Attached files
| file | filename |
|---|---|
| EX-21 - EXHIBIT 21 - MISONIX INC | v418437_ex21.htm |
| EX-23 - EXHIBIT 23 - MISONIX INC | v418437_ex23.htm |
| EX-31.2 - EXHIBIT 31.2 - MISONIX INC | v418437_ex31-2.htm |
| EX-32.2 - EXHIBIT 32.2 - MISONIX INC | v418437_ex32-2.htm |
| EX-31.1 - EXHIBIT 31.1 - MISONIX INC | v418437_ex31-1.htm |
| EX-32.1 - EXHIBIT 32.1 - MISONIX INC | v418437_ex32-1.htm |
UNITED STATES
SECURITIES AND EXCHANGE COMMISSION
Washington, D.C. 20549
FORM 10-K
(Mark One)
| þ | ANNUAL REPORT PURSUANT TO SECTION 13 OR 15(d) OF THE SECURITIES EXCHANGE ACT OF 1934 |
For the fiscal year ended June 30, 2015
OR
| ¨ | TRANSITION REPORT PURSUANT TO SECTION 13 OR 15(d) OF THE SECURITIES EXCHANGE ACT OF 1934 |
For the transition period from _____ to _____
Commission file number: 1-10986
| MISONIX, INC. |
(Exact name of registrant as specified in its charter)
| New York | 11-2148932 | |
| (State or other jurisdiction of incorporation or organization) | (I.R.S. Employer Identification No.) | |
| 1938 New Highway, Farmingdale, New York | 11735 | |
| (Address of principal executive offices) | (Zip Code) |
Registrant's telephone number, including area code: (631) 694-9555
Securities registered pursuant to Section 12(b) of the Act:
| Title of each class | Name of each exchange on which registered | |
| Common Stock, $.01 par value | Nasdaq Global Market |
Securities registered pursuant to Section 12(g) of the Act: None
Indicate by check mark if the registrant is a well-known seasoned issuer, as defined in Rule 405 of the Securities Act.
¨ Yes þ No
Indicate by check mark if the registrant is not required to file reports pursuant to Section 13 or Section 15(d) of the Act.
¨ Yes þ No
Indicate by check mark whether the registrant (1) has filed all reports required to be filed by Section 13 or 15(d) of the Securities Exchange Act of 1934 during the preceding 12 months (or for such shorter period that the registrant was required to file such reports), and (2) has been subject to such filing requirements for the past 90 days. þ Yes ¨ No
Indicate by check mark whether the registrant has submitted electronically and posted on its corporate Web site, if any, every Interactive Data File required to be submitted and posted pursuant to Rule 405 of Regulation S-T (§ 232.405 of this chapter) during the preceding 12 months (or for such shorter period that the registrant was required to submit and post such files). þ Yes ¨ No
Indicate by check mark if disclosure of delinquent filers pursuant to Item 405 of Regulation S-K (§229.405 of this chapter) is not contained herein, and will not be contained, to the best of registrant's knowledge, in definitive proxy or information statements incorporated by reference in Part III of this Form 10-K or any amendment to this Form 10-K. þ
Indicate by check mark whether the registrant is a large accelerated filer, an accelerated filer, a non-accelerated filer, or a smaller reporting company. See the definitions of "large accelerated filer," "accelerated filer" and "smaller reporting company" in Rule 12b-2 of the Exchange Act. (Check one):
| Large accelerated filer ¨ | Accelerated filer þ | Non-accelerated filer ¨ | Smaller reporting company ¨ | |||
| (Do not check if a smaller reporting company) |
Indicate by check mark whether the registrant is a shell company (as defined in Rule 12b-2 of the Exchange Act).
¨ Yes þ No
The aggregate market value of the voting stock held by non-affiliates of the registrant on December 31, 2014 (computed by reference to the closing price of such stock on such date) was approximately $81,749,310.
There were 7,744,113 shares of Common Stock outstanding at August 20, 2015.
DOCUMENTS INCORPORATED BY REFERENCE
None
With the exception of historical information contained in this Form 10-K, content herein may contain "forward looking statements" that are made pursuant to the Safe Harbor Provisions of the Private Securities Litigation Reform Act of 1995. These statements are based on management's current expectations and are subject to uncertainty and changes in circumstances. MISONIX, INC. (the “Company”) cannot guarantee that any forward looking statements will be accurate, although the Company believes that is has been reasonable in its expectations and assumptions. Investors should realize that if underlying assumptions prove inaccurate or unknown risks or uncertainties materialize, actual results could vary materially from the Company’s expectations and projections. These factors include general economic conditions, delays and risks associated with the performance of contracts, risks associated with international sales and currency fluctuations, uncertainties as a result of research and development, acceptable results from clinical studies, including publication of results and patient/procedure data with varying levels of statistical relevance, risks involved in introducing and marketing new products, potential acquisitions, consumer and industry acceptance, litigation and/or contemplated 510(k) filings, the ability to achieve and maintain profitability in the Company's business lines, and other factors discussed in this Annual Report on Form 10-K, subsequent Quarterly Reports on Form 10-Q and Current Reports on Form 8-K. The Company disclaims any obligation to update its forward-looking statements.
TABLE OF CONTENTS
| 2 |
Overview
MISONIX, INC. (“Misonix” or the “Company”) is a New York corporation which, through its predecessors, was first organized in 1959. The Company designs, manufactures, develops and markets minimally invasive ultrasonic surgical device products. These products include the BoneScalpel® surgical system (“BoneScalpel”) which is used, among other things, for surgical procedures of the spine and in Maxillofacial procedures, the SonaStar® Surgical Aspirator (“SonaStar”) which is used to emulsify and remove soft and hard tumors and the SonicOne® Wound Cleansing and Debridement System (“SonicOne”) which offers tissue specific debridement and cleansing of wounds and burns for effective removal of devitalized tissue and fibrin deposits while sparing viable cells.
The Company continues to develop its portfolio of therapeutic ultrasonic surgical devices aimed at expanding the base of clinical users. Current applications include the ability to transect or shape bone, ablate and aspirate both soft and hard tissue, cleanse and debride advanced wounds and remove unwanted body fat. Among clinical specialties served are: Spine Surgery, Skull-Based Surgery (i.e., Cranio-Maxillo-Facial), Neurosurgery, Orthopedic Surgery, Plastic Surgery, Wound, Burn and Vascular Surgery.
In the United States, a nationwide ‘hybrid’ sales organization, which includes contracted, commissioned, independent sales representatives, managed by Company personnel and supported by Company application specialists, markets our neuro/spine/skull-based products to our surgical customers. Products in this category are our BoneScalpel and SonaStar Systems.
In the United States, a second nationwide ‘hybrid’ sales organization, which includes contracted, commissioned, independent sales representatives managed by Company personnel and supported by Company specialists, markets our wound and burn care product portfolio to our acute, in patient and clinical customer base. Products in this category are SonicOne and SonicOne O.R.
Outside the United States, our BoneScalpel, SonaStar and SonicOne product platforms are marketed by specialty distributors who purchase products from the Company and resell products to their clinical customer bases. Representation for the BoneScalpel and SonaStar is worldwide with a strong presence in all major markets in the Americas, Europe, the Middle East, Asia, Australia and New Zealand. With regard to the SonicOne, representation is in a few countries at the present time.
The BoneScalpel is a unique, state of the art, ultrasonic bone cutting system capable of making precise cuts with minimal necrosis, minimal burn artifact, minimal inflammation and minimal bone loss. The device is also capable of preserving surrounding soft tissue structures. This device can make precise linear or curved cuts, on any plane, with precision not normally associated with power instrumentation. The BoneScalpel offers the speed and convenience of a power instrument without the dangers associated with conventional rotary devices. The effect on surrounding soft tissue is minimal due to the elastic and flexible structure of healthy tissue. This is a significant advantage in anatomical regions like the spine where patient safety is of primary concern. In addition, the linear motion of the blunt, tissue-impacting tips avoids accidental ‘trapping’ of soft tissue while largely eliminating the high speed spinning and tearing associated with rotary power instruments. The BoneScalpel allows surgeons to improve on existing surgical techniques by creating new approaches to osteotomies and bone removal, leading to substantial time savings and increased operation efficiencies.
Following its original market introduction in Europe almost four years ago, the BoneScalpel has attracted a steadily growing following in the surgical community, which led to significant sales growth in fiscal year 2015. The expandable BoneScalpel product platform will create entry into dynamic market segments like spine surgery and selected skull-based surgeries, i.e. Maxillo-Facial/Reconstructive procedures. In the future, additional market niche opportunities may exist in small bone surgery of the hand, foot or ankle, and additional skull-based procedures, i.e. ENT surgery.
The SonaStar System provides powerful precise aspiration following the ultrasonic ablation of hard or soft tissue. The SonaStar has been used for a wide variety of surgical procedures using both open and minimally invasive approaches, including neurosurgery and liver surgery. An additional option for the SonaStar is the use of OsteoSculpt® probe tips, which allows for the precise shaping or shaving of bony structures that prevent open access to partially or completely hidden soft tissue masses.
The SonicOne Ultrasonic Cleansing and Debridement System is a highly innovative, tissue specific approach for the effective removal of devitalized or necrotic tissue and fibrin deposits while sparing viable, surrounding cellular structures. The tissue specific capability is, in part, due to the fact that healthy and viable tissue structures have a higher elasticity and flexibility than necrotic tissue and are more resistant to destruction from the impact effects of ultrasound. The ultrasonic debridement process separates devitalized tissue from viable tissue layers, allowing for a more defined treatment and, usually, a reduced pain sensation. SonicOne establishes a new standard in wound and burn bed preparation, which is the essential first step in the healing process, while speeding the progression toward full patient healing.
| 3 |
The Company has an agreement with Covidien Plc (“Covidien”), now Medtronic plc, that expires in October 2016 which represents the development of the AutoSonix product and as a result of that joint development; patents are co-owned by Misonix and Covidien which results in Covidien paying Misonix a 5% royalty on end user sales. The royalty is recorded as “other income” in the Company’s financial statements and amounted to $4,162,000 in fiscal 2015.
On February 1, 2015, the Company entered into an agreement with Aesculap, Inc. (“Aesculap”) to buy back certain accounts that were protected under the termination agreement entered into by Misonix and Aesculap on December 31, 2012 (the “Termination Agreement”). The Termination Agreement allowed Aesculap to continue to sell and service key accounts which were defined as accounts maintaining a specified revenue level on average over a three year term which was due to expire on December 31, 2015. The buy back amount total is $328,136 and one half was paid on February 1, 2015 and the balance was paid on March 1, 2015. The total buy back amount includes $28,867 worth of units that will be for customer use and is expected to be fully utilized. The buy back has been recorded as reacquired contractual rights in intangible and other assets and will be amortized over the period through December 31, 2015.
| 4 |
Discontinued Operations
High Intensity Focused Ultrasound Technology
In consideration for the May 2010 sale of its rights to the high intensity focused ultrasound technology to USHIFU LLC, now SonaCare, Misonix will receive up to approximately $5.8 million, paid out of an earn-out of 7% of gross revenues received from SonaCare’s sales of the (i) prostate product in Europe and (ii) kidney and liver products around the world related to the business being sold up to the time the Company has received the first $3 million and thereafter 5% of the gross revenues up to $5.8 million. Commencing 90 days after each December 31st and beginning December 31, 2011 the payments will be the greater of (a) $250,000 or (b) 7% of gross revenues received up to the time the Company has received the first $3 million and thereafter 5% of gross revenues up to the $5.8 million. Cumulative payments through June 30, 2015 were $1,004,788.
| 5 |
Medical Devices
In October 1996, the Company entered into a twenty-year license agreement with Covidien. The Covidien license covers the further development of the Company's medical technology relating to laparoscopic products, which uses high frequency sound waves to coagulate and divide tissue for both open and laparoscopic surgery. The Covidien license gives Covidien exclusive worldwide marketing and sales rights for this technology and device. Total sales by Misonix of this device to Covidien were approximately $3,820, $5,226 and $110,437 for the fiscal years ended June 30, 2015, 2014 and 2013, respectively. Total royalties from sales of this device worldwide were approximately $4,162,000, $3,619,000 and $2,369,000 for the fiscal years ended June 30, 2015, 2014 and 2013, respectively.
The Company’s distribution agreement with Mentor Corporation, a subsidiary of Johnson & Johnson, for the sale, marketing and distribution of the Lysonix soft tissue aspirator used for cosmetic surgery has terminated. Sales continue on a limited non-contractual purchase order basis. Total sales of this device were approximately $264,000, $267,000 and $382,000 for the fiscal years ended June 30, 2015, 2014 and 2013, respectively.
| 6 |
The Company’s revenues are generated from various regions throughout the world. Sales by the Company outside the United States are made through distributors. Sales made in the United States are made primarily through representative agents. The following is an analysis of net sales from continuing operations by geographic region:
| For the years ended ended June 30, | ||||||||
| 2015 | 2014 | |||||||
| United States | $ | 10,797,920 | $ | 8,185,468 | ||||
| Australia | 364,156 | 120,118 | ||||||
| Europe | 3,385,603 | 2,387,376 | ||||||
| Asia | 4,125,662 | 3,572,056 | ||||||
| Canada and Mexico | 836,188 | 779,833 | ||||||
| South America | 911,711 | 1,165,124 | ||||||
| South Africa | 540,185 | 378,287 | ||||||
| Middle East | 1,243,153 | 472,173 | ||||||
| $ | 22,204,578 | $ | 17,060,435 | |||||
| For the years ended June 30, | ||||||||
| 2014 | 2013 | |||||||
| United States | $ | 8,185,468 | $ | 7,649,041 | ||||
| Australia | 120,118 | 358,509 | ||||||
| Europe | 2,387,376 | 3,062,307 | ||||||
| Asia | 3,572,056 | 1,619,255 | ||||||
| Canada and Mexico | 779,833 | 516,088 | ||||||
| South America | 1,165,124 | 735,060 | ||||||
| South Africa | 378,287 | 489,756 | ||||||
| Middle East | 472,173 | 397,210 | ||||||
| $ | 17,060,435 | $ | 14,827,226 | |||||
| 7 |
Market and Customers
The Company’s products are sold worldwide and has many customers and distributors. The Company’s largest customer is our Chinese distributor. Sales to Cicel (Beijing) Science and Tech Co. Ltd. (“Cicel”) were $2,974,086 (13.4% of total sales) for the fiscal year ended June 30, 2015. The Company also receives royalties from Covidien, which was our non-exclusive BoneScalpel distributor in the United States, for patents it co-owns on the AutoSonic product. Total royalties from Covidien related to their sales of the Company’s ultrasonic cutting products, which use high frequency sound waves to coagulate and divide tissue for both open and laparoscopic surgery, were $4,162,000, $3,619,000 and $2,369,000 for the fiscal years ended June 30, 2015, 2014 and 2013, respectively. Net income/(loss) for the years ended June 30, 2015, 2014 and 2013 was $5,571,171, $1,393,299 and ($2,670,000), respectively, of which $4,162,000, $3,619,000 and $2,369,000, respectively, was from royalty income from Covidien. Accounts receivable from Covidien were approximately $1,012,000 and $892,000, which includes $1,012,000 and $892,000 of royalty income receivable, at June 30, 2015 and 2014, respectively. Accounts receivable from Aesculap were approximately $1,000 and $121,000 at June 30, 2015 and 2014, respectively. At June 30, 2015 and 2014, the Company’s accounts receivable with customers outside the United States were approximately $1,805,000 and $1,332,000, respectively. Accounts receivable from Cicel were approximately $586,000 and $606,000 at June 30, 2015 and 2014, respectively. The Company sells the BoneScalpel, SonaStar and SonicOne Wound Cleansing and Debridement System through direct sales persons and sales agents in the United States and through distributors outside the United States.
The Company continues its strategy to consign units, primarily the BoneScalpel and SonicOne OR, in the United States in an effort to increase the installed base of units in the market. This strategy has the effect of increasing Property, Plant and Equipment and we do not receive revenues for these units, as the Company continues to own the units and depreciates them over time. This strategy offers the Company wider acceptance of the product and ultimately increases our revenues through the sale of disposables used with the BoneScalpel and SonicOne OR. The practice of placing systems with hospitals has the effect of accelerating hospital acceptance during a time of budget constraints.
Manufacturing and Supply
The Company manufactures and assembles its medical device products at its production facility located in Farmingdale, New York. The Company's products include components manufactured by other companies in the United States. The Company is not dependent upon any single source of supply and has no long-term supply agreements. The Company believes that it will not encounter difficulty in obtaining materials, supplies and components adequate for its anticipated short-term needs.
Competition
Competition in the medical device products industry is rigorous with many companies having significant capital resources, large research laboratories and extensive distribution systems greater than the Company's. Some of the Company's major competitors are Medtronic, Anspach, Synthes (a division of Johnson and Johnson), Integra Life Sciences, Inc., Sööring, Stryker Corporation and Smith and Nephew.
| 8 |
Regulatory Requirements
The Company's medical device products are subject to the regulatory requirements of the U.S. Food and Drug Administration (“FDA”). A medical device, as defined by the FDA, is an instrument, apparatus, implement, machine, contrivance, implant, in vitro reagent, or other similar or related article, including a component, part, or accessory which is recognized in the official National Formulary or the United States Pharmacopoeia, or any supplement to such listings, intended for use in the diagnosis of disease or other conditions, or in the cure, mitigation, treatment or prevention of disease, in man or animals, or intended to affect the structure or any function of the body of man or animals, and which does not achieve any of its primary intended purposes through chemical action within or on the body of man or animals and which is not dependent upon being metabolized for the achievement of any of its primary intended purposes (a "medical device"). The Company's products that are subject to FDA regulations for product labeling and promotion comply with all applicable regulations. The Company is listed with the FDA as a medical device manufacturer and has the appropriate FDA Establishment Numbers in place. The Company has a post-market monitoring system in place such as Complaint Handling and Medical Device Reporting procedures. All current devices manufactured and sold by the Company have all the necessary regulatory approvals. The Company is not aware of any situations which would be materially adverse at this time and neither has the FDA sought legal remedies available, nor have there been any material violations of its regulations alleged, against the Company at present.
Patents, Trademarks, Trade Secrets and Licenses
The following is a list of the U.S. patents which have been issued to the Company:
| Number | Description | Issue Date | Expiration Date | |||
| D478165 | Cannula for ultrasonic probe | 08/05/2003 | 08/05/2017 | |||
| 5,769,211 | Autoclavable switch - relating to a medical handpiece with autoclavable rotary switch to be used in medical procedures | 06/23/1998 | 01/21/2017 | |||
| 6,033,375 | Ultrasonic probe with isolated and teflon coated outer cannula | 03/07/2000 | 12/23/2017 | |||
| 6,270,471 | Ultrasonic probe with isolated outer cannula | 08/07/2001 | 12/23/2017 | |||
| 6,443,969 | Ultrasonic blade with cooling | 09/03/2002 | 08/15/2020 | |||
| 6,379,371 | Ultrasonic blade with cooling | 04/30/2002 | 11/15/2019 | |||
| 6,375,648 | Infiltration cannula with teflon coated outer surface | 04/23/2002 | 10/02/2018 | |||
| 6,063,050 | Ultrasonic dissection and coagulation system | 05/16/2000 | 10/16/2017 | |||
| 6,036,667 | Ultrasonic dissection and coagulation system | 03/14/2000 | 08/14/2017 | |||
| 6,582,440 | Non-clogging catheter for lithotripsy | 06/24/2003 | 12/26/2016 | |||
| 6,454,730 | Thermal film ultrasonic dose indicator | 09/24/2002 | 04/02/2019 |
| 9 |
| 6,613,056 | Ultrasonic probe with low-friction bushings | 09/02/2003 | 02/17/2019 | |||
| 6,648,839 | Ultrasonic medical treatment device for RF cauterization and related method | 11/18/2003 | 05/08/2022 | |||
| 6,736,814 | Ultrasonic medical treatment device for bipolar RF cauterization and related method | 05/18/2004 | 02/28/2022 | |||
| 6,799,729 | Ultrasonic cleaning and atomizing probe | 10/05/2004 | 10/05/2021 | |||
| 6,869,439 | Ultrasonic dissector | 03/22/2005 | 03/22/2022 | |||
| 6,902,536 | RF cauterization and ultrasonic ablation | 06/07/2005 | 06/07/2022 | |||
| 7,442,168 | High efficiency medical transducer with ergonomic shape and method manufacture | 10/28/2008 | 04/01/2023 | |||
| 7,223,267 | Ultrasonic probe with detachable slidable cauterization forceps | 02/06/2004 | 02/06/2024 | |||
| 7,717,913 | Cauterization and ultrasonic ablation instrument with multi hole collar and electrode MTG sleeve | 05/18/2010 | 11/04/2024 | |||
| 7,776,027 | Medical handpiece with automatic power switching means | 08/17/2010 | 07/11/2022 | |||
| 6,492,762 | Ultrasonic transducer, transducer array, and fabrication method | 12/10/2002 | 03/22/2020 | |||
| 6,787,974 | Ultrasound transducer unit and planar ultrasound lens | 09/07/2004 | 11/21/2021 | |||
| 6,461,314 | Intrabody HIFU applicator | 10/08/2002 | 02/2/2020 | |||
| D627,463 | Ultrasonic wound treatment probe | 01/27/2010 | 11/24/2024 | |||
| 7,931,611 | Ultrasonic wound debrider probe and method of use | 03/23/2005 | 10/15/2027 | |||
| D627,463 | Ultrasonic wound treatment probe | 08/30/2011 | 08/30/2025 | |||
| 8,025,672 | Ultrasonic wound treatment method and apparatus | 09/27/2011 | 08/29/2026 | |||
| 8,109,925 | Treatment of breast disease with vibrating device | 02/07/2012 | 05/25/2027 | |||
| D667,117 | Ultrasonic bone cutting blade | 09/11/2012 | 09/11/2026 | |||
| 8,343,178 | Method for ultrasonic tissue excision with tissue selectivity | 01/01/2013 | 12/30/2031 | |||
| 8,353,912 | Ultrasonic spinal surgery method | 01/15/2013 | 08/12/2030 | |||
| D680,218 | Ultrasonic bone cutting blade | 04/16/2013 | 04/16/2027 | |||
| 8,430,897 | Ultrasonic wound debrider probe and method of use | 04/30/2013 | 03/11/2028 | |||
| 8,444,629 | Medical handpiece with automatic power switching means | 05/21/2013 | 01/12/2031 |
| 10 |
| D683,087 | Surgical instrument sleeve | 06/25/2013 | 06/25/2027 | |||
| D699,839 | Surgical shield | 02/18/2014 | 02/18/2028 | |||
| D700,327 | Ultrasonic osteotome tip | 02/25/2014 | 02/25/2028 | |||
| 8,659,208 | Waveform generator for driving electromechanical device | 02/25/2014 | 07/26/2032 | |||
| 8,690,783 | Ultrasonic transducer assembly | 04/08/2014 | 05/20/2031 | |||
| 8,698,377 | Dual-mode piezocomposite ultrasonic transducer | 04/15/2014 | 05/20/2031 | |||
| 8,814,870 | Hook blade for bone cutting | 08/26/2014 | 06/14/2026 | |||
| 8,894,673 | Guarded osteotome | 11/25/2014 | 10/07/2031 | |||
| 9,070,856 | Digital waveform generator | 06/30/2015 | 06/12/2028 | |||
| D715,434 | Osteotome blades-design | 10/14/2014 | 10/14/2028 | |||
| D715,936 | Osteotome blades | 10/21/2014 | 10/21/2028 | |||
| D715,435 | Osteotome blades-design | 10/14/2014 | 10/14/2028 | |||
| D715,436 | Osteotome blades-design | 10/14/2014 | 10/14/2028 | |||
| 152,513* | Serrated hook blade | 08/01/2014 | 08/01/2024 |
The Company regularly has patents that have been applied for but have not received approval; to date the Company has thirty (30) pending U.S. patent applications and thirty five (35) pending international applications.
| * | Patent valid in Canada. |
| 11 |
The following is a list of the U.S. trademarks which have been issued to the Company:
| Registration | Registration | ||||||
| Number | Date | Mark | Goods | ||||
| 2,812,718 | 02/10/2004 | Misonix | Ultrasonic medical devices, namely ultrasonic surgical aspirators, ultrasonic lithotripters and ultrasonic phacoemulsifiers | ||||
| 3,373,435 | 01/22/2008 | SonicOne | Ultrasonic surgical systems | ||||
| 3,583,091 | 03/03/2009 | Osteosculpt | Surgical devices, and instruments, namely, ultrasonic cutters and ablators | ||||
| 3,775,329 | 04/13/2010 | Sonastar | Ultrasonic medical devices namely ultrasonic surgical aspirators, ultrasonic scalpels and ultrasonic bone shavers | ||||
| 3,637,456 | 06/16/2009 | Misonix | Ultrasonic cleaning units and ultrasonic liquid processors for industrial, domestic and/or laboratory use | ||||
| 4,506,761 | 04/01/2014 | SonicOne Plus | Ultrasonic surgical system | ||||
| 3,882,225 | 11/30/2010 | Misonix | Laboratory equipment | ||||
| 4,715,865 | 04/07/2015 | BoneScalpel | Surgical devices and instruments, and surgical and medical kits for ultrasonic surgical procedures comprised of ultrasonic cutting blades, ultrasonic bone cutting blades, osteotomes, ultrasonic osteotomes; ultrasonic ablating tools, namely, ultrasonic cutting blades, ultrasonic osteotomes; ultrasonic bone ablating tools, namely, ultrasonic bone cutting blades, ultrasonic bone shavers, ultrasonic osteotomes; incising tools, namely, cutting instruments, osteotomes and ultrasonic incising tools, namely, ultrasonic cutting blades, ultrasonic osteotomes; and ancillary ultrasonic surgical equipment, namely, ultrasonic signal generators, ultrasonic waveform generators, ultrasonic controllers, cables, hand-pieces with electro-mechanical transducers |
| 12 |
Backlog
As of June 30, 2015, the Company's backlog (firm orders that have not yet been shipped) was $33,238, as compared to $357,645 as of June 30, 2014. The Company’s method of business has changed with the shift from major distributors in 2012. As a result, we no longer have large recurring orders but ship on a just in time basis.
Employees
As of June 30, 2015, the Company employed a total of 80 full-time employees, including 30 in management and supervisory positions. The Company considers its relationship with its employees to be good.
Website Access Disclosure
The Company's Annual Reports on Form 10-K, Quarterly Reports on Form 10-Q and Current Reports on Form 8-K are available free of charge on the Company's website at www.misonix.com as soon as reasonably practicable after such material is electronically filed with or furnished to the Securities and Exchange Commission (“SEC”). Copies of the Company's Annual Report will be made available to shareholders, free of charge, upon written request.
| 13 |
In addition to the other information contained in this Annual Report on Form 10-K and the exhibits hereto, the following risk factors should be considered carefully in evaluating our business. Our business, financial condition and/or results of operations could be materially adversely affected by any of these risks. This section contains forward-looking statements. You should refer to the explanation of the qualifications and limitations on forward-looking statements set forth immediately prior to the beginning of Item 1 of this Annual Report on Form 10-K. Additional risks not presently known to us or that we currently deem immaterial may also adversely affect our business, financial condition and/or results of operations. The following list sets forth many, but not all, of the factors that could impact the Company’s ability to achieve results discussed in any forward-looking statement. Investors should understand that it is not possible to predict or identify all such factors and should not consider this list to be a complete statement of all potential risks and uncertainties.
Risks Related to Our Business
We are subject to extensive medical device regulation which may impede or hinder the approval process for our products and, in some cases, may not ultimately result in approval or may result in the recall or seizure of previously approved products.
Our products, development activities and manufacturing processes are subject to extensive and rigorous regulation by the FDA pursuant to the Federal Food, Drug, and Cosmetic Act (the "FDC Act"), by comparable agencies in foreign countries, and by other regulatory agencies and governing bodies. Under the FDC Act, medical devices must receive FDA clearance or approval before they can be commercially marketed in the U.S. In addition, most major markets for medical devices outside the U.S. require clearance, approval or compliance with certain standards before a product can be commercially marketed. The process of obtaining marketing approval or clearance from the FDA for new products, or with respect to enhancements or modifications to existing products, could:
| • | take a significant period of time; |
| • | require the expenditure of substantial resources; |
| • | involve rigorous pre-clinical and clinical testing; |
| • | require changes to the products; and |
| • | result in limitations on the indicated uses of the products. |
Even after products have received marketing approval or clearance, product approvals and clearances by the FDA can be withdrawn due to failure to comply with regulatory standards or the occurrence of unforeseen problems following initial approval. There can be no assurance that we will receive the required clearances from the FDA for new products or modifications to existing products on a timely basis or that any FDA approval will not be subsequently withdrawn. Later discovery of previously unknown problems with a product or manufacturer could result in fines, delays or suspensions of regulatory clearances, seizures or recalls of products, operating restrictions and/or criminal prosecution. The failure to receive product approval clearance on a timely basis, suspensions of regulatory clearances, seizures or recalls of products or the withdrawal of product approval by the FDA could have a material adverse effect on our business, financial condition or results of operations.
We may not meet regulatory quality standards applicable to our manufacturing and quality processes and registrations of products outside the United States.
As a medical device manufacturer, we are required to register with the FDA and are subject to periodic inspection by the FDA for compliance with the FDA's Quality System Regulation requirements, which require manufacturers of medical devices to adhere to certain regulations, including testing, quality control and documentation procedures. In addition, the Federal Medical Device Reporting regulations require us to provide information to the FDA whenever there is evidence that reasonably suggests that a medical device may have caused or contributed to a death or serious injury or, if a malfunction were to occur, could cause or contribute to a death or serious injury. Compliance with applicable regulatory requirements is subject to continual review and is rigorously monitored through periodic inspections by the FDA. In the European Community and China, we are required to maintain certain ISO certifications in order to sell our products and must undergo periodic inspections by notified bodies to obtain and maintain these certifications. Failure to meet regulatory quality standards could have a material adverse effect on our business, financial condition or results of operations.
| 14 |
Future intellectual property litigation could be costly and disruptive to us.
We operate in an industry that is susceptible to significant intellectual property litigation and, in recent years, it has been common for companies in the medical device field to aggressively challenge the patent rights of other companies in order to prevent the marketing of new devices. Intellectual property litigation is expensive, complex and lengthy and its outcome is difficult to predict. Future patent litigation may result in significant royalty or other payments or injunctions that can prevent the sale of products and may significantly divert the attention of our technical and management personnel. In the event that our right to market any of our products is successfully challenged, and if we fail to obtain a required license or are unable to design around a patent, our business, financial condition or results of operations could be materially adversely affected.
We may not be able to effectively protect our intellectual property rights.
Patents and other proprietary rights are and will be essential to our business and our ability to compete effectively with other companies will be dependent upon the proprietary nature of our technologies. We also rely upon trade secrets, know-how, continuing technological innovations, strategic alliances and licensing opportunities to develop, maintain and strengthen our competitive position. We pursue a policy of generally obtaining patent protection in both the U.S. and abroad for patentable subject matter in our proprietary devices and also attempt to review third-party patents and patent applications to the extent publicly available to develop an effective patent strategy, avoid infringement of third-party patents, identify licensing opportunities and monitor the patent claims of others. We currently own numerous U.S. and foreign patents. We also are party to various license agreements pursuant to which patent rights have been obtained or granted in consideration for cash or royalty payments. No assurance can be made that any pending or future patent applications will result in issued patents, that any current or future patents issued to, or licensed by, us will not be challenged or circumvented by our competitors, or that our patents will not be found invalid.
In addition, we may have to take legal action in the future to protect our patents, trade secrets or know-how or to assert our intellectual property rights against claimed infringement by others. Any legal action of that type could be costly and time consuming to us and no assurances can be made that any lawsuit will be successful.
The invalidation of key patents or proprietary rights that we own, or an unsuccessful outcome in lawsuits to protect our intellectual property, could have a material adverse effect on our business, financial condition or results of operations.
Future product liability claims and other litigation, including private securities litigation and shareholder derivative suits, may adversely affect our business, reputation and ability to attract and retain customers.
The design, manufacture and marketing of medical device products of the types that we produce entail an inherent risk of product liability claims. A number of factors could result in an unsafe condition or injury to, or death of, a patient with respect to these or other products that we manufacture or sell, including component failures, manufacturing flaws, design defects or inadequate disclosure of product-related risks or product-related information. These factors could result in product liability claims, a recall of one or more of our products or a safety alert relating to one or more of our products. Product liability claims may be brought by individuals or by groups seeking to represent a class.
Anyone or any company can bring an action against Misonix.
Our judicial system allows anyone to bring a claim against the Company and force the Company to defend itself even if the claim is baseless. The defense may or may not be covered by the Company’s insurance, the result of which could ultimately create a burden on the Company dependent upon the outcome.
Our future growth is dependent upon the development of new products and line extensions, which requires significant research and development, clinical trials and regulatory approvals, all of which are very expensive and time-consuming and may not result in a commercially viable product.
In order to develop new products and improve current product offerings, we focus our research and development programs largely on the development of next-generation and novel technology offerings across multiple programs and opportunities.
As a part of the regulatory process of obtaining marketing clearance from the FDA for new products, we conduct and participate in numerous clinical trials with a variety of study designs, patient populations and trial endpoints. Unfavorable or inconsistent clinical data from existing or future clinical trials conducted by us, by our competitors or by third parties, or the market's perception of this clinical data, may adversely impact our ability to obtain product approvals from the FDA, our position in, and share of, the markets in which we participate and our business, financial condition, results of operations or future prospects.
| 15 |
New products may not be accepted in the market.
We are now, and will continue to be, developing new products and introducing them into the market. There can be no assurance that any new product will be accepted by the market. New products are sometimes introduced into the market in a prototype format and may need later revisions or design changes before they operate in a manner to be accepted in the market. As a result of the introduction of new products, there is some risk that revenue expectations may not be met and in some cases the product may not achieve market acceptance.
We face intense competition and may not be able to keep pace with the rapid technological changes in the medical device industry.
The medical device product market is highly competitive. We encounter significant competition across our product lines and in each market in which our products are sold from various medical device companies, some of which have greater financial and marketing resources than we do.
Additionally, the medical device product market is characterized by extensive research and development and rapid technological change. Developments by other companies of new or improved products, processes or technology may make our products or proposed products obsolete or less competitive and may negatively impact our revenues. In some cases foreign companies may attempt to copy our designs illegally. We are required to devote continued efforts and financial resources to develop or acquire scientifically advanced technologies and products, apply our technologies cost-effectively across product lines and markets, attract and retain skilled development personnel, obtain patent and other protection for our technology and products, obtain required regulatory and reimbursement approvals and successfully manufacture and market our products. Failure to develop new products or enhance existing products could have a material adverse effect on our business, financial condition or results of operations.
Consolidation in the healthcare industry could lead to demands for price concessions or the exclusion of some suppliers from certain of our significant market segments.
The cost of healthcare has risen significantly over the past decade and numerous initiatives and reforms initiated by legislators, regulators and third-party payers to curb these costs have resulted in a consolidation trend in the healthcare industry, including hospitals. This in turn has resulted in greater pricing pressures and the exclusion of certain suppliers from important market segments as group purchasing organizations, independent delivery networks and large single accounts continue to consolidate purchasing decisions for some of our hospital customers. We expect that market demand, government regulation, third-party reimbursement policies and societal pressures will continue to change the worldwide healthcare industry, resulting in further business consolidations and alliances among our customers and competitors, which may reduce competition, exert further downward pressure on the prices of our products and may adversely impact our business, financial condition or results of operations.
We may experience disruption in supply due to our dependence on our suppliers to continue to ship product requirements and our inability to obtain suppliers of certain components for our products.
Our suppliers may encounter problems during manufacturing due to a variety of reasons, including failure to follow specific protocols and procedures, failure to comply with applicable regulations, equipment malfunctions, labor shortages or environmental factors. In addition, we purchase both raw materials used in our products and finished goods from various suppliers and may have to rely on a single source supplier for certain components of our products where there are no alternatives are available. Although we anticipate that we have adequate sources of supply and/or inventory of these components to handle our production needs for the foreseeable future, if we are unable to secure on a timely basis sufficient quantities of the materials we depend on to manufacture our products, if we encounter delays or contractual or other difficulties in our relationships with these suppliers, or if we cannot find suppliers at an acceptable cost, then the manufacture of our products may be disrupted, which could increase our costs and have a material adverse effect on our business.
If we fail to manage any expansion or acquisition, our business could be impaired.
We may in the future acquire one or more technologies, products or companies that complement our business. We may not be able to effectively integrate these into our business and any such acquisition could bring additional risks, exposures and challenges to the Company. In addition, acquisitions may dilute our earnings per share, disrupt our ongoing business, distract our management and employees, increase our expenses, subject us to liabilities and increase our risk of litigation, all of which could harm our business. If we use cash to acquire technologies, products, or companies, such use may divert resources otherwise available for other purposes. If we use our common stock to acquire technologies, products, or companies, our shareholders may experience substantial dilution. If we fail to manage any expansions or acquisition, our business could be impaired.
| 16 |
Our agreements and contracts entered into with partners and other third parties may not be successful.
We signed in the past and may pursue in the future agreements and contracts with third parties to assist in our marketing, manufacturing, selling and distribution efforts. We cannot assure you that any agreements or contracts entered into will be successful.
The current disruptions in the financial markets could affect our ability to obtain debt financing on favorable terms (or at all) and have other adverse effects on us.
The United States credit markets have recently experienced historic dislocations and liquidity disruptions which have caused financing to be unavailable in many cases and even if available caused spreads on prospective debt financings to widen considerably. These circumstances have materially impacted liquidity in the debt markets, making financing terms for borrowers able to find financing less attractive, and in many cases have resulted in the unavailability of certain types of debt financing. Continued uncertainty in the credit markets may negatively impact our ability to access debt financing on favorable terms or at all. In addition, Federal legislation to deal with the current disruptions in the financial markets could have an adverse effect on our financial condition and results of operations.
The fluctuation of our quarterly results may adversely affect the trading price of our common stock.
Our revenues and results of operations have in the past and will likely vary in the future from quarter to quarter due to a number of factors, many of which are outside of our control and any of which may cause our stock price to fluctuate. You should not rely on quarter-to-quarter comparisons of our results of operations as an indication of our future performance. It is likely that in some future quarters, our results of operations may be below the expectations of public market analysts and investors. In this event, the price of our common stock may fall.
We may not be able to attract and retain additional key management, sales and marketing and technical personnel, or we may lose existing key management, sales and marketing or technical personnel, which may delay our development and marketing efforts.
We depend on a number of key management, sales and marketing and technical personnel. The loss of the services of one or more key employees could delay the achievement of our development and marketing objectives. Our success will also depend on our ability to attract and retain additional highly qualified management, sales and marketing and technical personnel to meet our growth goals. We face intense competition for qualified personnel, many of whom are often subject to competing employment offers, and we do not know whether we will be able to attract and retain such personnel.
Future changes in financial accounting standards or practices or existing taxation rules or practices may cause adverse or unexpected revenue fluctuations and affect our reported results of operations.
A change in accounting standards or practices or a change in existing taxation rules or practices can have a significant effect on our reported results and may even affect our reporting of transactions completed before the change is effective. New accounting pronouncements and taxation rules and varying interpretations of accounting pronouncements and taxation practice have occurred and may occur in the future. Changes to existing rules or the questioning of current practices may adversely affect our reported financial results or the way we conduct our business.
Adverse litigation results could affect our business.
Litigation can be lengthy, expensive and disruptive to our operations, and results cannot be predicted with certainty. An adverse decision could result in monetary damages or injunctive relief that could affect our financial condition or results of operations.
The Affordable Healthcare for America Act includes provisions that may adversely affect our business and results of operations, including an excise tax on the sales of most medical devices.
On March 21, 2010, the House of Representatives passed the Affordable Health Care for America Act, which President Obama signed into law on March 23, 2010. While the current evaluation for this legislation is not material, its potential impact on the Company may adversely affect our business and results of operations. The medical device tax has been established, but in the future the government may decide to increase the tax rate.
| 17 |
We are subject to extensive anti-corruption laws and regulations.
Our international operations must comply with U.S. law, including the U.S. Foreign Corrupt Practices Act (“FCPA”). The FCPA and similar foreign anti-corruption laws generally prohibit companies and their intermediaries from making improper payments or providing anything of value to improperly influence foreign government officials for the purpose of obtaining or retaining business regardless of whether those practices are legal or culturally expected in the foreign jurisdiction. Recently, there has been a substantial increase in the global enforcement of anti-corruption laws. Although we are not aware of any incidents, we could be the subject of claims that may adversely impact our business, results of operations, financial condition or reputation. Violations of these laws could result in criminal or civil sanctions.
We are experiencing greater scrutiny and regulation by governmental authorities, which may lead to greater regulation in the future.
Our medical devices and our business activities are subject to rigorous regulation, including by the FDA, U.S. Department of Justice, and numerous other federal, state and foreign governmental authorities. These authorities and members of Congress have been increasing their scrutiny of our industry. Certain state governments and the federal government have enacted legislation aimed at increasing transparency of our interactions with health care providers. As a result, we are required by law to disclose payments and other transfers of value to health care providers licensed by certain states and, starting with payments or other transfers of value made on or after August 1, 2013, to all U.S. physicians and U.S. teaching hospitals at the federal level. Any failure to comply with these legal and regulatory requirements could impact our business. In addition, we may continue to devote substantial additional time and financial resources to further develop and implement policies, systems, and processes to comply with enhanced legal and regulatory requirements, which may also impact our business. We anticipate that governmental authorities will continue to scrutinize our industry closely, and that additional regulation may increase compliance and legal costs, exposure to litigation, and other adverse effects on our operations.
Risk of reprocessing disposables.
In some jurisdictions around the world culture and practice encourages reuse when the product is clearly labeled for single use.
Item 1B. Unresolved Staff Comments.
None.
The Company occupies approximately 34,400 square feet at 1938 New Highway, Farmingdale, New York pursuant to a lease expiring on June 30, 2018. The Company pays rent of approximately $26,000 a month, which includes a pro rata share of real estate taxes, water, sewer and other charges which are assessed on the leased premises or the land upon which the leased premises are situated. The Company believes that the leased facilities are adequate for its present needs.
None.
Item 4. Mine Safety Disclosures.
Not applicable.
| 18 |
Item 5. Market for Registrant's Common Equity, Related Stockholder Matters and Issuer Purchases of Equity Securities.
| (a) | The Company's common stock, $.01 par value ("Common Stock"), is listed on the Nasdaq Global Market ("Nasdaq") under the symbol "MSON". |
The following table sets forth the high and low sales prices for the Common Stock during the periods indicated as reported by Nasdaq:
| High | Low | |||||||
| Fiscal 2015: | ||||||||
| First Quarter | $ | 13.49 | $ | 6.01 | ||||
| Second Quarter | 14.90 | 8.89 | ||||||
| Third Quarter | 14.50 | 10.78 | ||||||
| Fourth Quarter | 13.90 | 9.50 | ||||||
| High | Low | |||||||
| Fiscal 2014: | ||||||||
| First Quarter | $ | 5.50 | $ | 3.92 | ||||
| Second Quarter | 6.03 | 3.86 | ||||||
| Third Quarter | 7.17 | 4.85 | ||||||
| Fourth Quarter | 6.88 | 5.57 | ||||||
| High | Low | |||||||
| Fiscal 2013: | ||||||||
| First Quarter | $ | 4.38 | $ | 2.15 | ||||
| Second Quarter | 9.13 | 4.01 | ||||||
| Third Quarter | 8.55 | 2.98 | ||||||
| Fourth Quarter | 6.91 | 5.00 | ||||||
| (b) | As of August 12, 2015, the Company had 7,744,113 shares of Common Stock outstanding and 66 shareholders of record. This does not take into account shareholders whose shares are held in "street name" by brokerage houses. |
| (c) | The Company has not paid any cash dividends since its inception. The Company does not intend to pay any cash dividends in the foreseeable future, but intends to retain all earnings, if any, for use in its business operations. |
| 19 |
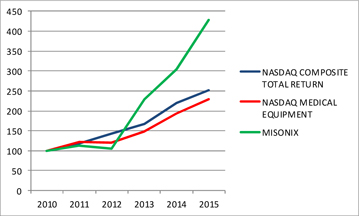
Share Performance Graph
The following graph compares the cumulative total return on the Company’s Common Stock during the last five fiscal years with the NASDAQ Total U.S. and Foreign Return Index and the NASDAQ Medical Devices, Instruments and Supplies Index during the same period. The graph shows the value, at the end of each of the last five fiscal years, of $100 invested in the Common Stock or the indices on June 30, 2010. The graph depicts the change in value of the Company’s Common Stock relative to the noted indices as of the end of each fiscal year and not for any interim period. Historical stock price performance is not necessarily indicative of future stock price performance.
| 2010 | 2011 | 2012 | 2013 | 2014 | 2015 | |||||||||||||||||||
| MISONIX, INC. | 100 | 113 | 105 | 230 | 304 | 428 | ||||||||||||||||||
| NASDAQ Composite Total Return | 100 | 119 | 142 | 167 | 219 | 251 | ||||||||||||||||||
| NASDAQ Medical Equipment Index | 100 | 122 | 120 | 149 | 194 | 224 | ||||||||||||||||||
| 20 |
Equity Compensation Plan Information:
| Number of | ||||||||||||
| securities | ||||||||||||
| remaining | ||||||||||||
| available for | ||||||||||||
| Number of | Weighted | future | ||||||||||
| securities to | -average | issuance | ||||||||||
| be | exercise | under equity | ||||||||||
| issued upon | price of | compensation | ||||||||||
| exercise of | outstanding | plans | ||||||||||
| outstanding | options, | (excluding | ||||||||||
| options, | warrants | securities | ||||||||||
| warrants | and | reflected in | ||||||||||
| Plan category | and rights | rights | column (a)) | |||||||||
| (a) | (b) | (c) | ||||||||||
| Equity compensation plans approved by security holders | ||||||||||||
| I. 1996 Directors Plan | 15,000 | $ | 7.60 | - | ||||||||
| II. 1996 Plan | 1,000 | 7.60 | - | |||||||||
| III.1998 Plan | 6,000 | 7.60 | - | |||||||||
| IV.2001 Plan | 9,968 | 2.80 | - | |||||||||
| V. 2005 Plan | 223,725 | 2.19 | 625 | |||||||||
| VI. 2005 Directors Plan | 120,000 | 3.63 | 12,500 | |||||||||
| VII. 2009 Plan | 345,423 | 2.91 | 21,100 | |||||||||
| VIII. 2009 Directors Plan | 138,750 | 5.68 | 35,000 | |||||||||
| IX. 2012 Plan | 442,750 | 6.59 | 48,500 | |||||||||
| X. 2012 Directors Plan | 75,000 | 13.20 | 125,000 | |||||||||
| XI. 2014 Plan | 180,000 | 12.28 | 570,000 | |||||||||
| Equity compensation plans not approved by security holders | - | - | - | |||||||||
| Total | 1,557,616 | $ | 5.80 | 812,725 | ||||||||
| 21 |
Item 6. Selected Financial Data.
The following selected consolidated financial data should be read in conjunction with Item 7 “Management’s Discussion and Analysis of Financial Condition and Results of Operations” and our consolidated financial statements and the related notes appearing in Item 8 “Financial Statements and Supplementary Data” of this Annual Report on Form 10-K.
The consolidated statements of income data for the years ended June 30, 2013, 2014 and 2015 and the consolidated balance sheet data as of June 30, 2014 and 2015 are derived from our audited consolidated financial statements appearing in Item 8 of this Annual Report on Form 10-K. The consolidated statements of income data for the years ended June 30, 2011 and 2012 and the consolidated balance sheets data as of June 30, 2011, 2012 and 2013 are derived from our audited consolidated financial statements that are not included in this Annual Report on Form 10-K. The historical results are not necessarily indicative of the results to be expected in any future period.
Selected income statement data:
| 2015 | 2014 | 2013 | 2012 | 2011 | ||||||||||||||||
| Net sales | $ | 22,204,578 | $ | 17,060,435 | $ | 14,827,226 | $ | 15,678,000 | $ | 12,373,029 | ||||||||||
| Net income (loss) from continuing operations | 5,571,171 | 1,393,299 | (2,670,965 | ) | 366,325 | (3,534,246 | ) | |||||||||||||
| Net Income/(loss) per share from continuing operations - Basic | $ | 0.70 | $ | 0.15 | $ | (0.40 | ) | $ | (0.09 | ) | $ | (0.30 | ) | |||||||
| Net Income/(loss) per share from continuing operations - Diluted | $ | 0.66 | $ | 0.15 | $ | (0.40 | ) | $ | (0.09 | ) | $ | (0.30 | ) | |||||||
Selected balance sheet data:
| June 30, | ||||||||||||||||||||
| 2015 | 2014 | 2013 | 2012 | 2011 | ||||||||||||||||
| Total assets | $ | 26,454,248 | $ | 19,527,869 | $ | 17,359,927 | $ | 18,312,837 | $ | 18,358,322 | ||||||||||
| Total long term liabilities | 20,395 | 67,932 | 96,745 | 140,143 | 175,403 | |||||||||||||||
| Total stockholders' equity | 23,754,345 | 16,352,364 | 13,777,220 | 15,590,067 | 14,877,283 | |||||||||||||||
| 22 |
Item 7. Management's Discussion and Analysis of Financial Condition and Results of Operations.
The following table sets forth, for the three most recent fiscal years, the percentage relationship to net sales of principal items in the Company's Consolidated Statements of Operations:
| Fiscal years ended | ||||||||||||
| June 30, | ||||||||||||
| 2015 | 2014 | 2013 | ||||||||||
| Net sales | 100.0 | % | 100.0 | % | 100.0 | % | ||||||
| Cost of goods sold | 32.8 | 34.8 | 50.1 | |||||||||
| Gross profit | 67.2 | 65.2 | 49.9 | |||||||||
| Selling expenses | 40.8 | 42.6 | 45.7 | |||||||||
| General and administrative expenses | 26.9 | 27.5 | 30.0 | |||||||||
| Research and development expenses | 7.2 | 10.0 | 10.1 | |||||||||
| Total operating expenses | 74.9 | 80.2 | 85.8 | |||||||||
| Loss from operations | (7.7 | ) | (14.9 | ) | (35.9 | ) | ||||||
| Other income | 19.1 | 21.7 | 16.2 | |||||||||
| Income/(loss) before provision for income taxes | 11.3 | 6.8 | (19.7 | ) | ||||||||
| Income tax (benefit)/expense | (12.5 | ) | 0.2 | (0.5 | ) | |||||||
| Net income/(loss) from continuing operations | 23.9 | 6.6 | (19.2 | ) | ||||||||
| Income from discontinued operations (net of income tax) | 1.2 | 1.6 | 1.2 | |||||||||
| Net income/(loss) | 25.1 | % | 8.2 | % | (18.0 | )% | ||||||
| 23 |
Results of Operations:
The following discussion and analysis provides information which the Company's management believes is relevant to an assessment and understanding of the Company's results of operations and financial condition. This discussion should be read in conjunction with the consolidated financial statements and notes thereto appearing elsewhere herein. Unless otherwise specified, this discussion relates solely to the Company's continuing operations.
All of the Company's sales have been derived from the sale of medical device products, which include manufacture and distribution of ultrasonic medical device products.
Fiscal years ended June 30, 2015 and 2014:
Net sales:
Net sales increased $5,144,143 to $22,204,578 in fiscal 2015 from $17,060,435 in fiscal 2014. The increase is due to higher BoneScalpel revenue of $3,400,398, higher SonicOne revenue of $1,045,786 and higher SonaStar revenue of $861,224, partially offset by lower Lithotripsy revenue of $81,666, lower service revenue of $51,295 and lower other revenue of $30,304. There were 83 BoneScalpel units consigned in the United States in fiscal 2015 as compared to 59 consigned BoneScalpel units in fiscal 2014.
Set forth below are tables showing the Company’s net sales by (i) product category and (ii) geographic region for the years ended June 30, 2015 and 2014:
| For the years ended ended June 30, | ||||||||||||
| 2015 | 2014 | Variance | ||||||||||
| BoneScalpel | $ | 11,084,084 | $ | 7,683,686 | $ | 3,400,398 | ||||||
| SonicOne | 3,272,826 | 2,227,040 | 1,045,786 | |||||||||
| SonaStar | 7,209,299 | 6,348,075 | 861,224 | |||||||||
| Other | 638,369 | 801,634 | (163,265 | ) | ||||||||
| $ | 22,204,578 | $ | 17,060,435 | $ | 5,144,143 | |||||||
| For the years ended ended June 30, | ||||||||
| 2015 | 2014 | |||||||
| United States | $ | 10,797,920 | $ | 8,185,468 | ||||
| Australia | 364,156 | 120,118 | ||||||
| Europe | 3,385,603 | 2,387,376 | ||||||
| Asia | 4,125,662 | 3,572,056 | ||||||
| Canada and Mexico | 836,188 | 779,833 | ||||||
| South America | 911,711 | 1,165,124 | ||||||
| South Africa | 540,185 | 378,287 | ||||||
| Middle East | 1,243,153 | 472,173 | ||||||
| $ | 22,204,578 | $ | 17,060,435 | |||||
| 24 |
Net sales increased $1,171,289 to $6,749,436 for the three month period ended June 30, 2015 from $5,578,147 for the three month period ended June 30, 2014. The increase is due to higher BoneScalpel revenue of $1,198,526 and higher SonicOne revenue of $490,809, partially offset by lower SonaStar revenue of $505,317 and lower other revenue of $12,729. There were 19 BoneScalpel units consigned in the United States for the three months ended June 30, 2015 as compared to 15 consigned units for the same period in fiscal 2014.
Set forth below are tables showing the Company’s net sales by (i) product category and (ii) geographic region for the three months ended June 30, 2015 and 2014:
| Three months ended June 30, | ||||||||||||
| 2015 | 2014 | Variance | ||||||||||
| BoneScalpel | $ | 3,685,901 | $ | 2,487,375 | $ | 1,198,526 | ||||||
| SonicOne | 984,610 | 493,801 | 490,809 | |||||||||
| SonaStar | 1,940,193 | 2,445,510 | (505,317 | ) | ||||||||
| Other | 138,732 | 151,461 | (12,729 | ) | ||||||||
| $ | 6,749,436 | $ | 5,578,147 | $ | 1,171,289 | |||||||
| Three months ended June 30, | ||||||||
| 2015 | 2014 | |||||||
| United States | $ | 3,088,818 | $ | 2,518,285 | ||||
| Australia | 50,935 | 3,960 | ||||||
| Europe | 794,987 | 799,891 | ||||||
| Asia | 1,366,541 | 1,546,564 | ||||||
| Canada and Mexico | 322,272 | 163,660 | ||||||
| South America | 296,416 | 354,147 | ||||||
| South Africa | 295,034 | 56,190 | ||||||
| Middle East | 534,433 | 135,450 | ||||||
| $ | 6,749,436 | $ | 5,578,147 | |||||
Gross profit:
Gross profit increased to 67.2% in fiscal 2015 from 65.2% in fiscal 2014. The increase is primarily related to higher sales volume as well as a favorable product mix of higher margin product deliveries in fiscal 2105. The higher sales volume resulted in higher coverage of fixed expenses resulting in higher margins.
Gross profit increased to 66.6% for the three months ended June 30, 2015 from 65.4% for the three months ended June 30, 2014. The increase is due to higher sales volume as well as a favorable product mix of higher margin product deliveries for the three months ended June 30, 2015. The higher sales volume resulted in higher coverage of fixed expenses resulting in higher margins.
Selling expenses:
Selling expenses increased $1,789,969 to $9,062,695 in fiscal 2015 from $7,272,726 in fiscal 2014. The increase is related to higher sales commissions of $560,371, higher salary expenses of $484,083 due to increased head count, higher depreciation expense of $233,833 due the increase in the number of demo units used for consignments in the field, higher travel expense of $218,143, higher employee welfare and office expense of $92,426 and higher other expenses of $12,638.
Selling expenses increased $646,030 to $2,492,432 for the three months ended June 30, 2015 from $1,846,402 for the three months ended June 30, 2014. The increase is due to higher salary and benefit expenses of $290,165 due to increased headcount, higher travel expenses of $134,718, higher sales commissions of $108,156, higher depreciation expense of $70,768 and higher consulting and advertising expenses of $44,261, partially offset by lower other expenses of $2,038.
| 25 |
General and administrative expenses:
General and administrative expenses increased $1,292,568 to $5,983,623 in fiscal 2015 from $4,691,055 in fiscal 2014. The increase is due to higher consulting expenses of $616,541 mainly as a result of a onetime expense related to the upgrade of the Company’s information and technology systems, higher non-cash compensation from the issuance of stock options of $410,365, higher stockholder relation expenses of $67,105, higher office expenses of $57,952, higher insurance expenses of $45,964, higher bonus and bank fee expenses of $55,264, higher employment fees of $35,163 and higher other expenses of $4,484.
General and administrative expenses increased $446,595 to $1,619,362 for the three months ended June 30, 2015 from $1,172,767 for the three months ended June 30, 2014. The increase is due to higher non-cash compensation due to the issuance of stock options of $156,940, higher consulting expenses of $102,006 due to one-time expenses related to the upgrade of the Company’s information and technology systems, higher insurance expenses of $60,108, higher bad debt reserve and employee expenses of $78,597, higher office and depreciation expenses of $35,993 and higher other expenses of $12,951.
Research and development expenses:
Research and development expenses decreased $118,828 to $1,592,923 for fiscal 2015 from $1,711,751 for fiscal 2014. The decrease is due to lower product development material expenses of $70,035, lower consulting expenses of $48,151 and lower other expenses of $642.
Research and development expenses increased $25,880 to $423,258 for the three months ended June 30, 2015 from $397,378 for the three months ended June 30 2014. The increase is due to higher temporary help of $13,411, higher employee benefits of $9,172 and higher other expenses of $3,297.
Other income:
Other income increased $528,189 to $4,234,363 in fiscal 2015 from $3,706,174 in fiscal 2104. The increase is related to higher royalty income from Covidien.
Other income decreased $143,550 to $1,026,366 for the three months ended June 30, 2015 from $1,169,916 for the three months ended June 30, 2014. The decrease is due to lower royalty income from Covidien.
Income taxes: In fiscal 2015 and 2014 the income tax benefit for continuing operations had an effective tax rate of (110.5%) as compared to income tax expense with an effective rate of .2% in fiscal 2014. Prior to June 30, 2014 and through March 31, 2015, the Company had a full valuation allowance recorded against deferred tax assets. As of the year ended June 30, 2015, the Company reduced the valuation allowance by $5,503,417. The change in the valuation allowance includes a $1,499,297 write-off of deferred tax assets against its corresponding valuation allowance. The write-off primarily pertains to a loss in tax benefit for net operating losses subject to limitation under federal tax law that preclude its utilization. In addition, during the fourth quarter of fiscal 2015, based on our consideration of all available positive and negative evidence including achieving cumulative profitable operating performance over the past three years and our positive outlook for taxable income in the future, the Company reevaluated its deferred tax asset. Based upon the guidance under ASC 740, we concluded that it was more likely than not that the Company would realize the benefit of such deferred tax assets. The portion of the valuation allowance release attributable to income in future years resulted in the recognition of a tax benefit of $2,892,000 in continuing operations in the fourth quarter of fiscal 2015. The deferred tax asset will be realized against future income tax expense that would be payable in the absence of the net operating loss carryforwards. The Company still maintains a full valuation allowance on foreign net operating losses.
Fiscal years ended June 30, 2014 and 2013:
Net sales:
Net sales increased $2,233,209 to $17,060,435 in fiscal 2014 from $14,827,226 in fiscal 2013. The increase is due to higher BoneScalpel revenue of $1,340,540, higher SonaStar revenue of $1,037,032 and higher SonicOne revenue of $369,644, partially offset by lower service revenue of $385,202, lower Lysonix revenue of $114,679 and lower other revenue of $14,126.
| 26 |
Set forth below are tables showing the Company’s net sales by (i) product category and (ii) geographic region for the years ended June 30, 2014 and 2013:
| For the years ended June 30, | ||||||||||||
| 2014 | 2013 | Variance | ||||||||||
| BoneScalpel | $ | 7,683,686 | $ | 6,343,146 | $ | 1,340,540 | ||||||
| SonicOne | 2,227,040 | 1,857,396 | 369,644 | |||||||||
| SonaStar | 6,348,075 | 5,311,043 | 1,037,032 | |||||||||
| Other | 801,634 | 1,315,641 | (514,007 | ) | ||||||||
| $ | 17,060,435 | $ | 14,827,226 | $ | 2,233,209 | |||||||
| For the years ended June 30, | ||||||||
| 2014 | 2013 | |||||||
| United States | $ | 8,185,468 | $ | 7,649,041 | ||||
| Australia | 120,118 | 358,509 | ||||||
| Europe | 2,387,376 | 3,062,307 | ||||||
| Asia | 3,572,056 | 1,619,255 | ||||||
| Canada and Mexico | 779,833 | 516,088 | ||||||
| South America | 1,165,124 | 735,060 | ||||||
| South Africa | 378,287 | 489,756 | ||||||
| Middle East | 472,173 | 397,210 | ||||||
| $ | 17,060,435 | $ | 14,827,226 | |||||
Net sales for the three months ended June 30, 2014 were $5,578,147, an increase of $1,819,164 from $3,758,983 for the three months ended June 30, 2013. The increase is due to higher SonaStar revenue of $1,047,342, higher BoneScalpel revenue of $975,434, higher SonicOne revenue of $63,614 and higher other revenue of $1,521, partially offset by lower Lysonix revenue of $168,386 and lower service revenue of $100,361.
Set forth below are tables showing the Company’s net sales by (i) product category and (ii) geographic region for the three months ended June 30, 2014 and 2013:
| Three months ended June 30, | ||||||||||||
| 2014 | 2013 | Variance | ||||||||||
| BoneScalpel | $ | 2,487,375 | $ | 1,511,941 | $ | 975,434 | ||||||
| SonicOne | 493,801 | 430,187 | 63,614 | |||||||||
| SonaStar | 2,445,510 | 1,398,168 | 1,047,342 | |||||||||
| Other | 151,461 | 418,687 | (267,226 | ) | ||||||||
| $ | 5,578,147 | $ | 3,758,983 | $ | 1,819,164 | |||||||
| Three months ended June 30, | ||||||||
| 2014 | 2013 | |||||||
| United States | $ | 2,518,285 | $ | 1,996,969 | ||||
| Australia | 3,960 | 37,135 | ||||||
| Europe | 799,891 | 762,499 | ||||||
| Asia | 1,546,564 | 525,776 | ||||||
| Canada and Mexico | 163,660 | 79,350 | ||||||
| South America | 354,147 | 156,680 | ||||||
| South Africa | 56,190 | 126,327 | ||||||
| Middle East | 135,450 | 74,247 | ||||||
| $ | 5,578,147 | $ | 3,758,983 | |||||
| 27 |
Gross profit:
Gross profit increased to 65.2% in fiscal 2014 from 49.9% in fiscal 2013. The increase is primarily due to the reversal of $438,509 of Soma related costs previously accrued in fiscal 2013 in accordance with the PuriCore Settlement Agreement (see Note 8 to Consolidated Financial Statements included in this Annual Report) in addition to $638,000 of Soma-related costs booked in fiscal 2013, in addition to inventory reserves booked in the fourth quarter 2013.
Gross profit increased to 65.4% for the three months ended June 30, 2014 from 34.2% for the three months ended June 30, 2013. The increase is primarily related to Soma-related costs of approximately $189,000 and inventory reserves of approximately $610,000 booked against the Soma and Anika inventory in fiscal 2013.
Selling expenses:
Selling expenses increased $496,522 to $7,272,726 (42% of sales) in fiscal 2014 from $6,776,204 (46% of sales) in fiscal 2013. The increase is due to higher sales commissions of $765,711, higher depreciation expense of $176,598 (due to the increase in number of demonstration units placed in the field) and higher other expenses of $3,779, partially offset by lower personnel expenses of $221,248 and lower travel expenses of $228,318.
Selling expenses for the three months ended June 30, 2014 decreased $160,935 to $1,846,402 (33% of sales) from $2,007,337 (53% of sales) for the three months ended June 30, 2013. The decrease is due to lower personnel costs of $167,154, lower travel expenses of $144,452 and lower advertising expenses of $69,751, partially offset by higher sales commission expenses of $215,479 and higher other expenses of $4,943.
General and administrative expenses:
General and administrative expenses increased $244,566 to $4,691,055 in fiscal 2014 from $4,446,489 in fiscal 2013. The increase is related to higher non-cash compensation expenses from the issuance of stock options of $208,413, higher legal expenses of $45,167 and higher accounting and travel expenses of $42,132, partially offset by lower bad debt expense of $50,000 and other lower expenses of $1,145.
For the three months ended June 30, 2014, general and administrative expenses increased $16,949 to $1,172,767 from $1,155,818 for the three months ended June 30, 2013. The increase is primarily related to higher non-cash compensation expenses from the issuance of stock options of $55,468 and other higher expenses of $6,428, partially offset by lower consulting expenses of $44,947.
Research and development expenses:
Research and development expenses increased $215,693 to $1,711,751 in fiscal 2014 from $1,496,058 in fiscal 2013. The increase in research and development expenses is due to higher product development material costs of $75,625, higher temporary help expenses of $57,592, higher legal expenses of $34,246, higher amortization expense of $24,099 and other higher expenses of $24,131.
For the three months ended June 30, 2014, research and development expenses increased $44,609 to $397,378 from $352,769 for the three months ended June 30, 2013. The increase is due to higher product development labor expenses of $21,331, higher legal expenses of $18,849 and higher other expenses of $4,429.
Other income:
Other income increased $1,309,345 to $3,706,174 in fiscal 2014 from $2,396,829 in fiscal 2013. The increase in other income is related to higher royalty income from Covidien of $1,213,781.
Other income increased $486,502 to $1,169,916 for the three months ended June 30, 2014 from $683,414 for the three months ended June 30, 2013. The increase is due to higher royalty income from Covidien of $431,110.
Income taxes: In fiscal 2014 and 2013 the income tax benefit for continuing operations had an effective tax rate of .2%. Overall, when considering discontinued operations, the Company had minimal income tax expense. In prior years the Company established a valuation allowance against deferred tax assets due to the net loss from operations over the past 5 years which caused management to conclude that it is more likely than not that its deferred tax assets may not be fully realized.
| 28 |
Discontinued operations:
The following represents the results of the Laboratory and Forensic Safety Products business along with legal and other expenses associated with Labcaire Systems Limited and Misonix HIFU Technologies Limited which are included in discontinued operations:
| For the years ended | ||||||||||||
| June 30, | ||||||||||||
| 2015 | 2014 | 2013 | ||||||||||
| Revenues | $ | 18,242 | $ | 19,901 | $ | 19,901 | ||||||
| Income from discontinued operations, before tax | $ | 18,242 | $ | 19,901 | $ | 5,449 | ||||||
| Gain on sale of discontinued operations | 250,000 | 250,000 | 250,000 | |||||||||
| Income tax expense | (1,127 | ) | (3,182 | ) | (79,667 | ) | ||||||
| Net income from discontinued operations, net of tax | $ | 267,115 | $ | 266,719 | $ | 175,782 | ||||||
See Note 1 of the Notes to Consolidated Financial Statements included in Item 8 of this Annual Report for further discussion of the nature of discontinued operations.
Liquidity and Capital Resources:
Working capital at June 30, 2015 and 2014 was $18,289,000 and $12,277,000, respectively. For the fiscal year ended June 30, 2015, cash provided by operations totaled $2,371,339, mainly due to higher net income, partially offset by higher inventory and accounts receivable. For the fiscal year ended June 30, 2015, cash used in investing activities totaled $778,203, primarily consisting of the purchase of property, plant and equipment along with filing for additional patents. For the fiscal year ended June 30, 2015, cash provided by financing activities was $723,560. Cash provided by discontinued operations was $267,115.
As of June 30, 2015, the Company had a cash balance of $9,623,949 and believes it has sufficient cash to finance operations for at least the next 12 months.
The Company maintains cash balances at various financial institutions. At June 30, 2015, these financial institutions held cash that was approximately $9,375,735 in excess of amounts insured by the Federal Deposit Insurance Corporation.
Commitments
The Company has commitments under operating leases that will be funded from operating sources. At June 30, 2015, the Company’s contractual cash obligations and commitments relating to operating leases are as follows:
| Less than | After | |||||||||||||||||||
| Commitment | 1 year | 1-3 years | 4-5 years | 5 years | Total | |||||||||||||||
| Operating leases | 347,038 | 675,427 | - | - | 1,022,465 | |||||||||||||||
| Purchase commitments | 2,982,198 | - | - | - | 2,982,198 | |||||||||||||||
| $ | 3,329,236 | $ | 675,427 | $ | - | $ | - | $ | 4,004,663 | |||||||||||
Off-Balance Sheet Arrangements
The Company has no off-balance sheet arrangements that have or are reasonably likely to have a current or future effect on the Company's financial condition, changes in financial condition, revenues or expenses, results of operations, liquidity, capital expenditures or capital resources that is material to the Company.
Other
In the opinion of management, inflation has not had a material effect on the operations of the Company.
| 29 |
Critical Accounting Policies:
New Accounting Pronouncements:
We are required to adopt certain new accounting pronouncements. See Note 1 to our consolidated financial statements included as part of this Annual Report.
General: Note 1 of the Notes to Consolidated Financial Statements included in this Annual Report includes a summary of the Company's significant accounting policies and methods used in the preparation of its financial statements. The Company's discussion and analysis of its financial condition and results of operations is based upon the Company's financial statements, which have been prepared in accordance with accounting principles generally accepted in the United States. The preparation of these financial statements requires the Company to make estimates and judgments that affect the reported amounts of assets, liabilities, revenues and expenses. On an on-going basis, management evaluates its estimates and judgments, including those related to bad debts, inventories, goodwill, property, plant and equipment, stock-based compensation and income taxes. Management bases its estimates and judgments on historical experience and on various other factors that are believed to be reasonable under the circumstances, the results of which form the basis for making judgments about the carrying values of assets and liabilities that are not readily apparent from other sources. Actual results may differ from these estimates under different assumptions or conditions. The Company believes that the following are our more critical estimates and assumptions used in the preparation of our consolidated financial statements:
Accounts Receivable and Allowance for Doubtful Accounts: Accounts receivable, principally trade, are generally due within 30 to 90 days and are stated at amounts due from customers, net of an allowance for doubtful accounts. The Company performs ongoing credit evaluations and adjusts credit limits based upon payment history and the customer's current credit worthiness, as determined by a review of their current credit information. The Company continuously monitors aging reports, collections and payments from customers and maintains a provision for estimated credit losses based upon historical experience and any specific customer collection issues that have been identified. While such credit losses have historically been within expectations and the provisions established, the Company cannot guarantee the same credit loss rates will be experienced in the future. The Company writes off accounts receivable when they become uncollectible.
Inventories: Inventories, consisting of purchased materials, direct labor and manufacturing overhead, are stated at the lower of cost (determined by the first-in, first-out method) or market. At each balance sheet date, we evaluate ending inventories for excess quantities and obsolescence. Our evaluation includes an analysis of historical sales by product, projections of future demand by product, the risk of technological or competitive obsolescence for our products, general market conditions, and the feasibility of reworking or using excess or obsolete products or components in the production or assembly of other products that are not obsolete or for which we do not have excess quantities in inventory. The Company also, based upon market conditions, determines the level of safety stock for key disposables so that there is always adequate product on hand to fulfill customer demand. To the extent that we determine that there are excess or obsolete quantities, we record valuation reserves against all or a portion of the value of the related products to adjust their carrying value to estimated net realizable value. If future demand or market conditions are different from our projections, or if we are unable to rework excess or obsolete quantities into other products, we may change the recorded amount of inventory valuation reserves through a charge or reduction in cost of product revenues in the period the revision is made.
Long Lived Assets: Property, plant and equipment are recorded at cost. Minor replacements and maintenance and repair expenses are charged to expense as incurred. Depreciation of property and equipment is provided using the straight-line method over estimated useful lives ranging from 3 to 5 years. Leasehold improvements are amortized over the life of the lease or the useful life of the related asset, whichever is shorter. Inventory items included in property, plant and equipment are depreciated using the straight line method over estimated useful lives of 3 to 5 years. We evaluate long-lived assets, including property, plant and equipment and intangible assets other than goodwill, for impairment whenever events or changes in circumstances indicate that the carrying amounts of specific assets or group of assets may not be recoverable. When an evaluation is required, we estimate the future undiscounted cash flows associated with the specific asset or group of assets. If the cost of the asset or group of assets cannot be recovered by these undiscounted cash flows, an impairment charge would be recorded. Our estimates of future cash flows are based on our experience and internal business plans. Our internal business plans require judgments regarding future economic conditions, product demand and pricing. Although we believe our estimates are appropriate, significant differences in the actual performance of an asset or group of assets may materially affect our evaluation of the recoverability of the asset values currently recorded.
Revenue Recognition: The Company records revenue upon shipment for products shipped F.O.B. shipping point. Products shipped F.O.B. destination points are recorded as revenue when received at the point of destination. Shipments under agreements with distributors are not subject to return and payment for these shipments is not contingent on sales by the distributor. Accordingly, the Company recognizes revenue on shipments to distributors in the same manner as with other customers. Service contract income is recognized when earned.
| 30 |
Goodwill: Goodwill is not amortized. We review goodwill for impairment annually and whenever events or changes indicate that the carrying value of an asset may not be recoverable. These events or circumstances could include a significant change in the business climate, legal factors, operating performance indicators, competition, or sale or disposition of significant assets or products. Application of these impairment tests requires significant judgments, including estimation of cash flows, which is dependent on internal forecasts, estimation of the long-term rate of growth for our business, the useful life over which cash flows will occur and determination of our weighted-average cost of capital. Changes in the projected cash flows and discount rate estimates and assumptions underlying the valuation of goodwill could materially affect the determination of fair value at acquisition or during subsequent periods when tested for impairment. The Company completed its annual goodwill impairment tests for fiscal 2015 and 2014 in the respective fourth quarter. No impairment of goodwill was deemed to exist.
Income Taxes: Income taxes are accounted for under ASC 740 authoritative guidance (“Guidance”) which requires the asset and liability method of accounting for deferred income taxes. Deferred tax assets and liabilities are determined based on the difference between the financial statement and tax bases of assets and liabilities. Deferred tax assets or liabilities at the end of each period are determined using the tax rate expected to be in effect when taxes are actually paid or recovered.
The Guidance also requires that a valuation allowance be established when it is more likely than not that all or a portion of a deferred tax asset will not be realized. A review of all available positive and negative evidence needs to be considered, including a company’s current and past performance, the market environment in which the company operates, length of carryback and carryforward periods and existing contracts that will result in future profits. Prior to June 30, 2014 and through March 31, 2015, the Company had a full valuation allowance recorded against deferred tax assets since it was not more likely than not that the Company would realize the benefits of such deferred tax assets. During the fourth quarter of fiscal 2015, the Company determined based upon the Guidance that it was more likely than not that it would realize the benefit of such deferred tax assets. As result, the Company reversed the valuation allowance previously recorded against the deferred tax assets. The Company still maintains a full valuation allowance on foreign net operating losses and federal net operating losses subject to the separate return loss rules.
The Guidance also prescribes a comprehensive model for recognizing, measuring, presenting and disclosing in the consolidated financial statements tax positions taken or expected to be taken on a tax return, including a decision whether to file or not to file in a particular jurisdiction.
Stock-Based Compensation: The fair value of the Company’s outstanding stock options is estimated based upon option price, volatility, the risk free rate, and the average time the shares are held. It is then amortized over the vesting period. See Note 7 of Notes to Consolidated Financial Statements included in this Annual Report for additional information regarding stock-based compensation.
Item 7A. Quantitative and Qualitative Disclosures About Market Risk.
Market Risk:
The principal market risks (i.e., the risk of loss arising from adverse changes in market rates and prices) to which the Company is exposed are interest rates on cash and certain items in inventory.
| 31 |
Item 8. Financial Statements and Supplemental Data.
The Company’s report of independent registered public accounting firm and consolidated financial statements listed in the accompanying index is filed as part of this Annual Report. See “Index to Consolidated Financial Statements” on page F-1.
QUARTERLY RESULTS OF OPERATIONS
The following table presents selected financial data for each quarter of fiscal 2015, 2014 and 2013. Although unaudited, this information has been prepared on a basis consistent with the Company’s audited consolidated financial statements and, in the opinion of the Company’s management, reflects all adjustments (consisting only of normal recurring adjustments) that the Company considers necessary for a fair presentation of this information in accordance with accounting principles generally accepted in the United States. Such quarterly results are not necessarily indicative of future results of operations and should be read in conjunction with the audited consolidated financial statements of the Company and the notes thereto.
| FISCAL 2015 | ||||||||||||||||||||
| Q1 | Q2 | Q3 | Q4 | YEAR | ||||||||||||||||
| Net sales | $ | 4,539,337 | $ | 5,601,008 | $ | 5,314,797 | $ | 6,749,436 | $ | 22,204,578 | ||||||||||
| Cost of goods sold | 1,586,105 | 1,767,175 | 1,670,359 | 2,256,637 | 7,280,276 | |||||||||||||||
| Gross profit | 2,953,232 | 3,833,833 | 3,644,438 | 4,492,799 | 14,924,302 | |||||||||||||||
| Operating expenses: | ||||||||||||||||||||
| Selling expenses | 2,019,286 | 2,085,174 | 2,465,803 | 2,492,432 | 9,062,695 | |||||||||||||||
| General and administrative expenses | 1,246,078 | 1,534,784 | 1,583,399 | 1,619,362 | 5,983,623 | |||||||||||||||
| Research and development expenses | 437,591 | 324,301 | 407,773 | 423,258 | 1,592,923 | |||||||||||||||
| Total operating expenses | 3,702,955 | 3,944,259 | 4,456,975 | 4,535,052 | 16,639,241 | |||||||||||||||
| Loss from operations | (749,723 | ) | (110,426 | ) | (812,537 | ) | (42,253 | ) | (1,714,939 | ) | ||||||||||
| Other income/(expense): | ||||||||||||||||||||
| Interest income | 25 | 19 | 12 | 19 | 75 | |||||||||||||||
| Royalty income and license fees | 1,147,951 | 1,044,941 | 1,032,027 | 1,031,402 | 4,256,321 | |||||||||||||||
| Other | (5,679 | ) | (4,847 | ) | (6,452 | ) | (5,055 | ) | (22,033 | ) | ||||||||||
| Total other income | 1,142,297 | 1,040,113 | 1,025,587 | 1,026,366 | 4,234,363 | |||||||||||||||
| Income from continuing operations before income taxes | 392,574 | 929,687 | 213,050 | 984,113 | 2,519,424 | |||||||||||||||
| Income tax expense/(benefit) | 14,352 | 33,465 | 8,406 | (2,840,855 | ) | (2,784,632 | ) | |||||||||||||
| Net income from continuing operations | $ | 378,222 | $ | 896,222 | $ | 204,644 | $ | 3,824,968 | $ | 5,304,056 | ||||||||||
| Discontinued operations: | ||||||||||||||||||||
| Net income from discontinued operations net of income tax expense/(benefit) of $0, $0, $5,280 and ($4,153), respectively | 4,975 | 4,975 | 249,696 | 7,469 | 267,115 | |||||||||||||||
| Net income from discontinued operations | 4,975 | 4,975 | 249,696 | 7,469 | 267,115 | |||||||||||||||
| Net income | $ | 383,197 | $ | 901,197 | $ | 454,340 | $ | 3,832,437 | $ | 5,571,171 | ||||||||||
| Net income per share from continuing operations - Basic | $ | 0.05 | $ | 0.12 | $ | 0.03 | $ | 0.50 | $ | 0.70 | ||||||||||
| Net income per share from discontinued operations - Basic | 0.00 | 0.00 | 0.03 | 0.00 | 0.04 | |||||||||||||||
| Net income per share - Basic | $ | 0.05 | $ | 0.12 | $ | 0.06 | $ | 0.50 | $ | 0.74 | ||||||||||
| Net income per share from continuing operations - Diluted | $ | 0.05 | $ | 0.11 | $ | 0.02 | $ | 0.46 | $ | 0.66 | ||||||||||
| Net income per share from discontinued operations - Diluted | 0.00 | 0.00 | 0.03 | 0.00 | 0.03 | |||||||||||||||
| Net income per share - Diluted | $ | 0.05 | $ | 0.11 | $ | 0.05 | $ | 0.46 | $ | 0.69 | ||||||||||
| 32 |
| FISCAL 2014 | ||||||||||||||||||||
| Q1 | Q2 | Q3 | Q4 | YEAR | ||||||||||||||||
| Net sales | $ | 3,075,584 | $ | 4,122,059 | $ | 4,284,645 | $ | 5,578,147 | $ | 17,060,435 | ||||||||||
| Cost of goods sold | 1,345,330 | 1,229,409 | A | 1,431,766 | 1,927,362 | 5,933,867 | ||||||||||||||
| Gross profit | 1,730,254 | 2,892,650 | 2,852,879 | 3,650,785 | 11,126,568 | |||||||||||||||
| Operating expenses: | ||||||||||||||||||||
| Selling expenses | 1,828,830 | 1,683,699 | 1,913,795 | 1,846,402 | 7,272,726 | |||||||||||||||
| General and administrative expenses | 1,221,315 | 1,120,926 | 1,176,047 | 1,172,767 | 4,691,055 | |||||||||||||||
| Research and development expenses | 472,888 | 435,019 | 406,466 | 397,378 | 1,711,751 | |||||||||||||||
| Total operating expenses | 3,523,033 | 3,239,644 | 3,496,308 | 3,416,547 | 13,675,532 | |||||||||||||||
| (Loss)/income from operations | (1,792,779 | ) | (346,994 | ) | (643,429 | ) | 234,238 | (2,548,964 | ) | |||||||||||
| Other income/(expense): | ||||||||||||||||||||
| Interest income | 19 | 19 | 18 | 13 | 69 | |||||||||||||||
| Royalty income and license fees | 912,794 | 809,392 | 830,702 | 1,172,548 | 3,725,436 | |||||||||||||||
| Other | (6,261 | ) | (5,304 | ) | (5,121 | ) | (2,645 | ) | (19,331 | ) | ||||||||||
| Total other income | 906,552 | 804,107 | 825,599 | 1,169,916 | 3,706,174 | |||||||||||||||
| (Loss)/income from continuing operations before income taxes | (886,227 | ) | 457,113 | 182,170 | 1,404,154 | 1,157,210 | ||||||||||||||
| Income tax expense | 2,750 | 2,750 | 8,376 | 16,754 | 30,630 | |||||||||||||||
| Net (loss)/income from continuing operations | $ | (888,977 | ) | $ | 454,363 | $ | 173,794 | $ | 1,387,400 | $ | 1,126,580 | |||||||||
| Discontinued operations: | ||||||||||||||||||||
| Net income from discontinued operations net of income tax expense of $0, $0, $0 and $3,182, respectively | 4,975 | 4,975 | 254,976 | 1,793 | 266,719 | |||||||||||||||
| Net income from discontinued operations | 4,975 | 4,975 | 254,976 | 1,793 | 266,719 | |||||||||||||||
| Net (loss)/income | $ | (884,002 | ) | $ | 459,338 | $ | 428,770 | $ | 1,389,193 | $ | 1,393,299 | |||||||||
| Net (loss)/income per share from continuing operations - Basic | $ | (0.12 | ) | $ | 0.06 | $ | 0.02 | $ | 0.19 | $ | 0.15 | |||||||||
| Net income per share from discontinued operations - Basic | 0.00 | 0.00 | 0.04 | 0.00 | 0.04 | |||||||||||||||
| Net (loss)/income per share - Basic | $ | (0.12 | ) | $ | 0.06 | $ | 0.06 | $ | 0.19 | $ | 0.19 | |||||||||
| Net (loss)/income per share from continuing operations - Diluted | $ | (0.12 | ) | $ | 0.06 | $ | 0.02 | $ | 0.18 | $ | 0.15 | |||||||||
| Net income per share from discontinued operations - Diluted | 0.00 | 0.00 | 0.03 | 0.00 | 0.04 | |||||||||||||||
| Net (loss)/income per share - Diluted | $ | (0.12 | ) | $ | 0.06 | $ | 0.05 | $ | 0.18 | $ | 0.19 | |||||||||
| A. | Includes the reversal of $439,508 of previously accrued and unpaid contractual gross profit requirements pursuant to a signed Settlement Agreement. |
| 33 |
| FISCAL 2013 | ||||||||||||||||||||
| Q1 | Q2 | Q3 | Q4 | YEAR | ||||||||||||||||
| Net sales | $ | 4,570,525 | $ | 3,474,231 | $ | 3,023,487 | $ | 3,758,983 | $ | 14,827,226 | ||||||||||
| Cost of goods sold | 1,843,899 | 1,626,965 | 1,482,329 | 2,474,054 | B | 7,427,247 | ||||||||||||||
| Gross profit | 2,726,626 | 1,847,266 | 1,541,158 | 1,284,929 | 7,399,979 | |||||||||||||||
| Operating expenses: | ||||||||||||||||||||
| Selling expenses | 1,458,564 | 1,545,585 | 1,764,718 | 2,007,337 | 6,776,204 | |||||||||||||||
| General and administrative expenses | 1,042,332 | 1,092,726 | 1,155,613 | 1,155,818 | 4,446,489 | |||||||||||||||
| Research and development expenses | 397,131 | 366,257 | 379,901 | 352,769 | 1,496,058 | |||||||||||||||
| Total operating expenses | 2,898,027 | 3,004,568 | 3,300,232 | 3,515,924 | 12,718,751 | |||||||||||||||
| Loss from operations | (171,401 | ) | (1,157,302 | ) | (1,759,074 | ) | (2,230,995 | ) | (5,318,772 | ) | ||||||||||
| Other income/(expense): | ||||||||||||||||||||
| Interest income | 13 | 25 | 18 | 19 | 75 | |||||||||||||||
| Interest expense | - | - | - | (7 | ) | (7 | ) | |||||||||||||
| Royalty income and license fees | 222,679 | 522,385 | 1,025,153 | 741,438 | 2,511,655 | |||||||||||||||
| Royalty(expense)/recovery | (3,698 | ) | (1,415 | ) | (182 | ) | (8,066 | ) | (13,361 | ) | ||||||||||
| Other | (7,577 | ) | (18,608 | ) | (25,378 | ) | (49,970 | ) | (101,533 | ) | ||||||||||
| Total other income | 211,417 | 502,387 | 999,611 | 683,414 | 2,396,829 | |||||||||||||||
| Income/(loss) from continuing operations before income taxes | 40,016 | (654,915 | ) | (759,463 | ) | (1,547,581 | ) | (2,921,943 | ) | |||||||||||
| Income tax expense/(benefit) | 1,500 | 2,329 | (59,126 | ) | (19,899 | ) | (75,196 | ) | ||||||||||||
| Net income/(loss) from continuing operations | $ | 38,516 | $ | (657,244 | ) | $ | (700,337 | ) | $ | (1,527,682 | ) | $ | (2,846,747 | ) | ||||||
| Discontinued operations: | ||||||||||||||||||||
| Net income/(loss) from discontinued operations net of income tax expense/(benefit) of $0, $0, $82,968 and $(3,301), respectively | 6,318 | 3,475 | 172,007 | (6,018 | ) | 175,782 | ||||||||||||||
| Net income/(loss) from discontinued operations | 6,318 | 3,475 | 172,007 | (6,018 | ) | 175,782 | ||||||||||||||
| Net income/(loss) | $ | 44,834 | $ | (653,769 | ) | $ | (528,330 | ) | $ | (1,533,700 | ) | $ | (2,670,965 | ) | ||||||
| Net income/(loss) per share from continuing operations - Basic | $ | 0.01 | $ | (0.09 | ) | $ | (0.10 | ) | $ | (0.22 | ) | $ | (0.40 | ) | ||||||
| Net income per share from discontinued operations - Basic | - | - | 0.02 | - | 0.02 | |||||||||||||||
| Net income/(loss) per share - Basic | $ | 0.01 | $ | (0.09 | ) | $ | (0.08 | ) | $ | (0.22 | ) | $ | (0.38 | ) | ||||||
| Net income/(loss) per share from continuing operations - Diluted | $ | 0.01 | $ | (0.09 | ) | $ | (0.10 | ) | $ | (0.22 | ) | $ | (0.40 | ) | ||||||
| Net income per share from discontinued operations - Diluted | - | - | 0.02 | - | 0.02 | |||||||||||||||
| Net income/(loss) per share - Diluted | $ | 0.01 | $ | (0.09 | ) | $ | (0.08 | ) | $ | (0.22 | ) | $ | (0.38 | ) | ||||||
| B. | Includes additional inventory reserves of $835,000. |
| 34 |
Item 9. Changes in and Disagreements With Accountants on Accounting and Financial Disclosure.
Not applicable.
Item 9A. Controls and Procedures.
Evaluation of Disclosure Controls and Procedures
We maintain disclosure controls and procedures (as defined in Rule 13a-15(e) of the Securities Exchange Act of 1934, as amended ("Exchange Act")) that are designed to assure that information required to be disclosed in our Exchange Act reports is recorded, processed, summarized and reported within the time periods specified in the rules and forms of the SEC, and that such information is accumulated and communicated to management, including our principal executive officer and principal financial officer, as appropriate, to allow timely decisions regarding required disclosures.
As required by Exchange Act Rule 13a-15(b), as of the end of the period covered by this Annual Report, under the supervision and with the participation of our principal executive officer and principal financial officer, we evaluated the effectiveness of our disclosure controls and procedures. Based on this evaluation, our principal executive officer and principal financial officer concluded that our disclosure controls and procedures were effective as of that date.
Management's Report on Internal Control over Financial Reporting
Our management is responsible for establishing and maintaining adequate internal control over financial reporting as defined in Exchange Act Rule 13a-15(f). Our internal control system was designed to provide reasonable assurance to our management and Board of Directors of adequate preparation and fair presentation of the published financial statements.
All internal control systems, no matter how well designed, have inherent limitations. Therefore, even those systems determined to be effective can provide only reasonable assurance with respect to the adequacy of financial statement preparation and presentation. Our management assessed the effectiveness of the Company’s internal control over financial reporting as of June 30, 2015. In making this assessment, management used the criteria set forth by the Committee of Sponsoring Organizations of the Treadway Commission (COSO) in Internal Control-Integrated Framework (2013 framework). Based on our assessment, we believe that as of June 30, 2015, the Company’s internal control over financial reporting is operating as designed and is effective based on those criteria.
Misonix’s independent registered public accounting firm has audited our internal control over financial reporting as of June 30, 2015 as stated in their report which is included herein.
| 35 |
Because of its inherent limitations, internal control over financial reporting may not prevent or detect misstatements. Also, projections of any evaluation of effectiveness to future periods are subject to the risk that controls may become inadequate because of changes in conditions, or that the degree of compliance with the policies or procedures may deteriorate.
Changes in Internal Control over Financial Reporting.
There were no changes in our internal control over financial reporting during the fourth quarter of 2015 that have materially affected or are reasonably likely to materially affect our internal control over financial reporting.
Inherent Limitations on Effectiveness of Controls.
Our management, including our Chief Executive Officer and our Chief Financial Officer, does not expect that our disclosure controls or our internal control over financial reporting will prevent or detect all error and all fraud. A control system, no matter how well designed and operated, can provide only reasonable, not absolute, assurance that the control system’s objectives will be met. Our disclosure controls and procedures are designed to provide reasonable assurance of achieving their objectives. The design of a control system must reflect the fact that there are resource constraints, and the benefits of controls must be considered relative to their costs. Further, because of the inherent limitations in all control systems, no evaluation of controls can provide absolute assurance that misstatements due to error or fraud will not occur or that all control issues and instances of fraud, if any, within the Company have been detected. These inherent limitations include the realities that judgments in decision-making can be faulty and that breakdowns can occur because of simple error or mistake. Controls can also be circumvented by the individual acts of some persons, by collusion of two or more people, or by management override of the controls. The design of any system
None.
| 36 |
Item 10. Directors, Executive Officers of the Registrant and Corporate Governance.
The Company currently has six Directors (the “Board”). Their term expires at the next Annual Meeting of Shareholders. The following table contains information regarding all Directors and executive officers of the Company:
| Director | |||||||
| Name | Age | Principal Occupation | Since | ||||
| John W. Gildea | 72 | Director | 2004 | ||||
| Dr. Charles Miner III | 64 | Director | 2005 | ||||
| T. Guy Minetti | 64 | Director | 2003 | ||||
| Stavros G. Vizirgianakis | 45 | Director | 2013 | ||||
| Patrick A. McBrayer | 62 | Director | 2014 | ||||
| Michael A. McManus, Jr. | 72 | Director, President and Chief Executive Officer | 1998 | ||||
| Richard A. Zaremba | 59 | Senior Vice President, Chief Financial Officer, Secretary and Treasurer | - | ||||
| Robert S. Ludecker | 48 | Senior Vice President, Global Sales and Marketing | - | ||||
| Dan Voic | 53 | Vice President of Research and Development and Engineering | - | ||||
| Joseph J. Brennan | 52 | Vice President of Operations | - | ||||
| John J. Salerno | 60 | Vice President of Quality and Regulatory Affairs | - | ||||
| Michael L. Consilvio | 52 | Vice President of Marketing | - |
The following is a brief account of the business experience of the Company's Directors and executive officers:
John W. Gildea is the founding principal of Gildea Management Co., a management company of special situations with middle market companies in the United States and Central Europe (“Gildea Management”). From 2000 to 2003, Gildea Management formed a joint venture with J.O. Hambro Capital Management Co. to manage accounts targeting high yield debt and small capitalization equities. From 1996 to 2000, Gildea Management formed and founded Latona Europe, a joint venture between Latona U.S., Lazard Co. and Gildea Management to restructure several Czech Republic companies. Before forming Gildea Management in 1990, Mr. Gildea managed the Corporate Services Group at Donaldson, Lufkin and Jenrette, an investment banking firm. Mr. Gildea is a graduate of the University of Pittsburgh.
Mr. Gildea has extensive experience as an international investment banker and sits on the board of several companies. The Board believes this experience in addition to his experience as a Director of Misonix and knowledge of the Company qualifies him to serve as a Director.
| 37 |
Dr. Charles Miner III currently practices internal medicine in Darien, Connecticut. Dr. Miner is on staff at Stamford and Norwalk Hospitals and since 1982 has held a teaching position at Columbia Presbyterian Hospital. Dr. Miner received his M.D. from the University of Cincinnati College of Medicine in 1979 and received a Bachelor of Science from Lehigh University in 1974.
Dr. Miner is an experienced physician and teacher in the medical field. He serves on the board of private companies. The Board believes his experience as a medical doctor and his corporate experience qualifies him to serve as a Director.
T. Guy Minetti is currently a Managing Director of Eos Partners (“Eos”), a New York City-based real estate consulting firm. Before joining Eos in March 2014, he was employed as an advisor to Level Four Orthotics and Prosthetics, Inc., a specialty healthcare company which designs and sells customized and prefabricated prosthetic and orthotic products. Until August 2012, he served as Chief Executive Officer of TwigTek, Inc., a company engaged in the remarketing and recycling of used electronics. Prior to joining TwigTek in November 2009, he founded and was the Managing Director of Senior Resource Advisors LLC. Mr. Minetti served as the Vice Chairman of the Board of Directors of 1-800-Flowers.Com, a publicly traded specialty gift retailer based in Westbury, New York. Before joining 1-800-Flowers.Com in 2000, Mr. Minetti was a Managing Director of Bayberry Advisors, an investment banking boutique he founded in 1989 to provide corporate finance advisory services to small-to-medium-sized business. From 1981 through 1989, Mr. Minetti was a Managing Director of the investment banking firm, Kidder, Peabody & Company. While at Kidder, Peabody, Mr. Minetti worked in the investment banking and high yield bond departments. Mr. Minetti is a graduate of St. Michael’s College.
Mr. Minetti has extensive experience as an investment banker and as a director of a public company. The Board believes this experience in addition to his marketing, financial and management experience and experience as a Director of Misonix qualifies him to serve as a Director.
Stavros G. Vizirgianakis has a distinguished career in the medical devices field having worked for United States Surgical Corporation as director of sales for sub-Saharan Africa and later Tyco Healthcare in the capacity of General Manager South Africa. In 2006, Mr. Vizirgianakis co-founded Surgical Innovations, which has become one of the largest privately owned medical device distributors in the African region, and now part of the Johannesburg Stock Exchange listed entity Healthcare Ascendis. See “Transactions with Related Persons”. Mr. Vizirgianakis also serves on the board of Tenaxis Medical and is a strategic investor and advisor to numerous medical device startups and established companies in this field. Mr. Vizirgianakis has a degree in commerce from the University of South Africa.
The Board believes Mr. Vizirgianakis’ industry knowledge, sales and marketing experience and his vast international business relationships qualify him to serve as a Director.
Patrick A. McBrayer has served as President and Chief Executive Officer and as a director of privately-held AxioMed Spine Corporation (“AxioMed”) from February 2006 to the present time. AxioMed is a medical device company focused on restoring the natural function of the spine. Prior to joining AxioMed, he held positions with Xylos Corporation (medical biomaterials); Exogen, Inc. (treatment of musculoskeletal injury and disease); Osteotech, Inc. (tissue technology); and Johnson and Johnson Products, Inc. (healthcare products). Mr. McBrayer holds a B. S. in General Engineering from the United States Military Academy.
The Board believes Mr. McBrayer’s industry knowledge and experience as a CEO qualifies him to serve as a Director.
Michael A. McManus, Jr. became President and Chief Executive Officer of the Company in November 1999. From November 1991 to March 1999, Mr. McManus was President and Chief Executive Officer of New York Bancorp, Inc. Prior to New York Bancorp, Inc., Mr. McManus held senior positions with Jamcor Pharmaceutical, Inc., Pfizer, Inc. and Revlon Corp. Mr. McManus also spent several years as an Assistant to President Reagan. Mr. McManus serves on the Board of Directors of the following publicly traded companies: A. Schulman, Inc., Novavax, Inc. and The Eastern Company. Mr. McManus holds a B.A. degree in Economics from the University of Notre Dame and a Juris Doctorate from Georgetown University Law Center.
Mr. McManus’ extensive first-hand knowledge of the business and historical development of the Company, as well as his executive, management and leadership experience and achievement, along with his previous experience in the pharmaceutical, government and medical device areas, give him highly valued insights into our Company’s challenges, opportunities and business. Mr. McManus also possesses broad knowledge related to equity and capital markets that the Board believes are invaluable to the Board’s discussions of the Company’s capital and liquidity needs and qualify him to serve as a Director.
| 38 |
Richard A. Zaremba became Senior Vice President in 2004. He became Vice President and Chief Financial Officer in February 1999. From March 1995 to February 1999, he was the Vice President and Chief Financial Officer of Converse Information Systems, Inc., a manufacturer of digital voice recording systems. Previously, Mr. Zaremba was Vice President and Chief Financial Officer of Miltope Group, Inc., a manufacturer of electronic equipment. Mr. Zaremba is a licensed certified public accountant in the state of New York and holds BBA and MBA degrees in Accounting from Hofstra University.
Robert S. Ludecker became Senior Vice President of Global Sales and Marketing in May 2015. Prior to joining the Company as Global Vice President of Sales and Marketing in May 2013, Mr. Ludecker served from February 2011 to May 2013 as Vice President of Global Sales and Marketing for BioMimetic Therapeutics, a NASDAQ-listed biotechnology company, specializing in the development and commercialization of products which promote the healing of musculoskeletal injury and diseases, including orthopedic, spine, and sports medicine applications (“BioMimetic”). Prior to BioMimetic, Mr. Ludecker served from February 2008 to February 2011 in a variety of senior sales and marketing leadership positions with Small Bone Innovations, a private New York City-based orthopedic company specializing in small bones, and Smith and Nephew, a leading U.K.-based global provider of orthopedic reconstruction implants and a broad portfolio of medical instruments and supplies. Mr. Ludecker holds a B. A. degree from Kenyon College.
Dan Voic became Vice President of Research and Development and Engineering in January 2002. Prior thereto, he served as Engineering Manager and Director of Engineering with the Company. Mr. Voic has in excess of 15 years experience in both medical and laboratory and scientific products development. Mr. Voic holds an M.S. degree in mechanical engineering from Polytechnic University “Traian Vuia” of Timisoara, Romania and an MS degree in applied mechanics from Polytechnic University of New York.
Joseph J. Brennan became Vice President of Operations in November 2014. Prior to joining the Company, Mr. Brennan served from October 2008 to August 2014 as Director of Operations for Air Techniques, Inc., a global medical device company. Mr. Brennan holds a B. T. degree from the State University of New York at Farmingdale.
John J. Salerno became Vice President of Quality and Regulatory Affairs in March 2015. Prior to joining the Company, Mr. Salerno served from December 2012 to March 2015 as Senior Director of Quality Assurance for US Nonwovens Corp., a privately-held over the counter drug products, cosmetics, personal care and EPA surface disinfectant company (“US Nonwovens”). From May 2010 to December 2012, Mr. Salerno was a consultant for US Nonwovens. From 2006 to 2010, Mr. Salerno held the position of Vice President of Quality Assurance and Regulatory Affairs for International Technidyne Corporation. Prior to 2006, Mr. Salerno held the position of Vice President of Regulator Compliance and Reliability Engineering for Pall Life Sciences. Mr. Salerno holds a Master’s degree in Microbiology from Long Island University and a Bachelor’s degree in biology from Fordham University.
Michael L. Consilvio became Vice President of Marketing in July 2105. Prior to joining the Company, Mr. Consilvio served from 2008 to 2015, most recently in the position of Director of International Commercializations, with Biomet Spine. From 2007 – 2008 Mr. Consilvio held the position of worldwide director of Marketing and Medical Education with Small Bone Innovations. From 2004 – 2007 he held the position of Group Product Director for the Musculoskeletal Transplant Foundation. Prior to 2004, Mr. Consilvio held positions with various organizations in the Orthopedics field. Mr. Consilvio holds a Masters degree in Corporate Finance from Fairleigh Dickinson University and a Bachelor’s Degree in Economics from the State University of New York at Oneonta.
| 39 |
Executive officers are elected annually by, and serve at the discretion of, the Board.
| DIRECTOR COMPENSATION FOR THE 2015 | ||||||||||||
| FISCAL YEAR | ||||||||||||
Fees Earned or Paid in | Option | |||||||||||
| Name | Cash ($) | Awards ($) | Total ($) | |||||||||
| Michael A. McManus, Jr. | - | - | - | |||||||||
| John W. Gildea | 20,000 | 60,000 | 80,000 | |||||||||
| Dr. Charles Miner III | 20,000 | 60,000 | 80,000 | |||||||||
| T. Guy Minetti | 25,000 | 60,000 | 85,000 | |||||||||
| Thomas F. O’Neill | 16,000 | - | 16,000 | |||||||||
| Stavros G. Vizirgianakis | 16,000 | 60,000 | 76,000 | |||||||||
| Patrick A. McBrayer | 7,000 | 60,000 | 67,000 | |||||||||
Outstanding options at fiscal year-end for Mr. Miner are 105,000 shares. Messrs. Gildea and Minetti are 90,000 shares each, Mr. Vizirgianakis is 45,000 shares, and Mr. McBrayer is 15,000 shares. Each non-employee director receives an annual fee of $20,000 and the Chairman of the Audit Committee receives $25,000. Each Director also receives options to purchase 15,000 shares each year. In May 2015, Thomas F. O’Neill resigned from the Board for personal reasons. Each non-employee director is also reimbursed for reasonable expenses incurred while traveling to attend meeting of the Board of Directors or while traveling in furtherance of the business of the Company.
Section 16 (a) Beneficial Ownership Reporting Compliance of the Securities Exchange Act
Section 16(a) of the Exchange Act requires the Company’s executive officers, directors and persons who own more than 10% of a registered class of the Company’s equity securities (“Reporting Persons”) to file reports of ownership and changes in ownership on Forms 3, 4, and 5 with the SEC. These Reporting Persons are required by SEC regulation to furnish the Company with copies of all Forms 3, 4 and 5 they file with the SEC. Based solely on the Company’s review of the copies of the forms it has received, the Company believes that all Reporting Persons, complied on a timely basis with all filing requirements applicable to them with respect to transactions during fiscal year 2015.
Code of Ethics
The Company has adopted a code of ethics that applies to all of its directors, officers (including its Chief Executive Officer, Chief Financial Officer, Controller and any person performing similar functions) and employees. The Company has filed a copy of this Code of Ethics as Exhibit 14 to this Form 10-K. The Company has also made the Code of Ethics available on its website at www.MISONIX.com.
Audit Committee
The Company has a separately-designated standing audit committee established in accordance with section 3(a) (58) (A) of the Exchange Act. The members of the Audit Committee are Messrs. Gildea, Miner, Minetti and McBrayer. The Board of Directors has determined that each member of the Audit Committee is “independent” not only under the Corporate Governance Requirements applicable to Nasdaq-listed companies but also within the definition contained in a final rule of the SEC. Furthermore, the Board of Directors has determined that Messrs. Gildea and Minetti are “audit committee financial experts” within the definition contained in a final rule adopted by the SEC.
| 40 |
Item 11. Executive Compensation.
Compensation Discussion and Analysis
Overview of Compensation Program and Philosophy
Our compensation program is intended to:
| • | Attract, motivate, retain and reward employees of outstanding ability; |
| • | Link changes in employee compensation to individual and corporate performance; |
| • | Align employees’ interests with those of the Company’s shareholders. |
The ultimate objective of our compensation program is to increase shareholder value. We seek to achieve these objectives with a total compensation approach which takes into account a competitive base salary, bonus pay based on the annual performance of the Company and individual goals and stock option awards.
Base Salaries
Base salaries paid to executives are intended to attract and retain highly talented individuals. In setting base salaries, individual experience, individual performance, the Company’s performance and job responsibilities during the year are considered. Executive salaries are reconciled by Human Resources and evaluated against local companies of similar size and nature.
Annual Bonus Plan Compensation
The Compensation Committee of the Board approves annual performance-based compensation. The purpose of the annual bonus-based compensation is to motivate executive officers and key employees. Target bonuses, based upon recommendations from the Chief Executive Officer, are evaluated and approved by the Compensation Committee for all management employees other than the Chief Executive Officer. The bonus recommendations are derived from individual and Company performance but not based on a specific formula and are discretionary. The Chief Executive Officer’s bonus compensation is derived from the recommendation of the Compensation Committee based upon the Chief Executive Officer’s performance and Company performance but is not based on a specific formula and is discretionary.
Stock Option Awards
Stock option awards are intended to attract and retain highly talented executives, to provide an opportunity for significant compensation when overall Company performance is reflected in the stock price and to help align executives’ and shareholders’ interests. Stock options are typically granted at the time of hire to key new employees and annually to a broad group of existing key employees, including executive officers.
Annual option grants to executive officers may be made at the discretion of the Board in the form of incentive stock options (“ISOs”) up to the fullest extent permitted under tax laws, with the balance granted in the form of nonqualified stock options. ISOs have potential income tax advantage for executives if the executive disposes of the acquired shares after satisfying certain holding periods. Tax laws provide that the aggregate grant at date of grant for market value of ISOs that become exercisable for any employee in any year may not exceed $100,000.
Our current standard vesting schedule for all employees is 25% on the first anniversary of the date of grant, 50% on the second anniversary of the date of grant, 75% on the third anniversary of the date of grant and 100% on the fourth anniversary of the date of grant. We have on occasion issued options that have two year vesting to employees
401 (k) Plan
Our Individual Deferred Tax and Savings Plan (the “401 (k) plan”) is a tax qualified retirement savings plan pursuant to which all of the Company’s U.S. employees may defer compensation under Section 401 (k) of the Internal Revenue Code of 1986, as amended (the “Code”). The Company contributes an amount equal to 10% of salary contributed under the 401 (k) plan by an eligible employee, up to the maximum allowed under the Code. We do not provide any supplemental retirement benefits to executive officers.
| 41 |
COMPENSATION AND CORPORATE GOVERNANCE COMMITTEE REPORT
Our Compensation and Corporate Governance Committee has furnished the following report. The information contained is the “Compensation and Corporate Governance Committee Report” is not deemed to be “soliciting material” or the be “filed” with the SEC, nor is such information to be incorporated by reference into any future filing under the Securities Act of 1933, as amended, or the Securities Exchange Act of 1934, as amended, except to the extent that we specifically incorporate it by reference in to such filings.
Our Executive Compensation Committee has reviewed and discussed the “Compensation Discussion and Analysis” required by Item 402(b) of Regulation S-K of the Securities Act of 1933, as amended, with management.
Based on such review and discussion, our Compensation and Corporate Governance Committee recommended to our Board of Directors that the “Compensation Discussion and Analysis” be included in our Annual Report on Form 10-K for the fiscal year ended June 30, 2015 for filing with the SEC.
| Executive Compensation Committee | |
| John W. Gildea | |
| Charles Miner, III | |
| T. Guy Minetti | |
| *** |
COMPENSATION AND CORPORATE GOVERNANCE COMMITTEE INTERLOCKS AND INSIDER PARTICIPATION
During fiscal 2015, Messrs. Gildea, Miner and Minetti served as members of our Compensation and Corporate Governance Committee. No Member of our Compensation and Corporate Governance Committee is or was during fiscal year 2015 an employee or an officer of Misonix or its Subsidiaries.
| 42 |
The number of stock options granted in fiscal 2015 by person, and their estimated fair value, were as follows:
| Named Executive Officer | Number of Stock Options Granted | Estimated Fair Value of Awards at Grant Date | ||||||
| Michael A. McManus, Jr. | 225,000 | $ | 1,314,695 | |||||
| Robert S. Ludecker | 115,000 | $ | 748,751 | |||||
| Richard A. Zaremba | 30,000 | $ | 178,374 | |||||
| Dan Voic | 35,000 | $ | 208,103 | |||||
The stock options awarded in September 2014 had an exercise price of $7.67 (which was equal to the average of the opening and closing market price per share of our stock on the date of grant). The stock options awarded on May 14, 2015 to Mr. Ludecker and on May 22, 2015 to Mr. McManus had the average price of $12.77 and $11.88, respectively (which was equal to the average of the opening and closing market price per share of the stock on the date of grant).
Mr. McManus was granted options to purchase 100,000 shares on May 22, 2015 in consideration of his new Employment Agreement. Mr. Ludecker was granted options to purchase 80,000 shares on May 14, 2015 in connection with his promotion to Senior Vice President.
All stock options in the above table, except 100,000 of the options issued to Mr. McManus which has a vesting period of 100% at June 30, 2017, provide for vesting at 25% per year on the first four year anniversary dates of the grant date, with a stated expiration date of ten years after grant.
Other Annual Compensation and Benefits –Although direct compensation, in the form of salary, non-equity incentive awards and long-term equity incentive awards provide most of the compensation to each Executive Officer, we also provide for the following items of additional compensation:
| · | Retirement savings are provided by 401 (k) plan, in the same manner to all U.S. employees. This plan includes an employer matching contribution of 10% which is intended to encourage employees (including the Chief Executive Officer) to save for retirement. |
| · | Health, life and disability benefits are offered the Chief Executive Officer in the same manner to all of our U.S. employees. We provide additional life insurance policies for our Chief Executive Officer and each of our Executive Officers. |
Perquisites are provided at levels to Executive Officers, primarily in the form of an automobile allowance except for our Chief Executive Officer. Our Chief Executive Officer has use of a company provided automobile with driver.
| 43 |
TABLE OF GRANTS OF PLAN-BASED AWARDS THAT OCCURRED IN FISCAL 2015
| Name | Grant Date | All other Option Awards: Number of Securities Underlying Options | (1) Exercise or Base price of Option Awards ($/Share) | (2) Grant Date Fair Value of Stock and Option Awards ($) | ||||||||||
| Michael A. McManus, Jr. | September 9, 2014 | 125,000 | $ | 7.67 | $ | 743,225 | ||||||||
| May 14, 2015 | 100,000 | $ | 11.88 | $ | 571,470 | |||||||||
| Robert S. Ludecker | September 9, 2014 | 35,000 | $ | 7.67 | $ | 208,103 | ||||||||
| May 22, 2015 | 80,000 | $ | 12.77 | $ | 540,648 | |||||||||
| Richard A. Zaremba | September 9, 2014 | 30,000 | $ | 7.67 | $ | 178,374 | ||||||||
| Dan Voic | September 9, 2014 | 35,000 | $ | 7.67 | $ | 208,108 | ||||||||
| (1) | Stock option awards were issued September 9, 2014 pursuant to our 2012 Employee Equity Incentive Plan. Stock Option Awards were issued May 14, 2015 and May 22, 2015 pursuant to our 2014 Employee Equity Incentive Plan. |
| (2) | This amount represents the Black-Scholes computation as of that date of award. |
TABLE OF OPTIONS EXERCISES THAT OCCURRED IN FISCAL 2015
| Name of Executive Officer | Number of Shares Acquired on Exercise | (1) Value Realized on Exercise | ||||||
| Michael A. McManus, Jr. | 125,000 | $ | 523,750 | |||||
| Richard A. Zaremba | 133,750 | $ | 805,303 | |||||
| Dan Voic | 129,250 | $ | 1,081,978 | |||||
| (1) | Amounts reflect the difference between the exercise price of the options and the market value of the shares acquired upon exercise. Market values are based on the closing price per share of our Common Stock on the NASDAQ Global Market on the date of exercise. |
| 44 |
SUMMARY OF POTENTIAL PAYMENTS UPON TERMINATION
OR FOLLOWING A CHANGE-IN-CONTROL
Severance Agreement and Severance Payments
Except for our Chief Executive Officer, we do not have severance agreements with any of our Executive Officer. As described below under “- Employment Agreement,” our Chief Executive Officer’s employment agreement requires severance payments in the event that he is terminated. Upon termination payment of two times his total compensation (annual base salary plus bonus) at the highest rate paid him at any time during the aggregate time he has been employed by the Company plus twenty-four (24) months of premiums for medical dental, vision, hospitalization and long term care coverage is required.
Change-in-Control and Change-in-Control Payments
In the event of a change-in-control, we are required to make certain change-in-control payments to Mr. Zaremba, Mr. Ludecker, and Mr. Voic under the terms of the change-in-control agreements. The agreements provide for twelve (12) months base salary upon change in control of the Company. These amounts currently represent, $229,000, $260,000 and $177,000, respectively. In addition, unvested options granted to Mr. Zaremba, Mr. Ludecker and Mr. Voic would vest upon a change-in-control. Assuming the change-in-control occurred on June 30, 2015, the value of unvested options is $394,263, $100,200 and $361,055, respectively.
| 45 |
Employment Agreement
On May 22, 2015, the Employment Agreement, dated July 1, 2014, by and between Michael A. McManus, Jr. and the Company was mutually terminated and replaced by a new Employment Agreement whereby Mr. McManus will continue to serve as the Company's President and Chief Executive Officer (the "McManus Agreement"). The McManus Agreement, effective as of May 22, 2015, has an initial term expiring June 30, 2017 and renews for successive one-year periods thereafter unless terminated by either party not less than ninety (90) days prior to the end of the then-current term. The McManus Agreement provides for an annual base salary of (i) $299,000 through June 30, 2015 and (ii) $325,000 commencing July 1, 2015, and an annual bonus based on Mr. McManus' achievement of annual goals and objectives as determined by the Compensation Committee of the Company's Board of Directors. Mr. McManus also received a one-time grant of options to purchase 100,000 shares of Common Stock at an exercise price of $11.88 per share (the “McManus Options”). The McManus Options vest in their entirety on June 30, 2017.
Mr. McManus is entitled under the McManus Agreement to participate in any plans and programs made available to the executive employees of the Company generally.
The Company can terminate the McManus Agreement for cause (as defined in the McManus Agreement). Mr. McManus can terminate the McManus Agreement for good reason (as defined in the McManus Agreement). If Mr. McManus terminates the McManus Agreement for good reason, the Company must (i) pay him an amount equal to two times his total compensation (annual base salary plus bonus) at the highest rate paid him at any time during the aggregate time he has been employed by the Company, payable in a lump sum within sixty days of termination of employment, and (ii) pay premiums for medical, dental, vision, hospitalization and long term care coverage under Company plans for a period of twenty-four (24) months.
Mr. McManus is entitled to severance pay and benefits if he terminates his employment with the Company following a Change in Control (as defined in the McManus Agreement), to provide him with an incentive to remain with the Company and consummate a strategic corporate sale or transaction that maximizes shareholder value. Severance pay and benefits are triggered upon (i) his Involuntary Termination without Cause (as defined in the McManus Agreement) for a reason other than death or Disability (as defined in the McManus Agreement) or (ii) as a result of a Constructive Termination (as defined in the McManus Agreement) which in either case occurs: (x) during the period not to exceed twenty-four (24) months after the effective date of a Change in Control, or (y) before the effective date of a Change in Control, but after the first date on which the Board of Directors and/or senior management of the Company has entered into formal negotiations with a potential acquirer that results in the consummation of a Change in Control.
In the event that pay and benefits are so triggered, Mr. McManus (A) is entitled to receive severance pay in an amount equal to two (2) times the sum of (a) his annual base pay and (b) bonus at the highest rate paid him for any fiscal year during the aggregate period of his employment by the Company, payable in cash in a lump sum; the payment of premiums for medical, dental, vision, hospitalization and long term care coverage under Company plans for a period of twenty-four (24) months; (B) has the right, for a period of (i) ninety (90) days for stock options granted under any of the Company's Employee Stock Option Plans adopted prior to 2005 and (ii) two (2) years for stock options granted under the Company's 2005 Employee Equity Incentive Plan, 2009 Employee Equity Incentive Plan, 2014 Employee Equity Incentive Plan and any Plan adopted after the effective date of the McManus Agreement, following his Termination Date (as defined in the McManus Agreement) to exercise the options to the extent such options are otherwise vested and exercisable as of the Termination Date under the terms of the applicable stock option McManus Agreement(s) and plan(s); and (C) will vest in all unvested stock option grants with respect to options granted after July 1, 2012.
Mr. McManus has also agreed in the McManus Agreement to an eighteen month post-termination covenant not-to-compete, as well as other customary covenants concerning non-solicitation and non-disclosure of confidential information of the Company.
The Company and Mr. McManus had previously entered into two letter agreements (the "Letter Agreements") providing for the exercise of vested options by Mr. McManus (i) for a ninety (90) day period after his retirement with respect to stock options granted under certain of the Company's stock option plans and (ii) for two (2) years after Mr. McManus terminates his employment with the Company in the event of a Change-in-Control (as defined in the applicable stock option plans) and he is eligible for the severance benefits provided for by the McManus Agreement. The Company and Mr. McManus have entered into a letter agreement which makes clear that the terms and conditions of the Letter Agreements continue to be in full force and effect and apply to the McManus Agreement.
Assuming a Change in Control occurred on June 30, 2015, Mr.McManus would receive (i) salary and bonus of $830,000; (ii) perquisites of $40,000 and (iii) the value of unvested stock options of $1,267,211.
| 46 |
Tax deductibility of Executive Compensation
Section 162 (m) of the Code limits to $1,000,000 per person the amount that we may deduct for compensation paid to any of our most highly compensated officers in any year. In fiscal 2015, Michael A. McManus, Jr. and Robert S. Ludecker had executive officer’s compensation that exceeded $1,000,000. No other officer or director exceeded $1,000,000.
The following table sets forth information concerning the compensation awarded to, earned by or paid to our named executive officers during the past three fiscal years for services rendered to the Company:
SUMMARY COMPENSATION TABLE
| Name and Principal Position | Fiscal Year Ended June 30, | Salary ($) | Bonus ($) | Options Awards ($) | Total ($) | |||||||||||||||
| Michael A. McManus, Jr. | 2015 | 290,008 | 100,000 | 1,314,695 | 1,704,703 | |||||||||||||||
| President and Chief | 2014 | 288,915 | 100,000 | 469,575 | 858,490 | |||||||||||||||
| Executive Officer | 2013 | 288,915 | 100,000 | 307,293 | 696,211 | |||||||||||||||
| Richard A. Zaremba | 2015 | 226,038 | 20,000 | 178,374 | 424,412 | |||||||||||||||
| Senior Vice President, | 2014 | 219,455 | 25,000 | 150,264 | 394,719 | |||||||||||||||
| Chief Financial Officer, | 2013 | 213,063 | 30,000 | 93,172 | 336,235 | |||||||||||||||
| Secretary and Treasurer | ||||||||||||||||||||
| Robert S. Ludecker | 2015 | 215,098 | 40,000 | 748,751 | 1,003,849 | |||||||||||||||
| Senior Vice President-Medical | 2014 | 203,000 | - | 37,566 | 240,566 | |||||||||||||||
| Global Sales and Marketing | 2013 | 27,273 | - | - | 27,273 | |||||||||||||||
| Dan Voic | 2015 | 174,873 | 15,000 | 208,103 | 397,976 | |||||||||||||||
| Vice President of | 2014 | 169,375 | 15,000 | 131,481 | 315,856 | |||||||||||||||
| Research and Development | 2013 | 164,038 | 12,000 | 81,526 | 257,564 | |||||||||||||||
| and Engineering | ||||||||||||||||||||
| Joseph J. Brennan | 2015 | 139,182 | - | - | 139,182 | |||||||||||||||
| Vice President – Operations | 2014 | - | - | - | - | |||||||||||||||
| 2013 | - | - | - | - | ||||||||||||||||
| 47 |
OUTSTANDING EQUITY AWARDS FOR THE 2015 FISCAL YEAR
| Name | Number of Securities Underlying Unexercised Options (#) Exercisable | Number of Securities Underlying Unexercised Options (#) Unexercisable | Option Exercise Price ($) | Option Expiration Date | ||||||||||
| Michael A. McManus, Jr. | ||||||||||||||
| 75,000 | - | 1.91 | 11/04/18 | |||||||||||
| 50,000 | - | 2.44 | 09/09/19 | |||||||||||
| 75,000 | - | 1.82 | 09/07/20 | |||||||||||
| 75,000 | 25,000 | (2) | 2.19 | 09/13/21 | ||||||||||
| 59,350 | 59,350 | (3) | 2.96 | 09/13/22 | ||||||||||
| 1,575 | 4,725 | (4) | 6.18 | 12/05/22 | ||||||||||
| 31,250 | 93,750 | (1) | 4.68 | 09/10/23 | ||||||||||
| - | 125,000 | (6) | 7.67 | 09/09/24 | ||||||||||
| - | 100,000 | (5) | 11.88 | 05/22/25 | ||||||||||
| Richard A. Zaremba | ||||||||||||||
| - | - | 2.44 | 09/09/19 | |||||||||||
| - | 8,750 | (2) | 2.19 | 09/13/21 | ||||||||||
| - | 20,000 | (3) | 2.96 | 09/13/22 | ||||||||||
| - | 30,000 | (1) | 4.68 | 09/10/23 | ||||||||||
| - | 30,000 | (6) | 7.67 | 09/09/24 | ||||||||||
| Robert S. Ludecker | ||||||||||||||
| 2,500 | 7,500 | (1) | 4.68 | 09/10/23 | ||||||||||
| - | 35,000 | (6) | 7.67 | 09/09/24 | ||||||||||
| - | 80,000 | (5) | 12.77 | 05/14/25 | ||||||||||
| Dan Voic | ||||||||||||||
| 5,000 | - | 7.60 | 09/26/15 | |||||||||||
| - | 7,500 | (2) | 2.19 | 09/13/21 | ||||||||||
| - | 17,500 | (3) | 2.96 | 09/13/22 | ||||||||||
| - | 26,500 | (1) | 4.68 | 09/10/23 | ||||||||||
| - | 35,000 | (6) | 7.67 | 09/09/24 | ||||||||||
| Joseph J. Brennan | ||||||||||||||
| - | - | - | - | |||||||||||
| (1) | Options issued 09/10/13 and vest equally over 4 years. |
| (2) | Options issued 09/13/11 and vest equally over 4 years. |
| (3) | Options issued 09/09/12 and vest equally over 4 years. |
| (4) | Options issued 12/05/12 and vest equally over 4 years. |
| (5) | Options issued 05/22/15 and vest on June 30, 2017. |
| (6) | Options issued 09/09/2015 and vest equally over 4 years. |
| 48 |
Stock Options
In March 1996, the Board of Directors adopted and, in February 1997, the shareholders approved the 1996 Employee Incentive Stock Option Plan covering an aggregate of 450,000 shares (the "1996 Plan") and the 1996 Non-Employee Director Stock Option Plan (the "1996 Directors Plan") covering an aggregate of 1,125,000 shares of Common Stock. At June 30, 2015, options to purchase 1,000 shares were outstanding under the 1996 Plan at an exercise price of $7.60 per share all of which are currently vested and options to acquire 15,000 shares were outstanding under the 1996 Directors Plan at an exercise price of $7.60 per share all of which are currently vested. At June 30, 2015, options to purchase 178,295 shares under the 1996 Plan have been exercised and options to purchase 422,650 shares have been forfeited (of which options to purchase 151,945 shares have been reissued). As of June 30, 2015, there were no shares available for future grants. At June 30, 2015, options to purchase 913,500 shares under the 1996 Directors Plan have been exercised and options to purchase 130,000 shares have been forfeited (of which none have been reissued). As of June 30, 2015, there were no shares available for future grants.
In October 1998, the Board of Directors adopted and, in January 1999, the shareholders approved the 1998 Employee Stock Option Plan (the "1998 Plan") covering an aggregate of 500,000 shares of Common Stock. At June 30, 2015, options to purchase 6,000 shares were outstanding under the 1998 Plan at an exercise price of $7.60 per share all of which are currently vested. At June 30, 2015, options to purchase 81,598 shares under the 1998 Plan have been exercised and options to purchase 477,677 shares under the 1998 Plan have been forfeited (of which options to purchase 65,275 shares have been reissued). At June 30, 2015, there were no shares available for future grants.
In October 2000, the Board of Directors adopted and, in February 2001, the shareholders approved the 2001 Employee Stock Option Plan (the "2001 Plan") covering an aggregate of 1,000,000 shares of Common Stock. At June 30, 2015, options to purchase 9,968 shares were outstanding under the 2001 Plan at exercise prices ranging from $1.82 to $5.82 per share with a vesting period of one to four years. At June 30, 2015, options to purchase 375,318 shares under the 2001 Plan have been exercised and options to purchase 865,975 shares under the 2001 Plan have been forfeited (of which options to purchase 251,261 shares have been reissued). At June 30, 2015, there were no shares available for future grants.
In September 2005, the Board of Directors adopted and, in December 2005, the shareholders approved, the 2005 Employee Equity Incentive Plan (the "2005 Plan") covering an aggregate of 500,000 shares of Common Stock and the 2005 Non-Employee Director Stock Option Plan (the "2005 Directors Plan") covering an aggregate of 200,000 shares of Common Stock. At June 30, 2015, options to purchase 223,725 shares were outstanding under the 2005 Plan at exercise prices ranging from $.85 to $6.18 per share with a vesting period of four years. At June 30, 2015 options to purchase 275,650 shares have been exercised under the 2005 Plan and options to purchase 47,750 shares have been forfeited (of which options to purchase 47,125 shares have been reissued). At June 30, 2015, 625 shares were available for future grants under the 2005 Plan. At June 30, 2015, options to purchase 120,000 shares were outstanding under the 2005 Directors Plan at exercise prices ranging from $2.41 to $5.42 with a vesting period over three years. At June 30, 2015, options to purchase 67,500 shares under the 2005 Directors Plan have been exercised and options to purchase 7,500 shares have been forfeited (of which none have been reissued). At June 30, 2015, there were 12,500 shares available for future grants under the 2005 Directors Plan.
In December 2009, the Board of Directors and shareholders adopted the 2009 Employee Equity Incentive Plan (the "2009 Plan") covering an aggregate of 500,000 shares of Common Stock and the 2009 Non-Employee Director Stock Option Plan (the "2009 Directors Plan") covering an aggregate of 200,000 shares of Common Stock. At June 30, 2015, options to purchase 345,423 shares were outstanding under the 2009 Plan at exercise prices ranging from $1.82 to $6.18 per share with a vesting period of four years. At June 30, 2015, options to purchase 133,477 shares have been exercised and options to purchase 89,025 shares were forfeited under the 2009 Plan (of which options to purchase 67,925 shares have been reissued). At June 30, 2015, there were 21,100 shares available for future grants under the 2009 Plan. At June 30, 2015, options to purchase 138,750 shares were outstanding under the 2009 Directors Plan at exercise prices ranging from $2.41 to $6.71 with a vesting period of up to four years. At June 30, 2015, options to purchase 26,250 shares have been exercised and options to purchase 30,000 shares were forfeited under the 2009 Directors Plan (of which none have been reissued). At June 30, 2015, there were 35,000 shares available for future grants under the 2009 Directors Plan.
| 49 |
In December 2012, the Board of Directors and shareholders adopted the 2012 Employee Equity Incentive Plan (the “2012 Plan”) covering an aggregate of 500,000 shares of Common Stock and the 2012 Non-Employee Director Stock Option Plan (the “2012 Directors Plan”) covering an aggregate of 200,000 shares of Common Stock. At June 30, 2015, options to purchase 442,750 shares were outstanding under the 2012 Plan at exercise prices ranging from $4.68 to $13.89 per share with a vesting period of four years. At June 30, 2015, options to purchase 8,750 shares have been exercised and options to purchase 7,000 shares were forfeited under the 2012 Plan (of which none have been reissued). At June 30, 2015, 48,500 shares were available for future grants under the 2012 Plan. At June 30, 2015, options to purchase 75,000 shares were outstanding under the 2012 Directors Plan at an exercise price of $13.20 per share with a vesting period of four years. At June 30, 2015, there were no options exercised and options to purchase 15,000 shares were forfeited under the 2012 Directors Plan (of which none have been reissued). At June 30, 2015, 125,000 shares were available for future grants under the 2012 Directors Plan.
In November 2014, the Board of Directors adopted and, in February 2015, the shareholders approved the 2014 Employee Equity Incentive Plan (the “2014 Plan”) covering an aggregate of 750,000 shares of common stock. At June 30, 2015, options to purchase 180,000 shares were outstanding under the 2014 Plan at prices ranging from $11.88 to $12.77 per share with a vesting period of up to four years. At June 30, 2015, there were no options exercised or forfeited under the 2014 Plan. At June 30, 2015, 570,000 shares were available for future grants under the 2014 Plan.
The selection of participants, allotments of shares and determination of price and other conditions relating to options are determined by the Board of Directors or a committee thereof, depending on the Plan, and in accordance with Rule 4350(c) of the Corporate Governance Requirements applicable to Nasdaq-listed companies. Incentive stock options granted under the Plans are exercisable for a period of up to ten years from the date of grant at an exercise price which is not less than the fair market value of the Common Stock on the date of the grant, except that the term of an incentive stock option granted under the Plans to a shareholder owning more than 10% of the outstanding Common Stock may not exceed five years and its exercise price may not be less than 110% of the fair market value of the Common Stock on the date of grant. Options shall become exercisable at such time and in such installments as provided in the terms of each individual option agreement.
| 50 |
Item 12. Security Ownership of Certain Beneficial Owners and Management and Related Stockholder Matters.
The following table sets forth as of August 17, 2015, certain information with regard to the ownership of the Company's Common Stock by (i) each beneficial owner of 5% or more of the Company's Common Stock; (ii) each director; (iii) each executive officer named in the "Summary Compensation Table" above; and (iv) all executive officers and directors of the Company as a group. Unless otherwise stated, the persons named in the table have sole voting and investment power with respect to all Common Stock shown as beneficially owned by them.
| Name and Address (1) | Common Stock Beneficially Owned | Percent Of Class | ||||||
| Michael A. McManus, Jr. | 836,942 | (2) | 10.2 | |||||
| Norman H. Pessin | 631,399 | (3) | 8.2 | |||||
| Dimensional Fund Advisors LP | 501,808 | 6.5 | ||||||
| Stavros G. Vizigianakis | 460,859 | (4) | 6.0 | |||||
| Dan Voic | 176,243 | (5) | 2.3 | |||||
| Richard A. Zaremba | 156,576 | (6) | 2.0 | |||||
| T. Guy Minetti | 133,250 | (7) | 1.7 | |||||
| Charles Miner | 73,750 | (8) | * | |||||
| John W. Gildea | 71,250 | (9) | * | |||||
| Robert S. Ludecker | 16,693 | (10) | * | |||||
| Joseph J. Brennan | - | * | ||||||
| All executive officers and Directors as a group (twelve people) | 1,925,563 | (11) | 22.7 | |||||
* Less than 1%
| (1) |
Except as otherwise noted, the business address of each of the named individuals in this table is c/o MISONIX, INC., 1938 New Highway, Farmingdale, New York 11735. Dimensional Fund Advisors LP has a principal business office at 1299 Ocean Avenue, Santa Monica, CA 90401. Norman H. Pessin has a principal business office at 366 Madison Avenue, 14 th Floor, New York, New York 10017. |
| (2) | Includes 485,925 shares which Mr. McManus has the right to acquire upon exercise of stock options which are currently exercisable. |
| (3) | Sandra F. Pessin, Mr. Pessin’s spouse, is listed as the beneficial owner of 94,025 of such shares in the statement on Schedule 13D filed by Mr. Pessin and Mrs. Pessin on November 15, 2013 with the SEC. |
| (4) | Includes 11,250 shares which Mr. Vizigianakis has the right to acquire upon exercise of stock options which are currently exercisable. |
| (5) | Includes 38,750 shares which Mr. Voic has the right to acquire upon exercise of stock options which are currently exercisable. |
| (6) | Includes 36,250 shares which Mr. Zaremba has the right to acquire upon exercise of stock options which are currently exercisable. |
| (7) | Includes 56,250 shares which Minetti has the right to acquire upon exercise of stock options which are currently exercisable. |
| (8) | Includes 71,250 shares which Dr. Miner has the right to acquire upon exercise of stock options which are currently exercisable. |
| (9) | Includes 56,250 shares which Mr. Gildea has the right to acquire upon exercise of stock options which are currently exercisable. |
| (10) | Includes 13,750 shares which Mr. Ludecker has the right to acquire upon exercise of stock options which are currently exercisable. |
| (11) | Includes the shares indicated in notes (2), (4), (5), (6), (7), (8), (9) and (10). |
| 51 |
Item 13. Certain Relationships and Related Transactions, and Director Independence.
Stavros G. Vizirgianakis was appointed to Misonix’s Board of Directors on May 7, 2013. During the fiscal year ended June 30, 2014, Mr. Vizirgianakis owned (i) a controlling interest in MD Solutions Australasia PTY Ltd. (“MD Solutions”) and (ii) an interest in Surgical Innovations (“SI”). MD Solutions is an independent distributor for the Company outside of the United States. Applied BioSurgical, a company formerly owned by Mr. Vizirgianakis’ father, is an independent distributor for the Company outside of the United States. SI purchased certain of the Company’s products from Applied BioSurgical during the fiscal year ended June 30, 2014. Mr. Vizirgianakis disposed of his interest in each of MD Solutions and SI during the fiscal year ended June 30, 2014.
Set forth below is a table showing the Company’s net sales and accounts receivable for the indicated time periods below with Applied BioSurgical and MD Solutions:
| For the years ended June 30, | ||||||||||||
| Applied Bio Surgical | 2015 | 2014 | 2013 | |||||||||
| Sales | $ | 540,185 | $ | 378,287 | $ | 489,592 | ||||||
| Accounts receivable | 294,683 | 147,585 | 130,123 | |||||||||
| MD Solutions Australasia PTY Ltd. | 2015 | 2014 | 2013 | |||||||||
| Sales | $ | - | $ | 120,118 | $ | 335,274 | ||||||
| Accounts receivable | - | 1,785 | 18,700 | |||||||||
Director Independence
The Company is required to have a Board of Directors a majority of whom are “independent” as defined by the Corporate Governance Rules applicable to Nasdaq-listed companies and to disclose those Directors that the Board has determined to be independent. Based on such definition, the Board has determined that all directors other than Mr. McManus, who is an officer of the Company, and Stavros G. Vizigianakis are independent. See “Item 10. Directors, Executive Officers of the Registrant and Corporate Governance” and immediately above.
| 52 |
Item 14. Principal Accountant Fees and Services.
Audit Fees:
Grant Thornton LLP ("Grant Thornton") billed the Company $485,000 and $295,955 in the aggregate for services rendered for the audit of the Company's 2015 and 2014 fiscal years, respectively, and the review of the Company's interim financial statements included in the Company's Quarterly Reports on Form 10-Q for the Company's 2015 and 2014 fiscal years, respectively.
Audit-Related Fees:
Grant Thornton billed the Company $20,000 and $20,900 for audit-related services as defined by the SEC for the fiscal years ended June 30, 2015 and 2014, respectively. The audit-related services were for the audits of the Company’s pension plan.
Tax Fees:
Grant Thornton did not render any tax related services, as defined by the SEC, to the Company for the fiscal years 2015 and 2014.
Policy on Pre-approval of Independent Registered Public Accounting Firm Services:
The charter of the Audit Committee provides for the pre-approval of all audit services and all permitted non-audit services to be performed for Misonix by the independent registered public accounting firm, subject to the requirements of applicable law. The procedures for pre-approving all audit and non-audit services provided by the independent registered public accounting firm include the Audit Committee reviewing audit-related services, tax services and other services. The Audit Committee periodically monitors the services rendered by and actual fees paid to the independent registered public accounting firm to ensure that such services are within the parameters approved by the Audit Committee.
| 53 |
Item 15. Exhibits and Financial Statement Schedules.
| (a) | 1. | The response to this portion of Item 15 is submitted as a separate section of this Report. |
| 2. | Financial Statement Schedules | |
| Schedule II - Valuation and Qualifying Accounts. | ||
| 3. | Exhibits | |
| 3 (a) | Restated Certificate of Incorporation of the Company. (1) | |
| 3 (b) | By-laws of the Company. (2) | |
| 10.1 | Form of Indemnification Agreement. (3) | |
| 10.2 | Development and Option Agreement dated August 27, 1996 between the Company and United States Surgical Corporation. (4) | |
| 10.3 | License Agreement dated October 16, 1996 between the Company and United States Surgical Corporation. (4) | |
| 10.4 | 1996 Non-Employee Director Stock Option Plan. (5) | |
| 10.5 | 1996 Employee Incentive Stock Option Plan. (5) | |
| 10.6 | 1998 Employee Stock Option Plan. (6) | |
| 10.7 | 2001 Employee Stock Option Plan. (7) | |
| 10.8 | 2005 Employee Equity Incentive Plan. (8) | |
| 10.9 | 2005 Non-Employee Director Stock Option Plan. (8) | |
| 10.10 | 2009 Employee Equity Incentive Plan. (9) | |
| 10.11 | 2009 Non-Employee Director Stock Option Plan. (9) |
| 54 |
| 10.12 | Asset Purchase Agreement, dated as of May 28, 2010, among MISONIX, INC., MISONIX HIFU TECHNOLOGIES LIMITED, MISONIX LIMITED and USHIFU, LLC. (10) | |
| 10.13 | Letter Agreement, dated November 14, 2011, by and between MISONIX, INC. and Richard A. Zaremba. (11) | |
| 10.14 | Letter Agreement, dated as of July 1, 2012, by and between MISONIX, INC. and Michael A. McManus, Jr. (12) | |
| 10.15 | Letter Agreement, dated as of July 1, 2012, by and between MISONIX, INC. and Michael A. McManus, Jr. (12) | |
| 10.16 | Letter Agreement, dated May 7, 2013 by and between MISONIX, INC. and Stavros G. Vizirgianakis. (13) | |
| 10.17 | 2012 Employee Equity Incentive Plan. (14) | |
| 10.18 | 2012 Non-Employee Director Stock Option Plan. (14) | |
| 10.19 | 2014 Employee Equity Incentive Plan. (15) | |
| 10.20 | Employment Agreement, dated May 22, 2015, by and between MISONIX, INC. and Michael A. McManus, Jr. (16) | |
| 10.21 | Letter Agreement, dated as of May 22, 2015, by and between MISONIX, INC. and Michael A. McManus, Jr. (16) | |
| 10.22 | Lease Modification Agreement, dated as of July 1, 2015, between Sanwood Realty and MISONIX, INC. (17) | |
| 14 | Code of Ethics. (18) | |
| 21 | Subsidiaries of the Company. | |
| 23 | Consent of Grant Thornton LLP. | |
| 31.1 | Rule 13a-14(a)/15d-14(a) Certification. | |
| 31.2 | Rule 13a-14(a)/15d-14(a) Certification. | |
| 32.1 | Section 1350 Certification. | |
| 32.2 | Section 1350 Certification. |
| 101.INS | XBRL Instance Document | |
| 101.SCH | XBRL Taxonomy Extension Scheme Document | |
| 101.CAL | XBRL Taxonomy Extension Calculation Linkbase Document | |
| 101.DEF | XBRL Taxonomy Extension Definition Linkbase Document | |
| 101.LAB | XBRL Taxonomy Extension Label Linkbase Document | |
| 101.PRE | XBRL Taxonomy Extension Presentation Linkbase Document |
| 55 |
| (1) | Incorporated by reference from the Company's Registration Statement on Form S-8 (Reg. No. 333-165088). |
| (2) | Incorporated by reference from the Company's Current Report on Form 8-K filed on October 3, 2014. |
| (3) | Incorporated by reference from the Company’s Annual Report on Form 10-K for the fiscal year ended June 30, 2011. |
| (4) | Incorporated by reference from the Company's Annual Report on Form 10-KSB for the fiscal year ended June 30, 1997. |
| (5) | Incorporated by reference from the Company's definitive proxy statement for the Annual Meeting of Shareholders held on February 19, 1997. |
| (6) | Incorporated by reference from the Company's Registration Statement on Form S-8 (Reg. No. 333-78795). |
| (7) | Incorporated by reference from the Company’s Registration Statement on Form S-8 (Reg. No. 333-63166). |
| (8) | Incorporated by reference from the Company's definitive proxy statement for the Annual Meeting of Shareholders held on December 14, 2005. |
| (9) | Incorporated by reference from the Company's definitive proxy statement for the Annual Meeting of Shareholders held on December 8, 2009. |
| (10) | Incorporated by reference from the Company's Current Report on Form 8-K filed on June 4, 2010. |
| (11) | Incorporated by reference from the Company’s Current Report on Form 8-K filed on November 15, 2011. |
| (12) | Incorporated by reference from the Company’s Current Report on Form 8-K filed on September 13, 2012. |
| (13) | Incorporated by reference from the Company’s Current Report on Form 8-K filed on May 10, 2013. |
| (14) | Incorporated by reference from the Company’s definitive proxy statement for the Annual Meeting of Shareholders held on December 4, 2012. |
| (15) | Incorporated by reference from the Company’s definitive proxy statement for the Annual Meeting of Shareholders held on February 3, 2015. |
| (16) | Incorporated by reference by the Company’s Current Report on Form 8-K filed on May 26, 2015. |
| (17) | Incorporated by reference from the Company’s Current Report on Form 8-K filed on July 8, 2015. |
| (18) | Incorporated by reference from the Company’s Annual Report on Form 10-K for the fiscal year ended June 30, 2004. |
| 56 |
INDEX TO CONSOLIDATED FINANCIAL STATEMENTS
MISONIX, INC. and Subsidiaries
For the years ended June 30, 2015, June 30, 2014 and June 30, 2013
| Page | ||
| Report of Independent Registered Public Accounting Firm | F-1 | |
| Report of Independent Registered Public Accounting Firm | F-2 | |
| Consolidated Balance Sheets - June 30, 2015 and 2014 | F-3 | |
| Consolidated Statements of Operations - Years Ended June 30, 2015, 2014 and 2013 | F-4 | |
| Consolidated Statements of Stockholders' Equity - Years Ended June 30, 2015, 2014 and 2013 | F-5 | |
| Consolidated Statements of Cash Flows - Years Ended June 30, 2015, 2014 and 2013 | F-6 | |
| Notes to Consolidated Financial Statements | F-7 | |
| The following consolidated financial statement schedule is included in Item 15(a)(2): | ||
| Schedule II - Valuation and Qualifying Accounts | F-31 |
All other schedules for which provision is made in the applicable accounting regulations of the SEC are not required under the related instructions or are not applicable and therefore have been omitted.
| 57 |
Pursuant to the requirements of Section 13 or 15(d) of the Securities Exchange Act of 1934, the registrant has duly caused this report to be signed on its behalf by the undersigned, thereunto duly authorized.
| MISONIX, INC. | ||
| By: | /s/ Michael A. McManus, Jr. | |
| Michael A. McManus, Jr. | ||
| President and Chief Executive Officer | ||
Date: August 20, 2015
Pursuant to the requirements of the Securities Exchange Act of 1934, this report has been signed below by the following persons on behalf of the registrant and in the capacities and on the dates indicated.
| Signature | Title | Date | ||
| /s/ Michael A. McManus, Jr. | President, Chief Executive Officer and Director | August 20, 2015 | ||
| Michael A. McManus, Jr. | (principal executive officer) | |||
| /s/ Richard A. Zaremba | Senior Vice President, Chief Financial Officer, | August 20, 2015 | ||
| Richard A. Zaremba | Treasurer and Secretary | |||
| (principal financial and accounting officer) | ||||
| /s/ T. Guy Minetti | Director | August 20, 2015 | ||
| T. Guy Minetti | ||||
| /s/ Patrick A. McBrayer | Director | August 20, 2015 | ||
| Patrick A. Mc Brayer | ||||
| /s/ John W. Gildea | Director | August 20, 2015 | ||
| John W. Gildea | ||||
| /s/ Charles Miner III | Director | August 20, 2015 | ||
| Charles Miner III | ||||
| /s/ Stavros G. Vizirgianakis | Director | August 20, 2015 | ||
| Stavros G. Vizirgianakis |
| 58 |
REPORT OF INDEPENDENT REGISTERED PUBLIC ACCOUNTING FIRM
Board of Directors and Stockholders
MISONIX, INC. and Subsidiaries
We have audited the accompanying consolidated balance sheets of MISONIX, INC. and Subsidiaries (collectively, the “Company”) as of June 30, 2015 and 2014, and the related consolidated statements of operations, stockholders’ equity and cash flows for each of the three years in the period ended June 30, 2015. Our audits of the basic consolidated financial statements included the financial statement schedule listed in the index, appearing under Item 15(a)(2). These financial statements and financial statement schedule are the responsibility of the Company’s management. Our responsibility is to express an opinion on these financial statements and financial statement schedule based on our audits.
We conducted our audits in accordance with the standards of the Public Company Accounting Oversight Board (United States). Those standards require that we plan and perform the audit to obtain reasonable assurance about whether the financial statements are free of material misstatement. An audit includes examining, on a test basis, evidence supporting the amounts and disclosures in the financial statements. An audit also includes assessing the accounting principles used and significant estimates made by management, as well as evaluating the overall financial statement presentation. We believe that our audits provide a reasonable basis for our opinion.
In our opinion, the consolidated financial statements referred to above present fairly, in all material respects, the financial position of MISONIX, INC. and Subsidiaries as of June 30, 2015 and 2014, and the results of their operations and their cash flows for each of the three years in the period ended June 30, 2015 in conformity with accounting principles generally accepted in the United States of America. Also, in our opinion, the related financial statement schedule, when considered in relation to the basic consolidated financial statements taken as a whole, presents fairly, in all material respects, the information set forth therein.
We also have audited, in accordance with the standards of the Public Company Accounting Oversight Board (United States), the Company’s internal control over financial reporting as of June 30, 2015, based on criteria established in the 2013 Internal Control—Integrated Framework issued by the Committee of Sponsoring Organizations of the Treadway Commission (COSO), and our report dated August 20, 2015 expressed an unqualified opinion.
/s/ GRANT THORNTON LLP
Melville, New York
August 20, 2015
| F-1 |
| REPORT OF INDEPENDENT REGISTERED PUBLIC ACCOUNTING FIRM |
Board of Directors and Shareholders
MISONIX, Inc. and Subsidiaries
We have audited the internal control over financial reporting of MISONIX, INC. and Subsidiaries (the “Company”) as of June 30, 2015, based on criteria established in the 2013 Internal Control—Integrated Framework issued by the Committee of Sponsoring Organizations of the Treadway Commission (COSO). The Company’s management is responsible for maintaining effective internal control over financial reporting and for its assessment of the effectiveness of internal control over financial reporting, included in the accompanying Management’s Report on Internal Control Over Financial Reporting. Our responsibility is to express an opinion on the Company’s internal control over financial reporting based on our audit.
We conducted our audit in accordance with the standards of the Public Company Accounting Oversight Board (United States). Those standards require that we plan and perform the audit to obtain reasonable assurance about whether effective internal control over financial reporting was maintained in all material respects. Our audit included obtaining an understanding of internal control over financial reporting, assessing the risk that a material weakness exists, testing and evaluating the design and operating effectiveness of internal control based on the assessed risk, and performing such other procedures as we considered necessary in the circumstances. We believe that our audit provides a reasonable basis for our opinion.
A company’s internal control over financial reporting is a process designed to provide reasonable assurance regarding the reliability of financial reporting and the preparation of financial statements for external purposes in accordance with generally accepted accounting principles. A company’s internal control over financial reporting includes those policies and procedures that (1) pertain to the maintenance of records that, in reasonable detail, accurately and fairly reflect the transactions and dispositions of the assets of the company; (2) provide reasonable assurance that transactions are recorded as necessary to permit preparation of financial statements in accordance with generally accepted accounting principles, and that receipts and expenditures of the company are being made only in accordance with authorizations of management and directors of the company; and (3) provide reasonable assurance regarding prevention or timely detection of unauthorized acquisition, use, or disposition of the company’s assets that could have a material effect on the financial statements.
Because of its inherent limitations, internal control over financial reporting may not prevent or detect misstatements. Also, projections of any evaluation of effectiveness to future periods are subject to the risk that controls may become inadequate because of changes in conditions, or that the degree of compliance with the policies or procedures may deteriorate.
In our opinion, the Company maintained, in all material respects, effective internal control over financial reporting as of June 30, 2015, based on criteria established in the 2013 Internal Control—Integrated Framework issued by COSO.
We also have audited, in accordance with the standards of the Public Company Accounting Oversight Board (United States), the consolidated financial statements of the Company as of and for the year ended June 30, 2015, and our report dated August 20, 2015 expressed an unqualified opinion on those financial statements.
/s/ GRANT THORNTON LLP
Melville, New York
August 20, 2015
| F-2 |
MISONIX, INC. and Subsidiaries
Consolidated Balance Sheets
| June 30, | June 30, | |||||||
| 2015 | 2014 | |||||||
| Assets | ||||||||
| Current assets: | ||||||||
| Cash and cash equivalents | $ | 9,623,749 | $ | 7,039,938 | ||||
| Accounts receivable, less allowance for doubtful accounts of $126,868 and $136,868, respectively | 4,481,247 | 3,759,152 | ||||||
| Inventories, net | 4,303,163 | 4,217,350 | ||||||
| Prepaid expenses and other current assets | 441,562 | 367,830 | ||||||
| Deferred income tax - current | 2,118,716 | - | ||||||
| Total current assets | 20,968,437 | 15,384,270 | ||||||
| Property, plant and equipment, net of accumulated amortization and depreciation of $5,672,287 and $4,842,009, respectively | 2,056,600 | 1,517,852 | ||||||
| Goodwill | 1,701,094 | 1,701,094 | ||||||
| Intangible and other assets | 954,405 | 924,653 | ||||||
| Deferred income tax - long term | 773,712 | - | ||||||
| Total assets | $ | 26,454,248 | $ | 19,527,869 | ||||
| Liabilities and stockholders' equity | ||||||||
| Current liabilities: | ||||||||
| Accounts payable | $ | 1,147,414 | $ | 1,650,323 | ||||
| Accrued expenses and other current liabilities | 1,532,094 | 1,457,250 | ||||||
| Total current liabilities | 2,679,508 | 3,107,573 | ||||||
| Deferred lease liability | - | 16,614 | ||||||
| Deferred income | 20,395 | 51,318 | ||||||
| Total liabilities | 2,699,903 | 3,175,505 | ||||||
| Commitments and contingencies (Note 8) | ||||||||
| Stockholders' equity: | ||||||||
| Common stock, $.01 par value-shares authorized 20,000,000, 7,869,095 and 7,412,096 shares issued and 7,744,113 and 7,334,536 shares outstanding, respectively | 78,691 | 74,121 | ||||||
| Additional paid-in capital | 30,531,129 | 28,169,622 | ||||||
| Accumulated deficit | (5,909,215 | ) | (11,480,386 | ) | ||||
| Treasury stock, at cost, 124,982 and 77,560 shares, respectively | (946,260 | ) | (410,993 | ) | ||||
| Total stockholders' equity | 23,754,345 | 16,352,364 | ||||||
| Total liabilities and stockholders' equity | $ | 26,454,248 | $ | 19,527,869 | ||||
See Accompanying Notes to Consolidated Financial Statements.
| F-3 |
MISONIX, INC. and Subsidiaries
Consolidated Statements of Operations
| For the years ended | ||||||||||||
| June 30, | ||||||||||||
| 2015 | 2014 | 2013 | ||||||||||
| Net sales | $ | 22,204,578 | $ | 17,060,435 | $ | 14,827,226 | ||||||
| Cost of goods sold | 7,280,276 | 5,933,867 | 7,427,247 | |||||||||
| Gross profit | 14,924,302 | 11,126,568 | 7,399,979 | |||||||||
| Operating expenses: | ||||||||||||
| Selling expenses | 9,062,695 | 7,272,726 | 6,776,204 | |||||||||
| General and administrative expenses | 5,983,623 | 4,691,055 | 4,446,489 | |||||||||
| Research and development expenses | 1,592,923 | 1,711,751 | 1,496,058 | |||||||||
| Total operating expenses | 16,639,241 | 13,675,532 | 12,718,751 | |||||||||
| Loss from operations | (1,714,939 | ) | (2,548,964 | ) | (5,318,772 | ) | ||||||
| Other income (expense): | ||||||||||||
| Interest income | 75 | 69 | 75 | |||||||||
| Interest expense | - | - | (7 | ) | ||||||||
| Royalty income and license fees | 4,256,321 | 3,725,436 | 2,511,655 | |||||||||
| Royalty expense | - | - | (13,361 | ) | ||||||||
| Other | (22,033 | ) | (19,331 | ) | (101,533 | ) | ||||||
| Total other income | 4,234,363 | 3,706,174 | 2,396,829 | |||||||||
| Income/(loss) from continuing operations before income taxes | 2,519,424 | 1,157,210 | (2,921,943 | ) | ||||||||
| Income tax (benefit)/expense | (2,784,632 | ) | 30,630 | (75,196 | ) | |||||||
| Net income/(loss) from continuing operations | 5,304,056 | 1,126,580 | (2,846,747 | ) | ||||||||
| Discontinued operations: | ||||||||||||
| Income from discontinued operations net of tax expense of $1,127, $235 and $1,853, respectively | 17,115 | 19,666 | 3,596 | |||||||||
| Gain from sale of discontinued operations net of tax expense of $0, $2,947 and $77,814, respectively | 250,000 | 247,053 | 172,186 | |||||||||
| Net income from discontinued operations | 267,115 | 266,719 | 175,782 | |||||||||
| Net income/(loss) | $ | 5,571,171 | $ | 1,393,299 | $ | (2,670,965 | ) | |||||
| Net income/(loss) per share from continuing operations - Basic | $ | 0.70 | $ | 0.15 | $ | (0.40 | ) | |||||
| Net income per share from discontinued operations - Basic | 0.04 | 0.04 | 0.02 | |||||||||
| Net income/(loss) per share - Basic | $ | 0.74 | $ | 0.19 | $ | (0.38 | ) | |||||
| Net income/(loss) per share from continuing operations - Diluted | $ | 0.66 | $ | 0.15 | $ | (0.40 | ) | |||||
| Net income per share from discontinued operations - Diluted | 0.03 | 0.04 | 0.02 | |||||||||
| Net income/(loss) per share - Diluted | $ | 0.69 | $ | 0.19 | $ | (0.38 | ) | |||||
| Weighted average shares - Basic | 7,580,450 | 7,232,004 | 7,050,423 | |||||||||
| Weighted average shares - Diluted | 8,094,119 | 7,467,592 | 7,050,423 | |||||||||
See Accompanying Notes to Consolidated Financial Statements.
| F-4 |
MISONIX, INC. and Subsidiaries
Consolidated Statements of Stockholders' Equity
For the Years Ended June 30, 2015, 2014 and 2013
| Common Stock, | ||||||||||||||||||||||||||||
| $.01 Par Value | Treasury Stock | |||||||||||||||||||||||||||
| Additional | Total | |||||||||||||||||||||||||||
| Number | Number | paid-in | Accumulated | stockholders' | ||||||||||||||||||||||||
| of shares | Amount | of shares | Amount | capital | deficit | equity | ||||||||||||||||||||||
| Balance, June 30, 2012 | 7,082,920 | $ | 70,829 | (77,560 | ) | $ | (410,993 | ) | $ | 26,132,951 | $ | (10,202,720 | ) | $ | 15,590,067 | |||||||||||||
| Net loss/comprehensive loss | - | - | - | - | - | (2,670,965 | ) | (2,670,965 | ) | |||||||||||||||||||
| Proceeds from exercise of stock options | 150,964 | 1,510 | - | - | 368,136 | - | 369,646 | |||||||||||||||||||||
| Stock-based compensation | - | - | - | - | 488,472 | - | 488,472 | |||||||||||||||||||||
| Balance, June 30, 2013 | 7,233,884 | $ | 72,339 | (77,560 | ) | $ | (410,993 | ) | $ | 26,989,559 | $ | (12,873,685 | ) | $ | 13,777,220 | |||||||||||||
| Net income/comprehensive income | - | - | - | - | - | 1,393,299 | 1,393,299 | |||||||||||||||||||||
| Proceeds from exercise of stock options | 178,212 | 1,782 | - | - | 483,178 | - | 484,960 | |||||||||||||||||||||
| Stock-based compensation | - | - | - | - | 696,885 | - | 696,885 | |||||||||||||||||||||
| Balance, June 30, 2014 | 7,412,096 | $ | 74,121 | (77,560 | ) | $ | (410,993 | ) | $ | 28,169,622 | $ | (11,480,386 | ) | $ | 16,352,364 | |||||||||||||
| Net income/comprehensive income | - | - | - | - | - | 5,571,171 | 5,571,171 | |||||||||||||||||||||
| Proceeds from exercise of stock options | 456,999 | 4,570 | (47,422 | ) | (535,267 | ) | 1,254,257 | - | 723,560 | |||||||||||||||||||
| Stock-based compensation | - | - | - | - | 1,107,250 | - | 1,107,250 | |||||||||||||||||||||
| Balance, June 30, 2015 | 7,869,095 | $ | 78,691 | (124,982 | ) | $ | (946,260 | ) | $ | 30,531,129 | $ | (5,909,215 | ) | $ | 23,754,345 | |||||||||||||
See Accompanying Notes to Consolidated Financial Statements.
| F-5 |
MISONIX, INC. and Subsidiaries
Consolidated Statements of Cash Flows
| For the years ended | ||||||||||||
| June 30, | ||||||||||||
| 2015 | 2014 | 2013 | ||||||||||
| Operating activities | ||||||||||||
| Net income/(loss) from continuing operations | $ | 5,304,056 | $ | 1,126,580 | $ | (2,846,747 | ) | |||||
| Adjustments to reconcile net income/(loss) to net cash provided by/(used in) by continuing operating activities: | ||||||||||||
| Depreciation and amortization and other non-cash items | 1,439,972 | 978,468 | 785,437 | |||||||||
| Bad debt (recovery)/expense | (10,000 | ) | (77,773 | ) | 58,902 | |||||||
| Deferred income tax benefit | (2,892,428 | ) | - | - | ||||||||
| Stock-based compensation | 1,107,250 | 696,885 | 488,472 | |||||||||
| Deferred income | (46,052 | ) | (17,786 | ) | (36,216 | ) | ||||||
| Deferred lease liability | (16,614 | ) | (7,197 | ) | 815 | |||||||
| Changes in operating assets and liabilities: | ||||||||||||
| Accounts receivable | (712,095 | ) | (706,738 | ) | 124,541 | |||||||
| Inventories | (1,259,986 | ) | (1,033,624 | ) | 92,926 | |||||||
| Prepaid expenses and other assets | (129,828 | ) | 106,741 | 40,488 | ||||||||
| Accounts payable, accrued expenses and other non-cash items | (412,936 | ) | (382,219 | ) | 895,337 | |||||||
| Net cash provided by/(used in) continuing operating activities | 2,371,339 | 683,337 | (396,045 | ) | ||||||||
| Investing activities | ||||||||||||
| Acquisition of property, plant and equipment | (345,312 | ) | (72,437 | ) | (533,239 | ) | ||||||
| Payments for assets acquisition | (328,136 | ) | - | - | ||||||||
| Additional patents | (104,755 | ) | (129,078 | ) | (82,722 | ) | ||||||
| Net cash used in investing activities | (778,203 | ) | (201,515 | ) | (615,961 | ) | ||||||
| Financing activities | ||||||||||||
| Proceeds from exercise of stock options | 723,560 | 484,960 | 369,646 | |||||||||
| Net cash provided by financing activities | 723,560 | 484,960 | 369,646 | |||||||||
| Cash flows from discontinued operations | ||||||||||||
| Net cash provided by/(used in) operating activities | 17,115 | 16,719 | (74,218 | ) | ||||||||
| Net cash provided by investing activities | 250,000 | 250,000 | 250,000 | |||||||||
| Net cash provided by discontinued operations | 267,115 | 266,719 | 175,782 | |||||||||
| Net increase/(decrease) in cash and cash equivalents | 2,583,811 | 1,233,501 | (466,578 | ) | ||||||||
| Cash and cash equivalents at beginning of period | 7,039,938 | 5,806,437 | 6,273,015 | |||||||||
| Cash and cash equivalents at end of period | $ | 9,623,749 | $ | 7,039,938 | $ | 5,806,437 | ||||||
| Supplemental disclosure of cash flow information: | ||||||||||||
| Cash paid for: | ||||||||||||
| Interest | $ | - | $ | - | $ | 7 | ||||||
| Income taxes | $ | 86,070 | $ | 26,954 | $ | 32,341 | ||||||
See Accompanying Notes to Consolidated Financial Statements.
| F-6 |
MISONIX, INC. and Subsidiaries
Notes to Consolidated Financial Statements
For the Years Ended June 30, 2015, 2014 and 2013
1. Basis of Presentation, Organization and Business and Summary of Significant Accounting Policies
Basis of Presentation
The consolidated financial statements of MISONIX, INC. (“Misonix” or the “Company”) include the accounts of Misonix and its 100% owned subsidiaries, Fibra-Sonics (NY) Inc. and Hearing Innovations, Inc. All significant intercompany balances and transactions have been eliminated.
Organization and Business
Misonix is a surgical device company, operating in one business segment, that designs, manufactures and markets innovative therapeutic ultrasonic products worldwide for spine surgery, skull-based surgery, neurosurgery, wound debridement, cosmetic surgery, laparoscopic surgery and other surgical applications.
The Company’s revenues are generated from various regions throughout the world. Sales by the Company outside the United States are made through distributors. Sales made in the United States are made primarily through representative agents. The following is an analysis of net sales from continuing operations by geographic region:
| For the years ended June 30, | ||||||||
| 2015 | 2014 | |||||||
| United States | $ | 10,797,920 | $ | 8,185,468 | ||||
| Australia | 364,156 | 120,118 | ||||||
| Europe | 3,385,603 | 2,387,376 | ||||||
| Asia | 4,125,662 | 3,572,056 | ||||||
| Canada and Mexico | 836,188 | 779,833 | ||||||
| South America | 911,711 | 1,165,124 | ||||||
| South Africa | 540,185 | 378,287 | ||||||
| Middle East | 1,243,153 | 472,173 | ||||||
| $ | 22,204,578 | $ | 17,060,435 | |||||
| For the years ended June 30, | ||||||||
| 2014 | 2013 | |||||||
| United States | $ | 8,185,468 | $ | 7,649,041 | ||||
| Australia | 120,118 | 358,509 | ||||||
| Europe | 2,387,376 | 3,062,307 | ||||||
| Asia | 3,572,056 | 1,619,255 | ||||||
| Canada and Mexico | 779,833 | 516,088 | ||||||
| South America | 1,165,124 | 735,060 | ||||||
| South Africa | 378,287 | 489,756 | ||||||
| Middle East | 472,173 | 397,210 | ||||||
| $ | 17,060,435 | $ | 14,827,226 | |||||
| F-7 |
MISONIX, INC. and Subsidiaries
Notes to Consolidated Financial Statements
For the Years Ended June 30, 2015, 2014 and 2013
Discontinued Operations
| For the years ended | ||||||||||||
| June 30, | ||||||||||||
| 2015 | 2014 | 2013 | ||||||||||
| Revenues | $ | 18,242 | $ | 19,901 | $ | 19,901 | ||||||
| Income from discontinued operations, before tax | $ | 18,242 | $ | 19,901 | $ | 5,449 | ||||||
| Gain on sale of discontinued operations | 250,000 | 250,000 | 250,000 | |||||||||
| Income tax benefit/(expense) | (1,127 | ) | (3,182 | ) | (79,667 | ) | ||||||
| Net income from discontinued operations, net of tax | $ | 267,115 | $ | 266,719 | $ | 175,782 | ||||||
High Intensity Focused Ultrasound Technology
In consideration for the May 2010 sale of its rights to the high intensity focused ultrasound technology to SonaCare Medical (“SonaCare”), Misonix will receive up to approximately $5.8 million, paid out of an earn-out of 7% of gross revenues received by SonaCare related to the business being sold up to the time the Company has received the first $3 million and thereafter 5% of the gross revenues up to $5.8 million. Commencing 90 days after each December 31st and beginning December 31, 2011 the payments due to Misonix will be the greater of (a) $250,000 or (b) 7% of gross revenues received up to the time the Company has received the first $3 million and thereafter 5% of gross revenues up to the $5.8 million. Cumulative payments through June 30, 2015 were $1,004,788. The gain on the sale has been recognized when received as the ultimate collectability of the amount due from SonaCare cannot be reasonably assured at this time.
| F-8 |
MISONIX, INC. and Subsidiaries
Notes to Consolidated Financial Statements
For the Years Ended June 30, 2015, 2014 and 2013
Cash and Cash Equivalents
The Company considers all highly liquid debt instruments purchased with a maturity of three months or less to be cash equivalents.
The Company maintains cash balances at various financial institutions. At June 30, 2015, these financial institutions held cash that was approximately $9,375,735 in excess of amounts insured by the Federal Deposit Insurance Corporation and other government agencies.
Major Customers and Concentration of Credit Risk
Included in sales from continuing operations are sales to Cicel (Beijing) Science and Tech Co. Ltd. (“Cicel”) of $2,974,086, $2,495,960 and $619,537, Covidien plc (“Covidien”) of $3,820, $5,226 and $110,437, and Aesculap, Inc. (“Aesculap”) of $497,581, $636,085 and $1,425,708 for the fiscal years ended June 30, 2015, 2014 and 2013, respectively. Total royalties from Covidien related to their sales of the Company’s ultrasonic cutting products, which use high frequency sound waves to coagulate and divide tissue for both open and laparoscopic surgery, were $4,162,000, $3,619,000 and $2,369,000 for the fiscal years ended June 30, 2015, 2014 and 2013, respectively. Accounts receivable from Covidien royalties were approximately $1,012,000 and $892,000 at June 30, 2015 and 2014, respectively. Accounts receivable from Aesculap were approximately $1,000 and $121,000 and from Cicel were approximately $586,000 and $606,000 at June 30, 2015 and 2014, respectively. At June 30, 2015 and 2014, the Company’s accounts receivable with customers outside the United States were approximately $1,805,000 and $1,332,000, respectively, none of which is over 90 days. The Company sells its BoneScalpel, SonaStar and SonicOne Wound Cleansing and Debridement System through direct sales persons and agents in the United States and through distributors outside the United States.
Accounts Receivable
Accounts receivable, principally trade, are generally due within 30 to 90 days and are stated at amounts due from customers, net of an allowance for doubtful accounts. The Company performs ongoing credit evaluations and adjusts credit limits based upon payment history and the customer's current credit worthiness, as determined by a review of their current credit information. The Company continuously monitors aging reports, collections and payments from customers and maintains a provision for estimated credit losses based upon historical experience and any specific customer collection issues that have been identified. While such credit losses have historically been within expectations and the provisions established, the Company cannot guarantee that the same credit loss rates will be experienced in the future. The Company writes off accounts receivable when they become uncollectible.
Inventories
Inventories are stated at the lower of cost (first-in, first-out) or market and consist of raw materials, work-in process and finished goods and include purchased materials, direct labor and manufacturing overhead. Management evaluates the need to record adjustments to write down inventory to the lower of cost or market on a quarterly basis. The Company’s policy is to assess the valuation of all inventories, including raw materials, work-in-process and finished goods and it writes down its inventory for estimated obsolescence based upon the age of inventory and assumptions about future demand and usage. During the year ended June 30, 2013 the Company also established inventory reserves aggregating approximately $835,000 resulting from terminating an agreement for products not meeting specifications for which recovery from the supplier is not expected. Inventory items used for demonstration purposes, rentals or on consignment are classified as property, plant and equipment.
Property, Plant and Equipment
Property, plant and equipment are recorded at cost. Minor replacements and maintenance and repair expenses are charged to expense as incurred. Depreciation of property and equipment is provided using the straight-line method over estimated useful lives ranging from 3 to 5 years. Leasehold improvements are amortized over the life of the lease or the useful life of the related asset, whichever is shorter. The Company's policy is to periodically evaluate the appropriateness of the lives assigned to property, plant and equipment and make adjustments if necessary. Inventory items included in property, plant and equipment are depreciated using the straight line method over estimated useful lives of 3 to 5 years. See Note 4.
| F-9 |
MISONIX, INC. and Subsidiaries
Notes to Consolidated Financial Statements
For the Years Ended June 30, 2015, 2014 and 2013
Revenue Recognition
The Company records revenue upon shipment for products shipped F.O.B. shipping point. Products shipped F.O.B. destination points are recorded as revenue when received at the point of destination. Shipments under agreements with distributors are not subject to return, and payment for these shipments is not contingent on sales by the distributor. Accordingly, the Company recognizes revenue on shipments to distributors in the same manner as with other customers. Fees from exclusive license agreements are recognized ratably over the terms of the respective agreements. Service contracts and royalty income are recognized when earned.
The Company presents taxes collected from customers and remitted to governmental authorities in the consolidated statements of operations on a net basis.
Long-Lived Assets
The carrying values of intangible and other long-lived assets, excluding goodwill, are periodically reviewed to determine if any impairment indicators are present. If it is determined that such indicators are present and the review indicates that the assets will not be fully recoverable, based on undiscounted estimated cash flows over the remaining amortization and depreciation period, their carrying values are reduced to estimated fair value. Impairment indicators include, among other conditions, cash flow deficits, an historic or anticipated decline in revenue or operating profit, adverse legal or regulatory developments, accumulation of costs significantly in excess of amounts originally expected to acquire the asset and a material decrease in the fair value of some or all of the assets. Assets are grouped at the lowest levels for which there are identifiable cash flows that are largely independent of the cash flows generated by other asset groups. No such impairment was deemed to exist in fiscal 2015, 2014 or 2013.
Goodwill
Goodwill is not amortized. We review goodwill for impairment annually and whenever events or changes indicate that the carrying value of an asset may not be recoverable. These events or circumstances could include a significant change in the business climate, legal factors, operating performance indicators, competition, or sale or disposition of significant assets or products. Application of these impairment tests requires significant judgments, including estimation of cash flows, which is dependent on internal forecasts, estimation of the long term rate of growth for the Company’s business, the useful lives over which cash flows will occur and determination of the Company’s weighted average cost of capital. We primarily utilize a discontinued cashflow model in determining the fair value which consists of Level 3 inputs. Changes in the projected cash flows and discount rate estimates and assumptions underlying the valuation of goodwill could materially affect the determination of fair value at acquisition or during subsequent periods when tested for impairment. The Company completed its annual goodwill impairment tests for fiscal 2015 and 2014 as of June 30th each year. No impairment of goodwill was deemed to exist in fiscal 2015, 2014 or 2013.
Intangible and Other Assets
The cost of acquiring or processing patents is capitalized at cost. This amount is being amortized using the straight-line method over the estimated useful lives of the underlying assets, which is approximately 17 years. Net patents reported in intangible and other assets totaled $566,028 and $611,355 at June 30, 2015 and 2014, respectively. Accumulated amortization totaled $791,551 and $641,469 at June 30, 2015 and 2014, respectively. Amortization expense for the years ended June 30, 2015, 2014 and 2013 was approximately $150,000, $83,000 and $75,000, respectively.
| F-10 |
MISONIX, INC. and Subsidiaries
Notes to Consolidated Financial Statements
For the Years Ended June 30, 2015, 2014 and 2013
Net customer relationships are amortized over 5 years and reported in intangible and other assets and totaled $40,000 and $200,000 at June 30, 2015 and June 30, 2014, respectively. Accumulated amortization amounted to $760,000 at June 30, 2015 and $600,000 at June 30, 2014. Amortization expense for the fiscal years ended June 30, 2015, 2014 and 2013 was $160,000, respectively.
Net reacquired contractual rights from Aesculap reported in intangible and other assets totaled $178,983 at June 30, 2015 and $0 at June 30, 2014. Accumulated amortization amounted to $149,153 at June 30, 2015 and $0 at June 30, 2014. Amortization expense for the fiscal years ended June 30, 2015, 2014 and 2013 was $149,153, $0 and $0, respectively.
The following is a schedule of estimated future amortization expense as of June 30, 2015:
| Customer | Reacquired | |||||||||||
| Patents | Relationships | Contractual Rights | ||||||||||
| 2016 | $ | 85,636 | $ | 40,000 | $ | 178,983 | ||||||
| 2017 | 80,540 | - | - | |||||||||
| 2018 | 77,960 | - | - | |||||||||
| 2019 | 70,353 | - | - | |||||||||
| 2020 | 47,425 | - | - | |||||||||
| Thereafter | 204,114 | - | - | |||||||||
| $ | 566,028 | $ | 40,000 | $ | 178,983 | |||||||
| F-11 |
MISONIX, INC. and Subsidiaries
Notes to Consolidated Financial Statements
For the Years Ended June 30, 2015, 2014 and 2013
Income Taxes
Deferred tax assets and liabilities are recognized for the future tax consequences attributable to differences between the financial statement carrying amounts of existing assets and liabilities and their respective tax bases and operating loss and tax credit carry forwards. Deferred tax assets and liabilities are measured using enacted tax rates expected to apply to taxable income in the years in which those temporary differences are expected to be recovered or settled. The effect on deferred tax assets and liabilities of a change in tax rates is recognized in income in the period that includes the enactment date. The ultimate realization of deferred tax assets is dependent upon the generation of future taxable income in those periods in which temporary differences become deductible. Should management determine that it is more likely than not that some portion of the deferred tax asset will not be realized, a valuation allowance against the deferred tax asset would be established in the period such determination was made.
The Company recognizes a tax benefit from an uncertain tax position only if it is more likely than not that the tax position will be sustained on examination by the taxing authorities based on the technical merits of the position. The tax benefits recognized in the financial statements from such position are measured based on the largest benefit that has a greater than fifty percent likelihood of being realized upon ultimate settlement. The Company classifies income tax related interest and penalties as a component of income tax expense.
Income (Loss) Per Share
Basic income (loss) per common share ("Basic EPS") is computed by dividing income (loss) by the weighted average number of common shares outstanding using the treasury stock method. Diluted income (loss) per common share ("Diluted EPS") is computed by dividing income (loss) by the weighted average number of common shares and the dilutive common share equivalents and convertible securities then outstanding.
The number of weighted average common shares used in the calculation of Basic EPS and Diluted EPS were as follows:
| For the years ended | ||||||||||||
| June 30, | ||||||||||||
| 2015 | 2014 | 2013 | ||||||||||
| Basic shares | 7,580,450 | 7,232,004 | 7,050,423 | |||||||||
| Dilutive effect of stock options | 513,669 | 235,588 | - | |||||||||
| Diluted shares | 8,094,119 | 7,467,592 | 7,050,423 | |||||||||
Excluded from the calculation to Diluted EPS are options to purchase 257,000 shares of common stock for twelve months ended June 30, 2015. In addition, excluded from the calculation of Diluted EPS are options to purchase 312,630 shares of common stock for the twelve months ended June 30, 2014. The excluded shares are any shares in which the average stock price for the year ended June 30, 2015 is less than the exercise price of the outstanding options in the period in which the Company has net income. Diluted EPS for the twelve months ended June 30, 2013 presented is the same as Basic EPS, as the inclusion of the effect of common share equivalents then outstanding would be anti-dilutive. For this reason, excluded from the calculations of Diluted EPS for the twelve months ended June 30, 2013 are outstanding options to purchase 1,729,991 shares.
Comprehensive Income/(Loss)
Total comprehensive income/(loss) was $5,571,171 for the fiscal year ended June 30, 2015, $1,393,299 for the fiscal year ended June 30, 2014 and ($2,670,965) for the fiscal year ended June 30, 2013.
Research and Development
All research and development expenses are expensed as incurred and are included in operating expenses.
Advertising Expense
The cost of advertising is expensed in the period the advertising first takes place. The Company incurred approximately $155,000, $100,000 and $141,000 in advertising costs during the fiscal years ended June 30, 2015, 2014 and 2013, respectively.
| F-12 |
MISONIX, INC. and Subsidiaries
Notes to Consolidated Financial Statements
For the Years Ended June 30, 2015, 2014 and 2013
Use of Estimates
The preparation of financial statements in conformity with accounting principles generally accepted in the United States requires management to make estimates and judgments that affect the reported amount of assets and liabilities and disclosure of contingent assets and liabilities at the date of the financial statements and the reported amounts of revenues and expenses during the reporting period. Significant estimates and assumptions are used for but not limited to, establishing the allowance for doubtful accounts, valuation of inventory, depreciation, asset impairment evaluations and establishing deferred tax assets and stock-based compensation. Actual results could differ from those estimates.
| F-13 |
MISONIX, INC. and Subsidiaries
Notes to Consolidated Financial Statements
For the Years Ended June 30, 2015, 2014 and 2013
Shipping and Handling
Shipping and handling fees for the fiscal years ended June 30, 2015, 2014 and 2013 were approximately $62,000, $75,000 and $47,000, respectively, and are reported as a component of net sales. Shipping and handling costs for the fiscal years ended June 30, 2015, 2014 and 2013 were approximately $87,000, $85,000 and $101,000, respectively, and are reported as a component of selling expenses.
Stock-Based Compensation
The Company measures compensation cost for all share based payments at fair value and recognizes the cost over the vesting period. The Company utilizes the straight line amortization method to recognize the expense associated with the awards with graded vesting terms.
Recent Accounting Pronouncements
In April 2014, the Financial Accounting Standards Board (“FASB”) issued Accounting Standards Update (“ASU”) 2014-08, “Presentation of Financial Statements (Topic 205)” and “Property, Plant and Equipment (Topic 360): Reporting Discontinued Operations and Disclosures of Disposals of Components of an Entity.” The amendments in the ASU change the criteria for reporting discontinued operations while enhancing related disclosures. The amendments in the ASU are effective in the first quarter of 2015. The adoption of ASU 2014-08 did not have a material impact on the Company’s consolidated financial statements.
In May 2014, the FASB issued ASU 2014-09, "Revenue from Contracts with Customers (Topic 606)." The new revenue recognition standard provides a five-step analysis to determine when and how revenue is recognized. The standard requires that a company recognize revenue to depict the transfer of promised goods or services to customers in an amount that reflects the consideration to which the company expects to be entitled in exchange for those goods or services. This ASU is effective for annual periods beginning after December 15, 2017 and will be applied retrospectively to each period presented or as a cumulative-effect adjustment as of the date of adoption. This pronouncement has been officially deferred for one year. The Company is currently evaluating the impact of the pending adoption of ASU 2014-09 on its consolidated financial statements.
| F-14 |
MISONIX, INC. and Subsidiaries
Notes to Consolidated Financial Statements
For the Years Ended June 30, 2015, 2014 and 2013
2. Fair Value of Financial Instruments
We follow a three-level fair value hierarchy that prioritizes the inputs to measure fair value. This hierarchy requires entities to maximize the use of "observable inputs" and minimize the use of "unobservable inputs." The three levels of inputs used to measure fair value are as follows:
Level 1: Quoted prices (unadjusted) for identical assets or liabilities in active markets as of the measurement date.
Level 2: Significant other observable inputs other than Level 1 prices such as quoted prices for similar assets or liabilities; quoted prices in markets that are not active; or other inputs that are observable or can be corroborated by observable market data.
Level 3: Significant unobservable inputs that reflect assumptions that market participants would use in pricing an asset or liability.
The following is a summary of the carrying amounts and estimated fair values of our financial instruments:
| June 30, 2015 | June 30, 2014 | |||||||||||||||
| Carrying | Fair | Carrying | Fair | |||||||||||||
| Amount | Value | Amount | Value | |||||||||||||
| Cash and cash equivalents | $ | 9,623,749 | $ | 9,623,749 | $ | 7,039,938 | $ | 7,039,938 | ||||||||
| Trade accounts receivable | 4,481,247 | 4,481,247 | 3,759,152 | 3,759,152 | ||||||||||||
| Trade accounts payable | 1,147,414 | 1,147,414 | 1,650,323 | 1,650,323 | ||||||||||||
The following methods and assumptions were used to estimate the fair value of each class of financial instruments for which it is practicable to estimate that value:
Cash and Cash Equivalents
The carrying amount approximates fair value because of the short maturity of those instruments.
Trade Accounts Receivable
The carrying amount of trade receivables reflects net recovery value and approximates fair value because of their short outstanding terms.
Trade Accounts Payable
The carrying amount of trade payables approximates fair value because of their short outstanding terms.
| F-15 |
MISONIX, INC. and Subsidiaries
Notes to Consolidated Financial Statements
For the Years Ended June 30, 2015, 2014 and 2013
3. Inventories
Inventories are summarized as follows:
| June 30, | June 30, | |||||||
| 2015 | 2014 | |||||||
| Raw material | $ | 2,096,443 | $ | 1,820,046 | ||||
| Work-in-process | 660,267 | 410,827 | ||||||
| Finished goods | 2,536,699 | 3,337,568 | ||||||
| 5,293,409 | 5,568,441 | |||||||
| Less valuation reserve | 990,246 | 1,351,091 | ||||||
| $ | 4,303,163 | $ | 4,217,350 | |||||
| F-16 |
MISONIX, INC. and Subsidiaries
Notes to Consolidated Financial Statements
For the Years Ended June 30, 2015, 2014 and 2013
4. Property, Plant and Equipment
Property, plant and equipment consist of the following:
| June 30, | June 30, | |||||||
| 2015 | 2014 | |||||||
| Machinery and equipment | $ | 1,998,574 | $ | 1,887,309 | ||||
| Furniture and fixtures | 1,287,070 | 1,234,104 | ||||||
| Automobiles | 22,328 | 22,328 | ||||||
| Leasehold improvements | 476,501 | 445,879 | ||||||
| Demonstration and consignment inventory | 3,944,414 | 2,770,241 | ||||||
| 7,728,887 | 6,359,861 | |||||||
| Less: accumulated depreciation and amortization | (5,672,287 | ) | (4,842,009 | ) | ||||
| $ | 2,056,600 | $ | 1,517,852 | |||||
Depreciation and amortization of property, plant and equipment totaled approximately $981,000, $732,000 and $550,000 for the fiscal years ended June 30, 2015, 2014 and 2013, respectively.
5. Accrued Expenses and Other Current Liabilities
The following summarizes accrued expenses and other current liabilities:
| June 30, | June 30, | |||||||
| 2015 | 2014 | |||||||
| Accrued payroll and vacation | $ | 507,172 | $ | 460,341 | ||||
| Accrued bonuses | 300,000 | 250,000 | ||||||
| Accrued commissions | 321,440 | 340,462 | ||||||
| Accrued professional and legal fees | 97,880 | 85,832 | ||||||
| Income tax payable | 71,302 | 29,506 | ||||||
| Deferred income | 40,911 | 102,453 | ||||||
| Other | $ | 193,389 | $ | 188,656 | ||||
| $ | 1,532,094 | $ | 1,457,250 | |||||
| F-17 |
MISONIX, INC. and Subsidiaries
Notes to Consolidated Financial Statements
For the Years Ended June 30, 2015, 2014 and 2013
6. Leases
Misonix has entered into several noncancellable operating leases for the rental of certain manufacturing and office space, equipment and automobiles expiring in various years through 2019. The principal building lease provides for a monthly rental of approximately $26,000. The Company also leases certain office equipment and automobiles under operating leases expiring through fiscal 2018.
The following is a schedule of future minimum lease payments, by year and in the aggregate, under operating leases with initial or remaining terms of one year or more at June 30, 2015:
| Operating | ||||
| Leases | ||||
| 2016 | $ | 347,038 | ||
| 2017 | 343,580 | |||
| 2018 | 331,847 | |||
| Total minimum lease payments | $ | 1,022,465 | ||
Certain of the leases provide for escalation clauses, renewal options and the payment of real estate taxes and other occupancy costs. Rent expense for all operating leases was approximately $375,000, $392,000 and $387,000 for the fiscal years ended June 30, 2015, 2014 and 2013, respectively.
7. Stock-Based Compensation Plans
Stock options are granted with exercise prices not less than the fair market value of our common stock, par value $.01 per share (“Common Stock”), at the time of the grant, with an exercise term as determined by the Committee administering the applicable option plan (the "Committee") not to exceed 10 years. The Committee determines the vesting period for the Company's stock options. Generally, such stock options have vesting periods of immediate to four years. Certain option awards provide for accelerated vesting upon meeting specific retirement, death or disability criteria, and upon change of control. During the fiscal years ended June 30, 2015, 2014 and 2013, the Company granted options to purchase 549,000, 324,000 and 357,000 shares of Common Stock, respectively.
Compensation expense is recognized in the general and administrative expenses line item of the Company's consolidated statements of operations on a straight-line basis over the vesting periods. There are no capitalized stock-based compensation costs at June 30, 2015 and 2014. As of June 30, 2015, there was approximately $3,583,000 of total unrecognized compensation cost related to non-vested share-based compensation arrangements to be recognized over a weighted-average period of 2.8 years.
| F-18 |
MISONIX, INC. and Subsidiaries
Notes to Consolidated Financial Statements
For the Years Ended June 30, 2015, 2014 and 2013
Shares may be acquired by various methods. They may be acquired by (a) cash or by certified check, (b) with previously acquired shares of Common Stock having an aggregate fair market value, on the date of exercise, equal to the aggregate exercise price of all options being exercised (provided that such shares were not acquired less than six (6) months prior to such exercise date), (c) by surrendering options to acquire shares of Common Stock in exchange for the number of shares of Common Stock equal to the product of the number of shares of Common Stock as to which the option is being exercised multiplied by a fraction, the numerator of which is the fair market value of the Common Stock less the exercise price of the options and the denominator of which is such fair market value. Cash in the amount of $723,560 was received from the exercise of stock options for the twelve months ended June 30, 2015. The Company received 47,422 shares of previously acquired Common Stock as payment for option exercises for the twelve months ended June 30, 2015. The acquired shares are held and accounted for as treasury stock. Total options, exercised by either cash or through surrender of previously owned shares, were 579,463. The total number of options forfeited for the twelve months ended June 30, 2015 was 47,250 options, representing the unvested portion upon termination of employment. Options expiring at the end of the option term totaled 28,000 for the twelve months ended June 30, 2015.
The weighted average fair value at date of grant for options granted during the fiscal years ended June 30, 2015, 2014 and 2013 was $5.70, $3.95 and $3.04 per share, respectively. The fair value of options at date of grant was estimated using the Black-Scholes option-pricing model utilizing the following assumptions:
| 2015 | 2014 | 2013 | ||||||||||
| Risk-free interest rates | 1.6 | % | 3.0 | % | 2.5 | % | ||||||
| Expected option life in years | 6.5 | 6.5 | 6.5 | |||||||||
| Expected stock price volatility | 61.13 | % | 76.09 | % | 75.15 | % | ||||||
| Expected dividend yield | 0 | % | 0 | % | 0 | % | ||||||
The risk free interest rate is based on the U.S. Treasury yield in effect at the time of grant. The expected option term is based upon the number of years the Company estimates the option will be outstanding based on historical exercises and terminations. The expected dividend yield is based upon historical and projected dividends. The Company estimates volatility based upon historical price changes of the Company’s stock over a period equal to that of the expected life of the option.
In March 1996, the Board of Directors adopted and, in February 1997, the shareholders approved the 1996 Employee Incentive Stock Option Plan covering an aggregate of 450,000 shares of Common Stock (the "1996 Plan") and the 1996 Non-Employee Director Stock Option Plan (the "1996 Directors Plan") covering an aggregate of 1,125,000 shares of Common Stock. At June 30, 2015, options to purchase 1,000 shares were outstanding under the 1996 Plan at an exercise price of $7.60 per share all of which are currently vested and options to acquire 15,000 shares were outstanding under the 1996 Directors Plan at an exercise price of $7.60 per share all of which are currently vested. At June 30, 2015, options to purchase 178,295 shares under the 1996 Plan have been exercised and options to purchase 422,650 shares have been forfeited (of which options to purchase 151,945 shares have been reissued). As of June 30, 2015, there were no shares available for future grants. At June 30, 2015, options to purchase 913,500 shares under the 1996 Directors Plan have been exercised and options to purchase 130,000 shares have been forfeited (of which none have been reissued). As of June 30, 2015, there were no shares available for future grants.
In October 1998, the Board of Directors adopted and, in January 1999, the shareholders approved the 1998 Employee Stock Option Plan (the "1998 Plan") covering an aggregate of 500,000 shares of Common Stock. At June 30, 2015, options to purchase 6,000 shares were outstanding under the 1998 Plan at an exercise price of $7.60 per share all of which are currently vested. At June 30, 2015, options to purchase 81,598 shares under the 1998 Plan have been exercised and options to purchase 477,677 shares under the 1998 Plan have been forfeited (of which options to purchase 65,275 shares have been reissued). At June 30, 2015, there were no shares available for future grants.
In October 2000, the Board of Directors adopted and, in February 2001, the shareholders approved the 2001 Employee Stock Option Plan (the "2001 Plan") covering an aggregate of 1,000,000 shares of Common Stock. At June 30, 2015, options to purchase 9,968 shares were outstanding under the 2001 Plan at exercise prices ranging from $1.82 to $5.82 per share with a vesting period of one to four years. At June 30, 2015, options to purchase 375,318 shares under the 2001 Plan have been exercised and options to purchase 865,975 shares under the 2001 Plan have been forfeited (options to purchase 251,261 shares have been reissued). At June 30, 2015, there were no shares available for future grants.
| F-19 |
MISONIX, INC. and Subsidiaries
Notes to Consolidated Financial Statements
For the Years Ended June 30, 2015, 2014 and 2013
In September 2005, the Board of Directors adopted and, in December 2005, the shareholders approved, the 2005 Employee Equity Incentive Plan (the "2005 Plan") covering an aggregate of 500,000 shares of Common Stock and the 2005 Non-Employee Director Stock Option Plan (the "2005 Directors Plan") covering an aggregate of 200,000 shares of Common Stock. At June 30, 2015, options to purchase 223,725 shares were outstanding under the 2005 Plan at exercise prices ranging from $.85 to $6.18 per share with a vesting period of four years. At June 30, 2015 options to purchase 275,650 shares have been exercised under the 2005 Plan and options to purchase 47,750 shares have been forfeited (of which options to purchase 47,125 shares have been reissued). At June 30, 2015, 625 shares were available for future grants under the 2005 Plan. At June 30, 2015, options to purchase 120,000 shares were outstanding under the 2005 Directors Plan at exercise prices ranging from $2.41 to $5.42 with a vesting period over three years. At June 30, 2015, options to purchase 67,500 shares under the 2005 Directors Plan have been exercised and options to purchase 7,500 shares have been forfeited (of which none have been reissued). At June 30, 2015, there were 12,500 shares available for future grants under the 2005 Directors Plan.
In December 2009, the Board of Directors and shareholders adopted the 2009 Employee Equity Incentive Plan (the "2009 Plan") covering an aggregate of 500,000 shares of Common Stock and the 2009 Non-Employee Director Stock Option Plan (the "2009 Directors Plan") covering an aggregate of 200,000 shares of Common Stock. At June 30, 2015, options to purchase 345,423 shares were outstanding under the 2009 Plan at exercise prices ranging from $1.82 to $6.18 per share with a vesting period of four years. At June 30, 2015, options to purchase 133,477 shares have been exercised and options to purchase 89,025 shares were forfeited under the 2009 Plan (of which options to purchase 67,925 shares have been reissued). At June 30, 2015, there were 21,100 shares available for future grants under the 2009 Plan. At June 30, 2015, options to purchase 138,750 shares were outstanding under the 2009 Directors Plan at exercise prices ranging from $2.41 to $6.71 with a vesting period of up to four years. At June 30, 2015, options to purchase 26,250 shares have been exercised and options to purchase 30,000 shares were forfeited under the 2009 Directors Plan (of which none have been reissued). At June 30, 2015, there were 35,000 shares available for future grants under the 2009 Directors Plan.
In December 2012, the Board of Directors and shareholders adopted the 2012 Employee Equity Incentive Plan (the “2012 Plan”) covering an aggregate of 500,000 shares of Common Stock and the 2012 Non-Employee Director Stock Option Plan (the “2012 Directors Plan”) covering an aggregate of 200,000 shares of Common Stock. At June 30, 2015, options to purchase 442,750 shares were outstanding under the 2012 Plan at exercise prices ranging from $4.68 to $13.89 per share with a vesting period of four years. At June 30, 2015, options to purchase 8,750 shares have been exercised and options to purchase 7,000 shares were forfeited under the 2012 Plan (of which none have been reissued). At June 30, 2015, 48,500 shares were available for future grants under the 2012 Plan. At June 30, 2015, options to purchase 75,000 shares were outstanding under the 2012 Directors Plan at an exercise price of $13.20 per share with a vesting period of four years. At June 30, 2015, there were no options exercised and options to purchase 15,000 shares were forfeited under the 2012 Directors Plan (of which none have been reissued). At June 30, 2015, 125,000 shares were available for future grants under the 2012 Directors Plan.
In November 2014, the Board of Directors adopted and, in February 2015, the shareholders approved the 2014 Employee Equity Incentive Plan (the “2014 Plan”) covering an aggregate of 750,000 shares of Common Stock. At June 30, 2015, options to purchase 180,000 shares were outstanding under the 2014 Plan at prices ranging from $11.88 to $12.77 per share with a vesting period of up to four years. At June 30, 2015, there were no options exercised or forfeited under the 2014 Plan. At June 30, 2015, 570,000 shares were available for future grants under the 2014 Plan.
The selection of participants, allotments of shares and determination of price and other conditions relating to options are determined by the Board of Directors or a committee thereof, depending on the Plan, and in accordance with Rule 4350(c) of the Corporate Governance Requirements applicable to Nasdaq-listed companies. Incentive stock options granted under the Plans are exercisable for a period of up to ten years from the date of grant at an exercise price which is not less than the fair market value of the Common Stock on the date of the grant, except that the term of an incentive stock option granted under the Plans to a shareholder owning more than 10% of the outstanding Common Stock may not exceed five years and its exercise price may not be less than 110% of the fair market value of the Common Stock on the date of grant. Options shall become exercisable at such time and in such installments as provided in the terms of each individual option agreement.
| F-20 |
MISONIX, INC. and Subsidiaries
Notes to Consolidated Financial Statements
For the Years Ended June 30, 2015, 2014 and 2013
The following table summarizes information about stock option activity during 2015, 2014 and 2013:
| Options | ||||||||||||||||
| Weighted | ||||||||||||||||
| Average | ||||||||||||||||
| Weighted | Remaining | |||||||||||||||
| Number | Average | Contractual | Aggregate | |||||||||||||
| of | Exercise | Life | Intrinsic | |||||||||||||
| Shares | Price | Years | Value | |||||||||||||
| Outstanding as of June 30, 2014 | 1,663,329 | $ | 3.88 | |||||||||||||
| Granted | 549,000 | 10.11 | ||||||||||||||
| Exercised | (579,463 | ) | 4.11 | $ | 1,592,472 | |||||||||||
| Forfeited | (47,250 | ) | 7.70 | |||||||||||||
| Expired | (28,000 | ) | 8.00 | |||||||||||||
| Outstanding as of June 30, 2015 | 1,557,616 | $ | 5.80 | 6.4 | $ | 6,553,821 | ||||||||||
| Vested and exercisable at June 30, 2015 | 620,256 | $ | 3.19 | 5.0 | $ | 3,911,604 | ||||||||||
| Outstanding as of June 30, 2013 | 1,729,991 | $ | 3.65 | |||||||||||||
| Granted | 324,000 | 4.94 | ||||||||||||||
| Exercised | (178,212 | ) | 2.72 | $ | 341,479 | |||||||||||
| Forfeited | (50,250 | ) | 4.31 | |||||||||||||
| Expired | (162,200 | ) | 4.67 | |||||||||||||
| Outstanding as of June 30, 2014 | 1,663,329 | $ | 3.88 | 5.2 | $ | 4,879,106 | ||||||||||
| Vested and exercisable at June 30, 2014 | 967,056 | $ | 3.81 | 4.3 | $ | 2,937,802 | ||||||||||
| Outstanding as of June 30, 2012 | 1,820,930 | $ | 3.60 | |||||||||||||
| Granted | 357,500 | 3.83 | ||||||||||||||
| Exercised | (150,964 | ) | 2.45 | $ | 86,972 | |||||||||||
| Forfeited | (95,775 | ) | 2.41 | |||||||||||||
| Expired | (201,700 | ) | 5.10 | |||||||||||||
| Outstanding as of June 30, 2013 | 1,729,991 | $ | 3.65 | 5.4 | $ | 2,937,132 | ||||||||||
| Vested and exercisable at June 30, 2013 | 1,104,817 | $ | 3.97 | 3.6 | $ | 1,554,007 | ||||||||||
| F-21 |
MISONIX, INC. and Subsidiaries
Notes to Consolidated Financial Statements
For the Years Ended June 30, 2015, 2014 and 2013
The following table summarizes information about stock options outstanding at June 30, 2015:
| Options Outstanding | Options Exercisable | |||||||||||||||||||
| Weighted | ||||||||||||||||||||
| Average | Weighted | Weighted | ||||||||||||||||||
| Range of | Contractual | Average | Average | |||||||||||||||||
| Exercise | Life | Exercise | Exercise | |||||||||||||||||
| Prices | Number | (Yrs.) | Price | Number | Price | |||||||||||||||
| $0.85-2.96 | 605,386 | 5.5 | $ | 2.39 | 455,051 | $ | 2.28 | |||||||||||||
| $3.45-4.68 | 220,850 | 6.4 | $ | 4.66 | 44,975 | $ | 4.56 | |||||||||||||
| $5.42-13.89 | 731,380 | 7.4 | $ | 8.96 | 120,230 | $ | 6.14 | |||||||||||||
| 1,557,616 | 6.4 | $ | 5.80 | 620,256 | $ | 3.19 | ||||||||||||||
As of June 30, 2015, 2014 and 2013, 1,557,616, 1,663,329 and 1,729,991 shares are reserved for issuance under outstanding options and 812,725, 564,475 and 854,725 shares are reserved for the granting of additional options, respectively. All outstanding options expire between September 2015 and May 2025 and vest over periods of up to four years.
The total number of unvested options as of June 30, 2015 are 937,361 shares at a fair value using our Black-Scholes valuation method of $3,583,407.
| F-22 |
MISONIX, INC. and Subsidiaries
Notes to Consolidated Financial Statements
For the Years Ended June 30, 2015, 2014 and 2013
8. Commitments and Contingencies
Employment Agreement
On May 22, 2015, the Employment Agreement, dated July 1, 2014, by and between Michael A. McManus, Jr. and the Company was mutually terminated and replaced by a new Employment Agreement whereby Mr. McManus will continue to serve as the Company's President and Chief Executive Officer (the "McManus Agreement"). The McManus Agreement, effective as of May 22, 2015, has an initial term expiring June 30, 2017 and renews for successive one-year periods thereafter unless terminated by either party not less than ninety (90) days prior to the end of the then-current term. The McManus Agreement provides for an annual base salary of (i) $299,000 through June 30, 2015 and (ii) $325,000 commencing July 1, 2015, and an annual bonus based on Mr. McManus' achievement of annual goals and objectives as determined by the Compensation Committee of the Company's Board of Directors. Mr. McManus also received a one-time grant of options to purchase 100,000 shares of Common Stock at an exercise price of $11.88 per share (the “McManus Options”). The McManus Options vest in their entirety on June 30, 2017.
Mr. McManus is entitled under the McManus Agreement to participate in any plans and programs made available to the executive employees of the Company generally.
The Company can terminate the McManus Agreement for cause (as defined in the McManus Agreement). Mr. McManus can terminate the McManus Agreement for good reason (as defined in the McManus Agreement). If Mr. McManus terminates the McManus Agreement for good reason, the Company must (i) pay him an amount equal to two times his total compensation (annual base salary plus bonus) at the highest rate paid him at any time during the aggregate time he has been employed by the Company, payable in a lump sum within sixty days of termination of employment, and (ii) pay premiums for medical, dental, vision, hospitalization and long term care coverage under Company plans for a period of twenty-four (24) months.
Mr. McManus is entitled to severance pay and benefits if he terminates his employment with the Company following a Change in Control (as defined in the McManus Agreement), to provide him with an incentive to remain with the Company and consummate a strategic corporate sale or transaction that maximizes shareholder value. Severance pay and benefits are triggered upon (i) his Involuntary Termination without Cause (as defined in the McManus Agreement) for a reason other than death or Disability (as defined in the McManus Agreement) or (ii) as a result of a Constructive Termination (as defined in the McManus Agreement) which in either case occurs: (x) during the period not to exceed twenty-four (24) months after the effective date of a Change in Control, or (y) before the effective date of a Change in Control, but after the first date on which the Board of Directors and/or senior management of the Company has entered into formal negotiations with a potential acquirer that results in the consummation of a Change in Control.
In the event that pay and benefits are so triggered, Mr. McManus (A) is entitled to receive severance pay in an amount equal to two (2) times the sum of (a) his annual base pay and (b) bonus at the highest rate paid him for any fiscal year during the aggregate period of his employment by the Company, payable in cash in a lump sum; the payment of premiums for medical, dental, vision, hospitalization and long term care coverage under Company plans for a period of twenty-four (24) months; (B) has the right, for a period of (i) ninety (90) days for stock options granted under any of the Company's Employee Stock Option Plans adopted prior to 2005 and (ii) two (2) years for stock options granted under the Company's 2005 Employee Equity Incentive Plan, 2009 Employee Equity Incentive Plan, 2014 Employee Equity Incentive Plan and any Plan adopted after the effective date of the McManus Agreement, following his Termination Date (as defined in the McManus Agreement) to exercise the options to the extent such options are otherwise vested and exercisable as of the Termination Date under the terms of the applicable stock option McManus Agreement(s) and plan(s); and (C) will vest in all unvested stock option grants with respect to options granted after July 1, 2012.
Mr. McManus has also agreed in the McManus Agreement to an eighteen month post-termination covenant not-to-compete, as well as other customary covenants concerning non-solicitation and non-disclosure of confidential information of the Company.
The Company and Mr. McManus had previously entered into two letter agreements (the "Letter Agreements") providing for the exercise of vested options by Mr. McManus (i) for a ninety (90) day period after his retirement with respect to stock options granted under certain of the Company's stock option plans and (ii) for two (2) years after Mr. McManus terminates his employment with the Company in the event of a Change-in-Control (as defined in the applicable stock option plans) and he is eligible for the severance benefits provided for by the McManus Agreement. The Company and Mr. McManus have entered into a letter agreement which makes clear that the terms and conditions of the Letter Agreements continue to be in full force and effect and apply to the McManus Agreement.
| F-23 |
MISONIX, INC. and Subsidiaries
Notes to Consolidated Financial Statements
For the Years Ended June 30, 2015, 2014 and 2013
Purchase Commitments
As of June 30, 2015, 2014 and 2013, the Company had purchase and inventory commitments totaling $2,982,198, $2,300,949 and $1,510,566, respectively.
Contingencies
The Company and its subsidiaries are from time to time involved in ordinary and routine litigation. Management presently believes that the ultimate outcome of these proceedings, individually or in the aggregate, will not have a material adverse effect on the Company’s financial position, cash flows or result of operations. Nevertheless, litigation is subject to inherent uncertainties and an unfavorable ruling could occur. An unfavorable ruling could include money damages and, in such event, could result in a material adverse impact on the Company’s results of operations in the year in which the ruling occurs.
On July 19, 2011, Misonix entered into a Distribution Agreement (the “Distribution Agreement”) with Puricore, Inc. (“Puricore”). Pursuant to the Distribution Agreement, the Company had been granted the right to distribute PuriCore’s Vashe ® solution products in the United States, on a private label basis and known as the Misonix Soma product, as an antibacterial, antimicrobial irrigating solution for the treatment of human wound care in conjunction with therapeutic ultrasonic procedures (the “Field”). PuriCore had agreed, subject to modification, not to sell the products that were the subject of the Distribution Agreement (the “Licensed Products”) to any other therapeutic ultrasound company for distribution in the Field in the United States (“Exclusivity”). The Company had agreed not to sell or distribute in the United States in the Field any irrigating solution that has anti-microbial properties other than the Licensed Products so long as the Company had Exclusivity.
During the fiscal fourth quarter 2013, the Company sent a notice to terminate the Distribution Agreement due to management’s belief that the products subject to the Distribution Agreement were non-conforming. Puricore disputed the Company’s ability to terminate the Distribution Agreement. On October 11, 2013, the Company and Puricore mutually terminated the Distribution Agreement and signed a Settlement Agreement resolving all issues without the payment of any monies by either party. A reversal of the previously accrued and unpaid contractual minimum gross profit requirement in the amount of $439,508 was made through cost of goods sold in the quarter ended December 31, 2013 as a result of the Settlement Agreement. There are no further commitments to Puricore.
9. Related Party Transactions
Stavros G. Vizirgianakis was appointed to Misonix’s Board of Directors on May 7, 2013. During the fiscal year ended June 30, 2014, Mr. Vizirgianakis owned (i) a controlling interest in MD Solutions Australasia PTY Ltd. (“MD Solutions”) and (ii) an interest in Surgical Innovations (“SI”). MD Solutions is an independent distributor for the Company outside of the United States. Applied BioSurgical, a company formerly owned by Mr. Vizirgianakis’ father, was an independent distributor for the Company outside of the United States. SI purchased certain of the Company’s products from Applied BioSurgical during the fiscal year ended June 30, 2014. Mr. Vizirgianakis disposed of his interest in each of MD Solutions and SI during the fiscal year ended June 30, 2014.
Set forth below is a table showing the Company’s net sales and accounts receivable for the indicated time periods below with Applied BioSurgical and MD Solutions:
For the years ended June 30,
| Applied Bio Surgical | 2015 | 2014 | 2013 | |||||||||
| Sales | $ | 540,185 | $ | 378,287 | $ | 489,592 | ||||||
| Accounts receivable | 294,683 | 147,585 | 130,123 | |||||||||
MD Solutions Australasia PTY Ltd. | 2015 | 2014 | 2013 | |||||||||
| Sales | $ | - | $ | 120,118 | $ | 335,274 | ||||||
| Accounts receivable | - | 1,785 | 18,700 | |||||||||
| F-24 |
MISONIX, INC. and Subsidiaries
Notes to Consolidated Financial Statements
For the Years Ended June 30, 2015, 2014 and 2013
10. Income Taxes
Open tax years related to federal and state income tax filings are for the years ended June 30, 2012, 2013, 2014 and 2015. The Company’s net operating loss carryforwards from closed years can be adjusted by the tax authorities when they are utilized in an open year. The Company files state tax returns in California, New York and Texas. The Company's foreign subsidiaries, Misonix Ltd. and Misonix Urology Services Limited (formerly, UKHIFU Limited), filed tax returns in the United Kingdom. Open years related to the United Kingdom for filing are June 30, 2013, 2014 and 2015. As of June 30, 2015 and 2014, the Company has no material unrecognized tax benefits and no accrued interest and penalties.
Deferred income taxes reflect the net tax effects of temporary differences between the carrying amounts of assets and liabilities for financial reporting purposes and the amounts used for income tax purposes.
The tax effects of temporary differences that give rise to significant portions of the deferred tax assets and liabilities are presented below:
| June 30, | ||||||||||||
| 2015 | 2014 | 2013 | ||||||||||
| Deferred tax assets - current | ||||||||||||
| Bad debt reserves | 44,697 | 47,227 | 56,842 | |||||||||
| Inventory | 490,789 | 612,420 | 611,272 | |||||||||
| Accruals and allowances | 13,796 | 13,512 | 13,504 | |||||||||
| License fee and other income | 7,886 | 31,428 | 59,602 | |||||||||
| Net operating loss carryforwards | 1,561,548 | - | - | |||||||||
| Other | - | 24,031 | 22,512 | |||||||||
| 2,118,716 | 728,618 | 763,732 | ||||||||||
| Valuation allowance | - | (728,618 | ) | (763,732 | ) | |||||||
| Net deferred tax assets - current | 2,118,716 | - | - | |||||||||
| Deferred tax assets - non-current | ||||||||||||
| Net operating loss carryforwards | 628,730 | 4,636,476 | 5,235,264 | |||||||||
| Tax credits | 842,739 | 702,776 | 534,163 | |||||||||
| Stock based compensation | 161,580 | 225,925 | 225,793 | |||||||||
| Deferred gain - HIFU and Labcaire | 163,610 | 196,773 | 203,946 | |||||||||
| Depreciation | 167,597 | - | - | |||||||||
| Other | 12,709 | - | - | |||||||||
| 1,976,965 | 5,761,950 | 6,199,166 | ||||||||||
| Valuation allowance | (628,730 | ) | (5,403,529 | ) | (5,899,270 | ) | ||||||
| 1,348,235 | 358,421 | 299,896 | ||||||||||
| Deferred tax (liabilities) - non-current | ||||||||||||
| Amortization | (574,523 | ) | (358,421 | ) | (299,896 | ) | ||||||
| Net deferred tax assets - non-current | 773,712 | - | - | |||||||||
Prior to June 30, 2014 and through March 31, 2015, the Company had a full valuation allowance recorded against deferred tax assets. As of the year ended June 30, 2015, the Company reduced the valuation allowance by $5,503,417. The change in the valuation allowance includes a $1,499,297 write-off of deferred tax assets against its corresponding valuation allowance. The write-off primarily pertains to the loss in tax benefit for net operating losses subject to limitations under federal tax law that preclude its utilization. In addition, during the fourth quarter of fiscal 2015, based on our consideration of all available positive and negative evidence including achieving cumulative profitable operating performance over the past three years and our positive outlook for taxable income in the future, the Company reevaluated its deferred tax asset. Based upon the guidance under ASC 740, we concluded that it was more likely than not that the Company would realize the benefit of such deferred tax assets. The portion of the valuation allowance release attributable to income in future years resulted in the recognition of a tax benefit of $2,892,000 in continuing operations in the fourth quarter of fiscal 2015. The deferred tax asset will be realized against future income tax expense that would be payable in the absence of the net operating loss carryforward. The Company still maintains a full valuation allowance on foreign net operating losses.
| F-25 |
MISONIX, INC. and Subsidiaries
Notes to Consolidated Financial Statements
For the Years Ended June 30, 2015, 2014 and 2013
As of June 30, 2015, the Company had approximately $4,498,000 of U.S. federal net operating loss carryforwards which expire in tax years between 2031 and 2033. The Company has approximately $672,000 of research and development tax credits carryforwards which expire in the tax years between 2026 and 2035. In addition, the Company has approximately $170,000 of alternative minimum tax credit which has an indefinite carryforward period.
Significant components of the income tax expense (benefit) attributable to continuing operations are as follows:
| Year ended June 30, | ||||||||||||
| 2015 | 2014 | 2013 | ||||||||||
| Current: | ||||||||||||
| Federal | $ | 59,686 | $ | 24,613 | $ | (79,667 | ) | |||||
| State | 44,361 | 6,017 | 4,471 | |||||||||
| Total current | 104,047 | 30,630 | (75,196 | ) | ||||||||
| Deferred: | ||||||||||||
| Federal | (2,845,039 | ) | - | - | ||||||||
| State | (43,640 | ) | - | - | ||||||||
| Total deferred | (2,888,679 | ) | - | - | ||||||||
| $ | (2,784,632 | ) | $ | 30,630 | $ | (75,196 | ) | |||||
| F-26 |
MISONIX, INC. and Subsidiaries
Notes to Consolidated Financial Statements
For the Years Ended June 30, 2015, 2014 and 2013
The reconciliation of income tax expense (benefit) computed at the Federal statutory tax rates to income tax expense (benefit) is as follows:
| Year ended June 30, | ||||||||||||
| 2015 | 2014 | 2013 | ||||||||||
| Tax at federal statutory rates | $ | 856,604 | $ | 393,451 | $ | (993,461 | ) | |||||
| State income taxes, net of federal benefit | 29,278 | 3,971 | 2,951 | |||||||||
| Research credit | (70,401 | ) | (140,044 | ) | (58,777 | ) | ||||||
| Stock-based compensation | 303,398 | 236,941 | 166,080 | |||||||||
| Valuation allowance | (3,914,045 | ) | (486,106 | ) | 782,808 | |||||||
| Travel and entertainment | 21,508 | 21,587 | 24,860 | |||||||||
| Other | (10,974 | ) | 830 | 343 | ||||||||
| $ | (2,784,632 | ) | $ | 30,630 | $ | (75,196 | ) | |||||
11. Licensing Agreements for Medical Technology
In October 1996, the Company entered into a License Agreement (the "USS License") with United States Surgical (now, Medtronic plc) for a twenty-year period, expiring October 2016, covering the further development and commercial exploitation of the Company's medical technology relating to laparoscopic products, which uses high frequency sound waves to coagulate and divide tissue for both open and laparoscopic surgery.
The USS License gives Covidien exclusive worldwide marketing and sales rights for this technology. Under the USS License, the Company has received $475,000 in licensing fees (which are being recorded as income over the term of the USS License), plus royalties based upon net sales of AutoSonix products. Total royalties from sales of this device were approximately $4,162,000, $3,619,000 and $2,369,000 for the fiscal years ended June 30, 2015, 2014 and 2013, respectively.
12. Employee Profit Sharing Plan
The Company sponsors a retirement plan pursuant to Section 401(k) of the Internal Revenue Code of 1986, as amended (the “Code”) for all full time employees. Participants may contribute a percentage of compensation not to exceed the maximum allowed under the Code, which was $17,500 or $23,000 if the employee was over 50 years of age for the year ended June 30, 2015. The plan provides for a matching contribution by the Company of 10% of annual eligible compensation contributed by the participants based on years of service, which amounted to $46,636, $38,320 and $38,510 for the fiscal years ended June 30, 2015, 2014 and 2013, respectively.
| F-27 |
MISONIX, INC. and Subsidiaries
Notes to Consolidated Financial Statements
For the Years Ended June 30, 2015, 2014 and 2013
13. Quarterly Results (unaudited)
| FISCAL 2015 | ||||||||||||||||||||
| Q1 | Q2 | Q3 | Q4 | YEAR | ||||||||||||||||
| Net sales | $ | 4,539,337 | $ | 5,601,008 | $ | 5,314,797 | $ | 6,749,436 | $ | 22,204,578 | ||||||||||
| Cost of goods sold | 1,586,105 | 1,767,175 | 1,670,359 | 2,256,637 | 7,280,276 | |||||||||||||||
| Gross profit | 2,953,232 | 3,833,833 | 3,644,438 | 4,492,799 | 14,924,302 | |||||||||||||||
| Operating expenses: | ||||||||||||||||||||
| Selling expenses | 2,019,286 | 2,085,174 | 2,465,803 | 2,492,432 | 9,062,695 | |||||||||||||||
| General and administrative expenses | 1,246,078 | 1,534,784 | 1,583,399 | 1,619,362 | 5,983,623 | |||||||||||||||
| Research and development expenses | 437,591 | 324,301 | 407,773 | 423,258 | 1,592,923 | |||||||||||||||
| Total operating expenses | 3,702,955 | 3,944,259 | 4,456,975 | 4,535,052 | 16,639,241 | |||||||||||||||
| Loss from operations | (749,723 | ) | (110,426 | ) | (812,537 | ) | (42,253 | ) | (1,714,939 | ) | ||||||||||
| Other income/(expense): | ||||||||||||||||||||
| Interest income | 25 | 19 | 12 | 19 | 75 | |||||||||||||||
| Royalty income and license fees | 1,147,951 | 1,044,941 | 1,032,027 | 1,031,402 | 4,256,321 | |||||||||||||||
| Other | (5,679 | ) | (4,847 | ) | (6,452 | ) | (5,055 | ) | (22,033 | ) | ||||||||||
| Total other income | 1,142,297 | 1,040,113 | 1,025,587 | 1,026,366 | 4,234,363 | |||||||||||||||
| Income from continuing operations before income taxes | 392,574 | 929,687 | 213,050 | 984,113 | 2,519,424 | |||||||||||||||
| Income tax expense/(benefit) | 14,352 | 33,465 | 8,406 | (2,840,855 | ) | (2,784,632 | ) | |||||||||||||
| Net income from continuing operations | $ | 378,222 | $ | 896,222 | $ | 204,644 | $ | 3,824,968 | $ | 5,304,056 | ||||||||||
| Discontinued operations: | ||||||||||||||||||||
| Net income from discontinued operations net of income tax expense/(benefit) of $0,$0, $5,280 and ($4,153), respectively | 4,975 | 4,975 | 249,696 | 7,469 | 267,115 | |||||||||||||||
| Net income from discontinued operations | 4,975 | 4,975 | 249,696 | 7,469 | 267,115 | |||||||||||||||
| Net income | $ | 383,197 | $ | 901,197 | $ | 454,340 | $ | 3,832,437 | $ | 5,571,171 | ||||||||||
| Net income per share from continuing operations - Basic | $ | 0.05 | $ | 0.12 | $ | 0.03 | $ | 0.50 | $ | 0.70 | ||||||||||
| Net income per share from discontinued operations - Basic | 0.00 | 0.00 | 0.03 | 0.00 | 0.04 | |||||||||||||||
| Net income per share - Basic | $ | 0.05 | $ | 0.12 | $ | 0.06 | $ | 0.50 | $ | 0.74 | ||||||||||
| Net income per share from continuing operations - Diluted | $ | 0.05 | $ | 0.11 | $ | 0.02 | $ | 0.46 | $ | 0.66 | ||||||||||
| Net income per share from discontinued operations - Diluted | 0.00 | 0.00 | 0.03 | 0.00 | 0.03 | |||||||||||||||
| Net income per share - Diluted | $ | 0.05 | $ | 0.11 | $ | 0.05 | $ | 0.46 | $ | 0.69 | ||||||||||
| F-28 |
MISONIX, INC. and Subsidiaries
Notes to Consolidated Financial Statements
For the Years Ended June 30, 2015, 2014 and 2013
| FISCAL 2014 | ||||||||||||||||||||
| Q1 | Q2 | Q3 | Q4 | YEAR | ||||||||||||||||
| Net sales | $ | 3,075,584 | $ | 4,122,059 | $ | 4,284,645 | $ | 5,578,147 | $ | 17,060,435 | ||||||||||
| Cost of goods sold | 1,345,330 | 1,229,409 | A | 1,431,766 | 1,927,362 | 5,933,867 | ||||||||||||||
| Gross profit | 1,730,254 | 2,892,650 | 2,852,879 | 3,650,785 | 11,126,568 | |||||||||||||||
| Operating expenses: | ||||||||||||||||||||
| Selling expenses | 1,828,830 | 1,683,699 | 1,913,795 | 1,846,402 | 7,272,726 | |||||||||||||||
| General and administrative expenses | 1,221,315 | 1,120,926 | 1,176,047 | 1,172,767 | 4,691,055 | |||||||||||||||
| Research and development expenses | 472,888 | 435,019 | 406,466 | 397,378 | 1,711,751 | |||||||||||||||
| Total operating expenses | 3,523,033 | 3,239,644 | 3,496,308 | 3,416,547 | 13,675,532 | |||||||||||||||
| (Loss)/income from operations | (1,792,779 | ) | (346,994 | ) | (643,429 | ) | 234,238 | (2,548,964 | ) | |||||||||||
| Other income/(expense): | ||||||||||||||||||||
| Interest income | 19 | 19 | 18 | 13 | 69 | |||||||||||||||
| Royalty income and license fees | 912,794 | 809,392 | 830,702 | 1,172,548 | 3,725,436 | |||||||||||||||
| Other | (6,261 | ) | (5,304 | ) | (5,121 | ) | (2,645 | ) | (19,331 | ) | ||||||||||
| Total other income | 906,552 | 804,107 | 825,599 | 1,169,916 | 3,706,174 | |||||||||||||||
| (Loss)/income from continuing operations before income taxes | (886,227 | ) | 457,113 | 182,170 | 1,404,154 | 1,157,210 | ||||||||||||||
| Income tax expense | 2,750 | 2,750 | 8,376 | 16,754 | 30,630 | |||||||||||||||
| Net (loss)/income from continuing operations | $ | (888,977 | ) | $ | 454,363 | $ | 173,794 | $ | 1,387,400 | $ | 1,126,580 | |||||||||
| Discontinued operations: | ||||||||||||||||||||
| Net income from discontinued operations net of income tax expense of $0, $0, $0 and $3,182, respectively | 4,975 | 4,975 | 254,976 | 1,793 | 266,719 | |||||||||||||||
| Net income from discontinued operations | 4,975 | 4,975 | 254,976 | 1,793 | 266,719 | |||||||||||||||
| Net (loss)/income | $ | (884,002 | ) | $ | 459,338 | $ | 428,770 | $ | 1,389,193 | $ | 1,393,299 | |||||||||
| Net (loss)/income per share from continuing operations - Basic | $ | (0.12 | ) | $ | 0.06 | $ | 0.02 | $ | 0.19 | $ | 0.15 | |||||||||
| Net income per share from discontinued operations - Basic | 0.00 | 0.00 | 0.04 | 0.00 | 0.04 | |||||||||||||||
| Net (loss)/income per share - Basic | $ | (0.12 | ) | $ | 0.06 | $ | 0.06 | $ | 0.19 | $ | 0.19 | |||||||||
| Net (loss)/income per share from continuing operations - Diluted | $ | (0.12 | ) | $ | 0.06 | $ | 0.02 | $ | 0.18 | $ | 0.15 | |||||||||
| Net income per share from discontinued operations - Diluted | 0.00 | 0.00 | 0.03 | 0.00 | 0.04 | |||||||||||||||
| Net (loss)/income per share - Diluted | $ | (0.12 | ) | $ | 0.06 | $ | 0.05 | $ | 0.18 | $ | 0.19 | |||||||||
A. Includes the reversal of $439,508 of previously accrued and unpaid contractual minimum gross profit requirement pursuant to a signed Settlement Agreement.
| F-29 |
MISONIX, INC. and Subsidiaries
Notes to Consolidated Financial Statements
For the Years Ended June 30, 2015, 2014 and 2013
| FISCAL 2013 | ||||||||||||||||||||
| Q1 | Q2 | Q3 | Q4 | YEAR | ||||||||||||||||
| Net sales | $ | 4,570,525 | $ | 3,474,231 | $ | 3,023,487 | $ | 3,758,983 | $ | 14,827,226 | ||||||||||
| Cost of goods sold | 1,843,899 | 1,626,965 | 1,482,329 | 2,474,054 | B | 7,427,247 | ||||||||||||||
| Gross profit | 2,726,626 | 1,847,266 | 1,541,158 | 1,284,929 | 7,399,979 | |||||||||||||||
| Operating expenses: | ||||||||||||||||||||
| Selling expenses | 1,458,564 | 1,545,585 | 1,764,718 | 2,007,337 | 6,776,204 | |||||||||||||||
| General and administrative expenses | 1,042,332 | 1,092,726 | 1,155,613 | 1,155,818 | 4,446,489 | |||||||||||||||
| Research and development expenses | 397,131 | 366,257 | 379,901 | 352,769 | 1,496,058 | |||||||||||||||
| Total operating expenses | 2,898,027 | 3,004,568 | 3,300,232 | 3,515,924 | 12,718,751 | |||||||||||||||
| Loss from operations | (171,401 | ) | (1,157,302 | ) | (1,759,074 | ) | (2,230,995 | ) | (5,318,772 | ) | ||||||||||
| Other income/(expense): | ||||||||||||||||||||
| Interest income | 13 | 25 | 18 | 19 | 75 | |||||||||||||||
| Interest expense | - | - | - | (7 | ) | (7 | ) | |||||||||||||
| Royalty income and license fees | 222,679 | 522,385 | 1,025,153 | 741,438 | 2,511,655 | |||||||||||||||
| Royalty(expense)/recovery | (3,698 | ) | (1,415 | ) | (182 | ) | (8,066 | ) | (13,361 | ) | ||||||||||
| Other | (7,577 | ) | (18,608 | ) | (25,378 | ) | (49,970 | ) | (101,533 | ) | ||||||||||
| Total other income | 211,417 | 502,387 | 999,611 | 683,414 | 2,396,829 | |||||||||||||||
| Income/(loss) from continuing operations before income taxes | 40,016 | (654,915 | ) | (759,463 | ) | (1,547,581 | ) | (2,921,943 | ) | |||||||||||
| Income tax expense/(benefit) | 1,500 | 2,329 | (59,126 | ) | (19,899 | ) | (75,196 | ) | ||||||||||||
| Net income/(loss) from continuing operations | $ | 38,516 | $ | (657,244 | ) | $ | (700,337 | ) | $ | (1,527,682 | ) | $ | (2,846,747 | ) | ||||||
| Discontinued operations: | ||||||||||||||||||||
| Net income/(loss) from discontinued operations net of income tax expense/(benefit) of $0, $0, $82,968 and $(3,301), respectively | 6,318 | 3,475 | 172,007 | (6,018 | ) | 175,782 | ||||||||||||||
| Net income/(loss) from discontinued operations | 6,318 | 3,475 | 172,007 | (6,018 | ) | 175,782 | ||||||||||||||
| Net income/(loss) | $ | 44,834 | $ | (653,769 | ) | $ | (528,330 | ) | $ | (1,533,700 | ) | $ | (2,670,965 | ) | ||||||
| Net income/(loss) per share from continuing operations - Basic | $ | 0.01 | $ | (0.09 | ) | $ | (0.10 | ) | $ | (0.22 | ) | $ | (0.40 | ) | ||||||
| Net income per share from discontinued operations - Basic | - | - | 0.02 | - | 0.02 | |||||||||||||||
| Net income/(loss) per share - Basic | $ | 0.01 | $ | (0.09 | ) | $ | (0.08 | ) | $ | (0.22 | ) | $ | (0.38 | ) | ||||||
| Net income/(loss) per share from continuing operations - Diluted | $ | 0.01 | $ | (0.09 | ) | $ | (0.10 | ) | $ | (0.22 | ) | $ | (0.40 | ) | ||||||
| Net income per share from discontinued operations - Diluted | - | - | 0.02 | - | 0.02 | |||||||||||||||
| Net income/(loss) per share - Diluted | $ | 0.01 | $ | (0.09 | ) | $ | (0.08 | ) | $ | (0.22 | ) | $ | (0.38 | ) | ||||||
B. Includes additional inventory reserves of $835,000.
| F-30 |
MISONIX, INC. and Subsidiaries
Notes to Consolidated Financial Statements
For the Years Ended June 30, 2015, 2014 and 2013
| Column C | ||||||||||||||||
| Column B | Additions | Column E | ||||||||||||||
| Balance at | charged | Balance at | ||||||||||||||
| Column A | beginning | to cost and | Column D | end of | ||||||||||||
| Description | of period | expenses | (Deductions) | period | ||||||||||||
| Allowance for doubtful accounts: | ||||||||||||||||
| Year ended June 30: | ||||||||||||||||
| 2015 | $ | 136,868 | $ | (10,000 | ) | $ | - | $ | 126,868 | |||||||
| 2014 | $ | 214,641 | $ | (39,811 | ) | $ | (37,962 | )(A) | $ | 136,868 | ||||||
| 2013 | $ | 155,739 | $ | 60,000 | $ | (1,098 | )(A) | $ | 214,641 | |||||||
| (A) | Reduction in allowance for doubtful accounts due to write off of certain accounts receivable balances. |
| Column C | ||||||||||||||||
| Column B | Additions | Column E | ||||||||||||||
| Balance at | charged | Balance at | ||||||||||||||
| Column A | beginning | to cost and | Column D | end of | ||||||||||||
| Description | of period | expenses | (Deductions) | period | ||||||||||||
| Reserve for obsolescence | ||||||||||||||||
| Year ended June 30: | ||||||||||||||||
| 2015 | $ | 1,337,586 | $ | 87,041 | $ | (436,856 | )(B) | $ | 987,771 | |||||||
| 2014 | $ | 1,349,526 | $ | 107,289 | $ | (119,229 | )(B) | $ | 1,337,586 | |||||||
| 2013 | $ | 443,328 | $ | 916,198 | $ | - | $ | 1,349,526 | ||||||||
| (B) | Reduction in reserve for obsolescence due to the write off of obsolete items. |
| F-31 |
EXHIBIT INDEX
| Exhibit No. | Description | |
| 21 | Subsidiaries of the Company. | |
| 23 | Consent of Grant Thornton LLP. | |
| 31.1 | Rule 13a-14(a)/15d-14(a) Certification. | |
| 31.2 | Rule 13a-14(a)/15d-14(a) Certification. | |
| 32.1 | Section 1350 Certification. | |
| 32.2 | Section 1350 Certification. |
| 101.INS | XBRL Instance Document | |
| 101.SCH | XBRL Taxonomy Extension Scheme Document | |
| 101.CAL | XBRL Taxonomy Extension Calculation Linkbase Document | |
| 101.DEF | XBRL Taxonomy Extension Definition Linkbase Document | |
| 101.LAB | XBRL Taxonomy Extension Label Linkbase Document | |
| 101.PRE | XBRL Taxonomy Extension Presentation Linkbase Document |