Attached files
| file | filename |
|---|---|
| EX-99.1 - EXHIBIT 99.1 - EUROSITE POWER INC. | eurositepowerreports2ndquart.pdf |
| 8-K - 8-K - EUROSITE POWER INC. | eusp-20150818earningsrelea.htm |

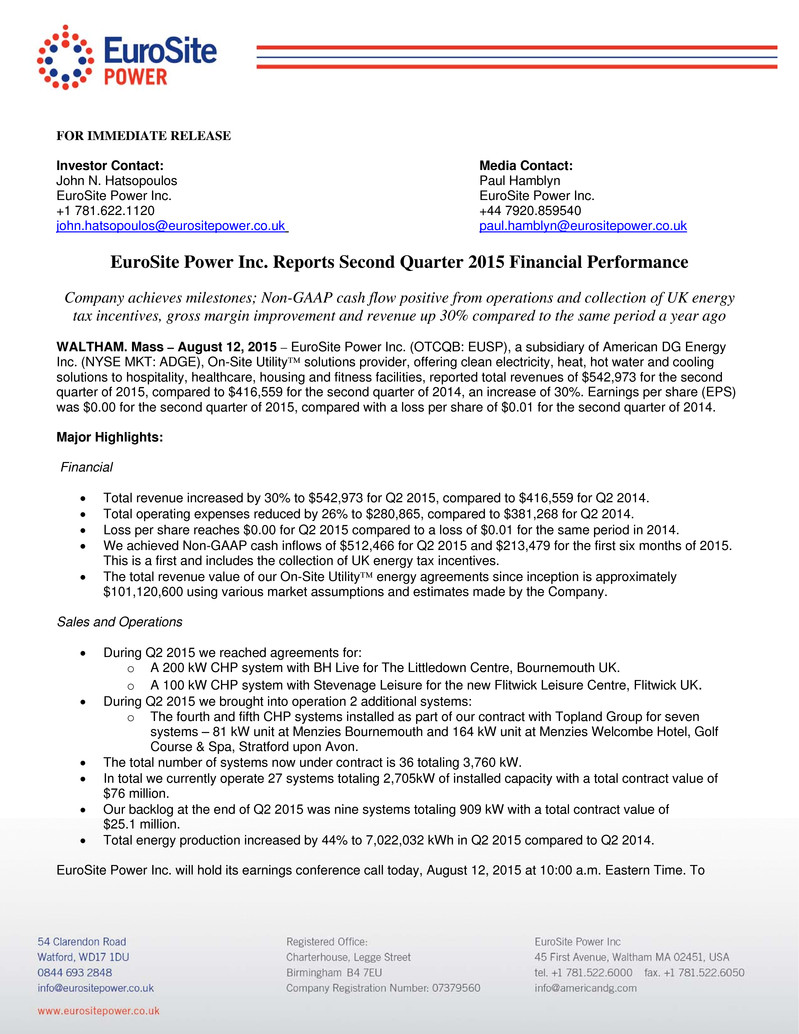
FOR IMMEDIATE RELEASE Investor Contact: Media Contact: John N. Hatsopoulos Paul Hamblyn EuroSite Power Inc. EuroSite Power Inc. +1 781.622.1120 +44 7920.859540 john.hatsopoulos@eurositepower.co.uk paul.hamblyn@eurositepower.co.uk EuroSite Power Inc. Reports Second Quarter 2015 Financial Performance Company achieves milestones; Non-GAAP cash flow positive from operations and collection of UK energy tax incentives, gross margin improvement and revenue up 30% compared to the same period a year ago WALTHAM. Mass – August 12, 2015 – EuroSite Power Inc. (OTCQB: EUSP), a subsidiary of American DG Energy Inc. (NYSE MKT: ADGE), On-Site Utility™ solutions provider, offering clean electricity, heat, hot water and cooling solutions to hospitality, healthcare, housing and fitness facilities, reported total revenues of $542,973 for the second quarter of 2015, compared to $416,559 for the second quarter of 2014, an increase of 30%. Earnings per share (EPS) was $0.00 for the second quarter of 2015, compared with a loss per share of $0.01 for the second quarter of 2014. Major Highlights: Financial Total revenue increased by 30% to $542,973 for Q2 2015, compared to $416,559 for Q2 2014. Total operating expenses reduced by 26% to $280,865, compared to $381,268 for Q2 2014. Loss per share reaches $0.00 for Q2 2015 compared to a loss of $0.01 for the same period in 2014. We achieved Non-GAAP cash inflows of $512,466 for Q2 2015 and $213,479 for the first six months of 2015. This is a first and includes the collection of UK energy tax incentives. The total revenue value of our On-Site Utility™ energy agreements since inception is approximately $101,120,600 using various market assumptions and estimates made by the Company. Sales and Operations During Q2 2015 we reached agreements for: o A 200 kW CHP system with BH Live for The Littledown Centre, Bournemouth UK. o A 100 kW CHP system with Stevenage Leisure for the new Flitwick Leisure Centre, Flitwick UK. During Q2 2015 we brought into operation 2 additional systems: o The fourth and fifth CHP systems installed as part of our contract with Topland Group for seven systems – 81 kW unit at Menzies Bournemouth and 164 kW unit at Menzies Welcombe Hotel, Golf Course & Spa, Stratford upon Avon. The total number of systems now under contract is 36 totaling 3,760 kW. In total we currently operate 27 systems totaling 2,705kW of installed capacity with a total contract value of $76 million. Our backlog at the end of Q2 2015 was nine systems totaling 909 kW with a total contract value of $25.1 million. Total energy production increased by 44% to 7,022,032 kWh in Q2 2015 compared to Q2 2014. EuroSite Power Inc. will hold its earnings conference call today, August 12, 2015 at 10:00 a.m. Eastern Time. To

listen, call (866) 364-3819 within the U.S., (855) 669-9657 from Canada, or (412) 902-4209 from other international locations. Participants should reference EuroSite Power to access the call. Please begin dialing at least 10 minutes before the scheduled starting time. The earnings conference call will be recorded and available for playback one hour after the end of the call through Thursday, August 20, 2015. To listen to the playback, call (877) 344-7529 within the U.S., (855) 669-9658 from Canada or (412) 317-0088 outside the U.S. and use Conference Number 10070270. The earnings conference call will also be webcast live. To register for and listen to the webcast, go to http://investors.americandg.com/webcast. Following the call, the webcast will be archived for 30 days. About EuroSite Power EuroSite Power Inc. is a subsidiary of American DG Energy Inc. (NYSE MKT: ADGE). American DG Energy owns 48% of EuroSite Power and consolidates their financial results and P&L. The Company is committed to providing institutional, commercial and small industrial facilities with clean, reliable power, cooling, heat and hot water at lower costs than charged by conventional energy suppliers – without any capital or start-up costs to the energy user – through On-Site Utility™ energy solutions. More information can be found at www.eurositepower.co.uk. # # # FORWARD-LOOKING STATEMENTS This press release contains forward-looking statements under the Private Securities Litigation Reform Act of 1995 that involve a number of risks and uncertainties that could affect our business including weather, electric price changes, gas prices, carbon credit markets and delays by government agencies to process tax and other incentives. Important other factors could cause actual results to differ materially from those indicated by such forward-looking statements, as disclosed on the Company's website and in Securities and Exchange Commission filings. This press release does not constitute an offer to buy or sell securities by the Company, its subsidiaries or any associated party and is meant purely for informational purposes. The statements in this press release are made as of the date of this press release, even if subsequently made available by the Company on its website or otherwise. The Company does not assume any obligation to update the forward-looking statements provided to reflect events that occur or circumstances that exist after the date on which they were made.

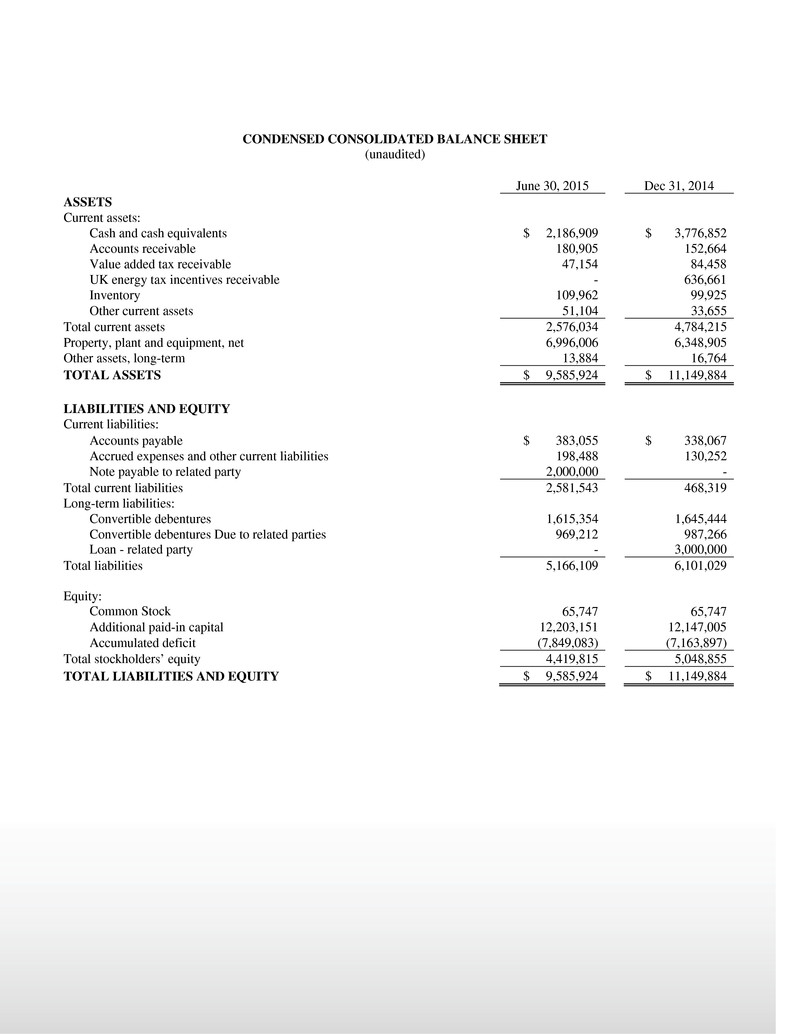
CONDENSED CONSOLIDATED BALANCE SHEET (unaudited) June 30, 2015 Dec 31, 2014 ASSETS Current assets: Cash and cash equivalents $ 2,186,909 $ 3,776,852 Accounts receivable 180,905 152,664 Value added tax receivable 47,154 84,458 UK energy tax incentives receivable - 636,661 Inventory 109,962 99,925 Other current assets 51,104 33,655 Total current assets 2,576,034 4,784,215 Property, plant and equipment, net 6,996,006 6,348,905 Other assets, long-term 13,884 16,764 TOTAL ASSETS $ 9,585,924 $ 11,149,884 LIABILITIES AND EQUITY Current liabilities: Accounts payable $ 383,055 $ 338,067 Accrued expenses and other current liabilities 198,488 130,252 Note payable to related party 2,000,000 - Total current liabilities 2,581,543 468,319 Long-term liabilities: Convertible debentures 1,615,354 1,645,444 Convertible debentures Due to related parties 969,212 987,266 Loan - related party - 3,000,000 Total liabilities 5,166,109 6,101,029 Equity: Common Stock 65,747 65,747 Additional paid-in capital 12,203,151 12,147,005 Accumulated deficit (7,849,083) (7,163,897) Total stockholders’ equity 4,419,815 5,048,855 TOTAL LIABILITIES AND EQUITY $ 9,585,924 $ 11,149,884

CONDENSED CONSOLIDATED STATEMENT OF OPERATIONS (unaudited) Three Months Ended June 30, 2015 June 30, 2014 Revenues Energy revenues $ 532,604 $ 409,867 Turnkey & other revenues 10,369 6,692 542,973 416,559 Cost of sales Fuel, maintenance and installation 412,207 323,886 Depreciation expense 96,744 72,766 508,951 396,652 Gross profit 34,022 19,907 Operating expenses General and administrative 130,405 235,236 Selling 107,023 116,050 Engineering 43,437 29,982 280,865 381,268 Loss from operations (246,843) (361,361) Other income (expense) Interest and other income 1,615 1,596 Interest expense (11,749) 6,294 (10,134) 7,890 Loss before income taxes (256,977) (353,471) Benefit from income taxes 2,188 - Net loss $ (254,789) $ (353,471) Net loss per share - basic and diluted $ (0.00) $ (0.01) Weighted-average shares outstanding - basic and diluted 65,747,100 56,747,100 Non-GAAP financial disclosure Loss from operations $ (246,843) $ (361,361) Depreciation expense 97,345 74,517 Stock based compensation 25,283 31,961 Adjusted EBITDA (124,215) (254,883) Grants, tax rebates and incentives 636,661 - Total cash inflows (outflows) $ 512,446 $ (254,883)

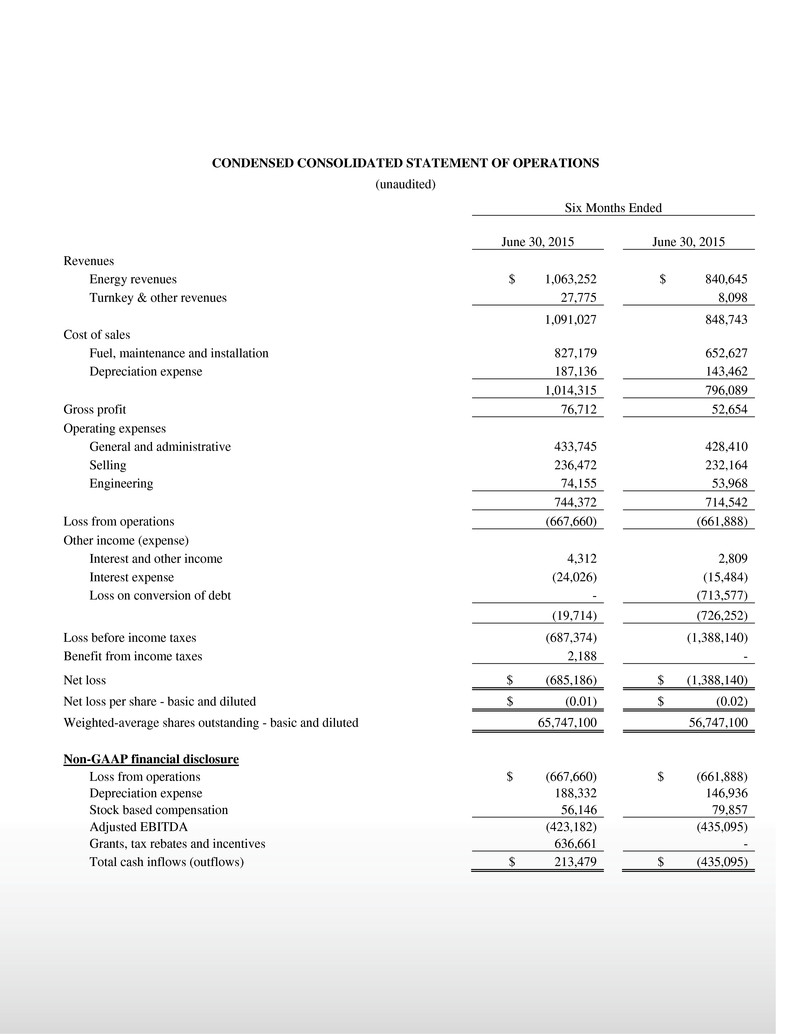
CONDENSED CONSOLIDATED STATEMENT OF OPERATIONS (unaudited) Six Months Ended June 30, 2015 June 30, 2015 Revenues Energy revenues $ 1,063,252 $ 840,645 Turnkey & other revenues 27,775 8,098 1,091,027 848,743 Cost of sales Fuel, maintenance and installation 827,179 652,627 Depreciation expense 187,136 143,462 1,014,315 796,089 Gross profit 76,712 52,654 Operating expenses General and administrative 433,745 428,410 Selling 236,472 232,164 Engineering 74,155 53,968 744,372 714,542 Loss from operations (667,660) (661,888) Other income (expense) Interest and other income 4,312 2,809 Interest expense (24,026) (15,484) Loss on conversion of debt - (713,577) (19,714) (726,252) Loss before income taxes (687,374) (1,388,140) Benefit from income taxes 2,188 - Net loss $ (685,186) $ (1,388,140) Net loss per share - basic and diluted $ (0.01) $ (0.02) Weighted-average shares outstanding - basic and diluted 65,747,100 56,747,100 Non-GAAP financial disclosure Loss from operations $ (667,660) $ (661,888) Depreciation expense 188,332 146,936 Stock based compensation 56,146 79,857 Adjusted EBITDA (423,182) (435,095) Grants, tax rebates and incentives 636,661 - Total cash inflows (outflows) $ 213,479 $ (435,095)

CONDENSED CONSOLIDATED STATEMENT OF CASH FLOWS (unaudited) Six Months Ended 2015 2014 CASH FLOWS FROM OPERATING ACTIVITIES: Net loss $ (685,186) $ (1,388,140) Adjustments to reconcile net loss to net cash provided by ( used in) operating activities: Depreciation and amortization 188,332 146,936 Loss on extinguishment of debt - 713,577 Amortization of convertible debt premium (48,144) (72,888) Amortization of deferred financing - 784 Accrued UK tax energy incentives 636,661 - Stock-based compensation 56,146 79,857 Changes in operating assets and liabilities (Increase) decrease in: Accounts receivable (28,241) 47,585 Value added tax receivable 37,304 (84,361) Inventory (10,037) 366,744 Prepaid and other current assets (17,449) (30,864) Other long term assets 2,880 (17,919) Increase (decrease) in: Accounts payable 44,988 117,221 Due to related party - 18,625 Accrued expenses and other current liabilities 68,236 116,472 Net cash provided by operating activities 245,490 13,629 CASH FLOWS FROM INVESTING ACTIVITIES: Purchases of property and equipment (835,433) (1,091,045) Net cash used in investing activities (835,433) (1,091,045) CASH FLOWS FROM FINANCING ACTIVITIES: Proceeds from related party (1,000,000) - Proceeds from convertible debentures - 1,450,000 Net cash (used in) provided by financing activities (1,000,000) 1,450,000 Net (decrease) increase in cash and cash equivalents (1,589,943) 372,584 Cash and cash equivalents, beginning of the period 3,776,852 1,519,602 Cash and cash equivalents, end of the period $ 2,186,909 $ 1,892,186
