Attached files
| file | filename |
|---|---|
| EX-10.1 - EXHIBIT10.1 - WESTERN CAPITAL RESOURCES, INC. | s101636_10-1.htm |
| EX-32.1 - EXHIBIT 32.1 - WESTERN CAPITAL RESOURCES, INC. | s101636_32-1.htm |
| EX-10.2 - EXHIBIT 10.2 - WESTERN CAPITAL RESOURCES, INC. | s101636_10-2.htm |
| EX-31.2 - EXHIBIT 31.2 - WESTERN CAPITAL RESOURCES, INC. | s101636_31-2.htm |
| EX-10.3 - EXHIBIT 10.3 - WESTERN CAPITAL RESOURCES, INC. | s101636_10-3.htm |
| EX-31.1 - EXHIBIT 31.1 - WESTERN CAPITAL RESOURCES, INC. | s101636_31-1.htm |
SECURITIES AND EXCHANGE COMMISSION
Washington, D.C. 20549
Form 10-Q
x Quarterly report pursuant to Section 13 or 15(d) of the Securities Exchange Act of 1934
For the quarterly period ended June 30, 2015
o Transition report pursuant to Section 13 or 15(d) of the Securities Exchange Act of 1934
Commission File Number: 000-52015
Western Capital Resources, Inc.
(Exact Name of Registrant as Specified in its Charter)
| Minnesota | 47-0848102 | |
| (State or Other Jurisdiction of Incorporation or Organization) | (I.R.S. Employer Identification Number) |
11550 “I” Street, Suite 150, Omaha, Nebraska 68137
(Address of Principal Executive Offices) (Zip Code)
Registrant’s telephone number, including area code: (402) 551-8888
N/A
(Former name, former address and former fiscal year, if changed since last report)
Check whether the issuer (1) filed all reports required to be filed by Section 13 or 15(d) of the Securities Exchange Act of 1934 during the past 12 months (or for such shorter period that the registrant was required to file such reports), and (2) has been subject to such filing requirements for the past 90 days. Yes þ No o
Indicate by check mark whether the registrant has submitted electronically and posted on its corporate website, if any, every Interactive Data File required to be submitted and posted pursuant to Rule 405 of Regulation S-T (§232.405 of this chapter) during the preceding 12 months (or for such shorter period that the registrant was required to submit and post such files). Yes þ No o
Indicate by check mark whether the registrant is a large accelerated filer, an accelerated filer, a non-accelerated filer, or a smaller reporting company. See definitions of “large accelerated filer,” “accelerated filer,” and “smaller reporting company” in Rule 12b-2 of the Exchange Act (check one):
| Large accelerated filer o | Accelerated filer o |
| Non-accelerated filer o | Smaller reporting company þ |
Indicate by check mark whether the registrant is a shell company (as defined in Rule 12b-2 of the Exchange Act).
Yes o No þ
APPLICABLE ONLY TO CORPORATE ISSUERS
As of August 14, 2015, the registrant had outstanding 9,497,588 shares of common stock, no par value per share.
Western Capital Resources, Inc.
Index
| 1 |
WESTERN CAPITAL RESOURCES, INC. AND SUBSIDIARIES
CONTENTS
| Page | |
| CONDENSED CONSOLIDATED FINANCIAL STATEMENTS | |
| Condensed Consolidated Balance Sheets | 3 |
| Condensed Consolidated Statements of Income | 4 |
| Condensed Consolidated Statements of Cash Flows | 5 |
| Notes to Condensed Consolidated Financial Statements | 6 |
| 2 |
WESTERN CAPITAL RESOURCES, INC. AND SUBSIDIARIES
CONDENSED CONSOLIDATED BALANCE SHEETS
June 30, 2015 (Unaudited) | December 31, 2014 | |||||||
| ASSETS | ||||||||
| CURRENT ASSETS | ||||||||
| Cash | $ | 3,184,828 | $ | 4,273,350 | ||||
| Loans receivable (less allowance for losses of $1,060,000 and $1,219,000, respectively) | 4,840,242 | 5,331,266 | ||||||
| Accounts receivable (less allowance for losses of $178,000 and $59,405, respectively) | 875,988 | 1,135,127 | ||||||
| Inventory | 2,910,008 | 2,340,824 | ||||||
| Prepaid expenses and other | 1,534,103 | 1,435,918 | ||||||
| Deferred income taxes | 643,000 | 644,000 | ||||||
| TOTAL CURRENT ASSETS | 13,988,169 | 15,160,485 | ||||||
| PROPERTY AND EQUIPMENT, net | 1,946,674 | 1,197,710 | ||||||
| GOODWILL | 13,757,368 | 12,956,868 | ||||||
| INTANGIBLE ASSETS, net | 8,146,443 | 7,248,793 | ||||||
| OTHER | 447,156 | 198,408 | ||||||
| TOTAL ASSETS | $ | 38,285,810 | $ | 36,762,264 | ||||
| LIABILITIES AND EQUITY | ||||||||
| CURRENT LIABILITIES | ||||||||
| Accounts payable and accrued liabilities | $ | 6,460,265 | $ | 6,025,920 | ||||
| Income taxes payable | 209,003 | 755,615 | ||||||
| Current portion notes payable | 4,500,000 | 3,500,000 | ||||||
| Current portion capital lease obligations | 32,225 | 42,240 | ||||||
| Deferred revenue and other | 619,843 | 638,068 | ||||||
| TOTAL CURRENT LIABILITIES | 11,821,336 | 10,961,843 | ||||||
| LONG-TERM LIABILITIES | ||||||||
| Notes payable, net of current portion | 875,000 | 1,625,000 | ||||||
| Capital lease obligations, net of current portion | 19,768 | 31,481 | ||||||
| Deferred income taxes | 4,059,000 | 3,939,000 | ||||||
| Other | 106,120 | 114,514 | ||||||
| TOTAL LONG-TERM LIABILITIES | 5,059,888 | 5,709,995 | ||||||
| TOTAL LIABILITIES | 16,881,224 | 16,671,838 | ||||||
| COMMITMENTS AND CONTINGENCIES (Note 15) | ||||||||
| EQUITY | ||||||||
| WESTERN SHAREHOLDERS’ EQUITY | ||||||||
| Common stock, no par value, 12,500,000 shares authorized, 5,997,588 issued and outstanding. | — | — | ||||||
| Additional paid-in capital | 22,750,062 | 22,703,745 | ||||||
| Accumulated deficit | (1,359,836 | ) | (2,621,692 | ) | ||||
| TOTAL WESTERN SHAREHOLDERS’ EQUITY | 21,390,226 | 20,082,053 | ||||||
| NONCONTROLLING INTERESTS | 14,360 | 8,373 | ||||||
| TOTAL EQUITY | 21,404,586 | 20,090,426 | ||||||
| TOTAL LIABILITIES AND EQUITY | $ | 38,285,810 | $ | 36,762,264 | ||||
See notes to condensed consolidated financial statements.
| 3 |
WESTERN CAPITAL RESOURCES, INC. AND SUBSIDIARIES
CONDENSED CONSOLIDATED STATEMENTS OF INCOME (Unaudited)
| Three months ended | Six months ended | |||||||||||||||
| June 30, 2015 | June 30, 2014 | June 30, 2015 | June 30, 2014 | |||||||||||||
| REVENUES | ||||||||||||||||
| Retail sales and associated fees | $ | 6,129,520 | $ | 4,092,586 | $ | 13,635,268 | $ | 9,970,378 | ||||||||
| Financing fees and interest | 2,556,202 | 2,597,584 | 5,141,596 | 5,309,394 | ||||||||||||
| Royalty and franchise fees, net | 2,454,752 | — | 5,079,809 | — | ||||||||||||
| Other revenue | 1,735,579 | 941,223 | 3,381,111 | 1,972,785 | ||||||||||||
| 12,876,053 | 7,631,393 | 27,237,784 | 17,252,557 | |||||||||||||
| COST OF REVENUES | ||||||||||||||||
| Cost of goods sold | 3,496,283 | 2,283,470 | 8,004,538 | 5,859,297 | ||||||||||||
| Provisions for loans receivable losses | 452,258 | 416,704 | 778,468 | 753,568 | ||||||||||||
| Other | 256,662 | — | 529,840 | — | ||||||||||||
| Total Cost of Revenues | 4,205,203 | 2,700,174 | 9,312,846 | 6,612,865 | ||||||||||||
| GROSS PROFIT | 8,670,850 | 4,931,219 | 17,924,938 | 10,639,692 | ||||||||||||
| OPERATING EXPENSES | ||||||||||||||||
| Salaries, wages and benefits | 4,281,389 | 2,438,108 | 8,497,503 | 4,995,879 | ||||||||||||
| Occupancy | 1,406,083 | 1,138,722 | 2,713,312 | 2,287,281 | ||||||||||||
| Advertising and development | 191,832 | 82,134 | 370,827 | 169,667 | ||||||||||||
| Depreciation | 106,610 | 84,932 | 210,692 | 171,494 | ||||||||||||
| Amortization | 113,510 | 29,831 | 217,350 | 54,589 | ||||||||||||
| Other | 1,612,593 | 972,894 | 3,473,710 | 1,919,177 | ||||||||||||
| 7,712,017 | 4,746,621 | 15,483,394 | 9,598,087 | |||||||||||||
| OPERATING INCOME | 958,833 | 184,598 | 2,441,544 | 1,041,605 | ||||||||||||
| OTHER INCOME (EXPENSES): | ||||||||||||||||
| Interest income | 716 | — | 2,070 | — | ||||||||||||
| Interest expense | (97,276 | ) | (51,156 | ) | (203,251 | ) | (131,330 | ) | ||||||||
| (96,560 | ) | (51,156 | ) | (201,181 | ) | (131,330 | ) | |||||||||
| INCOME BEFORE INCOME TAXES | 862,273 | 133,442 | 2,240,363 | 910,275 | ||||||||||||
| INCOME TAX EXPENSE | 432,870 | 51,000 | 972,520 | 339,000 | ||||||||||||
| NET INCOME | 429,403 | 82,442 | 1,267,843 | 571,275 | ||||||||||||
| Less net income attributable to noncontrolling interests | (3,610 | ) | — | (5,987 | ) | — | ||||||||||
| NET INCOME ATTRIBUTABLE TO WESTERN SHAREHOLDERS | $ | 425,793 | $ | 82,442 | $ | 1,261,856 | $ | 571,275 | ||||||||
| EARNINGS PER SHARE ATTRIBUTABLE TO WESTERN COMMON SHAREHOLDERS | ||||||||||||||||
| Basic and diluted | $ | 0.07 | $ | 0.03 | $ | 0.21 | $ | 0.19 | ||||||||
| WEIGHTED AVERAGE COMMON SHARES OUTSTANDING | ||||||||||||||||
| Basic and diluted | 5,997,588 | 3,010,996 | 5,997,588 | 3,011,002 | ||||||||||||
See notes to condensed consolidated financial statements.
| 4 |
WESTERN CAPITAL RESOURCES, INC. AND SUBSIDIARIES
CONDENSED CONSOLIDATED STATEMENTS OF CASH FLOWS (unaudited)
| Six Months Ended | ||||||||
| June 30, 2015 | June 30, 2014 | |||||||
| OPERATING ACTIVITIES | ||||||||
| Net Income | $ | 1,267,843 | $ | 571,275 | ||||
| Adjustments to reconcile net income to net cash provided by operating activities: | ||||||||
| Depreciation | 210,692 | 171,494 | ||||||
| Amortization | 217,350 | 54,589 | ||||||
| Deferred income taxes | 121,000 | 231,000 | ||||||
| Stock based compensation | 46,317 | — | ||||||
| Changes in operating assets and liabilities: | ||||||||
| Loans receivable | 491,024 | 583,873 | ||||||
| Accounts receivable | 259,139 | — | ||||||
| Inventory | (569,184 | ) | (142,513 | ) | ||||
| Prepaid expenses and other assets | 77,067 | 363,252 | ||||||
| Accounts payable and accrued liabilities | (900,339 | ) | (46,001 | ) | ||||
| Deferred revenue and other current liabilities | (18,225 | ) | — | |||||
| Accrued liabilities and other | (8,394 | ) | (22,852 | ) | ||||
| Net cash provided by operating activities | 1,194,290 | 1,764,117 | ||||||
| INVESTING ACTIVITIES | ||||||||
| Purchase of property and equipment | (291,656 | ) | (418,189 | ) | ||||
| Acquisition of stores | (2,608,500 | ) | — | |||||
| Cash acquired through acquisition | 389,072 | — | ||||||
| Net cash used by investing activities | (2,511,084 | ) | (418,189 | ) | ||||
| FINANCING ACTIVITIES | ||||||||
| Advances (payments) on notes payable – long-term, net | 250,000 | (750,000 | ) | |||||
| Common stock redemption | — | (388 | ) | |||||
| Payments on capital leases | (21,728 | ) | — | |||||
| Net cash provided (used) by financing activities | 228,272 | (750,388 | ) | |||||
| NET INCREASE (DECREASE) IN CASH | (1,088,522 | ) | 595,540 | |||||
| CASH | ||||||||
| Beginning of period | 4,273,350 | 1,983,835 | ||||||
| End of period | $ | 3,184,828 | $ | 2,579,375 | ||||
| SUPPLEMENTAL DISCLOSURE OF CASH FLOW INFORMATION | ||||||||
| Income taxes paid | $ | 1,408,494 | $ | 13,888 | ||||
| Interest paid | $ | 194,703 | $ | 141,735 | ||||
| Noncash investing and financing activities: | ||||||||
| Deposit applied to purchase of intangibles | $ | 50,000 | $ | — | ||||
See notes to condensed consolidated financial statements.
| 5 |
WESTERN CAPITAL RESOURCES, INC. AND SUBSIDIARIES
NOTES TO CONDENSED CONSOLIDATED FINANCIAL STATEMENTS
| 1. | Basis of Presentation, Nature of Business and Summary of Significant Accounting Policies – |
Basis of Presentation
The accompanying unaudited condensed consolidated financial statements have been prepared according to the instructions to Form 10-Q and Section 210.8-03(b) of Regulation S-X of the Securities and Exchange Commission (SEC) and, therefore, certain information and footnote disclosures normally included in financial statements prepared in accordance with accounting principles generally accepted in the United States of America (“GAAP”) have been omitted.
In the opinion of management, all adjustments (consisting of normal recurring accruals) considered necessary for a fair presentation have been included. Operating results for the three- and six-month periods ended June 30, 2015 are not necessarily indicative of the results that may be expected for the year ending December 31, 2015.
For further information, refer to the Consolidated Financial Statements and footnotes thereto included in our Form 10-K for the year ended December 31, 2014. The condensed consolidated balance sheet at December 31, 2014, has been derived from the audited consolidated financial statements at that date, but does not include all of the information and footnotes required by GAAP.
Nature of Business
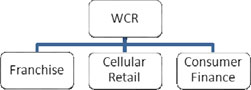
References in these financial statements notes to “Company” or “we” refer to Western Capital Resources, Inc. and its subsidiaries. References to specific companies within our enterprise, such as “PQH,” “WFL,” “EPI” or “AGI,” are references only to those companies. Western Capital Resources, Inc. (“WCR”) is a holding company owning operating subsidiaries, with the percentage of each operating subsidiary owned shown parenthetically, as summarized below.
| · | Franchise |
| ○ | AlphaGraphics, Inc. (AGI) (99.2% – acquired October 1, 2014) – franchisor of 250 domestic and 26 international AlphaGraphics Business Centers specializing in the planning, production and management of visual communications for businesses and individuals throughout the world. |
| · | Cellular Retail |
| ○ | PQH Wireless, Inc. (PQH) (100%) – owns and operates cellular retail stores (110 as of June 30, 2015) as an exclusive dealer of the Cricket brand in 15 states—Arizona, Colorado, Idaho, Illinois, Indiana, Iowa, Kansas, Missouri, Nebraska, Ohio, Oklahoma, Oregon, Texas, Washington and Wisconsin. |
| · | Consumer Finance |
| ○ | Wyoming Financial Lenders, Inc. (WFL) (100%) – owns and operates “payday” stores (50 as of June 30, 2015) in nine states (Colorado, Iowa, Kansas, Nebraska, North Dakota, South Dakota, Utah, Wisconsin and Wyoming) providing sub-prime short-term uncollateralized non-recourse “cash advance” or “payday” loans typically ranging from $100 to $500 with a maturity of generally two to four weeks, sub-prime short-term uncollateralized non-recourse installment loans typically ranging from $300 to $800 with a maturity of six months, check cashing and other money services to individuals. |
| ○ | Express Pawn, Inc. (EPI) (100%) – owns and operates retail pawn stores (three as of June 30, 2015) in Nebraska and Iowa providing collateralized non-recourse pawn loans and retail sales of merchandise obtained from forfeited pawn loans or purchased from customers. |
Basis of Consolidation
The consolidated financial statements include the accounts of WCR, its wholly owned subsidiaries and other entities in which the Company owns a controlling financial interest. For financial interests in which the Company owns a controlling financial interest, the Company applies the guidance of ASC 810 applicable to reporting the equity and net income or loss attributable to noncontrolling interests. All significant intercompany balances and transactions of the Company have been eliminated in consolidation.
Use of Estimates
The preparation of consolidated financial statements in conformity with accounting principles generally accepted in the United States of America requires management to make estimates and assumptions that may affect certain reported amounts and disclosures in the consolidated financial statements and accompanying notes. Management bases its estimates on historical experience and on various other assumptions that are believed to be reasonable under the circumstances. Actual results could differ from those estimates. Significant management estimates relate to the notes and loans receivable allowance, carrying value and impairment of long-lived goodwill and intangible assets, inventory valuation and obsolescence, estimated useful lives of property and equipment, and deferred taxes and tax uncertainties.
| 6 |
Net Income Per Common Share
Basic net income per common share is computed by dividing the income available to common shareholders by the weighted average number of common shares outstanding for the period. Diluted earnings per share gives effect to all dilutive potential common shares outstanding during the period, including stock options, using the treasury stock method. Options to purchase 65,000 shares granted under the 2015 Stock Incentive Plan effective February 6, 2015 (see Note 16) were outstanding at June 30, 2015. These options have a strike price in excess of the market price as of March 31, 2015, were antidilutive and therefore were not included in the computation of diluted earnings per share. Thus, there were no dilutive common shares as of June 30, 2015 and 2014.
Segment Reporting
The Company has grouped its operations into four segments – Franchise segment, Cellular Retail segment, Consumer Finance segment and Corporate. The Franchise segment specializes in the planning, production and management of visual communications for businesses and individuals. The Cellular Retail segment is an authorized Cricket premier dealer selling cellular phones and accessories, providing ancillary services and accepting service payments from customers. The Consumer Finance segment provides financial and ancillary services and also sells used merchandise at retail pawn stores. The Corporate segment consists of Company activities related to acquisitions and subsequent tone at the top management of acquired businesses.
Reclassifications
Certain Statement of Income reclassifications have been made in the presentation of our prior financial statements and accompanying notes to conform to the presentation as of and for the three and six months ended June 30, 2015.
Recent Accounting Pronouncements
No new accounting pronouncement issued or effective during the fiscal quarter has had or is expected to have a material impact on the condensed consolidated financial statements.
| 2. | Risks Inherent in the Operating Environment – |
Regulatory
The Company’s Consumer Finance segment activities are highly regulated under numerous local, state, and federal laws, regulations and rules, which are subject to change. New laws, regulations or rules could be enacted or issued, interpretations of existing laws, regulations or rules may change and enforcement action by regulatory agencies may intensify. Over the past several years, consumer advocacy groups and certain media reports have advocated governmental and regulatory action to prohibit or severely restrict sub-prime lending activities of the kind conducted by the WFL and EPI. The federal Consumer Financial Protection Bureau has indicated that it will use its authority to further regulate the payday industry.
Any adverse change in present local, state, and federal laws or regulations that govern or otherwise affect lending could result in the Consumer Finance segment’s curtailment or cessation of operations in certain or all jurisdictions or locations. Furthermore, any failure to comply with applicable local, state or federal laws or regulations could result in fines, litigation, closure of one or more store locations, or negative publicity. Any such change or failure would have a corresponding impact on the Company’s results of operations and financial condition, primarily through a decrease in revenues resulting from the cessation or curtailment of operations, decrease in operating income through increased legal expenditures or fines, and could also negatively affect the Company’s general business prospects if the Company is unable to effectively replace such revenues in a timely and efficient manner or if negative publicity effects its ability to obtain additional financing as needed.
In addition, the passage of federal or state laws and regulations or changes in interpretations of them could, at any point, essentially prohibit WFL or EPI from conducting its lending business in its current form. Any such legal or regulatory change would certainly have a material and adverse effect on the Company, its operating results and its financial condition and prospects.
| 7 |
| 3. | Loans Receivable – |
At June 30, 2015 and December 31, 2014, the Company’s outstanding loans receivable aging was as follows:
June 30, 2015
| Payday | Installment | Pawn & Title | Total | |||||||||||||
| Current | $ | 4,005,684 | $ | 284,897 | $ | 318,709 | $ | 4,609,290 | ||||||||
| 1-30 | 343,306 | 36,819 | — | 380,125 | ||||||||||||
| 31-60 | 206,718 | 19,001 | — | 225,719 | ||||||||||||
| 61-90 | 189,123 | 9,044 | — | 198,167 | ||||||||||||
| 91-120 | 141,303 | 5,266 | — | 146,569 | ||||||||||||
| 121-150 | 151,749 | 2,514 | — | 154,263 | ||||||||||||
| 151-180 | 185,381 | 728 | — | 186,109 | ||||||||||||
| 5,223,264 | 358,269 | 318,709 | 5,900,242 | |||||||||||||
| Less Allowance | (983,000 | ) | (77,000 | ) | — | (1,060,000 | ) | |||||||||
| $ | 4,240,264 | $ | 281,269 | $ | 318,709 | $ | 4,840,242 | |||||||||
December 31, 2014
| Payday | Installment | Pawn & Title | Total | |||||||||||||
| Current | $ | 4,387,393 | $ | 321,634 | $ | 372,805 | $ | 5,081,832 | ||||||||
| 1-30 | 305,382 | 47,321 | — | 352,703 | ||||||||||||
| 31-60 | 223,465 | 24,791 | — | 248,256 | ||||||||||||
| 61-90 | 236,072 | 11,799 | — | 247,871 | ||||||||||||
| 91-120 | 206,705 | 5,438 | — | 212,143 | ||||||||||||
| 121-150 | 200,101 | 1,984 | — | 202,085 | ||||||||||||
| 151-180 | 204,804 | 572 | — | 205,376 | ||||||||||||
| 5,763,922 | 413,539 | 372,805 | 6,550,266 | |||||||||||||
| Less Allowance | (1,147,000 | ) | (72,000 | ) | — | (1,219,000 | ) | |||||||||
| $ | 4,616,922 | $ | 341,539 | $ | 372,805 | $ | 5,331,266 |
| 4. | Loans Receivable Allowance – |
As a result of the Company’s collection efforts, it historically writes off approximately 42% of the returned payday items. Based on days past the check return date, write-offs of payday returned items historically have tracked at the following approximate percentages: 1 to 30 days – 42%; 31 to 60 days – 65%; 61 to 90 days – 82%; 91 to 120 days – 88%; and 121 to 180 days – 92%.
A rollforward of the Company’s loans receivable allowance is as follows:
Six Months Ended June 30, 2015 | Year Ended December 31, 2014 | |||||||
| Loans receivable allowance, beginning of period | $ | 1,219,000 | $ | 1,215,000 | ||||
| Provision for loan losses charged to expense | 778,468 | 1,817,822 | ||||||
| Charge-offs, net | (937,468 | ) | (1,813,822 | ) | ||||
| Loans receivable allowance, end of period | $ | 1,060,000 | $ | 1,219,000 | ||||
| 5. | Property and Equipment – |
A rollforward of the Company’s property and equipment is as follows:
| December 31, 2014 | Additions | Deletions | June 30, 2015 | |||||||||||||
| Furniture and equipment | $ | 2,853,603 | $ | 868,621 | $ | (706,740 | ) | $ | 3,015,484 | |||||||
| Leasehold improvements | 787,188 | 14,241 | — | 801,429 | ||||||||||||
| Software | 504,967 | 76,793 | (108,081 | ) | 473,679 | |||||||||||
| Other | 191,717 | — | — | 191,717 | ||||||||||||
| 4,337,475 | 959,655 | (814,821 | ) | 4,482,309 | ||||||||||||
| Accumulated depreciation | (3,139,765 | ) | (210,691 | ) | 814,821 | (2,535,635 | ) | |||||||||
| $ | 1,197,710 | $ | 748,964 | $ | — | $ | 1,946,674 | |||||||||
| 8 |
| 6. | Intangible Assets – |
A rollforward of the Company’s intangible assets consisted of the follows:
| December 31, 2014 | Additions | Deletions | June 30, 2015 | |||||||||||||
| Customer relationships | $ | 4,924,912 | $ | 1,115,000 | $ | — | $ | 6,039,912 | ||||||||
| Acquired franchise agreements | 5,227,112 | — | — | 5,227,112 | ||||||||||||
| Amortizable intangible assets | 10,152,024 | 1,115,000 | — | 11,267,024 | ||||||||||||
| Less accumulated amortization | (5,685,523 | ) | (217,350 | ) | — | (5,902,873 | ) | |||||||||
| Net amortizable intangible assets | 4,466,501 | 897,650 | — | 5,364,151 | ||||||||||||
| Non-amortizable trademarks | 2,782,292 | — | — | 2,782,292 | ||||||||||||
| Intangible assets, net | $ | 7,248,793 | $ | 897,650 | $ | — | $ | 8,146,443 | ||||||||
As of June 30, 2015, estimated future amortization expense for the amortizable intangible assets is as follows:
| 2015 (remainder) | $ | 270,569 | |||
| 2016 | 528,928 | ||||
| 2017 | 515,872 | ||||
| 2018 | 504,123 | ||||
| 2019 | 493,548 | ||||
| 2020 | 484,030 | ||||
| Thereafter | 2,567,081 | ||||
| $ | 5,364,151 |
| 7. | Other Non-Current Assets – |
Other Non-Current Assets include $153,900 for a note receivable. Our agreement with the borrower includes an approximate 50% forgiveness of principal if, among other terms and conditions, required payments under the agreement are received. The agreement provides for monthly payments of principal over a five-year term ending March 2020.
| 8. | Deferred Revenue and Other Liabilities – |
Deferred revenue and other liabilities consist of the following:
| June 30, 2015 | December 31, 2014 | |||||||
| Deferred financing fees | $ | 258,943 | $ | 284,231 | ||||
| Deferred franchise fees | 166,900 | 281,837 | ||||||
| Other | 194,000 | 72,000 | ||||||
| Total | $ | 619,843 | $ | 638,068 | ||||
| 9. | Notes Payable – Long Term – |
| June 30, 2015 | December 31, 2014 | |||||||
| Note payable (with a credit limit of $3,000,000) to River City Equity, Inc., a related party, with interest payable monthly at 12% due June 30, 2016 and upon certain events can be collateralized by substantially all assets of WCR, excluding any equity interest in AGI | $ | 3,000,000 | $ | 2,000,000 | ||||
| Subsidiary note payable to a financial institution with quarterly principal payments of $375,000 plus interest at prime rate plus 2.5% (5.75% as of June 30, 2015), secured by AGI’s assets, maturing June 2017 | 2,375,000 | 3,125,000 | ||||||
| Total | 5,375,000 | 5,125,000 | ||||||
| Less current maturities | (4,500,000 | ) | (3,500,000 | ) | ||||
| $ | 875,000 | $ | 1,625,000 | |||||
The Company’s term note payable with a financial institution includes certain financial covenants. Management has determined that the Company was in compliance with these financial covenants as of June 30, 2015.
| 9 |
As part of their lending agreement, AGI may draw on a $1,000,000 line of credit (LOC). The LOC bears interest at the greater of (a) the prime rate plus 2.50% or (b) the LIBOR rate plus 5.50%. The LOC matures on August 30, 2017. There was no activity on this LOC during the period ended June 30, 2015 and there was no balance outstanding as of June 30, 2015.
10. Other Operating Expense –
A breakout of other operating expense is as follows:
Three Months Ended June 30, | Six Months Ended June 30, | |||||||||||||||
| 2015 | 2014 | 2015 | 2014 | |||||||||||||
| Bank fees | $ | 135,222 | $ | 107,185 | $ | 284,745 | $ | 219,678 | ||||||||
| Collection costs | 108,984 | 98,461 | 220,303 | 221,982 | ||||||||||||
| Insurance | 93,200 | 50,211 | 175,995 | 97,664 | ||||||||||||
| Management and advisory fees | 124,801 | 126,163 | 274,303 | 237,985 | ||||||||||||
| Professional and consulting fees | 472,677 | 131,837 | 918,113 | 316,402 | ||||||||||||
| Supplies | 158,122 | 192,363 | 328,636 | 324,513 | ||||||||||||
| Other | 519,587 | 266,674 | 1,271,615 | 500,953 | ||||||||||||
| $ | 1,612,593 | $ | 972,894 | $ | 3,473,710 | $ | 1,919,177 | |||||||||
11. Income Tax Provision –
Income tax expense, as a percentage of Income Before Income Taxes, was 50% and 38% for the three months ended June 30, 2015 and 2014, respectively, and 43% and 37% for the six months ended June 30, 2015 and 2014, respectively. Nondeductible transaction costs of approximately $0.27 million contributed to the higher effective tax rates.
12. Acquisition –
Effective June 1, 2015, PQH consummated the acquisition of all outstanding membership interests in four separate limited liability companies. The entities acquired, when combined, do not meet the 20% significant subsidiaries thresholds under Rule 210.1-02 as modified by Rule 210.3-05(b) of SEC Reg. S-X. Under the equity method of accounting, the assets acquired and liabilities assumed were recorded at their estimated fair values as of the purchase date as follows:
| June 1, 2015 | ||||
| Cash | $ | 389,000 | ||
| Inventory | 427,000 | |||
| Other receivables | 405,000 | |||
| Property and equipment | 612,000 | |||
| Goodwill | 578,000 | |||
| Intangible assets | 903,000 | |||
| Other assets | 69,000 | |||
| Accounts payable and accrued liabilities | (826,000 | ) | ||
| $ | 2,557,000 | |||
The results of the operations for the acquired business have been included in the consolidated financial statements since the date of the acquisition. The following table presents the unaudited pro forma results of operations for the three and six months ended June 30, 2015 and 2014, as if this acquisition and the acquisition of AlphaGraphics (see Note 13 to the Company’s December 31, 2014 Notes to Consolidated Financial Statements) had been consummated at the beginning of 2014. The pro forma net income below excludes the expense of the transaction. The pro forma results of operations are prepared for comparative purposes only and do not necessarily reflect the results that would have occurred had the acquisition occurred at the beginning of the 2014 or the results which may occur in the future.
| 10 |
For the Three Months Ended June 30, 2015 (in thousands except earnings per share)
| ||||||||||||||||||||
| Franchise |
Cellular | Consumer Finance | Corporate | Total | ||||||||||||||||
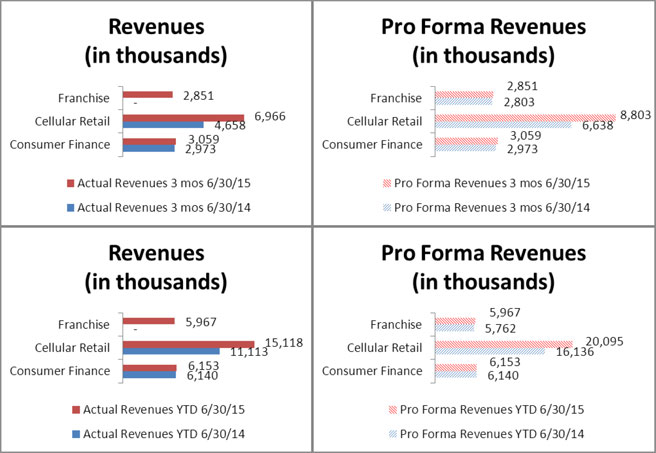
| Pro forma revenue | $ | 2,851 | $ | 8,803 | $ | 3,059 | $ | — | $ | 14,713 | ||||||||||
| Pro forma net income (loss) | $ | 457 | $ | 127 | $ | 257 | $ | (416 | ) | $ | 425 | |||||||||
| Pro forma net income attributable to noncontrolling interests | $ | 4 | $ | — | $ | — | $ | — | $ | 4 | ||||||||||
| Pro forma net income (loss) available to Western shareholders | $ | 453 | $ | 127 | $ | 257 | $ | (416 | ) | $ | 421 | |||||||||
| Pro forma earnings (loss) per share available to Western common shareholders – basic and diluted | $ | 0.076 | $ | 0.021 | $ | 0.043 | $ | (0.069 | ) | $ | 0.07 | |||||||||
For the Three Months Ended June 30, 2014 (in thousands except earnings per share)
| ||||||||||||||||||||
| Franchise |
Cellular | Consumer Finance | Corporate | Total | ||||||||||||||||
| Pro forma revenue | $ | 2,803 | $ | 6,638 | $ | 2,973 | $ | — | $ | 12,414 | ||||||||||
| Pro forma net income (loss) | $ | 304 | $ | (261 | ) | $ | 287 | $ | — | $ | 330 | |||||||||
| Pro forma net income attributable to noncontrolling interests | $ | 3 | $ | — | $ | — | $ | — | $ | 3 | ||||||||||
| Pro forma net income (loss) available to Western shareholders | $ | 301 | $ | (261 | ) | $ | 287 | $ | — | $ | 327 | |||||||||
| Pro forma earnings (loss) per share available to Western common shareholders – basic and diluted | $ | 0.050 | $ | (0.044 | ) | $ | 0.048 | $ | — | $ | 0.05 | |||||||||
For the Six Months Ended June 30, 2015 (in thousands except earnings per share)
| ||||||||||||||||||||
| Franchise |
Cellular | Consumer Finance | Corporate | Total | ||||||||||||||||
| Pro forma revenue | $ | 5,967 | $ | 20,095 | $ | 6,153 | $ | — | $ | 32,215 | ||||||||||
| Pro forma net income (loss) | $ | 755 | $ | 524 | $ | 543 | $ | (489 | ) | $ | 1,333 | |||||||||
| Pro forma net income attributable to noncontrolling interests | $ | 6 | $ | — | $ | — | $ | — | $ | 6 | ||||||||||
| Pro forma net income (loss) available to Western shareholders | $ | 749 | $ | 524 | $ | 543 | $ | (489 | ) | $ | 1,327 | |||||||||
| Pro forma earnings (loss) per share available to Western common shareholders – basic and diluted | $ | 0.125 | $ | 0.087 | $ | 0.091 | $ | (0.082 | ) | $ | 0.22 | |||||||||
For the Six Months Ended June 30, 2014 (in thousands except earnings per share)
| ||||||||||||||||||||
| Franchise |
Cellular | Consumer Finance | Corporate | Total | ||||||||||||||||
| Pro forma revenue | $ | 5,762 | $ | 16,136 | $ | 6,140 | $ | — | $ | 28,038 | ||||||||||
| Pro forma net income (loss) | $ | 606 | $ | 22 | $ | 639 | $ | — | $ | 1,267 | ||||||||||
| Pro forma net income attributable to noncontrolling interests | $ | 5 | $ | — | $ | — | $ | — | $ | 5 | ||||||||||
| Pro forma net income available to Western shareholders | $ | 601 | $ | 22 | $ | 639 | $ | — | $ | 1,262 | ||||||||||
| Pro forma earnings per share available to Western common shareholders – basic and diluted | $ | 0.100 | $ | 0.004 | $ | 0.107 | $ | — | $ | 0.21 | ||||||||||
| 11 |
13. Segment Information –
The Company has grouped its operations into four segments in 2015 and three segments in 2014 – Franchise (acquired October 1, 2014), Cellular Retail, Consumer Finance, and Corporate (beginning January 1, 2015). The Franchise segment offers franchise ownership opportunities for customized marketing solutions. The Cellular Retail segment is a dealer for Cricket Wireless selling cellular phones and accessories, ancillary services and serving as a payment center for customers. The Consumer Finance segment provides financial and ancillary services and also sells used merchandise at retail pawn stores. The Corporate segment consists of Company activities related to acquisitions and subsequent management of acquired businesses.
Segment information related to the three and six months ended June 30, 2015 and 2014, is presented below:
For the Three Months Ended June 30, 2015
| ||||||||||||||||||||
| Franchise |
Cellular | Consumer Finance | Corporate | Total | ||||||||||||||||
| Revenues from external customers | $ | 2,850,877 | $ | 6,965,859 | $ | 3,059,317 | $ | — | $ | 12,876,053 | ||||||||||
| Depreciation and amortization | $ | 103,771 | $ | 89,039 | $ | 27,310 | $ | — | $ | 220,120 | ||||||||||
| Interest expense | $ | 46,345 | $ | 50,931 | $ | — | $ | — | $ | 97,276 | ||||||||||
| Income tax expense (benefit) | $ | 280,120 | $ | 84,390 | $ | 156,250 | $ | (87,890 | ) | $ | 432,870 | |||||||||
| Net income (loss) | $ | 456,314 | $ | 140,456 | $ | 256,756 | $ | (424,123 | ) | $ | 429,403 | |||||||||
| Expenditures for segmented assets | $ | 50,609 | $ | 3,135,472 | $ | 15,813 | $ | 13,614 | $ | 3,215,508 | ||||||||||
For the Three Months Ended June 30, 2014
| ||||||||||||||||||||
| Franchise |
Cellular | Consumer Finance | Corporate | Total | ||||||||||||||||
| Revenues from external customers | $ | — | $ | 4,658,452 | $ | 2,972,941 | $ | — | $ | 7,631,393 | ||||||||||
| Depreciation and amortization | $ | — | $ | 86,116 | $ | 28,647 | $ | — | $ | 114,763 | ||||||||||
| Interest expense | $ | — | $ | 35,800 | $ | 15,356 | $ | — | $ | 51,156 | ||||||||||
| Income tax expense (benefit) | $ | — | $ | (124,000 | ) | $ | 175,000 | $ | — | $ | 51,000 | |||||||||
| Net income (loss) | $ | — | $ | (204,142 | ) | $ | 286,584 | $ | — | $ | 82,442 | |||||||||
| Expenditures for segmented assets | $ | — | $ | 253,659 | $ | 50,842 | $ | — | $ | 304,501 | ||||||||||
For the Six Months Ended June 30, 2015
| ||||||||||||||||||||
| Franchise |
Cellular | Consumer Finance | Corporate | Total | ||||||||||||||||
| Revenues from external customers | $ | 5,966,438 | $ | 15,118,018 | $ | 6,153,328 | $ | — | $ | 27,237,784 | ||||||||||
| Depreciation and amortization | $ | 215,733 | $ | 155,845 | $ | 56,464 | $ | — | $ | 428,042 | ||||||||||
|
Interest expense | $ | 99,717 | $ | 103,534 | $ | — | $ | — | $ | 203,251 | ||||||||||
| Income tax expense (benefit) | $ | 481,770 | $ | 281,390 | $ | 332,250 | $ | (122,890 | ) | $ | 972,520 | |||||||||
| Net income (loss) | $ | 755,395 | $ | 467,086 | $ | 542,541 | $ | (497,179 | ) | $ | 1,267,843 | |||||||||
| Total segment assets | $ | 9,555,181 | $ | 12,221,701 | $ | 16,191,888 | $ | 317,040 | $ | 38,285,810 | ||||||||||
| Expenditures for segmented assets | $ | 91,034 | $ | 3,655,691 | $ | 15,813 | $ | 13,614 | $ | 3,776,152 | ||||||||||
| 12 |
| For the Six Months Ended June 30, 2014 | ||||||||||||||||||||
| Franchise |
Cellular | Consumer Finance | Corporate | Total | ||||||||||||||||
| Revenues from external customers | $ | — | $ | 11,112,985 | $ | 6,139,572 | $ | — | $ | 17,252,557 | ||||||||||
| Depreciation and amortization | $ | — | $ | 171,173 | $ | 54,910 | $ | — | $ | 226,083 | ||||||||||
| Interest expense | $ | — | $ | 87,700 | $ | 43,630 | $ | — | $ | 131,330 | ||||||||||
| Income tax expense (benefit) | $ | — | $ | (45,000 | ) | $ | 384,000 | $ | — | $ | 339,000 | |||||||||
| Net income (loss) | $ | — | $ | (68,106 | ) | $ | 639,381 | $ | — | $ | 571,275 | |||||||||
| Total segment assets | $ | — | $ | 8,568,244 | $ | 15,767,875 | $ | — | $ | 24,336,119 | ||||||||||
| Expenditures for segmented assets | $ | — | $ | 367,347 | $ | 50,842 | $ | — | $ | 418,189 | ||||||||||
14. Leases –
The Company leases retail and office facilities under operating leases with terms ranging from month to month to six years, with rights to extend for additional periods. Future minimum base lease payments are approximately as follows:
| Year Ending December 31, | Operating Leases | |||||
| 2015 (remainder) | $ | 1,749,000 | ||||
| 2016 | 2,775,000 | |||||
| 2017 | 1,988,000 | |||||
| 2018 | 903,000 | |||||
| 2019 | 504,000 | |||||
| 2020 | 87,000 | |||||
| Thereafter | — | |||||
| Total minimum base lease payments | $ | 8,006,000 | ||||
15. Commitments and Contingencies –
On April 11, 2013, the Company entered into an Amended and Restated Employment Agreement with its Chief Executive Officer, Mr. John Quandahl. This agreement has a term of three years and contains, among other terms and conditions, provisions for an annual performance-based cash bonus pool for management. Pursuant to the management bonus plan, management bonuses of approximately $61,000 and ($58,000) were accrued for the three months ended June 30, 2015 and 2014, respectively, and $156,000 and $0 were accrued for the six months ended June 30, 2015 and 2014, respectively.
Effective February 9, 2015, the Company entered into a three-year employment agreement with its Chief Investment Officer (CIO). Pursuant to that agreement, the CIO is eligible for a discretionary annual performance-based bonus up to $200,000. To date no performance-based bonus has been accrued.
The Company has also entered into several employment agreements with certain members of subsidiary management. The terms of each agreement are different, but may ordinarily include stipulated base salary and bonus potential. Pursuant to the agreements, bonuses of approximately $59,000 and $146,000 were accrued for the three and six months ended June 30, 2015, respectively.
| 16. | Shareholders’ Equity – |
2015 Stock Incentive Plan
The Board of Directors adopted the Company’s new 2015 Stock Incentive Plan effective February 6, 2015. The plan replaces the Company’s earlier adopted 2008 Stock Incentive Plan, which the board terminated effective February 6, 2015. There were no incentives issued or outstanding under the terminated plan.
The Board of Directors, or a committee of the board, will administer the 2015 Stock Incentive Plan and have complete authority to award incentives, interpret the plan and make any other determination which it believes necessary and advisable for the proper administration of the plan. A total of 100,000 shares of common stock were reserved in connection with the adoption of the 2015 Stock Incentive Plan.
| 13 |
The new plan permits the granting of incentives in any one or a combination of the following forms:
| · | stock options, including options intended to qualify under Section 422 of the Internal Revenue Code of 1986, as amended, as “qualified” or “incentive” stock options; |
| · | stock appreciation rights (often referred to as “SARs”) payable in shares of common stock; |
| · | restricted stock and restricted stock units; |
| · | performance awards of cash, stock or property; and |
| · | stock awards. |
The following table summarizes nonvested stock option awards outstanding at June 30, 2015 and the changes for the three months then ended:
| Number of Shares | Weighted- Average Exercise Price Per Share | Weighted- Average Remaining Contractural Term (in years) | Aggregate Intrinsic Value | |||||||||||||
| Outstanding and nonvested at December 31, 2014 | — | $ | — | $ | — | |||||||||||
| Granted | 65,000 | 6.00 | 9.62 | — | ||||||||||||
| Vested | — | — | — | |||||||||||||
| Forfeited | — | — | — | |||||||||||||
| Outstanding and nonvested at June 30, 2015 | 65,000 | $ | 6.00 | 9.62 | $ | — | ||||||||||
| Exercisable at June 30, 2015 | — | |||||||||||||||
The option vests in three annual and near-equal installments on each of February 8, 2016, 2017 and 2018 and has a contract life of 10 years. There were no vested options at June 30, 2015 and thus no intrinsic value in outstanding vested options at June 30, 2015.
The Company accounts for its employee stock-based compensation plans using the fair value method. The fair value method requires the Company to estimate the grant-date fair value of its stock-based awards and amortize this fair value to compensation expense over the requisite service period or vesting term.
The Company uses the Black-Scholes option-pricing model to estimate the fair value of the Company’s stock option awards. The determination of the fair value of stock-based payment awards on the date of grant using an option-pricing model is affected by the Company’s stock price as well as assumptions regarding a number of complex and subjective variables. These variables include the expected stock price volatility over the term of the awards, actual and projected employee stock option exercise behaviors, the risk-free interest rate and expected dividends. Due to the inherent limitations of option-valuation models, future events that are unpredictable and the estimation process utilized in determining the valuation of the stock-based awards, the ultimate value realized by award holders may vary significantly from the amounts expensed in the Company’s financial statements. As of June 30, 2015, total unrecognized stock-based compensation expense related to nonvested stock options was approximately $149,000, which is expected to be recognized over a weighted average period of approximately 1.6 years.
Stock-based compensation expense is recognized net of estimated forfeitures such that expense is recognized only for those stock-based awards that are expected to vest. A forfeiture rate is estimated at the time of grant and revised, if necessary, in subsequent periods if actual forfeitures differ from initial estimate.
17. Subsequent Events –
Park Seed, Wayside Gardens, Jackson & Perkins, Van Dyke’s Restorers and J&P Real Estate Transaction
Effective July 1, 2015, the Company acquired the businesses of Restorers Acquisition, Inc., a Delaware corporation, J&P Park Acquisitions, Inc., a Delaware corporation, and J&P Real Estate, LLC, a Delaware limited liability company, by completing a merger and contribution transaction. Restorers Acquisition owns the Van Dyke’s Restorers brand business, an online retailer of home and furniture restoration products, J&P Park Acquisitions owns and operates the Park Seed online seed store, Wayside Gardens online and Jackson & Perkins online, and J&P Real Estate owns and operates certain related real estate properties.
In consideration for the acquisition of these businesses, the Company issued to the former owners of Restorers Acquisition, J&P Park Acquisitions and J&P Real Estate an aggregate of 3,500,000 shares of the Company’s common stock representing approximately 37% of the total issued and outstanding common stock after consummation of the acquisition.
| 14 |
Change in Board of Directors
On July 1, 2015, and in connection with the Park Seed, Wayside Gardens, Jackson & Perkins, Van Dyke’s Restorers and J&P Real Estate transaction, Gay A. Burke resigned from her position as a director of the Company. On that same day, the Board of Directors appointed Kevin Kuby to the board vacancy created by the resignation of Ms. Burke. Mr. Kuby is employed by Blackstreet Capital Management, a related-party, as its Managing Director in Restructuring.
Amended Management and Advisory Agreement
Effective July 1, 2015, the Company entered into an Amended and Restated Management and Advisory Agreement with Blackstreet Capital Management, LLC (“Blackstreet”) to provide certain financial, managerial, strategic and operating advice and assistance. The original Management and Advisory Agreement was effective April 1, 2010 and amended on October 1, 2014. Under the amended and restated agreement, annual fees are the greater of (i) $612,100 (subject to annual increases of five percent) or (ii) five percent of the Company’s “EBITDA,” as defined under the agreement. All other terms and provisions remain unmodified.
We evaluated all other events or transactions that occurred after June 30, 2015 up through August 14, 2015, the date we issued these financial statements. During this period we did not have any other material subsequent events that impacted our financial statements.
| 15 |
Item 2. Management’s Discussion and Analysis of Financial Condition and Results of Operations
Forward-Looking Statements
Some of the statements made in this report are “forward-looking statements,” as that term is defined under Section 27A of the Securities Act and Section 21E of the Securities Exchange Act of 1934. These forward-looking statements are based upon our current expectations and projections about future events. Whenever used in this report, the words “believe,” “anticipate,” “intend,” “estimate,” “expect” and similar expressions, or the negative of such words and expressions, are intended to identify forward-looking statements, although not all forward-looking statements contain such words or expressions. The forward-looking statements in this report are primarily located in the material set forth under the heading “Management’s Discussion and Analysis of Financial Condition and Results of Operations” (Part I, Item 2), but may be found in other parts of this report as well. These forward-looking statements generally relate to our plans, objectives and expectations for future operations and are based upon management’s current estimates and projections of future results or trends. Although we believe that our plans and objectives reflected in or suggested by these forward-looking statements are reasonable, we may not achieve these plans or objectives. You should read this report completely and with the understanding that actual future results may be materially different from what we expect. We will not necessarily update forward-looking statements even though our situation may change in the future.
Specific factors that might cause actual results to differ from our expectations or may affect the value of the common stock include, but are not limited to:
| · | changes in local, state or federal laws and regulations governing lending practices, or changes in the interpretation of such laws and regulations; |
| · | litigation and regulatory actions directed toward us or the industries in which we operate, particularly in certain key states and/or nationally; |
| · | our need for additional financing; |
| · | unpredictability or uncertainty in financing markets which could impair our ability to grow our business through acquisitions; |
| · | changes in Cricket dealer compensation; |
| · | the impact on us, as a Cricket dealer, of the AT&T acquisition of the Cricket Wireless business; and |
| · | our ability to successfully integrate our recently acquired businesses. |
Other factors that could cause actual results to differ from those implied by the forward-looking statements in this report are more fully described in the “Risk Factors” section of our Annual Report on Form 10-K for the fiscal year ended December 31, 2014.
Industry data and other statistical information used in this report are based on independent publications, government publications, reports by market research firms or other published independent sources. Some data are also based on our good faith estimates, derived from our review of internal surveys and the independent sources listed above. Although we believe these sources are reliable, we have not independently verified the information.
OVERVIEW
Western Capital Resources, Inc. (“WCR” or “Western Capital”) is a holding company that operates, through its subsidiaries, in the following industries and operating segments:
| 16 |
Our “Franchise” segment involves the franchising of AlphaGraphics® customized print and marketing solutions offered through our majority owned subsidiary AlphaGraphics, Inc. (99.2% owned) (“AlphaGraphics” or “AGI”). Our “Cellular Retail” segment involves the retail sale of cellular phones and accessories to consumers through our wholly owned subsidiary PQH Wireless, Inc. (“PQH”). Our “Consumer Finance” segment consists of retail financial services conducted through our wholly owned subsidiaries Wyoming Financial Lenders, Inc. (“WFL”) and Express Pawn, Inc. (“EP”). On January 1, 2015, our “Corporate” segment was formed which includes the corporate acquisition and due diligence team and tone at the top management of acquired subsidiaries. Throughout this report, we collectively refer to WCR and its consolidated subsidiaries as “we,” the “Company,” and “us.” References to specific companies within our enterprise, such as “AGI,” “PQH,” or “WFL” are references only to those companies.
Key actual and pro forma financial data for the three and six months ended June 30, 2015 and 2014 were as follows:
Discussion of Critical Accounting Policies
Our condensed consolidated financial statements and accompanying notes have been prepared in accordance with accounting principles generally accepted in the United States of America applied on a consistent basis. The preparation of these financial statements requires us to make a number of estimates and assumptions that affect the reported amounts of assets and liabilities, the disclosure of contingent assets and liabilities at the date of the financial statements, and the reported amounts of revenues and expenses during the reporting periods. We evaluate these estimates and assumptions on an ongoing basis. We base these estimates on the information currently available to us and on various other assumptions that we believe are reasonable under the circumstances. Actual results could vary materially from these estimates under different assumptions or conditions.
Our significant accounting policies are discussed in Note 1, “Basis of Presentation, Nature of Business and Summary of Significant Accounting Policies,” of the notes to our condensed consolidated financial statements included in this report. We believe that the following critical accounting policies affect the more significant estimates and assumptions used in the preparation of our condensed consolidated financial statements.
Loan Loss Allowance
Included in loans receivable are unpaid principal, interest and fee balances of payday, installment, pawn and title loans that have not reached their maturity date, and “late” payday loans that have reached maturity within the last 180 days and have remaining outstanding balances. Late payday loans generally are unpaid loans where a customer’s personal check has been deposited and the check has been returned due to non-sufficient funds in the customer’s account, a closed account, or other reasons. All returned items are charged-off after 180 days, as collections after that date have not been significant. Loans are carried at cost plus accrued interest or fees less payments made and a loans receivable allowance.
| 17 |
We do not specifically reserve for any individual payday, installment or title loan. We aggregate loan types for purposes of estimating the loss allowance using a methodology that analyzes historical portfolio statistics and management’s judgment regarding recent trends noted in the portfolio. This methodology takes into account several factors, including (1) the amount of loan principal, interest and fee outstanding, (2) historical charge offs from loans that originated during the last 24 months, (3) current and expected collection patterns and (4) current economic trends. We utilize a software program to assist with the tracking of our historical portfolio statistics. A loan loss allowance is maintained for anticipated losses for payday and installment loans based primarily on our historical percentages by loan type of net charge offs, applied against the applicable balance of loan principal, interest and fees outstanding. We also periodically perform a look-back analysis on our loan loss allowance to verify the historical allowance established tracks with the actual subsequent loan write-offs and recoveries. We are aware that as conditions change, we may need to make additional allowances in future periods. Loan losses or charge-offs of pawn or title loans are not recorded because the value of the collateral exceeds the loan amount.
A rollforward of our loans receivable allowance is as follows:
Six Months Ended June 30, 2015 | Year Ended December 31, 2014 | |||||||
| Loans receivable allowance, beginning of period | $ | 1,219,000 | $ | 1,215,000 | ||||
| Provision for loan losses charged to expense | 778,468 | 1,817,822 | ||||||
| Charge-offs, net | (937,468 | ) | (1,813,822 | ) | ||||
| Loans receivable allowance, end of period | $ | 1,060,000 | $ | 1,219,000 | ||||
Valuation of Long-lived and Intangible Assets
We assess the impairment of long-lived and intangible assets whenever events or changes in circumstances indicate that the carrying value may not be recoverable. Goodwill is analyzed on an annual basis. Factors that could trigger an impairment review include significant underperformance relative to expected historical or projected future cash flows, significant changes in the manner of use of acquired assets or the strategy for the overall business, and significant negative industry trends. When management determines that the carrying value of long-lived and intangible assets may not be recoverable, impairment is measured based on the excess of the assets’ carrying value over the estimated fair value.
Results of Operations – Three Months Ended June 30, 2015 Compared to Three Months Ended June 30, 2014
Net income attributable to our common shareholders was $0.43 million, or $0.07 per share (basic and diluted), for the three months ended June 30, 2015, compared to $.08 million, or $0.03 per share (basic and diluted), for the three months ended June 30, 2014. The Franchise segment, acquired on October 1, 2014, contributed $0.45 million, the Cellular Retail segment contributed $0.14 million, an increase of $0.34 million from the 2014 period, and the Consumer Finance segment contributed $0.26 million, a decline of $0.03 million from the 2014 period. The Corporate segment had $0.42 million in net costs. We expect the mix of segmented impact on net income to change throughout the remainder of 2015 due, at least in part, to completed acquisitions and fluctuating acquisition costs within this segment as we continue to move forward with our expansion initiative.
The following table provides quarter-over-quarter revenues and net income (in thousands) attributable to WCR common shareholders by operating segment:
| Franchise | Cellular Retail | Consumer Finance | Corporate | Total | ||||||||||||||||
| Three Months Ended June 30, 2015 | ||||||||||||||||||||
| Revenues | $ | 2,851 | $ | 6,966 | $ | 3,059 | $ | — | $ | 12,876 | ||||||||||
| % of total revenue | 22.1 | % | 54.1 | % | 23.8 | % | — | 100.0 | % | |||||||||||
| Net income (loss) | $ | 456 | $ | 140 | $ | 257 | $ | (424 | ) | $ | 429 | |||||||||
| Net income (loss) attributable to WCR common shareholders | $ | 453 | $ | 140 | $ | 257 | $ | (424 | ) | $ | 426 | |||||||||
| Three Months Ended June 30, 2014 | ||||||||||||||||||||
| Revenues | $ | — | $ | 4,658 | $ | 2,973 | $ | — | $ | 7,631 | ||||||||||
| % of total revenue | — | 61.0 | % | 39.0 | % | — | 100.0 | % | ||||||||||||
| Net income (loss) | $ | — | $ | (204 | ) | $ | 286 | $ | — | $ | 82 | |||||||||
| Net income (loss) attributable to WCR common shareholders | $ | — | $ | (204 | ) | $ | 286 | $ | — | $ | 82 | |||||||||
| 18 |
Franchise
Three Months Ended | 2015 % of | 2014 % of | ||||||||||||||
| 2015 | 2014 | Revenues | Revenues | |||||||||||||
| Revenues | $ | 2,851 | $ | — | 100.0 | % | — | % | ||||||||
| Less: | ||||||||||||||||
| Cost of revenues | 257 | — | 9.0 | % | — | % | ||||||||||
| Expenses | 2,138 | — | 75.0 | % | — | % | ||||||||||
| Net income | $ | 456 | $ | — | 16.0 | % | — | % | ||||||||
Our U.S. franchisees reported center sales for the three months ended June 30 as follows:
| 2015 | 2014 | |||||||
| Total gross U.S. network-wide center sales | $ | 68,289,0000 | $ | 64,076,000 | ||||
The table below summarizes the number of AlphaGraphics Business Centers owned and operated by franchisees during the three-month periods ended June 30, 2015 and 2014:
| Beginning | New | Closed | Ending | |||||||||||||
| 2015 | ||||||||||||||||
| US Centers | 245 | 5 | — | 250 | ||||||||||||
| International Centers | 32 | — | (6 | ) | 26 | |||||||||||
| Total | 277 | 5 | (6 | ) | 276 | |||||||||||
| 2014 | ||||||||||||||||
| US Centers | 244 | 3 | (2 | ) | 245 | |||||||||||
| International Centers | 33 | — | — | 33 | ||||||||||||
| Total | 277 | 3 | (2 | ) | 278 | |||||||||||
Revenues and net income for the three months ended June 30, 2015 and 2014 were $2.85 million and $0.46 million, respectively, comparable to pro forma revenues and net income for the comparable period in 2014 of $2.80 million and $0.30 million, respectively. Gross U.S. network-wide center sales as provided by franchisees increased 7% over the comparable periods.
Cellular Retail
The following table summarizes our Cellular Retail segment operating results:
Three Months Ended | 2015 % of | 2014 % of | ||||||||||||||
| 2015 | 2014 | Revenues | Revenues | |||||||||||||
| Revenues | $ | 6,966 | $ | 4,658 | 100.0 | % | 100.0 | % | ||||||||
| Less: | ||||||||||||||||
| Cost of revenues | 3,284 | 2,166 | 47.1 | % | 46.5 | % | ||||||||||
| Expenses | 3,542 | 2,696 | 50.9 | % | 57.9 | % | ||||||||||
| Net income (loss) | $ | 140 | $ | (204 | ) | 2.0 | % | (4.4 | )% | |||||||
A summary table of the number of Cricket cellular retail stores we operated during the three month periods ended June 30, 2015 and 2014 follows:
| 2015 | 2014 | |||||||
| Beginning | 68 | 53 | ||||||
| Acquired/ Launched | 42 | 6 | ||||||
| Closed | — | (1 | ) | |||||
| Ending | 110 | 58 | ||||||
| 19 |
On June 1, 2015 we acquired 41 Cricket retail stores, bringing the number of Cricket retail stores we operate up to 110. We will continue to evaluate store acquisition opportunities as they arise.
Revenues in the Cellular Retail segment increased $2.31 million, or 49.5%, to $6.97 million for the three months ended June 30, 2015, compared to $4.66 million for the three months ended June 30, 2014. This increase is due to a several factors that contributed to an approximate 100% increase in units sold period over period, including our acquisition of additional stores, relocation of under-performing locations, and the effects of AT&T’s acquisition of Cricket Wireless.
Our expenses increased $0.84 million from $2.70 for the three-month period ended June 30, 2014 to $3.54 million for the three-month period ended June 30, 2015, primarily as a result of adding the new store locations. Stated as a percentage of Cellular Retail revenues, our expenses were 50.9% and 57.9% of revenue for the three months ended June 30, 2015 and 2014, respectively.
Consumer Finance
The following table summarizes our Consumer Finance segment operating results:
Three Months Ended | 2015 % of | 2014 % of | ||||||||||||||
| 2015 | 2014 | Revenues | Revenues | |||||||||||||
| Revenues | $ | 3,059 | $ | 2,973 | 100.0 | % | 100.0 | % | ||||||||
| Less: | ||||||||||||||||
| Cost of revenues | 664 | 534 | 21.6 | % | 18.0 | % | ||||||||||
| Expenses | 2,138 | 2,153 | 70.0 | % | 72.4 | % | ||||||||||
| Net income | $ | 257 | $ | 286 | 8.4 | % | 9.6 | % | ||||||||
A summary table of the number of consumer finance locations we operated during the three month periods ended June 30, 2015 and 2014 follows:
| 2015 | 2014 | |||||||
| Beginning | 51 | 52 | ||||||
| Acquired/ Launched | — | — | ||||||
| Closed | — | (1 | ) | |||||
| Ending | 51 | 51 | ||||||
Our Consumer Finance segment revenues increased 2.9% for the three months ended June 30, 2015 compared to the three months ended June 30, 2014. The increase in our revenues for the three months ended June 30, 2015 was due to increased merchandise sales through our pawn stores. Our cost of revenues had a corresponding increase. Our operating expenses for the quarter decreased year over year primarily as a result of change in corporate allocations as duties and efforts are re-directed to other segments.
Corporate
Costs related to our new Corporate segment were $.42 million for the three months ended June 30, 2015, which includes nonrecurring acquisitions costs of $.27 million.
Results of Operations – Six Months Ended June 30, 2015 Compared to Six Months Ended June 30, 2014
Net income attributable to our common shareholders was $1.26 million, or $0.21 per share (basic and diluted), for the six months ended June 30, 2015, compared to $0.57 million, or $0.19 per share (basic and diluted), for the six months ended June 30, 2014. The Franchise segment, acquired on October 1, 2014, contributed $0.75 million, the Cellular Retail segment contributed $0.47 million, an increase of $0.54 million from the 2014 period, and the Consumer Finance segment contributed $0.54 million, a decline of $0.10 million from the 2014 period. The Corporate segment had $0.50 million in net costs. As previously indicated, we expect the mix of segmented contributions to net income to change throughout 2015.
| 20 |
The following table provides six-month year-over-year revenues and net income (in thousands) attributable to WCR common shareholders by operating segment:
| Franchise | Cellular Retail | Consumer Finance | Corporate | Total | ||||||||||||||||
| Six Months Ended June 30, 2015 | ||||||||||||||||||||
| Revenues | $ | 5,967 | $ | 15,118 | $ | 6,153 | $ | — | $ | 27,238 | ||||||||||
| % of total revenue | 21.9 | % | 55.5 | % | 22.6 | % | — | 100.0 | % | |||||||||||
| Net income (loss) | $ | 755 | $ | 467 | $ | 543 | $ | (497 | ) | $ | 1,268 | |||||||||
| Net income (loss) attributable to WCR common shareholders | $ | 749 | $ | 467 | $ | 543 | $ | (497 | ) | $ | 1,262 | |||||||||
| Six Months Ended June 30, 2014 | ||||||||||||||||||||
| Revenues | $ | — | $ | 11,113 | $ | 6,140 | $ | — | $ | 17,253 | ||||||||||
| % of total revenue | — | 64.4 | % | 35.6 | % | — | 100.0 | % | ||||||||||||
| Net income | $ | — | $ | (68 | ) | $ | 639 | $ | — | $ | 571 | |||||||||
| Net income attributable to WCR common shareholders | $ | — | $ | (68 | ) | $ | 639 | $ | — | $ | 571 | |||||||||
Franchise
Six Months Ended | 2015 % of | 2014 % of | ||||||||||||||
| 2015 | 2014 | Revenues | Revenues | |||||||||||||
| Revenues | $ | 5,967 | $ | — | 100.0 | % | — | % | ||||||||
| Less: | ||||||||||||||||
| Cost of revenues | 530 | — | 8.9 | % | — | % | ||||||||||
| Expenses | 4,682 | — | 78.4 | % | — | % | ||||||||||
| Net income | $ | 755 | $ | — | 12.7 | % | — | % | ||||||||
Our U.S. franchisees reported center sales for the six-months ended June 30, 2015 and 2014, as follows:
| 2015 | 2014 | |||||||
| Total gross U.S. network-wide center sales | $ | 132,153,000 | $ | 126,161,000 | ||||
The table below summarizes the number of AlphaGraphics Business Centers owned and operated by franchisees during the six month periods ended June 30, 2015 and 2014:
| Beginning | New | Closed | Ending | |||||||||||||
| 2015 | ||||||||||||||||
| US Centers | 242 | 10 | (2 | ) | 250 | |||||||||||
| International Centers | 32 | — | (6 | ) | 26 | |||||||||||
| Total | 274 | 10 | (8 | ) | 276 | |||||||||||
| 2014 | ||||||||||||||||
| US Centers | 243 | 7 | (5 | ) | 245 | |||||||||||
| International Centers | 34 | 2 | (3 | ) | 33 | |||||||||||
| Total | 277 | 9 | (8 | ) | 278 | |||||||||||
Revenues and net income for the six-months ended June 30, 2015 and 2014 were $5.97 million and $0.76 million, respectively, comparable to pro forma revenues and net income for the comparable period in 2014 of $5.77 million and $0.61 million, respectively. Gross U.S. network-wide center sales as provided by franchisees increased 5% over the comparable periods.
| 21 |
Cellular Retail
The following table summarizes our Cellular Retail segment operating results:
Six Months Ended June 30, (in thousands) | 2015 % of Revenues | 2014 % of Revenues | ||||||||||||||
| 2015 | 2014 | |||||||||||||||
| Revenues | $ | 15,118 | $ | 11,113 | 100.0 | % | 100.0 | % | ||||||||
| Less: | ||||||||||||||||
| Cost of revenues | 7,598 | 5,596 | 50.2 | % | 50.3 | % | ||||||||||
| Expenses | 7,053 | 5,585 | 46.7 | % | 50.3 | % | ||||||||||
| Net income (loss) | $ | 467 | $ | (68 | ) | 3.1 | % | (0.6 | )% | |||||||
A summary table of the number of Cricket cellular retail stores we operated during the six-month periods ended June 30, 2015 and 2014 follows:
| 2015 | 2014 | |||||||
| Beginning | 61 | 57 | ||||||
| Acquired/ Launched | 49 | 6 | ||||||
| Closed | — | (5 | ) | |||||
| Ending | 110 | 58 | ||||||
Revenues in the Cellular Retail segment increased $4.01 million, or 36%, to $15.12 million for the six months ended June 30, 2015, compared to $11.11 million for the six months ended June 30, 2014. This increase is due to a several factors that contributed to an approximate 80% increase in units sold period over period. Factors include our acquisition of additional stores, relocation or closing of under-performing locations and the effects of AT&T’s acquisition of Cricket Wireless, which effects include Cricket Wireless’ post-acquisition offering of subsidized and/or lower priced handsets to existing Cricket customers migrating off the older CDMA network onto the current GSM network, and Cricket Wireless’ increased post-acquisition advertising and marketing. The migration of Cricket customers, which we believe to have had a significant contribution to our increased unit sales, is expected to be substantially completed by year’s end. Accordingly, we anticipate that there will be a decline in unit sales as a result but are not able to reasonably predict the extent of any such decrease.
Our expenses increased $1.46 million from $5.59 million for the six-month period ended June 30, 2014 to $7.05 million for the six-month period ended June 30, 2015, primarily as a result of adding the new stores with partial offset by the reduction in costs associated with the closure of a small number of underperforming stores. Stated as a percentage of Cellular Retail revenues, our expenses were 46.7% and 50.3% of revenue for the six months ended June 30, 2015 and 2014, respectively.
We operate in a highly competitive marketplace and our future growth and success is largely dependent on our relationship with Cricket and the dealer compensation package and operational requirements provided by Cricket Wireless. We expect to continue our strategic acquisitions of other dealers, the opening of additional Cricket stores in new and existing markets and the consolidation of store locations operating in the same markets to reduce our operating costs.
Consumer Finance
The following table summarizes our Consumer Finance segment operating results:
Six Months Ended June 30, (in thousands) | 2015 % of Revenues | 2014 % of Revenues | ||||||||||||||
| 2015 | 2014 | |||||||||||||||
| Revenues | $ | 6,153 | $ | 6,140 | 100.0 | % | 100.0 | % | ||||||||
| Less: | ||||||||||||||||
| Cost of revenues | 1,186 | 1,017 | 19.3 | % | 16.6 | % | ||||||||||
| Expenses | 4,424 | 4,484 | 71.9 | % | 73.0 | % | ||||||||||
| Net income | $ | 543 | $ | 639 | 8.8 | % | 10.4 | % | ||||||||
| 22 |
A summary table of the number of consumer finance locations we operated during the six month periods ended June 30, 2015 and 2014 follows:
| 2015 | 2014 | |||||||
| Beginning | 51 | 52 | ||||||
| Acquired/ Launched | — | — | ||||||
| Closed | — | (1 | ) | |||||
| Ending | 51 | 51 | ||||||
Our Consumer Finance segment revenues increased slightly for the six months ended June 30, 2015 compared to the six months ended June 30, 2014. The increase in our revenues for the six months ended June 30, 2015 was due to slight growth in pawn retail sales.
Our cost of revenues increased $0.17 million, primarily due to the increased pawn retail sales. Our operating expenses for the period remained relatively flat at 72% of segment revenue.
Corporate
Costs related to our new Corporate segment were $0.50 million for the six months ended June 30, 2015, which includes nonrecurring acquisition costs of $0.27 million. As acquisition activity increases/decreases, costs within this segment will show a corresponding change.
Liquidity and Capital Resources
Summary cash flow data is as follows:
| Six Months Ended June 30, | ||||||||
| 2015 | 2014 | |||||||
| Cash flows provided (used) by: | ||||||||
| Operating activities | $ | 1,194,290 | $ | 1,764,117 | ||||
| Investing activities | (2,511,084 | ) | (418,189 | ) | ||||
| Financing activities | 228,272 | (750,388 | ) | |||||
| Net increase (decrease) in cash | (1,088,522 | ) | 595,540 | |||||
| Cash, beginning of period | 4,273,350 | 1,983,835 | ||||||
| Cash, end of period | $ | 3,184,828 | $ | 2,579,375 | ||||
At June 30, 2015, we had cash of $3.18 million compared to cash of $2.58 million on June 30, 2014. Our cash flows utilized for investing activities increased for the six months ended June 30, 2015 because of our 2015 purchases of 48 additional Cricket retail store locations compared to the purchase of six Cricket retail locations over the same period in 2014. Our cash flows from financing activities was $0.23 million, which includes a net $1.00 million advance on our long-term note with an expiration date of June 30, 2016 and principal payment by our subsidiary AGI (was not part of the consolidated group as of June 30, 2014) of $0.77 million. We believe that our available cash, combined with expected cash flows from operations, will be sufficient to fund our liquidity and capital expenditure requirements through June 30, 2016. Our expected short-term uses of available cash include the funding of operating activities, including anticipated increases in payday loans, the financing of additional expansion activities and the reduction of debt.
Because of the constant threat of regulatory changes to the payday lending industry, we believe it will be difficult for us to obtain debt financing from traditional financial institutions. As a result, financing we may obtain from alternate sources is likely to involve higher interest rates.
Credit Facility
On October 18, 2011 (and later amended on December 7, 2012, March 21, 2014 and May 21, 2015), we entered in a borrowing arrangement with River City Equity, Inc. Under this arrangement, as amended, we may borrow up to $3.00 million at an interest rate of 12% per annum, with interest payable on a monthly basis. The note contains no prepayment penalties, and matures June 30, 2016. The note, under certain circumstances, permits River City Equity to obtain a security interest in substantially all of our assets. As of June 30, 2015, $3.00 million was due and owing under this borrowing agreement.
| 23 |
Credit Facilities - AlphaGraphics
AGI is a party to term and revolving notes payable with a financial institution. Under the term debt agreements, $2.38 million was outstanding at June 30, 2015. The notes accrue interest at prime rate plus 2.5% (5.75% as of June 30, 2015), require quarterly payments of $375,000 principal plus accrued interest, and mature in June 2017. Under the revolving debt agreement, as amended, AGI may borrow up to $1.00 million, accruing interest at the higher of (a) prime rate plus 2.5% or (b) the LIBOR rate plus 5.5%. AlphaGraphics has not drawn on the revolving debt arrangement during the six-month period ended June 30, 2015. The revolving note matures in August 2017. The notes payable are secured by all the assets of AGI.
Off-Balance Sheet Arrangements
We had no off-balance sheet arrangements as of June 30, 2015.
Item 4. Controls and Procedures
Evaluation of Disclosure Controls and Procedures
We maintain disclosure controls and procedures designed to provide reasonable assurance that information required to be disclosed in our reports filed pursuant to the Securities Exchange Act of 1934 is recorded, processed, summarized and reported within the time periods specified in the SEC’s rules and forms, and that such information is accumulated and communicated to our management, including our Chief Executive Officer and Chief Financial Officer, as appropriate, to allow timely decisions regarding required disclosure. A control system, no matter how well conceived and operated, can provide only reasonable, not absolute, assurance the objectives of the control system are met.
We utilize the Committee of Sponsoring Organization’s Internal Control – Integrated Framework, 2013 version, for the design, implementation and assessment of the effectiveness of our disclosure controls and procedures and internal control over financial reporting.
As of June 30, 2015, our Chief Executive Officer and Chief Financial Officer carried out an evaluation of the effectiveness of our disclosure controls and procedures as such term is defined in Rule 13a-15(e) under the Securities and Exchange Act of 1934. Based on that evaluation, our Chief Executive Officer and Chief Financial Officer concluded our disclosure controls and procedures are effective as of June 30, 2015.
Changes in Internal Control over Financial Reporting
We began documenting and evaluating the effectiveness of controls and procedures related to our recent acquisitions upon completion of the transactions. We will assess and incorporate the design and operating effectiveness of the disclosure controls and internal controls over financial reporting and changes in internal control over financial reporting in our Annual Report on Form 10-K for the fiscal year ending December 31, 2015.
There were no changes in our internal control over
financial reporting during the quarter ended June 30, 2015 that have materially affected, or are reasonably likely to materially
affect, our internal control over financial reporting.
| 24 |
| Exhibit | Description | |
| 10.1 | Amendment to Promissory Note dated effective May 21, 2015 (filed herewith). | |
| 10.2 | Purchase and Sale Agreement with by and among PQH Wireless, Inc., Cheryn K. and Vernon G. Robins, dated May 22, 2015 (filed herewith). | |
| 10.3 | Merger and Contribution Agreement with Restorers Acquisition, Inc., J&P Park Acquisitions, Inc., and J&P Real Estate, LLC, and certain other parties, dated June 9, 2015 (filed herewith). | |
| 31.1 | Certification pursuant to Section 302 of the Sarbanes-Oxley Act of 2002 (filed herewith). | |
| 31.2 | Certification pursuant to Section 302 of the Sarbanes-Oxley Act of 2002 (filed herewith). | |
| 32 |
Certification pursuant to 18 U.S.C. Section 1350 as adopted pursuant to Section 906 of the Sarbanes-Oxley Act of 2002 (filed herewith). | |
| 101.INS | XBRL Instance Document (filed herewith). | |
| 101.SCH | XBRL Schema Document (filed herewith). | |
| 101.CAL | XBRL Calculation Linkbase Document (filed herewith). | |
| 101.DEF | XBRL Definition Linkbase Document (filed herewith). | |
| 101.LAB | XBRL Label Linkbase Document (filed herewith). | |
| 101.PRE | XBRL Presentation Linkbase Document (filed herewith). |
| 25 |
Pursuant to the requirements of the Securities and Exchange Act, the registrant has duly caused this report to be signed on its behalf by the undersigned, thereunto duly authorized.
| Dated: August 14, 2015 | Western Capital Resources, Inc. | |
| (Registrant) | ||
| By: | /s/ John Quandahl | |
| John Quandahl | ||
| Chief Executive Officer and Chief Operating Officer | ||
| By: | /s/ Stephen Irlbeck | |
| Stephen Irlbeck | ||
| Chief Financial Officer | ||
| 26 |