Attached files
| file | filename |
|---|---|
| 8-K - 8-K - PACWEST BANCORP | a15-17661_18k.htm |
Exhibit 99.1
Filed by PacWest Bancorp
Pursuant to Rule 425 under the Securities Act of 1933
And Deemed Filed Pursuant to Rule 14a-12 of the Securities and Exchange Act of 1934
Subject Company: Square 1 Financial, Inc.
Commission File No.: 001-36372
|
|
Investor Presentation 2015 Second Quarter Results |
|
|
Forward-Looking Statements This communication contains certain “forward-looking statements” about PacWest Bancorp (the “Company”), Square 1 Financial, Inc. (“Square 1”), and the combined company after the close of the transaction within the meaning of the Private Securities Litigation Reform Act of 1995, including certain plans, strategies, goals, and projections and including statements about our expectations regarding our pending merger between the Company and Square 1, profitability, credit trends, and effective tax rates. All statements contained in this communication that are not clearly historical in nature are forward-looking, and the words “anticipate,” “assume,” “intend,” “believe,” “forecast,” “expect,” “estimate,” “plan,” “continue,” “will,” “should,” “look forward” and similar expressions are generally intended to identify forward-looking statements. All forward-looking statements (including statements regarding future financial and operating results and future transactions and their results) involve risks, uncertainties and contingencies, many of which are beyond our control, which may cause actual results, performance, or achievements to differ materially from anticipated results, performance or achievements. In addition to factors previously disclosed in reports filed by PacWest and Square 1 with the SEC, risks and uncertainties for each institution and the combined institution could differ materially from those contained or implied by such forward-looking statements for a variety of factors, including without limitation: the Company’s ability to complete future acquisitions, including the Square 1 merger, and to successfully integrate such acquired entities or achieve expected benefits, synergies and/or operating efficiencies within expected timeframes or at all; the Company’s ability to obtain regulatory approvals and meet other closing conditions to the Square 1 merger on the expected terms and schedule; delay in closing the Square 1 merger; business disruption following the proposed Square 1 merger; changes in the Company’s stock price before completion of the Square 1 merger, including as a result of the financial performance of the Company or Square 1 prior to closing; the reaction to the Square 1 merger of the companies’ customers, employees and counterparties; changes in economic or competitive market conditions could negatively impact investment or lending opportunities or product pricing and services; deteriorations in credit and other markets; higher than anticipated loan losses; credit quality deterioration or pronounced and sustained reduction in market values or other economic factors which adversely effect our borrowers’ ability to repay loans and leases; continued or worsening credit losses or charge-offs; higher than anticipated delinquencies and reserves; compression of spreads on newly originated loans; asset/liability repricing risks and liquidity risks reduces interest margins and the value of investments; higher than anticipated increases in operating expenses; increased costs to manage and sell foreclosed assets; reduced demand for our services due to strategic or regulatory reasons; changes in tax laws or regulations affecting our business; our inability to generate sufficient earnings; tax planning or disallowance of tax benefits by tax authorities; changes in tax filing jurisdictions or entity classifications; and other risk factors described in documents filed by PacWest with the U.S. Securities and Exchange Commission (“SEC”). All forward-looking statements included in this communication are based on information available at the time of the communication. Pro forma, projected and estimated numbers are used for illustrative purposes only and are not forecasts, and actual results may differ materially. We are under no obligation to (and expressly disclaim any such obligation to) update or alter our forward-looking statements, whether as a result of new information, future events or otherwise except as required by law. |
|
|
1 Company Overview 4 Second Quarter Highlights 8 Loans and Leases 13 Credit Quality 20 Deposits 28 Net Interest Margin 32 Controlled Expenses 37 Acquisitions 40 CapitalSource Inc. 42 Square 1 Financial, Inc. 43 Strong Franchise Value 54 Non-GAAP Measurements 57 Presentation Index |
|
|
Company Overview |
|
|
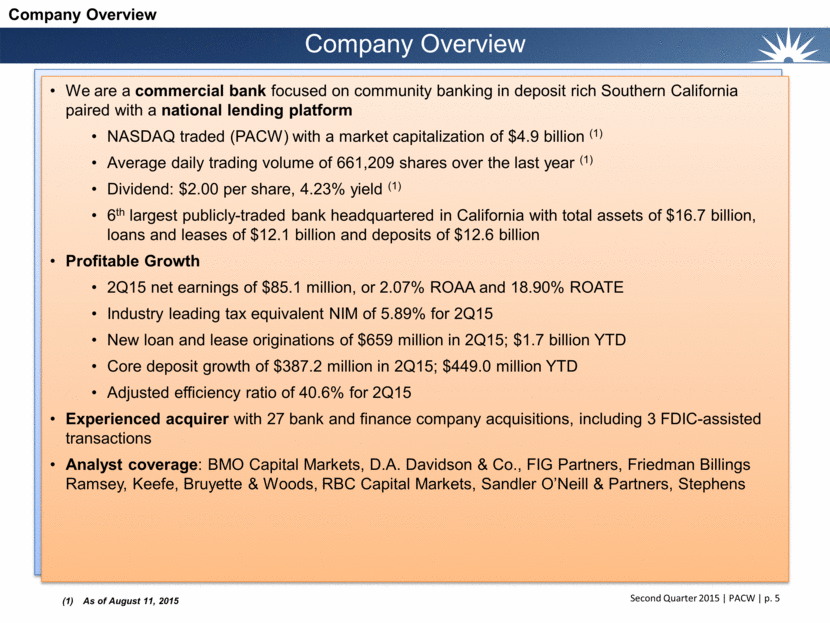
Company Overview As of August 11, 2015 We are a commercial bank focused on community banking in deposit rich Southern California paired with a national lending platform NASDAQ traded (PACW) with a market capitalization of $4.9 billion (1) Average daily trading volume of 661,209 shares over the last year (1) Dividend: $2.00 per share, 4.23% yield (1) 6th largest publicly-traded bank headquartered in California with total assets of $16.7 billion, loans and leases of $12.1 billion and deposits of $12.6 billion Profitable Growth 2Q15 net earnings of $85.1 million, or 2.07% ROAA and 18.90% ROATE Industry leading tax equivalent NIM of 5.89% for 2Q15 New loan and lease originations of $659 million in 2Q15; $1.7 billion YTD Core deposit growth of $387.2 million in 2Q15; $449.0 million YTD Adjusted efficiency ratio of 40.6% for 2Q15 Experienced acquirer with 27 bank and finance company acquisitions, including 3 FDIC-assisted transactions Analyst coverage: BMO Capital Markets, D.A. Davidson & Co., FIG Partners, Friedman Billings Ramsey, Keefe, Bruyette & Woods, RBC Capital Markets, Sandler O’Neill & Partners, Stephens Company Overview |
|
|
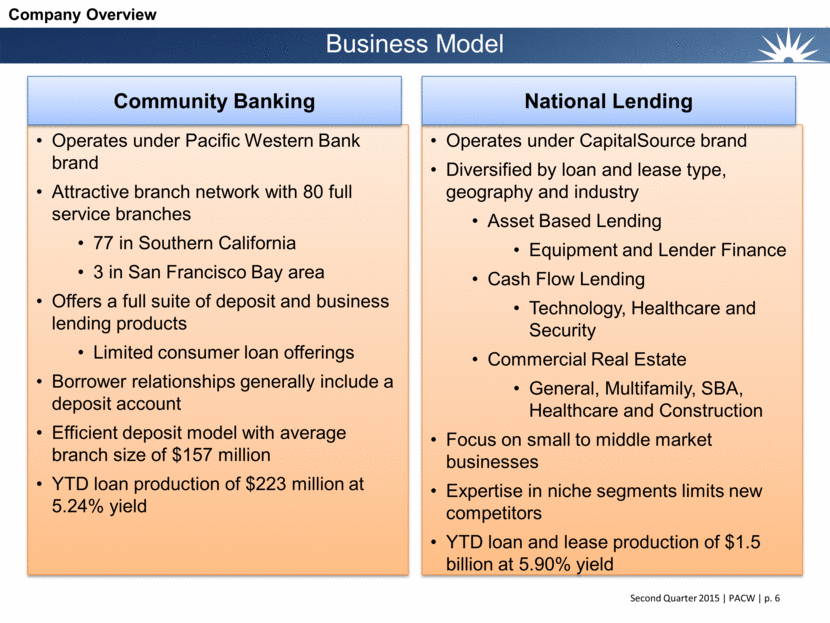
Operates under Pacific Western Bank brand Attractive branch network with 80 full service branches 77 in Southern California 3 in San Francisco Bay area Offers a full suite of deposit and business lending products Limited consumer loan offerings Borrower relationships generally include a deposit account Efficient deposit model with average branch size of $157 million YTD loan production of $223 million at 5.24% yield Operates under CapitalSource brand Diversified by loan and lease type, geography and industry Asset Based Lending Equipment and Lender Finance Cash Flow Lending Technology, Healthcare and Security Commercial Real Estate General, Multifamily, SBA, Healthcare and Construction Focus on small to middle market businesses Expertise in niche segments limits new competitors YTD loan and lease production of $1.5 billion at 5.90% yield Business Model Community Banking National Lending Company Overview |
|
|
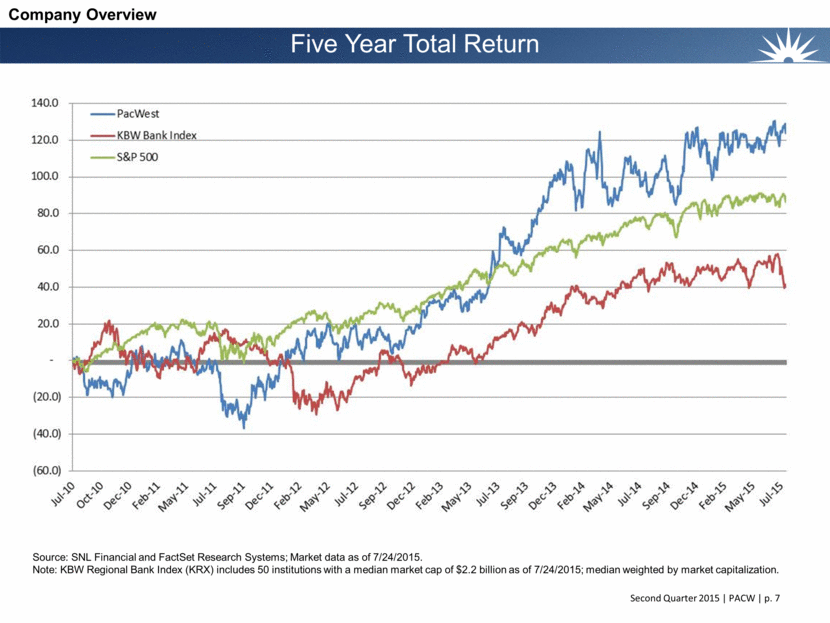
Five Year Total Return Company Overview Source: SNL Financial and FactSet Research Systems; Market data as of 7/24/2015. Note: KBW Regional Bank Index (KRX) includes 50 institutions with a median market cap of $2.2 billion as of 7/24/2015; median weighted by market capitalization. |
|
|
Second Quarter Highlights |
|
|
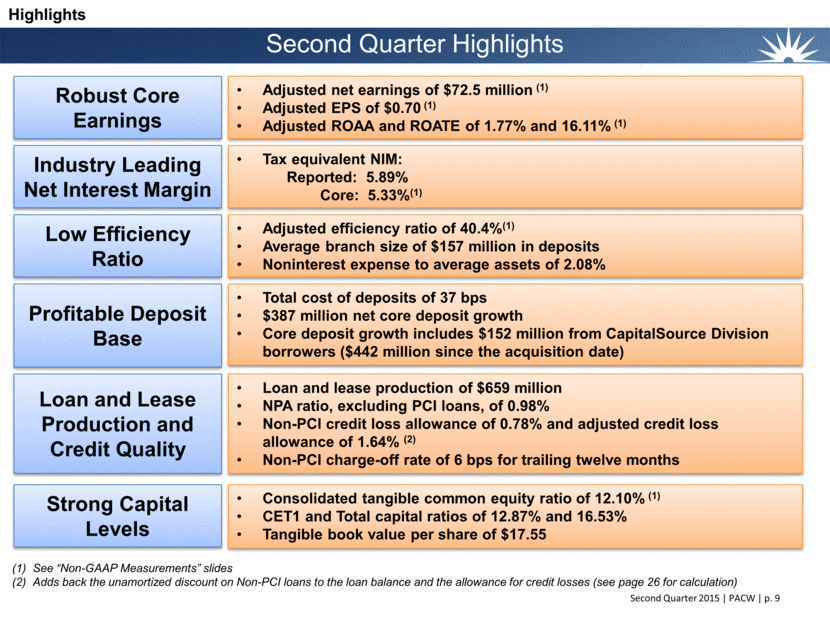
Adjusted efficiency ratio of 40.4%(1) Average branch size of $157 million in deposits Noninterest expense to average assets of 2.08% Strong Capital Levels Low Efficiency Ratio Loan and Lease Production and Credit Quality Industry Leading Net Interest Margin Tax equivalent NIM: Reported: 5.89% Core: 5.33%(1) Consolidated tangible common equity ratio of 12.10% (1) CET1 and Total capital ratios of 12.87% and 16.53% Tangible book value per share of $17.55 Loan and lease production of $659 million NPA ratio, excluding PCI loans, of 0.98% Non-PCI credit loss allowance of 0.78% and adjusted credit loss allowance of 1.64% (2) Non-PCI charge-off rate of 6 bps for trailing twelve months Second Quarter Highlights Robust Core Earnings Adjusted net earnings of $72.5 million (1) Adjusted EPS of $0.70 (1) Adjusted ROAA and ROATE of 1.77% and 16.11% (1) See “Non-GAAP Measurements” slides (2) Adds back the unamortized discount on Non-PCI loans to the loan balance and the allowance for credit losses (see page 26 for calculation) Highlights Total cost of deposits of 37 bps $387 million net core deposit growth Core deposit growth includes $152 million from CapitalSource Division borrowers ($442 million since the acquisition date) Profitable Deposit Base |
|
|
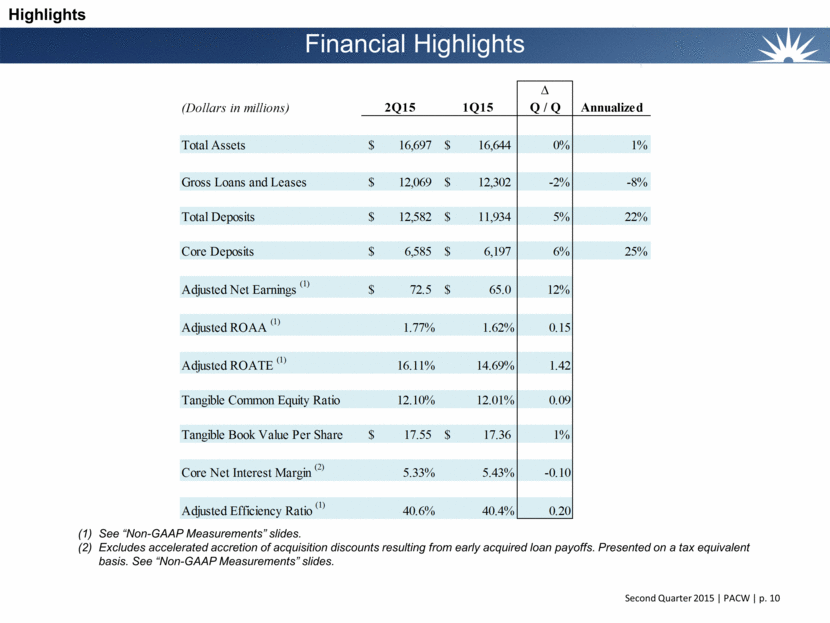
Financial Highlights See “Non-GAAP Measurements” slides. Excludes accelerated accretion of acquisition discounts resulting from early acquired loan payoffs. Presented on a tax equivalent basis. See “Non-GAAP Measurements” slides. Highlights ? (Dollars in millions) 2Q15 1Q15 Q / Q Annualized Total Assets 16,697 $ 16,644 $ 0% 1% Gross Loans and Leases 12,069 $ 12,302 $ -2% -8% Total Deposits 12,582 $ 11,934 $ 5% 22% Core Deposits 6,585 $ 6,197 $ 6% 25% Adjusted Net Earnings (1) 72.5 $ 65.0 $ 12% Adjusted ROAA (1) 1.77% 1.62% 0.15 Adjusted ROATE (1) 16.11% 14.69% 1.42 Tangible Common Equity Ratio 12.10% 12.01% 0.09 Tangible Book Value Per Share 17.55 $ 17.36 $ 1% Core Net Interest Margin (2) 5.33% 5.43% -0.10 Adjusted Efficiency Ratio (1) 40.6% 40.4% 0.20 |
|
|
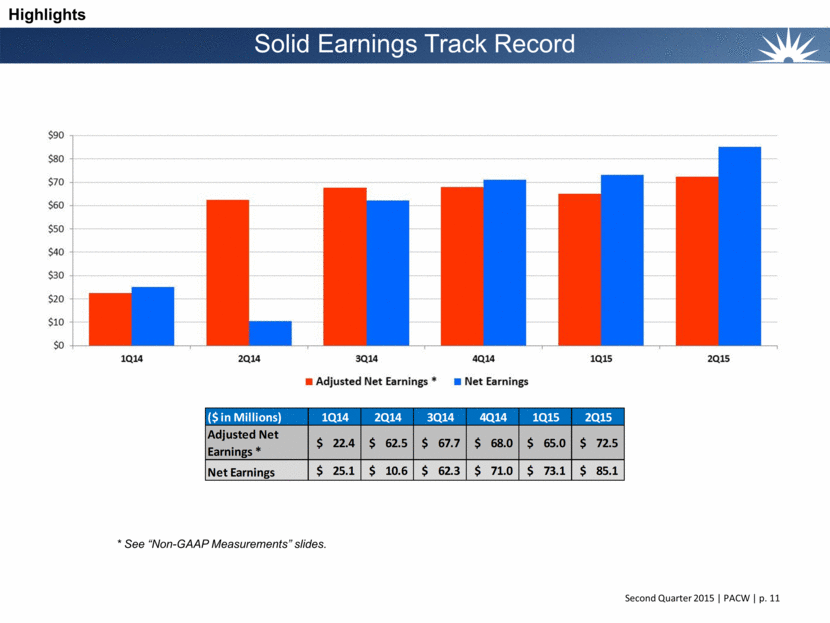
Solid Earnings Track Record * See “Non-GAAP Measurements” slides. Highlights ($ in Millions) 1Q14 2Q14 3Q14 4Q14 1Q15 2Q15 Adjusted Net Earnings * 22.4 $ 62.5 $ 67.7 $ 68.0 $ 65.0 $ 72.5 $ Net Earnings 25.1 $ 10.6 $ 62.3 $ 71.0 $ 73.1 $ 85.1 $ |
|
|
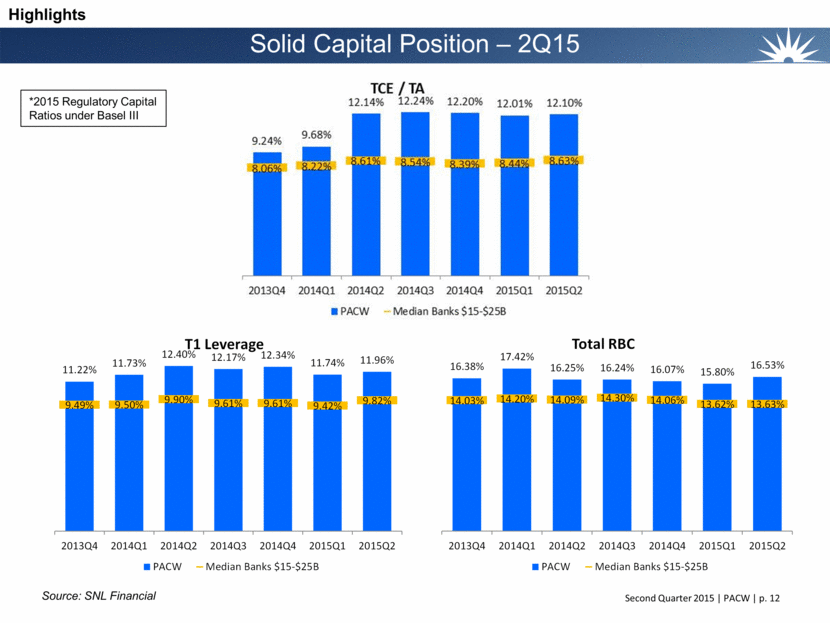
Solid Capital Position – 2Q15 Source: SNL Financial Highlights *2015 Regulatory Capital Ratios under Basel III 11.22% 11.73% 12.40% 12.17% 12.34% 11.74% 11.96% 9.49% 9.50% 9.90% 9.61% 9.61% 9.42% 9.82% 2013Q4 2014Q1 2014Q2 2014Q3 2014Q4 2015Q1 2015Q2 T1 Leverage PACW Median Banks $15-$25B 16.38% 17.42% 16.25% 16.24% 16.07% 15.80% 16.53% 14.03% 14.20% 14.09% 14.30% 14.06% 13.62% 13.63% 2013Q4 2014Q1 2014Q2 2014Q3 2014Q4 2015Q1 2015Q2 Total RBC PACW Median Banks $15-$25B |
|
|
Loans and Leases |
|
|
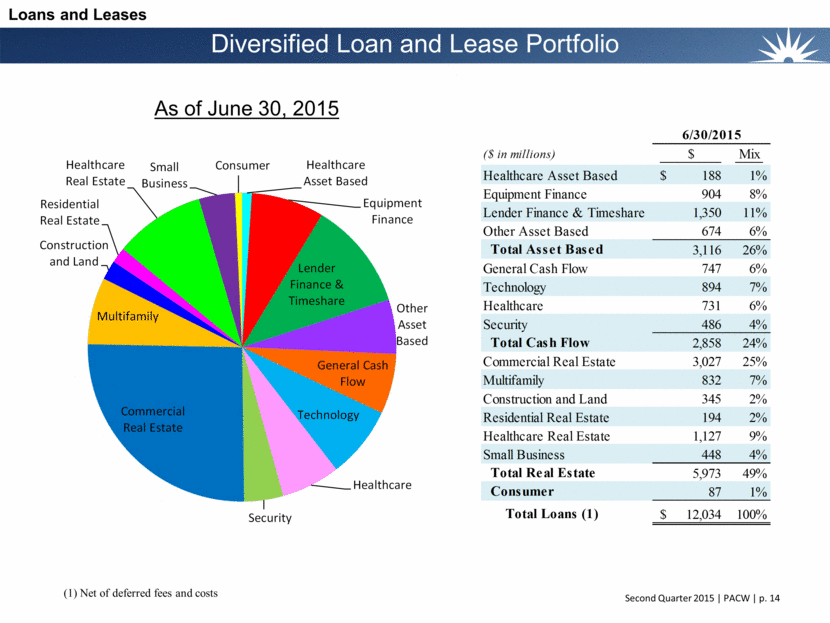
Diversified Loan and Lease Portfolio Loans and Leases As of June 30, 2015 (1) Net of deferred fees and costs Healthcare Asset Based Equipment Finance Lender Finance & Timeshare Other Asset Based General Cash Flow Technology Healthcare Security Commercial Real Estate Multifamily Construction and Land Residential Real Estate Healthcare Real Estate Small Business Consumer ($ in millions) $ Mix Healthcare Asset Based 188 $ 1% Equipment Finance 904 8% Lender Finance & Timeshare 1,350 11% Other Asset Based 674 6% Total Asset Based 3,116 26% General Cash Flow 747 6% Technology 894 7% Healthcare 731 6% Security 486 4% Total Cash Flow 2,858 24% Commercial Real Estate 3,027 25% Multifamily 832 7% Construction and Land 345 2% Residential Real Estate 194 2% Healthcare Real Estate 1,127 9% Small Business 448 4% Total Real Estate 5,973 49% Consumer 87 1% Total Loans (1) 12,034 $ 100% 6/30/2015 |
|
|
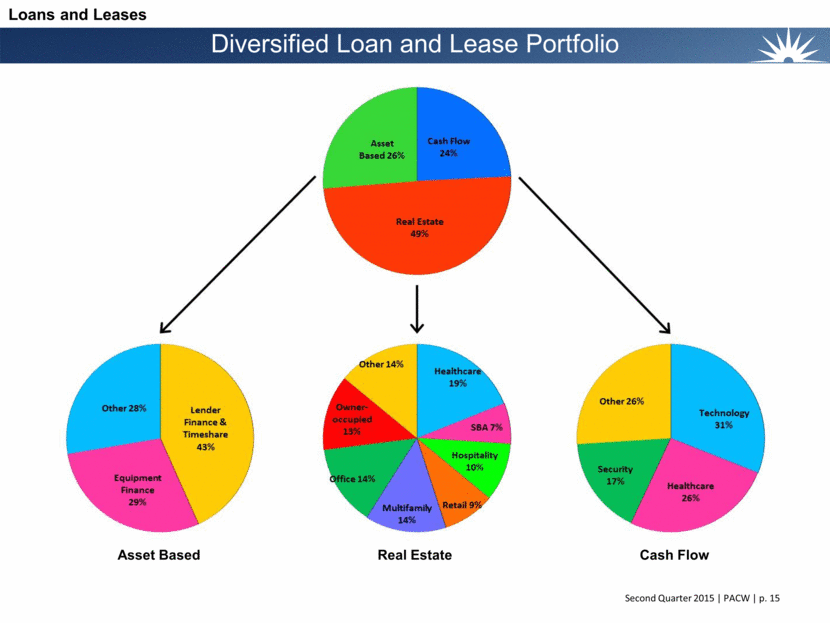
Diversified Loan and Lease Portfolio Loans and Leases Asset Based Real Estate Cash Flow |
|
|
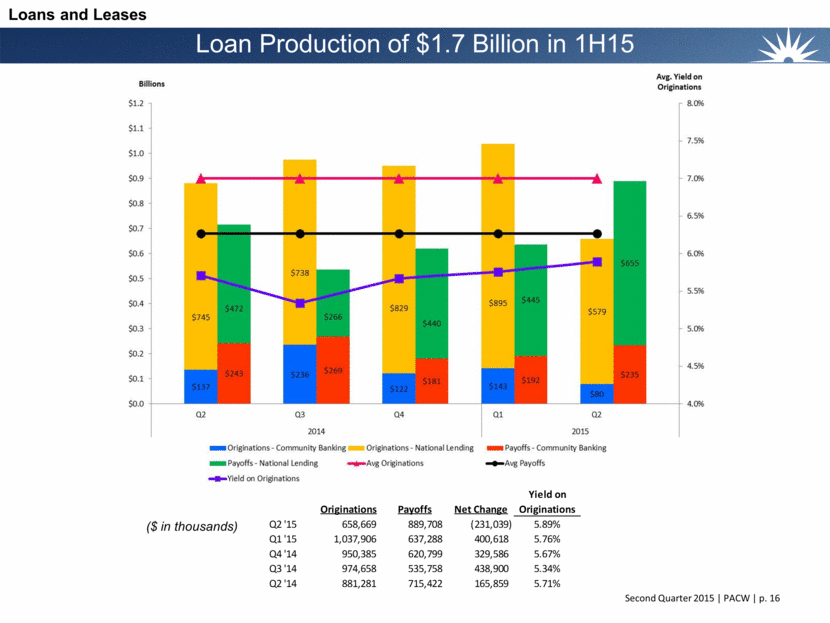
Loan Production of $1.7 Billion in 1H15 ($ in thousands) Loans and Leases Originations Payoffs Net Change Yield on Originations Q2 '15 658,669 889,708 (231,039) 5.89% Q1 '15 1,037,906 637,288 400,618 5.76% Q4 '14 950,385 620,799 329,586 5.67% Q3 '14 974,658 535,758 438,900 5.34% Q2 '14 881,281 715,422 165,859 5.71% |
|
|
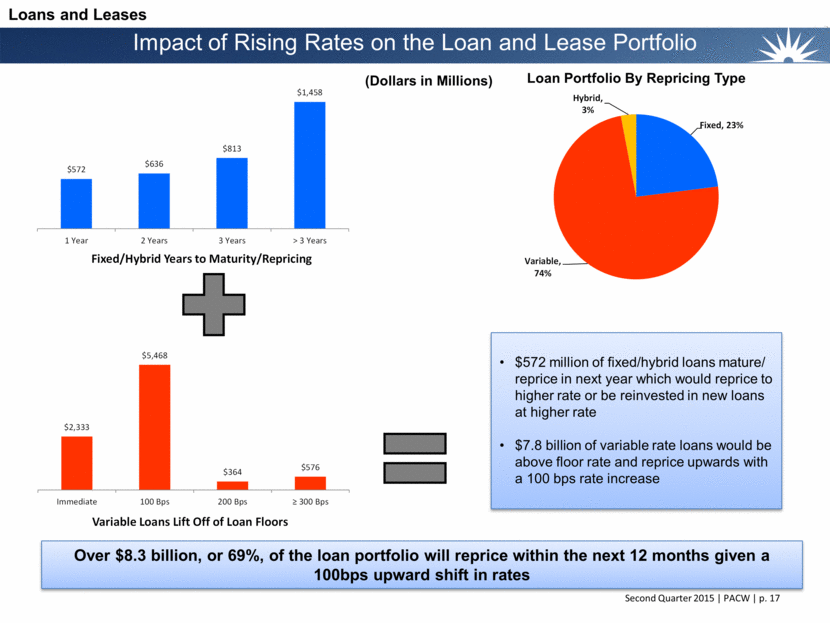
Impact of Rising Rates on the Loan and Lease Portfolio Loans and Leases Loan Portfolio By Repricing Type $572 million of fixed/hybrid loans mature/ reprice in next year which would reprice to higher rate or be reinvested in new loans at higher rate $7.8 billion of variable rate loans would be above floor rate and reprice upwards with a 100 bps rate increase (Dollars in Millions) Over $8.3 billion, or 69%, of the loan portfolio will reprice within the next 12 months given a 100bps upward shift in rates $572 $636 $813 $1,458 1 Year 2 Years 3 Years > 3 Years Fixed/Hybrid Years to Maturity/Repricing $2,333 $5,468 $364 $576 Immediate 100 Bps 200 Bps > 300 Bps Variable Loans Lift Off of Loan Floors Fixed, 23% Variable, 74% Hybrid, 3% |
|
|
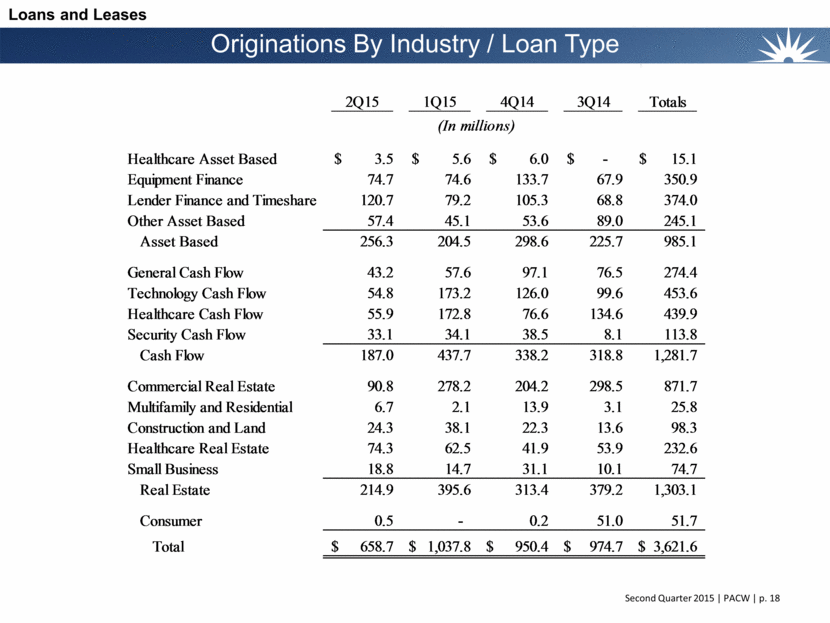
Originations By Industry / Loan Type Loans and Leases 2Q15 1Q15 4Q14 3Q14 Totals Healthcare Asset Based 3.5 $ 5.6 $ 6.0 $ - $ 15.1 $ Equipment Finance 74.7 74.6 133.7 67.9 350.9 Lender Finance and Timeshare 120.7 79.2 105.3 68.8 374.0 Other Asset Based 57.4 45.1 53.6 89.0 245.1 Asset Based 256.3 204.5 298.6 225.7 985.1 General Cash Flow 43.2 57.6 97.1 76.5 274.4 Technology Cash Flow 54.8 173.2 126.0 99.6 453.6 Healthcare Cash Flow 55.9 172.8 76.6 134.6 439.9 Security Cash Flow 33.1 34.1 38.5 8.1 113.8 Cash Flow 187.0 437.7 338.2 318.8 1,281.7 Commercial Real Estate 90.8 278.2 204.2 298.5 871.7 Multifamily and Residential 6.7 2.1 13.9 3.1 25.8 Construction and Land 24.3 38.1 22.3 13.6 98.3 Healthcare Real Estate 74.3 62.5 41.9 53.9 232.6 Small Business 18.8 14.7 31.1 10.1 74.7 Real Estate 214.9 395.6 313.4 379.2 1,303.1 Consumer 0.5 - 0.2 51.0 51.7 Total 658.7 $ 1,037.8 $ 950.4 $ 974.7 $ 3,621.6 $ (In millions) |
|
|
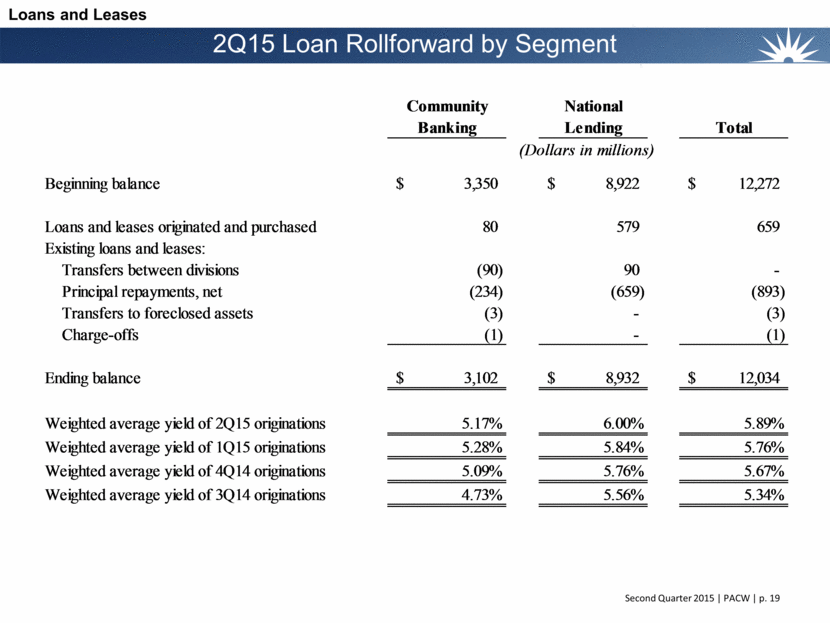
2Q15 Loan Rollforward by Segment Loans and Leases Community National Banking Lending Total Beginning balance 3,350 $ 8,922 $ 12,272 $ Loans and leases originated and purchased 80 579 659 Existing loans and leases: Transfers between divisions (90) 90 - Principal repayments, net (234) (659) (893) Transfers to foreclosed assets (3) - (3) Charge-offs (1) - (1) Ending balance 3,102 $ 8,932 $ 12,034 $ Weighted average yield of 2Q15 originations 5.17% 6.00% 5.89% Weighted average yield of 1Q15 originations 5.28% 5.84% 5.76% Weighted average yield of 4Q14 originations 5.09% 5.76% 5.67% Weighted average yield of 3Q14 originations 4.73% 5.56% 5.34% (Dollars in millions) |
|
|
Credit Quality |
|
|
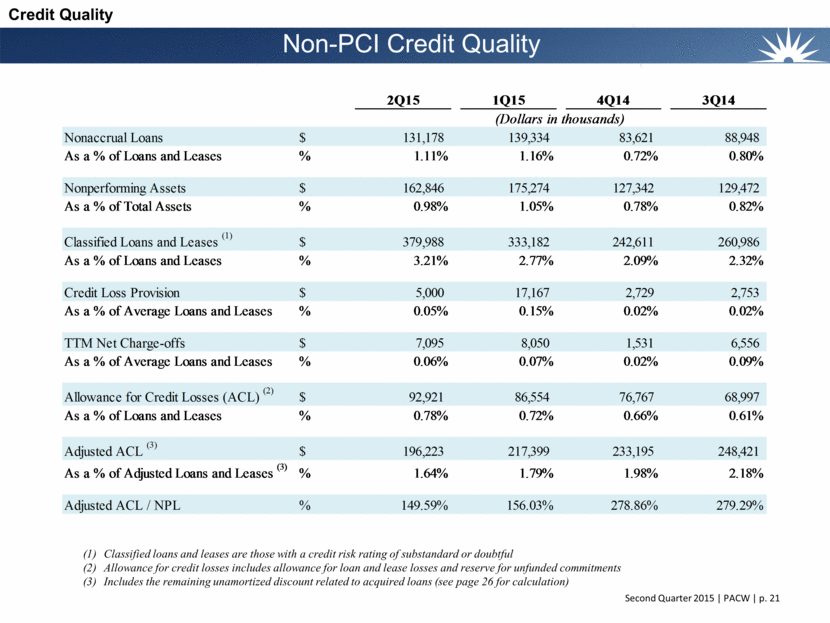
Non-PCI Credit Quality Classified loans and leases are those with a credit risk rating of substandard or doubtful Allowance for credit losses includes allowance for loan and lease losses and reserve for unfunded commitments Includes the remaining unamortized discount related to acquired loans (see page 26 for calculation) Credit Quality 2Q15 1Q15 4Q14 3Q14 Nonaccrual Loans $ 131,178 139,334 83,621 88,948 As a % of Loans and Leases % 1.11% 1.16% 0.72% 0.80% Nonperforming Assets $ 162,846 175,274 127,342 129,472 As a % of Total Assets % 0.98% 1.05% 0.78% 0.82% Classified Loans and Leases (1) $ 379,988 333,182 242,611 260,986 As a % of Loans and Leases % 3.21% 2.77% 2.09% 2.32% Credit Loss Provision $ 5,000 17,167 2,729 2,753 As a % of Average Loans and Leases % 0.05% 0.15% 0.02% 0.02% TTM Net Charge-offs $ 7,095 8,050 1,531 6,556 As a % of Average Loans and Leases % 0.06% 0.07% 0.02% 0.09% Allowance for Credit Losses (ACL) (2) $ 92,921 86,554 76,767 68,997 As a % of Loans and Leases % 0.78% 0.72% 0.66% 0.61% Adjusted ACL (3) $ 196,223 217,399 233,195 248,421 As a % of Adjusted Loans and Leases (3) % 1.64% 1.79% 1.98% 2.18% Adjusted ACL / NPL % 149.59% 156.03% 278.86% 279.29% (Dollars in thousands) |
|
|
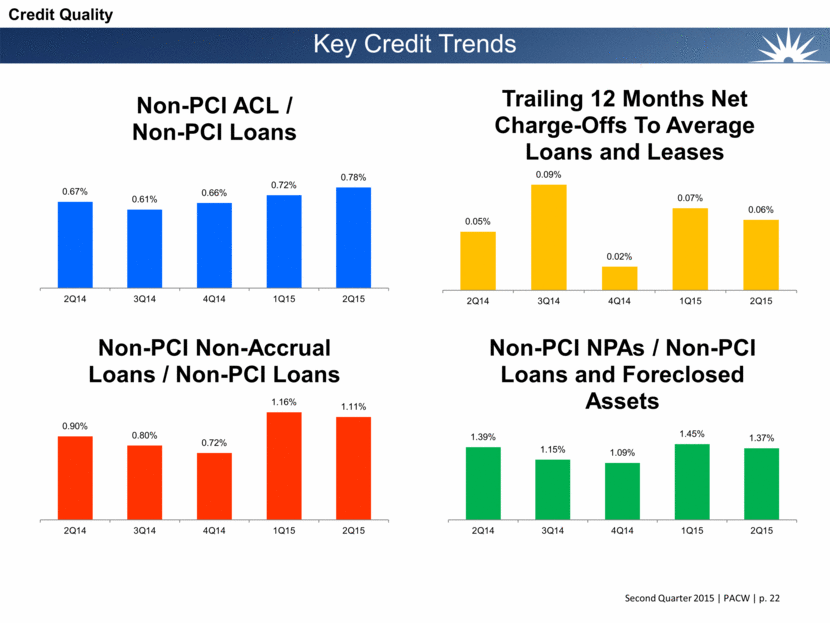
Key Credit Trends Credit Quality 0.67% 0.61% 0.66% 0.72% 0.78% 2Q14 3Q14 4Q14 1Q15 2Q15 Non - PCI ACL / Non - PCI Loans 0.05% 0.09% 0.02% 0.07% 0.06% 2Q14 3Q14 4Q14 1Q15 2Q15 Trailing 12 Months Net Charge - Offs To Average Loans and Leases 0.90% 0.80% 0.72% 1.16% 1.11% 2Q14 3Q14 4Q14 1Q15 2Q15 Non - PCI Non - Accrual Loans / Non - PCI Loans 1.39% 1.15% 1.09% 1.45% 1.37% 2Q14 3Q14 4Q14 1Q15 2Q15 Non - PCI NPAs / Non - PCI Loans and Foreclosed Assets |
|
|
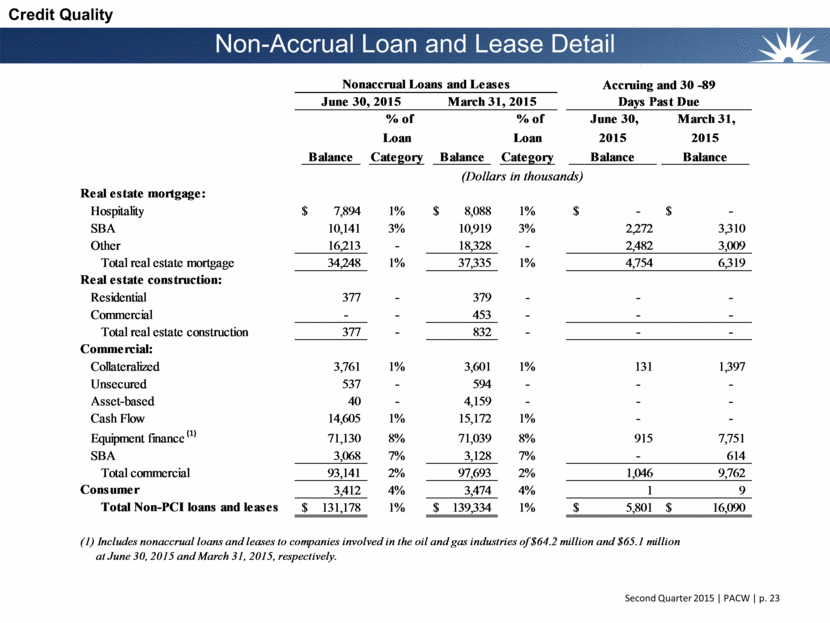
Non-Accrual Loan and Lease Detail Credit Quality Balance % of Loan Category Balance % of Loan Category June 30, 2015 Balance March 31, 2015 Balance Real estate mortgage: Hospitality 7,894 $ 1% 8,088 $ 1% - $ - $ SBA 10,141 3% 10,919 3% 2,272 3,310 Other 16,213 - 18,328 - 2,482 3,009 Total real estate mortgage 34,248 1% 37,335 1% 4,754 6,319 Real estate construction: Residential 377 - 379 - - - Commercial - - 453 - - - Total real estate construction 377 - 832 - - - Commercial: Collateralized 3,761 1% 3,601 1% 131 1,397 Unsecured 537 - 594 - - - Asset-based 40 - 4,159 - - - Cash Flow 14,605 1% 15,172 1% - - Equipment finance (1) 71,130 8% 71,039 8% 915 7,751 SBA 3,068 7% 3,128 7% - 614 Total commercial 93,141 2% 97,693 2% 1,046 9,762 Consumer 3,412 4% 3,474 4% 1 9 Total Non-PCI loans and leases 131,178 $ 1% 139,334 $ 1% 5,801 $ 16,090 $ (1) Includes nonaccrual loans and leases to companies involved in the oil and gas industries of $64.2 million and $65.1 million at June 30, 2015 and March 31, 2015, respectively. (Dollars in thousands) June 30, 2015 Nonaccrual Loans and Leases March 31, 2015 Accruing and 30 -89 Days Past Due |
|
|
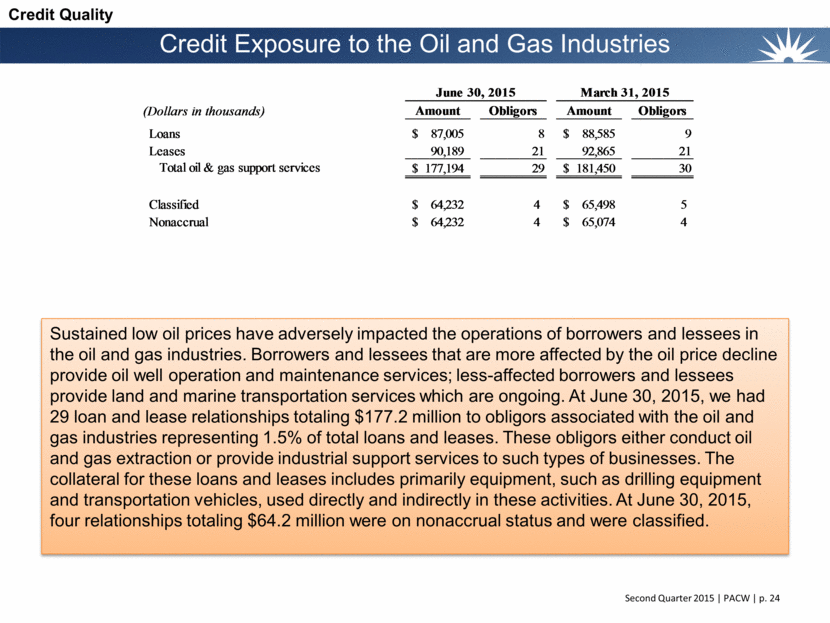
Credit Exposure to the Oil and Gas Industries Credit Quality Sustained low oil prices have adversely impacted the operations of borrowers and lessees in the oil and gas industries. Borrowers and lessees that are more affected by the oil price decline provide oil well operation and maintenance services; less-affected borrowers and lessees provide land and marine transportation services which are ongoing. At June 30, 2015, we had 29 loan and lease relationships totaling $177.2 million to obligors associated with the oil and gas industries representing 1.5% of total loans and leases. These obligors either conduct oil and gas extraction or provide industrial support services to such types of businesses. The collateral for these loans and leases includes primarily equipment, such as drilling equipment and transportation vehicles, used directly and indirectly in these activities. At June 30, 2015, four relationships totaling $64.2 million were on nonaccrual status and were classified. (Dollars in thousands) Amount Obligors Amount Obligors Loans 87,005 $ 8 88,585 $ 9 Leases 90,189 21 92,865 21 Total oil & gas support services 177,194 $ 29 181,450 $ 30 Classified 64,232 $ 4 65,498 $ 5 Nonaccrual 64,232 $ 4 65,074 $ 4 June 30, 2015 March 31, 2015 |
|
|
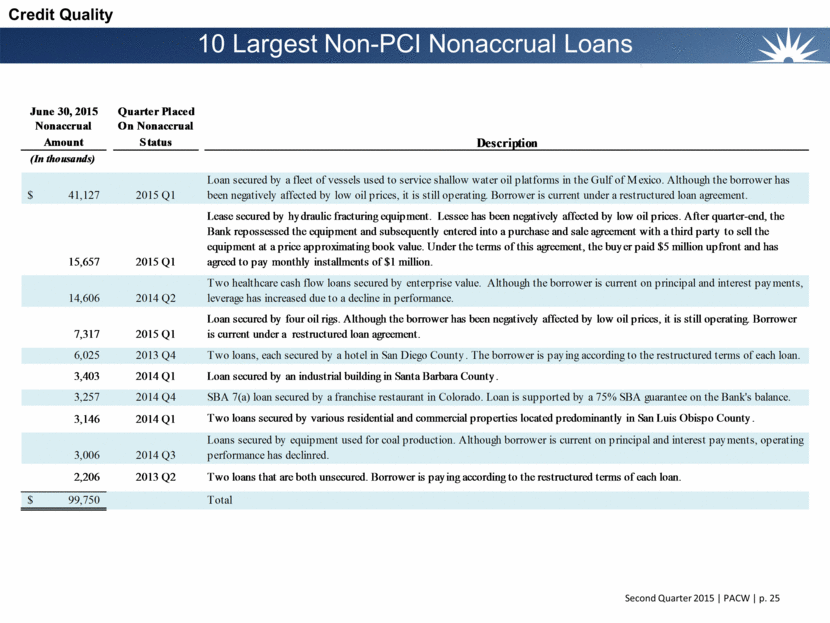
10 Largest Non-PCI Nonaccrual Loans Credit Quality June 30, 2015 Quarter Placed Nonaccrual On Nonaccrual Amount Status Description (In thousands) 41,127 $ 2015 Q1 Loan secured by a fleet of vessels used to service shallow water oil platforms in the Gulf of Mexico. Although the borrower has been negatively affected by low oil prices, it is still operating. Borrower is current under a restructured loan agreement. 15,657 2015 Q1 Lease secured by hydraulic fracturing equipment. Lessee has been negatively affected by low oil prices. After quarter-end, the Bank repossessed the equipment and subsequently entered into a purchase and sale agreement with a third party to sell the equipment at a price approximating book value. Under the terms of this agreement, the buyer paid $5 million upfront and has agreed to pay monthly installments of $1 million. 14,606 2014 Q2 Two healthcare cash flow loans secured by enterprise value. Although the borrower is current on principal and interest payments, leverage has increased due to a decline in performance. 7,317 2015 Q1 Loan secured by four oil rigs. Although the borrower has been negatively affected by low oil prices, it is still operating. Borrower is current under a restructured loan agreement. 6,025 2013 Q4 Two loans, each secured by a hotel in San Diego County. The borrower is paying according to the restructured terms of each loan. 3,403 2014 Q1 Loan secured by an industrial building in Santa Barbara County. 3,257 2014 Q4 SBA 7(a) loan secured by a franchise restaurant in Colorado. Loan is supported by a 75% SBA guarantee on the Bank's balance. 3,146 2014 Q1 Two loans secured by various residential and commercial properties located predominantly in San Luis Obispo County. 3,006 2014 Q3 Loans secured by equipment used for coal production. Although borrower is current on principal and interest payments, operating performance has declinred. 2,206 2013 Q2 Two loans that are both unsecured. Borrower is paying according to the restructured terms of each loan. 99,750 $ Total |
|
|
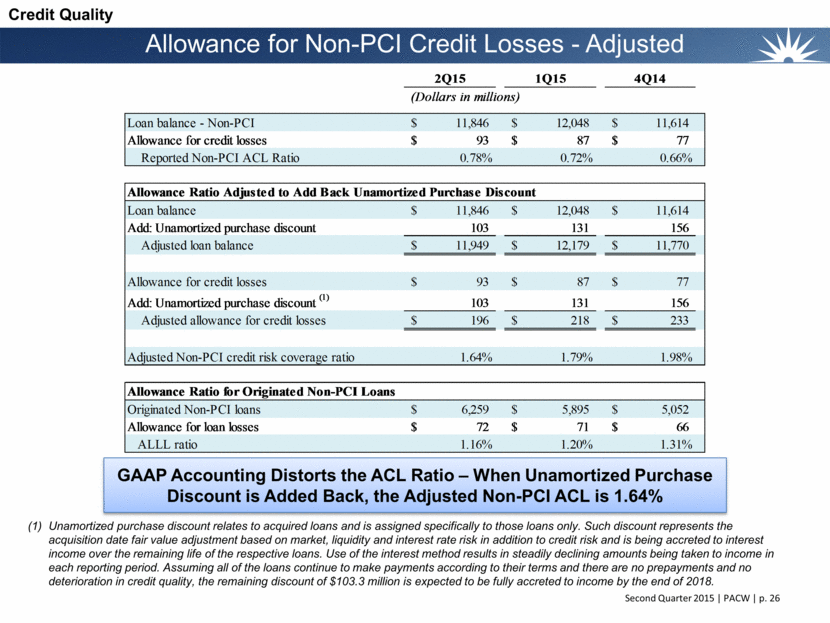
Allowance for Non-PCI Credit Losses - Adjusted GAAP Accounting Distorts the ACL Ratio – When Unamortized Purchase Discount is Added Back, the Adjusted Non-PCI ACL is 1.64% Credit Quality Unamortized purchase discount relates to acquired loans and is assigned specifically to those loans only. Such discount represents the acquisition date fair value adjustment based on market, liquidity and interest rate risk in addition to credit risk and is being accreted to interest income over the remaining life of the respective loans. Use of the interest method results in steadily declining amounts being taken to income in each reporting period. Assuming all of the loans continue to make payments according to their terms and there are no prepayments and no deterioration in credit quality, the remaining discount of $103.3 million is expected to be fully accreted to income by the end of 2018. 2Q15 1Q15 4Q14 (Dollars in millions) Loan balance - Non-PCI 11,846 $ 12,048 $ 11,614 $ Allowance for credit losses 93 $ 87 $ 77 $ Reported Non-PCI ACL Ratio 0.78% 0.72% 0.66% Allowance Ratio Adjusted to Add Back Unamortized Purchase Discount Loan balance 11,846 $ 12,048 $ 11,614 $ Add: Unamortized purchase discount 103 131 156 Adjusted loan balance 11,949 $ 12,179 $ 11,770 $ Allowance for credit losses 93 $ 87 $ 77 $ Add: Unamortized purchase discount (1) 103 131 156 Adjusted allowance for credit losses 196 $ 218 $ 233 $ Adjusted Non-PCI credit risk coverage ratio 1.64% 1.79% 1.98% Allowance Ratio for Originated Non-PCI Loans Originated Non-PCI loans 6,259 $ 5,895 $ 5,052 $ Allowance for loan losses 72 $ 71 $ 66 $ ALLL ratio 1.16% 1.20% 1.31% |
|
|
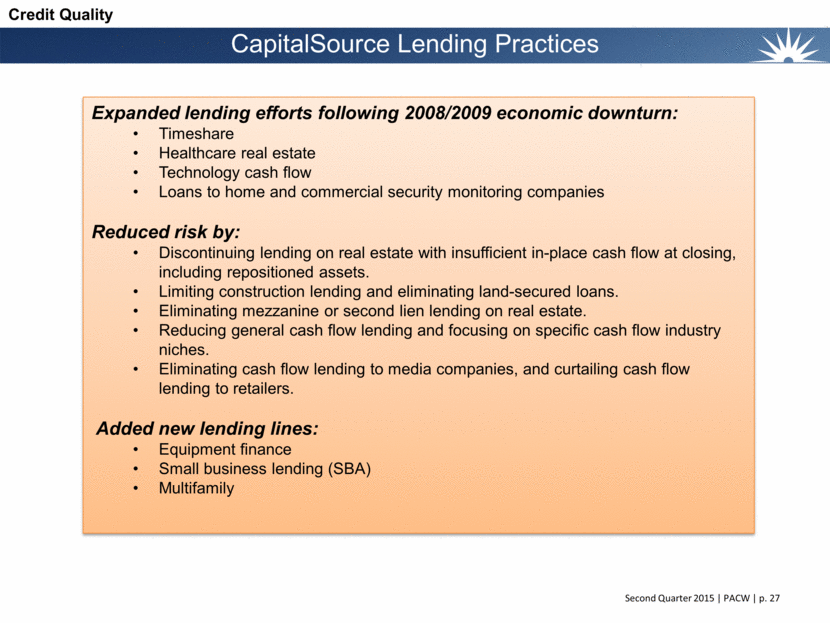
Expanded lending efforts following 2008/2009 economic downturn: Timeshare Healthcare real estate Technology cash flow Loans to home and commercial security monitoring companies Reduced risk by: Discontinuing lending on real estate with insufficient in-place cash flow at closing, including repositioned assets. Limiting construction lending and eliminating land-secured loans. Eliminating mezzanine or second lien lending on real estate. Reducing general cash flow lending and focusing on specific cash flow industry niches. Eliminating cash flow lending to media companies, and curtailing cash flow lending to retailers. Added new lending lines: Equipment finance Small business lending (SBA) Multifamily CapitalSource Lending Practices Credit Quality |
|
|
Deposits |
|
|
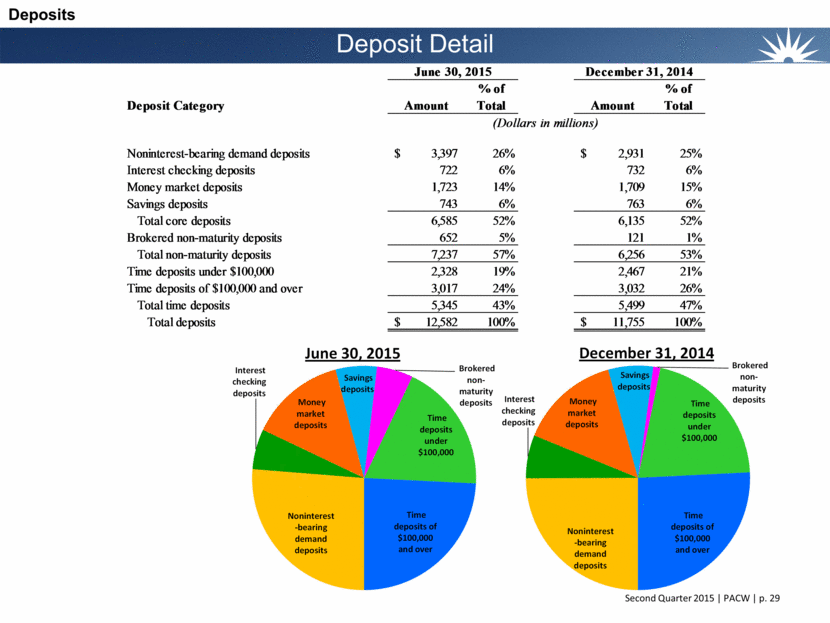
Deposit Detail Deposits % of % of Deposit Category Amount Total Amount Total Noninterest-bearing demand deposits 3,397 $ 26% 2,931 $ 25% Interest checking deposits 722 6% 732 6% Money market deposits 1,723 14% 1,709 15% Savings deposits 743 6% 763 6% Total core deposits 6,585 52% 6,135 52% Brokered non-maturity deposits 652 5% 121 1% Total non-maturity deposits 7,237 57% 6,256 53% Time deposits under $100,000 2,328 19% 2,467 21% Time deposits of $100,000 and over 3,017 24% 3,032 26% Total time deposits 5,345 43% 5,499 47% Total deposits 12,582 $ 100% 11,755 $ 100% June 30, 2015 December 31, 2014 (Dollars in millions) Noninterest - bearing demand deposits Interest checking deposits Money market deposits Savings deposits Brokered non - maturity deposits Time deposits under $100,000 Time deposits of $100,000 and over June 30, 2015 Noninterest - bearing demand deposits Interest checking deposits Money market deposits Savings deposits Brokered non - maturity deposits Time deposits under $100,000 Time deposits of $100,000 and over December 31, 2014 |
|
|
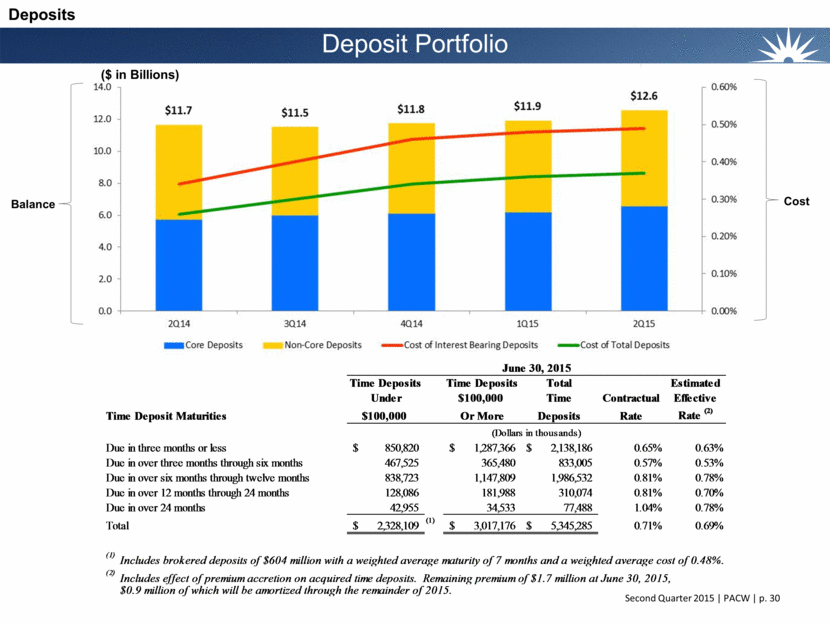
Deposit Portfolio Deposits ($ in Billions) Cost Balance Time Deposits Time Deposits Total Estimated Under $100,000 Time Contractual Effective Time Deposit Maturities $100,000 Or More Deposits Rate Rate (2) Due in three months or less 850,820 $ 1,287,366 $ 2,138,186 $ 0.65% 0.63% Due in over three months through six months 467,525 365,480 833,005 0.57% 0.53% Due in over six months through twelve months 838,723 1,147,809 1,986,532 0.81% 0.78% Due in over 12 months through 24 months 128,086 181,988 310,074 0.81% 0.70% Due in over 24 months 42,955 34,533 77,488 1.04% 0.78% Total 2,328,109 $ (1) 3,017,176 $ 5,345,285 $ 0.71% 0.69% (1) (2) $0.9 million of which will be amortized through the remainder of 2015. June 30, 2015 Includes brokered deposits of $604 million with a weighted average maturity of 7 months and a weighted average cost of 0.48%. Includes effect of premium accretion on acquired time deposits. Remaining premium of $1.7 million at June 30, 2015, (Dollars in thousands) |
|
|
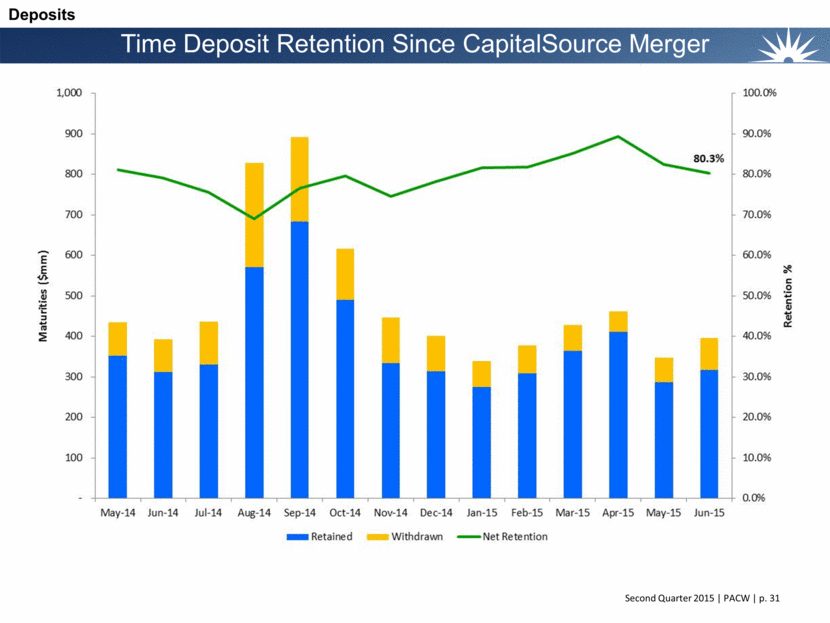
Time Deposit Retention Since CapitalSource Merger Deposits |
|
|
Net Interest Margin |
|
|
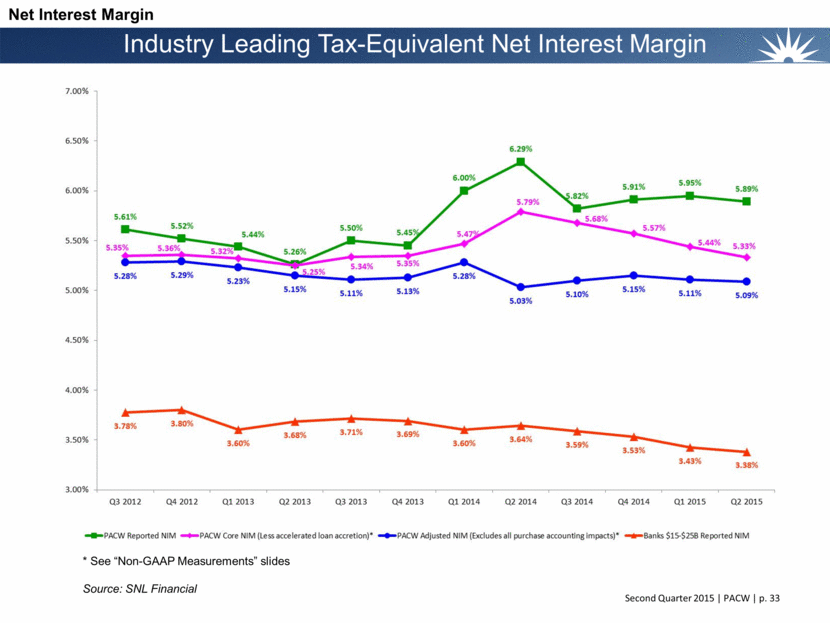
Industry Leading Tax-Equivalent Net Interest Margin * See “Non-GAAP Measurements” slides Source: SNL Financial Net Interest Margin |
|
|
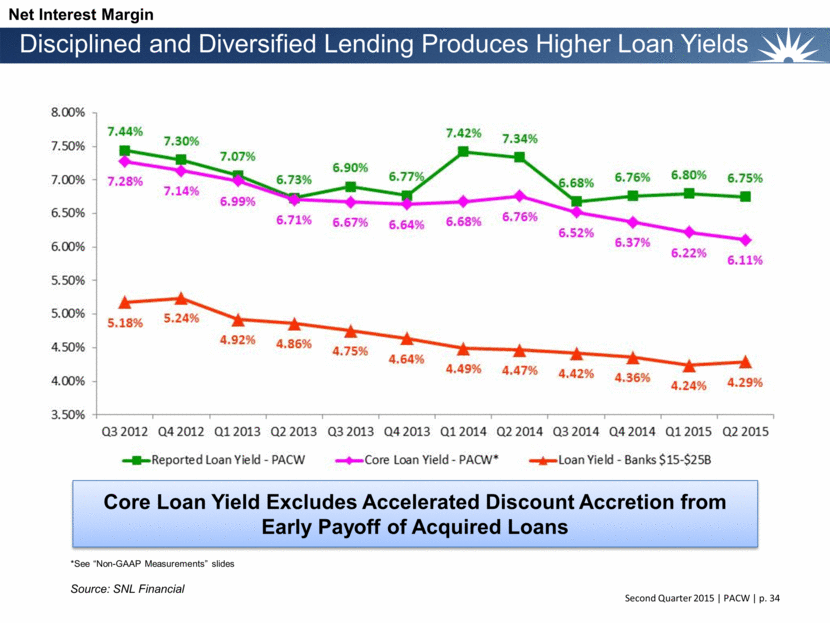
Disciplined and Diversified Lending Produces Higher Loan Yields Core Loan Yield Excludes Accelerated Discount Accretion from Early Payoff of Acquired Loans Source: SNL Financial Net Interest Margin *See “Non-GAAP Measurements” slides |
|
|
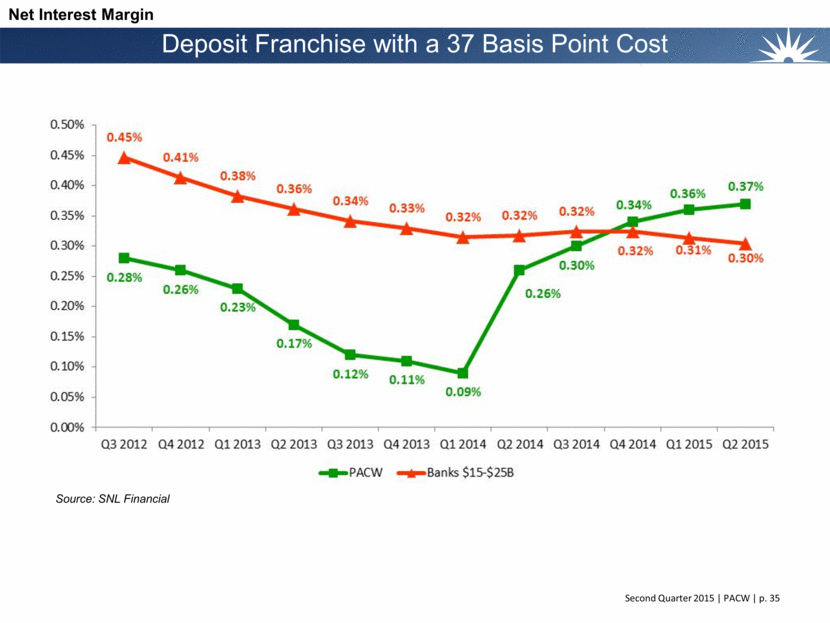
Deposit Franchise with a 37 Basis Point Cost Source: SNL Financial Net Interest Margin |
|
|
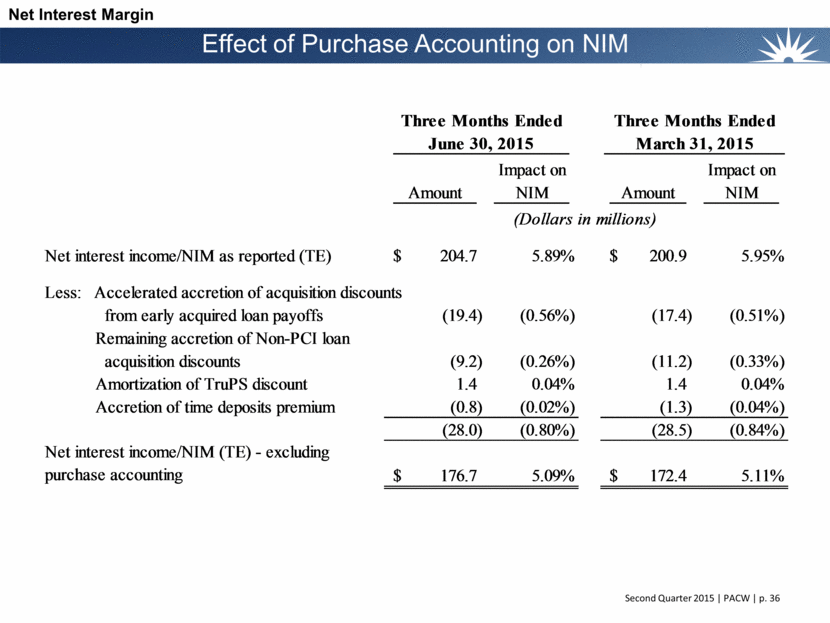
Effect of Purchase Accounting on NIM Net Interest Margin Impact on Impact on Amount NIM Amount NIM Net interest income/NIM as reported (TE) 204.7 $ 5.89% 200.9 $ 5.95% Less: Accelerated accretion of acquisition discounts from early acquired loan payoffs (19.4) (0.56%) (17.4) (0.51%) Remaining accretion of Non-PCI loan acquisition discounts (9.2) (0.26%) (11.2) (0.33%) Amortization of TruPS discount 1.4 0.04% 1.4 0.04% Accretion of time deposits premium (0.8) (0.02%) (1.3) (0.04%) (28.0) (0.80%) (28.5) (0.84%) Net interest income/NIM (TE) - excluding purchase accounting 176.7 $ 5.09% 172.4 $ 5.11% June 30, 2015 March 31, 2015 (Dollars in millions) Three Months Ended Three Months Ended |
|
|
Controlled Expenses |
|
|
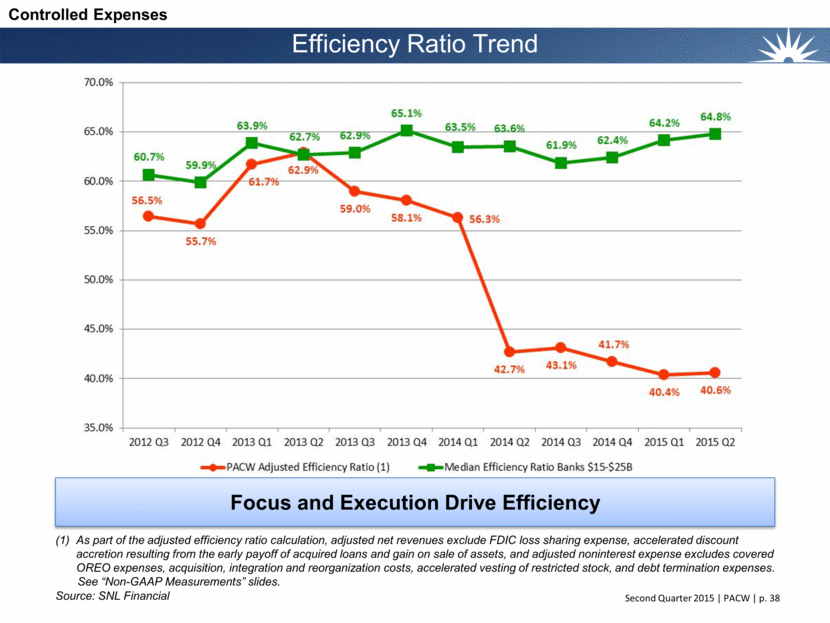
Efficiency Ratio Trend As part of the adjusted efficiency ratio calculation, adjusted net revenues exclude FDIC loss sharing expense, accelerated discount accretion resulting from the early payoff of acquired loans and gain on sale of assets, and adjusted noninterest expense excludes covered OREO expenses, acquisition, integration and reorganization costs, accelerated vesting of restricted stock, and debt termination expenses. See “Non-GAAP Measurements” slides. Focus and Execution Drive Efficiency Source: SNL Financial Controlled Expenses |
|
|
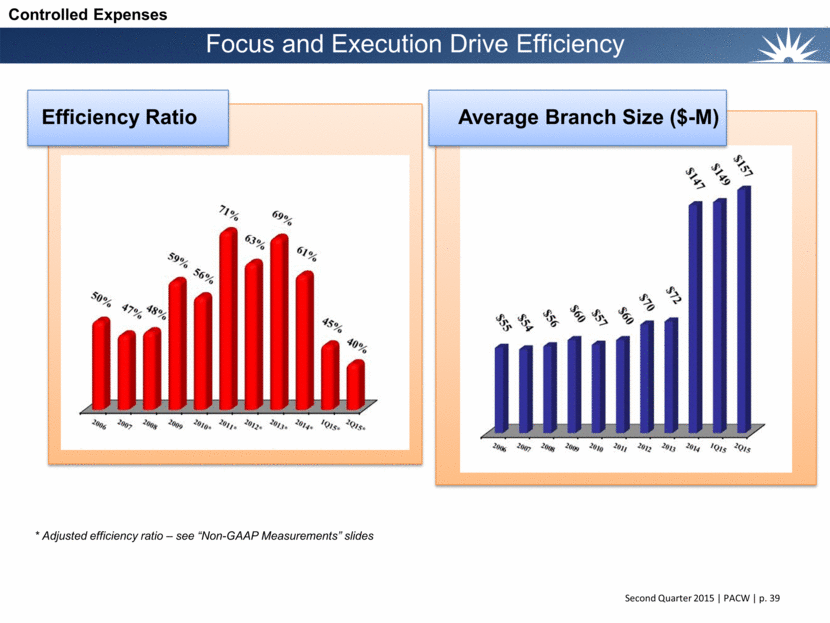
Efficiency Ratio Average Branch Size ($-M) Focus and Execution Drive Efficiency * Adjusted efficiency ratio – see “Non-GAAP Measurements” slides Controlled Expenses |
|
|
Acquisitions |
|
|
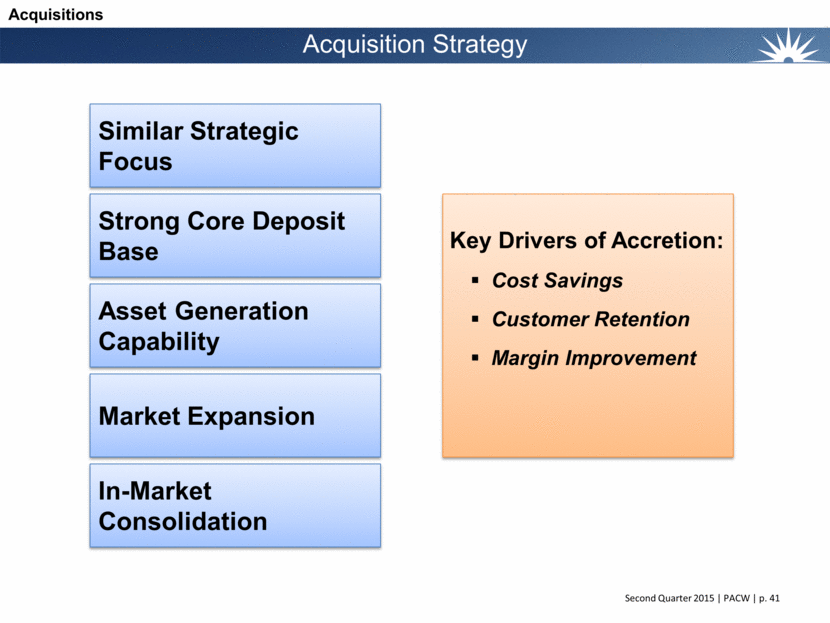
Asset Generation Capability In-Market Consolidation Strong Core Deposit Base Similar Strategic Focus Key Drivers of Accretion: Cost Savings Customer Retention Margin Improvement Acquisition Strategy Market Expansion Acquisitions |
|
|
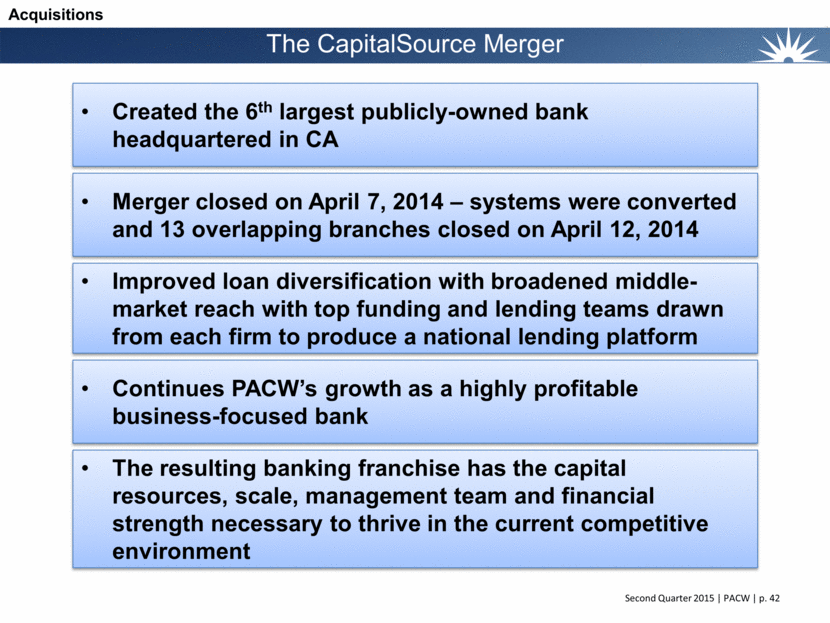
The CapitalSource Merger Acquisitions Created the 6th largest publicly-owned bank headquartered in CA Merger closed on April 7, 2014 – systems were converted and 13 overlapping branches closed on April 12, 2014 Continues PACW’s growth as a highly profitable business-focused bank Improved loan diversification with broadened middle-market reach with top funding and lending teams drawn from each firm to produce a national lending platform The resulting banking franchise has the capital resources, scale, management team and financial strength necessary to thrive in the current competitive environment |
|
|
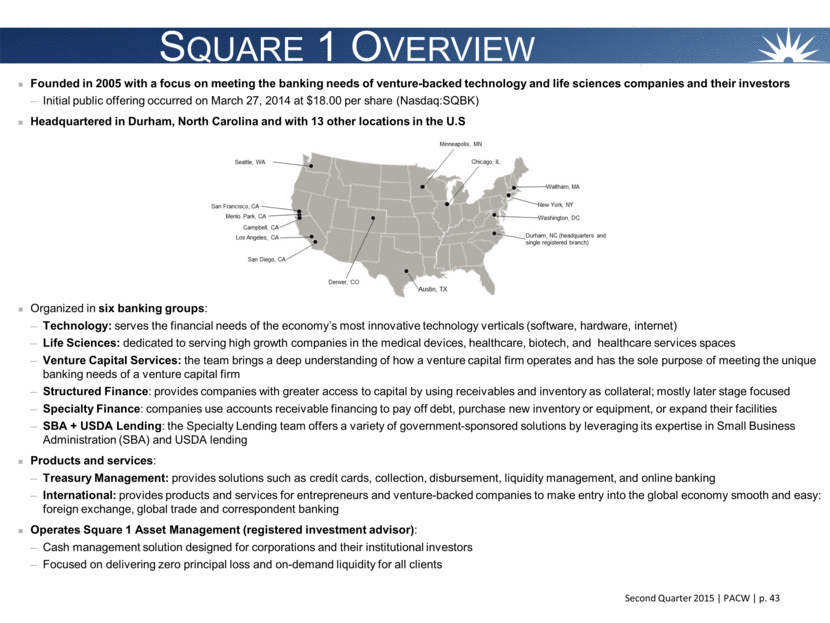
Founded in 2005 with a focus on meeting the banking needs of venture-backed technology and life sciences companies and their investors Initial public offering occurred on March 27, 2014 at $18.00 per share (Nasdaq:SQBK) Headquartered in Durham, North Carolina and with 13 other locations in the U.S Organized in six banking groups: Technology: serves the financial needs of the economy’s most innovative technology verticals (software, hardware, internet) Life Sciences: dedicated to serving high growth companies in the medical devices, healthcare, biotech, and healthcare services spaces Venture Capital Services: the team brings a deep understanding of how a venture capital firm operates and has the sole purpose of meeting the unique banking needs of a venture capital firm Structured Finance: provides companies with greater access to capital by using receivables and inventory as collateral; mostly later stage focused Specialty Finance: companies use accounts receivable financing to pay off debt, purchase new inventory or equipment, or expand their facilities SBA + USDA Lending: the Specialty Lending team offers a variety of government-sponsored solutions by leveraging its expertise in Small Business Administration (SBA) and USDA lending Products and services: Treasury Management: provides solutions such as credit cards, collection, disbursement, liquidity management, and online banking International: provides products and services for entrepreneurs and venture-backed companies to make entry into the global economy smooth and easy: foreign exchange, global trade and correspondent banking Operates Square 1 Asset Management (registered investment advisor): Cash management solution designed for corporations and their institutional investors Focused on delivering zero principal loss and on-demand liquidity for all clients Square 1 Overview |
|
|
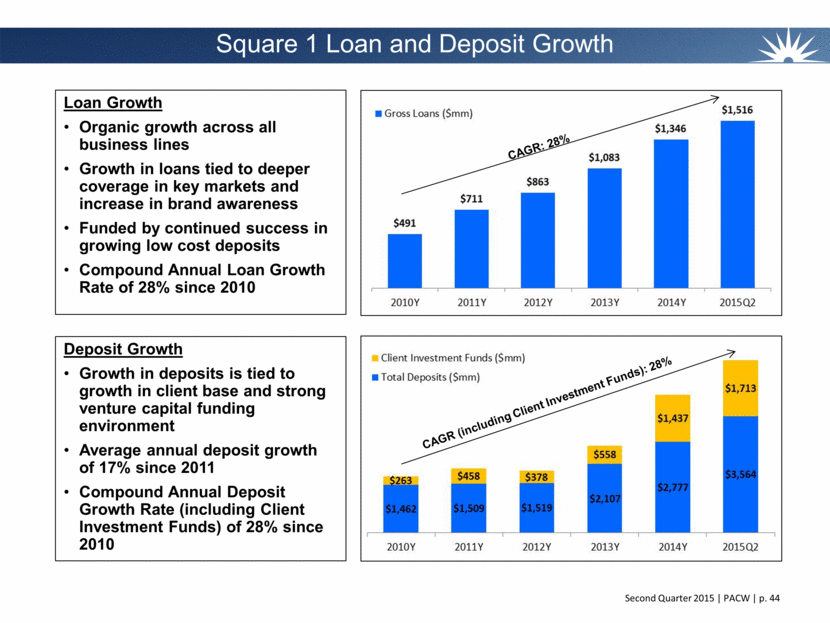
Square 1 Loan and Deposit Growth Loan Growth Organic growth across all business lines Growth in loans tied to deeper coverage in key markets and increase in brand awareness Funded by continued success in growing low cost deposits Compound Annual Loan Growth Rate of 28% since 2010 Deposit Growth Growth in deposits is tied to growth in client base and strong venture capital funding environment Average annual deposit growth of 17% since 2011 Compound Annual Deposit Growth Rate (including Client Investment Funds) of 28% since 2010 CAGR: 28% CAGR (including Client Investment Funds): 28% |
|
|
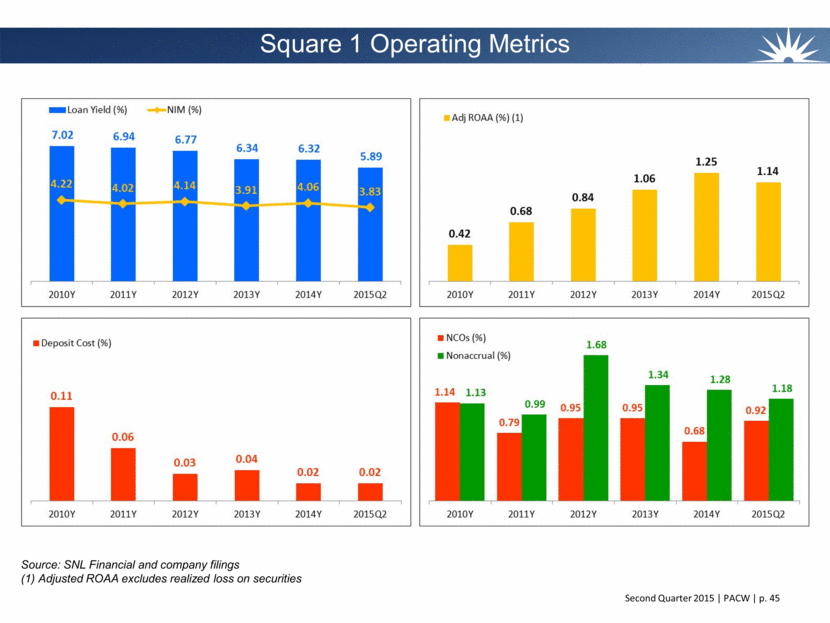
Square 1 Operating Metrics Source: SNL Financial and company filings (1) Adjusted ROAA excludes realized loss on securities |
|
|
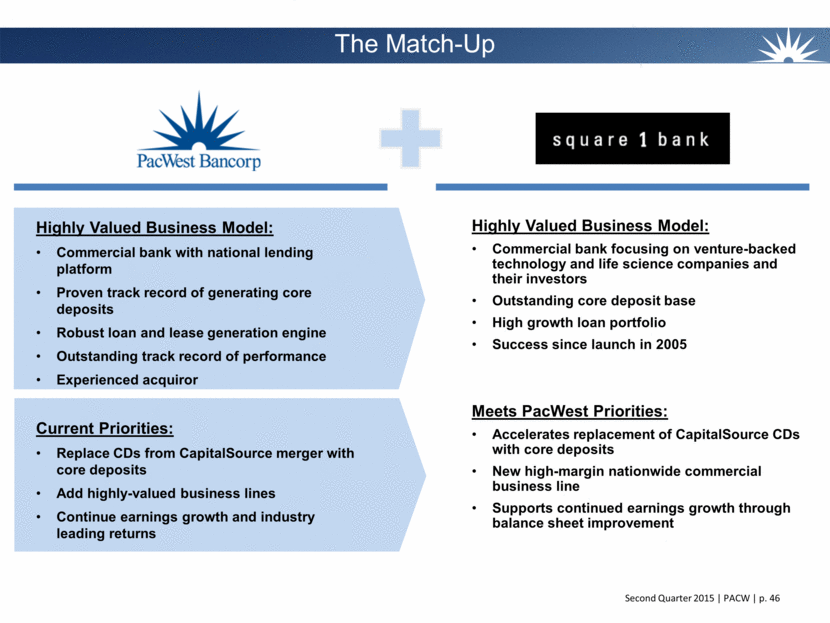
Highly Valued Business Model: Commercial bank with national lending platform Proven track record of generating core deposits Robust loan and lease generation engine Outstanding track record of performance Experienced acquiror Current Priorities: Replace CDs from CapitalSource merger with core deposits Add highly-valued business lines Continue earnings growth and industry leading returns Highly Valued Business Model: Commercial bank focusing on venture-backed technology and life science companies and their investors Outstanding core deposit base High growth loan portfolio Success since launch in 2005 Meets PacWest Priorities: Accelerates replacement of CapitalSource CDs with core deposits New high-margin nationwide commercial business line Supports continued earnings growth through balance sheet improvement The Match-Up |
|
|
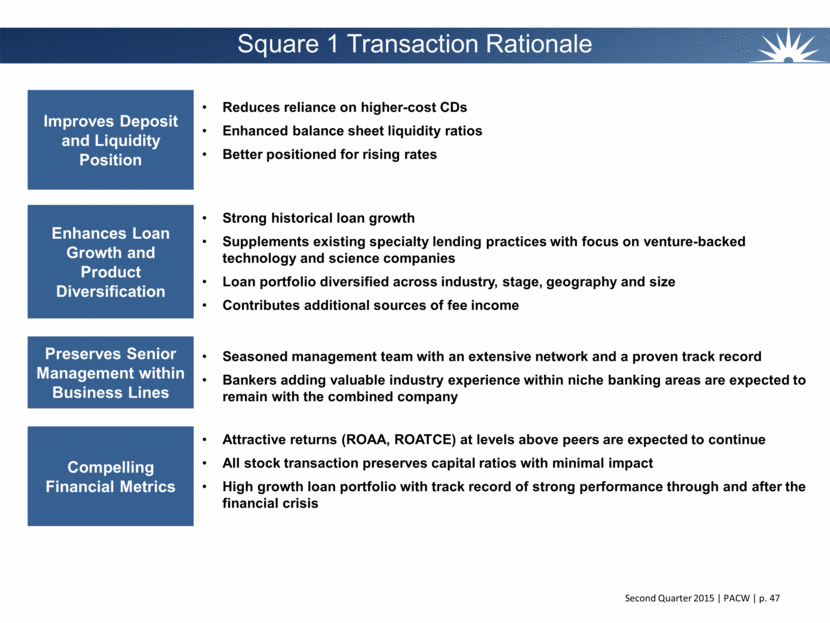
Reduces reliance on higher-cost CDs Enhanced balance sheet liquidity ratios Better positioned for rising rates Square 1 Transaction Rationale Improves Deposit and Liquidity Position Seasoned management team with an extensive network and a proven track record Bankers adding valuable industry experience within niche banking areas are expected to remain with the combined company Enhances Loan Growth and Product Diversification Preserves Senior Management within Business Lines Strong historical loan growth Supplements existing specialty lending practices with focus on venture-backed technology and science companies Loan portfolio diversified across industry, stage, geography and size Contributes additional sources of fee income Attractive returns (ROAA, ROATCE) at levels above peers are expected to continue All stock transaction preserves capital ratios with minimal impact High growth loan portfolio with track record of strong performance through and after the financial crisis Compelling Financial Metrics |
|
|
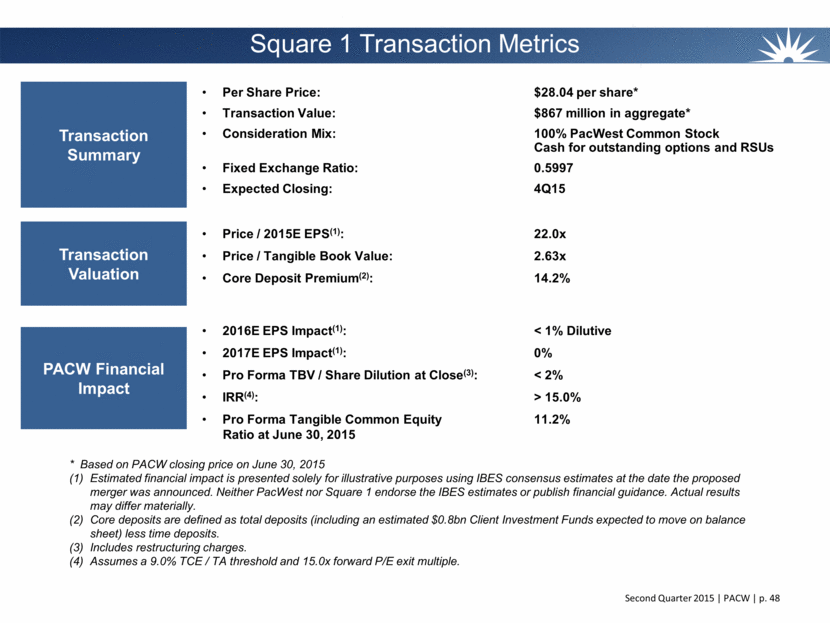
Per Share Price: $28.04 per share* Transaction Value: $867 million in aggregate* Consideration Mix: 100% PacWest Common Stock Cash for outstanding options and RSUs Fixed Exchange Ratio: 0.5997 Expected Closing: 4Q15 Price / 2015E EPS(1): 22.0x Price / Tangible Book Value: 2.63x Core Deposit Premium(2): 14.2% Square 1 Transaction Metrics 2016E EPS Impact(1): < 1% Dilutive 2017E EPS Impact(1): 0% Pro Forma TBV / Share Dilution at Close(3): < 2% IRR(4): > 15.0% Pro Forma Tangible Common Equity 11.2% Ratio at June 30, 2015 Transaction Summary Transaction Valuation PACW Financial Impact * Based on PACW closing price on June 30, 2015 Estimated financial impact is presented solely for illustrative purposes using IBES consensus estimates at the date the proposed merger was announced. Neither PacWest nor Square 1 endorse the IBES estimates or publish financial guidance. Actual results may differ materially. Core deposits are defined as total deposits (including an estimated $0.8bn Client Investment Funds expected to move on balance sheet) less time deposits. Includes restructuring charges. Assumes a 9.0% TCE / TA threshold and 15.0x forward P/E exit multiple. |
|
|
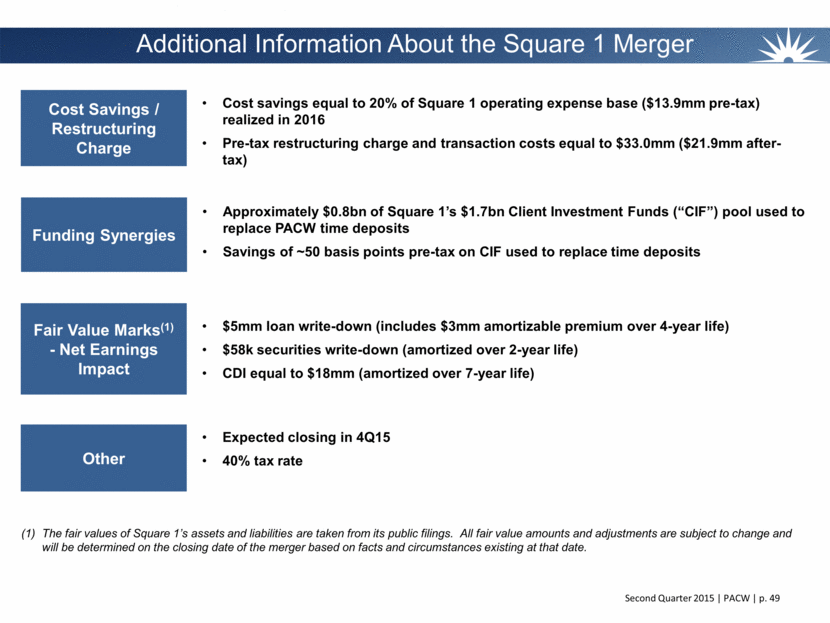
Cost savings equal to 20% of Square 1 operating expense base ($13.9mm pre-tax) realized in 2016 Pre-tax restructuring charge and transaction costs equal to $33.0mm ($21.9mm after-tax) Approximately $0.8bn of Square 1’s $1.7bn Client Investment Funds (“CIF”) pool used to replace PACW time deposits Savings of ~50 basis points pre-tax on CIF used to replace time deposits Additional Information About the Square 1 Merger $5mm loan write-down (includes $3mm amortizable premium over 4-year life) $58k securities write-down (amortized over 2-year life) CDI equal to $18mm (amortized over 7-year life) Cost Savings / Restructuring Charge Other Expected closing in 4Q15 40% tax rate Funding Synergies Fair Value Marks(1) - Net Earnings Impact The fair values of Square 1’s assets and liabilities are taken from its public filings. All fair value amounts and adjustments are subject to change and will be determined on the closing date of the merger based on facts and circumstances existing at that date. |
|
|
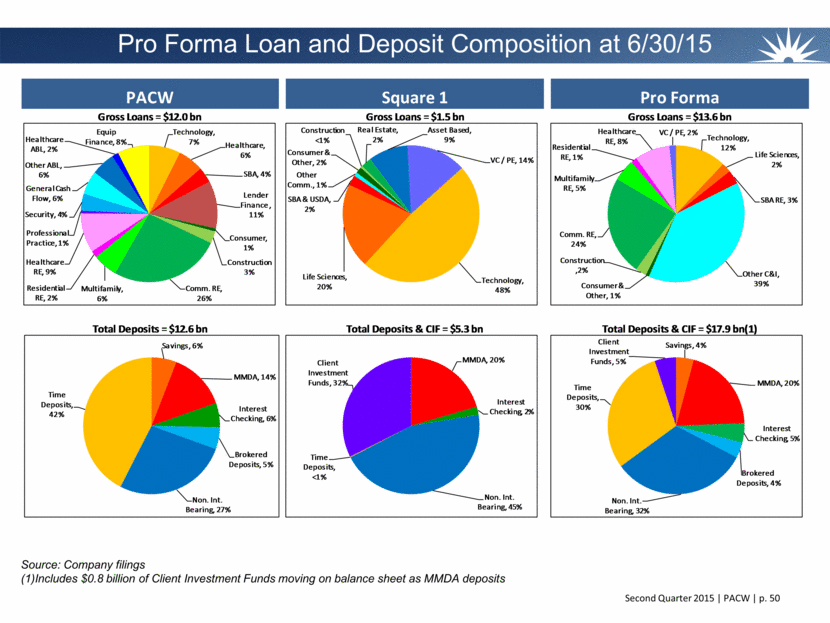
Pro Forma Loan and Deposit Composition at 6/30/15 Source: Company filings (1)Includes $0.8 billion of Client Investment Funds moving on balance sheet as MMDA deposits Total Deposits = $12.6 bn Total Deposits & CIF = $5.3 bn Total Deposits & CIF = $17.9 bn(1) PACW Square 1 Pro Forma Gross Loans = $12.0 bn Gross Loans = $1.5 bn Gross Loans = $13.6 bn Technology, 7% Healthcare, 6% SBA, 4% Lender Finance , 11% Consumer, 1% Construction 3% Comm. RE, 26% Multifamily, 6% Residential RE, 2% Healthcare RE, 9% Professional Practice, 1% Security, 4% General Cash Flow, 6% Other ABL, 6% Healthcare ABL, 2% Equip Finance, 8% Technology, 48% Life Sciences, 20% SBA & USDA, 2% Other Comm., 1% Consumer & Other, 2% Construction <1% Real Estate, 2% Asset Based, 9% VC / PE, 14% Technology, 12% Life Sciences, 2% SBA RE, 3% Other C&I, 39% Consumer & Other, 1% Construction ,2% Comm. RE, 24% Multifamily RE, 5% Residential RE, 1% Healthcare RE, 8% VC / PE, 2% Savings, 6% MMDA, 14% Interest Checking, 6% Brokered Deposits, 5% Non. Int. Bearing, 27% Time Deposits, 42% MMDA, 20% Interest Checking, 2% Non. Int. Bearing, 45% Time Deposits, <1% Client Investment Funds, 32% Savings, 4% MMDA, 20% Interest Checking, 5% Brokered Deposits, 4% Non. Int. Bearing, 32% Time Deposits, 30% Client Investment Funds, 5% |
|
|
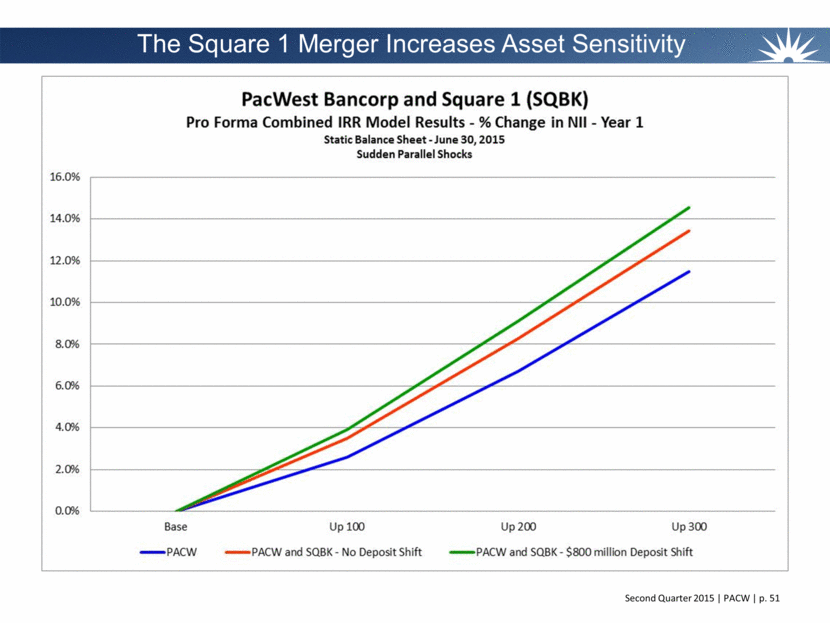
The Square 1 Merger Increases Asset Sensitivity |
|
|
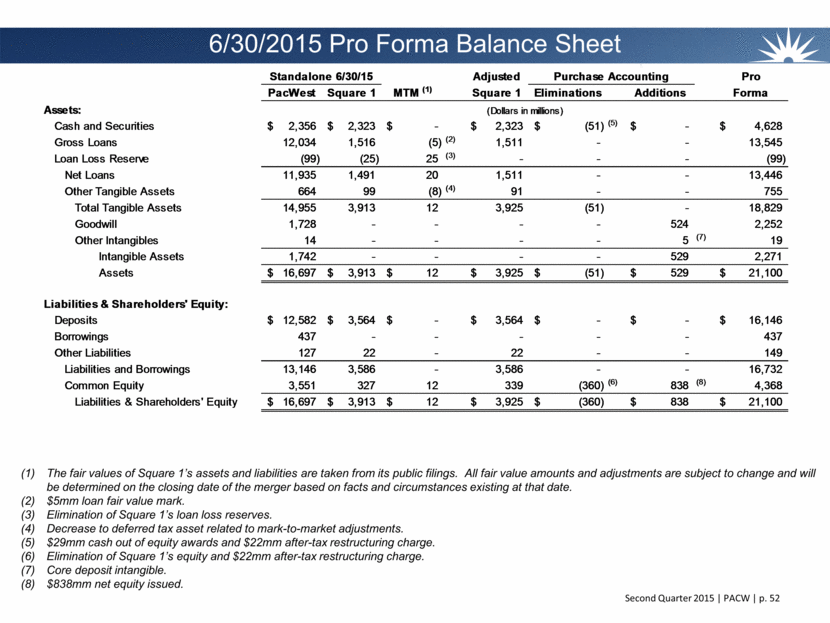
6/30/2015 Pro Forma Balance Sheet The fair values of Square 1’s assets and liabilities are taken from its public filings. All fair value amounts and adjustments are subject to change and will be determined on the closing date of the merger based on facts and circumstances existing at that date. $5mm loan fair value mark. Elimination of Square 1’s loan loss reserves. Decrease to deferred tax asset related to mark-to-market adjustments. $29mm cash out of equity awards and $22mm after-tax restructuring charge. Elimination of Square 1’s equity and $22mm after-tax restructuring charge. Core deposit intangible. $838mm net equity issued. Adjusted Pro PacWest Square 1 MTM (1) Square 1 Eliminations Additions Forma Assets: Cash and Securities 2,356 $ 2,323 $ - $ 2,323 $ (51) $ (5) - $ 4,628 $ Gross Loans 12,034 1,516 (5) (2) 1,511 - - 13,545 Loan Loss Reserve (99) (25) 25 (3) - - - (99) Net Loans 11,935 1,491 20 1,511 - - 13,446 Other Tangible Assets 664 99 (8) (4) 91 - - 755 Total Tangible Assets 14,955 3,913 12 3,925 (51) - 18,829 Goodwill 1,728 - - - - 524 2,252 Other Intangibles 14 - - - - 5 (7) 19 Intangible Assets 1,742 - - - - 529 2,271 Assets 16,697 $ 3,913 $ 12 $ 3,925 $ (51) $ 529 $ 21,100 $ Liabilities & Shareholders' Equity: Deposits 12,582 $ 3,564 $ - $ 3,564 $ - $ - $ 16,146 $ Borrowings 437 - - - - - 437 Other Liabilities 127 22 - 22 - - 149 Liabilities and Borrowings 13,146 3,586 - 3,586 - - 16,732 Common Equity 3,551 327 12 339 (360) (6) 838 (8) 4,368 Liabilities & Shareholders' Equity 16,697 $ 3,913 $ 12 $ 3,925 $ (360) $ 838 $ 21,100 $ Standalone 6/30/15 Purchase Accounting (Dollars in millions) |
|
|
Conclusion Adds a highly liquid balance sheet with a very low all-in cost of funds Estimated additional $0.8 billion pool of low-cost deposits to move on-balance sheet from Client Investment Funds Diversifies PACW’s nationwide lending platform across high growth technology, life science and venture capital business lines Portfolio with 28% compound annual growth since 2010 Established track record of strong asset quality Square 1 has an attractive profitability profile (1.14% ROAA for 2Q15) with ability for improved returns in a rising rate environment Variable rate loans comprise 91% of Square 1’s loan portfolio Non-interest bearing deposits represent 67% of total on-balance sheet deposits Enhances PACW franchise through a team of seasoned bankers with extensive expertise in lending to venture backed companies |
|
|
Strong Franchise Value |
|
|
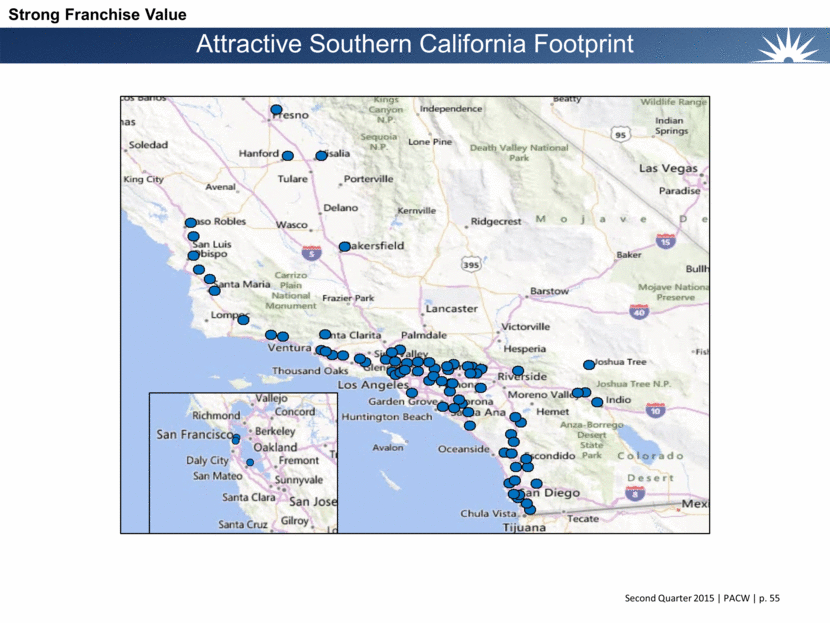
Attractive Southern California Footprint Strong Franchise Value |
|
|
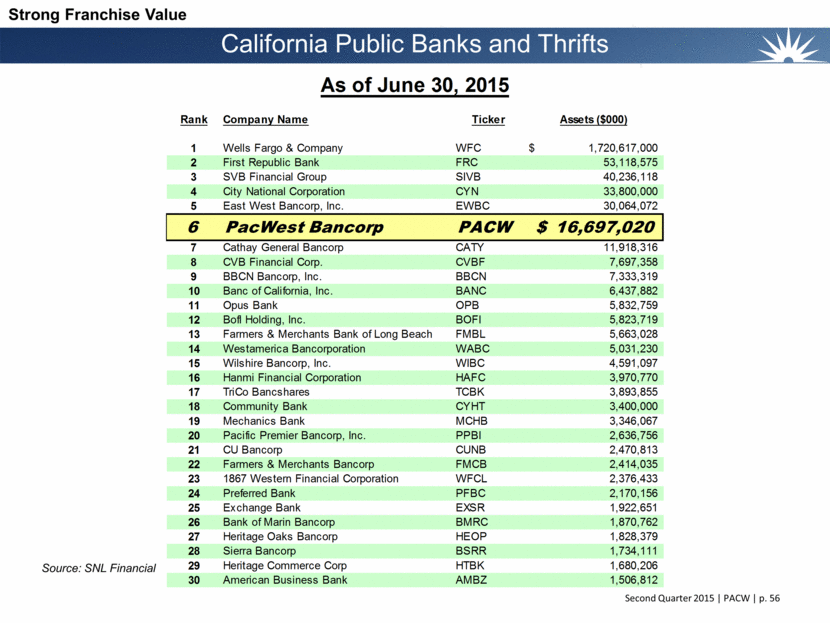
Source: SNL Financial California Public Banks and Thrifts Strong Franchise Value Rank Company Name Ticker Assets ($000) 1 Wells Fargo & Company WFC 1,720,617,000 $ 2 First Republic Bank FRC 53,118,575 3 SVB Financial Group SIVB 40,236,118 4 City National Corporation CYN 33,800,000 5 East West Bancorp, Inc. EWBC 30,064,072 6 PacWest Bancorp PACW 16,697,020 $ 7 Cathay General Bancorp CATY 11,918,316 8 CVB Financial Corp. CVBF 7,697,358 9 BBCN Bancorp, Inc. BBCN 7,333,319 10 Banc of California, Inc. BANC 6,437,882 11 Opus Bank OPB 5,832,759 12 BofI Holding, Inc. BOFI 5,823,719 13 Farmers & Merchants Bank of Long Beach FMBL 5,663,028 14 Westamerica Bancorporation WABC 5,031,230 15 Wilshire Bancorp, Inc. WIBC 4,591,097 16 Hanmi Financial Corporation HAFC 3,970,770 17 TriCo Bancshares TCBK 3,893,855 18 Community Bank CYHT 3,400,000 19 Mechanics Bank MCHB 3,346,067 20 Pacific Premier Bancorp, Inc. PPBI 2,636,756 21 CU Bancorp CUNB 2,470,813 22 Farmers & Merchants Bancorp FMCB 2,414,035 23 1867 Western Financial Corporation WFCL 2,376,433 24 Preferred Bank PFBC 2,170,156 25 Exchange Bank EXSR 1,922,651 26 Bank of Marin Bancorp BMRC 1,870,762 27 Heritage Oaks Bancorp HEOP 1,828,379 28 Sierra Bancorp BSRR 1,734,111 29 Heritage Commerce Corp HTBK 1,680,206 30 American Business Bank AMBZ 1,506,812 As of June 30, 2015 |
|
|
Non-GAAP Measurements The Company uses certain non-GAAP financial measures to provide meaningful supplemental information regarding the Company’s operational performance and to enhance investors’ overall understanding of such financial performance. These non-GAAP financial measures are presented for supplemental informational purposes only for understanding the Company’s operating results and should not be considered a substitute for financial information presented in accordance with GAAP. These non-GAAP financial measures presented by the Company may be different from non-GAAP financial measures used by other companies. The tables on the following slides present reconciliations of non-GAAP financial measurements to the GAAP financial measurements and certain key performance ratios. |
|
|
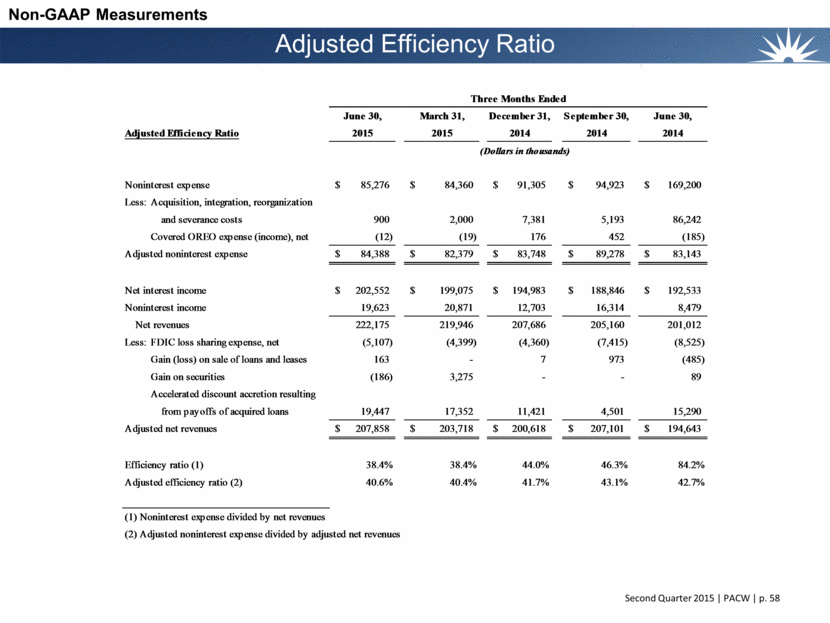
Adjusted Efficiency Ratio Non-GAAP Measurements June 30, March 31, December 31, September 30, June 30, Adjusted Efficiency Ratio 2015 2015 2014 2014 2014 (Dollars in thousands) Noninterest expense 85,276 $ 84,360 $ 91,305 $ 94,923 $ 169,200 $ Less: Acquisition, integration, reorganization and severance costs 900 2,000 7,381 5,193 86,242 Covered OREO expense (income), net (12) (19) 176 452 (185) Adjusted noninterest expense 84,388 $ 82,379 $ 83,748 $ 89,278 $ 83,143 $ Net interest income 202,552 $ 199,075 $ 194,983 $ 188,846 $ 192,533 $ Noninterest income 19,623 20,871 12,703 16,314 8,479 Net revenues 222,175 219,946 207,686 205,160 201,012 Less: FDIC loss sharing expense, net (5,107) (4,399) (4,360) (7,415) (8,525) Gain (loss) on sale of loans and leases 163 - 7 973 (485) Gain on securities (186) 3,275 - - 89 Accelerated discount accretion resulting from payoffs of acquired loans 19,447 17,352 11,421 4,501 15,290 Adjusted net revenues 207,858 $ 203,718 $ 200,618 $ 207,101 $ 194,643 $ Efficiency ratio (1) 38.4% 38.4% 44.0% 46.3% 84.2% Adjusted efficiency ratio (2) 40.6% 40.4% 41.7% 43.1% 42.7% (1) Noninterest expense divided by net revenues (2) Adjusted noninterest expense divided by adjusted net revenues Three Months Ended |
|
|
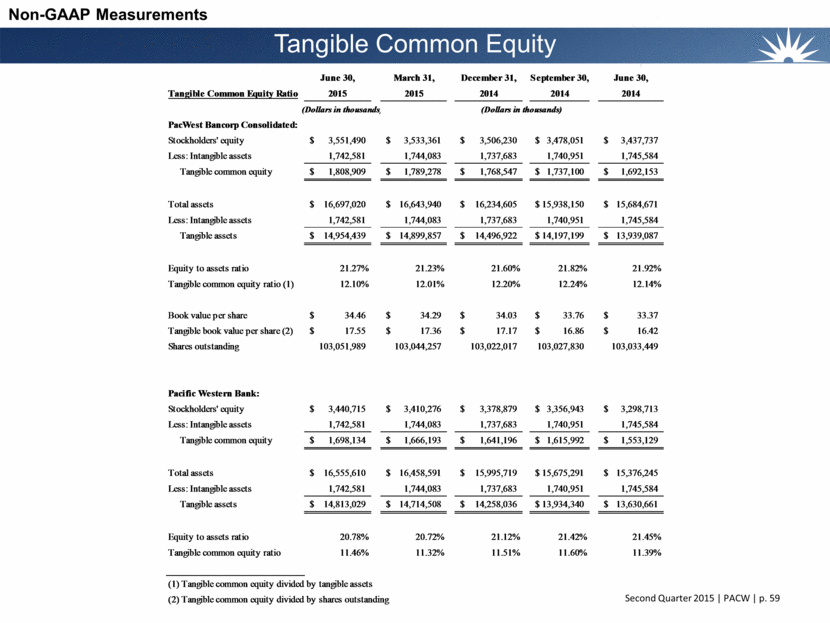
Tangible Common Equity Non-GAAP Measurements June 30, March 31, December 31, September 30, June 30, Tangible Common Equity Ratio 2015 2015 2014 2014 2014 (Dollars in thousands) (Dollars in thousands) PacWest Bancorp Consolidated: Stockholders' equity 3,551,490 $ 3,533,361 $ 3,506,230 $ 3,478,051 $ 3,437,737 $ Less: Intangible assets 1,742,581 1,744,083 1,737,683 1,740,951 1,745,584 Tangible common equity 1,808,909 $ 1,789,278 $ 1,768,547 $ 1,737,100 $ 1,692,153 $ Total assets 16,697,020 $ 16,643,940 $ 16,234,605 $ 15,938,150 $ 15,684,671 $ Less: Intangible assets 1,742,581 1,744,083 1,737,683 1,740,951 1,745,584 Tangible assets 14,954,439 $ 14,899,857 $ 14,496,922 $ 14,197,199 $ 13,939,087 $ Equity to assets ratio 21.27% 21.23% 21.60% 21.82% 21.92% Tangible common equity ratio (1) 12.10% 12.01% 12.20% 12.24% 12.14% Book value per share 34.46 $ 34.29 $ 34.03 $ 33.76 $ 33.37 $ Tangible book value per share (2) 17.55 $ 17.36 $ 17.17 $ 16.86 $ 16.42 $ Shares outstanding 103,051,989 103,044,257 103,022,017 103,027,830 103,033,449 Pacific Western Bank: Stockholders' equity 3,440,715 $ 3,410,276 $ 3,378,879 $ 3,356,943 $ 3,298,713 $ Less: Intangible assets 1,742,581 1,744,083 1,737,683 1,740,951 1,745,584 Tangible common equity 1,698,134 $ 1,666,193 $ 1,641,196 $ 1,615,992 $ 1,553,129 $ Total assets 16,555,610 $ 16,458,591 $ 15,995,719 $ 15,675,291 $ 15,376,245 $ Less: Intangible assets 1,742,581 1,744,083 1,737,683 1,740,951 1,745,584 Tangible assets 14,813,029 $ 14,714,508 $ 14,258,036 $ 13,934,340 $ 13,630,661 $ Equity to assets ratio 20.78% 20.72% 21.12% 21.42% 21.45% Tangible common equity ratio 11.46% 11.32% 11.51% 11.60% 11.39% (1) Tangible common equity divided by tangible assets (2) Tangible common equity divided by shares outstanding |
|
|
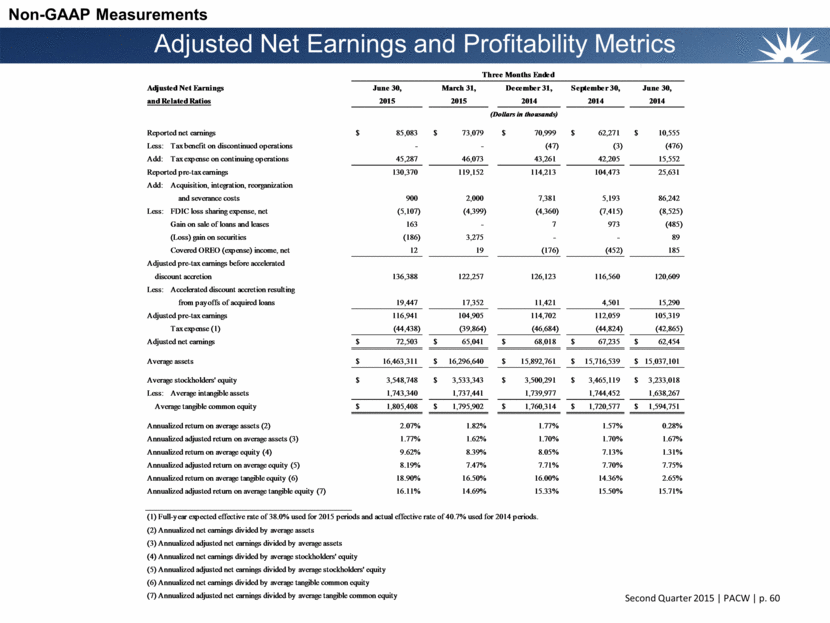
Adjusted Net Earnings and Profitability Metrics Non-GAAP Measurements Adjusted Net Earnings June 30, March 31, December 31, September 30, June 30, and Related Ratios 2015 2015 2014 2014 2014 (Dollars in thousands) Reported net earnings 85,083 $ 73,079 $ 70,999 $ 62,271 $ 10,555 $ Less: Tax benefit on discontinued operations - - (47) (3) (476) Add: Tax expense on continuing operations 45,287 46,073 43,261 42,205 15,552 Reported pre-tax earnings 130,370 119,152 114,213 104,473 25,631 Add: Acquisition, integration, reorganization and severance costs 900 2,000 7,381 5,193 86,242 Less: FDIC loss sharing expense, net (5,107) (4,399) (4,360) (7,415) (8,525) Gain on sale of loans and leases 163 - 7 973 (485) (Loss) gain on securities (186) 3,275 - - 89 Covered OREO (expense) income, net 12 19 (176) (452) 185 Adjusted pre-tax earnings before accelerated discount accretion 136,388 122,257 126,123 116,560 120,609 Less: Accelerated discount accretion resulting from payoffs of acquired loans 19,447 17,352 11,421 4,501 15,290 Adjusted pre-tax earnings 116,941 104,905 114,702 112,059 105,319 Tax expense (1) (44,438) (39,864) (46,684) (44,824) (42,865) Adjusted net earnings 72,503 $ 65,041 $ 68,018 $ 67,235 $ 62,454 $ Average assets 16,463,311 $ 16,296,640 $ 15,892,761 $ 15,716,539 $ 15,037,101 $ Average stockholders' equity 3,548,748 $ 3,533,343 $ 3,500,291 $ 3,465,119 $ 3,233,018 $ Less: Average intangible assets 1,743,340 1,737,441 1,739,977 1,744,452 1,638,267 Average tangible common equity 1,805,408 $ 1,795,902 $ 1,760,314 $ 1,720,577 $ 1,594,751 $ Annualized return on average assets (2) 2.07% 1.82% 1.77% 1.57% 0.28% Annualized adjusted return on average assets (3) 1.77% 1.62% 1.70% 1.70% 1.67% Annualized return on average equity (4) 9.62% 8.39% 8.05% 7.13% 1.31% Annualized adjusted return on average equity (5) 8.19% 7.47% 7.71% 7.70% 7.75% Annualized return on average tangible equity (6) 18.90% 16.50% 16.00% 14.36% 2.65% Annualized adjusted return on average tangible equity (7) 16.11% 14.69% 15.33% 15.50% 15.71% (1) Full-year expected effective rate of 38.0% used for 2015 periods and actual effective rate of 40.7% used for 2014 periods. (2) Annualized net earnings divided by average assets (3) Annualized adjusted net earnings divided by average assets (4) Annualized net earnings divided by average stockholders' equity (5) Annualized adjusted net earnings divided by average stockholders' equity (6) Annualized net earnings divided by average tangible common equity (7) Annualized adjusted net earnings divided by average tangible common equity Three Months Ended |
|
|
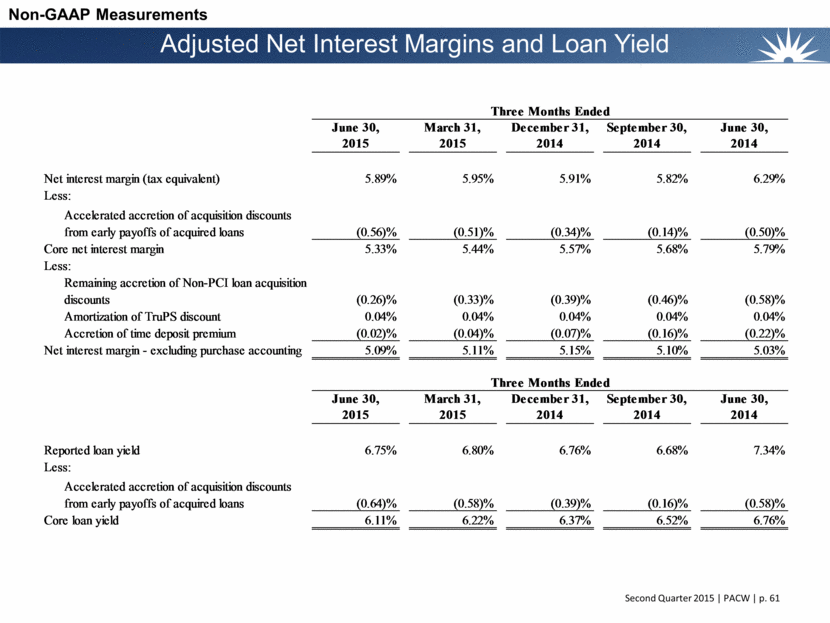
Adjusted Net Interest Margins and Loan Yield Non-GAAP Measurements June 30, 2015 March 31, 2015 December 31, 2014 September 30, 2014 June 30, 2014 Net interest margin (tax equivalent) 5.89% 5.95% 5.91% 5.82% 6.29% Less: Accelerated accretion of acquisition discounts from early payoffs of acquired loans (0.56)% (0.51)% (0.34)% (0.14)% (0.50)% Core net interest margin 5.33% 5.44% 5.57% 5.68% 5.79% Less: Remaining accretion of Non-PCI loan acquisition discounts (0.26)% (0.33)% (0.39)% (0.46)% (0.58)% Amortization of TruPS discount 0.04% 0.04% 0.04% 0.04% 0.04% Accretion of time deposit premium (0.02)% (0.04)% (0.07)% (0.16)% (0.22)% Net interest margin - excluding purchase accounting 5.09% 5.11% 5.15% 5.10% 5.03% June 30, 2015 March 31, 2015 December 31, 2014 September 30, 2014 June 30, 2014 Reported loan yield 6.75% 6.80% 6.76% 6.68% 7.34% Less: Accelerated accretion of acquisition discounts from early payoffs of acquired loans (0.64)% (0.58)% (0.39)% (0.16)% (0.58)% Core loan yield 6.11% 6.22% 6.37% 6.52% 6.76% Three Months Ended Three Months Ended |

