Attached files
| file | filename |
|---|---|
| EX-32.2 - EXHIBIT 32.2 - FRISCHS RESTAURANTS INC | v415301_ex32-2.htm |
| EX-31.1 - EXHIBIT 31.1 - FRISCHS RESTAURANTS INC | v415301_ex31-1.htm |
| EX-21 - EXHIBIT 21 - FRISCHS RESTAURANTS INC | v415301_ex21.htm |
| EX-32.1 - EXHIBIT 32.1 - FRISCHS RESTAURANTS INC | v415301_ex32-1.htm |
| EX-23 - EXHIBIT 23 - FRISCHS RESTAURANTS INC | v415301_ex23.htm |
| EX-31.2 - EXHIBIT 31.2 - FRISCHS RESTAURANTS INC | v415301_ex31-2.htm |
UNITED STATES
SECURITIES AND EXCHANGE COMMISSION
Washington, D.C. 20549
FORM 10-K
x ANNUAL REPORT PURSUANT TO SECTION 13 OR 15(d) OF THE SECURITIES EXCHANGE ACT OF 1934
For the
fiscal year ended June 2, 2015
or
¨ TRANSITION REPORT PURSUANT TO SECTION 13 OR 15(d) OF THE SECURITIES EXCHANGE ACT OF 1934
Commission file number 001-07323
FRISCH’S RESTAURANTS, INC.
(Exact name of registrant as specified in its charter)
| State of Ohio | 31-0523213 | |
| (State or other jurisdiction of incorporation or organization) | (IRS Employer Identification Number) |
2800 Gilbert Avenue
Cincinnati, Ohio 45206
(Address of principal executive offices)
513-961-2660
(Registrant’s telephone number, including area code)
Securities registered pursuant to Section 12(b) of the Act:
| Title of each class | Name of each Exchange on which registered | |
| Common Stock of No Par Value | NYSE MKT |
Securities registered pursuant to Section 12(g) of the Act: None
Indicate by check mark if the registrant is a well-known seasoned issuer, as defined in Rule 405 of the Securities Act.
Yes ¨ No x
Indicate by check mark if the registrant is not required to file reports pursuant to Section 13 or Section 15(d) of the Act.
Yes ¨ No x
Indicate by check mark whether the registrant (1) has filed all reports required to be filed by Section 13 or 15(d) of the Securities Exchange Act of 1934 during the preceding 12 months (or for such shorter period that the registrant was required to file such reports), and (2) has been subject to such filing requirements for the past 90 days.
Yes x No ¨
Indicate by check mark whether the registrant has submitted electronically and posted on its corporate Web site, if any, every Interactive Data File required to be submitted and posted pursuant to Rule 405 of Regulation S-T (Section 232.405 of this chapter) during the preceding 12 months (or for such shorter period that the registrant was required to submit and post such files).
Yes x No ¨
Indicate by check mark if disclosure of delinquent filers pursuant to Item 405 of Regulation S-K (Section 229.405 of this chapter) is not contained herein, and will not be contained, to the best of registrant’s knowledge, in definitive proxy or information statements incorporated by reference in Part III of this Form 10-K or any amendment to this Form 10-K.
x
Indicate by check mark whether the registrant is a large accelerated filer, an accelerated filer, a non-accelerated filer, or a smaller reporting company. See the definitions of “large accelerated filer,” “accelerated filer” and “smaller reporting company” in Rule 12b-2 of the Exchange Act.
| Large accelerated filer ¨ | Accelerated filer x | |
| Non-accelerated filer ¨ (Do not check if a smaller reporting company) | Smaller reporting company ¨ |
Indicate by check mark whether the registrant is a shell company (as defined in Rule 12b-2 of the Exchange Act).
Yes ¨ No x
The aggregate market value of voting common stock held by non-affiliates of the registrant on December 16, 2014 (the last business day of the registrant’s most recently completed second fiscal quarter) was approximately $106,744,052, based upon the closing sales price of the registrant’s common stock as reported on NYSE MKT on that date. The registrant does not have any non-voting common equity.
As of July 28, 2015, there were 5,131,579 shares of registrant’s common stock outstanding.
DOCUMENTS INCORPORATED BY REFERENCE
None
TABLE OF CONTENTS
Cautionary Statement Regarding Forward-Looking Information
Forward-looking statements are contained throughout this Annual Report on Form 10-K. Such statements may generally express management’s expectations with respect to its plans, goals and projections, or its current assumptions and beliefs concerning future developments and their potential effect on the Company. There can be no assurances that such expectations will be met or that future developments will not conflict with management’s current beliefs and assumptions, which are inherently subject to numerous risks and the development of other uncertainties. Factors that could cause actual results and performance to differ materially from anticipated results that may be expressed or implied in forward-looking statements are included in, but not limited to, the discussion in this Form 10-K under Part I, Item 1A. “Risk Factors,” Risk factors and other uncertainties may also be discussed from time to time in the Company’s news releases, public statements or in other reports that the Company files with the Securities and Exchange Commission.
Sentences that contain words such as “should,” “would,” “could,” “may,” “plan(s),” “anticipate(s),” “project(s),” “believe(s),” “will,” “expect(s),” “estimate(s),” “intend(s),” “continue(s),” “assumption(s),” “goal(s),” “target” and similar words (or derivatives thereof) are generally used to distinguish forward-looking statements from statements pertaining to historical or present facts.
All forward looking statements in this Form 10-K are provided by the Company pursuant to the safe harbor established under the Private Securities Litigation Reform Act of 1995. Such forward looking information should be evaluated in the context of all of the Company's risk factors, which readers should review carefully and not place undue reliance on management's forward looking statements. Except as may be required by law, the Company disclaims any obligation to update any of the forward-looking statements that may be contained throughout this Form 10-K.
References to fiscal years used in this Form 10-K
In this Annual Report on Form 10-K, the Company’s fiscal year that ended June 2, 2015 may be referred to as Fiscal Year 2015. The Company’s fiscal year is the 52 week (364 days) or 53 week (371 days) period ending on the Tuesday nearest to the last day of the month of May. Fiscal Year 2015 consists of 52 weeks which began on June 4, 2014 and ended on Tuesday, June 2, 2015.
Also in this Annual Report on Form 10-K, the Company’s fiscal years that ended June 3, 2014, May 28, 2013, May 29, 2012, and May 31, 2011 may be referred to as Fiscal Years 2014, 2013, 2012 and 2011, respectively. All of these, except for Fiscal Year 2014, years consisted of 52 weeks. Fiscal Year 2014 consisted of 53 weeks which began on May 29, 2013 and ended on Tuesday, June 3, 2014. References to Fiscal Year 2016 refer to the 52 week year that began on June 3, 2015, which will end on Tuesday, May 31, 2016.
With the exception of Fiscal Year 2014, the first quarter of each fiscal year presented herein contained 16 weeks while the last three quarters contained 12 weeks. The fourth quarter of Fiscal Year 2014 contained 13 weeks, which occurs normally every six years.
1
(Items 1 through 4)
Background
Frisch’s Restaurants, Inc. (together with its wholly owned subsidiaries, referred to as the “Company” or the “Registrant”), is a regional company that operates full service family-style restaurants under the name “Frisch’s Big Boy.” Frisch’s Big Boy restaurants operated by the Company during the last five years have been located entirely in various regions of Ohio, Kentucky and Indiana.
Incorporated in the state of Ohio in 1947, the Company’s stock has been publicly traded since 1960, and currently trades on the NYSE MKT. The Company’s executive offices are located at 2800 Gilbert Avenue, Cincinnati, Ohio 45206. The telephone number is (513) 961-2660. The Company’s web site is www.frischs.com.
As of June 2, 2015, the Company operated 95 Frisch's Big Boy restaurants. Additionally, the Company licensed the rights to operate 26 Frisch's Big Boy restaurants to other operators. All of the restaurants licensed to other operators are located in various markets within the states of Ohio, Kentucky and Indiana.
The Company owns the trademark “Frisch’s.” The rights to the “Big Boy” trademark, trade name and service mark are exclusively and irrevocably owned by the Company for use in the states of Kentucky and Indiana, and in most of Ohio and Tennessee.
Recent Development – Merger Agreement
On May 21, 2015, the Company entered into an Agreement and Plan of Merger with FRI Holding Company, LLC and FRI Merger Sub, LLC. The merger agreement was unanimously approved by the Company’s board of directors (the Board) also on that date. Under the terms of the agreement, as disclosed in the Company’s Current Report on Form 8-K on May 22, 2015, if the merger is consummated, each outstanding share of Frisch’s Common Stock will be converted into the right to receive $34.00 per share, in cash, without interest. The consummation of the merger is subject to customary closing conditions, including the approval of Frisch’s stockholders. The merger is expected to close in the first quarter of Fiscal Year 2016, at which time, the Company will cease being an Independent Public Company and no longer be traded on the NYSE MKT or required to file periodic reports with the Securities and Exchange Commission (SEC). Both FRI Holding Company, LLC and FRI Merger Sub, LLC. are wholly owned subsidiaries of NRD Partners I, L.P.
Frisch's Big Boy Restaurants
Frisch's Big Boy restaurants are full service family-style restaurants that offer quick service in an inviting atmosphere with genuine Midwestern hospitality. All of the restaurants offer “drive-thru” service. The restaurants are generally open seven days a week, typically from 7:00 a.m. to 11:00 p.m. with extended weekend evening hours. Standardized menus offer a wide variety of items at moderate prices, featuring well-known signature items such as the original “Big Boy” double-deck hamburger sandwich, freshly made onion rings and hot fudge cake for dessert. Burgers, such as the original “Big Boy”, the Swiss Miss or Brawny Lad are made with fresh, never frozen 100 percent ground beef. Other menu selections include many sandwiches, pasta, roast beef, chicken and seafood dinners, complemented by salads topped with homemade dressings, popular side dishes and a variety of well-liked desserts, non-alcoholic beverages and many other items. The Company works continually to develop new products. In Fiscal Year 2015, the Company introduced three new “Big Dinner” meals available after 4 p.m. Customers may choose from Hand Breaded Chicken Breast Fillets, Boston Scrod or Grilled Chicken Alfredo dinners. In addition, a full breakfast menu is offered, and all of the restaurants utilize breakfast bars that are converted easily to soup and salad bars for lunch and dinner hours.
2
Drive-thru and carryout menus emphasize combo meals that consist of a popular sandwich packaged with either French fries or onion rings and a beverage and are sold at lower prices than if purchased separately. In late Fiscal Year 2013, breakfast combo meals were added to the drive-thru menu. Breakfast combo meals offer breakfast sandwiches, breakfast burritos and other offerings paired with spicy spuds and customer’s choice of coffee or a soft drink. In Fiscal Year 2015, the Breakfast Combo Meal program was expanded to include a new crispy chicken breakfast biscuit.
The menu also has quality offerings for the health conscious customer, such as the soup and salad bar, a selection of wraps, seasonal fresh fruit smoothies and a section of the menu features smaller portions. All fried foods are fried only in trans fat-free shortening. In addition, customers may order customized servings to meet their dietary concerns. For example, the company offers gluten-free alternatives and sandwiches can be ordered without the usual dressing of cheese and tartar sauce.
The operations of the Company are vertically integrated. A commissary and food manufacturing plant manufactures and prepares foods, and stocks food and beverages, paper products and other supplies for distribution to all of the Company's restaurants. Raw materials, consisting principally of food items, are generally plentiful and may be obtained from any number of reliable suppliers. Quality and price are the principal determinants of source. Most companies in the restaurant industry do not operate commissaries or food manufacturing plants, choosing instead to purchase directly from outside sources. Management believes that restaurant operations benefit from centralized purchasing and food preparation through the commissary operation, which ensures uniform product quality, timeliness of distribution (two to three deliveries per week) to restaurants and ultimately results in lower food and supply costs.
Substantially all licensed Frisch's Big Boy restaurants regularly purchase products from the commissary. Sales of commissary products to restaurants licensed to other operators were $10.8 million in Fiscal Year 2015 (5.1 percent of consolidated sales), $9.9 million in Fiscal Year 2014 (4.7 percent of consolidated sales) and $9.5 million in Fiscal Year 2013 (4.7 percent of consolidated sales).
Television and radio are the primary media to carry and promote Frisch's Big Boy’s key messages. Television conveys the visual message with food photography, while radio provides a cost effective means to promote limited time offered menu items. Outdoor billboards and targeted on-line advertising are used to complement the media plan, primarily to introduce and promote new menu items. The Company also utilizes social media as a means to develop two-way communication directly with the customer. Targeted social media communities are a cost effective way to reach a wide range of customers, but are a particularly important means to promote limited time offerings and to engage younger audiences. The marketing strategy does not include discounting to increase customer traffic.
In recent years, the Frisch's Big Boy marketing strategy has evolved from “What's Your Favorite Thing?” to a tag free advertising message. This evolution has refocused marketing campaigns away from a primary emphasis on signature menu items toward other offerings to bring awareness to Frisch's Big Boy's broad menu, along with limited time offerings. However, signature menu items continue to be promoted through television commercials that are broadcast on local network affiliates and local cable programming. Television is also used to promote drive thru availability and speed, as well as dining experience with service.
The Company currently expends for advertising an amount equal to 2.5 percent of gross sales from its restaurant operations, plus fees paid into an advertising fund by restaurants licensed to other operators.
Designed with longevity in mind while also appealing to younger customers, newly constructed Frisch's Big Boy restaurants are marked with bold colors and bright environments, featuring sleek lines, cherry colored paneling and wood trim, customized glass wall partitions, accented with abundant natural light and company memorabilia covering much of the wall space. The cost to build and equip a full service Frisch's Big Boy restaurant has ranged from $2,250,000 to $3,825,000. The cost depends greatly on the costs of land and land improvements, both of which can vary widely from location to location, and whether the land is purchased or leased. Costs also depend on whether the new restaurant is constructed using basic plans for the original 2001 building prototype (5,700 square feet with seating for 172 guests) or its smaller adaptation, the 2010 building prototype (5,000 square feet with seating for 148 guests), which is used in smaller trade areas.
3
As part of the Company’s continuing commitment to serve customers in clean, pleasant surroundings, the Company renovates approximately one-fifth of its Frisch's Big Boy restaurants each year. The renovations are designed to not only refresh and upgrade the interior finishes, but also to synchronize the interiors and exteriors of older restaurants with that of newly constructed restaurants. Depending on age and a variety of other factors, the current cost to renovate a restaurant ranges from $90,000 to $235,000. The restaurants are not closed for business when being remodeled; all work is completed after normal operating hours.
In addition, certain high-volume restaurants are regularly evaluated to determine a) whether their kitchens should be redesigned for increased efficiencies (which may cost up to $150,000) and b) if an expansion of the dining room (which may cost $800,000 or more) is warranted.
The following tabulation recaps owned and operated Frisch's Big Boy restaurant openings and closings over the five most recent fiscal years:
| Fiscal Year | ||||||||||||||||||||
| 2015 | 2014 | 2013 | 2012 | 2011 | ||||||||||||||||
| Restaurants Owned and Operated by the Company | ||||||||||||||||||||
| Beginning of Year | 96 | 95 | 93 | 95 | 91 | |||||||||||||||
| Opened | — | 1 | 2 | 1 | 4 | |||||||||||||||
| Opened Replacement building | — | — | — | 1 | — | |||||||||||||||
| Closed to make way for new building | — | — | — | (1 | ) | — | ||||||||||||||
| Closed | (1 | ) | — | — | (3 | ) | — | |||||||||||||
| End of Year | 95 | 96 | 95 | 93 | 95 | |||||||||||||||
No new Frisch’s Big Boy restaurants were opened in Fiscal Year 2015 and no new location construction was in progress as of June 2, 2015. One older restaurant in Columbus, Ohio was closed in early July 2014 (the first quarter of Fiscal Year 2015).
The following tabulation recaps openings and closings for Frisch's Big Boy restaurants that are licensed to other operators over the five most recent fiscal years:
| Fiscal Year | ||||||||||||||||||||
| 2015 | 2014 | 2013 | 2012 | 2011 | ||||||||||||||||
| Frisch's Big Boy Restaurants Licensed to Others | ||||||||||||||||||||
| Beginning of Year - Licensed to Others | 25 | 25 | 25 | 25 | 25 | |||||||||||||||
| Opened | 1 | — | — | — | — | |||||||||||||||
| Closed | — | — | — | — | — | |||||||||||||||
| End of Year - Licensed to Others | 26 | 25 | 25 | 25 | 25 | |||||||||||||||
In August 2014 (the first quarter of Fiscal Year 2015), one new Franchisee location was opened in Ironton, Ohio. No Franchisee locations were closed during Fiscal Year 2015.
4
Franchise fees are charged to licensees for use of trademarks and trade names, and licensees are required to make contributions to the Company’s general advertising account. These fees and contributions are calculated principally on percentages of sales. Total franchise and other service fee revenue earned by the Company from licensees was $1.3 million in Fiscal Year 2015 and Fiscal Year 2014 and $1.2 million in Fiscal Year 2013. Other service fees from licensees include revenue from accounting and payroll services that four of the licensed restaurants purchased from the Company in each of the last three fiscal years.
The license agreements with licensees are not uniform, but most of the licenses for individually licensed restaurants that were in effect as of June 2, 2015 are covered by agreements containing the following provisions:
| 1. | The Company grants to the Licensee the right to use the name “Frisch” and/or “Frisch’s,” “Big Boy” and related trademarks and trade names in connection with the operation of a food and restaurant business, in return for which the Licensee pays a monthly license fee equal to 3.75 percent of its gross sales. In addition, an initial license fee of $30,000 is generally required in exchange for the granting of a license for a new Frisch's Big Boy restaurant. |
| 2. | The Company provides local and regional advertising through publications, radio, television, etc., in return for which the Licensee pays a monthly fee equal to 2.5 percent of its gross sales. |
In addition, Licensees are required to conduct business on a high scale, in an efficient manner, with cleanliness and good service, all to the complete satisfaction of the Company. Licensees are required to serve only quality foods and must comply with all food, sanitation and other regulations.
Long standing area license agreements granted to other operators in northern Indiana and northwestern Ohio differ in various ways from license agreements covering individual restaurants. The most notable differences are significantly lower license and advertising fee percentages and lower initial fees paid by the area operators. Provisions for these lower fees have been perpetually in place since the 1950s.
Human Resources
The Company provides equal opportunity employment without regard to age, race, religion, color, sex, national origin, disability, veteran status or any other legally protected class. The Company’s equal opportunity employment policy provides and maintains a work environment that is free from all forms of illegal discrimination including sexual harassment. The philosophy of the policy stresses the need to train and to promote the person who becomes the most qualified individual to do a particular job. The Company is committed to promoting “Diversity” in the workplace in order to enhance its equal opportunity employment policy.
The Company remains committed to providing employees with the best training possible, as management believes that investing in people is a strategic advantage. Comprehensive recruiting and training programs are designed to maintain the food and service quality necessary to achieve the Company’s goals for operating results. A management recruiting staff is maintained at the Company’s headquarters. Corporate training centers for new restaurant managers are operated in Cincinnati, Ohio and Covington, Kentucky. The training includes both classroom instruction and on-the-job training. A full time recruiter is on staff to attract high quality hourly-paid restaurant workers.
The Company’s incentive-based compensation program for restaurant managers, area supervisors and regional directors (collectively, members of the operations management team) ties compensation of the members of the operations management team directly to the cash flows of their restaurant(s), which allows incentive compensation to be earned consistently. The incentive compensation that the members of the operations management team can earn under the program is at a level the Company believes is above the average for competing restaurant concepts. The Company believes the program maintains turnover in operations management at the lowest possible level, and has resulted in a strong operations management team that focuses on building same store sales and margins.
Employee selection software helps lower hourly employee turnover rates; an employee validation website is in place that measures employee job satisfaction; and an interactive employee training program utilizes training videos and quizzes. These digital videos are loaded directly onto the hard drive of a computer located at each restaurant that is networked to the point-of-sale system, allowing headquarters to access the interactive results.
5
Information Technology
Each of the Company’s restaurants is managed through standardized operating and control systems anchored by a point-of-sale (POS) system that allows management to instantly accumulate and utilize data for more effective decision making, while allowing restaurant managers to spend more time in the dining room focusing on the needs of customers. The system generates the guest check and provides functionality for settling the customer’s check using cash, credit or debit card, or gift card. The system provides a record of all items sold, the service time, and the server responsible for the customer. Employee time keeping is also kept on the POS system. Back office functionality provides employee scheduling, inventory control, sales forecasting, product ordering and many other management reports. Security measures include biometric sign-on devices to access the POS system. The system meets the latest security requirements of the Payment Card Industry (PCI). In Fiscal Year 2015, the Company purchased and implemented new credit card signature capture devices at a cost of $316,000 that are Europay, Mastercard, and Visa (EMV) capable and meet the revised PCI 3.0 compliance levels. In addition, the Company is in the process of installing state-of-the-art firewall/routers equipped with intelligent switches at both the corporate and store level at an expected cost of $211,000. The Company has received its attestations of PCI compliance in each of the last three years. A finding of non-compliance could restrict the Company’s privileges to accept credit cards as a form of payment. A $2,000,000 four year plan to replace POS register equipment in all Frisch's Big Boy restaurants began in August 2012. As of June 2, 2015, new POS equipment had been installed in 75 Frisch's Big Boy restaurants, including 35 in Fiscal Year 2015. Twenty three more are currently scheduled for installation in Fiscal Year 2016 (the fourth and final year of the plan).
In addition to electronic signature capture devices that process debit and credit card transactions, other paperless systems in Frisch's Big Boy restaurants include a) employee payroll advices that can be either emailed directly to the employee or provided electronically to each restaurant where the employees may print them on demand if desired, b) signatures have been captured on key employment documents such as I-9s, Forms W-4 and acknowledgments regarding employee handbooks, c) an on-line employment application is on the Company’s corporate web site (www.frischs.com) that provides direct feeds into the POS system and the enterprise reporting system at headquarters, and d) a portal/dashboard, accessed centrally on corporate information systems, provides "actionable" information to restaurant operations, with "critical" information presented graphically.
Standardized operating and control systems also include an automated drive-thru timer system in all Frisch's Big Boy restaurants that measures the time from when a customer’s car first enters the drive-thru station until the order is received and the customer exits the drive-thru. This information is provided to the restaurant manager in a real time environment, which reduces the amount of time required to serve customers. To replenish restaurant inventories, a “suggested order” automated system analyzes current inventory balances and sales patterns and then “suggests” a replenishment order from the commissary operation. This process optimizes in-store inventory levels, which results in better control over food costs, identifies waste and improves food quality.
To enhance the customer's experience while visiting the drive-thru, a program was launched in Fiscal Year 2014 to fit each restaurant with an order confirmation board, replete with a sleek, custom built canopy to protect the customer from the elements of the weather, The order confirmation boards ensure that all drive-thru orders are filled accurately with the speed of service the customer expects. The project was completed during Fiscal Year 2015.
An enterprise reporting system supports the Company’s information needs including accounting, inventory control, procurement, processing of payroll and accounts payable, human resources records and other record keeping. A secondary data storage appliance with supporting hardware and a virtual server are in place as part of an off-site storage area network (SAN). The SAN performs near real time replication of all data in the production environment, which allows for quick start-up of the disaster recovery environment should it be necessary to call it into service.
6
Raw Materials
The sources and availability of food and supplies are discussed above under the caption "Frisch's Big Boy Restaurants". Other significant components used in food processing include equipment for cooking and preparing food, refrigeration and storage equipment and various other fixtures. The Company currently purchases the majority of its restaurant equipment from a single vendor. Other reliable restaurant equipment suppliers are available should the Company choose to replace this vendor, and in fact, a variety of other vendors are used to supply the balance of equipment purchased. In addition, the Company has not experienced any significant disruptions in the supply of raw materials, equipment components used in food processing and there have been no shortages in electricity and natural gas used in restaurant operations in recent years.
Trademarks and Service Marks
The Company has registered certain trademarks and service marks on the Principal Register of the United States Patent and Trademark Office, including “Frisch’s” and the tag line “What’s Your Favorite Thing?” Other registrations include, but are not limited to, “Brawny Lad,” “Buddie Boy,” “Just Right Favorites,” “Pie Baby,” “Fire & Ice,” “Frisch-ly Made,” “Bundle of Joy,” and “Tiers of Joy.” All of these registrations are considered important to the operations of Frisch's Big Boy restaurants, especially the primary mark “Frisch’s”. The duration of each registration varies, depending upon when registration was first obtained. The Company currently intends to renew all of its trademarks and service marks when each comes up for renewal.
Pursuant to a 2001 agreement with Big Boy Restaurants International, LLC, the Company acquired limited ownership rights and a right to use the “Big Boy” trademarks and service marks within the states of Indiana and Kentucky and in most of Ohio and Tennessee. A concurrent use registration was issued October 6, 2009 on the Principal Register of the United States Patent and Trademark Office, confirming these exclusive “Big Boy” rights.
The Company is not aware of any infringements on its federally registered trademarks and service marks or its other trademarks, nor is the Company aware of any infringement on any of its territorial rights to use the proprietary marks that are owned by or licensed to the Company.
Seasonality
The Company’s business is moderately seasonal, with the third quarter of the fiscal year (mid-December through early March) normally accounting for a smaller share of annual revenues. Additionally, severe winter weather can have a marked negative impact upon revenue during the third quarter. Occupancy and other fixed operating costs have a greater negative impact on operating results during any quarter that may experience lower sales. Results for any quarter should not be regarded as indicative of the year as a whole, especially the first quarter, which contains 16 weeks. Each of the last three quarters normally contains 12 weeks. The fourth quarter of Fiscal Year 2014 contained a 13th week that was necessary to complete the 53 week accounting year.
Working Capital
Restaurant sales provide the Company’s principal source of cash. Funds from restaurant operations are immediately available to meet the Company’s working capital needs, as substantially all sales from restaurant operations are settled in cash or cash equivalents such as debit and credit cards. Other sources of cash may include borrowing against credit lines, proceeds from stock options exercised and occasional sales of real estate.
The Company uses its positive cash flows for debt service, capital spending (restaurant expansion and remodeling costs), capital stock repurchases and cash dividends.
As there is no need to maintain significant levels of inventories, and accounts receivable are minimal in nature, the Company has historically maintained a strategic negative working capital position, which is not uncommon in the restaurant industry. The working capital deficit was $965,000 as of June 2, 2015. As significant, predictable cash flows are provided by restaurant operations, the deployment of a negative working capital strategy has not hindered the Company’s ability to satisfactorily retire any of its obligations when due. Additionally, a working capital revolving line of credit is readily accessible if needed. However, its availability will expire with the close of the Merger transaction.
7
Customers
Because all of the Company’s retail sales are derived from food sales to the general public, there is no material dependence upon a single customer or any group of a few customers.
Competition
The restaurant industry is highly competitive and many of the Company’s competitors are substantially larger and possess greater financial resources than does the Company. The Company's restaurants have numerous competitors, including national chains, regional and local chains, as well as independent operators. None of these competitors, in the opinion of the Company's management, is dominant in the family-style sector of the restaurant industry. In addition, competition continues to increase from non-traditional competitors such as supermarkets that not only offer home meal replacement but also have in-store dining space, trends that continue to grow in popularity.
The principal methods of competition in the restaurant industry are brand name recognition and advertising; menu selection and prices; food quality and customer perceptions of value, speed and quality of service; cleanliness and fresh, attractive facilities in convenient locations. In addition to competition for customers, sharp competition exists for qualified restaurant managers, hourly restaurant workers and quality sites on which to build new restaurants.
Research and Development
The Company’s corporate staff includes a research and development chef whose responsibilities entail development of new menu items and enhancing existing products. From time to time, the Company conducts a variety of other research to identify a) emerging industry trends and changing consumer behaviors and preferences, b) where future restaurants should be built, and c) observational research of competitors is sometimes utilized for various purposes, including assistance with design concepts for new restaurant prototypes. While these activities are important to the Company, these expenditures have not been material during the Company's last three fiscal years and are not expected to be material to the Company’s future results.
Government Regulation
The Company is subject to licensing and regulation by various Federal, state and local agencies. These licenses and regulations pertain to food safety, health, sanitation, safety, vendors’ licenses and hiring and employment practices including compliance with the Fair Labor Standards Act and minimum wage statutes. All Company operations, including the commissary and food manufacturing plant, are believed to be in compliance with all applicable laws and regulations. All of the Company’s restaurants substantially meet local and state building and fire codes, and the requirements under the Americans with Disabilities Act. Although the Company has not experienced any significant obstacles to obtaining building permits, licenses or approvals from governmental bodies, increasingly rigorous requirements on the part of state, and in particular, local governments, could delay or possibly prevent expansion in desired markets.
The federal Food Safety Modernization Act (FMA) was enacted in January 2011 to standardize procedures associated with recalls of manufactured food. The Company is in compliance with the required procedures of the FMA and is currently completing its documentation of those procedures. The Company expects implementation to be completed (including documentation of procedures) in advance of the 2016 compliance deadline.
8
In March 2014, an executive order was issued by President Obama that directed the Secretary of the U.S. Department of Labor (DOL) to revamp the regulations of the Fair Labor Standards Act (FLSA) that pertain to overtime compensation, with the end goal being to greatly expand the number of workers entitled to receive overtime compensation. On May 5, 2015, the DOL submitted its proposal to the White House Office of Management and Budget (OMB) for approval. Once the OMB completes its review, the DOL’s proposal will be published in the Federal Register, following which the regulatory process will begin, which could take a year or more before the Final Rule would be issued with a likely effective date to be at least four months later. The Company is currently evaluating the changes that are likely to be imposed by the revised regulations. The evaluation entails the review of certain jobs that are classified as exempt from overtime and contemplating new compensation plans to mitigate or offset the effects of the higher costs that will likely result once the new regulations are in place.
The federal Patient Protection and Affordable Care Act (PPACA) was enacted in March 2010. On January 1, 2015, the employer portion of the PPACA went into effect. In anticipation of significant cost increases, the Company’s 2015 coverage was moved to a different insurance carrier and new policies were issued which contained reductions in certain benefits, and a higher percentage of the premium cost is now borne by the employees. In addition to being required to provide full-time employees with medical insurance that meets minimum value and affordability standards, the employer mandate requires employers to provide covered employees and the Internal Revenue Service with specific reportable benefit information. The Company’s 2015 medical plan has been offered to all full time employees and meets the minimum value and affordability requirements of the PPACA, and the Company believes that it will be able to meet the informational reporting requirements of the act when due in January 2016.
PPACA requires calorie counts and other nutritional information to be posted on the Company’s menus. In December 2014, the Food and Drug Administration (FDA) issued the Final Rules for Calorie Labeling in Retail Food Establishments. The final rules, as originally approved, require nutritional information to appear on menus no later than December 1, 2015. On July 9, 2015, the FDA delayed the effective date by one year in response to requests from constituents. Calorie counts and other nutritional information about the Company's menu offerings are available now on the Company's website (http://www.frischs.com) and the Company expects to be in full compliance with the final rules well before the December 1, 2016 deadline. Sales and profitability could be adversely affected if customers significantly alter their menu ordering habits when this information becomes available on the Company's menus.
The Company is subject to the franchising regulations of the Federal Trade Commission and the franchising laws of Ohio, Kentucky and Indiana where it has licensed Frisch's Big Boy restaurants to other operators.
Environmental Matters
The Company does not believe that various federal, state or local environmental regulations have had or will have any material effect upon the capital expenditures, earnings or competitive position of the Company's operations. However, the Company cannot predict the effect of any future environmental legislation or regulations.
Employees
As of June 2, 2015, the Company and its subsidiaries employed approximately 6,100 active employees. Approximately 3,900 of the Company’s employees are considered part-time (those who work less than 30 hours per week). Although there is no significant seasonal fluctuation in employment levels, hours worked may vary according to sales patterns in individual restaurants. None of the Company’s employees is represented by a collective bargaining agreement. Management believes that employee relations are excellent and employee compensation is comparable with or better than competing restaurants.
Geographic Areas
The Company has no operations outside of the United States of America. The Company’s revenues, consisting principally of retail sales of food and beverages to the general public and certain wholesale sales to and license fees from restaurants licensed to other operators, were substantially generated in various markets in the states of Ohio, Kentucky and Indiana during each of the three fiscal years in the period ended June 2, 2015. Substantially all of the Company’s long-lived assets were deployed in service in the same states during the same periods stated above.
9
Available Information
The Securities Exchange Act of 1934, as amended, requires the Company to file periodic reports with the SEC including its Annual Report on Form 10-K, Quarterly Reports on Form 10-Q, Current Reports on Form 8-K, Definitive 14A Proxy Statements, and certain other information. The Company’s periodic reports (and any amendments thereto) can be viewed by visiting the website of the SEC (http://www.sec.gov). In addition, the SEC makes the Company’s periodic reports available for reading and copying in its Public Reference Room located at 100 F. Street, NE, Washington, DC 20549. Information on the operation of the Public Reference Room may be obtained by calling the SEC at 1-800-SEC-0330.
The Company makes available the periodic reports that it files with the SEC by visiting the "Investors" section of the Company's corporate website (http://www.frischs.com), through which a hyperlink is provided directly to the Company’s filings on the website of the SEC. New information available through the hyperlink is generally provided within a few minutes from the time a report is filed. Information contained on or available through the Company’s website is not a part of, nor is it being incorporated into, this Annual Report on Form 10-K. In addition, printed copies of the reports that the Company files with the SEC may be obtained without charge by writing to Mark R. Lanning, Chief Financial Officer, Frisch’s Restaurants, Inc., 2800 Gilbert Avenue, Cincinnati, Ohio 45206-1206. Email requests may be sent to cfo@frischs.com.
Copies of the Company’s corporate governance documents are available in the "Investors" section of the Company’s corporate website (http://www.frischs.com). The documents include the Company’s Code of Regulations, Corporate Governance Guidelines, Code of Conduct, Code of Ethics, Insider Trading Policy, Related Person Transaction Policy, the Charter of the Disclosure Controls and Risk Management Committee, and various charters of committees of the Board of Directors, including those of the Audit Committee, the Compensation Committee, the Nominating and Corporate Governance Committee and the Finance Committee.
The Audit Committee has established a procedure for the confidential, anonymous submission by employees and other concerned parties regarding the Company’s accounting, internal accounting controls or auditing matters. The toll free Corporate Governance Hotline number is 800-506-6424. The Hotline is managed by an independent third party and is available 24 hours a day, seven days a week. Messages are transcribed and referred electronically to the Audit Committee
Executive Officers of the Registrant
The following table sets forth the names and certain information concerning the executive officers of the Company:
10
| Name | Age | Current Principal Occupation or Employment and Five Year Employment History | ||
| Craig F. Maier (a) | 65 | President and Chief Executive Officer of the Company (since 1989); Director of the Company (since 1984) | ||
| Mark R. Lanning | 60 | Vice President and Chief Financial Officer of the Company (since August 2011) and Vice President - Finance of the Company (since May 2011); Vice President – Investor Relations and Treasurer, Hillenbrand, Inc. (from March 2008 to May 2011); Vice President and Treasurer of Hillenbrand Industries, Inc. (from 1988 to March 2008) | ||
| Michael E. Conner, Sr. | 63 | Vice President - Human Resources of the Company (since 2000) | ||
| Michael R. Everett | 61 | Vice President - Information Services of the Company (since May 2006); Director of Information Services of the Company (from May 2005 to May 2006) | ||
| Stephen J. Hansen | 50 | Vice President - Commissary of the Company (since June 2010); Plant Manager, Klosterman Baking Company (from March 2009 to May 2010); Operations Manager, General Mills (from October 2008 to February 2009); Plant Manager, Campos Foods LLC (from 1996 to June 2008) | ||
| James I. Horwitz | 58 | Vice President – Real Estate of the Company (since March 2008); Director of Leasing and Development, Cincinnati United Contractors (from February 2007 to March 2008); Director of Real Estate, Alderwoods Group (from December 2005 to January 2007) | ||
| Karen F. Maier (a) | 63 | Vice President - Marketing of the Company (since 1983); Director of the Company (since 2005) | ||
| James M. Fettig | 47 | Regional Director of the Company (since June 4, 2014) and formerly held position within the Company of Area Supervisor (from 1995 to June 3, 2014) | ||
| Lindon C. Kelley | 60 | Regional Director of the Company (since 2000) and formerly held positions within the Company of Area Supervisor and Executive Store Manager | ||
| Todd M. Rion | 55 | Regional Director of the Company (since February 2012) and formerly held the position within the Company of Area Supervisor (July 2009 to February 2012); independent restaurant operator (from 2006 to July 2009) |
| (a) | Craig F. Maier and Karen F. Maier are siblings |
11
Operational, strategic, compliance and other risks and uncertainties that continually face the Company are identified herein. The occurrence of adverse events associated with all risks, including those risks not listed specifically or those that are unforeseen at the present time, could result in significant adverse effects on the Company’s financial position, results of operations and cash flows, which could include the permanent closure of any affected restaurant(s) with an impairment of assets charge taken against earnings, and could adversely affect the price at which shares of the Company’s common stock trade.
In addition to operating results, other factors can influence the volatility and price at which the Company’s common stock trades. The Company’s stock is thinly traded on the NYSE MKT. Thinly traded stocks can be susceptible to sudden, rapid declines in price, especially when holders of large blocks of shares seek exit positions. Rebalancing of stock indices in which the Company’s shares are placed, such as the Russell 2000 Index, can also influence the price of the Company’s stock.
The Merger
On May 21, 2015, the Company entered into an Agreement and Plan of Merger with FRI Holding Company, LLC and FRI Merger Sub, LLC. Under the terms of the agreement approved by Frisch’s Board of Directors, if the merger is effectuated, each outstanding share of Frisch’s Common Stock will be converted into a right to receive $34.00 per share in cash, without interest. The closing of the merger is subject to customary closing conditions, including approval of Frisch’s stockholders and regulatory clearance.
Although there is no financing condition, the Merger is subject to the satisfaction of a number of conditions beyond the Company’s control that may prevent, delay or otherwise materially adversely affect the completion of the transaction. These conditions include, among other things, stockholder approval. Management cannot predict with certainty whether and when any of these conditions will be satisfied.
The Merger Agreement may be terminated under certain circumstances, including in specified circumstances in connection with superior proposals. Assuming the satisfaction of the conditions to the Merger, the transaction is expected to close in the third quarter of calendar year 2015. However, there can be no assurance.
If the Agreement and Plan of Merger are terminated, the Company may be obligated to reimburse FRI Holding Company, LLC or FRI Merger Sub, LLC for certain Merger related costs and could be subject to termination fees. These amounts would be paid from available cash that would have been otherwise available for other general corporate purposes.
Finally, the risk exists that some customers, suppliers and other persons with whom the Company has a business relationship may delay or defer certain business decisions or might decide to seek to terminate, change or renegotiate their relationship with the Company as a result of the Merger, which could negatively affect revenues, earnings and cash flows, as well as the market price of the Company’s common stock, regardless of whether the Merger is completed. Similarly, current and prospective employees may experience uncertainty about their future roles with the Company following completion of the Merger, which may materially adversely affect the ability to attract and retain key employees.
Food Safety
Food safety is the most significant risk to any company that operates in the restaurant industry. It is the focus of increased government regulatory initiatives at the local, state and federal levels. Failure to protect the Company’s food supplies could result in food borne illnesses and/or injuries to customers. If any of the Company’s customers become ill from consuming the Company’s products, the affected restaurants may be forced to close. An instance of food contamination originating at the commissary operation could have far reaching effects, as the contamination would affect substantially all Frisch's Big Boy restaurants, including those licensed to other operators.
12
Economic Factors
Economic recessions can negatively influence discretionary consumer spending in restaurants and result in lower customer counts, as consumers become more price conscientious, tending to conserve their cash amid unemployment and other economic uncertainty. The effects of higher gasoline prices can also negatively affect discretionary consumer spending in restaurants. Increasing costs for energy can affect profit margins in many other ways. Petroleum based material is often used to package certain products for distribution. In addition, suppliers may add fuel surcharges to their invoices. The cost to transport products from the commissary to restaurant operations will rise with each increase in fuel prices. Higher costs for electricity and natural gas result in higher costs to a) heat and cool restaurant facilities, b) refrigerate and cook food and c) manufacture and store food at the Company’s food manufacturing plant.
Inflationary pressure, particularly on food costs, labor costs (especially associated with increases in the minimum wage) and health care benefits, can negatively affect the operation of the business. Shortages of qualified labor are sometimes experienced in certain local economies. In addition, the loss of any key executives could pose a significant adverse effect on the Company.
Future funding requirements of the defined benefit pension plan that is sponsored by the Company largely depend upon the performance of investments that are held in the trust that has been established for the plan. Equity securities comprise 70 percent of the target allocation of the plan's assets. Poor performance in equity securities markets can significantly lower the market values of the plan's investment portfolio, which, in turn, can result in a) material increases in future funding requirements, b) much higher net periodic pension costs to be recognized in future years, and c) increases in the underfunded status of the plan, which requires a reduction in the Company’s equity to be recognized.
Competition
The restaurant industry is highly competitive and many of the Company’s competitors are substantially larger and possess greater financial resources than does the Company. Frisch's Big Boy restaurants have numerous competitors, including national chains, regional and local chains, as well as independent operators. None of these competitors, in the opinion of the Company’s management, presently dominates the family-style sector of the restaurant industry in any of the Company’s operating markets. That could change at any time due to:
| · | changes in economic conditions |
| · | changes in demographics in neighborhoods where the Company operates restaurants |
| · | changes in consumer perceptions of value, food and service quality |
| · | changes in consumer preferences, particularly based on concerns with nutritional content of food on the Company’s menu |
| · | new competitors enter the Company’s market from time to time |
| · | increased competition from supermarkets and other non-traditional competitors |
| · | increased completion for quality sites on which to build restaurants |
Development Plans and Financing Arrangements
The Company’s business strategy and development plans also face risks and uncertainties. These include the inherent risk of poor quality decisions in the selection of sites on which to build restaurants, the rising cost and availability of desirable sites and increasingly rigorous requirements on the part of local governments to obtain various permits and licenses. Other factors that could impede plans to increase the number of restaurants operated by the Company include saturation in existing markets, limitations on borrowing capacity and the effects of increases in interest rates.
In addition, the Company’s loan agreements include financial and other covenants with which compliance must be met or exceeded each quarter. Failure to meet these or other restrictions could result in an event of default under which the lender may accelerate any outstanding loan balances and declare them to be immediately due and payable.
13
The Supply and Cost of Food
Food purchases can be subject to significant price fluctuations that can considerably affect results of operations from quarter to quarter and year to year. Price fluctuations can be due to seasonality or any number of factors, such as weather, foreign demand and demographic factors. The market for beef, in particular, continues to be highly volatile due in part to import and export restrictions. Beef costs can also be affected by bio-fuel initiatives and other factors that influence the cost to feed cattle. The Company depends on timely deliveries of perishable food and supplies. Any interruption in the continuing supply would harm the Company’s operations.
Litigation and Negative Publicity
Employees, customers and other parties bring various claims against the Company from time to time. Defending such claims can distract the attention of senior level management away from the operation of the business. Legal proceedings can result in significant adverse effects to the Company’s financial condition, especially if other potentially responsible parties lack the financial wherewithal to satisfy a judgment against them or the Company’s insurance coverage proves to be inadequate. Also, see “Legal Proceedings” elsewhere in Part I, Item 3 of this Form 10-K.
Negative publicity associated with legal claims against the Company, especially those related to food safety issues, could harm the Company's reputation and brand (whether or not such complaints are valid), which, in turn, could adversely affect operating results. Publicity surrounding food safety issues has caused irreparable harm to the reputations of certain operators in the restaurant industry in the past. The Company’s reputation and brand can also be harmed by food safety issues and other operational problems that may be experienced by Frisch's Big Boy restaurants that the Company licenses to other operators, as well as Big Boy restaurants (non Frisch's) that are operated by others outside of the Company's territories or in the restaurant industry at large. Other negative publicity such as that arising from rumor and innuendo spread through social internet media and other sources can create adverse effects on the Company’s results of operations.
Intellectual Property
The Company's intellectual property, which includes its food recipes, is very important to the operation of the business and its competitive position in the marketplace. The Company protects these assets through a combination of federally registered trademarks and other trademark and service mark rights, and various other means. If the Company's efforts to protect its intellectual property are inadequate, or if any third party misappropriates or infringes on the Company's intellectual property, the value of the Company's brand may be harmed, which could have a material adverse effect upon the Company.
Governmental and Other Rules and Regulations
Governmental and other rules and regulations can pose significant risks to the Company. Examples include:
| · | general exposure to penalties or other costs associated with the potential for violations of numerous governmental regulations, include |
| o | immigration (I-9) and labor regulations regarding the employment of minors |
| o | minimum wage and overtime requirements |
| o | employment discrimination and sexual harassment |
| o | health, sanitation and safety regulations |
| o | facility issues, such as meeting the requirements of the Americans with Disabilities Act of 1990 or liabilities to remedy unknown environmental conditions |
| · | changes in existing environmental regulations that would significantly add to the Company’s costs |
| · | any future imposition by OSHA of costly ergonomics regulations on workplace safety |
| · | climate legislation that adversely affects the cost of energy |
| · | compliance with the Food Modernization Act (enacted January 2011) |
14
| · | legislative or regulatory changes affecting labor law, especially the Fair Labor Standards Act, including overtime rules and increases in federal minimum wage requirements |
| · | increases in state and local minimum wage requirements |
| · | compliance with legislation enacted to reform the U.S. health care system could have a material adverse effect upon the Company’s health care costs |
| · | nutritional labeling on menus - compliance with legislation enacted to reform the U.S. health care system that requires nutritional labeling to be placed on menus and the Company’s reliance on the accuracy of certain information that may be obtained from third party suppliers. Potential adverse effect on sales and profitability if customer menu ordering choices should change. |
| · | legislation or court rulings that result in changes to tax codes that are adverse to the Company |
| · | changes in accounting standards imposed by governmental regulators or private governing bodies could adversely affect the Company’s financial position |
| · | estimates used in preparing financial statements and the inherent risk that future events affecting them may cause actual results to differ markedly |
Catastrophic Events
Unforeseen catastrophic events could disrupt the Company’s operations, the operations of the Company’s suppliers and the lives of the Company’s employees and customers. In particular, the dependency of the Company's restaurants on the commissary operation could present an extensive disruption of products to restaurants should a catastrophe impair its ability to operate. Examples of catastrophic events include but are not limited to:
| · | adverse winter weather conditions |
| · | natural disasters such as earthquakes or tornadoes |
| · | fires or explosions |
| · | widespread power outages |
| · | criminal acts, including bomb threats, robberies, hostage taking, kidnapping and other violent crimes |
| · | acts of terrorists or acts of war |
| · | civil disturbances and boycotts |
| · | disease transmitted across borders that may enter the food supply chain |
Technology, Information Systems and Cyber Risks
Technology and information systems are of vital importance to the strategic operation of the Company. Security violations such as unauthorized access to information systems, including breaches on third party servers, could result in the loss of proprietary data. Should consumer privacy be compromised, consumer confidence may be lost, which could adversely affect sales and profitability. To prevent credit card fraud, the Payment Card Security Standards Council requires an annual audit to certify the Company's compliance with the required internal controls of processing and storing of credit card data. A finding of non-compliance could restrict the Company's authorization to accept credit cards as a form of payment, which could adversely affect sales and profitability.
Other events that could pose threats to the operation of the business include:
| · | catastrophic failure of certain information systems |
| · | failures of the Company’s disaster recovery plan |
| · | difficulties that may arise in maintaining existing systems |
| · | difficulties that may occur in the implementation of and transition to new systems |
| · | financial stability of vendors to support software over the long term |
15
Item 1B. Unresolved Staff Comments
None
All of the Company’s Frisch's Big Boy restaurants are freestanding, well-maintained facilities. In addition to full service dining rooms, all of the restaurants are fashioned with windows for drive-thru service. Older restaurants are generally located in urban or heavily populated suburban neighborhoods that cater to local trade rather than highway travel. A few of these restaurant facilities are now more than 40 years old. Restaurants that have been opened since the early 1990s have generally been located near interstate highways. A typical restaurant built before 2001 contains on average approximately 5,600 square feet with seating capacity for 156 guests. The prototype that was introduced in 2001 has generally contained 5,700 square feet with seating for 172 guests. An adaptation of the 2001 prototype was introduced in 2010 for use in smaller trade areas. Its footprint approximates 5,000 square feet and has 148 dining room seats.
Most new restaurant construction requires approximately 18 weeks to complete, depending on the time of year and weather conditions. A competitive bidding process is used to award contracts to general contractors for all new restaurant construction. The general contractor selects and schedules sub-contractors, and is responsible for procuring most building materials. A Company project coordinator is assigned to coordinate all construction projects.
The following table summarizes the number and location of Company operated restaurants and restaurants licensed to others as of June 2, 2015:
| Company | Operated by | |||||||
| Frisch's Big Boy | Operated | Licensees | ||||||
| Cincinnati, Ohio market | 51 | 4 | ||||||
| Dayton, Ohio market | 20 | — | ||||||
| Columbus, Ohio market | 9 | 1 | ||||||
| Louisville, Kentucky market | 9 | 2 | ||||||
| Lexington, Kentucky market | 6 | 3 | ||||||
| Toledo, Ohio market | — | 13 | ||||||
| Other | — | 3 | ||||||
| Total | 95 | 26 | ||||||
In July 2014, one of the Company operated restaurants in the Columbus, Ohio market was closed permanently, and in August 2014, a restaurant licensed to a third party operator was opened in Ironton, Ohio (southeast Ohio).
Sites acquired for development of new Company operated restaurants are identified and evaluated for potential long-term sales and profits. A variety of factors is analyzed including demographics, traffic patterns, competition and other relevant information. Because control of property rights is important to the Company, it is the Company’s policy to own its restaurant locations whenever possible.
In recent years, it has sometimes become necessary to enter into ground leases to obtain desirable land on which to build. In addition, many of the restaurants operated by the Company that opened prior to 1990 were financed with sale/leaseback transactions. Most of the leases have multiple renewal options. All of the leases generally require the Company to pay property taxes, insurance and maintenance. As of June 2, 2015, 15 restaurants were in operation on non-owned premises, 14 of which are classified as operating leases with one treated as a capital lease. Three of the operating leases contain options to purchase the underlying properties, which become available over time. Under the terms of the lone capital lease, the Company is required to acquire the underlying land in fee simple title at any time between the 10th (2020) and 15th (2025) years of the lease. The following table recaps the Company's restaurant operations by type of occupancy (as of June 2, 2015):
16
| Company | ||||
| Frisch's Big Boy | Operated | |||
| Owned in fee simple title | 80 | |||
| Land or land & building leased | 15 | |||
| Total | 95 | |||
The restaurant that was closed permanently in July 2014 was owned in fee simple title. It was sold to a real estate developer shortly after its closure. Six of the 15 leased locations will expire during the next five years, as detailed in the list below. One of the six expiring leases has a purchase option and four (including the one with the purchase option) have renewal options available.
| Number of | ||
| Fiscal year ending in | Leases Expiring | |
| 2016 | — | |
| 2017 | 1 | |
| 2018 | 2 | |
| 2019 | 2 | |
| 2020 | 1 |
No construction of any new Company operated Frisch's Big Boy restaurants were in progress as of June 2, 2015.
None of the real property owned by the Company is currently encumbered by mortgages or otherwise pledged as collateral. With the exception of certain delivery equipment utilized under capital leases expiring during periods through Fiscal Year 2021, the Company owns substantially all of the furnishings, fixtures and equipment used in the operation of the business.
The Company owns a 79,000 square foot building that houses its commissary in Cincinnati, Ohio. It is suitable and adequate to supply the Company's restaurant operations and the needs of restaurants licensed to others. As the facility normally operates one shift daily, additional productive capacity is readily available if needed.
The Company maintains its headquarters in Cincinnati on a well-traveled street in an up-town business district. This administrative office space approximates 49,000 square feet and is occupied under an operating lease that expires on December 31, 2022. During the term of the lease, the Company has been granted the right of first refusal in the event that the lessor receives a bona fide purchase offer from a third party. The Company has an option to purchase the property when the lease expires.
The Company owns five undeveloped pieces of land. Four of the five parcels may ultimately be developed into restaurant facilities. Two of these are in the Columbus, Ohio market and the other two in outlying areas of Indiana (south of Indianapolis). No specific plan is in place for the fifth piece of land, which is located in Northern Kentucky.
Seven surplus land locations owned by the Company were listed for sale with brokers as of June 2, 2015, four of which are located in the Columbus, Ohio area, two are in the Dayton, Ohio area and the seventh is located in Toledo, Ohio. Two former Golden Corral restaurants (which ceased operating in August 2011) are also listed for sale with brokers, one of which is in the Cincinnati area and the other one is in the Cleveland, Ohio area.
17
The Company remains contingently liable under certain ground lease agreements relating to land on which seven of the Company's former Golden Corral restaurant operations are situated. The seven restaurant operations were sold to Golden Corral Corporation (GCC) in May 2012 at which time the seven operating leases were simultaneously assigned to GCC, with the Company remaining contingently liable in the event of default by GCC. The amount remaining under contingent lease obligations totaled $5,692,000 as of June 2, 2015, for which the aggregate average annual lease payments approximate $680,000 in each of the next five years. The Company is also contingently liable for the performance of a certain ground lease (for property located in Covington, Kentucky on which a hotel once operated by the Company is situated) that was assigned to a third party in 2000; the annual obligation of the lease approximates $48,000 through April 2020. Should either of these third parties default, the Company generally has the right to re-assign the leases.
On October 16, 2012, a former employee (plaintiff) filed a complaint in Boone County Circuit Court, Burlington Kentucky, asserting various claims including negligence and intentional infliction of emotional distress, stemming from the plaintiff's employment in 1995. With the exception of the negligence claim, all claims were dismissed by the Court as a result of the Motion to Dismiss, filed by the Company on November 13, 2012. In August 2013, the plaintiff's complaint was amended to include claims of sexual harassment and a hostile work environment. Following discovery, the Company moved for summary judgment on all remaining counts. The court heard oral arguments and entertained supplemental briefings. On July 9, 2015, the Court granted the Company’s Motion for Summary Judgment in its entirety and all claims were dismissed. On July 17, 2015, the plaintiff filed a Notice of Appeal to the Kentucky Court of Appeals. The Company continues to deny all allegations and will continue to defend the matter vigorously; however, the ultimate outcome of the lawsuit remains uncertain.
As disclosed in the Company’s Current Report on Form 8-K on January 20, 2015, the Company filed a lawsuit against the Company’s former assistant treasurer (and others) alleging that he forged payroll documents and created other false documents and accounting entries to divert Company funds into his personal accounts. As part of the civil complaint filed in the Court of Common Pleas for Hamilton County, Ohio on January 20, 2015, the Company is seeking full restitution of the diverted funds, plus compensatory damages, including pre-judgment and post judgment interest, an award of punitive damages in an amount to be determined, an award of reasonable costs and expenses incurred in the action, including reasonable attorney fees and other costs, and a grant of such other relief as the Court deems just and proper. The former assistant treasurer answered the Company’s complaint on February 17, 2015 by denying all of the Company’s allegations. Similar answers have been filed by the other named defendants.
Employees, customers and other parties bring various other claims and suits against the Company from time to time in the ordinary course of business. Management continually evaluates exposure to loss contingencies from pending or threatened litigation, and presently believes that the resolution of claims currently outstanding, whether or not covered by insurance, will not result in a material effect on the Company’s earnings, cash flows or financial position.
Item 4. Mine Safety Disclosures
Not applicable.
18
(Items 5 through 9)
Item 5. Market for Registrant’s Common Equity, Related Stockholder Matters and Issuer Purchases of Equity Securities
The Company’s common stock is traded on NYSE MKT under the symbol “FRS.” The closing price of the Company’s common stock as reported by NYSE MKT on July 28, 2015 was $33.36. There were approximately 1,400 shareholders of record as of July 28, 2015. The following table sets forth the high and low sales prices for the common stock and the regular cash dividend declared for each quarter within the Company’s two most recent fiscal years:
| Fiscal Year Ended June 2, 2015 | Fiscal Year Ended June 3, 2014 | |||||||||||||||||||||||
| Stock Prices | Dividends | Stock Prices | Dividends | |||||||||||||||||||||
| High | Low | per Share | High | Low | per Share | |||||||||||||||||||
| 1st Quarter | $ | 30.90 | $ | 21.57 | $ | 0.18 | $ | 22.09 | $ | 16.17 | $ | 0.16 | ||||||||||||
| 2nd Quarter | $ | 29.29 | $ | 25.05 | $ | 0.20 | $ | 25.42 | $ | 21.60 | $ | 0.18 | ||||||||||||
| 3rd Quarter | $ | 29.00 | $ | 24.80 | $ | 0.20 | $ | 27.75 | $ | 23.19 | $ | 0.18 | ||||||||||||
| 4th Quarter | $ | 35.14 | $ | 26.80 | $ | 0.20 | $ | 24.95 | $ | 22.45 | $ | 0.18 | ||||||||||||
The closing sales price of Frisch’s common stock on the NYSE MKT on May 21, 2015, the last full day of trading and the day prior to the first media report after market close that Frisch’s had entered into the Agreement and Plan of Merger with FRI Holding Company, LLC and FRI Merger Sub, LLC, was $ 28.12 per share.
Dividend Policy
Through July 10, 2015, the Company has paid 218 consecutive regular quarterly cash dividends during its 55 year history as a public company. Until the closing of the transaction contemplated under the Agreement and Plan of Merger, the Company is permitted to continue paying its regular quarterly cash dividend in an amount not to exceed $0.20 per share.
Equity Compensation Plan Information
Information regarding equity compensation plans under which common stock of the Company is authorized for issuance is incorporated by reference to Item 12 of this Form 10-K.
Issuer Purchases of Equity Securities
On July 25, 2012, the Board of Directors authorized the Company to purchase, on the open market and in transactions negotiated privately, up to 450,000 shares of its common stock. The authorization allowed for purchases to begin immediately and to occur from time to time over a three year period. When the program expired on July 25, 2015, 237,071 shares remained available to be purchased. No shares were repurchased during the fourth quarter that ended June 2, 2015, nor through July 25, 2015.
Performance Graph
The following graph compares the yearly percentage change in the Company’s cumulative total stockholder return on its common stock over the five year period ended June 2, 2015 with the Russell 2000 Index (Index) and a group of the Company’s peer issuers, selected by the Company in good faith. The graph assumes an investment of $100 in the Company’s common stock, in the Index and in the common stock of each member of the peer group on June 2, 2010 and reinvestment of all dividends.
19
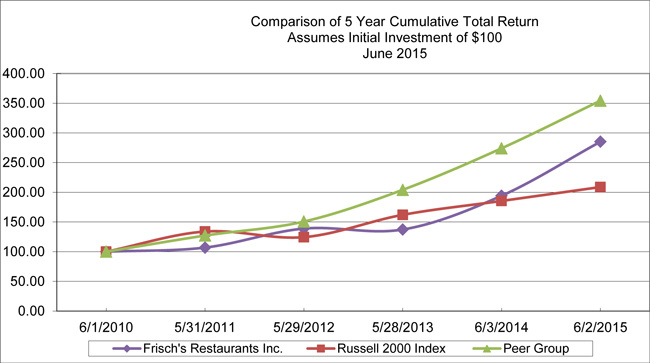
The Company’s Peer Group consists of the following issuers: CBRL Group, Inc. (Cracker Barrel Old Country Store), Denny’s, Inc., Popeye's Louisiana Kitchen, Inc., Cosi Inc., Sonic Corp., Buffalo Wild Wings Inc., and Famous Dave's of America Inc.
20
Item 6. Selected Financial Data
FRISCH’S RESTAURANTS, INC. AND SUBSIDIARIES
SUMMARY OF OPERATIONS
| 2015 | 2014 | 2013 | 2012 | 2011 | ||||||||||||||||
| (in thousands, except per share data) | ||||||||||||||||||||
| Sales | $ | 211,893 | $ | 209,173 | $ | 203,712 | $ | 205,083 | $ | 201,717 | ||||||||||
| Cost of sales | ||||||||||||||||||||
| Food and paper | 70,536 | 70,088 | 68,268 | 69,042 | 66,349 | |||||||||||||||
| Payroll and related | 72,986 | 74,236 | 71,523 | 72,721 | 71,820 | |||||||||||||||
| Other operating costs | 42,091 | 42,973 | 41,368 | 41,805 | 40,912 | |||||||||||||||
| Total cost of Sales | 185,613 | 187,297 | 181,159 | 183,568 | 179,081 | |||||||||||||||
| Restaurant operating income | 26,280 | 21,876 | 22,553 | 21,515 | 22,636 | |||||||||||||||
| Administrative and advertising | 16,725 | 12,539 | 13,424 | 13,660 | 13,087 | |||||||||||||||
| Franchise fees and other revenue, net | (1,471 | ) | (1,439 | ) | (1,376 | ) | (1,322 | ) | (1,324 | ) | ||||||||||
| (Gain) loss on sale of real property | (2,999 | ) | (135 | ) | 14 | (200 | ) | 40 | ||||||||||||
| Impairment of long-lived assets | 653 | — | 390 | 1,229 | — | |||||||||||||||
| Operating income | 13,372 | 10,911 | 10,101 | 8,148 | 10,833 | |||||||||||||||
| Interest expense | 370 | 586 | 964 | 1,414 | 1,582 | |||||||||||||||
| Earnings from continuing operations before income taxes | 13,002 | 10,325 | 9,137 | 6,734 | 9,251 | |||||||||||||||
| Income taxes | 3,047 | 853 | 2,388 | 1,114 | 2,512 | |||||||||||||||
| Earnings from continuing operations | 9,955 | 9,472 | 6,749 | 5,620 | 6,739 | |||||||||||||||
| (Loss) earnings from discontinued operations, net of tax | — | — | (158 | ) | (3,653 | ) | 2,368 | |||||||||||||
| NET EARNINGS | $ | 9,955 | $ | 9,472 | $ | 6,591 | $ | 1,967 | $ | 9,107 | ||||||||||
| Basic net earnings per share: | ||||||||||||||||||||
| Earnings from continuing operations | $ | 1.94 | $ | 1.86 | $ | 1.34 | $ | 1.14 | $ | 1.34 | ||||||||||
| (Loss) earnings from discontinued operations | — | — | (0.03 | ) | (0.74 | ) | 0.47 | |||||||||||||
| Basic net earnings per share | $ | 1.94 | $ | 1.86 | $ | 1.31 | $ | 0.40 | $ | 1.81 | ||||||||||
| Diluted net earnings per share: | ||||||||||||||||||||
| Earnings from continuing operations | $ | 1.94 | $ | 1.86 | $ | 1.34 | $ | 1.14 | $ | 1.33 | ||||||||||
| (Loss) earnings from discontinued operations | — | — | (0.03 | ) | (0.74 | ) | 0.47 | |||||||||||||
| Diluted net earnings per share | $ | 1.94 | $ | 1.86 | $ | 1.31 | $ | 0.40 | $ | 1.80 | ||||||||||
21
Item 6. Selected Financial Data (continued)
| Fiscal Year | ||||||||||||||||||||
| 2015 | 2014 | 2013 | 2012 | 2011 | ||||||||||||||||
| (in thousands, except per share data) | ||||||||||||||||||||
| Other financial statistics | ||||||||||||||||||||
| Cash dividends per share | $ | 0.78 | $ | 0.70 | $ | 0.64 | $ | 0.63 | $ | 0.58 | ||||||||||
| Special cash dividend per share | — | — | 9.50 | — | — | |||||||||||||||
| Working capital (deficit) | $ | (965 | ) | $ | (5,595 | ) | $ | (5,970 | ) | $ | 36,848 | $ | (14,963 | ) | ||||||
| Total capital expenditures | 8,270 | 13,160 | 9,837 | 13,365 | 19,703 | |||||||||||||||
| Total assets | 129,011 | 128,954 | 128,018 | 179,369 | 195,499 | |||||||||||||||
| Total long-term obligations | 11,217 | 16,792 | 25,795 | 36,069 | 41,399 | |||||||||||||||
| Shareholders' equity | 100,010 | 93,253 | 82,526 | 120,818 | 124,805 | |||||||||||||||
| Book value per share at year end | $ | 19.49 | $ | 18.29 | $ | 16.30 | $ | 24.46 | $ | 25.37 | ||||||||||
| Return on average shareholders' equity | 10.3 | % | 10.8 | % | 6.5 | % | 1.6 | % | 7.4 | % | ||||||||||
| Weighted average number of basic shares outstanding | 5,123 | 5,087 | 5,031 | 4,934 | 5,038 | |||||||||||||||
| Weighted average number of diluted shares outstanding | 5,138 | 5,101 | 5,045 | 4,952 | 5,068 | |||||||||||||||
| Number of shares outstanding at year end | 5,132 | 5,099 | 5,062 | 4,939 | 4,920 | |||||||||||||||
| Sales change percentage | 1.3 | % | 2.7 | % | (0.7 | )% | 1.7 | % | 5.3 | % | ||||||||||
| Earnings as a percentage of sales | ||||||||||||||||||||
| Gross profit from continuing operations | 12.4 | % | 10.5 | % | 11.1 | % | 10.5 | % | 11.2 | % | ||||||||||
| Operating profit from continuing operations | 6.3 | % | 5.2 | % | 5.0 | % | 4.0 | % | 5.4 | % | ||||||||||
| Earnings from continuing operations before income taxes | 6.1 | % | 4.9 | % | 4.5 | % | 3.3 | % | 4.6 | % | ||||||||||
| Earnings from continuing operations | 4.7 | % | 4.5 | % | 3.3 | % | 2.7 | % | 3.3 | % | ||||||||||
With the exception of fiscal year 2014, all fiscal years presented contained 52 weeks consisting of 364 days. Fiscal year 2014 contained 53 weeks consisting of 371 days.
22
Item 7. Management’s Discussion and Analysis of Financial Condition and Results of Operations
SAFE HARBOR STATEMENT under the PRIVATE SECURITIES LITIGATION REFORM ACT of 1995
Forward-looking statements are included in this Management’s Discussion and Analysis of Financial Condition and Results of Operations (MD&A). Such statements may generally express management’s expectations with respect to its plans, goals and projections, or its current assumptions and beliefs concerning future developments and their potential effect on the Company. There can be no assurances that such expectations will be met or that future developments will not conflict with management’s current beliefs and assumptions, which are inherently subject to the occurrence of adverse events associated with numerous risks and other uncertainties. Factors that could cause actual results and performance to differ materially from anticipated results that may be expressed or implied in forward-looking statements are included in, but not limited to, the discussion in this Form 10-K under Part I, Item 1A. “Risk Factors.” Risk factors and other uncertainties may also be discussed from time to time in the Company's news releases, public statements or in other reports that the Company files with the Securities and Exchange Commission.
Sentences that contain words such as “should,” “would,” “could,” “may,” “plan(s),” “anticipate(s),” “project(s),” “believe(s),” “will,” “expect(s),” “estimate(s),” “intend(s),” “continue(s),” “assumption(s),” “goal(s),” “target(s)” and similar words (or derivatives thereof) are generally used to distinguish forward-looking statements from statements pertaining to historical or present facts.
All forward-looking information in this MD&A is provided by the Company pursuant to the safe harbor established under the Private Securities Litigation Reform Act of 1995. Such forward-looking information should be evaluated in the context of all of the Company's risk factors, which readers should review carefully and not place undue reliance on management's forward-looking statements. Except as may be required by law, the Company disclaims any obligation to update any of the forward-looking statements that may be contained in this MD&A.
CORPORATE OVERVIEW
(all dollars reported in the text of this MD&A are in thousands)
This MD&A should be read in conjunction with the Consolidated Financial Statements found in this Form 10-K under Part II, Item 8. The Company has no off-balance sheet arrangements other than operating leases that are entered into from time to time in the ordinary course of business. The Company does not use special purpose entities.
Frisch’s Restaurants, Inc. and Subsidiaries (Company) is a regional company that operates full service family style restaurants under the name "Frisch's Big Boy." As of June 2, 2015, 95 Frisch's Big Boy restaurants were owned and operated by the Company, which are located in various regions of Ohio, Kentucky and Indiana. The Company also licenses 26 Frisch's Big Boy restaurants to other operators who pay franchise and other fees to the Company.
Fiscal Year 2015 ended on Tuesday, June 2, 2015, which compares with Fiscal Year 2014 that ended on Tuesday, June 3, 2014 and Fiscal Year 2013 that ended on Tuesday, May 28, 2013. Both Fiscal Year 2015 and 2013 were 52 week, 364 day periods, whereas Fiscal Year 2014 was a 53 week, 371 day period that occurs naturally every six years as a result of the Company’s fiscal year calendar. Fiscal Year 2016 will end on Tuesday, May 31, 2016, a 52 week year comprised of 364 days.
23
The following table recaps the earnings or loss components of the Company's Consolidated Statement of Earnings.
| Fiscal Year | Fiscal Year | Fiscal Year | ||||||||||
| 2015 | 2014 | 2013 | ||||||||||
| (52 weeks) | (53 weeks) | (52 weeks) | ||||||||||
| (in thousands, except per share data) | ||||||||||||
| Earnings from continuing operations before income taxes | $ | 13,002 | $ | 10,325 | $ | 9,137 | ||||||
| Earnings from continuing operations | $ | 9,955 | $ | 9,472 | $ | 6,749 | ||||||
| Diluted EPS from continuing operations | $ | 1.94 | $ | 1.86 | $ | 1.34 | ||||||
| Loss from discontinued operations, net of tax | $ | — | $ | — | $ | (158 | ) | |||||
| Diluted EPS from discontinued operations | $ | — | $ | — | $ | (0.03 | ) | |||||
| Net earnings | $ | 9,955 | $ | 9,472 | $ | 6,591 | ||||||
| Diluted net EPS | $ | 1.94 | $ | 1.86 | $ | 1.31 | ||||||
| Weighted average diluted shares outstanding | 5,138 | 5,101 | 5,045 | |||||||||
Factors having a notable effect on earnings from continuing operations before income taxes when comparing Fiscal Year 2015 with Fiscal Year 2014 and Fiscal Year 2013:
| · | Consolidated restaurant sales in Fiscal Years 2015, 2014 and 2013 were $211,893, $209,173 and $203,712, respectively. Fiscal Year 2014 had a 53rd week of sales, which contributed an estimated $737 to operating income. |
| · | Big Boy same store sales increased 3.4 percent in Fiscal Year 2015, which followed a 0.9 percent decrease in Fiscal Year 2014 (adjusted to a 52 week basis). |
| · | As a percentage of sales, consolidated food costs were 33.3 percent in Fiscal Year 2015 and 33.5 percent in both Fiscal Year 2014 and Fiscal Year 2013. |
| · | As a percentage of sales, consolidated payroll and related costs were 34.4 percent in Fiscal Year 2015, 35.5 percent in Fiscal Year 2014 and 35.1 percent in Fiscal Year 2013. |
| · | New store opening costs were zero in Fiscal Year 2015, $307 in Fiscal Year 2014 and $592 in Fiscal Year 2013. |
| · | Share based compensation costs were $545 in Fiscal Year 2015, $541 in Fiscal Year 2014 and $745 in Fiscal Year 2013. |
| · | The CEO's incentive compensation was $589 in Fiscal Year 2015, $426 in Fiscal Year 2014 and $409 in Fiscal Year 2013. |
| · | Officers incentive compensation was $1,020 in Fiscal Year 2015, $268 in Fiscal Year 2014 and $221 in Fiscal Year 2013. |
| · | During Fiscal Year 2015, the Company incurred legal and professional fees associated with the defalcation in the amount of $1,871 and $2,181 for the merger transaction. |
| · | Gains & losses on the sale of real estate – gains of $2,999 were recorded in Fiscal Year 2015, a gain of $135 in Fiscal Year 2014 and a loss of $14 was recorded in Fiscal Year 2013. |
| · | Impairment of long-lived assets - an impairment loss of $653 was recorded in Fiscal Year 2015, there were no charges for impairment of long-lived assets in Fiscal Year 2014, and $390 was recorded in Fiscal Year 2013. |
Income tax expense included in net earnings for Fiscal Year 2015, 2014 and 2013 amounted to $3,047, $853, and $2,338 (including $158 in discontinued operations), respectively. Income tax expense in Fiscal Year 2014 included certain tax benefits associated with the Domestic Production Activities Deduction (DPAD) available under the Internal Revenue Code and the release of valuation allowances that had been placed previously on certain deferred state income tax assets.
Underfunded status in the Company sponsored defined benefit pension plan was eliminated as of June 2, 2015, down from $1,871 as of June 3, 2014. The continued improvement in the underfunded position was driven primarily by market gains in the assets of the pension plan.
24
RESULTS OF OPERATIONS
(all dollars reported in the text are in thousands)
Sales
The Company’s sales are primarily generated through the operation of Frisch's Big Boy restaurants. Sales also include wholesale sales from the Company’s commissary to Frisch's Big Boy restaurants that are licensed to other operators and the sale of Frisch's signature brand tartar sauce to grocery stores. Same store sales comparisons are a key metric that management uses in the operation of the business. Same store sales are affected by changes in customer counts and menu price increases. Changes in sales also occur as new restaurants are opened and older restaurants are closed. Below is the detail of consolidated sales:
| Fiscal Year | Fiscal Year | Fiscal Year | ||||||||||
| 2015 | 2014 | 2013 | ||||||||||
| (52 weeks) | (53 weeks) | (52 weeks) | ||||||||||
| (in thousands, except per share data) | ||||||||||||
| Frisch's Big Boy restaurants operated by the Company | $ | 199,541 | $ | 197,623 | $ | 192,891 | ||||||
| Wholesale sales to licensees | 10,835 | 9,995 | 9,537 | |||||||||
| Wholesale sales to groceries | 1,517 | 1,555 | 1,284 | |||||||||
| Total Sales | $ | 211,893 | $ | 209,173 | $ | 203,712 | ||||||
A breakdown of changes in Frisch's Big Boy same store sales by quarter follows (adjusted to remove the effect of the extra week of sales in the fourth quarter of Fiscal Year 2014):
| 1st Quarter | 2nd Quarter | 3rd Quarter | 4th Quarter | Year | ||||||||||||||||
| Same store sales changes | ||||||||||||||||||||
| Fiscal Year 2015 | 1.8 | % | 4.8 | % | 4.8 | % | 2.5 | % | 3.4 | % | ||||||||||
| Fiscal Year 2014 | (1.0 | )% | 0.1 | % | (3.6 | )% | 0.7 | % | (0.9 | )% | ||||||||||
Menu prices are typically reviewed and adjusted each spring and autumn. The same store sales comparisons in the above table include average menu price increases of 1.0 percent, 1.5 percent, and 1.1 percent, implemented shortly after or shortly before the ends of the third quarters of Fiscal Years 2015, 2014 and 2013, respectively. The first quarters of Fiscal Years 2015, 2014 and 2013 included average menu price increases of 1.2 percent, 1.1 percent, and 0.9 percent, respectively. Another increase is currently being planned for implementation in the first quarter of Fiscal Year 2016 (September 2015). Customer counts in same stores were 0.4 percent higher in Fiscal Year 2015 compared with Fiscal Year 2014 (52 week basis), which was 3.4 percent lower than Fiscal Year 2013. The increase in customer counts during Fiscal Year 2015 can be partially attributed to the milder winter weather in Fiscal Year 2015 as compared with Fiscal Year 2014. While higher menu prices may sometimes have a dampening effect resulting in lower customer traffic, management believes economic conditions are slowly improving, particularly lower unemployment and falling gasoline prices, which, in turn, provide customers with higher levels of disposable income that can now be spent on discretionary items like dining out, increasing the Company’s growth opportunities.
The Company operated 95 Frisch's Big Boy restaurants as of June 2, 2015. The count of 95 includes the following openings and closings since the beginning of Fiscal Year 2013 (June 2012) when there were 93:
Fiscal Year 2015
| · | Closed unit in July 2014 in Columbus, Ohio |
25
Fiscal Year 2014
| · | Opened new unit in December 2013 in Lexington, Kentucky |
Fiscal Year 2013
| · | Opened new unit in March 2013 in Sidney, Ohio (Dayton market) |
| · | Opened new unit in August 2012 near Cincinnati, Ohio |
At this time, no new restaurant construction has been scheduled in Fiscal Year 2016.
On November 25, 2014, the U.S. Food and Drug Administration (FDA) released the final rule for menu labeling under the Federal Patient Protection and Affordable Care Act (ACA), following final review by the White House Office of Management and Budget (OMB). Under the final rule, as delayed in July 2015, the Company has until December 2016 to list calorie content information for standard menu items that appear on its restaurant menus and menu drive-thru boards. The final rule also requires the Company to provide, upon consumer request, written nutritional facts – total calories, total fat, calories from fat, saturated fat, trans fat, cholesterol, sodium, total carbohydrates, fiber, sugars and total proteins – about each standard menu offering. Sales volumes could be adversely affected if customers’ dining selections change significantly once this information is made readily available during the second quarter of Fiscal Year 2017.
The Payment Card Industry Security Standards Council (PCI) has a data security standard with which all organizations that process card payments must comply. The standard is intended to prevent credit card fraud by focusing on the internal controls of processing and storing such data. PCI requires an annual audit to certify the Company's compliance with the required internal controls. The Company received its Attestations of Compliance in June 2013, June 2014 and again in June 2015. A finding of non-compliance could restrict the Company from accepting credit and debit cards as a form of payment.
Restaurant Operating Income
The determination of restaurant operating income is shown with operating percentages in the following table. The table is intended to supplement the cost of sales discussion that follows. Cost of sales is comprised of food and paper costs, payroll and related costs, and other operating costs.
| Fiscal Year | Fiscal Year | Fiscal Year | ||||||||||
| 2015 | 2014 | 2013 | ||||||||||
| (52 weeks) | (53 weeks) | (52 weeks) | ||||||||||
| Sales | 100.0 | % | 100.0 | % | 100.0 | % | ||||||
| Food and paper | 33.3 | % | 33.5 | % | 33.5 | % | ||||||
| Payroll and related | 34.4 | % | 35.5 | % | 35.1 | % | ||||||
| Other operating costs (including opening costs) | 19.9 | % | 20.5 | % | 20.3 | % | ||||||
| Gross profit | 12.4 | % | 10.5 | % | 11.1 | % | ||||||
The cost of food remains at historically high levels, especially proteins – beef, pork and chicken. Hamburger and bacon have the greatest consumption of all the items in the Company’s menu mix and although the price of hamburger decreased slightly in the second half of Fiscal Year 2015, some industry forecasts predict that beef prices will not begin to decline in any significant degree until 2016 at the earliest.
The effect of commodity price increases is actively managed with changes to the menu mix, together with periodic increases in menu prices. However, rapid escalations in the cost of food can be problematic to effective menu management. Although the Company does not use financial instruments as a hedge against changes in commodity prices, purchase contracts for some commodities may contain provisions that limit the price the Company will pay. These contracts are normally for periods of one year or less, but may have longer terms.
26
Food safety poses a major risk to the Company. Management rigorously emphasizes and enforces established food safety policies in all of the Company’s restaurants and in its commissary and food manufacturing plant. These policies are designed to work cooperatively with programs established by health agencies at all levels of governmental authority, including the federal Hazard Analysis of Critical Control Points (HACCP) program. The Company is in substantial compliance with the federal Food Safety Modernization Act (FMA), which standardizes procedures associated with recalls of manufactured food. The Company expects to complete its documentation of FMA procedures in advance of the 2016 deadline. In addition, the Company makes use of ServSafe Training, a nationally recognized program developed by the National Restaurant Association. The ServSafe program provides accurate, up-to-date science-based information to all levels of restaurant workers on all aspects of food handling, from receiving and storing to preparing and serving. All restaurant managers are required to be certified in ServSafe Training and are required to be re-certified every five years.
Lower payroll and related costs (as a percentage of sales) shown in the table above for Fiscal Year 2015 are primarily due to the combination of reduced pension, medical expenses and higher same store sales and menu prices that were enough to offset the effects of higher restaurant management variable compensation and increased costs due to wage rate increases and the allowance of additional labor hours to be worked.
Payroll and related costs continue to be adversely affected by mandated increases in the minimum wage:
| · | In Ohio, where roughly two-thirds of the Company’s payroll costs are incurred, the minimum wage for non-tipped employees was increased 33 percent from $5.15 per hour to $6.85 per hour beginning January 1, 2007. It was subsequently increased to $7.00 per hour on January 1, 2008, to $7.30 per hour on January 1, 2009 (there was no increase on January 1, 2010), to $7.40 per hour on January 1, 2011, to $7.70 per hour on January 1, 2012, to $7.85 per hour on January 1, 2013 and to $7.95 on January 1, 2014. On January 1, 2015, the rate increased to $8.10 per hour, which represents a 57 percent increase since 2007. |
| · | The Ohio minimum wage for tipped employees increased 61 percent from $2.13 per hour to $3.43 per hour beginning January 1, 2007. It was subsequently increased to $3.50 per hour on January 1, 2008, to $3.65 per hour on January 1, 2009 (there was no increase on January 1, 2010), to $3.70 per hour on January 1, 2011, to $3.85 per hour on January 1, 2012, to $3.93 per hour on January 1, 2013, and to $3.98 per hour on January 1, 2014. On January 1, 2015, the rate increased to $4.05 per hour, which represents a 90 percent increase since 2007. |
| · | Federal minimum wage statutes currently apply to substantially all other (non-Ohio) employees. The federal minimum wage for non-tipped employees increased from $5.15 per hour to $5.85 per hour in July 2007. It was increased to $6.55 per hour in July 2008 and to $7.25 per hour in July 2009. The rate for tipped employees (non-Ohio) was not affected by the federal legislation, remaining at $2.13 per hour. |
Although there is no seasonal fluctuation in employment levels, the number of hours worked by hourly paid employees has always been managed closely according to sales patterns in individual restaurants. The effects of paying the mandated higher hourly rates of pay are customarily countered through the combination of reductions in the number of scheduled labor hours and higher menu prices charged to customers. Without benefit of reductions in labor hours, the Ohio minimum wage increase on January 1, 2013 would have added an estimated $320 to annual payroll costs in Ohio restaurant operations, the increase on January 1, 2014 would have added approximately $180, and the increase on January 1, 2015 would add approximately $220 absent any reductions in scheduled labor hours.
Pressure and support are mounting in Washington, DC to raise the federal minimum wage from $2.13 per hour for tipped employees to $7.07 per hour and from $7.25 per hour for non-tipped employees to $10.10 per hour. If the legislation is ultimately enacted, the rates will be increased gradually over a three year period, followed by automatic increases each year indexed to inflation. Management will analyze and evaluate the effect of the legislation on the Company's operations if and when enactment of such legislation appears likely.
27
On March 13, 2014, an executive order was issued by President Obama that directs the Secretary of Labor to revamp regulations to expand the number of workers entitled to receive overtime compensation and in May 2015, the Department of Labor issued its proposal that would raise the minimum salary level for exemption from $23,660 to $50,440 per year. The proposal is subject to public and Congressional comment and adjustment for up to one year following its issuance. Management will watch the development of the regulations closely and will analyze and evaluate the effect upon the Company's practices once the specifics of the anticipated regulations are finalized.
Benefit programs sponsored by the Company also greatly influence payroll and related costs.
The Company has always offered affordable medical insurance coverage to its full time employees. In response to the individual mandate of the ACA, on January 1, 2014, a sizable number of additional employees elected to enroll and be covered under the Company’s medical insurance plan as compared with prior years. As a result, the Company’s medical plan expenses for calendar year 2014 increased by approximately $30 per week.
The employer side of the ACA went into effect on January 1, 2015, which would have increased the Company’s medical insurance costs to even higher levels. To offset the expected increase, the Company’s 2015 coverage was moved to a different insurance carrier through which a new insurance policy was issued that contains certain reductions in plan benefits, and a higher percentage of the premium cost is now being paid by employees. The Company’s 2015 medical plan coverage has been offered to all full time employees and meets the minimum value and affordability requirements of the ACA. In addition, fewer employees elected to enroll in the Company’s medical plan for coverage in 2015 than did in 2014.
Periodic pension cost was $263, $1,863 and $3,247, respectively, in Fiscal Years 2015, 2014 and 2013. Periodic pension cost for Fiscal Year 2015 was much lower than Fiscal Year 2014 due to several factors. Certain demographic changes accounted for approximately $425, and the change in the rate of compensation increase added an estimated $675 to the improvement. In addition, approximately $300 of the improvement was the result of actual asset gains and differences for expected versus actual benefit payments and expenses. These improvements were offset by roughly $125 which resulted from lowering the discount rate from 4.40 percent to 3.90 percent. Periodic Pension cost for Fiscal Year 2014 was much lower than Fiscal Year 2013 primarily due to an exceptional return on plan assets in during Fiscal Year 2013.
Settlement losses are triggered when the sum of all settlements (lump sum cash outs) exceed interest and service cost. There were no settlement losses incurred in 2015, 2014 and 2013. The Company does not currently anticipate any settlement losses in Fiscal Year 2016.
The expected long-term rate of return on plan assets used to compute pension costs was 7.25 percent for Fiscal Year 2015 and 2014, reduced from 7.50 percent in Fiscal Year 2013. The expected long-term rate used to compute pension costs for Fiscal 2016 was lowered to 7.00 percent.
The discount rate used in the actuarial assumptions to compute pension costs was 3.90 percent in Fiscal Year 2015. The discount rate used in Fiscal Year 2014 was 4.40 percent and was 4.25 percent in Fiscal Year 2013. The rate for Fiscal Year 2016 will remain at the 3.90 percent used in Fiscal Year 2015. The rate of compensation increase was reduced from 4.00 percent in Fiscal Years 2014 and 2013 to 2.13 percent in Fiscal Year 2015 to account for the change in the weighted average age based rate. The rate will be further reduced to 2.07 percent for Fiscal Year 2016.
Net periodic pension cost for Fiscal Year 2016 is currently estimated at approximately $126, down from $263 in Fiscal Year 2015. The $137 improvement expected in Fiscal Year 2016 is largely the result of certain demographic changes along with actual asset gains and differences for expected versus actual benefit payments and expenses, as offset by changes in mortality assumptions, lump sum interest rate assumptions, and the lowering of the assumption for the expected rate of return on assets from 7.25 percent to 7.00 percent.
28
Contributions made to Company sponsored plans were $2,004 in Fiscal Year 2015, $2,000 in Fiscal Year 2014, and were $2,394 in Fiscal Year 2013. Contributions for Fiscal Year 2016 are tentatively anticipated to be at least $2,000, which includes amounts to meet minimum legal funding requirements, if any, and potential discretionary contributions. Future funding of the pension plans largely depends upon the performance of investments that are held in trusts that have been established for the defined benefit pension plan. Equity securities comprise 70 percent of the target allocation of the plan's assets. The fair value of all the plan's assets was $41,007, $37,835 and $33,376 respectively at the end of Fiscal Years 2015, 2014 and 2013.
Pension accounting standards require the overfunded or underfunded status of defined benefit pension plans to be recognized as an asset or liability in the Company’s Consolidated Balance Sheet. Funded status is measured as the difference between plan assets at fair value and projected benefit obligations (PBO). As of June 2, 2015, the fair value of pension plan assets was $41,007, and the PBO of the defined benefit pension plan was $40,714. The $293 excess of fair value over the PBO was recorded in other long-term assets in the Consolidated Balance Sheet as of June 2, 2015. The unfunded liability for the non-qualified Supplemental Executive Retirement Plan (SERP) was $316, which was recorded in accrued expenses in the Consolidated Balance Sheet as of June 2, 2015, reflective of payments scheduled in the near term when the Company’s CEO retires and the plan is terminated. When combined, a net obligation of $23 has been recognized for the two plans in the Consolidated Balance Sheet as of June 2, 2015. An underfunded pension obligation of $1,871 was reflected in long-term obligations in the Consolidated Balance Sheet at June 3, 2014, which consisted of the combination of the same two plans. The PBO of the defined benefit plan was $39,410, which exceeded the $37,835 fair value of the plan assets by $1,575. The long term liability for the unfunded SERP was $296.
Other operating costs include occupancy costs such as maintenance, rent, depreciation, abandonment losses, property tax, insurance and utilities, plus costs relating to field supervision, accounting and payroll preparation costs, new restaurant opening costs, and many other restaurant operating costs. Opening costs can have a significant effect on the operating costs. Opening costs in Fiscal Years 2014 and 2013 were $307 and $592, respectively. There were no opening costs in Fiscal Year 2015. Fees for processing the issuance of the Company's gift cards in supermarkets amounted to $29, $821 and $647 respectively, in Fiscal Years 2015, 2014 and 2013. There was little expense in Fiscal Year 2015, as the Company withdrew from the program in June 2014. As most of the other typical expenses charged to other operating costs tend to be more fixed in nature, the percentages shown in the above table can be greatly affected by changes in same store sales levels. In other words, percentages will generally rise when sales decrease and percentages will generally decrease when sales increase.
Operating Income
To arrive at the measure of operating income, administrative and advertising expense is subtracted from restaurant operating income, while the line item for franchise fees and other revenue is added to it. Gains and losses from the sale of real property (if any) are then respectively added or subtracted. Charges for impairment of assets (if any) are also subtracted from restaurant operating income to arrive at the measure of operating income.
Administrative and advertising expense was $16,725, $12,539 and $13,424 respectively in Fiscal Years 2015, 2014 and 2013. Advertising expense represents the largest component of these costs, which was $4,979, $4,931 and $4,855 respectively, in Fiscal Years 2015, 2014 and 2013. Spending for advertising and marketing programs is proportionate to sales levels, reflecting the Company’s long-standing policy to spend a constant percentage of sales on advertising and marketing.
All other administrative costs were $11,746, $7,608 and $8,569 respectively, in Fiscal Years 2015, 2014 and 2013. The primary drivers of the $4,138 increase in other administrative costs in Fiscal Year 2015 are approximately $2,181 related to legal and professional services associated with the recently announced merger and $1,871 related to legal and professional services associated with employee defalcation. The defalcation expenses were partially offset by proceeds of $505 under the Company’s Crime Insurance Policy. Also included in other administrative costs are recurring expenses associated with the Chief Executive Officer’s (CEO) incentive compensation, which was included in other administrative costs as follows: $589, $426 and $409 respectively, in Fiscal Years 2015, 2014 and 2013. Incentive compensation for executive officers (excluding the CEO) was $1,020, $268 and $221 for Fiscal Years 2015, 2014 and 2013, respectively. The increase in Fiscal 2015 includes special bonuses amounting to $465 paid to key executives for their work on the Merger. The remainder of the increase was due to the performance level achieved by the Company in the current year as compared with prior years. Stock based compensation costs included in other administrative costs were $545, $541 and $745 respectively in Fiscal Years 2015, 2014 and 2013.
29
Revenue from franchise fees is based upon sales volumes generated by Frisch's Big Boy restaurants that are licensed to other operators. The fees are based principally on percentages of sales and are recorded on the accrual method as earned. As of June 2, 2015, 26 Frisch's Big Boy restaurants were licensed to other operators and paying franchise fees to the Company including one that opened for business in August 2014 in Ironton, Ohio. No licensed Frisch's Big Boy restaurants opened or closed during Fiscal Year 2014 or 2013. Other revenue also includes certain other fees earned from Frisch's Big Boy restaurants that are licensed to others along with minor amounts of rent and investment income.
Gains and losses from the sale of assets consist of transactions involving real property and sometimes may include restaurant equipment that is sold together with real property as a package when closed restaurants are sold. Gains and losses reported on this line do not include abandonment losses that routinely arise when certain equipment is replaced before it reaches the end of its expected life; abandonment losses are instead reported in other operating costs.
Gains of $2,999 were recorded in Fiscal Year 2015, which resulted from the July 2014 sale of a former Frisch’s Big Boy restaurant that had ceased operations shortly before its sale, the January 2015 sale of a parcel of land in Covington, Kentucky that had previously been leased to an unrelated third party for the past 15 years, and in March 2015, certain transactions with the Ohio Department of Transportation with respect to land adjacent to the Company’s commissary. Proceeds in Fiscal Year 2015 from sales of real property amounted to $4,222.
Sales of three real properties took place during Fiscal Year 2014, resulting in a net gain of $135. Gains totaling $142 were recorded on two of the transactions - a former Golden Corral restaurant (for which cumulative impairment of assets charges of $791 had been recorded in previous years and an excess piece of property in Louisville, Kentucky. One former Frisch's Big Boy restaurant was sold at a loss of $7 (for which cumulative impairment of assets charges of $574 had been recorded in previous years). Proceeds from the sale of three properties amounted to $1,513.
Losses on the sales of three real properties amounted to $14 in Fiscal Year 2013. The losses were from the sales of two former Frisch's Big Boy restaurants (for which cumulative impairment of assets charges of $1,167 had been recorded in previous years) and one former Golden Corral restaurant (for which impairment of assets charges of $976 had been recorded in previous years). Proceeds from the sales of the three former restaurants amounted to $2,636 in Fiscal Year 2013.
Non-cash impairment of asset charges of $653 were recorded Fiscal Year 2015 to lower the previous estimates of fair value of properties held for sale. The asking price of a certain piece of excess property was lowered by $418 in order to facilitate an expeditious sale. The two remaining former Golden Corral Restaurants were collectively lowered by $235, $212 of which was based on acceptance of a sales contract.
No charges for impairment of assets were recorded during Fiscal Year 2014.
Impairment of assets charges in Fiscal Year 2013 amounted to $390, which reflected the continuation of soft local market conditions for the real estate held for sale by the Company. The 2013 impairment charges consisted of $212 to lower the fair values of the three former Golden Corral restaurants that had closed in August 2011 (two of which remained to be sold as of June 2, 2015), and $178 to lower the fair values of three former Frisch's Big Boy restaurants (all of which have since been sold).
Interest Expense
Interest expense was $370, $586 and $964 respectively, in Fiscal Years 2015, 2014 and 2013. The decreases are primarily the result of lower debt levels. All remaining long-term debt was paid off in Fiscal Year 2015.
30
Income Taxes
Income tax expense as a percentage of pre-tax earnings (effective tax rate) was 23.4 percent in Fiscal Year 2015, 8.3 percent in Fiscal Year 2014, and 26.1 percent in Fiscal Year 2013. Historically, the effective tax rates have been kept consistently low through the Company’s use of available tax credits, principally the federal credit allowed for Employer Social Security and Medicare Taxes Paid on Certain Employee Tips and the federal Work Opportunity Tax Credit (WOTC). In addition, tax benefits associated with the Domestic Production Activities Deduction (DPAD) were included in the effective tax rates for Fiscal Years 2015 and 2014.
The federal Tax Increase Prevention Act of 2014 (the Act) was signed into law on December 19, 2014. The Act reinstated retroactively to January 1, 2014 certain federal tax benefits, generally referred to as the “tax extenders”, which had expired on December 31, 2013. The provisions of the Act included reinstatement of the WOTC. The effect of the reinstatement of WOTC has been recognized in the tax provision for Fiscal Year 2015. Tax benefits associated with WOTC are recognized as certifications are received from state agencies; however, no WOTC tax benefits have been recorded for qualified individuals hired after December 31, 2014.
Management periodically assesses the likelihood of the realization of net deferred tax assets based on historical, current and future (expected) operating results. A valuation allowance is recorded if management believes the Company's net deferred tax assets will not be realized. In addition, management monitors the realization of valuation allowances and may consider their release in the future based on any positive evidence that may become available. Tax returns that the Company files in Indiana and Kentucky have had net operating losses (NOLs) from prior years, on which valuation allowances had been placed previously. Effective June 4, 2014 (the first day of Fiscal Year 2015), management implemented its restructuring plan of the Company’s operations to allow for greater taxable income to be generated in these jurisdictions. In the prior year (Fiscal Year 2014), management released its valuation allowances on its deferred tax assets in Indiana and Kentucky, the result of the impending plan to restructure the Company's consolidated subsidiaries from corporations to single member limited liability corporations. The release of the valuation allowances resulted in an income tax benefit of $222 in Fiscal Year 2014. The release of $222 included $135 that had been placed on these deferred tax assets in the tax provision for Fiscal Year 2013. The Company generated sufficient state taxable income during Fiscal Year 2015 to utilize the entire Kentucky NOL and a portion of the Indiana NOL. Management expects to generate sufficient taxable state income on a go-forward basis to realize its state deferred tax assets, including the remaining Indiana NOL carryforward before its expiration.
While the restructuring plan allows state deferred tax assets to be realized, its implementation on June 4, 2014 (the first day of Fiscal Year 2015) required existing deferred state tax assets to be revalued because the tax status change gave rise to lower apportionment factor percentages, which, in turn, lowered the expected tax benefits. The revaluation resulted in a $138 charge to income tax expense in the first quarter of Fiscal Year 2015.
During Fiscal Year 2014, management undertook a project to identify, quantify and document tax benefits associated with the Domestic Production Activities Deduction (DPAD), which are available under the Internal Revenue Code (IRC). Prior to undertaking this project, management had elected not to claim DPAD tax benefits on the original filings of the Company's income tax returns for Fiscal Years 2010 (filed February 2011), 2011 (filed February 2012), 2012 (filed February 2013) and 2013 (filed February 2014). In February 2014, the Company filed amended tax returns for Fiscal Year 2010 and the Company received a refund of $347 in April 2014. Amended income tax returns for Fiscal Years 2011, 2012 and 2013 were filed in the fourth quarter of Fiscal Year 2014, with expected refunds totaling $714. Total DPAD tax benefits of $1,061 were recorded in Fiscal Year 2014 resulting from amending tax returns for prior years. DPAD tax benefits associated with domestic production activities that occurred during Fiscal Years 2015 and 2014 were incorporated as part of the normal tax provision for those years.
Previously unrecognized tax benefits amounting to approximately $688, which are associated with the December 2014 discovery of a multi-year embezzlement by a former employee are now available to the Company under Section 165 of the IRC. Approximately $606 of the associated tax benefits have been recognized through adjustment to retained earnings as part of an immaterial revision and $82 was recognized during Fiscal Year 2015.
31
The effect of the of the Final Repair Regulations (issued by the IRS) on the Company's Change in Accounting Method (filed in Fiscal Year 2011) has been determined to be a net unfavorable timing difference of approximately $105 ($36 net tax due). The net adjustment consists of a favorable adjustment of $17, ($6 tax benefit), which is realizable in Fiscal Year 2015, and an unfavorable adjustment of $122 ($42 tax due), which is being paid prospectively over a four year period. The appropriate Change in Accounting Method Forms (IRS Form 3115) will be filed with the IRS to conform the previous Change in Accounting Method to the Final Repair Regulations.
The Company believes it has no uncertain tax positions that have been filed or that are expected to be taken on a future tax return. The examination by the IRS of the Company’s federal tax return for Fiscal Year 2013, which was filed in February 2014, was concluded officially in May 2015. The examination resulted in no changes from the original tax return, other than the allowance of DPAD tax benefits discussed in a preceding paragraph.
LIQUIDITY AND CAPITAL RESOURCES
Sources of Funds
Food sales to restaurant customers provide the Company’s principal source of cash. The funds from sales are available immediately for the Company’s use, as substantially all sales to restaurant customers are received in currency or are settled by debit or credit cards. The primary source of cash provided by operating activities is net earnings plus depreciation and impairment of assets, if any. Other sources of cash may include borrowing against credit lines, proceeds received when stock options are exercised and occasional sales of real estate. In addition to servicing debt, these cash flows are utilized for discretionary objectives, including capital projects (restaurant expansion and remodeling costs), capital stock repurchases and dividends.
Working Capital Practices
The Company has historically maintained a strategic negative working capital position, which is a common practice in the restaurant industry. As significant cash flows are provided consistently by operations, this practice should not hinder the Company’s ability to satisfactorily retire any of its obligations when due, including the aggregated contractual obligations and commercial commitments shown in the following table.
Aggregated Information about Contractual Obligations and Commercial Commitments as of June 2, 2015:
| More than | ||||||||||||||||||||||||||||
| Total | Year 1 | Year 2 | Year 3 | Year 4 | Year 5 | 5 years | ||||||||||||||||||||||
| (Payments due by period (in thousands) | ||||||||||||||||||||||||||||
| Long-Term Debt | $ | — | $ | — | $ | — | $ | — | $ | — | $ | — | $ | — | ||||||||||||||
| Interest on Long-Term Debt | — | — | — | — | — | — | — | |||||||||||||||||||||
| Rent due under Capital Lease Obligations | 2,459 | 390 | 365 | 237 | 214 | 1,179 | 74 | |||||||||||||||||||||
| Rent due under Operating Leases (1) | 12,707 | 1,025 | 1,015 | 986 | 926 | 890 | 7,865 | |||||||||||||||||||||
| Purchase obligations (2) | 26,494 | 12,629 | 5,218 | 2,644 | 2,505 | 2,629 | 869 | |||||||||||||||||||||
| Other long-term Obligations (3) | 309 | 101 | 103 | 105 | — | — | — | |||||||||||||||||||||
| Total Contractual Cash Obligations | $ | 41,969 | $ | 14,145 | $ | 6,701 | $ | 3,972 | $ | 3,645 | $ | 4,698 | $ | 8,808 | ||||||||||||||
| 1. | Operating leases may include option periods yet to be exercised, when exercise is determined to be reasonably assured. |
32
| 2. | Consists primarily of commitments for certain food and beverage items, plus capital projects including commitments to purchase real property, if any. Includes a contract entered November 1, 2013 with Pepsico Sales, Inc. (Pepsi and Dole beverages replaced Coke and Minute Maid beverages), the term of which is specified by the longer of seven years or an agreed upon number of gallons. Does not include agreements that can be canceled without penalty. |
| 3. | Consists of certain community involvement commitments. |
The Company's working capital deficit was $965 as of June 2, 2015. The Company's working capital deficit at June 3, 2014 was $5,595. The increase in working capital is attributable to the early retirement of all outstanding long-term debt and greater cash balances at year end primarily due to lower capital expenditures.
A financing package of unsecured credit facilities has been in place for many years with the same lending institution, currently styled (since October 2013) as the 2013 Loan Agreement:
| · | Revolving Credit Facility - $11,000 is available to fund temporary working capital through October 31, 2016. |
| · | Construction Credit Facility - $5,000 is available for construction financing through October 31, 2016. At the lender's discretion, the Company may request that the Construction facility be increased up to $15,000 at any time. |
As of June 2, 2015, The Company was in full compliance with the covenants contained in the 2013 Loan Agreement. However, the closing of the transaction contemplated by the Merger Agreement would effectively terminate the 2013 Loan Agreement and the Company would need a new source of credit facilities in order to maintain its existing borrowing capacity.
Operating Activities
Net cash provided by operations was $18,800 in Fiscal Year 2015, which compares with $21,415 in Fiscal Year 2014 and $19,063 Fiscal Year 2013. Management measures cash flows from operations by simply adding back certain non-cash expenses to earnings, which has the effect of excluding normal changes in assets and liabilities such as prepaid expenses, inventories, accounts payable and accrued, prepaid and deferred income taxes, all of which can and often do fluctuate widely from year to year. These non-cash expenses include items such as depreciation, gains and losses on dispositions of assets, charges for impairment of long-lived assets (if any), stock based compensation costs and pension costs in excess of plan contributions. The result of this approach is shown as a sub-total in the Consolidated Statement of Cash Flows: $16,614 in Fiscal Year 2015, $20,609 in Fiscal Year 2014 and $19,076 in Fiscal Year 2013.
Investing Activities
Capital spending is the principal component of the Company’s continuing investing activities. Capital spending was $8,270 during Fiscal Year 2015 down from $13,160 in Fiscal Year 2014, and $9,837 in Fiscal Year 2013. These capital expenditures typically consist of site acquisitions for expansion, new restaurant construction (one and two new Frisch's Big Boy restaurants were opened respectively in Fiscal Years 2014 and 2013), plus ongoing reinvestments in existing restaurants including remodeling jobs, dining room expansions, routine equipment replacements and other maintenance capital outlays.
Proceeds from disposition of property amounted to $4,378 in Fiscal Year 2015 ($4,222 in real property and $156 in other operating assets), $1,543 in Fiscal Year 2014 ($1,513 in real property and $30 in other operating assets), $2,680 in Fiscal Year 2013 ($2,636 in real property and $44 in other operating assets). The specifics of the real property sold in each of the last three fiscal years may be found in the earlier discussion on gains and losses under the caption "Operating Profit". Two former Golden Corral Restaurants (closed August 2011) and seven parcels of surplus property are currently held for sale at an aggregate asking price of approximately $4,314.
Financing Activities
On December 9, 2014, the Company paid $3,101 for the early retirement of six term loans and on April 2, 2015, the Company elected to retire the two remaining term loans with a payment of $2,208. Included in the early termination payments are early termination penalty payments of $84. Total scheduled and other payments of long-term debt (including early retirement) and capital lease obligations amounted to $6,983 during Fiscal Year 2015. There were no borrowings under the Company’s credit lines during Fiscal Year 2015.
33
When the 2013 Loan Agreement was executed on October 31, 2013 (Fiscal Year 2014), $2,000 was simultaneously drawn under the Revolving Credit Facility (Revolver) to refinance certain high interest Construction Term Loans. As part of the refinancing, six outstanding Construction Term Loans were retired with a single payment of $3,835, which was sourced from $1,835 in cash on hand and $2,000 drawn on the Revolver. Additionally, $1,500 was borrowed on the Revolver in February 2014 to meet working capital needs during the winter. Scheduled and other payments of long-term debt and capital lease obligations amounted to $11,438 during Fiscal Year 2014, which included $3,500 to retire the amounts that had been borrowed on the Revolver.
Regular quarterly cash dividends to shareholders amounted to $3,995 in Fiscal Year 2015, or $0.78 per share. The dividend per share was $0.70 and $0.64 in Fiscal Year 2014 and 2013, respectively. In addition, a $0.20 per share quarterly dividend was declared on June 12, 2015. Its payment of $1,026 on July 10, 2015 was the 218th consecutive quarterly dividend paid by the Company. Pending the closing of the transaction contemplated by the Agreement and Plan of Merger, the Company expects to suspend future payments of regular quarterly cash dividends.
In addition to regular quarterly cash dividends, a special one-time cash dividend of $9.50 per share was paid in Fiscal Year 2013 (on September 14, 2012), which amounted to $47,963 (financed principally with the proceeds from the sale of 29 Golden Corral restaurants in May 2012).
During Fiscal Year 2015, 10,917 shares of the Company’s common stock were re-issued from the Company’s treasury pursuant to the exercise of stock options. The aggregate strike price was $191, all of which was received by the Company in cash, including $173 directly from the holders of the options with the remainder settled through a broker pursuant to “cashless exercises”. As of June 2, 2015, 38,500 shares granted under the Company’s stock option plans remained outstanding, all of which were fully vested at an average exercise price of $17.03 per share. The closing price of the Company’s stock on June 2, 2015 was $33.81. The intrinsic value of the 38,500 fully vested “in-the-money” options was $646, which if exercised on that date, would have yielded $656 in proceeds to the Company. Pending the closing of the transaction contemplated by the Agreement and Plan of Merger which is anticipated to close during the first quarter of Fiscal 2016, the remaining 38,500 outstanding options would be converted into a right to receive an amount in cash equal to the excess of the Merger Consideration over the per share exercise price.
During Fiscal Year 2014, 12,502 shares of the Company's common stock were re-issued from the Company's treasury pursuant to the exercise of "cashless" stock options. The aggregate strike price was $172, all of which was received by the Company in cash, as all of the transactions were settled through a stock broker.
During Fiscal Year 2013, 320,416 shares of the Company’s common stock were re-issued from the Company's treasury pursuant to the exercise of stock options. The aggregate strike price for the options was $7,467, of which $2,398 was received in cash and $5,069 was charged to the treasury stock account to record shares re-acquired in connection with the exercise of "cashless" stock options that would otherwise have been be settled through a broker on the open market.
On October 22, 2014, 10,773 shares of restricted stock were granted to non-employee members of the Board of Directors and an award of 1,539 restricted shares was granted to the Chief Executive Officer (CEO) pursuant to the terms of his employment contract. The total fair value of the awards amounted to $320, which is being expensed ratably (beginning in the second quarter of 2015) over a one year vesting period ($197 in Fiscal Year 2015). On October 2, 2013 (Fiscal Year 2014), 11,984 shares of restricted stock were granted to non-employee members of the Board of Directors and an award of 1,712 restricted shares was granted to the CEO. The total fair value of the October 2013 grant was $320, of which the run out of the final $123 was expensed in Fiscal Year 2015. Restricted shares granted in October 2012 (Fiscal Year 2013) also amounted to $320, which followed the same expense pattern of the restricted shares granted in October 2014 and 2013.
All restricted shares vest in full on the first anniversary date of the award, unless accelerated by the Compensation Committee of the Board of Directors. Full voting and dividend rights are provided prior to vesting. Vested shares must be held until board service or employment ends, except that enough shares may be sold to satisfy tax obligations attributable to the grants. As of June 2, 2015, $123 of expense related to the restricted stock grant in October 2014 has yet to be expensed. If the contemplated transaction related to the Agreement and Plan of Merger closes in the first quarter of Fiscal Year 2016 as expected, the restricted options would become fully vested and any remaining unvested balances would be expensed upon the closing of the transaction.
34
The CEO's Employment Agreement was amended in June 2013 to allow the Committee to grant Performance Awards to the CEO under the 2012 Stock Option and Incentive Plan (2012 Plan). The Committee granted a new two year Performance Award to the CEO effective May 29, 2013 to govern the CEO's incentive compensation for the last two years of the Employment Agreement (Fiscal Years 2014 and 2015). In Fiscal Year 2015, $589 was expensed related to performance in Fiscal Year 2015. This amount was subsequently paid in cash in August 2015. Related to performance in Fiscal Year 2014, $426 was expensed and was subsequently paid in 90 percent cash and 10 percent stock in the first quarter of Fiscal Year 2015. Previously, the Committee had granted a Performance Award to the CEO under the 2003 Stock Option and Incentive Plan, to govern the CEO’s incentive compensation for Fiscal Year 2013, which amounted to $409, also paid in 90 percent cash and 10 percent in stock.
In recognition of their performance during Fiscal Year 2014, a group of executive officers (excluding the CEO) and key employees was granted an aggregate award of 9,685 shares of unrestricted stock (2012 Plan) in July 2014. The total value of the award amounted to $221, which was accrued in Fiscal Year 2014. An aggregate award of 13,450 shares of unrestricted stock (2012 Plan) was granted in June 2013 to the same group, the total value of which amounted to $244, which was accrued in Fiscal Year 2013. In recognition of their performance during Fiscal Year 2015, $225 was accrued during the year for the same group of executive officers and other key employees. However, the amount was subsequently paid in cash due to the pending Merger transaction in July 2015.
The fair value of stock options granted and restricted stock issued is recognized as compensation cost on a straight-line basis over the vesting periods of the awards. Although no stock options have been granted since June 2010, compensation cost continued in Fiscal Year 2013 from the run-out of the vesting period. Compensation costs arising from all share-based payments are charged to administrative and advertising expense in the Consolidated Statement of Earnings:
| Fiscal Year | Fiscal Year | Fiscal Year | ||||||||||
| 2015 | 2014 | 2013 | ||||||||||
| (in thousands) | ||||||||||||
| Stock options granted | $ | — | $ | — | $ | 54 | ||||||
| Restricted stock issued | 320 | 320 | 320 | |||||||||
| Unrestricted stock issued | — | — | 127 | |||||||||
| Unrestricted stock accrued | 225 | 221 | 244 | |||||||||
| Share-based compensation cost, pretax | $ | 545 | $ | 541 | $ | 745 | ||||||
On July 25, 2012, the Board of Directors authorized the purchase over a three year period, on the open market and in transactions negotiated privately, up to 450,000 shares of the Company's common stock. No shares were acquired under the program during the Fiscal Year 2015 and 2014. During Fiscal Year 2013, the Company re-acquired 212,929 shares under the program at a cost of $6,708, which includes 32,000 shares that had been beneficially owned by the CEO and 180,929 shares that were re-acquired in connection with the exercise of "cashless" stock options that otherwise would have settled through a stock broker on the open market.
Separate from the repurchase program discussed above, the Company’s treasury during Fiscal Years 2015, 2014 and 2013, acquired 2,736, 5,381 and 5,227 shares of the Company’s common stock, respectively to cover withholding tax obligations in connection with restricted and unrestricted stock awards. The costs associated with the re-acquired treasury shares was $63, $105 and $119, respectively.
35
Other Information
No new Company owned and operated Frisch’s Big Boy Restaurants were opened for business during Fiscal Year 2015. No construction of any new Frisch's Big Boy restaurants was in progress as of June 2, 2015. Although there are no contracts currently pending to acquire or lease land on which to build, the Company owns five land tracts at various locations in Ohio, Kentucky and Indiana for which development has been deferred for the time being.
Including land and land improvements, the cost required to build and equip each new Frisch's Big Boy restaurant opened by the Company over the last three fiscal years has ranged from $2,250 to $3,825. The actual cost depends greatly on the price paid for the land and the cost of land improvements, both of which can vary widely from location to location, and whether the land is purchased or leased. Costs also depend on whether new restaurants are constructed using plans for the original 2001 building prototype (5,700 square feet with seating for 172 guests) or its smaller adaptation, the 2010 building prototype (5,000 square feet with seating for 148 guests), which is used in smaller trade areas. The larger 2001 building prototype was used to build the Frisch's Big Boy restaurant that opened in December 2013. Its total cost amounted to approximately $3,825, of which $1,100 was for the land.
Approximately one-fifth of the Frisch's Big Boy restaurants are routinely renovated or decoratively updated each year. The renovations not only refresh and upgrade interior finishes, but are also designed to synchronize the interiors and exteriors of older restaurants with that of newly constructed restaurants. Depending on age and other factors, the current cost to renovate/update a Frisch's Big Boy restaurant approximates $100 to $110 for a minor remodeling and ranges from $150 to $250 for a major remodeling. During Fiscal Year 2015, approximately $2,800 was spent on 23 remodel jobs. The Fiscal Year 2016 remodeling plan calls for 18 restaurants to be remodeled at a budgeted cost of approximately $2,800.
Certain high-volume restaurants are regularly evaluated to determine whether their kitchens should be redesigned for increased efficiencies and whether an expansion of the dining room is warranted. A typical kitchen redesign costs approximately $150 and a dining room expansion can cost more than $800. One restaurant received a dining room expansion and a third cook line added to its kitchen during Fiscal Year 2014, at a total cost in excess of $900.
Part of the Company’s strategic plan entails owning the land on which it builds new restaurants. However, it is sometimes necessary to enter ground leases to obtain desirable land on which to build. As of June 2, 2015, 15 Frisch's Big Boy restaurants were in operation on non-owned premises - one capital lease and 14 operating leases.
The Company remains contingently liable under certain ground lease agreements relating to land on which seven of the Company's former Golden Corral restaurants are situated. The seven leases were assigned to Golden Corral Corporation (GCC) as part of the May 2012 transaction to sell the restaurants to GCC. The amount remaining under contingent lease obligations totaled $5,692 as of June 2, 2015, for which the aggregate average annual lease payments approximate $680 in each of the next five years. Since there is no reason to believe that GCC (the owner and franchisor of the Golden Corral brand) is likely to default, no provision has been made in the consolidated financial statements for amounts that would be payable by the Company.
APPLICATION OF CRITICAL ACCOUNTING POLICIES
The preparation of financial statements in conformity with accounting principles generally accepted in the United States of America requires management to use estimates and assumptions to measure certain items that affect the amounts reported in the financial statements and accompanying footnotes. These judgments are based on knowledge and experience about past and current events, and assumptions about future events. Accounting estimates can and do change as new events occur and additional information becomes available. Actual results may differ markedly from management's current judgment.
Two factors are required for an accounting policy to be deemed critical. The policy must be significant to the fair presentation of a company’s financial condition and its results of operations, and the policy must require management’s most difficult, subjective or complex judgments. Management believes the following to be the Company’s critical accounting policies.
36
Self-Insurance
Subject to a two year cycle, the Company self-insures a significant portion of expected losses from its workers’ compensation program in the state of Ohio. Insurance coverage is purchased from an insurance company for protection against individual claims that exceed $400 (was $300 prior to June 4, 2014).
An actuarial consulting firm provided an independent estimate of the Company's required unpaid loss and allocated loss adjustment expense for accidents occurring since the inception of the Company's self-insured program through each of the fiscal years ended June 3, 2014 (Fiscal Year 2014) and June 2, 2015 (Fiscal Year 2015). As the expected value estimates provided by the actuarial consulting firm are developed over the range of reasonably possible (as opposed to all conceivable) outcomes, unexpected case developments could result in actual costs differing materially from estimated values presently carried in the self-insurance reserves. Based on the consulting firm's independent estimates, management adjusts its self-insured reserves at the end of each fiscal year. Management monitors claim data as presented by its third party administrator (TPA) of the program and will only make interim period adjustments to the self-insured reserves if a catastrophic claim is incurred or if actual payments of claims differ significantly from the expected payment patterns developed by the actuarial consulting firm.
The actuarial consulting firm also provided forward estimates (based on historical claims data) of the ultimate value of claims that will be incurred during ensuing fiscal years. Management used the actuarial consulting firm's forward estimates to build the claims reserve for Fiscal Year 2015 and is using the firm's forward estimate to build the claims reserve for Fiscal Year 2016.
Pension Plans
Pension plan accounting requires rate assumptions for future compensation increases and the long-term investment return on plan assets. A discount rate is also applied to the calculations of net periodic pension cost and projected benefit obligations. A committee consisting of executives from the Finance Department and the Human Resources Department, with guidance provided by the Company’s actuarial consulting firm, develops these assumptions each year. The consulting firm also provides services in calculating estimated future obligations and net periodic pension cost.
To determine the long-term rate of return on plan assets, the committee considers a weighted average of the historical broad market return and the forward looking expected return. Returns are developed based on the plan's target asset allocation: 70 percent Domestic Equity, 25 percent Fixed Income and 5 percent Cash. The model to develop the historical broad market return assumes the widest period of historical data available for each asset class (as early as 1926 (in some cases) through 2013). Domestic equity securities are allocated equally between large cap and small cap funds, with fixed income securities allocated equally between long-term corporate/government bonds and intermediate-term government bonds. The model for the forward looking expected return uses a range of expected outcomes over a number of years based on the plan's asset allocation as noted above and assumptions about the return, variance, and co-variance for each asset class. The historical and forward looking returns are adjusted to reflect a 0.20 percent investment expense assumption representative of passive investments. The weighted average of the historical broad market return and the forward looking expected return is rounded to the level of the nearest 25 basis points to determine the overall expected rate of return on plan assets.
The discount rate is selected by matching the cash flows of the pension plan to that of a yield curve that provides the equivalent yields on zero-coupon bonds for each maturity. Benefit cash flows due in a particular year can be "settled" theoretically by "investing" them in the zero-coupon bond that matures in the same year. The discount rate is the single rate that produces the same present value of cash flows. The selection of the discount rate represents the equivalent single rate under a broad market AA yield curve. (The Above Mean Yield Curve developed by the Company's actuarial consulting firm has been used for this purpose since the May 28, 2013 measurement date.) The yield curve is used to set the discount rate assumption using cash flows on an aggregate basis, which is then rounded to the level of the nearest 10 basis points.
Pension plan assets are targeted to be invested 70 percent in equity securities, as these investments have historically provided the greatest long-term returns. Poor performance in equity securities markets can significantly lower the market values of the investment portfolios, which, in turn, can result in a) material increases in future funding requirements, b) much higher net periodic pension costs to be recognized in future years, and c) increases in underfunded plan status, requiring the Company’s equity to be reduced.
37
Long-Lived Assets
Long-lived assets include property and equipment, goodwill and other intangible assets. Judgments and estimates are used to determine the carrying value of long-lived assets. This includes the assignment of appropriate useful lives, which affect depreciation and amortization expense. Capitalization policies are continually monitored to assure they remain appropriate.
Management considers a history of cash flow losses on a restaurant-by-restaurant basis to be the primary indicator of potential impairment. Carrying values of property and equipment are tested for impairment at least annually, and whenever events or circumstances indicate that the carrying values of the assets may not be recoverable from the estimated future cash flows expected to result from the use and eventual disposition of the property. When undiscounted expected future cash flows are less than carrying values, an impairment loss is recognized equal to the amount by which carrying values exceed fair value, which is determined as either 1) the greater of the net present value of the future cash flow stream, or 2) by opinions of value provided by real estate brokers and/or management's judgment as developed through its experience in disposing of unprofitable restaurant operations. Broker opinions of value and the judgment of management consider various factors in their fair value estimates such as the sales of comparable area properties, general economic conditions in the area, physical condition and location of the subject property, and general real estate activity in the local market. Future cash flows can be difficult to predict. Changing neighborhood demographics and economic conditions, and many other factors may influence operating performance, which affect cash flows.
Sometimes it becomes necessary to cease operating a certain restaurant due to poor operating performance. The ultimate loss can be significantly different from the original impairment charge, particularly if the eventual market price received from the disposition of the property differs materially from initial estimates of fair values.
Acquired goodwill and other intangible assets are tested for impairment annually or whenever an impairment indicator arises.
Income Taxes
The provision for income taxes is based on management's estimate of federal, state and local tax liabilities. These estimates include, but are not limited to, the application of statutory federal, state and local tax rates to estimated taxable income, and the effect of tax credits such as the federal credits allowed for Employer Social Security and Medicare Taxes Paid on Certain Employee Tips and the Work Opportunity Tax Credit (WOTC). All tax returns are timely filed and subject to audit by all levels of taxing authority. Audits can result in a different interpretation of tax laws from that of management.
Deferred tax assets and liabilities result from timing differences in the recognition of revenue and expense between financial reporting and tax statutes. Deferred tax accounting requires management to evaluate deferred tax assets, including net operating loss carry forwards. These evaluations entail complex projections that require considerable judgment and ultimately are subject to future changes in tax laws including changes in tax rates. Part of the evaluation requires management to assess whether deferred tax assets will more likely than not be realized on a future tax return. If management's evaluation determines that it is more likely that such deferred assets will not be realized, a valuation allowance will be recorded. The Company does not currently carry any valuation allowances against its deferred tax assets.
38
Item 7A. Quantitative and Qualitative Disclosures about Market Risk
Conditions in the financial and commodity markets are subject to change at any time.
Management believes the Company has no significant market risk exposure to interest rate changes as the Company has no outstanding debt at June 2, 2015. Under the Company’s existing loan agreement, all of the Company's long-term debt, if any, would be financed with fixed interest rates within six months from the date of borrowing. The Company does not currently use derivative financial instruments to manage its exposure to changes in interest rates. Any cash equivalents maintained by the Company have original maturities of 90 days or less. Cash may be in excess of FDIC limits. The Company does not use any foreign currency in its operations.
Operations are vertically integrated, using centralized purchasing and food preparation, provided through the Company’s commissary and food manufacturing plant. Management believes the commissary operation ensures uniform product quality and safety, timeliness of distribution to restaurants and creates efficiencies that ultimately result in lower food and supply costs.
Commodity pricing affects the cost of many of the Company’s food products. Commodity pricing can be extremely volatile, affected by many factors outside of management's control, including import and export restrictions, the influence of currency markets relative to the U.S. dollar, the effects of supply versus demand, production levels and the impact that adverse weather conditions may have on crop yields.
Certain commodities purchased by the commissary, principally beef, chicken, pork, dairy products, fresh produce, fish, French fries and coffee, are generally purchased based upon market prices established with vendors. Purchase contracts for some of these items may contain contractual provisions that limit the price to be paid. These contracts are normally for periods of one year or less but may have longer terms if favorable long-term pricing becomes available. Food supplies are generally plentiful and may be obtained from any number of suppliers, which mitigates the Company’s overall commodity cost risk. Quality, timeliness of deliveries and price are the principal determinants of source. The Company does not use financial instruments as a hedge against changes in commodity pricing.
39
Item 8. Financial Statements and Supplementary Data
The following financial statements and reports are included in Item 8 of this report:
40
REPORT OF MANAGEMENT ON INTERNAL CONTROL OVER FINANCIAL REPORTING
Management of the Company is responsible for establishing and maintaining adequate internal control over the Company’s financial reporting, and for performing an assessment of the effectiveness of internal control over financial reporting as of June 2, 2015. Internal control over financial reporting is a process designed to provide reasonable assurance regarding the reliability of financial reporting and the preparation of financial statements for external purposes in accordance with generally accepted accounting principles. The Company’s system of internal control over financial reporting includes those policies and procedures that (i) pertain to the maintenance of records that, in reasonable detail, accurately and fairly reflect the transactions and dispositions of the assets of the Company; (ii) provide reasonable assurance that transactions are recorded as necessary to permit preparation of financial statements in accordance with generally accepted accounting principles, and that receipts and expenditures of the Company are being made only in accordance with authorizations of management and directors of the Company; and (iii) provide reasonable assurance regarding prevention or timely detection of unauthorized acquisition, use, or disposition of the Company’s assets that could have a material effect on the financial statements.
Because of its inherent limitations, internal control over financial reporting may not prevent or detect misstatements. Also, projections of any evaluation of effectiveness to future periods are subject to the risk that controls may become inadequate because of changes in conditions, or that the degree of compliance with the policies or procedures may deteriorate. Accordingly, even an effective system of internal control over financial reporting will provide only reasonable assurance with respect to the reliability of financial reporting and financial statement preparation.
Management performed an assessment of the effectiveness of the Company’s internal control over financial reporting as of June 2, 2015 based upon criteria in the 1992 Internal Control – Integrated Framework issued by the Committee of Sponsoring Organizations of the Treadway Commission (COSO). Management concluded that there were material weaknesses in internal controls over financial reporting related to (i) Information Technology General Controls (ITGC) intended to restrict access to data and applications, (ii) Controls over company disbursements and (iii) the Company’s failure to adequately assess user controls over information provided by third parties. A material weakness is a deficiency or a combination of deficiencies, in internal control over financial reporting, such that there is a reasonable possibility that a material misstatement of the Company’s annual or interim financial statements will not be prevented or detected on a timely basis.
Based on the assessment, management concluded that internal controls over financial reporting was not effective as of the end of the period covered by this Annual Report on Form 10-K.
The Board of Directors meets its responsibility for oversight of the integrity of the Company’s financial statements through its Audit Committee, which is composed entirely of four independent directors, none of whom are employees of the Company and three of whom are financial experts. The Audit Committee meets periodically with management and Internal Audit to review their work and confirm that their respective responsibilities are being properly discharged. In addition, Grant Thornton LLP, the Company’s independent registered public accounting firm, has full access to the Audit Committee to discuss the results of their audit work, the effectiveness of internal accounting controls and the quality of financial reporting.
The Company’s internal control over financial reporting as of June 2, 2015 has been audited by Grant Thornton LLP, as is stated in their report that is presented in these financial statements which appears herein.
| August, 14, 2015 | |
| Date | |
| /s/ Craig F. Maier | |
| Craig F. Maier | |
| President and Chief Executive Officer | |
| /s/ Mark R. Lanning | |
| Mark R. Lanning | |
| Vice President-Finance, Chief Financial Officer, | |
| Principal Financial Officer | |
| and Principal Accounting Officer |
41
REPORT OF INDEPENDENT REGISTERED PUBLIC ACCOUNTING FIRM
Board of Directors and Shareholders
Frisch’s Restaurants, Inc.
We have audited the accompanying consolidated balance sheets of Frisch’s Restaurants, Inc. (an Ohio corporation) and Subsidiaries (the “Company”) as of June 2, 2015 and June 3, 2014, and the related consolidated statements of earnings, comprehensive income, shareholders’ equity, and cash flows for each of the three years in the period ended June 2, 2015. These financial statements are the responsibility of the Company’s management. Our responsibility is to express an opinion on these financial statements based on our audits.
We conducted our audits in accordance with the standards of the Public Company Accounting Oversight Board (United States). Those standards require that we plan and perform the audit to obtain reasonable assurance about whether the financial statements are free of material misstatement. An audit includes examining, on a test basis, evidence supporting the amounts and disclosures in the financial statements. An audit also includes assessing the accounting principles used and significant estimates made by management, as well as evaluating the overall financial statement presentation. We believe that our audits provide a reasonable basis for our opinion.
In our opinion, the consolidated financial statements referred to above present fairly, in all material respects, the financial position of Frisch’s Restaurants, Inc. and Subsidiaries as of June 2, 2015 and June 3, 2014, and the results of their operations and their cash flows for each of the three years in the period ended June 2, 2015 in conformity with accounting principles generally accepted in the United States of America.
We also have audited, in accordance with the standards of the Public Company Accounting Oversight Board (United States), the Company’s internal control over financial reporting as of June 2, 2015, based on criteria established in the 1992 Internal Control—Integrated Framework issued by the Committee of Sponsoring Organizations of the Treadway Commission (COSO), and our report dated August 14, 2015 expressed an adverse opinion.
| /s/ GRANT THORNTON LLP |
| Cincinnati, Ohio |
| August 14, 2015 |
42
REPORT OF INDEPENDENT REGISTERED PUBLIC ACCOUNTING FIRM
Board of Directors and Shareholders
Frisch’s Restaurants, Inc.
We have audited the internal control over financial reporting of Frisch’s Restaurants, Inc. (an Ohio corporation) and Subsidiaries (the “Company”) as of June 2, 2015, based on criteria established in the 1992 Internal Control—Integrated Framework issued by the Committee of Sponsoring Organizations of the Treadway Commission (COSO). The Company’s management is responsible for maintaining effective internal control over financial reporting and for its assessment of the effectiveness of internal control over financial reporting, included in the accompanying Report of Management on Internal Control over Financial Reporting (“Management’s Report”). Our responsibility is to express an opinion on the Company’s internal control over financial reporting based on our audit.
We conducted our audit in accordance with the standards of the Public Company Accounting Oversight Board (United States). Those standards require that we plan and perform the audit to obtain reasonable assurance about whether effective internal control over financial reporting was maintained in all material respects. Our audit included obtaining an understanding of internal control over financial reporting, assessing the risk that a material weakness exists, testing and evaluating the design and operating effectiveness of internal control based on the assessed risk, and performing such other procedures as we considered necessary in the circumstances. We believe that our audit provides a reasonable basis for our opinion.
A company’s internal control over financial reporting is a process designed to provide reasonable assurance regarding the reliability of financial reporting and the preparation of financial statements for external purposes in accordance with generally accepted accounting principles. A company’s internal control over financial reporting includes those policies and procedures that (1) pertain to the maintenance of records that, in reasonable detail, accurately and fairly reflect the transactions and dispositions of the assets of the company; (2) provide reasonable assurance that transactions are recorded as necessary to permit preparation of financial statements in accordance with generally accepted accounting principles, and that receipts and expenditures of the company are being made only in accordance with authorizations of management and directors of the company; and (3) provide reasonable assurance regarding prevention or timely detection of unauthorized acquisition, use, or disposition of the company’s assets that could have a material effect on the financial statements.
Because of its inherent limitations, internal control over financial reporting may not prevent or detect misstatements. Also, projections of any evaluation of effectiveness to future periods are subject to the risk that controls may become inadequate because of changes in conditions, or that the degree of compliance with the policies or procedures may deteriorate.
A material weakness is a deficiency, or combination of control deficiencies, in internal control over financial reporting, such that there is a reasonable possibility that a material misstatement of the company’s annual or interim financial statements will not be prevented or detected on a timely basis. The following material weaknesses have been identified and included in management’s assessment.
| · | The Information Technology General Controls (“ITGC”) intended to restrict access to data and applications were not adequate, resulting in inappropriate access and improper segregation of duties at both the Information Technology and end user levels and across multiple applications. As a result of the pervasiveness of the ITGC weaknesses noted above and the degree to which the activity level controls rely on their effectiveness, the Company did not maintain a control environment that was designed and operating to prevent or detect a material misstatement in the Company’s consolidated financial statements. |
43
| · | Internal controls over the Company’s disbursement process were not adequate, and not designed or operating to prevent or detect a material misstatement in the Company’s consolidated financial statements. |
| · | The Company did not sufficiently assess its user controls related to third party service providers, and did not timely demonstrate that controls as designed would prevent or detect a material misstatement in the Company’s consolidated financial statements. |
In our opinion, because of the effect of the material weaknesses described above on the achievement of the objectives of the control criteria, the Company has not maintained effective internal control over financial reporting as of June 2, 2015, based on criteria established in the 1992 Internal Control—Integrated Framework issued by COSO.
We also have audited, in accordance with the standards of the Public Company Accounting Oversight Board (United States), the consolidated financial statements of the Company as of and for the year ended June 2, 2015. The material weaknesses identified above were considered in determining the nature, timing, and extent of audit tests applied in our audit of the June 2, 2015 consolidated financial statements, and this report does not affect our report dated August 14, 2015, which expressed an unqualified opinion on those financial statements.
| /s/ GRANT THORNTON LLP |
| Cincinnati, Ohio |
| August 14, 2015 |
44
FRISCH’S RESTAURANTS, INC. AND SUBSIDIARIES
CONSOLIDATED BALANCE SHEET
June 2, 2015 and June 3, 2014
ASSETS
| 2015 | 2014 | |||||||
| (in thousands) | ||||||||
| Current Assets | ||||||||
| Cash and equivalents | $ | 4,959 | $ | 1,124 | ||||
| Trade and other accounts receivable | 2,218 | 1,900 | ||||||
| Inventories | 6,267 | 5,637 | ||||||
| Prepaid expenses, sundry deposits and other | 1,112 | 1,260 | ||||||
| Deferred income taxes and other tax receivables | 2,263 | 3,393 | ||||||
| Total current assets | 16,819 | 13,314 | ||||||
| Property and Equipment | 232,646 | 231,931 | ||||||
| Accumulated depreciation and amortization | 131,286 | 127,069 | ||||||
| Net property and equipment | 101,360 | 104,862 | ||||||
| Other Assets | ||||||||
| Goodwill and other intangible assets | 770 | 773 | ||||||
| Real property not used in operations | 6,029 | 6,744 | ||||||
| Other | 4,033 | 3,261 | ||||||
| Total other assets | 10,832 | 10,778 | ||||||
| Total assets | $ | 129,011 | $ | 128,954 | ||||
The accompanying notes are an integral part of the consolidated financial statements.
45
FRISCH’S RESTAURANTS, INC. AND SUBSIDIARIES
CONSOLIDATED BALANCE SHEET
June 2, 2015 and June 3, 2014
LIABILITIES AND SHAREHOLDERS’ EQUITY
| 2015 | 2014 | |||||||
| (in thousands, except share data) | ||||||||
| Current Liabilities | ||||||||
| Long-term debt, current maturities | $ | — | $ | 1,996 | ||||
| Accounts payable | 6,248 | 7,594 | ||||||
| Accrued expenses | 11,536 | 9,319 | ||||||
| Total current liabilities | 17,784 | 18,909 | ||||||
| Long-Term Obligations | ||||||||
| Long-term debt, less current maturities | — | 4,737 | ||||||
| Deferred income taxes | 3,306 | 2,340 | ||||||
| Underfunded pension obligation | — | 1,867 | ||||||
| Deferred compensation | 4,040 | 3,617 | ||||||
| Other long-term obligations | 3,871 | 4,231 | ||||||
| Total long-term obligations | 11,217 | 16,792 | ||||||
| Shareholders’ Equity | ||||||||
| Preferred stock - 3,000,000 shares authorized without par value; none issued | — | — | ||||||
| Common stock - 12,000,000 shares authorized without par value; 7,586,764 shares issued - stated value - $1.00 | 7,587 | 7,587 | ||||||
| Additional contributed capital | 69,743 | 69,513 | ||||||
| 77,330 | 77,100 | |||||||
| Accumulated other comprehensive loss | (103 | ) | (174 | ) | ||||
| Retained earnings | 61,668 | 55,708 | ||||||
| 61,565 | 55,534 | |||||||
| Common stock in treasury (2,455,185 and 2,487,752 shares) | (38,885 | ) | (39,381 | ) | ||||
| Total shareholders’ equity | 100,010 | 93,253 | ||||||
| Total liabilities and shareholders’ equity | $ | 129,011 | $ | 128,954 | ||||
The accompanying notes are an integral part of the consolidated financial statements.
46
FRISCH’S RESTAURANTS, INC. AND SUBSIDIARIES
CONSOLIDATED STATEMENT OF EARNINGS
Three years ended June 2, 2015
| 2015 | 2014 | 2013 | ||||||||||
| (in thousands, except per share data) | ||||||||||||
| Sales | $ | 211,893 | $ | 209,173 | $ | 203,712 | ||||||
| Cost of sales | ||||||||||||
| Food and paper | 70,536 | 70,088 | 68,268 | |||||||||
| Payroll and related | 72,986 | 74,236 | 71,523 | |||||||||
| Other operating costs | 42,091 | 42,973 | 41,368 | |||||||||
| Total cost of Sales | 185,613 | 187,297 | 181,159 | |||||||||
| Restaurant operating income | 26,280 | 21,876 | 22,553 | |||||||||
| Administrative and advertising | 16,725 | 12,539 | 13,424 | |||||||||
| Franchise fees and other revenue, net | (1,471 | ) | (1,439 | ) | (1,376 | ) | ||||||
| (Gain) loss on sale of real property | (2,999 | ) | (135 | ) | 14 | |||||||
| Impairment of long-lived assets | 653 | — | 390 | |||||||||
| Operating income | 13,372 | 10,911 | 10,101 | |||||||||
| Interest expense | 370 | 586 | 964 | |||||||||
| Earnings from continuing operations before income taxes | 13,002 | 10,325 | 9,137 | |||||||||
| Income taxes | 3,047 | 853 | 2,388 | |||||||||
| Earnings from continuing operations | 9,955 | 9,472 | 6,749 | |||||||||
| Loss from discontinued operations, net of tax | — | — | (158 | ) | ||||||||
| NET EARNINGS | $ | 9,955 | $ | 9,472 | $ | 6,591 | ||||||
| Basic net earnings per share: | ||||||||||||
| Earnings from continuing operations | $ | 1.94 | $ | 1.86 | $ | 1.34 | ||||||
| Loss from discontinued operations | — | — | (0.03 | ) | ||||||||
| Basic net earnings per share | $ | 1.94 | $ | 1.86 | $ | 1.31 | ||||||
| Diluted net earnings per share: | ||||||||||||
| Earnings from continuing operations | $ | 1.94 | $ | 1.86 | $ | 1.34 | ||||||
| Loss from discontinued operations | — | — | (0.03 | ) | ||||||||
| Diluted net earnings per share | $ | 1.94 | $ | 1.86 | $ | 1.31 | ||||||
Fiscal years 2015 and 2013 contained 52 weeks consisting of 364 days each. Fiscal year 2014 contained 53 weeks consisting of 371 days. The accompanying notes are in integral part of the consolidated financial statements.
47
FRISCH’S RESTAURANTS, INC. AND SUBSIDIARIES
CONSOLIDATED STATEMENT OF COMPREHENSIVE INCOME
Three years ended June 2, 2015
| 2015 | 2014 | 2013 | ||||||||||
| (in thousands) | ||||||||||||
| Net earnings | $ | 9,955 | $ | 9,472 | $ | 6,591 | ||||||
| Other comprehensive income | ||||||||||||
| Amount recognized as a component of net periodic pension costs | 47 | 842 | 1,705 | |||||||||
| Current year actuarial gain (loss) on defined benefit pension plans | 60 | 5,680 | 5,403 | |||||||||
| Change in defined benefit plans (pretax) | 107 | 6,522 | 7,108 | |||||||||
| Tax effect | (36 | ) | (2,371 | ) | (2,426 | ) | ||||||
| Change in defined benefit plans, net of tax | 71 | 4,151 | 4,682 | |||||||||
| Comprehensive income | $ | 10,026 | $ | 13,623 | $ | 11,273 | ||||||
The accompanying notes are an integral part of the consolidated financial statements.
48
FRISCH’S RESTAURANTS, INC. AND SUBSIDIARIES
CONSOLIDATED STATEMENT OF CASH FLOWS
Three years ended June 2, 2015
| 2015 | 2014 | 2013 | ||||||||||
| (in thousands) | ||||||||||||
| Cash flows provided by (used in) operating activities: | ||||||||||||
| Net earnings | $ | 9,955 | $ | 9,472 | $ | 6,591 | ||||||
| Less loss from discontinued operations | — | — | (158 | ) | ||||||||
| Earnings from continuing operations | 9,955 | 9,472 | 6,749 | |||||||||
| Adjustments to reconcile net earnings from continuing operations to net cash from operating activities: | ||||||||||||
| Depreciation and amortization | 10,427 | 10,721 | 10,388 | |||||||||
| (Gain) loss on disposition of assets, including abandonment losses | (3,004 | ) | (12 | ) | 195 | |||||||
| Impairment of long-lived assets | 653 | — | 390 | |||||||||
| Stock-based compensation expense | 320 | 564 | 501 | |||||||||
| Net periodic pension cost | 263 | 1,864 | 3,247 | |||||||||
| Contributions to pension plans | (2,000 | ) | (2,000 | ) | (2,394 | ) | ||||||
| 16,614 | 20,609 | 19,076 | ||||||||||
| Changes in assets and liabilities: | ||||||||||||
| Trade and other receivables | (319 | ) | (603 | ) | 386 | |||||||
| Inventories | (630 | ) | 128 | (175 | ) | |||||||
| Prepaid expenses, sundry deposits and other | 148 | (574 | ) | 22 | ||||||||
| Other assets | (206 | ) | (80 | ) | 53 | |||||||
| Prepaid and deferred income taxes | 2,068 | (599 | ) | 736 | ||||||||
| Excess tax benefit from stock based compensation | (7 | ) | (19 | ) | (417 | ) | ||||||
| Accounts payable | (1,346 | ) | 1,279 | (283 | ) | |||||||
| Accrued and other expenses | 2,439 | 710 | 157 | |||||||||
| Other long-term obligations | (361 | ) | 372 | - | ||||||||
| Deferred compensation | 400 | 192 | 159 | |||||||||
| 2,186 | 806 | 638 | ||||||||||
| Net cash provided by continuing operations | 18,800 | 21,415 | 19,714 | |||||||||
| Net cash used in discontinued operations | — | — | (651 | ) | ||||||||
| Net cash provided by operating activities | 18,800 | 21,415 | 19,063 | |||||||||
The accompanying notes are an integral part of the consolidated financial statements.
49
| 2015 | 2014 | 2013 | ||||||||||
| (in thousands) | ||||||||||||
| Cash flows (used in) provided by investing activities: | ||||||||||||
| Additions to property and equipment | (8,270 | ) | (13,160 | ) | (9,837 | ) | ||||||
| Proceeds from disposition of property | 4,378 | 1,543 | 2,680 | |||||||||
| Change in restricted cash | — | — | 3,493 | |||||||||
| Change in other assets | (502 | ) | (211 | ) | (477 | ) | ||||||
| Net cash used in investing activities | (4,394 | ) | (11,828 | ) | (4,141 | ) | ||||||
| Cash flows (used in) provided by financing activities: | ||||||||||||
| Proceeds from borrowings | — | 3,500 | — | |||||||||
| Payment of long-term debt and capital lease obligations | (6,983 | ) | (11,438 | ) | (6,776 | ) | ||||||
| Cash dividends paid | (3,995 | ) | (3,560 | ) | (3,218 | ) | ||||||
| Special cash dividend paid | — | — | (47,963 | ) | ||||||||
| Proceeds from stock options exercised | 191 | 172 | 7,467 | |||||||||
| Other treasury shares re-issued | 277 | 42 | 12 | |||||||||
| Treasury shares acquired | (63 | ) | (105 | ) | (6,827 | ) | ||||||
| Excess tax benefit from stock options exercised | 7 | 19 | 417 | |||||||||
| Employee stock purchase plan | (5 | ) | (28 | ) | 41 | |||||||
| Net cash (used in) financing activities | (10,571 | ) | (11,398 | ) | (56,847 | ) | ||||||
| Net increase (decrease) in cash and equivalents | 3,835 | (1,811 | ) | (41,925 | ) | |||||||
| Cash and equivalents at beginning of year | 1,124 | 2,935 | 44,860 | |||||||||
| Cash and equivalents at end of year | $ | 4,959 | $ | 1,124 | $ | 2,935 | ||||||
| Supplemental disclosures: | ||||||||||||
| Interest paid | $ | 373 | $ | 661 | $ | 1,002 | ||||||
| Income taxes paid | $ | 1,003 | $ | 1,822 | $ | 1,523 | ||||||
| Income taxes refunded | $ | 421 | $ | 368 | $ | 1 | ||||||
| Lease transactions capitalized (non-cash) | $ | — | $ | 124 | $ | 781 | ||||||
The accompanying notes are an integral part of the consolidated financial statements.
50
FRISCH’S RESTAURANTS, INC. AND SUBSIDIARIES
CONSOLIDATED STATEMENT OF SHAREHOLDERS’ EQUITY
Three years ended June 2, 2015
| Common Stock at $1.00 per share - Shares and amount | Additional contributed capital | Accumulated other comprehensive income (loss) | Retained Earnings | Treasury Shares | Total | |||||||||||||||||||
| (in thousands, except per share data) | ||||||||||||||||||||||||
| Balance at May 29, 2012 | $ | 7,587 | $ | 65,908 | $ | (9,007 | ) | $ | 94,386 | $ | (38,056 | ) | $ | 120,818 | ||||||||||
| Net earnings for the year | — | — | — | 6,591 | — | 6,591 | ||||||||||||||||||
| Other comprehensive income, net of tax | — | — | 4,683 | — | — | 4,683 | ||||||||||||||||||
| Stock options exercised | — | 2,860 | — | — | 4,608 | 7,468 | ||||||||||||||||||
| Issuance of restricted stock | — | (258 | ) | — | — | 258 | - | |||||||||||||||||
| Excess tax benefit from stock options exercised | — | 418 | — | — | — | 418 | ||||||||||||||||||
| Stock based compensation costs | — | 432 | — | — | 70 | 502 | ||||||||||||||||||
| Other treasury shares re-issued | — | 6 | — | — | 7 | 13 | ||||||||||||||||||
| Treasury shares acquired | — | — | — | — | (6,827 | ) | (6,827 | ) | ||||||||||||||||
| Employee stock purchase plan | — | 41 | — | — | — | 41 | ||||||||||||||||||
| Special cash dividend - $9.50 per share | — | — | — | (47,963 | ) | — | (47,963 | ) | ||||||||||||||||
| Cash dividends paid - $0.64 per share | — | — | — | (3,218 | ) | — | (3,218 | ) | ||||||||||||||||
| Balance at May 28, 2013 | 7,587 | 69,407 | (4,324 | ) | 49,796 | (39,940 | ) | 82,526 | ||||||||||||||||
| Net earnings for the year | — | — | — | 9,472 | — | 9,472 | ||||||||||||||||||
| Other comprehensive income, net of tax | — | — | 4,150 | — | — | 4,150 | ||||||||||||||||||
| Stock options exercised | — | (26 | ) | — | — | 198 | 172 | |||||||||||||||||
| Issuance of restricted stock | — | (217 | ) | — | — | 217 | - | |||||||||||||||||
| Excess tax benefit from stock options exercised | — | 20 | — | — | 20 | |||||||||||||||||||
| Stock based compensation costs | — | 351 | — | — | 213 | 564 | ||||||||||||||||||
| Other treasury shares re-issued | — | 6 | — | — | 36 | 42 | ||||||||||||||||||
| Treasury shares acquired | — | — | — | — | (105 | ) | (105 | ) | ||||||||||||||||
| Employee stock purchase plan | — | (28 | ) | — | — | — | (28 | ) | ||||||||||||||||
| Cash dividends paid - $0.70 per share | — | — | — | (3,560 | ) | — | (3,560 | ) | ||||||||||||||||
| Balance at June 3, 2014 | 7,587 | 69,513 | (174 | ) | 55,708 | (39,381 | ) | 93,253 | ||||||||||||||||
| Net earnings for the year | — | — | — | 9,955 | — | 9,955 | ||||||||||||||||||
| Other comprehensive income, net of tax | — | — | 71 | — | — | 71 | ||||||||||||||||||
| Stock options exercised | — | 18 | — | — | 173 | 191 | ||||||||||||||||||
| Issuance of restricted stock | — | (195 | ) | — | — | 195 | - | |||||||||||||||||
| Excess tax benefit from stock options exercised | — | 7 | — | — | — | 7 | ||||||||||||||||||
| Stock based compensation costs | — | 320 | — | — | — | 320 | ||||||||||||||||||
| Other treasury shares re-issued | — | 87 | — | — | 190 | 277 | ||||||||||||||||||
| Treasury shares acquired | — | — | — | — | (62 | ) | (62 | ) | ||||||||||||||||
| Employee stock purchase plan | — | (7 | ) | — | — | — | (7 | ) | ||||||||||||||||
| Cash dividends paid - $0.78 per share | — | — | — | (3,995 | ) | — | (3,995 | ) | ||||||||||||||||
| Balance at June 2, 2015 | $ | 7,587 | $ | 69,743 | $ | (103 | ) | $ | 61,668 | $ | (38,885 | ) | $ | 100,010 | ||||||||||
The accompanying notes are an integral part of the consolidated financial statements.
51
Frisch’s Restaurants, Inc. and Subsidiaries
NOTES TO CONSOLIDATED FINANCIAL STATEMENTS
Three years ended June 2, 2015
NOTE A – ACCOUNTING POLICIES
A summary of the Company’s significant accounting policies consistently applied in the preparation of the accompanying Consolidated Financial Statements follows:
Description of the Business
Frisch’s Restaurants, Inc. and Subsidiaries (Company) is a regional company that operates full service family-style restaurants under the name “Frisch’s Big Boy.”All 95 Frisch's Big Boy restaurants operated by the Company as of June 2, 2015 are located in various regions of Ohio, Kentucky and Indiana. The Company owns the trademark “Frisch’s” and has exclusive, irrevocable ownership of the rights to the “Big Boy” trademark, trade name and service marks in the states of Kentucky and Indiana, and in most of Ohio and Tennessee. All of the Frisch’s Big Boy restaurants also offer “drive-thru” service. The Company also licenses 26 Frisch's Big Boy restaurants to other operators, which are located in certain parts of Ohio, Kentucky and Indiana. In addition, the Company operates a commissary and food manufacturing plant near its headquarters in Cincinnati, Ohio that services all Frisch's Big Boy restaurants operated by the Company, and is available to supply restaurants licensed to others.
Pending Agreement and Plan of Merger
On May 21, 2015, the Company entered into an Agreement and Plan of Merger with FRI Holding Company, LLC a Delaware limited liability company (Parent) and FRI Merger Sub, LLC, an Ohio limited liability company and wholly-owned subsidiary of Parent (Merger-Sub). The merger agreement was unanimously approved by the Company’s board of directors (the Board) also on that date. Under the terms of the agreement, if the merger is consummated, each outstanding share of Common Stock will be converted into the right to receive $34.00 per share, in cash, without interest. The consummation of the merger is subject to customary closing conditions, including the approval of a majority of shareholders. The merger is expected to close in the first quarter of Fiscal Year 2016, at which time, the Company will cease being an independent public company and no longer traded on the NYSE MKT or required to file periodic reports with the Securities and Exchange Commission (SEC). Both Parent and Merger Sub are wholly owned subsidiaries of NRD Partners I, L.P. (NRD). The Company has scheduled a Special Shareholder Meeting for August 24, 2015 for the purpose of obtaining shareholder approval.
Consolidation Practices
The accompanying Consolidated Financial Statements include the accounts of Frisch’s Restaurants, Inc. and all of its subsidiaries, prepared in conformity with generally accepted accounting principles in the United States of America (US GAAP) and in accordance with the rules and regulations of the SEC. Significant inter-company accounts and transactions have been eliminated in consolidation. All dollar amounts referenced in the text of these footnotes are reported in thousands.
Reclassifications
Certain amounts reported in prior years have been reclassified to conform to the current year presentation.
Immaterial Revision
The historical financial statements included in these Consolidated Financial Statements have been corrected for the errors associated with the employee theft (See NOTE M – IMMATERIAL REVISION).
52
Frisch’s Restaurants, Inc. and Subsidiaries
NOTES TO CONSOLIDATED FINANCIAL STATEMENTS
Three years ended June 2, 2015
NOTE A - ACCOUNTING POLICIES (continued)
Fiscal Year
The Company’s fiscal year is the 52 week (364 days) or 53 week (371 days) period ending on the Tuesday nearest to the last day of May. Fiscal Year 2015 ended on June 2, 2015 and consisted of 52 weeks. Fiscal Year 2014 ended June 3, 2014 and consisted of 53 weeks, whereas Fiscal Year 2013 ended on May 28, 2013 and consisted of 52 weeks. The fiscal year that will end on May 31, 2016 (Fiscal Year 2016) will be a normal year consisting of 52 weeks.
The first quarter of each fiscal year presented herein contained 16 weeks, while the last three quarters each contained 12 weeks, with the exception of the fourth quarter of Fiscal Year 2014, which contained 13 weeks.
Use of Estimates and Critical Accounting Policies
The preparation of financial statements in conformity with US GAAP requires management to use estimates and assumptions to measure certain items that affect the amounts reported. These judgments are based on knowledge and experience about past and current events, and assumptions about future events. Although management believes its estimates are reasonable and adequate, future events affecting them may differ markedly from current judgment. Significant estimates and assumptions are used to measure self-insurance liabilities, net periodic pension cost and future pension obligations, income taxes, the carrying values of property held for sale and for long-lived assets including property and equipment, goodwill and other intangible assets.
Management considers the following accounting policies to be critical accounting policies because the application of estimates to these policies requires management’s most difficult, subjective or complex judgments: self-insurance liabilities, net periodic pension cost and future pension obligations, income taxes and the carrying values of long-lived assets.
Cash and Cash Equivalents
Funds in transit from credit card processors are classified as cash. Highly liquid investments with original maturities of 90 days or less are considered as cash equivalents. As of June 2, 2015 and June 3, 2014, cash and cash equivalents consisted entirely of cash.
Receivables
Trade and other accounts receivable are valued net of applicable reserves. The reserve balance was $31 as of June 2, 2015 and June 3, 2014. The reserve is monitored for adequacy based on historical collection patterns and write-offs, and current credit risks.
Inventories
Inventories, comprised principally of food items, are valued at the lower of cost, determined by the first-in, first-out method, or market.
53
Frisch’s Restaurants, Inc. and Subsidiaries
NOTES TO CONSOLIDATED FINANCIAL STATEMENTS
Three years ended June 2, 2015
NOTE A - ACCOUNTING POLICIES (continued)
Accounting for Rebates
Cash rebates received from vendors are recorded as a reduction of cost of sales in the periods in which they are earned. Cash received in advance of the period of recognition is recorded as a liability in the Consolidated Balance Sheet.
Leases
Minimum scheduled payments on operating leases, including escalating rental payments, are recognized as rent expense on a straight-line basis over the term of the lease. Under certain circumstances, the lease term used to calculate straight-line rent expense includes option periods that have yet to be legally exercised. Contingent rentals, typically based on a percentage of restaurant sales in excess of a fixed amount, are expensed as incurred. Rent expense is also recognized during that part of the lease term when no rent is paid to the landlord, often referred to as a “rent holiday,” that generally occurs while a restaurant is being constructed on leased land. The Company does not typically receive leasehold incentives from landlords (See NOTE D – LEASED PROPERTY).
Property and Equipment
Property and equipment are stated at cost (see NOTE C - PROPERTY AND EQUIPMENT). Depreciation is provided principally on the straight-line method over the estimated service lives, which range from 10 to 25 years for new buildings or components thereof and five to 10 years for equipment. Leasehold improvements are depreciated over the shorter of the useful life of the asset or the lease term. Property betterments are capitalized while the cost of maintenance and repairs is expensed as incurred.
The cost of land not yet in service is included in “Construction in progress” if construction has begun or if construction is likely within the next 12 months. Construction in progress as of June 2, 2015 and June 3, 2014 is comprised principally of remodeling work that was at various stages of completion in existing restaurants.
Interest on borrowings is capitalized during active construction periods of new restaurants. Capitalized interest for Fiscal Years 2014 and 2013 was $26 and $14, respectively. There were no active construction projects that required capitalized interest during Fiscal Year 2015.
Costs incurred during the application development stage of computer software that is developed or obtained for internal use is capitalized, while the costs of the preliminary project stage are expensed as incurred, along with certain other costs such as training. Capitalized computer software is amortized on the straight-line method over the estimated service lives, which range from three to 10 years. Software assets are reviewed for impairment when events or circumstances indicate that the carrying value may not be recoverable over the remaining service life.
54
Frisch’s Restaurants, Inc. and Subsidiaries
NOTES TO CONSOLIDATED FINANCIAL STATEMENTS
Three years ended June 2, 2015
NOTE A - ACCOUNTING POLICIES (continued)
Impairment of Long-Lived Assets
Management considers a history of cash flow losses on a restaurant-by-restaurant basis to be its primary indicator of potential impairment of long-lived assets. Carrying values are tested for impairment at least annually, and whenever events or changes in circumstances indicate that the carrying values of the assets may not be recoverable from the estimated future cash flows expected to result from the use and eventual disposition of the property. When undiscounted expected future cash flows are less than carrying values, an impairment loss would be recognized equal to the amount by which the carrying values exceed fair value, which is determined as either 1) the greater of the net present value of the future cash flow stream, or 2) by opinions of value provided by real estate brokers and/or management's judgment as developed through its experience in disposing of unprofitable restaurant operations. Broker opinions of value and the judgment of management consider various factors in their fair value estimates such as the sales of comparable area properties, general economic conditions in the area, physical condition and location of the subject property, and general real estate activity in the area.
When decisions are made to permanently close under-performing restaurants, the carrying values of closed restaurant properties that are owned in fee simple title are reclassified to "Property held for sale" (see Real Property Not Used in Operations elsewhere in NOTE A – ACCOUNTING POLICIES) and are subjected to the accounting policy for impairment of long-lived assets (see the above discussion). When leased restaurant properties are permanently closed before reaching the end of their lease term and there is no immediate assignment of the lease to a third party, an impairment provision is made equal to the present value of remaining non-cancelable lease payments after the closing date, net of estimated subtenant income. The carrying values of leasehold improvements are also reduced, if necessary, in accordance with the accounting policy for impairment of long-lived assets.
In Fiscal Year 2015, three impairment charges totaling $653 were recorded to lower the estimated fair value of Property held for sale. The impairment charges reduced the fair value of two former Golden Corral restaurants held for sale since 2011, which are located in Lawrenceburg, Indiana and Medina, Ohio which were lowered by $23 and $212, respectively. The third impairment charge was for $418, which was recorded to lower the previous estimate of the fair value of on an undeveloped land parcel, which has been for sale for several years. There were no non-cash pretax impairments of long-lived assets charges recorded during Fiscal Year 2014. Fair value measurements recorded under level 2 (observable inputs) of the fair value hierarchy are based on accepted sales contracts. Fair value measurements recorded under level 3 (significant unobservable inputs) are generally based on brokers' opinions of value and/or management's judgment:
| Fair Value Measurements Using | ||||||||||||||||
| (in thousands) | ||||||||||||||||
| Level 1 | Level 2 | Level 3 | Gains (Losses) | |||||||||||||
| Fiscal Year 2015 | ||||||||||||||||
| Impairment on undeveloped property held for sale | $ | — | $ | — | $ | 799 | $ | (418 | ) | |||||||
| Former Golden Corral restaurants (closed August 2011) (2 units) | $ | — | $ | 799 | $ | 917 | $ | (235 | ) | |||||||
| Fiscal Year 2014 | ||||||||||||||||
| Former Golden Corral restaurants (closed August 2011) (2 units) | $ | — | $ | — | $ | 1,950 | $ | — | ||||||||
| Fiscal Year 2013 | ||||||||||||||||
| Former Frisch's Big Boy restaurants (3 units) | $ | — | $ | 1,795 | $ | — | $ | (179 | ) | |||||||
| Former Golden Corral restaurants (closed August 2011) (3 units) | $ | — | $ | — | $ | 2,844 | $ | (211 | ) | |||||||
55
Frisch’s Restaurants, Inc. and Subsidiaries
NOTES TO CONSOLIDATED FINANCIAL STATEMENTS
Three years ended June 2, 2015
NOTE A - ACCOUNTING POLICIES (continued)
Restaurant Closing Costs
Any liabilities associated with exit or disposal activities are recognized only when the liabilities are incurred, rather than upon the commitment to an exit or disposal plan. Conditional obligations that meet the definition of an asset retirement obligation are currently recognized if fair value is reasonably estimable. No conditional obligations meeting the definition of an asset retirement obligation have been recorded in these Consolidated Financial Statements.
Property Not Used in Operations
The cost of land on which construction is not likely within the next 12 months is classified as "Land - deferred development". Surplus property that is no longer needed by the Company and for which the Company is committed to a plan to sell the property is classified as "Property held for sale". Both classes of property are grouped together under the caption "Real property not used in operations" in other long-term assets in the Consolidated Balance Sheet, as shown below:
| Fiscal Year | ||||||||
| 2015 | 2014 | |||||||
| (in thousands) | ||||||||
| Land - deferred development | $ | 2,799 | $ | 2,861 | ||||
| Property held for sale | 3,230 | 3,883 | ||||||
| Total Property not used in operations | $ | 6,029 | $ | 6,744 | ||||
As of June 2, 2015 and June 3, 2014, “Land – deferred development” consisted of five tracts of land that are being held for potential future development. As of June 2, 2015 and June 3, 2014, “Property held for sale” consisted of two Golden Corral restaurants with carrying values of, $1,716 and $1,950, respectively and seven other surplus pieces of land with aggregate carrying values of $1,514 and $1,933, respectively.
All of the "Property held for sale" is stated at the lower of its cost or its fair value, less cost to sell, which is reviewed each quarter (see Impairment of Long-Lived Assets elsewhere in NOTE A – ACCOUNTING POLICIES). The stated value of any property for which a viable sales contract is pending at the balance sheet date is reclassified to current assets.
Gains and losses on the sale of assets, as reported in the Consolidated Statement of Earnings, consist of transactions involving real property and sometimes may include restaurant equipment that is sold together with real property as a package when former restaurants are sold. Gains and losses reported on this line do not include abandonment losses that routinely arise when certain equipment is replaced before it reaches the end of its expected life; abandonment losses are instead reported in other operating costs.
56
Frisch’s Restaurants, Inc. and Subsidiaries
NOTES TO CONSOLIDATED FINANCIAL STATEMENTS
Three years ended June 2, 2015
NOTE A - ACCOUNTING POLICIES (continued)
Goodwill and Other Intangible Assets
As of June 2, 2015 and June 3, 2014, the carrying amount of goodwill that was acquired in prior years amounted to $741. Acquired goodwill is tested for impairment in the fourth quarter of each fiscal year and whenever an impairment indicator arises. Impairment testing first assesses qualitative factors to determine whether it is necessary to perform the two-step quantitative goodwill impairment test. Fair value is not calculated unless the qualitative assessment determines that it is more likely than not that its fair value is less than its carrying amount. Other intangible assets are also tested for impairment in the fourth quarter of each fiscal year and whenever an impairment indicator arises.
Goodwill and Other Intangible Assets consists of:
| Fiscal Year | ||||||||
| 2015 | 2014 | |||||||
| (in thousands) | ||||||||
| Goodwill | $ | 741 | $ | 741 | ||||
| Other intangible assets not subject to amortization | 22 | 22 | ||||||
| Other intangible assets subject to amortization - net | 7 | 10 | ||||||
| Total goodwill and other intangible assets | $ | 770 | $ | 773 | ||||
Revenue Recognition
Revenue from restaurant operations is recognized upon the sale of products as they are sold to customers. All sales revenue is recorded on a net basis, which excludes sales tax collected from being reported as sales revenue and sales tax remitted from being reported as a cost. Receipts from sales of coupon books associated with seasonal promotions are de minimis, which are recorded as contra costs of sales.
Revenue from the sale of commissary products to restaurants licensed to other operators is recognized upon delivery of product. Revenue from franchise fees, based on certain percentages of sales volumes generated in restaurants licensed to other operators, is recorded on the accrual method as earned. Initial franchise fees are recognized as revenue when the fees are deemed fully earned and non-refundable, which ordinarily occurs upon the execution of the license agreement, in consideration for the Company’s services to that time.
Revenue from the sale of gift cards is deferred for recognition until the gift card is redeemed by the cardholder, or when the probability becomes remote that the cardholder will demand full performance by the Company and there is no legal obligation to remit the value of the unredeemed card under applicable state escheatment statutes.
Advertising
Advertising costs are charged to “Administrative and advertising” expense as incurred. Advertising expense for Fiscal Years 2015, 2014 and 2013 was $4,979, $4,931 and $4,855, respectively. Restaurants licensed to other operators are required to make contributions to the Company's general advertising fund. The advertising costs cited above have been offset by the contributions of licensees.
New Store Opening Costs
New store opening costs consist of new employee training costs, the cost of a team to coordinate the opening and the cost of certain replaceable items such as uniforms and china. New store opening costs are charged to “Other operating costs” as incurred. New store opening costs for Fiscal Years 2014 and 2013 were $307 and $592, respectively. There were no new stores opened during Fiscal Year 2015.
57
Frisch’s Restaurants, Inc. and Subsidiaries
NOTES TO CONSOLIDATED FINANCIAL STATEMENTS
Three years ended June 2, 2015
NOTE A - ACCOUNTING POLICIES (continued)
Benefit Plans
The Company sponsors the Frisch's Restaurants, Inc. Pension Plan, a defined benefit pension plan that was created on May 29, 2012 when two previously sponsored plans were merged: the Pension Plan for Operating Unit Hourly Employees (the Hourly Pension Plan) and the Pension Plan for Managers, Office and Commissary Employees (the Salaried Pension Plan). (See NOTE H - PENSION PLANS.) The merger did not affect plan benefits, but lower administrative costs have been realized.
Plan benefits are based on years-of-service and other factors. The Company’s funding policy is to contribute at least the minimum annual amount sufficient to satisfy legal funding requirements plus additional discretionary tax deductible amounts that may be deemed advisable, even when no minimum funding is required. Contributions are intended to provide not only for benefits attributed to service-to-date, but also for those expected to be earned in the future.
Hourly Restaurant Employees - Hourly restaurant employees hired after December 31, 1998 are ineligible for pension plan participation. Future accruals for credited service after August 31, 2009 have been frozen for hourly restaurant employees who were hired on or before December 31, 1998. Hourly restaurant employees hired January 1, 1999 or after have been eligible to participate in the Frisch’s Restaurants, Inc. Hourly Employees 401(k) Savings Plan (the Hourly Savings Plan), a defined contribution plan. In earlier years, the Hourly Savings Plan had provided a 40 percent match by the Company on the first 10 percent of earnings deferred by the participants and the Company’s match had vested on a scale based on length of service that reached 100 percent after four years of service. The Hourly Savings Plan was amended effective September 1, 2009 to provide for immediate vesting along
with a 100 percent match from the Company on the first 3 percent of earnings deferred by participants. All hourly restaurant employees are now eligible to participate in the Hourly Savings Plan, regardless of when hired.
Salaried Restaurant Management, Office and Commissary Employees - Salaried employees hired after June 30, 2009 are ineligible for pension plan participation. Salaried employees hired on or before June 30, 2009 continue to participate and are credited with normal benefits for years of service. Salaried employees are automatically enrolled, unless otherwise elected, in the Frisch’s Employee 401(k) Savings Plan (the Salaried Savings Plan), a defined contribution plan. The Salaried Savings Plan provides immediate vesting under two different Company matching schedules. Employees hired before June 30, 2009 may continue to defer up to 25 percent of their compensation under the Salaried Savings Plan, with the Company contributing a 10 percent match on the first 18 percent deferred. Salaried employees hired after June 30, 2009 receive a 100 percent match from the Company on the first 3 percent of compensation deferred.
The executive officers of the Company and certain other “highly compensated employees” (HCEs) are disqualified from participation in the Salaried Savings Plan. A non-qualified savings plan - Frisch’s Executive Savings Plan (FESP) - provides a means by which the HCEs may continue to defer a portion of their compensation. FESP allows deferrals of up to 25 percent of a participant’s compensation into a choice of mutual funds or common stock of the Company. Matching contributions are added to the first 10 percent of salary deferred at a rate of 10 percent for deferrals into mutual funds, while a 15 percent match is added to deferrals into the Company’s common stock. HCEs hired after June 30, 2009 receive a 100 percent matching contribution from the Company on the first 3 percent of compensation deferred into either mutual funds or common stock. (See NOTE I - FRISCH'S EXECUTIVE SAVINGS PLAN.)
58
Frisch’s Restaurants, Inc. and Subsidiaries
NOTES TO CONSOLIDATED FINANCIAL STATEMENTS
Three years ended June 2, 2015
NOTE A - ACCOUNTING POLICIES (continued)
The Company also sponsors an unfunded non-qualified Supplemental Executive Retirement Plan (SERP) that was originally intended to provide a supplemental retirement benefit to the HCEs whose benefits under the Salaried Pension Plan were reduced when their compensation exceeded Internal Revenue Code imposed limitations or when elective salary deferrals were made to FESP. Amendments to the SERP were made on January 1, 2000 to exclude any benefit accruals after December 31, 1999 (interest continues to accrue) and to close entry into the Plan by any HCE hired after December 31, 1999. (See NOTE H - PENSION PLANS .)
Effective January 1, 2000 a Non Deferred Cash Balance Plan was adopted to provide comparable retirement type benefits to the HCEs in lieu of future accruals under the qualified defined benefit plan and the SERP. The comparable benefit amount is determined each year and converted to a lump sum (reported as W-2 compensation) from which taxes are withheld and the net amount is deposited into the HCE’s individual trust account. In addition, accruals are made for additional required contributions that are due when the present value of lost benefits under the qualified defined benefit plan and the SERP exceeds the value of the assets in the HCE's trust account when a participating HCE retires or is otherwise separated from service with the Company. (See NOTE H - PENSION PLANS.)
Self Insurance
The Company self-insures its Ohio workers’ compensation claims (up to $300 per claim through June 3, 2014, which was increased to $400 per claim beginning June 4, 2014 - the first day of Fiscal Year 2015). Based on prior claims history, initial self-insurance liabilities are accrued each fiscal year from forward estimates, which are provided by an actuarial consulting firm, of the ultimate value of claims to be incurred during that fiscal year. The same actuarial consulting firm also provides an independent estimate each year of the Company's required loss and allocated loss adjustment expense for any accidents since the inception of the program, which remain open on the date of the actuarial consulting firm's assessment. The self-insurance program is subject to a two year cycle. The program continues to benefit from active claims management and post accident drug testing.
Income Taxes
Income taxes are provided on all items included in the Consolidated Statement of Earnings regardless of when such items are reported for tax purposes, which gives rise to deferred income tax assets and liabilities. (See NOTE F – INCOME TAXES.)
Fair Value of Financial Instruments
The Company’s financial instruments consist primarily of cash and cash equivalents, accounts payable and accounts receivable, investments and long-term debt. The carrying values of cash and cash equivalents together with accounts payable and accounts receivable approximate their fair value based on their short-term character. The fair value of investments held as part of FESP (see Benefit Plans elsewhere in NOTE A – ACCOUNTING POLICIES) is disclosed in NOTE I- FRISCH'S EXECUTIVE SAVINGS PLAN. Fair value measurements for non-financial assets and non-financial liabilities are used primarily in the impairment analyses of long-lived assets, goodwill and other intangible assets. The Company does not use derivative financial instruments.
59
Frisch’s Restaurants, Inc. and Subsidiaries
NOTES TO CONSOLIDATED FINANCIAL STATEMENTS
Three years ended June 2, 2015
NOTE A - ACCOUNTING POLICIES (continued)
Recently Adopted Accounting Pronouncements
In July 2013, The Financial Accounting Standards Board (FASB) issued Accounting Standards Update (ASU) 2013-11, "Presentation of an Unrecognized Tax Benefit When a Net Operating Loss Carryforward, a Similar Tax Loss, or a Tax Carryforward Exists.” The Company adopted ASU 2013-11 in the first quarter of Fiscal Year 2015. The adoption of this standard did not have a significant impact on these Consolidated Financial Statements.
In April 2014, the FASB issued Accounting Standards Update 2014-08, “Reporting Discontinued Operations and Disclosures of Disposals of Components of an Entity,” (ASU 2014-08). ASU 2014-08 includes amendments that change the requirements for reporting discontinued operations and requires additional disclosures about discontinued operations. Under ASU 2014-08, only disposals representing a strategic shift in operations should be presented as discontinued operations. ASU 2014-08 was effective June 4, 2014, the first day of Fiscal Year 2015. The adoption of this standard did not have a significant impact on these Consolidated Financial Statements.
In May 2015, FASB issued Accounting Standards Update 2015-08, “Pushdown Accounting - Amendments to SEC Paragraphs Pursuant to Staff Accounting Bulletin No. 115,” (ASU 2015-08). The amendments in ASU 2015-08 amend various SEC paragraphs included in the FASB’s Accounting Standards Codification to reflect the issuance of Staff Accounting Bulletin No. 115, or SAB 115. SAB 115 rescinds portions of the interpretive guidance included in the SEC’s Staff Accounting Bulletins series and brings existing guidance into conformity with ASU No. 2014-17, Business Combinations (Topic 805): Pushdown Accounting, which provides an acquired entity with an option to apply pushdown accounting in its separate financial statements upon occurrence of an event in which an acquirer obtains control of the acquired entity. The Company adopted the amendments in ASU 2015-08, effective May 8, 2015, as the amendments in the update are effective upon issuance. The adoption did not have an immediate impact on these Consolidated Financial Statements.
Recently Issued Accounting Pronouncements
In May 2014, the FASB issued Accounting Standards Update 2014-09, “Revenue from Contracts with Customers”, (ASU 2014-09) as a new Topic, ASC Topic 606. The new revenue recognition standard provides a five-step analysis of transactions to determine when and how revenue is recognized. The core principle of the guidance is that a company should recognize revenue to depict the transfer of promised goods or services to customers in an amount that reflects the consideration to which the entity expects to be entitled in exchange for those goods or services. In April 2015, the FASB voted to propose deferral of the effective date of the new revenue standard by one year, but to permit entities to adopt one year earlier if they choose. The deferral was approved on July 9, 2015 by the FASB. The Company will be required to adopt the new standard in Fiscal Year 2019 (May 30, 2018) and can adopt either retrospectively or as a cumulative effect adjustment as of the date of adoption. This new accounting guidance is currently being evaluated for its potential effect upon the Company’s results of operations, cash flows and financial position.
In January 2015, the FASB issued Accounting Standards Update 2015-01 “Income Statement—Extraordinary and Unusual Items” (ASU 2015-01). ASU 2015-01 eliminates from GAAP the concept of extraordinary items. ASU 2015-01 will be effective for Fiscal Year 2017 beginning, June 1, 2016 with early adoption permitted. The adoption of ASU 2015-01 is not expected to have a material impact on theses Consolidated Financial Statements.
60
Frisch’s Restaurants, Inc. and Subsidiaries
NOTES TO CONSOLIDATED FINANCIAL STATEMENTS
Three years ended June 2, 2015
NOTE A - ACCOUNTING POLICIES (continued)
In April 2015, the FASB issued Accounting Standards Update No. 2015-03, "Simplifying the Presentation of Debt Issuance Costs," (ASU 2015-03). ASU 2015-03 requires that debt issuance costs related to a recognized debt liability be presented in the balance sheet as a direct deduction from the carrying amount of that debt liability, consistent with debt discounts. The adoption of ASU 2015-03 will be effective for Fiscal Year 2017 beginning June 1, 2016 and is not expected to have a material impact on the Company’s Consolidated Financial Statements.
In April 2015, the FASB issued Accounting Standards Update No. 2015-04, "Compensation – Retirement Benefits - Practical Expedient for the Measurement Date of an Employer's Defined Benefit Obligation and Plan Assets," (ASU 2015-04). ASU 2015-04 provides the use of a practical expedient that permits the entity to measure defined benefit plans assets and obligations using the month-end that is closest to the entity's fiscal year-end and apply that practical expedient consistently from year to year. Further, if a contribution or significant event occurs between the month-end date used to measure defined benefit plan asset and obligations and an entity's fiscal year-end, the entity should adjust the measurement of defined plan assets and obligations to reflect of those contributions of significant events. However, an entity should not adjust the measurement of defined benefit plan asset and obligations for other events that occur between the month-end measurement and the entity's fiscal year-end that are not caused by the entity. The Company does not anticipate that the adoption of this standard will have a material impact on the Company’s Consolidated Financial Statements.
In April 2015, the FASB issued Accounting Standards Update No. 2015-05, "Customer's Accounting for Fees Paid in a Cloud Computing Arrangement," (ASU 2015-05). ASU 2015-05 provides guidance to customers about whether a cloud computing arrangement includes a software license. If a cloud computing arrangement includes a software license, then the customer should account for the software license element of the arrangement consistent with the acquisition of other software licenses. If a cloud computing arrangement does not include a software license, the customer should account for the arrangement as a service contract. The guidance will not change GAAP for a customer's accounting for service contracts. The adoption of ASU 2015-03 will be effective for Fiscal Year 2017 beginning June 1, 2016 and is not expected to have a material impact on the Company’s Consolidated Financial Statements.
Management reviewed all other significant newly issued accounting pronouncements and concluded that they are either not applicable to the Company’s business or that no material effect is expected on the Consolidated Financial Statements as a result of future adoption.
61
Frisch’s Restaurants, Inc. and Subsidiaries
NOTES TO CONSOLIDATED FINANCIAL STATEMENTS
Three years ended June 2, 2015
NOTE B - LONG-TERM DEBT
| Fiscal Year 2015 | Fiscal Year 2014 | |||||||||||||||
| Payable Within One Year | Payable After One Year | Payable Within One Year | Payable After One Year | |||||||||||||
| (in thousands) | ||||||||||||||||
| Construction Loan | ||||||||||||||||
| Construction Phase | $ | — | $ | — | $ | — | $ | — | ||||||||
| Term Loans | — | — | 1,854 | 4,265 | ||||||||||||
| Revolving Loan | — | — | — | — | ||||||||||||
| Stock Repurchase Loan | — | — | 142 | 472 | ||||||||||||
| $ | — | $ | — | $ | 1,996 | $ | 4,737 | |||||||||
Long term debt consists of the following maturities:
| Fiscal Year | ||||||||||
| 2015 | 2014 | |||||||||
| (in thousands) | ||||||||||
| Current Maturities | $ | — | $ | 1,996 | Current Maturities | |||||
| June 2017 | — | 1,685 | June 2016 | |||||||
| June 2018 | — | 1,616 | June 2017 | |||||||
| June 2019 | — | 1,164 | June 2018 | |||||||
| June 2020 | — | 272 | June 2019 | |||||||
| Long-term maturities | — | 4,737 | Long-term maturities | |||||||
| Total long-term debt | $ | — | $ | 6,733 | Total long-term debt | |||||
Loan Agreement
The Company’s long-term debt is governed by a three year unsecured loan agreement that has been in place since October 31, 2013 (2013 Loan Agreement). The terms of the 2013 Loan Agreement are set forth below in the various components.
62
Frisch’s Restaurants, Inc. and Subsidiaries
NOTES TO CONSOLIDATED FINANCIAL STATEMENTS
Three years ended June 2, 2015
NOTE B – LONG-TERM DEBT (continued)
Construction Loan Facility under the 2013 Loan Agreement
The purpose of the Construction Loan is to finance the construction and opening and/or refurbishing of Frisch's Big Boy Restaurants. Funds borrowed, are initially governed under the Construction Phase of the Facility, which then must be converted to a Term Loan within six months.
When funds are borrowed and in the Construction Phase, interest is based on the LIBOR Rate Margin, plus the one, two, or three month LIBOR rate, as selected by the Company. The sum of $5,000 is available for construction financing through October 31, 2016. At the lender's discretion, the Company may request that the facility be increased up to $15,000 at any time. The Company is required to pay the lender an unused credit fee in an amount equal to 0.25 percent per annum on the unused Construction Loan amount.
As of June 2, 2015, the Company had no borrowings in the Construction phase and no outstanding balances of Construction Term Loans. At June 3, 2014, the Company had aggregate outstanding Construction Term Loans of $6,119 ($1,854 of which was included in current maturities, in the table above, in the prior year), all of which was retired in Fiscal Year 2015.
During Fiscal Year 2015, outstanding Term Loans were subject to fixed interest rates between 3.25 percent and 6.63 percent. Included in interest expense in Fiscal Year 2015, the Company paid $84 in early termination penalties to retire the Construction Term Loans discussed above.
Revolving Loan under the 2013 Loan Agreement
The purpose of the Revolving Loan is to fund working capital needs and for other corporate needs. The sum of $11,000 is available to be borrowed at any time through October 16, 2016. Amounts repaid may be re-borrowed so long as the amount outstanding does not exceed $11,000 at any time. Interest accrues on each advance at an annual rate equal to the LIBOR Rate Margin plus the one month LIBOR rate, currently 1.54 percent. The Company is required to pay the lender an unused credit fee equal to 0.25 percent per annum on the unused Revolving Loan amount. There were no outstanding amounts under the Revolving Loan as of June 2, 2015 and June 3, 2014, respectively.
Revolving loans are ordinarily classified as short term. However, the 2013 Loan Agreement does not require a consecutive day "out-of-debt" period during each fiscal year, and any outstanding balance will not be due and payable until October 31, 2016. Management has evaluated the terms of the 2013 Loan Agreement and determined that all criteria have been satisfied in order to classify any outstanding balance on the Revolving Loan as long-term debt until October 31, 2015.
2011 Term Loan under the 2013 Loan Agreement
On December 9, 2014, the Company elected to pay-off the remaining balance owed in connection with the 2011 Term Loan (formerly styled as the Stock Repurchase Loan), therefore no balance was outstanding as of June 2, 2015.
63
Frisch’s Restaurants, Inc. and Subsidiaries
NOTES TO CONSOLIDATED FINANCIAL STATEMENTS
Three years ended June 2, 2015
NOTE B – LONG-TERM DEBT (continued)
Loan Covenants
The 2013 Loan Agreement contains financial covenants relating to the relationship of Senior Bank Debt and Earnings Before Interest, Taxes, Depreciation and Amortization (EBITDA) and minimum required levels of EBITDA, lease expense, asset dispositions, investments and restrictions on pledging certain restaurant operating assets. The Company was in compliance with all loan covenants as of June 2, 2015. Compensating balances are not required under the terms of the 2013 Loan Agreement.
Other
As discussed in NOTE A – ACCOUNTING POLICIES above, on May 21, 2015 the Company entered into an Agreement and Plan of Merger. The Merger Agreement provides for a business combination whereby Merger Sub will merge with and into the Company (the Merger). As a result of the Merger, the separate corporate existence of Merger Sub will cease. The Company will continue as the surviving corporation in the Merger and will be a wholly-owned subsidiary of Parent. The closing of the transaction contemplated by the Merger Agreement would effectively terminate the existing 2013 Loan Agreement and the Company would need to enter into a new loan agreement in order to maintain its existing borrowing capacity.
NOTE C - PROPERTY AND EQUIPMENT
Property and equipment consisted of the following:
| Fiscal Year | ||||||||
| 2015 | 2014 | |||||||
| (in thousands) | ||||||||
| Land and improvements | $ | 47,003 | $ | 48,056 | ||||
| Buildings | 77,303 | 76,713 | ||||||
| Equipment and fixtures | 86,031 | 84,955 | ||||||
| Leasehold improvements | 19,552 | 19,318 | ||||||
| Capitalized leases | 2,727 | 2,727 | ||||||
| Construction in Process | 30 | 162 | ||||||
| 232,646 | 231,931 | |||||||
| Less: Accumulated depreciation | 131,286 | 127,069 | ||||||
| Property and equipment, net | $ | 101,360 | $ | 104,862 | ||||
NOTE D - LEASED PROPERTY
Although the Company’s policy is to own the property on which it operates restaurants, the Company occupies certain of its restaurant facilities pursuant to lease agreements. As of June 2, 2015, the Company operated 15 Frisch's Big Boy restaurants on non-owned premises, 14 of which were classified as operating leases and one was a capital lease. Most of the operating leases have multiple renewal options, six of which will expire at various times over the next five years. One of the six expiring leases has a purchase option and four (including the one with the purchase option) have renewal options available.
64
Frisch’s Restaurants, Inc. and Subsidiaries
NOTES TO CONSOLIDATED FINANCIAL STATEMENTS
Three years ended June 2, 2015
NOTE D – LEASED PROPERTY (continued)
The Company remains contingently liable under certain ground lease agreements relating to land on which seven of the Company's former Golden Corral restaurants are situated (see Other Contingencies in NOTE L – COMMITMENTS AND CONTINGENCIES).
Office space is occupied under an operating lease that expires during Fiscal Year 2023, at which time a purchase option becomes available to acquire the office property in fee simple title.
Rent expense under operating leases:
| Fiscal Year | ||||||||||||
| 2015 | 2014 | 2013 | ||||||||||
| (in thousands) | ||||||||||||
| Minimum rentals | $ | 1,081 | $ | 1,110 | $ | 1,095 | ||||||
| Contingent payments | 10 | 3 | — | |||||||||
| $ | 1,091 | $ | 1,113 | $ | 1,095 | |||||||
The ground lease for the Frisch's Big Boy restaurant that is classified as a capital lease requires the Company to purchase the land in fee simple title at any time between the 10th (2020) and 15th (2025) years of the lease. Delivery and other equipment is held under capitalized leases expiring during various periods extending into Fiscal Year 2021.
An analysis of the capitalized lease property is shown in the following table. Amortization of capitalized delivery equipment is based on the straight-line method over the primary terms of the leases.
| Fiscal Year | ||||||||
| 2015 | 2014 | |||||||
| (in thousands) | ||||||||
| Restaurant property (land) | $ | 825 | $ | 825 | ||||
| Delivery and other equipment leases | 1,902 | 1,902 | ||||||
| Less accumulated amortization | (934 | ) | (657 | ) | ||||
| $ | 1,793 | $ | 2,070 | |||||
Future minimum lease payments under capitalized leases and operating leases are summarized in the table below. The column for capitalized leases includes the requirement to acquire land (presently leased by the Company) in fee simple title as described above.
65
Frisch’s Restaurants, Inc. and Subsidiaries
NOTES TO CONSOLIDATED FINANCIAL STATEMENTS
Three years ended June 2, 2015
NOTE D – LEASED PROPERTY (continued)
| Capitalized Leases | Operating Leases | |||||||
| (in thousands) | ||||||||
| 2016 | $ | 390 | $ | 1,025 | ||||
| 2017 | 365 | 1,015 | ||||||
| 2018 | 237 | 986 | ||||||
| 2019 | 214 | 926 | ||||||
| 2020 | 1,179 | 890 | ||||||
| 2021 - 2033 | 74 | 7,865 | ||||||
| Total | 2,459 | $ | 12,707 | |||||
| Amount representing interest | (525 | ) | ||||||
| Present value of capital lease obligations | 1,934 | |||||||
| Portion due within one-year (included in accrued and other expenses in the consolidated balance sheet) | (278 | ) | ||||||
| Long-term obligations (included in other long term obligations in the consolidated balance sheet) | $ | 1,656 | ||||||
NOTE E - ACCOUNTS PAYABLE AND ACCRUED OTHER EXPENSES
Accounts payable in the Condensed Consolidated Balance Sheet consist of the following:
| Fiscal Year | ||||||||
| 2015 | 2014 | |||||||
| (in thousands) | ||||||||
| Trade and other accounts payable | $ | 3,778 | $ | 4,159 | ||||
| Taxes - sales and use, payroll tax withheld from employees | 666 | 882 | ||||||
| Utilities | 642 | 681 | ||||||
| Gift cards | 805 | 1,499 | ||||||
| Miscellaneous employee withholding | 357 | 373 | ||||||
| Total accounts payable | $ | 6,248 | $ | 7,594 | ||||
Accrued other expenses in the Consolidated Balance Sheet consisted of the following:
66
Frisch’s Restaurants, Inc. and Subsidiaries
NOTES TO CONSOLIDATED FINANCIAL STATEMENTS
Three years ended June 2, 2015
NOTE E - ACCOUNTS PAYABLE AND ACCRUED OTHER EXPENSES (continued)
| Fiscal Year | ||||||||
| 2015 | 2014 | |||||||
| (in thousands) | ||||||||
| Salaries, wages and related expenses | $ | 4,771 | $ | 4,580 | ||||
| Accrued incentive compensation and other related expenses | 2,623 | 1,748 | ||||||
| Accrued property taxes | 1,917 | 1,881 | ||||||
| Other accrued expenses | 2,225 | 1,110 | ||||||
| Total accrued expenses | $ | 11,536 | $ | 9,319 | ||||
NOTE F – INCOME TAXES
Income tax returns are filed in the U.S. federal jurisdiction and in various state and local jurisdictions. The variations between the statutory federal tax rate and the effective tax rate for continuing operations are summarized as follows:
| Fiscal year | ||||||||||||
| 2015 | 2014 | 2013 | ||||||||||
| (percentage of pretax earnings) | ||||||||||||
| Statutory U.S. Federal income tax | 34.0 | 34.0 | 34.0 | |||||||||
| Tax credits | (15.7 | ) | (11.6 | ) | (13.2 | ) | ||||||
| Domestic Production Activities Deduction (DPAD) refunds received or expected | — | (10.3 | ) | — | ||||||||
| State and municipal income taxes - current and deferred (net of federal tax benefit) | 3.3 | 0.7 | 5.1 | |||||||||
| Release of valuation allowances of state deferred tax assets | — | (2.2 | ) | — | ||||||||
| Other | 1.8 | (2.3 | ) | 0.2 | ||||||||
| Effective rate | 23.4 | 8.3 | 26.1 | |||||||||
Deferred tax assets and liabilities result from timing differences in the recognition of revenue and expense between financial reporting and tax statutes. The components of the deferred tax asset (liability) for continuing operations are shown in the table that follows:
67
Frisch’s Restaurants, Inc. and Subsidiaries
NOTES TO CONSOLIDATED FINANCIAL STATEMENTS
Three years ended June 2, 2015
NOTE F – INCOME TAXES (continued)
| Fiscal Year | ||||||||
| 2015 | 2014 | |||||||
| (in thousands) | ||||||||
| Deferred compensation | $ | 934 | $ | 857 | ||||
| Compensated absences | 848 | 845 | ||||||
| Stock-based compensation | 100 | 123 | ||||||
| Self insurance | 394 | 384 | ||||||
| Pension | 8 | 728 | ||||||
| Lease transactions | 306 | 288 | ||||||
| Impairment of long-lived assets | 907 | 685 | ||||||
| State income taxes | 152 | 222 | ||||||
| Net operating loss (NOL) carry forward - state | 46 | 214 | ||||||
| Other | 1,367 | 628 | ||||||
| 5,062 | 4,974 | |||||||
| Less valuation allowance - state NOL | — | — | ||||||
| Total deferred income tax assets | 5,062 | 4,974 | ||||||
| Depreciation | (6,095 | ) | (5,839 | ) | ||||
| Other | (306 | ) | (309 | ) | ||||
| Total deferred income tax liabilities | (6,401 | ) | (6,148 | ) | ||||
| Net deferred income tax (liabilities) assets | $ | (1,339 | ) | $ | (1,174 | ) | ||
| Net current deferred income tax assets | $ | 1,967 | $ | 1,165 | ||||
| Net long-term deferred income tax liabilities | (3,306 | ) | (2,339 | ) | ||||
| $ | (1,339 | ) | $ | (1,174 | ) | |||
Deferred income taxes and other tax receivables reported as current assets in the consolidated balance sheet include prepaid income taxes of $3 and $908 respectively as of June 2, 2015 and June 3, 2014. Refunds associated with Domestic Production Activities Deductions (DPAD) (see further discussion below) totaling $293 and $714 were included in current "Deferred income taxes and other tax receivables" as of June 2, 2015 and June 3, 2014. In addition, deferred income taxes and other tax receivables reported in current assets at June 3, 2014 has been revised to included tax benefits associated with the employee embezzlement (see NOTE M – IMMATERIAL REVISION).
Provision for Income Taxes
The provision for income taxes for continuing operations in all periods presented is summarized in the table below:
68
Frisch’s Restaurants, Inc. and Subsidiaries
NOTES TO CONSOLIDATED FINANCIAL STATEMENTS
Three years ended June 2, 2015
NOTE F – INCOME TAXES (continued)
| Fiscal Year | ||||||||||||
| 2015 | 2014 | 2013 | ||||||||||
| (in thousands) | ||||||||||||
| Income Tax Expense (Benefit) | ||||||||||||
| Current | ||||||||||||
| Federal | $ | 4,652 | $ | 2,738 | $ | 3,259 | ||||||
| Less tax credits | (2,035 | ) | (1,802 | ) | (1,895 | ) | ||||||
| State and local | 299 | 143 | 217 | |||||||||
| Deferred | 131 | (226 | ) | 807 | ||||||||
| Total income taxes | $ | 3,047 | $ | 853 | $ | 2,388 | ||||||
Valuation Allowances
Management periodically assesses the realization of its net deferred tax assets by evaluating all available evidence, both positive and negative, associated with the Company and determining whether, based on the weight of that associated evidence, a valuation allowance for the deferred tax assets is needed. Based on this analysis, management has determined that as of June 2, 2015 it is more likely than not that the Company will realize the deferred income tax benefits of its federal and state deferred tax assets.
Tax returns that the Company files in Indiana and Kentucky have had net operating losses (NOLs) from prior periods, on which valuation allowances had been placed in earlier years. During Fiscal Year 2015, the Company restructured its operations to allow for greater taxable income to be generated in these jurisdictions. In the prior year (Fiscal Year 2014), management released its valuation allowances on its deferred tax assets in Indiana and Kentucky, the result of the impending plan to restructure (Restructuring Plan) the Company’s consolidated subsidiaries from corporations into single member limited liability corporations. As a result, the valuation allowances that had been previously placed on these deferred tax assets were released during Fiscal Year 2014, the effect of which was to record an income tax benefit of $222. The release of $222 included $135 that had been placed on these deferred state income tax assets and included in the tax provision for Fiscal Year 2013. No additional facts have developed that would require a valuation allowance to be placed on these state deferred income tax assets in Fiscal Year 2015. The Company generated sufficient state taxable income during Fiscal Year 2015 to utilize the entire Kentucky NOL and a portion of the Indiana NOL. The Company expects to generate sufficient state taxable income on a go-forward basis to realize its state deferred tax assets, including the remaining Indiana NOL carryforward before its expiration.
While the Restructuring Plan allows state deferred tax assets to be realized, its implementation on June 4, 2014 (the first day of Fiscal Year 2015) required existing state tax assets to be revalued because the tax status change gave rise to lower apportionment factor percentages, which, in turn, lowered the expected tax benefits. The result was a $138 charge to income tax expense in the first quarter of Fiscal Year 2015.
69
Frisch’s Restaurants, Inc. and Subsidiaries
NOTES TO CONSOLIDATED FINANCIAL STATEMENTS
Three years ended June 2, 2015
NOTE F – INCOME TAXES (continued)
Domestic Production Activities Deductions (DPAD)
During Fiscal Year 2014, management undertook a project to identify, quantify and document tax benefits associated with the Domestic Production Activities Deduction (DPAD), which are available under the Internal Revenue Code (IRC). Prior to undertaking this project, management had not elected to claim DPAD benefits. During Fiscal Year 2014, the Company filed amended income tax returns for its Fiscal Years 2010, 2011, 2012 and 2013 to take advantage of DPAD. Total DPAD tax benefits approximating $1,061 were included in the tax provision for Fiscal Year 2014, $347 of which had been received prior to June 3, 2014, with $418 received during Fiscal Year 2015, and the final $296 was received in June 2015 (Fiscal 2016).
DPAD tax benefits associated with domestic production activities that occurred during Fiscal Years 2014 and 2015 were incorporated as part of the normal tax provision for those years.
Other Information
The federal Tax Increase Prevention Act of 2014 (the Act) was signed into law on December 19, 2014. The Act reinstated retroactively to January 1, 2014 certain federal tax benefits, generally referred to as “tax extenders”, which had expired on December 31, 2013. The provisions of the Act included reinstatement for one year (to December 31, 2014) of the Work Opportunity Tax Credit (WOTC), which is a permanent difference between the recognition of expense between financial reporting and tax statutes, along with bonus depreciation and 15 year straight-line cost recovery for qualified leasehold improvements, both of which are timing differences. The effect of these reinstatements has been recognized in the tax provision for Fiscal Year 2015. Tax benefits associated with WOTC are recognized as certifications are received from state agencies, however, no benefits have been recorded for individuals hired after December 31, 2014. In addition to the WOTC, the Company receives substantial federal income tax benefits through the use of the credit allowed for Employer Social Security and Medicare Taxes Paid on Certain Employee Tips (sometimes referred to as the FICA tip credit or the 45(b) credit).
Previously unrecognized tax benefits amounting to approximately $688, which are associated with the December 2014 discovery of a multi-year embezzlement by a former employee (see NOTE M – IMMATERIAL REVISION), are now available to the Company under Section 165 of the IRC. Approximately $606 of the associated tax benefits have been recognized through adjustment to retained earnings as part of the immaterial revision and $82 was recognized during Fiscal Year 2015.
The effect of the Final Repair Regulations (issued by the Internal Revenue Service (IRS)) on the Company's Change in Accounting Method (filed in Fiscal Year 2011) has been determined to be a net unfavorable timing difference of approximately $105 ($36 net tax due). The net adjustment consists of a favorable adjustment of approximately $17 ($6 tax benefit) which is realizable in Fiscal Year 2015, and an unfavorable adjustment of $122 ($42 tax due) which is being paid prospectively over four years. The appropriate Forms 3115 will be filed with the IRS to conform the previous Change in Accounting Method to the Final Repair Regulations.
The Company's total income taxes paid (net of refunds) during Fiscal Years 2015, 2014 and 2013 were $582, $1,454 and $1,521, respectively. (For more information about refunds, refer to the above discussion of Domestic Production Activities Deductions (DPAD.)
70
Frisch’s Restaurants, Inc. and Subsidiaries
NOTES TO CONSOLIDATED FINANCIAL STATEMENTS
Three years ended June 2, 2015
NOTE F – INCOME TAXES (continued)
The Company believes it has no material uncertain tax positions taken in any tax returns that have been filed or that are expected to be taken on a future tax return. The impact of an uncertain tax position taken or expected to be taken on an income tax return must be recognized in the financial statements at the largest amount that is more likely than not to not be sustained upon audit by the relevant taxing authority. An uncertain income tax position will be recognized in the financial statements if it is more likely of not being sustained.
The Company’s federal income tax return for the year ended May 28, 2013 (Fiscal Year 2013, filed in February 2014) was selected for examination by the IRS in the spring of 2014. The examination concluded in May 2015 with no changes proposed by the examiner, other than the allowance of DPAD benefits discussed earlier.
NOTE G - SHAREHOLDERS' EQUITY / CAPITAL STOCK
Pending Agreement and Plan of Merger
As discussed in NOTE A – ACCOUNTING POLICIES above, on May 21, 2015 the Company entered into an agreement with Parent and Merger-Sub. The Merger Agreement provides for a business combination whereby Merger Sub will merge with and into the Company (the Merger). As a result of the Merger, the separate corporate existence of Merger Sub will cease. The Company will continue as the surviving corporation in the Merger and will be a wholly-owned subsidiary of Parent.
Upon closing of the contemplated transaction, all of the plans discussed in NOTE G – SHAREHOLDERS’ EQUITY/CAPITAL STOCK will be effectively terminated. Any existing stock awards and options will fully vest at that time. Holders of stock awards will be entitled to receive the full $34.00 per share price included in the Merger Agreement and holders of options will have the right to receive an amount in cash equal to the excess of the Merger Consideration over the per share exercise price. All shares and options that have been converted into the right to receive the Merger Consideration shall be automatically cancelled upon the conversion thereof and shall cease to exist, and the holders of certificates shall cease to have any rights with respect to such shares or options, other than the right to receive the Merger Consideration.
Equity Compensation Plans
During the year that ended June 2, 2015, the Company had three equity compensation plans, which were adopted respectively in 1993, 2003 and 2012.
2003 and 2012 Stock Option and Incentive Plans
Shareholders approved the 2012 Stock Option and Incentive Plan (2012 Plan) in October 2012. The 2012 Plan has material, substantive differences from the 2003 Stock Option and Incentive Plan (as amended) (2003 Plan).
71
Frisch’s Restaurants, Inc. and Subsidiaries
NOTES TO CONSOLIDATED FINANCIAL STATEMENTS
Three years ended June 2, 2015
NOTE G - SHAREHOLDERS' EQUITY / CAPITAL STOCK (continued)
Under the 2003 Plan (approved by shareholders in October 2003), up to 800,000 shares were originally authorized for awards. Shareholder approval of the 2012 Plan canceled 483,410 shares that had remained available to be awarded under the 2003 Plan. The authorization under the 2012 Plan has been set at 500,000 shares that may be awarded (subject to proportionate and equitable adjustments determined by the Compensation Committee of the Board of Directors (Committee) as deemed necessary following the event of any equity restructuring). The 2003 Plan had limited the number of shares to 80,000 that could be awarded to an individual during a single fiscal year. The 2012 Plan reduced the annual limit to 50,000 shares, but retained the maximum annual dollar limit of $1,000 (one million dollars) for awards denominated in dollars that may be granted to any individual during any fiscal year if the award is intended to qualify as performance based compensation. No awards were permitted to be granted under the 2003 Plan after the 10th anniversary (October 6, 2013) of its inception. The 2012 Plan will remain in effect until all shares subject to the Plan have been awarded or issued according to the Plan's provisions, unless terminated sooner by the Board of Directors.
All other provisions of the 2012 Plan mirror those of the 2003 Plan, including continuance to provide for several forms of awards including stock options, stock appreciation rights, stock awards including restricted and unrestricted awards of stock, and performance awards. Employees of the Company and non-employee members of the Board of Directors are eligible to be selected to participate in the 2012 Plan. Participation is based on selection by the Committee. Although there is no limitation on the number of participants in the Plan, approximately 35 to 40 persons have historically participated.
Options to purchase shares of the Company’s common stock (stock options) permit the holder to purchase a fixed number of shares at a fixed price. When options are granted, the Committee determines the number of shares subject to the option, the term of the option, which may not exceed 10 years, the time or times when the option will become exercisable and the price per share that a participant must pay to exercise the option. No option will be granted with an exercise price that is less than 100 percent of fair market value on the date of the grant. The option price and obligatory withholding taxes may be paid pursuant to a “cashless” exercise/sale procedure involving the simultaneous sale by a broker of shares that are covered by the option.
Stock appreciation rights (SAR’s) are rights to receive payment, in cash, shares of common stock or a combination of the two, equal to the excess of (1) the fair market value of a share of common stock on the date of exercise over (2) the price per share of common stock established in connection with the grant of the SAR (the reference price). The reference price must be at least 100 percent of the common stock’s fair market value on the date the SAR is granted. SAR’s may be granted by the Committee in its discretion to any participant, and may have terms no longer than 10 years.
Stock awards are grants of shares of common stock that may be restricted (subject to a holding period or other conditions) or unrestricted. The Committee determines the amounts, vesting, if any, terms and conditions of the awards, including the price to be paid, if any, for restricted awards and any contingencies related to the attainment of specified performance goals or continued employment or service.
The Committee may also grant performance awards to participants. Performance awards are the right to receive cash, common stock or both, at the end of a specified performance period, subject to satisfaction of the performance criteria and any vesting conditions established for the award.
72
Frisch’s Restaurants, Inc. and Subsidiaries
NOTES TO CONSOLIDATED FINANCIAL STATEMENTS
Three years ended June 2, 2015
NOTE G - SHAREHOLDERS' EQUITY / CAPITAL STOCK (continued)
2012 Plan - Restricted Stock Awards
On October 22, 2014 (Fiscal Year 2015), October 2, 2013 (Fiscal Year 2014), and October 3, 2012 (Fiscal Year 2013) each non-employee member of the Board of Directors was granted a restricted stock award under the 2012 Plan that was equivalent to $40 (forty thousand dollars) in shares of the Company's common stock. The aggregate awards amounted to 10,773 (Fiscal Year 2015), 11,984 (Fiscal Year 2014) and 14,245 (Fiscal Year 2013) shares granted, which resulted in 1,539 (Fiscal Year 2015), 1,712 (Fiscal Year 2014) and 2,035 (Fiscal Year 2013) shares being issued to each non-employee director, based on the market value of the Company's stock on the dates of the awards. Pursuant to the terms of his employment agreement, the Chief Executive Officer (CEO) was granted a restricted stock award in the same amount (1,539 shares in Fiscal Year 2015, 1,712 shares in Fiscal Year 2014 and 2,035 shares in Fiscal Year 2013) and subject to the same conditions as the restricted stock that was granted to the non-employee directors on that same day. The total value of all awards granted on October 22, 2014, October 2, 2013, and October 3, 2012 amounted to $320 (three hundred twenty thousand dollars) in each of the three fiscal years.
The restricted stock awards were re-issued from the Company's treasury and will vest in full on the first anniversary of the grant dates. Full voting and dividend rights are provided prior to vesting. Vested shares must be held until board service ends, except that enough shares may be sold to satisfy tax obligations attributable to the grant.
2012 Plan - Unrestricted Stock Awards
In recognition of their performance during Fiscal Years 2014 and 2013, a group of executive officers (excluding the CEO) and other key employees was granted an aggregate award of 9,685 and 13,450 shares, respectively, of unrestricted stock, which were re-issued from the Company's treasury on June 18, 2014 and June 12, 2013, respectively. The total value of the awards amounted $221 (two hundred twenty one thousand dollars, which was accrued in Fiscal Year 2014) and $244 (two hundred forty four thousand dollars, which was accrued in Fiscal Year 2013). In connection with the awards, 2,736 (on June 18, 2014 for Fiscal Year 2014) and 3,895 (on June 12, 2013 for Fiscal Year 2013) shares were immediately surrendered to the Company's treasury to cover the withholding tax obligations on the compensation. As of June 2, 2015, $225 (two hundred twenty five thousand dollars) has been accrued in anticipation of a similar performance award for Fiscal Year 2015. However, pending the closing of the Merger transaction discussed in NOTE A – ACCOUNTING POLICIES, above, this amount was paid in cash instead of restricted stock in July 2015 (Fiscal Year 2016).
2012 Plan - Performance Award
The CEO's employment agreement was amended on June 12, 2013 to allow the Committee to grant Performance Awards to the CEO under the 2012 Plan. On June 12, 2013 the Committee granted a two-year Performance Award to the CEO that was effective May 29, 2013 to govern the CEO's incentive compensation for the last two years of the employment agreement (Fiscal Years 2014 and 2015). Under that agreement, the award amounted to $426 (four hundred twenty six thousand dollars) for Fiscal Year 2014. The award consisted of $139 (one hundred thirty nine thousand dollars) for the nondeferred cash balance plan award (see Other Post Retirement Plans in NOTE H – PENSION PLANS) and $287 (two hundred eighty seven thousand dollars), of which 90 percent was paid in cash and 10 percent was paid in common shares of the Company stock (1,309 shares were re-issued from the Company’s treasury on August 5, 2014). For performance during Fiscal Year 2015, $589 (five hundred eighty nine thousand dollars) was accrued during Fiscal Year 2015 and subsequently paid to the CEO in cash in August 2015 (Fiscal Year 2016). The cash award consisted of $210 (two hundred ten thousand dollars) for the nondeferred cash balance plan award and $379 (three hundred seventy nine thousand dollars). In prior years, the CEO’s annual performance award was paid in 90 percent cash and 10 percent common shares of Company stock.
73
Frisch’s Restaurants, Inc. and Subsidiaries
NOTES TO CONSOLIDATED FINANCIAL STATEMENTS
Three years ended June 2, 2015
NOTE G - SHAREHOLDERS' EQUITY / CAPITAL STOCK (continued)
2012 Plan - Other Awards
No other awards - stock options, stock appreciation rights, other stock awards or other performance awards - have been granted under the 2012 Plan.
2003 Plan - Unrestricted Stock Awards
On June 13, 2012 the Committee granted unrestricted stock awards to the executive officers (excluding the CEO) and other key employees. Pursuant to the awards, 4,850 shares of the Company's common stock were re-issued from the Company's treasury. The total value of the awards amounted to $127 (one hundred twenty seven thousand dollars). In connection with the awards, 1,349 shares were immediately surrendered to the Company's treasury to cover the withholding tax obligations on the compensation.
2003 Plan - Restricted Stock Awards
Each non-employee member of the Board of Directors was granted a restricted stock award on October 5, 2011 equivalent to $40 (forty thousand dollars) in shares of the Company’s common stock. The aggregate award amounted to 14,560 shares granted, which resulted in 2,080 shares being issued to each non-employee director, based upon the October 5, 2011 market value of the Company's common stock. Pursuant to the terms of his employment contract, the CEO was granted a restricted stock award on October 5, 2011 in the same amount (2,080 shares) and subject to the same conditions as the restricted stock granted to non-employee directors that day. The total value of the awards granted on October 5, 2011 amounted to $320 (three hundred twenty thousand dollars). In connection with these awards, certain members of the Board of Directors surrendered a total of 1,456 shares to the Company's treasury on the October 5, 2012 vesting date to satisfy their tax obligations.
All restricted stock awards under the 2003 Plan were re-issued from the Company's treasury and vested in full on the first anniversary of the grant date. Full voting and dividend rights were provided prior to vesting. Vested shares must be held until board service or employment ends, except that enough shares may be sold to satisfy tax obligations attributable to the grant.
2003 Plan - Performance Award
Pursuant to the terms of the CEO's employment agreement that was effective May 30, 2012 (the first day of Fiscal Year 2013), the Committee granted a one-year Performance Award to the CEO on May 30, 2012 as permitted under 2003 Plan. The Performance Award governed the CEO's incentive compensation for Fiscal Year 2013, which amounted to $409 (four hundred nine thousand dollars), and which consisted of $137 (one hundred thirty seven thousand dollars) for the nondeferred cash balance plan and $272 (two hundred seventy two thousand dollars) that was paid 90 percent in cash and 10 percent in common shares of the Company's stock (1,103 shares were re-issued from the Company's treasury in July 2013).
2003 Plan - Stock Option Awards
Stock options were last granted under the 2003 Plan in June 2010. There were 38,500 options outstanding as of June 2, 2015, the last of which reached fully vested status in June 2013.
74
Frisch’s Restaurants, Inc. and Subsidiaries
NOTES TO CONSOLIDATED FINANCIAL STATEMENTS
Three years ended June 2, 2015
NOTE G - SHAREHOLDERS' EQUITY / CAPITAL STOCK (continued)
1993 Stock Option Plan
The 1993 Stock Option Plan (1993 Plan) (approved by shareholders in October 1993) authorized the grant of stock options for up to 562,432 shares (as adjusted for subsequent changes in capitalization from the original authorization of 500,000 shares) of the common stock of the Company for a 10 year period beginning in May 1994.
As of June 3, 2014, 6,834 shares granted under the 1993 Plan remained outstanding, all of which expired on June 8, 2014 (Fiscal Year 2015), which effectively terminated the 1993 Plan.
Outstanding and Exercisable Options
The changes in outstanding and exercisable options involving both the 1993 Plan and the 2003 Plan are shown below as of June 2, 2015:
| No. of Shares | Weighted Avg. Price Per Share | Weighted Avg. Remaining Contractual Term | Aggregate Intrinsic Value | |||||||||||
| (in thousands) | ||||||||||||||
| Outstanding at beginning of year | 56,501 | $ | 18.73 | |||||||||||
| Granted | — | |||||||||||||
| Exercised | (10,917 | ) | $ | 17.51 | ||||||||||
| Forfeited or expired | (7,084 | ) | $ | 29.84 | ||||||||||
| Outstanding at end of year | 38,500 | $ | 17.03 | 2.44 years | $ | 646 | ||||||||
| Exercisable at end of year | 38,500 | $ | 17.03 | 2.44 years | $ | 646 | ||||||||
The intrinsic value of stock options exercised during Fiscal Years 2015, 2014 and 2013 was $84 (eighty four thousand dollars), $127 (one hundred twenty seven thousand dollars) and $2,771 (two million seven hundred seventy one thousand dollars), respectively. Options exercised during Fiscal Year 2013 included 136,000 by the CEO, the intrinsic value of which amounted to $1,278 (one million two hundred seventy eight thousand dollars). Excess tax benefits of $417 (four hundred seventeen thousand dollars) were recorded in additional paid in capital from the exercise of stock options during Fiscal Year 2013. All shares exercised during Fiscal Years 2015, 2014 and 2013 were re-issued from the Company's treasury.
75
Frisch’s Restaurants, Inc. and Subsidiaries
NOTES TO CONSOLIDATED FINANCIAL STATEMENTS
Three years ended June 2, 2015
NOTE G - SHAREHOLDERS' EQUITY / CAPITAL STOCK (continued)
| 2003 Stock Option Plan - Range of Exercise Prices Per Share | No. of Shares | Weighted Avg. Price per Share | Weighted Avg. Remaining Life In Years | |||||||
| Outstanding and Exercisable | ||||||||||
| $10.05 to $15.90 | 14,000 | $ | 13.64 | 1.54 Years | ||||||
| $15.91 to $24.20 | 24,500 | $ | 18.97 | 2.96 Years | ||||||
| $10.05 to $24.20 | 38,500 | $ | 17.03 | 2.44 Years | ||||||
Restricted Stock Awards
The changes in restricted stock issued under the 2012 Plan are shown below as of June 2, 2015:
| No. of Shares | Weighted Avg. Price Per Share | |||||||
| Non-vested at beginning of year | 13,696 | $ | 23.36 | |||||
| Granted | 12,312 | $ | 25.99 | |||||
| Vested | (13,696 | ) | $ | 23.36 | ||||
| Forfeited | — | — | ||||||
| Non-vested at end of year | 12,312 | $ | 25.99 | |||||
Employee Stock Purchase Plan
Shareholders approved the Employee Stock Option Plan (elsewhere referred to as Employee Stock Purchase Plan) in October 1998. The Plan provides employees who have completed 90 days of continuous service with an opportunity to purchase shares of the Company’s common stock through payroll deduction. Immediately following the end of each semi-annual offering period, participant account balances are used to purchase shares of stock measured at 85 percent of the fair market value of shares at the beginning of the offering period or at the end of the offering period, whichever is lower. The Plan authorizes a maximum of 1,000,000 shares that may be purchased on the open market or from the Company’s treasury. As of April 30, 2015 (latest available data), 212,703 shares had been cumulatively purchased through the Plan. Shares purchased through the Plan are held by the Plan’s custodian until withdrawn or distributed. As of April 30, 2015, the custodian held 48,544 shares on behalf of employees. This plan was suspended following the Company’s entry into the Agreement and Plan of Merger discussed in NOTE A – ACCOUNTING POLICIES.
Frisch’s Executive Savings Plan
Common shares totaling 58,492 (as adjusted for subsequent changes in capitalization from the original authorization of 50,000 shares) were reserved for issuance under the non-qualified Frisch’s Executive Savings Plan (FESP) (see Benefit Plans in NOTE I - FRISCH'S EXECUTIVE SAVINGS PLAN) when it was established in 1993. As of June 2, 2015, 28,072 shares remained in the FESP reserve, including 13,934 shares allocated but not issued to participants.
76
Frisch’s Restaurants, Inc. and Subsidiaries
NOTES TO CONSOLIDATED FINANCIAL STATEMENTS
Three years ended June 2, 2015
NOTE G - SHAREHOLDERS' EQUITY / CAPITAL STOCK (continued)
Other Outstanding Options, Warrants or Rights
There are no other outstanding options, warrants or rights.
Treasury Stock
As of June 2, 2015, the Company’s treasury held 2,455,185 shares of the Company’s common stock. Most of the shares were acquired through a modified “Dutch Auction” self-tender offer in 1997, and in a series of intermittent open market repurchase programs that began in 1998.
On July 25, 2012, the Board of Directors authorized the Company to purchase over a three year period, on the open market and in transactions negotiated privately, up to 450,000 shares of its common stock. No shares were acquired under the program during Fiscal Years 2015 and 2014. During Fiscal Year 2013, the Company acquired 212,929 shares under the program at a cost of $6,708 (six million seven hundred eight thousand dollars), which includes 32,000 shares that were beneficially owned by the CEO (see NOTE K - RELATED PARTY TRANSACTIONS) and 180,929 shares that were re-acquired in connection with the exercise of "cashless" stock options that normally settle through a broker on the open market.
Separate from the repurchase program, during Fiscal Years 2015, 2014 and 2013, the Company’s treasury acquired 2,736, 5,381 and 5,227 shares of common stock, respectively to cover withholding tax obligations in connection with stock awards. The cost associated with the re-acquired treasury shares was $63 (sixty three thousand dollars), $105 (one hundred five thousand dollars) and $119 (one hundred nineteen thousand dollars), respectively.
Dividends
Regular quarterly cash dividends paid to shareholders during Fiscal Year 2015 amounted to $3,995 (three million nine hundred ninety five thousand dollars) or $0.78 per share. In addition, a $0.20 per share dividend was declared on June 12, 2015. Its payment of $1,026 (one million twenty six thousand dollars) on July 10, 2015 (not included in accounts payable at June 2, 2015) was the 218th consecutive quarterly cash dividend paid by the Company.
Earnings Per Share
Basic earnings per share (EPS) calculations are based on the weighted average number of outstanding common shares during the period presented. Diluted EPS calculations include the effect of common stock equivalents, which assumes the exercise and conversion of dilutive stock options.
77
Frisch’s Restaurants, Inc. and Subsidiaries
NOTES TO CONSOLIDATED FINANCIAL STATEMENTS
Three years ended June 2, 2015
NOTE G - SHAREHOLDERS' EQUITY / CAPITAL STOCK (continued)
| Used to Calculate Basic EPS | Used to Calculate Diluted EPS | |||||||||||
| Weighted Average Shares Outstanding | Stock Equivalents | Weighted Average Shares Outstanding | ||||||||||
| Fiscal Year 2015 | 5,123,116 | 14,788 | 5,137,904 | |||||||||
| Fiscal Year 2014 | 5,087,317 | 13,820 | 5,101,137 | |||||||||
| Fiscal Year 2013 | 5,030,964 | 13,926 | 5,044,890 | |||||||||
Stock options to purchase 7,000 and 20,000 shares were respectively excluded from the calculation of diluted EPS in Fiscal Years 2014 and 2013 because the effect was anti-dilutive. No stock options were excluded from the calculation for Fiscal Year 2015.
Share-Based Payment (Compensation Cost)
The fair value of restricted stock issued (one year vesting) and stock options granted (three year vesting) is recognized as compensation cost on a straight-line basis over the vesting periods of the awards. The fair value of unrestricted stock awarded under the 2003 Plan was recognized entirely during the period granted. Unrestricted stock awarded under the 2012 Plan on June 18, 2014 and June 12, 2013 was accrued in in Fiscal Years 2014 and 2013, respectively. The unrestricted stock awards accrued for in Fiscal Year 2015 under the 2012 Plan were subsequently paid in cash in July 2015 (Fiscal Year 2016) in contemplation of the closing of the Merger transaction discussed in NOTE A – ACCOUNTING POLICIES, above. Compensation costs arising from all share-based payments are charged to the line item for administrative and advertising expense in the Consolidated Statement of Earnings.
78
Frisch’s Restaurants, Inc. and Subsidiaries
NOTES TO CONSOLIDATED FINANCIAL STATEMENTS
Three years ended June 2, 2015
NOTE G - SHAREHOLDERS' EQUITY / CAPITAL STOCK (continued)
| Fiscal Year | ||||||||||||
| 2015 | 2014 | 2013 | ||||||||||
| (in thousands, except per share data) | ||||||||||||
| Stock options granted | $ | — | $ | — | $ | 54 | ||||||
| Restricted stock issued October 2014 ($320) - Board (7) & CEO | 197 | — | — | |||||||||
| Restricted stock issued October 2013 ($320) - Board (7) & CEO | 123 | 197 | — | |||||||||
| Restricted stock issued October 2012 ($320) - Board (7) & CEO | — | 123 | 197 | |||||||||
| Restricted stock issued October 2011 ($320) - Board (7) & CEO | — | — | 123 | |||||||||
| Unrestricted stock issued June 2012 - Executive Officers, excl. CEO | — | — | 127 | |||||||||
| Unrestricted stock accrued | 225 | (a) | 221 | 244 | ||||||||
| Share-based compensation cost, pretax | 545 | 541 | 745 | |||||||||
| Tax benefit | (186 | ) | (184 | ) | (254 | ) | ||||||
| Total share-based compensation cost, net of tax | $ | 359 | $ | 357 | $ | 491 | ||||||
| Effect on basic earnings per share | $ | 0.07 | $ | 0.07 | $ | 0.10 | ||||||
| Effect on diluted earnings per share | $ | 0.07 | $ | 0.07 | $ | 0.10 | ||||||
| (a) | Amounts accrued in Fiscal Year 2015 were subsequently paid in cash in July 2015 as a result of the contemplated pending Merger transaction. |
There was no unrecognized pretax compensation cost related to non-vested stock options as of June 2, 2015. Unrecognized pretax compensation cost related to restricted stock awards amounted to $123 (one hundred twenty three thousand dollars) as of June 2, 2015, which is expected to be recognized over a weighted average period of 0.38 years.
No stock options have been awarded since June 2010.
Compensation cost is also recognized in connection with the Company’s Employee Stock Purchase Plan (see Employee Stock Purchase Plan described elsewhere in NOTE G - SHAREHOLDERS' EQUITY / CAPITAL STOCK). Compensation costs related to the Employee Stock Purchase Plan, determined at the end of each semi-annual offering period - October 31 and April 30 - amounted to $39 (thirty nine thousand dollars), $40 (forty thousand dollars) and $147 (one hundred forty seven thousand dollars) respectively, during Fiscal Years 2015, 2014 and 2013.
NOTE H - PENSION PLANS
As described more fully under Benefit Plans in NOTE A – ACCOUNTING POLICIES, the Company sponsors the Frisch's Restaurants, Inc. Pension Plan, a defined benefit pension plan (DB plan) that was created on May 29, 2012 when two previously sponsored DB plans were merged. The Company also sponsors an unfunded non-qualified Supplemental Executive Retirement Plan (SERP) for “highly compensated employees” (HCEs). The accounting for the merged DB plan and the SERP is summarized in the tables that follow.
79
Frisch’s Restaurants, Inc. and Subsidiaries
NOTES TO CONSOLIDATED FINANCIAL STATEMENTS
Three years ended June 2, 2015
NOTE H - PENSION PLANS (continued)
Recognition of the overfunded or underfunded status of the DB plan is recorded as an asset or liability in the Consolidated Balance Sheet. Funded status is measured as the difference between plan assets at fair value and projected benefit obligations, which includes projections for future salary increases. Actuarial gains and losses, prior service costs or credits and transition obligations, if any, which have not yet been recognized, are recorded in equity as Accumulated Other Comprehensive Income or Loss (AOCI). Such items are amortized on a straight-line basis over the projected average remaining employment service period of active participants expected to benefit under the plan.
The measurement dates in the following tables are May 31, 2015 and May 31, 2014.
| Fiscal Year | ||||||||
| 2015 | 2014 | |||||||
| (in thousands) | ||||||||
| Change In Benefit Obligation | ||||||||
| Projected benefit obligation at beginning of year | $ | 39,706 | $ | 41,906 | ||||
| Service cost | 1,404 | 1,622 | ||||||
| Interest cost | 1,487 | 1,815 | ||||||
| Benefits paid from the plans (including expenses) | (2,344 | ) | (2,261 | ) | ||||
| Actuarial loss (gain) | 777 | (3,376 | ) | |||||
| Projected benefit obligation at end of year | $ | 41,030 | $ | 39,706 | ||||
| Accumulated benefit obligation at end of year | $ | 39,532 | $ | 38,057 | ||||
| Fiscal Year | ||||||||
| 2015 | 2014 | |||||||
| (in thousands) | ||||||||
| Change in Plan Assets | ||||||||
| Fair value of plan assets at beginning of year (a) | $ | 37,835 | $ | 33,376 | ||||
| Actual return on plan assets | 3,512 | 4,720 | ||||||
| Employer contributions | 2,004 | 2,000 | ||||||
| Benefits paid from the plans (including expenses) | (2,344 | ) | (2,261 | ) | ||||
| Fair value of plan assets at end of year (a) | $ | 41,007 | $ | 37,835 | ||||
(a) No portion of plan assets has been invested in shares of the Company’s common stock.
80
Frisch’s Restaurants, Inc. and Subsidiaries
NOTES TO CONSOLIDATED FINANCIAL STATEMENTS
Three years ended June 2, 2015
NOTE H - PENSION PLANS (continued)
| Fiscal Year | ||||||||
| 2015 | 2014 | |||||||
| (in thousands) | ||||||||
| Reconciliation of Funded Status | ||||||||
| Fair value of plan assets | $ | 41,007 | $ | 37,835 | ||||
| Projected benefit obligations | (41,030 | ) | (39,706 | ) | ||||
| Funded status at end of year | $ | (23 | ) | $ | (1,871 | ) | ||
| Amount of asset or (liability) recognized at end of year | $ | (23 | ) | $ | (1,871 | ) | ||
| Fiscal Year | ||||||||
| 2015 | 2014 | |||||||
| (in thousands) | ||||||||
| Funded Status Recognized in Consolidated Balance Sheet | ||||||||
| Non-current asset (c) | $ | 293 | $ | — | ||||
| Current liability (d) | (316 | ) | (4 | ) | ||||
| Non-current liability (d) | — | (1,867 | ) | |||||
| Net amount (asset (obligation)) recognized in the Consolidated Balance Sheet | $ | (23 | ) | $ | (1,871 | ) | ||
| (c) | Non-current asset primarily consists of the fair value of plan assets in excess of the projected benefit obligation of the DB Plan. |
| (d) | Current liability for Fiscal Year 2015 consists of the unfunded SERP. Fiscal Year 2014 non-current liability consists of $1,575 in underfunding of the DB plan plus $292 for the unfunded SERP. |
| Fiscal Year | ||||||||
| 2015 | 2014 | |||||||
| (in thousands) | ||||||||
| Pretax Amounts Recognized In Accumulated Other Comprehensive Income Or Loss (AOCI) | ||||||||
| Unrecognized net actuarial loss | $ | 238 | $ | 353 | ||||
| Unrecognized prior service cost / (credit) | (73 | ) | (80 | ) | ||||
| Accumulated other comprehensive (income) loss (e) | $ | 165 | $ | 273 | ||||
(e) Accumulated contributions were in excess of net periodic benefit cost by $143 as of June 2, 2015. As of June 3, 2014, accumulated net periodic pension cost exceed accumulated contributions by $1,599.
81
Frisch’s Restaurants, Inc. and Subsidiaries
NOTES TO CONSOLIDATED FINANCIAL STATEMENTS
Three years ended June 2, 2015
NOTE H - PENSION PLANS (continued)
The estimated amounts that will be amortized from AOCI into net periodic pension cost in Fiscal Year 2016 are as follows:
| Fiscal Year 2016 | ||||
| (in thousands) | ||||
| Net actuarial loss | $ | 53 | ||
| Prior service cost (credit) | (8 | ) | ||
| $ | 45 | |||
The projected benefit obligation and fair value of plan assets for pension plans with a projected benefit obligation in excess of plan assets at the measurement date were as follows:
| Fiscal Year | ||||||||
| 2015 | 2014 | |||||||
| (in thousands) | ||||||||
| Projected benefit obligation at end of year | $ | 41,030 | $ | 39,706 | ||||
| Fair value of plan assets at end of year | 41,007 | 37,834 | ||||||
The projected benefit obligation, accumulated benefit obligation and fair value of plan assets for pension plans with an accumulated benefit obligation in excess of plan assets at the measurement date were as follows:
| Fiscal Year | ||||||||
| 2015 | 2014 | |||||||
| (in thousands) | ||||||||
| Projected benefit obligation at end of year | $ | 41,030 | $ | 39,706 | ||||
| Accumulated benefit obligation at end of year (f) | 39,532 | 38,057 | ||||||
| Fair value of plan assets at end of year | 41,007 | 37,834 | ||||||
| (f) | Accumulated benefit obligation consists of DB Plan obligations of $39,216 and unfunded SERP obligations of $316. At June 2, 2015, only the SERP had obligations in excess of fair value of plan assets. |
82
Frisch’s Restaurants, Inc. and Subsidiaries
NOTES TO CONSOLIDATED FINANCIAL STATEMENTS
Three years ended June 2, 2015
NOTE H - PENSION PLANS (continued)
| Fiscal Year | ||||||||||||
| 2015 | 2014 | 2013 | ||||||||||
| (in thousands) | ||||||||||||
| Net Periodic Pension Cost Components | ||||||||||||
| Service cost | $ | 1,404 | $ | 1,622 | $ | 1,803 | ||||||
| Interest cost | 1,487 | 1,815 | 1,734 | |||||||||
| Expected return on plan assets | (2,675 | ) | (2,416 | ) | (1,995 | ) | ||||||
| Amortization of prior service cost | (8 | ) | (8 | ) | (8 | ) | ||||||
| Amortization of net actuarial loss | 55 | 850 | 1,713 | |||||||||
| Net periodic pension cost (g) | $ | 263 | $ | 1,863 | $ | 3,247 | ||||||
(g) Net periodic pension cost for Fiscal Year 2016 is expected to approximate $126.
| Fiscal Year | ||||||||||||
| 2015 | 2014 | 2013 | ||||||||||
| (in thousands) | ||||||||||||
| Changes In Other Comprehensive Income (Pretax) | ||||||||||||
| Changes in plan assets and benefit obligations recognized in other comprehensive income: | ||||||||||||
| Current year actuarial (gain) | $ | (60 | ) | $ | (5,680 | ) | $ | (5,403 | ) | |||
| Amounts recognized as a component of net periodic benefit cost: | ||||||||||||
| Amortization of actuarial loss | (55 | ) | (850 | ) | (1,713 | ) | ||||||
| Amortization of prior service costs | 8 | 8 | 8 | |||||||||
| Total recognized in other comprehensive (income) loss | $ | (107 | ) | $ | (6,522 | ) | $ | (7,108 | ) | |||
| Total recognized in net periodic pension cost and other comprehensive loss (income) | $ | 156 | $ | (4,659 | ) | $ | (3,861 | ) | ||||
83
Frisch’s Restaurants, Inc. and Subsidiaries
NOTES TO CONSOLIDATED FINANCIAL STATEMENTS
Three years ended June 2, 2015
NOTE H - PENSION PLANS (continued)
| Fiscal Year | ||||||||||||
| 2015 | 2014 | 2013 | ||||||||||
| Weighted Average Assumptions | ||||||||||||
| Discount rate - net periodic pension cost | 3.90 | % | 4.40 | % | 4.25 | % | ||||||
| Discount rate - projected benefit obligation | 3.90 | % | 3.90 | % | 4.40 | % | ||||||
| Rate of compensation increase - net periodic pension cost | 2.13 | % | 4.00 | % | 4.00 | % | ||||||
| Rate of compensation increase - projected benefit obligation | 2.07 | % | 2.13 | % | 4.00 | % | ||||||
| Expected long-term rate of return on plan assets | 7.25 | % | 7.25 | % | 7.50 | % | ||||||
The discount rate is selected by matching the cash flows of the pension plan to that of a yield curve that provides the equivalent yields on zero-coupon corporate bonds for each maturity. Benefit cash flows due in a particular year can be "settled" theoretically by "investing" them in the zero-coupon bond that matures in the same year. The discount rate is the single rate that produces the same present value of cash flows. The selection of the discount rate represents the equivalent single rate under a broad market AA yield curve (Above Mean Yield Curve) as developed by the Company's actuarial consulting firm. The yield curve is used to set the discount rate assumption using cash flows on an aggregate basis, which is then rounded to the level of the nearest 10 basis points.
The assumption for the expected return on plan assets is selected by using a weighted average of the historical broad market return and the forward looking expected return. Returns are developed based on the plan's target asset allocation (see the table elsewhere in NOTE H - PENSION PLANS ). The historical broad market return assumes the widest period of historical data available for each asset class, as early as 1926 (in some cases) through 2014. Domestic equity securities are allocated equally between large cap and small cap funds, with fixed income securities
allocated equally between long-term corporate/government bonds and intermediate-term government bonds. The model for the forward looking expected return uses a range of expected outcomes over a number of years based on the plan's asset allocation as noted above and assumptions about the return, variance, and co-variance for each asset class. The historical and forward looking returns are adjusted to reflect a 0.20 percent investment expense assumption representative of passive investments. The weighted average of the historical broad market return and the forward looking expected return is rounded to the level of the nearest 25 basis points to determine the overall expected return on assets. The expected rate of return has been adjusted to reflect a 7.00 percent return for Fiscal Year 2016, down from 7.25 percent for Fiscal Year 2015.
The following table shows the estimated future benefit payments for the DB plans and the SERP:
| Expected Benefit Payments | (in thousands) | |||
| Fiscal Year 2016 | $ | 2,914 | ||
| Fiscal Year 2017 | 2,780 | |||
| Fiscal Year 2018 | 2,510 | |||
| Fiscal Year 2019 | 2,854 | |||
| Fiscal Year 2020 | 2,744 | |||
| Next 5 Years 2021 - 2025 | 15,022 | |||
84
Frisch’s Restaurants, Inc. and Subsidiaries
NOTES TO CONSOLIDATED FINANCIAL STATEMENTS
Three years ended June 2, 2015
NOTE H - PENSION PLANS (continued)
Investment Policies and Asset Allocation
The objectives of the committee that sets investment policy for pension assets include holding, protecting and investing the assets prudently. The committee has determined that plan assets should be invested using long-term objectives, since the plan is intended to fund current and future benefits for participants and beneficiaries. Equity securities have provided the highest historical return to investors over extended time horizons. Thus, the bulk of the plan assets are targeted to be held in equity securities. Prudent investment strategies also call for a certain portion of the plan assets to be held in fixed return instruments. The committee does not use derivative instruments to re-balance exposures to certain asset classes. Although not prohibited from doing so, the committee has chosen not to invest the plan assets in the common stock of the Company.
Target and actual pension plan asset allocations are summarized as follows:
| Fiscal Year | ||||||||||||
| 2015 | 2014 | |||||||||||
| Asset Class | Target | (Actual Allocations) | ||||||||||
| Equity Securities | 70 | % | 71 | % | 69 | % | ||||||
| Fixed income | 25 | % | 28 | % | 30 | % | ||||||
| Cash equivalents | 5 | % | 1 | % | 1 | % | ||||||
| Total | 100 | % | 100 | % | 100 | % | ||||||
Funding
The Company contributes amounts to the DB plan that are sufficient to satisfy legal funding requirements, plus discretionary tax-deductible amounts that may be deemed advisable. Contributions to the DB plan for Fiscal Year 2016 are currently anticipated at a level of $2,000, which includes amounts to meet minimum legal funding requirements, if any, and potential discretionary contributions. Obligations to participants in the SERP are satisfied in the form of a lump sum distribution upon the retirement of the participants. A payment of approximately $319 from the SERP is currently anticipated for Fiscal Year 2016.
Future funding of the DB plan largely depends upon the performance of investments that are held in the trust that has been established for the plan.
Plan Assets at Fair Value
Fair value measurements are used for recording the assets of the DB plan. Fair value is defined as the exchange price that would be received for an asset in its principal market in an orderly transaction between market participants on the measurement date. Assets of the plan are grouped into a three-level hierarchy for valuation techniques used to measure the fair values of the assets. These levels are:
| · | Level 1 – Quoted prices in active markets for identical assets. |
85
Frisch’s Restaurants, Inc. and Subsidiaries
NOTES TO CONSOLIDATED FINANCIAL STATEMENTS
Three years ended June 2, 2015
NOTE H - PENSION PLANS (continued)
| · | Level 2 – Observable inputs other than Level I prices, such as quoted prices for similar assets; quotes prices in markets that are not active; or other inputs that are observable or can be corroborated by observable market data by correlation or other means. |
| · | Level 3 – Unobservable inputs that are supported by little or no market activity and that are significant to the fair value of the assets. |
The assets of the defined benefit pension plan include investments in mutual funds whose fair values are determined based on quoted market prices and are classified within Level 1 of the fair value hierarchy. Plan assets also include investments that are based on other observable inputs, which are classified within Level 2 of the fair value hierarchy. The Level 2 assets for Fiscal Years 2015 and 2014 are money market funds, corporate and U.S. government bonds, and foreign obligations. The following table summarizes the plan assets measured at fair value as of May 31, 2015 and May 31, 2014:
| Fiscal Year | ||||||||||||||||
| 2015 | 2014 | |||||||||||||||
| (in thousands) | ||||||||||||||||
| Level 1 | Level 2 | Level 1 | Level 2 | |||||||||||||
| Money market funds | $ | $ | 194 | $ | — | $ | 412 | |||||||||
| U.S. Treasury and agency obligations | 1,940 | — | 1,840 | |||||||||||||
| Corporate obligations | 7,715 | — | 7,193 | |||||||||||||
| Mutual funds | 29,712 | 26,787 | — | |||||||||||||
| Foreign obligations and other | 1,446 | — | 1,602 | |||||||||||||
| Total | $ | 29,712 | $ | 11,295 | $ | 26,787 | $ | 11,047 | ||||||||
Other Post Retirement Plans
Compensation expense (not included in any of the above tables) relating to the Non Deferred Cash Balance Plan (NDCBP) (see Benefit Plans in NOTE A – ACCOUNTING POLICIES) is equal to amounts contributed to the trusts established for the benefit of certain highly compensated employees (HCE's) - $309 in Fiscal Year 2015, $367 in Fiscal Year 2014 and $351 in Fiscal Year 2013.
Additional NDCBP (benefit)/expense is accrued for additional required contributions that would be due when a participating HCE retires or is otherwise separated from service with the Company. The expense accrual is necessary whenever the present value of lost benefits under the DB plan and the SERP exceeds the value of the assets in the HCE’s trust accounts. Additional (benefit)/expense of ($269), $40 and $18 was accrued for this purpose in Fiscal Years 2015, 2014 and 2013, respectively. The estimated minimum required total account balance for all participants as of June 2, 2015 was $2,973, which includes $1,651 for the CEO. All participants' trust accounts exceeded the minimum requirement as of June 2, 2015.
Separate and apart from normal benefits under the NDCBP, the President and Chief Executive Officer (CEO) may receive additional annual contributions to his NDCBP trust (as part of his incentive compensation, which is earned when certain levels of annual pretax earnings are achieved). Provisions of $210, $139 and $137 respectively, were earned in Fiscal Years 2015, 2014 and 2013.
86
Frisch’s Restaurants, Inc. and Subsidiaries
NOTES TO CONSOLIDATED FINANCIAL STATEMENTS
Three years ended June 2, 2015
NOTE H - PENSION PLANS (continued)
The Company sponsors two 401(k) defined contribution plans (see Benefit Plans in NOTE A – ACCOUNTING POLICIES). In Fiscal Years 2015, 2014 and 2013, matching contributions to the 401(k) plans amounted to $343, $313 and $254, respectively.
The Company does not sponsor post-retirement health care benefits.
NOTE I - FRISCH'S EXECUTIVE SAVINGS PLAN
As described more fully under Benefit Plans in NOTE A – ACCOUNTING POLICIES, the Company sponsors a non-qualified savings plan - Frisch's Executive Savings Plan (FESP) for "highly compensated employees" (HCEs).
Although the Company owns the mutual funds of the FESP until the retirement of the participating HCEs, the funds are invested at the direction of the participants. FESP assets are the principal component of “Other long-term assets” in the Consolidated Balance Sheet. Shares of Frisch's common stock under FESP are a “phantom investment” that may be paid in actual shares or in cash upon retirement of the participant. Except for any portion expected to be paid out to HCEs who will be retiring during the next 12 months, the FESP liability to the participants is included in “Deferred compensation” as a long term obligation in the Consolidated Balance Sheet. The mutual funds and the corresponding liability to FESP participants were increased $188 (due to market gains) during Fiscal Year 2015. Market gains increased the mutual funds and corresponding FESP liability by $332 and $399 during Fiscal Years 2014 and 2013, respectively. All of these changes were effected through offsetting investment income or loss and charges (market gains) or credits (market losses) to deferred compensation expense within "Administrative and advertising" expense in the Consolidated Statement of Earnings.
Matching contributions to FESP were $38, $37 and $33, respectively in Fiscal Years 2015, 2014 and 2013.
Fair value measurements are used for recording the assets in FESP. Assets of the plan are grouped into a three-level hierarchy for valuation techniques used to measure the fair values of the assets. These levels are:
| · | Level 1 – Quoted prices in active markets for identical assets. |
| · | Level 2 – Observable inputs other than Level 1 prices, such as quoted prices for similar assets, quoted prices in markets that are not active; or other inputs that are observable or can be corroborated by observable market data by correlation or other means. |
| · | Level 3 – Unobservable inputs that are supported by little or no market activity and that are significant to the fair value of the assets. |
The fair values of all FESP assets are determined based on quoted market prices and are classified within Level 1 of the fair value hierarchy:
87
Frisch’s Restaurants, Inc. and Subsidiaries
NOTES TO CONSOLIDATED FINANCIAL STATEMENTS
Three years ended June 2, 2015
NOTE I - FRISCH'S EXECUTIVE SAVINGS PLAN (continued)
| Fiscal Year | ||||||||
| 2015 | 2014 | |||||||
| (in thousands) | ||||||||
| Level 1 | Level 1 | |||||||
| Money market funds | $ | 516 | $ | 449 | ||||
| Mutual funds | 1,685 | 1,542 | ||||||
| Foreign equity mutual funds | 301 | 311 | ||||||
| Taxable bond mutual funds | 819 | 740 | ||||||
| Large blend target date mutual funds | 627 | 523 | ||||||
| Total (1) | $ | 3,948 | $ | 3,565 | ||||
(1) The total for Fiscal Year 2015 consists of $3,566 classified as long term and $382 as current.
NOTE J - OTHER COMPREHENSIVE INCOME
The following table summarizes items reclassified out of accumulated other comprehensive income and the related tax effects for the components of net periodic pension cost:
| Fiscal Year | ||||||||
| 2015 | 2014 | |||||||
| (in thousands) | ||||||||
| Amortization of pretax amounts incl. in net periodic pension expense (1) | ||||||||
| Included in Cost of Sales | $ | 44 | $ | 794 | ||||
| Included in Administrative and Advertising Expense | 3 | 48 | ||||||
| Total reclassification (pretax) (1) | 47 | 842 | ||||||
| Tax Benefit | (15 | ) | (286 | ) | ||||
| Total reclassification (net of tax) | $ | 32 | $ | 556 | ||||
| (1) | These amounts are included in the computation of net periodic pension expense as a net of the two components (See NOTE H - PENSION PLANS )as shown below: |
| Fiscal Year | ||||||||
| 2015 | 2014 | |||||||
| (in thousands) | ||||||||
| Amortization of prior service (credit) cost | $ | (8 | ) | $ | (8 | ) | ||
| Recognized net actuarial loss | 55 | 850 | ||||||
| Total reclassification (pretax) | $ | 47 | $ | 842 | ||||
88
Frisch’s Restaurants, Inc. and Subsidiaries
NOTES TO CONSOLIDATED FINANCIAL STATEMENTS
Three years ended June 2, 2015
NOTE J - OTHER COMPREHENSIVE INCOME (continued)
The following table summarizes changes in accumulated other comprehensive loss (all of which is from Company sponsored pension plans), net of tax, for the fiscal year ended June 2, 2015:
| Fiscal Year | ||||||||
| Accumulated Other Comprehensive Loss | 2015 | |||||||
| (in thousands) | ||||||||
| Balance in Accumulated Other Comprehensive Loss on June 3, 2014 | $ | 174 | ||||||
| AOCI - Pretax Change in Underfunded Status | $ | (60 | ) | |||||
| AOCI - Tax Effected Change in Underfunded Status | 21 | |||||||
| AOCI - Change in Underfunded Status, net of tax | (39 | ) | ||||||
| Amount reclassified from AOCI (Pretax) | (47 | ) | ||||||
| Tax effect | 15 | |||||||
| Amount reclassified from AOCI, net of tax | (32 | ) | ||||||
| Other Comprehensive Income for Fiscal Year 2015 | (71 | ) | ||||||
| Balance in Accumulated Other Comprehensive Loss on June 2, 2015 | $ | 103 | ||||||
The following table summarizes changes in accumulated other comprehensive loss (all of which is from Company sponsored pension plans), net of tax, for the fiscal year ended June 3, 2014:
| Fiscal Year | ||||||||
| Accumulated Other Comprehensive Loss | 2014 | |||||||
| (in thousands) | ||||||||
| Balance in Accumulated Other Comprehensive Loss on May 28, 2013 | $ | 4,324 | ||||||
| AOCI - Pretax Change in Underfunded Status | $ | (5,680 | ) | |||||
| AOCI - Tax Effected Change in Underfunded Status | 2,085 | |||||||
| AOCI - Change in Underfunded Status, net of tax | (3,595 | ) | ||||||
| Amount reclassified from AOCI (Pretax) | (842 | ) | ||||||
| Tax effect | 287 | |||||||
| Amount reclassified from AOCI, net of tax | (555 | ) | ||||||
| Other Comprehensive Income for Fiscal Year 2014 | (4,150 | ) | ||||||
| Balance in Accumulated Other Comprehensive Loss on June 3, 2014 | $ | 174 | ||||||
89
Frisch’s Restaurants, Inc. and Subsidiaries
NOTES TO CONSOLIDATED FINANCIAL STATEMENTS
Three years ended June 2, 2015
NOTE K - RELATED PARTY TRANSACTIONS
The Chief Executive Officer (CEO) of the Company (Craig F. Maier), who also serves as a director of the Company, owns a Frisch's Big Boy restaurant (Frisch New Richmond Big Boy, Inc.) that is licensed to him by the Company. Another officer and director of the Company (Karen F. Maier) is a part owner of a Frisch's Big Boy restaurant (Frisch West Chester, Inc.) that is licensed to her and her siblings (excluding Craig F. Maier). Certain other family members of Craig F. Maier and Karen F. Maier also own a licensed Frisch's Big Boy restaurant (Frisch Hamilton West, Inc.).
All three of these restaurants are operated by the Company pursuant to the terms of certain Restaurant Management and Operations Agreements, under which they pay management fees to the Company. The management fees consist of a) pro-rata portions of the Company's costs of providing centralized shared services - accounting, payroll processing, and information technology including POS help desk services - which are allocated in the same way the Company allocates these costs to its own restaurants, and b) the Company's fully burdened cost of salaries and wages, payroll taxes and employee benefits of Company employees who staff the three restaurants. Total management fees paid to the Company by these three restaurant entities amounted to $2,912, $2,874 and $2,814 respectively, in Fiscal Years 2015, 2014 and 2013.
In addition, these three restaurant entities pay the Company franchise fees, contribute to the Company's general advertising fund and make purchases from the Company’s commissary. The total paid to the Company by these three restaurants amounted to $2,230, $2,184 and $2,149 respectively, in Fiscal Years 2015, 2014 and 2013. These transactions were effected on substantially similar terms as transactions with other licensees of the Company.
Management fees earned from centralized shared services are included in "Franchise fees and other revenue" in the Consolidated Statement of Earnings. The management fees relating to the reimbursement of employee staffing costs are offset primarily in "Payroll and related" costs in the Consolidated Statement of Earnings, while other smaller portions of staffing costs are offset in "Other Operating costs". Wholesale sales of food and other products from the Company's commissary are included in "Sales" in the Consolidated Statement of Earnings. Funds contributed to the Company's general advertising fund are offset in "Administrative and advertising" in the Consolidated Statement of Earnings (see Advertising in NOTE A – ACCOUNTING POLICIES).
The amount owed to the Company from these three restaurants for management fees, franchise fees, advertising contributions and for commissary purchases, amounted to $10 and $23 respectively, as of June 2, 2015 and June 3, 2014. Amounts due are generally settled within 28 days of billing. These accounts receivable are subject to the same terms as transactions with other licensees of the Company.
The Company is party with Frisch West Chester, Inc. (West Chester) to an Agreement to Purchase Stock which provides that when there is only one remaining shareholder of West Chester, the remaining shareholder may require the Company to purchase any or all of his or her shares of West Chester at any time, and the Company is required to purchase all such shares upon the death of the sole remaining shareholder. The purchase price for any such purchase by the Company would be the greater of either the book value of the shares or twice the average earnings per share over the prior three years, with a maximum purchase price of $100 less any outstanding debt owed by West Chester to the deceased shareholder. The remaining life expectancy of the youngest shareholder of West Chester is 30 to 40 years.
90
Frisch’s Restaurants, Inc. and Subsidiaries
NOTES TO CONSOLIDATED FINANCIAL STATEMENTS
Three years ended June 2, 2015
NOTE K - RELATED PARTY TRANSACTIONS (continued)
The Company is party with Frisch Hamilton West, Inc. (Hamilton West) to an Agreement to Purchase Stock which provides that when there is only one remaining shareholder of Hamilton West, the remaining shareholder may require the Company to purchase any or all of his or her shares of Hamilton West at any time, and the Company is required to purchase all such shares upon the death of the sole remaining shareholder. The purchase price for any such purchase by the Company would be the book value of the shares (determined by Hamilton West’s Certified Public Accountants) based on generally accepted accounting principles. The remaining life expectancy of the youngest shareholder of Hamilton West is 30 to 40 years.
The respective shareholders of the three restaurant entities discussed above have the equity that is at risk and the Company does not have the characteristics of having a controlling interest of that of a primary beneficiary. The Company does not believe that it has any residual risks from these relationships and has therefore concluded that consolidation of the three restaurant entities into the Company’s financial statements is not required under the guidance of Accounting Standards Codification ASC 810-10, “Variable Interest Entities”.
The Chairman of the Board of Directors from 1970 to 2005 (Jack C. Maier, deceased February 2005 - the father of Craig F. Maier and Karen F. Maier) had an employment agreement that contained a provision for deferred compensation. The agreement provided that upon its expiration or upon the Chairman’s retirement, disability, death
or other termination of employment, the Company would become obligated to pay the Chairman or his survivors for each of the next 10 years the amount of $214, adjusted annually to reflect 50 percent of the annual percentage change in the Consumer Price Index (CPI). Monthly payments of $18 to the Chairman’s widow (Blanche F. Maier - the mother of Craig F. Maier and Karen F. Maier), a director of the Company until her death in September 2009, commenced in March 2005. In accordance with the CPI provisions of the agreement, the monthly payment was increased for the final time on March 1, 2014, to just under $20 per month. Payments to the heirs of Jack C. Maier and Blanche F. Maier (including Craig F. Maier and Karen F. Maier) concluded on February 1, 2015. During Fiscal Year 2015, $157 was paid in final settlement of this liability.
NOTE L – COMMITMENTS AND CONTINGENCIES
Commitments
In the ordinary course of business, purchase commitments are entered into with certain of the Company’s suppliers. Most of these agreements are typically for periods of one year or less in duration; however, longer term agreements are also in place. Future minimum payments under these arrangements are $14,145, $6,701, $3,972, $3,645, $4,698, and $8,808 respectively, for Fiscal Years 2016, 2017, 2018, 2019, 2020 and later years. These agreements are intended to secure favorable pricing while ensuring availability of desirable products. Management does not believe such agreements expose the Company to any significant risk.
Litigation
General
Employees, customers and other parties bring various claims and suits against the Company from time to time in the ordinary course of business. Claims made by employees are subject to workers' compensation insurance or are covered generally by employment practices liability insurance. Claims made by customers are covered by general and product liability insurance. Exposure to loss contingencies from pending or threatened litigation is continually monitored by management, which believes presently that the resolution of claims outstanding as of June 2, 2015, whether covered by insurance or not, will not result in a material adverse effect upon the Company's earnings, cash flows or financial position. Management believes presently that adequate provisions for expected losses not covered by insurance are included in the Consolidated Financial Statements.
91
Frisch’s Restaurants, Inc. and Subsidiaries
NOTES TO CONSOLIDATED FINANCIAL STATEMENTS
Three years ended June 2, 2015
NOTE L – COMMITMENTS AND CONTINGENCIES (continued)
Employee Harassment Suit
On October 16, 2012, a former employee (plaintiff) filed a complaint asserting various claims including negligence and intentional infliction of emotional distress, stemming from the plaintiff's employment in 1995. With the exception of the negligence claim, all claims were dismissed by the Court as a result of the Motion to Dismiss, filed by the Company on November 13, 2012. In August 2013, the plaintiff's complaint was amended to include claims of sexual harassment and a hostile work environment. Following discovery, the Company moved for summary judgment on all remaining counts. The Court heard oral arguments and entertained supplemental briefings. On July 9, 2015, the Court granted the Company’s Motion for Summary Judgment in its entirety and all claims were dismissed. The plaintiff filed a Notice of Appeal on July 17, 2015. The Company continues to deny all allegations and will continue to defend the matter vigorously; however, the ultimate outcome of the lawsuit remains uncertain.
Defalcation Suit
As discussed in detail in NOTE M – IMMATERIAL REVISION below, during the Third Quarter Fiscal 2015, the Company identified that a former officer had embezzled approximately $3,900 over a multi-year period and on January 20, 2015, the Company disclosed in a Current Report on Form 8-K that it had filed a civil lawsuit against the former officer for defrauding the Company and embezzlement. Since identification of the theft during the Third Quarter Fiscal 2015, the Company incurred $1,871 in forensic, legal and professional fees investigating the theft. The Company does not expect that it will incur significant future legal, accounting and professional service expenses defining the extent of the theft and determining any recovery options that exist. The Company will recognize these expenses in future periods as services are received. During the Fourth Quarter Fiscal 2015, the Company recorded insurance proceeds of $505 under its crime insurance policy.
Other Contingencies
Subject to a two year cycle, the Company self-insures a significant portion of expected losses under its workers’ compensation program in the state of Ohio. Insurance coverage is purchased from an insurance company for individual claims that may exceed $400 (the retention was $300 in periods prior to June 4, 2014). (See Self Insurance in NOTE A – ACCOUNTING POLICIES.) Insurance coverage is maintained for various levels of casualty and general and product liability.
Outstanding letters of credit maintained by the Company totaled $100 as of June 2, 2015.
As of June 2, 2015, the Company operated 15 restaurants on non-owned properties. (See NOTE D - LEASED PROPERTY.) One of the leases provides for contingent rental payments based on a percentage of the leased restaurant’s sales in excess of a fixed amount.
92
Frisch’s Restaurants, Inc. and Subsidiaries
NOTES TO CONSOLIDATED FINANCIAL STATEMENTS
Three years ended June 2, 2015
NOTE L – COMMITMENTS AND CONTINGENCIES (continued)
The Company remains contingently liable under certain ground lease agreements relating to land on which seven of the Company's former Golden Corral restaurant operations are situated. The seven restaurant operations were sold to Golden Corral Corporation (GCC) in May 2012, at which time the seven operating leases were simultaneously assigned to GCC, with the Company contingently liable in the event of default by GCC. The amount remaining under contingent lease obligations totaled $5,692 as of June 2, 2015, for which the aggregate average annual lease payments approximate $680 in each of the next five years. The Company is also contingently liable for the performance of a certain ground lease that was assigned to a third party in 2000; the annual obligation of the lease approximates $48 through 2020.
Since management has no reason to believe that either of these third party assignees are likely to default, no provision has been made in the Consolidated Financial Statements for amounts that would be payable by the Company. In addition, the Company generally retains the right to re-assign the leases in the event of a third party’s default.
NOTE M — IMMATERIAL REVISION
As the Company disclosed in a Current Report on Form 8-K filing on January 20, 2015, subsequent to the close of the second quarter ended December 16, 2014, the Company discovered that a former employee had been unlawfully diverting Company funds into his personal accounts over a multi-year period. The completion of a forensic investigation in the Third Quarter Fiscal 2015 determined that the amount embezzled approximated $3,900.
A summary of the effects of the adjustments on the Company’s prior period financial statements was as follows. The pretax earnings adjustment applicable to Fiscal Year 2014 was a $60 reduction to administrative and advertising expense. The pretax earnings adjustment applicable to Fiscal Year 2013 resulted in a $350 increase to administrative and advertising expenses. The pretax impact to all periods prior to Fiscal Year 2013 was an aggregate increase of $1,406 in administrative and advertising expense. As a result, at June 3, 2014, cash was overstated by approximately $914 and accounts payable was understated by approximately $782. The remainder of the theft had already been expensed in the Company’s financial statements during the periods that funds were diverted.
Pursuant to the guidance of Staff Accounting Bulletin (SAB) No. 99, “Materiality”, the Company evaluated the materiality of these errors quantitatively and qualitatively and has concluded that the errors described above were not material to any of its annual or quarterly prior period financial statements or trends of financial results. The errors were immaterial to prior periods. However, because of the significance of the cumulative out-of-period corrections that would be needed, the prior period financial statements were instead revised, in accordance with SAB No. 108, “Considering the Effects of Prior Year Misstatements when Quantifying Misstatements in Current Year Financial Statements”.
The table below reconciles the effects of the adjustments to the previously reported Consolidated Balance Sheet at June 3, 2014 (including related tax effect):
93
Frisch’s Restaurants, Inc. and Subsidiaries
NOTES TO CONSOLIDATED FINANCIAL STATEMENTS
Three years ended June 2, 2015
NOTE M — IMMATERIAL REVISION (continued)
| June 3, 2014 | ||||||||||||
| Consolidated Balance Sheet | Previously Reported | Adjustment | As Adjusted | |||||||||
| Cash and equivalents | $ | 2,038 | $ | (914 | ) | $ | 1,124 | |||||
| Deferred income taxes and other tax receivables | 2,787 | 606 | 3,393 | |||||||||
| Accounts payable | 6,812 | 782 | 7,594 | |||||||||
| Retained earnings | 56,798 | (1,090 | ) | 55,708 | ||||||||
The following table reconciles the effects of the adjustments to the previously reported Consolidated Statement of Earnings for the fiscal years ended June 3, 2014 and May 28, 2013:
| June 3, 2014 | May 28, 2013 | |||||||||||||||||||||||
| Consolidated Statement of Earnings | Previously Reported | Adjustment | As Adjusted | Previously Reported | Adjustment | As Adjusted | ||||||||||||||||||
| Administrative and advertising | $ | 12,599 | $ | (60 | ) | $ | 12,539 | $ | 13,074 | $ | 350 | $ | 13,424 | |||||||||||
| Income taxes | 832 | 21 | 853 | 2,513 | (125 | ) | 2,388 | |||||||||||||||||
| Net earnings | 9,433 | 39 | 9,472 | 6,816 | (225 | ) | 6,591 | |||||||||||||||||
The following table reconciles the effects of the adjustments to the previously reported Consolidated Statement of Cash Flows for the fiscal years ended June 3, 2014 and May 28, 2013:
| June 3, 2014 | May 28, 2013 | |||||||||||||||||||||||
| Consolidated Statement of Cash Flows | Previously Reported | Adjustment | As Adjusted | Previously Reported | Adjustment | As Adjusted | ||||||||||||||||||
| Net earnings | $ | 9,433 | $ | 39 | $ | 9,472 | $ | 6,816 | $ | (225 | ) | $ | 6,591 | |||||||||||
| Deferred income taxes and other obligations | (620 | ) | 21 | (599 | ) | 861 | (125 | ) | 736 | |||||||||||||||
| Accounts payable | 933 | 346 | 1,279 | (414 | ) | 131 | (283 | ) | ||||||||||||||||
| Net increase (decrease) in cash and equivalents | (2,218 | ) | 406 | (1,811 | ) | (41,706 | ) | (219 | ) | (41,925 | ) | |||||||||||||
| Cash and equivalents at beginning of year | 4,256 | (1,321 | ) | 2,935 | 45,962 | (1,102 | ) | 44,860 | ||||||||||||||||
There was no impact to the Consolidated Statement of Comprehensive Income or the Consolidated Statement of Shareholders’ Equity for any of the respective periods other than the impact on Net Earnings. In addition, the immaterial revision did not affect the Company’s compliance with debt covenants.
94
Frisch’s Restaurants, Inc. and Subsidiaries
NOTES TO CONSOLIDATED FINANCIAL STATEMENTS
Three years ended June 2, 2015
NOTE N - QUARTERLY RESULTS (UNAUDITED)
| Fiscal Year | ||||||||||||||||||||
| 2015 | ||||||||||||||||||||
| 1st | 2nd | 3rd | 4th | |||||||||||||||||
| Fiscal Year Ended June 2, 2015 | Quarter | Quarter | Quarter | Quarter | Total | |||||||||||||||
| Sales | $ | 62,583 | $ | 52,016 | $ | 47,073 | $ | 50,221 | $ | 211,893 | ||||||||||
| Operating Income | 3,851 | 3,354 | 2,996 | 3,171 | 13,372 | |||||||||||||||
| Net earnings | 2,623 | 2,464 | 2,338 | 2,530 | 9,955 | |||||||||||||||
| Basic net earnings per share | 0.51 | 0.48 | 0.46 | 0.49 | 1.94 | |||||||||||||||
| Diluted net earnings per share | 0.51 | 0.48 | 0.45 | 0.50 | 1.94 | |||||||||||||||
| · | The first quarter contained 16 weeks, while the last three quarters each contained 12 weeks. |
| · | Net earnings in the third quarter included charges related to the forensic investigation and professional fees for investigating the theft of $1,730 and $1,871 for Fiscal Year 2015. During the fourth quarter, the Company recovered $505 of for these expenses under its crime insurance policy. The net expenditures are recorded as a component of Administrative expense. |
| · | Net earnings for Fiscal Year 2015 include charges related to legal and professional fees in support of the Agreement and Plan of Merger entered into on May 21, 2015 for $2,181. The net expenditures are recorded as a component of Administrative expense. |
| · | Net earnings include $2,999 gains from the sale of three parcels of real property during Fiscal Year 2015, the proceeds of which were $4,222. |
| Fiscal Year | ||||||||||||||||||||
| 2014 | ||||||||||||||||||||
| 1st | 2nd | 3rd | 4th | |||||||||||||||||
| Fiscal Year Ended June 3, 2014 | Quarter | Quarter | Quarter | Quarter | Total | |||||||||||||||
| Sales | $ | 61,236 | $ | 49,217 | $ | 45,161 | $ | 53,559 | $ | 209,173 | ||||||||||
| Operating Income | 2,984 | 3,320 | 1,090 | 3,517 | 10,911 | |||||||||||||||
| Net earnings | 1,936 | 2,350 | 1,634 | 3,552 | 9,472 | |||||||||||||||
| Basic net earnings per share | 0.38 | 0.46 | 0.32 | 0.70 | 1.86 | |||||||||||||||
| Diluted net earnings per share | 0.38 | 0.46 | 0.32 | 0.70 | 1.86 | |||||||||||||||
| · | The first quarter contained 16 weeks, the second and third quarter each contained 12 weeks while the fourth quarter contained 13 weeks. |
95
Frisch’s Restaurants, Inc. and Subsidiaries
NOTES TO CONSOLIDATED FINANCIAL STATEMENTS
Three years ended June 2, 2015
NOTE N - QUARTERLY RESULTS (UNAUDITED) (continued)
| · | The third quarter tax provision was recorded as a net tax benefit of $691. The fourth quarter tax provision was recorded as a tax benefit of $140. These tax benefits are primarily attributable to amended federal income tax returns associated with the Domestic Production Activities Deduction (DPAD). |
NOTE O - SUBSEQUENT EVENTS
The Company has reviewed and evaluated all other material subsequent events from the balance sheet date of June 2, 2015 through the financial statements date of filing, and determined that no other subsequent event disclosures are necessary in the notes to these Consolidated Financial Statements.
96
Item 9. Changes in and Disagreements with Accountants on Accounting and Financial Disclosure
None.
Item 9A. Controls and Procedures
(a) Effectiveness of Disclosure Controls and Procedures. The Company’s Chief Executive Officer (CEO) and Chief Financial Officer (CFO) reviewed and evaluated the effectiveness of the Company’s disclosure controls and procedures (as defined in Rules 13a-15(e) and 15d-15(e) under the Securities Exchange Act of 1934 (the Exchange Act)) as of June 2, 2015, the end of the period covered by this Annual Report on Form 10-K. Based on that evaluation, the CEO and CFO concluded that the Company’s disclosure controls and procedures were not effective as of such date to ensure that information that would be required to be disclosed in the Company’s Exchange Act reports is (i) recorded, processed, summarized and reported within the time periods specified in Securities and Exchange Commission rules and forms, and (ii) would be accumulated and communicated to the Company’s management, including the CEO and CFO, as appropriate to allow timely decisions regarding required disclosures.
(b) Management’s Annual Report on Internal Control over Financial Reporting. The Report of Management on Internal Control over Financial Reporting and the Report of the Independent Registered Public Accounting Firm thereon are set forth in Part II, Item 8 of this Annual Report on Form 10-K.
(c) Changes in Internal Control over Financial Reporting. As part of their review and evaluation of the Company's disclosure controls and procedures, the Company's CEO and the CFO concluded that there were no changes in the Company’s internal control over financial reporting (as defined in Exchange Act Rules 13a-15(f) or 15d-15(f)) during the fourth quarter ended June 2, 2015 that have materially affected, or are reasonably likely to materially affect, the Company’s internal control over financial reporting, except as otherwise described in this Item 9A.
(d) Remediation of the Material Weaknesses. As previously disclosed in Item 4 of the Quarterly Report on Form 10-Q for the fiscal quarter ended December 16, 2014, management concluded that there were material weaknesses in internal controls over financial reporting related to (i) enforcement of segregation of duties within the treasury department, (ii) failure to maintain effective fraudulent detective controls over the alteration of third party documents, and (iii) weaknesses in the execution of adequate compensating analytical procedures. Subsequently, during the third and fourth quarter of Fiscal Year 2015, management believes there was significant progress made in remediating this material weakness, including adherence to existing control procedures and the implementation of enhanced controls during the third quarter related to review and oversight of our treasury department. Based upon the actions taken and the testing and evaluation of the design and effectiveness of these internal controls, management has concluded the material weaknesses in internal control over financial reporting related to the above, no longer existed as of June 2, 2015.
In response to the material weaknesses set forth in Part II, Item 8 of this Annual Report on Form 10-K, which were identified during the Company’s most recent assessment of internal controls over financial reporting, management, with oversight from the Audit Committee of the Board of Directors, has taken the following actions:
| · | As it relates to management’s failure to adequately assess user controls over information provided by third parties, management completed the assessment without exception subsequent to the balance sheet date and based on testing and evaluation subsequent to year end of the design and effectiveness of control, management has concluded that this material weakness will be remediated once the control has operated for a sufficient period of time. |
97
| · | As it relates to effectively designed and operating controls over Company disbursements, management has (i) revoked unauthorized security access to the Vendor Master file, (ii) re-initiated reviews of change based reports over the Vendor Master file, (iii) documented processes and procedures, and (iv) educated users. Management believes the measures described above will remediate the material weakness identified. As management continues to evaluate its Internal Controls over Financial Reporting, it may be determined that additional measures are required. In addition, certain modifications or other adjustments to the remediation efforts described above may become necessary. As a result, the material weakness cannot be considered remediated until the applicable controls have operated for a sufficient period of time and management has concluded, through testing, that these controls are operating effectively. |
| · | As it relates to Information Technology General Controls intended to restrict access to data and applications, management has implemented the following changes subsequent to June 2, 2015, (i) restricted access to the file directories that hold the Point of Sale (POS) system data which is utilized by the application systems and the general ledger system to only authorized personnel, (ii) segregating duties further and monitoring when conflicting duties are performed, (iii) developing change management monitoring over the software that supports data analysis and the financial statement compilation and (iv) completed its annual security access review and approval. Management believes the measures described above will remediate the material weakness identified. As management continues to evaluate its Internal Controls over Financial Reporting, it may be determined that additional measures are required. In addition, certain modifications or other adjustments to the remediation efforts described above may become necessary. As a result, the material weakness cannot be considered remediated until the applicable controls have operated for a sufficient period of time and management has concluded, through testing, that these controls are operating effectively. |
None.
98
(Items 10 through 14)
Item 10. Directors, Executive Officers and Corporate Governance
The information required by this item regarding executive officers appears at the end of Item 1 of Part I of this Form 10-K under the caption “Executive Officers of the Registrant.”
Below is a list of the names and ages of the directors of the Company as of July 28, 2015, indicating their positions with the Company and their principal occupations during the past five years and prior thereto where applicable. In addition, the information set forth below with respect to each director includes the specific experience, qualifications, attributes and/or skills of the director which, in the opinion of the Board of Directors (the “Board”), qualifies him or her to serve as a director and are likely to enhance the Board’s ability to manage and direct the business and affairs of the Company.
Daniel W. Geeding, Director since 1992
Mr. Geeding, age 73, is currently the Chairman of the Board of the Company, Chair of the Board’s Compensation Committee, and a member of the Audit Committee. From 2001 through 2014, he was the Executive Vice President, Chief Financial Officer and Treasurer of Interact for Health (formerly known as The Health Foundation of Greater Cincinnati), which also included management of the financial, investment, IT, and human resources operations of Interact for Health and its subsidiaries. He was also the Vice President and Chief Financial Officer of InterAct for Change from 2002 until his recent retirement. He held various positions at Xavier University from 1969 to 2002, including Director of the Center for International Business (1997 to 2002), Dean, Acting Dean and Associate Dean of the College of Business Administration (1985 to 1997), Director of the Executive MBA Program (1982 to 1991), and Assistant, Associate and Professor of Management (1969 to 2002). He is currently a director of Cincinnati Eye Institute Foundation (since 2006); a director (since 2002), the Chairman of the Board, and member of the Audit Committee of the Corporation For Findlay Market; a member of the Audit Committee of the Greater Cincinnati Foundation (since 2009); a director of the Sulgrave Manor Preservation Foundation (since 2010); and a director and Chair of the Market Development Committee of Mercy Health (since 2012). Mr. Geeding is a Certified Public Accountant (since 1969) and holds a B.S. and M.B.A. in accounting and a Ph.D. in management. He is a member of The American Institute of Certified Public Accountants, the Foundation Financial Officers Group, and Financial Executives International. Based upon his significant financial and accounting training, experience, and expertise, the Board has determined that Mr. Geeding qualifies as an “audit committee financial expert” under the SEC rules, and that he provides financial and accounting expertise to the Board.
Jerome P. Montopoli, Director since 2005
Mr. Montopoli, age 72, is Chair of the Board’s Audit Committee and a member of the Compensation Committee. He retired as a Certified Public Accountant in September 2001, and has since been a private investor and consultant. He is a Trustee Emeriti (since 2007) and Member of the Audit and Finance Committees of The University of Cincinnati Foundation. He was a Trustee of the University of Cincinnati Foundation from 1996 to 2007. Mr. Montopoli was the Managing Partner, Partner Matters of Andersen Worldwide from October 1999 to August 2001. He was the Managing Partner, Michigan Offices of Arthur Andersen LLP from March 1992 to October 1999 and Managing Partner, Cincinnati Offices of Arthur Andersen LLP from March 1988 to March 1992. He was also Chair of the Audit Committee and a member of the Finance Committee of the Health Alliance of Greater Cincinnati from November 2004 to May 2010. Mr. Montopoli has over 35 years of experience as a Certified Public Accountant in public accounting; 25 of those years as a Partner at Arthur Andersen LLP. Based upon his extensive financial, accounting and audit training, experience, and expertise, the Board has determined that Mr. Montopoli qualifies as an “audit committee financial expert” under the SEC rules, and that he provides financial and accounting expertise to the Board.
99
Dale P. Brown, Director since 1999
Ms. Brown, age 68, is the Chair of the Board’s Nominating and Corporate Governance Committee and a member of the Audit Committee. She is now a self-employed Author and Marketing Consultant. She was President and Chief Executive Officer of Sive/Young & Rubicam, a prominent Cincinnati advertising firm, for eight years from July 1990 to December 1998 and is the Recipient of Two Silver Medals from the American Advertising Federation. She is also currently a Trustee Emeriti of the University of Richmond; and a director (since 1994) and member of the Audit and Nominating and Corporate Governance Committees of Ohio National Financial Services. Ms. Brown has substantial experience and expertise in marketing, advertising, and public relations that is complementary to the Company’s business.
Lorrence T. Kellar, Director since 1998
Mr. Kellar, age 78, is the Chair of the Board’s Finance Committee and a member of the Nominating and Corporate Governance Committee. Mr. Kellar was Vice President of Continental Properties Company, Inc., a retail and residential developer, from November 2002 until his retirement in November 2009. Prior to that, he was Vice President - Real Estate of Kmart Corporation from 1996 to September 2002. He held various positions in finance, capital management, audit, accounting, and real estate at The Kroger Co. from 1965 until April 1996, including Group Vice President – Finance and Real Estate. He also held positions in finance, accounting and tax at 3-M Co. from 1962 to 1965. He is currently a director and a member of the Audit, Governance and Compensation Committees of Spar Group, Inc. (retail merchandiser – NASDAQ); and a Trustee and member of the Audit and Compensation Committees of Acadia Realty Trust (NYSE). He was formerly the Chairman of the Board and a member of the Audit and Compensation Committees of Multi-Color Corporation (label printer – NASDAQ). He was also the Chairman and Trustee of Hamilton County Library Foundation; Chairman and member of the Urban Design Review Board – City of Cincinnati; Chairman and Trustee of the City of Cincinnati Retirement System; Chairman and Trustee of The Cincinnati Ballet; Chairman and Trustee of the Central Community Health Board; President of the Queen City Association; and has been integrally involved with various other civic and charitable organizations, including the Cincinnati Symphony Orchestra, Cincinnati Opera, Riverfront Advisory Council – City of Cincinnati, Charter Committee of Greater Cincinnati, Greater Cincinnati Educational Television Foundation, Public Media Connect, University of Cincinnati Foundation, and United Way Social Planning Council. Mr. Kellar holds an M.B.A. and has extensive accounting, audit, and finance experience that is ideally suited for the Company’s Board .
William J. Reik, Jr., Director since 1998
Mr. Reik, age 77, is a member of the Board’s Nominating and Corporate Governance and Finance Committees. He is the Managing Member of Reik & Co., LLC, an investment counseling firm, since November 2006. Prior to that, he was the Managing Director of William D. Witter, Inc., an investment counseling firm, from February 1991 until November 2006. He was previously Managing Director of Mitchell Hutchins Asset Management, Inc. until February 1991. Mr. Reik brings to the Board his valuable and extensive experience in the investment management industry.
Robert J. (RJ) Dourney, Director since 2005
Mr. Dourney, age 57, is a member of the Compensation Committee and the Finance Committee. Mr. Dourney is the Chief Executive Officer, President and a Director of COSI (American restaurant chain) (since March 2014). He is the owner of and was formerly the Chief Executive Officer of Hearthstone Associates LLC, an operator and franchisee of fast-casual restaurants and retail meal preparation businesses throughout New England (from May 2005 to March 2014). He is a Trustee of the Catholic Schools Foundation in Boston, Massachusetts. He was a director of Boloco (a regional restaurant chain from January 2014 through May 2015) and he was previously Vice President-Operations of Au Bon Pain, a company that owns or franchises over 250 cafés throughout the world (June 2001 to June 2005). Prior to that, he was Vice President-Operations of Applebee’s International (May 2000 to June 2001). Mr. Dourney brings to the Board over 33 years of experience in the restaurant industry, serving in both operations and strategic capacities.
100
Donald H. Walker, Director since November 2009
Mr. Walker, age 69, is retired. He was the Vice President and Chief Financial Officer (from 1996) and the Treasurer (from 1982) of the Company until his retirement in August 2011. He served in various other finance and accounting positions at the Company from 1977 to 1996. Prior to 1977, Mr. Walker worked as a Certified Public Accountant with the accounting firm Grant Thornton LLP. He holds a B.B.A. degree in accounting and an M.B.A. in quantitative analysis. During Mr. Walker’s 15-year tenure as Chief Financial Officer, he was principally responsible for all of the Company’s financing and banking resources and activities, the design of Company-wide cash management initiatives, regulatory compliance, and accounting, auditing, and transaction processing. Mr. Walker qualified as an independent board member in August 2014, and based on his accounting expertise and his extensive experience with finance, accounting, and regulatory compliance, the Board determined that Mr. Walker qualified as an “audit committee financial expert” under the SEC rules, and that he provides financial and accounting expertise to the Board.
Craig F. Maier, Director since 1984
Mr. Maier, age 65, has been the President and Chief Executive Officer of the Company since 1989. Mr. Maier joined the Company as a manager trainee in 1975 and worked his way up through the positions of area supervisor and Divisional Vice President before becoming Executive Vice President in October 1988. Mr. Maier holds an MBA from Columbia University and has since July 2008 served as a director and a member of the Audit, Compensation (currently serving as Chair), and Finance Committees of Cincinnati Bell, Inc. (NYSE). He is also a Director of the Cincinnati Zoo and Botanical Garden and the Dan Beard Council of the Boy Scouts of America; Board Emeritus of the Cincinnati Museum Center and Cincinnati Art Museum; and Honorary Trustee of the Cincinnati Ballet. With over 40 years of experience in all facets of the operations of the Company, and over 25 years of experience as the Chief Executive Officer of a large, publicly-traded corporation, Mr. Maier brings to the Board demonstrated management, operational, and leadership ability, all of which makes him a valuable asset to the Board.
Karen F. Maier, Director since 2005
Ms. Maier, age 63, has been the Vice President-Marketing of the Company since 1983. Ms. Maier joined the Company in 1974 as a manager trainee and worked her way up to Shift Manager and then Unit Manager. She transferred to the Advertising Department in 1975 and became the Director of Advertising and Marketing in 1978. She is also a director of the Free Store Food Bank (since 2001) and a Member of the Tourism Ohio Advisory Board. Ms. Maier is the sister of Craig F. Maier. For over 37 years, Ms. Maier has been directly responsible for the development and execution of the marketing and advertising programs of the Company, contributing substantially to the introduction and promotion of new products, marketing initiatives, and retail marketing of branded products. This marketing and advertising experience and intimate knowledge of the market for the Company’s products make Ms. Maier a valuable asset to the Board.
CODE OF CONDUCT AND CODE OF ETHICS
The Company has a Code of Conduct applicable to all directors, officers, and employees that describes requirements related to ethical conduct, conflicts of interest and compliance with laws. In addition, the Chief Executive Officer, senior financial officers, members of the Disclosure Controls and Risk Management Committee, and other persons serving in financial, accounting or public reporting roles are also subject to a Code of Ethics containing additional requirements with respect to ethical conduct, conflicts of interest and full, fair and accurate reporting. Both the Code of Conduct and Code of Ethics are available on the Company’s website at http://www.frischs.com and are available in print upon written request to the Company’s Secretary, Donald A. Bodner.
101
SECTION 16(a) BENEFICIAL OWNERSHIP REPORTING COMPLIANCE
Section 16(a) of the Exchange Act requires our directors, executive officers, and persons owning more than 10 percent of the outstanding shares of the Company’s Common Stock to file reports of their ownership and changes in ownership of the Company’s Common Stock with the SEC and the NYSE MKT and to furnish copies of such reports to the Company. Such reports are filed on Forms 3, 4 and 5 under the Exchange Act. The Company is required to set forth in this Annual Reportt the number of late reports, transactions not reported and any known failure to file a report. Based solely on our review of the reports furnished to us and certain written representations of each reporting person, to the Company's knowledge, the filing requirements were satisfied by the persons subject thereto during the most recent fiscal year.
102
Item 11. Executive Compensation
The Compensation Committee has furnished the following report for inclusion in this annual report.
COMPENSATION COMMITTEE REPORT
The Compensation Committee reviewed and discussed with management the Compensation Discussion and Analysis below. Based on the review and discussions, the Compensation Committee recommended to the Board that the Compensation Discussion and Analysis be included in this Annual Report.
COMPENSATION COMMITTEE
Daniel W. Geeding, Chair
Jerome P. Montopoli
Robert J. Dourney
COMPENSATION DISCUSSION AND ANALYSIS
Our compensation programs during fiscal year 2015 were intended to enhance the interests of our shareholders by attracting high quality executive talent, encouraging our executives to remain with Frisch’s Restaurants, Inc. (the “Company”), rewarding our executive officers for financial and individual performance, and aligning the interests of our executives with those of our shareholders. The Company strives to ensure that the overall compensation paid to the named executive officers is appropriate, competitive with the comparable labor markets, and in line with our overall compensation objective to attract, motivate and retain the executive talent required to achieve our corporate objectives and increase shareholder value.
Throughout this Item 11, the individuals included in the “Summary Compensation Table” below, including the Company’s Chief Executive Officer (the “CEO”) and Chief Financial Officer (the “CFO”), are referred to as the “Named Executive Officers.”
Compensation Objectives and Strategy
Our compensation programs were designed with the following objectives in mind:
| · | Attract and Retain High Quality Executive Talent. Our compensation programs are intended to attract and retain high quality executive talent in our industry. In order to attract and retain executive talent with proven skills and experience, we believe our compensation programs must be competitive and compare favorably with those offered by companies with which we compete for a limited pool of executive talent. |
| · | Pay for Performance. Our compensation programs are intended to motivate our Named Executive Officers to achieve a superior level of performance. The amount of compensation for each Named Executive Officer is intended to reflect the executive’s experience and portions of our compensation program are expressly tied to the performance of the Company including our incentive compensation and variable compensation plans. We seek to balance incentives for both short-term and long-term performance. |
| · | Shareholder Alignment. We seek to align the interests of our Named Executive Officers with our stockholders by using incentives that link executive compensation to the Company’s short-term and long-term performance. |
Our executive compensation program is designed to reward executives for overall Company performance. We generally reward executives for short-term and long-term financial and operating performance as well as leadership excellence.
103
Determining Compensation
The Compensation Committee (“Committee”) monitors the administration of the Company’s compensation and benefit programs for the Company’s directors, executives and other employees. The Committee focuses on the attraction and retention of key executives and makes the final determination of base salary and annual incentive compensation for the CEO, taking into account the recommendations of the CEO, for each of the Company’s other Named Executive Officers. When making compensation decisions, the Committee considers the Company’s overall compensation philosophy, objectives and policies, performance results of the Company, relevant peer data, recommendations by management, and the advice and recommendations of Towers Watson & Co. (“Towers Watson”) and RSC Advisory Group (“RSC"). The Committee has assessed the independence of these compensation consultants for conflicts of interest, in light of the enumerated independence factors contained in Section 10(C)(b) of the Securities Exchange Act of 1934, as well as amended Item 407(e)(3) of Regulation S-K and New York Stock Exchange Rule 805(c)(4).
The Compensation Committee has considered the following:
| · | Provision of other services to the Company by the person that employs the consultant. |
| · | Amount of fees paid by the Company to the person that employs the consultant, as a percentage of that person's total revenue. |
| · | Policies and procedures of the person that employs the consultant regarding prevention of conflicts of interest. |
| · | Any business or personal relationship between the consultant and any member of the Committee. |
| · | Ownership by the consultant of the Company's stock. |
| · | Any business or personal relationship between the consultant, or any person that employs the consultant, and any Named Executive Officer of the Company. |
RSC is engaged and supervised by the Committee. RSC provided guidance, analysis, and advisory services with respect to the non-employee Board of Directors’ compensation during the past fiscal year. RSC provides no other services to the Company. None of RSC’s employees involved in compensation consulting services has any personal or business relationship with the Company, and none of these employees owns Company stock.
Towers Watson is engaged and supervised by the Company to review the compensation of select Company positions biennially with the last review conducted in early 2015. Towers Watson does not provide other services to the Company. None of Towers Watson’s employees involved in compensation consulting services has any personal or business relationship with the Company, and none of these employees owns Company stock. Further, Towers Watson employs specific policies and procedures designed to protect against conflicts of interest, which were provided to the Company during the compensation consultant review process.
The Committee also considers the results of any votes of shareholders with respect to compensation matters. At our 2014 Annual Shareholders Meeting, our shareholders approved a non-binding advisory “say-on-pay” proposal with over 76.0 percent of the votes cast approving the compensation of the Named Executive Officers. The Committee reviewed the results of the shareholder votes and took the high percentage in favor as an indication that there is strong support among our shareholders for our executive compensation philosophy and our pay-for-performance approach.
104
Among other actions, the Committee takes the following steps to ensure that it effectively carries out its responsibilities:
| · | Retains an external consultant with expertise in executive compensation, to provide the Committee with relevant market data and analysis and compensation recommendations. |
| · | Conducts an annual review of the Company’s Compensation Philosophy and Strategy policy to ensure it remains appropriate given the Company’s performance and strategic objectives. |
| · | Uses a tally sheet, prepared by the Company, containing all relevant compensation information to conduct an annual review of all compensation for each Named Executive Officer. Information reported on the tally sheet includes: |
| o | All cash compensation, including base salary and incentive compensation |
| o | Equity compensation |
| o | Annual contributions to retirement plans, as well as total balances |
| o | Any increases in pension benefits |
| o | Perquisites including auto allowance, medical reimbursement plan, supplemental long-term disability, and reimbursement of relocation expenses |
| · | Conducts an annual review and assessment of potential risks arising from our compensation programs (including the executive compensation programs) and policies and reports its assessment to the full Board of Directors. |
| · | Conducts an annual review of the Compensation Committee Charter to ensure that it effectively reflects the Committee’s responsibilities. |
| · | Conducts an annual self-evaluation of the effectiveness of the Committee and each Committee member and makes any changes that are appropriate based upon the self-evaluation. |
During the Fiscal Year ended June 2, 2015, the Committee also reviewed and oversaw various compensation and benefits issues, including but not limited to the following:
| · | Reviewed the tally sheet information and determined that the compensation was reasonable and appropriate for each of the Named Executive Officers for the last fiscal year. The Committee was satisfied that the payments were appropriate with the level of responsibility and performance and were aligned with the Company’s Compensation Philosophy and Strategy policy. |
| · | Reviewed and approved the merit increases, incentive compensation payments, and stock awards to the Named Executive Officers and other key employees of the Company. |
| · | Reviewed and approved restricted Stock awards for non-employee directors. |
| · | Reviewed and approved the CEO evaluation form and conducted the annual CEO evaluation. |
| · | Reviewed and approved the amended and restated Frisch’s Restaurants, Inc. Pension Plan to comply with the cyclical remedial amendment program since the volume submitted practitioner no longer sponsors a volume submitter defined benefit pension plan. |
105
Management’s Role. Management, including the CEO, CFO, and Vice President of Human Resources, makes recommendations to the Committee for salary adjustments and incentive compensation for the executive officers based upon the performance of the Company during the prior fiscal year and any changes in the officers’ responsibilities during the year. Management may also recommend material changes to compensation or to the mix of components of compensation during a fiscal year in connection with new hires or promotions of Named Executive Officers. The members of the Committee, in addition to the recommendations of management, also consider their own experience with the Named Executive Officers, including interactions of such officers with the Board, business results and business unit results, and the reports and presentations by such officers provided to the Board on a regular and as-requested basis. No executive officer has any role in approving his or her own compensation.
Elements of Executive Compensation
To be consistent with our objectives to attract and retain quality talent, pay for performance and align the interests of our executives with our shareholders, our executive compensation program consists of the following elements of compensation:
| · | Base Salary |
| · | Incentive Compensation and Variable Compensation Plans |
| · | Equity Awards* |
| · | Retirement Benefits, Health and Welfare Benefits and Perquisites |
*For fiscal year ending 2015, due to the pending sale of the Company, eligible executives will receive the cash equivalent of the equity awards.
Generally, the types of compensation and benefits provided to the Named Executive Officers are similar to those provided to other executive officers of the Company.
Use of Market Data and Peer Groups
When making compensation decisions, the Committee compares the compensation of our executives to the compensation of similarly positioned executives at other companies in the restaurant industry to gain an understanding of the market compensation practices for these positions. We generally target for base pay to be at the 50th percentile and the total cash compensation to be targeted between the 50th and the 75th percentiles. To assist the Committee in evaluating and determining competitive levels of compensation for the various elements of pay, Towers Watson., one of our compensation consultants, provides the Committee with a biennial report comparing each element of each executive’s compensation to that of their peers in the restaurant industry using regional/national data for restaurant chains with comparable revenue and total restaurant units. General industry data is used when position-specific pay data is not available in the restaurant industry. The source of the data is a comprehensive annual compensation survey provided by the Chain Restaurant Total Rewards Association (CRTRA), which had 94 restaurant organizations reporting compensation data in 2014. Included in this study were peers such as Buffalo Wild Wings, Inc., CEC Entertainment, Inc., Cracker Barrel Old Country Store, Inc., Denny’s, Inc., DineEquity, Inc., Eat’n Park Restaurants, Einstein Noah Restaurant Group, Inc., Famous Dave’s of America, Inc., Friendly Ice Cream Corporation, Furr’s Family Dining, Garden Fresh, Golden Corral Corporation, and Perkins & Marie Callender’s LLC.
106
In addition, the Committee, with the assistance of management and its independent compensation consultant RSC, benchmarks the compensation of the Company’s Board of Director’s against a peer group of 10 chain restaurant companies and 13 regional general industry companies, which the Committee believes are of similar aggregate size. The chain restaurant peer group consisted of the following companies: Ark Restaurants Corp., Chuy’s Holdings, Cosi Inc., Denny’s Corporation, Einstein Noah Restaurant Group, Famous Dave’s of America, Inc., Jamba, Luby’s Inc., and Popeye’s Louisiana Kitchen Inc. The 13 regional general Industry companies included Almost Family, Inc., CECO Environmental Corporation, Core Molding Technologies, Inc., Delta Natural Gas Company, Dixie Group Inc., Gorman-Rupp Company, Healthstream, Inc., Hurco Companies, Inc., LSI Industries, Inc., Miller Industries, RG Barry Corporation, Rocky Brands, Inc., and Skyline Corporation.
Base Salary
Chief Executive Officer (CEO). The Company signed a three-year employment agreement with the CEO for the period beginning May 30, 2012, and ending on June 2, 2015. An employment agreement extension effective June 3, 2015 maintains the annual base salary of the CEO at $381,183 until the Transaction to Sell the Company closes.
Executives. To determine the base salaries of the Company’s other executives, the Company established a series of salary ranges that correspond to levels of executive responsibility. The basis for the salary ranges is the comparative data provided by an independent compensation consultant. The Company updates the salary ranges annually, based on current market data. Individual salaries are set within the applicable salary range for the position and evaluated annually. The CEO recommends merit increases, subject to the Committee’s approval, based on job performance as measured against one or more individual performance goals established annually for each executive and based upon the overall performance of the Company.
Incentive Compensation
Chief Executive Officer Bonus and Incentive Plans
Pursuant to the terms of the CEO’s employment agreement that went into effect on May 30, 2012, the Committee granted a one year Performance Award to the CEO on May 30, 2012, as permitted, under Section X of the Company’s 2003 Stock Option and Incentive Plan (the “2003 Plan”). The Performance Award governed the CEO’s incentive compensation for the fiscal year that ended on May 28, 2013. The Performance Award granted on May 30, 2012 (the 2003 Plan Performance Award) stipulated that incentive compensation would be earned by the CEO if the Company’s pre-tax earnings equaled or exceeded 4 percent of the Company’s total revenue as reported in the Company’s annual report to shareholders.
Pursuant to the terms of the CEO’s current Employment Agreement Extension effective June 3, 2015, the Committee granted an opportunity to earn a Bonus consisting of Base Incentive Compensation and Incremental Incentive Compensation. The Bonus would be earned by the CEO if the Company’s pre-tax earnings equaled or exceeded 4 percent of the Company’s total revenue for the Measurement Period. The Bonus will be paid in cash.
The Company discontinued the issuance of any new awards under the 2003 Plan effective October 3, 2012, when the 2003 Plan was replaced with the 2012 Stock Option and Incentive Plan (the “2012 Plan”) which was approved by shareholders in October 2012. The CEO’s employment agreement was amended on June 12, 2013 to allow the Committee to grant Performance Awards to the CEO under the 2012 Plan. On June 12, 2013, Committee granted a two-year Performance Award to the CEO that was effective May 29, 2013 to govern the CEO’s incentive compensation for the last two years of the employment contract (the year that ended June 2, 2015 ). Pursuant to the Performance Award granted on June 12, 2013 (the 2012 Plan Performance Award), the CEO is eligible to receive incentive compensation during each of the last two years of the employment contract, if the Company’s pre-tax earnings for those years equal or exceed 4 percent of the Company’s total revenue as reported in the Company’s annual report to shareholders.
107
“Pre-tax earnings” is defined as the amount reported in the annual report, but computed without reduction for: the CEO’s incentive compensation, the value of stock options and awards granted that are recognized as stock based compensation and deducted as an expense in calculating pre-tax earnings, and performance based bonuses paid under the Company’s Senior Executive Bonus Plan. The incentive compensation is equal to (a) 1.5 percent of the Company’s pre-tax earnings if in such fiscal year pre-tax earnings equal or exceed 4 percent (but are less than 5 percent) of the Company’s total revenue, and (b) an additional 1 percent of the Company’s pre-tax earnings is added (a total of 2.5 percent of the Company’s pre-tax earnings) if in such fiscal year the Company’s pre-tax earnings equal or exceed 5 percent of the Company’s total revenue. However, the incentive compensation is reduced, if necessary, to the extent that the accrual of the incentive compensation would reduce pre-tax earnings in a fiscal year to below 4 percent of the Company’s total revenue.
Also, the 2003 and 2012 Plan Performance Awards granted to the CEO require the Company to make a contribution to the trust established for the benefit of the CEO under the Frisch’s Restaurants, Inc. Nondeferred Cash Balance Plan (see Benefits section below) for any fiscal year in which the Company’s pre-tax earnings equal or exceed 4 percent of its total revenue, based upon the below schedule. The Employment Agreement Extension eliminated this requirement for fiscal year 2016, instead the amount will be paid in cash directly to the CEO.
Pre-Tax Earnings as a Percentage of Total Revenue | Contributions to the Plan as a Percentage of Salary | |
| At least 4% but less than 5% | 18% | |
| At least 5% but less than 6% | 37% | |
| At least 6% | 55% |
In addition, on the day of the annual shareholders meeting in each contract year, the CEO’s employment agreement requires the Company to grant to the CEO restricted Common Stock in the same amount and subject to the same conditions as the restricted Common Stock granted to the non-employee directors on that day.
Senior Executive Bonus Plan
The objectives of the Senior Executive Bonus Plan (the “Bonus Plan”), which has been in place since 2003, are to motivate team and individual behavior that contributes to the short-term and long-term objectives of the Company. Under the Bonus Plan, the non-operations senior executives are eligible to earn annual incentive bonuses of up to 40 percent of their annual base salary. Each executive’s incentive bonus is determined by a formula that takes into account the Company’s pre-tax consolidated earnings for the fiscal year, as a percentage of total revenue (adjusted to exclude certain revenue, if any, not related to the Company’s food service operations). No incentive bonuses are paid unless pre-tax consolidated earnings of the Company are at least 4 percent of total revenue, however the Bonus Plan does allow the CEO to amend, interpret, or revise the plan.
In order to receive the maximum incentive bonus permissible under the Bonus Plan pre-tax consolidated earnings of the Company must equal or exceed 7 percent of total revenue (see chart below).
Pre-Tax Earnings as a Percentage of Total Revenue | Contributions to the Plan as a Percentage of Salary | |
| 4 - 4.9% | 10% | |
| 5 - 5.9% | 20% | |
| 6 - 6.9% | 30% | |
| 7% or over | 40% |
108
Of the total incentive bonuses earned by each executive, 10 percent was paid in shares of the Company’s Common Stock (rounded down to the nearest whole share) and the remainder was paid in cash. For fiscal year ending 2015 incentive bonuses will be paid 100% in cash.
Equity Awards
Executives - 2012 Stock Option and Incentive Plan
Pursuant to the 2012 Stock Option and Incentive Plan (“2012 Plan”), which was approved by shareholders, awards for shares of the Common Stock of the Company may be granted to officers and certain key management personnel as determined by the Committee for achievement of meeting certain pre-tax earnings goals or expectations.
The 2012 Plan will remain in effect until all shares subject to the Plan have been awarded or issued according to the 2012 Plan’s provisions unless terminated earlier by the Board. Awards under this plan, subject to the approval of the Committee, are generally granted for each fiscal year, if merited, at the first Committee meeting held after the fiscal year ends, when the operating results for the prior fiscal year are known. No awards will be granted unless pre-tax earnings equal or exceed 4 percent of the Company’s total revenue. At the discretion of the Committee, stock awards also may be granted to newly hired executives as incentive compensation. Awards for fiscal years 2015 and 2016 will be paid 100% in cash.
Benefits
The benefit programs, including health and welfare benefits and retirement benefits, are designed to attract and retain the best employees. The Company reviews its benefits annually to ensure that they are competitive with those offered by other restaurant chains. The source of the comparison data is a comprehensive annual benefit survey provided by the Chain Restaurant Total Rewards Association (CRTRA), which had 67 restaurant organizations reporting benefits data in 2014. Data reported in the CRTRA report is used to benchmark benefits against other restaurant chains.
Employee Stock Purchase Plan
All employees who meet the waiting period, including eligible Named Executive Officers, have the opportunity to purchase the Company’s Common Stock at a discount through payroll deductions through the Employee Stock Purchase Plan, which is a qualified, non-discriminatory Internal Revenue Code (IRC) Section 423 discount stock purchase plan. The Employee Stock Purchase Plan was suspended effective May 1, 2015.
Defined Benefit Pension Plan (Qualified Plan), Supplemental Executive Retirement Plan (Non-Qualified Plan) and Nondeferred Cash Balance Plan (Non-Qualified Plan)
The Company maintains a qualified pension plan which provides benefits at retirement of employees covered by the plan. Highly compensated employees (HCEs), as defined by U.S. Treasury Regulations, were covered previously by the qualified pension plan and accrued benefits through December 31, 1999. Commencing January 1, 2000, any employee designated as an HCE for a given year under the IRS definition receives a comparable pension benefit for that year through the Non deferred Cash Balance Plan (NCBP) instead of accruing additional benefits under the qualified pension plan. The comparable NCBP benefit amount is determined annually and converted to a lump sum. Taxes are withheld from the lump sum, and the net amount is deposited into the HCE’s individual trust and reported as W-2 compensation. When an HCE participant in the NCBP retires or terminates, the tax-adjusted actuarial present value of all lost benefits is determined and if it exceeds the tax-adjusted value of the assets held in trust, the Company makes a contribution to the participant’s trust for the shortfall. All participants’ trust accounts exceeded the minimum requirement as of June 2, 2015.
109
All employees hired prior to July 1, 2009 and not designated as an HCE earn a benefit in the qualified plan. Both the qualified pension plan and the NCBP plan were closed to all employees hired after June 30, 2009. All participating employees hired July 1, 2009, or after are eligible for an enhanced company paid match on their contributions to the qualified Frisch’s Employee 401(k) Savings Plan (a defined contribution plan) or, if an HCE, the match is made on the non-qualified Frisch’s Executive Savings Plan (see below).
For 1999 and earlier, HCEs accrued benefits under an unfunded, non-qualified Supplemental Executive Retirement Plan (SERP) which provides a supplemental retirement benefit to HCEs equal to the reduction in their benefits under the qualified pension plan that results when compensation exceeds the Internal Revenue Code limitation, or when elective salary deferrals are made to the non-qualified Frisch’s Executive Savings Plan (see below). Effective January 1, 2000 the plan was amended and all participants’ benefits were frozen.
Under the qualified pension plan, an individual’s monthly benefit equals 51 percent of his or her average monthly compensation minus 50 percent of monthly Social Security benefits. The benefit of an individual who has less than 28 years of service with the Company is reduced by 1/28 for each year less than 28. The benefit can be taken as early as age 55, but the benefit amount will be reduced if taken before age 65. Average monthly compensation is based upon the participant’s five highest consecutive compensation periods. Compensation that is taken into consideration for periods after 1991 includes all compensation reported on the participant’s W-2 and all elective contributions to an IRC Section 125 or 401(k) plan, except that after July 15, 2002, the following items are specifically excluded: medical expense reimbursements, automobile expense allowances, use of a Company-owned automobile or any other Company-owned property, moving expense allowances and all other allowances, contributions to or benefits under the Company’s NCBP, amounts realized from the grant and/or exercise of stock options, other fringe benefits (cash and non-cash), and deferred compensation.
Amounts set aside under the qualified pension plan are computed on an actuarial basis using an aggregate funding method. Cash contributions totaling $2,000,000 were made by the Company to the qualified pension plan during the fiscal year ended June 2, 2015.
Defined Contribution Plan (Non-Qualified Plan) – Frisch’s Executive Savings Plan (FESP)
The Frisch’s Executive Savings Plan (FESP) provides a means for HCEs who have been disqualified from participating in the Frisch’s Employee 401(k) Savings Plan, to participate in a similarly designed non-qualified plan. Under the FESP, an eligible employee may defer up to 25 percent of his or her salary, which may be invested in mutual funds or a phantom investment in Common Stock of the Company. On the first 10 percent of salary deferred, the Company makes a 15 percent matching contribution on the phantom investment in Common Stock and a 10 percent matching contribution on investments in mutual funds. All eligible FESP participants hired July 1, 2009 or after receive an enhanced match of 100 percent of the first 3 percent of their contributions to either the investment in mutual funds or the phantom investment in the Company’s Common Stock (in lieu of qualified pension benefits). Upon an employee’s retirement, the Company has the option to issue to the employee the actual shares of Common Stock allocated to that employee’s FESP account on a phantom basis or to pay to the employee the fair market value of the Common Stock in cash. A reserve of 58,492 shares of Common Stock (as adjusted for subsequent changes in capitalization from the original authorization of 50,000 shares) was established for issuance under the FESP when it was established in November 1993. Since its inception, participants have cumulatively redeemed 30,420 shares through June 2, 2015. The current reserve balance of 28,072 shares contains 13,934 shares (including 1,856 shares allocated during the fiscal year ended June 2, 2015) that have been allocated but not issued to active plan participants. A summary of the FESP Plan benefits accrued for the Named Executive Officers during the last fiscal year is as follows:
110
| Name | Executive Contributions in Last Fiscal Year ($) | Company Contributions in Last Fiscal Year ($) | Aggregate Earnings in Last Fiscal Year ($) | Aggregate Withdraws / Distributions ($) | Aggregate Balance at Fiscal Year End ($) | |||||||||||||||
| Craig F. Maier Chief Executive Officer | - | - | - | - | - | |||||||||||||||
| Mark R. Lanning Chief Financial Officer | 8,655 | 8,655 | 3,685 | - | 72,813 | |||||||||||||||
| Michael E. Conner VP - Human Resources | 36,024 | 2,169 | 19,966 | - | 535,623 | |||||||||||||||
| Karen F. Maier VP - Marketing | 15,961 | 1,596 | 19,776 | - | 317,026 | |||||||||||||||
| Michael R. Everett VP - Information Systems | 54,464 | 2,179 | 43 | - | 456,008 | |||||||||||||||
Health and Welfare Benefits
The Company offers medical, dental, life and disability insurance to its eligible employees. The benefits are designed to attract, retain, and provide security to employees for their health and welfare needs. All full-time employees are eligible for medical and disability coverage after meeting applicable waiting periods. Executive officers are eligible for the same major medical plans that are offered to full-time employees. In addition, executive officers are provided a supplemental medical reimbursement plan that reimburses out-of-pocket medical, dental, and vision expenses. This taxable benefit is grossed up and reported as income on the employee’s W-2 form. A maximum of 10 percent of the employee’s annual base and incentive compensation, including tax gross up, will be reimbursed each year.
The Company provides a long-term disability plan (LTD) to eligible employees. The plan provides replacement income of 60 percent of base and incentive pay, up to $5,000 per month. The Company provides a supplemental long-term disability plan to employees whose income exceeds the level covered by the standard long-term disability plan. In addition, the CEO’s employment contract provides that in the event he becomes disabled as defined by the Company’s standard long-term disability plan, he will receive disability pay equal to 60 percent of his average compensation. “Average compensation” is defined as the total compensation, including amounts earned under any Performance Award granted to the CEO under the 2012 Stock Option and Incentive Plan, (as well as “Incentive Compensation” provided under the terms of the CEO’s previous employment agreement) earned by the CEO in the three fiscal years preceding the year in which he becomes disabled, divided by three.
Vacation Benefits
The Company offers vacation benefits to employees after meeting applicable waiting periods. These benefits are offered to all employees with variances based on an employee’s classification and years of service.
111
Summary Compensation Table
The following table summarizes the compensation awarded, paid to, or earned by the Company’s Named Executive Officers during the Company’s last three fiscal years.
| Name and Principal Position | Year | Salary ($) | Stock Awards ($) | Option Awards ($) | Non-Equity | Change in | All Other | Total ($) | ||||||||||||||||||||||||
| Craig F. Maier | 2015 | 381,183 | - | - | 378,852 | 54,779 | 289,532 | 1,104,346 | ||||||||||||||||||||||||
| Chief Executive | 2014 | 382,772 | 30,434 | - | 258,682 | 63,817 | 295,189 | 1,030,894 | ||||||||||||||||||||||||
| Officer | 2013 | 370,000 | 22,722 | - | 244,523 | 48,380 | 265,181 | 950,806 | ||||||||||||||||||||||||
| Mark R. Lanning | 2015 | 242,212 | - | - | 437,240 | (4) | - | 9,051 | 688,503 | |||||||||||||||||||||||
| Chief Financial | 2014 | 235,129 | 4,618 | - | 41,687 | - | 7,120 | 288,554 | ||||||||||||||||||||||||
| Officer | 2013 | 219,692 | 4,131 | - | 37,213 | - | 11,896 | 272,932 | ||||||||||||||||||||||||
| Michael E. Conner | 2015 | 181,053 | - | - | 72,476 | 3,778 | 66,382 | 323,689 | ||||||||||||||||||||||||
| VP - Human | 2014 | 182,576 | 3,572 | - | 32,308 | 2,468 | 63,682 | 284,606 | ||||||||||||||||||||||||
| Resources | 2013 | 175,485 | 3,145 | - | 28,373 | 2,287 | 56,819 | 266,109 | ||||||||||||||||||||||||
| Karen F. Maier | 2015 | 177,505 | - | - | 71,331 | 7,221 | 61,161 | 317,218 | ||||||||||||||||||||||||
| VP - Marketing | 2014 | 179,690 | 3,526 | - | 31,786 | 14,817 | 52,713 | 282,532 | ||||||||||||||||||||||||
| 2013 | 172,711 | 1,785 | - | 16,174 | 10,830 | 51,701 | 253,201 | |||||||||||||||||||||||||
| Michael R. Everett | 2015 | 181,823 | - | - | 72,785 | 2,824 | 52,958 | 310,390 | ||||||||||||||||||||||||
| VP - Information | 2014 | 183,353 | 3,595 | - | 32,438 | 2,171 | 54,241 | 275,798 | ||||||||||||||||||||||||
| Systems | 2013 | 176,231 | 3,519 | - | 31,806 | 1,746 | 38,669 | 251,971 | ||||||||||||||||||||||||
| (1) | The amounts in this column represent the cash portion of the incentive compensation paid under the CEO’s employment contract, the CEO’s Performance Awards and the Senior Executive Bonus Plan. The Senior Executive Bonus Plan allows the CEO to amend, interpret or revise the plan. |
| (2) | For fiscal year 2015 the bonuses were paid 100% in cash due to the pending sale of the Company. |
| (3) | Change in pension value includes the Qualified Pension Plan and the Supplemental Executive Retirement Plan. |
| (4) | Includes a board authorized special bonus to Mr. Lanning in the amount of $340,000. |
| (5) | All Other Compensation is as follows: |
112
| Name | Year | Severance ($) | Auto Allowance ($) | Supplemental Long-Term Disability ($) | Moving Expenses ($) | Medical Reimbursement Plan ($) | Contributions to Nondeferred Cash Balance Plan ($) | Total ($) | ||||||||||||||||||||||||
| Craig F. Maier | 2015 | - | 7,840 | 13,805 | - | 33,100 | 234,787 | 289,532 | ||||||||||||||||||||||||
| 2014 | - | 7,990 | 13,805 | - | 45,784 | 227,610 | 295,189 | |||||||||||||||||||||||||
| 2013 | - | 7,842 | 13,805 | - | 27,500 | 216,034 | 265,181 | |||||||||||||||||||||||||
| Mark R. Lanning | 2015 | - | - | 3,192 | - | 5,859 | - | 9,051 | ||||||||||||||||||||||||
| 2014 | - | - | 2,616 | - | 4,504 | - | 7,120 | |||||||||||||||||||||||||
| 2013 | - | - | 2,616 | - | 9,280 | - | 11,896 | |||||||||||||||||||||||||
| Michael E. Conner | 2015 | - | - | 3,045 | - | 17,775 | 45,562 | 66,382 | ||||||||||||||||||||||||
| 2014 | - | - | 2,452 | - | 14,975 | 46,255 | 63,682 | |||||||||||||||||||||||||
| 2013 | - | - | 2,453 | - | 18,624 | 35,742 | 56,819 | |||||||||||||||||||||||||
| Karen F. Maier | 2015 | - | - | 3,018 | - | 5,729 | 52,414 | 61,161 | ||||||||||||||||||||||||
| 2014 | - | - | 2,033 | - | 4,319 | 46,361 | 52,713 | |||||||||||||||||||||||||
| 2013 | - | - | 2,033 | - | 11,079 | 38,589 | 51,701 | |||||||||||||||||||||||||
| Michael R. Everett | 2015 | - | - | 2,853 | - | 15,443 | 34,662 | 52,958 | ||||||||||||||||||||||||
| 2014 | - | - | 2,302 | - | 17,665 | 34,274 | 54,241 | |||||||||||||||||||||||||
| 2013 | - | - | 2,302 | - | 9,103 | 27,264 | 38,669 | |||||||||||||||||||||||||
Grants of Plan-Based Awards
The following table shows the equity-based incentive compensation of unrestricted stock awards granted by the Compensation Committee to the Named Executive Officers (excluding the CEO) during the fiscal year ended June 2, 2015, and the restricted stock awards granted to the CEO, in accordance with the terms of his employment agreement, in October 2014, which will vest on the first anniversary date of the award but have full voting and dividend rights prior to vesting. Vesting will be accelerated so as to be fully vested at the date the transaction to sell the Company closes.
113
Fiscal 2015 Grants of Plan-Based Awards
| Name | Grant Date | All Other Awards: Number of Shares of Stock (#) | Grant Date Fair Value of Stock Awards(1) | |||||||
| Craig F. Maier (2) | 10/22/2014 | 1,539 | 39,999 | |||||||
| Mark R. Lanning | 6/18/2014 | 1,170 | 26,758 | |||||||
| Michael E. Conner | 6/18/2014 | 820 | 18,753 | |||||||
| Karen F. Maier | 6/18/2014 | 820 | 18,753 | |||||||
| Michael R. Everett | 6/18/2014 | 820 | 18,753 | |||||||
| (1) | Grant Date Fair Value of stock awards is calculated using the closing price of our Common Stock on the grant date. |
| (2) | Craig F. Maier’s stock award is restricted. The other Named Executive Officers’ awards are unrestricted. |
On June 17, 2015, in recognition of their performance in the fiscal year ended June 2, 2015, the Committee granted the Named Executive Officers (excluding the CEO) the following cash equivalent amounts in replacement of the unrestricted stock awards shown above.
| Mark R. Lanning | $ | 27,100 | ||
| Michael E. Conner | $ | 19,000 | ||
| Karen F. Maier | $ | 19,000 | ||
| Michael R. Everett | $ | 19,000 |
Outstanding Equity Awards at Fiscal Year End
The following table outlines outstanding long-term equity-based incentive compensation awards (non-qualified stock options) for the Named Executive Officers as of the fiscal year ended June 2, 2015. Each outstanding award is shown separately.
114
| Number of Securities Underlying Unexercised Options | Number of Securities Underlying Unexercised Options | Equity Incentive Plan Awards: Number of Securities Underlying Unexercised Unearned Options | Option Exercise Price | Option Expiration | ||||||||||||||
| Name | (#) Exercisable | (#) Unexercisable | (#) | ($) | Date | |||||||||||||
| Craig F. Maier | - | - | - | - | - | |||||||||||||
| Mark R. Lanning | - | - | - | - | - | |||||||||||||
| Michael E. Conner | 1,750 | - | - | 21,175 | 6/5/2017 | |||||||||||||
| Karen F. Maier | 1,750 | - | - | 21,175 | 6/5/2017 | |||||||||||||
| Michael R. Everett | - | - | - | - | - | |||||||||||||
Option Exercises and Restricted Stock Vested in Fiscal Year Ended June 2, 2015
| Option Awards | Restricted Stock Awards | |||||||||||||
| Number of Shares Acquired on Exercise | Value Realized on Exercise | Number of Shares Acquired on Vesting | Value Realized on Vesting | |||||||||||
| Name | (#) | ($) | (#) | ($) | ||||||||||
| Craig F. Maier | - | - | 1,712 (1) | 39,992 | ||||||||||
| Mark R. Lanning | - | - | - | - | ||||||||||
| Michael E. Conner | - | - | - | - | ||||||||||
| Karen F. Maier | - | - | - | - | ||||||||||
| Michael R. Everett | - | - | - | - | ||||||||||
| (1) | Restricted shares vested October 2, 2014 at $23.36 per share. |
Pension Benefits
The following table shows the present value of accumulated benefits payable to each of the Named Executive Officers, including the number of years of service credited to each such Named Executive Officer, under the qualified pension plan and the Supplemental Executive Retirement Plan (SERP).
115
Pension Benefits as of Fiscal Year End June 2, 2015
| Name | Plan Name | Years of Credited Service (#) | Present Value of Accumulated Benefit ($) | Payments During Last Fiscal Year ($) | ||||||||||
| Craig F. Maier | Qualified Pension Plan (Defined Benefit) | 20.833 | 532,307 | - | ||||||||||
| Supplemental Executive Retirement Plan (SERP) | 20.833 | 291,375 | - | |||||||||||
| Mark R. Lanning (1)(2) | Qualified Pension Plan (Defined Benefit) | N/A | N/A | N/A | ||||||||||
| Michael E. Conner (2) | Qualified Pension Plan (Defined Benefit) | 1.000 | 48,096 | - | ||||||||||
| Karen F. Maier | Qualified Pension Plan (Defined Benefit) | 25.500 | 224,557 | - | ||||||||||
| Supplemental Executive Retirement Plan (SERP) | 25.500 | 4,699 | - | |||||||||||
| Michael R. Everett (2) | Qualified Pension Plan (Defined Benefit) | 1.000 | 35,798 | - | ||||||||||
| (1) | Mark R. Lanning was employed after the Qualified Pension Plan was amended to exclude HCEs from participating and accordingly does not have a balance. |
| (2) | Mark R. Lanning, Michael E. Conner and Michael R. Everett were employed after the SERP was frozen |
Potential Payments upon Termination or Change in Control
The Company maintains a change in control agreement with Craig F. Maier, the CEO, dated November 21, 1989, as amended on March 17, 2006, and October 7, 2008. The agreement provides that if there is a change in control of the Company that has not been approved by the Board, the Company shall either (a) continue the CEO’s employment for up to three years with compensation and perquisites equal to that which he would have received had there not been such a change, (b) employ him on such other terms as he and the Company agree, or (c) terminate his employment and make lump sum payments to him equal to the present value, based on a certain discount rate, of such compensation and continue such perquisites until the end of the period for which his employment would have continued. The maximum aggregate lump sum payment that would be payable to the CEO under the agreement if he were terminated on the date of filing of this Annual Report would be approximately $2,768,315 using a discount rate of 0.10 percent in accordance with provisions of the agreement. The Company does not have a change in control agreement with any of the other Named Executive Officers.
Fiscal 2015 Non-Employee Director Compensation
The compensation for our non-employee directors is intended to attract and retain the services of individuals who will be a valuable asset to the Board based upon their qualifications, experience, skills, expertise and other attributes. Our objective is to fairly compensate them for the time and effort required of a director of a public company. Part of the compensation is given in the form of stock awards to further align the interests of the directors with shareholders of the Company and to motivate directors to focus on the long-term financial interests of the Company. Directors who are Company employees are not paid any additional compensation for their services as a Board member or a member of any committee of the Board.
During the fiscal year ended June 2, 2015, the Company paid non-employee directors an annual retainer fee of $20,000 plus $1,600 for each Board meeting or committee meeting attended in person ($800 if attended by telephone). Each non-employee director was paid an additional annual retainer of $2,500 for each Committee they chaired and the Chairman of the Board received an additional fee of $8,500 for serving as the Chairman. Benchmarking was the basis for determining an appropriate and competitive stock based award for each non-employee director. On October 22, 2014, each non-employee director was granted a restricted stock award equivalent to $39,999 in shares of the Company’s Common Stock (1,539 shares of restricted Common Stock each) based upon the closing price of the stock that day. The restricted shares vest on the first anniversary of the date of the award, but have full voting and dividend rights prior to vesting. Vested shares must be held until Board service ends, except that enough shares may be sold to satisfy any tax obligations attributable to the award. Reasonable out-of-pocket expenses incurred for travel and attendance at Board or committee meetings are reimbursed upon request. The following table summarizes the compensation earned by or awarded to each non-employee director who served on the Board during the fiscal year ended June 2, 2015.
116
Fiscal 2015 Non-Employee Director Compensation
| Name | Fees Earned or Paid in Cash ($) | Stock Awards(1) ($) | Option Awards(2) ($) | All other Compensation(3) ($) | Total ($) | |||||||||||||||
| Dale P. Brown | 51,300 | 39,999 | - | 924 | 92,223 | |||||||||||||||
| Robert J. Dourney | 48,000 | 39,999 | - | 924 | 88,923 | |||||||||||||||
| Daniel W. Geeding | 99,033 | 39,999 | - | 10,714 | 149,746 | |||||||||||||||
| Lorrence T. Kellar | 79,300 | 39,999 | - | 37,344 | 156,643 | |||||||||||||||
| Jerome P. Montopoli | 99,700 | 39,999 | - | 924 | 140,623 | |||||||||||||||
| William J. Reik, Jr. | 44,800 | 39,999 | - | 10,484 | 95,283 | |||||||||||||||
| Donald H. Walker | 50,400 | 39,999 | - | 924 | 91,323 | |||||||||||||||
| (1) | Represents the aggregate grant date fair value of the 1,539 shares of restricted Common Stock granted to each non-employee director on October 22, 2014. |
| (2) | The following 32,000 stock options, all of which are fully vested, remained outstanding as of June 2, 2015. All of the outstanding stock options were granted under the 2003 Plan. |
| Director | Option (#) | |||
| Daniel W. Geeding | 10,000 | |||
| Jerome P. Montopoli | 9,000 | |||
| William J. Reik, Jr. | 13,000 | |||
| (3) | Amounts in this column represent the value realized on exercise of stock options during the fiscal year and dividends paid on restricted shares prior to vesting. |
The Company does not provide non-employee directors with retirement benefits, benefits under health and welfare plans, or compensation in any form not described above, nor does it have any agreement with any director to make charitable donations in the director’s name.
117
Item 12. Security Ownership of Certain Beneficial Owners and Management and Related Stockholder Matters
SECURITY OWNERSHIP OF CERTAIN BENEFICIAL OWNERS AND MANAGEMENT
The following tables set forth information concerning the beneficial ownership, within the meaning of applicable securities regulations, of Frisch’s Common Stock by (i) each person known to us to be the beneficial owner of 5 percent or more of the outstanding shares of Frisch’s Common Stock; (ii) each director of Frisch’s; (iii) each named executive officer of Frisch’s; and (iv) all current directors and executive officers of Frisch’s as a group. The information below is provided as of May 28, 2015 (except as noted below) and the information for FRI Holding Company, LLC, Royce & Associates, LLC, Reik & Co., LLC, Craig F. Maier, Karen F. Maier, Dimensional Fund Advisors LP, and Active Owners Fund LP is based solely on the latest Schedule 13 reports each entity had filed with the SEC as of such date. The nature of beneficial ownership of the shares included is presented in the notes following the table.
| Name and Address of Beneficial Owner | Amount and Nature of Beneficial Ownership (1) | Percent of Class | ||||||
| FRI Holding Company 4170 Ashford Road, Suite 390 Atlanta, GA 30319 | 827,266 | (2) | 16.12 | % | ||||
| Royce & Associates, LLC 1414 Avenues of Americas New York, New York 10019 | 816,520 | (3) | 15.91 | % | ||||
| Reik & Co., LLC 15 West 53rd Street, Suite 12B New York, New York 10019 | 637,631 | (4) | 12.43 | % | ||||
| Craig F. Maier 2800 Gilbert Avenue Cincinnati, Ohio 45206 | 520,007 | (5) | 10.13 | % | ||||
| Karen F. Maier 2800 Gilbert Avenue Cincinnati, Ohio 45206 | 307,259 | (6) | 5.99 | % | ||||
| Dimensional Fund Advisors LP Palisades West, Building One 6300 Bee Cave Road Austin, Texas 78746 | 275,636 | (7) | 5.37 | % | ||||
| Active Owners Fund LP 1800 N. Highland Avenue, 5th Floor Los Angeles, CA 90028 | 260,137 | (8) | 5.07 | % | ||||
| (1) | “Beneficial Ownership” for purposes of the table, is determined according to the meaning of applicable securities regulations and based on a review of reports filed with the Securities and Exchange Commission pursuant to Section 13(d) of the Exchange Act. |
| (2) | FRI Holding Company, LLC reported in its Schedule 13D filed with the SEC on June 1, 2015 that it had shared voting power over 827,266 shares by virtue of having entered into Voting Agreements dated as of May 21, 2015 with Craig F. Maier and Karen F. Maier, both of whom are shareholders and beneficial owners of Frisch’s. |
118
| (3) | Royce & Associates, LLC (“Royce”) reported in its Schedule 13G/AF filed with the SEC on January 9, 2015 that it had beneficial ownership of 816,520 shares. Royce had sole power to vote over 816,520 shares and sole power to dispose 816,520 shares. |
| (4) | Reik & Co., LLC (“Reik LLC”) reported in its Schedule 13G filed with the SEC on April 20, 2015 that it had beneficial ownership of 637,631 shares, including sole power to vote over 248,294 shares and sole power to dispose 637,631 shares. William J. Reik, Jr., a director of the Company, is a Managing Member of Reik LLC. The number of shares reported includes all shares personally owned by Mr. Reik, which are also reported in the section below entitled “Director.” |
| (5) | Includes 38,577 shares of owned by Frisch New Richmond Big Boy, Inc., of which Mr. Maier is President and sole shareholder; 2,037 shares owned as Trustee of three trusts for the benefit of his minor children; and 52,062 shares as Trustee of the Jack C. Maier Trusts for the benefit of Craig Maier Family. Shares beneficially owned by Craig F. Maier are subject to the Voting Agreement disclosure in footnote (2) above. |
| (6) | Includes 1,750 shares Ms. Maier has the right to acquire pursuant to the exercise of stock options. Shares beneficially owned by Ms. Maier are subject to the Voting Agreement disclosure in footnote (2) above. |
| (7) | Dimensional Fund Advisors LP (“Dimensional”) reported in its Schedule 13G/A filed with the SEC on February 5, 2015 that it had beneficial ownership of 275,636 shares, together with its affiliates. Dimensional had sole power to vote over 270,526 shares and sole power to dispose 275,636 shares. |
| (8) | Active Owners Fund LP (“AOF”) reported in its Schedule 13D filed with the SEC on September 18, 2014 that it had beneficial ownership of 260,137 shares, together with its affiliates. AOF had sole power to vote over 260,137 shares and sole power to dispose 260,137 shares. |
Except as otherwise indicated, the persons named in the table below have sole voting and investment power over the shares included in the table.
| Name and Address of Beneficial Owner | Amount and Nature of Beneficial Ownership | Percent of Class | ||||||
| Directors | ||||||||
| Daniel W. Geeding | 29,163 | (1) | * | |||||
| Jerome P. Montopoli | 21,742 | (2) | * | |||||
| Craig F. Maier (also a Named Executive Officer) | 520,007 | (3) | 10.13 | % | ||||
| Dale P. Brown | 16,183 | * | ||||||
| Lorrence T. Kellar | 22,578 | * | ||||||
| William J. Riek, Jr. | 238,021 | (4) | 4.64 | % | ||||
| Karen F. Maier (also a Named Executive Officer) | 307,259 | (5) | 5.99 | % | ||||
| Robert J. Dourney | 12,407 | * | ||||||
| Donald H. Walker | 16,818 | * | ||||||
| Other Named Executive Officers | ||||||||
| Mark R. Lanning | 4,428 | * | ||||||
| Michael E. Conner | 8,113 | * | ||||||
| Michael R. Everett | 2,616 | * | ||||||
| All Directors and Officers as a group | 1,212,963 | (6) | 23.64 | |||||
119
| * | Percentage information is omitted for individuals who owned less than 1 percent of the outstanding Common Stock and shares of Common Stock deemed outstanding due to exercisable options. |
| (1) | Includes 10,000 shares Mr. Geeding has the right to acquire pursuant to the exercise of stock options. |
| (2) | Includes 9,000 shares Mr. Montopoli has the right to acquire pursuant to the exercise of stock options. |
| (3) | See footnote (5) to the chart in the preceding section “Security Ownership of Certain Beneficial Owners.” |
| (4) | Includes 13,000 shares Mr. Reik has the right to acquire pursuant to the exercise of stock options. |
| (5) | See footnote (6) to the chart in the preceding section “Security Ownership of Certain Beneficial Owners.” |
| (6) | Includes 35,750 shares the group has the right to acquire pursuant to the exercise of stock options. |
Upon the close of the contemplated Merger transaction, options not exercised will be converted into the right to receive the difference between the $34.00 Merger consideration and the exercise price of the option.
120
Equity Compensation Plan Information as of June 2, 2015
| (a) | (b) | (c) | ||||||||||
| Plan Category | Number of Securities to be issued upon exercise of outstanding options, warrants and rights | Weighted-average exercise price of outstanding options, warrants and rights | Number of securities remaining available for future issuance under equity compensation plans (excluding securities reflected in column (a)) | |||||||||
| Equity compensation plans approved by security holders: | ||||||||||||
| 2003 Stock Option and Incentive Plan | 38,500 | $ | 17.03 | — | ||||||||
| 2012 Stock Option and Incentive Plan | — | $ | — | 429,898 | ||||||||
| Total | 38,500 | $ | 17.03 | 429,898 | ||||||||
| Equity compensation plans not approved by security holders: | ||||||||||||
| Executive Savings Plan (1) | — | — | 28,072 | |||||||||
| Senior Executive Bonus Plan (2) | — | — | — | |||||||||
| CEO Employment Agreement/Performance Award (3) | — | — | — | |||||||||
| Total | 38,500 | $ | 17.03 | 457,970 | ||||||||
(1) Frisch’s Executive Savings Plan
The Frisch’s Executive Savings Plan (FESP) provides a means for certain management employees who are disqualified from participating in the Frisch’s Employee 401(k) Savings Plan, to participate in a similarly designed non-qualified plan. Under the FESP, an eligible employee may choose to defer up to 25 percent of his or her salary, which may be invested in mutual funds or in common stock of the Company. For participants who choose to invest in the Company’s common stock, the Company makes a 15 percent matching contribution of common stock to the employee’s account, but only on the first 10 percent of salary deferred.
All eligible FESP participants hired July 1, 2009 or after receive an enhanced match of 100 percent on the first 3 percent of compensation deferred into either mutual funds or common stock.
Upon an employee’s retirement, the Company has the option to issue to the employee the shares of common stock allocated to that employee or to pay cash to the employee in an amount equal to the fair market value of the common stock allocated to the employee's account. A reserve of 58,492 shares of common stock (as adjusted for subsequent changes in capitalization from the original authorization of 50,000 shares) was established for issuance under the FESP when it was established in 1993. Since its inception, participants have cumulatively redeemed 30,420 shares through June 2, 2015.
121
The current reserve balance of 28,072 shares contains 13,934 shares (including 1,856 shares allocated during the year ended June 2, 2015) that have been allocated but not issued to active plan participants.
Upon the closing of the Merger transaction, see “Pending Agreement and Plan of Merger” NOTE A – ACCOUNTING POLICIES included under PART II, Item 8. “Financial Statements and Supplemental Data”, the FESP would be required to liquidate the assets held by the plan and distribute the proceeds to the participants. The 13,934 shares that have been allocated but not issued to plan participants would be paid out in cash at the $34.00, the same Merger consider price paid for the Company’s Common Stock.
The Senior Executive Bonus Plan and the CEO Employment Agreement/Performance Awards did not have an equity component for Fiscal Year 2015, as a result of the pending Merger transaction noted above and therefore were paid out in cash in the first quarter of Fiscal Year 2016. For a detailed discussion of compensation paid to executive officers in Fiscal Year 2015, see Part III, Item 11. “Executive Compensation”.
122
Item 13. Certain Relationships and Related Transactions, and Director Independence
Certain Relationships and Related Person Transactions
The Board is committed to upholding the highest ethical conduct in fulfilling its duties and has adopted a written Related Person Transaction Policy to ensure the careful review of any related party transactions. The policy requires that the Audit Committee review and approve or ratify all related person transactions for which disclosure is required pursuant to the rules and regulations of the SEC. A related person transaction includes any transaction, arrangement or relationship in which the Company or any of its subsidiaries is a participant and in which any of the following persons has or will have a direct or indirect interest:
| · | an executive officer, director or director nominee of the Company; |
| · | any shareholder owning more than 5 percent of the Company’s Common Stock; |
| · | any immediate family member (as defined in the rules and regulations of the SEC) of an executive officer, director, director nominee or beneficial owner of more than 5 percent of the Company’s Common Stock; and |
| · | any firm, corporation or other entity in which any of the foregoing persons is employed or is a partner or principal or in a similar position or in which such person, together with any other of the foregoing persons, has a 5 percent or greater ownership interest. |
As part of its review and approval process of related person transactions, the Audit Committee of the Board of Directors considers all relevant facts and circumstances available to the Audit Committee, including the recommendations of management. No member of the Audit Committee participates in any review, consideration or approval of any related person transaction involving such member or any of his or her immediate family members, except that such member is required to provide all material information concerning the related person transaction to the Audit Committee.
The Board has pre-approved the following related person transactions as part of the Company’s Related Person
Transaction Policy:
| · | any transaction with a related persons involving the purchase or sale of products or services in the ordinary course of business on arm’s length terms available to third parties where the aggregate amount involved does not exceed $120,000; |
| · | any transaction with another company where the related person’s only relationship with that Company is as an employee (but not an executive officer), director or beneficial owner of less than 10 percent of that company’s shares; |
| · | any employment by the Company of a relative of a director or executive officer where the employment was entered into in the ordinary course of business and the relative’s compensation is in accordance with the Company’s practices applicable to employees with equivalent qualifications and responsibilities holding similar positions; |
| · | any charitable contribution, grant or endowment by the Company to a charitable organization, founcation or university where the related person’s only relationship to the organization, foundation or university is as an employee or a director (but not an executive officer); |
| · | any transaction where the related person’s interest arises solely from the ownership of the Company’s Common Stock and all holders of such Common Stock receive the same benefit on a pro-rata basis (e.g. dividends); and |
| · | director compensation arrangements, if the Board has approved such arrangements. |
123
During the fiscal year ended June 2, 2015, the related party transactions required to be disclosed are as follows:
Simultaneously with the Company’s entering into an Agreement and Plan of Merger to sell the Company, Craig F. Maier, the Chief Executive Officer (CEO) and a director of the Company, and Karen F. Maier, Vice President – Marketing and a director of the Company, entered into Voting Agreements with FRI Holding Company, LLC, agreeing to vote each Share held by both of them in favor of the transactions contemplated in the Merger Agreement, subject to the reservations and conditions stated in each Voting Agreement.
Craig F. Maier, is the owner of Frisch New Richmond Big Boy, Inc. (“New Richmond”), which operates a licensed Frisch’s Big Boy restaurant in New Richmond, Ohio. Karen F. Maier, is a part owner (along with her siblings, excluding Craig F. Maier) of Frisch West Chester, Inc. (“West Chester”), which operates a licensed Frisch's Big Boy restaurant in West Chester, Ohio. Certain other family members of Craig F. Maier and Karen F. Maier are the owners of Frisch Hamilton West, Inc. (“Hamilton West”), which operates a licensed Frisch’s Big Boy restaurant in West Hamilton, Ohio.
All three of these restaurants are operated by the Company (through its wholly-owned subsidiary, Frisch Ohio, LLC) pursuant to the terms of certain Restaurant Management and Operations Agreements, under which the restaurants pay management fees to the Company. The management fees consist of a) pro-rata portions of the Company's costs of providing centralized shared services - accounting, payroll processing, and information technology including POS help desk services - which are allocated in the same way the Company allocates these costs to its own restaurants, and b) the Company's fully burdened cost of salaries and wages, payroll taxes and employee benefits of Company employees who staff the three restaurants. Total management fees paid to the Company by these three restaurant entities amounted to $2,911,736 during the fiscal year ended June 2, 2015. These Restaurant Management and Operations Agreements were entered into on July 29, 2014, to replace certain employee leasing agreements and to formalize other long-standing arrangements. The initial term of each agreement is five years. Five renewal periods of one year each are available under each agreement.
In addition, these three restaurant entities pay the Company franchise fees, contribute to the Company's general advertising fund and make purchases from the Company’s commissary. The total paid to the Company by these three restaurants amounted to $2,229,602 during the fiscal year ended June 2, 2015. These non-management fee transactions were effected on substantially similar terms as transactions with other licensees of the Company.
All management fees and non-management fee transactions are summarized in detail below:
| · | New Richmond made purchases from the Company’s commissary totaling $386,719, and paid the Company advertising fees of $36,465, employee leasing fees of $622,857, payroll and accounting fees of $18,489, human resources and benefit fees of $7,683, franchise fees of $54,698, and point of sales help desk fees of $6,136. |
| · | West Chester made purchases from the Company’s commissary totaling $518,313, and paid the Company advertising fees of $49,763, employee leasing fees of $873,588, payroll and accounting fees of $21,789, human resources and benefit fees of $12,530, franchise fees of $74,645, and point of sales help desk fees of $6,136. |
| · | Hamilton West made purchases from the Company’s commissary totaling $896,136, and paid the Company advertising fees of $85,145, employee leasing fees of $1,304,533, payroll and accounting fees of $20,793, human resources and benefit fees of $11,067, franchise fees of $127,717, and point of sales help desk fees of $6,136. |
124
Hamilton West is a party to an Agreement to Purchase Stock with the Company which provides when there is only one remaining shareholder of Hamilton West, that remaining shareholder may require the Company to purchase any or all his or her shares of Hamilton West at any time, and the Company is required to purchase all such shares upon the death of the sole remaining shareholder. The purchase price for any such purchase by the Company would be the book value of the shares as determined by the Hamilton West’s accountants based upon generally accepted accounting principles, determined as of the end of the month immediately preceding the closing. The closing must be held within 30 days after the demand for purchase by the remaining shareholder or the appointment of the personal representative for the shareholder’s estate, as applicable, and the purchase price must be paid in cash at the closing.
West Chester is a party to an Agreement to Purchase Stock with the Company which provides when there is only one remaining shareholder of West Chester, that remaining shareholder may require the Company to purchase any or all his or her shares of West Chester at any time, and the Company is required to purchase all such shares upon the death of the sole remaining shareholder. The purchase price for any such purchase by the Company would be the greater of either the book value of the shares or twice the average earnings per share over the prior three years, with a maximum purchase price of $100,000 less any outstanding debt owed by West Chester to the deceased shareholder. The closing must be held within 30 days after the demand for purchase by the remaining shareholder or the appointment of the personal representative for the deceased shareholder’s estate, as applicable, and the purchase price must be paid in cash at the closing.
During the fiscal year ended June 2, 2015, Scott C. Maier, a Construction Manager at the Company who is the brother of Craig F. Maier and Karen F. Maier, received a salary of $80,048 and an auto allowance of $5,645.
Until his death on February 2, 2005, Jack C. Maier served as Chairman of the Board and provided other services to the Company pursuant to an employment agreement effective May 29, 2000, that contained a provision for deferred compensation. Jack C. Maier was the husband of Blanche F. Maier, a director of the Company until her death on September 1, 2009. Jack C. Maier and Blanche F. Maier are the parents of Craig F. Maier and Karen F. Maier. Pursuant to the agreement, upon the death of Jack C. Maier, the Company became obligated to pay his widow the amount of $214,050 for each of the next 10 years, adjusted annually to reflect 50 percent of the latest annual percentage change in the Consumer Price Index for All Urban Consumers (“CPI”). After the settling of Blanche F. Maier’s Estate, from July 1, 2013 (the first payment due date in fiscal year 2014) through September 1, 2013, monthly payments of $19,601 were made to Craig F. Maier, Trustee. Beginning October 1, 2013, after distributions from the Trust, payments have been split seven ways among Karen F. Maier, Linda L. Maier, Jack C. Maier Trust FBO Craig F. Maier Family, Jack C. Maier Trust FBO Lisa M. Dayton Family, Jack C. Maier Trust FBO Diane N. Knight Family, Jack C. Maier Trust FBO Paula Maier Family, and Jack C. Maier FBO Scott C. Maier Family. Effective March 1, 2014, as a result of the required CPI adjustment, the monthly amount increased to $19,748 per month and aggregate payments during Fiscal Year 2015 totaled $157,984. The final payment occurred on February 1, 2015.
Director Independence
The Company’s Code of Regulations requires that a majority of the directors on the Board be independent and provides certain criteria for determining independence. The Company’s Code of Regulations is available on the Company’s website at http://www.frischs.com and is available in print upon written request to the Company’s Secretary, Donald A. Bodner.
125
In accordance with the Guidelines and the rules and listing standards of the New York Stock Exchange (“NYSE MKT”), the Board reviews at least annually the independence of each non-employee director and affirmatively determines whether each non-employee director qualifies as independent under the independence standards of the NYSE MKT, the Company’s Code of Regulations, and any applicable federal securities laws and regulations. The Board recognizes that members of the Audit Committee and Compensation Committee are subject to more stringent standards of independence. Based upon an analysis of information provided by the non-employee directors, the Board also evaluates whether any such director has any material relationship, directly or indirectly, that may cause a conflict of interest in the performance of the director’s duties.
Based upon its review, the Board has affirmatively determined that the following seven directors are independent under the applicable independence standards: Dale P. Brown, Daniel W. Geeding, Jerome P. Montopoli, Robert J. Dourney, Lorrence T. Kellar, and William J. Reik, Jr. and Donald H. Walker. Pursuant to the Guidelines, each director must keep the Nominating and Corporate Governance Committee fully and promptly informed as to any developments that might affect the director’s independence. Craig F. Maier and Karen F. Maier, are deemed not to be independent based upon their employment status with the Company and because of certain relationships discussed above see “Certain Relationships and Related Person Transactions” elsewhere in Part III, Item 13.
126
Item 14. Principal Accounting Fees and Services
The Company has adopted a policy requiring pre-approval by the Audit Committee of audit and permissible non-audit services by Grant Thornton LLP. The Audit Committee did pre-approve all services by Grant Thornton LLP referenced below.
| Fiscal Year | ||||||||
| 2015 | 2014 | |||||||
| Audit Fees (1) | $ | 454,800 | $ | 398,500 | ||||
| Audit Related Fees (2) | 27,250 | 29,250 | ||||||
| Tax Fees (3) | 1,950 | 224,300 | ||||||
| All Other Fees (4) | 144,790 | - | ||||||
| Total | $ | 628,790 | $ | 652,050 | ||||
| (1) | Audit Fees services include: (i) the audit of the financial statements and controls included in our annual reports on Form 10-K; (ii) reviews of the interim financial statements included in our quarterly reports on Form 10-Q; and (iii) out of pocket expenses. |
| (2) | Audit-Related Fees services include: These fees were for assurance and related services reasonably related to the performance of the audit or review of the financial statements, including consultations on the application of accounting standards and out of pocket expenses. |
| (3) | Tax Fees services include: (i) FY 2014, fees to identify, quantify and document tax benefits associated with the Domestic Production Activities Deduction available under the Internal Revenue Code; (ii) FY 2014, fees to conform the Company’s previous Change in Accounting Method (filed with the Internal Revenue Service (IRS)) to the Final Repair Regulations that were issued by the IRS in September 2013 and (iii) general tax consulting services. |
| (4) | All other fees include: fees related to professional services rendered by Grant Thornton LLP during Fiscal Year 2015 related to the theft and forensic work. |
The Audit Committee considered the services of Grant Thornton LLP as referenced above and determined those services were compatible with maintaining Grant Thornton LLP’s independence.
127
Item 15. Exhibits, Financial Statement Schedules
| a.) List of document filed as part of this report. | |||||||||
| 1.) FINANCIAL STATEMENTS | |||||||||
| The following Consolidated Financial Statements of the Registrant are contained in Part II, Item 8 of this Form 10-K. | |||||||||
| Report of Management on Internal Control over Financial Reporting | |||||||||
| Report of Independent Registered Public Accounting Firm (on Financial Statements) | |||||||||
| Report of Independent Registered Public Accounting Firm (on Internal Control over Financial Reporting) | |||||||||
| Consolidated Balance Sheet - June 2, 2015 and June 3, 2014 | |||||||||
| Consolidated Statement of Earnings - Three fiscal years ended June 2, 2015 | |||||||||
| Consolidated Statement of Cash Flows - Three fiscal years ended June 2, 2015 | |||||||||
| Consolidated Statement of Shareholders' Equity - Three fiscal years ended June 2, 2015 | |||||||||
| Notes to Consolidated Financial Statements - Three fiscal years ended June 2, 2015 | |||||||||
| 2.) FINANCIAL STATEMENT SCHEDULES | |||||||||
| Financial statement schedules are not applicable or are not required under the related instructions or the information is included in the financial statements or the notes to the financial statements. | |||||||||
| 3.) EXHIBITS | |||||||||
| Plan of acquisition, reorganization, arrangement, liquidation or succession | |||||||||
| 2.1 | Agreement and Plan of Merger between FRI Holding Company LLC, FRI Merger Sub, LLC and Frisch's Restaurants, Inc. on May 21, 2015. Incorporated by reference to Exhibit 2.1 to Current Report on Form 8-K filed May 22, 2015 | ||||||||
| Articles of Incorporation and Bylaws | |||||||||
| 3.1 | Third Amended Articles of Incorporation, which was filed as Exhibit (3)(a) to the Registrant's Annual Report on Form 10-K for 1993, is incorporated herein by reference. | ||||||||
| 3.2 | Amended and Restated Code of Regulations effective October 2, 2006, which was filed as Exhibit A to the Registrant's Definitive Proxy Statement dated September 1, 2006, is incorporated herein by reference. | ||||||||
| Voting Trust Agreements | |||||||||
| 9.1 | Voting Agreement between Craig F. Maier and FRI Holding Company, LLC dated May 21, 2015, which was filed as Exhibit 10.2 to the Registrant's Form 8-K Current Report dated May 22, 2015, is incorporated herein by reference. | ||||||||
| 9.2 | Voting Agreement between Karen F. Maier and FRI Holding Company, LLC dated May 21, 2015, which was filed as Exhibit 10.3 to the Registrant's Form 8-K Current Report dated May 22, 2015, is incorporated herein by reference. | ||||||||
128
| Material Contracts | |||
| 10.1 | Loan Agreement between the Registrant and US Bank dated October 31, 2013, which was filed as Exhibit 10.1 to the Registrant's Form 10-Q Quarterly Report for December 10, 2013, is incorporated herein by reference. | ||
| 10.2 | Agreement to Purchase Stock between the Registrant and Frisch West Chester, Inc. dated June 1, 1988, which was filed as Exhibit 10(f) to the Registrant's Form 10-Q Quarterly Report for September 19, 2006, is incorporated herein by reference. | ||
| 10.3 | Agreement to Purchase Stock between the Registrant and Frisch Hamilton West, Inc. dated February 19, 1988, which was filed as Exhibit 10(g) to the Registrant's Form 10-Q Quarterly Report for September 19, 2006, is incorporated herein by reference. | ||
| 10.4 | Form of Restaurant Management and Operations Agreement dated July 30, 2014 between the Registrant and each of Frisch West Chester, Inc. Frisch Hamilton West, Inc. and Frisch New Richmond Big Boy, Inc., which was filed as Exhibit 10.4 to the Registrant’s Form 10-K Annual Report for 2014, is incorporated herein by reference. | ||
| Material Contracts - Compensatory Plans or Agreements | |||
| 10.50 | Employment Agreement between the Registrant and Craig F. Maier effective May 30, 2012, dated April 4, 2012, which was filed as Exhibit 10.52 to the Registrant's Form 10-Q Quarterly Report for March 6, 2012, is incorporated herein by reference. | ||
| 10.51 | Performance Award under the 2003 Stock Option and Incentive Plan (see Exhibits 10.64, 10.65, 10.66, and 10.67 below) granted by the Registrant to Craig F. Maier dated May 30, 2012, which was filed as Exhibit 10.53 to the Registrant's Form 10-Q Quarterly Report for March 6, 2012, is incorporated herein by reference. | ||
| 10.52 | Amendment dated June 13, 2013 (effective May 29, 2013) to the Employment Agreement between the Registrant and Craig F. Maier (see Exhibit 10.50 above), which was filed as Exhibit 99.1 to the Registrant's Form 8-K Current Report dated June 12, 2013, is incorporated herein by reference. | ||
| 10.53 | Performance Award under the 2012 Stock Option and Incentive Plan (see Exhibit 10.62 below) granted by the Registrant to Craig F. Maier dated May 29, 2013 (approved June 12, 2013), which was filed as Exhibit 99.2 to the Registrant's Form 8-K Current Report dated June 12, 2013, is incorporated herein by reference. | ||
| 10.54 | Unrestricted Stock Agreement to be used for unrestricted stock granted to employees (between the Registrant and Craig F. Maier dated June 15, 2011) under the Registrant’s 2003 Stock Option and Incentive Plan (see Exhibits 10.64, 10.65, 10.66 and 10.67 below), which was filed as Exhibit 10.61 to the Registrant's Form 10-K Annual Report for 2011, is incorporated herein by reference. | ||
| 10.55 | Change of Control Agreement between the Registrant and Craig F. Maier dated November 21, 1989, which was filed as Exhibit (10) (g) to the Registrant’s Form 10-K Annual Report for 1990, is incorporated herein by reference. It was also filed as Exhibit 99.2 to the Registrant’s Form 8-K Current Report dated March 17, 2006, which is also incorporated herein by reference. | ||
129
| 10.56 | First Amendment to Change of Control Agreement (see Exhibit 10.55 above) between the Registrant and Craig F. Maier dated March 17, 2006, which was filed as Exhibit 99.1 to the Registrant’s Form 8-K Current Report dated March 17, 2006, is incorporated herein by reference. | ||
| 10.57 | Second Amendment to Change of Control Agreement (see Exhibits 10.55 and 10.56 above) between the Registrant and Craig F. Maier dated October 7, 2008, which was filed as Exhibit 99.1 to the Registrant’s Form 8-K Current Report dated October 7, 2008, is incorporated herein by reference. | ||
| 10.58 | Extension of the Employment Agreement effective May 30, 2012 (as amended on June 13, 2013) (see Exhibits 10.50 and 10.52, above) between Frisch's Restaurants, Inc., an Ohio corporation, and Craig F. Maier and filed as Exhibit 10.4 to the Registrant's Form 8-K Current Report dated May 22, 2015, is incorporated herein by reference. | ||
| 10.60 | Frisch’s Executive Retirement Plan (SERP) effective June 1, 1994, which was filed as Exhibit (10) (b) to the Registrant’s Form 10-Q Quarterly Report for September 17, 1995, is incorporated herein by reference. | ||
| 10.61 | Amendment No. 1 to Frisch’s Executive Retirement Plan (SERP) (see Exhibit 10.60 above) effective January 1, 2000, which was filed as Exhibit 10 (k) to the Registrant’s form 10-K Annual Report for 2003, is incorporated herein by reference. | ||
| 10.62 | 2012 Stock Option and Incentive Plan, which was filed as Exhibit B to the registrant's Proxy Statement dated August 26, 2012, is incorporated herein by reference. | ||
| 10.63 | Restricted Stock Agreement to be used for restricted stock granted to non-employee members of the Board of Directors (between the Registrant and Daniel W. Geeding) under the Registrant's 2012 Stock Option and Incentive Plan (see Exhibit 10.62 above), which was filed as Exhibit 10.50 to the Registrant's Form 10-Q Quarterly report for December 12, 2012, is incorporated herein by reference. There are identical agreements between the registrant and all other non-employee members of the Board of Directors. An identical agreement is also in place between the Registrant and Craig F. Maier. | ||
| 10.64 | 2003 Stock Option and Incentive Plan, which was filed as Appendix A to the Registrant’s Proxy Statement dated August 28, 2003, is incorporated herein by reference. | ||
| 10.65 | Amendment # 1 to the 2003 Stock Option and Incentive Plan (see Exhibit 10.64 above) effective September 26, 2006, which was filed as Exhibit 10 (q) to the Registrant’s Form 10-Q Quarterly Report for September 19, 2006, is incorporated herein by reference. | ||
| 10.66 | Amendments to the 2003 Stock Option and Incentive Plan (see Exhibits 10.64 and 10.65 above) effective December 19, 2006, which was filed as Exhibit 99.2 to the Registrant’s Form 8-K Current Report dated December 19, 2006, is incorporated herein by reference. | ||
| 10.67 | Amendments to the 2003 Stock Option and Incentive Plan (see Exhibits 10.64, 10.65 and 10.66 above) adopted October 7, 2008, which was filed as Exhibit 10.21 to the Registrant’s Form 10-Q Quarterly Report for September 23, 2008, is incorporated herein by reference. |
130
| 10.68 | Forms of Agreement to be used for stock options granted to employees and to non-employee directors under the Registrant’s 2003 Stock Option and Incentive Plan (see Exhibits 10.64, 10.65, 10.66 and 10.67 above), which was filed as Exhibits 99.1 and 99.2 to the Registrant’s Form 8-K dated October 1, 2004, are incorporated herein by reference. | ||
| 10.69 | Restricted Stock Agreement to be used for restricted stock granted to non-employee members of the Board of Directors under the Registrant’s 2003 Stock Option and Incentive Plan (see Exhibits 10.64, 10.65, 10.66 and 10.67 above), which was filed as Exhibit 10.58 to the Registrant’s Form 10-Q Quarterly Report for September 21, 2010, is incorporated herein by reference. | ||
| 10.70 | Restricted Stock Agreement to be used for restricted stock granted to key employees under the Registrant’s 2003 Stock Option and Incentive Plan (see Exhibits 10.64, 10.65, 10.66 and 10.67 above), which was filed as Exhibit 10.60 to the Registrant's Form 10-K Annual Report for 2011, is incorporated herein by reference. | ||
| 10.71 | Unrestricted Stock Agreement to be used for unrestricted stock granted to employees (between the Registrant and Michael E. Conner dated June 13, 2012) under the Registrant's 2003 Stock Option and Incentive Plan (see Exhibits 10.64, 10.65, 10.66 and 10.67 above), which was filed as Exhibit 10.70 to the Registrant's Form 10-K Annual Report for 2012, is incorporated herein by reference. There are similar agreements (but for differing amounts of shares) between the Registrant and Karen F. Maier, Mark R. Lanning, Michael R. Everett, James I. Horwitz, Stephen J. Hansen, Lindon C. Kelley, Todd M. Rion, James Fettig and certain other highly compensated employees. | ||
| 10.72 | Unrestricted Stock Agreement to be used for unrestricted stock granted to employees (between the Registrant and Mark R. Lanning dated June 12, 2013) under the Registrant's 2012 Stock Option and Incentive Plan (see Exhibit 10.62 above), which was filed as Exhibit 10.72 to the Registrant's Form 10-K Annual Report for 2013, is incorporated herein by reference. There are similar agreements (but for differing amounts of shares) between the Registrant and Karen F. Maier, Michael E. Conner, Michael R. Everett, James I. Horwitz, Stephen J. Hansen, Lindon C. Kelley, Todd M. Rion, James Fettig and certain other highly compensated employees. These agreements were used for unrestricted stock granted in June 2013 and June 2014. | ||
| 10.73 | Amended and Restated 1993 Stock Option Plan, which was filed as Exhibit A to the Registrant’s Proxy Statement dated September 9, 1998, is incorporated herein by reference. | ||
| 10.74 | Amendments to the Amended and Restated 1993 Stock Option Plan (see Exhibit 10.73 above) effective December 19, 2006, which was filed as Exhibit 99.1 to the Registrant’s Form 8-K Current Report dated December 19, 2006, is incorporated herein by reference. | ||
| 10.75 | Employee Stock Option Plan (Employee Stock Purchase Plan), which was filed as Exhibit B to the Registrant’s Proxy Statement dated September 9, 1998, is incorporated herein by reference. | ||
| 10.76 | Second Amendment to the Employee Stock Option Plan (Employee Stock Purchase Plan) (see Exhibit 10.75 above), which was filed as Exhibit 10.52 to the Registrant's Form 10-Q Quarterly Report for September 18, 2012, is incorporated herein by reference. |
131
| 10.77 | Frisch’s Nondeferred Cash Balance Plan effective January 1, 2000, which was filed as Exhibit (10) (r) to the Registrant’s Form 10-Q Quarterly Report for December 10, 2000, is incorporated herein by reference, together with the Trust Agreement established by the Registrant between the Plan’s Trustee and the Grantor (employee). There are identical Trust Agreements between the Plan’s Trustee and Craig F. Maier, Karen F. Maier, Michael E. Conner, Lindon C. Kelley, Michael R. Everett, James I. Horwitz and certain other highly compensated employees (Grantors). | ||
| 10.78 | First Amendment (to be effective June 6, 2006) to the Frisch’s Nondeferred Cash Balance Plan that went into effect January 1, 2000 (see Exhibit 10.77 above), which was filed as Exhibit 99.2 to the Registrant’s Form 8-K Current Report dated June 7, 2006, is incorporated herein by reference. | ||
| 10.79 | Second Amendment (to be effective January 9, 2013) to the Frisch's Nondeferred Cash Balance Plan that went into effect on January 1, 2000 (see Exhibits 10.77 and 10.78 above), which was filed as Exhibit 10.51 to the Registrant's Form 10-Q Quarterly Report for December 11, 2012, is incorporated herein by reference. | ||
| 10.80 | Senior Executive Bonus Plan effective June 2, 2003, which was filed as Exhibit (10) (s) to the Registrant’s Form 10-K Annual Report for 2003, is incorporated herein by reference. | ||
| 10.81 | Non-Qualified Deferred Compensation Plan, Basic Plan Document to Restate Frisch’s Executive Savings Plan (FESP) effective December 31, 2008, (also see Exhibits 10.82, 10.83 and 10.84), which was filed as Exhibit 10.32 to the Registrant’s Form 10-Q Quarterly Report for September 23, 2008, is incorporated herein by reference. | ||
| 10.82 | Non-Qualified Deferred Compensation Plan, Adoption Agreement (Stock) to Restate Frisch’s Executive Savings Plan (FESP) effective December 31, 2008, (also see Exhibits 10.81, 10.83 and 10.84), which was filed as Exhibit 10.33 to the Registrant’s Form 10-Q Quarterly Report for September 23, 2008, is incorporated herein by reference. | ||
| 10.83 | Non-Qualified Deferred Compensation Plan, Adoption Agreement (Mutual Funds) to Restate Frisch’s Executive Savings Plan (FESP) effective December 31, 2008, (also see Exhibits 10.81, 10.82 and 10.84), which was filed as Exhibit 10.34 to the Registrant’s Form 10-Q Quarterly Report for September 23, 2008, is incorporated herein by reference. | ||
| 10.84 | Non-Qualified Deferred Compensation Plan, Adoption Agreement to Restate Frisch’s Executive Savings Plan (FESP) effective July 1, 2009 (also see Exhibits 10.81, 10.82 and 10.83), which was filed as Exhibit 10.36 to the Registrant’s Form 10-K Annual Report for 2009, and to correct a typographical error in Section 4.02(c) was re-filed as Exhibit 10.74 to the Registrant's Form 10-Q Quarterly Report for September 20, 2011, is incorporated herein by reference. |
132
| Other Exhibits | |||
| 21 | Subsidiaries of the Registrant is filed herewith. | ||
| 23 | Consent of Grant Thornton LLP is filed herewith. | ||
| 31.1 | Certification of Chief Executive Officer pursuant to Rule 13a-14(a)/15d-14(a), is filed herewith. | ||
| 31.2 | Certification of Chief Financial Officer pursuant to Rule 13a-14(a)/15d-14(a) is filed herewith. | ||
| 32.1 | Section 1350 Certification of Chief Executive Officer is filed herewith. | ||
| 32.2 | Section 1350 Certification of Chief Financial Officer is filed herewith. | ||
| The XBRL interactive data files appearing below are filed herewith. | |||
| 101.INS | XBRL Instance Document | ||
| 101.SCH | XBRL Taxonomy Extension Schema Document | ||
| 101.CAL | XBRL Taxonomy Extension Calculation Linkbase Document | ||
| 101.DEF | XBRL Taxonomy Extension Definition Linkbase Document | ||
| 101.LAB | XBRL Taxonomy Extension Label Linkbase Document | ||
| 101.PRE | XBRL Taxonomy Presentation Linkbase Document | ||
133
Pursuant to the requirements of Section 13 or 15(d) of the Securities Exchange Act of 1934, the Registrant has duly caused this Report to be signed on its behalf by the undersigned, thereunto duly authorized.
FRISCH’S RESTAURANTS, INC. (Registrant)
| By | /s/ Craig F. Maier | August 14, 2015 | |
| Craig F. Maier, President and Chief Executive Officer | Date | ||
| By | /s/ Mark R. Lanning | August 14, 2015 | |
| Mark R. Lanning, Vice President-Finance and Chief Financial Officer (Principal Financial Officer and Principal Accounting Officer) | Date | ||
134
Pursuant to the requirements of the Securities Exchange Act of 1934, this report has been signed below by the following persons on behalf of the Registrant and in the capacities and on the dates indicated:
| Signature | Title | Date | ||
| /s/ Daniel W. Geeding | ||||
| Daniel W. Geeding | Director | August 14, 2015 | ||
| Chairman of the Board | ||||
| /s/ Craig F. Maier | ||||
| Craig F. Maier | Director | August 14, 2015 | ||
| President and Chief Executive Officer | ||||
| (Principal Executive Officer) | ||||
| /s/ Dale P. Brown | ||||
| Dale P. Brown | Director | August 14, 2015 | ||
| /s/ Robert J. (RJ) Dourney | ||||
| Robert J. (RJ) Dourney | Director | August 14, 2015 | ||
| /s/ Lorrence T. Kellar | ||||
| Lorrence T. Kellar | Director | August 14, 2015 | ||
| /s/ Karen F. Maier | ||||
| Karen F. Maier | Director | August 14, 2015 | ||
| Vice President - Marketing | ||||
| /s/ Jerome P. Montopoli | ||||
| Jerome P. Montopoli | Director | August 14, 2015 | ||
| /s/ William J. Reik, Jr. | ||||
| William J. Reik, Jr. | Director | August 14, 2015 | ||
| /s/ Donald H. Walker | Director | August 14, 2015 | ||
| Donald H. Walker | ||||
| /s/ Mark R. Lanning | Vice President-Finance and Chief | August 14, 2015 | ||
| Mark R. Lanning | Financial Officer (Principal Financial | |||
| Officer and Principal Accounting Officer) |
135