Attached files
| file | filename |
|---|---|
| 8-K - 8-K - FRANKLIN FINANCIAL SERVICES CORP /PA/ | fraf-20150813x8k.htm |
 In order for you to better understand the business of the Company – where we all have been and where we want to go – our remarks today (those of the Company officers who will speak or respond to questions) will include forward looking statements related to anticipated financial performance, future operating results, business prospects, new products, and similar matters. These statements represent our best judgment, based upon present circumstances and the information now available to us, of what we think may occur in the future – and, of course, it is possible that actual results may differ materially from those we envision today. For a more complete discussion on the subject of forward looking statements, including a list of some of the risk factors that might adversely affect future operating results, we refer you to the section entitled “Forward Looking Statements” which appears in our annual report on Form 10-K as filed with the Securities and Exchange Commission. FORWARD LOOKING 2

 COMPANY PROFILE •F&M Trust founded in 1906 •Franklin Financial formed in 1984 •Headquartered in Chambersburg, PA •22 offices throughout Cumberland, Franklin, Fulton and Huntingdon Counties •$1.028 billion in assets at June 30, 2015 •$736 million in brokerage and trust assets under management FRANKLIN FINANCIAL AND F&M TRUST 4
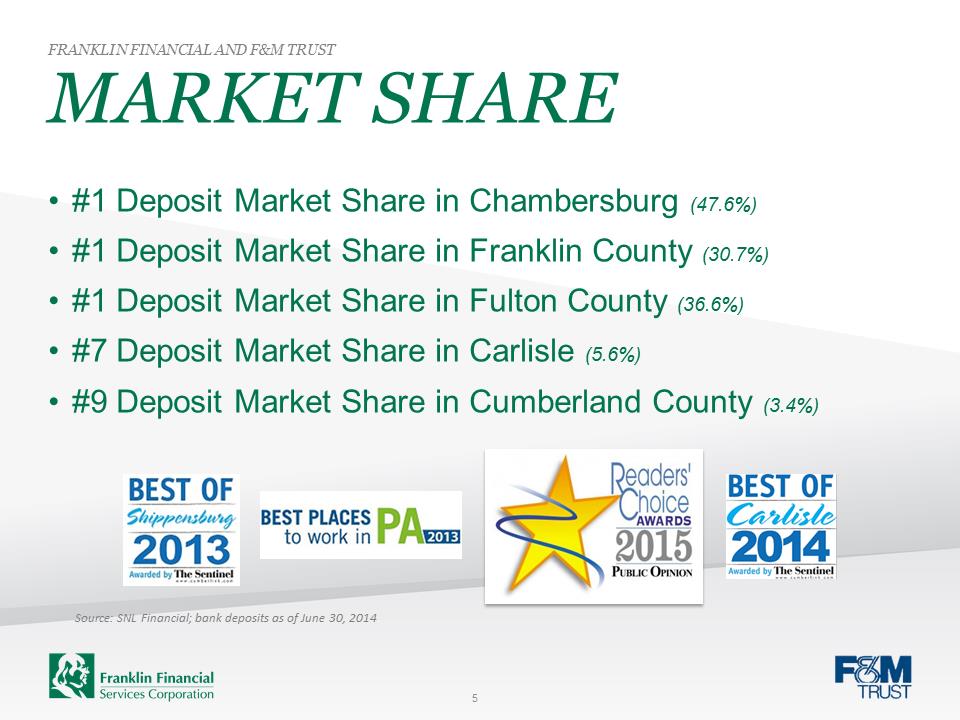 MARKET SHARE •#1 Deposit Market Share in Chambersburg (47.6%) •#1 Deposit Market Share in Franklin County (30.7%) •#1 Deposit Market Share in Fulton County (36.6%) •#7 Deposit Market Share in Carlisle (5.6%) •#9 Deposit Market Share in Cumberland County (3.4%) Source: SNL Financial; bank deposits as of June 30, 2014 FRANKLIN FINANCIAL AND F&M TRUST 5
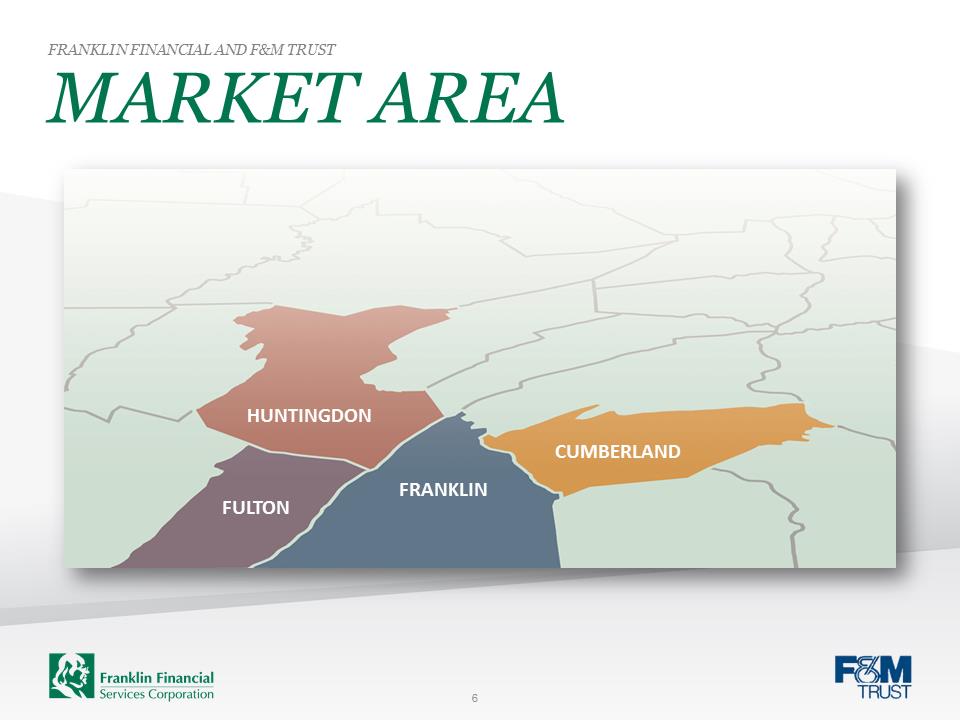 FULTON FRANKLIN CUMBERLAND HUNTINGDON MARKET AREA FRANKLIN FINANCIAL AND F&M TRUST 6
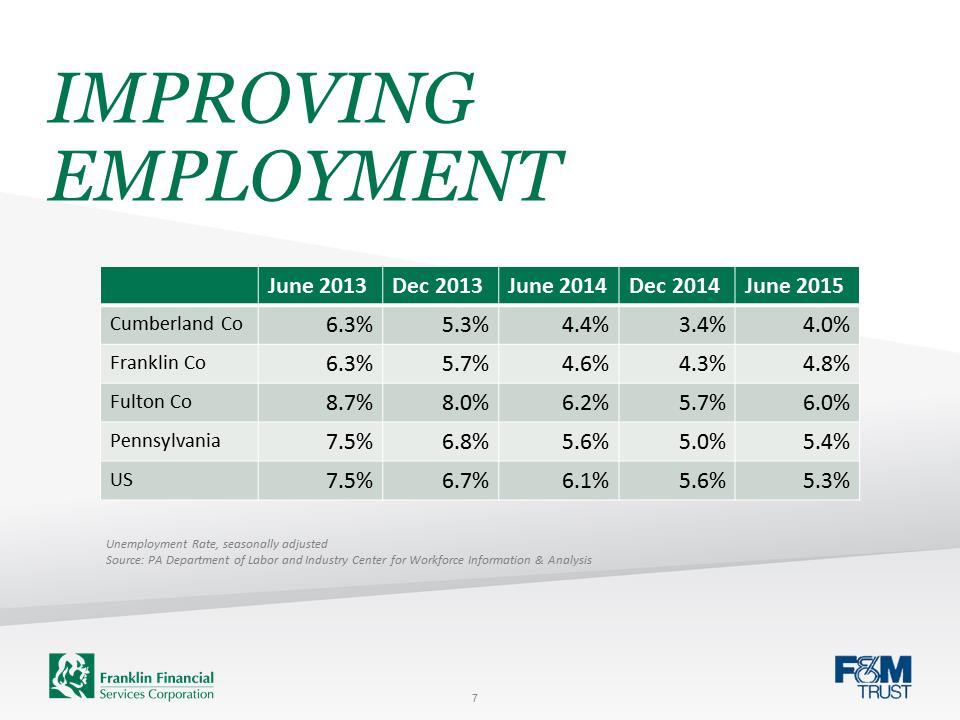 IMPROVING EMPLOYMENT 7 June 2013 Dec 2013 June 2014 Dec 2014 June 2015 Cumberland Co 6.3% 5.3% 4.4% 3.4% 4.0% Franklin Co 6.3% 5.7% 4.6% 4.3% 4.8% Fulton Co 8.7% 8.0% 6.2% 5.7% 6.0% Pennsylvania 7.5% 6.8% 5.6% 5.0% 5.4% US 7.5% 6.7% 6.1% 5.6% 5.3% Unemployment Rate, seasonally adjusted Source: PA Department of Labor and Industry Center for Workforce Information & Analysis
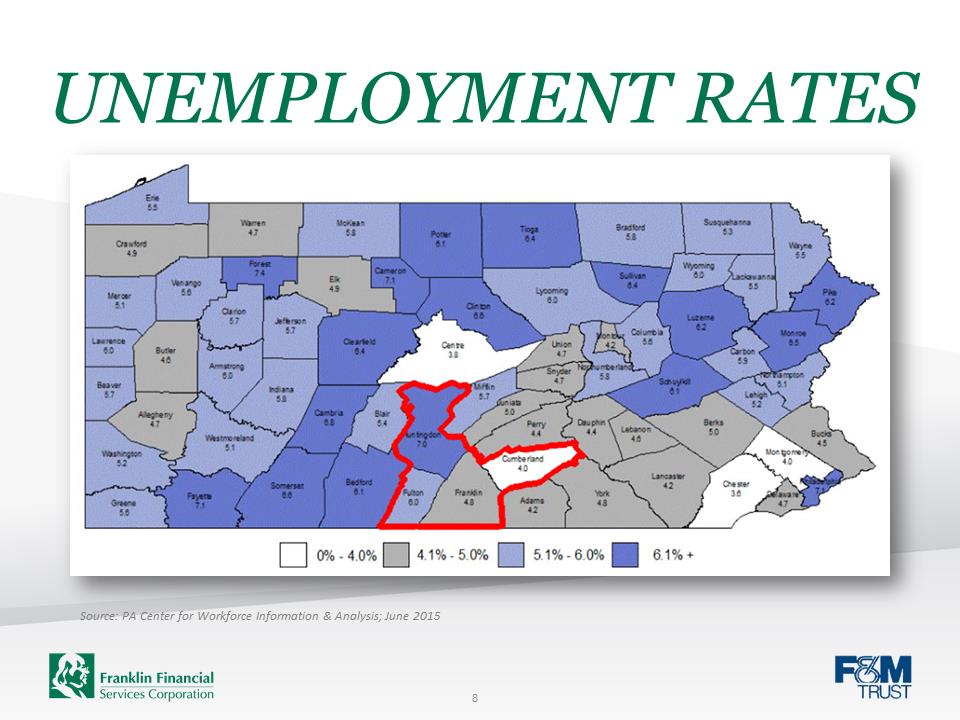 UNEMPLOYMENT RATES 8
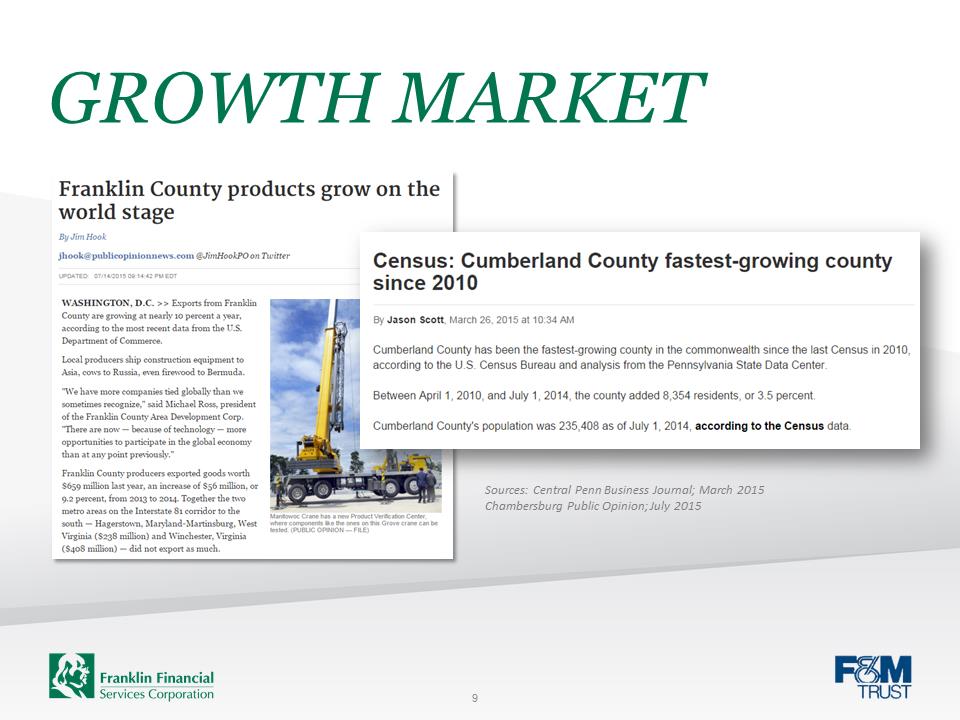 GROWTH MARKET 9
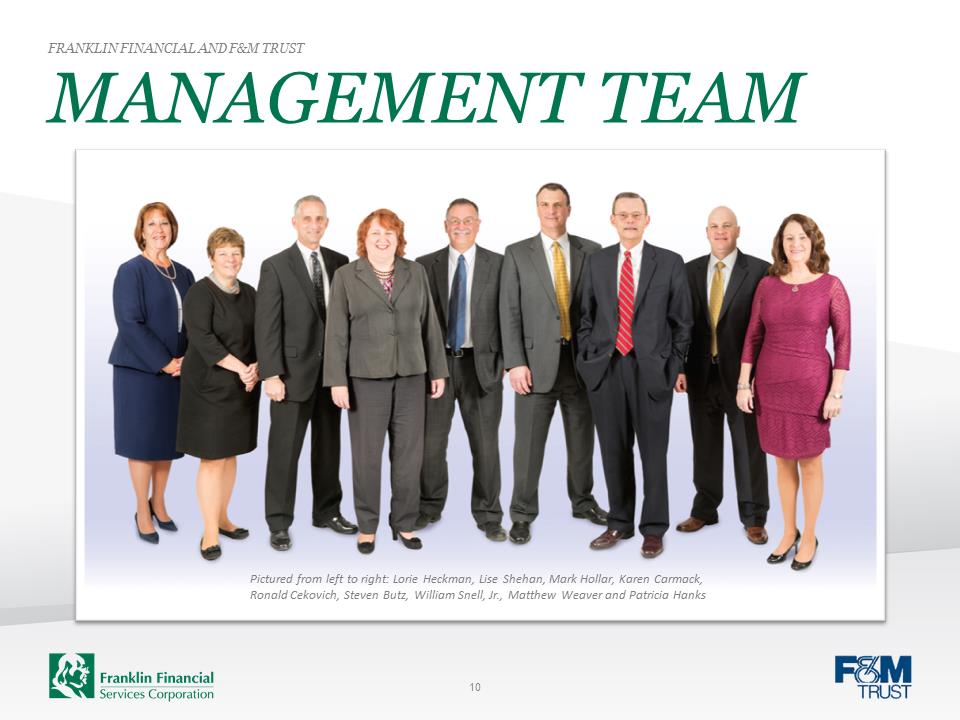 InteriorSlide-Franklin-logo-green-01.pngInterior-slide-FM-logo-blue.pngMANAGEMENT TEAM FRANKLIN FINANCIAL AND F&M TRUST 10 Pictured from left to right: Lorie Heckman, Lise Shehan, Mark Hollar, Karen Carmack, Ronald Cekovich, Steven Butz, William Snell, Jr., Matthew Weaver and Patricia Hanks
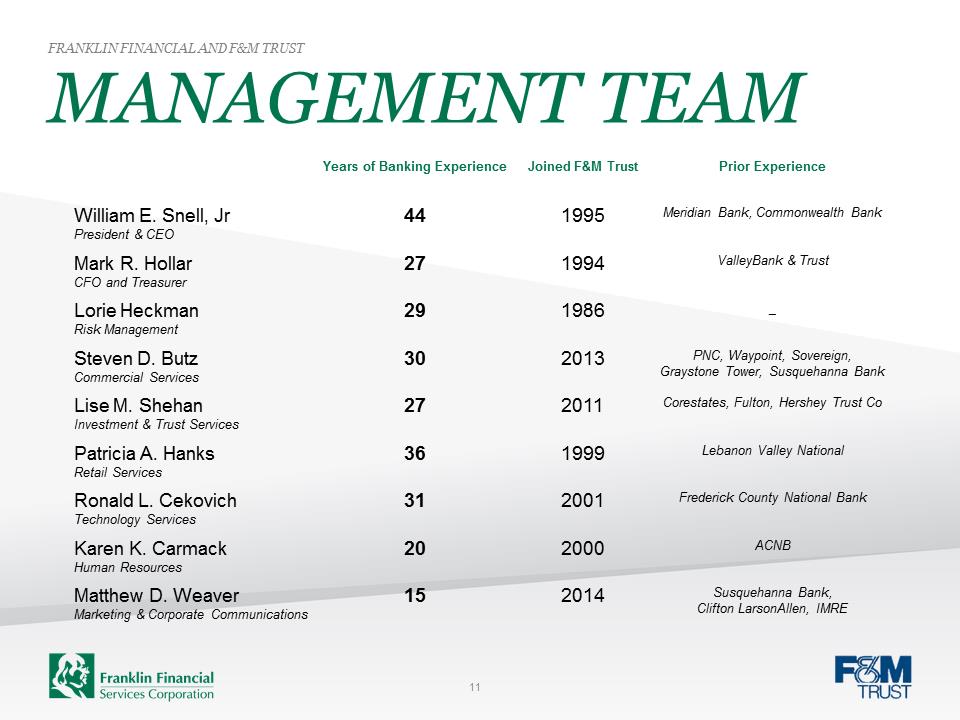 MANAGEMENT TEAM FRANKLIN FINANCIAL AND F&M TRUST Years of Banking Experience Joined F&M Trust Prior Experience William E. Snell, Jr President & CEO 44 1995 Meridian Bank, Commonwealth Bank Mark R. Hollar CFO and Treasurer 27 1994 ValleyBank & Trust Lorie Heckman Risk Management 29 1986 _ Steven D. Butz Commercial Services 30 2013 PNC, Waypoint, Sovereign, Graystone Tower, Susquehanna Bank Lise M. Shehan Investment & Trust Services 27 2011 Corestates, Fulton, Hershey Trust Co Patricia A. Hanks Retail Services 36 1999 Lebanon Valley National Ronald L. Cekovich Technology Services 31 2001 Frederick County National Bank Karen K. Carmack Human Resources 20 2000 ACNB Matthew D. Weaver Marketing & Corporate Communications 15 2014 Susquehanna Bank, Clifton LarsonAllen, IMRE 11
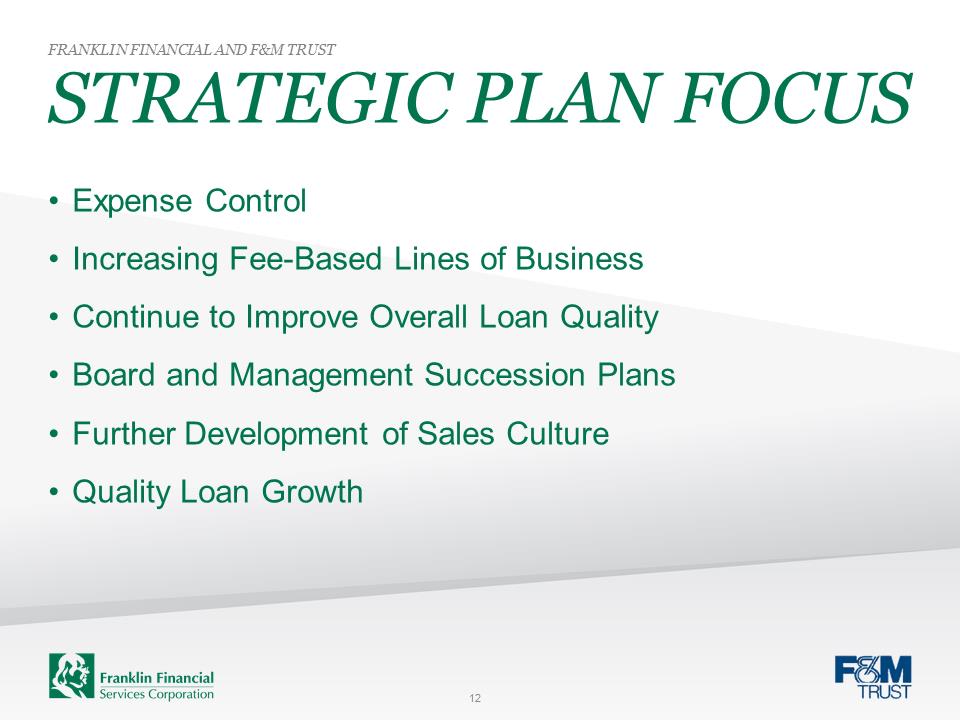 STRATEGIC PLAN FOCUS FRANKLIN FINANCIAL AND F&M TRUST 12 •Expense Control •Increasing Fee-Based Lines of Business •Continue to Improve Overall Loan Quality •Board and Management Succession Plans •Further Development of Sales Culture •Quality Loan Growth
 EXPENSE CONTROL
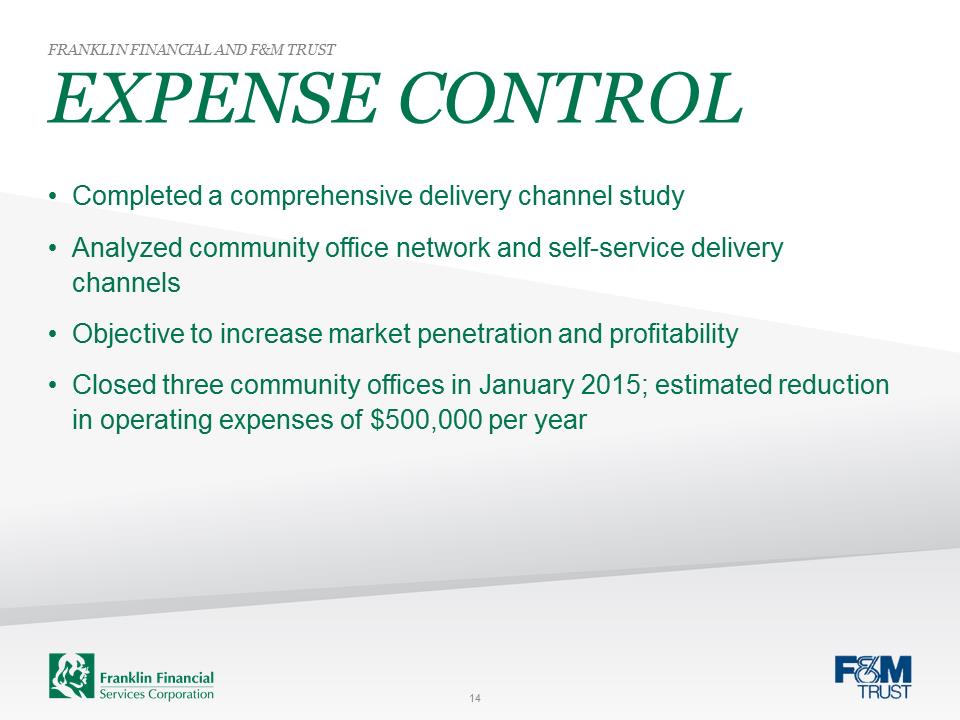 InteriorSlide-Franklin-logo-green-01.pngInterior-slide-FM-logo-blue.pngEXPENSE CONTROL FRANKLIN FINANCIAL AND F&M TRUST 14 •Completed a comprehensive delivery channel study •Analyzed community office network and self-service delivery channels •Objective to increase market penetration and profitability •Closed three community offices in January 2015; estimated reduction in operating expenses of $500,000 per year
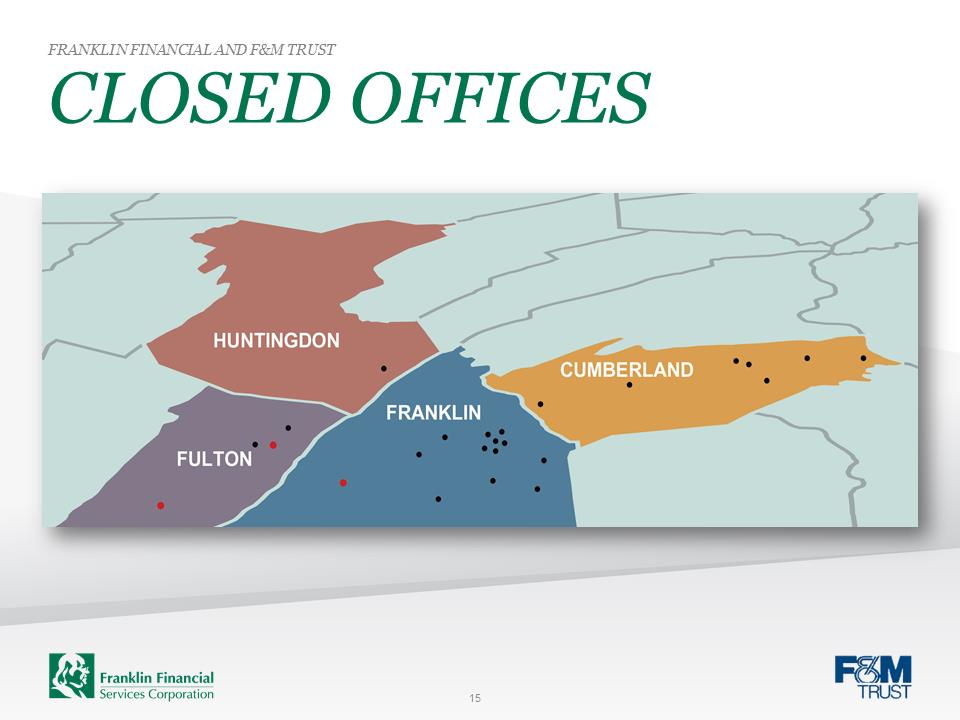 CLOSED OFFICES FRANKLIN FINANCIAL AND F&M TRUST 15
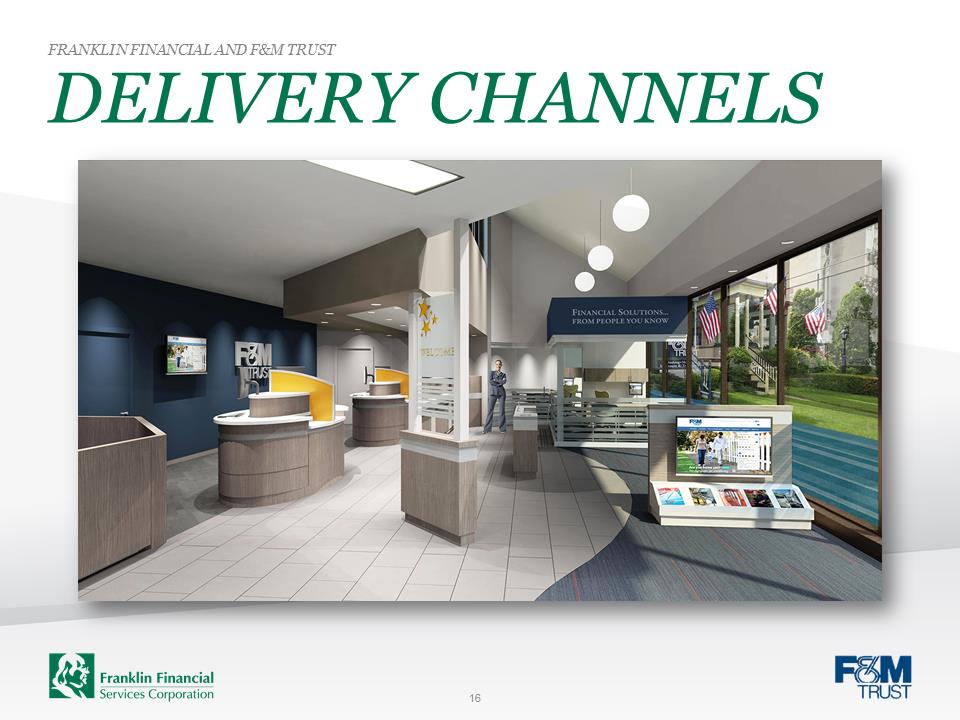 DELIVERY CHANNELS FRANKLIN FINANCIAL AND F&M TRUST 16
 INCREASING FEE-BASED LINES OF BUSINESS
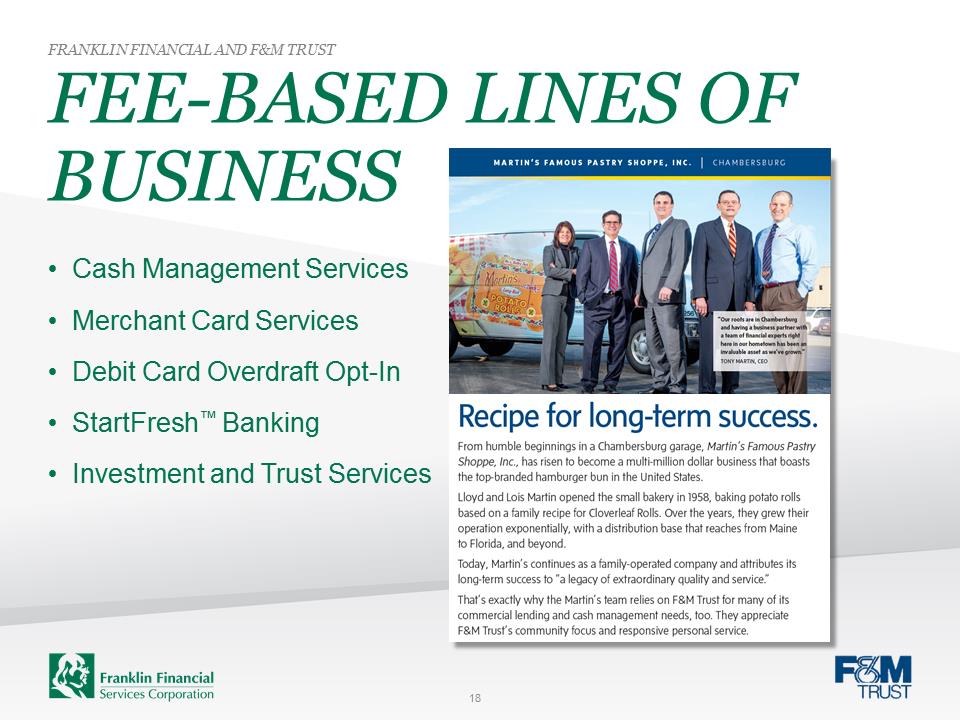 FEE-BASED LINES OF BUSINESS FRANKLIN FINANCIAL AND F&M TRUST 18 •Cash Management Services •Merchant Card Services •Debit Card Overdraft Opt-In •StartFresh™ Banking •Investment and Trust Services
 INVESTMENT & TRUST SERVICES •Trust powers since our incorporation in 1906 •Fully integrated trust, investment, insurance and brokerage services, focused exclusively on client needs •Operating profitability ratio of 31.7%* •Fee income increased by 20.9% for the first six months of 2015 •Strategic focus on the West Shore region of Cumberland County – addition of Bruce Smith as Regional Market Manager FRANKLIN FINANCIAL AND F&M TRUST 19 *Source: TRUSTCOMPARE®; Pohl Consulting & Training, Inc.; data as of December 31, 2014
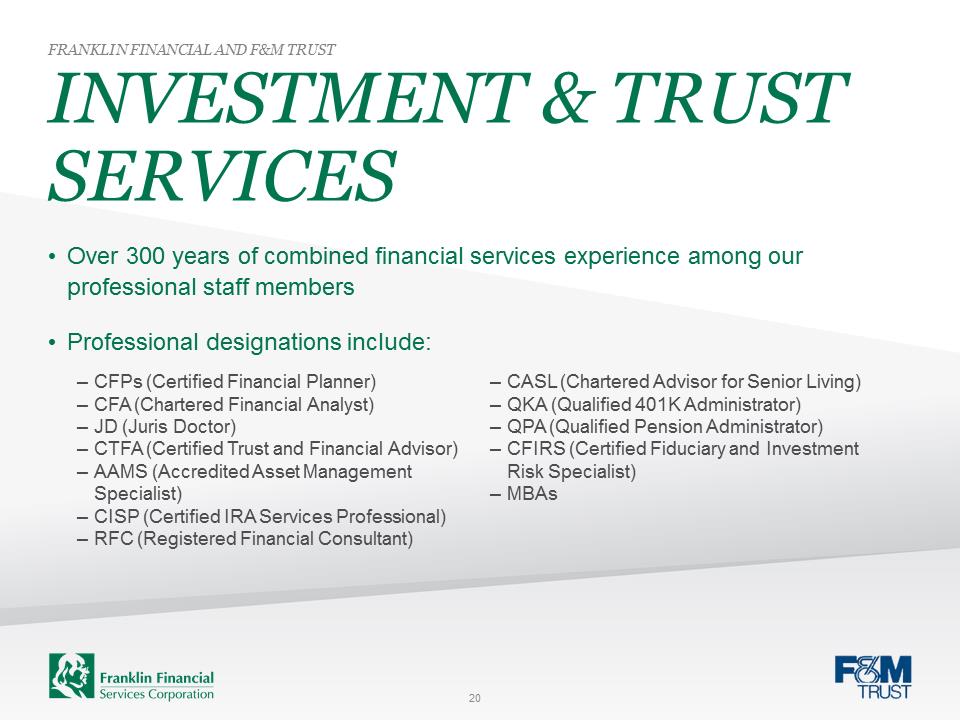 InteriorSlide-Franklin-logo-green-01.pngInterior-slide-FM-logo-blue.pngINVESTMENT & TRUST SERVICES •Over 300 years of combined financial services experience among our professional staff members •Professional designations include: FRANKLIN FINANCIAL AND F&M TRUST 20 –CFPs (Certified Financial Planner) –CFA (Chartered Financial Analyst) –JD (Juris Doctor) –CTFA (Certified Trust and Financial Advisor) –AAMS (Accredited Asset Management Specialist) –CISP (Certified IRA Services Professional) –RFC (Registered Financial Consultant) –CASL (Chartered Advisor for Senior Living) –QKA (Qualified 401K Administrator) –QPA (Qualified Pension Administrator) –CFIRS (Certified Fiduciary and Investment Risk Specialist) –MBAs

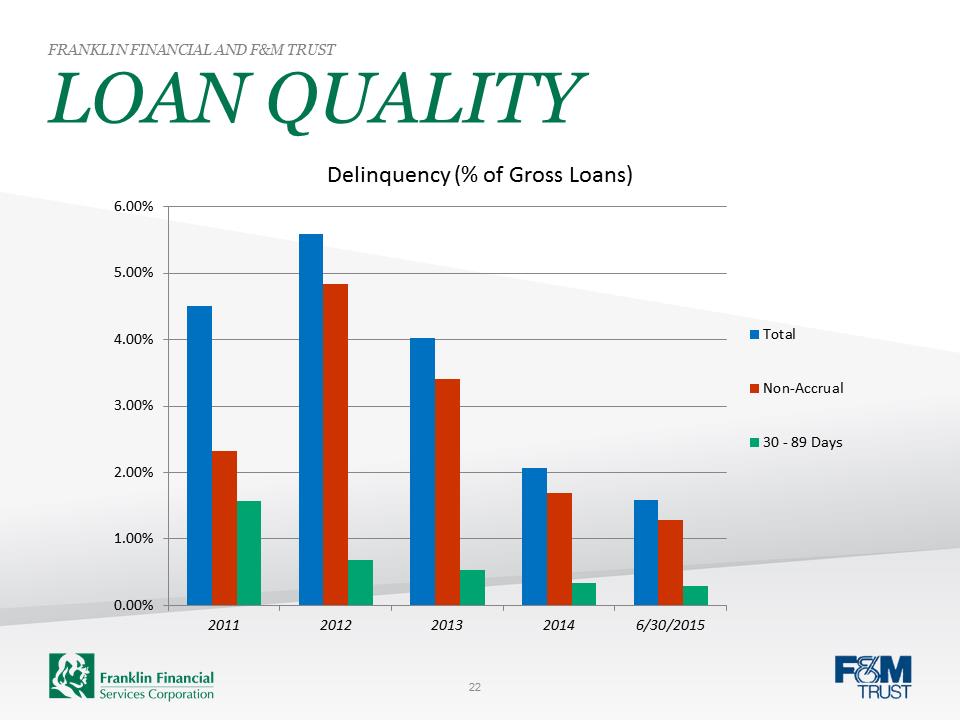 LOAN QUALITY FRANKLIN FINANCIAL AND F&M TRUST 0.00%1.00%2.00%3.00%4.00%5.00%6.00%20112012201320146/30/2015Delinquency (% of Gross Loans) TotalNon-Accrual30 - 89 Days22 CONTINUE TO IMPROVE OVERALL LOAN QUALITY
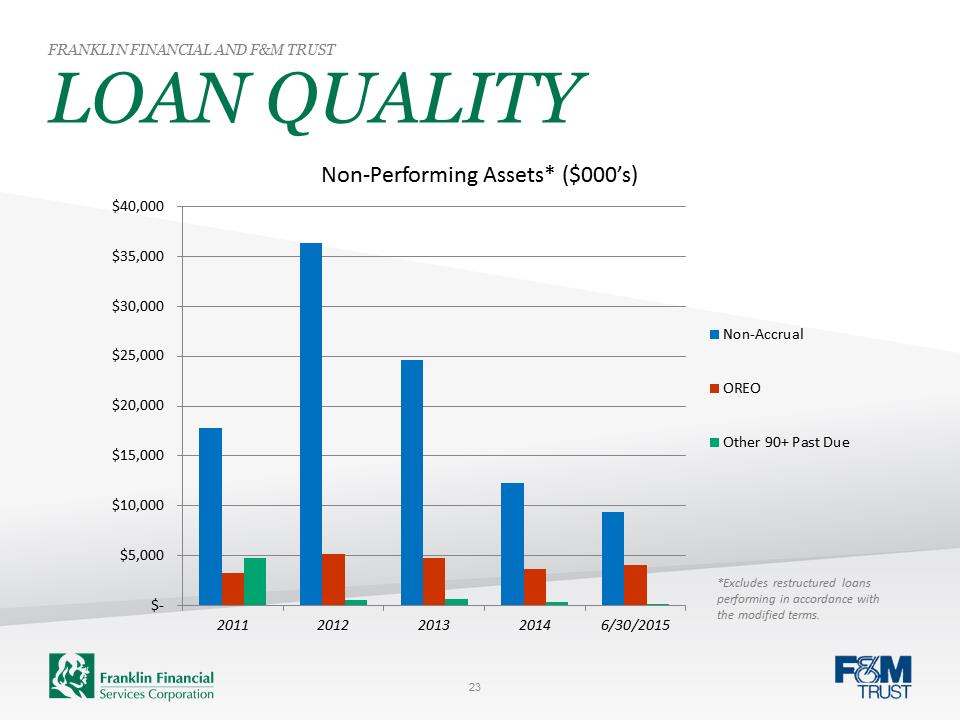 LOAN QUALITY FRANKLIN FINANCIAL AND F&M TRUST $- $5,000 $10,000 $15,000 $20,000 $25,000 $30,000 $35,000 $40,00020112012201320146/30/2015Non-Performing Assets* ($000’s) Non-AccrualOREOOther 90+ Past Due23 *Excludes restructured loans performing in accordance with the modified terms.
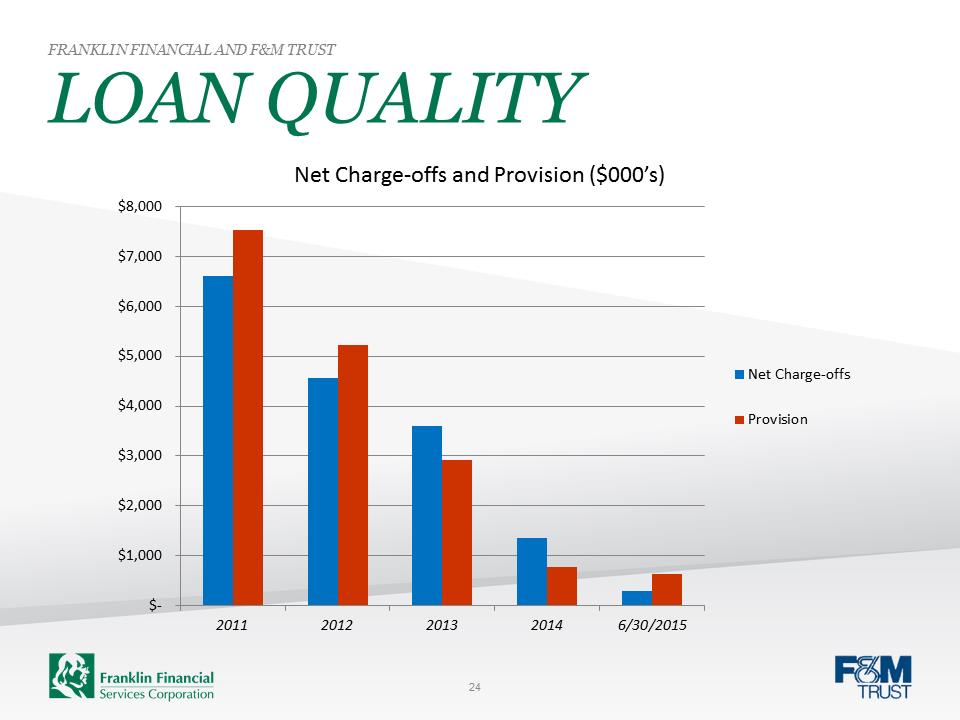 LOAN QUALITY FRANKLIN FINANCIAL AND F&M TRUST $- $1,000 $2,000 $3,000 $4,000 $5,000 $6,000 $7,000 $8,00020112012201320146/30/2015Net Charge-offs and Provision ($000’s) Net Charge-offsProvision24
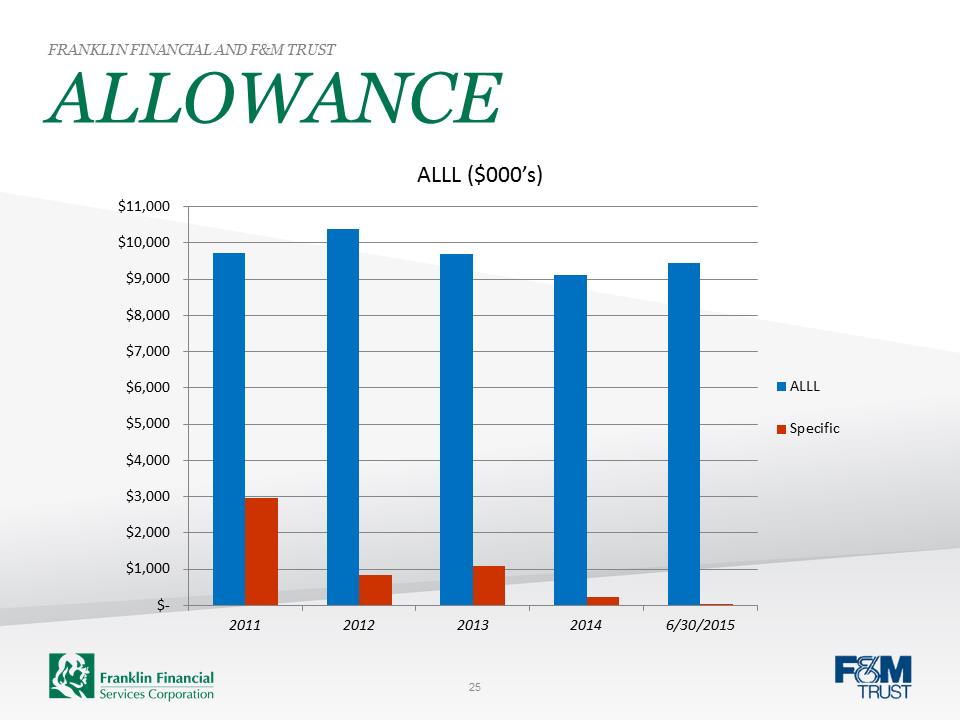 ALLOWANCE FRANKLIN FINANCIAL AND F&M TRUST $- $1,000 $2,000 $3,000 $4,000 $5,000 $6,000 $7,000 $8,000 $9,000 $10,000 $11,00020112012201320146/30/2015ALLL ($000’s) ALLLSpecific25
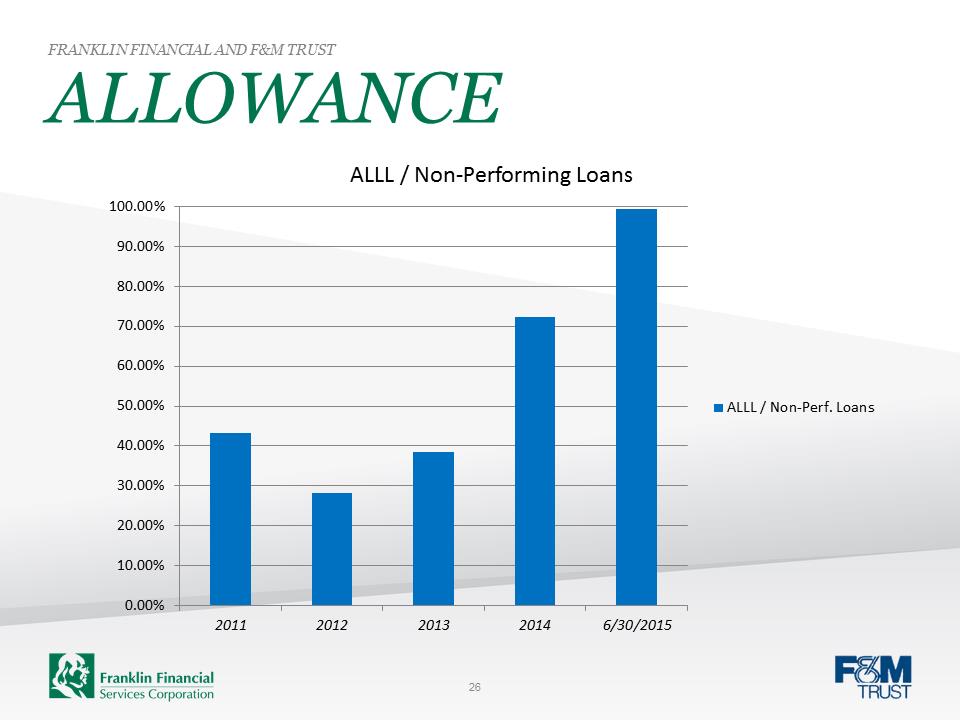 ALLOWANCE FRANKLIN FINANCIAL AND F&M TRUST 0.00%10.00%20.00%30.00%40.00%50.00%60.00%70.00%80.00%90.00%100.00%20112012201320146/30/2015ALLL / Non-Performing Loans ALLL / Non-Perf. Loans26
 BOARD AND MANAGEMENT SUCCESSION PLANS
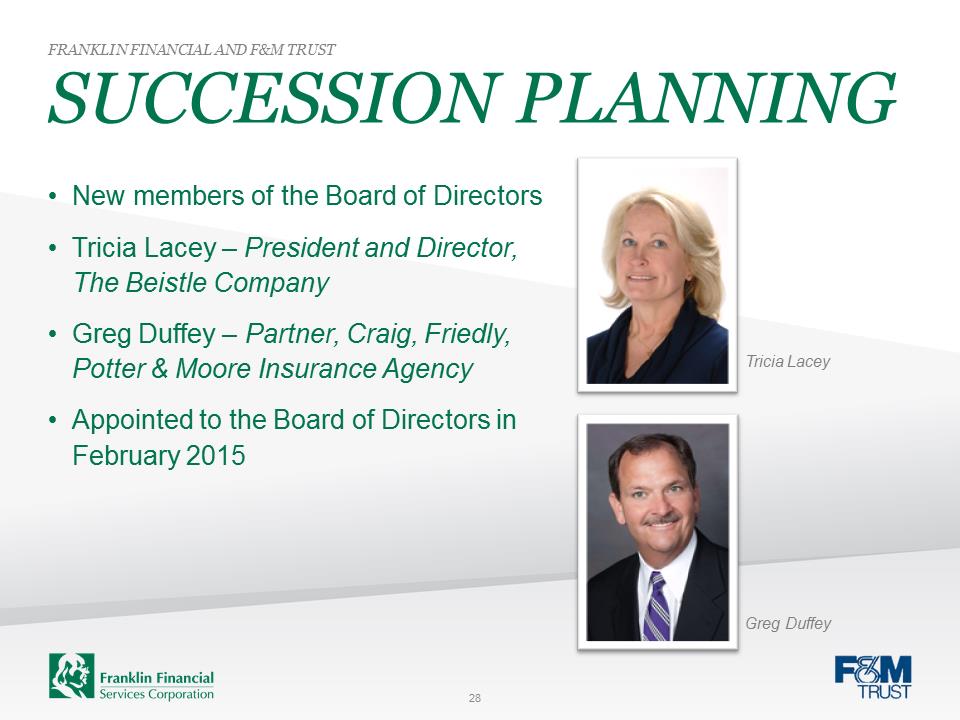 SUCCESSION PLANNING FRANKLIN FINANCIAL AND F&M TRUST 28 Tricia Lacey Greg Duffey •New members of the Board of Directors •Tricia Lacey – President and Director, The Beistle Company •Greg Duffey – Partner, Craig, Friedly, Potter & Moore Insurance Agency •Appointed to the Board of Directors in February 2015
 FURTHER DEVELOPMENT OF SALES CULTURE
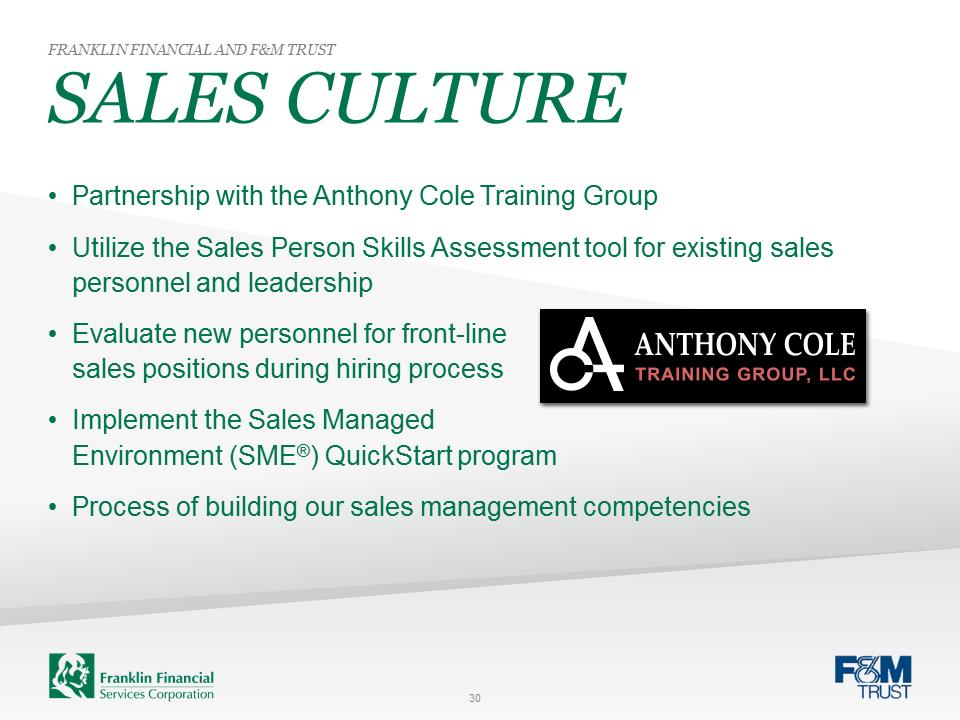 SALES CULTURE FRANKLIN FINANCIAL AND F&M TRUST 30 •Partnership with the Anthony Cole Training Group •Utilize the Sales Person Skills Assessment tool for existing sales personnel and leadership •Evaluate new personnel for front-line sales positions during hiring process •Implement the Sales Managed Environment (SME®) QuickStart program •Process of building our sales management competencies
 QUALITY LOAN GROWTH
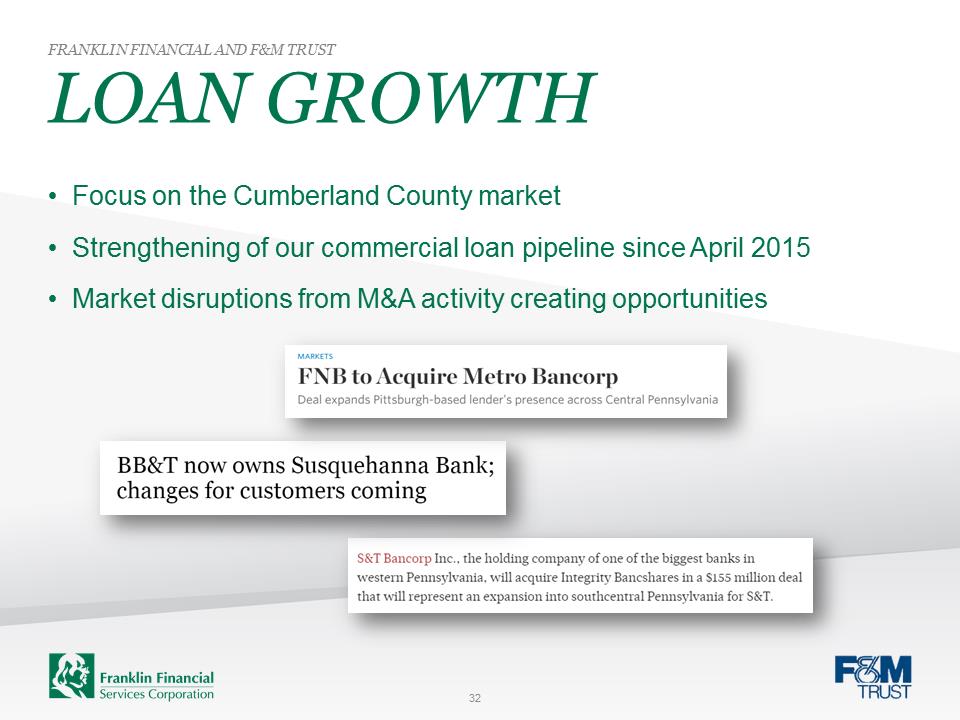 LOAN GROWTH FRANKLIN FINANCIAL AND F&M TRUST 32 •Focus on the Cumberland County market •Strengthening of our commercial loan pipeline since April 2015 •Market disruptions from M&A activity creating opportunities
 NEW PRODUCTS
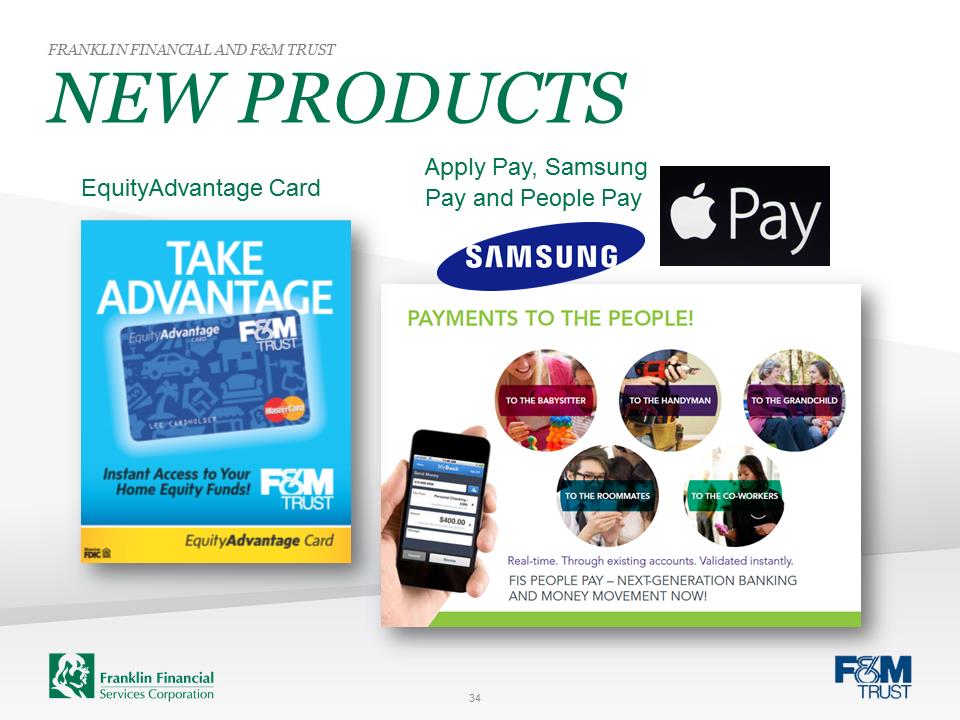 http://uploads.webflow.com/54d241baa59e05340ae1f500/552e7ce78f4602c87dfca1ab_Samsung.pngNEW PRODUCTS FRANKLIN FINANCIAL AND F&M TRUST 34 EquityAdvantage Card http://mobileidworld.com/assets/Apple-Pay-1.jpgApply Pay, Samsung Pay and People Pay
 INVESTOR RELATIONS
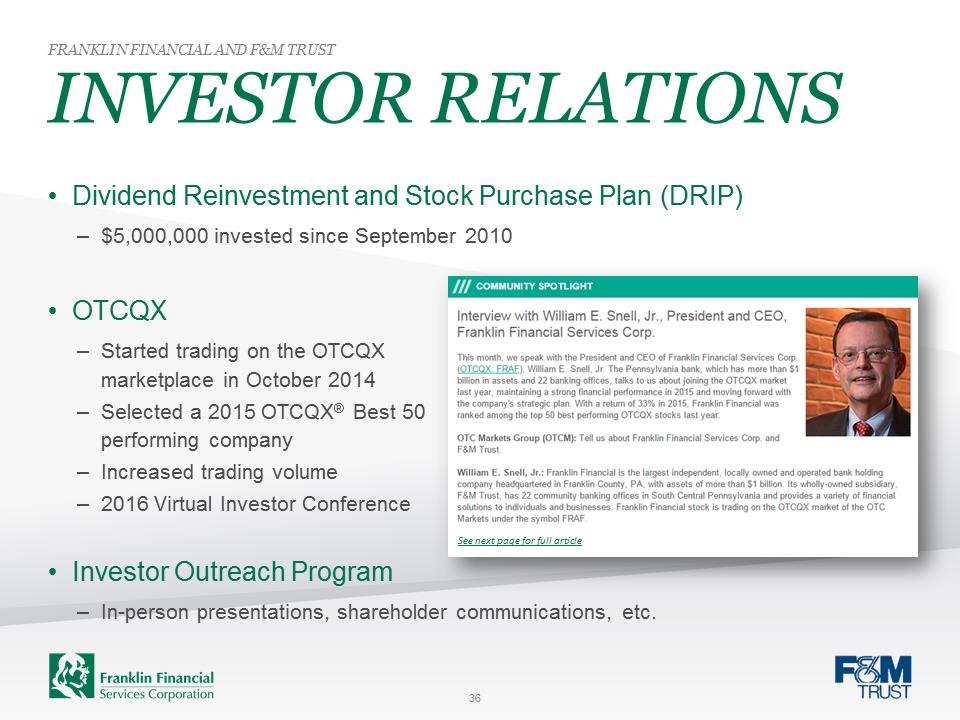 INVESTOR RELATIONS FRANKLIN FINANCIAL AND F&M TRUST 36 •Dividend Reinvestment and Stock Purchase Plan (DRIP) –$5,000,000 invested since September 2010 •OTCQX –Started trading on the OTCQX marketplace in October 2014 –Selected a 2015 OTCQX® Best 50 performing company –Increased trading volume –2016 Virtual Investor Conference •Investor Outreach Program –In-person presentations, shareholder communications, etc. See next page for full article
 37 Get to Know Your Community: Interview with William E. Snell, Jr., President and CEO, Franklin Financial Services Corp. This month, we speak with the President and CEO of Franklin Financial Services Corp (OTCQX: FRAF), William E. Snell, Jr. The Pennsylvania bank, which has more than $1 billion in assets and 22 banking offices, talks to us about joining the OTCQX market last year, maintaining a strong financial performance in 2015 and moving forward with the company's strategic plan. With a return of 33% in 2015, Franklin Financial was ranked among the top 50 best performing OTCQX stocks last year. OTC Markets Group (OTCM): Tell us about Franklin Financial Services Corp. and F&M Trust. Mr. Snell: Franklin Financial is the largest independent, locally owned and operated bank holding company headquartered in Franklin County, PA, with assets of more than $1 billion. Its wholly-owned subsidiary, F&M Trust, has 22 community banking offices in South Central Pennsylvania and provides a variety of financial solutions to individuals and businesses. Franklin Financial stock is trading on the OTCQX market of the OTC Markets under the symbol FRAF. OTCM: What differentiates F&M Trust in the south central Pennsylvania market? Mr. Snell: A unique offering as a community bank, we have a long tradition of providing Investment & Trust Services since acquiring fiduciary powers in 1906. F&M Trust maintains nearly $600 million of trust assets under management, excluding an additional $136 million held at third-party brokers. Our Investment & Trust Services fee income totaled $4,575,000 in 2014. For the first six months of 2015, our Investment & Trust Services fee income increased by 20.9%, reflecting the addition of new client relationships and higher market valuations. In addition to our Investment & Trust Services, we are continually working to evolve our financial product and service offerings to meet the banking needs of our customers. We offer a wide array of financial services and technology for both individual customers and businesses such as mobile banking, remote deposit and cash management to name a few. What makes us unique is our ability to not only build relationships with customers, but adapt to their needs. From a financial performance perspective, Franklin Financial is uniquely positioned amongst our peer group due to a higher level of non-interest income and lower cost of deposits. This contributed to our selection as a 2015 OTCQX Best 50 performing company. July 2015 Newsletter
 38 Continued from previous page OTCM: Franklin Financial upgraded its stock to trade on the OTCQX market last October. What caused you to make that move and what do you see are the benefits of trading on a premium market with high financial and disclosure standards? Mr. Snell: We believe OTCQX will provide better visibility and exposure to Franklin Financial and ultimately improve the liquidity of our stock. Since joining the market last year, we have observed an increase in trading volume when news is released about our financial performance. OTCM: You were ranked among the top 50 best performing OTCQX stocks last year with a total return of 33%. Why do you think you have been so successful? Mr. Snell: Our financial performance has remained strong despite the low interest rate environment and costs associated with additional regulation. We attribute our success to focusing on three key areas: expense control, increasing fee-based lines of business and strengthening our overall loan quality. As a result, earnings increased last year by nearly 35% over the previous year and remain strong in 2015. We reported earnings of $2,884,000 for the first quarter of this year, which represents a 58% increase when compared to first quarter earnings in 2014. Our first quarter 2015 earnings were enhanced by two nonrecurring events that increased noninterest income by $899,000. These events included a gain of $171,000 from the liquidation of an off-shore insurance company in which the Bank held an ownership interest and a $728,000 gain on the conversion of equity securities held by the Bank as the result of an acquisition. Without these events, earnings for the quarter would have been $2,290,000, which still represents a 25% increase over 2014. Earnings for the second quarter of 2015 increased by 6.7% over last year, and for the first six months of 2015 increased 29.3% to $5,358,000 compared with the same period in 2014. Our adjusted earnings for the first six months of 2015 were $4,764,000, without the nonrecurring events, an increase of 14.9% over the previous year. OTCM: What is your strategy for growing your shareholder base and communicating with investors? Mr. Snell: Our strategy to grow our shareholder base and communicate with investors is a multifaceted approach. We will rely heavily on our partnership with OTCQX and leverage the opportunities provided to tell our story. For example, we are planning to participate in an upcoming community bank “Virtual Investor Conference”, which is a perfect environment to share information about Franklin Financial with a broad investor audience. July 2015 Newsletter
 39 Continued from previous page Additionally, we are in the process of developing an outreach program that will specifically target local investors through a number of channels. The program will include participation in investor forums, in-person presentations, public relations and shareholder communications. We believe this strategy will elevate our status as a top-performing community bank within the investor community. Another very important aspect of our shareholder relations program is our Dividend Reinvestment and Stock Purchase Plan. The plan provides shareholders with a convenient and economical way to purchase additional shares of Franklin Financial common stock by reinvesting cash dividends paid on their shares or through optional cash payments. Since amendments were made to the plan in September 2010 to enhance our capital adequacy, in excess of $5,000,000 has been invested. We are delighted with the response received from shareholders, many of which are new to Franklin Financial, both in terms of participation and the increase in the level of voluntary cash contributions. Shareholders can find more information about the Dividend Reinvestment Plan (DRIP) and Franklin Financial by visiting our website at www.franklinfin.com. OTCM: What else do you want shareholders to know about your company? Mr. Snell: We are committed to earning the right to stay independent by building long-term shareholder value. To that end, we have historically paid a dividend to shareholders and recently increased our dividend for the second quarter of 2015 by 11.8% over the same period in 2014. Our current annualized dividend yield is 2.91% based on the closing stock price as of March 31, 2015. We continue to make progress in a number of areas related to our strategic plan, specifically the development of a sales culture. As we move forward with this initiative, we are transforming every aspect of our sales process – from how we identify and hire front-line sales personnel to how we manage and track sales performance. Additionally, we are introducing a branch model that will not only provide a better experience for customers, but will also break down the barriers of traditional banking. Features of the new design include an open floor plan and interactive technology that allows employees to demonstrate products and share information. As a community bank, we take great pride in providing support for the communities we serve. Our employees spend countless hours volunteering at community events and serving on boards and committees with various non-profit organizations. We are also consistently named one of the “Best Places to Work” in Pennsylvania and “Best Bank” in a number of our local markets. July 2015 Newsletter
 FINANCIAL PERFORMANCE
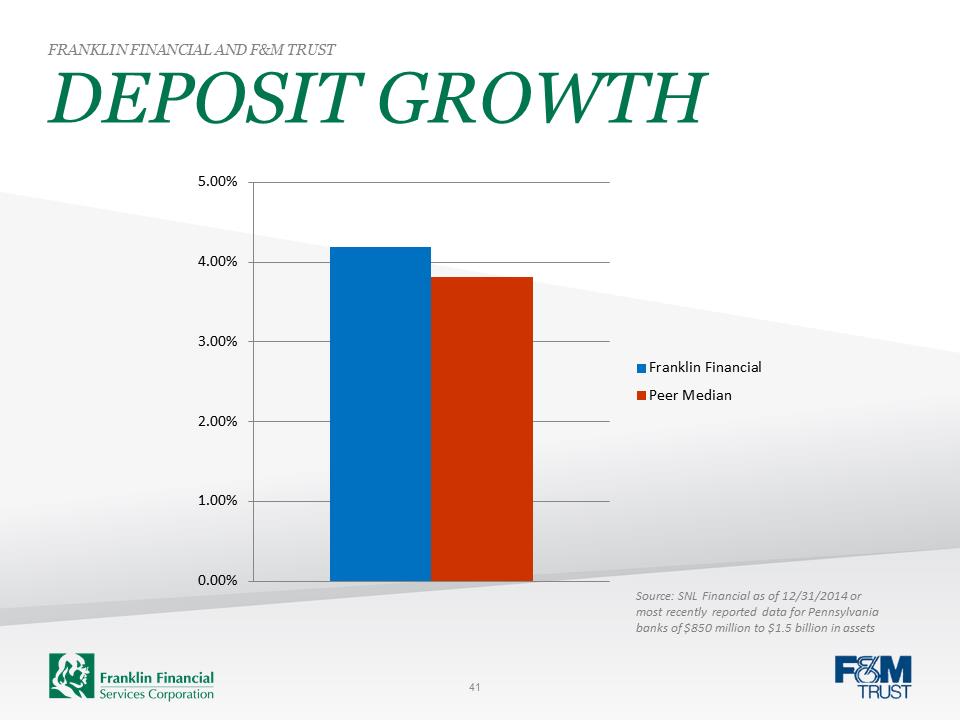 DEPOSIT GROWTH FRANKLIN FINANCIAL AND F&M TRUST 41 Source: SNL Financial as of 12/31/2014 or most recently reported data for Pennsylvania banks of $850 million to $1.5 billion in assets 0.00%1.00%2.00%3.00%4.00%5.00%Franklin FinancialPeer Median
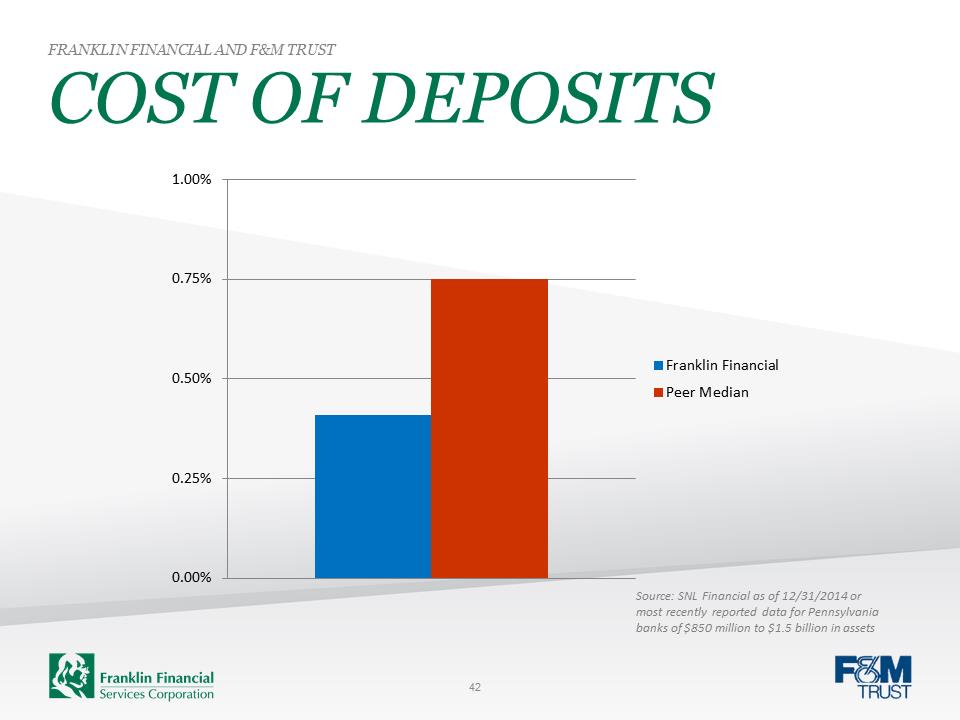 COST OF DEPOSITS FRANKLIN FINANCIAL AND F&M TRUST 42 0.00%0.25%0.50%0.75%1.00%Franklin FinancialPeer MedianSource: SNL Financial as of 12/31/2014 or most recently reported data for Pennsylvania banks of $850 million to $1.5 billion in assets
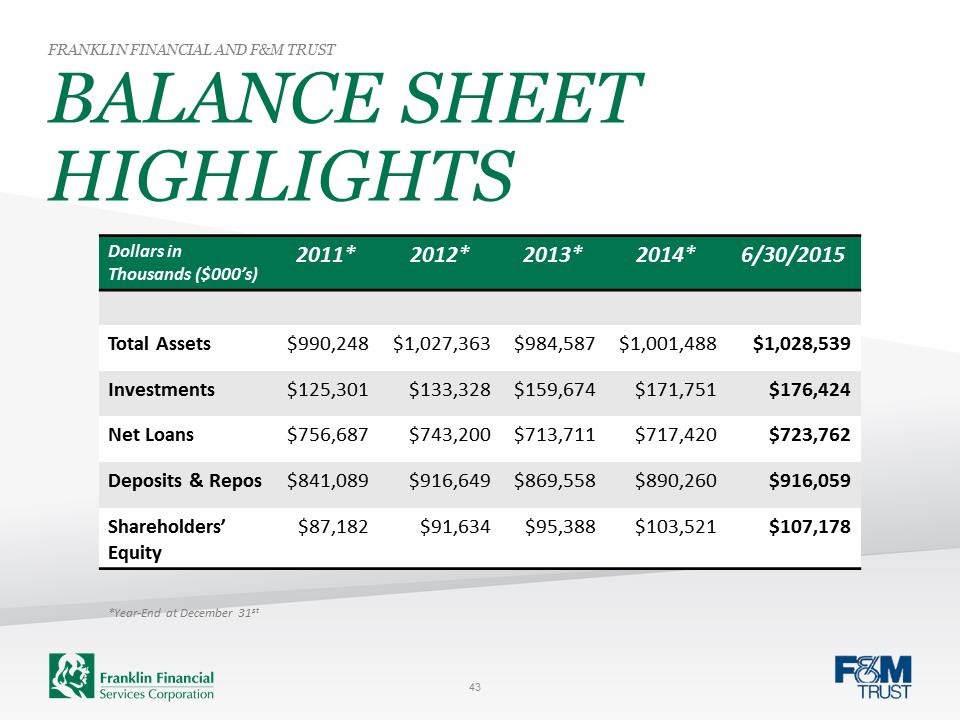 BALANCE SHEET HIGHLIGHTS FRANKLIN FINANCIAL AND F&M TRUST 43 Dollars in Thousands ($000’s) 2011* 2012* 2013* 2014* 6/30/2015 Total Assets $990,248 $1,027,363 $984,587 $1,001,488 $1,028,539 Investments $125,301 $133,328 $159,674 $171,751 $176,424 Net Loans $756,687 $743,200 $713,711 $717,420 $723,762 Deposits & Repos $841,089 $916,649 $869,558 $890,260 $916,059 Shareholders’ Equity $87,182 $91,634 $95,388 $103,521 $107,178 *Year-End at December 31st
 FINANCIAL HIGHLIGHTS FRANKLIN FINANCIAL AND F&M TRUST 44 Dollars in Thousands ($000’s) 2011 2012 2013 2014 6/30/2015 Net Interest Income $32,637 $32,252 $31,664 $31,614 $15,845 Provision $7,524 $5,225 $2,920 $764 $635 Noninterest Income $10,200 $9,451 $9,877 $10,861 $6,770 Noninterest Expense $28,333 $30,601 $31,094 $31,303 $15,150 Income before Taxes $6,980 $5,877 $7,527 $10,408 $6,830 Income Tax $411 $512 $1,295 $2,006 $1,472 Net Income $6,569 $5,365 $6,232 $8,402 $5,358
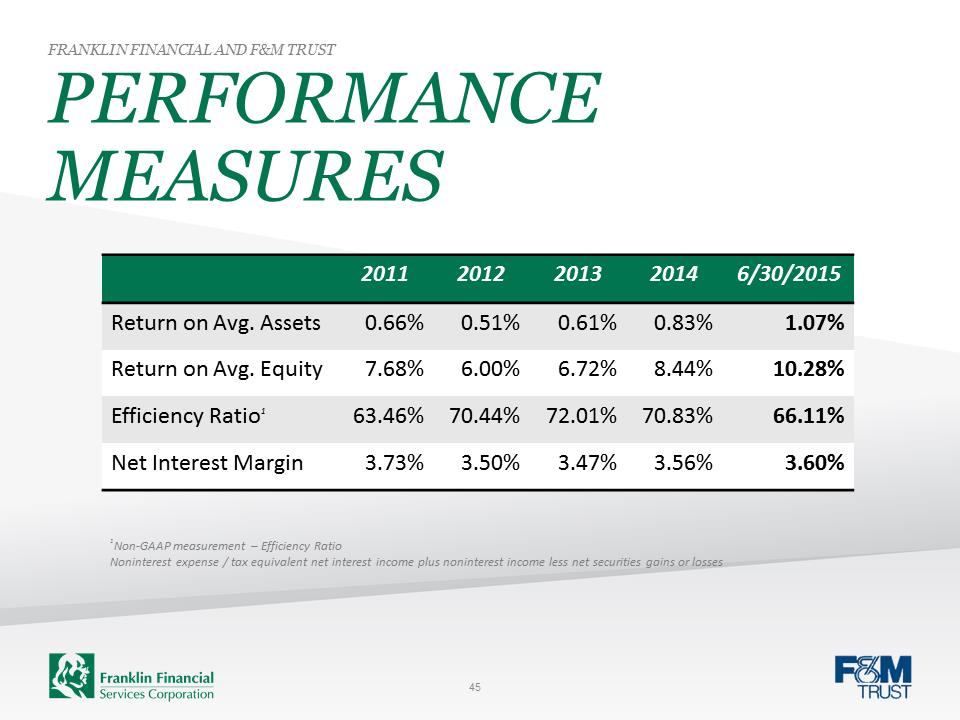 PERFORMANCE MEASURES FRANKLIN FINANCIAL AND F&M TRUST 45 2011 2012 2013 2014 6/30/2015 Return on Avg. Assets 0.66% 0.51% 0.61% 0.83% 1.07% Return on Avg. Equity 7.68% 6.00% 6.72% 8.44% 10.28% Efficiency Ratio1 63.46% 70.44% 72.01% 70.83% 66.11% Net Interest Margin 3.73% 3.50% 3.47% 3.56% 3.60% 1Non-GAAP measurement – Efficiency Ratio Noninterest expense / tax equivalent net interest income plus noninterest income less net securities gains or losses
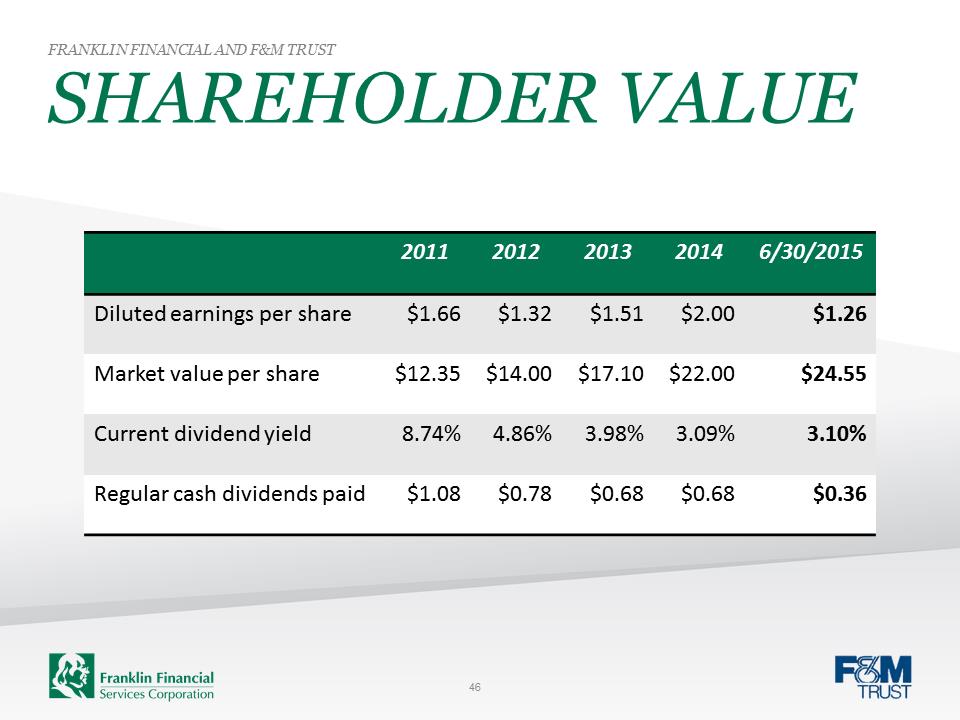 SHAREHOLDER VALUE FRANKLIN FINANCIAL AND F&M TRUST 46 2011 2012 2013 2014 6/30/2015 Diluted earnings per share $1.66 $1.32 $1.51 $2.00 $1.26 Market value per share $12.35 $14.00 $17.10 $22.00 $24.55 Current dividend yield 8.74% 4.86% 3.98% 3.09% 3.10% Regular cash dividends paid $1.08 $0.78 $0.68 $0.68 $0.36
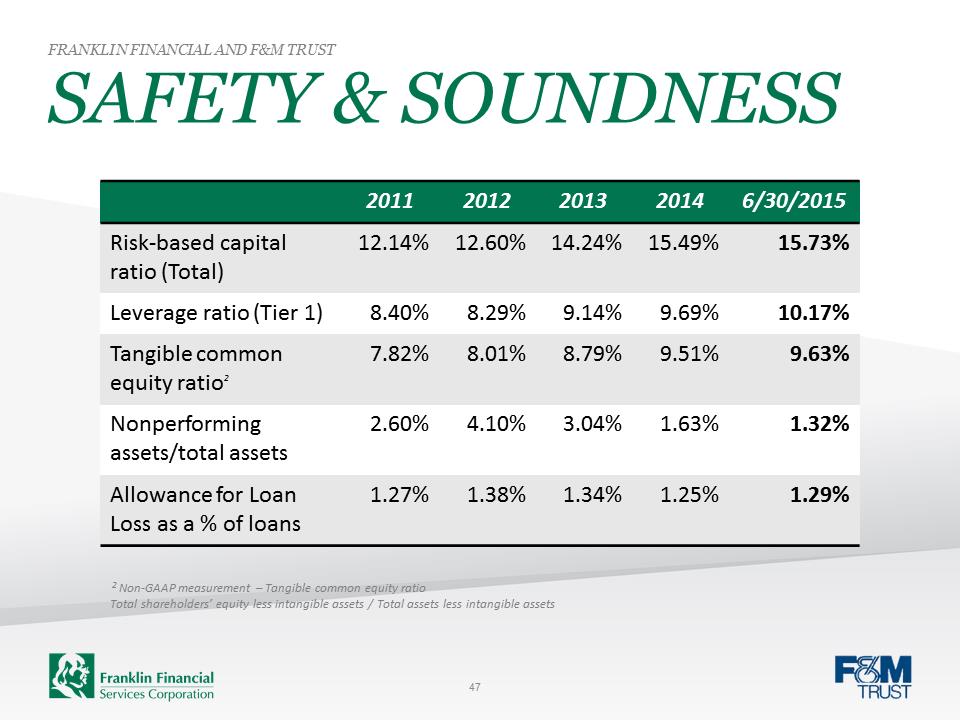 SAFETY & SOUNDNESS FRANKLIN FINANCIAL AND F&M TRUST 47 2011 2012 2013 2014 6/30/2015 Risk-based capital ratio (Total) 12.14% 12.60% 14.24% 15.49% 15.73% Leverage ratio (Tier 1) 8.40% 8.29% 9.14% 9.69% 10.17% Tangible common equity ratio2 7.82% 8.01% 8.79% 9.51% 9.63% Nonperforming assets/total assets 2.60% 4.10% 3.04% 1.63% 1.32% Allowance for Loan Loss as a % of loans 1.27% 1.38% 1.34% 1.25% 1.29% 2 Non-GAAP measurement – Tangible common equity ratio Total shareholders’ equity less intangible assets / Total assets less intangible assets
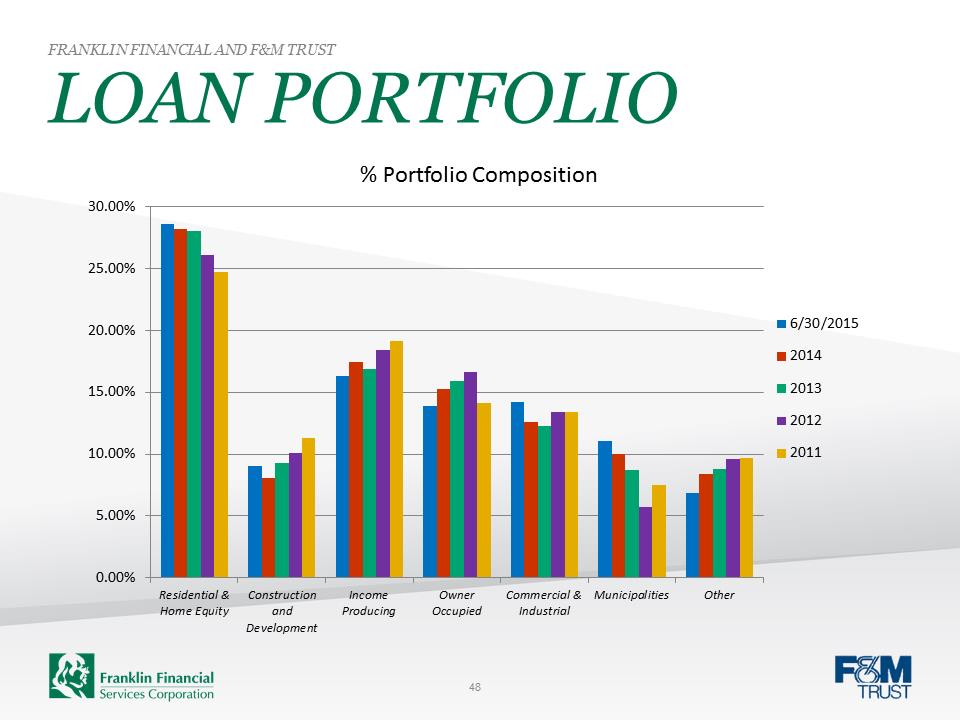 LOAN PORTFOLIO FRANKLIN FINANCIAL AND F&M TRUST 0.00%5.00%10.00%15.00%20.00%25.00%30.00%Residential &Home EquityConstructionandDevelopmentIncomeProducingOwnerOccupiedCommercial &IndustrialMunicipalitiesOther% Portfolio Composition 6/30/2015201420132012201148
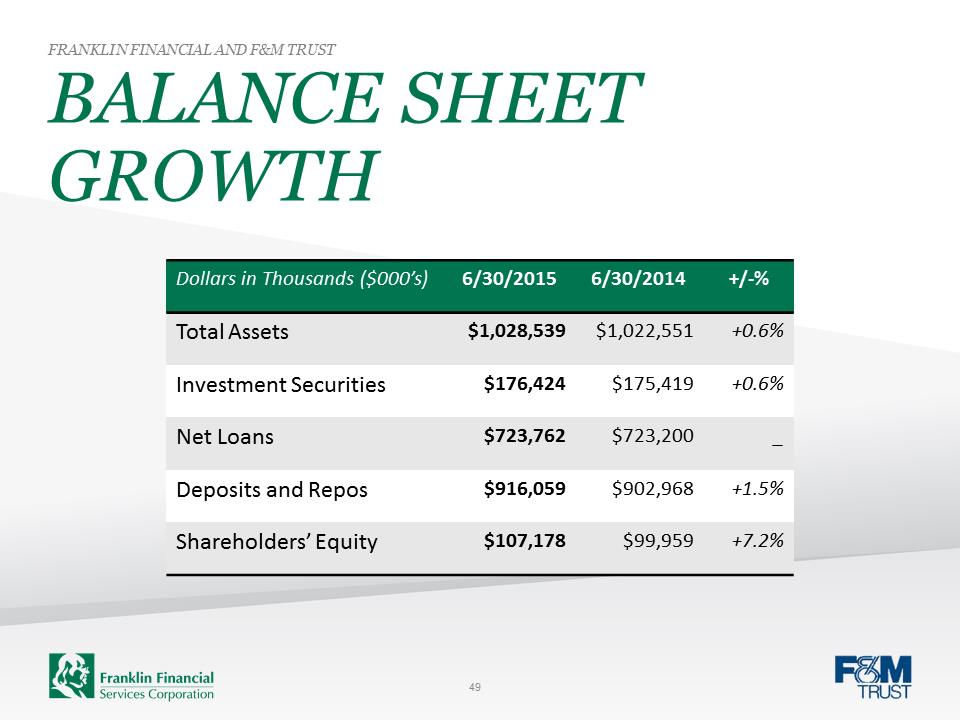 BALANCE SHEET GROWTH FRANKLIN FINANCIAL AND F&M TRUST 49 Dollars in Thousands ($000’s) 6/30/2015 6/30/2014 +/-% Total Assets $1,028,539 $1,022,551 +0.6% Investment Securities $176,424 $175,419 +0.6% Net Loans $723,762 $723,200 _ Deposits and Repos $916,059 $902,968 +1.5% Shareholders’ Equity $107,178 $99,959 +7.2%
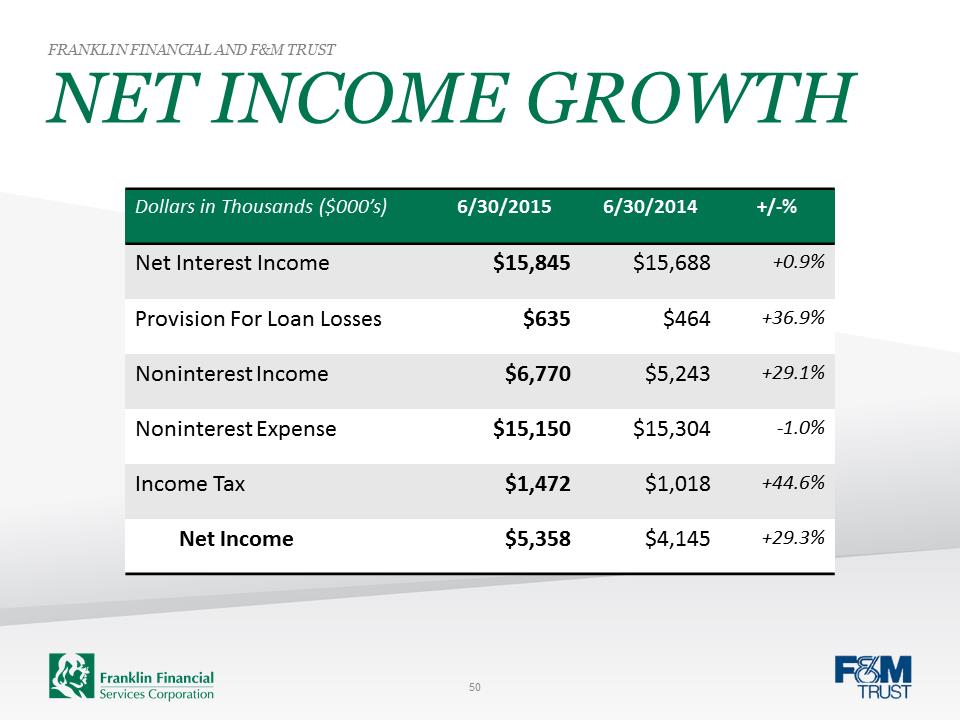 NET INCOME GROWTH FRANKLIN FINANCIAL AND F&M TRUST 50 Dollars in Thousands ($000’s) 6/30/2015 6/30/2014 +/-% Net Interest Income $15,845 $15,688 +0.9% Provision For Loan Losses $635 $464 +36.9% Noninterest Income $6,770 $5,243 +29.1% Noninterest Expense $15,150 $15,304 -1.0% Income Tax $1,472 $1,018 +44.6% Net Income $5,358 $4,145 +29.3%
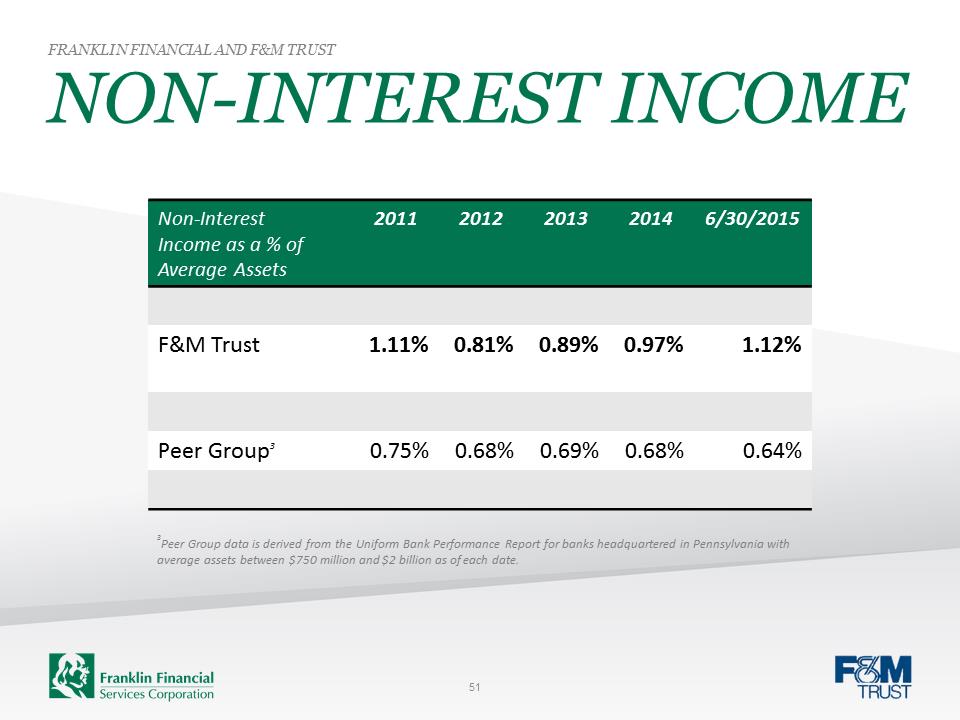 NON-INTEREST INCOME FRANKLIN FINANCIAL AND F&M TRUST 51 Non-Interest Income as a % of Average Assets 2011 2012 2013 2014 6/30/2015 F&M Trust 1.11% 0.81% 0.89% 0.97% 1.12% Peer Group3 0.75% 0.68% 0.69% 0.68% 0.64% 3Peer Group data is derived from the Uniform Bank Performance Report for banks headquartered in Pennsylvania with average assets between $750 million and $2 billion as of each date.
 THANK YOU!
 53 F:\Marketing\Logos and Graphics\FFSC Logo\Franklin Financial logo.jpgStock Symbol: FRAF (OTCQX) www.franklinfin.com www.fmtrustonline.com