Attached files
| file | filename |
|---|---|
| 8-K - CURRENT REPORT - Bright Mountain Media, Inc. | bmaq_8k.htm |

Bright Mountain Acquisition CorporationTalking PointsAugust 13, 2015 Safe Harbor Statement This presentation may contain forward-looking statements that can be identified by terminology such as “believes,” “expects,” “potential,” “plans,” “suggests,” “may,” “should,” “could,” “intends,” or similar expressions. Many forward-looking statements involve known and unknown risks, uncertainties and other factors that may cause actual results to be materially different from any future results or implied by such statements. These factors include, but are not limited to, our limited operating history, managing our expected growth, risks associated with integration of acquired websites, possible inadvertent infringement of third party intellectual property rights, our ability to effectively compete, our acquisition strategy, and a limited public market for our common stock, among other risks. Bright Mountain Acquisition Corporation’s future results may also be impacted by other risk factors listed from time-to-time in its SEC filings. Many factors are difficult to predict accurately and are generally beyond the company’s control. Forward-looking statements speak only as to the date they are made and Bright Mountain Acquisition Corporation does not undertake to update forward-looking statements to reflect circumstances or events that occur after the date the forward-looking statements are made. OTCQB: BMAQ
OVERVIEW Bright Mountain Acquisition Corporation is a media company providing content to the U.S. military and public safety sectors. The company has grown from 1 website in March, 2013 to 20 websites as of July 1, 2015. Total site visitor traffic has grown from 51,000 visitors per quarter to 9,197,000 visitors per quarter in the same time frame. Total website unique visitor traffic has grown from 38,892 per quarter to 6,617,022 per quarter in the same time frame.Bright Mountain Acquisition Corporation mission is dedicated to providing the military and public safety audience places to go online where they can stay current on news and events affecting them, to look for jobs, share information, communicate with the public, and buy products. Our websites feature a robust offering of specifically targeted proprietary content as well as third party content we acquire from a number of sources.Bright Mountain’s business model is similar to Yahoo! In the sense that its websites provide content and e-commerce opportunities to its targeted demographics. OTCQB: BMAQ *

WEBSITES Bootcamp4me.comBootcamp4me.orgBMAQ.comBrightWatches.comCertifiedwolfhunter.comCoastguardnews.comFdcareers.comFireaffairs.comFirefightingnews.comGopoliceblotter.com OTCQB: BMAQ JQPublicblog.comLeoaffairs.comPopularmilitary.comTeacheraffairs.comThebravestonline.comThebright.comWardocumentaryfilms.comWelcomehomeblog.comUsmclife.com360fire.com *

QUARTERLY WEBSITE VISITORS OTCQB: BMAQ *

QUARTERLY WEBSITE UNIQUE VISITORS OTCQB: BMAQ *
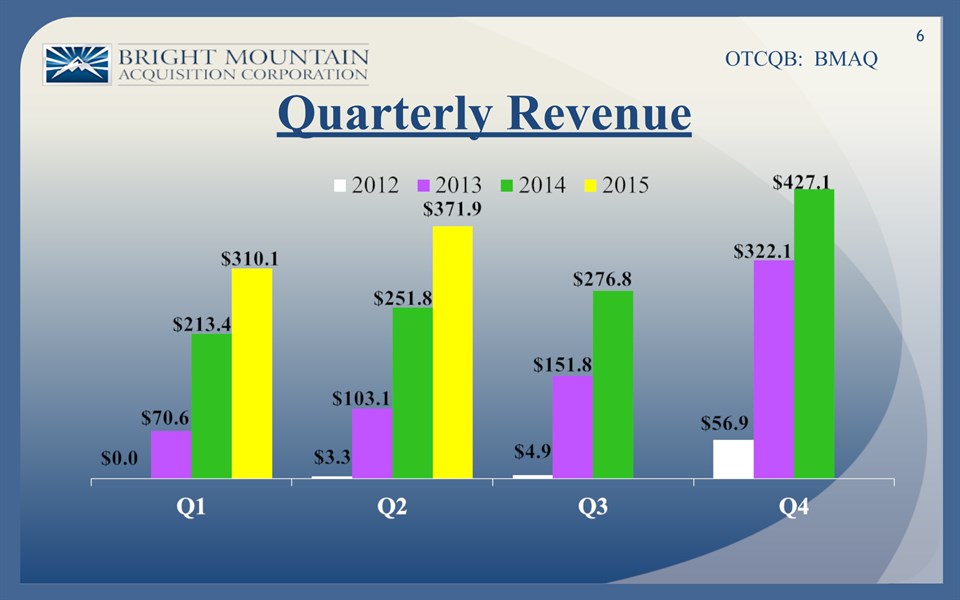
Quarterly Revenue OTCQB: BMAQ *

FINANCIAL & OPERATING RESULTS OTCQB: BMAQ * Results for the Year ended December 31, 2014, as compared to the Year ended December 31, 2013:For the twelve months ended December 31, 2014 revenue increased 81% to $1,169,186, as compared to $647,603 for the same period 2013.Revenue from services, consisting of advertising and subscriptions, increased 1,633% to $118,792, as compared to $6,852 for the same period 2013.Product revenue increased 64% to $1,050,394, as compared to $640,751 for the same period 2013.Website traffic visitors to our sites increased 1,465% to 13,142,000, as compared to 840,000 for the same period 2013 as a result of organic growth and acquisitions.Website traffic unique visitors to our sites increased 1,238% to 8,148,174, as compared to 608,784 for the same period 2013 as a result of organic growth and acquisitions.

NON-GAAP ADJUSTED EBITDA FOR THE YEAR ENDED DECEMBER 31, 2015 AND 2014 * OTCQB: BMAQ For the Year Ended December 31, For the Year Ended December 31, For the Year Ended December 31, For the Year Ended December 31, For the Year Ended December 31, For the Year Ended December 31, 2014 2013 Product Sales $ 1,050,394 $ 640,751 Revenues from Services Revenues from Services 118,792 6,852 Total Revenue 1,169,186 647,603 Cost of sales 820,979 522,926 Gross profit 348,207 124,677 Selling, general and administrative expenses Selling, general and administrative expenses 1,858,634 1,409,318 Loss from operations Loss from operations (1,510,427) (1,284,641) Other income (expense) Other income (expense) Interest income 62 53 Interest expense (271) (12,093) Total other income (expense), net Total other income (expense), net (209) (12,040) Net Loss $ (1,510,636) $ (1,296,681) Stock compensation expense Stock compensation expense $ 69,890 $ 50,829 Depreciation expense Depreciation expense 11,335 8,396 Amortization expense Amortization expense 147,006 - Impairment expense Impairment expense 24,716 - Adjusted EBITDA: Adjusted EBITDA: $ (1,257,689) $ (1,237,456)

Results for the Six Months Ended June 30, 2015, as compared to the Six Months Ended June 30, 2014:For the six ended June 30, 2015 revenue increased 47% to $682,030, as compared to $465,164 for the same period last year.Revenue from services, consisting of advertising and subscription revenue, increased 169% to $96,458, as compared to $35,846 for the same period last year.Product revenue increased 36% to $585,572, as compared to $429,318 for the same period last year.Website traffic visitors to our sites increased 380% to 16,920,000 as compared to 3,523,000 visitors for the same period last year as a result of organic growth and acquisitions.Website traffic unique visitors to our sites increased 530% to 12,033,924 as compared to 1,911,243 visitors for the same period last year as a result of organic growth and acquisitions. Q2 FINANCIAL & OPERATING RESULTS OTCQB: BMAQ *

NON-GAAP ADJUSTED EBITDA FOR THE SIX MONTHS ENDED JUNE 30, 2015 AND 2014 * OTCQB: BMAQ For the Six Months Ended June 30, For the Six Months Ended June 30, For the Six Months Ended June 30, For the Six Months Ended June 30, For the Six Months Ended June 30, For the Six Months Ended June 30, 2015 2014 Product Sales $ 585,572 $ 429,318 Revenues from Services Revenues from Services 96,458 35,846 Total Revenue 682,030 465,164 Cost of sales 459,919 339,777 Gross profit 222,111 125,387 Selling, general and administrative expenses Selling, general and administrative expenses 943,215 889,995 Loss from operations Loss from operations (721,104) (764,608) Other income (expense) Other income (expense) Interest income 13 34 Interest expense (891) - Total other income (expense), net Total other income (expense), net (878) 34 Net Loss $ (721,982) $ (764,574) Stock compensation expense Stock compensation expense $ 29,124 $ 41,325 Depreciation expense Depreciation expense 6,757 5,332 Amortization expense Amortization expense 86,136 52,849 Stock compensation for services Stock compensation for services 37,350 12,500 Adjusted EBITDA: Adjusted EBITDA: $ (562,615) $ (652,568)

Results for the Three Months Ended June 30, 2015, as compared to the Three Months Ended June 30, 2014:For the quarter ended June 30, 2015 revenue increased 48% to $371,947, as compared to $251,793 for the same period last year.Revenue from services, consisting of advertising and subscription revenue, increased 90% to $48,099, as compared to $25,305 for the same period last year.Product revenue increased 43% to $323,848, as compared to $226,488 for the same period last year.Website traffic visitors to our sites increased 349% to 9,197,000 as compared to 2,048,000 visitors for the same period last year as a result of organic growth and acquisitions.Website traffic unique visitors to our sites increased 500% to 6,617,022 as compared to 1,102,469 visitors for the same period last year as a result of organic growth and acquisitions. Q2 FINANCIAL & OPERATING RESULTS OTCQB: BMAQ *

NON-GAAP ADJUSTED EBITDA FOR THE THREE MONTHS ENDED JUNE 30, 2015 AND 2014 * OTCQB: BMAQ For the Three Months EndedJune 30, For the Three Months EndedJune 30, For the Three Months EndedJune 30, For the Three Months EndedJune 30, For the Three Months EndedJune 30, For the Three Months EndedJune 30, 2015 2014 Product Sales $ 323,848 $ 226,488 Revenues from Services Revenues from Services 48,099 25,305 Total Revenue 371,947 251,793 Cost of sales 271,809 179,916 Gross profit 100,138 71,877 Selling, general and administrative expenses Selling, general and administrative expenses 487,473 477,202 Loss from operations Loss from operations (387,335) (405,325) Other income (expense) Other income (expense) Interest income 5 14 Interest expense (446) - Total other income (expense), net Total other income (expense), net (441) 14 Net Loss $ (387,776) $ (406,311) Stock compensation expense Stock compensation expense $ 15,390 $ 16,563 Depreciation expense Depreciation expense 3,421 2,752 Amortization expense Amortization expense 45,801 31,468 Stock issued for services Stock issued for services 37,050 - Adjusted EBITDA: Adjusted EBITDA: $ (286,114) $ (355,528)

TARGETED U.S. DEMOGRAPHIC OTCQB: BMAQ Current U.S. targeted demographic represents an estimated 39.3 million users with an additional estimated 100 million outside the U.S. Adding spouses, parents, and other direct family members could increase U.S. targeted demographics to approximately 100 million. *

GROWTHBoth organic and through acquisitions INCREASE WEBSITE TRAFFIC, INCREASE SALES, AND IMPROVE OPERATING MARGINS MONETIZETRAFFIC Add Digital Media Sales, E-Commerce, and Data sales reps FOCUSED MARKET Military, Public Safety and their families IMPROVE MARGINS Concentrate on Advertising, Higher Margin Products, and Data Sales STRATEGY OTCQB: BMAQ *

Unlike many media companies which target a wide variety of audiences, Bright Mountain’s focus on U.S. military and public safety sector audiences provides unique growth opportunities, including:The fragmented online presence for serving military and public safety and their families has created an opportunity for a company to consolidate and dominate the U.S. market via acquisitions and organic growth.The current competitive landscape is populated with businesses operating with an unclear business plan and no expansion plans except for a few large websites, such as military.com, which is owned by Monster.The business community has consistently supported veterans and public safety with jobs and programs to enhance their lives; this has created a valuable advertising opportunity.Building a large online community will provide a marketing medium for advertisers targeting military, public safety and their family members.Conversations are beginning in Congress and city and state agencies about stabilizing and possibly increasing the military and public safety budgets. UNIQUE OPPORTUNITIES OTCQB: BMAQ *

MONETIZATION OPPORTUNITIES FOR WEB TRAFFIC OTCQB: BMAQ Following several acquisitions and building upon the recent fast growth of its website traffic, in July 2015 Bright Mountain began its efforts to monetize this increased web traffic to rapidly grow its revenues.Revenues will be generated from an expanded revenue channel, including digital media sales, e-commerce and data sales.Long term revenue goal is $1.00 in annual revenues for each unique visitor to Bright Mountain’s websites.Based upon traffic at the end of Q2 2015, this goal would translate to annual revenues of approximately $25 million.Bright Mountain’s revenue goal for each unique visitor is compared to Yahoo!’s approximately $3.00 in annual revenues for each unique visitor and Amazon’s approximately $48 in annual revenues for each unique visitor.1________________________________________________1 As determined by estimated analysis of public filings of these entities. *

Current Management Focus Develop sales divisions for digital media sales, e-commerce, and data sales by Q4, 2015.Continue to drive organic website traffic growth by increasing the amount of quality content.Search for strategic acquisitions including related e-commerce.Accelerate conversion into higher margin digital media, e-commerce, and data sales revenue.Create liquidity in BMAQ common stock.NASDAQ up listing. * OTCQB: BMAQ

Notes to Talking Points: Revenue Channels Bright Mountain’s current revenue channels include revenue from digital media sales consisting of advertising and subscription revenue, and revenue from e-commerce. Management is implementing procedures to expand into a third revenue channel; data sales. Digital Media Sales - Selling to advertisers who specifically and directly want to reach the military and public safety demographic. Bright Mountain will sell space on our websites for “sponsored ads”, messages tailored for the specific website audience. Additionally, the Company will accept certain advertisers to “sponsor” or be the principal advertiser for the entire site. This is especially beneficial for advertisers that have multiple product lines or divisions and want to reach veterans and their spouses with products ranging from automotive tools to kitchen appliances. Many advertisers have departments devoted to directly reaching the military and public safety markets. Selling directly to military and public safety allows advertisers to customize their message and Bright Mountain to maximize revenue per ad location. Bright Mountain generates subscription revenue through subscriptions to its career posting site and its proprietary private e-mail service. * OTCQB: BMAQ
Notes to Talking Points: Revenue Channels * E-Commerce - Bright Mountain has two types of e-commerce, 1) direct sales to our website visitor traffic, which has a higher profit margin, and 2) sales through third party e-commerce platforms, which have lower profit margin. Although the Company will continue to grow e-commerce through third party e-commerce platforms, Bright Mountain’s primary emphasis will be to aggressively expand the higher margin direct to website visitors e-commerce business; the Company has hired a sales manager to grow this business, effective July 1, 2015. Two additional core reasons for emphasizing direct to website visitor e-commerce are Bright Mountain now has millions of potential customers visiting on a regular basis, the Company has both word and design trademarks (from a recent acquisition) which can be applied to literally dozens of products which are very popular with our targeted demographic and will allow the Company to protect higher margins.Data Sales - In its simplest form this is selling “data” to companies who want to reach our military and public safety demographic; the approximately 40 million people plus immediate family estimated to total approximately 100 million. The data could be sold to companies who want to reach our target demographic market including companies marketing diverse products and services such as education, moving services, banking, insurance, employment, fitness, clothing, cars, beverages, fishing and camping, legal and accounting services, sporting goods, real estate and a wide variety of consumer products. OTCQB: BMAQ
Revenue Channels: Gross Profit Margins * Gross Profit Margins for the Three Channels:Digital Media Sales - there is no direct cost for this channel so the gross profit is essentially 100% less an estimated sales commission of 10%, although many of the sponsored ads will be sold by the house, so 90% gross profit is realistic, including the sales commission.E-Commerce - direct to website visitor sales should average approximately 55% including sales of trademarked goods (early sales have shown higher GP) mixed with sales through third party e-commerce distributor portals at approximately 22% could yield a combined mixed gross profit of 45% as the company grows the direct to website visitor sales and trademarked product business.Data Sales - there is no direct cost here either for this revenue channel, so 100% gross profit; less an estimated sales commission of 10%, although these sales may be generated largely by hourly telephone employees, but 10% is reasonable for a net gross profit of 90%. OTCQB: BMAQ

W. Kip SpeyerCEO30+ years of successful executive leadershipFounder, President & CEO of Speyer Door and Window, which was sold in 2009Former President & CEO of ICAD, a business combination of ISSI and Howtek, Inc.Former President & CEO of Galileo Corp., sold to Corning.Founder and former President of Leisegang MedicalFormer President of Hays Medical CompaniesBS in Business Administration, Northeastern University Executive Management Team OTCQB: BMAQ Annette CasacciCFO20+ years of successful managerial, accounting and financial experience in private and public corporate environments across a variety of industriesFormer CFO of Universal Court ReportingExtensive experience with start-up companies and M&A activitiesBS in Business Administration and Management and M.B.A, Florida Atlantic University Todd SpeyerDigital Director10+ years of marketing and business development experienceFormer Director of Business Development & Website Manager at Bright MountainFormer Marketing & Product Manager for Speyer Door and Window where he was responsible for the Company’s website developmentBS in English Literature, Florida State University * Jon ThielmannGeneral Manager, BrightWatches®20+ years of successful business management experienceFormer Operations ManagerExperienced with growing start-upsSix-year tour of duty with the United States Navy achieving rank of Petty Officer First Class

COMPANY CONTACT6400 Congress AvenueSuite 2050Boca Raton, FL 33487(561) 998-2440Kip Speyer, CEOkip@bmaq.comAnnette Casacci, CFOacasacci@bmaq.com CONTACT US OTCQB: BMAQ SERVICE PROVIDERSIndependent AuditorsLiggett, Vogt & Webb, P.A.432 Park Avenue South,10th FloorNew York, NY 10016 and1500 Gateway BoulevardSuite 202Boynton Beach, FL 33426Legal CounselPearlman Schneider LLP2200 Corporate Boulevard NWSuite 210Boca Raton, FL 33431Transfer AgentIsland Stock Transfer15500 Roosevelt BoulevardSuite 301Clearwater, FL 33760 *