Attached files
| file | filename |
|---|---|
| 8-K - 8-K - AVID TECHNOLOGY, INC. | a08-13x20158xk.htm |
| EX-99.1 - EXHIBIT 99.1 - AVID TECHNOLOGY, INC. | a08-13x20158xkxexhibit991.htm |
Avid Business Update August 13, 2015
2 Safe Harbor & Non-GAAP Measures The information provided in this presentation includes forward-looking statements that involve risks and uncertainties, including statements about our anticipated plans, objectives, expectations and intentions. Such statements include, without limitation, statements regarding our recently filed financial statements or other information included herein based upon or otherwise incorporating judgments or estimates relating to future performance such as future operating expenses, earnings, bookings, revenue backlog, backlog conversion rate, product mix and free cash flow; our cost savings initiatives; our future strategy and business plans; our product plans, including products under development, such as cloud and subscription based offerings; the expected timing and closing of the proposed acquisition of Orad and term loan financing as well as refinancing of our existing credit facility, the anticipated benefits of the proposed acquisition, including estimated synergies; and the effects of the proposed transaction, including effects on future financial and operating results; and our liquidity and ability to raise capital. These forward-looking statements are based our expectations as of August 13, 2015 and subject to known and unknown risks and uncertainties that could cause actual results to differ materially from those expressed or implied by such statements, including but not limited to the effect on our sales, operations and financial performance resulting from: our liquidity; our ability to execute our strategic plan, including cost savings initiatives, and meet customer needs; our ability to produce innovative products in response to changing market demand, particularly in the media industry; our ability to successfully accomplish our product development plans; competitive factors; history of losses; fluctuations in our revenue, based on, among other things, our performance and risks in particular geographies or markets; fluctuations in foreign currency exchange rates and seasonal factors; adverse changes in economic conditions; variances in our backlog and the realization thereof; the identified material weaknesses in our internal control over financial reporting; the previously disclosed SEC and Department of Justice inquiries; pending litigation, including the previously disclosed class action and possibility of further legal proceedings adverse to our company resulting from the restatement or related matters; the costs associated with the restatement. Moreover, the business may be adversely affected by future legislative, regulatory or changes, including tax law changes, as well as other economic, business and/or competitive factors. The risks included above are not exhaustive. Other factors that could adversely affect our business and prospects are described in the filings made by our company with the SEC. We expressly disclaim any obligation or undertaking to update or revise any forward-looking statements whether as a result of new information, future events or otherwise. Avid includes non-GAAP financial measures in this presentation, including adjusted EBITDA, free cash flow, non-GAAP operating income, non-GAAP operating income per share, and non-GAAP operating expenses. The Company also includes the operational metric of bookings and revenue backlog in this presentation. For an explanation of these measures and a reconciliations to the Company's comparable GAAP financial measures please see our previous filings with the SEC, including our current report on Form 8-K filed on March 16, 2015, May 7, 2015 and August 10, 2015,
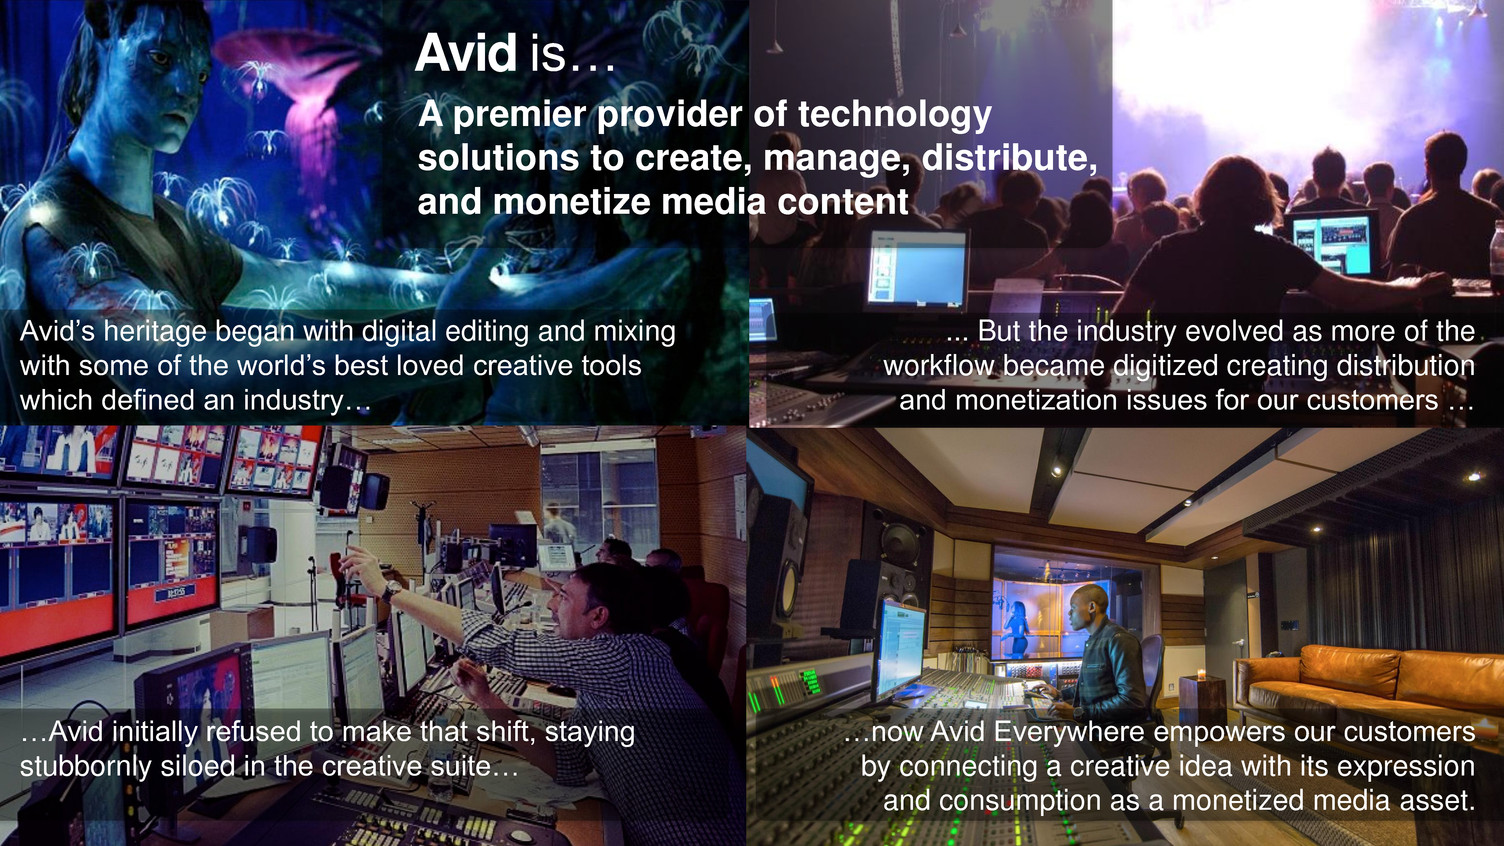
3 Avid’s heritage began with digital editing and mixing with some of the world’s best loved creative tools which defined an industry… Avid is… A premier provider of technology solutions to create, manage, distribute, and monetize media content ... But the industry evolved as more of the workflow became digitized creating distribution and monetization issues for our customers … …Avid initially refused to make that shift, staying stubbornly siloed in the creative suite… …now Avid Everywhere empowers our customers by connecting a creative idea with its expression and consumption as a monetized media asset.
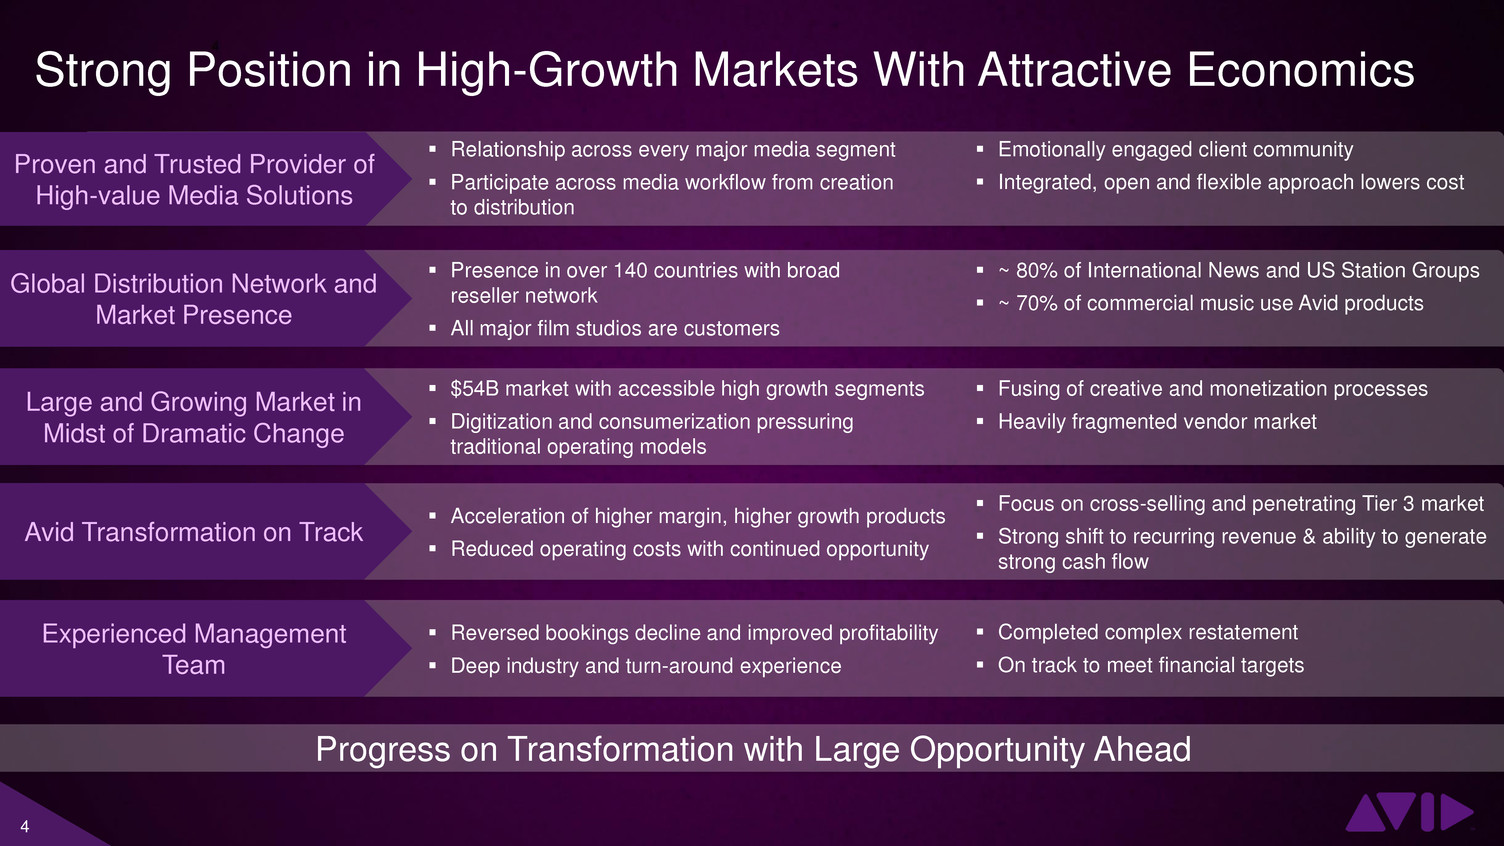
4 Strong Position in High-Growth Markets With Attractive Economics Proven and Trusted Provider of High-value Media Solutions Relationship across every major media segment Participate across media workflow from creation to distribution Global Distribution Network and Market Presence Large and Growing Market in Midst of Dramatic Change Avid Transformation on Track Experienced Management Team Progress on Transformation with Large Opportunity Ahead Emotionally engaged client community Integrated, open and flexible approach lowers cost Presence in over 140 countries with broad reseller network All major film studios are customers $54B market with accessible high growth segments Digitization and consumerization pressuring traditional operating models Acceleration of higher margin, higher growth products Reduced operating costs with continued opportunity Reversed bookings decline and improved profitability Deep industry and turn-around experience ~ 80% of International News and US Station Groups ~ 70% of commercial music use Avid products Fusing of creative and monetization processes Heavily fragmented vendor market Focus on cross-selling and penetrating Tier 3 market Strong shift to recurring revenue & ability to generate strong cash flow Completed complex restatement On track to meet financial targets
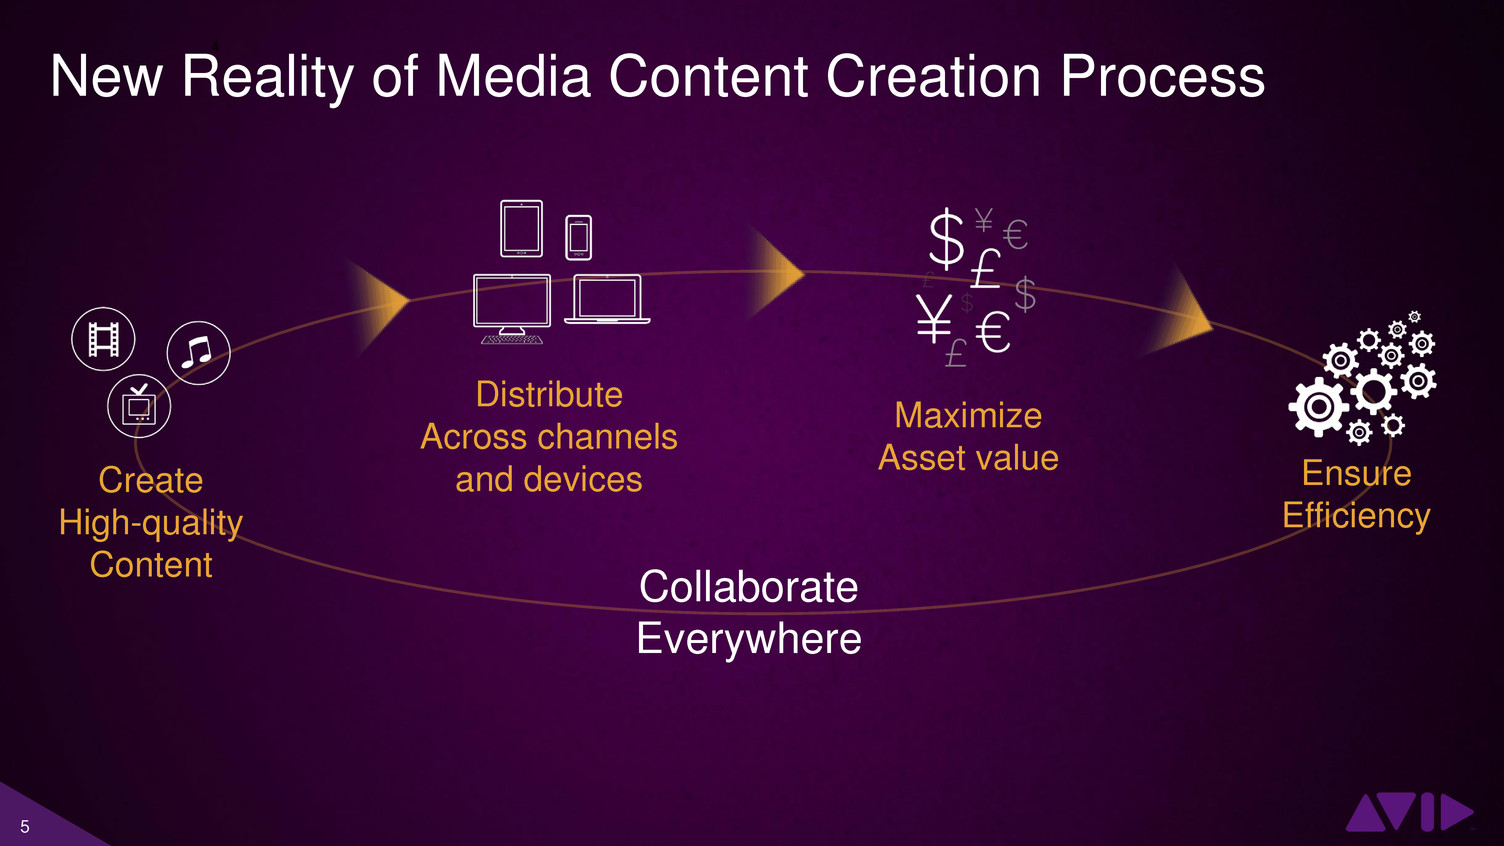
5 Collaborate Everywhere Create High-quality Content Maximize Asset value Distribute Across channels and devices Ensure Efficiency New Reality of Media Content Creation Process

6
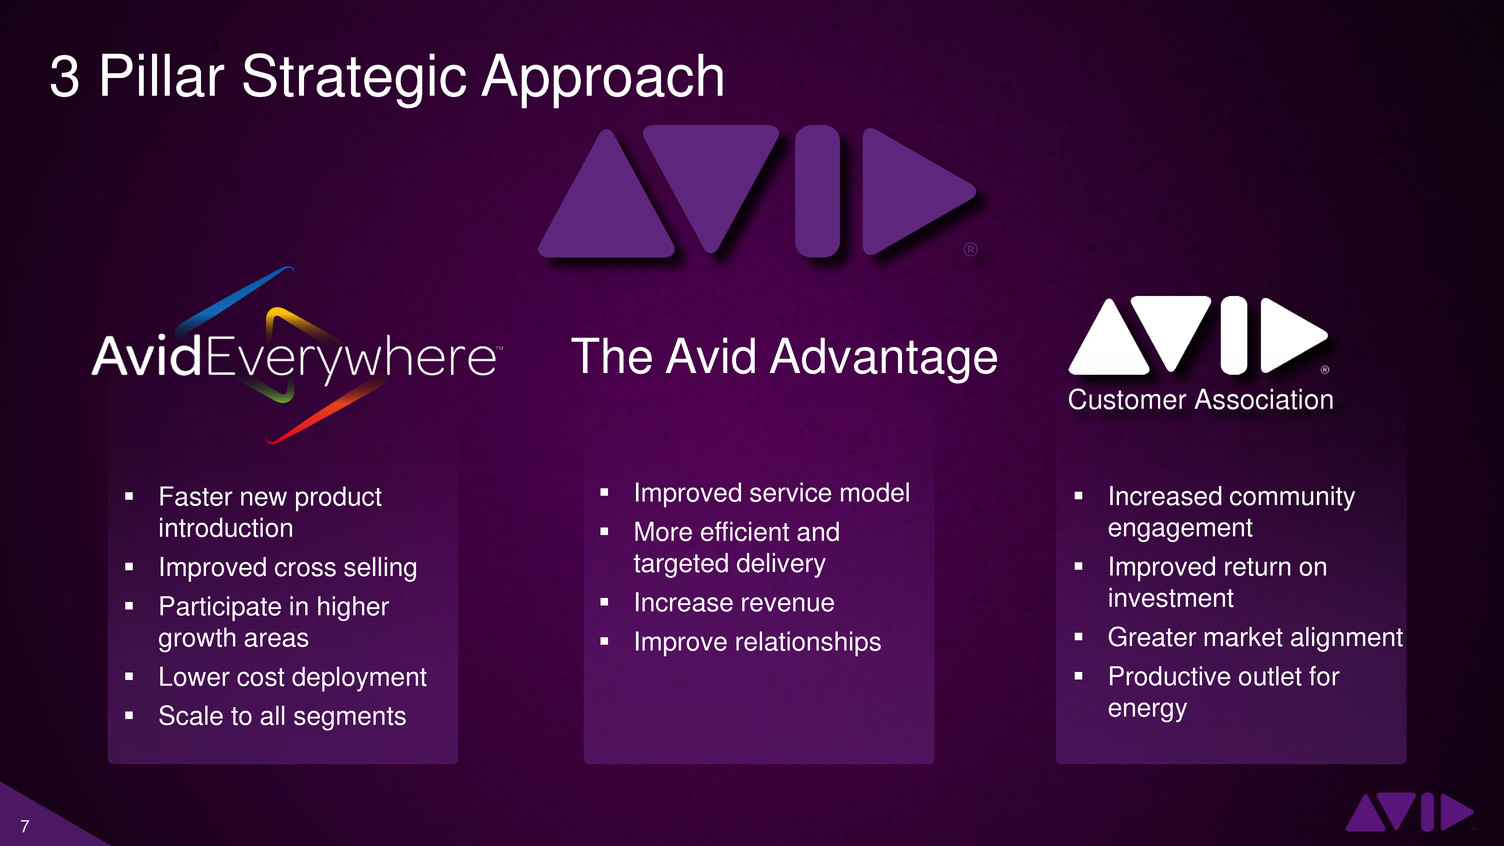
7 The Avid Advantage Customer Association Faster new product introduction Improved cross selling Participate in higher growth areas Lower cost deployment Scale to all segments Improved service model More efficient and targeted delivery Increase revenue Improve relationships Increased community engagement Improved return on investment Greater market alignment Productive outlet for energy 3 Pillar Strategic Approach
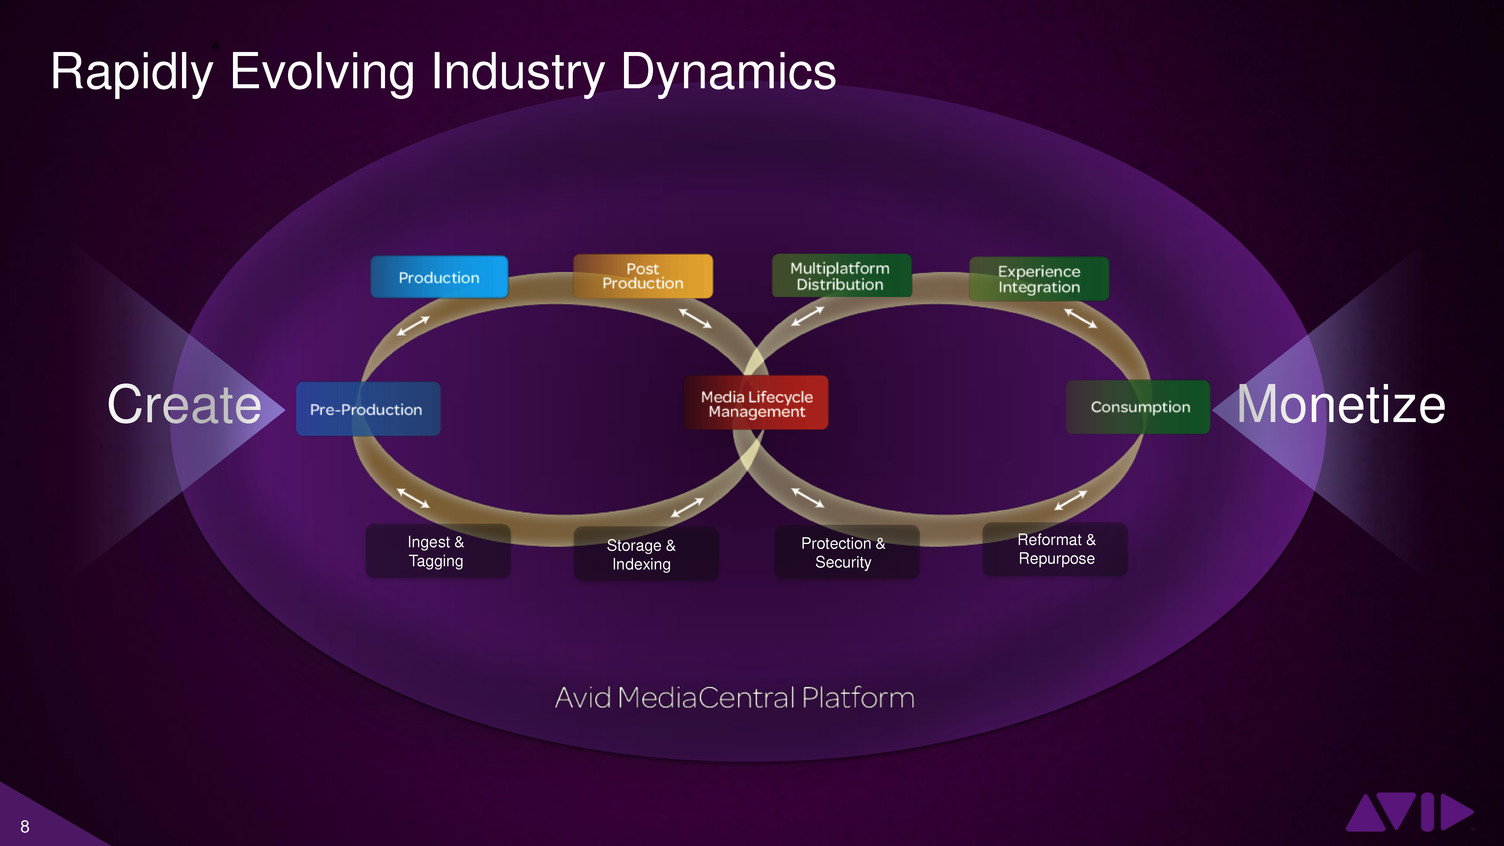
8 Create Monetize Ingest & Tagging Reformat & Repurpose Protection & Security Storage & Indexing Rapidly Evolving Industry Dynamics

9 Collaboration Media Services System Administration Connectivity Toolkit Resolution Independence Orchestration Engine Metadata Management Security Services Video Engine Graphics Engine Search across your entire network Media access and playback on any device Tie third parties into the workflow Platform level connection for end-to-end integration Work on-prem or remotely Projects and media always stay in sync Workflow and process automation Flexible resource allocation Content protection User authentication and policy-based access Centralized system configuration, management and monitoring Work with any resolution Fluidly scale playback to bandwidth available Persistence of metadata across apps Dynamic data model for changing needs Real time video encoding and decoding Scalable, highly responsive and flexible Foundation for real-time graphics solutions Reliable, modular, high- performance graphics rendering Common Services and Engines
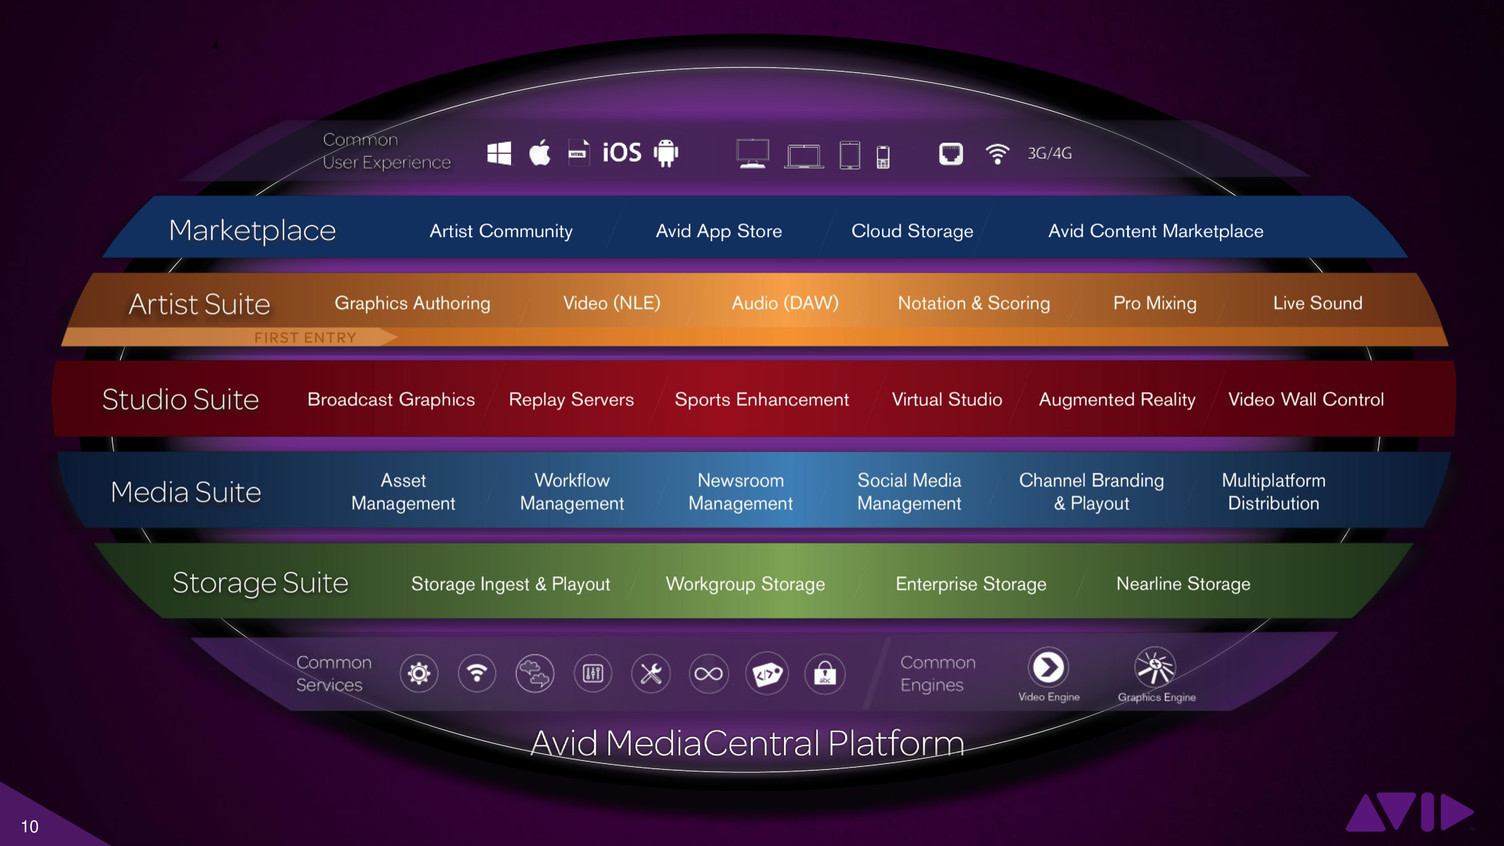
10
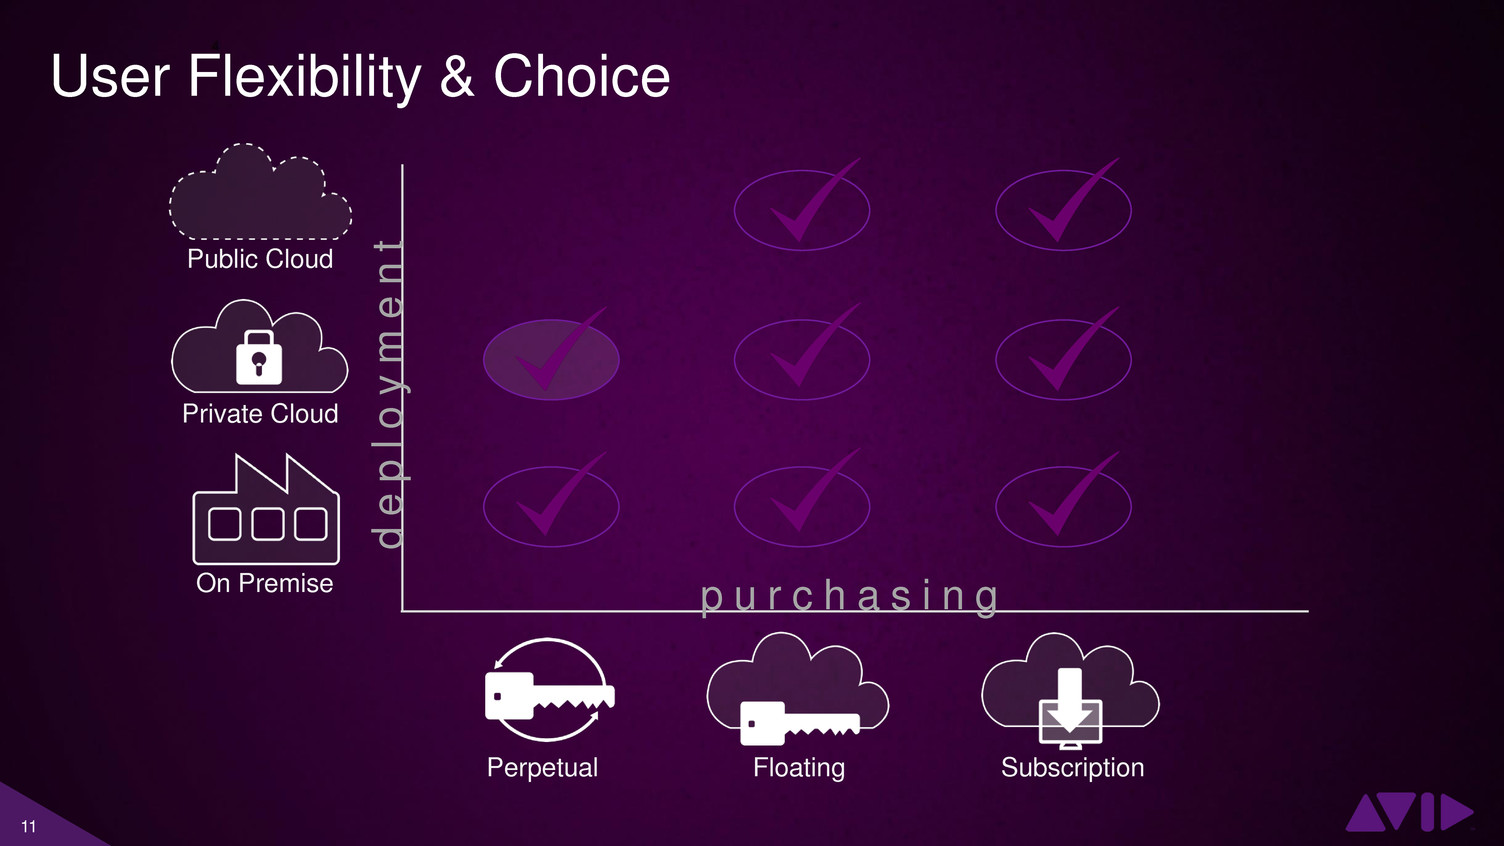
11 User Flexibility & Choice d e p lo y m e n t p u r c h a s i n g Public Cloud Private Cloud On Premise Perpetual Floating Subscription
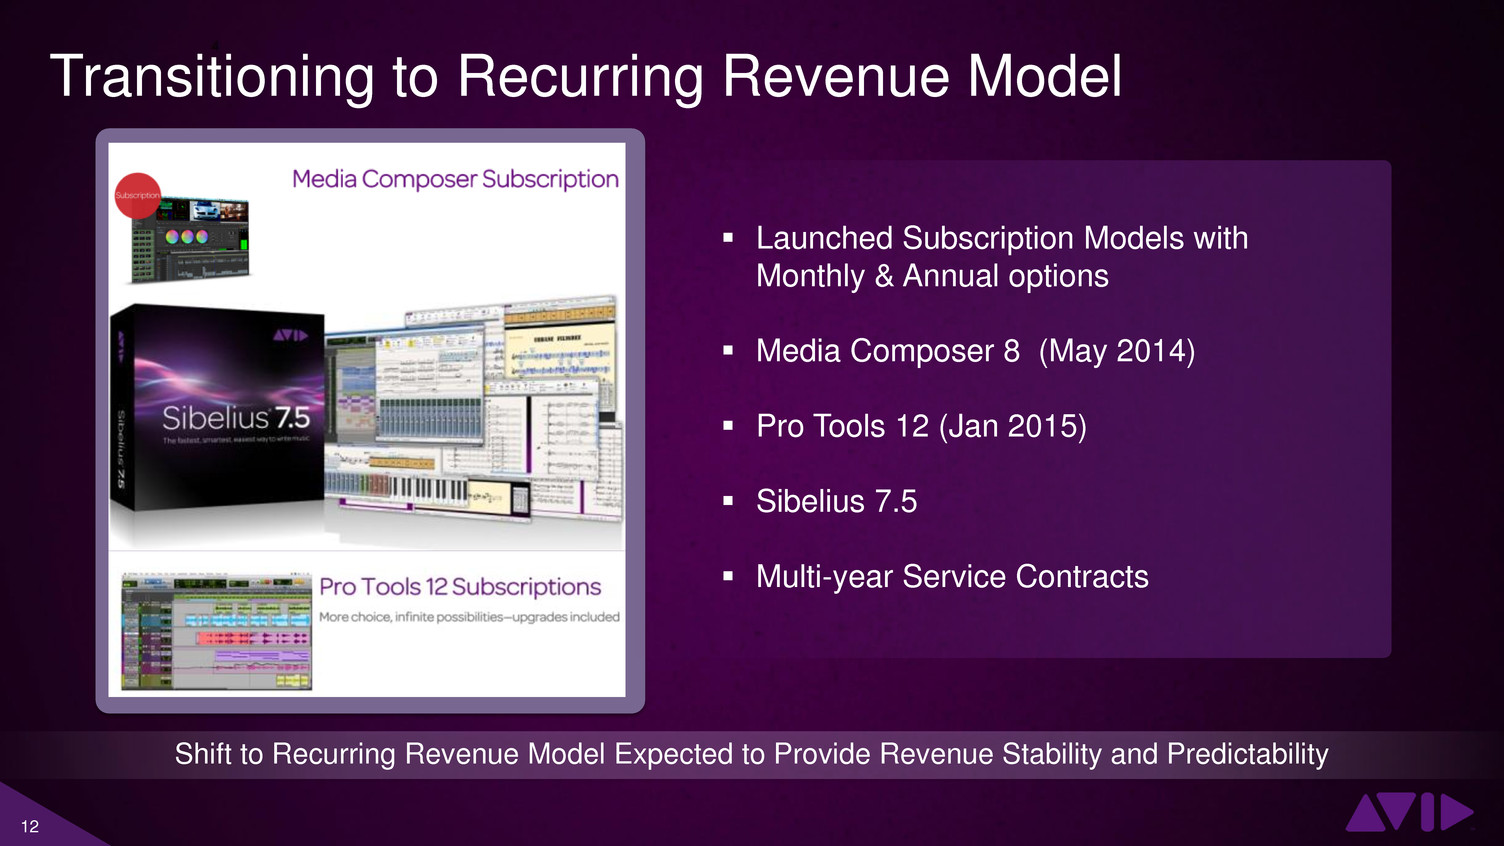
12 Transitioning to Recurring Revenue Model Launched Subscription Models with Monthly & Annual options Media Composer 8 (May 2014) Pro Tools 12 (Jan 2015) Sibelius 7.5 Multi-year Service Contracts Shift to Recurring Revenue Model Expected to Provide Revenue Stability and Predictability
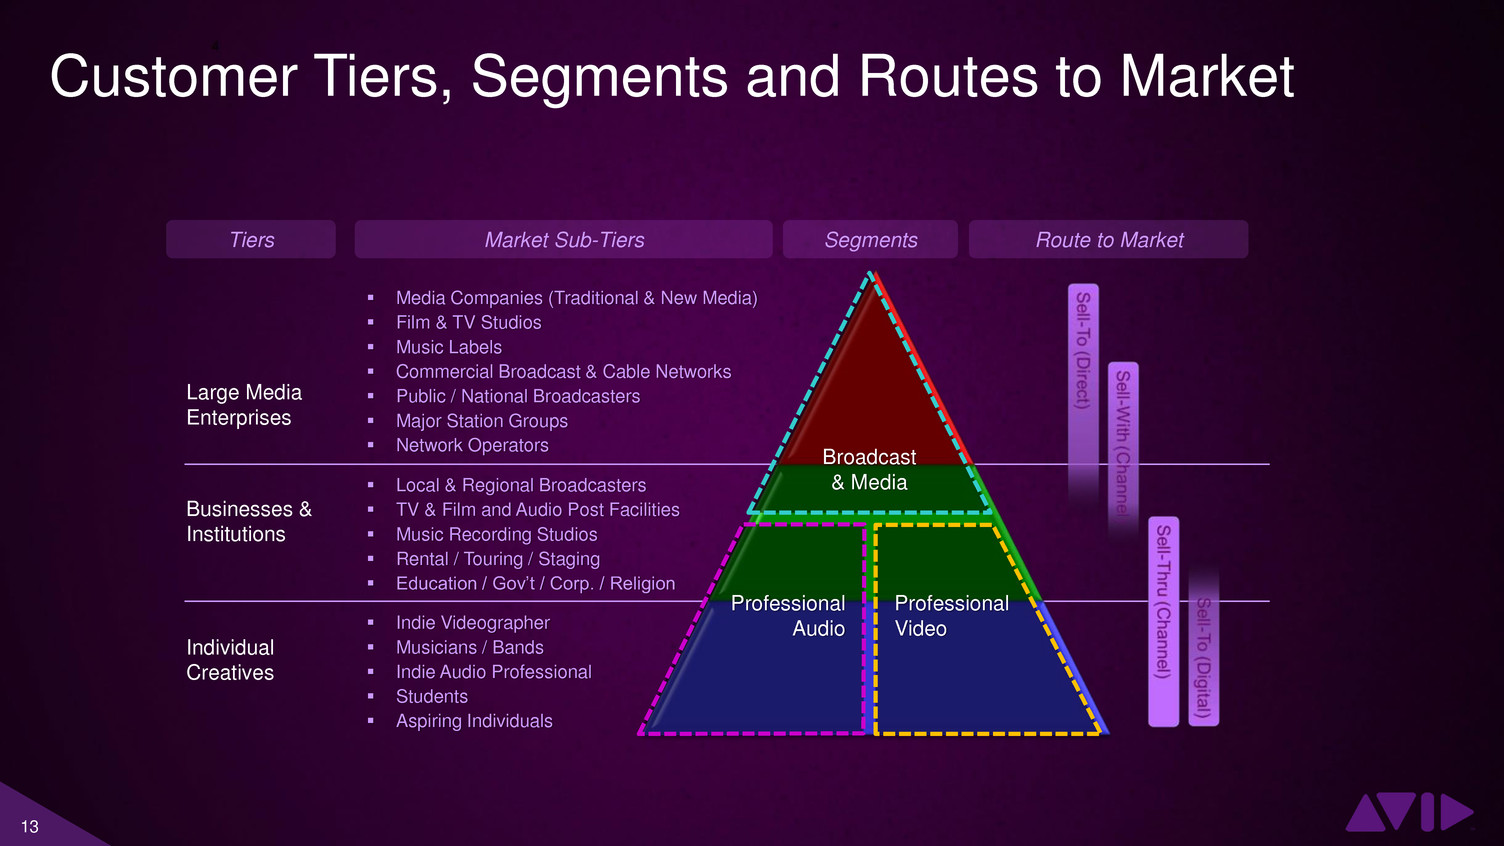
13 Customer Tiers, Segments and Routes to Market Media Companies (Traditional & New Media) Film & TV Studios Music Labels Commercial Broadcast & Cable Networks Public / National Broadcasters Major Station Groups Network Operators Local & Regional Broadcasters TV & Film and Audio Post Facilities Music Recording Studios Rental / Touring / Staging Education / Gov’t / Corp. / Religion Indie Videographer Musicians / Bands Indie Audio Professional Students Aspiring Individuals Large Media Enterprises Businesses & Institutions Individual Creatives Tiers Market Sub-Tiers Route to Market Broadcast & Media Professional Audio Professional Video Segments
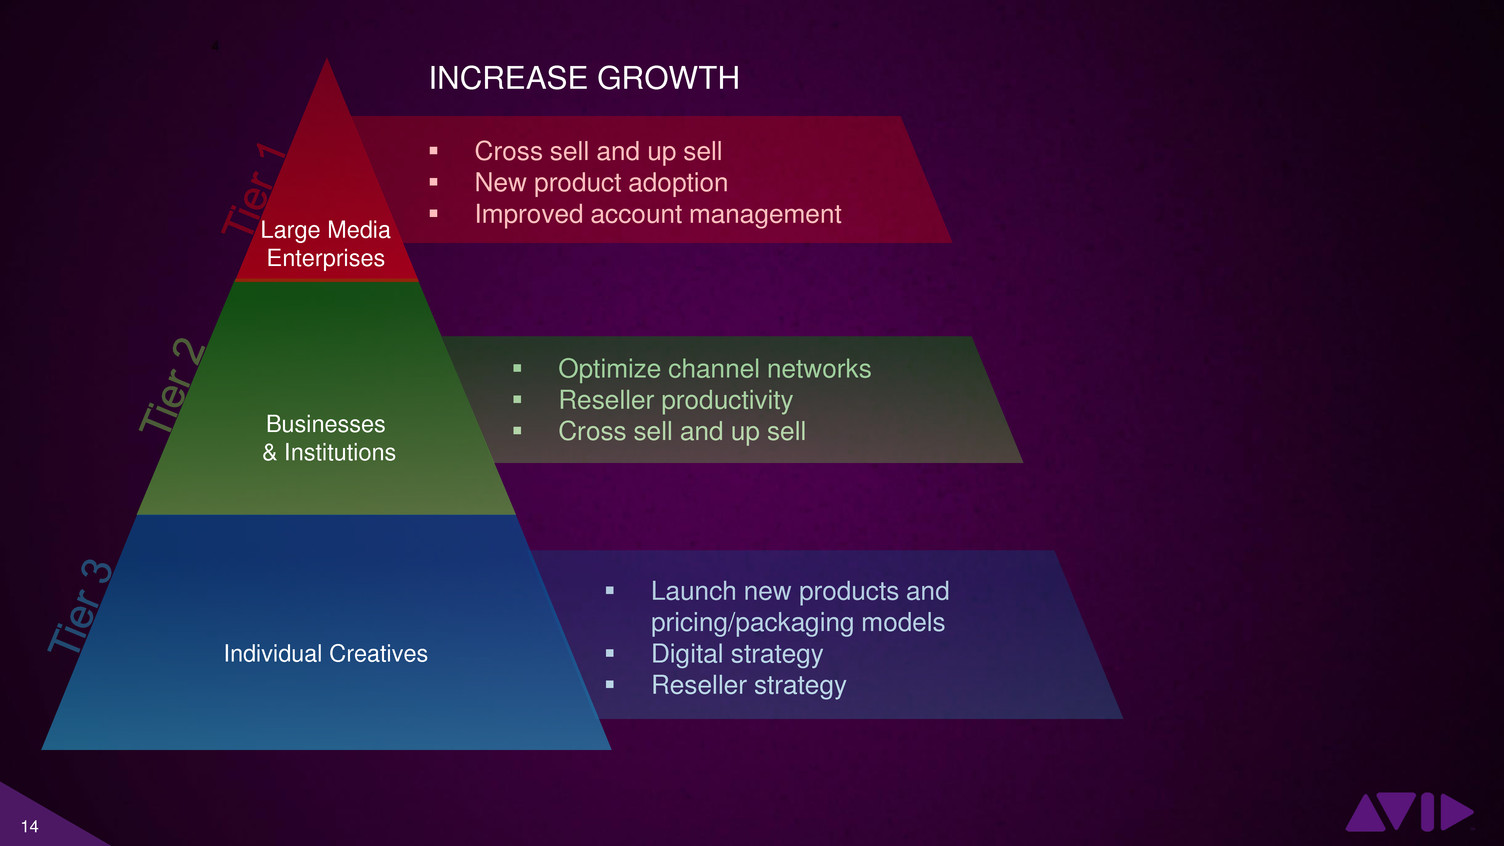
14 Launch new products and pricing/packaging models Digital strategy Reseller strategy Cross sell and up sell New product adoption Improved account management Optimize channel networks Reseller productivity Cross sell and up sell Large Media Enterprises Businesses & Institutions Individual Creatives INCREASE GROWTH
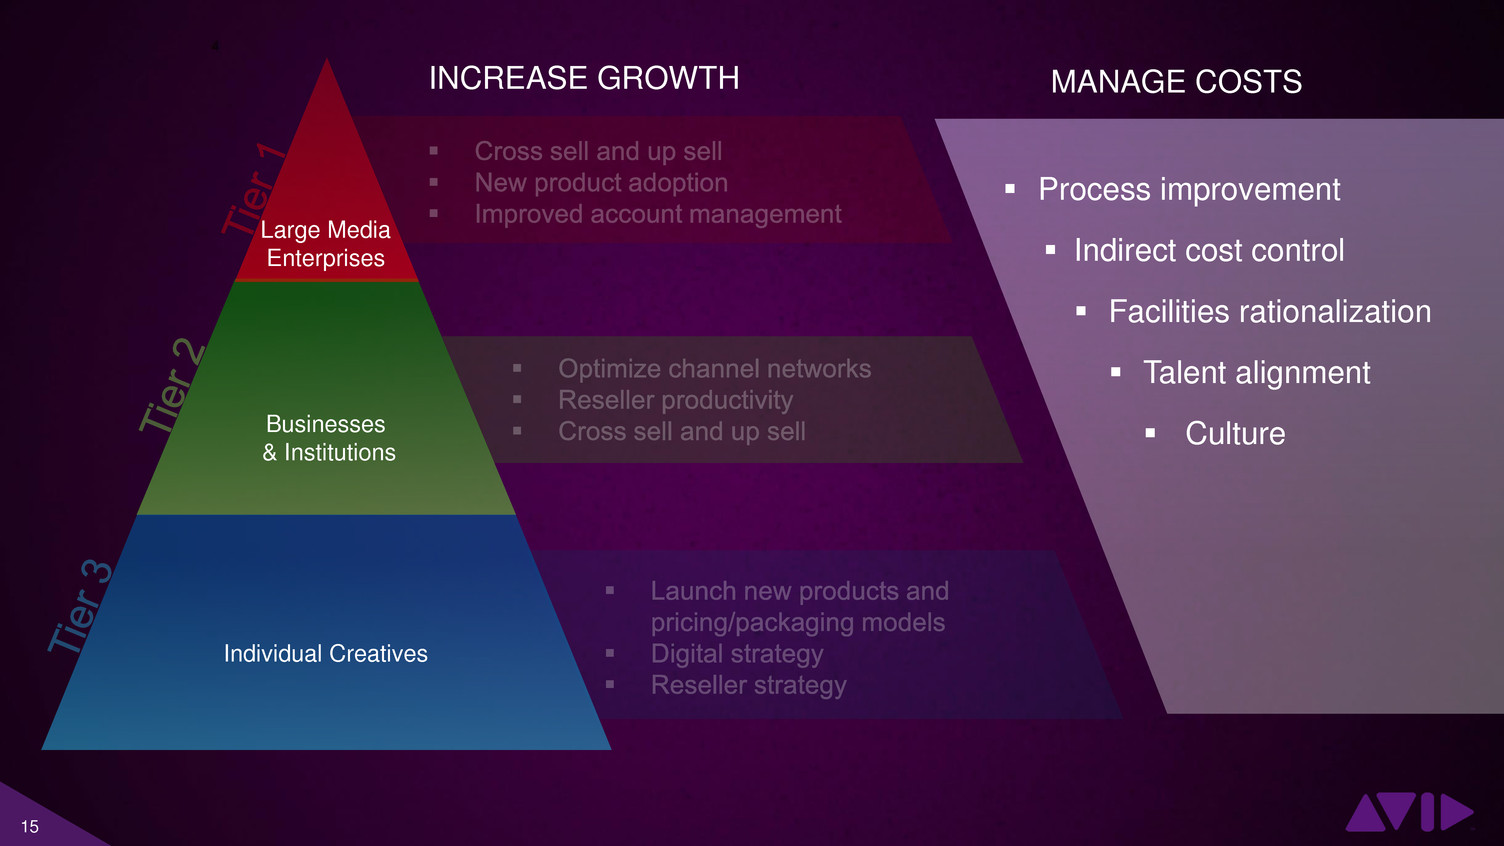
15 Large Media Enterprises Businesses & Institutions Individual Creatives INCREASE GROWTH MANAGE COSTS Process improvement Indirect cost control Facilities rationalization Talent alignment Culture
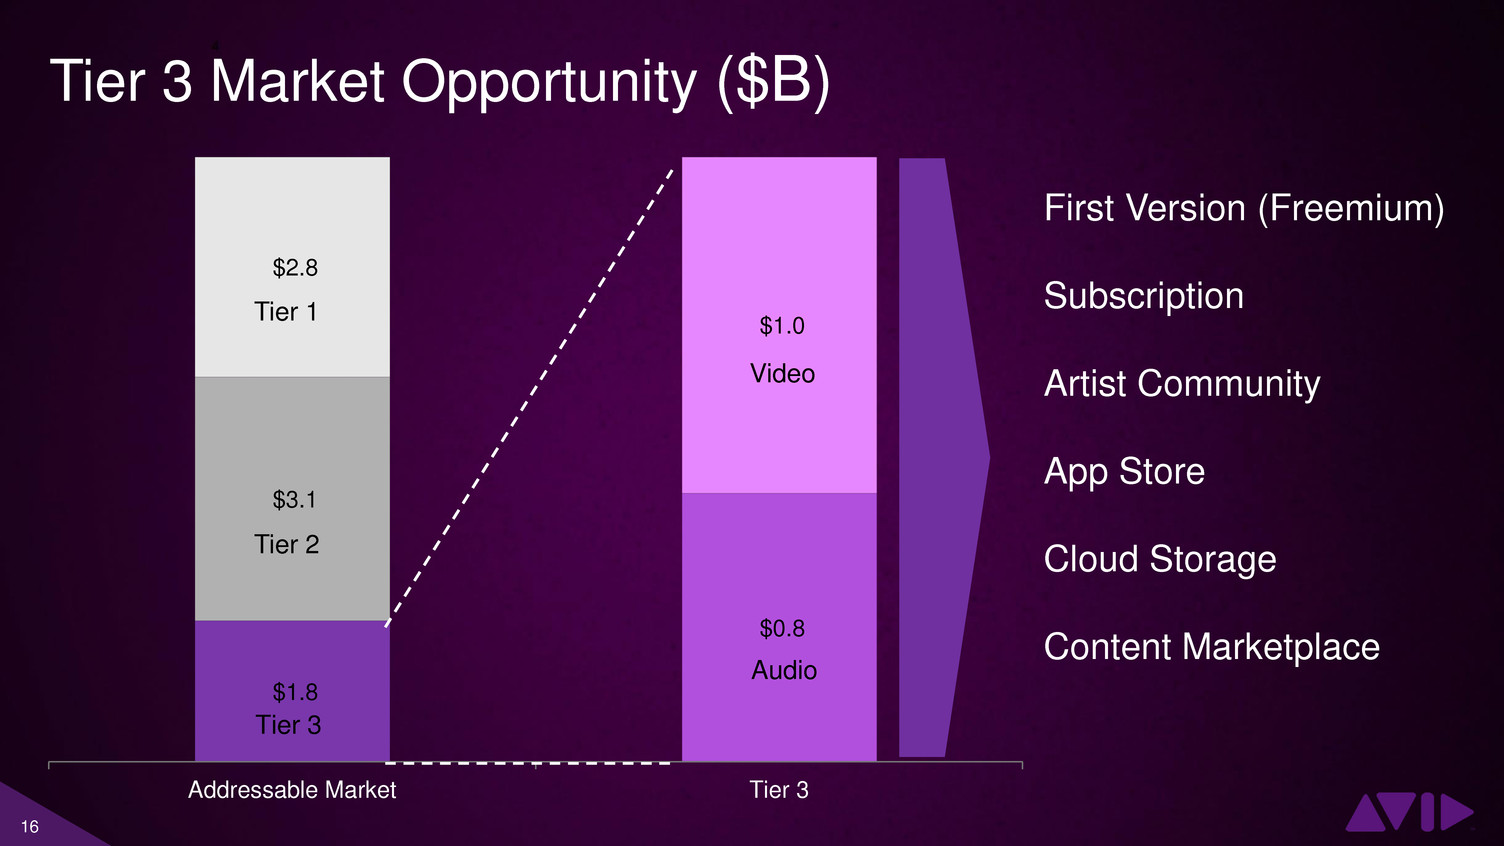
16 Tier 3 Market Opportunity ($B) $1.8 $3.1 $2.8 $0.8 $1.0 Addressable Market Tier 3 Tier 3 Audio Video Tier 2 Tier 1 First Version (Freemium) Subscription Artist Community App Store Cloud Storage Content Marketplace
17 Performance Update
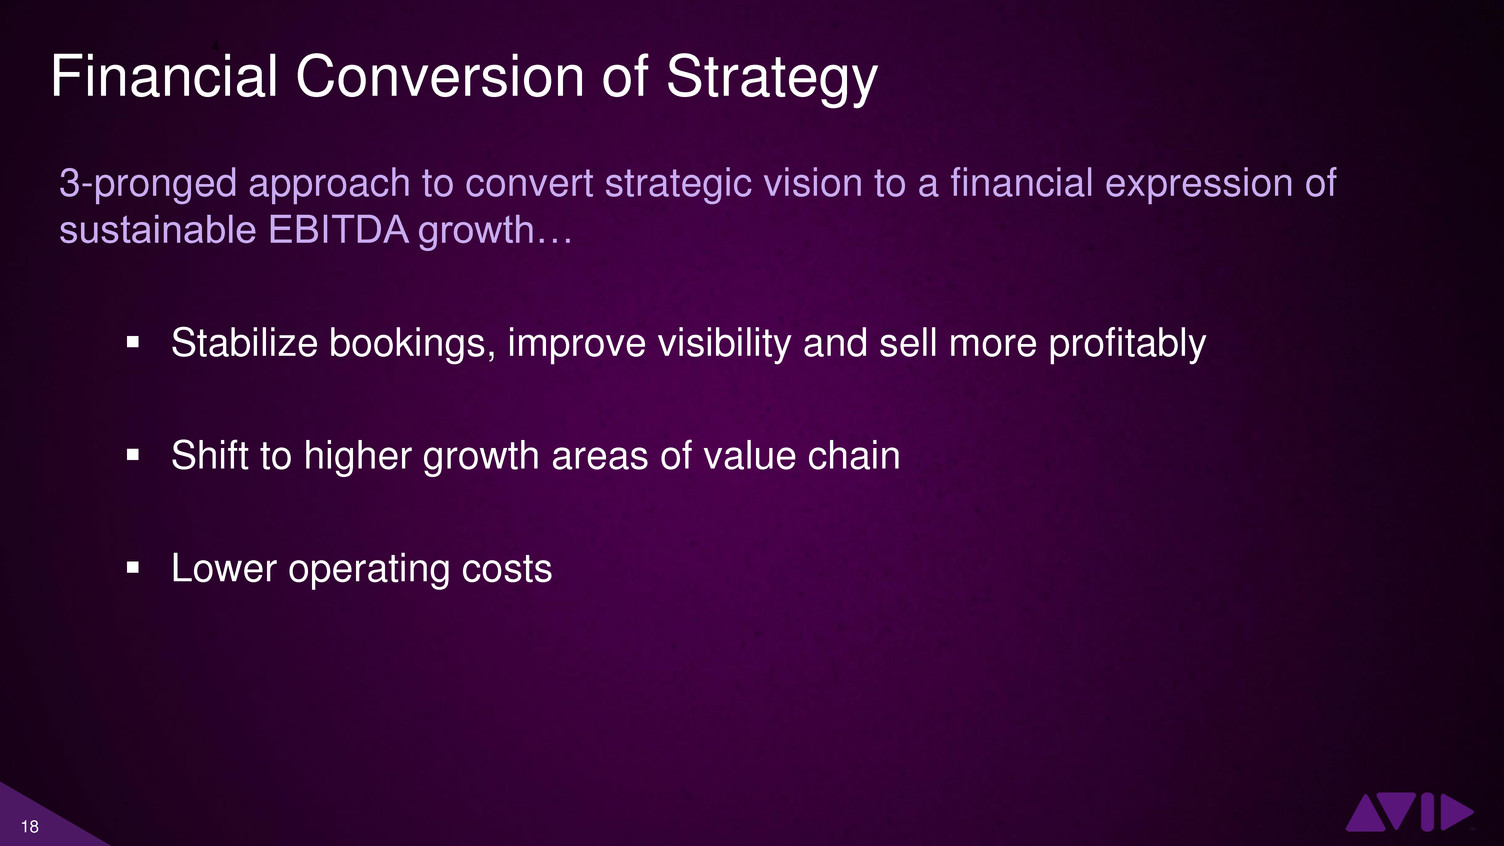
18 Financial Conversion of Strategy 3-pronged approach to convert strategic vision to a financial expression of sustainable EBITDA growth… Stabilize bookings, improve visibility and sell more profitably Shift to higher growth areas of value chain Lower operating costs
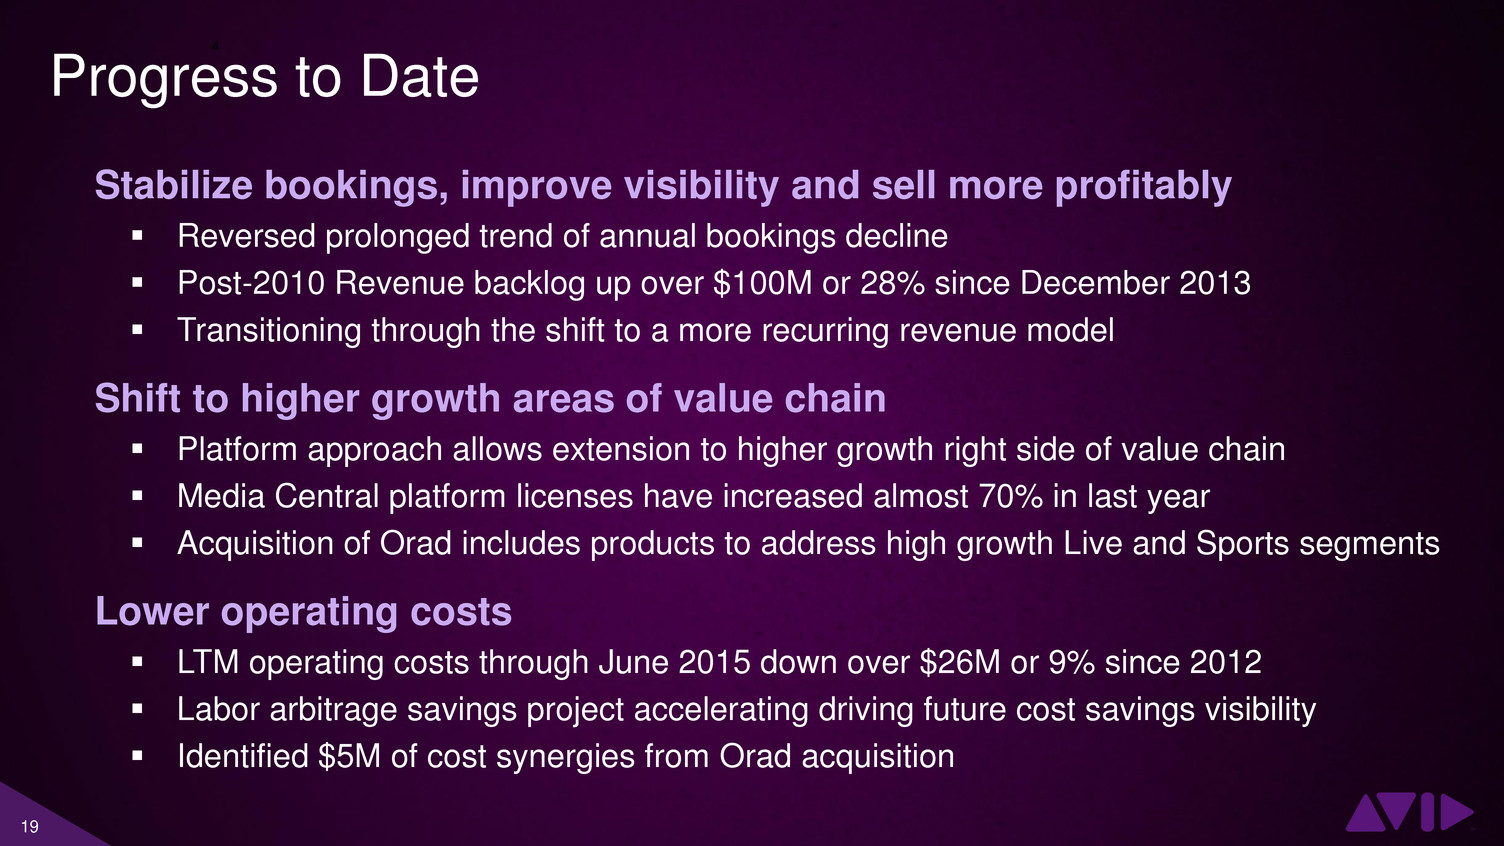
19 Progress to Date Stabilize bookings, improve visibility and sell more profitably Reversed prolonged trend of annual bookings decline Post-2010 Revenue backlog up over $100M or 28% since December 2013 Transitioning through the shift to a more recurring revenue model Shift to higher growth areas of value chain Platform approach allows extension to higher growth right side of value chain Media Central platform licenses have increased almost 70% in last year Acquisition of Orad includes products to address high growth Live and Sports segments Lower operating costs LTM operating costs through June 2015 down over $26M or 9% since 2012 Labor arbitrage savings project accelerating driving future cost savings visibility Identified $5M of cost synergies from Orad acquisition
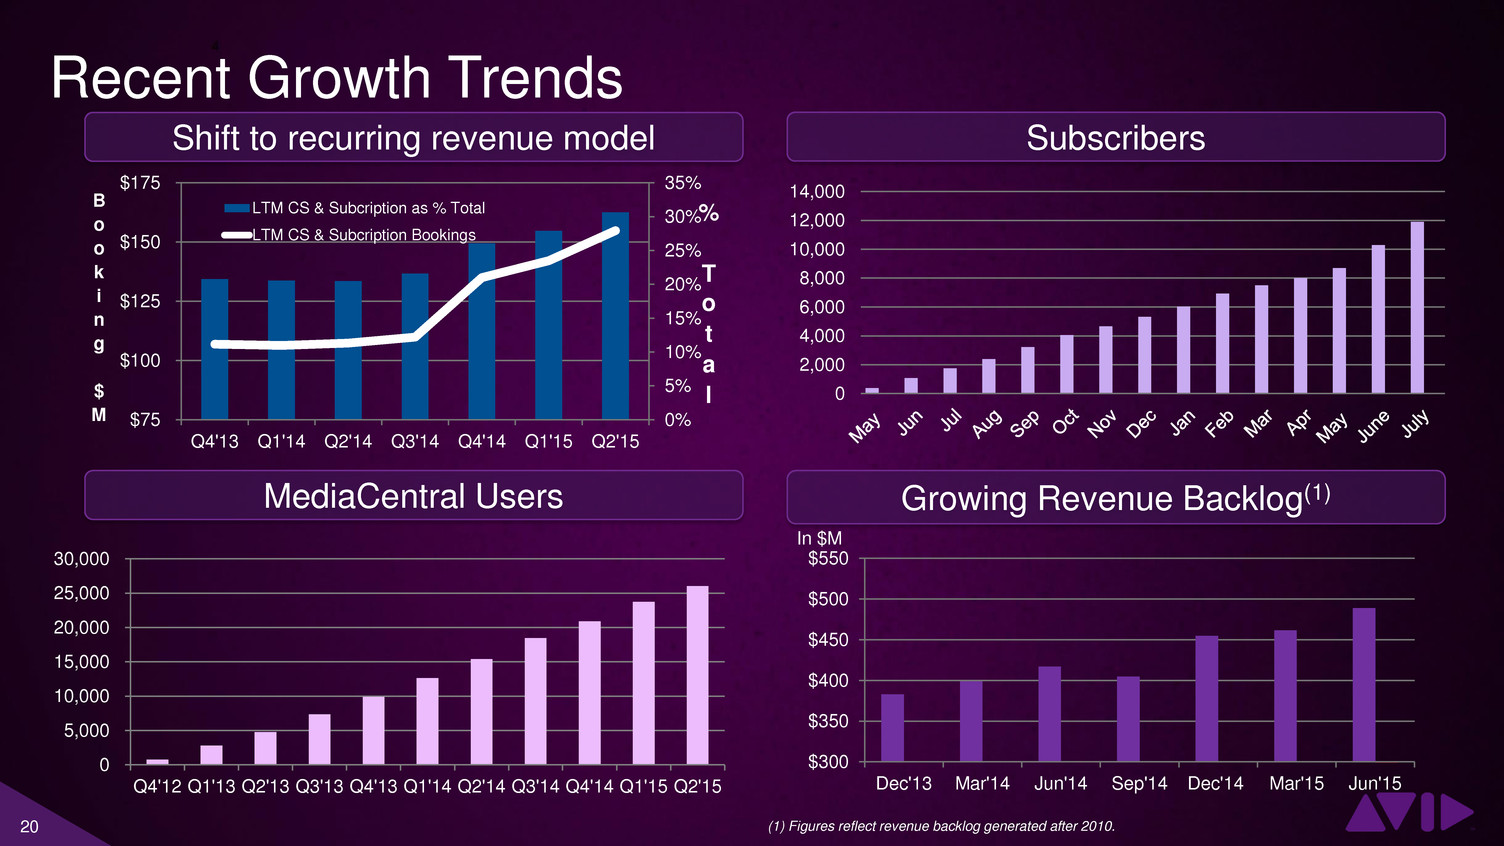
20 MediaCentral Users 0 5,000 10,000 15,000 20,000 25,000 30,000 Q4'12 Q1'13 Q2'13 Q3'13 Q4'13 Q1'14 Q2'14 Q3'14 Q4'14 Q1'15 Q2'15 Subscribers 0 2,000 4,000 6,000 8,000 10,000 12,000 14,000 Growing Revenue Backlog(1) $300 $350 $400 $450 $500 $550 Dec'13 Mar'14 Jun'14 Sep'14 Dec'14 Mar'15 Jun'15 In $M (1) Figures reflect revenue backlog generated after 2010. Recent Growth Trends 0% 5% 10% 15% 20% 25% 30% 35% $75 $100 $125 $150 $175 Q4'13 Q1'14 Q2'14 Q3'14 Q4'14 Q1'15 Q2'15 % T o t a l B o o k i n g $ M LTM CS & Subcription as % Total LTM CS & Subcription Bookings Shift to recurring revenue model
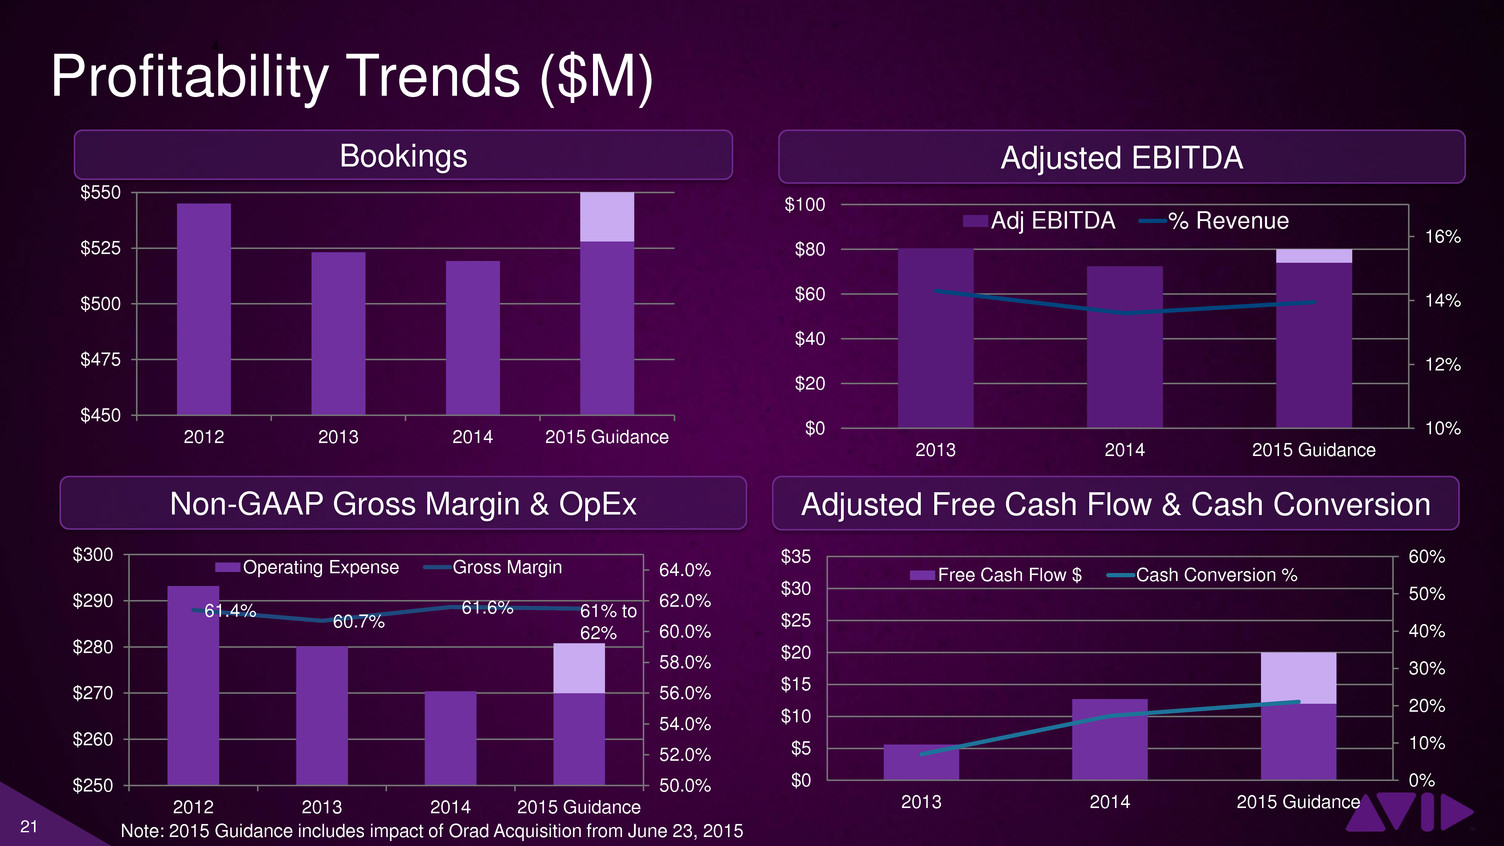
21 10% 12% 14% 16% $0 $20 $40 $60 $80 $100 2013 2014 2015 Guidance Adj EBITDA % Revenue Non-GAAP Gross Margin & OpEx Adjusted EBITDA 61.4% 60.7% 61.6% 50.0% 52.0% 54.0% 56.0% 58.0% 60.0% 62.0% 64.0% $250 $260 $270 $280 $290 $300 2012 2013 2014 2015 Guidance Operating Expense Gross Margin 61% to 62% Adjusted Free Cash Flow & Cash Conversion 0% 10% 20% 30% 40% 50% 60% $0 $5 $10 $15 $20 $25 $30 $35 2013 2014 2015 Guidance Free Cash Flow $ Cash Conversion % Profitability Trends ($M) $450 $475 $500 $525 $550 2012 2013 2014 2015 Guidance Bookings Note: 2015 Guidance includes impact of Orad Acquisition from June 23, 2015
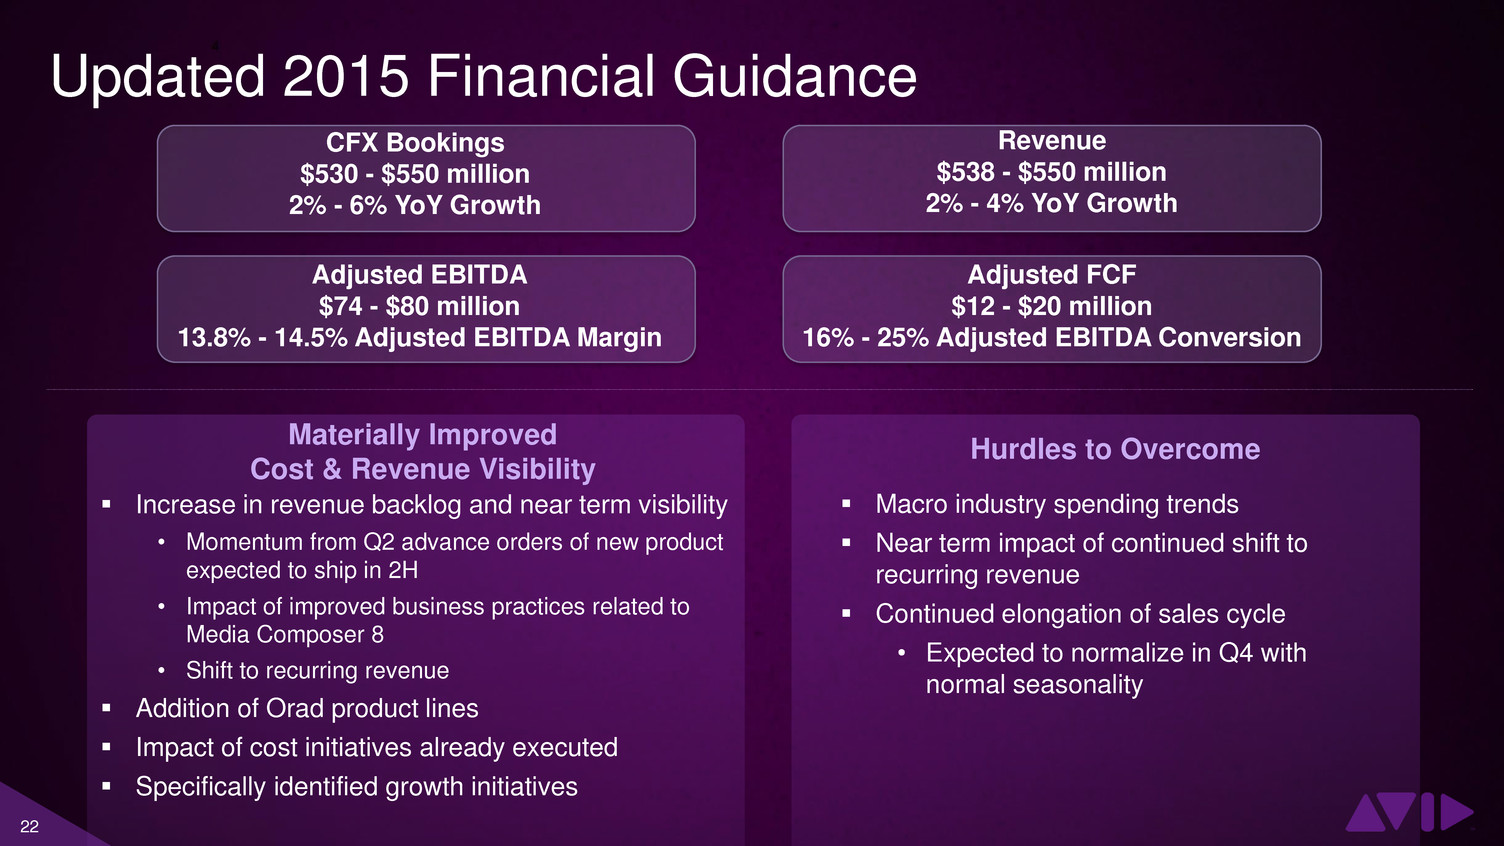
22 Materially Improved Cost & Revenue Visibility Revenue $538 - $550 million 2% - 4% YoY Growth Adjusted EBITDA $74 - $80 million 13.8% - 14.5% Adjusted EBITDA Margin Adjusted FCF $12 - $20 million 16% - 25% Adjusted EBITDA Conversion Hurdles to Overcome Macro industry spending trends Near term impact of continued shift to recurring revenue Continued elongation of sales cycle • Expected to normalize in Q4 with normal seasonality Increase in revenue backlog and near term visibility • Momentum from Q2 advance orders of new product expected to ship in 2H • Impact of improved business practices related to Media Composer 8 • Shift to recurring revenue Addition of Orad product lines Impact of cost initiatives already executed Specifically identified growth initiatives Updated 2015 Financial Guidance CFX Bookings $530 - $550 million 2% - 6% YoY Growth

23 Growth and Visibility on a Scalable Operating Model Focus on a leaner, more directed cost structure enabled by common platform architecture R e v e n u e C o st s Bookings have hit a growth inflection point and Avid has turned on 5 key growth engines enabled by Avid Everywhere Align resources to support growth engines Product rationalization Indirect procurement Indirect procurement Labor arbitrage and facility rationalization Clear focus on ROI supported investments Direct Reseller Digital Media Central platform adoption enabling cross-selling of existing product suite Expand cross-sell through natural extensions of current product suite Sell new products beyond our traditional workflows all the way to consumption Sell third-party products via the connectivity toolkit and AppStore by leveraging Media Central Platform Enter the Tier III market aggressively via cloud subscription and marketplace

