Attached files
| file | filename |
|---|---|
| 8-K - FORM 8-K - Northern Power Systems Corp. | d50496d8k.htm |
| EX-99.1 - EX-99.1 - Northern Power Systems Corp. | d50496dex991.htm |
 Troy
Patton – CEO
Ciel Caldwell – CFO August 12, 2015 Q2 2015 Earnings Presentation Northern Power Systems Exhibit 99.2 |
| FORWARD LOOKING STATEMENT AND NON -GAAP DISCLOSURES 2 All statements and other information contained in this document related to anticipated future events or results constitute forward-looking statements. Forward-looking statements often, but not always, are identified by the use of words such as “seek”, “anticipate”, “believe”, “plan”, “estimate”, “expect”, “intend”, “forecast”, “project”, “likely”, “potential”, “targeted” and “possible” and statements that an event or result “may”, “will”, “would”, “should”, “could” or “might” occur or be achieved and other similar expressions. Forward-looking statements are subject to known and unknown business and economic risks and uncertainties and other factors that could cause actual results of operations to differ materially from those expressed or implied by the forward-looking statements. Forward- looking statements are based on estimates and opinions of management at the date the statements are made. Northern Power Systems does not undertake any obligation to update forward-looking statements even if circumstances or management’s estimates or opinions should change, except as required by law. For the reasons set forth above, investors should not place undue reliance on forward-looking statements. This presentation references non-GAAP financial measures with the required reconciliation referenced in the table captioned “Non-GAAP Reconciliations” to the most comparable GAAP financial measures. |
 Presentation Organization and Call Details
3 Q&A Session: Immediately following prepared remarks Link from IR webpage at http://www.ir.northernpower.com/events- and-presentations.aspx Troy Patton President and CEO Ciel Caldwell CFO Presentation Organization: Q2 2015 business update Q2 2015 operational and financial results review GAAP to Non-GAAP reconciliations Hosted by: |
 NPS’
Business Lines Fully developed strategic
partnership approach
Successfully deployed in China
and Brazil to date
4 High-margin Development Expansion of IP portfolio NPS 2MW turbine platform Converter and Controls Systems NPS 60/100kW Technology Licensing Product Sales & Service Technology Development |
 ($5) ($4) ($3) ($2) ($1) $0 $1 (2.9) (3.0) (2.2) (3.1) (2.5) (1.2) 0.5 (1.6) (3.3)*** (2.7) (0.3) (2.4) (3.3) Business Expansion Trends 5 $0 $10 $20 $30 $40 $50 21 34 36 45 48 40 47 41 43 41 BACKLOG ** $0 $2 $4 $6 $8 $10 $12 $14 $16 1.7 4.3 9.0 13.8* 13.8 15.0 14.0 8.3 12.5 REVENUE 5.6 5 Bridge to Net Loss Non-GAAP EBITDA (Loss)/Income (2.2) (4.1)*** (3.1) *Includes the impact of delayed Q413 turbine deliveries ***Includes $0.6M of costs related to a considered financing transaction
(4.9) (3.1) (2.8) (3.4) **Represents currency fluctuation impact |
 Q2 2015:
Product Sales and Service Update Strong long-term European
demand Demand continues to build in Italy after
recent favorable regulations announced
Strong continued demand in UK
Distributed wind turbines remain core
product Returning strength in orders and execution Blade production stabilized producing adequate high quality blades Blade costs high in second quarter reducing in third quarter and beyond Distributed wind emerging as an ever- important element of a distributed generation portfolio Solar has exposed consumers and utilities to the benefits of distributed generation Wind capacity factors double that of solar 6 NPS 2MW turbine platform Converter and Controls Systems NPS 60/100kW Product Sales & Service Distributed Turbines |
 Q2 2015:
Product Sales and Service Update NPS Flexphase
power converters serve
utility needs in complex grids
FIAMM storage systems (partnering with
NPS) provide reliable power to crowded
transmission systems MCM controllers and system integration (partnering with NPS) bring unique microgrid control to challenging demand-response situations Through direct IP and key partnerships, NPS becomes a solution provider for complex grid challenges that combine value price points and high reliability 7 NPS 2MW turbine platform Converter and Controls Systems NPS 60/100kW Product Sales & Service Power Systems |
 Q2 2015:
Technology Licensing & Development Update WEG 2.1MW turbine production
has achieved a steady 8 units per month
Healthy and increasing order backlog
at over 500MW Actively exploring other regions & expanded WEG relationship WEG 3.3MW development progressing as scheduled: Expecting design completion in 2016 Backbone of planned development activity for next twelve months 8 Fully developed strategic partnership approach Successfully deployed in China and Brazil to date Technology Licensing Technology Development High-margin Development Expansion of IP portfolio |
 Q2 2015:
Key Financial Metrics 9
Q2 2015 YTD 2015 Revenue • $12.5M • 9% y/y reduction • 51% q/q growth • $20.8M • 24% y/y reduction Backlog • $41M • 1% y/y increase • Currency fluctuation impact of approximately 10% Gross Margin • 9.3% • PY at 15.9% • Q1 22.2% • 14.5% • PY at 12.3% Net Loss • ($3.3M) • 57% y/y loss increase • ($.14/share) • 20% q/q improvement • ($7.4M) • 42% y/y loss increase • ($.33/share) Non-GAAP EBITDA Loss • ($2.7M) • 125% y/y loss increase • ($.12/share) • 18% q/q improvement • ($6.2M) • 57% y/y loss increase • ($.25/share) |
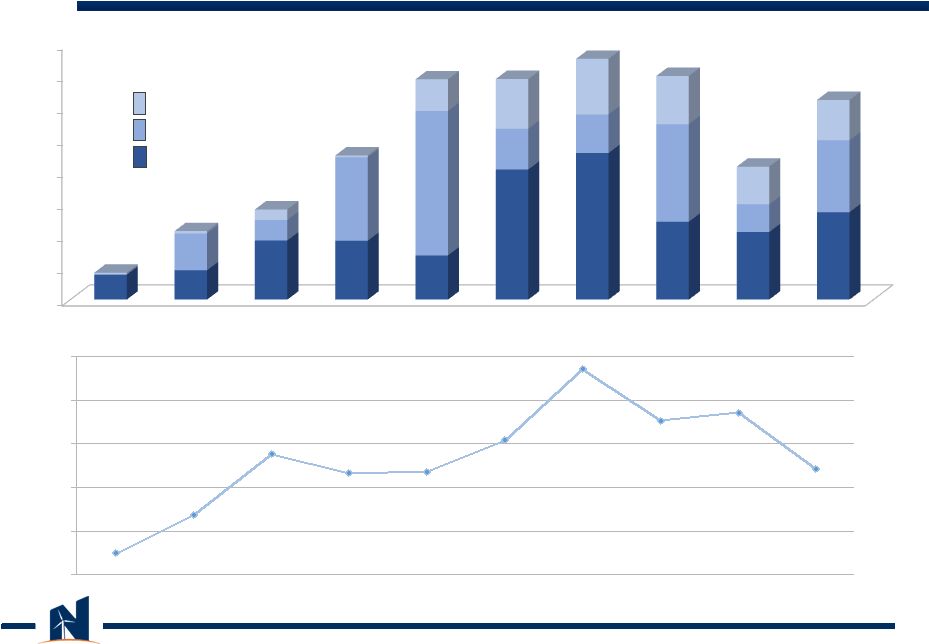 Revenue
and Gross Margin Trends 10
Q1 ‘15 -9.9% -1.3% 12.7% 8.4% 8.7% 15.9% 32.2% 20.4% 22.2% 9.3% -15.0% -5.0% 5.0% 15.0% 25.0% 35.0% Q1 ‘14 Q3 ‘14 Q4 ‘14 $0 $2 $4 $6 $8 $10 $12 $14 $16 High-wind Regimes Non-turbine Revenue Low-wind Regimes Q2 ‘13 Q1 ‘13 Q3 ‘13 Q4 ‘13 Q2 ‘14 Q2 ‘15 |
 Q2 2015:
Other Financial Metrics Cash Flow Statement
Q2 2015 Q2 2014 Cash used in operations $0.1M • Change in operating assets / liab. $3.1M ($6.7M) • Change in operating assets / liab. ($5.5M) Cash (used in) provided by investing activities ($0.3M) $0.8M Cash provided by (used in) financing activities ($1.0M) $19.3M 11 Balance Sheet Metrics June 30, 2015 June 30, 2014 Cash and cash equivalents $6.1M $15.4M Inventory $15.2M $4.6M of which or 30% is in transit $13.6M Working capital line $3.0M* - * Comerica working capital line of credit was renewed and extended and is now available through 9/30/16 for up to $6M |
 Full
Year Revenue for first half of 2015 lower than first half of
2014 Year over year growth to resume in back half of year
Core business focus (utility through partnerships)
First Half Second Half Reach full production Year over Year topline growth Euro decrease Continued negative impact Core business gross margin pressure Core business margins improving; Potential Euro impact of >700bps 12 2015 Expectations Transitioning blade production Order and backlog expansion |
 Non-GAAP Reconciliations 13 * * * * * ****************** |
 Non-GAAP Reconciliations Non-GAAP adjusted EBITDA
14 Q1 2014 Q2 2014 Q3 2014 Q4 2014 Q1 2015 Q2 2015 Net Loss $(3,124) $(2,064) $(289) $(2,417) $(4,133) $(3,298) Interest 240 37 40 26 26 71 Taxes 14 15 412 454 385 383 Depreciation 178 391 194 179 190 193 Stock compensation 148 454 144 141 178 190 Non cash implied license revenue - - - - - (243) Loss on disposal of asset - - - 4 50 - Adjusted EBITDA $(2,544) $(1,167) $501 $(1,613) $(3,304) $(2,704) (All amounts in thousands) |