Attached files
| file | filename |
|---|---|
| EX-32.1 - EXHIBIT 32.1 - Kandi Technologies Group, Inc. | exhibit32-1.htm |
| EX-4.1 - EXHIBIT 4.1 - Kandi Technologies Group, Inc. | exhibit4-1.htm |
| EX-31.1 - EXHIBIT 31.1 - Kandi Technologies Group, Inc. | exhibit31-1.htm |
| EX-31.2 - EXHIBIT 31.2 - Kandi Technologies Group, Inc. | exhibit31-2.htm |
UNITED STATES
SECURITIES AND EXCHANGE COMMISSION
Washington, D.C.
20549
FORM 10-Q
[X] Quarterly Report Pursuant to Section 13 or 15(d) of the Securities Exchange Act of 1934
For the quarterly period ended June 30, 2015
or
[ ] Transition Report Pursuant to Section 13 or 15(d) of the Securities Exchange Act of 1934
For the transition period from ______ to______
Commission file number 001-33997
KANDI TECHNOLOGIES GROUP, INC.
(Exact name of registrant as specified in charter)
| Delaware | 90-0363723 |
| (State or other jurisdiction of | (I.R.S. Employer Identification No.) |
| incorporation or organization) |
Jinhua City Industrial Zone
Jinhua, Zhejiang
Province
People’s Republic of China
Post Code 321016
(Address of principal executive offices)
(86 - 579) 82239856
(Registrant’s
telephone number, including area code)
Indicate by check mark whether the registrant (1) has filed all
reports required to be filed by Section 13 or 15(d) of the Securities Exchange
Act of 1934 during the preceding 12 months (or for such shorter period that the
registrant was required to file such reports), and (2) has been subject to such
filing requirements for the past 90 days.
Yes
[X] No [ ]
Indicate by check mark whether the registrant has submitted
electronically and posted on its corporate Web site, if any, every Interactive
Data File required to be submitted and posted pursuant to Rule 405 of Regulation
S-T during the preceding 12 months (or for such shorter period that the
registrant was required to submit and post such files)
Yes
[X] No [ ]
Indicate by check mark whether the registrant is a large accelerated filer, an accelerated filer, a non-accelerated filer, or a smaller reporting company. See definitions of “large accelerated filer,” “accelerated filer” and “smaller reporting company” in Rule 12b-2 of the Exchange Act. (Check one):
| Large accelerated filer [ ] | Accelerated filer [X] |
| Non-accelerated filer [ ] | Smaller reporting company [ ] |
Indicate by check mark whether the registrant is a shell
company (as defined in Rule 12b-2 of the Exchange Act).
Yes [
] No [X]
As of August 3, 2015, the registrant had issued and outstanding 46,954,855 shares of common stock, par value $0.001 per share.
TABLE OF CONTENTS
| Page | ||
| PART I-- FINANCIAL INFORMATION | 2 | |
| Item 1. | Financial Statements | 2 |
| Condensed Consolidated Balance Sheets as of June 30, 2015 (unaudited) and December 31, 2014 | 2 | |
| Condensed Consolidated Statements of Income (Loss) and Comprehensive Income (Loss) (unaudited) – Three Months and six months Ended June 30, 2015 and 2014 | 3 | |
| Condensed Consolidated Statements of Cash Flows (unaudited) –Six Months Ended June 30, 2015 and 2014 | 4 | |
| Item 2. | Management’s Discussion and Analysis of Financial Condition and Results of Operations | 34 |
| Item 3. | Quantitative and Qualitative Disclosures about Market Risk | 49 |
| Item 4. | Controls and Procedures | 50 |
| PART II-- OTHER INFORMATION | 50 | |
| Item 1A. | Risk Factors | 50 |
| Item 5. | Other Information | 50 |
| Item 6. | Exhibits | 51 |
1
PART I-- FINANCIAL INFORMATION
Item 1. Financial Statements. (Unaudited)
KANDI TECHNOLOGIES GROUP, INC.
AND SUBSIDIARIES
CONDENSED CONSOLIDATED BALANCE SHEETS
| December 31, | ||||||
|
|
June 30, 2015 | 2014 | ||||
|
|
||||||
|
ASSETS |
||||||
|
|
||||||
|
Current assets |
||||||
|
Cash on cash equivalents |
$ | 9,463,991 | $ | 26,379,460 | ||
|
Restricted cash |
23,006,135 | 13,000,731 | ||||
|
Accounts receivable |
29,898,905 | 15,736,805 | ||||
|
Inventories (net of provision for slow moving inventory of 316,856 and 315,584 as of June 30, 2015 and December 31, 2014, respectively |
27,607,154 | 15,403,840 | ||||
|
Notes receivable |
10,541,927 | 9,060,441 | ||||
|
Other receivables |
311,086 | 238,567 | ||||
|
Prepayments and prepaid expense |
364,284 | 120,761 | ||||
|
Due from employees |
38,856 | 34,475 | ||||
|
Advances to suppliers |
6,829,462 | 6,901,505 | ||||
|
Amount due from JV Company, net |
101,958,555 | 51,450,612 | ||||
|
Deferred taxes assets |
- | - | ||||
|
TOTAL CURRENT ASSETS |
210,020,355 | 138,327,197 | ||||
|
|
||||||
|
LONG-TERM ASSETS |
||||||
|
Plant and equipment, net |
23,889,831 | 26,215,356 | ||||
|
Land use rights, net |
15,516,697 | 15,649,152 | ||||
|
Construction in progress |
58,785,276 | 58,510,051 | ||||
|
Deferred taxes assets |
- | - | ||||
|
Investment in associated company |
- | - | ||||
|
Investment in JV Company |
84,366,460 | 83,309,095 | ||||
|
Goodwill |
322,591 | 322,591 | ||||
|
Intangible assets |
536,353 | 577,401 | ||||
|
Other long term assets |
163,164 | 162,509 | ||||
|
TOTAL Long-Term Assets |
183,580,372 | 184,746,155 | ||||
|
|
||||||
|
TOTAL ASSETS |
$ | 393,600,727 | $ | 323,073,352 | ||
| CURRENT LIABILITIES | ||||||
| Accounts payables | $ | 100,772,098 | $ | 45,772,481 | ||
| Other payables and accrued expenses | 3,377,791 | 5,101,740 | ||||
| Short-term loans | 38,833,051 | 35,589,502 | ||||
| Customer deposits | 2,748,050 | 2,630,723 | ||||
| Notes payable | 9,953,009 | 5,702,121 | ||||
| Income tax payable | 2,350,173 | 1,835,685 | ||||
| Due to employees | 10,829 | 15,787 | ||||
| Deferred taxes liabilities | 569,499 | 230,864 | ||||
| Financial derivate - liability | 2,894,695 | 2,245,610 | ||||
| Deferred income | 58,162 | - | ||||
| Total Current Liabilities | 161,567,357 | 99,124,513 | ||||
| LONG-TERM LIABILITIES | ||||||
| Deferred taxes liabilities | 1,772,278 | 2,266,725 | ||||
| Bond payable | - | - | ||||
| Financial derivate - liability | 694,846 | 10,097,275 | ||||
| Total Long-Term Liabilities | 2,467,124 | 12,364,000 | ||||
| TOTAL LIABILITIES | 164,034,481 | 111,488,513 | ||||
| STOCKHOLDER'S EQUITY | ||||||
| Common stock, $0.001 par value; 100,000,000 shares authorized; 46,954,855 and 46,274,855 shares issued and outstanding at June 30,2015 and December 31,2014, respectively | 46,955 | 46,275 | ||||
| Additional paid-in capital | 195,740,366 | 190,258,037 | ||||
| Retained earnings (the restricted portion is $4,172,324 and $4,172,324 at June 30,2015 and December 31,2014, respectively) | 27,947,579 | 16,390,424 | ||||
| Accumulated other comprehensive income(loss) | 5,831,346 | 4,890,103 | ||||
| TOTAL STOCKHOLDERS' EQUITY | 229,566,246 | 211,584,839 | ||||
| TOTAL LIABILITIES AND STOCKHOLDERS' EQUITY | $ | 393,600,727 | $ | 323,073,352 |
See accompanying notes to condensed consolidated financial statements
2
KANDI TECHNOLOGIES GROUP, INC.
AND SUBSIDIARIES
CONDENSED CONSOLIDATED STATEMENTS OF INCOME (LOSS) AND
COMPREHENSIVE INCOME (LOSS)
(UNAUDITED)
|
|
Three Months Ended | Six Months Ended | ||||||||||
|
|
June 30, 2015 | June 30, 2014 | June 30, 2015 | June 30, 2014 | ||||||||
|
|
||||||||||||
|
REVENUES, NET |
$ | 47,963,460 | $ | 32,960,055 | $ | 91,744,546 | $ | 73,131,359 | ||||
|
|
||||||||||||
|
COST OF GOODS SOLD |
41,471,997 | 25,738,967 | 78,882,350 | 61,049,862 | ||||||||
|
|
||||||||||||
|
GROSS PROFIT |
6,491,463 | 7,221,088 | 12,862,196 | 12,081,497 | ||||||||
|
|
||||||||||||
|
OPERATING EXPENSES: |
||||||||||||
|
Research and development |
571,621 | 971,673 | 1,142,641 | 2,143,930 | ||||||||
|
Selling and marketing |
75,516 | 435,894 | 189,411 | 507,151 | ||||||||
|
General and administrative |
3,845,013 | 3,173,178 | 7,625,661 | 9,643,944 | ||||||||
|
Total Operating Expenses |
4,492,150 | 4,580,745 | 8,957,713 | 12,295,025 | ||||||||
|
|
||||||||||||
|
INCOME FROM OPERATIONS |
1,999,313 | 2,640,343 | 3,904,483 | (213,528 | ) | |||||||
|
|
||||||||||||
|
OTHER INCOME(EXPENSE): |
||||||||||||
|
Interest income |
722,843 | 748,843 | 1,313,323 | 1,232,136 | ||||||||
|
Interest (expense) |
(597,320 | ) | (963,838 | ) | (1,195,911 | ) | (1,918,311 | ) | ||||
|
Change in fair value of financial |
||||||||||||
|
|
4,003,044 | 8,941,569 | 8,753,344 | (3,372,602 | ) | |||||||
|
instruments |
||||||||||||
|
Government grants |
92,863 | 153,700 | 92,863 | 153,700 | ||||||||
|
Share of (loss) in associated companies |
- | (77,187 | ) | - | (92,992 | ) | ||||||
|
Share of profit after tax of JV |
251,167 | (9,526 | ) | 720,523 | 1,718,830 | |||||||
|
Other income, net |
82,207 | 60,247 | 106,054 | 119,827 | ||||||||
|
Total other income(expense), net |
4,554,804 | 8,853,808 | 9,790,196 | (2,159,412 | ) | |||||||
|
|
||||||||||||
|
INCOME(LOSS) BEFORE INCOME |
||||||||||||
|
|
6,554,117 | 11,494,151 | 13,694,679 | (2,372,940 | ) | |||||||
|
TAXES |
||||||||||||
|
|
||||||||||||
|
INCOME TAX EXPENSE |
(1,128,615 | ) | (337,066 | ) | (2,137,524 | ) | (556,135 | ) | ||||
|
NET INCOME (LOSS) |
5,425,502 | 11,157,085 | 11,557,155 | (2,929,075 | ) | |||||||
|
|
||||||||||||
|
OTHER COMPREHENSIVE INCOME |
||||||||||||
|
|
||||||||||||
|
Foreign currency translation |
448,032 | (717,476 | ) | 941,243 | (1,928,592 | ) | ||||||
|
|
||||||||||||
|
COMPREHENSIVE INCOME(LOSS) |
$ | 5,873,534 | $ | 10,439,609 | $ | 12,498,398 | $ | (4,857,667 | ) | |||
|
|
||||||||||||
|
WEIGHTED AVERAGE SHARES OUTSTANDING BASIC |
46,759,651 | 41,142,346 | 46,523,584 | 40,364,986 | ||||||||
|
|
||||||||||||
|
WEIGHTED AVERAGE SHARES OUTSTANDING DILUTED |
46,896,809 | 41,254,507 | 46,800,156 | 40,364,986 | ||||||||
|
|
||||||||||||
|
NET INCOME(LOSS) PER SHARE, BASIC |
$ | 0.12 | $ | 0.27 | $ | 0.25 | $ | (0.07 | ) | |||
|
|
||||||||||||
|
NET INCOME(LOSS) PER SHARE, DILUTED |
$ | 0.12 | $ | 0.27 | $ | 0.25 | $ | (0.07 | ) |
See accompanying notes to condensed consolidated financial statements
3
KANDI TECHNOLOGIES GROUP, INC.
AND SUBSIDIARIES
CONDENSED CONSOLIDATED STATEMENTS OF CASH FLOWS
(UNAUDITED)
|
|
Six Months Ended | |||||
|
|
June 30, 2015 | June 30, 2014 | ||||
|
|
||||||
|
CASH FLOWS FROM OPERATING ACTIVITIES: |
||||||
|
Net income(loss) |
$ | 11,557,155 | $ | (2,929,075 | ) | |
|
Adjustments to reconcile net income to net cash provided by operating activities |
||||||
|
Depreciation and amortization |
2,955,663 | 2,764,984 | ||||
|
Assets Impairments |
- | - | ||||
|
Deferred taxes |
(153,916 | ) | 924,449 | |||
|
|
||||||
|
Change in fair value of financial instruments |
(8,753,344 | ) | 3,372,602 | |||
|
|
||||||
|
Loss (income) in investment in associated companies |
- | 96,364 | ||||
|
|
||||||
|
Share of profit after tax of JV Company |
(720,523 | ) | (1,718,830 | ) | ||
|
|
||||||
|
Decrease in reserve for fixed assets |
- | - | ||||
|
Stock Compensation cost |
5,482,808 | - | ||||
|
|
||||||
|
Changes in operating assets and liabilities, net of effects of acquisition: |
||||||
|
(Increase) Decrease In: |
||||||
|
Accounts receivable |
(14,077,317 | ) | 11,955,855 | |||
|
Inventories |
(12,122,839 | ) | (8,544,033 | ) | ||
|
Other receivables |
(58,055 | ) | (231,945 | ) | ||
|
Due from employee |
(9,250 | ) | (2,390 | ) | ||
|
|
||||||
|
Prepayments and prepaid expenses |
(143,163 | ) | (44,194,377 | ) | ||
|
Amount due from JV Company |
(50,224,378 | ) | (31,680,191 | ) | ||
|
|
||||||
|
Increase (Decrease) In: |
||||||
|
Accounts payable |
54,732,723 | 31,083,370 | ||||
|
|
||||||
|
Other payables and accrued liabilities |
(1,716,848 | ) | 2,344,763 | |||
|
Customer deposits |
106,563 | 107,199 | ||||
|
Income Tax payable |
506,321 | (533,133 | ) | |||
|
Due to related party |
- | - | ||||
|
|
||||||
|
Net cash (used in ) provided by operating activities |
$ | (12,638,400 | ) | $ | (37,184,388 | ) |
|
|
||||||
|
|
||||||
|
CASH FLOWS FROM INVESTING ACTIVITIES: |
||||||
|
|
||||||
|
(Purchases)/Disposal of plant and equipment, net |
(291,895 | ) | (308,838 | ) | ||
|
Purchases of land use rights |
- | (1,669,648 | ) | |||
|
Purchases of construction in progress |
(39,361 | ) | (23,046 | ) | ||
|
Deposit for acquisition |
- | - | ||||
|
Asset acquisition, net of deposit |
- | - | ||||
|
Issuance of notes receivable |
(5,588,283 | ) | (21,468,326 | ) | ||
|
Repayment of notes receivable |
4,145,502 | 26,020,234 | ||||
|
Investment in JV Company |
- | - | ||||
|
Cash acquired in acquisition |
- | - | ||||
|
|
||||||
|
Net cash provided by (used in) investing activities |
$ | (1,774,037 | ) | $ | 2,550,376 | |
|
|
||||||
|
|
||||||
|
CASH FLOWS FROM FINANCING ACTIVITIES: |
||||||
|
Restricted cash |
(9,937,929 | ) | 1,628 | |||
|
|
||||||
|
Proceeds from short-term bank loans |
19,061,273 | 16,764,023 | ||||
|
|
||||||
|
Repayments of short-term bank loans |
(15,965,853 | ) | (16,764,023 | ) | ||
|
Proceeds from notes payable |
9,937,929 | 13,020,600 | ||||
|
Repayment of notes payable |
(5,716,427 | ) | (16,601,265 | ) | ||
|
|
||||||
|
Fund raising through issuing common stock and warrants |
- | - | ||||
|
|
||||||
|
Option exercise,stock awards & other financing |
- | 4,405,697 | ||||
|
Warrant exercise |
- | 22,447,914 | ||||
|
|
||||||
|
Common stock issued for acquisition, net of cost of capital |
- | 11,067,734 | ||||
|
|
||||||
|
Net cash (used in) provided by financing activities |
$ | (2,621,007 | ) | $ | 34,342,308 | |
|
|
||||||
|
NET INCREASE IN CASH AND CASH |
||||||
|
|
(17,033,444 | ) | (291,704 | ) | ||
|
EQUIVALENTS |
||||||
|
|
||||||
|
Effect of exchange rate changes on cash |
117,975 | (1,183,045 | ) | |||
|
|
||||||
|
Cash and cash equivalents at beginning of year |
26,379,460 | 12,762,369 | ||||
|
CASH AND CASH EQUIVALENTS AT END OF PERIOD |
9,463,991 | 11,287,620 | ||||
|
|
||||||
|
SUPPLEMENTARY CASH FLOW INFORMATION |
||||||
|
Income taxes paid |
1,310,173 | 1,145,600 | ||||
|
Interest paid |
1,192,526 | 1,170,556 | ||||
See accompanying notes to condensed consolidated financial statements
4
NOTE 1 - ORGANIZATION AND PRINCIPAL ACTIVITIES
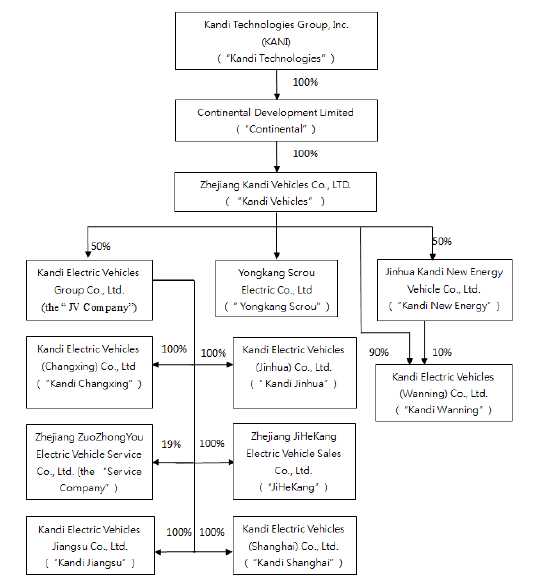
Kandi Technologies Group, Inc. (“Kandi Technologies”) was incorporated under the laws of the State of Delaware on March 31, 2004. Kandi Technologies changed its name from Stone Mountain Resources, Inc. to Kandi Technologies, Corp. on August 13, 2007. On December 21, 2012, Kandi Technologies changed its name to Kandi Technologies Group, Inc. As used herein, the term the “Company” means Kandi Technologies and its operating subsidiaries, as described below.
Headquartered in the Jinhua city, Zhejiang Province, China, the Company is one of China’s leading producers and manufacturers of electrical vehicle products, electrical vehicle parts and off-road vehicles for sale in the People’s Republic of China (the “PRC”) and global markets. The Company conducts its primary business operations through its wholly-owned subsidiary, Zhejiang Kandi Vehicles Co., Ltd. (“Kandi Vehicles”), and the partial and wholly-owned subsidiaries of Kandi Vehicles.
The Company’s organizational chart is as follows:
Operating Subsidiaries:
Pursuant to relevant agreements executed in January 2011, Kandi Vehicles is entitled to 100% of the economic benefits, voting rights and residual interests (100% the profits and losses) of Jinhua Kandi New Energy Vehicles Co., Ltd. (“Kandi New Energy”), a company in which Kandi Vehicles has a 50% interest. Kandi New Energy was established in accordance with relevant Chinese government regulations on automobile manufacturing enterprises, which prohibit foreign ownership of greater than 50%. Mr. Hu Xiaoming owns the other 50%, which he entrusted to Kandi Vehicles to manage. Kandi New Energy currently holds vehicle production rights (a PRC license) to manufacture Kandi-brand electric utility vehicles (“Special-purpose Vehicles”) and production rights (a PRC license) to manufacture battery packs used in Kandi-brand electric vehicles (“EVs”). Kandi New Energy supplies battery packs for Kandi-brand EVs.
5
In April 2012, pursuant to a share exchange agreement, the Company acquired 100% of YongkangScrou Electric Co, Ltd. (“YongkangScrou”), a manufacturer of automobile and EV parts, including EV drive motors, EV controllers, air conditioners and other electrical products, that are sold primarily to the JV Company (defined below).
As a part of the Company’s EV business strategy, the Company believes it needs more production resources to timely and efficiently satisfy the market demands. In March 2013, pursuant to a joint venture agreement (the “JV Agreement”) entered into by and between Kandi Vehicles and Shanghai Maple Guorun Automobile Co., Ltd. (“Shanghai Guorun”), a 99%-owned subsidiary of Geely Automobile Holdings Ltd. (“Geely”), the parties established Zhejiang Kandi Electric Vehicles Co., Ltd. (the “JV Company”) to develop, manufacture and sell EVs and related auto parts, and to invest in other companies with related or similar businesses. Each of Kandi Vehicles and Shanghai Guorun has a 50% ownership interest in the JV Company. In March 2014, the JV Company changed its name to Kandi Electric Vehicles Group Co., Ltd. At present, the JV Company is a holding company with products that are manufactured by its subsidiaries.
In March 2013, Kandi Vehicles formed Kandi Electric Vehicles (Changxing) Co., Ltd. (“Kandi Changxing”) in the Changxing (National) Economic and Technological Development Zone. Kandi Changxing is engaged in the production of EVs. In the fourth quarter of 2013, Kandi Vehicles entered into an ownership transfer agreement with the JV Company pursuant to which Kandi Vehicles transferred 100% of its ownership in Kandi Changxing to the JV Company. The Company, indirectly through its 50% ownership interest in the JV Company, has a 50% economic interest in Kandi Changxing.
In April 2013, Kandi Electric Vehicles (Wanning) Co., Ltd. (“Kandi Wanning”) was formed in Wanning City of Hainan Province by Kandi Vehicles and Kandi New Energy. Kandi Vehicles has a 90% ownership in Kandi Wanning, and Kandi New Energy has the remaining 10% interest. However, by contract, Kandi Vehicles is, effectively, entitled to 100% of the economic benefits, voting rights and residual interests (100% of the profits and losses) of Kandi Wanning. According to the JV Agreement, once Kandi Wanning becomes fully operational, its entire equity interests will be transferred to the JV Company.
In July 2013, Zhejiang ZuoZhongYou Electric Vehicle Service Co., Ltd. (the “Service Company”) was formed. The Service Company is engaged in various pure EV leasing businesses. The JV Company has a 19% ownership interest in the Service Company. The Company, indirectly through its 50% ownership interest in the JV Company, has a 9.5% economic interest in the Service Company.
In November 2013, Zhejiang Kandi Electric Vehicles Jinhua Co., Ltd. (“Kandi Jinhua”) was formed by the JV Company. The JV Company has 100% ownership interest in Kandi Jinhua, and the Company, indirectly through its 50% ownership interest in the JV Company, has a 50% economic interest in Kandi Jinhua. According to the terms of the JV Agreement, except through the JV Company and its subsidiaries, Kandi Vehicle and its subsidiaries are not allowed to manufacture pure EVs. However, Kandi New Energy holds the production rights (a PRC license) to manufacture of Special-purpose Vehicles. Therefore, it was necessary to establish Kandi Jinhua, which is in charge of the Special-purpose Vehicle business and entitled to use Kandi New Energy’s Special-purpose Vehicle production rights (license).
In November 2013, Zhejiang JiHeKang Electric Vehicle Sales Co., Ltd. (“JiHeKang”) was formed by the JV Company and is engaged in the EV car sales business. The JV Company has 100% ownership interest in JiHeKang, and the Company, indirectly through its 50% ownership interest in the JV Company, has a 50% economic interest in JiHeKang.
In December 2013, the JV Company entered into an ownership transfer agreement with Shanghai Guorun pursuant to which the JV Company acquired 100% ownership of Kandi Electric Vehicles (Shanghai) Co., Ltd. (“Kandi Shanghai”). As a result, Kandi Shanghai is a wholly-owned subsidiary of the JV Company, and the Company, indirectly through its 50% ownership interest in the JV Company, has a 50% economic interest in Kandi Shanghai. Kandi Shanghai is mainly engaged in EV research and development, manufacturing and sales.
6
In January 2014, Zhejiang Kandi Electric Vehicles Jiangsu Co., Ltd. (“Kandi Jiangsu”) was formed by the JV Company. The JV Company has a 100% ownership interest in Kandi Jiangsu, and the Company, indirectly through its 50% ownership interest in the JV Company, has a 50% economic interest in Kandi Jiangsu. Kandi Jiangsu is mainly engaged in EV research and development, manufacturing and sales.
The Company’s primary business operations are the design, development, manufacturing and commercialization of EV products, EV parts, and off-road vehicles. As part of its strategic objective to become a leading manufacturer of EV products and related services, the Company has increased its focus on fuel efficient, pure EV products with a particular emphasis on expanding its market share in China.
NOTE 2 – LIQUIDITY
The Company had a working capital surplus of $48,452,998 as of June 30, 2015, an increase of $9,250,314 from $39,202,684 as of December 31, 2014.
As of June 30, 2015, the Company had credit lines from commercial banks of $38,833,051, all of which were used as of June 30, 2015. The Company believes that its cash flows generated internally may not be sufficient to support the growth of future operations and to repay short-term bank loans for the next twelve (12) months. However, the Company believes its cash reserves and its access to existing financing sources, including established relationships with PRC banks, will enable it to fund its ongoing operations.
The Company has historically financed its operations through short-term commercial bank loans from PRC banks. The term of these loans is typically for one year, and upon the payment of all outstanding principal and interest in a particular loan, the banks have typically rolled over the loan for additional one-year terms, with adjustments made to the interest rate to reflect prevailing market rates. The Company believes this situation has not changed and that short-term bank loans remain available on normal trade terms if needed.
On March 24, 2014, the Company raised approximately $11.05 million from the sale to two institutional investors of an aggregate of 606,000 shares of its common stock at a price of $18.24 per share. As part of the transaction, the Company also issued to the investors warrants for the purchase of up to 90,900 shares of common stock at an exercise price of $22.80 per share, with a term of 18 months from the date of issuance. In July 25, 2015, the Company adjusted the warrant exercise price to $9.72 per share in connection with the grant of employee stock options that triggered the warrant exercise price adjustment term according to the warrant agreement.
On September 4, 2014, the Company raised approximately $71.00 million before deducting fees to the placement agent and other offering expenses incurred from the sale to six institutional investors of an aggregate of 4,127,908 shares of its common stock at a price of $17.20 per share. As part of the transaction terms, the Company also issued to the investors warrants for the purchase of up to 743,024 shares of common stock at an exercise price of $21.50 per share, with a term of 17 months from the date of issuance. On July 25, 2015, the Company adjusted the warrant exercise price to $9.72 per share in connection with the grant of employee stock options that triggered the warrant exercise price adjustment term according to the warrant agreement.
NOTE 3 - BASIS OF PRESENTATION
The Company maintains its general ledger and journals with the accrual method accounting for financial reporting purposes. The financial statements and notes are representations of management. Accounting policies adopted by the Company conform to generally accepted accounting principles in the United States (“U.S. GAAP”) and have been consistently applied in the presentation of the Company’s financial statements.
7
The financial information included herein for the three-month and six-month period ended June 30, 2015 and 2014 are unaudited; however, such information reflects all adjustments, consisting of normal recurring adjustments, that are, in the opinion of management, necessary for a fair presentation of the Company’s condensed consolidated financial statements for these interim periods.
The results of operations for the three-month and six months ended June 30, 2015 are not necessarily indicative of the results expected for the entire fiscal year ending December 31, 2015.
NOTE 4 – PRINCIPLES OF CONSOLIDATION
The consolidated financial statements reflect the accounts of the Company and its ownership interest in following subsidiaries:
| (i) |
Continental, a wholly-owned subsidiary of the Company; |
| (ii) |
Kandi Vehicles, a wholly-owned subsidiary of Continental; |
| (iii) |
Kandi New Energy, a 50% owned subsidiary of Kandi Vehicles. Pursuant to relevant agreements executed in January 2011, Kandi Vehicles is entitled to 100% of the economic benefits, voting rights and residual interests of Kandi New Energy; |
| (iv) |
YongkangScrou, a wholly-owned subsidiary of Kandi Vehicles; |
| (v) |
Kandi Wanning, a subsidiary 10% owned by Kandi New Energy and 90% owned by Kandi Vehicles). |
All inter-company accounts and transactions have been eliminated in consolidation.
Equity Method Investees
The consolidated net income also includes the Company’s proportionate share of the net income or loss of its equity method investees as following:
| (i) |
The JV Company, a 50% owned subsidiary of Kandi Vehicles; |
| (ii) |
Kandi Changxing, a wholly-owned subsidiary of the JV Company. The Company, indirectly through its 50% ownership interest in the JV Company, has a 50% economic interest; |
| (iii) |
Kandi Jinhua, a wholly-owned subsidiary of the JV Company. The Company, indirectly through its 50% ownership interest in the JV Company, has a 50% economic interest; |
| (iv) |
JiHeKang, a wholly-owned subsidiary of the JV Company. The Company, indirectly through its 50% ownership interest in the JV Company, has a 50% economic interest; |
| (v) |
Kandi Shanghai, a wholly-owned subsidiary of the JV Company. The Company, indirectly through its 50% ownership interest in the JV Company, has a 50% economic interest; |
| (vi) |
Kandi Jiangsu, a wholly-owned subsidiary of the JV Company. The Company, indirectly through its 50% ownership interest in the JV Company, has a 50% economic interest; |
8
| (vii) |
The Service Company, a 19%-owned subsidiary of the JV Company. The Company, indirectly through its 50% ownership interest in the JV Company, has a 9.5% economic interest. |
All intra-entity profits and losses with the Company’s equity method investees have been eliminated.
NOTE 5 – USE OF ESTIMATES
The preparation of financial statements in conformity with U.S. GAAP requires management to make estimates and assumptions that affect the reported amounts of assets and liabilities and the disclosure of contingent assets and liabilities at the date of the consolidated financial statements, and the reported amounts of revenue and expenses during the reporting period. Management makes these estimates using the best information available at the time the estimates are made; however actual results when ultimately realized could differ from those estimates.
NOTE 6 - SUMMARY OF SIGNIFICANT ACCOUNTING POLICIES
(a) Economic and Political Risks
The Company’s operations are conducted in the PRC. As a result, the Company’s business, financial condition and results of operations may be influenced by the political, economic and legal environments in the PRC, and by the general state of the PRC economy. In addition, the Company’s earnings are subject to movements in foreign currency exchange rates when transactions are denominated in Renminbi (“RMB”), which is the Company’s functional currency. Accordingly, the Company’s operating results are affected by changes in the exchange rate between the U.S. dollar and the RMB.
The Company’s operations in the PRC are subject to special considerations and significant risks not typically associated with companies in North America and Western Europe. These include risks associated with, among others, the political, economic and legal environment and foreign currency exchange. The Company’s performance may be adversely affected by changes in the political and social conditions in the PRC, and by changes in governmental policies with respect to laws and regulations, anti-inflationary measures, currency conversion, remittances abroad, and rates and methods of taxation, among other things.
(b) Fair Value of Financial Instruments
ASC 820 establishes a three-tier fair value hierarchy, which prioritizes the inputs used in measuring fair value. The hierarchy prioritizes the inputs into three levels based on the extent to which inputs used in measuring fair value are observable in the market.
These tiers include:
Level 1—defined as observable inputs such as quoted prices in active markets;
Level 2—defined as inputs other than quoted prices in active markets that are either directly or indirectly observable; and
Level 3—defined as unobservable inputs in which little or no market data exists, therefore requiring an entity to develop its own assumptions.
As of June 30, 2015, the Company’s assets, measured at fair value, on a recurring basis, subject to the disclosure requirements of ASC 820, were as follows:
9
| Fair
Value Measurements at Reporting Date Using Quoted Prices in Carrying Value as of June 30, 2015 |
Active Markets for Identical Assets (Level 1) |
Significant Other Observable Inputs (Level 2) |
Significant Unobservable Inputs (Level 3) |
|||||||||
| Cash and cash equivalents | $ | 9,463,991 | $ | 9,463,991 | - | - | ||||||
| Restricted cash | $ | 23,006,135 | $ | 23,006,135 | - | - | ||||||
| Warrants | $ | 3,589,541 | - | - | $ | 3,589,541 |
Cash and cash equivalents consist primarily of highly-rated money market funds at a number of well-known institutions with original maturities of three months or less. Restricted cash represents time deposits on account, some of which are used to secure short-term bank loans and notes payable. The original cost of these assets approximates fair value due to their short term maturity.
Warrants, which are accounted as liabilities, are treated as derivative instruments, and are measured at each reporting date for their fair value using Level 3 inputs. Also see Note 6 (t).
(c) Cash and Cash Equivalents
The Company considers highly-liquid investments purchased with original maturities of three months or less to be cash equivalents.
Restricted cash, as of June 30, 2015 and December 31, 2014, represented time deposits on account, some of which were used to secure short-term bank loans and notes payable. As of June 30, 2015, the Company’s restricted cash was $23,006,135.
(d) Inventories
Inventories are stated at the lower of cost or net realizable value (market value). The cost of raw materials is determined on the basis of weighted average. The cost of finished goods is determined on the weighted average basis and comprises direct materials, direct labor and an appropriate proportion of overhead.
Net realizable value is based on estimated selling prices less selling expenses and any further costs expected to be incurred for completion. Adjustments to reduce the cost of inventory to its net realizable value are made, if required, for estimated excess, obsolescence, or impaired balances.
(e) Accounts Receivable
Accounts receivable are recognized and carried at net realizable value. An allowance for doubtful accounts is recorded in periods in which the Company determines a loss is probable, based on its assessment of specific factors, such as troubled collections, historical experience, accounts aging, ongoing business relations and other factors. Accounts are written off after an exhaustive collection effort. If accounts receivable are to be provided for, or written off, they are recognized in the consolidated statement of operations within the operating expenses line item. As of June 30, 2015 and December 31, 2014, the Company had no allowance for doubtful accounts, as per the management’s judgment based on their best knowledge.
10
As of June 30, 2015 and December 31, 2014, the credit terms with the Company’s customers were typically 90 to 120 days after delivery.
(f) Notes receivable
Notes receivable represent short-term loans to third parties with the maximum term of one year. Interest income will be recognized according to each agreement between a borrower and the Company on an accrual basis. If notes receivable are paid back, or written off, that transaction will be recognized in the relevant year. If the loan default is probable, reasonably assured and the loss can be reasonably estimated, the Company will recognize income if the written-off loan is recovered at a future date. In case of any foreclosure proceedings or legal actions being taken, the Company provides an accrual for the related foreclosure expenses and related litigation expenses.
(g) Prepayments
Prepayments represent cash paid in advance to suppliers, which also includes advances to raw material suppliers, mold manufacturers, and suppliers of equipment.
Advances for raw materials purchases typically are settled within two months by the Company’s receipt of raw materials. Prepayment is offset against purchase amount after equipment or materials are delivered.
(h) Plant and Equipment
Plant and equipment are carried at cost less accumulated depreciation. Depreciation is provided over the assets estimated useful lives, using the straight-line method. Leasehold improvements are amortized over the life of the asset or the term of the lease, whichever is shorter. Estimated useful lives are as follows:
| Buildings | 30 years |
| Machinery and equipment | 10 years |
| Office equipment | 5 years |
| Motor vehicles | 5 years |
| Molds | 5 years |
The cost and related accumulated depreciation of assets sold or otherwise retired are eliminated from the accounts and any gain or loss is included in the statement of income. The cost of maintenance and repairs is charged to expense as incurred, whereas significant renewals and betterments are capitalized.
(i) Construction in Progress
Construction in progress represents the direct costs of construction, the acquisition cost of buildings or machinery and design fees. Capitalization of these costs ceases, and the construction in progress is transferred to plant and equipment, when substantially all the activities necessary to prepare the assets for their intended use are completed. No depreciation is provided until the assets are completed and ready for their intended use.
(j) Land Use Rights
According to Chinese laws, land in the PRC is owned by the government and land ownership rights cannot be sold to an individual or to a private company. However, the government grants the user a “land use right” to use the land. The land use rights granted to the Company are being amortized using the straight-line method over a term of fifty years.
11
(k) Accounting for the Impairment of Long-Lived Assets
The Company periodically evaluates the carrying value of long-lived assets to be held and used, including intangible assets subject to amortization, when events and circumstances warrant such a review, pursuant to the guidelines established in Statement of Financial Accounting Standards (“SFAS”) No. 144 (now known as “ASC 360”). The carrying value of a long-lived asset is considered impaired when the anticipated undiscounted cash flow from such asset is separately identifiable and is less than its carrying value. In that event, a loss is recognized based on the amount by which the carrying value exceeds the fair market value of the long-lived asset. Fair market value is determined primarily using the anticipated cash flows discounted at a rate commensurate with the risk involved. Losses on long-lived assets to be disposed of are determined in a similar manner, except that fair market values are reduced for the cost to dispose.
During the three-month and six-month periods ended June 30, 2015, no impairment loss was recognized.
(l) Revenue Recognition
Revenue represents the invoiced value of goods sold. Revenue is recognized when the Company ships the goods to its customers and all of the following criteria are met:
- Persuasive evidence of an arrangement exists;
- Delivery has occurred or services have been rendered;
- The seller’s price to the buyer is fixed or determinable; and
- Collectability is reasonably assured.
The Company recognized revenue when the products and the risk they carry are transferred to the other party.
(m) Research and Development
Expenditures relating to the development of new products and processes, including significant improvements to existing products, are expensed as incurred. Research and development expenses were $571,621 and $971,673 for the three months ended June 30, 2015 and 2014, respectively. Research and development expenses were $1,142,641 and $2,142,930 for the six months ended June 30, 2015 and 2014, respectively.
(n) Government Grants
Grants and subsidies received from the PRC Government are recognized when the proceeds are received or collectible.
For the three months ended June 30, 2015 and 2014, $92,863 and $153,700, respectively, was received. For the six months ended June 30, 2015 and 2014, $92,863 and $153,700 was, respectively, received.
(o) Income Taxes
The Company accounts for income tax using an asset and liability approach, which allows for the recognition of deferred tax benefits in future years. Under the asset and liability approach, deferred taxes are provided for the net tax effects of temporary differences between the carrying amounts of assets and liabilities for financial reporting purposes and the amounts used for income tax purposes. The accounting for deferred tax calculation represents the management’s best estimate on the most likely future tax consequences of events that have been recognized in our financial statements or tax returns and related future anticipation. A valuation allowance is provided for deferred tax assets if it is more likely than not these items will either expire before the Company is able to realize their benefits, or that future realization is uncertain.
12
(p) Foreign Currency Translation
The accompanying consolidated financial statements are presented in United States dollars. The functional currency of the Company is the Renminbi (RMB). Capital accounts of the consolidated financial statements are translated into United States dollars from RMB at their historical exchange rates when the capital transactions occurred.
Assets and liabilities are translated at the exchange rates as of balance sheet date. Income and expenditures are translated at the average exchange rate of the reporting period, which rates are obtained from the website: http://www.oanda.com
| June 30, | December 31, | June 30, | |
| 2015 | 2014 | 2014 | |
| Period end RMB : USD exchange rate | 6.12880 | 6.15350 | 6.15770 |
| Average RMB : USD exchange rate | 6.13810 | 6.14821 | 6.14410 |
(q) Comprehensive Income
Comprehensive income is defined to include all changes in equity except those resulting from investments by owners and distributions to owners. Among other disclosures, all items that are required to be recognized under current accounting standards as components of comprehensive income are required to be reported in a financial statement that is presented with the same prominence as other financial statements. Comprehensive income includes net income and the foreign currency translation changes.
(r) Segments
In accordance with ASC 280-10, Segment Reporting, the Company’s chief operating decision makers rely upon the consolidated results of operations when making decisions about allocating resources and assessing performance of the Company. As a result of the assessment made by the chief operating decision makers, the Company has only one single operating segment. The Company does not distinguish between markets or segments for the purpose of internal reporting.
(s) Stock Option Expenses
The Company’s stock option expenses are recorded in accordance with ASC 718,Compensation — Stock Compensation, and ASC 505, Equity.
The fair value of stock options is estimated using the Black-Scholes-Merton model. The Company’s expected volatility assumption is based on the historical volatility of the Company’s common stock. The expected life assumption is primarily based on the expiration date of the option. The risk-free interest rate for the expected term of the option is based on the U.S. Treasury yield curve in effect at the time of grant.
The recognition of the stock option expenses is based on awards expected to vest, and there were no estimated forfeitures. ASC standards require forfeitures to be estimated at the time of grant and revised in subsequent periods, if necessary, if actual forfeitures differ from those estimates.
The stock-based option expenses for the three months and six months ended June 30, 2015 were both $2,036,555. See Note 20.
(t) Warrant Costs
The Company’s warrant costs are recorded in liabilities and equities, respectively, in accordance with ASC 480,Distinguishing Liabilities From Equity, ASC 505,Equity, and ASC 815,Derivatives and Hedging.
The fair value of a warrant, which is classified as a liability, is estimated using the Black-Scholes-Merton model and the lattice valuation model. The Company’s expected volatility assumption is based on the historical volatility of the Company’s common stock. The expected life assumption is primarily based on the expiration date of the warrant. The risk-free interest rate for the expected term of the warrant is based on the U.S. Treasury yield curve in effect at the time of measurement. The warrants, which are freestanding derivatives and are classified as liabilities on the balance sheet, will be measured at fair value on each reporting date, with decreases in fair value recognized in earnings and increases in fair values were recognized in expenses.
13
The fair value of equity-based warrants, which are not considered derivatives under ASC 815, is estimated using the Black-Scholes-Merton model. The Company’s expected volatility assumption is based on the historical volatility of the Company’s common stock. The expected life assumption is primarily based on the expiration date of the warrant. The risk-free interest rate for the expected term of the option is based on the U.S. Treasury yield curve in effect at the time of grant.
(u) Goodwill
The Company allocates goodwill from business combinations to reporting units based on the expectation that the reporting unit is to benefit from the business combination. The Company evaluates its reporting units on an annual basis and, if necessary, reassigns goodwill using a relative fair value allocation approach. Goodwill is tested for impairment at the reporting unit level on an annual basis and between annual tests if an event occurs or circumstances change that would more likely than not reduce the fair value of a reporting unit below its carrying value. These events or circumstances could include a significant change in the business climate, legal factors, operating performance indicators, competition, or sale or disposition of a significant portion of a reporting unit.
Application of the goodwill impairment test requires judgments, including the identification of reporting units, assignment of assets and liabilities to reporting units, assignment of goodwill to reporting units, and the determination of the fair value of each reporting unit. The Company first assesses qualitative factors to determine whether it is more likely than not that goodwill is impaired. If the more likely than not threshold is met, the Company performs a quantitative impairment test.
As of June 30, 2015, the Company determined that its goodwill was not impaired.
(v) Intangible assets
Intangible assets consist of tradenames and customer relations associated with the purchase price from the allocation of Yongkang Scrou. Such assets are being amortized over their estimated useful lives of 9.7 years. Intangible assets were straight-line amortized as of June 30, 2015.
(w) Accounting for Sale of Common Stock and Warrants
Gross proceeds are first allocated according to the initial fair value of the freestanding derivative instruments (i.e. the warrants issued to the Company’s investors in its previous offerings or the “Investor Warrants”). The remaining proceeds are allocated to common stock. The related issuance expenses, including the placement agent cash fees, legal fees, the initial fair value of the warrants issued to the placement agent and others were allocated between the common stock and the Investor Warrants based on how the proceeds are allocated to these instruments. Expenses related to the issuance of common stock were charged to paid-in capital. Expenses related to the issuance of derivative instruments were expensed upon issuance.
NOTE 7 – NEW ACCOUNTING PRONOUNCEMENTS
The Financial Accounting Standards Board (“FASB”) has issued Accounting Standards Update (“ASU”) No. 2015-01 “Simplifying Income Statement Presentation by Eliminating the Concept of Extraordinary Items”. The objective is to reduce the cost and complexity of income statement presentation by eliminating the concept of extraordinary items while maintaining or improving the usefulness of the information provided to the users of financial statements. The extraordinary items must meet two criteria: unusual nature and infrequency of occurrence. If an event or transaction meets the criteria for extraordinary classification, an entity is required to segregate the extraordinary item from the results of ordinary operations and show the item separately in the income statement, net of tax, after income from continuing operations. The entity also is required to disclose applicable income taxes and either. This amendment will be effective for annual periods, and interim periods within those annual periods, beginning after December 15, 2015. The Board decided to permit early adoption provided that the guidance is applied from the beginning of the fiscal year of adoption.
14
The FASB has issued ASU No. 2015-03 “Simplifying the Presentation of Debt Issuance Costs”. The objective is to require that debt issuance costs related to a recognized debt liability be presented in the balance sheet as a direct deduction from the carrying amount of that debt liability, consistent with debt discounts. The recognition and measurement guidance for debt issuance costs are not affected by the amendments in this Update. For public business entities, the amendments in this Update are effective for financial statements issued for fiscal years beginning after December 15, 2015, and interim periods within those fiscal years. For all other entities, the amendments in this Update are effective for financial statements issued for fiscal years beginning after December 15, 2015, and interim periods within fiscal years beginning after December 15, 2016. Early adoption of the amendments in this Update is permitted for financial statements that have not been previously issued.
The FASB has issued ASU No. 2015-05 “Intangibles-Goodwill and Other-Internal-Use Software”. The objective is to provide a guidance about whether a cloud computing arrangement includes a software license. If a cloud computing arrangement includes a software license, then the customer should account for the software license element of the arrangement consistent with the acquisition of other software licenses. If a cloud computing arrangement does not include a software license, the customer should account for the arrangement as a service contract. The amendment will not change GAAP for a customer accounting for service contracts. In addition, the guidance in this Update supersedes paragraph 350-40-25-16. Consequently, all software licenses within the scope of Subtopic 350-40 will be accounted for consistent with other licenses of intangible assets. For public business entities, the FASB decided that the amendments will be effective for annual periods, including interim periods within those annual periods, beginning after December 15, 2015. For all other entities, the amendment will be effective for annual periods beginning after December 15, 2015, and interim periods in annual periods beginning after December 15, 2016. Early adoption is permitted for all entities.
The FASB has issued ASU No. 2015-07 “Topic 820, Fair Value Measurement”, which permits a reporting entity, as a practical expedient, to measure the fair value of certain investments using the net asset value per share of the investment. The amendments in this Update remove the requirement to categorize within the fair value hierarchy all investments for which fair value is measured using the net asset value per share practical expedient. The amendments also remove the requirement to make certain disclosures for all investments that are eligible to be measured at fair value using the net asset value per share practical expedient. Rather, those disclosures are limited to investments for which the entity has elected to measure the fair value using that practical expedient. The amendments in this Update apply to reporting entities that elect to measure the fair value of an investment within the related scope by using the net asset value per share (or its equivalent) practical expedient.
The FASB has issued No. 2015-10 “Technical Corrections and Improvements”, which aims to address feedback received from stakeholders on the Codification and make improvements to GAAP. The amendments in this Update represent changes to clarify the Codification, correct unintended application of guidance, or make minor improvements to the Codification that are not expected to have a significant effect on current accounting practice or create a significant administrative cost to most entities. Some of the amendments will make the Codification easier to understand and apply by eliminating inconsistencies, providing needed clarifications, and improving the presentation of guidance in the Codification. The amendments in this Update will apply to all reporting entities within the scope of the affected accounting guidance. The amendments in this Update are effective for all entities for fiscal years, and interim periods within those fiscal years, beginning after December 15, 2015. Early adoption is permitted.
The FASB has issued No. 2015-11“Topic 330,Inventory”, which aims to simplify the measurement of inventory by changing the subsequent measurement guidance from the lower of cost or market to the lower of cost and net realizable value for inventory within the scope of this Update. The amendments in this Update do not apply to inventory that is measured using last-in, first-out (LIFO) or the retail inventory method. The amendments apply to all other inventory, which includes inventory that is measured using first-in, first-out (FIFO) or average cost. An entity should measure inventory within the scope of this Update at the lower of cost and net realizable value. Subsequent measurement is unchanged for inventory measured using LIFO or the retail inventory method. For public business entities, the amendments in this Update are effective for fiscal years beginning after December 15, 2016, including interim periods within those fiscal years. For all other entities, the amendments in this Update are effective for fiscal years beginning after December 15, 2016, and interim periods within fiscal years beginning after December 15, 2017.
15
Other accounting standards that have been issued or proposed by the FASB or other standards-setting bodies that do not require adoption until a future date are not expected to have a material impact on the Company’s consolidated financial statements upon adoption.
NOTE 8 – CONCENTRATIONS
(a) Customers
For the six-month period ended June 30, 2015, the Company’s major customers, each of whom accounted for more than 10% of the Company’s consolidated revenue, were as follows:
| Sales | Accounts Receivable | |||||||||||
| Six Months | Six Months | |||||||||||
| Ended | Ended | June 30 | December 31 | |||||||||
| June 30 | June 30 | |||||||||||
| Major Customers | 2015 | 2014 | 2015 | 2014 | ||||||||
| Kandi Electric Vehicles (Changxing) Co., Ltd. | 39% | 40% | 28% | 17% | ||||||||
| Zhejiang Zuozhongyou Electric Vehicle Service Co., Ltd. | 15% | - | 13% | - | ||||||||
| Shanghai Maple Auto Co., Ltd | - | 24% | - | 3% | ||||||||
| Kandi Electric Vehicles (Shanghai) Co., Ltd. | 39% | 15% | 36% | 16% | ||||||||
For the three-month period ended June 30, 2015, the Company’s major customers, each of whom accounted for more than 10% of the Company’s consolidated revenue, were as follows:
| Sales | Accounts Receivable | |||||||||||
| Three Months | Three Months | |||||||||||
| Ended | Ended | June 30 | December 31 | |||||||||
| June 30 | June 30 | |||||||||||
| Major Customers | 2015 | 2014 | 2015 | 2014 | ||||||||
| Kandi Electric Vehicles (Changxing) Co., Ltd. | 38% | 37% | 28% | 17% | ||||||||
| Shanghai Maple Auto Co., Ltd | - | 31% | - | 3% | ||||||||
| Kandi Electric Vehicles (Shanghai) Co., Ltd. | 54% | 12% | 36% | 16% | ||||||||
Both Kandi Changxing and Kandi Shanghai are wholly-owned subsidiaries of the JV Company. The Company indirectly has a 50% economic interest in each of Kandi Changxing and Kandi Shanghai through its 50% ownership interest in the JV Company. For the six months ended June 30, 2015, the Company sold $ 35,589,309 and $35,694,802 of battery packs, body parts, motors, air conditioning units, and other auto parts to Kandi Changxing and Kandi Shanghai, respectively. For the three months ended June 30, 2015, the Company sold $17,984,007 and $25,835,483 of battery packs, body parts, motors, air conditioning units, and other auto parts to Kandi Changxing and Kandi Shanghai, respectively. The balances due from both Kandi Changxing and Kandi Shanghai were included in amount due from JV Company, net on the Company’s balance sheets. See Note 23.
16
The Service Company is a 19% investment of the JV Company, and the Company indirectly has a 9.5% economic interest in it. For the three months ended June 30, 2015, the Company has the sales return for $462,251 from the Service Company; For the six months ended June 30, 2015, the Company has the sale of $13,450,394at June 30, 2015, respectively, of EV Parts to the Service Company and the balance due from it was $14,274,939 at June 30, 2015.
(b) Suppliers
For the six-month period ended June 30, 2015, the Company’s material suppliers, each of whom accounted for more than 10% of the Company’s total purchases, were as follows:
| Purchases | Accounts Payable | |||||||||||
| Six Months
Ended June, 30 |
Six Months
Ended June, 30 |
June, 30 | December, 31 | |||||||||
| Major Suppliers | 2015 | 2014 | 2015 | 2014 | ||||||||
| Zhejiang Xinneng Automotive Systems Co. Ltd. | 25% | - | 40% | 12% | ||||||||
| Zhejiang Tianneng Energy Technology Co., Ltd. | 21% | - | 25% | - | ||||||||
| Dongguan Chuangming Battery Technology Co., Ltd. | 12% | - | 11% | - | ||||||||
| Shandong Henyuan New Energy Tech Co., Ltd. | 6% | 30% | 15% | 32% | ||||||||
| Zhongju (Tianjin) New Energy Investment Co., Ltd. | - | 15% | - | 29% | ||||||||
For the three-month period ended June 30, 2015, the Company’s material suppliers, each of whom accounted for more than 10% of the Company’s total purchases, were as follows:
| Purchases | Accounts Payable | |||||||||||
| Major Suppliers | Three Months Ended June, 30 2015 |
Three Months Ended June, 30 2014 |
June, 30 2015 |
December, 31 2014 |
||||||||
| Zhejiang Xinneng Automotive Systems Co. Ltd. | 42% | - | 40% | 12% | ||||||||
| Dongguan Chuangming Battery Technology Co., Ltd. | 14% | - | 11% | - | ||||||||
| Lishen Energy Battery Systems Co. Ltd. | 10% | - | 8% | - | ||||||||
| Shandong Henyuan New Energy Tech Co., Ltd. | 2% | 52% | 15% | 32% | ||||||||
| Zhongju (Tianjin) New Energy Investment Co., Ltd. | - | 15% | - | 29% | ||||||||
17
NOTE 9 –EARNINGS (LOSS) PER SHARE
The Company calculates earnings per share in accordance with ASC 260, Earnings Per Share, which requires a dual presentation of basic and diluted earnings per share. Basic earnings per share are computed using the weighted average number of shares outstanding during the reporting period. Diluted earnings per share represents basic earnings per share adjusted to include the potentially dilutive effect of outstanding stock options, warrants and convertible notes (using the if-converted method). For the three months ended June 30, 2015 and 2014, the average number of potentially dilutive common shares was 137,158 and 112,161, respectively. For the six months ended June 30, 2015 and 2014, the average number of potentially dilutive common shares was 276,572 and 124,898, respectively.
The following is the calculation of earnings per share for the six-month periods ended June 30, 2015:
| For six months ended | ||||||
| June 30, | ||||||
| 2015 | 2014 | |||||
| Net income (loss) | $ | 11,557,155 | $ | (2,929,075 | ) | |
| Weighted average shares used in basic computation | 46,523,584 | 40,364,986 | ||||
| Dilutive shares | 276,572 | - | ||||
| Weighted average shares used in diluted computation | 46,800,156 | 40,364,986 | ||||
| Earnings (loss) per share: | ||||||
| Basic | $ | 0.25 | $ | (0.07 | ) | |
| Diluted | $ | 0.25 | $ | (0.07 | ) | |
The following is the calculation of earnings per share for the three-month periods ended June 30, 2015:
| For three months ended | ||||||
| June 30, | ||||||
| 2015 | 2014 | |||||
| Net income (loss) | $ | 5,425,502 | $ | 11,157,085 | ||
| Weighted average shares used in basic computation | 46,759,651 | 41,142,346 | ||||
| Dilutive shares | 137,158 | 112,161 | ||||
| Weighted average shares used in diluted computation | 46,896,809 | 41,254,507 | ||||
| Earnings (loss) per share: | ||||||
| Basic | $ | 0.12 | $ | 0.27 | ||
| Diluted | $ | 0.12 | $ | 0.27 | ||
Also see Note 18.
18
NOTE 10 - ACCOUNTS RECEIVABLE
Accounts receivable are summarized as follows:
| June 30, | December 31, | |||||
| 2015 | 2014 | |||||
| Accounts receivable | $ | 29,898,905 | $ | 15,736,805 | ||
| Less: Provision for doubtful debts | - | - | ||||
| Accounts receivable, net | $ | 29,898,905 | $ | 15,736,805 |
During the three months ended June 30, 2015 and 2014, the Company sold products to Kandi USA Inc., a company that operates under the trade name of Eliteway Motorsports (“Eliteway”), amounting to $0 and $1,628,096, respectively. During the six months ended June 30, 2015 and 2014, the Company sold products to Kandi USA Inc. amounting to $0 and $2,187,115, respectively. As of June 30, 2015 and December 31, 2014, the outstanding receivable due from Eliteway were $0 and $620,410, respectively.
Mr. Hu Wangyuan was the sole shareholder and officer of Eliteway, which served as a U.S. importer of the Company's products. Mr. Hu Wangyuan is the adult son of the Company's Chairman and Chief Executive Officer, Mr. Hu Xiaoming. For the six months ended June 30, 2015 and the year ended December 31, 2014, Eliteway and Mr. Hu Wangyuan were financially independent from the Company. The transactions between the Company and Eliteway were carried out at arm's-length without any preferential terms when compared with other customers at the comparative order size or volume.
NOTE 11 - INVENTORIES
Inventories are summarized as follows:
| June 30, | December 31, | |||||
| 2015 | 2014 | |||||
| Raw material | $ | 14,173,181 | $ | 3,621,428 | ||
| Work-in-progress | 5,206,314 | 3,104,678 | ||||
| Finished goods | 8,544,515 | 8,993,318 | ||||
| Total inventories | 27,924,010 | 15,719,424 | ||||
| Less: provision for slowing moving inventories | (316,856 | ) | (315,584 | ) | ||
| Inventories, net | $ | 27,607,154 | $ | 15,403,840 |
NOTE 12 - NOTES RECEIVABLE
Notes receivable are summarized as follows:
19
| June 30, | December 31, | |||||
| 2015 | 2014 | |||||
| Notes receivable from unrelated companies: | ||||||
| Due September 30, 2015, interest at 9.6% per annum | $ | 10,419,554 | $ | 8,117,888 | ||
| Bank acceptance notes | 122,373 | 942,553 | ||||
| Notes receivable | $ | 10,541,927 | $ | 9,060,441 |
Details of Notes receivable are as below as of June 30, 2015
| Index | Amount ($) |
Counter party | Relationship | Nature | Manner of settlement |
| 1 | 10,419,554 | Yongkang HuiFeng Guarantee Co., Ltd | No relationship beyond loan | Receive interest income | Not due |
| 2 | 122,373 | Kandi Changxing | Subsidiary of JV company |
payment for sales |
Not due |
Details of Notes Receivable are as below as of December 31, 2014
| Index | Amount ($) | Counter party | Relationship | Nature | Manner of settlement |
| 1 | 8,117,888 | Yongkang HuiFeng
Guarantee Co., Ltd |
No relationship beyond
loan |
Receive interest income |
Not due |
| 2 | 406,273 | Kandi Changxing | Subsidiary of JV company |
payment for sales | Not due |
| 3 | 455,025 | Kandi Shanghai | Subsidiary of JV
company |
payment for sales | Not due |
| 4 | 81,255 | Kandi Jinhua | Subsidiary of JV company |
payment for sales | Not due |
NOTE 13 – PLANT AND EQUIPMENT
Plant and equipment consisted of the following:
| June 30, | December 31, | |||||
| 2015 | 2014 | |||||
| At cost: | ||||||
| Buildings | $ | 14,621,421 | $ | 14,492,949 | ||
| Machinery and equipment | 8,031,455 | 7,916,281 | ||||
| Office equipment | 415,598 | 283,494 | ||||
| Motor vehicles | 356,345 | 355,547 | ||||
| Moulds | 34,670,969 | 34,523,167 | ||||
| 58,095,788 | 57,571,438 | |||||
| Less : Accumulated depreciation | ||||||
| Buildings | $ | (3,732,441 | ) | $ | (3,480,417 | ) |
| Machinery and equipment | (7,461,119 | ) | (7,371,047 | ) | ||
| Office equipment | (241,377 | ) | (220,944 | ) | ||
| Motor vehicles | (271,330 | ) | (254,331 | ) | ||
| Moulds | (22,442,765 | ) | (19,972,647 | ) | ||
| (34,149,032 | ) | (31,299,386 | ) | |||
| Less: provision for impairment for fixed assets | (56,925 | ) | (56,696 | ) | ||
| Plant and equipment, net | $ | 23,889,831 | $ | 26,215,356 |
20
As of June 30, 2015 and December 31, 2014, the net book value of plant and equipment pledged as collateral for bank loans was $10,587,343 and $10,816,480, respectively.
Depreciation expenses for the six months ended June 30, 2015 and 2014, was $2,719,388 and $2,540,032, respectively. Depreciation expenses for the three months ended June 30, 2015 and 2014, was $1,357,907 and $1,263,552, respectively.
NOTE 14 – LAND USE RIGHTS
The Company’s land use rights consisted of the following:
| June 30, | December 31, | |||||
| 2015 | 2014 | |||||
| Cost of land use rights | $ | 17,990,824 | $ | 17,786,170 | ||
| Less: Accumulated amortization | (2,474,127 | ) | (2,137,018 | ) | ||
| Land use rights, net | $ | 15,516,697 | $ | 15,649,152 |
As of June 30, 2015 and December 31, 2014, the net book value of land use rights pledged as collateral for the Company’s bank loans was $10,210,476 and $9,665,834, respectively. Also see Note 16.
The amortization expense for the six months ended June 30, 2015 and 2014 was $195,227 and $183,905, respectively. The amortization expense for the three months ended June 30, 2015 and 2014 was $97,848 and $94,382, respectively. Amortization expense for the next five years and thereafter is as follows:
| 2015 (six months) | $ | 195,227 | |
| 2016 | 390,454 | ||
| 2017 | 390,454 | ||
| 2018 | 390,454 | ||
| 2019 | 390,454 | ||
| Thereafter | 13,759,654 | ||
| Total | $ | 15,516,697 |
NOTE 15 - CONSTRUCTION-IN-PROGRESS
Construction-in-progress (“CIP”) relates to the facility being built in Wanning City of Hainan Province.
21
KandiWanning facility
In April 2013, Kandi Electric Vehicles (Wanning) Co., Ltd. (“KandiWanning”) was formed in Wanning City of Hainan Province. The Company signed an agreement with Wanning city government and planned to invest a total of RMB 1 billion, or $163,164,078, to develop a factory in Wanning with an annual production of 100,000 EVs. In 2013, the Company contracted with an unrelated third party equipment supplier, Nanjing Shangtong Auto Technologies Co., Ltd. (“Nanjing Shangtong”), to purchase equipment. The equipment was purchased and delivered according to the construction schedule and development of Kandi Wanning. As of June 30, 2015, a total amount of advances to suppliers of RMB 353,000,000, or $57,596,919, made by Kandi Wanning to Nanjing Shangtong for equipment purchases was transferred to CIP. None of CIP was transferred to property, plant and equipment at June 30, 2015. The Company expects the purchase and installation of the equipment will be completed by the end of 2015.
No depreciation is provided for CIP until such time as the facility is completed and placed into operation.
Information with respect to the Company’s CIP of June 30, 2015 is as follow:
| Total in CIP as | |||||||||||||
| of | |||||||||||||
| June 30, | Estimated Cost to | Estimated | Estimated | ||||||||||
| Project | 2015 | Complete | Total Cost | Completion Date | |||||||||
| Kandi Wanning facility | $ | 58,785,276 | $ | 104,378,802 | $ | 163,164,078 | December 2015 | ||||||
| Total | $ | 58,785,276 | $ | 104,378,802 | $ | 163,164,078 |
As of June 30, 2015 and December 31, 2014, the Company had CIP amounting to $58,785,276 and $58,510,051, respectively.
No interest expense has been capitalized for CIP at the end of June 30, 2015 and December 31, 2014, respectively.
NOTE 16 – SHORT TERM BANK LOANS
Short-term loans are summarized as follows:
| June 30, | December 31, | |||||
| 2015 | 2014 | |||||
| Loans from China Ever-bright Bank | ||||||
| Interest rate up 18% based on the base rate (The current base rate for one-year loan is 7.08%, effective from March 1, 2015), paid off on May 11, 2015, secured by the assets of the Company, guaranteed by Mr. Hu Xiaoming, Nanlong Group Co., Ltd. and Zhejiang Mengdeli Electric Co., Ltd. Also see Note 13 and Note 14. | 12,675,713 | |||||
| Interest rate 5.78% per annum, consist of $6,852,891 due October 28, 2015 and $5,873,907 due November 5, 2015, secured by the assets of the Company, guaranteed by Mr. Hu Xiaoming, Nanlong Group Co., Ltd. and Zhejiang Mengdeli Electric Co., Ltd. Also see Note 13 and Note 14. | 12,726,799 | |||||
| Loans from China Ever-growing Bank | ||||||
| Interest rate up 20% based on the base rate (The current base rate for one-year loan is 7.20%, effective from March 1, 2015), due April 22, 2015, guaranteed by Mr. Hu Xiaoming, Ms. Ling Yueping, and Zhejiang Shuguang industrial Co., Ltd. | 3,250,183 | |||||
| Loans from Hangzhou Bank | ||||||
| Interest rate 6.00% per annum, due October 20, 2015, secured by the assets of the Company. Also see Note 13 and Note 14. | 7,962,407 | 7,930,446 | ||||
| Interest rate 6.00% per annum, due November 17, 2015, secured by the assets of the Company. Also see Note 13 and Note 14. | 11,780,446 | 11,733,160 | ||||
| Interest rate at 5.35% per annum, due March 23, 2016, secured by the assets of the Company. Also see Note 13 and Note 14. | 6,363,399 | |||||
| $ | 38,833,051 | $ | 35,589,502 |
22
The interest expenses for the six months ended June 30, 2015 and 2014 were $1,184,586 and $1,169,626, respectively. The interest expenses for the three months ended June 30, 2015 and 2014 were $597,293 and $590,979, respectively.
As of June 30, 2015, the aggregate amount of short-term loans that was guaranteed by various third parties was $12,726,798.
| No. | Amount | Guarantor | ||
| 1 | $ | 12,726,799 | Jointly guaranteed by Zhejiang Mengdeli Electric Co Ltd (“ZMEC”) and Nanlong Group Co., Ltd. For Nanlong Group Co., Ltd, whose bank loans of $3,263,282 was also guaranteed by the Company. Also see Note 24. |
It is a common business practice among companies in the region of the PRC in which the Company is located to exchange guarantees for bank debt with no additional consideration given. It is considered a “favor for favor” business practice and is commonly required by Chinese lending banks, as in these cases.
NOTE 17 – NOTES PAYABLE
By issuing bank notes payables rather than paying cash to suppliers, the Company can defer the payments until the date the bank notes payable are due. Simultaneously, the Company may need to deposit restricted cash in banks to back up the bank notes payable. The restricted cash deposited in banks will generate interest income.
Notes payable are summarized as follows:
| June 30, | December 31, | |||||
| 2015 | 2014 | |||||
| Bank acceptance notes: | ||||||
| Due April 30, 2015 | $ | 4,062,729 | ||||
| Due May 4, 2015 | 826,847 | |||||
| Due June 2, 2015 | 812,545 | |||||
| Due July 8, 2015 | 3,589,610 | |||||
| Due July 21, 2015 | 815,820 | |||||
| Due July 23, 2015 | 1,631,641 | |||||
| Due July 30, 2015 | 652,656 | |||||
| Due December 1, 2015 | 3,263,282 | |||||
| Total | $ | 9,953,009 | 5,702,121 |
23
A bank acceptance note is a promised future payment or time draft, which is accepted and guaranteed by a bank and drawn on a deposit at the bank. The banker's acceptance specifies the amount of money, the date, and the person to which the payment is due.
After acceptance, the draft becomes an unconditional liability of the bank. But the holder of the draft can sell (exchange) it for cash at a discount to a buyer who is willing to wait until the maturity date for the funds in the deposit.
All of the bank acceptance notes do not bear interest, but are subject to bank charges of 0.05% of the principal as a commission on each transaction. Bank charges for notes payable were $4,969 and $6,510 for the six months ended June 30, 2015 and 2014, respectively. Bank charges for notes payable were $1,637 and $6,510 for the three months ended June 30, 2015 and 2014, respectively.
No restricted cash was held as collateral for the notes payable as of June 30, 2015 and December 31, 2014.
NOTE 18 – BOND PAYABLE
On December 27, 2013, the Company issued a bond in the amount of RMB 80,000,000, or $13,000,731, to China Ever-bright Securities Co. Ltd. and CITIC Securities Company Limited. The maturity of this bond was 3 years, and the material terms of this bond were similar to the terms of the bond issued in 2012 and repaid in August 2013, except that the interest rate was reduced to 11.5% . Bond interest was payable on December 27 in each of 2014, 2015 and 2016. In October 2014, the Company repaid, without a prepayment penalty, all principal and interest to China Ever-bright Securities Co. Ltd. and CITIC Securities Company Limited. For the year ended December 31, 2014, $1,262,691 of interest expense was paid. There was no bond payable as at the end of June 30, 2015 and December 31, 2014 respectively.
NOTE 19 – TAXES
(a) Corporation Income Tax
In accordance with the relevant tax laws and regulations of the PRC, applicable corporate income tax (“CIT”) rate is 25%. However, Kandi Vehicle is qualified as a high technology company in China and is entitled to pay a reduced income tax rate of 15%. The applicable CIT rate of each of Kandi Vehicle’s three subsidiaries, Kandi New Energy, Yongkang Scrou and Kandi Wanning, the JV Company and its subsidiaries and the Service Company is 25%.
The Company is qualified as a high technology company in China and is entitled to pay a reduced CIT rate of 15%. After combining with the research and development tax credit of 25% on certain qualified research and development expenses, the final effective reduced income tax rate is23.5% . The combined tax benefits were 26.8% . The actual effective income tax rate was reduced from 25% to 18.3 % at June 30, 2015.
According to the PRC CIT reporting system, the CIT sales cut-off base is concurrent with the value-added tax (“VAT”), which should be reported to the State Administration of Taxation (“SAT”) on a quarterly basis. Since the VAT and CIT are accounted for on a VAT tax basis that recorded all sales on a “State provided official invoices” reporting system, the Company is reporting the CIT according to the SAT prescribed tax reporting rules. Under the VAT tax reporting system, sales cut-off is not done on an accrual basis but rather on a VAT taxable reporting basis. Therefore, when the Company adopted U.S. GAAP using an accrual basis, the sales cut-off CIT timing (due to the VAT reporting system) created a temporary sales cut-off timing difference. This difference is reflected in the deferred tax assets or liabilities calculations on the income tax estimate reported in the Company’s annual report on Form 10-K.
Effective January 1, 2007, the Company adopted ASC 740, Income Taxes. The interpretation addresses the determination of whether tax benefits claimed or expected to be claimed on a tax return should be recorded in the financial statements.
24
Under ASC 740, Income Taxes, the Company may recognize the tax benefit from an uncertain tax position only if it is more likely than not that the tax position will be sustained on examination by the taxing authorities, based on the technical merits of the position. The tax benefits recognized in the financial statements from such a position should be measured based on the largest benefit that has a greater than fifty percent likelihood of being realized upon ultimate settlement. ASC 740 also provides guidance on de-recognition, classification, interest and penalties on income taxes, accounting in interim periods and requires increased disclosures.
As of June 30, 2015, the Company did not have a liability for unrecognized tax benefits. The Company files income tax returns with the U.S. Internal Revenue Services (“IRS”) and state tax authorities where the Company has operations. The Company is subject to U.S. federal or state income tax examinations by the IRS and relevant state tax authorities for years after 2006. During the periods open to examination, the Company has net operating loss carry forwards (“NOLs”) for U.S. federal and state tax purposes that have attributes from closed periods. Since these NOLs may be utilized in future periods, they remain subject to examination. The Company also files certain tax returns in China. As of June 30, 2015, the Company was not aware of any pending income tax examinations by U.S. or China tax authorities. The Company's policy is to record interest and penalties on uncertain tax provisions as income tax expense. As of June 30, 2015, the Company has no accrued interest or penalties related to uncertain tax positions. The Company has not recorded a provision for U.S. federal income tax for the three months or six months ended June 30, 2015 due to the accumulated net operating loss carry forward from prior years in the United States.
Income tax expense (benefit) for the six months ended June 30, 2015 and 2014 is summarized as follows:
| For the Six Months Ended | ||||||
| June 30, | ||||||
| (Unaudited) | ||||||
| 2015 | 2014 | |||||
| Current: | ||||||
| Provision for CIT | $ | 2,137,524 | $ | 556,135 | ||
| Provision for Federal Income Tax | - | - | ||||
| Deferred: | ||||||
| Provision for CIT | - | - | ||||
| Income tax expense (benefit) | $ | 2,137,524 | $ | 556,135 | ||
The Company’s income tax expense (benefit) differs from the “expected” tax expense for the six months ended June 30, 2015 and 2014 (computed by applying the U.S. Federal Income Tax rate of 34% and PRC CIT rate of 25%, respectively, to income before income taxes) as follows:
| For the Six Months Ended | ||||||
| June 30, | ||||||
| (Unaudited) | ||||||
| 2015 | 2014 | |||||
| Computed “expected” expense | $ | 2,021,518 | $ | (4,178,865 | ) | |
| Favorable tax rate | (1,660,950 | ) | (42,822 | ) | ||
| Permanent differences | 161,304 | (11,464 | ) | |||
| Valuation allowance | 1,615,652 | 4,789,286 | ||||
| Income tax expense (benefit) | $ | 2,137,524 | $ | 556,135 | ||
25
The tax effects of temporary differences that give rise to the Company’s net deferred tax assets and liabilities as of June 30, 2015 and December 31, 2014 are summarized as follows:
| June 30, | December 31, | |||||
| 2015 | 2014 | |||||
| (Unaudited) | ||||||
| Current portion: | ||||||
| Deferred tax assets (liabilities): | ||||||
| Expense | $ | 158,797 | $ | (80,016 | ) | |
| Subtotal | 158,797 | (80,016 | ) | |||
| Deferred tax assets (liabilities): | ||||||
| Sales cut-off difference derived from Value Added Tax | ||||||
| reporting system to calculate PRC Corporation Income | ||||||
| (728,297 | ) | (26,226 | ) | |||
| Tax in accordance with the PRC State Administration of | ||||||
| Taxation | ||||||
| Other | (124,623 | ) | ||||
| Subtotal | (728,297 | ) | (150,849 | ) | ||
| Total deferred tax assets (liabilities) – current portion | (569,500 | ) | (230,864 | ) | ||
| Non-current portion: | ||||||
| Deferred tax assets (liabilities): | ||||||
| Depreciation | (464,001 | ) | (551,697 | ) | ||
| Loss carried forward | 1,615,652 | 3,025,997 | ||||
| Valuation allowance | (1,615,652 | ) | (3,025,997 | ) | ||
| Subtotal | (464,001 | ) | (551,697 | ) | ||
| Deferred tax liabilities: | ||||||
| Accumulated other comprehensive gain | (1,308,276 | ) | (1,715,028 | ) | ||
| Subtotal | (1,308,276 | ) | (1,715,028 | ) | ||
| Total deferred tax assets – non-current portion | (1,772,277 | ) | (2,266,725 | ) | ||
| Net deferred tax assets (liabilities) | $ | (2,341,777 | ) | $ | (2,497,589 | ) |
(b) Tax Benefit (Holiday) Effect
For the six months ended June 30, 2015 and 2014, the PRC CIT rate was 25%. Certain subsidiaries of the Company were entitled to tax benefit (holidays) for the six months ended June 30, 2015 and 2014.
The combined effects of the income tax expense exemptions and reductions available to the Company for the three and six months ended June 30, 2015 and 2014 were as follows:
26
| For the Six Months Ended | ||||||
| June 30, | ||||||
| (Unaudited) | ||||||
| 2015 | 2014 | |||||
| Tax benefit (holiday) credit | $ | 1,660,950 | $ | 42,822 | ||
| Basic net income per share effect | $ | 0.036 | $ | 0.001 | ||
NOTE 20 - STOCK OPTIONS AND WARRANTS
(a) Stock Options
On February 11, 2009, the Compensation Committee of the Board of Directors of the Company approved the grant of stock options to purchase 2,600,000 shares of common stock at an exercise price of $0.80 per share to ten of the Company’s employees and directors. The stock options vested ratably over three years and expire on the tenth anniversary of the grant date. The Company valued the stock options at $2,062,964 and amortized the stock compensation expense using the straight-line method over the service period from February 11, 2009 through February 11, 2012. The value of the options was estimated using the Black Scholes Model with an expected volatility of 164%, expected life of 10 years, risk-free interest rate of 2.76% and expected dividend yield of 0.00% . On June 30, 2011, one of the Company's directors resigned, and his 6,668 unexercised options were forfeited. As of December 31, 2013, options for 2,366,672 shares have been exercised and 6,668 options have been forfeited. As of December 31, 2014, options for 2,593,332 shares had been exercised and options for 6,668 shares had been forfeited.
On October 6, 2009, the Company executed an agreement with Wang Rui and Li Qiwen, third-party consultants, whereby Mr. Wang and Mr. Li were to provide to the Company business development services in China in exchange for options to purchase 350,000 shares of the Company’s common stock at an exercise price of $1.50 per share. Per the agreement, options to purchase 250,000 shares vested and became exercisable on March 6, 2010, and options to purchase 100,000 shares vested and became exercisable on June 6, 2010. The options are issued under and subject to the terms of the Company’s 2008 Omnibus Long-Term Incentive Plan. As of December 31, 2014, options for 250,000 shares had been exercised and 100,000 shares had been forfeited due to the non-performance of services.
On May 29, 2015, the Compensation Committee of the Board of Directors of the Company approved the grant of stock options to purchase 4,900,000 shares of common stock at an exercise price of $9.72 per share to the Company’s senior staff. The stock options will vest ratably over three years and expire on the tenth anniversary of the grant date. The Company valued the stock options at $ 2,036,555 and will amortize the stock compensation expense using the straight-line method over the service period from May 29, 2015 through May 29, 2018. The value of the options was estimated using the Black Scholes Model with an expected volatility of 90%, expected life of 10 years, risk-free interest rate of 2.23% and expected dividend yield of 0.00% .
(b) Warrants
On June 26, 2013, the Company entered into a securities purchase agreement with certain institutional investors (the “Third Round Investors”) that closed on July 1, 2013, pursuant to which the Company sold to the Third Round Investors, in a registered direct offering, an aggregate of 4,376,036 shares of the Company’s common stock at a negotiated purchase price of $6.03 per share. Under the 2013 Securities Purchase Agreement, the Third Round Investors also received Series A warrants for the purchase of up to 1,750,415 shares of the Company’s common stock at an exercise price of $7.24 per share and an option to make an additional investment in the form of Series B warrants and Series C warrants: Series B warrants to purchase a maximum aggregate of 728,936 shares of the Company’s common stock at an exercise price of $7.24 per share and the Series C warrants to purchase a maximum aggregate of 291,574 shares of the Company’s common stock at an exercise price of $8.69 (the “Third Round Warrants”). In addition, the placement agent for this transaction also received warrants for the purchase of up to 262,562 shares of the Company’s common stock at an exercise price of $7.24 per share (the “Third Round Placement Agent Warrants”). As of June 30, 2014 all the Third Round Series A, Series B and Series C warrants had been exercised on a cash basis and the Third Round Placement Agent Warrants, which will expire on July 1, 2016, had a fair value of $10.64 per share.
27
On January 15, 2014, the Company sold to certain institutional investors warrants to purchase an aggregate of 1,429,393 shares of the Company’s common stock at an exercise price of $15 per share (the “Fourth Round Warrants”) for a total purchase price of approximately $14,294. According to the warrant subscription agreement by and among the Company and the holders, the exercise price was reduced by a credit of $0.01, which reflected the price per warrant share paid in connection with the issuance of the Fourth Round Warrants. Consequently, the effective exercise price per warrant share is $14.99. The Fourth Round Warrants were expired on January 30, 2015 and no investors exercised their warrants.
On March 19, 2014, the Company entered into a securities purchase agreement with certain purchasers (the “Fourth Round Investors”), pursuant to which the Company sold to the Fourth Round Investors, in a registered direct offering, an aggregate of 606,000 shares of common stock, at a negotiated purchase price of $18.24 per share, for aggregate gross proceeds to the Company of approximately $11,053,440, before deducting fees to the placement agent and other estimated offering expenses payable by the Company. As part of the transaction, the Fourth Round Investors also received warrants for the purchase of up to 90,900 shares of the Company’s common stock at an exercise price of $22.80 per share (the “Fifth Round Warrants”). In addition, the placement agent for this transaction also received warrants for the purchase of up to 36,360 shares of the Company’s common stock at an exercise price of $22.80 per share, which was adjusted to $9.72 on July 27, 2015. The Fourth Round Warrants have a term of eighteen months and are exercisable by the holders at any time after the date of issuance. As of June 30, 2015, the fair value of the Fourth Round Warrants was $0.89 per share.
On September 4, 2014, the Company entered in a securities purchase agreement with certain purchasers (the “Fifth Round Investors”), pursuant to which the Company sold to the Fifth Round Investors, in a registered direct offering, an aggregate of 4,127,908 shares of its common stock at a price of $17.20 per share, for aggregate gross proceeds to the Company of approximately $71 million, before deducting fees to the placement agent and other estimated offering expenses payable by the Company. As part of the transaction, the Fifth Round Investors also received warrants for the purchase of up to 743,024 shares of the Company’s common stock at an exercise price of $21.50 per share (the “Fifth Round Warrants”), which was adjusted to $9.72 on July 27, 2015. The Fifth Round Warrants have a term of seventeen months and are exercisable by the holders at any time after the date of issuance. In addition, the placement agent for this transaction also received warrants for the purchase of up to 206,395 shares of the Company’s common stock at an exercise price of $20.64 per share. The placement agent’s warrants are exercisable for a term of seventeen months after the six months from the issuance. As of June 30, 2015, the fair value of the Fifth Round Warrants was $2.02 per share and the Fifth Round Placement Agent Warrants had a fair value of $3.37 per share.
In addition, any Fifth Round Investor that invested more than $30 million in the initial offering of shares and warrants in the Fifth Round had an option to purchase its pro rata share of up to a $30 million of shares, or 1,744,186 shares of common stock, and its pro rata share of warrants to purchase an aggregate of up to 313,954 shares of our comment stock at $17.20 for a period commencing on September 4, 2014 and ending on November 17, 2014. As of November 17, 2014, none of the Fifth Round Investors that invested more than $30 million in the initial offering of shares and warrants in the Fifth Round exercised this option and such option expired.
NOTE 21 – STOCK AWARD
In connection with the appointment of Mr. Henry Yu as a member of the Board of Directors (the “Board”), and as compensation, the Board authorized the Company to provide Mr. Henry Yu with 5,000 shares of Company's restricted common stock every six months, beginning in July 2011.
As compensation for having Mr. Jerry Lewin to serve as a member of the Board, the Board authorized the Company to provide Mr. Jerry Lewin with 5,000 shares of Company's restricted common stock every six months, in August 2011.
28
As compensation for having Ms. Kewa Luo to serve as the Company’s investor relation officer, the Board authorized the Company to provide Ms. Kewa Luo with 5,000 shares of Company's common stock every six months, beginning in September 2013.
As compensation for having Mr. Wei Chen serve as CEO assistant, the Board authorized the issuance by the Company to Mr. Chen of 10,000 shares of Company’s common stock every year beginning in January 2012 and 2,500 shares of Company’s common stock every three months, beginning in January 2014. As of June 1, 2014, Mr. Chen was no longer with the Company.
The fair value of stock awards based on service is determined based on closing price of the common stock on the date the shares are granted. The compensation costs for awards of common stock are recognized over the requisite service period of six months.
On December 30, 2013, the Board approved a proposal (as submitted by the Compensation Committee) of an award for selected executives and other key employees comprising a total of 335,000 shares of common stock for each fiscal year, beginning with the 2013 fiscal year, under the Company’s 2008 Omnibus Long-Term Incentive Plan (the “Plan”), if the Company’s “Non-GAAP Net Income” for the current fiscal year increased by 10% comparing to that of the prior year. The specific number of shares of common stock to be issued in respect of such award could proportionally increase or decrease if the actual Non-GAAP Net Income increase is more or less than 10%. “Non-GAAP Net Income” means the Company’s net income for a particular year calculated in accordance with GAAP, excluding option-related expenses, stock award expenses, and the effects caused by the change of fair value of financial derivatives. For example, if Non-GAAP Net Income for the 2014 fiscal year increased by 10% compared to the Non-GAAP Net Income for the 2013 fiscal year, the selected executives and other key employees each would be granted his or her target amount of common stock of the Company. If Non-GAAP Net Income in 2014 is less than Non-GAAP Net Income in 2013, then no common stock would be granted. If Non-GAAP Net Income in 2014 increased compared to Non-GAAP Net Income in 2013 but the increase is less than 10%, then the target amount of the common stock grant would be proportionately decreased. If Non-GAAP Net Income in 2014 increased compared to Non- GAAP Net Income in 2013 but the increase is more than 10%, then the target amount of the common stock grant would be proportionately increased up to 200% of the target amount. Any such increase in the grant would be subject to the total number of shares available under the Plan, and the Company’s Board and shareholders will need to approve an increase in the number of shares reserved under the Plan if the number of shares originally reserved is used up.
The fair value of each award granted under the Plan is determined based on the closing price of the Company’s stock on the date of grant of the award. To the extent that the performance goal is not met and so no shares become due, no compensation cost is recognized and any recognized compensation cost during the applicable year is reversed. The number of shares of common stock granted under the Plan with respect to fiscal 2014 would be 670,000 shares based on the Non-GAAP Net Income of the year of 2014. The compensation expense is recognized in General and Administrative Expenses. On April 17, 2015 and June 12, 2015, the Company issued 550,000 shares and 120,000 shares, respectively, to the senior management and key employee as year 2014 performance awards.
NOTE 22 – INTANGIBLE ASSETS
The following table provides the gross carrying value and accumulated amortization for each major class of intangible assets other than goodwill:
29
| Remaining | June 30, | December 31, | |||||||
| useful life | 2015 | 2014 | |||||||
| Gross carrying amount: | |||||||||
| Trade name | 6.5 years | $ | 492,235 | $ | 492,235 | ||||
| Customer relations | 6.5 years | 304,086 | 304,086 | ||||||
| 796,321 | 796,321 | ||||||||
| Less : Accumulated amortization | |||||||||
| Trade name | $ | (160,695 | ) | $ | (135,323 | ) | |||
| Customer relations | (99,273 | ) | (83,597 | ) | |||||
| (259,968 | ) | (218,920 | ) | ||||||
| Intangible assets, net | $ | 536,353 | $ | 577,401 |
The aggregate amortization expense for those intangible assets that continue to be amortized is reflected in amortization of intangible assets in the consolidated statements of income, and comprehensive income was both $20,524 for the three-months ended June 30, 2015 and 2014, respectively, and both $41,048 for the six-months period ended June 30, 2015 and 2014, respectively.
Amortization expense for the next five years and thereafter is as follows:
| 2015 (six months) | $ | 41,048 | |
| 2016 | 82,095 | ||
| 2017 | 82,095 | ||
| 2018 | 82,095 | ||
| 2019 | 82,095 | ||
| Thereafter | 166,925 | ||
| Total | $ | 536,353 |
NOTE 23 – SUMMARIZED INFORMATION OF EQUITY METHOD INVESTMENT IN THE JV COMPANY
The Company’s consolidated net income includes the Company’s proportionate share of the net income or loss of the Company’s equity method investees. When the Company records its proportionate share of net income, it increases equity income (loss) – net in the Company’s consolidated statements of income and the Company’s carrying value in that investment. Conversely, when the Company records its proportionate share of a net loss, it decreases equity income (loss) – net in the Company’s consolidated statements of income and the Company’s carrying value in that investment. All intra-entity profits and losses with the Company’s equity method investees have been eliminated.
Kandi Electric Vehicles Group Co., Ltd. (the “JV Company”)
In March 2013, pursuant to a joint venture agreement (the “JV Agreement”) entered into between Kandi Vehicles and Shanghai Maple Guorun Automobile Co., Ltd. (“Shanghai Guorun”), a 99%-owned subsidiary of Geely Automobile Holdings Ltd. (“Geely”), the parties established Zhejiang Kandi Electric Vehicles Co., Ltd. (the “JV Company”) to develop, manufacture and sell electric vehicles (“EVs”) and related auto parts. Each of Kandi Vehicles and Shanghai Guorun has a 50% ownership interest in the JV Company. In the fourth quarter of 2013, Kandi Vehicles entered into an ownership transfer agreement with the JV Company pursuant to which Kandi Vehicles transferred 100% of its ownership in Kandi Changxing to the JV Company. As a result, the Company indirectly has a 50% economic interest in Kandi Changxing through its 50% ownership interest in the JV Company after this transfer. In November 2013, Zhejiang Kandi Electric Vehicles Jinhua Co., Ltd. (“Kandi Jinhua”) was formed by the JV Company. The JV Company has 100% ownership interest in Kandi Jinhua, and the Company, indirectly through its 50% ownership interest in the JV Company, has a 50% economic interest in Kandi Jinhua. In November 2013, Zhejiang JiHeKang Electric Vehicle Sales Co., Ltd. (“JiHeKang”) was formed by the JV Company. The JV Company has 100% ownership interest in JiHeKang, and the Company, indirectly through its 50% ownership interest in the JV Company, has a 50% economic interest in JiHeKang. In December 2013, the JV Company entered into an ownership transfer agreement with Shanghai Guorun pursuant to which the JV Company acquired 100% ownership of Kandi Electric Vehicles (Shanghai) Co., Ltd. (“Kandi Shanghai”). As a result, Kandi Shanghai is a wholly-owned subsidiary of the JV Company, and the Company, indirectly through its 50% ownership interest in the JV Company, has a 50% economic interest in Kandi Shanghai. In January 2014, Zhejiang Kandi Electric Vehicles Jiangsu Co., Ltd. (“Kandi Jiangsu”) was formed by the JV Company. The JV Company has 100% ownership interest in Kandi Jiangsu, and the Company, indirectly through its 50% ownership interest in the JV Company, has a 50% economic interest in Kandi Jiangsu. In addition, In July 2013, Zhejiang ZuoZhongYou Electric Vehicle Service Co., Ltd. (the “Service Company”) was formed. The JV Company has a 19% ownership interest in the Service Company. The Company, indirectly through its 50% ownership interest in the JV Company, has a 9.5% of economic interest in the Service Company. In March 2014, the JV Company changed its name to Kandi Electric Vehicles Group Co., Ltd.
30
As of June 30, 2015, the JV Company consolidated the following entities on its financial statements: (1) 100% interest in Kandi Changxing; (2) 100% interest in Kandi Jinhua; (3) 100% interest in JiHeKang; (4) 100% interest in Kandi Shanghai; and (5) 100% interest in Kandi Jiangsu.
The Company accounted for its investments in the JV Company under the equity method of accounting as the Company has a 50% ownership interest in the JV Company. Therefore, the Company’s consolidated net income for the three months and six months ended June 30, 2015, included equity income from the JV Company during such periods.
The combined results of operations and financial position of the JV Company are summarized below:
| Three months ended June 30, |
||||||
| 2015 | 2014 | |||||
| Condensed income statement information: | ||||||
| Net sales | $ | 68,952,347 | $ | 45,135,796 | ||
| Gross income | 10,652,743 | 2,638,447 | ||||
| % of net sales | 15.4% | 5.8% | ||||
| Net income | 1,585,902 | 728,994 | ||||
| % of net sales | 2.3% | 1.6% | ||||
| Company’s equity in net income of JV | $ | 792,951 | $ | 364,497 | ||
| Six months ended | ||||||
| June 30, | ||||||
| 2015 | 2014 | |||||
| Condensed income statement information: | ||||||
| Net sales | $ | 99,517,343 | $ | 79,995,840 | ||
| Gross income | 18,633,407 | 6,926,375 | ||||
| % of net sales | 18.7% | 8.7% | ||||
| Net income | 2,389,123 | 2,385,818 | ||||
| % of net sales | 2.4% | 3.0% | ||||
| Company’s equity in net income of JV | $ | 1,194,562 | $ | 1,192,909 | ||
31
| June 30, | December 31, | |||||
| 2015 | 2014 | |||||
| Condensed balance sheet information: | ||||||
| Current assets | $ | 327,875,380 | $ | 262,543,256 | ||
| Noncurrent assets | 195,014,272 | 194,229,114 | ||||
| Total assets | $ | 522,889,652 | $ | 456,772,370 | ||
| Current liabilities | 332,242,670 | 280,779,432 | ||||
| Noncurrent liabilities | 20,595,103 | 9,006,787 | ||||
| Equity | 170,051,879 | 166,986,151 | ||||
| Total liabilities and equity | $ | 522,889,652 | $ | 456,772,370 |
During the first six months of 2015, 100% of the JV Company’s revenues were derived from the sales of EV products in the PRC with a total of 6,116 units sold, 643 units of which were direct sales through the distribution company (“JiHeKang”) and the rest were sold to Micro Public Transportation Program (“MTP”,or the “EV-Share” Program). As the Company only has a 50% ownership interest in the JV Company and accounted for its investments in the JV Company under the equity method of accounting, the Company didn’t consolidate the JV Company’s financial results but included equity income from the JV Company during such periods.
Note: The following table illustrates the captions used in the Company’s Income Statements for its equity basis investments in the JV Company.
Changes in the Company’s equity method investment in JV Company for the six months ended June 30, 2015 and 2014 were as follows:
| Six Months Ended | ||||||
| June 30, | ||||||
| 2015 | 2014 | |||||
| Investment in JV Company, beginning of the period, | $ | 83,309,095 | $ | 79,331,930 | ||
| Investment in JV Company Share of profit | 1,194,561 | 1,192,909 | ||||
| Intercompany transaction elimination | (658,480 | ) | (386,009 | ) | ||
| Last year unrealized profit realized | 184,442 | 911,930 | ||||
| Exchange difference | 336,842 | (566,796 | ) | |||
| Investment in JV Company, end of the period | $ | 84,366,460 | $ | 80,483,964 | ||
Sales to the Company’s customers, the JV Company’s subsidiaries, for the three months ended June 30, 2015 were$45,515,354, and they were primarily the sales of battery packs, body parts, EV drive motors, EV controllers, air conditioning units and other auto parts, of which the majority of sales were to Kandi Changxing which amounted to $17,633,894, Kandi Shanghai which amounted to $27,869,812 and Kandi Jinhua which amounted to $11,649. Theses EV parts were used in manufacturing of pure EV products by the JV Company’s subsidiaries to sell entirely to the JV Company’s customer via Zhejiang Geely Automobile Company Limited (“Zhejiang Geely”). Zhejiang Geely holds the country’s vehicle production rights, equivalent to license, for sedans, which qualifies it to sell the EV products to the end customers. Zhejiang Geely is 90% owned by Zhejiang Geely Holding Group Company Limited and 10% owned by Zhejiang Maple Asset Management Co. Ltd. According to the JV Agreement, before the JV Company received vehicle production rights (license), the JV Company and its subsidiaries all may sell their products through the channel of Zhejiang Geely’s vehicle production rights (license) to the end customers or the Service Company, which purchased and used the cars in Hangzhou Micro Public Transportation project and group long-term lease project. Among the total sales to the JV Company and its subsidiaries, approximately 88%forthe six months ended June 30, 2015 and approximately 86%for the three months ended June 30, 2015of the sales were related to the sales of battery packs because Kandi New Energy holds a production rights (license) to manufacture requisite battery packs used in manufacturing of Kandi brand’s EVs. Under the JV agreement, the Company’s EV product manufacturing business has been completely transferred to the JV Company. The Company is mainly responsible for supplying the JV Company with EV parts and the JV Company is responsible for producing EV products and for selling finished goods through channels to its end customers.
32
As of June 30, 2015 and December 31, 2014, the amount due from the JV Company, net was $101,958,555and $51,450,612, respectively, of which the majority was the balances with Kandi Jinhua, Kandi Changxing, Kandi Shanghai. The breakdown was as below:
| June 30, | |||
| 2015 | |||
| Kandi Shanghai | $ | 38,316,569 | |
| Kandi Changxing | 29,592,281 | ||
| Kandi Jinhua | 9,575,093 | ||
| JV Company | 24,474,612 | ||
| Consolidated JV Company | $ | 101,958,555 |
The amount due from the JV Company of $24,474,612 was a one-year entrusted loan that Kandi Vehicle lent to the JV Company from December 16, 2014 to December 15, 2015 carrying an annual interest rate determined by using the People's Bank of China floating benchmark lending rate on the date of withdraw plus 5% of that rate. The rate will not be adjusted after the withdraw during the lending period, which was 5.88% . The loan was organized by Bank of Communications Hangzhou Zhongan Branch as the agent bank between Kandi Vehicle and the JV Company. Entrusted loans are commonly found in China, where direct borrowing and lending between commercial enterprises are restricted.
NOTE 24 – COMMITMENTS AND CONTINGENCIES
Guarantees and Pledged collateral for third party bank loans
As of June 30, 2015 and December 31, 2014, the Company provided guarantees for the following third parties:
(1) Guarantees for bank loans
| June 30, | December 31, | |||||
| Guarantee provided to | 2015 | 2014 | ||||
| Zhejiang Kangli Metal Manufacturing Company. | $ | 0 | $ | 4,875,274 | ||
| Zhejiang Shuguang industrial Co., Ltd. | 4,894,922 | 4,875,274 | ||||
| Nanlong Group Co., Ltd. | 3,263,282 | 9,750,549 | ||||
| Total | $ | 8,158,204 | $ | 19,501,097 |
On March 4, 2014, the Company entered into a guarantee contract to serve as the guarantor for the bank loan borrowed from Ping An Bank in the amount of $4,894,922 by Zhejiang Shuguang industrial Co., Ltd. (“ZSICL”) for the period from March 4, 2014 to March 4, 2015. At March 4, 2015, the bank agreed to extend the repayment day. ZSICL is not related to the Company. Under these guarantee contracts, the Company agrees to perform all obligations of ZSICL under the loan contracts if ZSICL fails to perform its obligations as set forth therein.
33
On March 15, 2013, the Company entered into a guarantee contract to serve as the guarantor for the bank loans borrowed from Shanghai Pudong Development Bank Jinhua Branch and Shanghai Bank Hangzhou branch in the amount for the total amount $3,263,282 by Nanlong Group Co., Ltd. (“NGCL”) for the period from March 15, 2013 to March 15, 2016. NGCL is not related to the Company. Under this guarantee contract, the Company agrees to perform all obligations of NGCL under the loan contract if NGCL fails to perform its obligations as set forth therein.
(2) Pledged collateral for a third party’s bank loans
As of June 30, 2015 and December 31, 2014, none of the Company’s land use rights or plant and equipment were pledged as collateral securing bank loans to third parties.
NOTE 25 –SEGMENT REPORTING
The Company has only one single operating segment. The Company’s revenue and long-lived assets are primarily derived from and located in the PRC. The Company only has operations in the PRC.
The following table sets forth revenues by geographic area for the six months ended June 30, 2015 and 2014, respectively:
| Six Months Ended June 30 | ||||||||||||
| 2015 | 2014 | |||||||||||
| Sales Revenue | Percentage | Sales Revenue | Percentage | |||||||||
| Overseas | $ | 1,944,172 | 2% | $ | 3,354,996 | 5% | ||||||
| China | 89,800,374 | 98% | 69,776,363 | 95% | ||||||||
| Total | $ | 91,744,546 | 100% | $ | 73,131,359 | 100% | ||||||
The following table sets forth revenues by geographic area for the three months ended June 30, 2015 and 2014, respectively:
| Three Months Ended June 30 | ||||||||||||
| 2015 | 2014 | |||||||||||
| Sales Revenue | Percentage | Sales Revenue | Percentage | |||||||||
| Overseas | $ | 1,157,676 | 2% | $ | 2,259,176 | 7% | ||||||
| China | 46,805,784 | 98% | 30,700,879 | 93% | ||||||||
| Total | $ | 47,963,460 | 100% | $ | 32,960,055 | 100% | ||||||
Item 2. Management’s Discussion and Analysis of Financial Condition and Results of Operations.
This report contains forward-looking statements within the meaning of the federal securities laws that relate to future events or our future financial performance. In some cases, you can identify forward-looking statements by terminology, such as “may,” “will,” “should,” “could,” “expect,” “plan,” “anticipate,” “believe,” “estimate,” “project,” “predict,” “intend,” “potential” or “continue” or the negative of such terms or other comparable terminology, although not all forward-looking statements contain such terms.
In addition, these forward-looking statements include, but are not limited to, statements regarding implementing our business strategy; development and marketing of our products; our estimates of future revenue and profitability; our expectations regarding future expenses, including research and development, sales and marketing, manufacturing and general and administrative expenses; difficulty or inability to raise additional financing, if needed, on terms acceptable to us; our estimates regarding our capital requirements and our needs for additional financing; attracting and retaining customers and employees; sources of revenue and anticipated revenue; and competition in our market.
34
Forward-looking statements are only predictions. Although we believe that the expectations reflected in these forward-looking statements are reasonable, we cannot guarantee future results, levels of activity, performance or achievements. All of our forward-looking information is subject to risks and uncertainties that could cause actual results to differ materially from the results expected. Although it is not possible to identify all factors, these risks and uncertainties include the risk factors and the timing of any of those risk factors described in our Annual Report on Form 10-K for the year ended December 31, 2014 and those set forth from time to time in our other filings with the Securities and Exchange Commission (“SEC”). These documents are available on the SEC’s Electronic Data Gathering and Analysis Retrieval System at http://www.sec.gov.
Critical Accounting Policies and Estimates
This section should be read together with the Summary of Significant Accounting Policies in the attached condensed consolidated financial statements included in this report.
Policy affecting options and warrants
Our stock option cost is recorded in accordance with ASC 718, Compensation — Stock Compensation, and ASC 505, Equity. The fair value of stock options is estimated using the Black-Scholes-Merton model. Our expected volatility assumption is based on the historical volatility of our common stock. The expected life assumption is primarily based on the expiration date of the option. The risk-free interest rate for the expected term of the option is based on the U.S. Treasury yield curve in effect at the time of grant. Stock option expense recognition is based on awards expected to vest. There were no estimated forfeitures. ASC standards require forfeitures to be estimated at the time of grant and revised in subsequent periods, if necessary, if actual forfeitures differ from those estimates.
Our warrant costs are recorded in liabilities and equities, respectively, in accordance with ASC 480,Distinguishing Liabilities From Equity, ASC 505, Equity, and ASC 815, Derivatives and Hedging. The fair value of a warrant, which is classified as a liability, is estimated using the Black-Scholes-Merton model and the lattice valuation model. Our expected volatility assumption is based on the historical volatility of our common stock. The expected life assumption is primarily based on the expiration date of the warrant. The risk-free interest rate for the expected term of the warrant is based on the U.S. Treasury yield curve in effect at the time of measurement. The warrants, which are freestanding derivatives classified as liabilities on the balance sheet, are measured at fair value on each reporting date, with decreases in fair value recognized in earnings and increases in fair values recognized in expenses.
The fair value of equity-based warrants, which are not considered derivatives under ASC 815, is estimated using the Black-Scholes-Merton model. Our expected volatility assumption is based on the historical volatility of our common stock. The expected life assumption is primarily based on the expiration date of the warrant. The risk-free interest rate for the expected term of the option is based on the U.S. Treasury yield curve in effect at the time of grant.
Estimates affecting accounts receivable and inventories
The preparation of our consolidated financial statements requires management to make estimates and assumptions that affect our reporting of assets and liabilities (and contingent assets and liabilities). These estimates are particularly significant where they affect the reported net realizable value of our accounts receivable and inventories.
Accounts receivable are recognized and carried at net realizable value. An allowance for doubtful accounts is recorded in the period when a loss is probable based on an assessment of specific factors, such as troubled collection, historical experience, accounts aging, ongoing business relations and other factors. Accounts are written off after exhaustive efforts at collection. If accounts receivable are to be provided for, or written off, they would be recognized in the consolidated statement of operations within operating expenses. As of June 30, 2015 and December 31, 2014, we recorded no allowance for doubtful accounts. This determination was made per our management’s judgment, which was based on their best knowledge.
35
Inventory is stated at the lower of cost, determined on a weighted average basis, or net realizable value. Net realizable value is the estimated selling price in the ordinary course of business less the estimated cost of completion and the estimated costs necessary to make the sale. Adjustments to reduce the cost of inventory to its net realizable value are made, if required, for estimated excess, obsolescence, or impaired balances. When inventories are sold, their carrying amount is charged to expense in the year in which the revenue is recognized.
Write-downs for declines in net realizable value or for losses of inventories are recognized as an expense in the year the impairment or loss occurs.
Although we believe that there is little likelihood that actual results will differ materially from current estimates, if customer demand for our products decreases significantly in the near future, or if the financial condition of our customers deteriorates in the near future, we could realize significant write downs for slow-moving inventories or uncollectible accounts receivable.
Revenue Recognition
Our revenue recognition policy plays a key role in our consolidated financial statements. Revenues represent the invoiced value of goods sold, recognized upon the shipment of goods to customers, and revenues are recognized when all of the following criteria are met:
Persuasive evidence of an arrangement exists; Delivery has occurred or services have been rendered; the seller’s price to the buyer is fixed or determinable; and Collectability is reasonably assured.
The revenue recognition policies for our products, including EVs, EV parts and Off-road vehicles, are the same: When the products are delivered, the associated risk of loss is deemed transferred, and at that time we recognize revenue.
Warranty Liability
Most of our non-EV products (the “Legacy Products”) are exported out of China to foreign countries that have legal and regulatory requirements with which we are not familiar. Development of warranty policies for our Legacy Products in each of these countries would be virtually impossible and prohibitively expensive. Therefore, we provide price incentives and free parts to our customers and in exchange, our customers establish appropriate warranty policies and assume warranty responsibilities. Consequently, warranty issues are taken into consideration during the price negotiation for our products. The free parts are delivered along with the products, and when products are sold, the related parts are recorded as cost of goods sold. Due to the reliable quality of our products, we have been able to maintain this warranty policy and we have not had any product liabilities attributed to the quality of our products.
For the EV products that we sold before year 2015 in China, there is a three-year or 50,000 kilometer manufacturer warranty. This warranty affects us through our participation and investment in the JV Company, which manufactures the EV products.
Results of Operations
Comparison of Six Months Ended June 30, 2015 and 2014
The following table sets forth the amounts and percentage relationship to revenue of certain items in our condensed consolidated statements of income (loss) and comprehensive income (loss) for the six months ended June 30, 2015 and 2014.
36
| Six Months Ended | ||||||||||||||||||
| June 30, 2015 | % of Revenue |
June 30, 2014 | % of Revenue |
Change in Amount |
Change in % |
|||||||||||||
| REVENUES, NET | $ | 91,744,546 | $ | 73,131,359 | 18,613,187 | 25.5% | ||||||||||||
| COST OF GOODS SOLD | 78,882,350 | 86.0% | 61,049,862 | 83.5% | 17,832,488 | 29.2% | ||||||||||||
| GROSS PROFIT | 12,862,196 | 14.0% | 12,081,497 | 16.5% | 780,699 | 6.5% | ||||||||||||
| OPERATING EXPENSES: | ||||||||||||||||||
| Research and development | 1,142,641 | 1.2% | 2,143,930 | 2.9% | (1,001,289 | ) | -46.7% | |||||||||||
| Selling and marketing | 189,411 | 0.2% | 507,151 | 0.7% | (317,740 | ) | -62.7% | |||||||||||
| General and administrative | 7,625,661 | 8.3% | 9,643,944 | 13.2% | (2,018,283 | ) | -20.9% | |||||||||||
| Total Operating | ||||||||||||||||||
| 8,957,713 | 9.8% | 12,295,025 | 16.8% | (3,337,312 | ) | -27.1% | ||||||||||||
| Expenses | ||||||||||||||||||
| INCOME FROM OPERATIONS | 3,904,483 | 4.3% | (213,528 | ) | -0.3% | 4,118,011 | -1928.6% | |||||||||||
| OTHER INCOME (EXPENSE): | ||||||||||||||||||
| Interest income | 1,313,323 | 1.4% | 1,232,136 | 1.7% | 81,187 | 6.6% | ||||||||||||
| Interest (expense) | (1,195,911 | ) | -1.3% | (1,918,311 | ) | -2.6% | 722,400 | -37.7% | ||||||||||
| Change in fair value of | ||||||||||||||||||
| 8,753,344 | 9.5% | (3,372,602 | ) | -4.6% | 12,125,946 | -359.5% | ||||||||||||
| financial instruments | ||||||||||||||||||
| Government grants | 92,863 | 0.1% | 153,700 | 0.2% | (60,837 | ) | -39.6% | |||||||||||
| Share of (loss) in associated companies | 0 | 0.0% | (92,992 | ) | -0.1% | 92,992 | -100.0% | |||||||||||
| Share of profit after tax of JV | 720,523 | 0.8% | 1,718,830 | 2.4% | (998,307 | ) | -58.1% | |||||||||||
| Other income, net | 106,054 | 0.1% | 119,827 | 0.2% | (13,773 | ) | -11.5% | |||||||||||
| Total other income (expense), net | 9,790,196 | 10.7% | (2,159,412 | ) | -3.0% | 11,949,608 | -553.4% | |||||||||||
| INCOME (LOSS) BEFORE INCOME TAXES | 13,694,679 | 14.9% | (2,372,940 | ) | -3.2% | 16,067,619 | -677.1% | |||||||||||
| INCOME TAX EXPENSE | (2,137,524 | ) | -2.3% | (556,135 | ) | -0.8% | (1,581,389 | ) | 284.4% | |||||||||
| NET INCOME (LOSS) | 11,557,155 | 12.6% | (2,929,075 | ) | -4.0% | 14,486,230 | -494.6% | |||||||||||
37
(a) Revenue
For the six months ended June 30,2015, our revenue was $91,744,546 compared to $73,131,359 for the same period of 2014, an increase of $18,613,187 or 25.5% . The increase in revenue was mainly due to the increase in EV parts sales during this period. The majority of the EV parts sales were battery sales.
The following table summarizes our revenues as well as the number of units sold by product types for the six months ended June 30, 2015 and 2014:
| Six Months Ended June 30 | ||||||||||||
| 2015 | 2014 | |||||||||||
| Unit | Sales | Unit | Sales | |||||||||
| EV parts | 46,131 | $ | 89,629,426 | 49,468 | $ | 42,451,760 | ||||||
| EV products | - | 0 | 1,531 | 21,617,300 | ||||||||
| Off-road vehicles | 2,914 | 2,115,120 | 11,843 | 9,062,299 | ||||||||
| Total | 49,045 | $ | 91,744,546 | 62,842 | $ | 73,131,359 | ||||||
EV Parts
Among our total revenues during the six months ended June 30, 2015, approximately $89,629,426, or 97.7%, resulted from the sale of EV parts. Our revenue of EV parts increased $47,177,666, or 111.1%, compared to the first six months of 2014. Our EV parts sales primarily consisted of the sales of battery packs, body parts, EV drive motors, EV controllers, air conditioning units and other auto parts to the JV Company for manufacturing of EV products.
EV Products
Among our total revenues during the six months ended June 30, 2015, there were no revenue from EV products sales because the manufacture of EV products was transferred to the JV Company based on the JV Agreement. As a result, the EV products revenue decreased $21,617,300, or 100% compared to the same period of 2014 Under the JV Agreement with our joint venture partner, Shanghai Maple Guorun Automobile Co., Ltd., since March 2013, our EV products manufacturing business has been gradually transferred to the JV Company, and such transfer was completed at the end of 2014. We are now primarily responsible for supplying the JV Company with EV parts and the JV Company is primarily responsible for the production of EV products.
Off-Road Vehicles
Among our total revenues during the six months ended June 30, 2015, approximately $2,115,120, or 2.3%, resulted from the sale of off-road vehicles. The off-road vehicles revenue decreased $6,947,178, or 76.7%, compared to the same period of 2014, mainly because the Company now focuses on the EV parts production, which is in line with the long-term strategy of the Company.
(b) Cost of goods sold
Cost of goods sold was $78,882,350 during the six months ended June 30, 2015, representing an increase of $17,832,488, or 29.2%, compared to the same period of 2014. This increase was mainly due to the increase in corresponding sales. Please also refer to (c) for cost details of each products.
(c) Gross profit
Gross profit for the first six months of 2015 increased 6.5% to $12,862,196, compared to $12,081,497 for the same period last year. Margin by product was as below:
38
| Six Months Ended June 30 | ||||||||||||||||||||||||
| 2015 | 2014 | |||||||||||||||||||||||
| Sales | Cost | Gross Profit |
Margin % | Sales | Cost | Gross Profit |
Margin % | |||||||||||||||||
| EV parts | $ | 89,629,426 | 77,151,655 | 12,477,771 | 13.9% | $ | 42,451,760 | 38,519,402 | 3,932,358 | 9.3% | ||||||||||||||
| EV products | - | - | - |
- |
21,617,300 | 15,485,690 | 6,131,610 | 28.4% | ||||||||||||||||
| Off-road vehicles | 2,115,120 | 1,730,695 | 384,425 | 18.2% | 9,062,299 | 7,044,770 | 2,017,529 | 22.3% | ||||||||||||||||
| Total | $ | 91,744,546 | 78,882,350 | 12,862,196 | 14.0% | $ | 73,131,359 | 61,049,862 | 12,081,497 | 16.5% | ||||||||||||||
The overall margin decreased from 16.5% for the first six months of 2014 to 14.0% for the same period of 2015.The principle reason for the decrease was that the Company did not sell any EV products directly to consumers in the 2015 period, which was a high margin business in the last year. The margin of EV parts has significantly improved from 9.3% of the six months of 2014 to 13.9% of the same period of 2015 due to the cost control and the scaled production for EV parts.
(d) Selling and distribution expenses
Selling and distribution expenses were $189,411 for the first six months of 2015, compared to$507,151 for the same period last year, a decrease of $317,740 or 62.7% .
This decrease was primarily due to the decrease of contractual maintenance and repair expense of EV products for $ 303,945 because we did not have EV products sales starting from year 2015.
(e) General and administrative expenses
General and administrative expenses were $7,625,661 for the first six months of 2015, compared to $9,643,944 for the same period of last year, a decrease of $2,018,283 or 20.9% . For the first six months of 2015, general and administrative expenses included $5,531,492 in expenses for common stock awards and stock options to employees and consultants, compared to $4,429,247 for the same period in 2014. Excluding stock award costs, our net general and administrative expenses for the first six months of 2015 were $2,094,169, a decrease of $3,120,528, or 59.8%, from $5,214,697 for the same period of 2014. The decrease was primarily due to a placement agent fee of $1,963,408 occurred in the first six months of 2014. We did not incur a similar fee in the same period of 2015.
(f) Research and development
Research and development expenses were $1,142,641 for the first six months of 2015, a decrease of $1,001,289 or 46.7% compared to $2,143,930 for the same period of last year. This decrease was primarily due to: 1) the expenses on China Auto Research Centre for EV testing decreased $244,234 compared to the same period last year; and 2) the depreciation expenses decreased by $ 871,222 compared to the same period last year due to the related R&D equipment transferred from R&D department into the production department.
(g) Government grants
Government grants were $92,863 for the first six months of 2015, a decrease of $60,837 or 39.6% compared to and $153,700 for the same period of last year.
39
The government grants are project based. In April 2015, we received an RMB 400,000 (approximately $ 65,167) grant for the research of Kandi EV SMA7005 for Kandi Vehicle and an RMB 170,000(approximately $27,696) grant for technologies incentive for Yongkang Scruo.
(h) Interest income
Interest income was $1,313,323 for the first six months of 2015, a slight increase of $81,187 or 6.6% compared to $1,232,136 for the same period of last year. This change was primarily attributable to an increase in interest income earned on the entrusted loans made to the JV Company.
(i) Interest expense
Interest expense was $1,195,911 for the first six months of 2015, a decrease of $722,400 or 37.7% compared to $1,918,311for the same period of last year. This change was mainly due to the bond interest expense for $749,418 in the first half year of 2014.
(j) Change in fair value of financial instruments
For the first six months of 2015, the gain related to changes in the fair value of derivative liability relating to the warrants issued to the investors and a placement agent was $8,753,344, an increase of $12,125,946 compared to the same period of last year. The gain on the changes in the fair value of derivative, liability is due to the decrease of the fair value price of the derivative which was primarily attributable to two factors. First, it was caused by the decrease in the market price of the Company’s common stock underlying the warrants issued on September 4, 2014, which decreased from $17.13 on the issuance date to $9.04 on June 30, 2015. Second, it was due to the passage of remaining life of 1,429,393 shares of warrants, a significant portion of the Company’s outstanding warrants. These warrants expired on January 30, 2015.
(k) Share of (loss) of associated company
Investment gains were $0 for the first six months of 2015, a positive change of $92,992 compared to the same period of last year, primarily due to the liquidation of our investment in Jinhua Service as this entity was dissolved in the third quarter of 2014.
(l) Share of profit (loss) after tax of the JV Company
For the first six months of 2015, the JV Company’s net sales was $99,517,343, gross profit was $18,633,407, and net profit was $2,389,123. We accounted for our investments in the JV Company under the equity method of accounting as we have a 50% ownership interest in the JV Company. As a result, we recorded 50% of the JV Company’s profit for $1,194,561 for the first six months of 2015. After eliminating intra-entity profits and losses, our share of the after tax profit of the JV Company was $720,523 for the first six months of 2015, a decrease of $998,307 or 58.1% compared to the same period of last year, the main reasons for the decrease of the JV Company’s profits primarily due to the significant interest expense occurred for the increased bank loan for operating needs, and the increased operating expenses incurred compared to the same period last year, which were for the JV Company’s future business growth.
During the first six months of 2015, a total of 6,116 units of EV products were sold by the JV Company, an increase of 14.8% compared to 5,329 units sold in the same period of 2014.
(m) Other income, net
Net other income was $106,054 for the first six months of 2015, a decrease of $13,773 or 11.5% compared to the same period of last year, which was primarily due to a rental income from one of our factory facilities from one of our clients in the last year.
40
(n) Net income from continuing operation
Net income was $11,557,155 for the first six months of 2015, an increase of $14,486,230 compared to the net loss of $2,929,075 for the same period of last year. The increase in net income was primarily attributable to the increased revenue and gross profits, and the gain from the change in the fair value of derivative securities, including (i) the effects of stock award expenses, which were $5,531,492 and $4,429,247 for the first six months of 2015 and 2014, respectively, and (ii) the change of the fair value of financial derivatives, which was income of $8,753,344 and an expense of $3,372,602 for the first six months of 2015 and 2014, respectively, our non-GAAP net income was $8,335,303 for the first six months of 2015 as compared to non-GAAP net income of $4,872,774 for the same period of 2014, an increase of $3,462,529. This increase in net income (non-GAAP) was primarily attributable to the increase in revenue and gross profits and the operating expense savings during this six-month period.
We make reference to certain non-GAAP financial measures, i.e., the adjusted net income. Management believes that such adjusted financial result is useful to investors in evaluating our operating performance because it presents a meaningful measure of corporate performance. See the non-GAAP reconciliation table below. Any non-GAAP measures should not be considered as a substitute for, and should only be read in conjunction with measures of financial performance prepared in accordance with GAAP.
| Six Months Ended | ||||||
| June 30, | ||||||
| 2015 | 2014 | |||||
| GAAP net income (loss) from continuing operations | $ | 11,557,155 | $ | (2,929,075 | ) | |
| Stock award expenses | 5,531,492 | 4,429,247 | ||||
| Change of the fair value of financial derivatives | 8,753,344 | (3,372,602 | ) | |||
| Non-GAAP net income (loss) from continuing operations | $ | 8,335,303 | $ | 4,872,774 | ||
Comparison of Three Months Ended June 30, 2015 and 2014
The following table sets forth the amounts and percentage relationship to revenue of certain items in our condensed consolidated statements of income (loss) and comprehensive income (loss) for the three months ended June 30, 2015 and 2014.
| Three Months Ended | ||||||||||||||||||
| June 30, 2015 | % of Revenue |
June 30, 2014 | % of Revenue |
Change in Amount |
Change in % |
|||||||||||||
| REVENUES, NET | $ | 47,963,460 | $ | 32,960,055 | 15,003,405 | 45.5% | ||||||||||||
| COST OF GOODS | ||||||||||||||||||
| 41,471,997 | 86.5% | 25,738,967 | 78.1% | 15,733,030 | 61.1% | |||||||||||||
| SOLD | ||||||||||||||||||
| GROSS PROFIT | 6,491,463 | 13.5% | 7,221,088 | 21.9% | (729,625 | ) | -10.1% | |||||||||||
| OPERATING EXPENSES: | ||||||||||||||||||
| Research and development | 571,621 | 1.2% | 971,673 | 2.9% | (400,052 | ) | -41.2% | |||||||||||
| Selling and marketing | 75,516 | 0.2% | 435,894 | 1.3% | (360,378 | ) | -82.7% | |||||||||||
| General and administrative | 3,845,013 | 8.0% | 3,173,178 | 9.6% | 671,835 | 21.2% | ||||||||||||
| Total Operating Expenses | 4,492,150 | 9.4% | 4,580,745 | 13.9% | (88,595 | ) | -1.9% | |||||||||||
| INCOME FROM OPERATIONS | 1,999,313 | 4.2% | 2,640,343 | 8.0% | (641,030 | ) | -24.3% | |||||||||||
| OTHER INCOME (EXPENSE): | ||||||||||||||||||
| Interest income | 722,843 | 1.5% | 748,843 | 2.3% | (26,000 | ) | -3.5% | |||||||||||
| Interest (expense) | (597,320 | ) | -1.2% | (963,838 | ) | -2.9% | 366,518 | -38.0% | ||||||||||
| Change in fair value of financial instruments | 4,003,044 | 8.3% | 8,941,569 | 27.1% | (4,938,525 | ) | -55.2% | |||||||||||
| Government grants | 92,863 | 0.2% | 153,700 | 0.5% | (60,837 | ) | -39.6% | |||||||||||
| Share of (loss) in associated companies | - | 0.0% | (77,187 | ) | -0.2% | 77,187 | -100.0% | |||||||||||
| Share of profit after tax of JV | 251,167 | 0.5% | (9,526 | ) | 0.0% | 260,693 | -2736.6% | |||||||||||
| Other income, net | 82,207 | 0.2% | 60,247 | 0.2% | 21,960 | 36.4% | ||||||||||||
| Total other income (expense), net | 4,554,804 | 9.5% | 8,853,808 | 26.9% | (4,299,004 | ) | -48.6% | |||||||||||
| INCOME (LOSS) BEFORE INCOME TAXES | 6,554,117 | 13.7% | 11,494,151 | 34.9% | (4,940,034 | ) | -43.0% | |||||||||||
| INCOME TAX | ||||||||||||||||||
| (1,128,615 | ) | -2.4% | (337,066 | ) | -1.0% | (791,549 | ) | 234.8% | ||||||||||
| EXPENSE | ||||||||||||||||||
| NET INCOME (LOSS) | 5,425,502 | 11.3% | 11,157,085 | 33.9% | (5,731,583 | ) | -51.4% | |||||||||||
41
(a) Revenue
For the three months ended June 30, 2015, our revenue was $47,963,460 compared to $32,960,055 for the same period of 2014, an increase of $15,003,405 or 45.5% . The increase in revenue was mainly due to the increase in EV parts sales during this period. The majority of the EV parts sales were battery sales.
The following table summarizes our revenues as well as the number of units sold by product types for the three months ended June 30, 2015 and 2014:
| Three Month Ended June 30 | ||||||||||||
| 2015 | 2014 | |||||||||||
| Unit | Sales | Unit | Sales | |||||||||
| EV parts | 28,542 | $ | 46,637,471 | 29,651 | $ | 17,379,761 | ||||||
| EV products | - | - | 911 | 13,249,212 | ||||||||
| Off-road vehicles | 1,586 | 1,325,989 | 2,776 | 2,331,082 | ||||||||
| 30,128 | $ | 47,963,460 | 33,338 | $ | 32,960,055 | |||||||
EV Parts
Among our total revenues during the three months ended June 30, 2015, approximately $46,637,471resulted from the sale of EV parts. We started the EV parts business in 2014, and our revenue of EV parts increased $29,257,710or 168.3%, compared to the first three months of 2014. Our EV parts sales primarily consisted of the sales of battery packs, body parts, EV drive motors, EV controllers, air conditioning units and other auto parts to the JV Company for manufacturing of EV products.
42
EV Products
Among our total revenues during the three months ended June 30, 2015, there was no EV products sales. The EV products revenue decreased $13,249,212, or 100% compared to the same period of 2014 because the manufacture of EV products was transferred to the JV Company based on the JV Agreement. Under the JV Agreement with our joint venture partner, Shanghai Maple Guorun Automobile Co., Ltd., since March 2013, our EV products manufacturing business has been gradually transferred to the JV Company, such transfer was completed at the end of 2014. We are now primarily responsible for supplying the JV Company with EV parts and the JV Company is primarily responsible for the production of EV products.
Off-Road Vehicles
Among our total revenues during the three months ended June 30, 2015, approximately $1,325,989 or 2.8%, resulted from the sale of off-road vehicles. The off-road vehicles revenue decreased $1,005,092, or 43.1% compared to the same period of 2014, mainly because the Company now focused on the EV parts production, which is in line with the long-term strategy of the Company.
(b) Cost of goods sold
Cost of goods sold was $41,471,997 during the three months ended June 30, 2015, representing an increase of $15,733,030, or 61.1%, compared to the same period of 2014. This increase was mainly due to the increase in corresponding sales. Please also refer to below (c) for the details cost by products.
(c) Gross profit
Gross profit for the second three months of 2015 decreased 10.1% to $6,491,463, compared to $7,221,088 for the same period last year. Margin by product is as below:
| Three Months Ended June 30 | ||||||||||||||||||||||||
| 2015 | 2014 | |||||||||||||||||||||||
| Sales | Cost | Gross Profit |
Margin % | Sales | Cost | Gross Profit |
Margin % | |||||||||||||||||
| EV parts | $ | 46,637,471 | 40,379,853 | 6,257,618 | 13.4% | $ | 17,379,761 | 14,637,948 | 2,741,813 | 15.8% | ||||||||||||||
| EV products | - | - | - | 13,249,212 | 9,499,328 | 3,749,884 | 28.3% | |||||||||||||||||
| Off-road vehicles | 1,325,989 | 1,092,144 | 233,845 | 17.6% | 2,331,082 | 1,601,691 | 729,391 | 31.3% | ||||||||||||||||
| Total | $ | 47,963,460 | 41,471,997 | 6,491,463 | 13.5% | $ | 32,960,055 | 25,738,967 | 7,221,088 | 21.9% | ||||||||||||||
The overall margin decreased from 21.9% of the second three months of 2014 to 13.5% of the same period of 2015, the main reason was that the Company didn’t sell the EV products directly which was a high margin in last year. The margin of EV parts has decreased from 15.8% of the second three months of 2014 to 13.4% of the same period of 2015 due to the decrease in the selling prices from the purchase agreement with the JV Company.
43
(d) Selling and distribution expenses
Selling and distribution expenses were $75,516 for the second three months of 2015, compared to $435,894 for the same period last year, a decrease of $360,378 or 82.7% .
This decrease was primarily due to the decrease of contractual maintenance and repair expense of $ 303,945 since we don’t have EV products sales starting year 2015.
(e) General and administrative expenses
General and administrative expenses were $3,845,013 for the second three months of 2015, compared to $3,173,178 for the same period of last year, an increase of $671,835 or 21.2% . For the three months ended June 30, 2015, general and administrative expenses included $3,481,809 in expenses for common stock awards and stock options to employees and consultants, compared to $1,008,616 for the same period in 2014. Excluding stock award costs, our net general and administrative expenses for the three months ended June 31, 2015 were $363,204, a decrease of $1,801,358, or 83.2%, from $2,164,562 for the same period of 2014. The decrease was primarily due to an office expense increase of $895,166 in the second quarter of 2014, and also the other operating expense savings.
(f) Research and development
Research and development expenses were $571,621 for the second three months of 2015, a decrease of $400,052 or 41.2% compared to $971,673for the same period of last year. This decrease was primarily due to the depreciation expenses decreased by $429,816 compared to the same period last year due to the related R&D equipment transferred from R&D department into the production department.
(g) Government grants
Government grants were $92,863 for the second three months of 2015, a decrease of $60,837 or 39.6% compared to $153,700 for the same period of last year.
The government grants are project based. In April 2015, we received an RMB 400,000 (approximately $ 65,167) for the research of Kandi EV SMA7005 for Kandi Vehicle and an RMB 170,000 (approximately $27,696) for technologies incentive for Yongkang Scruo.
(h) Interest income
Interest income was $722,843 for the second three months ended June 30, 2015, a decrease of $26,000 compared to $748,843 for the same period of last year. This change was primarily due to the decrease in interest deposit rate since November 2014 and March and May 2015.
(i) Interest expense
Interest expense was $597,320 for the second three months of 2015, an increase of $366,518 compared to $963,838 for the same period of last year. This change was due to the interest expense of the bond for $373,595 in the same period last year.
(j) Change in fair value of financial instruments
For the second three months of 2015, the gain related to changes in the fair value of derivative liability relating to the warrants issued to the investors and a placement agent was $4,003,044, a decrease of $4,938,525 compared to the same period of last year. The decrease was due to the warrants fair value valuation change during the period.
44
(k) Share of (loss) of associated company
Investment gains were $0 for the second three months of 2015, a positive change of $77,187 compared to the same period of last year, primarily due to the liquidation of our investment in Jinhua Service as this entity was dissolved in the third quarter of 2014.
(l) Share of profit (loss) after tax of the JV Company
For the three months ended June 30, 2015, the JV Company’s net sales was $68,952,347, gross profit was $10,652,744, and net profit was $1,585,902. We accounted for our investments in the JV Company under the equity method of accounting as we have a 50% ownership interest in the JV Company. As a result, we recorded 50% of the JV Company’s profit for $792,951 for the second three months of 2015. After eliminating intra-entity profits and losses, our share of the after tax profit of the JV Company was $251,167 for the second quarter of 2015, a decrease of $260,693 compared to the same period of last year. The decrease of the JV Company’s profits were primarily due to the significant interest expense occurred for the increased bank loan for operating needs, and the increased operating expenses incurred compared to the same period last year, which were for the JV Company’s future business growth.
During the second three months of 2015, a total of4,446 units of EV products were sold by the JV Company, an increase of 8.1% compared to 4,114 units sold in the same period of 2014.
(m) Other income, net
Net other income was $82,207 for the second three months of 2015, an increase of $21,960 or36.4% compared to the same period of last year, which was primarily due to a rental income from one of our factory facilities from one of our clients.
(n) Net income from continuing operation
Net income was $5,425,502 for the second three months of 2015, a decrease of $5,731,583 or 51.4% compared to $11,157,085 for the same period of last year. The decrease in net income was primarily attributable to the change of the fair value of financial derivatives, which was an income of $4,003,044 and $8,941,569 for the second three months ended June 30, 2015 and 2014, respectively; The other reason was the difference of stock compensation expense which was $3,481,809 and $1,008,616 for the second quarter ended June 30, 2015 and 2014 respectively, Our non-GAAP net income was $4,904,267 for the second three months of 2015 as compared to non-GAAP net income of $3,224,132 for the same period of 2014, an increase of $1,680,135. This increase in net income (non-GAAP) was primarily attributable to the operating expense savings during this three-month period.
We make reference to certain non-GAAP financial measures, i.e., the adjusted net income. Management believes that such adjusted financial result is useful to investors in evaluating our operating performance because it presents a meaningful measure of corporate performance. See the non-GAAP reconciliation table below. Any non-GAAP measures should not be considered as a substitute for, and should only be read in conjunction with measures of financial performance prepared in accordance with GAAP.
| Three Months Ended | ||||||
| June 30, | ||||||
| 2015 | 2014 | |||||
| GAAP net income (loss) from continuing operations | $ | 5,425,502 | $ | 11,157,085 | ||
| Stock award expenses | 3,481,809 | 1,008,616 | ||||
| Change of the fair value of financial derivatives | 4,003,044 | 8,941,569 | ||||
| Non-GAAP net income (loss) from continuing operations | $ | 4,904,267 | $ | 3,224,132 | ||
45
LIQUIDITY AND CAPITAL RESOURCES
Cash Flow
For the first six months of 2015, cash used in operating activities was $(12,638,400), as compared to cash used in operating activities of $(37,184,388) for the same period of last year.
Below is the cash flow statement for the operating activities:
| Six Months Ended | ||||||
| June 30, 2015 | June 30, 2014 | |||||
| CASH FLOWS FROM OPERATING ACTIVITIES: | ||||||
| Net income(loss) | $ | 11,557,155 | $ | (2,929,075 | ) | |
| Adjustments to reconcile net income to net cash provided by operating activities | ||||||
| Depreciation and amortization | 2,955,663 | 2,764,984 | ||||
| Assets Impairments | - | - | ||||
| Deferred taxes | (153,916 | ) | 924,449 | |||
| Change in fair value of financial instruments | (8,753,344 | ) | 3,372,602 | |||
| Loss (income) in investment in associated companies | - | 96,364 | ||||
| Share of profit after tax of JV Company | (720,523 | ) | (1,718,830 | ) | ||
| Decrease in reserve for fixed assets | - | - | ||||
| Stock Compensation cost | 5,482,808 | - | ||||
| Changes in operating assets and liabilities, net of effects of acquisition: | ||||||
| (Increase) Decrease In: | ||||||
| Accounts receivable | (14,077,317 | ) | 11,955,855 | |||
| Inventories | (12,122,839 | ) | (8,544,033 | ) | ||
| Other receivables | (58,055 | ) | (231,945 | ) | ||
| Due from employee | (9,250 | ) | (2,390 | ) | ||
| Prepayments and prepaid expenses | (143,163 | ) | (44,194,377 | ) | ||
| Amount due from JV Company | (50,224,378 | ) | (31,680,191 | ) | ||
| Increase (Decrease) In: | ||||||
| Accounts payable | 54,732,723 | 31,083,370 | ||||
| Other payables and accrued liabilities | (1,716,848 | ) | 2,344,763 | |||
| Customer deposits | 106,563 | 107,199 | ||||
| Income Tax payable | 506,321 | (533,133 | ) | |||
| Due to related party | - | - | ||||
| Net cash (used in) provided by operating activities | $ | (12,638,400 | ) | $ | (37,184,388 | ) |
The major operating activities that provided cash for the first six months of 2015 were net income of $11,557,155 and an increase in accounts payable of $54,732,723. The major operating activities that used cash for first six months of 2015 were an increase in receivables from the JV Company of $50,224,378 and from other clients of $14,077,317, and an increase in inventories of $12,122,839.
46
Below is the cash flow statement for the investing activities:
| Six Months Ended | ||||||
| June 30, | June 30, | |||||
| CASH FLOWS FROM INVESTING ACTIVITIES: | 2015 | 2014 | ||||
| (Purchases)/Disposal of plant and equipment, net | (291,895 | ) | (308,838 | ) | ||
| Purchases of land use rights | - | (1,669,648 | ) | |||
| Purchases of construction in progress | (39,361 | ) | (23,046 | ) | ||
| Deposit for acquisition | - | - | ||||
| Asset acquisition, net of deposit | - | - | ||||
| Issuance of notes receivable | (5,588,283 | ) | (21,468,326 | ) | ||
| Repayment of notes receivable | 4,145,502 | 26,020,234 | ||||
| Investment in JV Company | - | - | ||||
| Cash acquired in acquisition | - | - | ||||
| Net cash provided by (used in) investing activities | $ | (1,774,037 | ) | $ | 2,550,376 | |
Cash used by investing activities for the first six months of 2015 was $1,774,037 primarily due to the result of the issuance of notes receivable of $5,588,283 and repayment of notes receivable of $4,145,502.
Below is the cash flow statement for the financing activities:
| Six Months Ended | ||||||
| June 30, | June 30, | |||||
| CASH FLOWS FROM FINANCING ACTIVITIES: | 2015 | 2014 | ||||
| Restricted cash | (9,937,929 | ) | 1,628 | |||
| Proceeds from short-term bank loans | 19,061,273 | 16,764,023 | ||||
| Repayments of short-term bank loans | (15,965,853 | ) | (16,764,023 | ) | ||
| Proceeds from notes payable | 9,937,929 | 13,020,600 | ||||
| Repayment of notes payable | (5,716,427 | ) | (16,601,265 | ) | ||
| Fund raising through issuing common stock and warrants | - | - | ||||
| Option exercise,stock awards & other financing | - | 4,405,697 | ||||
| Warrant exercise | - | 22,447,914 | ||||
| Common stock issued for acquisition, net of cost of capital | 11,067,734 | |||||
| Net cash (used in) provided by financing activities | $ | (2,621,007 | ) | $ | 34,342,308 | |
Cash provided by financing activities for the first six months of 2015 was $28,999,202, primarily due to the result of proceeds from short-term loans of $19,061,273, and the proceeds from notes payable of $9,937,929. Cash used in financing activities for the first six months of 2015 was $31,620,209 , primarily due torestricted cash increase of $9,937,929, repayments of short-term bank loans of $15,965,853 and repayment of notes payable of $5,716,427.
47
Working Capital
We had a working capital surplus of $48,452,998 at June 30, 2015, compared to $39,202,684 as of December 31, 2014.
We have historically financed our operations through short-term commercial bank loans from PRC banks. The term of these loans is typically for one year, and upon the payment of all outstanding principal and interest in a particular loan, the banks have typically rolled over the loan for an additional one-year term, with adjustments made to the interest rate to reflect prevailing market rates. We believe that this situation has not changed and that short-term bank loans will be available on normal trade terms if needed.
Capital Requirements and Capital Provided
Capital requirements and capital provided for the six months ended June 30, 2015 were as follows:
| Six Months Ended | |||
| June 30, 2015 | |||
| (In Thousands) | |||
| Capital requirements | |||
| Purchase of plant and equipment | 292 | ||
| Purchases of land use rights | - | ||
| Purchase of construction in progress | 39 | ||
| Issuance of notes receivable | 5,588 | ||
| Disposal of associated company | - | ||
| Repayments of short-term bank loans | 15,966 | ||
| Repayments of notes payable | 5,716 | ||
| Repayments of bond | - | ||
| Increase in restricted cash | 9,938 | ||
| Internal cash used in operations | 12,638 | ||
| Increase in cash and restricted cash | - | ||
| Total capital requirements | 50,177 | ||
| Capital provided | |||
| Decrease in restricted cash | - | ||
| Repayments of notes receivable | 4,146 | ||
| Proceeds from short-term bank loan | 19,061 | ||
| Proceeds from notes payable | 9,938 | ||
| Common stock and warrants issued | - | ||
| Warrant exercise | - | ||
| Decrease in cash | 16,915.00 | ||
| Other financing activities | |||
| Total capital provided | 50,060 |
The difference between capital provided and capital required caused the effect of exchange rate changes over the past six months.
Recent Development Activities:
On May 28, 2015, we announced that the JV company signed a strategic cooperation framework agreement with ZTE Corporation (“ZTE”, listed in Hongkong and Shenzhen China), a leading international provider of telecommunications, enterprise and consumer technology solutions for Mobile Internet, and Zhejiang ZuoZhongYou Electric Vehicle Service Co., Ltd. (the “Service Company”).Under the Agreement, Kandi, ZTE and the Service Company will combine their expertise and resources to promote the Micro Public Transportation (“MPT”) program with advanced wireless charging technologies. The main contents for this agreement includes: 1) Market the MPT program in China and conduct R&D for automotive wireless charging and other core EV technologies; 2) Establish a research institute, which will focus on key topics, including MPT operation optimization, big data analysis and self-service EV rental; 3) Apply for China’s National Program on Key Research Projects to resolve technological challenges for EVs;4) Enhance the MPT operating system with a focus on performance efficiency and user experience; 5) Explore and develop an information platform for the MPT program, which facilitates the expansion of the EV infrastructure network. We believe this cooperation will accelerate MPT’s market penetration, and help us maintain our leadership position, and achieve greater success in China’s booming EV industry.
48
On June 2, 2015, we signed an agreement with Alibaba (China) Co., LTD. Based on Kandi’s EV information, the Alibaba YunOS system will be used as an operating system for Kandi vehicle while connecting with customer’s individual Taobao accounts. Through this system, car-sharing providers can collect information about traffic conditions and individual habits. We believe, via the cooperation with Alibaba, we will provide customers better user experiences and assure Kandi’s leading position in the EV market.
On June 30, 2015, we announced that the JV company has received a payment of US$44.3 million representing a national subsidy for pure EV sales during the third and fourth quarter of 2014. In addition, the government starts to distribute the 2015 financial subsidy, and the JV Company will receive this payment shortly. These funds will improve the balance of the Company’s accounts receivable. With the national government’s strong financial support, we believe the Kandi brand will continue to lead pure electric vehicle production and sales growth in China.
On July 6, 2015, we announced that the JV company signed a sales contract with Zhejiang Shi Kong Electric Vehicle Co. Ltd. (“Zhejiang Shi Kong”) for 4,000 units of Kandi Brand electric vehicles (EVs), including 1,500 units of Kandi K11 (Panda) and 2,500 units of Kandi K10 (Mini). The total value of the contract is over $89 million. Kandi expects vehicle delivery to be completed by the end of 2015.Zhejiang Shi Kong is dedicated to deepening the penetration of new energy vehicles (NEVs) through the Internet Plus concept. The 4,000 units of Kandi Brand EVs will be used in Zhejiang Shi Kong’s innovative programs to promote the adoption of NEVs in China. This sales contract marks Kandi’s entrance into this innovative field, and will further enhance our leadership position in China’s EV market.
On July 13, 2015, we announced that the JV company planned to launch MPT program in Kunming City, the target is to deliver 2,000 Kandi Brand electric vehicles products by the end of 2015.This program is also strongly supported by the local government.
On July 20, 2015, we announced that the JV company and Luzhou Jiecheng Auto Co. Ltd. have signed a strategic cooperation agreement for the sale of1,500Kandi brand EVs in Luzhou to launch the MPT program. In support of the program, the Luzhou municipal government will match the national government’s per-vehicle subsidy. The delivery is expected by the end of 2015. We believe this cooperation will accelerate MPT’s market penetration and help us to maintain our leadership position in China’s booming EV industry.
Item 3. Quantitative and Qualitative Disclosures About Market Risk
Exchange Rate Risk
Our operations are conducted mainly in the PRC. As such, our earnings are subject to movements in foreign currency exchange rates when transactions are denominated in Chinese Renminibi (“RMB”), which is our functional currency. Accordingly, our operating results are affected by changes in the exchange rate between the U.S. dollar and RMB currencies.
Economic and Political Risks
Our operations in the PRC are subject to special considerations and significant risks not typically associated with companies in North America and Western Europe. These include risks associated with, among others, the political, economic and legal environment in the PRC and foreign currency exchange. Our performance may be adversely affected by changes in the political and social conditions in the PRC, and by changes in governmental policies with respect to laws and regulations, anti-inflationary measures, currency conversion, remittances abroad, and rates and methods of taxation, among other things.
49
Item 4.Controls and Procedures.
Evaluation of Disclosure Controls and Procedures
We have evaluated, under the supervision of our Chief Executive Officer (“CEO”) and our Chief Financial Officer (“CFO”), the effectiveness of disclosure controls and procedures (as such term is defined in Rules 13a-15(e) and 15d-15(e) under the Securities Exchange Act of 1934 (the “Exchange Act”)) as of June 30, 2015. Based on this evaluation, our CEO and CFO concluded that as of the end of the period covered by this report, our disclosure controls and procedures were effective.
Disclosure controls and procedures are controls and other procedures that are designed to ensure that information required to be disclosed in our reports filed or submitted under the Exchange Act (a) is recorded, processed, summarized and reported within the time periods specified in the SEC’s rules and forms and (b) is accumulated and communicated to management, including our CEO and CFO, as appropriate, to allow timely decisions regarding required disclosure. Our management recognizes that any controls and procedures, no matter how well designed and operated, can provide only reasonable assurance of achieving their objectives and management necessarily applies its judgment in evaluating the cost-benefit relationship of possible controls and procedures. Our disclosure controls and procedures are designed to provide reasonable assurance of achieving their objectives as described above.
Changes in Internal Control over Financial Reporting
There was no change to our internal control over financial reporting (as defined in Rules 13a-15(f) and 15d-15(f) under the Exchange Act) that occurred during the period covered by this report that have materially affected, or are reasonably likely to materially affect, our internal control over financial reporting.
PART II – OTHER INFORMATION
Item 1A. Risk Factors
Changes in the policies of the PRC government could have a significant impact upon the business we may be able to conduct in the PRC and the profitability of such business.
On April 29, 2015, the four government departments in the PRC, Ministry of Finance, Ministry of Science and Technology, Ministry of Industry and Information Technology and National Development and Reform Commission jointly announced the subsidy policy for new energy vehicles from year 2016 to 2020, which declares the subsidy of year 2017-2018 will be reduced by 20% based on year 2016, and the subsidy of year 2019-2020 will be reduced by 40% based on year 2016. Furthermore, the policy increased the driving range from 80 kilometers to 100 kilometers as a threshold for the receipt of the subsidy. This policy may impact the Company’s future business and profitability growth.
Item 5. Other Information
On August 8, 2015, the Company, the investors and the placement agent in the
registered direct financing consummated in March 2014 entered into certain
warrant extension agreements for the warrants to purchase a total of 127,260
shares of the common stock (the “March Warrants”). Pursuant to the extension
agreements, the term for the March Warrants was extended for four months from
September 21, 2015 to January 20, 2016.
On August 8, 2015, the Company and the investors in the registered direct
financing consummated in September 2014 entered into certain warrant extension
agreements for the warrants to purchase a total of 743,024 shares of the common
stock (the “September Warrants”). Pursuant to the extension agreements, the term
for the September Warrants was extended for four months from February 4, 2016 to
June 3, 2016.
On May 29, 2015, the Company granted certain non-statutory stock options at an
exercise price of $9.72 under its 2008 Omnibus Long-Term Incentive Plan to
certain directors, officers and employees. This action triggered an adjustment
of the exercise price set forth in the March Warrants and September Warrants.
The exercise price of the March Warrants has been adjusted from $22.80 to $9.72
and the exercise price of the September Warrants has been adjusted from $21.50
to $9.72 (the “Adjustments”). The Company notified the applicable holders of the
March Warrants and the September Warrants the Adjustments on July 28, 2015 after
which a four-month period extension for both the March Warrants and the
September Warrants were negotiated and agreed upon by the Company and the
applicable warrant holders. In consideration of the extension, the applicable
warrant holders agreed to forfeit all rights to compensation or other damages,
and to file lawsuits or other claims against the Company, regarding or arising
out of the late notice of the Adjustments. A copy of the form warrant extension
agreement is filed hereto as Exhibit 4.1 and incorporated by reference herein.
50
Item 6. Exhibits
| Exhibit | Description |
| Number | |
| 4.1 | Form of Warrant Extension Agreement |
| 31.1 | |
| 31.2 | |
| 32.1 | |
| 101.INS | |
| 101.SCH | |
| 101.CAL | |
| 101.LAB | |
| 101.PRE | |
| 101.DEF |
51
SIGNATURES
Pursuant to the requirements of the Securities Exchange Act of 1934, as amended, the registrant caused this report to be signed on its behalf by the undersigned, thereunto duly authorized.
| Date: August 10, 2015 | By: | /s/ Hu Xiaoming |
| Hu Xiaoming | ||
| President and Chief Executive Officer | ||
| (Principal Executive Officer) | ||
| Date: August 10, 2015 | By: | /s/ Wang Cheng (Henry) |
| Wang Cheng (Henry) | ||
| Chief Financial Officer | ||
| (Principal Financial Officer and Principal | ||
| Accounting Officer) |
52