Attached files
Table of Contents
Index to Financial Statements
As filed with the Securities and Exchange Commission on August 10, 2015
Registration No. 333-205170
UNITED STATES
SECURITIES AND EXCHANGE COMMISSION
Washington, D.C. 20549
Amendment No. 1
to
FORM S-1
REGISTRATION STATEMENT
UNDER
THE SECURITIES ACT OF 1933
Freeport-McMoRan Oil & Gas Inc.
(Exact name of registrant as specified in its charter)
| Delaware | 1311 | 47-4274520 | ||
| (State or other jurisdiction of incorporation or organization) |
(Primary Standard Industrial Classification Code Number) |
(I.R.S. Employer Identification Number) |
700 Milam, Suite 3100
Houston, Texas 77002
(713) 579-6000
(Address, including zip code, and telephone number, including area code, of registrant’s principal executive offices)
John F. Wombwell
Executive Vice President, General Counsel and Secretary
700 Milam, Suite 3100
Houston, Texas 77002
(713) 579-6000
(Name, address, including zip code, and telephone number, including area code, of agent for service)
Copies to:
| Michael E. Dillard Sean T. Wheeler Latham & Watkins LLP 811 Main Street, Suite 3700 Houston, Texas 77002 (713) 546-5400 |
G. Michael O’Leary Henry Havre Andrews Kurth LLP 600 Travis Street, Suite 4200 Houston, Texas 77002 (713) 220-4200 |
Approximate date of commencement of proposed sale to the public:
As soon as practicable after the effective date of this Registration Statement.
If any of the securities being registered on this Form are to be offered on a delayed or continuous basis pursuant to Rule 415 under the Securities Act of 1933 check the following box: ¨
If this Form is filed to register additional securities for an offering pursuant to Rule 462(b) under the Securities Act, please check the following box and list the Securities Act registration statement number of the earlier effective registration statement for the same offering. ¨
If this Form is a post-effective amendment filed pursuant to Rule 462(c) under the Securities Act, check the following box and list the Securities Act registration statement number of the earlier effective registration statement for the same offering. ¨
If this Form is a post-effective amendment filed pursuant to Rule 462(d) under the Securities Act, check the following box and list the Securities Act registration statement number of the earlier effective registration statement for the same offering. ¨
Indicate by check mark whether the registrant is a large accelerated filer, an accelerated filer, a non-accelerated filer, or a smaller reporting company. See the definitions of “large accelerated filer,” “accelerated filer” and “smaller reporting company” in Rule 12b-2 of the Exchange Act.
| Large accelerated filer ¨ | Accelerated filer ¨ | Non-accelerated filer x | Smaller reporting company ¨ | |||
| (Do not check if a smaller reporting company) |
The registrant hereby amends this Registration Statement on such date or dates as may be necessary to delay its effective date until the registrant shall file a further amendment which specifically states that this Registration Statement shall thereafter become effective in accordance with Section 8(a) of the Securities Act of 1933 or until this Registration Statement shall become effective on such date as the Securities and Exchange Commission, acting pursuant to said Section 8(a), may determine.
Table of Contents
Index to Financial Statements
The information in this prospectus is not complete and may be changed. We may not sell these securities until the registration statement filed with the Securities and Exchange Commission is effective. This prospectus is not an offer to sell these securities and it is not soliciting an offer to buy these securities in any jurisdiction where the offer or sale is not permitted.
Subject to Completion, dated August 10, 2015
PROSPECTUS
Shares
Freeport-McMoRan Oil & Gas Inc.
Class A Common Stock
This is the initial public offering of the Class A common stock of Freeport-McMoRan Oil & Gas Inc. We are offering shares of our Class A common stock. No public market currently exists for our Class A common stock.
We intend to apply to list our Class A common stock on the New York Stock Exchange under the symbol “FMOG.”
We anticipate that the initial public offering price will be between $ and $ per share.
Following this offering, we will have two classes of authorized common stock: Class A common stock and Class B common stock. Each share of our Class A common stock entitles its holder to one vote on all matters to be voted on by stockholders, generally. Each share of our Class B common stock entitles its holder to five votes on all matters to be voted on by stockholders, generally. Holders of our Class A and Class B common stock vote together as a single class on all matters presented to our stockholders for their vote or approval, except as otherwise required by applicable law. Our parent company, Freeport-McMoRan Inc., will hold shares of Class B common stock, representing percent of our total outstanding shares of common stock, 100 percent of our total outstanding shares of Class B common stock, and percent of the combined voting power of our outstanding common stock upon completion of this offering, assuming that the underwriters do not exercise their option to purchase additional shares of Class A common stock from us. The shares being sold in this offering will represent percent of our total outstanding shares of common stock immediately following this offering assuming that the underwriters do not exercise their option to purchase additional shares of Class A common stock from us.
Investing in our Class A common stock involves certain risks. See “Risk Factors” beginning on page 25 of this prospectus.
| Per Share | Total | |||||||
| Price to the public |
$ | $ | ||||||
| Underwriting discounts and commissions(1) |
$ | $ | ||||||
| Proceeds to us (before expenses) |
$ | $ | ||||||
| (1) | See “Underwriting” for a description of all underwriting compensation payable in connection with this offering. |
We have granted the underwriters the option to purchase additional shares of Class A common stock from us on the same terms and conditions set forth above if the underwriters sell more than shares of Class A common stock in this offering.
Neither the Securities and Exchange Commission nor any state securities commission has approved or disapproved of these securities or passed on the adequacy or accuracy of this prospectus. Any representation to the contrary is a criminal offense.
Barclays expects to deliver the shares on or about , 2015 through the book-entry facilities of The Depository Trust Company.
| Barclays |
Prospectus dated , 2015
Table of Contents
Index to Financial Statements
| 1 | ||||
| 1 | ||||
| Deepwater GOM Producing Assets, Sanctioned Discoveries and Associated Drilling Inventory |
2 | |||
| Deepwater GOM Discoveries in Pre-Sanction Stage with Potential Development Opportunities |
6 | |||
| 6 | ||||
| 7 | ||||
| 8 | ||||
| 9 | ||||
| 9 | ||||
| 10 | ||||
| 10 | ||||
| 11 | ||||
| 13 | ||||
| 13 | ||||
| 14 | ||||
| 15 | ||||
| 17 | ||||
| 18 | ||||
| 19 | ||||
| 20 | ||||
| 24 | ||||
| 25 | ||||
| 25 | ||||
| 49 | ||||
| 57 | ||||
| 59 | ||||
| 59 | ||||
| 60 | ||||
| 61 | ||||
| 62 | ||||
| MANAGEMENT’S DISCUSSION AND ANALYSIS OF FINANCIAL CONDITION AND RESULTS OF OPERATIONS |
64 | |||
| 64 | ||||
| 65 | ||||
| 66 | ||||
| 72 | ||||
| 78 | ||||
| 81 | ||||
| 82 | ||||
| 85 | ||||
| 86 | ||||
| 89 | ||||
| 89 | ||||
| 90 | ||||
| 105 | ||||
| 105 | ||||
| 107 | ||||
| Select Producing Fields and Development Projects in the Deepwater GOM |
108 | |||
| 109 |
i
Table of Contents
Index to Financial Statements
| 111 | ||||
| 111 | ||||
| Deepwater GOM Producing Assets, Sanctioned Discoveries and Associated Drilling Inventory |
112 | |||
| Deepwater GOM Discoveries in Pre-Sanction Stage with Potential Development Opportunities |
118 | |||
| 120 | ||||
| 124 | ||||
| 126 | ||||
| 127 | ||||
| 128 | ||||
| 129 | ||||
| 130 | ||||
| 131 | ||||
| 133 | ||||
| 139 | ||||
| 144 | ||||
| 146 | ||||
| 153 | ||||
| 154 | ||||
| 154 | ||||
| 154 | ||||
| 155 | ||||
| 155 | ||||
| 156 | ||||
| 156 | ||||
| 156 | ||||
| 157 | ||||
| 157 | ||||
| 157 | ||||
| 158 | ||||
| 171 | ||||
| 172 | ||||
| 177 | ||||
| 180 | ||||
| 180 | ||||
| 181 | ||||
| 181 | ||||
| 182 | ||||
| 182 | ||||
| 182 | ||||
| 182 | ||||
| 183 | ||||
| Policies and Procedures for Review of Related Party Transactions |
184 | |||
| 185 | ||||
| 187 | ||||
| 188 | ||||
| 188 | ||||
| 188 | ||||
| 189 | ||||
| Certain Provisions of Our Amended and Restated Certificate of Incorporation and By-laws |
189 |
ii
Table of Contents
Index to Financial Statements
| 193 | ||||
| 193 | ||||
| 193 | ||||
| 193 | ||||
| 194 | ||||
| 194 | ||||
| MATERIAL U.S. FEDERAL INCOME TAX CONSEQUENCES TO NON-U.S. HOLDERS OF OUR CLASS A COMMON STOCK |
195 | |||
| 196 | ||||
| 196 | ||||
| 197 | ||||
| 197 | ||||
| Additional Withholding Tax on Payments Made to Foreign Accounts |
198 | |||
| 199 | ||||
| 199 | ||||
| 199 | ||||
| 200 | ||||
| 201 | ||||
| 201 | ||||
| 201 | ||||
| 201 | ||||
| 202 | ||||
| 202 | ||||
| 202 | ||||
| 203 | ||||
| 203 | ||||
| 203 | ||||
| 207 | ||||
| 207 | ||||
| 207 | ||||
| 208 |
You should rely only on the information contained in this prospectus and any free writing prospectus prepared by or on behalf of us or to which we have referred you. Neither we nor the underwriters have authorized anyone to provide you with information different from that contained in this prospectus and any free writing prospectus. We are offering to sell shares of Class A common stock and seeking offers to buy shares of Class A common stock only in jurisdictions where offers and sales are permitted. The information contained in this prospectus is accurate only as of the date of this prospectus regardless of the time of delivery of this prospectus or any sale of the Class A common stock.
Industry and Market Data
The market data and certain other statistical information used throughout this prospectus are based on independent industry publications, government publications or other independent published sources. Some data is also based on our good faith estimates. Such data involve a number of assumptions and limitations, and you are cautioned not to give undue weight to such information. The industry in which we operate is subject to a high degree of uncertainty and risk due to a variety of factors, including those described in the section entitled “Risk Factors.” These and other factors could cause results to differ materially from those expressed in these publications.
iii
Table of Contents
Index to Financial Statements
This summary provides a brief overview of information contained elsewhere in this prospectus and does not contain all of the information that you should consider before investing in our Class A common stock. You should read the entire prospectus carefully before making an investment decision, including the information presented under the headings “Risk Factors,” “Cautionary Note Regarding Forward-Looking Statements” and “Management’s Discussion and Analysis of Financial Condition and Results of Operations.” Unless otherwise indicated, the information presented in this prospectus assumes that the underwriters’ option to purchase additional shares of Class A common stock from us is not exercised. Several terms used in this prospectus are defined in the “Glossary.” References to our estimated proved, probable and possible reserves, standardized measure and PV-10 are derived from our reserve reports prepared by our external, independent petroleum engineering firms Netherland, Sewell & Associates, Inc., which we refer to as NSAI, and Ryder Scott Company, L.P., which we refer to as Ryder Scott.
In this prospectus, unless the context otherwise requires, the terms “we,” “us,” “our,” and “FCX O&G” refer to FCX Oil & Gas Inc. and its subsidiaries before the completion of our corporate reorganization prior to the closing of this offering, and Freeport-McMoRan Oil & Gas Inc., which we refer to as “FM O&G Inc.” and its subsidiaries as of the completion of our corporate reorganization and thereafter. The term “FCX” refers to Freeport-McMoRan Inc., our direct parent after completion of our corporate reorganization. See “Corporate Reorganization.”
We are an upstream oil and gas energy company primarily engaged in acquiring, exploring for, developing and producing oil and gas properties. We are focused on growing our strategic position in the Deepwater U.S. Gulf of Mexico, which we refer to as the Deepwater GOM. Our Deepwater GOM position has significant current oil production, strong cash margins and existing infrastructure with excess production and handling capacity. We expect this existing infrastructure and our extensive inventory of drilling opportunities will allow us to grow our Deepwater GOM production with comparatively low capital expenditures. In addition, our onshore and offshore properties in California are characterized as low-decline properties with stable production and long-lived reserves. We also have a large, onshore gas position in the Haynesville shale and the Inboard Lower Tertiary/Cretaceous gas trend located onshore in South Louisiana. Our Madden field in Central Wyoming also provides us with additional predictable cash flows, low-decline production and long-lived gas reserves. Our gas-weighted assets position us to benefit from a recovery in gas prices. We are currently focused on growing our proved reserves and production by developing our oil-weighted properties in the Deepwater GOM with a prudent capital profile for the current commodity price environment.
We believe our portfolio of oil and gas properties delivers financially attractive investment opportunities with growth potential in terms of production, cash margin and reserves. For the six months ended June 30, 2015, 88 percent of our oil and gas revenues, excluding the impact of derivative contracts, was from oil and NGLs. Our oil and gas business has significant proved, probable and possible reserves and a broad range of additional development opportunities, including discoveries and identified prospects in the Deepwater GOM. A significant portion of our planned capital expenditures are expected to be focused on converting our probable and possible reserves and prospective resources to the proved reserves category as we are focused on developing our relatively low-risk near-term Deepwater GOM inventory. We strive to manage our business to reinvest cash flows in projects with attractive risk-adjusted rates of return.
1
Table of Contents
Index to Financial Statements
Based on data derived from reserve reports prepared by our external, independent petroleum engineering firms, our estimated oil and gas reserves at December 31, 2014 were as follows:
| Oil (MMBbls) |
NGLs (MMBbls) |
Gas (Bcf)(1) |
Total (MMBoe)(1) |
PV-10(2) | ||||||||||||||||
| Proved Reserves(3) |
278 | 10 | 610 | 390 | $ | 8.1 billion | ||||||||||||||
| Probable Reserves(3) |
192 | 7 | 278 | 245 | $ | 4.8 billion | ||||||||||||||
| Possible Reserves(3) |
230 | 9 | 592 | 338 | $ | 6.7 billion | ||||||||||||||
| (1) | Excludes 19 Bcf of proved reserves, 25 Bcf of probable reserves and 53 Bcf of possible reserves as of December 31, 2014, related to the Highlander gas discovery well located in the Inboard Lower Tertiary/Cretaceous trend, for which external reserve estimates were completed in March 2015. |
| (2) | PV-10 is a non-GAAP financial measure. Standardized Measure is the most directly comparable GAAP measure, which was $6.5 billion for proved reserves at December 31, 2014. GAAP does not provide a measure of estimated future net cash flows for reserves other than proved reserves. Therefore, a reconciliation between PV-10 and Standardized Measure for probable and possible reserves is not subsequently provided. Because PV-10 estimates of probable and possible reserves are more uncertain than the PV-10 and Standardized Measure of proved reserves, but have not been adjusted for risk due to that uncertainty, they may not be comparable with each other. For additional information about PV-10 and how it differs from the Standardized Measure, see “Summary Consolidated Financial, Reserve and Operating Data—Non-GAAP Financial Measures.” |
| (3) | At December 31, 2014, proved undeveloped reserves were composed of 104 MMBbls of oil and NGLs and 241 Bcf of gas for a total of 144 MMBoe, which comprised 37 percent of our total proved reserves. Volumes and values were determined in accordance with the U.S. Securities and Exchange Commission, which we refer to as the SEC, rules using reference prices for oil and gas of $94.99 per Bbl and $4.35 per MMBtu, respectively. Our probable and possible reserves include 70 MMBoe and 182 MMBoe, respectively, related to our Deepwater GOM producing assets and discoveries attributable to incremental increases in recovery factor or volumetric drainage areas. Our probable and possible reserves are based upon observed well production performance, reservoir simulation modeling and volumetric calculations. See “Risk Factors—Risks Related to Our Business—Our estimated reserves are based on many assumptions that may turn out to be inaccurate. Significant inaccuracies in these underlying assumptions will materially affect the quantities and present value of our proved reserves.” |
Our acreage position was 1,022,537 gross (436,189 net) developed acres and 4,017,361 gross (2,458,424 net) undeveloped acres at December 31, 2014. At December 31, 2014, we owned working interests in 3,069 gross (2,991 net) active producing oil wells and 1,710 gross (211 net) active producing gas wells. For the six months ended June 30, 2015, we generated sales volumes of 142 MBoe/d with realized revenues, including cash gains on derivatives, of $46.95 per Boe and cash production costs of $19.62 per Boe. Realized revenue and cash production costs are non-GAAP financial measures. Revenue and production costs, respectively, are the most directly comparable GAAP measure, which were $41.35 per Boe and $22.01 per Boe, respectively, for the six months ended June 30, 2015. See “Summary Consolidated Financial, Reserve and Operating Data—Non-GAAP Financial Measures.”
Deepwater GOM Producing Assets, Sanctioned Discoveries and Associated Drilling Inventory
We have a large strategic position in the Deepwater GOM with significant current oil production, strong cash margins and existing infrastructure with excess production and handling capacity. These assets, combined with our large leasehold interests, provide financially attractive near-term drilling opportunities for growth in oil production and cash margins. Our properties and activities are principally located in four focus areas, which we refer to as Atwater Valley, Green Canyon, Mississippi Canyon and Keathley Canyon. Furthermore, our capital allocation strategy is principally focused on drilling wells that can be tied back expeditiously to our existing facilities. We have adopted a prudent capital profile for the current commodity price environment in which we have deferred certain capital associated with completion and infrastructure spending and are electing to defer production growth for potentially more favorable market conditions. We believe our existing infrastructure provides us with a competitive advantage by allowing for flexibility to control the pace of our development and production activities for relatively low amounts of investment capital as compared to competitors who lack access to such facilities. In addition, we expect to apply existing technologies in subsea pumping and lifting technology to our properties. This technology can provide the potential for increasing hydrocarbon recovery by boosting pressure required for delivery at the existing host platform.
2
Table of Contents
Index to Financial Statements
The following is a summary of our Deepwater GOM platforms and currently producing fields at June 30, 2015:
| Avg. Daily Net Sales Volumes for the Six Months Ended June 30, 2015 (MBoe/d) |
||||||||||||||||||||||||||||||||
| Platform |
Working Interest |
Operator | Type of Platform | Production Commenced |
Water Depth (Feet) |
Gross |
Gross Oil Capacity Utilization %(1) |
|||||||||||||||||||||||||
| Oil (MBbls) |
Gas (MMcf) |
|||||||||||||||||||||||||||||||
| Holstein |
100 | % | FCX O&G | Truss Spar | 2004 | 4,300 | 13 | 113 | 142 | 11 | % | |||||||||||||||||||||
| Marlin Hub(2) |
100 | % | FCX O&G | Tension Leg | 2000 | 3,200 | 24 | 60 | 235 | 37 | % | |||||||||||||||||||||
| Horn Mountain |
100 | % | FCX O&G | Truss Spar | 2002 | 5,400 | 9 | 75 | 72 | 11 | % | |||||||||||||||||||||
| Lucius |
25.1 | % | Anadarko | Truss Spar | 2015 | 7,200 | 13 | 80 | 450 | 59 | % | |||||||||||||||||||||
| Ram Powell |
31.0 | % | Shell | Tension Leg | 1997 | 3,200 | 3 | 70 | 310 | 7 | % | |||||||||||||||||||||
| Hoover |
33.3 | % | ExxonMobil | Deep Draft Caisson Vessel |
2000 | 4,800 | 2 | 100 | 325 | 6 | % | |||||||||||||||||||||
|
|
|
|||||||||||||||||||||||||||||||
| Total | 64 | |||||||||||||||||||||||||||||||
| (1) | Represents average daily gross oil production for the six months ended June 30, 2015 as a percentage of total production capacity during such period. |
| (2) | The Marlin Hub is the production facility for three fields: Marlin, Dorado and King. |
Since the acquisition of our Holstein, Marlin Hub and Horn Mountain properties from subsidiaries of BP p.l.c., which we refer to as BP, and Royal Dutch Shell p.l.c., which we refer to as Shell, in November 2012, we have been active in optimizing production from existing wells through well workover and stimulation activities in previously developed formations. The significant production history from these assets, together with extensive reservoir modeling and multiple series of seismic evaluation and interpretation, gives us high confidence in achieving positive results in our planned near-term development drilling activities.
Our planned development activities associated with our Deepwater GOM producing assets targeting known productive pay sand in these fields are listed below.
| Focus Area | Working Interest |
Operator | Number of Currently Producing Wells |
Identified Undeveloped Locations(1) |
||||||||||||||||
| Producing Field |
Number | Projected First Spud |
||||||||||||||||||
| Holstein |
Green Canyon | 100 | % | FCX O&G | 11 | 9 | 2016 | |||||||||||||
| Marlin Hub |
Mississippi Canyon | |||||||||||||||||||
| Dorado |
100 | % | FCX O&G | 4 | 2 | 2016 | ||||||||||||||
| King |
100 | % | FCX O&G | 4 | 5 | (2) | 2015 | |||||||||||||
| Horn Mountain |
Mississippi Canyon | 100 | % | FCX O&G | 6 | 7 | (3) | 2015 | ||||||||||||
| Lucius |
Keathley Canyon | 25.1 | % | Anadarko | 6 | 10 | 2016 | |||||||||||||
| Ram Powell |
Mississippi Canyon | 31.0 | % | Shell | 8 | 1 | 2015 | |||||||||||||
|
|
|
|
|
|||||||||||||||||
| Total | 39 | 34 | ||||||||||||||||||
| (1) | Of our 34 identified undeveloped locations associated with our Deepwater GOM producing assets, 19 are included in our reserve reports, 15 of which were classified as proved undeveloped locations, prepared by our external, independent petroleum engineering firms as of December 31, 2014. The drilling locations on which we ultimately drill will depend on the availability of capital, regulatory approvals, commodity prices, costs, actual drilling results and other factors. Any drilling activities on these identified undeveloped locations may not be successful and may not result in additions to our existing proved reserves. Successful drilling activities could require substantial additional capital expenditures. For more information, see “Risk Factors—Risks Related to Our Business—Our business plan requires |
3
Table of Contents
Index to Financial Statements
| substantial additional capital, which we may be unable to raise on acceptable terms in the future, which may in turn limit our ability to execute our business plan and could lead to a loss of properties and have a material adverse effect on our production, reserves and results of operations.” |
| (2) | Includes a development well drilled in January 2015. |
| (3) | Includes a development well drilled in June 2015 and two development wells drilled in July 2015. |
Holstein. In 2014, we commenced a program to redevelop Holstein and successfully drilled two sidetrack wells utilizing our owned platform drilling rig. Our future plans for Holstein include additional sidetracks and drilling activities. In addition, we have made a significant discovery in deeper subsalt Miocene reservoirs at Holstein, which we refer to as Holstein Deep, and we are developing this discovery by means of a subsea tieback with the potential to apply existing subsea enhancement technologies that could increase total recovery efficiencies for the project.
Marlin Hub. Activities in the Marlin Hub area have focused on infield drilling at the Dorado and King fields, which are produced through subsea tie back to the Marlin platform. In December 2014, we successfully drilled a development well at Dorado that encountered 245 net feet of Miocene oil pay. This well was placed on production in March 2015 after a successful production test with gross volumes in excess of seven MBbls of oil per day and eight MMcf of gas per day and continues to produce at strong rates. At King, we drilled a development well in January 2015 and logged 63 net feet of Miocene oil pay. We subsequently sidetracked and completed this well for an optimum oil take point, and we expect to place this well on production in 2015. Our future plans at Dorado and King include additional drilling in the same Miocene horizons in the second half of 2015 and in 2016. In addition, we have identified prospective drilling at King in deeper horizons, which we refer to as King West Deep. Future wells in the Marlin Hub area can be brought on-line expeditiously through our existing infrastructure and future subsea tiebacks have the potential to utilize existing subsea enhancement technologies that could increase total recovery efficiencies. In second-quarter 2015, we completed maintenance activities, including installation of new export flow line flex joints, which will extend the life of the Marlin platform.
Horn Mountain. Our producing wells in the Horn Mountain field target formations similar to those in the Marlin Hub area and are located in the same geologic setting as our production from the Dorado and King fields. The currently producing wells use dry trees to connect to the Horn Mountain spar. To enhance our recovery of remaining oil in place, our future development plan anticipates utilizing subsea tieback wells targeting multiple stacked sands. During the three months ended June 30, 2015, the Quebec/Victory well, the first location of this program, was drilled to 14,780 feet and we have logged 355 net feet of oil and gas pay. Upon completion, we plan to put this well on production in 2016. In June 2015, drilling operations commenced at the Kilo/Oscar and Horn Mountain Updip wells. At Kilo/Oscar, the well was drilled to a total depth of 14,250 feet and successfully logged 166 net feet of oil pay. At Horn Mountain Updip, the well was drilled to a total depth of 14,780 feet and successfully logged 112 net feet of oil and gas pay. This infill development drilling program will target hydrocarbon accumulations in the sands found to be productive at Horn Mountain and, in addition to these three wells, consists of the Horn Mountain Northwest, Eland/Zebra, Sable and Lion locations. In addition, we have identified prospective drilling in deeper horizons, which we refer to as Horn Mountain Deep which we plan to spud in third-quarter 2015. All planned and prospective drilling at Horn Mountain has the potential to utilize existing subsea enhancement technologies that could increase total recovery efficiencies.
Lucius. In January 2015, we began production from an initial six-well development in the Lucius field operated by Anadarko Petroleum Corporation, which we refer to as Anadarko. During the three months ended June 30, 2015, the Lucius Oil Facility reached capacity of 80 MBbls of oil per day. Lucius is a world-class subsalt Pliocene and Miocene discovery with high-quality reservoir attributes. We participated in the drilling of the discovery well in 2009 and increased our working interest through an acquisition in 2014. In 2011, we and the other working interest owners sanctioned the spar construction, with initial development focused primarily on the Pliocene-aged sands with average net pay thickness of 469 feet. In addition, we have identified further
4
Table of Contents
Index to Financial Statements
drilling opportunities in the Pliocene and Miocene horizons at Lucius. Our Lucius development is an example of how historically we have partnered with third party capital providers to finance development costs related to our Deepwater GOM properties. In 2011, subsequent to the Lucius discovery well, we raised $450 million through the issuance of convertible preferred stock in one of our subsidiaries that holds a portion of our interest at Lucius.
Ram Powell. In March 2015, Shell successfully drilled a development well at Ram Powell logging 106 feet of pay in above salt Miocene reservoirs. The well has been completed and came online in July 2015.
In addition to our activities on our producing fields we own interests in and have been actively developing two discoveries that have been sanctioned for development. Both of these discoveries are located in our Green Canyon focus area and target subsalt Miocene reservoirs.
The following table provides a summary of our active development projects:
| Discovery |
Working Interest |
Operator | Identified Undeveloped Locations(1) |
Projected First Oil |
Focus Area | |||||||||||
| Holstein Deep |
100 | % | FCX O&G | 10 | (2) | 2016 | Green Canyon | |||||||||
| Heidelberg |
12.5 | % | Anadarko | 9 | (3) | 2016 | Green Canyon | |||||||||
|
|
|
|||||||||||||||
| Total | 19 | |||||||||||||||
| (1) | Of our 19 identified undeveloped locations associated with our Deepwater GOM discoveries sanctioned for development, 12 are included in our reserve reports, 6 of which are classified as proved undeveloped locations, prepared by our external, independent petroleum engineering firms as of December 31, 2014. The drilling locations on which we ultimately drill will depend on the availability of capital, regulatory approvals, commodity prices, costs, actual drilling results and other factors. Any drilling activities on these identified undeveloped locations may not be successful and may not result in adding additional reserves to our existing proved reserves. Successful drilling activities could require substantial additional capital expenditures. For more information, see “Risk Factors—Risks Related to Our Business—Our business plan requires substantial additional capital, which we may be unable to raise on acceptable terms in the future, which may in turn limit our ability to execute our business plan and could lead to a loss of properties and have a material adverse effect on our production, reserves and results of operations.” |
| (2) | Includes three development wells drilled in December 2014, February 2015 and July 2015, respectively. |
| (3) | Includes three development wells drilled by Anadarko in 2014 and through May 31, 2015. |
Holstein Deep. This large, high-quality subsalt Miocene oil discovery has the potential to be a phased development project tied back to the Holstein spar. In December 2014, we achieved successful results from a Holstein Deep delineation well that logged 444 feet of net oil pay. In February 2015, we completed drilling the second delineation well, with positive results. This second well encountered 482 feet of net oil pay. The third delineation well was drilled to 29,440 feet and encountered approximately 200 feet of net oil pay. Drilling results from this initial three-well development program successfully established sand continuity across the primary reservoir. Production from this initial three-well development is expected to begin in 2016 with estimated risk-adjusted gross initial individual well flowrates of 8 MBbls of oil per day. We believe that when fully developed this project could have the potential to produce up to 75 MBbls of oil per day.
Heidelberg. The initial Heidelberg discovery well was drilled in 2009 and encountered more than 200 net feet of oil pay. Log and pressure data from the discovery and delineation wells indicate excellent quality, continuous and pressure-connected reservoirs with subsalt Miocene oil. The Heidelberg working interest owners sanctioned a six well development plan, with a new truss spar facility having a design capacity of 80 MBbls of oil per day. Completion activities on the three initial wells are in progress. Fabrication of the main topsides module is complete, the hull is on location, the mooring lines are completed, and the project remains on track for first production in 2016 with anticipated risk-adjusted gross initial individual well flowrates of 10.4 MBbls of oil per day.
5
Table of Contents
Index to Financial Statements
Deepwater GOM Discoveries in Pre-Sanction Stage with Potential Development Opportunities
In addition to our discoveries that have been sanctioned for development, we own working interests in several additional significant oil discoveries that could provide additional production reserves and drilling opportunities. These discoveries consist of subsalt Miocene and Lower Tertiary formations located in our Atwater Valley and Keathley Canyon focus areas. These discoveries hold significant potential and the timing of their development will be dependent on finalization of development plans and sanctioning by us and our partners.
The following table provides a summary of our discoveries that are in the pre-sanctioning phase:
| Discovery |
Working Interest |
Operator | Identified Undeveloped Locations(1) |
Projected First Oil |
Focus Area | |||||||||||
| Vito |
18.67 | % | Shell | 15 | 2020 | Atwater Valley | ||||||||||
| Power Nap |
50 | % | Shell | 5 | 2020 | Atwater Valley | ||||||||||
| Phobos |
50 | % | Anadarko | 9 | 2020 | Keathley Canyon | ||||||||||
|
|
|
|||||||||||||||
| Total | 29 | |||||||||||||||
| (1) | Of our 29 identified undeveloped locations associated with our Deepwater GOM discoveries in the pre-sanctioning stage, none are included in our reserve reports prepared by our external, independent petroleum engineering firms. The drilling locations on which we ultimately drill will depend on the availability of capital, regulatory approvals, commodity prices, costs, actual drilling results and other factors. Neither the Vito, Power Nap, nor Phobos discoveries have been sanctioned for further development by us or our partners. Any drilling activities on these identified undeveloped locations may not be successful and may not result in adding additional reserves to our existing proved reserves. Successful drilling activities could require substantial additional capital expenditures. For more information, see “Risk Factors—Risks Related to Our Business—Our business plan requires substantial additional capital, which we may be unable to raise on acceptable terms in the future, which may in turn limit our ability to execute our business plan and could lead to a loss of properties and have a material adverse effect on our production, reserves and results of operations.” |
Vito and Power Nap. Vito is a large, deep subsalt Miocene oil discovery made in 2009. Exploration and delineation drilling in recent years confirmed a significant resource in high-quality, subsalt Miocene sands with an average net pay of 457 feet. Development options are under evaluation by the working interest owners, and we expect Shell, as the operator, to propose a sanctioning development plan for 2016. Power Nap is located in close proximity to Vito where we encountered positive drilling results in December 2014 in the same sands as Vito. Delineation drilling activities consisting of two sidetracks have confirmed the findings in the initial well. The working interest owners are currently evaluating development options for Power Nap.
Phobos. In 2013, the initial Phobos discovery well, located in the Sigsbee Escarpment area, was drilled and encountered more than 250 net feet of pay in Lower Tertiary reservoirs. We expect a potential Phobos development to benefit from its close proximity to the Lucius spar. The working interest owners are evaluating future plans for this discovery.
Deepwater GOM Prospect Inventory and Drilling Plans
In addition to the proved, probable and possible reserves and prospective resources associated with our Deepwater GOM producing assets and Deepwater GOM discoveries, we have a large inventory of identified prospects with production and resource potential. Our inventory consists of both above salt and subsalt formations and is focused on resources that, upon success, we plan to tieback to our Holstein, Horn Mountain, Marlin and Lucius platforms or can be developed in conjunction with our Vito and Power Nap discoveries, should those discoveries be sanctioned for development. Our operational control and remaining primary term lease position for these prospects allows us the ability to modify the timing of when we expect to drill the initial well in these prospects. We target resources primarily in Pliocene and Miocene reservoirs but also have large prospects in the Lower Tertiary.
6
Table of Contents
Index to Financial Statements
Our Deepwater GOM prospect inventory consists of interests in 16 prospects, which were identified by seismic imaging and which include 154 undeveloped well locations. The following table provides a summary of prospects and projected spud dates. The commercial success of these prospects would likely lead to a large number of additional drilling opportunities in the future.
| Prospect |
Operator | Working Interest(1) |
Identified Undeveloped Locations(2) |
Projected Spud Year(3) |
Focus Area | |||||||||
| Deep Sleep |
Shell | 50 | % | 10 | 2015 | Atwater Valley | ||||||||
| Horn Mountain Deep |
FCX O&G | 100 | % | 6 | 2015 | Mississippi Canyon | ||||||||
| Sun |
FCX O&G | 100 | % | 14 | 2016 | Atwater Valley | ||||||||
| Spitfire |
FCX O&G | 100 | % | 20 | 2016 | Atwater Valley | ||||||||
| Holstein Wilcox |
FCX O&G | 100 | % | 16 | 2017 | Green Canyon | ||||||||
| Orange |
FCX O&G | 100 | % | 8 | 2017 | Mississippi Canyon | ||||||||
| Sugar |
FCX O&G | 100 | % | 8 | 2017 | Mississippi Canyon | ||||||||
| Rose |
FCX O&G | 100 | % | 6 | 2017 | Mississippi Canyon | ||||||||
| Fiesta |
FCX O&G | 100 | % | 7 | 2017 | Mississippi Canyon | ||||||||
| Gator |
FCX O&G | 100 | % | 4 | 2017 | Mississippi Canyon | ||||||||
| Lionhead |
Anadarko | 50 | % | 11 | 2017 | Keathley Canyon | ||||||||
| King West Deep |
FCX O&G | 100 | % | 8 | 2018+ | Mississippi Canyon | ||||||||
| Platinum |
FCX O&G | 100 | % | 5 | 2018+ | Mississippi Canyon | ||||||||
| Peach |
FCX O&G | 100 | % | 8 | 2018+ | Mississippi Canyon | ||||||||
| Silverfox |
FCX O&G | 100 | % | 16 | 2018+ | Green Canyon | ||||||||
| Tungsten |
FCX O&G | 100 | % | 7 | 2018+ | Green Canyon | ||||||||
|
|
|
|||||||||||||
| Total | 154 | |||||||||||||
| (1) | Our working interests are subject to change as a result of unitization or co-development of the applicable block or area with adjacent acreage. Our working interest may increase or decrease based on the extent and productivity of the discovery. |
| (2) | We work with NSAI in assessing our identified undeveloped locations for our prospects. Of our 154 identified undeveloped locations associated with our Deepwater GOM prospect inventory, none are included in our reserve reports as of December 31, 2014. The drilling locations on which we actually drill will depend on the availability of capital, regulatory approvals, commodity prices, costs, actual drilling results, participation of partners and other factors. Drilling activities on these identified undeveloped locations may not be successful and may not result in our adding additional proved reserves to our existing proved reserves. Successful drilling activities could require substantial additional capital expenditures. For more information, see “Risk Factors—Risks Related to Our Business—Our business plan requires substantial additional capital, which we may be unable to raise on acceptable terms in the future, which may in turn limit our ability to execute our business plan and could lead to a loss of properties and have a material adverse effect on our production, reserves and results of operations.” The number of identified undeveloped locations are based upon our P10 estimates. |
| (3) | See “Risk Factors—Risks Related to Our Business—Drilling for and producing oil and gas are high-risk activities with many uncertainties that may result in a total loss of investment or otherwise adversely affect our business, financial condition or results of operations.” |
Utilizing seismic interpretation, we intend to identify areas for potential hydrocarbon accumulations and add to this undrilled inventory through farm outs, acquisitions and participation in future BOEM lease sales. Also, as part of our exploration efforts, we regularly collaborate with experienced and respected large independent, major integrated and international state owned oil and gas energy companies on geologic and engineering studies covering currently owned leasehold and uncaptured domestic and international acreage. We believe these efforts will enable us to enhance and optimize our undrilled portfolio.
Our prospect generation approach is predicated upon a thorough, basin-wide understanding of the geologic trends within our focus areas through a detailed review of industry drilling results, followed by a rigorous analysis and reprocessing of our basin wide, focused 3-D seismic data. Consistent with our approach and to drive the internal generation and acquisition of new prospects, we have made significant investments in the latest
7
Table of Contents
Index to Financial Statements
seismic data and seismic imaging technology. Since 2006, we have spent in excess of $300 million on the acquisition, reprocessing and analysis of extensive geophysical data in the Deepwater GOM. We currently own or have licensed 3-D seismic data covering over 5,000 blocks in the Deepwater GOM. Our seismic data base includes the most recent advanced technologies, including wide-azimuth 3-D data. Wide-azimuth 3-D seismic data generates substantially more accurate images than traditional 3-D seismic data, helping to reduce exploration risk. Wide-azimuth 3-D seismic data is critical to understanding of a particular reservoir’s characteristics, including trapping mechanics and fluid migration patterns. Additionally, we utilize 4-D seismic data, which is a series of 3-D seismic surveys repeated over a period of time. Our technical team also regularly makes use of advanced seismic imaging technology including pre-stack depth migration, which is a technique that uses advanced processing algorithms to transform seismic data from a scale of time to a scale of depth.
Our Holstein Deep, Phobos, Highlander, Vito and Power Nap discoveries are evidence of a successful prospect generation approach coupled with advanced seismic data that resulted in discoveries of significant hydrocarbon reservoirs. We believe that these discoveries will add to our proved reserve base over time. We expect to add Holstein Deep and Highlander reserves starting this year. Going forward we expect that new prospects generated through our exploration efforts will typically target formations with gross hydrocarbon potential in excess of 100 MMBoe. We expect our exploration process and our collaboration with other companies that have comparable technology and technical expertise to continue to provide significant high-quality prospects. Capri and Eagle are two of our long term exploration prospects and are examples of interests acquired through BOEM lease sales, that are currently being matured. Future drilling decisions for these or other prospects will be driven by the results of our exploration process and capital budget considerations. In the current commodity price environment we intend to significantly reduce spending on our exploration inventory in the near term.
In addition to employing our exploration process and technical capabilities in the U.S., we have in the past explored for hydrocarbons internationally and may do so in the future. Currently, we have licenses to 1,662 square miles of 3-D seismic data covering deepwater areas, offshore Morocco. Further, we have been pre-qualified as a bidder in the upcoming Mexican lease sale and we are in the early stages of evaluating the hydrocarbon potential of Mexico.
Our California assets provide an established oil production base with low-decline production profiles, long-lived reserves and significant exposure to an improving oil market. Our onshore California properties are primarily located in the Los Angeles Basin and San Joaquin Valley. We hold a 100 percent working interest in the substantial majority of our onshore position. The Los Angeles Basin properties are characterized by light crude oil, have well depths ranging from 2,000 feet to over 10,000 feet and include both primary production and secondary recovery using waterflood methods, and produce with high water cuts. The San Joaquin Basin properties are characterized by heavier oil and shallow wells (generally less than 2,000 feet) that require enhanced oil recovery techniques, including steam injection. Our offshore California properties are primarily located in the Point Arguello and Point Pedernales fields, where we hold a 69.3 percent and 100 percent working interest, respectively. In 2015, we plan to focus our operating and capital expenditures in California on high-margin re-completion and well maintenance activities. For the six months ended June 30, 2015, our California assets produced 39.0 MBoe/d. In 2016 we plan to focus our drilling activities in the Cymric field, our largest property in California.
8
Table of Contents
Index to Financial Statements
We own a substantial portfolio of gas-weighted assets, including a large position in the Haynesville shale in Louisiana, a position in the Inboard Lower Tertiary/Cretaceous gas trend located onshore in South Louisiana, producing properties on the shelf of the Gulf of Mexico, which we refer to as the GOM Shelf, and a position in the Madden field located in Central Wyoming. As of December 31, 2014, in the Haynesville shale, we have a non-operated interest in over 1,400 producing wells with an average working interest of 8.5 percent and leases covering 75,000 net acres. We estimate the potential to drill an additional 12,000 gross (1,000 net) wells on our Haynesville shale acreage. In the Lower Tertiary/Cretaceous we have recently experienced success from a production test indicating a flow rate of 75 MMcf/d. The Highlander well, which has been restricted because of limited processing facilities, averaged a gross rate of 22 MMcf/d (approximately 11 MMcf/d net) during the quarter ended June 30, 2015. We are developing additional processing facilities to accommodate the higher flow rates with installation expected by year-end 2015. In July 2015, the Highlander well was shut in for remedial workover operations to address a mechanical issue encountered in the wellbore. A second well location has been identified and future plans are being considered. Our gas-weighted assets in Louisiana are geographically positioned to benefit from the expected growth in gas demand from existing and planned LNG terminals and petrochemical plants along the Gulf Coast. We also own interests in gas-weighted properties in the GOM Shelf in Louisiana. Further, our approximate non-operated 14 percent working interest in the Madden Deep Unit and Lost Cabin Gas Plant in Wyoming provides us with low-decline stable cash flows with long reserve life. Our large resource and acreage position provides us with the opportunity for significant reserve and production growth on a rapidly scalable basis upon a return of a more favorable gas price environment. For the six months ended June 30, 2015, our gas-weighted assets produced 233.8 MMcfe/d.
We estimate our fiscal 2015 capital budget will be $2.8 billion (of which $1.8 billion was spent for the six months ended June 30, 2015). This capital budget reflects our focus on growth of production and reserves, as well as executing on our inventory of discoveries and prospects in the Deepwater GOM. Our 2015 capital budget includes:
| 2015(1) | ||||
| (in billions) | ||||
| Development (Drilling, Completion, Infrastructure and Maintenance) |
$ | 2.5 | ||
| Deepwater GOM |
2.2 | |||
| California |
0.1 | |||
| Gas-weighted assets |
0.2 | |||
| Exploration |
0.1 | |||
| Other items |
0.2 | |||
| (1) | Budget figures were prepared assuming prices of $56.00 per Bbl of oil and $2.50 per MMcf of gas for the second half of 2015. The ultimate amount of capital we will expend may fluctuate materially based on market conditions and the success of our drilling results. |
9
Table of Contents
Index to Financial Statements
We estimate our fiscal 2016 capital budget will be $2.0 billion. This capital budget reflects our conservative strategy of moderate production growth in the current commodity price environment. The majority of capital budget in 2016 will be allocated to operated properties focused on development in the Deepwater GOM, giving us increased flexibility to respond to more favorable commodity pricing. We plan to engage third party investors and industry partners to further delineate our existing discoveries and test our prospects in the Atwater Valley focus area. We have elected to defer capital spending and associated production growth for more favorable market conditions. We also plan to defer exploratory spending to future periods. Our 2016 capital budget includes:
| 2016(1) | ||||
| (in billions) | ||||
| Development (Drilling, Completion, Infrastructure and Maintenance) |
$ | 1.8 | ||
| Deepwater GOM |
1.6 | |||
| California |
0.1 | |||
| Gas-weighted assets |
0.1 | |||
| Other items |
0.2 | |||
| (1) | Budget figures were prepared assuming prices of $61.00 per Bbl of oil and $3.00 per MMcf of gas. The ultimate amount of capital we will expend may fluctuate materially based on market conditions and the success of our drilling results. |
We have made, and expect to make in 2015, 2016 and beyond, substantial capital expenditures in our business and operations for the exploration, development, production and acquisition of reserves, as well as the development and maintenance of necessary infrastructure and other items. We may not have sufficient resources to undertake these activities. For more information, see “Risk Factors—Risks Related to Our Business—Our business plan requires substantial additional capital, which we may be unable to raise on acceptable terms in the future, which may in turn limit our ability to execute our business plan and could lead to a loss of properties and have a material adverse effect on our production, reserves and results of operations.”
We have a number of competitive strengths that we believe will help us to successfully execute our business strategies, including:
| • | We own a world-class asset portfolio and a large inventory of development projects and prospects in the Deepwater GOM. We have a large strategic position in the Deepwater GOM with significant current oil production, strong cash margins and existing infrastructure with excess production and handling capacity. Our Deepwater GOM portfolio includes 310 identified undeveloped locations in the Pliocene, Miocene and Lower Tertiary trends, which we believe offer impactful development and exploration potential. We have focused our capital on high cash margin oil-weighted properties where we receive favorable prices in relation to WTI. We have an extensive inventory of high-quality seismic imaging encompassing our prospects and covering over 5,000 blocks in the Deepwater GOM. |
In addition to current production, we believe that our Deepwater GOM properties have attractive production growth profiles in well-defined areas driven by our key discoveries and identified prospects. Our existing infrastructure enables us to develop resources using subsea tiebacks. This infrastructure position allows us to reduce the time from investment to first production and our capital costs have the potential to be lower when compared to other operators with similar prospects that lack infrastructure capacity. This is evidenced by our recent Dorado well that was brought on-line within five months of spud and our Holstein Deep and Horn Mountain developments, which we expect to begin production in
10
Table of Contents
Index to Financial Statements
2016. Our non-operated interests in the Lucius and Heidelberg are expected to provide additional production growth and our discoveries at Vito and Power Nap have a potential to add value upon their potential sanctioning. Our plan for developing our Deepwater GOM portfolio provides opportunities for near-term cash generation, reserve replacement and long-term production growth.
| • | Our California assets provide significant cash flow from stable production. We believe our long-lived reserve base in California should also provide us with relatively stable production and recurring cash flow with significant exposure to improvements in oil prices. Our inventory consists of more than 4,500 future well operations. Given the maturity of our assets, we believe our drilling and development operations in California are predictable and low risk. Our California production is sold locally under long-term contracts with prices based upon regional benchmarks. In response to current oil market conditions, we plan to focus our 2015 operating and capital expenditures in California on high-margin recompletion and well maintenance activities and conduct a moderate level of drilling in 2016 focused on our Cymric field. |
| • | We own an attractively positioned gas portfolio in Louisiana and Wyoming. We own extensive positions in the Haynesville shale formation in Louisiana, a position in the Inboard Lower Tertiary/Cretaceous gas trend located onshore in South Louisiana and a position in the Madden field located in Central Wyoming. Our gas properties in the Haynesville shale formation and in the Inboard Lower Tertiary/Cretaceous trend are geographically located to benefit from expected gas demand growth at existing and planned LNG terminals and petrochemical plants in the Gulf Coast region. Our position in the Madden field provides us with stable production and cash flows with long reserve life. Our large resource and acreage position provides us with the opportunity for significant reserve and production growth on a rapidly scalable basis upon a return of a more favorable gas price environment. |
| • | Experienced management and technical team with proven offshore and onshore expertise. Our senior management team has extensive expertise in the oil and gas industry, with an average of 33 years of experience, many of which have been spent working together in the Deepwater GOM. We believe this experience, along with widespread industry relationships, allows our senior management team to identify attractive acquisition opportunities and evaluate resource potential. We have also assembled a technical team that includes 135 engineers, 62 geologists/geophysicists and 236 petrotechnical professionals with an average of 26 years of experience. We believe our experienced and cohesive management and technical team will be of strategic importance as we continue to expand our future exploration and development plans. |
| • | Strong financial position. After giving effect to our corporate reorganization and this offering and the use of proceeds therefrom, we will have zero debt, $ million in cash on hand and $ million of available borrowing capacity through bank credit facilities and/or an intercompany loan agreement with our parent FCX. In the future, we will seek to maintain financial flexibility to enable us to most effectively develop our portfolio in the Deepwater GOM, California and other areas. |
Our strategy consists of the following principal elements:
| • | Grow proved reserves and production through measured development of our asset portfolio. We intend to develop our asset portfolio of identified drilling locations at a prudent pace given the current commodity price environment and plan to seek partnerships with third parties to delineate our discoveries and prospects. Capital expenditures for 2015 are currently estimated to total $2.8 billion, with 79 percent of our 2015 capital budget expected to be directed to our focus areas in the Deepwater GOM. We intend to pursue drilling opportunities that offer competitive risk-adjusted rates of return. We believe our near-term investments are low risk based on production history and industry activity in |
11
Table of Contents
Index to Financial Statements
| the area and repeatable as a result of well-defined geological properties over a large area. Through the conversion of our resource base to developed reserves, we will seek to increase our proved reserves, production and cash flow while generating favorable returns on invested capital. |
| • | Focus on our high-margin, oil-weighted Deepwater GOM projects. We focus our capital on high cash margin oil-weighted properties in the Deepwater GOM where we receive favorable prices in relation to WTI. Because we have extensive existing infrastructure and facilities with excess production and handling capacity in the Deepwater GOM, our capital allocation strategy is principally focused on drilling and development opportunities that can be tied back to existing facilities. We expect to continue to maintain and grow our reserve and production base through the development of our existing inventory of projects in the Deepwater GOM. |
| • | Utilize our proven technical experience to optimize results and increase returns in the Deepwater GOM. Our senior management and technical team intend to continue to seek ways to maximize hydrocarbon recovery by enhancing our evaluation, drilling, completion and production techniques. We utilize a variety of techniques to increase returns in the Deepwater GOM, including reservoir modeling, pressure maintenance, flow optimization, subsea pumping, and evaluation of seismic data. Continued reprocessing, new acquisitions and improvement in seismic imaging have allowed us to identify additional hydrocarbon potential in previously producing fields as well as in our exploration drilling. Advancements in subsea pumping as well as existing deepwater wellbore lift mechanisms have the potential to allow us to increase the recovery factors from our properties. We regularly evaluate our operating results in order to optimize our performance and make informed decisions about our capital program. |
| • | Maintain a high degree of operational control in order to improve operating and cost efficiencies and leverage relationships with key partners. We seek operational control of our properties in order to enhance returns through operational and cost efficiencies and increase ultimate hydrocarbon recovery by continuous improvement of our drilling techniques, completion methodologies and reservoir evaluation processes. Operational control allows us to more efficiently manage the pace of development activities and the gathering and marketing of our production. Of our estimated 2015 capital budget, 77 percent is related to projects we operate, allowing us to effectively manage the timing and levels of our development spending, overall well costs and operating costs. For properties we operate, in addition to having the ability to control the timing and method of development, we have the ability to partner with third party investors similar to our financing related to our Lucius development. For wells that we do not operate, we seek to join with other experienced and respected companies in the Deepwater GOM, including Anadarko and Shell, with comparable technology and technical expertise. In addition, we benefit from shared information and technology with our working interest partners and believe this enhances our operational results. |
| • | Maintain a rigorous, ongoing prospect maturation and enhancement process through our technical capabilities. We believe that having seismic data in the Deepwater GOM complemented by an experienced technical team that is capable of reprocessing the data to maximize its benefit is a core requirement for generating and maturing high-quality exploratory prospects. We actively leverage our extensive inventory of seismic data to identify prospects by correlating regional imaging analysis to industry drilling results. We continually enhance our prospect inventory through our technical team’s interpretation and reprocessing of our existing seismic data, our ongoing acquisition of incremental data to augment our data base and our team’s detailed regional sand isopach mapping and analysis and since 2006 have spent in excess of $300 million on acquiring and reprocessing seismic data. We believe these initiatives will allow us to replenish our exploration inventory through maturation of prospects on currently owned leasehold, farmouts or acquisitions from other oil and gas energy companies and participation in future lease sales. In the near term we plan to limit the amount of spending on lease acquisitions and exploration activities. |
12
Table of Contents
Index to Financial Statements
| • | Continue enhancing California operations to realize increased cash flow and grow our reserve base. Our management team is focused on continuous improvement of our California operations, both onshore and offshore, and has significant experience in identifying cost efficiencies while maintaining a stable production profile. Our California development plans are focused principally on maintaining stable production levels through continued drilling of conventional, waterflood and steamflood opportunities in the onshore fields. We believe the nature of our asset portfolio in California will continue to provide us with stable production and recurring cash flows in the foreseeable future. |
| • | Execute strategic acquisitions where our operating experience can be applied. We believe that attractive acquisition opportunities will become available and that our management team’s familiarity with our key operating areas and its contacts with the operators in those regions will enable us to identify high-return acquisition opportunities at attractive prices. We focus our acquisition activity where we believe our operational expertise provides the opportunity for meaningful incremental value creation and where our operational methods are most effective. Historically, this approach has allowed us to enter new areas and capture additional opportunities as evidenced by our acquisitions from BP and Shell of the Holstein, Horn Mountain and Marlin assets in 2012, as well as our recent acquisitions from Apache of an initial interest in Heidelberg and an additional interest in Lucius, our recent acquisition from Anadarko of interests in Vito and surrounding acreage, and our regular participation in the BOEM’s Deepwater GOM lease sales. We may selectively make acquisitions on attractive terms that complement our growth and help us achieve economies of scale. |
| • | Maintain financial flexibility to fund growth. We intend to maintain flexibility to fund our long-term growth plan. We expect our cash flows from operating activities, the net proceeds of this offering and our borrowing availability will be sufficient to fund our capital expenditures and other obligations necessary to execute our business plan in the near term. Substantially all of our lease terms allow us to allocate capital among projects in a manner that optimizes both costs and returns. In addition, our lease terms allow us to adjust our capital spending depending on commodity prices and market conditions. We currently have 84 MBbls/d hedged in 2015 with $90 by $70 put spreads. In the future, we plan to opportunistically hedge a portion of our expected production in order to stabilize our cash flows and maintain liquidity. |
Investing in our Class A common stock involves risks that include the speculative nature of oil and gas exploration, competition, volatile commodity prices and other material factors. For a discussion of these risks and other considerations that could negatively affect us, including risks related to this offering and our common stock, see “Risk Factors” and “Cautionary Note Regarding Forward-Looking Statements.”
Our principal stockholder is FCX, a leading international natural resources company with headquarters in Phoenix, Arizona. FCX operates large, long-lived, geographically diverse assets with significant reserves of copper, gold, molybdenum, cobalt, crude oil and gas.
FCX currently owns 100 percent of our Class A and Class B common stock. Upon completion of this offering, FCX will hold shares of Class B common stock, representing percent of our total outstanding shares of common stock, 100 percent of our total outstanding shares of Class B common stock, and percent of the combined voting power of our outstanding common stock upon completion of this offering (or percent, 100 percent and percent, respectively, if the underwriters’ option to purchase additional shares of Class A common stock from us is exercised in full). We also expect to enter into several agreements with FCX at the
13
Table of Contents
Index to Financial Statements
closing of this offering, including a tax matters agreement, an intercompany loan agreement, a shared services agreement, a transaction agreement and a stockholders agreement. For a description of these agreements, see “Certain Relationships and Related Party Transactions.” For more information regarding risks related to our relationship with FCX, see “Risk Factors,” including “Risk Factors—Risks Relating to this Offering and Our Class A Common Stock.”
Our principal executive offices are located at 700 Milam, Suite 3100, Houston, Texas 77002, and our telephone number is (713) 579-6000. Our website is www. .com. We expect to make our periodic reports and other information filed with or furnished to the SEC available free of charge through our website as soon as reasonably practicable after those reports and other information are electronically filed with or furnished to the SEC. Information on our website or any other website is not incorporated by reference herein and does not constitute a part of this prospectus.
14
Table of Contents
Index to Financial Statements
| Issuer |
Freeport-McMoRan Oil & Gas Inc., a Delaware corporation. |
| Class A common stock offered by us |
shares (or shares if the underwriters exercise their option to purchase additional shares in full). |
| Option to purchase additional shares of Class A common stock |
The underwriters have a 30-day option to purchase up to additional shares of Class A common stock from us. |
| Class A common stock to be outstanding after the offering |
shares (or shares if the underwriters exercise their option to purchase additional shares in full). |
| Class B common stock to be outstanding after this offering |
shares. |
| Voting power of Class A common stock outstanding after giving effect to this offering |
percent ( percent if the underwriters exercise their option to purchase additional shares in full). |
| Voting power of Class B common stock outstanding after giving effect to this offering |
percent ( percent if the underwriters exercise their option to purchase additional shares in full). |
| Voting rights |
Following this offering, we will have two classes of authorized common stock: Class A common stock and Class B common stock. Each share of our Class A common stock entitles its holder to one vote on all matters to be voted on by stockholders generally. Each share of our Class B common stock entitles its holder to five votes on all matters to be voted on by stockholders generally. |
| Holders of our Class A and Class B common stock vote together as a single class on all matters presented to our stockholders for their vote or approval, except as otherwise required by applicable law. Please see “Description of Capital Stock.” |
| Use of proceeds |
We expect to receive $ million of net proceeds from the sale of the Class A common stock offered by us, after deducting underwriting discounts and commissions and estimated offering expenses. We intend to use the net proceeds from this offering and any proceeds received pursuant to any exercise by the underwriters of their option to purchase additional shares of our Class A common stock to fund the remainder of our 2015 capital budget and portions of our 2016 capital budget and for general corporate purposes. |
15
Table of Contents
Index to Financial Statements
| Dividend policy |
We do not anticipate paying any cash dividends on our Class A or Class B common stock. |
| Listing |
We intend to apply to list our Class A common stock on the New York Stock Exchange under the symbol “FMOG.” |
| Risk factors |
You should carefully read and consider the information beginning on page 25 of this prospectus set forth under the heading “Risk Factors” and all other information set forth in this prospectus before deciding to invest in our Class A common stock. |
The information above excludes shares of Class A common stock reserved for issuance under the Freeport-McMoRan Oil & Gas Inc. 2015 Incentive Award Plan. See “Management—2015 Incentive Plan.”
16
Table of Contents
Index to Financial Statements
SUMMARY CONSOLIDATED FINANCIAL, RESERVE AND OPERATING DATA
The following summary consolidated financial, reserve and operating data should be read in conjunction with, and are qualified by reference to, “Selected Historical Consolidated Financial Data,” “Management’s Discussion and Analysis of Financial Condition and Results of Operations,” “Corporate Reorganization” and the consolidated financial statements and related notes contained elsewhere in this prospectus.
On May 31, 2013, FCX acquired Plains Exploration & Production Company, which we refer to as the Predecessor or PXP, through a merger into Freeport-McMoRan Oil & Gas LLC, which we refer to as FM O&G LLC, a wholly owned subsidiary of FCX O&G, which we refer to as the Successor. On June 3, 2013, FCX acquired McMoRan Exploration Co., which we refer to as McMoRan, which became a wholly owned subsidiary of FCX O&G. The below selected unaudited pro forma consolidated information as of and for the six months ended June 30, 2015, and for the year ended December 31, 2014, relates to the Successor. The below summary consolidated financial data as of and for the six months ended June 30, 2015, for the six months ended June 30, 2014, as of and for the year ended December 31, 2014, as of December 31, 2013, and for the period from April 23, 2013, to December 31, 2013, relates to the Successor. The results included in the summary financial data for the period from April 23, 2013, to December 31, 2013, include PXP’s results beginning June 1, 2013, and McMoRan’s results beginning June 4, 2013. The Successor’s oil and gas operations commenced on June 1, 2013. The below summary consolidated financial data for the period from January 1, 2013, to May 31, 2013, and as of and for the years ended December 31, 2012, 2011 and 2010, relates to the Predecessor.
The unaudited pro forma information of FCX O&G gives effect to (i) the expected sale of shares of Class A common stock, the use of proceeds from the sale of the Class A common stock and the proposed corporate reorganization (which, among other things will result in the elimination of our revolving notes and other long-term debt, including our senior notes) and (ii) the Eagle Ford shale divestment. The unaudited pro forma condensed consolidated statement of operations for the six months ended June 30, 2015, gives effect to the expected sale of equity securities as if the sale had occurred on January 1, 2014; the unaudited pro forma condensed consolidated statement of operations for the year ended December 31, 2014, gives effect to the expected sale of equity securities and the Eagle Ford shale divestment as if the transactions had occurred on January 1, 2014; and the unaudited pro forma condensed consolidated balance sheet gives effect to the expected sale of Class A common stock securities as if it had occurred on June 30, 2015. This unaudited pro forma condensed consolidated financial data is provided for information purposes only and does not purport to represent what the actual results of operations or financial position would have been if these transactions had occurred on the dates assumed. The unaudited pro forma condensed consolidated financial data should be read together with the historical financial statements and the pro forma condensed consolidated financial statements included elsewhere in this prospectus.
The summary historical consolidated statements of operations data and statements of cash flow data for the six months ended June 30, 2015 and 2014, and the summary historical consolidated balance sheet data as of June 30, 2015, were derived from the unaudited consolidated financial statements of the Successor included elsewhere in this prospectus. These statements have been prepared on a basis consistent with the audited consolidated financial statements of the Successor. In the opinion of management, such unaudited financial data reflects all adjustments, consisting only of normal and recurring adjustments, necessary for a fair presentation of the results for such period. The results of operations for the interim periods are not necessarily indicative of the results to be expected for the full year or any future period.
We derived the summary historical consolidated statements of operations data and statements of cash flow data for the year ended December 31, 2014, and for the period from April 23, 2013, to December 31, 2013, and the summary historical consolidated balance sheet data as of December 31, 2014 and 2013, from the audited consolidated financial statements of the Successor included elsewhere in this prospectus.
17
Table of Contents
Index to Financial Statements
We derived the summary historical consolidated statements of operations data and statements of cash flow data for the period from January 1, 2013, to May 31, 2013, and for the year ended December 31, 2012, from the audited consolidated financial statements of the Predecessor included elsewhere in this prospectus.
Summary Consolidated Financial Data
| FM O&G Inc. Pro Forma |
FCX O&G (Successor) | PXP (Predecessor) | ||||||||||||||||||||||||||||||||
| As of and for the Six Months Ended June 30, 2015 |
For the Year Ended December 31, 2014 |
As of and for the Six Months Ended June 30, 2015 |
For the Six Months Ended June 30, 2014 |
As of and for the Year Ended December 31, 2014 |
April 23 to and as of December 31, 2013(1) |
January 1 to May 31, 2013 |
As of and for the Year Ended December 31, 2012 |
|||||||||||||||||||||||||||
| (unaudited) | (unaudited) | |||||||||||||||||||||||||||||||||
| (in thousands, except outstanding shares) |
(in thousands, except earnings per share) |
|||||||||||||||||||||||||||||||||
| Statement of operations data |
||||||||||||||||||||||||||||||||||
| Revenues(2) |
$ | 1,068,588 | $ | 2,496,998 | $ | 4,709,706 | $ | 2,615,966 | $ | 2,041,802 | $ | 2,565,307 | ||||||||||||||||||||||
| (Loss) income from operations(2)(3) |
(6,400,590 | ) | 508,351 | (4,479,725 | ) | 450,137 | 627,837 | 615,657 | ||||||||||||||||||||||||||
| Net (loss) income |
(4,432,758 | ) | 178,685 | (3,569,611 | ) | 199,475 | 274,523 | 342,787 | ||||||||||||||||||||||||||
| Net (loss) income attributable to common stockholders(4) |
(4,453,060 | ) | 158,925 | (3,609,437 | ) | 177,691 | 256,152 | 306,420 | ||||||||||||||||||||||||||
| (Loss) earnings per common share |
||||||||||||||||||||||||||||||||||
| Basic |
(40,482 | ) | 1,589 | (34,375 | ) | 1,776 | 1.96 | 2.36 | ||||||||||||||||||||||||||
| Diluted |
(40,482 | ) | 1,589 | (34,375 | ) | 1,776 | 1.93 | 2.32 | ||||||||||||||||||||||||||
| Weighted-average common shares outstanding |
||||||||||||||||||||||||||||||||||
| Basic |
110 | 100 | 105 | 100 | 130,522 | 129,925 | ||||||||||||||||||||||||||||
| Diluted |
110 | 100 | 105 | 100 | 132,818 | 131,867 | ||||||||||||||||||||||||||||
| Statement of cash flow data |
||||||||||||||||||||||||||||||||||
| Net cash provided by operating activities |
$ | 535,076 | $ | 1,579,160 | $ | 2,452,676 | $ | 1,815,502 | $ | 1,296,430 | $ | 1,330,791 | ||||||||||||||||||||||
| Net cash (used in) provided by investing activities(5) |
(1,833,911 | ) | 246,452 | (1,667,577 | ) | (1,381,491 | ) | (889,128 | ) | (7,703,255 | ) | |||||||||||||||||||||||
| Net cash provided by (used in) financing activities |
1,303,294 | (1,825,067 | ) | (783,854 | ) | (433,140 | ) | (272,805 | ) | 6,133,931 | ||||||||||||||||||||||||
| Balance sheet data |
||||||||||||||||||||||||||||||||||
| Cash and cash equivalents |
$ | 6,575 | $ | 2,116 | $ | 871 | $ | 180,565 | ||||||||||||||||||||||||||
| Total assets |
15,453,132 | 20,854,002 | 26,397,709 | 17,298,283 | ||||||||||||||||||||||||||||||
| Long-term debt |
— | — | 8,470,050 | 7,156,610 | 10,113,320 | 9,979,369 | ||||||||||||||||||||||||||||
| Total equity |
3,290,346 | 7,733,764 | 9,301,699 | 3,956,441 | ||||||||||||||||||||||||||||||
| Other financial data |
||||||||||||||||||||||||||||||||||
| Adjusted EBITDA(6) |
$ | 609,895 | $ | 1,756,365 | $ | 2,723,459 | $ | 2,151,636 | $ | 1,538,450 | $ | 1,823,613 | ||||||||||||||||||||||
| Development costs(7) |
672,615 | 642,220 | 1,270,123 | 854,209 | 498,641 | 829,090 | ||||||||||||||||||||||||||||
18
Table of Contents
Index to Financial Statements
| (1) | Oil and gas operations began June 1, 2013. |
| (2) | The Successor consolidated financial statements present mark-to-market gains (losses) on derivative contracts of $58.0 million and ($120.3) million for the six months ended June 30, 2015 and 2014, respectively, $504.4 million for the year ended December 31, 2014, and ($334.2) million for the period from April 23, 2013, to December 31, 2013, in revenues. The Predecessor consolidated financial statements present net mark-to-market (losses) gains on derivative contracts of ($24.7) million for the period from January 1, 2013, to May 31, 2013, and ($2.9) million, for the year ended December 31, 2012, respectively, as a component of other expense (income). |
| (3) | Includes impairment charges of $5.8 billion and $3.7 billion for the six months ended June 30, 2015, and the year ended December 31, 2014, respectively, relating to ceiling test impairment charges for our oil and gas properties pursuant to full cost accounting rules. Also, includes an additional impairment charge of $1.7 billion for the year ended December 31, 2014, to fully impair goodwill. |
| (4) | Includes net income attributable to noncontrolling interest in the form of preferred stock of subsidiary. |
| (5) | Includes net proceeds provided by the divestment of our Eagle Ford shale assets of $3.0 billion and $2.9 billion for the six months ended June 30, 2014, and twelve months ended December 31, 2014, respectively. Includes net cash used for the acquisition of certain Deepwater GOM interests of $0.9 billion and $1.4 billion for the six months ended June 30, 2014, and twelve months ended December 31, 2014, respectively. Includes net cash used for the acquisition of interests in the Deepwater GOM of $5.9 billion for the year ended December 31, 2012. |
| (6) | Adjusted earnings before interest, taxes, depreciation and amortization, which we refer to as Adjusted EBITDA, is a non-GAAP financial measure. For a definition of Adjusted EBITDA and a reconciliation to net (loss) income attributable to common stockholders, see “—Non-GAAP Financial Measures.” |
| (7) | Development costs are incurred to obtain access to proved reserves and to provide facilities for extracting, treating, gathering and storing the oil and gas. |
The following tables present summary data with respect to our estimated proved, probable and possible reserves as of the dates indicated. The reserve estimates presented in the table below are based on reserve reports prepared by NSAI and Ryder Scott in accordance with the rules and regulations of the SEC regarding oil and gas reserve reporting. For more information about our proved, probable and possible reserves, see NSAI’s and Ryder Scott’s reserve reports, which are filed as exhibits to the registration statement of which this prospectus forms a part. We determined our possible reserves to be either developed or undeveloped using methodology similar to that used by NSAI and Ryder Scott in the preparation of their reserve reports.
| December 31, | ||||||||||||
| 2014 | 2013(1) | 2012(2) | ||||||||||
| Proved Reserves Data: |
||||||||||||
| Estimated proved reserves(3): |
||||||||||||
| Oil (MMBbls) |
278 | 350 | 345 | |||||||||
| Gas (Bcf) |
610 | 562 | 468 | |||||||||
| NGLs (MMBbls) |
10 | 20 | 17 | |||||||||
| Total estimated proved reserves (MMBoe) |
390 | 464 | 440 | |||||||||
| Proved developed reserves (MMBoe) |
246 | 307 | 278 | |||||||||
| % proved developed |
63 | % | 66 | % | 63 | % | ||||||
| Proved undeveloped reserves (MMBoe) |
144 | 157 | 163 | |||||||||
| PV-10 of proved reserves (in billions)(4) |
$ | 8.1 | $ | 12.6 | $ | 13.7 | ||||||
| Standardized Measure (in billions)(5) |
$ | 6.5 | $ | 9.5 | $ | 10.0 | ||||||
| (1) | Includes 59.0 MMBoe of proved reserves associated with our Eagle Ford shale properties that were sold in June 2014. |
| (2) | Includes 49.0 MMBoe of proved reserves associated with our Eagle Ford shale properties that were sold in June 2014. |
| (3) | Our estimated proved reserves and related future net revenues, PV-10 and Standardized Measure were determined using the unweighted arithmetic average first-day-of-the-month prices for the prior 12 months for oil and gas, without giving effect to commodity derivative contracts, and were held constant throughout the life of the properties. Prices were adjusted by lease for quality, transportation fees, historical geographic differentials, marketing bonuses or deductions and other factors affecting the price received at the wellhead. Oil and gas prices have declined beginning in the second half of 2014, which may adversely affect future estimates of our proved reserves. See “Risk Factors—Risks Related to Our Business—Oil prices have declined substantially from historic highs and may remain depressed for the foreseeable future. Any additional decreases in prices of oil may materially and adversely affect our cash generated from operations, results of operations, financial position, our ability to repay debt that we may incur and the trading prices of our common stock” and “Risk Factors—Risks Related to Our Business—Gas prices have declined substantially from historic highs and may remain depressed for the foreseeable future. Any additional decreases in prices of gas may adversely affect our cash generated from operations, results of |
19
Table of Contents
Index to Financial Statements
| operations, financial position, our ability to repay debt that we may incur and the trading prices of our common stock.” Excludes 19 Bcf of proved reserves as of December 31, 2014, related to the Highlander gas discovery well located in the Inboard Lower Tertiary/Cretaceous trend, which were identified in 2015. |
| (4) | PV-10 is a non-GAAP financial measure and generally differs significantly from Standardized Measure, the most directly comparable GAAP financial measure, because it does not include the effects of federal income taxes on future net revenues. Neither PV-10 nor Standardized Measure represents an estimate of the fair market value of our proved reserves. We and others in the industry use PV-10 as a measure to compare the relative size and value of proved reserves held by companies without regard to the specific tax characteristics of such entities. See “—Non-GAAP Financial Measures.” |
| (5) | Standardized Measure represents the present value of estimated future cash inflows from proved reserves, less future development, production and income tax expenses, discounted at 10 percent per annum to reflect timing of future cash flows. |
| December 31, 2014 |
||||
| Probable and Possible Reserves Data: |
||||
| Estimated probable reserves(1): |
||||
| Oil (MMBbls) |
192 | |||
| Gas (Bcf) |
278 | |||
| NGLs (MMBbls) |
7 | |||
| Total estimated probable reserves (MMBoe) |
245 | |||
| Probable developed reserves (MMBoe) |
41 | |||
| % probable developed |
17 | % | ||
| Probable undeveloped reserves (MMBoe) |
204 | |||
| PV-10 of probable reserves (in billions)(2) |
$ | 4.8 | ||
| Estimated possible reserves(1): |
||||
| Oil (MMBbls) |
230 | |||
| Gas (Bcf) |
592 | |||
| NGLs (MMBbls) |
9 | |||
| Total estimated possible reserves (MMBoe) |
338 | |||
| Possible developed reserves (MMBoe) |
57 | |||
| % possible developed |
17 | % | ||
| Possible undeveloped reserves (MMBoe) |
281 | |||
| PV-10 of possible reserves (in billions)(2) |
$ | 6.7 | ||
| (1) | Excludes 25 Bcf of probable reserves and 53 Bcf of possible reserves as of December 31, 2014, related to the Highlander gas discovery well located in the Inboard Lower Tertiary/Cretaceous trend for which external reserve estimates were completed in 2015. |
| (2) | PV-10 is a non-GAAP financial measure and generally differs significantly from Standardized Measure, the most directly comparable GAAP financial measure, because it does not include the effects of federal income taxes on future net revenues. Neither PV-10 nor Standardized Measure represents an estimate of the fair market value of our proved reserves. We and others in the industry use PV-10 as a measure to compare the relative size and value of proved reserves held by companies without regard to the specific tax characteristics of such entities. See “—Non-GAAP Financial Measures.” |
Adjusted EBITDA
Adjusted EBITDA is used as a supplemental financial measure by management and by external users of our consolidated financial statements, such as investors, commercial banks, research analysts and others, to assess: (i) the financial performance of our assets without regard to financing methods, capital structure or historical cost basis; (ii) our operating performance and return on capital as compared to those of other companies in the upstream energy sector, without regard to financing or capital structure; and (iii) the attractiveness of capital projects and acquisitions and the overall rates of return on alternative investment opportunities.
Our calculation of Adjusted EBITDA may not be comparable to other similar measures used by other companies and you should not consider Adjusted EBITDA in isolation or as a substitute for analysis of our results as reported under GAAP.
20
Table of Contents
Index to Financial Statements
The following table presents a reconciliation of the GAAP financial measure of consolidated net income (loss) attributable to common stockholders to Adjusted EBITDA for the periods indicated:
| FM O&G Inc. Pro Forma |
FCX O&G (Successor) | PXP (Predecessor) | ||||||||||||||||||||||||||||||||
| Six Months Ended June 30, 2015 |
Year Ended December 31, 2014 |
Six Months Ended June 30, |
Year Ended December 31, 2014 |
April 23 to December 31, 2013(1) |
January 1 to May 31, 2013 |
Year Ended December 31, 2012 |
||||||||||||||||||||||||||||
| 2015 | 2014 | |||||||||||||||||||||||||||||||||
| (in thousands) | ||||||||||||||||||||||||||||||||||
| Net (loss) income attributable to common stockholders(2) |
$ | (4,453,060 | ) | $ | 158,925 | $ | (3,609,437 | ) | $ | 177,691 | $ | 256,152 | $ | 306,420 | ||||||||||||||||||||
| Interest expense, net |
637 | 2,996 | 84,944 | 150,046 | 241,267 | 180,752 | 232,361 | 297,539 | ||||||||||||||||||||||||||
| Income tax (benefit) provision |
(2,052,036 | ) | 189,780 | (1,065,888 | ) | 87,447 | 108,516 | 171,310 | ||||||||||||||||||||||||||
| Depreciation, depletion and amortization |
1,014,589 | 1,231,831 | 2,291,074 | 1,363,618 | 873,445 | 1,101,108 | ||||||||||||||||||||||||||||
| Impairment of oil and gas properties |
5,787,415 | — | 3,737,281 | — | — | — | ||||||||||||||||||||||||||||
| Goodwill impairment |
— | — | 1,716,571 | — | — | — | ||||||||||||||||||||||||||||
| Net noncash mark-to-market losses (gains) on derivative contracts |
143,535 | (7,511 | ) | (626,696 | ) | 312,293 | 8,798 | 50,632 | ||||||||||||||||||||||||||
| Other items(3) |
39,436 | — | 37,562 | — | — | — | ||||||||||||||||||||||||||||
| Accretion expense |
25,510 | 23,694 | 47,392 | 25,588 | 16,723 | 16,944 | ||||||||||||||||||||||||||||
| (Gain) loss on early extinguishment of debt |
— | (6,015 | ) | (78,014 | ) | (9,877 | ) | 18,052 | 8,388 | |||||||||||||||||||||||||
| (Gain) on investment measured at fair value |
— | — | — | — | (29,907 | ) | (206,552 | ) | ||||||||||||||||||||||||||
| Acquisition and merger related costs |
— | — | — | — | 36,335 | 42,151 | ||||||||||||||||||||||||||||
| Other income, net |
(740 | ) | (4,145 | ) | (7,479 | ) | (7,660 | ) | (396 | ) | (694 | ) | ||||||||||||||||||||||
| Preferred dividends attributable to redeemable noncontrolling interest |
20,302 | 19,760 | 39,826 | 21,784 | 18,371 | 36,367 | ||||||||||||||||||||||||||||
|
|
|
|
|
|
|
|
|
|
|
|
|
|||||||||||||||||||||||
| Adjusted EBITDA |
$ | 609,895 | $ | 1,756,365 | $ | 2,723,459 | $ | 2,151,636 | $ | 1,538,450 | $ | 1,823,613 | ||||||||||||||||||||||
|
|
|
|
|
|
|
|
|
|
|
|
|
|||||||||||||||||||||||
| (1) | Oil and gas operations began June 1, 2013. |
| (2) | Includes net income attributable to noncontrolling interest in the form of preferred stock of subsidiary. |
| (3) | Other items include idle/terminated rig costs and inventory adjustments of $39.4 million for the six months ended June 30, 2015 and $37.6 million for the year ended December 31, 2014. |
21
Table of Contents
Index to Financial Statements
PV-10
PV-10 is a non-GAAP financial measure and is derived from Standardized Measure, which is the most directly comparable GAAP financial measure. PV-10 is equal to the Standardized Measure of discounted future net cash flows at the applicable date, before deducting future income taxes, discounted at 10 percent. We believe that the presentation of PV-10 is relevant and useful to investors because it presents the relative monetary significance of our properties regardless of tax structure. Further, investors may utilize the measure as a basis for comparison of the relative size and value of our proved reserves to other companies. We use this measure when assessing the potential return on investment related to our oil, gas and NGL properties. However, PV-10 is not equal to, nor a substitute for, the Standardized Measure of discounted future net cash flows. Our PV-10 and the Standardized Measure of discounted future net cash flows do not purport to present the fair value of our proved reserves. The following table provides a reconciliation of PV-10 to the GAAP financial measure of Standardized Measure for the periods indicated:
| FCX O&G (Successor) |
PXP (Predecessor) | |||||||||||||
| As of December 31, | As of December 31, 2012 |
|||||||||||||
| (in millions) | 2014 | 2013 | ||||||||||||
| PV-10 of proved reserves |
$ | 8,142 | $ | 12,643 | $ | 13,738 | ||||||||
| Present value of future income tax discounted at 10 percent |
(1,650 | ) | (3,188 | ) | (3,714 | ) | ||||||||
|
|
|
|
|
|
|
|||||||||
| Standardized Measure |
$ | 6,492 | $ | 9,455 | $ | 10,024 | ||||||||
|
|
|
|
|
|
|
|||||||||
22
Table of Contents
Index to Financial Statements
Realized Revenue and Cash Production Costs per Boe
Realized revenues and cash production costs per Boe are measures intended to provide information about the cash operating margin of our oil and gas operations and for monitoring our operation performance against other oil and gas companies. We show revenue adjustments from derivative contracts as separate line items because these adjustments do not result from oil and gas sales, these gains and losses have been reflected separately from revenues on current period sales. Additionally, accretion charges for asset retirement obligations and other costs are removed from production costs in the calculation of cash production costs per Boe. This information differs from measures of performance determined in accordance with GAAP and should not be considered in isolation or as a substitute for measures of performance determined in accordance with GAAP. The following schedules include calculations of oil and gas realized revenues and cash production costs per Boe together with reconciliations to revenue and production costs.
| FCX O&G (Successor) | PXP (Predecessor) | |||||||||||||||||||||||||
| Six Months Ended June 30, |
Year Ended December 31, 2014 |
April 23 to December 31, 2013 |
January 1 to May 31, 2013 |
Year Ended December 31, 2012 |
||||||||||||||||||||||
| 2015 | 2014 | |||||||||||||||||||||||||
| (in thousands) | ||||||||||||||||||||||||||
| Oil and gas revenues before derivatives |
$ | 1,001,765 | $ | 2,616,048 | $ | 4,202,184 | $ | 2,948,676 | $ | 2,039,656 | $ | 2,558,363 | ||||||||||||||
| Derivatives |
58,047 | (120,276 | ) | 504,357 | (334,202 | ) | (24,688 | ) | (2,879 | ) | ||||||||||||||||
| Add noncash mark-to-market losses (gains) on derivatives contracts |
143,535 | (7,511 | ) | (626,696 | ) | 312,293 | 8,798 | 50,632 | ||||||||||||||||||
|
|
|
|
|
|
|
|
|
|
|
|
|
|||||||||||||||
| Realized revenues |
$ | 1,203,347 | $ | 2,488,261 | $ | 4,079,845 | $ | 2,926,767 | $ | 2,023,766 | $ | 2,606,116 | ||||||||||||||
|
|
|
|
|
|
|
|
|
|
|
|
|
|||||||||||||||
| Production costs |
$ | 564,648 | $ | 640,117 | $ | 1,236,733 | $ | 682,369 | $ | 431,160 | $ | 649,369 | ||||||||||||||
| Less accretion |
25,510 | 23,694 | 47,392 | 25,588 | 16,723 | 16,944 | ||||||||||||||||||||
| Less other operating expense |
35,722 | 4,101 | 49,110 | 4,405 | 8,438 | (27 | ) | |||||||||||||||||||
|
|
|
|
|
|
|
|
|
|
|
|
|
|||||||||||||||
| Cash production costs |
$ | 503,416 | $ | 612,322 | $ | 1,140,231 | $ | 652,376 | $ | 405,999 | $ | 632,452 | ||||||||||||||
|
|
|
|
|
|
|
|
|
|
|
|
|
|||||||||||||||
| Per Boe: |
||||||||||||||||||||||||||
| Oil and gas revenues before derivatives |
$ | 39.08 | $ | 81.34 | $ | 73.98 | $ | 77.45 | $ | 80.77 | $ | 65.79 | ||||||||||||||
| Derivatives |
2.27 | (3.74 | ) | 8.88 | (8.78 | ) | (0.98 | ) | (0.07 | ) | ||||||||||||||||
| Add noncash mark-to-market losses (gains) on derivatives contracts |
5.60 | (0.23 | ) | (11.03 | ) | 8.20 | 0.35 | 1.30 | ||||||||||||||||||
|
|
|
|
|
|
|
|
|
|
|
|
|
|||||||||||||||
| Realized revenues |
$ | 46.95 | $ | 77.37 | $ | 71.83 | $ | 76.87 | $ | 80.14 | $ | 67.02 | ||||||||||||||
|
|
|
|
|
|
|
|
|
|
|
|
|
|||||||||||||||
| Production costs |
$ | 22.01 | $ | 19.90 | $ | 21.77 | $ | 17.93 | $ | 17.07 | $ | 16.71 | ||||||||||||||
| Less accretion |
1.00 | 0.74 | 0.83 | 0.67 | 0.67 | 0.44 | ||||||||||||||||||||
| Less other operating expense |
1.39 | 0.13 | 0.86 | 0.12 | 0.33 | — | ||||||||||||||||||||
|
|
|
|
|
|
|
|
|
|
|
|
|
|||||||||||||||
| Cash production costs |
$ | 19.62 | $ | 19.03 | $ | 20.08 | $ | 17.14 | $ | 16.07 | $ | 16.27 | ||||||||||||||
|
|
|
|
|
|
|
|
|
|
|
|
|
|||||||||||||||
23
Table of Contents
Index to Financial Statements
The following table sets forth summary data with respect to our production results, average realized prices and certain expenses on a per Boe basis for the periods indicated:
| FCX O&G (Successor) | PXP (Predecessor) | |||||||||||||||||||||||||
| Six Months Ended June 30, |
Year Ended December 31, 2014 |
April 23 to December 31, 2013(1) |
January 1 to May 31, 2013 |
Year Ended December 31, 2012 |
||||||||||||||||||||||
| 2015 | 2014 | |||||||||||||||||||||||||
| Total sales volumes |
||||||||||||||||||||||||||
| Oil (MBbls) |
16,971 | 23,453 | 40,116 | 26,630 | 17,700 | 22,685 | ||||||||||||||||||||
| Gas (MMcf) |
45,301 | 39,782 | 80,842 | 54,175 | 36,148 | 87,110 | ||||||||||||||||||||
| NGLs (MBbls) |
1,110 | 2,076 | 3,211 | 2,417 | 1,528 | 1,680 | ||||||||||||||||||||
| Combined (MBoe) |
25,632 | 32,160 | 56,801 | 38,077 | 25,253 | 38,883 | ||||||||||||||||||||
| Average daily sales volumes |
||||||||||||||||||||||||||
| Oil (MBbls/d) |
94 | 130 | 110 | 124 | 117 | 62 | ||||||||||||||||||||
| Gas (MMcf/d) |
250 | 220 | 221 | 254 | 239 | 238 | ||||||||||||||||||||
| NGLs (MBbls/d) |
6 | 11 | 9 | 11 | 10 | 5 | ||||||||||||||||||||
| Combined (MBoe/d) |
142 | 178 | 156 | 178 | 167 | 106 | ||||||||||||||||||||
| Average realized prices |
||||||||||||||||||||||||||
| Oil ($/Bbl) (before cash settled derivatives) |
$ | 50.25 | $ | 99.54 | $ | 92.76 | $ | 99.67 | $ | 104.89 | $ | 99.62 | ||||||||||||||
| Oil ($/Bbl) (after impact of cash settled derivatives) |
62.13 | 94.63 | 90.00 | 98.32 | 103.39 | 99.48 | ||||||||||||||||||||
| Gas ($/Mcf) (after impact of cash settled derivatives) |
2.75 | 4.55 | 4.23 | 3.99 | 3.82 | 3.25 | ||||||||||||||||||||
| NGLs ($/Bbl) |
21.71 | 42.35 | 39.73 | 38.20 | 36.50 | 39.35 | ||||||||||||||||||||
| Expenses (per Boe) |
||||||||||||||||||||||||||
| Cash production costs(2) |
19.62 | 19.03 | 20.08 | 17.14 | 16.07 | 16.27 | ||||||||||||||||||||
| Depletion, depreciation and amortization |
39.58 | 38.30 | 40.34 | 35.81 | 34.59 | 28.32 | ||||||||||||||||||||
| Impairment of oil and gas properties |
225.79 | — | 65.80 | — | — | — | ||||||||||||||||||||
| General and administrative |
4.00 | 3.63 | 3.67 | 3.14 | 4.33 | 5.11 | ||||||||||||||||||||
| (1) | Oil and gas operations began June 1, 2013. |
| (2) | Cash production costs is a non-GAAP financial measure. See “—Non-GAAP Financial Measures—Realized Revenue and Cash Production Costs per Boe.” |
24
Table of Contents
Index to Financial Statements
An investment in our Class A common stock involves a high degree of risk. You should carefully consider the following risks and all of the other information contained in this prospectus before deciding to invest in our Class A common stock. Our business, financial condition and results of operations could be materially and adversely affected by any of these risks. The risks described below are not the only ones facing us. Additional risks not presently known to us or which we consider immaterial also may adversely affect us.
Drilling for and producing oil and gas are high-risk activities with many uncertainties that may result in a total loss of investment or otherwise adversely affect our business, financial condition or results of operations.
Our drilling activities are subject to many risks. For example, wells drilled by us or other operators for our non-operated properties may not be productive and we may not recover all or any portion of our investment in such wells. Drilling for oil, gas or NGLs often involves unprofitable efforts, not only from dry holes but also from wells that are productive but do not produce sufficient oil or gas to return a profit after deducting drilling, operating and other costs. The seismic data and other technologies we use do not allow us to know conclusively prior to drilling a well that oil or gas is present or that it can be produced economically. The costs of drilling activities are subject to numerous uncertainties beyond our control, and increases in those costs can adversely affect the economics of a project. In addition, the application of new drilling techniques may make it more difficult to accurately estimate these costs. Further, our drilling and producing operations may be curtailed, delayed, canceled or otherwise negatively impacted as a result of other factors, including:
| • | geologic risks and formation uncertainties; |
| • | facility or equipment malfunctions; |
| • | unexpected operational events, such as blowouts; |
| • | shortages or delivery delays or increases in the cost of equipment and services; |
| • | reductions in oil and gas prices; |
| • | lack of proximity to and shortage of capacity of transportation facilities; |
| • | the limited availability of financing at acceptable rates; |
| • | loss of title or other title related issues; |
| • | potential for delays caused by litigation; |
| • | delays imposed by or resulting from compliance with environmental and other governmental or regulatory requirements; and |
| • | adverse weather conditions. |
Any of these risks can cause substantial losses, including personal injury or loss of life, damage to or destruction of property, natural resources and equipment, pollution, environmental contamination or loss of wells and regulatory penalties.
Our success depends on finding, developing or acquiring additional reserves. Unless we replace our oil and gas reserves, our reserves and production will decline, which would adversely affect our business, financial condition and results of operations.
Our future oil and gas reserves and production, and therefore our cash flows and income, are highly dependent on our ability to find, develop or acquire additional reserves that are economically recoverable. Our proved reserves will generally decline as reserves are depleted, except to the extent that we conduct successful
25
Table of Contents
Index to Financial Statements
exploration or development activities or acquire properties containing proved reserves, or both. To increase reserves and production, we undertake development, exploration and other replacement activities or use third parties to accomplish these activities. We have made, and expect to make in the future, substantial capital expenditures in our business and operations for the development, production, exploration and acquisition of reserves. We may not have sufficient resources to undertake our exploration, development and production activities. In addition, the acquisition of reserves, our exploratory projects and other replacement activities may not result in significant additional reserves, and we may not have success drilling productive wells at economic finding and development costs. Furthermore, although our revenues may increase if prevailing commodity prices increase, our finding costs for additional reserves could also increase.
Our estimated reserves are based on many assumptions that may turn out to be inaccurate. Significant inaccuracies in these underlying assumptions will materially affect the quantities and present value of our proved reserves.
Oil and gas reserve engineering is not an exact science and requires subjective estimates of underground accumulations of reserves and assumptions concerning future commodity prices, production levels and operating and development costs. As a result, estimated quantities of proved, probable and possible reserves, projections of future production rates and the timing of development expenditures may be incorrect. Our estimates of proved, probable and possible reserves and related valuations included in this prospectus are based on reserve reports prepared by NSAI and Ryder Scott, our external independent petroleum engineering firms. NSAI and Ryder Scott conducted a well-by-well review of all our properties for the periods covered by their proved, probable and possible reserve reports using information provided by us. Over time, we may make material changes to proved, probable and possible reserve estimates taking into account the results of actual drilling, testing and production. Also, certain assumptions regarding future commodity prices, production levels and operating and development costs may prove incorrect. Significant variance from these assumptions could greatly affect our estimates of proved, probable and possible reserves, the economically recoverable quantities of reserves attributable to any particular group of properties, the classification of reserves based on risk of recovery and estimates of the future net cash flows. A substantial portion of our reserve estimates are made without the benefit of a lengthy production history, and are therefore less reliable than estimates based on a lengthy production history. Numerous changes over time from the assumptions on which our reserve estimates are based, as described above, often result in the actual quantities of reserves we ultimately recover being different from our estimates.
The estimates of proved, probable and possible reserves included in this prospectus were prepared using an average price equal to the unweighted arithmetic average of hydrocarbon prices received on a field-by-field basis on the first day of each month within the 12 months ended December 31, 2014, 2013 and 2012, as applicable, in accordance with SEC guidelines. The reserve estimates represent our net revenue interest in our properties.
The timing of both our production and our incurrence of costs in connection with the development and production of reserves will affect the timing of actual future net cash flows from proved, probable and possible reserves.
We face substantial uncertainties in estimating the characteristics of our prospects, so you should not place undue reliance on any of our estimates.
In this prospectus, we provide estimates of the characteristics of our prospects for the basins in which our prospects are located. These estimates may be incorrect, as the accuracy of these estimates is a function of available data, geological interpretation and judgment. Any analogies drawn by us from other wells, prospects or producing fields may not prove to be accurate indicators of the success of developing reserves from our prospects. Furthermore, we have no way of evaluating the accuracy of the data from analog wells or prospects produced by other parties which we may use.
Many of our newly drilled wells may not find underground accumulations of oil or gas. Significant variance between actual results and our assumptions could materially affect the quantities of reserves attributable to our
26
Table of Contents
Index to Financial Statements
properties. In this prospectus, identified undeveloped locations and identified prospective areas refer to our P10 estimates, which means these estimates have at least a 10 percent likelihood of occuring based on current information. These measurements are statistically calculated based on a range of possible outcomes of such estimates, with such ranges being particularly large in scope. Therefore, there may be large discrepancies between the P10 estimate provided in this prospectus and our actual results.
The volatility of oil, gas and NGLs prices due to factors beyond our control greatly affects our earnings, cash flows and asset values.
Our financial results vary with fluctuations in the market prices of oil, primarily, and to a lesser extent, gas and NGLs. A substantial or extended decline in the market prices of oil, gas and NGLs could have a material adverse effect on our financial results, the value of our assets and our ability to repay any debt that we may incur or to meet our other fixed obligations, and could depress the trading prices of our Class A common stock. Additionally, if the market prices for oil, gas and NGLs continue to decline, we may have to revise our operating plans, including curtailing production, halting or delaying expansion projects, reducing operating costs and capital expenditures and discontinuing certain exploration and development programs. We may be unable to decrease our costs in an amount sufficient to offset reductions in revenues, and we may incur losses.
Our revenues, operating results, profitability, future rate of growth and the carrying value of our oil and gas properties depend primarily upon the prevailing commodity prices. Historically, oil, gas and NGL prices have been volatile and are subject to fluctuations in response to changes in supply and demand, market uncertainty and a variety of additional factors that are beyond our control, including:
| • | the regional, domestic and foreign supply of oil, gas and NGLs; |
| • | the level of commodity prices and market expectations about future commodity prices; |
| • | the level of global oil and gas exploration and production; |
| • | localized supply and demand fundamentals, including the proximity and capacity of oil and gas pipelines and other transportation facilities, and other factors that result in differentials to benchmark prices from time to time; |
| • | the cost of exploring for, developing, producing and transporting reserves; |
| • | transportation and refinery capacity; |
| • | continued development of shale reserves in the U.S. through hydraulic fracturing and other techniques; |
| • | the amount and price of foreign imports into the U.S.; |
| • | potential changes in U.S. laws restricting oil exports; |
| • | the demand for LNG exports from the U.S.; |
| • | the demand from existing and planned LNG terminals and petrochemical plants in the Gulf coast region; |
| • | political and economic conditions in oil producing countries; |
| • | the ability of members of the Organization of Petroleum Exporting Countries to agree to and maintain oil price and production controls; |
| • | speculative trading in oil and gas derivative contracts; |
| • | the level of consumer product demand; |
| • | weather conditions and other natural disasters; |
| • | risks associated with operating drilling rigs; |
| • | technological advances affecting exploration and production operations and overall energy consumption; |
27
Table of Contents
Index to Financial Statements
| • | the amount of gas utilized for electricity generation; |
| • | domestic and foreign governmental regulations and taxes; |
| • | the continued threat of terrorism and the impact of military and other action, including U.S. military operations in the Middle East; |
| • | the price and availability of competitors’ supplies of oil and gas and alternative fuels; and |
| • | overall domestic and global economic conditions. |
Oil prices have declined substantially from historic highs and may remain depressed for the foreseeable future. Any additional decreases in prices of oil may materially and adversely affect our cash generated from operations, results of operations, financial position, our ability to repay any debt that we may incur and the trading prices of our Class A common stock.
Since the second half of 2014, oil prices have declined significantly. After averaging $109 per barrel in the first half of 2014, Brent crude oil prices averaged $90 per barrel for the second half of 2014, declined to $57.33 per barrel on December 31, 2014, and were $49.52 per barrel on August 3, 2015. During fourth-quarter of 2014, we evaluated goodwill associated with our oil and gas operations. This evaluation resulted in impairment charges of $1.7 billion, which reduced the value of goodwill attributable to such operations to zero as of December 31, 2014. Crude oil prices and our estimates of oil reserves at December 31, 2014 represent the most significant assumptions used in the evaluation of goodwill. As of June 30, 2015, net capitalized costs with respect to our proved U.S. oil and gas properties exceeded the ceiling amount specified by the SEC’s full cost accounting rules, which resulted in the recognition of an impairment charge totaling $2.7 billion in second-quarter 2015 and $3.1 billion in first-quarter 2015. We may incur additional ceiling test impairments of our oil and gas properties during the remainder of 2015 if prices do not increase. The possibility and amount of any future impairment is difficult to predict, and will depend, in part, upon future oil and natural gas prices to be utilized in the ceiling test, estimates of proved reserves and future capital expenditures and operating costs. See “Management’s Discussion and Analysis of Financial Condition and Results of Operations” for further discussion of these impairment charges. The International Energy Agency, which we refer to as the IEA, forecasts continued U.S. production growth and a slowdown in global demand growth in 2015. This environment could cause the prices for oil to remain at current levels or to fall to lower levels. If prices for oil continue to remain depressed for lengthy periods, we may be required to write down the value of our oil and gas properties, and some of our undeveloped locations may no longer be economically viable. In addition, sustained low prices for oil will negatively impact the value of our estimated proved reserves and reduce the amounts of cash we would otherwise have available to pay expenses and service any indebtedness that we may incur.
Gas prices have declined substantially from historic highs and may remain depressed for the foreseeable future. Any additional decreases in prices of gas may materially and adversely affect our cash generated from operations, results of operations, financial position, our ability to repay any debt that we may incur and the trading prices of our Class A common stock.
During the seven years prior to December 31, 2014, gas prices at Henry Hub have ranged from a high of $13.31 per MMBtu in 2008 to a low of $1.82 per MMBtu in 2012. On December 31, 2014, the Henry Hub spot market price of gas was $3.14 per MMBtu. On August 3, 2015, the Henry Hub spot market price was $2.76 per MMBtu. The reduction in prices has been caused by many factors, including increases in gas production and reserves from unconventional (shale) reservoirs, without an offsetting increase in demand. The expected increase in gas production, based on reports from the IEA, could cause the prices for gas to remain at current levels or fall to lower levels. If prices for gas continue to remain depressed for lengthy periods, we may be required to write down the value of our oil and gas properties, and some of our undeveloped locations may no longer be economically viable. In addition, sustained low prices for gas will negatively impact the value of our estimated reserves and reduce the amounts of cash we would otherwise have available to pay expenses and any indebtedness that we may incur.
28
Table of Contents
Index to Financial Statements
Our identified potential drilling locations, which are scheduled out over many years, are susceptible to uncertainties that could materially alter the occurrence or timing of their drilling.
Our identified potential drilling locations, including those without proved undeveloped reserves, which we refer to as PUDs, represent a significant part of our growth strategy. Our ability to drill and develop these locations depends on a number of uncertainties, including the availability of capital, construction of infrastructure, inclement weather, regulatory approvals, commodity prices, lease expirations, our ability to secure rights to drill at deeper formations, costs and drilling results.
Further, our identified potential drilling locations are in various stages of evaluation, ranging from locations that are ready to drill to locations that will require substantial additional analysis of data. We cannot predict in advance of drilling and testing whether any particular drilling location will yield oil or gas reserves in sufficient quantities to recover drilling or completion costs or to be economically viable. The use of technology and the study of producing fields in the same area will not enable us to know conclusively prior to drilling whether oil or gas reserves will be present or, if present, whether oil or gas reserves will be present in sufficient quantities to be economically viable. Even if sufficient amounts of oil or gas reserves exist, we may damage the potentially productive hydrocarbon bearing formation or experience mechanical difficulties while drilling or completing the well, possibly resulting in a reduction in production from the well or abandonment of the well. If we drill dry holes in our current and future drilling locations, our drilling success rate will decline and may materially harm our business. The analogies we draw from available data from other wells, more fully explored locations or producing fields may not be applicable to our drilling locations. Further, initial production rates reported by us or other operators in the areas in which we operate may not be indicative of future or long-term production rates.
Because of these uncertainties, we do not know if the potential drilling locations we have identified will ever be drilled or if we will be able to produce oil or gas reserves from these or any other potential drilling locations. As such, our actual drilling activities may materially differ from those presently identified, which could adversely affect our business, financial condition and results of operations.
Operating hazards and uninsured risks may result in substantial losses and could prevent us from realizing profits.
Our operations are subject to all of the hazards and operating risks associated with drilling for and production of oil and gas, including the risk of fire, explosions, blowouts, surface cratering, uncontrollable flows of gas, oil and formation water, pipe or pipeline failures, collisions with other vessels, abnormally pressured formations, casing collapses and environmental hazards such as oil spills, gas leaks, ruptures or discharges of toxic gases, as well as natural disasters such as earthquakes, mudslides, currents and hurricanes. The occurrence of any of these events could result in substantial losses to us due to injury or loss of life, severe damage to or destruction of property, natural resources and equipment, pollution or other environmental damage, clean-up responsibilities, regulatory investigation and penalties, suspension of operations and repairs to resume operations.
Our operations in the GOM and Gulf Coast region are particularly susceptible to interruption and damage from hurricanes. Our operations in California, including transportation of oil by pipelines within the city and county of Los Angeles, are especially susceptible to damage from earthquakes and involve increased risks of personal injury, property damage and marketing interruptions because of the population density of southern California. Any of these operating hazards could cause personal injuries, fatalities, oil spills, discharge of hazardous substances into the air, soil, water and groundwater and other property or environmental damage, lost production and revenue, remediation and clean-up costs and liability for damages, all of which could adversely affect our financial condition and results of operations and may not be fully covered by our insurance.
We endeavor to contractually allocate potential liabilities and risks between us and the parties that provide us with services and goods. Under our agreements with our vendors, to the extent responsibility for environmental liability is allocated between the parties, (1) our vendors generally assume all responsibility for control and removal of pollution or contamination which is directly associated with such vendors’ equipment
29
Table of Contents
Index to Financial Statements
while in their control and (2) we generally assume the responsibility for control and removal of all other pollution or contamination which may occur during our operations, including pre-existing pollution and pollution which may result from fire, blowout, cratering, seepage or any other uncontrolled flow of oil, gas or other substances, as well as the use or disposition of all drilling fluids. In addition, we generally agree to indemnify our vendors for loss or destruction of vendor-owned property that occurs in the wellbore. However, despite this general allocation of risk, we might not succeed in enforcing such contractual allocation, might incur an unforeseen liability falling outside the scope of such allocation or may be required to enter into contractual arrangements with terms that vary from the above allocations of risk. As a result, we may incur substantial losses which could materially and adversely affect our financial condition and results of operations.
In accordance with what we believe to be customary industry practice, we maintain insurance against some, but not all, of our business risks. Our insurance may not be adequate to cover any losses or liabilities we may suffer. Also, insurance may no longer be available to us or, if it is, its availability may be at costs that do not justify its purchase. The occurrence of a significant uninsured claim, a claim in excess of insurance coverage limits or a claim at a time when we are not able to or chose not to obtain liability insurance could have a material adverse effect on our ability to conduct normal business operations and on our financial condition, results of operations or cash flows. In addition, we may not be able to secure additional insurance or bonding that might be required by new governmental regulations. This may cause us to restrict our operations, which might severely impact our financial condition. We may also be liable for environmental damage caused by previous owners of properties purchased by us, which liabilities may not be covered by insurance.
We maintain insurance against claims made for bodily injury, property damage and clean-up costs stemming from a sudden and accidental pollution event. However, we may not have coverage if we are unaware of the pollution event and unable to report the “occurrence” to our insurance company within the time frame required under our insurance policy. We have no coverage for gradual, long-term pollution events. In addition, these policies do not provide coverage for all liabilities, and the insurance coverage may not be adequate to cover claims that may arise, or that we will be able to maintain adequate insurance at rates we consider reasonable. A loss not fully covered by insurance could have a material adverse effect on our financial condition, results of operations and cash flows. See “Business—Operational Hazards and Insurance” for a description of our insurance coverage.
Operations in the Deepwater GOM present greater operating risks than operations in the shallower waters or onshore.
The Deepwater GOM presents significant challenges because of risks associated with water depth and higher drilling and development costs. Our Deepwater GOM platforms are used in water depths ranging from approximately 3,200 to 7,200 feet, and our wells are drilled to depths reaching 32,000 feet. The Deepwater GOM, in general, also lacks the infrastructure present in shallower waters, which can result in significant delays in obtaining or maintaining production. As a result, though we have significant existing offshore infrastructure in the Deepwater GOM that may allow for accelerated development and production, certain deepwater operations may require significant time between a discovery and marketability, thereby increasing the financial risk of these operations.
Our operations that target Inboard Lower Tertiary/Cretaceous prospects involve greater risks and costs than shallower conventional prospects located in the GOM Shelf or Gulf Coast regions.
Our Inboard Lower Tertiary/Cretaceous exploration prospects have not traditionally been the subject of exploratory activity in the GOM Shelf or Gulf Coast regions, so little direct comparative data is available. On February 25, 2015, the Highlander discovery, located onshore in South Louisiana in the Inboard Lower Tertiary/Cretaceous gas trend, began production. Prior to this date, there had been no commercial production of hydrocarbons from Inboard Lower Tertiary/Cretaceous reservoirs in the area. The lack of comparative data and the limitations of diagnostic tools operating in the extreme temperatures and pressures encountered at these
30
Table of Contents
Index to Financial Statements
significant depths make it difficult to predict reservoir quality and well performance of these formations. It is also significantly more risky and expensive to drill and complete wells in these formations than at shallower depths. Major contributors to such increased risks and costs include far higher temperatures and pressures encountered down hole, longer drilling times, extended procurement time and increased costs associated with the specialized equipment required to drill, complete and produce wells in these formations.
Our business plan requires substantial additional capital, which we may be unable to raise on acceptable terms in the future, which may in turn limit our ability to execute our business plan and could lead to a loss of properties and have a material adverse effect on our production, reserves and results of operations.
Developing our properties is very expensive, and we expect that we will need to raise substantial additional capital, through future private or public equity offerings, strategic alliances or debt financing, before we achieve commercialization of some of our properties.
Our future capital requirements will depend on many factors, including:
| • | the scope, success rate and cost of our exploration and production activities; |
| • | oil, gas and NGL prices; |
| • | our ability to locate and acquire hydrocarbon reserves; |
| • | our ability to produce oil or gas from those reserves; |
| • | the terms and timing of our drilling and other production-related arrangements; |
| • | the cost and timing of governmental approvals; and |
| • | the effects of competition by larger companies operating in the oil and gas industry. |
In the near term, we intend to finance our capital expenditures with cash flows from operations, borrowing availability and proceeds from this offering. Our cash flows from operations and access to capital are subject to a number of variables, including:
| • | our reserves; |
| • | the volume of hydrocarbons we are able to produce from existing wells; |
| • | the prices at which our production is sold; |
| • | the levels of our operating expenses; and |
| • | our ability to acquire, locate and produce new reserves and discoveries. |
Our operations and other capital resources may not provide cash in sufficient amounts to maintain planned or future levels of capital expenditures. Further, our actual capital expenditures could exceed our planned amounts. In the event our capital expenditure requirements at any time are greater than the amount of capital we have available, we could be required to seek additional sources of capital, which may include funding from FCX, private or public offerings of debt or equity securities, debt financing, joint ventures, production payment financings, sales of assets, or other means. Our ability to access the private and public debt or equity markets is dependent upon a number of factors outside our control, including oil and gas prices as well as economic conditions in the financial markets. We may not be able to obtain debt or equity financing on terms favorable to us, or at all.
Our business and operating results can be harmed by factors such as the availability, terms and cost of capital or increases in interest rates. Changes in any one or more of these factors could cause our cost of doing business to increase, limit our access to capital, limit our ability to pursue acquisition opportunities, reduce our cash flows available for drilling and place us at a competitive disadvantage. Continuing disruptions and volatility in the global financial markets may lead to an increase in interest rates or a contraction in credit availability, which could impact our ability to finance our operations.
31
Table of Contents
Index to Financial Statements
If we are unable to fund our capital requirements, we may be required to curtail our operations relating to the exploration and development of our prospects, which in turn could lead to a possible loss of properties, a decline in our reserves, an inability to make payments under certain contracts where we have contracted for service or capacity or an inability to implement our development plan, complete acquisitions or otherwise take advantage of business opportunities or respond to competitive pressures, any of which could have a material adverse effect on our production, revenues and results of operations. In addition, a delay in or the failure to complete proposed or future infrastructure projects could delay or eliminate potential efficiencies and related cost savings.
The holders of the preferred stock of Plains Offshore Operations Inc. may cause us to consummate an exit event of one of our consolidated subsidiaries.
One of our consolidated subsidiaries, Plains Offshore Operations Inc., which we refer to as Plains Offshore, holds certain of our Deepwater GOM assets, including a 19.998 percent working interest in the Lucius field and our interest in the Phobos discovery. As of December 31, 2014, Plains Offshore held 5.3 percent, 3.6 percent and 7.5 percent of our total proved, probable and possible oil and gas reserves, respectively. See “Business—Redeemable Noncontrolling Interest—Plains Offshore” and “Certain Relationships and Related Party Transactions—Redeemable Noncontrolling Interest—Plains Offshore.”
Plains Offshore has 474,000 shares of 8.0% Convertible Preferred Stock outstanding with associated warrants. In connection with the offering of the preferred stock, the holders of such stock were given the right, at any time after November 17, 2015, to cause Plains Offshore to use its commercially reasonable efforts to consummate an exit event. Such an exit event must be requested by the majority of the holders of the preferred stock and would consist of (i) the repurchase of all of the issued and outstanding preferred stock of Plains Offshore, (ii) a sale of Plains Offshore or (iii) an initial public offering of Plains Offshore. The form of such exit event if such right is exercised shall be determined by Plains Offshore in its sole discretion. Depending on the ultimate form of such an exit event, the occurrence of such an exit event could materially adversely affect our financial condition and results of operations. Furthermore, if we are unsuccessful in consummating an exit event by the applicable deadline, the conversion price of the preferred stock and the exercise price of the warrants will immediately and automatically be adjusted such that all issued and outstanding shares of preferred stock on an as-converted basis, taken together with shares of Plains Offshore common stock issuable upon exercise of the warrants, in the aggregate, will constitute 49 percent of the common equity securities of Plains Offshore on a fully diluted basis. In addition, in such event, we would be required to purchase $300.0 million of junior preferred stock in Plains Offshore.
The geographic concentration and characteristics of our oil reserves may have a greater effect on our ability to sell our oil production.
A substantial portion of our production and reserves are located in the Deepwater GOM and California. Any regional events, including price fluctuations, natural disasters and restrictive regulations that increase costs, reduce availability of equipment or supplies, reduce demand or limit our production, may impact our operations more than if our reserves were more geographically diversified.
Our California oil production is, on average, heavier than premium grade light oil, and the margin (sales price minus production costs) is generally less than that of lighter oil sales due to the processes required to refine this type of oil and transportation requirements. As such, the effect of material price decreases will more adversely affect the profitability of heavy oil production compared with lighter grades of oil.
32
Table of Contents
Index to Financial Statements
The marketability of our production is dependent upon transportation and other facilities, certain of which we do not control. When these facilities are unavailable, our operations can be interrupted and our revenues reduced.
The marketability of our production depends in part upon the availability, proximity and capacity of transportation facilities owned by third parties. Our share of oil and gas production from our Deepwater GOM properties is sold under a series of arm’s length contracts awarded on a competitive bid basis or entered into following negotiations. Oil is sold directly to companies with refineries in the Gulf Coast regions of Texas and Louisiana at prices based on widely-used industry benchmarks. Gas is processed in one of four large onshore gas plants, where we are paid our contractual share of revenues from the sale of NGLs. We sell or deliver our residue gas to various industrial and energy markets as well as intrastate and interstate pipeline systems.
We use a series of pipelines, some of which are ours, to transport our oil and gas production from our offshore platforms to shore. These movements are made under a combination of transportation contracts and tariffs subject to Federal Energy Regulatory Commission, which we refer to as FERC, regulation. Natural disasters or other operational situations beyond our control could result in increased transportation costs to us or require us to find transportation alternatives. Such circumstances may also result in significant decreases in our oil and gas production.
There are a limited number of alternative methods of transportation for our onshore and offshore production. A substantial portion of our oil and gas production is transported by pipelines and trucks owned by third parties. The inability or unwillingness of these parties to provide transportation services to us for a reasonable fee could result in us having to find transportation alternatives, increased transportation costs or involuntary curtailment of a significant portion of our oil and gas production which could have a negative impact on future results of operations or cash flows.
Our acreage must be drilled before the lease primary term expiration, which is generally within four to ten years, in order to hold the acreage by production or a commitment to develop. In a highly competitive market for acreage, failure to drill sufficient wells to hold acreage may result in a substantial lease renewal cost, or if renewal is not feasible, loss of our lease and prospective drilling opportunities.
As of December 31, 2014, 85 percent of our total net leasehold acreage is undeveloped, or acreage on which wells have not been drilled or completed to a point that would permit the production of economic quantities of oil and gas regardless of whether such acreage contains proved reserves. In addition, many of our oil and gas leases require us to drill wells that are commercially productive, and if we are unsuccessful in drilling such wells, we could lose our rights under such leases. Our reserves and future production and, therefore, our future cash flow and income are highly dependent on successfully developing our undeveloped leasehold acreage.
Our leases of U.S. onshore oil and gas properties typically have a primary term of four to five years, after which they expire unless production is established prior to expiration. As of December 31, 2014, 33 percent of our total U.S. net undeveloped onshore acres are covered by leases that expire from 2015 through 2017. Our leases of offshore U.S. oil and gas properties typically have a primary term of five to ten years, after which they expire unless, prior to expiration, production is established. As of December 31, 2014, 36 percent of our total U.S. net undeveloped GOM offshore acres are covered by leases that expire from 2015 through 2017. As a result of the decrease in crude oil prices, our current plans anticipate that the majority of expiring acreage will not be retained by drilling operations or other means. The exploration permits covering our Morocco acreage expire in 2016; however, we have the ability to extend the exploration permits through 2019. Any such losses of leases could materially and adversely affect the growth of our asset base, cash flows and results of operations.
33
Table of Contents
Index to Financial Statements
Drilling wells is speculative, often involving significant costs that may be more than our estimates, and may not result in any discoveries or additions to our future production or reserves. Any material inaccuracies in drilling costs, estimates or underlying assumptions will materially affect our business.
Exploring for and developing hydrocarbon reserves involves a high degree of operational and financial risk, which precludes definitive statements as to the time required and costs involved in reaching certain objectives. The budgeted costs of planning, drilling, completing and operating wells are often exceeded and can increase significantly when drilling costs rise due to a tightening in the supply of various types of oilfield equipment and related services or unanticipated geologic conditions. Before a well is spud, we incur significant acquisition, geological and geophysical (seismic) costs, which are incurred whether a well eventually produces commercial quantities of hydrocarbons, or is drilled at all. Drilling may be unsuccessful for many reasons, including geologic conditions, weather, cost overruns, equipment shortages and mechanical difficulties. Exploratory wells bear a much greater risk of loss than development wells. Furthermore, the successful drilling of a well does not necessarily result in the commercially viable development of a field. A variety of factors, including geologic and market-related, can cause a field to become uneconomic or only marginally economic. Many of our prospects that may be developed require significant additional exploration and development, regulatory approval and commitments of resources prior to commercial development. The successful drilling of a single well may not be indicative of the potential for the development of a commercially viable field. In Morocco, where we own 1.1 million undeveloped net acres, we face higher above-ground risks necessitating higher expected returns, the requirement for increased capital expenditures due to a general lack of infrastructure and underdeveloped oil and gas industries, and increased transportation expenses due to geographic remoteness, which either require a single well to be exceptionally productive, or the existence of multiple successful wells, to allow for the development of a commercially viable field. See “—Our international operations are subject to political, social and geographic risks of doing business in countries outside the U.S.” Furthermore, if our actual drilling and development costs are significantly more than our estimated costs, we may not be able to continue our business operations as proposed and would be forced to modify our plan of operation.
Our international operations are subject to political, social and geographic risks of doing business in countries outside the U.S.
We currently have and have historically had oil and gas operations located outside of the United States. We plan to continue to be active internationally. Currently, we are pre-qualified as a participant in the oil and gas lease auction being conducted in Mexico. Accordingly, in addition to the usual risks associated with conducting business in countries outside the U.S., our business may be adversely affected by political, economic and social uncertainties in Morocco and other countries. Risks of conducting business in countries outside of the U.S. include, but are not limited to, the following:
| • | renegotiation, cancellation or forced modification of existing contracts; |
| • | expropriation or nationalization of property; |
| • | changes in another country’s laws, regulations and policies, including those relating to labor, taxation, royalties, divestment, imports, exports, trade regulations, currency and environmental matters, which because of rising “resource nationalism” in countries around the world, may impose increasingly onerous requirements on foreign operations and investment; |
| • | political instability, bribery, extortion, corruption, civil strife, acts of war, guerrilla activities, insurrection and terrorism; |
| • | foreign exchange controls and movements in foreign currency exchange rates; and |
| • | the risk of having to submit to the jurisdiction of an international court or arbitration panel or having to enforce the judgment of an international court or arbitration panel against a sovereign nation within its own territory. |
34
Table of Contents
Index to Financial Statements
Our insurance does not cover most losses caused by the above described risks. Accordingly, our drilling activities outside of the U.S. may be substantially affected by many unpredictable factors beyond our control, some of which could materially and adversely affect our results of operations and financial condition.
Our international operations must comply with the U.S. Foreign Corrupt Practices Act and similar anti-corruption and anti-bribery laws of the other jurisdictions in which we operate. There has been a substantial increase in the global enforcement of these laws. Any violation of these laws could result in significant criminal or civil fines and penalties, litigation, and loss of operating licenses or permits, and may damage our reputation, which could have a material adverse effect on our business, results of operations and financial condition.
The development of our PUDs and other undeveloped reserves may take longer and may require higher levels of capital expenditures than we anticipate and may not be economically viable.
At December 31, 2014, approximately 37 percent of our total proved reserves were PUDs, and 83 percent of our total probable and possible reserves, respectively, were undeveloped. These PUDs and other undeveloped reserves may not be ultimately developed or produced. Recovery of PUDs and other undeveloped reserves requires significant capital expenditures and successful drilling operations. The development of probable and possible reserves will require additional capital expenditures and such reserves are less certain to be recovered than proved reserves. The reserve data included in our independent petroleum engineering firms’ reserve reports assumes that substantial capital expenditures are required to develop such reserves. We cannot be certain that the estimated costs of the development of these reserves are accurate, that development will occur as scheduled or that the results of such development will be as estimated. Delays in the development of our reserves or increases in costs to drill and develop such reserves will reduce future net revenues of our estimated undeveloped reserves and may result in some projects becoming uneconomic. In addition, delays in the development of proved reserves could cause us to have to reclassify such reserves as PUDs.
SEC rules could limit our ability to consider additional undeveloped resources to be reserves in the future.
SEC rules require that, subject to limited exceptions, undeveloped resources may only be considered reserves if they relate to wells scheduled to be drilled within five years after the date of booking. This requirement has limited and may continue to limit our ability to consider additional undeveloped resources as reserves as we pursue our drilling program. Moreover, we may be required to write down our undeveloped reserves if we do not drill those wells within the required five-year timeframe.
The unavailability, high cost or shortages of rigs, equipment, raw materials, supplies or personnel may restrict our operations.
The oil and gas industry is cyclical, which can result in shortages of drilling rigs, equipment, raw materials, supplies and personnel. When shortages occur, the costs and delivery times of rigs, equipment and supplies increase. In addition, when demand for oil and gas increases, the demand for, and wage rates of, qualified drilling rig crews also rise. In accordance with customary industry practice, we rely on independent third-party service providers to provide most of the services necessary to drill new wells. If we are unable to secure a sufficient number of drilling rigs at reasonable costs, our financial condition and results of operations could suffer, and we may not be able to drill all of our acreage before our leases expire.
We have entered into oil derivative contracts and may in the future enter into additional commodity derivative contracts for a portion of our production, which may result in future cash payments or prevent us from receiving the full benefit of increases in commodity prices.
We use commodity derivative contracts to reduce price volatility associated with certain of our oil and gas sales. The extent of our commodity price exposure is related largely to the effectiveness and scope of our commodity derivative contracts. For example, some of the commodity derivative contracts we utilize are based
35
Table of Contents
Index to Financial Statements
on quoted market prices, which may differ significantly from the actual prices we realize in our operations. We currently have oil derivative contracts for 84 MBbls/d in 2015 with $90 by $70 put spreads. We are not under an obligation to contract a specific portion of our production. The prices at which we contract our production in the future will be dependent upon commodity prices at the time we enter into these transactions, which may be substantially higher or lower than current commodity prices. Accordingly, our oil derivative contracts may not protect us from significant declines in commodity prices received for our future production, whether due to declines in prices in general or to widening differentials we experience with respect to our products. Conversely, our oil derivative contracts may limit our ability to realize cash flows from commodity price increases. It is also possible that a substantially larger percentage of our future production will not have oil derivative contracts, which would result in our revenues becoming more sensitive to commodity price changes.
In addition, our actual future production may be significantly higher or lower than we estimate at the time we enter into commodity derivative contracts for such period. If the actual amount is higher than we estimate, we will have greater commodity price exposure than we intended. If the actual amount is lower than the notional amount of our commodity derivative contracts, we might be forced to satisfy all or a portion of our commodity derivative contracts without the benefit of the cash flow from our sale or purchase of the underlying physical commodity, substantially diminishing our liquidity. There may be a change in the expected differential between the underlying commodity price in the commodity derivative contract and the actual price received, which may result in payments to our derivative counterparty that are not offset by our receipt of payments for our production in the field. Accordingly, our earnings may fluctuate significantly as a result of changes in the fair value of our commodity derivative contracts.
Our commodity derivative contracts expose us to counterparty credit risk.
Our commodity derivative contracts expose us to risk of financial loss if a counterparty fails to perform under a contract. Disruptions in the financial markets could lead to sudden decreases in a counterparty’s liquidity, which could make them unable to perform under the terms of the contract and we may not be able to realize the benefit of the contract. We are unable to predict these changes in a counterparty’s creditworthiness or ability to perform. Even if we do accurately predict sudden changes, our ability to negate the risk may be limited depending upon market conditions.
During periods of declining commodity prices, our derivative contract receivable positions generally increase, which increases our counterparty credit exposure. If the creditworthiness of our counterparties deteriorates and results in their nonperformance, we could incur a significant loss with respect to our commodity derivative contracts.
The inability of one or more of our customers to meet their obligations may adversely affect our financial results.
In addition to credit risk related to receivables from commodity derivative contracts, our principal exposure to credit risk is through receivables from purchasers of our oil and gas production. For the year ended December 31, 2014, Phillips 66 Company represented 61 percent of our revenue and may be affected by changes in economic and other conditions in a manner similar to us. Current economic circumstances may further increase these risks. We do not require our customers to post collateral. The inability or failure of our significant customers to meet their obligations to us or their insolvency or liquidation may materially adversely affect our financial condition and results of operations.
The asset values of our investments in oil and gas properties may become impaired.
We account for our oil and gas producing activities using the full cost method of accounting. Accordingly, all costs incurred in the acquisition and development of proved oil and gas properties, including the costs of abandoned properties, dry holes, geophysical costs and annual lease rentals are capitalized. We also capitalize
36
Table of Contents
Index to Financial Statements
direct operating costs for services performed with internally owned drilling and well servicing equipment. All general and administrative corporate costs unrelated to drilling activities are expensed as incurred. Sales or other dispositions of oil and gas properties are accounted for as adjustments to capitalized costs, with no gain or loss recorded unless the ratio of cost to proved reserves would significantly change.
The net capitalized costs of proved oil and gas properties are subject to a full cost ceiling limitation in which the costs are not allowed to exceed their related estimated future net revenues discounted at 10 percent. To the extent capitalized costs of evaluated oil and gas properties, net of accumulated depreciation, depletion, amortization, which we refer to as DD&A, and impairment exceed the discounted future net revenues of proved reserves, the excess capitalized costs are charged to expense.
During fourth-quarter of 2014, we evaluated goodwill associated with our oil and gas operations. This evaluation resulted in impairment charges of $1.7 billion, which reduced the value of goodwill attributable to such operations to zero as of December 31, 2014. As of June 30, 2015, net capitalized costs with respect to our proved U.S. oil and gas properties exceeded the ceiling amount specified by the SEC’s full cost accounting rules, which resulted in the recognition of an impairment charge totaling $2.7 billion in second-quarter 2015 and $3.1 billion in first-quarter 2015. We expect significant additional ceiling test impairments of our oil and gas properties during the remainder of 2015. In the future, many factors could result in significant additional ceiling test impairments of our oil and gas properties, including weaker oil prices, increases in capitalized costs and other factors. See “Management’s Discussion and Analysis of Financial Condition and Results of Operations—Critical Accounting Policies and Estimates—Impairment of Oil and Gas Properties” for a more detailed description of our method of accounting.
The Standardized Measure of discounted future net cash flows from our proved reserves will not be the same as the current market value of our estimated oil and gas reserves.
You should not assume that the Standardized Measure of discounted future net cash flows from our proved reserves is the current market value of our estimated oil and gas reserves. In accordance with SEC requirements in effect at December 31, 2014, 2013, and 2012, we based the discounted future net cash flows from our proved reserves on the 12-month first-day-of-the-month oil and gas average prices without giving effect to derivative transactions. Actual future net cash flows from our oil and gas properties will be affected by factors such as:
| • | actual prices we receive for oil and gas; |
| • | actual cost of development and production expenditures; |
| • | the amount and timing of actual production; and |
| • | changes in governmental regulations or taxation. |
The timing of both our production and our incurrence of expenses in connection with the development and production of oil and gas properties will affect the timing and amount of actual future net revenues from proved reserves, and thus their actual present value. In addition, the 10 percent discount factor we use when calculating Standardized Measure may not be the most appropriate discount factor based on interest rates in effect from time to time and risks associated with us or the oil and gas industry in general. As a corporation, we will be treated as a taxable entity for federal income tax purposes and our future income taxes will be dependent on our future taxable income. Actual future prices and costs may differ materially from those used in the present value estimates included in this prospectus, which could have a material effect on the value of our reserves.
We have limited control over the activities on properties we do not operate.
Some of our properties are operated by other companies and involve third-party working interest owners. As a result, we have limited ability to influence or control the operation or future development of such properties, including compliance with environmental, safety and other regulations, or the amount of capital expenditures that
37
Table of Contents
Index to Financial Statements
we will be required to fund with respect to such properties. Moreover, we are dependent on the other working interest owners of such projects to fund their contractual share of the capital expenditures of such projects. 23 percent of our 2015 capital budget is allocated to properties we do not operate. These limitations and our dependence on the operator and other working interest owners for these projects could cause us to incur unexpected future costs, result in lower production and materially and adversely affect our financial condition and results of operations.
We have plugging and abandonment obligations related to our current and former oil and gas operations and are required to provide bonds or other forms of financial assurance in connection with those operations. Changes in or the failure to comply with these requirements could have a material adverse effect on us.
We are subject to financial assurance requirements in connection with our oil and gas operations under both state and federal laws. For example, permits, bonding and insurance are required to drill, operate, and plug and abandon wells. Also, the BOEM and the Bureau of Safety and Environmental Enforcement, which we refer to as the BSEE, regulations applicable to lessees in federal waters require that lessees have substantial U.S. assets and net worth or post bonds or other acceptable financial assurance that the regulatory obligations will be met. Financial responsibility requirements are also required under the Oil Pollution Act of 1990 to cover containment and cleanup costs resulting from an oil spill.
The BOEM has signaled its intention to redesign and implement revised financial assurance requirements associated with offshore plugging and abandonment obligations. The BOEM has recently taken a stricter approach regarding the level of decommissioning liabilities to be included in its financial test for purposes of determining eligibility for exemption from financial assurance requirements. It is uncertain whether additional changes will be implemented by the BOEM and how these changes might affect the form and amount of our existing and future financial assurance obligations associated with our offshore activities in federal waters. The BSEE has recently implemented increased estimates for costs to abandon properties including allocating abandonment costs for wells not yet drilled or facilities not yet set, but for which permits have been sought.
As of December 31, 2014, our asset retirement obligations totaled $1.1 billion and a substantial portion of these obligations are covered by financial capability demonstrations. If our financial condition were to deteriorate substantially, we may be required to provide additional or alternative forms of financial assurance, such as letters of credit, surety bonds or collateral. These other forms of assurance would be costly to provide and, depending on our financial condition and market conditions, may be difficult or impossible to obtain. Failure to provide the required financial assurance could result in the suspension of the affected operations.
We rely on a few key employees whose absence or loss could adversely affect our business.
Many key responsibilities within our business have been assigned to a small number of employees. The loss of their services could adversely affect our business. In particular, the loss of the services of one or more members of our senior management team, including our Chief Executive Officer, James C. Flores, could disrupt our operations. FCX has employment agreements with our senior executives which contain restrictions on competition with us in the event they cease to be employed by us. However, as a practical matter, such employment agreements may not assure the retention of our key employees. Further, we do not maintain “key person” life insurance policies on any of our employees. As a result, we are not insured against any losses resulting from the death of our key employees.
Our failure to successfully identify, complete and integrate future acquisitions of properties or businesses could reduce our operating results and slow our growth.
There is intense competition for acquisition opportunities in our industry and we may not be able to identify attractive acquisition opportunities. Even if we do identify attractive acquisition opportunities, we may not be able to complete the acquisition or do so on commercially acceptable terms. Competition for acquisitions may
38
Table of Contents
Index to Financial Statements
increase the cost of, or cause us to refrain from, completing acquisitions. Our ability to complete acquisitions is dependent upon, among other things, our ability to obtain debt and equity financing and, in some cases, regulatory approvals. Further, these acquisitions may be in geographic regions in which we do not currently operate, which could result in unforeseen operating difficulties and difficulties in coordinating geographically dispersed operations, personnel and facilities. In addition, if we enter into new geographic markets, we may be subject to additional and unfamiliar legal and regulatory requirements. Compliance with these regulatory requirements may impose substantial additional obligations on us and our management, cause us to expend additional time and resources in compliance activities and increase our exposure to penalties or fines for non-compliance with such additional legal requirements. Completed acquisitions could require us to invest further in operational, financial and management information systems and to attract, retain, motivate and effectively manage additional employees. The inability to effectively manage the integration of acquisitions could reduce our focus on subsequent acquisitions and current operations, which, in turn, could negatively impact our results of operations and growth. Our financial condition and results of operations may fluctuate significantly from period to period, based in part on whether or not significant acquisitions are completed in particular periods.
Any acquisition involves potential risks, including, among other things:
| • | the validity of our assumptions about estimated proved, probable or possible reserves, future production, commodity prices, revenues, capital expenditures, operating expenses and costs; |
| • | an inability to obtain satisfactory title to the assets we acquire; |
| • | a decrease in our liquidity by using a significant portion of our available cash to finance acquisitions; |
| • | a significant increase in our interest expense or financial leverage if we incur additional debt to finance acquisitions; |
| • | the assumption of unknown liabilities, losses or costs for which we obtain no or limited indemnity or other recourse; |
| • | the diversion of management’s attention from other business concerns; |
| • | an inability to hire, train or retain qualified personnel to manage and operate our growing assets; and |
| • | the occurrence of other significant changes, such as impairment of oil and gas properties, goodwill or other intangible assets, asset devaluation or restructuring charges. |
Properties we acquire may not produce as projected, and we may be unable to determine reserve potential, identify liabilities associated with the properties that we acquire or obtain protection from sellers against such liabilities.
Acquiring oil and gas properties requires us to assess reservoir and infrastructure characteristics, including recoverable reserves, development and operating costs and potential environmental and other liabilities. Such assessments are inexact and inherently uncertain. In connection with the assessments, we perform a review of the subject properties, but such a review will not reveal all existing or potential problems. In the course of our due diligence, we may not inspect every well or pipeline. We cannot necessarily observe structural and environmental problems, such as pipe corrosion, when an inspection is made. We may not be able to obtain contractual indemnities from the seller for liabilities created prior to our purchase of the property. We may be required to assume the risk of the physical condition of the properties in addition to the risk that the properties may not perform in accordance with our expectations.
We may incur losses as a result of title defects in the properties in which we invest.
As is customary in the oil and gas industry, we make minimal investigation of title at the time we acquire undeveloped properties. We make title investigations and receive title opinions of local counsel only before we commence drilling operations. Frequently, as a result of such examinations, certain curative work must be done
39
Table of Contents
Index to Financial Statements
to correct defects in the marketability of the title, and such curative work entails expense. Our failure to cure any title defects may delay or prevent us from utilizing the associated mineral interest, which may adversely impact our ability in the future to increase production and reserves. Additionally, undeveloped acreage has greater risk of title defects than developed acreage. If there are any title defects or defects in assignment of leasehold rights in properties in which we hold an interest, we will suffer a financial loss.
Competition in the oil and gas industry is intense, which may adversely affect our ability to succeed.
The oil and gas industry is intensely competitive, and we compete with other companies that have greater resources than us. Many of these companies not only explore for and produce oil and gas, but also carry on midstream and refining operations and market petroleum and other products on a regional, national or worldwide basis. These companies may be able to pay more for productive oil and gas properties and exploratory prospects or define, evaluate, bid for and purchase a greater number of properties and prospects than our financial or human resources permit. In addition, these companies may have a greater ability to continue exploration activities during periods of low oil and gas market prices. Our larger competitors may be able to absorb the burden of present and future federal, state, local and other laws and regulations more easily than we can, which would adversely affect our competitive position. Our ability to acquire additional properties and to discover reserves in the future will be dependent upon our ability to evaluate and select suitable properties and to consummate transactions in a highly competitive environment. In addition, because we have fewer financial and human resources than many companies in our industry, we may be at a disadvantage in bidding for exploratory prospects and producing reserves, or we may be required to partner with others for the development of prospects and discoveries, thus reducing our net share of such prospects.
The oil and gas industry is characterized by rapid and significant technological advancements and introductions of new products and services using new technologies. As others use or develop new technologies, we may be placed at a competitive disadvantage or competitive pressures may force us to implement those new technologies at substantial costs. In addition, other oil and gas companies may have greater financial, technical and personnel resources that allow them to enjoy technological advantages and may in the future allow them to implement new technologies before we can. We may not be able to respond to these competitive pressures and implement new technologies on a timely basis or at an acceptable cost. If one or more of the technologies we use now or in the future were to become obsolete or if we are unable to use the most advanced commercially available technology, our business, financial condition and results of operations could be materially adversely affected.
We are subject to various legal proceedings, which may have an adverse effect on our business.
We are party to a number of legal proceedings in the normal course of business activities, including workers’ compensation claims, employment-related disputes, commercial disputes, personal injury claims, royalty claims, property damage claims and contract actions. For example, we are named as defendants in various lawsuits relating to our ownership in the Haynesville shale dealing with claimants’ entitlement to, and accounting for, royalties. These lawsuits allege, among other things, that we or Chesapeake Energy Corporation, an operator of our Haynesville Shale interests, used below-market prices, made improper deductions, used improper measurement techniques or the operator entered into arrangements with affiliates that resulted in underpayment of royalties in connection with the production and sale of natural gas and natural gas liquids. We have also received multiple related claim notices from other lessors, and additional lawsuits may be filed against us by new plaintiffs making similar allegations.
There is the potential that litigation could have an adverse effect on our cash flows, results of operations or financial position. If we are not able to successfully defend ourselves with respect to various legal proceedings, there could be a delay or even a halt in our exploration, development or production activities or other business plans, resulting in a reduction in reserves, loss of production and reduced cash flows.
40
Table of Contents
Index to Financial Statements
Our use of seismic data is subject to interpretation and may not accurately identify the presence of oil and gas, which could adversely affect the results of our drilling operations.
Even when properly used and interpreted, seismic data and visualization techniques are only tools used to assist geoscientists in identifying subsurface structures and hydrocarbon indicators and do not enable the interpreter to know whether hydrocarbons are, in fact, present in those structures. In addition, the use of 3-D seismic and other advanced technologies requires greater predrilling expenditures than traditional drilling strategies, and we could incur losses as a result of such expenditures. As a result, our drilling activities may not be successful or economical.
Conservation measures and technological advances could reduce demand for oil and gas.
Fuel conservation measures, alternative fuel requirements, increasing consumer demand for alternatives to oil and gas, technological advances in fuel economy and energy generation devices could reduce demand for oil and gas. The impact of the changing demand for oil and gas services and products may have a material adverse effect on our business, financial condition, results of operations and cash flows.
Our operations are subject to complex and evolving environmental laws and regulations. Compliance with environmental regulatory requirements involves significant costs and may constrain our expansion opportunities.
Our operations are subject to extensive environmental laws and regulations governing the generation, transportation and disposal of hazardous substances, waste disposal, air emissions, water discharges, remediation, restoration and reclamation of environmental contamination, including oil spill cleanup and well plug and abandonment requirements, protection of endangered and other protected species, and related matters. Certain laws may subject us to joint and several liability for environmental damages caused by previous owners or operators of properties we acquired or are currently operating or at sites where we sent materials for processing, recycling or disposal. Noncompliance with these laws and regulations could result in material penalties or other liabilities. In addition, compliance with these laws may from time to time result in delays in or changes to our development or expansion plans.
Changes in, or challenges to, our rates and other terms and conditions of service could have a material adverse effect on our financial condition and result of operations.
We will use a series of pipelines to transport our oil and gas production. The rates charged on certain of those pipeline systems are regulated by the FERC or state regulatory agencies, or both. These regulatory agencies also regulate other terms and conditions of the services these pipeline systems provide, including the types of services offered. If one of these regulatory agencies, on its own initiative or due to challenges by third parties, were to alter the tariff rates or make any other material changes to the types or terms and conditions of services available to us, the cost of transporting our oil and gas could increase. Furthermore, the regulatory agencies that regulate pipeline systems periodically implement new rules, regulations and terms and conditions of services subject to their jurisdiction. New initiatives or orders may adversely affect the rates we charge or pay for pipeline services, or otherwise adversely affect our financial condition, results of operations and cash flows.
Legislation and regulatory initiatives relating to hydraulic fracturing could increase our cost of doing business and adversely affect our operations.
Our operations periodically utilize the practice of hydraulic fracturing for new oil and gas wells. Hydraulic fracturing is also occasionally used to recomplete or restimulate an existing well that has declined in production performance. Hydraulic fracturing involves the injection of water, sand and chemicals under pressure into rock formation to stimulate oil and gas production. The process is typically regulated by state oil and gas commissions and agencies, but federal agencies have asserted regulatory authority over the process. For example, in 2012, the
41
Table of Contents
Index to Financial Statements
Environmental Protection Agency, which we refer to as the EPA, published final rules that subject oil and gas operations (production, processing, transmission, storage and distribution) to regulation under the New Source Performance Standards, which we refer to as NSPS, and National Emission Standards for Hazardous Air Pollutants, which we refer to as NESHAPS, programs, which also includes NSPS standards for completions of hydraulically fractured gas wells. Similarly, in May 2014, the EPA issued an advanced notice of proposed rulemaking regarding Toxic Substances Control Act reporting of the chemical substances and mixtures used in hydraulic fracturing. In addition, on March 20, 2015, the U.S. Bureau of Land Management, which we refer to as BLM, released final regulations that require the public disclosure of the chemicals used in hydraulic fracturing and impose certain permitting, testing and other requirements on such operations on federal lands. From time to time, legislation has been introduced in Congress to amend the federal Safe Drinking Water Act, which we refer to as SDWA, to eliminate exemptions for most hydraulic fracturing activities.
Similar efforts to review the practice of hydraulic fracturing and impose new regulatory conditions are taking place at the state and local level in states where we operate and may operate in the future. California, Texas and Wyoming as well as other states, and various cities and counties in these and other states, have adopted or are considering new regulations and statutes pertaining to hydraulic fracturing. These new requirements will (and future regulatory and legislative changes, if enacted, could) create new permitting and financial assurance requirements, require us to adhere to certain construction specifications, fulfill monitoring, reporting and recordkeeping obligations and meet plugging and abandonment requirements, and, in some instances, may limit or preclude the use of hydraulic fracturing.
Certain governmental reviews have also been conducted or are underway that focus on the environmental aspects of hydraulic fracturing practices. For example, the EPA has commenced a study of the potential environmental effects of hydraulic fracturing on drinking water and groundwater. A final draft of the report was released for peer review and public comment in June 2015. Depending on the results of these studies, additional regulatory requirements could be imposed by federal, state and local governments.
The imposition of stringent new regulatory and permitting requirements related to the practice of hydraulic fracturing could significantly increase our cost of doing business, could create adverse effects on our operations including creating delays related to the issuance of permits, and depending on the specifics of any particular proposal that is enacted, could be material.
Regulation of greenhouse gas emissions and climate change issues may increase our costs, adversely affect our operations and impact the demand for the oil and gas that we produce.
Since 2009, the EPA has been monitoring and regulating greenhouse gas emissions from certain sources in the oil and gas sector. Our facilities are subject to the EPA’s reporting rules (Subpart C and W) that cover onshore and offshore oil and gas production, processing, transmission, storage and distribution facilities. Under these rules, reporting of greenhouse gas emissions from such facilities, including most of our facilities, is required on an annual basis. The EPA also recently announced its intention to take measures to require or encourage reductions in methane emissions from oil and gas operations. Those measures may include the development of NSPS regulations in 2016 for reducing methane from new and modified oil and gas production sources and gas processing and transmission sources.
From time to time, legislation has been introduced in the U.S. Congress to regulate greenhouse gas emissions. Similarly, the United States also is actively participating in international discussions that are currently underway to develop a treaty to replace the Kyoto Protocol after its expiration. In November 2014, President Obama announced that the United States would seek to cut net greenhouse gas emissions 26-28 percent below 2005 levels by 2025 in return for China’s commitment to seek to peak emissions around 2030, with concurrent increases in renewable energy.
In addition, more than one-third of the states have already taken legal measures to reduce emissions of greenhouse gases, primarily through the planned development of greenhouse gas emission inventories and/or
42
Table of Contents
Index to Financial Statements
regional greenhouse gas cap and trade programs. For example, in California, the California Air Resources Board, which we refer to as CARB, developed regulations pursuant to Assembly Bill 32 (AB 32 or the California Global Warming Solutions Act of 2006) that are intended to achieve an overall reduction in greenhouse gas emissions to 1990 levels, a 15 percent reduction by 2020. Compliance with these regulations will require certain companies, including us, to periodically secure offsets and allowances, each of which is equal to one metric ton of emissions under the cap and trade program. The price of these instruments varies in accordance with market conditions. The total amount of instruments we owe will vary annually based on the total greenhouse gas emissions registered in any one year and the number of “free allowances” issued by CARB annually. California or other states may also expand environmental programs requiring greenhouse gas reductions and renewable energy mandates. For example, in California, in January 2015, Governor Brown called for increasing the state’s Renewables Portfolio Standard to 50 percent by 2030 and to extend AB 32 to require an 80 percent reduction in greenhouse gas emissions by 2050. Legislation has been introduced in California consistent with these goals (SB 350 and SB 32).
The regulation of emissions of greenhouse gases from our equipment and operations could require us to incur costs to reduce the greenhouse gas emissions from our own operations, and it could also adversely affect demand for our products.
One consequence of climate change could be increased severity of extreme weather, such as increased hurricanes and floods. If such effects were to occur, our operations could be adversely affected in various ways, including damage to facilities or increased costs for insurance.
Environmental liabilities could adversely affect our financial condition.
The oil and gas business is subject to environmental hazards, such as oil spills, gas leaks and ruptures and discharges of petroleum products and hazardous substances and historical disposal activities. These environmental hazards could expose us to material liabilities for property damages, personal injuries or other environmental harm, including costs of investigating and remediating contaminated properties. We also may be liable for environmental damages caused by the previous owners or operators of properties we have purchased or are currently operating. A variety of stringent federal, state and local laws and regulations govern the environmental aspects of our business and impose strict requirements for, among other things:
| • | well drilling or workover, operation and abandonment; |
| • | waste management; |
| • | land reclamation; |
| • | financial assurance; and |
| • | controlling air emissions, preventing water contamination and unauthorized waste discharges. |
Any noncompliance with these laws and regulations could subject us to administrative, civil or criminal penalties or other liabilities. Additionally, our compliance with these laws may, from time to time, result in increased costs to our operations or decreased production, and may affect our costs of acquisitions.
In addition, existing, modified or new environmental laws may, in the future, cause a decrease in our production or cause an increase in our costs of production, development or exploration. Pollution and similar environmental risks generally are not fully insurable.
Some of our onshore California fields have been in operation for more than 100 years, and current or future local, state and federal environmental and other laws and regulations may require substantial expenditures to remediate the properties or to otherwise comply with these laws and regulations. The Montebello field operates under a number of federal and California permits that are over and above what may be required in our other California facilities. The primary reason for the additional permits and associated restrictions on property use is the property’s location within what has been designated critical habitat for the federally threatened songbird,
43
Table of Contents
Index to Financial Statements
known as the California gnatcatcher, in accordance with Section 7 of the federal Endangered Species Act. A variety of existing laws, rules and guidelines govern activities that can be conducted on properties that contain coastal sage scrub and gnatcatchers and generally limit the scope of operations that we can conduct on this property. The presence of coastal sage scrub and gnatcatchers in the Montebello field and other existing or future laws, rules and guidelines could prohibit or limit our operations and our planned activities for this property.
Our operations are subject to extensive regulations, some of which require permits and other approvals. These regulations increase our costs and in some circumstances may delay or suspend our operations.
Our operations are subject to extensive and complex laws and regulations that are subject to change and to changing interpretation by governmental agencies and other bodies vested with broad supervisory authority. Social activism can also result in changes to these laws and regulations. As an oil and gas company, compliance with environmental legal requirements is an integral and costly part of our business. We are also subject to extensive regulation of worker health and safety, including the requirements of the U.S. Occupational Safety and Health Act and similar laws of other jurisdictions.
Our oil and gas operations are subject to extensive laws and regulations that require, among other things, permits for the drilling and operation of wells and bonding and insurance to drill, operate and plug and abandon wells, and that regulate the safety of our pipelines. Our U.S. offshore operations in federal waters are subject to broad regulation by the BOEM and BSEE, which among other things must issue permits in connection with our exploration, drilling, development and production plans.
Exploration, production or development within the coastal zone or near-shore environment may be subject to additional environmental approvals. For example, in California, projects within the coastal zone may require a Coastal Development Permit from the California Coastal Commission or a local agency with delegated authority.
Many other governmental bodies regulate our onshore operations. Under certain circumstances, agencies may impose civil or criminal penalties and may suspend or terminate our operations. In addition, new laws and regulations or changes to existing laws and regulations and new interpretations of existing laws and regulations by courts or regulatory authorities occur regularly, but are difficult to predict. Any such variations could have a material adverse effect on our business and prospects.
State and federal environmental review processes, such as the National Environmental Policy Act, or in California, the California Environmental Quality Act, can add delays and litigation risks to entitlement approvals, as well provide opportunities for public involvement. Environmental review may restrict new development projects, require alternations to proposed projects, or require the imposition of environmental mitigation, all of which may cause additional delays or costs. Entitlement approvals and environmental review documents can be challenged in court, which can cause substantial delays and, if the litigation is successful, result in the loss of some or all entitlement approvals.
The EPA has also recently accelerated their review and audits of the Clean Water Act’s Underground Injection Control, which we refer to as UIC, program, delegated to and administered by states through memorandums of understanding. As a result of their audit findings, the EPA is requiring that certain states correct deficiencies and update their compliance programs. Those corrections could include potential temporary or permanent shut-in of injection wells if those states do not comply with EPA deadlines and/or injection wells are found to have been incorrectly permitted. Our operations include wells identified through the EPA audits, and should they be found to have been incorrectly permitted by the state, could result in shut-in production and loss of reserves.
In addition, our real estate entitlement efforts are subject to regulatory approvals. Some of these regulatory approvals are discretionary by nature. The entitlement approval process is often a lengthy and complex procedure requiring, among other things, the submission of development plans and reports and presentations at public
44
Table of Contents
Index to Financial Statements
hearings. Because of the provisional nature of these procedures and the concerns of various environmental and public interest groups, our ability to entitle and realize future income from our surface properties could be delayed, prevented or made more expensive.
More comprehensive and stringent regulation in the GOM in the aftermath of the Macondo well oil spill may result in increased costs and delays in offshore oil and gas exploration and production operations, which costs and delays may be significant.
Following an April 20, 2010 fire and explosion aboard the Deepwater Horizon drilling rig and resulting oil spill from the Macondo well operated by a third party in deep water in the GOM, there have been a series of regulatory initiatives developed and implemented at the federal level to address the direct impact of the incident and to prevent similar incidents in the future. Beginning in 2010 and continuing through the present, the U.S. Department of the Interior, which we refer to as DOI, through the BOEM and the BSEE, has issued a variety of regulations and Notices to Lessees and Operators, which we refer to as NTLs, intended to impose additional safety, permitting and certification requirements applicable to exploration, development and production activities in the GOM. Most recently, on April 17, 2015, the DOI published a proposed rule that would impose more stringent standards on blowout preventers. These regulatory initiatives effectively slowed down the pace of drilling and production operations in the GOM as adjustments were being made in operating procedures, certification requirements and lead times for inspections, drilling applications and permits, and exploration and production plan reviews, and as the federal agencies evolved into their present day bureaus.
In addition to the array of new or revised safety, permitting and certification requirements developed and implemented by the DOI in the past few years, there have been a variety of proposals to change existing laws and regulations that could affect offshore development and production, such as, for example, a proposal to significantly increase the minimum financial responsibility demonstration required under the Oil Pollution Act of 1990, which we refer to as OPA. OPA currently requires a minimum financial responsibility demonstration of $35 million for companies operating on the Outer Continental Shelf, which we refer to as the OCS, although the Secretary of Interior may increase this amount up to $150 million in certain situations. Also, in August 2014, the BOEM issued an Advanced Notice of Proposed Rulemaking which we refer to as ANPRM, on Risk Management, Financial Assurance, and Loss Prevention to seek public input as the agency considers modernizing its risk management program and financial assurance regulations for offshore oil and gas operations on the OCS. At this time, we cannot predict the outcome of this ANPRM, but any increase in the BOEM’s financial assurance requirements could have a significant impact on our operations. To the extent that the existing regulatory initiatives implemented and pursued over the past few years or any future restrictions, whether through legislative or regulatory means or increased or broadened permitting and enforcement programs, foster uncertainties or delays in our offshore oil and gas development or exploration activities, then such conditions may have a material adverse effect on our results of operations and financial position.
Derivatives laws and related regulations and other regulations could have an adverse effect on our ability to hedge risks associated with our business.
The Dodd-Frank Wall Street Reform and Consumer Protection Act, which we refer to as the Dodd-Frank Act, provides for federal oversight of the over-the-counter derivatives market and entities that participate in that market and mandates that the Commodity Futures Trading Commission, which we refer to as the CFTC, adopt rules or regulations implementing derivatives-related provisions of the Dodd-Frank Act and providing definitions of terms used in the Dodd-Frank Act. All of the derivative-related provisions of the Dodd-Frank Act and the mandated rules result in market participants conducting their derivatives operations differently than they have done in the past and may result in certain market participants needing to curtail or cease their derivatives activities.
The Dodd-Frank Act, which refers to regulated derivatives as “swaps,” requires swaps of certain classes designated by the CFTC to be cleared on a derivatives clearing organization unless exempt from such clearing requirement. Such clearing organizations must impose margin requirements on the cleared derivatives in accordance with the Dodd-Frank Act and applicable regulations.
45
Table of Contents
Index to Financial Statements
The Dodd-Frank Act also requires the CFTC and the federal banking regulators to adopt rules imposing margin requirements with respect to uncleared derivatives entered into by certain parties.
Although some of the rules necessary to implement the Dodd-Frank Act remain to be adopted, the CFTC has adopted a large number of rules to implement the Dodd-Frank Act, including a rule implementing an “end-user” exception to mandatory clearing established by the Dodd-Frank Act, referred to herein as the “End-User Exception,” and a rule imposing position limits, referred to herein as the Initial Position Limit Rule, which was vacated in 2012 in a federal court proceeding. The CFTC proposed a new version of the Initial Position Limit Rule in November 2013, referred to herein as the “Re-Proposed Position Limit Rule,” but a final rule has not been adopted.
The CFTC and bank regulators in September 2014 reproposed rules, referred to herein as the “Re-Proposed SD/MSP Margin Rules,” which would impose margin requirements on uncleared swaps between banks, swap dealers and major swap participants and between such an entity and financial end-users that are not swap dealers or major swap participants and requires banks to obtain collateral from commercial end-users with respect to derivatives in such amounts as the banks determine to be appropriate to address the credit risks relating to their counterparties and such derivatives. However, a recently enacted law provides that no margin requirements may be imposed on derivatives qualifying for the End-User Exception.
Federal banking regulators have adopted new capital requirements for certain regulated financial institutions in connection with the Basel III Accord. Once those requirements are fully implemented, if we enter into derivatives with financial institutions subject to those capital requirements, as a condition to their entry into such derivatives, such financial institutions could contractually require its counterparties to provide cash or other collateral with respect to our obligations under the derivatives to reduce the amount of capital the financial institutions may have to maintain with respect to such derivatives. In the alternative, the new capital requirements, once implemented, may cause the financial institutions to price transactions such that we will pay them a premium to enter into the derivatives in an amount that will compensate the financial institutions for their additional capital costs relating to such derivatives. Any requirement that we post collateral with respect to any derivatives to which we are a party could have a material adverse effect on our liquidity.
We qualify as a “non-financial entity” for purposes of the End-User Exception and we will likely utilize such exception in the future for derivatives we enter into to hedge our commercial risks so that any future hedging activity is not subject to mandatory clearing or the margin requirements imposed in connection with mandatory clearing. However, we anticipate that most if not all of our future hedge counterparties will be subject to mandatory clearing in connection with their hedging activities with parties who do not qualify for the End-User Exception and, if the Re-Proposed SD/MSP Margin Rules are adopted, will be subject to such rules and required to post margin in accordance with such rules in connection with their derivatives with other banks, swap dealers, major swap participants and financial end-users.
The Dodd-Frank Act, the rules mandated thereby that have been adopted and not vacated, the Re-Proposed Position Limit Rule and the Re-Proposed SD/MSP Margin Rules as they are ultimately adopted and the rules implementing the Basel III capital requirements could significantly increase the cost of derivative contracts and materially reduce our liquidity (including through requirements to post collateral), materially alter the terms of derivative contracts, reduce the availability of derivatives to protect against risks we encounter, reduce our ability to monetize or restructure our existing derivative contracts, and increase our exposure to less creditworthy counterparties. If we are limited in our use of derivatives in the future as a result of the Dodd-Frank Act and regulations, our results of operations may become more volatile and our cash flows may be less predictable, which could adversely affect our ability to plan for and fund capital expenditures. Finally, the Dodd-Frank Act was intended, in part, to reduce the volatility of oil and gas prices, which some legislators attributed to speculative trading in derivatives and commodity contracts related to oil and gas. Our revenues could therefore be adversely affected if a consequence of the Dodd-Frank Act and regulations is to lower commodity prices.
46
Table of Contents
Index to Financial Statements
Under the Dodd-Frank Act, the CFTC is also directed generally to prevent price manipulation and fraud in the market for: physical commodities traded in interstate commerce, including physical energy and other commodities, as well as the market for financial instruments, such as futures, options and swaps. Pursuant to the Dodd-Frank Act, the CFTC has adopted additional anti-market manipulation, anti-fraud and disruptive trading practices regulations prohibiting, among other things, fraud and price manipulation in the physical commodities, futures, options and swaps markets. The CFTC is developing its enforcement program under its new authorities under the Dodd Frank Act and at this time it is impossible to quantify the risks of potential enforcement action from the CFTC. Should we violate these laws and regulations, we could be subject to CFTC enforcement action and material penalties, and sanctions.
In addition to the Dodd-Frank Act, the European Union and other foreign regulators have adopted and are implementing local reforms generally comparable with the reforms under the Dodd-Frank Act. Implementation and enforcement of these regulatory provisions may reduce our ability to hedge our market risks with non-U.S. counterparties and may make transactions involving cross-border swaps more expensive and burdensome. Additionally, the lack of regulatory equivalency across jurisdictions may increase compliance costs and make it more difficult to satisfy our regulatory obligations.
If we fail to maintain proper and effective internal controls over financial reporting, our ability to produce accurate and timely financial statements could be impaired and investors’ views of us could be harmed.
After the completion of this offering, we will be a controlled subsidiary of FCX, which is already subject to the requirements of the Sarbanes-Oxley Act of 2002, which we refer to as the Sarbanes-Oxley Act. Under a Shared Services Agreement that we will enter into with FCX, FCX will provide legal, accounting and other services necessary for us to meet our regulatory obligations as a public company. If the Shared Services Agreement is terminated or not renewed, we will need to find a replacement service provider or provide such functions ourselves, which may increase the costs associated with meeting our public company reporting requirements. The Sarbanes-Oxley Act requires, among other things, that we maintain effective internal control over financial reporting and disclosure controls and procedures. One key aspect of the Sarbanes-Oxley Act is that we must perform system and process evaluation and testing of our internal control over financial reporting to allow management and our independent registered public accounting firm to report on the effectiveness of our internal control over financial reporting, as required by Section 404 of the Sarbanes-Oxley Act, with auditor attestation of the effectiveness of our internal controls, beginning with our annual report on Form 10-K for the fiscal year ending December 31, 2016. If we are not able to comply with the requirements of Section 404 in a timely manner, or if we or our independent registered public accounting firm identify deficiencies in our internal control over financial reporting that are deemed to be material weaknesses, the market price of our Class A common stock could decline and we could be subject to sanctions or investigations by the NYSE, the SEC or other regulatory authorities, which would require additional financial and management resources.
Our ability to successfully implement our business plan and comply with the Sarbanes-Oxley Act requires us to be able to prepare timely and accurate financial statements, among other requirements. Any delay in the implementation of, or disruption in the transition to, new or enhanced systems, procedures or controls, may cause our operations to suffer and we may be unable to conclude that our internal control over financial reporting is effective and to obtain an unqualified report on internal controls from our auditors. Moreover, we cannot be certain that these measures would ensure that we implement and maintain adequate controls over our financial processes and reporting in the future. Even if we were to conclude, and our independent registered public accounting firm were to concur, that our internal control over financial reporting provided reasonable assurance regarding the reliability of financial reporting and the preparation of financial statements for external purposes in accordance with GAAP, because of its inherent limitations, internal control over financial reporting may not prevent or detect fraud or misstatements. This, in turn, could have an adverse impact on the market price for our Class A common stock, and could adversely affect our ability to access the capital markets.
47
Table of Contents
Index to Financial Statements
Our business may be adversely affected by information technology disruptions.
Cybersecurity incidents are increasing in frequency, evolving in nature and include, but are not limited to, installation of malicious software, unauthorized access to data and other electronic security breaches that could lead to disruptions in systems, unauthorized release of confidential or otherwise protected information and the corruption of data. We have experienced cybersecurity incidents in the past and may experience them in the future. We believe we have implemented appropriate measures to mitigate potential risks. However, given the unpredictability of the timing, nature and scope of information technology disruptions, we could be subject to manipulation or improper use of our systems and networks or financial losses from remedial actions, any of which could have a material adverse effect on our financial condition and results of operations.
A terrorist attack or armed conflict could harm our business.
Terrorist activities, anti-terrorist efforts and other armed conflicts involving the United States or other countries may adversely affect the United States and global economies and could prevent us from meeting our financial and other obligations. If any of these events occur, the resulting political instability and societal disruption could reduce overall demand for oil and gas, potentially putting downward pressure on demand for our services and causing a reduction in our revenues. Oil and gas related facilities could be direct targets of terrorist attacks, and our operations could be adversely impacted if infrastructure integral to our customers’ operations is destroyed or damaged. Costs for insurance and other security may increase as a result of these threats, and some insurance coverage may become more difficult to obtain, if available at all.
Although we will be party to the Tax Matters Agreement with FCX under which our tax liabilities effectively may be determined as if we were not part of any consolidated, combined or unitary tax group of FCX and/or its subsidiaries, we nonetheless could be held liable for the tax liabilities of other members of these groups.
For so long as FCX continues to own at least 80 percent of the total voting power and value of our common stock, we and our subsidiaries will be included in FCX’s consolidated group for U.S. federal income tax purposes. In addition we and our subsidiaries may also be included in certain consolidated, combined or unitary groups that include FCX and/or certain of its subsidiaries for state and local income tax purposes. Under the Tax Matters Agreement, FCX will prepare pro forma federal income tax returns for us as if we and our subsidiaries filed our own consolidated return, except that while such pro forma federal income tax return generally will include current income, deductions, credits and losses from us (with certain exceptions), it will not include any carrybacks of losses or credits. We will be required to reimburse FCX for any taxes (including, if applicable, the federal alternative minimum tax) shown on the pro forma federal income tax returns as well as our allocable share of any tax liability with respect to any other consolidated, combined or unitary returns in which we (or any of our subsidiaries) are included and that also include FCX or any of its subsidiaries (excluding us and our subsidiaries). Our inclusion in FCX’s consolidated group may result in FCX utilizing certain tax attributes that we generate, including net operating losses and certain deductions relating to our oil and gas exploration activities, and we will receive no compensation from FCX for the use of such attributes. In addition, although FCX may use its tax attributes to cause FCX’s consolidated group to owe no tax, we are nevertheless required to reimburse FCX for any taxes shown on the pro forma federal income tax returns, even though FCX had no cash tax expense for that period.
Notwithstanding the Tax Matters Agreement, each member of a consolidated group for U.S. federal income tax purposes during any part of a consolidated return year is liable for the consolidated group’s entire tax liability for such year and for any subsequently determined deficiency thereon. Further, in some other jurisdictions, each member of a consolidated, combined or unitary group for state, local or foreign income tax purposes is jointly and severally liable for the state, local or foreign income tax liability of each other member of the consolidated, combined or unitary group. Accordingly, for any period in which we were included in the FCX consolidated group for U.S. federal income tax purposes or any other consolidated, combined or unitary group of FCX and/or its subsidiaries, we could be liable in the event that any income tax liability was incurred, but not discharged, by FCX or any other member of any such group.
48
Table of Contents
Index to Financial Statements
Proposed changes to U.S. tax laws, if adopted, could have an adverse effect on our business, financial condition, results of operations and cash flows.
From time to time legislative proposals are made that would, if enacted, make significant changes to U.S. tax laws. These proposed changes have included, among others, eliminating the immediate deduction for intangible drilling and development costs, eliminating the deduction from income for domestic production activities relating to oil and natural gas exploration and development, repealing the percentage depletion allowance for oil and natural gas properties and extending the amortization period for certain geological and geophysical expenditures. Such proposed changes in the U.S. tax laws, if adopted, or other similar changes that reduce or eliminate deductions currently available with respect to oil and natural gas exploration and development, could adversely affect our business, financial condition, results of operations and cash flows.
Risks Related to this Offering and Our Class A Common Stock
The dual-class structure of our common stock has the effect of concentrating voting control with holders of our Class B common stock and limiting your ability to influence corporate matters.
Our Class B common stock has five votes per share, and our Class A common stock, which is being offered in this initial public offering, has one vote per share. Upon completion of this offering, FCX will hold shares of Class B common stock, representing 100 percent of our total outstanding shares of Class B common stock and percent of the combined voting power of our outstanding common stock (or 100 percent and percent, respectively, if the underwriters’ option to purchase additional shares of Class A common stock from us is exercised in full).
Due to the 5-to-1 voting ratio between our Class B and Class A common stock, FCX will be able to determine the outcome of all matters requiring stockholder approval, including the ability to elect all of the members of our Board of Directors and thereby control our management and affairs, even when the shares of Class B common stock represent a small minority of all outstanding shares of our Class A and Class B common stock. This concentrated control will very significantly limit your ability to influence corporate matters for the foreseeable future, and, as a result, the market price of our Class A common stock could be materially and adversely affected.
The interests of our largest stockholder may conflict with those of our other stockholders.
In addition, we expect to enter into several agreements with FCX at the closing of this offering, including a stockholders agreement setting forth various matters governing our relationship with FCX while it remains a significant stockholder, including the right to designate directors for nomination and election to our Board of Directors and, so long as FCX owns shares representing at least percent of the outstanding voting power of all of our shares of common stock, the right to approve certain operational and corporate actions proposed to be taken by us. Accordingly, so long as FCX continues to own a significant amount of our common stock, even if such amount represents less than 50 percent of the aggregate voting power, FCX will be able to control or to exercise significant influence over our business and affairs. For a description of the stockholder agreements and other agreements we intend to enter into with FCX, see “Certain Relationships and Related Party Transactions.”
As a controlling or influential stockholder, FCX may have interests that differ from, or conflict with, the interests of our other stockholders. FCX may cause us to take certain actions or prevent us from taking certain actions if, in its judgment, doing so could enhance its investment in us or is otherwise in the interests of FCX, even if such actions or inactions might involve risks to us or adversely affect us or our public stockholders, including you. For example, FCX could delay or prevent an acquisition of us that our other stockholders, including you, may consider favorable, or could cause an acquisition of us to occur that our other stockholders, including you, may consider unfavorable. This could substantially impede the ability of public stockholders to benefit from a change in control or change our Board of Directors and management. FCX could also prevent us from taking certain operational or corporate actions that our management or Board of Directors believe are in our best interest.
49
Table of Contents
Index to Financial Statements
As a result, FCX’s position as a controlling or influential stockholder and its rights under its agreements with us may adversely affect the market price of our Class A common stock or your ability to realize any potential change of control premium. This concentration of stock ownership may also adversely affect the trading price of our Class A common stock to the extent investors perceive a disadvantage in owning stock of a company with a controlling or influential stockholder. We will not be able to terminate our agreements with FCX, or amend them in a manner we deem more favorable, except as otherwise agreed by FCX.
Restrictions in FCX’s credit facilities, uncommitted lines of credit and the indentures governing FCX’s debt securities could adversely affect our business, financial condition, results of operations, and value of our Class A common stock.
Due to our status as a controlled company and a “subsidiary” under the agreements governing FCX’s indebtedness, FCX has the ability to prevent us from taking actions that would cause FCX to violate any covenants in, or otherwise to be in default under, FCX’s $4.0 billion senior unsecured revolving credit facility (of which $985.0 million was outstanding at June 30, 2015) and FCX’s $4.0 billion senior unsecured term loan credit facility (of which $3.0 billion was outstanding at June 30, 2015), which we refer to collectively as the FCX Credit Facilities, FCX’s uncommitted, short-term lines of credit, which we refer to as the FCX Lines of Credit (of which $410.0 million was outstanding at June 30, 2015), or the indentures governing FCX’s debt securities, which we refer to as the FCX Indentures. In deciding whether to prevent us from taking any such action, FCX will have no fiduciary duty to us or our stockholders. Moreover, if we desire to take any action, to the extent such action would not be permitted under the FCX Credit Facilities, the FCX Lines of Credit or the FCX Indentures, FCX would be required to seek the consent of the lenders under the FCX Credit Facilities or the FCX Lines of Credit or the holders of FCX’s debt securities, as applicable. FCX’s compliance with the covenants in the FCX Credit Facilities, FCX Lines of Credit and FCX Indentures may restrict our ability to undertake certain actions that might otherwise be considered beneficial to us.
The operating and financial restrictions and covenants in the FCX Credit Facilities, FCX Lines of Credit and/or the FCX Indentures could limit our and our subsidiaries’ ability to, among other things:
| • | incur or guarantee additional debt; |
| • | incur certain liens or permit them to exist; |
| • | merge or consolidate with another company; |
| • | enter into certain sale and leaseback transactions; and |
| • | transfer, sell or otherwise dispose of assets or equity interests. |
The restrictions on incurring additional debt and/or liens could impact our ability to engage in certain transactions, including making distributions on stock, redeeming or repurchasing stock and making investments, acquisitions and capital expenditures.
Any debt instruments that FCX or any of its affiliates enter into in the future, including any amendments to the FCX Credit Facilities or FCX Lines of Credit or the issuance of any new series of debt securities under a new indenture or supplemental indenture, may include additional or more restrictive limitations that may impact our ability to conduct our business. These additional restrictions could adversely affect our ability to finance our future operations or capital needs or engage in, expand or pursue our business activities.
The FCX Credit Facilities contain covenants requiring the borrowers thereunder to maintain certain financial ratios. Their ability to meet those financial ratios and tests can be affected by events beyond our control, and we cannot assure you that they will meet those ratios and tests.
50
Table of Contents
Index to Financial Statements
In addition, the FCX Credit Facilities, the FCX Lines of Credit and/or the FCX Indentures contain events of default customary for transactions of their type, including:
| • | failure to make payments; |
| • | failure to comply with covenants; and |
| • | institution of insolvency or similar proceedings. |
The FCX Credit Facilities and/or FCX Lines of Credit contain additional customary events of default, including:
| • | failure to comply with financial ratios; |
| • | material judgments; |
| • | material violations of laws; |
| • | governmental appropriation of material assets; and |
| • | occurrence of a change of control. |
The provisions of the FCX Credit Facilities, the FCX Lines of Credit and the FCX Indentures may affect our ability to obtain future financing and pursue attractive business opportunities and our flexibility in planning for, and reacting to, changes in business conditions. In addition, a failure by FCX or its subsidiaries to comply with the provisions of the FCX Credit Facilities, the FCX Lines of Credit or the FCX Indentures could result in a default or an event of default that could enable FCX’s lenders or debt security holders to declare the outstanding principal of that debt, together with accrued and unpaid interest, to be immediately due and payable. If the payment of FCX’s debt is accelerated, its assets may be insufficient to repay such debt in full. As a result, even though we do not guarantee and none of our assets are pledged to back such FCX debt, we may lose access to financing from FCX and other sources, our results of operations could be materially and adversely affected and our stockholders could experience a partial or total loss of their investment.
Certain of our directors may have actual or potential conflicts of interest because of their positions with FCX.
Following this offering, James R. Moffett and James C. Flores will serve on our Board of Directors and retain their positions as senior executive officers and directors of FCX. In addition, each of these directors may own FCX common stock, options to purchase FCX common stock or other FCX equity awards, which may be significant for some of these persons. Their positions at FCX and the ownership of any FCX equity or equity awards create, or may create the appearance of, conflicts of interest when these directors are faced with decisions that could have different implications for FCX than the decisions have for us or our public stockholders, including you. Pursuant to its charter, our Audit Committee, as well as the Executive Committee of the Board of Directors of FCX, must review and approve all material related party transactions. See “Certain Relationships and Related Party Transactions—Policies and Procedures for Review of Related Party Transactions.”
If FCX sells a controlling interest in our company to a third party in a private transaction, you may not realize any change-of-control premium on shares of our Class A common stock and we may become subject to the control of a presently unknown third party.
Following the completion of this offering, FCX will own percent of our total outstanding shares of common stock and percent of the combined voting power of our Class A and Class B common stock (in each case assuming the underwriters’ option to purchase additional shares of Class A common stock from us is not exercised). FCX will have the ability, should it choose to do so, to sell some or all of its shares of our common stock in a privately negotiated transaction, which, if sufficient in size, could result in a change of control of our company. The ability of FCX to privately sell its shares of our common stock, with no requirement for a concurrent offer to be made to acquire all of the shares of our common stock that will be publicly traded
51
Table of Contents
Index to Financial Statements
hereafter, could prevent you from realizing any change-of-control premium on your shares of our Class A common stock that may otherwise accrue to FCX upon its private sale of our common stock. Additionally, if FCX privately sells its significant equity interest in our company, we may become subject to the control of a presently unknown third party. Such third party may have conflicts of interest with those of public stockholders, including you. However, FCX has agreed, subject to certain exceptions, not to dispose of or hedge any shares of our common stock for a period of days from the date of this prospectus.
We expect to be a “controlled company” within the meaning of the NYSE rules and, as a result, will qualify for, and intend to rely on, exemptions from certain corporate governance requirements.
Following the completion of this offering, FCX will own percent of the total voting power of our Class A and Class B common stock. As a result, we expect to qualify as a “controlled company” within the meaning of the NYSE corporate governance standards. Under the NYSE rules, a company of which more than 50 percent of the voting power for the election of directors is held by an individual, group or another company is a “controlled company” and may elect not to comply with certain NYSE corporate governance requirements, including:
| • | the requirement that a majority of our Board of Directors consist of independent directors; |
| • | the requirement that we have a nominating and corporate governance committee that is composed entirely of independent directors with a written charter addressing the committee’s purpose and responsibilities; |
| • | the requirement that we have a compensation committee that is composed entirely of independent directors with a written charter addressing the committee’s purpose and responsibilities; and |
| • | the requirement for an annual performance evaluation of the nominating and corporate governance and compensation committees. |
Following this offering, we intend to take advantage of certain of these exemptions. As a result, we will not have a majority of independent directors nor will our Nominating and Corporate Governance and Compensation Committees consist entirely of independent directors, and we will not be required to have an annual performance evaluation of the Nominating and Corporate Governance and Compensation Committees. See “Management—Composition of Our Board of Directors.” Accordingly, you will not have the same protections afforded to stockholders of companies that are subject to such corporate governance requirements.
The corporate opportunity provisions in our amended and restated certificate of incorporation could enable FCX to benefit from corporate opportunities that might otherwise be available to us.
Subject to the limitations of applicable law, our amended and restated certificate of incorporation, among other things:
| • | permits us to enter into transactions with entities in which one or more of our officers or directors are financially or otherwise interested; |
| • | permits FCX and our officers or directors who are affiliated with FCX to conduct business that competes with us and to make investments in any kind of property in which we may make investments; and |
| • | provides that if any director or officer of FCX who is also one of our officers or directors becomes aware of a potential business opportunity, transaction or other matter (other than one expressly offered to that director or officer in writing solely in his or her capacity as our director or officer), that director or officer will have no duty to communicate or offer that opportunity to us, and will be permitted to communicate or offer that opportunity to such affiliates and we will waive any claim against that director or officer and shall indemnify that director or officer against any claim that such director or officer is liable to us or our stockholders for breach of his or her fiduciary duties. |
52
Table of Contents
Index to Financial Statements
As a result, FCX or its affiliates may become aware, from time to time, of certain business opportunities, such as acquisition opportunities, and may direct such opportunities to other businesses in which they have invested, in which case we may not become aware of or otherwise have the ability to pursue such opportunity. Further, such businesses may choose to compete with us for these opportunities. As a result, our renouncing our interest and expectancy in any business opportunity that may be from time to time presented to FCX or its affiliates could adversely impact our business or prospects if attractive business opportunities are procured by such parties for their own benefit rather than for ours. See “Description of Capital Stock.”
We have engaged in transactions with our affiliates and expect to do so in the future. The terms of such transactions and the resolution of any conflicts that may arise may not always be in our or our stockholders’ best interests.
We have engaged in transactions and expect to continue to engage in transactions with affiliated companies, as described under the caption “Certain Relationships and Related Party Transactions.” The resolution of any conflicts that may arise in connection with any related party transactions that we have entered into with FCX or its affiliates, including pricing, duration or other terms of service, may not always be in our or our stockholders’ best interests because FCX may have the ability to influence the outcome of these conflicts. For a discussion of potential conflicts, see “—The interests of our largest stockholder may conflict with those of our other stockholders.”
We will incur increased costs as a result of being a public company, which may significantly affect our financial condition.
As a public company, we will incur significant legal, accounting and other expenses that we did not incur as a private company to meet related reporting requirements. We also anticipate that we will incur costs associated with corporate governance requirements, including requirements under the Sarbanes-Oxley Act, as well as rules implemented by the SEC and the Financial Industry Regulatory Authority. We expect these rules and regulations to increase our legal and financial compliance costs and to make some activities more time-consuming and costly. Under the Shared Services Agreement that we expect to enter into with FCX at the closing of this offering, FCX will provide legal, accounting and other services necessary for us to meet our regulatory obligations as a public company. If the Shared Services Agreement is terminated or not renewed, we will need to find a replacement service provider or provide such functions ourselves, which may increase the costs associated with meeting our public company reporting requirements.
We expect to incur additional expenses and devote additional management effort toward ensuring compliance with Section 404 of the Sarbanes-Oxley Act. See “—Risks Related to Our Business—If we fail to maintain proper and effective internal controls over financial reporting, our ability to produce accurate and timely financial statements could be impaired and investors’ views of us could be harmed.”
There has been no public market for our Class A common stock, and if the price of our Class A common stock fluctuates significantly, your investment could lose value.
Prior to this offering, there has been no public market for our Class A common stock. Although we intend to apply to list our Class A common stock on the NYSE, an active public market may not develop for our Class A common stock or our Class A common stock may not trade in the public market subsequent to this offering at or above the initial public offering price. If an active public market for our Class A common stock does not develop, the stock price and liquidity of our Class A common stock will be materially and adversely affected. If there is a thin trading market or “float” for our Class A common stock, the market price for our Class A common stock may fluctuate significantly more than the stock market as a whole. Without a large float, our Class A common stock is less liquid than the stock of companies with broader public ownership and, as a result, the stock price of our Class A common stock may be more volatile. In addition, in the absence of an active public trading market, investors may be unable to liquidate their investment in us. The initial offering price, which will be negotiated
53
Table of Contents
Index to Financial Statements
between us and the underwriters, may not be indicative of the stock price for our Class A common stock after this offering. In addition, the stock market is subject to significant price and volume fluctuations, and the price of our Class A common stock could fluctuate widely in response to several factors, including:
| • | our quarterly or annual operating results; |
| • | changes in our earnings estimates; |
| • | investment recommendations by securities analysts following our business or our industry; |
| • | additions or departures of key personnel; |
| • | changes in the business, earnings estimates or market perceptions of our competitors; |
| • | our failure to achieve operating results consistent with securities analysts’ projections; |
| • | changes in industry, general market or economic conditions; and |
| • | announcements of legislative or regulatory change. |
The stock market has experienced extreme price and volume fluctuations in recent years that have significantly affected the quoted prices of the securities of many companies, including companies in our industry. The changes often appear to occur without regard to specific operating performance. The price of our Class A common stock could fluctuate based upon factors that have little or nothing to do with our company and these fluctuations could materially reduce our stock price.
Future sales of our Class A common stock, or the perception that such future sales may occur, may cause our stock price to decline.
Sales of substantial amounts of our Class A common stock in the public market after this offering, or the perception that these sales may occur, could cause the market price of our Class A common stock to decline. See “Shares Eligible for Future Sale.” In addition, the sale of these shares could impair our ability to raise capital through the sale of additional common or preferred stock. After this offering, we will have shares of Class A common stock outstanding, excluding awards under the Freeport-McMoRan Oil & Gas Inc. 2015 Incentive Award Plan that are exchangeable for shares of our Class A common stock (or shares if the underwriters’ option to purchase additional shares of Class A common stock from us is exercised in full). All of the shares sold in this offering, except for any shares purchased by our affiliates, will be freely tradable.
FCX and our directors and executive officers will be subject to agreements that limit their ability to sell our common stock held by them. These holders cannot sell or otherwise dispose of any shares for a period of at least days after the date of this prospectus without the prior written approval of Barclays Capital Inc. However, these lock-up agreements are subject to certain specific exceptions, including transfers of common stock as a bona fide gift or by will or intestate succession and transfers to such person’s immediate family or to a trust or to an entity controlled by such holder, provided that the recipient of the shares agrees to be bound by the same restrictions on sales. Furthermore, Barclays Capital Inc. at any time and without notice, may release all or any portion of the common stock subject to the foregoing lock-up agreements. In the event that one or more of our stockholders sells a substantial amount of our Class A common stock in the public market, or the market perceives that such sales may occur, the price of our Class A common stock could decline.
We cannot predict the size of future issuances of shares of our Class A common stock or the effect, if any, that future issuances and sales of shares of our Class A common stock will have on the market price of our Class A common stock. Sales of substantial amounts of our Class A common stock (including shares issued in connection with an acquisition), or the perception that such sales could occur, may adversely affect prevailing market prices of our Class A common stock.
54
Table of Contents
Index to Financial Statements
If securities or industry analysts do not publish research or reports about our business, if they adversely change their recommendations regarding our Class A common stock or if our operating results do not meet their expectations, our stock price could decline.
The trading market for our Class A common stock will be influenced by the research and reports that industry or securities analysts publish about us or our business. If one or more of these analysts cease coverage of our company or fail to publish reports on us regularly, we could lose visibility in the financial markets, which in turn could cause our stock price or trading volume to decline. Moreover, if one or more of the analysts who cover our company downgrades our Class A common stock or if our operating results do not meet their expectations, our stock price could decline.
Purchasers in this offering will experience immediate dilution.
The initial public offering price is substantially higher than the pro forma net tangible book value per share of our outstanding Class A common stock. As a result, you will experience immediate and substantial dilution of $ per share, representing the difference between our net tangible book value per share as of December 31, 2014 after giving effect to this offering at the initial public offering price of $ per share. See “Dilution.”
We may issue preferred stock, the terms of which could adversely affect the voting power or value of our Class A common stock.
Our amended and restated certificate of incorporation authorizes us to issue, without the approval of our stockholders, one or more classes or series of preferred stock having such designations, preferences, limitations and relative rights, including preferences over our common stock respecting dividends and distributions, as our Board of Directors may determine. The terms of one or more classes or series of preferred stock could adversely impact the voting power or value of our Class A common stock. For example, we might grant holders of preferred stock the right to elect some number of our directors in all events or on the happening of specified events or the right to veto specified transactions. Similarly, the repurchase or redemption rights or liquidation preferences we might assign to holders of preferred stock could affect the residual value of the Class A common stock.
Anti-takeover provisions in our charter documents and Delaware law may make an acquisition of us more difficult.
Anti-takeover provisions in our charter documents and Delaware law may make an acquisition of us more difficult. These provisions:
| • | authorize our Board of Directors to issue preferred stock without stockholder approval and to designate the rights, preferences and privileges of each class; if issued, such preferred stock would increase the number of outstanding shares of our capital stock and could include terms that may deter an acquisition of us; |
| • | establish advance notice requirements for nominations to the Board of Directors or for proposals that can be presented at stockholder meetings; |
| • | upon FCX holding less than 50 percent of the combined voting power of our outstanding common stock, limit removal of directors for cause only; |
| • | limit who may call stockholder meetings; and |
| • | upon FCX holding less than 50 percent of the combined voting power of our outstanding common stock, require the approval of the holders of two thirds of the voting power of our outstanding common stock to enter into certain business combination transactions, subject to certain exceptions, including if the consideration to be received by our common stockholders in the transaction is deemed to be a fair price. |
55
Table of Contents
Index to Financial Statements
These provisions may discourage potential takeover attempts, discourage bids for our Class A common stock at a premium over market price or adversely affect the market price of, and the voting and other rights of the holders of, our Class A common stock. These provisions could also discourage proxy contests and make it more difficult for stockholders to elect directors other than the candidates nominated by the Board of Directors.
In addition, because we are incorporated in Delaware, we are governed by the provisions of Section 203 of the Delaware General Corporation Law, which may prohibit large stockholders from consummating a merger with, or acquisition of, us.
These provisions may deter an acquisition of us that might otherwise be attractive to stockholders.
We do not intend to pay cash dividends on our Class A common stock in the foreseeable future, and therefore only appreciation of the price of our Class A common stock will provide a return to our stockholders.
We anticipate that we will retain all future earnings, if any, to finance the growth and development of our business. We do not intend to pay cash dividends in the foreseeable future. Any future determination as to the declaration and payment of cash dividends will be at the discretion of our Board of Directors and will depend upon our financial condition, results of operations, contractual restrictions, capital requirements, business prospects and other factors deemed relevant by our Board of Directors. As a result, only appreciation of the price of our Class A common stock, which may not occur, will provide a return to our stockholders.
56
Table of Contents
Index to Financial Statements
CAUTIONARY NOTE REGARDING FORWARD-LOOKING STATEMENTS
The information in this prospectus includes forward-looking statements. All statements, other than statements of historical fact included in this prospectus, regarding our strategy, future operations, financial position, estimated revenues and losses, projected costs and capital expenditures, prospects, plans and objectives of management are forward-looking statements. Words such as “may,” “assume,” “forecast,” “position,” “predict,” “possible,” “probable,” “strategy,” “expect,” “intend,” “plan,” “estimate,” “anticipate,” “believe,” “project,” “budget,” “potential,” or “continue,” and similar expressions are used to identify forward-looking statements, although not all forward-looking statements contain such identifying words. These forward-looking statements are based on our current expectations and assumptions about future events and are based on currently available information as to the outcome and timing of future events. You should not place undue reliance on these forward-looking statements. When considering these forward-looking statements, you should keep in mind the risk factors described under the heading “Risk Factors” and other cautionary statements in this prospectus. You should also understand that it is not possible to predict or identify all such factors and should not consider the following list to be a complete statement of all potential risks and uncertainties.
Forward-looking statements may include statements about:
| • | our business strategy; |
| • | our estimated reserves and the present value thereof; |
| • | our technology; |
| • | our cash flows and liquidity; |
| • | our financial strategy, budget, projections and future operating results; |
| • | realized commodity prices; |
| • | timing and amount of future production of reserves; |
| • | availability of drilling and production equipment; |
| • | availability of pipeline capacity; |
| • | availability of oilfield labor; |
| • | the amount, nature and timing of capital expenditures, including future development costs; |
| • | availability and terms of capital; |
| • | drilling of wells; |
| • | government regulations; |
| • | marketing of production; |
| • | exploitation or property acquisitions; |
| • | costs of exploiting and developing our properties and conducting other operations; |
| • | general economic and business conditions; |
| • | competition in the oil and gas industry; |
| • | effectiveness of our risk management activities; |
| • | environmental and other liabilities; |
| • | counterparty credit risk; |
| • | taxation of the oil and gas industry; |
57
Table of Contents
Index to Financial Statements
| • | developments in other countries that produce oil and gas; |
| • | uncertainty regarding future operating results; |
| • | plans and objectives of management or FCX; and |
| • | plans, objectives, expectations and intentions contained in this prospectus that are not historical. |
Although we believe that our plans, intentions and expectations reflected in or suggested by the forward-looking statements we make in this prospectus are reasonable, we can give no assurance that these plans, intentions or expectations will be achieved when anticipated or at all. We disclose important factors that could cause our actual results to differ materially from our expectations under “Risk Factors” and “Management’s Discussion and Analysis of Financial Condition and Results of Operations” and elsewhere in this prospectus. These factors include, but are not limited to risks related to:
| • | variations in the market demand for, and prices of, oil, gas and NGLs, including recent substantial declines in oil and gas prices; |
| • | uncertainties about our estimated reserves and prospects; |
| • | the adequacy of our capital resources and liquidity including; |
| • | general economic and business conditions; |
| • | risks associated with negative developments in the capital markets; |
| • | failure to realize expected value creation from property acquisitions; |
| • | the outcome of litigation or unforeseen liabilities arising therefrom; |
| • | uncertainties about our ability to replace reserves and economically develop our current reserves; |
| • | drilling results; |
| • | risks associated with offshore and international drilling; |
| • | potential financial losses or earnings reductions from our commodity price risk management programs; |
| • | potential adoption of new governmental regulations; |
| • | cybersecurity and terrorist attacks; |
| • | the availability of capital on economic terms to fund our capital expenditures and acquisitions; and |
| • | our ability to satisfy future cash obligations and environmental costs. |
All forward-looking statements, expressed or implied, included in this prospectus are expressly qualified in their entirety by this cautionary statement. This cautionary statement should also be considered in connection with any subsequent written or oral forward-looking statements that we or persons acting on our behalf may issue.
All forward-looking statements speak only as of the date of this prospectus and we undertake no obligation to publicly update any forward-looking statement whether as a result of new information, future developments or otherwise.
58
Table of Contents
Index to Financial Statements
We expect to receive net proceeds of $ million from this offering, after deducting the underwriters’ discounts and commissions and estimated offering expenses. If the underwriters exercise their option to purchase additional shares of Class A common stock from us in full, the net proceeds from this exercise, after deducting underwriters’ discounts and commissions and estimated offering expenses, will be $ million. We plan to use the net proceeds from this offering to fund the remainder of our 2015 capital budget and portions of our 2016 capital budget as set forth in “Prospectus Summary—Our 2015 Capital Budget” and “Prospectus Summary—Our 2016 Capital Budget.” If our 2015 or 2016 capital budgets are reduced or cash flow exceeds our estimates, then we will use the remainder of the net proceeds of this offering for general corporate purposes. Our Board of Directors will retain broad discretion over the allocation of the net proceeds from this offering.
We do not anticipate declaring or paying any cash dividends to holders of our Class A or Class B common stock in the foreseeable future. Our future dividend policy is within the discretion of our Board of Directors and will depend upon various factors, including our results of operations, financial condition, capital requirements and investment opportunities.
59
Table of Contents
Index to Financial Statements
Purchasers of our Class A common stock in this offering will experience immediate and substantial dilution in the net tangible book value per share of the Class A common stock for accounting purposes. Our net tangible book value (tangible assets less total liabilities) as of June 30, 2015, after giving pro forma effect to the transactions described under “Corporate Reorganization,” was approximately $ million, or $ per share of Class A common stock. Pro forma net tangible book value per share is determined by dividing our pro forma net tangible book value by our shares of Class A common stock that will be outstanding immediately prior to the closing of this offering, including giving effect to the reorganization transactions described under “Corporate Reorganization.” After giving effect to the sale of the shares in this offering and the receipt of the estimated net proceeds (after deducting underwriting discounts and commissions and estimated offering expenses), our adjusted pro forma net tangible book value as of would have been approximately $ million, or $ per share. This represents an immediate increase in the net tangible book value of $ per share to our existing stockholders and an immediate dilution to new investors purchasing shares in this offering of $ per share, resulting from the difference between the offering price and the pro forma as adjusted net tangible book value after this offering. The following table illustrates the per share dilution to new investors purchasing shares in this offering:
| Initial public offering price per share |
$ | |||
| Pro forma net tangible book value per share as of (after giving effect to our corporate reorganization) |
$ | |||
| Increase per share attributable to new investors in the offering |
||||
| As adjusted pro forma net tangible book value per share (after giving effect to our corporate reorganization and this offering) |
||||
|
|
|
|||
| Dilution in pro forma net tangible book value per share to new investors in this offering |
$ | |||
|
|
|
The following table sets forth, on an as adjusted pro forma basis as of , the number of shares of Class A common stock held by our existing stockholders immediately prior to the closing of this offering, and to be held by the new investors at the initial public offering price of $ per share, together with the total consideration paid and average price per share paid or to be paid by each of these groups, before deducting underwriting discounts and commissions and estimated offering expenses:
| Shares Acquired(1) |
Total Consideration | Average Price Per Share | ||||||||||||||
| Number | % | Amount | % | |||||||||||||
| (in thousands) | ||||||||||||||||
| Existing stockholders |
$ | |||||||||||||||
| New investors |
||||||||||||||||
| Total |
100.0 | $ | 100.0 | |||||||||||||
|
|
|
|
|
|
|
|
| |||||||||
| (1) | The data in the table excludes shares of Class A common stock initially reserved for issuance under the Freeport-McMoRan Oil & Gas Inc. 2015 Incentive Award Plan. |
If the underwriters’ option to purchase additional shares of Class A common stock from us is exercised in full, the number of shares held by new investors will be increased to , or approximately percent of our outstanding shares of Class A common stock.
60
Table of Contents
Index to Financial Statements
The following table sets forth our cash and capitalization as of June 30, 2015:
| • | on an actual basis; and |
| • | as adjusted to give effect to our corporate reorganization as described under “Corporate Reorganization,” which will be completed in conjunction with this offering (and which will result in the elimination of our revolving notes and other long-term debt, including our senior notes), and the sale of shares of our Class A common stock in this offering and our receipt of an estimated $ million of net proceeds from this offering after deducting underwriting discounts and commissions and estimated offering expenses. |
You should read the following table in conjunction with “Use of Proceeds,” “Management’s Discussion and Analysis of Financial Condition and Results of Operations” and our consolidated financial statements and related notes contained elsewhere in this prospectus.
| Actual | As Adjusted | |||||||
| (in thousands except share data) | ||||||||
| Cash and cash equivalents |
$ | 6,575 | $ | |||||
|
|
|
|
|
|||||
| Long-term debt |
$ | 8,470,050 | $ | — | ||||
|
|
|
|
|
|||||
| Stockholders’ equity: |
||||||||
| Preferred stock, $0.01 par value; shares authorized (as adjusted); no shares issued and outstanding (as adjusted) |
— | |||||||
| Common stock, $0.01 par value, 1,000 shares issued and outstanding (actual) |
— | |||||||
| Class A common stock, $0.01 par value; shares authorized (as adjusted); shares issued and outstanding (as adjusted)(1) |
— | |||||||
| Class B common stock; $0.01 par value; shares authorized (as adjusted); shares issued and outstanding (as adjusted) |
— | |||||||
| Additional paid-in capital |
11,174,825 | |||||||
| Accumulated deficit |
(7,884,806 | ) | ||||||
| Accumulated other comprehensive income |
327 | |||||||
|
|
|
|
|
|||||
| Total stockholders’ equity |
3,290,346 | |||||||
|
|
|
|
|
|||||
| Total capitalization |
$ | 11,760,396 | $ | |||||
|
|
|
|
|
|||||
| (1) | Assumes no exercise of the underwriters’ option to purchase additional shares of Class A common stock from us. |
61
Table of Contents
Index to Financial Statements
SELECTED HISTORICAL CONSOLIDATED FINANCIAL DATA
On May 31, 2013, FCX acquired PXP, which we refer to as the Predecessor, through a merger into FM O&G LLC. On June 3, 2013, FCX acquired McMoRan, which became a wholly owned subsidiary of FCX O&G, which we refer to as the Successor. The below selected historical consolidated financial data as of and for the six months ended June 30, 2015, for the six months ended June 30, 2014, as of and for the year ended December 31, 2014, as of December 31, 2013, and for the period from April 23, 2013, to December 31, 2013, relates to the Successor. The results included in the selected historical consolidated financial data for the period from April 23, 2013, to December 31, 2013, include PXP’s results beginning June 1, 2013, and McMoRan’s results beginning June 4, 2013. The Successor’s oil and gas operations commenced on June 1, 2013. The below selected historical consolidated financial data for the period from January 1, 2013, to May 31, 2013, and as of and for the years ended December 31, 2012, 2011 and 2010, relate to the Predecessor.
The selected historical consolidated statements of operations data and statements of cash flow data for the six months ended June 30, 2015 and 2014, and the selected historical consolidated balance sheet data as of June 30, 2015, were derived from the unaudited consolidated financial statements of the Successor included elsewhere in this prospectus. These statements have been prepared on a basis consistent with the audited consolidated financial statements of the Successor. In the opinion of management, such unaudited financial data reflects all adjustments, consisting only of normal and recurring adjustments, necessary for a fair presentation of the results for such period. The results of operations for the interim periods are not necessarily indicative of the results to be expected for the full year or any future period.
The selected historical consolidated statements of operations data and statements of cash flow data for the year ended December 31, 2014, and for the period from April 23, 2013, to December 31, 2013, and the selected historical consolidated balance sheet data as of December 31, 2014 and 2013, were derived from the audited consolidated financial statements of the Successor included elsewhere in this prospectus.
The selected historical consolidated statements of operations data and statements of cash flow data for the period from January 1, 2013, to May 31, 2013, and for the year ended December 31, 2012 were derived from the audited consolidated financial statements of the Predecessor included elsewhere in this prospectus.
The selected historical consolidated statements of operations data, statements of cash flow data for the years ended December 31, 2011 and 2010, and the selected historical consolidated balance sheet data as of December 31, 2012, 2011 and 2010, were derived from the audited consolidated financial statements of the Predecessor not included in this prospectus.
62
Table of Contents
Index to Financial Statements
You should read the following table in conjunction with “Use of Proceeds,” “Management’s Discussion and Analysis of Financial Condition and Results of Operations,” “Corporate Reorganization” and the historical consolidated financial statements and notes.
| FCX O&G (Successor) | PXP (Predecessor) | |||||||||||||||||||||||||||||||
| As of and for the Six Months Ended June 30, 2015 |
For the Six Months Ended June 30, 2014 |
As of and for the Year Ended December 31, 2014 |
April 23 to and as of December 31, 2013(1) |
January 1 to May 31, 2013 |
As of and for the Year Ended December 31, | |||||||||||||||||||||||||||
| 2012 | 2011 | 2010 | ||||||||||||||||||||||||||||||
| (unaudited) | ||||||||||||||||||||||||||||||||
| (in thousands, except outstanding shares) |
(in thousands, except earnings per share) | |||||||||||||||||||||||||||||||
| Statement of operations data |
||||||||||||||||||||||||||||||||
| Revenues(2) |
$ | 1,068,588 | $ | 2,496,998 | $ | 4,709,706 | $ | 2,615,966 | $ | 2,041,802 | $ | 2,565,307 | $ | 1,964,488 | $ | 1,544,595 | ||||||||||||||||
| (Loss) income from operations(2)(3) |
(6,400,590 | ) | 508,351 | (4,479,725 | ) | 450,137 | 627,837 | 615,657 | 590,549 | 358,216 | ||||||||||||||||||||||
| Net (loss) income |
(4,432,758 | ) | 178,685 | (3,569,611 | ) | 199,475 | 274,523 | 342,787 | 206,679 | 103,265 | ||||||||||||||||||||||
| Net (loss) income attributable to common stockholders(4) |
(4,453,060 | ) | 158,925 | (3,609,437 | ) | 177,691 | 256,152 | 306,420 | 205,279 | 103,265 | ||||||||||||||||||||||
| (Loss) earnings per common share |
||||||||||||||||||||||||||||||||
| Basic |
(40,482 | ) | 1,589 | (34,375 | ) | 1,776 | 1.96 | 2.36 | 1.45 | 0.74 | ||||||||||||||||||||||
| Diluted |
(40,482 | ) | 1,589 | (34,375 | ) | 1,776 | 1.93 | 2.32 | 1.44 | 0.73 | ||||||||||||||||||||||
| Weighted-average common shares outstanding |
||||||||||||||||||||||||||||||||
| Basic |
110 | 100 | 105 | 100 | 130,522 | 129,925 | 141,227 | 140,438 | ||||||||||||||||||||||||
| Diluted |
110 | 100 | 105 | 100 | 132,818 | 131,867 | 142,999 | 141,897 | ||||||||||||||||||||||||
| Statement of cash flow data |
||||||||||||||||||||||||||||||||
| Net cash provided by operating activities |
$ | 535,076 | $ | 1,579,160 | $ | 2,452,676 | $ | 1,815,502 | $ | 1,296,430 | $ | 1,330,791 | $ | 1,110,755 | $ | 912,470 | ||||||||||||||||
| Net cash (used in) provided by investing activities(5) |
(1,833,911 | ) | 246,452 | (1,667,577 | ) | (1,381,491 | ) | (889,128 | ) | (7,703,255 | ) | (1,154,591 | ) | (1,575,308 | ) | |||||||||||||||||
| Net cash provided by (used in) financing activities |
1,303,294 | (1,825,067 | ) | (783,854 | ) | (433,140 | ) | (272,805 | ) | 6,133,931 | 456,500 | 667,413 | ||||||||||||||||||||
| Balance sheet data |
||||||||||||||||||||||||||||||||
| Cash and cash equivalents |
$ | 6,575 | $ | 2,116 | $ | 871 | $ | 180,565 | $ | 419,098 | $ | 6,434 | ||||||||||||||||||||
| Total assets |
15,453,132 | 20,854,002 | 26,397,709 | 17,298,283 | 9,791,472 | 8,894,937 | ||||||||||||||||||||||||||
| Long-term debt |
8,470,050 | 7,156,610 | 10,113,320 | 9,979,369 | 3,760,952 | 3,344,717 | ||||||||||||||||||||||||||
| Total equity |
3,290,346 | 7,733,764 | 9,301,699 | 3,956,441 | 3,695,232 | 3,382,965 | ||||||||||||||||||||||||||
| Other financial data |
||||||||||||||||||||||||||||||||
| Adjusted EBITDA(6) |
$ | 609,895 | $ | 1,756,365 | $ | 2,723,459 | $ | 2,151,636 | $ | 1,538,450 | $ | 1,823,613 | $ | 1,220,902 | $ | 935,971 | ||||||||||||||||
| Development |
672,615 | 642,220 | 1,270,123 | 854,209 | 498,641 | 829,090 | 708,519 | 363,242 | ||||||||||||||||||||||||
| (1) | Oil and gas operations began June 1, 2013. |
| (2) | The Successor consolidated financial statements present mark-to-market gains (losses) on derivative contracts of $58.0 million and ($120.3) million for the six months ended June 30, 2015 and 2014, respectively, $504.4 million for the year ended December 31, 2014, and ($334.2) million for the period from April 23, 2013, to December 31, 2013, in revenues. The Predecessor consolidated financial statements present net mark-to-market (losses) gains on derivative contracts of ($24.7) million for the period from January 1, 2013, to May 31, 2013, and ($2.9) million, $82.0 million and ($60.7) million for the years ended December 31, 2012, 2011 and 2010, respectively, as a component of other expense (income). |
| (3) | Includes impairment charges of $5.8 billion and $3.7 billion for the six months ended June 30, 2015, and the year ended December 31, 2014, respectively, relating to ceiling test impairment charges for our oil and gas properties pursuant to full cost accounting rules. Also, includes an additional impairment charge of $1.7 billion for the year ended December 31, 2014, to fully impair goodwill. |
| (4) | Includes net income attributable to noncontrolling interest in the form of preferred stock of subsidiary. |
| (5) | Includes net proceeds provided by the divestment of our Eagle Ford shale assets of $3.0 billion and $2.9 billion for the six months ended June 30, 2014, and twelve months ended December 31, 2014, respectively. Includes net cash used for the acquisition of certain Deepwater GOM interests of $0.9 billion and $1.4 billion for the six months ended June 30, 2014, and twelve months ended December 31, 2014, respectively. Includes net cash used for the acquisition of interests in the Deepwater GOM of $5.9 billion for the year ended December 31, 2012. |
| (6) | Adjusted EBITDA is a non-GAAP financial measure. For a definition of Adjusted EBITDA and a reconciliation to net (loss) income attributable to common stockholders, see “—Non-GAAP Financial Measures.” |
| (7) | Development costs are incurred to obtain access to proved reserves and to provide facilities for extracting, treating, gathering and storing the oil and gas. |
63
Table of Contents
Index to Financial Statements
MANAGEMENT’S DISCUSSION AND ANALYSIS OF FINANCIAL CONDITION AND
RESULTS OF OPERATIONS
In Management’s Discussion and Analysis of Financial Condition and Results of Operations, “we,” “us,” “our” and “FCX O&G” refer to FCX Oil & Gas Inc. and its subsidiaries on a consolidated basis before the completion of our corporate reorganization prior to the closing of this offering, and Freeport-McMoRan Oil & Gas Inc. and its subsidiaries on a consolidated basis after completion of our corporate reorganization.
The following discussion analyzes the results of operations and financial condition of FCX O&G. You should read this discussion in conjunction with the audited historical consolidated financial statements and the unaudited historical consolidated financial statements, and the notes thereto, included elsewhere in this prospectus. This discussion and analysis contains forward-looking statements that involve risks and uncertainties. The results of operations reported and summarized below are not necessarily indicative of and could differ materially from future operating results. See “Cautionary Note Regarding Forward-Looking Statements.” Factors that could cause or contribute to such differences include, but are not limited to, those identified below and those discussed in the section entitled “Risk Factors” included elsewhere in this prospectus.
FCX O&G was incorporated on April 23, 2013, and is a wholly owned subsidiary of Freeport-McMoRan Inc., which we refer to as FCX. FCX O&G is the sole member of Freeport-McMoRan Oil & Gas LLC, which we refer to as FM O&G LLC. On May 31, 2013, FCX acquired Plains Exploration & Production Company, which we refer to as the Predecessor or PXP, through the merger of PXP into FM O&G LLC. On June 3, 2013, FCX acquired McMoRan Exploration Co., which we refer to as McMoRan, which became a wholly owned subsidiary of FM O&G LLC. Our oil and gas operations commenced on June 1, 2013.
Except where noted, the discussion of the results of operations for the period from January 1, 2012, through May 31, 2013, relates to the Predecessor and the discussion of the results of operations for the period from June 1, 2013, through June 30, 2015, relates to the Successor, which includes PXP beginning June 1, 2013, and McMoRan beginning June 4, 2013. The Predecessor’s assets and liabilities are recorded on a historical cost basis, whereas the Successor’s assets and liabilities were recorded at their acquisition-date fair values. References to audited historical financial statements refer to the audited financial statements of FCX O&G (Successor) for the year ended December 31, 2014, and the period from April 23, 2013, to December 31, 2013, unless otherwise noted.
We are an upstream oil and gas energy company primarily engaged in acquiring, exploring for, developing and producing oil and gas properties. We are focused on growing our strategic position in the Deepwater U.S. Gulf of Mexico, which we refer to as the Deepwater GOM. Our Deepwater GOM position has significant current oil production, strong cash margins and existing infrastructure with excess production and handling capacity. In addition to our extensive inventory of drilling opportunities, we believe our existing infrastructure provides us with a competitive advantage by allowing for accelerated development and production using subsea tiebacks at an accelerated pace and on a cost-effective basis when compared to competitors who lack access to such facilities. In addition, our onshore and offshore properties in California are characterized as low-decline properties with stable production and long-lived reserves. We also have a large, onshore gas position in the Haynesville shale and the Inboard Lower Tertiary/Cretaceous gas trend located onshore in South Louisiana. Our Madden field in Central Wyoming also provides us with additional predictable cash flows, low-decline production and long-lived gas reserves. Our gas-weighted assets position us to benefit from a recovery in gas prices. We are currently focused on growing our proved reserves and production by developing our oil-weighted properties in the Deepwater GOM.
We believe our portfolio of oil and gas properties delivers financially attractive investment opportunities with significant growth potential in terms of production, cash margin and reserves. For the first six months of
64
Table of Contents
Index to Financial Statements
2015, 88 percent of our oil and gas revenues, excluding the impact of derivative contracts, was from oil and NGLs. Our oil and gas business has significant proved, probable and possible reserves and a broad range of additional development opportunities, including discoveries and identified prospects in the Deepwater GOM. A significant portion of our planned capital expenditures will be focused on converting our probable and possible reserves and prospective resources to the proved reserves category. We manage our business to reinvest cash flows in projects with attractive rates of return and risk profiles.
Our results for the first six months of 2015, and the year ended December 31, 2014, were impacted by lower price realizations, ceiling test impairment charges pursuant to full cost accounting rules and lower oil volumes primarily associated with the June 2014 sale of the Eagle Ford shale properties. Additionally, our results for the year ended December 31, 2014, included a goodwill impairment charge. See “—Summary Financial Data” for further discussion of our results.
In June 2014, FCX O&G completed the sale of its Eagle Ford shale properties for net cash proceeds of $2.9 billion and the acquisition of Deepwater GOM interests for $0.9 billion, including interests in the Lucius and Heidelberg oil fields and several exploration leases. In September 2014, we acquired additional Deepwater GOM interests for $0.5 billion, including an 18.67 percent interest in the Vito oil discovery and a significant nearby lease position. See Note 2 to our audited historical financial statements included elsewhere in this prospectus for further discussion of these transactions.
At June 30, 2015, we had $8.5 billion in total debt and have taken actions to reduce or defer capital expenditures in response to market conditions. We are deferring investments in several long-term projects, which will result in a reduction of $0.9 billion in projected capital expenditures for each of the years 2016 and 2017. We have also revised our estimate of the start-up of initial production from our recent drilling success in the Horn Mountain area to 2016, from the previously estimated start-up in 2017. The revised operating plan will allow us to continue to grow production and enhance cash flow in a weak oil and gas price environment. After giving effect to our corporate reorganization we will have no debt. See “—Capital Resources and Liquidity” for further discussion.
Our financial results vary as a result of fluctuations in market prices of oil, primarily, and to a lesser extent, gas and NGLs, as well as other factors. World market prices have fluctuated historically and are affected by numerous factors beyond our control. Because we cannot control the price of our products, the key measures that management focuses on in operating our business are sales volumes, cash production costs per barrel of oil equivalent, which we refer to as Boe, and consolidated operating cash flow.
We view the long-term outlook for our business positively, supported by the historical demand for oil in the world’s economy. For the year ended December 31, 2015, sales volumes are expected to total 52.9 MMBoe compared to 56.8 MMBoe for the year ended December 31, 2014. The change is primarily due to the sale of the Eagle Ford shale properties which contributed 8.7 MMBoe for the year ended December 31, 2014, partially offset by production from our Lucius field in 2015. Projected sales volumes are dependent on a number of factors, including operational performance.
Based on current sales volume and cost estimates, our cash production costs, a non-GAAP measure, are expected to approximate $20 per Boe for the year ended December 31, 2015, compared to $20.08 per Boe in the year ended December 31, 2014. See “—Summary Operating Results” for further discussion of oil and gas production costs per Boe.
Our operating cash flows will vary with prices realized from oil sales, our sales volumes, production costs, income taxes, other working capital changes and other factors. Based on current sales volume and cost estimates and assuming average prices of $56 per barrel of Brent crude oil for the remaining six months of 2015, we estimate our consolidated operating cash flows for the year ended December 31, 2015, to approximate $1.1 billion. The impact of a $5 per barrel change in the average Brent crude oil price on operating cash flows for the remaining six months of 2015 would be approximately $85 million.
65
Table of Contents
Index to Financial Statements
Second-Quarter and First Six Months of 2015, Compared to Second-Quarter and First Six Months of 2014.
| FCX O&G (Successor) | ||||||||||||||||
| Three Months Ended June 30, |
Six Months Ended June 30, |
|||||||||||||||
| 2015 | 2014(1) | 2015 | 2014(1) | |||||||||||||
| (in thousands) | ||||||||||||||||
| Summary Statement of Operations Data: |
||||||||||||||||
| Oil and gas sales revenues, excluding derivatives |
$ | 554,523 | $ | 1,305,706 | $ | 1,001,765 | $ | 2,616,048 | ||||||||
| Gain (loss) on derivative contracts(2) |
6,227 | (70,167 | ) | 58,047 | (120,276 | ) | ||||||||||
| Impairment of oil and gas properties |
2,683,234 | — | 5,787,415 | — | ||||||||||||
| Net (loss) income attributable to common stockholder |
(2,217,387 | ) | 46,093 | (4,453,060 | ) | 158,925 | ||||||||||
| (1) | Summary financial data for the three and six months ended June 30, 2014, includes results from our Eagle Ford shale properties which were sold June 19, 2014. |
| (2) | In connection with FCX’s 2013 acquisition of PXP, we have crude oil option contracts for 2015 and had crude oil and gas contracts for 2014 that were not designated as hedging instruments. Accordingly, the contracts are recorded at fair value with the mark-to-market gains and losses recorded each period. Included in the gain (loss) on derivative contracts are noncash mark-to-market gains (losses) totaling ($95.1) million in second-quarter 2015, ($7.1) million in second-quarter 2014, ($143.5) million in the first six months of 2015, and $7.5 million in the first six months of 2014. |
Oil and Gas Revenues. Oil and gas revenues, excluding derivative contracts, totaled $554.5 million in second-quarter 2015 and $1.0 billion in the first six months of 2015, compared to $1.3 billion in second-quarter 2014 and $2.6 billion in the first six months of 2014. The decrease in revenues in second-quarter 2015 compared to second-quarter 2014 was primarily due to lower price realizations ($580.3 million) and lower volumes ($170.9 million). The decrease in revenues in the first six months of 2015 compared to the first six months of 2014 was primarily due to lower price realizations ($1.3 billion) and lower volumes ($331.5 million).
Oil and gas price realizations, excluding cash gains (losses) on derivative contracts, of $42.31 per Boe in second-quarter 2015 and $39.08 per Boe in the first six months of 2015, compared to $81.47 per Boe in second-quarter 2014 and $81.34 per Boe in the first six months of 2014, primarily reflected lower oil prices. Oil price realizations, excluding cash gains (losses) on derivative contracts, decreased $44.64 per barrel in second-quarter 2015 compared to second-quarter 2014 and decreased $49.29 per barrel in the first six months of 2015 compared to the first six months of 2014. Additionally, oil and gas sales volumes decreased to 13.1 MMBoe in second-quarter 2015, compared to 16.0 MMBoe in second-quarter 2014. Oil and gas sales decreased to 25.6 MMBoe in the first six months of 2015, compared to 32.2 MMBoe in the first six months of 2014. The decreases in sales volumes were primarily due to the sale of the Eagle Ford properties which contributed 4.0 MMBoe in second-quarter 2014 and 8.7 MMBoe in the first six months of 2014, partially offset by increases in the Deepwater GOM volumes of 0.5 MMBoe in second-quarter 2015 and 0.8 MMBoe in the first six months of 2015. See “—Summary Operating Results” for further discussion of our sales volumes and average price realizations.
Production Costs. Production costs were $282.0 million in second-quarter 2015 and $564.6 million in the first six months of 2015, compared to $328.9 million in second-quarter 2014 and $640.1 million in the first six months of 2014. Lower production costs in second-quarter 2015 compared to the same period in 2014 was primarily due to lower sales volumes as a result of the sale of our Eagle Ford shale properties, which had production costs of $52.4 million in second-quarter 2014. Lower production costs in the first six months of 2015 when compared to the same period in 2014 was primarily due to lower sales volumes as a result of the sale of Eagle Ford shale properties, which had production costs of $112.8 million in the first six months of 2014, partially offset by higher production costs in the GOM of $47.5 million due to higher volumes. See “—Summary Operating Results” for further discussion of oil and gas production costs per Boe.
66
Table of Contents
Index to Financial Statements
Depreciation, Depletion and Amortization. DD&A will vary under the unit-of-production method, which we refer to as the UOP method, as a result of changes in sales volumes and the related UOP rates which are primarily impacted by changes to estimates of proved reserves. Lower DD&A of $484.7 million in second-quarter 2015 and $1.0 billion in the first six months of 2015, compared to $615.4 million in second-quarter 2014 and $1.2 billion in the first six months of 2014, was primarily due to lower volumes following the sale of our Eagle Ford shale properties in second-quarter 2014. Our DD&A rate per Boe was $36.98 in second-quarter 2015 and $39.58 in the first six months of 2015 compared to $38.39 per Boe in second-quarter 2014 and $38.30 in the first six months of 2014.
Impairment of Oil and Gas Properties. Under full cost accounting rules, a “ceiling test” is conducted each quarter to review the carrying value of our oil and gas properties for impairment. As of June 30, 2015, net capitalized costs with respect to FCX O&G’s proved U.S. oil and gas properties exceeded the related ceiling limitation, which resulted in the recognition of an impairment charge of $2.7 billion in second-quarter 2015. Impairment charges in the first six months of 2015 were $5.8 billion. As of March 31, 2014 and June 30, 2014, the ceiling with respect to our domestic oil and gas properties exceeded the net capitalized costs and we did not record an impairment. See “—Critical Accounting Policies and Estimates” for further discussion.
General and Administrative Expense. General and administrative expense totaled $48.4 million in second-quarter 2015 and $102.5 million in the first six months of 2015, compared to $59.9 million in second-quarter 2014 and $116.7 million in the first six months of 2014. General and administrative expense excludes capitalized general and administrative expense totaling $38.3 million in second-quarter 2015 and $70.8 million in the first six months of 2015, compared to $39.7 million in second-quarter 2014 and $74.2 million in the first six months of 2014.
Interest Expense, Net. Lower interest expense, before capitalized interest, of $61.3 million in second-quarter 2015 and $118.8 million in the first six months of 2015, compared to $96.7 million in second-quarter 2014 and $197.8 million in the first six months of 2014, primarily reflects redemptions of several of our senior notes. Replacement of borrowings under our senior notes with borrowings under our revolving notes with FCX has reduced the weighted-average interest rate on our average debt outstanding in second-quarter 2015 and first six months of 2015. Capitalized interest relates to the level of expenditures for our exploration projects and average interest rates on our borrowings, and totaled $13.8 million in second-quarter 2015 and $33.9 million in the first six months of 2015, compared to $23.1 million in second-quarter 2014 and $47.8 million in the first six months of 2014.
Provision for Income Taxes. Our taxable income or loss is included in the consolidated U.S. federal income tax returns filed by FCX. We had not entered into a tax sharing agreement with FCX as of June 30, 2015. The estimated annual effective tax rate and related income tax obligations reflected in these statements are calculated using the separate return method, under which income taxes are calculated as if FCX O&G was filing its own separate tax return. As a result, certain net operating losses (and other tax attributes) are characterized as realized or generated by FCX O&G when the tax attributes may or may not have been utilized or generated in the consolidated FCX tax return.
Income tax (benefit) expense during interim periods is based on the estimated annual effective income tax rate plus any significant unusual or infrequently occurring items, which are recorded in the period that the specific item occurs. Our effective tax rate was 32 percent (benefit) of pre-tax loss in the first six months of 2015 and 52 percent (expense) of pre-tax income in the first six months of 2014.
The variance in our effective tax rate for the first six months of 2015, from the 35 percent U.S. federal statutory rate resulted from federal and state net operating loss valuation allowances, established as a result of the ceiling test impairment, partially offset by the estimated tax benefit of state income taxes. Additionally, the income tax benefit for the first six months of 2015 included a deferred tax benefit of $2.2 billion related to the ceiling test impairments.
67
Table of Contents
Index to Financial Statements
The variance in our effective tax rate in the first six months of 2014, from the 35 percent U.S. federal statutory rate resulted primarily from the estimated tax effects of permanent differences including (i) deferred tax expense recorded in connection with the allocation of $220.8 million of goodwill (for which deferred taxes were not previously provided) to the Eagle Ford shale assets and (ii) state income taxes partially offset by the domestic production activities deduction.
Year Ended December 31, 2014, and Seven-Month Period Ending December 31, 2013, Representing the Successor Periods; and Five-Month Period Ending May 31, 2013, and Year Ended December 31, 2012, Representing the Predecessor Periods.
| FCX O&G (Successor) |
|
PXP (Predecessor) | ||||||||||||||||
| Year Ended December 31, 2014(1) |
April 23 to December 31, 2013(2) |
|
January 1 to May 31, 2013 |
Year Ended December 31, 2012 |
||||||||||||||
| (in thousands) | ||||||||||||||||||
| Summary Statement of Operations Data: |
||||||||||||||||||
| Oil and gas sales revenues, excluding derivatives |
$ | 4,202,184 | $ | 2,948,676 | $ | 2,039,656 | $ | 2,558,363 | ||||||||||
| Gain (loss) on derivative contracts(3) |
504,357 | (334,202 | ) | (24,688 | ) | (2,879 | ) | |||||||||||
| Impairment of oil and gas properties |
3,737,281 | — | — | — | ||||||||||||||
| Goodwill impairment |
1,716,571 | — | — | — | ||||||||||||||
| Net (loss) income attributable to common stockholder(s) |
(3,609,437 | ) | 177,691 | 256,152 | 306,420 | |||||||||||||
| (1) | Summary financial data includes results from our Eagle Ford shale properties through June 19, 2014. |
| (2) | Oil and gas operations began June 1, 2013. |
| (3) | In connection with FCX’s 2013 acquisition of PXP, we had derivative contracts that are not designated as hedging instruments, and were recorded at fair value with the mark-to-market gains and losses recorded each period. The gains and losses on derivative contracts were recorded in revenues for the Successor periods, and as a component of other expense (income) for the Predecessor periods. Included in the net gain (loss) on derivative contracts are noncash mark-to-market gains (losses) totaling $626.7 million for the year ended December 31, 2014, ($312.3) million for the period from June 1, 2013, to December 31, 2013, ($8.8) million for the period from January 1, 2013, to May 31, 2013, and ($50.6) million for the year ended December 31, 2012. |
(Successor Periods) Year Ended December 31, 2014, Compared to Seven-month Period Ended December 31, 2013.
Oil and Gas Revenues. Oil and gas revenues, excluding derivatives contracts, totaled $4.2 billion in the year ended December 31, 2014, and $2.9 billion in the seven-month period ended December 31, 2013. Revenues increased approximately $1.3 billion for the year ended December 31, 2014, compared to the seven-month period ending December 31, 2013, primarily due to a full year of volumes being included for a $1.4 billion increase in revenues, partially offset by lower realized oil and gas prices which decreased revenues $132.1 million.
Oil and gas sales volumes totaled 56.8 MMBoe (156 MBoe/d) for the year ended December 31, 2014, and 38.1 MMBoe (178 MBoe/d) for the seven-month period ended December 31, 2013. The increase in sales volumes was primarily due to the additional five months of activity included in the December 31, 2014, results, however, volumes per day decreased for the year ended December 31, 2014, primarily due to the sale of the Eagle Ford shale properties.
Oil and gas realizations, excluding cash (losses) gains on derivative contracts, were $73.98 per Boe for the year ended December 31, 2014, and $77.45 per Boe for the seven-month period ended December 31, 2013. The decrease in oil and gas realizations was primarily due to lower oil prices.
See “—Summary Operating Results” for further discussion of our sales volumes and average realizations.
68
Table of Contents
Index to Financial Statements
Production Costs. Production costs totaled $1.2 billion in the year ended December 31, 2014, and $682.4 million in the seven-month period ended December 31, 2013. The increase in production costs was primarily due to the additional five months of activity included in the December 31, 2014 results. See “—Summary Operating Results” for further discussion of production costs per Boe.
Depreciation, Depletion and Amortization. DD&A of $2.3 billion in the year ended December 31, 2014, compared to $1.4 billion in the seven-month period ended December 31, 2013. The increase in DD&A of $0.9 billion in the year ended December 31, 2014, compared to the seven-month period ended December 31, 2013, was the result of more production days resulting in increased volumes, with an impact of $0.7 billion, and the increased rate with an impact of $0.2 billion. DD&A will vary under the UOP method as a result of changes in sales volumes and the related UOP rates which are primarily impacted by changes to estimates of proved reserves. A higher DD&A rate per Boe of $40.34 for the year ended December 31, 2014, compared to $35.81 per Boe for the seven-month period ended December 31, 2013, was due in part to higher capitalized costs and lower proved reserves.
Impairment of Oil and Gas Properties. Under full cost accounting rules, a “ceiling test” is conducted quarterly to review the carrying value of the oil and gas properties for impairment. At September 30, 2014, and December 31, 2014, net capitalized costs with respect to FCX O&G’s proved U.S. oil and gas properties exceeded the related ceiling limitation, which resulted in the recognition of impairment charges totaling $3.7 billion in the year ended December 31, 2014. As of December 31, 2013, the ceiling with respect to our domestic oil and gas properties exceeded the net capitalized costs and we did not record an impairment during the seven-month period ended December 31, 2013. See “—Critical Accounting Policies and Estimates” for further discussion.
General and Administrative Expense. Higher general and administrative expense of $207.8 million in the year ended December 31, 2014, compared with $119.8 million in the seven-month period ended December 31, 2013, primarily reflected an additional five months of expense for the December 31, 2014 results. General and administrative expense exclude capitalized general and administrative expense totaling $143.0 million of the year ended December 31, 2014, and $67.1 million for the seven-month period ended December 31, 2013.
Goodwill Impairment. We performed a goodwill assessment as of December 31, 2014, which resulted in an impairment charge of $1.7 billion for the full carrying value of goodwill. See “—Critical Accounting Policies and Estimates” for further discussion.
Interest Expense, Net. Higher interest expense, before capitalized interest, of $334.8 million in the year ended December 31, 2014, compared with $253.3 million in the seven-month period ended December 31, 2013, primarily reflected an additional five months of interest expense for the December 31, 2014 results, partially offset by lower expense as a result of the full and partial redemptions of several of our senior notes, which were primarily funded by contributions from FCX.
Capitalized interest relates to the level of expenditures for our exploration projects and average interest rates on our borrowings, and totaled $93.6 million in the year ended December 31, 2014, and $72.6 million in the seven-month period ended December 31, 2013.
69
Table of Contents
Index to Financial Statements
Provision for Income Taxes. Set forth below is a reconciliation between the income tax provision computed at the U.S. federal statutory rate to the effective tax rate for the year ended December 31, 2014, and for the seven-month period ended December 31, 2013:
| FCX O&G (Successor) | ||||||||||||||||
| Year Ended December 31, 2014 |
April 23, 2013, to December 31, 2013(1) |
|||||||||||||||
| (in thousands, except percentages) | Amount | Percent | Amount | Percent | ||||||||||||
| U.S. federal statutory tax rate |
$ | (1,622,425 | ) | 35 | % | $ | 100,423 | 35 | % | |||||||
| State income taxes, net of federal benefit |
(127,474 | )(2) | 3 | (12,442 | )(3) | (4 | ) | |||||||||
| Goodwill impairment |
600,800 | (13 | ) | — | — | |||||||||||
| Proceeds from sale of Eagle Ford shale assets charged to goodwill |
77,270 | (2 | ) | — | — | |||||||||||
| Other items, net |
5,941 | — | (534 | ) | (1 | ) | ||||||||||
|
|
|
|
|
|
|
|
|
|||||||||
| Income tax (benefit) expense on (loss) income before income taxes |
$ | (1,065,888 | ) | 23 | % | $ | 87,447 | 30 | % | |||||||
|
|
|
|
|
|
|
|
|
|||||||||
| (1) | Oil and gas operations began June 1, 2013. |
| (2) | Includes a net benefit of $56.7 million related to changes in U.S. state income tax filing positions. |
| (3) | Includes a net benefit of $16.3 million related to the revaluation of state deferred tax liabilities as a result of FCX’s acquisition of McMoRan. |
See Note 10 to our audited historical financial statements included elsewhere in this prospectus for further discussion of income taxes.
(Predecessor Periods) Five-month Period Ended May 31, 2013, Compared to Year Ended December 31, 2012.
Oil and Gas Revenues. Lower oil and gas revenues, excluding derivative contracts, totaled $2.0 billion in the five-month period ended May 31, 2013, compared to $2.6 billion in the year ended December 31, 2012, primarily reflected fewer production days partially offset by higher price realizations.
Oil and gas sales volumes totaled 25.3 MMBoe (167 MBoe/d) for the five-month period ended May 31, 2013, and 38.9 MMBoe (106 MBoe/d) for the year ended December 31, 2012. The decrease in sales volumes was primarily due to a full year of activity included in the December 31, 2012 results, however, volumes per day increased for the five-month period ended May 31, 2013, primarily due to increased sales volumes associated with PXP’s fourth-quarter 2012 Deepwater GOM acquisitions which were 59 MBoe/d for the five-month period ended May 31, 2013, compared to 6 MBoe/d for the year ended December 31, 2012.
Oil and gas realizations, excluding cash (losses) gains on derivative contracts, were $80.77 per Boe for the five-month period ended May 31, 2013, and $65.79 per Boe for the year ended December 31, 2012. The increase in realized prices was primarily due to proportionately higher oil sales volumes for the five-month period ended May 31, 2013 as a result of PXP’s fourth-quarter 2012 Deepwater GOM acquisitions.
See “—Summary Operating Results” for further discussion of our sales volumes and average realizations.
Production Costs. For comparative purposes, production costs for the Predecessor periods have been presented on a consistent basis with production costs for the Successor periods and include operating costs and expenses reported in the consolidated financial statements of the Predecessor (which are included elsewhere in this prospectus), excluding DD&A, general and administrative expense and acquisition and merger related costs. Production costs totaled $431.2 million in the five-month period ended May 31, 2013, and $649.4 million in the year ended December 31, 2012.
Lower production costs primarily reflected a full year of activity for December 31, 2012. See “—Summary Operating Results” for further discussion of production costs per Boe.
70
Table of Contents
Index to Financial Statements
Depreciation, Depletion and Amortization. DD&A totaled $873.4 million in the five-month Predecessor period ended May 31, 2013, and $1.1 billion in the year ended December 31, 2012. DD&A will vary under the UOP method as a result of changes in sales volumes and the related UOP rates which are primarily impacted by changes to estimates of proved reserves. A higher DD&A rate per Boe of $34.59 for the five-month period ended May 31, 2013, compared with $28.32 per Boe for the year ended December 31, 2012, was primarily due to higher capitalized costs.
General and Administrative Expense. General and administrative expense, including acquisition and merger related costs, totaled $109.4 million in the five-month period ended May 31, 2013, and $199.2 million in the year ended December 31, 2012. Lower general and administrative expense primarily reflected a full year of activity for the year ended December 31, 2012. Results for the five-month period ended May 31, 2013, included acquisition and merger related costs totaling $36.3 million associated with FCX’s 2013 acquisition of PXP and the year ended December 31, 2012, include $42.2 million in acquisition and merger related costs from PXP’s fourth-quarter 2012 Deepwater GOM acquisitions.
General and administrative expense excludes capitalized general and administrative expense totaling $46.4 million for the five-month period ended May 31, 2013, and $93.5 million for the year ended December 31, 2012.
Interest Expense, Net. Interest expense, before capitalized interest, totaled $244.1 million in the five-month period ended May 31, 2013, and $348.8 million in the year ended December 31, 2012. Lower interest expense for the five-month period ended May 31, 2013, primarily reflects a full year of activity for the year ended December 31, 2012, partially offset by additional interest expense from the term loans and senior notes that were issued for PXP’s fourth-quarter 2012 Deepwater GOM acquisitions.
Capitalized interest is related to the level of expenditures for our exploration projects and average interest rates on our borrowings, and totaled $11.7 million in the five-month period ended May 31, 2013, and $51.2 million in the year ended December 31, 2012.
Net Loss on Early Extinguishment of Debt. Net losses on early extinguishment of debt totaled $18.1 million in the five-month period ended May 31, 2013, and $8.4 million in the year ended December 31, 2012, related to redemptions of senior notes.
Investment in McMoRan. Prior to June 3, 2013, PXP owned 51.0 million shares of McMoRan common stock and was deemed to exercise significant influence over the operating and investing policies of McMoRan, but did not have control. PXP elected to measure its equity investment in McMoRan at fair value, and recognized gains of $29.9 million in the five-month period ended May 31, 2013, and $206.6 million in the year ended December 31, 2012, which were primarily associated with an increase in McMoRan’s stock price subsequent to the announcement of FCX’s acquisition of McMoRan.
Provision for Income Taxes. Set forth below is a reconciliation between the income tax provision computed at the U.S. federal statutory rate to the effective tax rate for the five-month period ended May 31, 2013, and for the year ended December 31, 2012:
| PXP (Predecessor) | ||||||||||||||||
| January 1, 2013, to May 31, 2013 |
Year Ended December 31, 2012 |
|||||||||||||||
| (in thousands, except percentages) | Amount | Percent | Amount | Percent | ||||||||||||
| U.S. federal statutory tax rate |
$ | 134,064 | 35 | % | $ | 179,933 | 35 | % | ||||||||
| State income taxes, net of federal benefit |
(32,118 | )(1) | (8 | ) | (25,305 | )(2) | (5 | ) | ||||||||
| Non-deductible expenses |
990 | — | 14,852 | 3 | ||||||||||||
| Other items, net |
5,580 | 1 | 1,830 | — | ||||||||||||
|
|
|
|
|
|
|
|
|
|||||||||
| Income tax expense on income before income taxes |
$ | 108,516 | 28 | % | $ | 171,310 | 33 | % | ||||||||
|
|
|
|
|
|
|
|
|
|||||||||
71
Table of Contents
Index to Financial Statements
| (1) | Includes a net benefit of $45.2 million related to changes in U.S. state income tax apportionment factors as a result of the termination of a tax partnership. |
| (2) | Includes a net benefit of $31.5 million related to changes in U.S. state income tax apportionment factors as a result of PXP’s 2012 Deepwater GOM acquisitions. |
See Note 11 to the PXP audited historical financial statements included elsewhere in this prospectus for further discussion of income taxes.
Second-Quarter and First Six Months of 2015, Compared to Second-Quarter and First Six Months of 2014.
| FCX O&G (Successor) | ||||||||||||||||
| Three Months Ended June 30, |
Six Months Ended June 30, |
|||||||||||||||
| 2015 | 2014 | 2015 | 2014 | |||||||||||||
| Sales Volumes |
||||||||||||||||
| Oil (MBbls) |
8,599 | 11,674 | 16,971 | 23,453 | ||||||||||||
| Gas (MMcf) |
23,534 | 20,303 | 45,301 | 39,782 | ||||||||||||
| NGLs (MBbls) |
586 | 969 | 1,110 | 2,076 | ||||||||||||
| MBoe |
13,107 | 16,028 | (1) | 25,632 | 32,160 | (1) | ||||||||||
| Daily Average Volumes |
||||||||||||||||
| Oil (MBbls/d) |
94.5 | 128.3 | 93.8 | 129.6 | ||||||||||||
| Gas (MMcf/d) |
258.6 | 223.1 | 250.3 | 219.8 | ||||||||||||
| NGLs (MBbls/d) |
6.4 | 10.7 | 6.1 | 11.5 | ||||||||||||
| Average Realizations(2) |
||||||||||||||||
| Oil (per barrel) |
$ | 67.61 | $ | 95.50 | $ | 62.13 | $ | 94.63 | ||||||||
| Gas (per MMBtu) |
2.66 | 4.44 | 2.75 | 4.55 | ||||||||||||
| NGLs (per barrel) |
20.50 | 38.79 | 21.71 | 42.35 | ||||||||||||
| Gross (Loss) Profit per Boe |
||||||||||||||||
| Realized revenues(2) |
$ | 50.04 | $ | 77.53 | $ | 46.95 | $ | 77.37 | ||||||||
| Less cash production costs(2) |
19.04 | 19.57 | (1) | 19.62 | 19.03 | (1) | ||||||||||
|
|
|
|
|
|
|
|
|
|||||||||
| Cash operating margin(2) |
31.00 | 57.96 | 27.33 | 58.34 | ||||||||||||
| Less: depreciation, depletion and amortization |
36.98 | 38.39 | 39.58 | 38.30 | ||||||||||||
| Less: impairment of oil and gas properties |
204.72 | — | 225.79 | — | ||||||||||||
| Less: accretion and other operating expense |
2.46 | 0.94 | 2.39 | 0.87 | ||||||||||||
| Plus: net noncash mark-to-market (losses) gains on derivative contracts |
(7.26 | ) | (0.44 | ) | (5.60 | ) | 0.23 | |||||||||
| Plus: other operating revenues |
0.61 | 0.04 | 0.34 | 0.04 | ||||||||||||
|
|
|
|
|
|
|
|
|
|||||||||
| Gross (loss) profit |
$ | (219.81 | ) | $ | 18.23 | $ | (245.69 | ) | $ | 19.44 | ||||||
|
|
|
|
|
|
|
|
|
|||||||||
| (1) | Summary operating results in second-quarter 2014 and the first six months of 2014, include 3,959 MBoe and 8,694 MBoe, respectively, from our Eagle Ford shale properties that were sold in June 2014. Excluding costs associated with the Eagle Ford shale properties, cash production costs were $21.66 per Boe in second-quarter 2014 and $21.29 per Boe in the first six months of 2014.. |
| (2) | Cash operating margin, a non-GAAP measure, reflects realized revenues less cash production costs. Realized revenues exclude noncash mark-to-market adjustments on derivative contracts. For reconciliations of realized revenues and cash production costs per Boe to revenues and production costs reported in our financial statements, see “—Product Revenues and Cash Production Costs.” |
In second-quarter 2015, FCX O&G’s average realized price for crude oil was $67.61 per barrel, including $11.79 per barrel of cash gains on derivative contracts, compared to $95.50 per barrel, including ($4.96) per barrel of cash losses on derivative contracts in second-quarter 2014. Excluding the impact of derivative contracts, second-quarter 2015 average realized price for crude oil was $55.82 per barrel (88 percent of the average Brent crude oil price of $63.57 per barrel) compared to $100.46 per barrel in second-quarter 2014 (92 percent of the average Brent crude oil price of $109.73 per barrel).
72
Table of Contents
Index to Financial Statements
The increase in average crude oil differentials in second-quarter 2015 compared to second-quarter 2014 was primarily due to lower realized prices received on California production. Average realized prices received for California oil sales were approximately 77 percent of Brent for second-quarter 2015 compared to 88 percent of Brent for second-quarter 2014.
In the first six months of 2015, FCX O&G’s average realized price for crude oil was $62.13 per barrel, including $11.88 per barrel of cash gains on derivative contracts, compared to $94.63 per barrel, including ($4.91) per barrel in cash losses on derivative contracts in the first six months of 2014. Excluding the impact of derivative contracts, average realized price for crude oil was $50.25 per barrel in the first six months of 2015 (85 percent of the average Brent crude oil price of $59.41 per barrel), compared to $99.54 per barrel in the first six months of 2014 (91 percent of the average Brent crude oil price of $108.79 per barrel).
The increase in average crude oil differentials for the first six months of 2015 compared to the first six months of 2014 was primarily due to lower realized prices received on California and GOM production. Average realized prices received for California and GOM oil sales were approximately 74 and 87 percent of Brent, respectively, in the first six months of 2015 compared to 91 and 96 percent of Brent for the first six months of 2014, respectively.
The Brent crude oil price is used as a reference price against actual realized prices which are ultimately determined by sales contracts in place at various production locations. These sales contracts typically consider local market conditions, delivery points and quality of oil in their pricing and as a result, there can be fluctuations in differentials between Brent pricing and realized pricing. At this time we do not believe these variances will have a material effect on our sales, revenues or income.
FCX O&G has derivative contracts that provide price protection between $70 and $90 per barrel of Brent crude oil for more than 80 percent of estimated 2015 oil production. Assuming an average price of $56 per barrel for Brent crude oil, we would receive a benefit of $20 per barrel on remaining 2015 derivative contract volumes of 15.5 million barrels, before taking into account weighted-average premiums of $6.89 per barrel.
FCX O&G’s average realized price for gas was $2.66 per MMBtu in second-quarter 2015, compared to the NYMEX gas price average of $2.65 per MMBtu for the January through June 2015 contracts. This compares to second-quarter 2014 when FCX O&G’s average realized price for gas was $4.44, including ($0.26) of cash losses on derivative contracts per MMBtu. Excluding the impact of derivative contracts, our realized price for gas was $4.70 per MMBtu in second-quarter 2014, compared to the NYMEX gas price average of $4.67 per MMBtu.
FCX O&G’s average realized price for gas was $2.75 per MMBtu in the first six months of 2015, compared to the NYMEX gas price average of $2.81 per MMBtu for the January through June 2015 contracts. This compares to the first six months of 2014 when FCX O&G’s average realized price for gas was $4.55 per MMBtu, including ($0.32) of cash losses per MMBtu. Excluding the impact of derivative contracts, our realized price for gas was $4.87 per MMBtu in the first six months of 2014, compared to the NYMEX gas price average of $4.79 per MMBtu.
Cash production costs for oil and gas operations of $19.04 per Boe in second-quarter 2015 were lower than cash production costs of $19.57 per Boe in second-quarter 2014, primarily reflecting cash production costs in California related to reductions in repair and maintenance costs and well workover expense.
Cash production costs for oil and gas operations of $19.62 per Boe in the first six months of 2015 were higher than cash production costs of $19.03 per Boe for the first six months of 2014, primarily reflecting the sale of lower-cost Eagle Ford shale properties. Cash production costs were $12.97 per Boe for the Eagle Ford shale properties in the six months ended June 30, 2014.
73
Table of Contents
Index to Financial Statements
Following is a summary of average sales volumes per day by region for oil and gas operations in second-quarter 2015 and 2014 and the first six months of 2015 and 2014:
| FCX O&G (Successor) | ||||||||||||||||
| Three Months Ended June 30, |
Six Months Ended June 30, |
|||||||||||||||
| 2015 | 2014 | 2015 | 2014 | |||||||||||||
| Sales Volumes (MBoe/d): |
||||||||||||||||
| GOM |
80 | 75 | 77 | 73 | ||||||||||||
| California |
38 | 39 | 39 | 39 | ||||||||||||
| Haynesville/Madden/Other |
26 | 18 | 26 | 18 | ||||||||||||
| Eagle Ford(1) |
— | 44 | — | 48 | ||||||||||||
|
|
|
|
|
|
|
|
|
|||||||||
| Total |
144 | 176 | 142 | 178 | ||||||||||||
|
|
|
|
|
|
|
|
|
|||||||||
| (1) | The sale of the Eagle Ford shale properties was completed in June 2014. |
Daily sales volumes averaged 144 MBoe/d in second-quarter 2015, including 95 MBbls/d of crude oil, 259 MMcf/d of gas and 6 MBbls/d of NGLs, compared to 176 MBoe/d in second-quarter 2014, including 128 MBbls/d of crude oil, 223 MMcf/d of gas and 11 MBbls/d of NGLs. Lower daily sales volumes in second-quarter 2015, compared to second-quarter 2014, primarily reflected the sale of the Eagle Ford shale properties which were 44 MBoe/d in second-quarter 2014, partially offset by increased volumes from our Haynesville, Madden, and Other areas of 8 MBoe/d.
Daily sales volumes averaged 142 MBoe/d for the first six months of 2015, including 94 MBbls/d of crude oil, 250 MMcf/d of gas and 6 MBbls/d of NGLs compared to 178 MBoe/d for the first six months of 2014, including 130 MBbls/d of crude oil, 220 MMcf/d of gas and 11 MBbls/d of NGLs. Lower daily volumes in the first six months of 2015, compared to the first six months of 2014, primarily reflected the sale of the Eagle Ford shale properties which were 48 MBoe/d for the six months ended 2014, partially offset by increased volumes from our Haynesville, Madden, and Other areas of 8 MBoe/d.
74
Table of Contents
Index to Financial Statements
(Successor Periods) Year Ended December 31, 2014, Compared to Seven-month Period Ended December 31, 2013.
| FCX O&G (Successor) | ||||||||
| Year Ended December 31, 2014(1) |
April 23 to December 31, 2013(2) |
|||||||
| Sales Volumes |
||||||||
| Oil (MBbls) |
40,116 | 26,630 | ||||||
| Gas (MMcf) |
80,842 | 54,175 | ||||||
| NGLs (MBbls) |
3,211 | 2,417 | ||||||
| MBoe |
56,801 | 38,077 | ||||||
| Daily Average Volumes |
||||||||
| Oil (MBbls/d) |
109.9 | 124.4 | ||||||
| Gas (MMcf/d) |
221.5 | 253.8 | ||||||
| NGLs (MBbls/d) |
8.8 | 11.3 | ||||||
| Average Realizations(3) |
||||||||
| Oil (per barrel) |
$ | 90.00 | $ | 98.32 | ||||
| Gas (per MMBtu) |
4.23 | 3.99 | ||||||
| NGLs (per barrel) |
39.73 | 38.20 | ||||||
| Gross (Loss) Profit per Boe |
||||||||
| Realized revenues(3) |
$ | 71.83 | $ | 76.87 | ||||
| Less cash production costs(3) |
20.08 | 17.14 | ||||||
|
|
|
|
|
|||||
| Cash operating margin(3) |
51.75 | 59.73 | ||||||
| Less: depreciation, depletion and amortization |
40.34 | 35.81 | ||||||
| Less: impairment of oil and gas properties |
65.80 | — | ||||||
| Less: accretion and other operating expenses |
1.69 | 0.79 | ||||||
| Plus: net noncash mark-to-market gains (losses) on derivative contracts |
11.03 | (8.20 | ) | |||||
| Plus: other operating revenues |
0.06 | 0.04 | ||||||
|
|
|
|
|
|||||
| Gross (loss) profit |
$ | (44.99 | ) | $ | 14.97 | |||
|
|
|
|
|
|||||
| (1) | Summary operating results for the year ended December 31, 2014, includes results from our Eagle Ford shale properties through June 19, 2014. |
| (2) | Oil and gas operations began June 1, 2013. |
| (3) | Cash operating margin, a non-GAAP measure, reflects realized revenues less cash production costs. Realized revenues exclude noncash mark-to-market adjustments on derivative contracts. For reconciliations of realized revenues and cash production costs per Boe to revenues and production costs reported in our financial statements, see “—Product Revenues and Cash Production Costs.” |
FCX O&G’s average realized price for crude oil was $90.00 per barrel, including $2.76 per barrel of cash losses on derivative contracts, in the year ended December 31, 2014, compared to $98.32 per barrel, including $1.35 per barrel of cash losses on derivative contracts, for the seven-month period ending December 31, 2013. Excluding the impact of derivative contracts, the 2014 average realized price for crude oil was $92.76 per barrel for the year ended December 31, 2014, which was 93 percent of the average Brent crude oil price of $99.45 per barrel. For the seven-month period ending December 31, 2013, the average realized price for crude oil, excluding the impact of derivative contracts was $99.67 per barrel, which was 92 percent of the average Brent crude oil price of $108.66 per barrel.
The decrease in average crude oil differentials for the year ended December 31, 2014, compared to the seven-month period ending December 31, 2013, was primarily due to higher realized prices received for GOM oil sales. Average realized prices received for GOM sales were approximately 97 percent of Brent for the year-ended December 31, 2014, compared to 96 percent for the seven-month period ending December 31, 2013.
75
Table of Contents
Index to Financial Statements
The Brent crude oil price is used as a reference price against actual realized prices which are ultimately determined by sales contracts in place at various production locations. These sales contracts typically consider local market conditions, delivery points and quality of oil in their pricing and as a result, there can be fluctuations in differentials between Brent pricing and realized pricing.
FCX O&G’s average realized price for gas was $4.23 per MMBtu for the year ended December 31, 2014, and $3.99 per MMBtu for the seven-month period ending December 31, 2013. Excluding the impact of derivative contracts, the 2014 average realized price for gas was $4.37 per MMBtu for the year ended December 31, 2014, compared to the NYMEX gas price average of $4.41 per MMBtu for the January through December 2014 contracts. For the seven-month period ending December 31, 2013, the 2013 average realized price for gas was $3.73 per MMBtu, compared to the NYMEX gas price average of $3.67 per MMBtu for the June through December contracts. As of December 31, 2014, FCX O&G has no remaining derivative contracts for gas.
Cash production costs of $20.08 per Boe for the year ended December 31, 2014, were higher than cash production costs of $17.14 per Boe for the seven-month period ending December 31, 2013, primarily reflecting the sale of lower cost Eagle Ford shale properties. The Eagle Ford shale properties contributed approximately 15 percent of the sales volumes for the year ended December 31, 2014, at an average cash production cost of $12.97 per Boe and 26 percent of the sales volumes for the seven-month period ending December 31, 2013, at an average cash production cost of $11.97 per Boe. In addition to the loss of lower-cost Eagle Ford shale production, cash production costs increased $4.26 per Boe in California for the year ended December 31, 2014, compared to the seven-month period ending December 31, 2013, primarily due to higher well-work and maintenance expense. Cash production costs increased $1.68 per Boe in the GOM for the year ended December 31, 2014, compared to the seven-month period ending December 31, 2013, primarily due to higher repairs and maintenance expense.
Following is a summary of average sales volumes per day by region for oil and gas operations for the year ended December 31, 2014, and the seven-month period ended December 31, 2013:
| FCX O&G (Successor) | ||||||||
| Year Ended December 31, 2014 |
April 23 to December 31, 2013(1) |
|||||||
| Sales Volumes (MBoe/d): |
||||||||
| GOM |
73 | 72 | ||||||
| California |
39 | 39 | ||||||
| Haynesville/Madden/Other |
20 | 21 | ||||||
| Eagle Ford |
24 | (2) | 46 | |||||
|
|
|
|
|
|||||
| Total |
156 | 178 | ||||||
|
|
|
|
|
|||||
| (1) | Oil and gas operations began June 1, 2013. |
| (2) | Summary average sale volumes per day for the year ended December 31, 2014, includes results from Eagle Ford shale properties through June 19, 2014. |
Daily sales volumes averaged 156 MBoe/d for the year ended December 31, 2014, including 110 MBbls/d of crude oil, 221 MMcf/d of gas and nine MBbls/d of NGLs, compared to 178 MBoe/d for the seven-month Successor period ending December 31, 2013, including 124 MBbls/d of crude oil, 254 MMcf/d of gas and 11 MBbls/d of NGLs. Lower average daily sales volumes from 2013 to 2014, primarily reflected the sale of the Eagle Ford shale properties.
76
Table of Contents
Index to Financial Statements
(Predecessor Periods) Five-month Period Ended May 31, 2013, Compared to Year Ended December 31, 2012.
| PXP (Predecessor) | ||||||||
| January 1, to May 31, 2013 |
Year Ended December 31, 2012 |
|||||||
| Sales Volumes |
||||||||
| Oil (MBbls) |
17,700 | 22,685 | ||||||
| Gas (MMcf) |
36,148 | 87,110 | ||||||
| NGLs (MBbls) |
1,528 | 1,680 | ||||||
| MBoe |
25,253 | 38,883 | ||||||
| Daily Average Volumes |
||||||||
| Oil (MBbls/d) |
117.2 | 62.0 | ||||||
| Gas (MMcf/d) |
239.4 | 238.0 | ||||||
| NGLs (MBbls/d) |
10.1 | 4.6 | ||||||
| Average Realizations(1) |
||||||||
| Oil (per barrel) |
$ | 103.39 | $ | 99.48 | ||||
| Gas (per MMBtu) |
3.82 | 3.25 | ||||||
| NGLs (per barrel) |
36.50 | 39.35 | ||||||
| Gross Profit per Boe |
||||||||
| Realized revenues(1) |
$ | 80.14 | $ | 67.02 | ||||
| Less cash production costs(1) |
16.07 | 16.27 | ||||||
|
|
|
|
|
|||||
| Cash operating margin(1) |
64.07 | 50.75 | ||||||
| Less: depreciation, depletion and amortization |
34.59 | 28.32 | ||||||
| Less: accretion and other operating expenses |
1.00 | 0.44 | ||||||
| Plus: net noncash mark-to-market losses on derivative contracts |
(0.35 | ) | (1.30 | ) | ||||
| Plus: other operating revenues |
0.08 | 0.18 | ||||||
|
|
|
|
|
|||||
| Gross profit |
$ | 28.21 | $ | 20.87 | ||||
|
|
|
|
|
|||||
| (1) | Cash operating margin, a non-GAAP measure, reflects realized revenues less cash production costs. Realized revenues exclude noncash mark-to-market adjustments on derivative contracts. For reconciliations of realized revenues and cash production costs per Boe to revenues and production costs reported in our financial statements, see “—Product Revenues and Cash Production Costs.” |
The average realized price for crude oil was $103.39 per barrel, including $1.50 per barrel of cash losses on derivative contracts, in the five-month period ended May 31, 2013 compared to $99.48 per barrel, including $0.14 per barrel of cash losses on derivative contracts, for the year ended December 31, 2012. Excluding the impact of derivative contracts, the average realized price for crude oil during the five-month period ended May 31, 2013 was $104.89 per barrel, which was 96 percent of the average Brent crude oil price of $108.71 per barrel, and for the year ended December 31, 2012, the average realized price for crude oil was $99.62 per barrel, which was 89 percent of the average Brent crude oil price of $111.63 per barrel. The improvement in realized crude oil prices excluding the impact of derivative contracts compared to the average Brent crude oil price during the five-month period ended May 31, 2013, compared to the year ended December 31, 2012, was primarily due to sales received for volumes sold from our Deepwater GOM projects acquired in fourth-quarter 2012.
The Brent crude oil price is used as a reference price against actual realized prices which are ultimately determined by sales contracts in place at various production locations. These sales contracts typically consider local market conditions, delivery points and quality of oil in their pricing and as a result, there can be fluctuations in differentials between Brent pricing and realized pricing.
The average realized price for gas was $3.82 per MMBtu in the five-month period ended May 31, 2013, and $3.25 per MMBtu for the year ended December 31, 2012. Excluding the impact of derivative contracts, the
77
Table of Contents
Index to Financial Statements
average realized price for gas was $3.53 per MMBtu for the five month period ended May 31, 2013, compared to the NYMEX gas price average of $3.65 per MMBtu for the January through May 2013 contracts; and for the year ended December 31, 2012, the average realized price for gas was $2.67 per MMBtu, compared to the NYMEX gas price average of $2.79 per MMBtu for the January through December 2012 contracts.
Cash production costs of $16.07 per Boe for the five-month period ended May 31, 2013, were lower than cash production costs of $16.27 per Boe for the year ended December 31, 2012, primarily reflecting lower operating costs in the GOM.
Following is a summary of average sales volumes per day by region for oil and gas operations for the five-month period ended May 31, 2013, and the year ended December 31, 2012:
| PXP (Predecessor) | ||||||||
| January 1 to May 31, 2013 |
Year Ended December 31, 2012 |
|||||||
| Sales Volumes (MBoe/d): |
||||||||
| GOM |
59 | 6 | ||||||
| California |
38 | 38 | ||||||
| Haynesville/Madden/Other |
26 | 34 | ||||||
| Eagle Ford |
44 | 28 | ||||||
|
|
|
|
|
|||||
| Total |
167 | 106 | ||||||
|
|
|
|
|
|||||
Daily sales volumes averaged 167 MBoe/d for the five-month period ended May 31, 2013, including 117 MBbls/d of crude oil, 239 MMcf/d of gas and 10 MBbls/d of NGLs, compared to 106 MBoe/d for the year ended December 31, 2012, including 62 MBbls/d of crude oil, 238 MMcf/d of gas and five MBbls/d of NGLs. Higher average daily sales volumes in the five-month period ended May 31, 2013, compared to the year ended December 31, 2012, primarily reflected additions of 59 MBoe/d from PXP’s fourth-quarter 2012 Deepwater GOM acquisitions.
Capital Resources and Liquidity
Our liquidity may be affected by declines in oil and gas prices and an inability to access the capital and credit markets. These situations may arise due to circumstances beyond our control, such as a general disruption of the financial markets and adverse economic conditions that cause substantial or extended declines in oil and gas prices. Volatility and disruption in the capital and credit markets may adversely affect the financial condition of lenders in our revolving line of credit, our insurers and our oil and gas purchasers.
Our primary sources of liquidity are cash generated from our operations and our intercompany revolving notes with FCX, under which FCX will lend us a maximum of $9.0 billion. Our 2015 capital expenditures are expected to approximate $2.8 billion, including capitalized interest and general and administrative expense, which we intend to fund from the net proceeds of this offering, internally generated funds and borrowings under our revolving notes. In July 2015, we announced that we are undertaking a comprehensive review of operating plans in our business to target significant additional reductions in capital spending and operating and administrative costs in response to weak market conditions for our products. On August 5, 2015, we provided an update on our progress and announced the deferral of investments in several long-term projects, which will result in a reduction of $0.9 billion in projected capital expenditures for each of the years 2016 and 2017.
After giving effect to our corporate reorganization and this offering and the use of proceeds therefrom, we will have zero debt, $ million in cash on hand and $ million of available borrowing capacity through bank credit facilities and/or an intercompany loan agreement with FCX. In the future, we will seek to maintain financial flexibility to enable us to most effectively develop our portfolio. We expect our cash flows from operating activities, the net proceeds of this offering and our borrowing availability will be sufficient to fund our capital expenditures and other obligations necessary to execute our business plan in the near term.
78
Table of Contents
Index to Financial Statements
First Six Months of 2015, Compared to First Six Months of 2014.
| FCX O&G (Successor) | ||||||||
| Six Months Ended June 30, |
||||||||
| 2015 | 2014(1) | |||||||
| (in thousands) | ||||||||
| Cash Flows |
||||||||
| Cash flows provided by operating activities |
$ | 535,076 | $ | 1,579,160 | ||||
| Cash flows (used in) provided by investing activities |
(1,833,911 | ) | 246,452 | |||||
| Cash flows provided by (used in) financing activities |
1,303,294 | (1,825,067 | ) | |||||
| (1) | Data includes results from Eagle Ford shale properties through June 19, 2014. |
Operating Activities. Net cash provided by operating activities totaled $535.1 million (including $245.7 million of working capital sources) in the first six months of 2015, compared to $1,579.2 million (including $71.1 million of working capital sources) in the first six months of 2014. The decrease in net cash provided by operating activities reflects lower average realized oil and gas prices and oil sales volumes.
Investing Activities. Net cash (used in) provided by investing activities was ($1.8) billion in the first six months of 2015, compared to $0.2 billion in the first six months of 2014. The increase in cash used in investing activities primarily reflects an increase in additions to oil and gas properties associated with our exploration and development activities in the Deepwater GOM. In addition, the first six months of 2014 includes $3.0 billion in proceeds from the sale of our Eagle Ford shale properties offset by $1.3 billion in additional Deepwater GOM acquisitions.
Financing Activities. Net cash provided by (used in) financing activities was $1.3 billion in the first six months of 2015 and ($1.8) billion in the first six months of 2014. The increase in net cash provided by financing activities primarily reflected net borrowings under the revolving notes with FCX.
(Successor Periods) Year Ended December 31, 2014, Compared to Seven-month Period Ended December 31, 2013.
| FCX O&G (Successor) | ||||||||
| Year Ended December 31, 2014(1) |
April 23 to December 31, 2013(2) |
|||||||
| (in thousands) | ||||||||
| Cash Flows |
||||||||
| Cash flows provided by operating activities |
$ | 2,452,676 | $ | 1,815,502 | ||||
| Cash flows used in investing activities |
(1,667,577 | ) | (1,381,491 | ) | ||||
| Cash flows used in financing activities |
(783,854 | ) | (433,140 | ) | ||||
| (1) | Data includes results from Eagle Ford shale properties through June 19, 2014. |
| (2) | Oil and gas operations began June 1, 2013. |
Operating Activities. Net cash provided by operating activities totaled $2.5 billion (net of $53.4 million of working capital uses) in the year ended December 31, 2014, $1.8 billion (net of $36.0 million in working capital uses) in the seven-month period ending December 31, 2013. Higher cash provided by operating activities in 2014, was primarily due to a full year results for the year ended December 31, 2014, partially offset by lower oil sales volumes and average realized prices.
Investing Activities. Net cash used in investing activities of $1.7 billion in the year ended December 31, 2014, primarily reflected additions to oil and gas properties of $3.1 billion and additional Deepwater GOM
79
Table of Contents
Index to Financial Statements
acquisitions of $1.4 billion, partially offset by net proceeds of $2.9 billion from the sale of our Eagle Ford shale properties. Net cash used in investing activities of $1.4 billion in the seven-month period ending December 31, 2013, primarily reflected additions to oil and gas properties.
Financing Activities. Net cash used in financing activities of $783.9 million in the year ended December 31, 2014, primarily reflected the repayments of $4.0 billion of long-term debt, which included the partial and full redemption of certain senior notes. This was offset by net additional borrowings under the revolving notes with FCX of $1.2 billion and cash proceeds of $2.0 billion from additional issuances of equity to FCX.
Net cash used in financing activities of $433.1 million in the seven-month period ending December 31, 2013, primarily reflected the repayments of $716.6 million of long-term debt, which included the full redemption of certain senior notes, partly offset by additional borrowings under the revolving notes with FCX of $303.7 million.
Other Equity Transactions. From time to time, we receive cash contributions from FCX in exchange for common shares. We are authorized to issue one additional share of our common stock to FCX for each $200.0 million of capital contribution; provided, however that no fractional shares of common stock shall be issued.
(Predecessor Periods) Five-month Period Ended May 31, 2013, Compared to Year Ended December 31, 2012.
| PXP (Predecessor)(1) | ||||||||
| January 1 to May 31, 2013 |
Year Ended December 31, 2012 |
|||||||
| (in thousands) | ||||||||
| Cash Flows |
||||||||
| Cash flows provided by operating activities |
$ | 1,296,430 | $ | 1,330,791 | ||||
| Cash flows used in investing activities |
(889,128 | ) | (7,703,255 | ) | ||||
| Cash flows (used in)/provided by financing activities |
(272,805 | ) | 6,133,931 | |||||
| (1) | Derivative settlement (losses) gains of ($15.9) million and $47.8 million for the periods January 1 to May 31, 2013 and for the year ended December 31, 2012, respectively, are included in investing activities. |
Operating Activities. Net cash provided by operating activities totaled $1.3 billion (net of $3.1 million of working capital sources) in the five-month period ended May 31, 2013, and $1.3 billion (net of $174.5 million of working capital uses) in the year ended December 31, 2012. Net cash provided by operating activities decreased in the five-month period ended May 31, 2013, primarily due to a full-year results for the year ended December 31, 2012, partially offset by results of fourth-quarter 2012 Deepwater GOM acquisitions.
Investing Activities. Net cash used in investing activities of $889.1 million in the five-month period ended May 31, 2013, primarily reflected additions to oil and gas properties of $823.4 million. Net cash used in investing activities of $7.7 billion in the year ended December 31, 2012, primarily reflected PXP’s fourth-quarter 2012 Deepwater GOM acquisitions for $5.9 billion and additions to oil and gas properties of approximately $1.9 billion.
Financing Activities. Net cash used in financing activities of $272.8 million in the five-month period ended May 31, 2013 primarily reflected the repayments of $171.2 million of long-term debt.
Net cash provided by financing activities of $6.1 billion in the year ended December 31, 2012 primarily reflected $3.8 billion of proceeds from senior note offerings and $2.0 billion of net proceeds from term loans to fund PXP’s fourth-quarter 2012 Deepwater GOM acquisitions, and net borrowings under PXP’s revolving line of credit of $835.0 million, partially offset by the $156.2 million redemption of certain senior notes.
80
Table of Contents
Index to Financial Statements
We have contractual and other long-term obligations, including debt maturities based on the principal amounts, which we expect to fund with available cash, projected operating cash flows, availability under our revolving notes with FCX or future financing transactions, if necessary. With the exception of debt maturities and the related impact on scheduled interest payment obligations, which have been presented as of June 30, 2015, following is a summary of our contractual obligations as of December 31, 2014, for which there have been no material changes:
| Total | 2015 | 2016 to 2017 |
2018 to 2019 |
Thereafter | ||||||||||||||||
| (in thousands) | ||||||||||||||||||||
| Debt maturities(1) |
$ | 8,258,463 | $ | — | $ | — | $ | 236,922 | $ | 8,021,541 | ||||||||||
| Scheduled interest payment obligations(2) |
2,594,514 | 137,224 | 548,895 | 541,639 | 1,366,756 | |||||||||||||||
| ARO(3) |
1,894,307 | 117,852 | 154,327 | 47,743 | 1,574,385 | |||||||||||||||
| Take-or-pay contracts(4) |
2,638,710 | 1,189,647 | 1,296,906 | 59,494 | 92,663 | |||||||||||||||
| Operating lease obligations(5) |
105,607 | 20,568 | 45,727 | 22,588 | 16,724 | |||||||||||||||
|
|
|
|
|
|
|
|
|
|
|
|||||||||||
| Total |
$ | 15,491,601 | $ | 1,465,291 | $ | 2,045,855 | $ | 908,386 | $ | 11,072,069 | ||||||||||
|
|
|
|
|
|
|
|
|
|
|
|||||||||||
| (1) | Excludes $211.6 million of unamortized fair value adjustments at June 30, 2015. Includes the revolving notes with FCX, under which we owed $5.9 billion at June 30, 2015. See Note 3 to our audited historical financial statements included elsewhere in this prospectus for further discussion. |
| (2) | Scheduled interest payment obligations were calculated using stated coupon rates for fixed-rate debt and interest rates applicable at December 31, 2014, for variable-rate debt. |
| (3) | Represents estimated cash payments, on undiscounted and unescalated basis, associated with ARO activities. The timing and the amount of these payments could change as a result of changes in regulatory requirements, changes in scope and timing of ARO activities and as actual spending occurs. |
| (4) | Represents contractual obligations for purchases of goods or service agreements enforceable and legally binding and that specify all significant terms, including minimum commitments for deepwater drillships to be utilized in our Deepwater GOM drilling campaign ($1.8 billion), transportation services ($250 million) and deferred premium costs and future interest on the crude oil derivative contracts ($231 million). Some of our take-or-pay contracts are settled based on the prevailing market rate for the service or commodity purchased, and in some cases, the amount of the actual obligation may change over time because of market conditions. Drillship obligations provide for an operating rate over the contractual term upon delivery of the drillship. Transportation obligations are primarily for contracted gathering. |
| (5) | Operating leases relate primarily to obligations associated with office facilities. |
The table excludes purchase orders for the purchase of inventory and other goods and services, as purchase orders typically represent authorizations to purchase rather than binding agreements.
Take-or-Pay Contracts. We have entered into various commitments and operating agreements associated with, among other things, oil and gas exploration, development and production activities, gathering and transportation, drilling rig and oilfield and other services. Aggregate future obligations under these agreements are described below.
We have contracted with an affiliate of Noble Corporation for the Noble Sam Croft and Noble Tom Madden new-build drillships that support our Deepwater GOM drilling activity. The drillship contracts for the Noble Sam Croft and the Noble Tom Madden each provide for firm three-year commitments, which began in third-quarter and fourth-quarter of 2014, respectively, each at rates of $0.6 million per day. Such rates are subject to standard reimbursement and contractual escalation provisions. The drillship contracts each required us to pay $24.1 million for mobilization.
In May 2014, we contracted with an affiliate of Rowan Companies plc for the Rowan Relentless new-build drillship that will support our Deepwater GOM drilling activity. The drillship contract for the Rowan Relentless provides for a two-year commitment that commenced in June 2015 at a rate of approximately $0.6 million per day. Such rates are subject to standard reimbursement and contractual provisions.
81
Table of Contents
Index to Financial Statements
Through our ownership in Lucius, located in the Deepwater GOM, we joined the Lucius and Hadrian working interest partners and executed a unit participation and unit operating agreement effective June 1, 2011. As part of the agreements, we have agreed to share in our portion of certain costs for construction and installation of the production facility and subsea infrastructure, long-lead equipment orders and detailed engineering work and have a commitment, in addition to our aggregate future contractual obligations, which totaled $37.7 million as of December 31, 2014. We entered into various agreements with third parties totaling $206.1 million for long-term oil and gas gathering and transportation services at the Lucius oil field. In 2014, we began paying guaranteed fixed minimum monthly fees and will pay additional variable gathering fees based upon actual throughput.
Through our recent acquisition of an interest in the Vito oil discovery, located in the Deepwater GOM, we joined the Vito working interest partners in their unit participation and unit operating agreement. Per the agreements, we have a commitment, in addition to our aggregate future contractual obligations, to share in our portion of certain remaining costs under the exploration plan for exploratory drilling, long-lead equipment orders and detailed engineering work, which totaled $125.4 million as of December 31, 2014.
Through our recent acquisition of an interest in the Heidelberg oil field, located in the Deepwater GOM, we joined the Heidelberg working interest partners in their unit participation and unit operating agreement. As a result, we have entered into various agreements with guaranteed fixed minimum monthly fees for long-term oil transportation services with third parties at Heidelberg totaling $43.9 million over the period 2016 through 2028. Per the agreements, we have a commitment, in addition to our aggregate future contractual obligations, to share in our portion of certain remaining costs under the development plan for construction and installation of the production facility and subsea infrastructure, long-lead equipment orders and detailed engineering work, which totaled $80.4 million as of December 31, 2014.
In December 2014, we terminated certain of our drilling rig rental agreements and incurred $27.8 million in associated charges, which was recognized in other operating expense for the year 2014.
Offshore Morocco Exploration. We have executed, with Pura Vida Energy, a farm-in arrangement in exploration blocks located in the Mazagan permit area offshore Morocco. We are operator of the permit area and have agreed to fund 100 percent of defined exploration activities in exchange for a 52 percent working interest. Our agreement to fund the exploration activities includes a commitment to fund and drill two wells, subject to a maximum carry commitment of $215.0 million (excluding a $15.0 million payment to farm-in to Pura Vida Energy’s working interest). Office Nationale des Hydrocarbures et des Mines, the Moroccan national oil company, holds a 25 percent working interest and is carried for defined exploration work throughout the exploration phase of the permits. The exploration area covers 2.2 million gross acres in water depths of 4,500 to 9,900 feet. The exploration permits covering our Morocco acreage expire in 2016; however, we have the ability to extend the exploration permits through 2019.
In February 2014, we entered into a rig share agreement with Kosmos Energy Ventures for the use of a drillship to drill two planned wells in the Mazagan permit area offshore Morocco. In July 2015, we and Kosmos agreed to reduce our share to one well slot at a rate of approximately $0.7 million per day (included within our maximum carry commitment with Pura Vida Energy). Drilling commenced on our slot at the end of May 2015. The rig share agreement further requires us to pay a proportionate share of rig mobilization and demobilization fees, as well as other costs incidental to the preparation, testing and operation of the drillship.
Litigation and Other Contingencies
Environmental Matters. As an owner or lessee and operator of oil and gas properties, we are subject to various federal, state and local laws and regulations relating to discharge of materials into, and protection of, the environment. These regulations are often more stringent on older properties that were operated before the regulations came into effect, including certain of our California properties that have operated for over a century.
82
Table of Contents
Index to Financial Statements
We have established policies for continuing compliance with environmental laws and regulations. We also maintain insurance coverage for environmental matters that we believe is customary in the industry, though we are not fully insured against all environmental risks. There can be no assurance that current or future local, state or federal rules and regulations will not require us to spend material amounts to comply with such rules and regulations. At June 30, 2015, and December 31, 2014, we had no known environmental obligations for which accruals would be necessary.
Surety and Oil Spill Financial Responsibility Requirements. As a lessee in the Deepwater GOM, we must comply with regulations set forth by the BOEM and the BSEE, which we refer to together as BOEM/BSEE, and hold any bonds, or provide the financial assurances, required for our leases in federal waters. To cover the various obligations of lessees in federal waters, the BOEM/BSEE generally requires that lessees have substantial U.S. assets and net worth or post bonds or other acceptable assurances that such obligations will be met. We are subject to the following types of surety requirements with BOEM: (i) general lessee or operator’s bonds required to accept title to any lease in federal waters, (ii) supplemental bonding, which is required to be provided by all lessees and specifically covers the plugging and abandonment obligations associated with a lease, and (iii) oil spill financial responsibility, generally provided by operators pursuant to the OPA. The OPA imposes a variety of requirements related to the prevention of and response to oil spills into waters of the U.S., including the Outer Continental Shelf, which includes the GOM. The OPA subjects operators of offshore leases and owners and operators of oil handling facilities to strict joint and several liability for all containment and cleanup costs and certain other damages arising from a spill, including, but not limited to, the costs of responding to a release of oil, natural resource damages, and economic damages suffered by persons adversely affected by an oil spill. The OPA also requires owners and operators of offshore oil production facilities to establish and maintain evidence of financial responsibility to cover costs that could be incurred in responding to an oil spill. The OPA currently requires a minimum financial responsibility demonstration of $35 million for companies operating oil production facilities on the Outer Continental Shelf, although the Secretary of Interior may increase this amount up to $150 million in certain situations. The cost of these bonds or other surety could be substantial and there is no assurance that bonds or other surety could be obtained in all cases.
Plugging, Abandonment and Remediation Obligations. Consistent with normal industry practices, substantially all of our oil and gas leases require that, upon termination of economic production, the working interest owners plug and abandon non-producing wellbores, remove platforms, tanks, production equipment and flow lines and restore the wellsite. Our asset retirement obligations, which we refer to as ARO, cover wells, platforms and other structures. At June 30, 2015, we had accrued $1.2 billion associated with ARO. Typically, when producing oil and gas assets are purchased, the purchaser assumes the obligation to plug and abandon wells and facilities that are part of such assets. However, in some instances, we have received an indemnity with respect to those costs. We cannot be assured that we will be able to collect on these indemnities.
Third parties have retained the majority of the obligations for abandoning these acquired properties, which include the Point Arguello Unit, offshore California, where the companies from which we purchased our interests retained responsibility for (i) removing, dismantling and disposing of the existing offshore platforms, (ii) removing and disposing of all existing pipelines and (iii) removing, dismantling, disposing and remediating all existing onshore facilities. We are responsible for our 69.3 percent share of other abandonment costs which primarily consist of well bore abandonments, conductor removals and site cleanup and restoration.
In connection with sale of certain properties offshore California in 2004, we have responsibility for certain abandonment costs, including removing, dismantling and disposing of the 11 existing offshore platforms. The present value of such abandonment costs at December 31, 2014, was $107.4 million ($162.7 million undiscounted), and was included in our ARO. In addition, we guarantee the performance of the purchaser with respect to the remaining abandonment obligations related to the properties ($84.3 million). To secure its abandonment obligations, the purchaser of the properties is required to periodically deposit funds into an escrow account. At December 31, 2014, the escrow account had a balance of $27.0 million. The fair value of our guarantee at December 31, 2014, ($0.5 million) considered the payment and performance risk of the purchaser and was included in other long-term liabilities in our consolidated balance sheet.
83
Table of Contents
Index to Financial Statements
Operating Risks and Insurance Coverage. Our operations are subject to all of the risks normally incident to the exploration for and the production of oil and gas, including well blowouts, cratering, explosions, oil spills, releases of gas or well fluids, fires, pollution and releases of toxic gas, each of which could result in damage to or destruction of oil and gas wells, production facilities or other property or injury to persons. Our operations in California, including transportation of oil by pipelines within the city and county of Los Angeles, are especially susceptible to damage from earthquakes and involve increased risks of personal injury, property damage and marketing interruptions because of the population density of southern California. We maintain coverage for earthquake damages in California, but this coverage may not provide for the full effect of damages that could occur, and we may be subject to additional liabilities. Although we maintain insurance coverage considered to be customary in the industry, we are not fully insured against all risks, either because insurance is not available or because of high premium costs. We are self-insured for named windstorms in the GOM. The occurrence of a significant event that is not fully insured against could have a material adverse effect on our financial position. Our insurance does not cover every potential risk associated with operating our pipelines, including the potential loss of significant revenues. Consistent with insurance coverage generally available to the industry, our insurance policies provide limited coverage for losses or liabilities relating to pollution resulting from sudden and accidental occurrences.
Indemnification of FCX. We and FCX will enter into the Transaction Agreement detailing the terms of our corporate reorganization and providing for, among other things, indemnification of FCX by us for all liabilities relating to the conduct of the oil and gas business of FCX, and indemnification of us by FCX for all liabilities relating to the conduct of the mining business of FCX, in each case whether arising before or after the closing.
Litigation. From time to time, we are a party to ongoing legal proceedings in the ordinary course of business, including workers’ compensation claims, employment-related disputes, commercial disputes, personal injury claims, royalty claims, property damage claims and contract actions. We do not believe the results of these proceedings, individually or in the aggregate, will have a material adverse effect on our business, financial condition, results of operations or liquidity.
84
Table of Contents
Index to Financial Statements
Disclosures about Market Risks
Commodity Price Risk
Market prices for crude oil and gas can fluctuate significantly and are affected by numerous factors beyond our control. The following graph presents Brent crude oil prices and NYMEX gas contract prices from January 2005 through August 3, 2015.
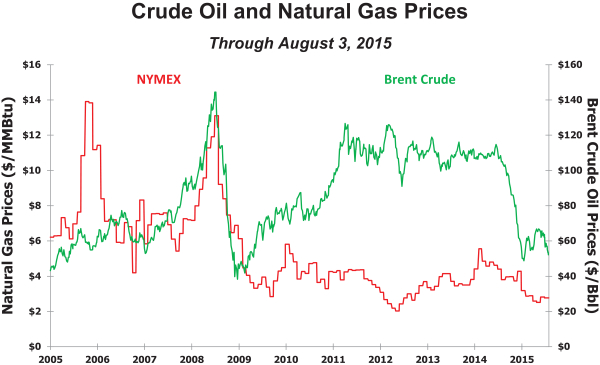
Crude oil prices reached a record high in July 2008 as economic growth in emerging economies and the U.S. created high global demand for oil and lower inventories. By the end of 2008, financial turmoil in the U.S. contributed to a global economic slowdown and a decline in many commodity prices. Crude oil prices rebounded after 2008, supported by a gradually improving global economy and demand outlook. Since mid-2014, oil prices have significantly declined associated with global oversupply primarily attributable to continued strong production from U.S. shale plays, the Organization of Petroleum Exporting Countries and Russia, coupled with weak economic data in Europe and slowing Chinese demand.
During 2014, the Brent crude oil price ranged from a low of $57.33 per barrel to a high of $115.06 per barrel, and averaged $99.45 per barrel. During the six months ended June 30, 2015, the Brent crude oil price ranged from a low of $46.59 per barrel to a high of $67.77 per barrel and averaged $59.41 per barrel. The Brent crude oil price was $49.52 per barrel on August 3, 2015.
Our financial results from oil and gas operations may vary with fluctuations in crude oil prices and, to a lesser extent, gas prices. In connection with FCX’s 2013 acquisition of PXP, we have derivative contracts that are not designated as hedging instruments and are recorded at fair value with the mark-to-market gains and losses recorded in revenues each period. Cash gains (losses) on crude oil and gas derivative contracts totaled $101.3 million for second-quarter 2015, $201.6 million for the first six months of 2015, ($122.3) million for the year ended December 31, 2014, and ($21.9) million for the seven-month period ended December 31, 2013. Noncash mark-to-market (losses) gains on crude oil and gas derivative contracts totaled ($95.1) million for second-quarter 2015, ($143.5) million for the first six months of 2015, $626.7 million for the year ended December 31, 2014, and ($312.3) million for the seven-month period ended December 31, 2013.
85
Table of Contents
Index to Financial Statements
At June 30, 2015, the fair value of the crude oil derivative contracts totaled a $279.8 million asset. Partly offsetting the fair value is $106.3 million in deferred premiums and interest to be settled in future periods. The estimated increase in the net asset on our balance sheet of a 10 percent decrease in Brent crude oil prices on the fair values of outstanding crude oil derivative contracts, compared with forward prices used to determine the June 30, 2015 fair values, approximates $18 million. The estimated decrease in the net asset on our balance sheet of a 10 percent increase in Brent crude oil prices on the fair values of outstanding crude oil derivative contracts, compared with the forward prices used to determine the June 30, 2015 fair values, approximates $37 million. See Note 6 to our audited historical financial statements included elsewhere in this prospectus for further discussion of our crude oil and gas derivative contracts.
Interest Rate Risk
At June 30, 2015, we had total debt maturities of $8.5 billion, of which 70 percent was the variable-rate revolving notes with FCX. Interest rates on the FCX revolving notes are based on LIBOR, plus the higher of (i) 1.75 percent or (ii) the current applicable rate defined under FCX’s Revolving Credit Agreement.
Critical Accounting Policies and Estimates
Our consolidated financial statements, both that of our Successor and Predecessor, have been prepared in conformity with GAAP in the United States. The preparation of these statements requires that we make estimates and assumptions that affect the reported amounts of assets, liabilities, revenues and expenses. We base these estimates on historical experience and on assumptions that we consider reasonable under the circumstances; however, reported results could differ from those based on the current estimates under different assumptions or conditions.
Oil and Gas Reserves. Proved reserves are those quantities of oil and gas, which, by analysis of geoscience and engineering data, can be estimated with reasonable certainty to be economically producible from a given date forward, from known reservoirs, and under existing economic conditions, operating methods and government regulations. The term “reasonable certainty” implies a high degree of confidence that the quantities of oil and gas actually recovered will equal or exceed the estimate. Engineering estimates of proved oil and gas reserves directly impact financial accounting estimates, including DD&A and the ceiling limitation under the full cost method. Estimates of total proved reserves are determined using methods prescribed by the SEC, which require the use of an average reference price calculated as the twelve-month average of the first-day-of-the-month historical market prices for crude oil and gas. Our estimates were based on a West Texas Intermediate, which we refer to as WTI, oil reference price ($71.68 as of June 30, 2015, and $94.99 as of December 31, 2014) per barrel and the Henry Hub spot gas price ($3.39 as of June 30, 2015, and $4.35 as of December 31, 2014) per MMBtu, as adjusted for location and quality differentials, which are held constant throughout the lives of the oil and gas properties, except where such guidelines permit alternate treatment, including the use of fixed and determinable contractual price escalations, but excluding derivatives. Actual future prices and costs may be materially higher or lower than the average prices and costs as of the date of the estimate.
There are numerous uncertainties inherent in estimating quantities and values of proved oil and gas reserves and in projecting future rates of production and the amount and timing of development expenditures, including many factors beyond our control. Future development and abandonment costs are determined annually for each of our properties based upon its geographic location, type of production structure, water depth, reservoir depth and characteristics, currently available procedures and consultations with engineering consultants. Because these costs typically extend many years into the future, estimating these future costs is difficult and requires management to make judgments that are subject to future revisions based upon numerous factors, including changing technology and the political and regulatory environment. Reserve engineering is a subjective process of estimating the recovery from underground accumulations of oil and gas that cannot be measured in an exact manner and the accuracy of any reserve estimate is a function of the quality of available data and of engineering and geological interpretation and judgment. Because all reserve estimates are subjective, the quantities of oil and
86
Table of Contents
Index to Financial Statements
gas that are ultimately recovered, production and operating costs, the amount and timing of future development expenditures and future oil and gas sales prices may all differ from those assumed in our estimates.
See Note 14 to our audited historical financial statements included elsewhere in this prospectus for further information regarding estimated proved oil and gas reserves.
The average DD&A rate per Boe was $36.98 in second-quarter 2015, $39.58 for the first six months of 2015, $38.39 per Boe in second-quarter 2014, $38.30 per Boe for the first six months of 2014, $40.34 for the year ended December 31, 2014, $35.81 for the period from June 1, 2013, to December 31, 2013, $34.59 for the period from January 1, 2013, to May 31, 2013, and $28.32 for the year ended December 31, 2012. After the effect of the ceiling test impairment charges recorded during the year ended December 31, 2014 and for the first six months of 2015, but excluding the impact of additional future ceiling test impairment charges, our DD&A rate per Boe is expected to average $27.52 for the remainder of 2015. Changes to estimates of proved reserves could result in changes to the prospective UOP amortization rate for our oil and gas properties, which could have a significant impact on our results of operations. Based on our estimated proved reserves and our net oil and gas properties subject to amortization at December 31, 2014, a 10 percent increase in our costs subject to amortization would increase our amortization rate by approximately $3.63 per Boe and a 10 percent reduction to proved reserves would increase our amortization rate by approximately $4.04 per Boe. Changes in estimates of proved oil and gas reserves may also affect our future ceiling test calculations. See Note 1 to our audited historical financial statements included elsewhere in this prospectus.
Impairment of Oil and Gas Properties. We follow the full cost method of accounting for our oil and gas operations, whereby all costs associated with oil and gas property acquisition, exploration and development activities are capitalized and amortized to expense under the UOP method on a country-by-country basis using estimates of proved oil and gas reserves relating to each country where such activities are conducted.
In evaluating our oil and gas properties for impairment, estimates of future cash flows associated with proved oil and gas reserves are used. See Note 1 to our audited historical financial statements included elsewhere in this prospectus for further discussion of the ceiling test calculation. Additionally, SEC rules require that we price our future oil and gas production at the twelve-month average of the first-day-of-the-month historical reference prices adjusted for location and quality differentials. Our reference prices are WTI for oil and the Henry Hub spot price for gas. Such prices are utilized except where different prices are fixed and determinable from applicable contracts for the remaining term of those contracts, excluding derivatives. The pricing in ceiling test impairment calculations required by full cost accounting rules may cause results that do not reflect market conditions that exist at the end of an accounting period. For example, in periods of increasing oil and gas prices, the use of a twelve-month historical average price in the ceiling test calculation may result in an impairment. Conversely, in times of declining prices, ceiling test calculations may not result in an impairment.
Net capitalized costs with respect to our proved U.S. oil and gas properties exceeded the ceiling amount specified by SEC full cost accounting rules, which resulted in the recognition of impairment charges totaling $3.7 billion in the year ended December 31, 2014, and $5.8 billion in the first six months of 2015. The SEC requires the twelve-month average of the first-day-of-the-month historical reference oil price to be used in determining the ceiling amount under its full cost accounting rules. This price, using WTI as the reference price, was $94.99 per barrel as of December 31, 2014, and $71.68 per barrel as of June 30, 2015. Because the ceiling test limitation uses a twelve-month historical average price, if WTI oil prices remain below the June 30, 2015, twelve-month average of $71.68 per barrel, the ceiling limitation will decrease. We may incur additional ceiling test impairments to our oil and natural gas properties during the remainder of 2015 if prices do not increase. The possibility and amount of any future impairment is difficult to predict, and will depend, in part, upon future oil and natural gas prices to be utilized in the ceiling test, estimates of proved reserves and future capital expenditures and operating costs.
If the trailing twelve-month average prices for the period ended June 30, 2015, had been $59.35 per barrel of oil and $3.07 per MMBtu of natural gas, while all other inputs and assumptions remained constant, an additional
87
Table of Contents
Index to Financial Statements
pre-tax impairment charge of $1.8 billion would have been recorded to our oil and gas properties in second-quarter 2015. These oil and gas prices were determined using a twelve-month simple average of the first day of the month for the eleven months ended August 2015, and the August 2015 prices were held constant for the remaining one month. The additional pre-tax impairment is partly the result of a 26 percent decrease in proved undeveloped reserves because certain locations would not be economic at these prices. This calculation solely reflects the impact of hypothetical lower oil and natural gas prices on our ceiling test limitation and proved reserves as of June 30, 2015, and does not reflect the reduction in oil and gas capital expenditures that was announced on August 5, 2015. The oil and natural gas price is a single variable in the estimation of our proved reserves and other factors could have a significant impact on future reserves and the present value of future cash flows.
As of June 30, 2015, we also had $9.3 billion of costs for unproved oil and gas properties that were excluded from amortization. These costs will be transferred into the amortization base (i.e., full cost pool) as the properties are evaluated and proved reserves are established or if impairment is determined. We assess our unproved properties at least annually, and if impairment is indicated, the cumulative drilling costs incurred to date for such property and all or a portion of the associated leasehold costs are transferred to the full cost pool and subject to amortization. Accordingly, an impairment of unproved properties does not immediately result in the recognition of a charge to the consolidated statements of operations, but rather increases the costs subject to amortization and the costs subject to the ceiling limitation under the full cost accounting method. The transfer of costs into the amortization base involves a significant amount of judgment and may be subject to changes over time based on our drilling plans and results, geological and geophysical evaluations, the assignment of proved reserves, availability of capital and other factors.
Because the transfer of unevaluated property to the full cost pool requires significant judgment and the ceiling test used to evaluate impairment of our proved oil and gas properties requires us to make several estimates and assumptions that are subject to risk and uncertainty, changes in these estimates and assumptions could result in the impairment of our oil and gas properties. Events that could result in impairment of our oil and gas properties include, but are not limited to, decreases in future crude oil and gas prices, decreases in estimated proved oil and gas reserves, increases in production, development or abandonment costs and any event that might otherwise have a material adverse effect on our oil and gas production levels or costs.
Goodwill. We account for business combinations using the acquisition method of accounting, which requires us to allocate the purchase price to the assets acquired and liabilities assumed based on their estimated fair values on the acquisition date. Determining the fair values of assets acquired and liabilities assumed requires management’s judgment, may include the utilization of independent valuation experts, and often involves the use of significant estimates and assumptions, including future cash flows, discount rates and forward prices. The excess of acquisition consideration over the fair values of assets acquired and liabilities assumed is recorded as goodwill. In connection with FCX’s acquisitions of PXP and McMoRan in 2013, goodwill was recorded, all of which was assigned to FM O&G LLC.
Goodwill is required to be evaluated for impairment on at least an annual basis, or at any other time if events or circumstances indicate that its carrying amount may no longer be recoverable. During fourth-quarter of each year, we conduct a qualitative goodwill impairment assessment, which involves examining relevant events and circumstances which could have a negative impact on our goodwill such as macroeconomic conditions, industry and market conditions, cost factors that have a negative effect on earnings and cash flows, overall financial performance, dispositions and acquisitions, and any other relevant events or circumstances. After assessing the relevant events and circumstances for the qualitative impairment assessment as of December 31, 2014, including the significant decline in oil prices, we determined that performing a quantitative goodwill impairment test was necessary. These evaluations resulted in impairment charges totaling $1.7 billion for the full carrying value of goodwill. Crude oil prices and our estimates of oil reserves at December 31, 2014, represent the most significant assumptions used in our evaluation of goodwill. Forward strip Brent oil prices used in our estimates as of December 31, 2014, ranged from approximately $62 per barrel to $80 per barrel for the years 2015 through 2021.
88
Table of Contents
Index to Financial Statements
Income Taxes. The amount of income taxes recorded by us requires interpretations of complex rules and regulations of various tax jurisdictions. We estimate the actual amount of income taxes currently payable or receivable as well as deferred income tax assets and liabilities attributable to temporary differences between the financial statement carrying amounts of existing assets and liabilities and their respective tax bases. Deferred income tax assets and liabilities are measured using enacted tax rates expected to apply to taxable income in the years in which these temporary differences are expected to be recovered or settled. The effect on deferred income tax assets and liabilities of a change in tax rates or laws is recognized in income in the period in which such changes are enacted.
A valuation allowance is provided for those deferred income tax assets for which it is more likely than not that the related benefits will not be realized. In determining the amount of the valuation allowance, we consider estimated future taxable income as well as feasible tax planning strategies. If we determine that we will not realize all or a portion of our deferred income tax assets, we will increase our valuation allowance. Conversely, if we determine that we will ultimately be able to realize all or a portion of the related benefits for which a valuation allowance has been provided, all or a portion of the related valuation allowance will be reduced. Our valuation allowances at June 30, 2015 and December 31, 2014, totaled $398.8 million and $5.5 million, respectively. See Note 10 to our audited historical financial statements included elsewhere in this prospectus.
Asset Retirement Obligations. Our ARO cover wells, platforms and other structures. At June 30, 2015, we had accrued $1.2 billion associated with ARO. We record the fair value of our estimated ARO associated with tangible long-lived assets in the period incurred. Fair value is measured as the present value of cash flow estimates after considering inflation and, if applicable, a market risk premium. Our cost estimates are reflected on a third-party cost basis and comply with our legal obligation to retire tangible long-lived assets in the period incurred. These cost estimates may differ from financial assurance cost estimates for reclamation activities because of a variety of factors, including obtaining updated cost estimates for reclamation activities, the timing of reclamation activities, changes in scope and the exclusion of certain costs not considered reclamation and closure costs.
Generally, ARO activities are specified by regulations or in permits issued by the relevant governing authority, and management judgment is required to estimate the extent and timing of expenditures. Accounting for ARO represents a critical accounting estimate because (i) we will not incur most of these costs for a number of years, requiring us to make estimates over a long period, (ii) laws and regulations could change in the future and/or circumstances affecting our operations could change, either of which could result in significant changes to our current plans, (iii) the methods used or required to plug and abandon non-producing oil and gas wellbores, remove platforms, tanks, production equipment and flow lines, and restore the wellsite could change, (iv) calculating the fair value of our ARO requires management to estimate projected cash flows, make long-term assumptions about inflation rates, determine our credit-adjusted, risk-free interest rates and determine market risk premiums that are appropriate for our operations and (v) given the magnitude of our estimated wellsite abandonment and restoration costs, changes in any or all of these estimates could have a significant impact on our results of operations.
In May 2014, the Financial Accounting Standards Board, which we refer to as FASB, issued an Accounting Standards Update, which we refer to as ASU, which outlines a single comprehensive model and supersedes most of the current revenue recognition guidance. We are evaluating this new guidance, but do not expect it to have a significant impact on our current revenue recognition policies. In July 2015, the FASB approved a one year deferral of the effective date which permits public entities to apply the new revenue standard for annual and interim reporting periods beginning after December 15, 2018. Early adoption would be permitted, but not before the original effective date (i.e., annual and interim reporting periods beginning after December 15, 2017).
Off-Balance Sheet Arrangements
We have no significant off-balance sheet arrangements.
89
Table of Contents
Index to Financial Statements
Product Revenues and Cash Production Costs
Realized revenues and cash production costs per unit, non-GAAP financial measures, are measures intended to provide investors with information about the cash operating margin, a non-GAAP financial measure of our oil and gas operations expressed on a basis relating to each product sold. We use this measure for the same purpose and for monitoring operating performance of our oil and gas operations. This information differs from measures of performance determined in accordance with GAAP and should not be considered in isolation or as a substitute for measures of performance determined in accordance with GAAP. Our measures may not be comparable to similarly titled measures reported by other companies.
We show revenue adjustments from derivative contracts as separate line items. Because these adjustments do not result from oil and gas sales, these gains and losses have been reflected separately from revenues on current period sales. Additionally, accretion and other costs are removed from production costs in the calculation of cash production costs per Boe. The following schedules include calculations of oil and gas product revenues and cash production costs together with a reconciliation to amounts reported in our consolidated financial statements.
For comparative purposes, production costs for the Predecessor periods have been presented on a consistent basis with production costs for the Successor periods. Accordingly, production costs include operating costs and expenses reported in the consolidated financial statements of the Predecessor, excluding DD&A (which is presented separately in the reconciliation), general and administrative expense and acquisition and merger related costs. Additionally, the Predecessor consolidated financial statements present net mark-to-market losses on derivative contracts as a component of other expense (income), whereas the Successor consolidated financial statements presents net mark-to-market gains (losses) on derivative contracts in revenues. In order to present realized revenues on a consistent basis with the Successor periods, the net mark-to-market gains (losses) for the predecessor periods have been presented as part of revenues.
90
Table of Contents
Index to Financial Statements
FCX O&G (Successor)
Product Revenues, Cash Production Costs and Realizations
Three Months Ended June 30, 2015
| Oil | Gas | NGLs | Total | |||||||||||||
| (in thousands) | ||||||||||||||||
| Oil and gas revenues before derivatives |
$ | 480,018 | $ | 62,492 | $ | 12,013 | $ | 554,523 | ||||||||
| Cash gains on derivative contracts |
101,348 | — | — | 101,348 | ||||||||||||
|
|
|
|
|
|
|
|
|
|||||||||
| Realized revenues |
$ | 581,366 | $ | 62,492 | $ | 12,013 | 655,871 | |||||||||
|
|
|
|
|
|
|
|||||||||||
| Less: cash production costs |
249,681 | |||||||||||||||
|
|
|
|||||||||||||||
| Cash operating margin |
406,190 | |||||||||||||||
| Less: DD&A |
484,719 | |||||||||||||||
| Less: impairment of oil and gas properties |
2,683,234 | |||||||||||||||
| Less: accretion and other operating expense |
32,340 | |||||||||||||||
| Plus: net noncash mark-to-market losses on derivative contracts |
(95,121 | ) | ||||||||||||||
| Plus: other operating revenues |
8,039 | |||||||||||||||
|
|
|
|||||||||||||||
| Gross loss |
$ | (2,881,185 | ) | |||||||||||||
|
|
|
|||||||||||||||
| Oil (MBbls) |
8,599 | |||||||||||||||
| Gas (MMcf) |
23,534 | |||||||||||||||
| NGLs (MBbls) |
586 | |||||||||||||||
| Oil equivalents (MBoe) |
13,107 | |||||||||||||||
| Oil (per barrel) |
Gas (per MMBtu) |
NGLs (per barrel) |
Per Boe | |||||||||||||
| Oil and gas revenues before derivatives |
$ | 55.82 | $ | 2.66 | $ | 20.50 | $ | 42.31 | ||||||||
| Cash gains on derivative contracts |
11.79 | — | — | 7.73 | ||||||||||||
|
|
|
|
|
|
|
|
|
|||||||||
| Realized revenues |
$ | 67.61 | $ | 2.66 | $ | 20.50 | 50.04 | |||||||||
|
|
|
|
|
|
|
|||||||||||
| Less: cash production costs |
19.04 | |||||||||||||||
|
|
|
|||||||||||||||
| Cash operating margin |
31.00 | |||||||||||||||
| Less: DD&A |
36.98 | |||||||||||||||
| Less: impairment of oil and gas properties |
204.72 | |||||||||||||||
| Less: accretion and other operating expense |
2.46 | |||||||||||||||
| Plus: net noncash mark-to-market losses on derivative contracts |
(7.26 | ) | ||||||||||||||
| Plus: other operating revenues |
0.61 | |||||||||||||||
|
|
|
|||||||||||||||
| Gross loss |
$ | (219.81 | ) | |||||||||||||
|
|
|
|||||||||||||||
91
Table of Contents
Index to Financial Statements
Reconciliation to Amounts Reported
| Revenues | Production Costs |
DD&A and Impairment of Oil and Gas Properties |
||||||||||
| (in thousands) | ||||||||||||
| Totals presented above |
$ | 554,523 | $ | 249,681 | $ | 484,719 | ||||||
| Cash gains on derivative contracts |
101,348 | — | — | |||||||||
| Net noncash mark-to-market losses on derivative contracts |
(95,121 | ) | — | — | ||||||||
| Accretion and other operating expense |
— | 32,340 | — | |||||||||
| Impairment of oil and gas properties |
— | — | 2,683,234 | |||||||||
| Other operating revenues |
8,039 | — | — | |||||||||
|
|
|
|
|
|
|
|||||||
| As reported in consolidated financial statements |
$ | 568,789 | $ | 282,021 | $ | 3,167,953 | ||||||
|
|
|
|
|
|
|
|||||||
| MBoe | Revenues (in thousands) |
Average Realized Price per Boe |
Cash Production Costs (in thousands) |
Cash Production Costs per Boe |
||||||||||||||||
| Gulf of Mexico |
7,310 | $ | 349,594 | $ | 47.82 | $ | 124,093 | $ | 16.98 | |||||||||||
| California |
3,462 | 167,227 | 48.30 | 93,941 | 27.13 | |||||||||||||||
| Haynesville/Madden/Other |
2,335 | 37,702 | 16.15 | 31,647 | 13.55 | |||||||||||||||
|
|
|
|
|
|
|
|||||||||||||||
| 13,107 | $ | 554,523 | 42.31 | $ | 249,681 | 19.04 | ||||||||||||||
|
|
|
|
|
|
|
|||||||||||||||
FCX O&G (Successor)
Product Revenues, Cash Production Costs and Realizations
Three Months Ended June 30, 2014
| Oil | Gas | NGLs | Total | |||||||||||||
| (in thousands) | ||||||||||||||||
| Oil and gas revenues before derivatives |
$ | 1,172,763 | $ | 95,342 | $ | 37,601 | $ | 1,305,706 | ||||||||
| Cash losses on derivative contracts |
(57,858 | ) | (5,250 | ) | — | (63,108 | ) | |||||||||
|
|
|
|
|
|
|
|
|
|||||||||
| Realized revenues |
$ | 1,114,905 | $ | 90,092 | $ | 37,601 | 1,242,598 | |||||||||
|
|
|
|
|
|
|
|||||||||||
| Less: cash production costs |
313,835 | (1) | ||||||||||||||
|
|
|
|||||||||||||||
| Cash operating margin |
928,763 | |||||||||||||||
| Less: DD&A |
615,386 | |||||||||||||||
| Less: accretion and other operating expense |
15,110 | |||||||||||||||
| Plus: net noncash mark-to-market losses on derivative contracts |
(7,059 | ) | ||||||||||||||
| Plus: other operating revenues |
565 | |||||||||||||||
|
|
|
|||||||||||||||
| Gross profit |
$ | 291,773 | ||||||||||||||
|
|
|
|||||||||||||||
| Oil (MBbls) |
11,674 | |||||||||||||||
| Gas (MMcf) |
20,303 | |||||||||||||||
| NGLs (MBbls) |
969 | |||||||||||||||
| Oil equivalents (MBoe) |
16,028 | |||||||||||||||
92
Table of Contents
Index to Financial Statements
| Oil (per barrel) |
Gas (per MMBtu) |
NGLs (per barrel) |
Per Boe | |||||||||||||
| Oil and gas revenues before derivatives |
$ | 100.46 | $ | 4.70 | $ | 38.79 | $ | 81.47 | ||||||||
| Cash losses on derivative contracts |
(4.96 | ) | (0.26 | ) | — | (3.94 | ) | |||||||||
|
|
|
|
|
|
|
|
|
|||||||||
| Realized revenues |
$ | 95.50 | $ | 4.44 | $ | 38.79 | 77.53 | |||||||||
|
|
|
|
|
|
|
|||||||||||
| Less: cash production costs |
19.57 | (1) | ||||||||||||||
|
|
|
|||||||||||||||
| Cash operating margin |
57.96 | |||||||||||||||
| Less: DD&A |
38.39 | |||||||||||||||
| Less: accretion and other operating expense |
0.94 | |||||||||||||||
| Plus: net noncash mark-to-market losses on derivative contracts |
(0.44 | ) | ||||||||||||||
| Plus: other operating revenues |
0.04 | |||||||||||||||
|
|
|
|||||||||||||||
| Gross profit |
$ | 18.23 | ||||||||||||||
|
|
|
|||||||||||||||
Reconciliation to Amounts Reported
| Revenues | Production Costs |
DD&A | ||||||||||
| (in thousands) | ||||||||||||
| Totals presented above |
$ | 1,305,706 | $ | 313,835 | $ | 615,386 | ||||||
| Cash losses on derivative contracts |
(63,108 | ) | — | — | ||||||||
| Net noncash mark-to-market gains on derivative contracts |
(7,059 | ) | — | — | ||||||||
| Accretion and other operating expense |
— | 15,110 | — | |||||||||
| Other operating revenues |
565 | — | — | |||||||||
|
|
|
|
|
|
|
|||||||
| As reported in consolidated financial statements |
$ | 1,236,104 | $ | 328,945 | $ | 615,386 | ||||||
|
|
|
|
|
|
|
|||||||
| (1) | Following is a reconciliation of FCX O&G’s second-quarter 2014 cash production costs per Boe, excluding Eagle Ford: |
| Cash Production Costs (in thousands) |
Oil Equivalents (MBoe) |
Cash Production Costs per Boe |
||||||||||
| Totals presented above |
$ | 313,835 | 16,028 | $ | 19.57 | |||||||
| Less: Eagle Ford |
52,391 | 3,959 | 13.23 | |||||||||
|
|
|
|
|
|||||||||
| $ | 261,444 | 12,069 | 21.66 | |||||||||
|
|
|
|
|
|||||||||
| MBoe | Revenues (in thousands) |
Average Realized Price per Boe |
Cash Production Costs (in thousands) |
Cash Production Costs per Boe |
||||||||||||||||
| Gulf of Mexico |
6,862 | $ | 600,332 | $ | 87.49 | $ | 101,532 | $ | 14.80 | |||||||||||
| California |
3,578 | 337,670 | 94.37 | 134,907 | 37.70 | |||||||||||||||
| Haynesville/Madden/Other |
1,629 | 44,952 | 27.59 | 25,005 | 15.35 | |||||||||||||||
| Eagle Ford |
3,959 | 322,752 | 81.52 | 52,391 | 13.23 | |||||||||||||||
|
|
|
|
|
|
|
|||||||||||||||
| 16,028 | $ | 1,305,706 | 81.47 | $ | 313,835 | 19.57 | ||||||||||||||
|
|
|
|
|
|
|
|||||||||||||||
93
Table of Contents
Index to Financial Statements
FCX O&G (Successor)
Product Revenues, Cash Production Costs and Realizations
Six Months Ended June 30, 2015
| Oil | Gas | NGLs | Total | |||||||||||||
| (in thousands) | ||||||||||||||||
| Oil and gas revenues before derivatives |
$ | 852,907 | $ | 124,753 | $ | 24,105 | $ | 1,001,765 | ||||||||
| Cash gains on derivative contracts |
201,582 | — | — | 201,582 | ||||||||||||
|
|
|
|
|
|
|
|
|
|||||||||
| Realized revenues |
$ | 1,054,489 | $ | 124,753 | $ | 24,105 | 1,203,347 | |||||||||
|
|
|
|
|
|
|
|||||||||||
| Less: cash production costs |
503,416 | |||||||||||||||
|
|
|
|||||||||||||||
| Cash operating margin |
699,931 | |||||||||||||||
| Less: DD&A |
1,014,589 | |||||||||||||||
| Less: impairment of oil and gas properties |
5,787,415 | |||||||||||||||
| Less: accretion and other operating expense |
61,232 | |||||||||||||||
| Plus: net noncash mark-to-market losses on derivative contracts |
(143,535 | ) | ||||||||||||||
| Plus: other operating revenues |
8,776 | |||||||||||||||
|
|
|
|||||||||||||||
| Gross loss |
$ | (6,298,064 | ) | |||||||||||||
|
|
|
|||||||||||||||
| Oil (MBbls) |
16,971 | |||||||||||||||
| Gas (MMcf) |
45,301 | |||||||||||||||
| NGLs (MBbls) |
1,110 | |||||||||||||||
| Oil equivalents (MBoe) |
25,632 | |||||||||||||||
| Oil (per barrel) |
Gas (per MMBtu) |
NGLs (per barrel) |
Per Boe | |||||||||||||
| Oil and gas revenues before derivatives |
$ | 50.25 | $ | 2.75 | $ | 21.71 | $ | 39.08 | ||||||||
| Cash gains on derivative contracts |
11.88 | — | — | 7.87 | ||||||||||||
|
|
|
|
|
|
|
|
|
|||||||||
| Realized revenues |
$ | 62.13 | $ | 2.75 | $ | 21.71 | 46.95 | |||||||||
|
|
|
|
|
|
|
|||||||||||
| Less: cash production costs |
19.62 | |||||||||||||||
|
|
|
|||||||||||||||
| Cash operating margin |
27.33 | |||||||||||||||
| Less: DD&A |
39.58 | |||||||||||||||
| Less: impairment of oil and gas properties |
225.79 | |||||||||||||||
| Less: accretion and other operating expense |
2.39 | |||||||||||||||
| Plus: net noncash mark-to-market losses on derivative contracts |
(5.60 | ) | ||||||||||||||
| Plus: other operating revenues |
0.34 | |||||||||||||||
|
|
|
|||||||||||||||
| Gross loss |
$ | (245.69 | ) | |||||||||||||
|
|
|
|||||||||||||||
94
Table of Contents
Index to Financial Statements
Reconciliation to Amounts Reported
| Revenues | Production Costs |
DD&A and Impairment of Oil and Gas Properties |
||||||||||
| (in thousands) | ||||||||||||
| Totals presented above |
$ | 1,001,765 | $ | 503,416 | $ | 1,014,589 | ||||||
| Cash gains on derivative contracts |
201,582 | — | — | |||||||||
| Net noncash mark-to-market losses on derivative contracts |
(143,535 | ) | — | — | ||||||||
| Accretion and other operating expense |
— | 61,232 | — | |||||||||
| Impairment of oil and gas properties |
— | — | 5,787,415 | |||||||||
| Other operating revenues |
8,776 | — | — | |||||||||
|
|
|
|
|
|
|
|||||||
| As reported in consolidated financial statements |
$ | 1,068,588 | $ | 564,648 | $ | 6,802,004 | ||||||
|
|
|
|
|
|
|
|||||||
| MBoe | Revenues (in thousands) |
Average Realized Price per Boe |
Cash Production Costs (in thousands) |
Cash Production Costs per Boe |
||||||||||||||||
| Gulf of Mexico |
13,971 | $ | 620,371 | $ | 44.40 | $ | 239,936 | $ | 17.17 | |||||||||||
| California |
6,975 | 303,314 | 43.49 | 205,302 | 29.43 | |||||||||||||||
| Haynesville/Madden/Other |
4,686 | 78,080 | 16.66 | 58,178 | 12.42 | |||||||||||||||
|
|
|
|
|
|
|
|||||||||||||||
| 25,632 | $ | 1,001,765 | 39.08 | $ | 503,416 | 19.62 | ||||||||||||||
|
|
|
|
|
|
|
|||||||||||||||
95
Table of Contents
Index to Financial Statements
FCX O&G (Successor)
Product Revenues, Cash Production Costs and Realizations
Six Months Ended June 30, 2014
| Oil | Gas | NGLs | Total | |||||||||||||
| (in thousands) | ||||||||||||||||
| Oil and gas revenues before derivatives |
$ | 2,334,390 | $ | 193,740 | $ | 87,918 | $ | 2,616,048 | ||||||||
| Cash losses on derivative contracts |
(115,080 | ) | (12,707 | ) | — | (127,787 | ) | |||||||||
|
|
|
|
|
|
|
|
|
|||||||||
| Realized revenues |
$ | 2,219,310 | $ | 181,033 | $ | 87,918 | 2,488,261 | |||||||||
|
|
|
|
|
|
|
|||||||||||
| Less: cash production costs |
612,322 | (1) | ||||||||||||||
|
|
|
|||||||||||||||
| Cash operating margin |
1,875,939 | |||||||||||||||
| Less: DD&A |
1,231,831 | |||||||||||||||
| Less: accretion and other operating expense |
27,795 | |||||||||||||||
| Plus: net noncash mark-to-market gains on derivative contracts |
7,511 | |||||||||||||||
| Plus: other operating revenues |
1,226 | |||||||||||||||
|
|
|
|||||||||||||||
| Gross profit |
$ | 625,050 | ||||||||||||||
|
|
|
|||||||||||||||
| Oil (MBbls) |
23,453 | |||||||||||||||
| Gas (MMcf) |
39,782 | |||||||||||||||
| NGLs (MBbls) |
2,076 | |||||||||||||||
| Oil equivalents (MBoe) |
32,160 | |||||||||||||||
| Oil (per barrel) |
Gas (per MMBtu) |
NGLs (per barrel) |
Per Boe | |||||||||||||
| Oil and gas revenues before derivatives |
$ | 99.54 | $ | 4.87 | $ | 42.35 | $ | 81.34 | ||||||||
| Cash losses on derivative contracts |
(4.91 | ) | (0.32 | ) | — | (3.97 | ) | |||||||||
|
|
|
|
|
|
|
|
|
|||||||||
| Realized revenues |
$ | 94.63 | $ | 4.55 | $ | 42.35 | 77.37 | |||||||||
|
|
|
|
|
|
|
|||||||||||
| Less: cash production costs |
19.03 | (1) | ||||||||||||||
|
|
|
|||||||||||||||
| Cash operating margin |
58.34 | |||||||||||||||
| Less: DD&A |
38.30 | |||||||||||||||
| Less: accretion and other operating expense |
0.87 | |||||||||||||||
| Plus: net noncash mark-to-market gains on derivative contracts |
0.23 | |||||||||||||||
| Plus: other operating revenues |
0.04 | |||||||||||||||
|
|
|
|||||||||||||||
| Gross profit |
$ | 19.44 | ||||||||||||||
|
|
|
|||||||||||||||
Reconciliation to Amounts Reported
| Revenues | Production Costs |
DD&A | ||||||||||
| (in thousands) | ||||||||||||
| Totals presented above |
$ | 2,616,048 | $ | 612,322 | $ | 1,231,831 | ||||||
| Cash losses on derivative contracts |
(127,787 | ) | — | — | ||||||||
| Net noncash mark-to-market gains on derivative contracts |
7,511 | — | — | |||||||||
| Accretion and other operating expense |
— | 27,795 | — | |||||||||
| Other operating revenues |
1,226 | — | — | |||||||||
|
|
|
|
|
|
|
|||||||
| As reported in consolidated financial statements |
$ | 2,496,998 | $ | 640,117 | $ | 1,231,831 | ||||||
|
|
|
|
|
|
|
|||||||
96
Table of Contents
Index to Financial Statements
| (1) | Following is a reconciliation of FCX O&G’s six months ended 2014 cash production costs per Boe, excluding Eagle Ford: |
| Cash Production Costs (in thousands) |
Oil Equivalents (MBoe) |
Cash Production Costs per Boe |
||||||||||
| Totals presented above |
$ | 612,322 | 32,160 | $ | 19.03 | |||||||
| Less: Eagle Ford |
112,755 | 8,694 | 12.97 | |||||||||
|
|
|
|
|
|||||||||
| $ | 499,567 | 23,466 | 21.29 | |||||||||
|
|
|
|
|
|||||||||
| MBoe | Revenues (in thousands) |
Average Realized Price per Boe |
Cash Production Costs (in thousands) |
Cash Production Costs per Boe |
||||||||||||||||
| Gulf of Mexico |
13,163 | $ | 1,150,722 | $ | 87.42 | $ | 192,409 | $ | 14.62 | |||||||||||
| California |
7,129 | 663,498 | 93.07 | 264,626 | 37.12 | |||||||||||||||
| Haynesville/Madden/Other |
3,174 | 91,839 | 28.93 | 42,532 | 13.40 | |||||||||||||||
| Eagle Ford |
8,694 | 709,989 | 81.66 | 112,755 | 12.97 | |||||||||||||||
|
|
|
|
|
|
|
|||||||||||||||
| 32,160 | $ | 2,616,048 | 81.34 | $ | 612,322 | 19.03 | ||||||||||||||
|
|
|
|
|
|
|
|||||||||||||||
FCX O&G (Successor)
Product Revenues, Cash Production Costs and Realizations
Year Ended December 31, 2014
| Oil | Gas | NGLs | Total | |||||||||||||
| (in thousands) | ||||||||||||||||
| Oil and gas revenues before derivatives |
$ | 3,721,051 | $ | 353,582 | $ | 127,551 | $ | 4,202,184 | ||||||||
| Cash losses on derivative contracts |
(110,773 | ) | (11,566 | ) | — | (122,339 | ) | |||||||||
|
|
|
|
|
|
|
|
|
|||||||||
| Realized revenues |
$ | 3,610,278 | $ | 342,016 | $ | 127,551 | 4,079,845 | |||||||||
|
|
|
|
|
|
|
|||||||||||
| Less: cash production costs |
1,140,231 | |||||||||||||||
|
|
|
|||||||||||||||
| Cash operating margin |
2,939,614 | |||||||||||||||
| Less: DD&A |
2,291,074 | |||||||||||||||
| Less: impairment of oil and gas properties |
3,737,281 | |||||||||||||||
| Less: accretion and other operating expense |
96,502 | |||||||||||||||
| Plus: net noncash mark-to-market gains on derivative contracts |
626,696 | |||||||||||||||
| Plus: other operating revenues |
3,165 | |||||||||||||||
|
|
|
|||||||||||||||
| Gross loss |
$ | (2,555,382 | ) | |||||||||||||
|
|
|
|||||||||||||||
| Oil (MBbls) |
40,116 | |||||||||||||||
| Gas (MMcf) |
80,842 | |||||||||||||||
| NGLs (MBbls) |
3,211 | |||||||||||||||
| Oil equivalents (MBoe) |
56,801 | |||||||||||||||
97
Table of Contents
Index to Financial Statements
| Oil (per barrel) |
Gas (per MMBtu) |
NGLs (per barrel) |
Per Boe | |||||||||||||
| Oil and gas revenues before derivatives |
$ | 92.76 | $ | 4.37 | $ | 39.73 | $ | 73.98 | ||||||||
| Cash losses on derivative contracts |
(2.76 | ) | (0.14 | ) | — | (2.15 | ) | |||||||||
|
|
|
|
|
|
|
|
|
|||||||||
| Realized revenues |
$ | 90.00 | $ | 4.23 | $ | 39.73 | 71.83 | |||||||||
|
|
|
|
|
|
|
|||||||||||
| Less: cash production costs |
20.08 | |||||||||||||||
|
|
|
|||||||||||||||
| Cash operating margin |
51.75 | |||||||||||||||
| Less: DD&A |
40.34 | |||||||||||||||
| Less: impairment of oil and gas properties |
65.80 | |||||||||||||||
| Less: accretion and other operating expense |
1.69 | |||||||||||||||
| Plus: net noncash mark-to-market gains on derivative contracts |
11.03 | |||||||||||||||
| Plus: other operating revenues |
0.06 | |||||||||||||||
|
|
|
|||||||||||||||
| Gross loss |
$ | (44.99 | ) | |||||||||||||
|
|
|
|||||||||||||||
Reconciliation to Amounts Reported
| Revenues | Production Costs |
DD&A and Impairment of Oil and Gas Properties |
||||||||||
| (in thousands) | ||||||||||||
| Totals presented above |
$ | 4,202,184 | $ | 1,140,231 | $ | 2,291,074 | ||||||
| Cash losses on derivative contracts |
(122,339 | ) | — | — | ||||||||
| Net noncash mark-to-market gains on derivative contracts |
626,696 | — | — | |||||||||
| Accretion and other operating expense |
— | 96,502 | — | |||||||||
| Impairment of oil and gas properties |
— | — | 3,737,281 | |||||||||
| Other operating revenues |
3,165 | — | — | |||||||||
|
|
|
|
|
|
|
|||||||
| As reported in consolidated financial statements |
$ | 4,709,706 | $ | 1,236,733 | $ | 6,028,355 | ||||||
|
|
|
|
|
|
|
|||||||
| MBoe | Revenues (in thousands) |
Average Realized Price per Boe |
Cash Production Costs (in thousands) |
Cash Production Costs per Boe |
||||||||||||||||
| Gulf of Mexico |
26,491 | $ | 2,097,284 | $ | 79.17 | $ | 413,901 | $ | 15.62 | |||||||||||
| California |
14,298 | 1,196,036 | 83.65 | 523,102 | 36.59 | |||||||||||||||
| Haynesville/Madden/Other |
7,318 | 198,875 | 27.18 | 90,473 | 12.36 | |||||||||||||||
| Eagle Ford |
8,694 | 709,989 | 81.66 | 112,755 | 12.97 | |||||||||||||||
|
|
|
|
|
|
|
|||||||||||||||
| 56,801 | $ | 4,202,184 | 73.98 | $ | 1,140,231 | 20.08 | ||||||||||||||
|
|
|
|
|
|
|
|||||||||||||||
98
Table of Contents
Index to Financial Statements
FCX O&G (Successor)
Product Revenues, Cash Production Costs and Realizations
Period from June 1—December 31, 2013
| Oil | Gas | NGLs | Total | |||||||||||||
| (in thousands) | ||||||||||||||||
| Oil and gas revenues before derivatives |
$ | 2,654,412 | $ | 201,940 | $ | 92,324 | $ | 2,948,676 | ||||||||
| Cash (losses) gains on derivative contracts |
(36,068 | ) | 14,159 | — | (21,909 | ) | ||||||||||
|
|
|
|
|
|
|
|
|
|||||||||
| Realized revenues |
$ | 2,618,344 | $ | 216,099 | $ | 92,324 | 2,926,767 | |||||||||
|
|
|
|
|
|
|
|||||||||||
| Less: cash production costs |
652,376 | |||||||||||||||
|
|
|
|||||||||||||||
| Cash operating margin |
2,274,391 | |||||||||||||||
| Less: DD&A |
1,363,618 | |||||||||||||||
| Less: accretion and other operating expense |
29,993 | |||||||||||||||
| Plus: net noncash mark-to-market losses on derivative contracts |
(312,293 | ) | ||||||||||||||
| Plus: other operating revenues |
1,492 | |||||||||||||||
|
|
|
|||||||||||||||
| Gross profit |
$ | 569,979 | ||||||||||||||
|
|
|
|||||||||||||||
| Oil (MBbls) |
26,630 | |||||||||||||||
| Gas (MMcf) |
54,175 | |||||||||||||||
| NGLs (MBbls) |
2,417 | |||||||||||||||
| Oil equivalents (MBoe) |
38,077 | |||||||||||||||
| Oil (per barrel) |
Gas (per MMBtu) |
NGLs (per barrel) |
Per Boe | |||||||||||||
| Oil and gas revenues before derivatives |
$ | 99.67 | $ | 3.73 | $ | 38.20 | $ | 77.45 | ||||||||
| Cash (losses) gains on derivative contracts |
(1.35 | ) | 0.26 | — | (0.58 | ) | ||||||||||
|
|
|
|
|
|
|
|
|
|||||||||
| Realized revenues |
$ | 98.32 | $ | 3.99 | $ | 38.20 | 76.87 | |||||||||
|
|
|
|
|
|
|
|||||||||||
| Less: cash production costs |
17.14 | |||||||||||||||
|
|
|
|||||||||||||||
| Cash operating margin |
59.73 | |||||||||||||||
| Less: DD&A |
35.81 | |||||||||||||||
| Less: accretion and other operating expense |
0.79 | |||||||||||||||
| Plus: net noncash mark-to-market losses on derivative contracts |
(8.20 | ) | ||||||||||||||
| Plus: other operating revenues |
0.04 | |||||||||||||||
|
|
|
|||||||||||||||
| Gross profit |
$ | 14.97 | ||||||||||||||
|
|
|
|||||||||||||||
Reconciliation to Amounts Reported
| Revenues | Production Costs |
DD&A | ||||||||||
| (in thousands) | ||||||||||||
| Totals presented above |
$ | 2,948,676 | $ | 652,376 | $ | 1,363,618 | ||||||
| Cash losses on derivative contracts |
(21,909 | ) | — | — | ||||||||
| Net noncash mark-to-market losses on derivative contracts |
(312,293 | ) | — | — | ||||||||
| Accretion and other operating expense |
— | 29,993 | — | |||||||||
| Other operating revenues |
1,492 | — | — | |||||||||
|
|
|
|
|
|
|
|||||||
| As reported in consolidated financial statements |
$ | 2,615,966 | $ | 682,369 | $ | 1,363,618 | ||||||
|
|
|
|
|
|
|
|||||||
99
Table of Contents
Index to Financial Statements
| MBoe | Revenues (in thousands) |
Average Realized Price per Boe |
Cash Production Costs (in thousands) |
Cash Production Costs per Boe |
||||||||||||||||
| Gulf of Mexico |
15,286 | $ | 1,284,046 | $ | 84.00 | $ | 213,028 | $ | 13.94 | |||||||||||
| California |
8,293 | 779,130 | 93.95 | 268,118 | 32.33 | |||||||||||||||
| Haynesville/Madden/Other |
4,574 | 102,765 | 22.47 | 52,416 | 11.46 | |||||||||||||||
| Eagle Ford |
9,924 | 782,735 | 78.87 | 118,814 | 11.97 | |||||||||||||||
|
|
|
|
|
|
|
|||||||||||||||
| 38,077 | $ | 2,948,676 | 77.45 | $ | 652,376 | 17.14 | ||||||||||||||
|
|
|
|
|
|
|
|||||||||||||||
100
Table of Contents
Index to Financial Statements
PXP (Predecessor)
Product Revenues, Cash Production Costs and Realizations
Period from January 1—May 31, 2013
| Oil | Gas | NGLs | Total | |||||||||||||
| (in thousands) | ||||||||||||||||
| Oil and gas revenues before derivatives |
$ | 1,856,495 | $ | 127,398 | $ | 55,763 | $ | 2,039,656 | ||||||||
| Cash (losses) gains on derivative contracts |
(26,495 | ) | 10,605 | — | (15,890 | ) | ||||||||||
|
|
|
|
|
|
|
|
|
|||||||||
| Realized revenues |
$ | 1,830,000 | $ | 138,003 | $ | 55,763 | 2,023,766 | |||||||||
|
|
|
|
|
|
|
|||||||||||
| Less: cash production costs |
405,999 | |||||||||||||||
|
|
|
|||||||||||||||
| Cash operating margin |
1,617,767 | |||||||||||||||
| Less: DD&A |
873,445 | |||||||||||||||
| Less: accretion and other operating expense |
25,161 | |||||||||||||||
| Plus: net noncash mark-to-market losses on derivative contracts |
(8,798 | ) | ||||||||||||||
| Plus: other operating revenues |
2,146 | |||||||||||||||
|
|
|
|||||||||||||||
| Gross profit |
$ | 712,509 | ||||||||||||||
|
|
|
|||||||||||||||
| Oil (MBbls) |
17,700 | |||||||||||||||
| Gas (MMcf) |
36,148 | |||||||||||||||
| NGLs (MBbls) |
1,528 | |||||||||||||||
| Oil equivalents (MBoe) |
25,253 | |||||||||||||||
| Oil (per barrel) |
Gas (per MMBtu) |
NGLs (per barrel) |
Per Boe | |||||||||||||
| Oil and gas revenues before derivatives |
$ | 104.89 | $ | 3.53 | $ | 36.50 | $ | 80.77 | ||||||||
| Cash (losses) gains on derivative contracts |
(1.50 | ) | 0.29 | — | (0.63 | ) | ||||||||||
|
|
|
|
|
|
|
|
|
|||||||||
| Realized revenues |
$ | 103.39 | $ | 3.82 | $ | 36.50 | 80.14 | |||||||||
|
|
|
|
|
|
|
|||||||||||
| Less: cash production costs |
16.07 | |||||||||||||||
|
|
|
|||||||||||||||
| Cash operating margin |
64.07 | |||||||||||||||
| Less: DD&A |
34.59 | |||||||||||||||
| Less: accretion and other operating expense |
1.00 | |||||||||||||||
| Plus: net noncash mark-to-market losses on derivative contracts |
(0.35 | ) | ||||||||||||||
| Plus: other operating revenues |
0.08 | |||||||||||||||
|
|
|
|||||||||||||||
| Gross profit |
$ | 28.21 | ||||||||||||||
|
|
|
|||||||||||||||
Reconciliation to Amounts Reported
| Revenues | Production Costs |
DD&A | ||||||||||
| (in thousands) | ||||||||||||
| Totals presented above |
$ | 2,039,656 | $ | 405,999 | (2) | $ | 873,445 | |||||
| Cash losses on derivative contracts |
(15,890 | )(1) | — | — | ||||||||
| Net noncash mark-to-market losses on derivative contracts |
(8,798 | )(1) | — | — | ||||||||
| Accretion and other operating expense |
— | 25,161 | — | |||||||||
| Other operating revenues |
2,146 | — | — | |||||||||
|
|
|
|
|
|
|
|||||||
| As reported in consolidated financial statements |
$ | 2,017,114 | (1) | $ | 431,160 | (2) | $ | 873,445 | ||||
|
|
|
|
|
|
|
|||||||
101
Table of Contents
Index to Financial Statements
| MBoe | Revenues (in thousands) |
Average Realized Price per Boe |
Cash Production Costs (in thousands) |
Cash Production Costs per Boe |
||||||||||||||||
| Gulf of Mexico |
8,938 | $ | 865,883 | $ | 96.88 | $ | 116,079 | $ | 12.99 | |||||||||||
| California |
5,675 | 545,317 | 96.09 | 182,565 | 32.17 | |||||||||||||||
| Haynesville/Madden/Other |
4,020 | 88,079 | 21.91 | 27,889 | 6.94 | |||||||||||||||
| Eagle Ford |
6,620 | 540,377 | 81.63 | 79,466 | 12.00 | |||||||||||||||
|
|
|
|
|
|
|
|||||||||||||||
| 25,253 | $ | 2,039,656 | 80.77 | $ | 405,999 | (1) | 16.07 | |||||||||||||
|
|
|
|
|
|
|
|||||||||||||||
| (1) | The Predecessor consolidated financial statements for the five-month period from January 1, 2013, to May 31, 2013, present net mark-to-market losses on derivative contracts of $24.7 million as a component of Other Expense (Income), whereas the Successor consolidated financial statements present net mark-to-market gains (losses) on derivative contracts in Revenues. For purposes of this reconciliation and in order to present realized revenues on a consistent basis with the Successor periods, the net mark-to-market losses for the five-month Predecessor period have been presented as part of Revenues. |
| (2) | For comparative purposes, production costs for the Successor and Predecessor periods have been presented on a consistent basis. Accordingly, production costs for the five-month Predecessor period from January 1, 2013, to May 31, 2013, include operating costs and expenses reported in the Predecessor’s consolidated financial statements, excluding DD&A (which is presented separately in the above reconciliation), general and administrative expense and acquisition and merger related costs. |
102
Table of Contents
Index to Financial Statements
PXP (Predecessor)
Product Revenues, Cash Production Costs and Realizations
Year Ended December 31, 2012
| Oil | Gas | NGLs | Total | |||||||||||||
| (in thousands) | ||||||||||||||||
| Oil and gas revenues before derivatives |
$ | 2,259,818 | $ | 232,441 | $ | 66,104 | $ | 2,558,363 | ||||||||
| Cash (losses) gains on derivative contracts |
(3,201 | ) | 50,954 | — | 47,753 | |||||||||||
|
|
|
|
|
|
|
|
|
|||||||||
| Realized revenues |
$ | 2,256,617 | $ | 283,395 | $ | 66,104 | 2,606,116 | |||||||||
|
|
|
|
|
|
|
|||||||||||
| Less: cash production costs |
632,452 | |||||||||||||||
|
|
|
|||||||||||||||
| Cash operating margin |
1,973,664 | |||||||||||||||
| Less: DD&A |
1,101,108 | |||||||||||||||
| Less: accretion and other operating expense |
16,917 | |||||||||||||||
| Plus: net noncash mark-to-market losses on derivative contracts |
(50,632 | ) | ||||||||||||||
| Plus: other operating revenues |
6,944 | |||||||||||||||
|
|
|
|||||||||||||||
| Gross profit |
$ | 811,951 | ||||||||||||||
|
|
|
|||||||||||||||
| Oil (MBbls) |
22,685 | |||||||||||||||
| Gas (MMcf) |
87,110 | |||||||||||||||
| NGLs (MBbls) |
1,680 | |||||||||||||||
| Oil equivalents (MBoe) |
38,883 | |||||||||||||||
| Oil (per barrel) |
Gas (per MMBtu) |
NGLs (per barrel) |
Per Boe | |||||||||||||
| Oil and gas revenues before derivatives |
$ | 99.62 | $ | 2.67 | $ | 39.35 | $ | 65.79 | ||||||||
| Cash (losses) gains on derivative contracts |
(0.14 | ) | 0.58 | — | 1.23 | |||||||||||
|
|
|
|
|
|
|
|
|
|||||||||
| Realized revenues |
$ | 99.48 | $ | 3.25 | $ | 39.35 | 67.02 | |||||||||
|
|
|
|
|
|
|
|||||||||||
| Less: cash production costs |
16.27 | |||||||||||||||
|
|
|
|||||||||||||||
| Cash operating margin |
50.75 | |||||||||||||||
| Less: DD&A |
28.32 | |||||||||||||||
| Less: accretion and other operating expense |
0.44 | |||||||||||||||
| Plus: net noncash mark-to-market losses on derivative contracts |
(1.30 | ) | ||||||||||||||
| Plus: other operating revenues |
0.18 | |||||||||||||||
|
|
|
|||||||||||||||
| Gross profit |
$ | 20.87 | ||||||||||||||
|
|
|
|||||||||||||||
Reconciliation to Amounts Reported
| Revenues | Production Costs |
DD&A | ||||||||||
| (in thousands) | ||||||||||||
| Totals presented above |
$ | 2,558,363 | $ | 632,452 | (2) | $ | 1,101,108 | |||||
| Cash gains on derivative contracts |
47,753 | (1) | — | — | ||||||||
| Net noncash mark-to-market losses on derivative contracts |
(50,632 | )(1) | — | — | ||||||||
| Accretion and other operating expense |
— | 16,917 | — | |||||||||
| Other operating revenues |
6,944 | — | — | |||||||||
|
|
|
|
|
|
|
|||||||
| As reported in consolidated financial statements |
$ | 2,562,428 | (1) | $ | 649,369 | (2) | $ | 1,101,108 | ||||
|
|
|
|
|
|
|
|||||||
103
Table of Contents
Index to Financial Statements
| MBoe | Revenues (in thousands) |
Cash Realized Price per Boe |
Cash Production Costs (in thousands) |
Cash Production Costs per Boe |
||||||||||||||||
| Gulf of Mexico |
2,089 | $ | 196,249 | $ | 93.94 | $ | 33,632 | $ | 16.10 | |||||||||||
| California |
14,094 | 1,351,389 | 95.89 | 381,689 | 27.08 | |||||||||||||||
| Haynesville/Madden/Other |
12,582 | 214,378 | 17.04 | 101,574 | 8.07 | |||||||||||||||
| Eagle Ford |
10,118 | 796,347 | 78.71 | 115,557 | 11.42 | |||||||||||||||
|
|
|
|
|
|
|
|||||||||||||||
| 38,883 | $ | 2,558,363 | 65.79 | $ | 632,452 | 16.27 | ||||||||||||||
|
|
|
|
|
|
|
|||||||||||||||
| (1) | The Predecessor consolidated financial statements for the year ended December 31, 2012, presents net mark-to-market losses on derivative contracts of $2.9 million as a component of Other Expense (Income), whereas the Successor consolidated financial statements presents net mark-to-market gains (losses) on derivative contracts in Revenues. For purposes of this reconciliation and in order to present realized revenues on a consistent basis with the Successor periods, the net mark-to-market losses for the Predecessor period have been presented as part of Revenues. |
| (2) | For comparative purposes, production costs for the Successor and Predecessor periods have been presented on a consistent basis. Accordingly, production costs for the Predecessor period for the year ended December 31, 2012, include operating costs and expenses reported in the Predecessor’s consolidated financial statements, excluding DD&A (which is presented separately in the above reconciliation), general and administrative expenses and acquisition and merger related costs. |
104
Table of Contents
Index to Financial Statements
The U.S. Gulf of Mexico, which we refer to as the GOM and which is one of the most prolific hydrocarbon basins in the world, is generally classified into two primary areas: the GOM Shelf and the Deepwater GOM, which is defined as the portion of the GOM with greater than 1,000 feet water depth. Until the late 1970s, the majority of GOM exploration and production occurred on the GOM Shelf. In the mid-1970s, the U.S. government granted the first deepwater leases, and the first commercial deepwater discovery was made shortly thereafter in 1977. Since that initial discovery, numerous large discoveries have confirmed the Deepwater GOM’s hydrocarbon potential and have significantly increased the region’s prominence as an exploration and production area. According to the U.S. Energy Information Administration, which we refer to as the EIA, total production from the Deepwater GOM during the year ended December 31, 2014 totaled 1.6 MMBoe/d, of which 1.2 MMBbl/d was crude oil. The Deepwater GOM has become an integral part of the energy production for the U.S. In 2014, the Deepwater GOM accounted for approximately 13.5 percent of U.S. crude oil production and 4.0 percent of U.S. gas production.
The Deepwater GOM is regarded as a highly favorable area for investment due to the attractive U.S. fiscal regime, low political risk, large remaining hydrocarbon resources, established infrastructure and growth opportunities in emerging plays. In addition to FCX O&G, large companies with significant operations in the Deepwater GOM include Anadarko, BP, BHP Billiton Limited, Chevron Corporation, which we refer to as Chevron, Eni S.p.A., Exxon Mobil Corporation, which we refer to as ExxonMobil, Hess Corporation, which we refer to as Hess, and Shell. An estimated two billion Boe of resources were discovered in 2013 and 2014. Numerous large discoveries have been sanctioned and are in active development and are projected to contribute materially to additional near term production, including Appomattox, Big Bend, Big Foot, Dantzler, Gunflint, Heidelberg, Jack/St. Malo, Julia, Lucius, Stampede, Stones, Troubadour, Tubular Bells and Who Dat.
As a result of recent advancements in seismic imaging, drilling and development technologies, the oil and gas industry’s focus on the Deepwater GOM has increased significantly in recent years. Improvements in seismic imaging have allowed the industry to better distinguish hydrocarbon traps and identify previously unknown prospects. Concurrent advancements in floating production facilities, subsea pumping, separation systems and drilling rigs, including the advent of sixth generation rigs capable of operating in deeper waters and drilling to greater depths, have enabled operators to target previously untested horizons.
The areas most impacted by these recent technological advances are those subsurface regions overlaid with significant layers of salt, which are approximately 20,000 to 40,000 feet below sea level. In the past, the salt canopies have obscured the ability to effectively identify hydrocarbon bearing traps due to seismic distortion caused by the highly refractive nature of salt. While imaging these subsalt reservoirs remains difficult, advanced technologies, particularly the commercial availability of wide-azimuth 3-D seismic data, have meaningfully enhanced the quality of regional data used to identify a prospect. In a wide-azimuth 3-D seismic data survey, a single vessel equipped with multiple recording streamers receives signals emitted from at least two source vessels which shoot each source line multiple times in a single direction. Multiple source vessels make it possible to collect data from many different azimuths.
This technology represents a paradigm shift in marine seismic resolution compared to traditional narrow-azimuth 3-D seismic data, in which a single vessel acts as both the source and recording vessel, because the overlapping data from a wide-azimuth survey minimizes refraction noise and provides multi-angle illumination of targets. As a result, wide-azimuth 3-D seismic data generates substantially more accurate images than traditional 3-D seismic data, helping to reduce exploration risk. 4-D seismic data can also be generated, which is a series of 3-D seismic surveys repeated over a period of time. 4-D seismic data may show depletion of a reservoir and potential flow obstructions that might not be identified in one 3-D snapshot.
105
Table of Contents
Index to Financial Statements
Further, the development of advanced processing algorithms, including pre-stack depth migration, has allowed for a meaningful step change in the detail in which explorationists can view and interpret this data. Pre-stack depth migration is a processing technique that improves definition of the seismic data from a scale of time to a scale of depth, providing an enhanced picture of the subsurface, particularly in relation to salt-impacted areas.
The following diagram illustrates the geologic features common to our areas of exploration and discovery in the Deepwater GOM:
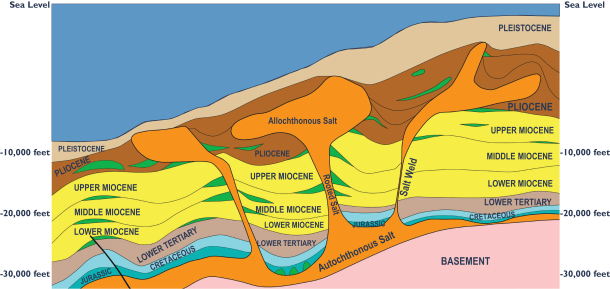
Source: Internal diagram
The continued development of enhanced imaging capabilities has occurred in conjunction with advancements in drilling and production technologies and expansions of deepwater infrastructure. The most recent generation of deepwater drillships is capable of operating in water depths of over 12,000 feet and drilling to depths of up to 40,000 feet. Additional enhancements of the dynamically positioned drillships include dual activity derricks, two blowout preventer stacks, and 2.5 million pound hook loads. These improvements provide the opportunity to achieve more efficient drilling operations, to increase redundancy and to develop deeper casing strings.
Deepwater production technologies, including floating production systems, truss spars, and subsea completions have advanced to the point of wide application across the Deepwater GOM. A recent example of advanced deepwater field development is the Lucius field, which was successfully brought on-line in January 2015 with production from the subsalt Miocene sands located approximately 20,000 feet below sea level. This field is producing through six subsea wells tied back to a floating production facility atop a truss spar. The Lucius development system was built to support production of 80 MBbls and 450 MMcf/d. The Lucius project was developed with production startup three years from sanction and five years from discovery.
Subsea enhancement technologies have worldwide existing and developing applications. Current application methods within the Deepwater GOM include subsea pumping, separation, and lifting. This technology, along with developing subsea compression and raw saltwater injection, has the potential to increase recovery efficiencies throughout the Deepwater GOM.
The most promising economic prospects in the Deepwater GOM reside in the Pliocene and Miocene horizons, as well as in the Lower Tertiary formations.
106
Table of Contents
Index to Financial Statements
Pliocene-aged reservoirs in the Deepwater GOM generally exhibit high permeability and porosity reservoirs that contain high-quality oil and gas. Significant Pliocene discoveries such as Auger, Mars, Delta House and Holstein were made in these confined basins found in the shallower water depth areas of the Deepwater GOM. Further south, and in much deeper water, these Pliocene channels expand into basin floor fans of much greater areal extent. The discoveries at Lucius, Hadrian and Dantzler have been made in these Pliocene basin floor fans.
Miocene-aged reservoirs in the Deepwater GOM also generally exhibit high permeability and contain high-quality oil and gas. The Miocene has yielded discoveries such as Big Bend, Heidelberg, Delta House, Gunflint, Tahiti, Thunderhorse, Troubadour, Tubular Bells and several others. Our Horn Mountain, Marlin, King and Dorado fields produce from the Miocene trend. We also participated in the recent Holstein Deep, Power Nap and Vito discoveries in the Miocene trend.
According to the BOEM, daily production in the Deepwater GOM during 2014 was one MMBbl/d of crude oil and condensate, and two Bcf/d of casinghead and gas-well gas. Historical annual production in the GOM is shown in the chart below:
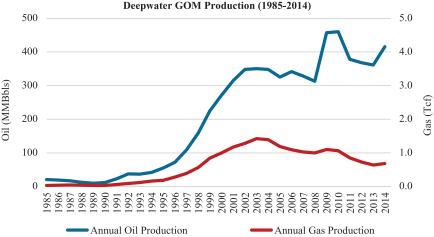
Source: BOEM
Important contributors to the commercial development of the Deepwater GOM are the significant amount of existing takeaway capacity and the buildout of infrastructure associated with new projects. Deepwater GOM infrastructure buildout began in the 1970s and 1980s with construction of large facilities associated with fields on the GOM Shelf. As the production of the original shallow fields declined and deepwater discoveries were made, producers converted these facilities into deepwater hubs. In addition to the original facilities, producers constructed pipelines for various field-specific and shared gathering projects.
As production facilities and associated pipeline capacity are brought on-line in the region, additional discoveries can be tied back to this infrastructure, substantially enhancing field economics through lower capital costs and a decreased lag from discovery to first production. Infrastructure development continued in first-quarter of 2015 as DCP Midstream Partners, L.P. and Williams Partners L.P. commenced operation of the new Keathley Canyon Connector, a deepwater gas gathering system. The new 20-inch, 209-mile Keathley Canyon Connector is capable of gathering more than 400 MMcf/d of gas.
107
Table of Contents
Index to Financial Statements
The map below shows the substantial GOM pipeline infrastructure as of 2012:
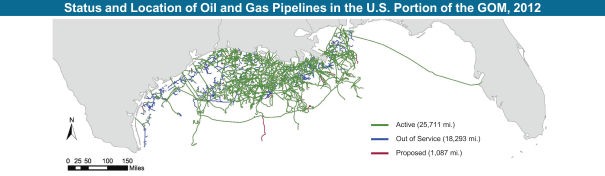
Source: BOEM
Select Producing Fields and Development Projects in the Deepwater GOM
Select Pliocene and Miocene GOM Producing Fields
The chart below presents information regarding select Pliocene and Miocene producing fields in the Deepwater GOM.
| Field (Block) |
Play | Operator | Water Depth (Feet) |
Year Of Discovery |
Year of Start- Up |
2014 Production (MBoe/d) | ||||||||
| Mars (MC 807) |
Pliocene / Miocene |
Shell | 3,341 | 1989 | 1996 | 72 | ||||||||
| Mad Dog (GC 826) |
Miocene | BP | 4,500 | 1998 | 2005 | 25 | ||||||||
| Atlantis (GC 787) |
Miocene | BP | 7,074 | 1998 | 2007 | 147 | ||||||||
| Thunder Horse (MC 778) |
Miocene | BP | 6,077 | 1999 | 2008 | 91 | ||||||||
| Tahiti (GC 640) |
Miocene | Chevron | 4,300 | 2002 | 2009 | 71 | ||||||||
| Holstein (GC 644) |
Miocene | FCX O&G | 4,300 | 1999 | 2004 | 14 | ||||||||
| Horn Mountain (MC 127) |
Miocene | FCX O&G | 5,400 | 1999 | 2002 | 8 | ||||||||
| King (MC 84) |
Miocene | FCX O&G | 5,200 | 1993 | 2002 | 19 | ||||||||
| Dorado (VK 915) |
Miocene | FCX O&G | 3,860 | 2002 | 2009 | 13 | ||||||||
| Ram Powell (VK 912) |
Miocene | Shell | 3,200 | 1995 | 1997 | 5 | ||||||||
| Hoover (AC 25 / EB 945) |
Miocene | ExxonMobil | 4,800 | 1990 /1997 | 2000 | 7 | ||||||||
| Tubular Bells (MC 725) |
Miocene | Hess | 4,300 | 2003 | 2014 | 12 | ||||||||
| Lucius (KC 875) |
Pliocene / Miocene |
Anadarko | 7,200 | 2009 | 2015 | 0 | ||||||||
Source: Public filings, company presentations, internal estimates and press releases.
108
Table of Contents
Index to Financial Statements
Select Pliocene and Miocene GOM Development Projects
The chart below presents information regarding select Pliocene and Miocene development projects in the Deepwater GOM.
| Field |
Play | Operator | Water Depth (Feet) |
Year Of Discovery |
Est. First Production |
|||||||||||
| Stampede (GC 468/512) |
Miocene | Hess | 3,500 | 2005 | 2018 | |||||||||||
| Big Foot (WR 29) |
Miocene | Chevron | 5,200 | 2006 | TBD | |||||||||||
| Hadrian South (KC 964) |
Pliocene / Miocene |
ExxonMobil | 7,650 | 2008 | 2015 | |||||||||||
| Gunflint (MC 948) |
Miocene | Noble Energy | 6,100 | 2008 | 2016 | |||||||||||
| Heidelberg (GC 859) |
Miocene | Anadarko | 5,300 | 2009 | 2016 | |||||||||||
| Vito (MC 940) |
Miocene | Shell | 4,000 | 2009 | 2020 | |||||||||||
| Big Bend (MC 698) |
Miocene | Noble Energy | 7,200 | 2012 | 2015 | |||||||||||
| Delta House (MC 245) |
Pliocene / Miocene |
LLOG Exploration | 4,500 | 2012 | 2015 | |||||||||||
| Dantzler (MC 782) |
Miocene | Noble Energy | 6,580 | 2013 | 2016 | |||||||||||
| Troubadour (MC 699) |
Miocene | Noble Energy | 7,273 | 2013 | TBD | |||||||||||
| Holstein Deep (GC 643) |
Miocene | FCX O&G | 3,890 | 2006 | 2016 | |||||||||||
| Katmai (GC 40) |
Miocene | Noble Energy | 2,100 | 2014 | TBD | |||||||||||
| Power Nap (MC 943) |
Miocene | Shell | 4,200 | 2014 | 2020 | |||||||||||
Source: Public filings, company presentations, internal estimates and press releases.
The U.S. government has generally conducted license, or lease, allocation in the GOM on an annual or biannual basis using a cash bonus bidding system that allocates leases to the bidder offering the largest bonus payment. The first federal awards relating to OCS acreage were made in 1954, although deepwater activity did not commence until the mid-1970s.
Over the last three years, on average, lease bonus awards have ranged from around $0.2 million to $10 million per lease, although they have reached upwards of $150 million on occasion. Winning bidders are required to make nominal rental payments on areas that are under lease but not yet productive, and these payments are superseded by royalty payments on leases which become productive. A lease is “held by production” for an indefinite period from initial production until production ceases. Following cessation of production, a lessee then has 180 days to re-establish production or the lease is terminated unless the lease is still in its primary term. GOM leases may also be unitized, which involves combining two or more leases into a single operating unit. The goal is to allow lessees to minimize the amount of spending and number of wells necessary for efficient exploration, development and production.
On August 12, 2012, the U.S. Secretary of the Interior gave final approval to the schedule of lease sales as part of the OCS Oil and Gas Leasing Program 2012-2017, which we refer to as the Program. The Program, completed by the BOEM, advances a regionally tailored approach that is designed to account for the distinct needs of the areas across the OCS. The Program contemplates 15 potential lease sales in six offshore areas, including those with the highest resource potential of any OCS areas. The Program has scheduled 14 additional sales in offshore areas with active leases and known or anticipated hydrocarbon potential, including portions of the Western, Central and the Eastern GOM not currently under Congressional moratorium.
Results from recent lease sales have been robust, indicating a continued interest in the deepwater leasing market. The June 2012 Lease Sale 216/222 resulted in $1.7 billion in total deepwater spend. The March 2014 Central Lease Sale attracted $851 million and the March 2015 Central Lease Sale attracted $539 million in high bids.
109
Table of Contents
Index to Financial Statements
Total acreage offered in the five year program includes 28.6 million acres, 64.5 million acres and 0.7 million acres in the Western, Central and Eastern GOM, respectively. These lease sales are widely viewed in the oil and gas industry as an important access point for capturing potentially large undeveloped resource accumulations.
In January 2015, the BOEM announced the Draft Proposed Program for the 2017-2022 leasing plan, highlighted by the inclusion of two planning areas located in the Atlantic, the Mid-Atlantic and the South Atlantic. There will be 14 potential lease sales during the period, including 10 lease sales of GOM areas.
110
Table of Contents
Index to Financial Statements
We are an upstream oil and gas energy company primarily engaged in acquiring, exploring for, developing and producing oil and gas properties. We are focused on growing our strategic position in the Deepwater U.S. Gulf of Mexico, which we refer to as the Deepwater GOM. Our Deepwater GOM position has significant current oil production, strong cash margins and existing infrastructure with excess production and handling capacity. We expect this existing infrastructure and our extensive inventory of drilling opportunities will allow us to grow our Deepwater GOM production with comparatively low capital expenditures. In addition, our onshore and offshore properties in California are characterized as low-decline properties with stable production and long-lived reserves. We also have a large, onshore gas position in the Haynesville shale and the Inboard Lower Tertiary/Cretaceous gas trend located onshore in South Louisiana. Our Madden field in Central Wyoming also provides us with additional predictable cash flows, low-decline production and long-lived gas reserves. Our gas-weighted assets position us to benefit from a recovery in gas prices. We are currently focused on growing our proved reserves and production by developing our oil-weighted properties in the Deepwater GOM with a prudent capital profile for the current commodity price environment.
We believe our portfolio of oil and gas properties delivers financially attractive investment opportunities with growth potential in terms of production, cash margin and reserves. For the six months ended June 30, 2015, 88 percent of our oil and gas revenues, excluding the impact of derivative contracts, was from oil and NGLs. Our oil and gas business has significant proved, probable and possible reserves and a broad range of additional development opportunities, including discoveries and identified prospects in the Deepwater GOM. A significant portion of our planned capital expenditures are expected to be focused on converting our probable and possible reserves and prospective resources to the proved reserves category as we are focused on developing our relatively low-risk near-term Deepwater GOM inventory. We strive to manage our business to reinvest cash flows in projects with attractive risk-adjusted rates of return.
Based on data derived from reserve reports prepared by our external, independent petroleum engineering firms, our estimated oil and gas reserves at December 31, 2014 were as follows:
| Oil (MMBbls) |
NGLs (MMBbls) |
Gas (Bcf)(1) |
Total (MMBoe)(1) |
PV-10(2) | ||||||||||||||||
| Proved Reserves(3) |
278 | 10 | 610 | 390 | $ | 8.1 billion | ||||||||||||||
| Probable Reserves(3) |
192 | 7 | 278 | 245 | $ | 4.8 billion | ||||||||||||||
| Possible Reserves(3) |
230 | 9 | 592 | 338 | $ | 6.7 billion | ||||||||||||||
| (1) | Excludes 19 Bcf of proved reserves, 25 Bcf of probable reserves, and 53 Bcf of possible reserves as of December 31, 2014 related to the Highlander gas discovery well located in the Inboard Lower Tertiary/Cretaceous trend, for which external reserve estimates were completed in March 2015. |
| (2) | PV-10 is a non-GAAP financial measure. Standardized Measure is the most directly comparable GAAP measure, which was $6.5 billion for proved reserves at December 31, 2014. GAAP does not provide a measure of estimated future net cash flows for reserves other than proved reserves. Therefore, a reconciliation between PV-10 and Standardized Measure for probable and possible reserves is not subsequently provided. Because PV-10 estimates of probable and possible reserves are more uncertain than the PV-10 and Standardized Measure of proved reserves, but have not been adjusted for risk due to that uncertainty, they may not be comparable with each other. For additional information about PV-10 and how it differs from the Standardized Measure, see “Summary Consolidated Financial, Reserve and Operating Data—Non-GAAP Financial Measures.” |
| (3) | At December 31, 2014, proved undeveloped reserves were composed of 104 MMBbls of oil and NGLs and 241 Bcf of gas for a total of 144 MMBoe, which comprised 37 percent of our total proved reserves. Volumes and values were determined in accordance with SEC rules using reference prices for oil and gas of $94.99 per Bbl and $4.35 per MMBtu, respectively. Our probable and possible reserves include 70 MMBoe and 182 MMBoe, respectively, related to our Deepwater GOM producing assets and discoveries attributable to incremental increases in recovery factor or volumetric drainage areas. Our probable and possible reserves are based upon observed well production performance, reservoir simulation modeling and volumetric calculations. See “Risk Factors—Risks Related to Our Business—Our estimated reserves are based on many assumptions that may turn out to be inaccurate. Significant inaccuracies in these underlying assumptions will materially affect the quantities and present value of our proved reserves.” |
111
Table of Contents
Index to Financial Statements
Our acreage position was 1,022,537 gross (436,189 net) developed acres and 4,017,361 gross (2,458,424 net) undeveloped acres at December 31, 2014. At December 31, 2014, we owned working interests in 3,069 gross (2,991 net) active producing oil wells and 1,710 gross (211 net) active producing gas wells. For the six months ended June 30, 2015, we generated sales volumes of 142 MBoe/d, with realized revenues, including cash gains on derivatives of $46.95 per Boe and cash production costs of $19.62 per Boe. Realized revenue and cash production costs are non-GAAP financial measures. Revenue and production costs, respectively, are the most directly comparable GAAP measure, which were $41.35 per Boe and $22.01 per Boe, respectively, for the six months ended June 30, 2015. See “Summary Consolidated Financial, Reserve and Operating Data—Non-GAAP Financial Measures.”
Deepwater GOM Producing Assets, Sanctioned Discoveries and Associated Drilling Inventory
We have a large strategic position in the Deepwater GOM with significant current oil production, strong cash margins and existing infrastructure with excess production and handling capacity. These assets, combined with our large leasehold interests, provide financially attractive near-term drilling opportunities for growth in oil production and cash margins. Our properties and activities are principally located in four focus areas, which we refer to as Atwater Valley, Green Canyon, Mississippi Canyon and Keathley Canyon. Furthermore, our capital allocation strategy is principally focused on drilling wells that can be tied back expeditiously to our existing facilities. We have adopted a prudent capital profile for the current commodity price environment in which we have deferred certain capital associated with completion and infrastructure spending and are electing to defer production growth for potentially more favorable market conditions. We believe our existing infrastructure provides us with a competitive advantage by allowing for flexibility to control the pace of our development and production activities for relatively low amounts of investment capital as compared to competitors who lack access to such facilities. In addition, we expect to apply existing technologies in subsea pumping and lifting technology to our properties. This technology can provide the potential for increasing hydrocarbon recovery by boosting pressure required for delivery at the existing host platform.
The following is a summary of our Deepwater GOM platforms and currently producing fields at June 30, 2015:
| Avg. Daily Net Sales Volumes for the Six Months Ended June 30, 2015 (MBoe/d) |
Gross |
Gross Oil Capacity Utilization %(1) |
||||||||||||||||||||||||||||||
| Platform |
Working Interest |
Operator | Type of Platform |
Production Commenced |
Water Depth (Feet) |
Oil (MBbls) |
Gas (MMcf) |
|||||||||||||||||||||||||
| Holstein |
100 | % | FCX O&G | Truss Spar | 2004 | 4,300 | 13 | 113 | 142 | 11 | % | |||||||||||||||||||||
| Marlin Hub(2) |
100 | % | FCX O&G | Tension Leg | 2000 | 3,200 | 24 | 60 | 235 | 37 | % | |||||||||||||||||||||
| Horn Mountain |
100 | % | FCX O&G | Truss Spar | 2002 | 5,400 | 9 | 75 | 72 | 11 | % | |||||||||||||||||||||
| Lucius |
25.1 | % | Anadarko | Truss Spar | 2015 | 7,200 | 13 | 80 | 450 | 59 | % | |||||||||||||||||||||
| Ram Powell |
31.0 | % | Shell | Tension Leg | 1997 | 3,200 | 3 | 70 | 310 | 7 | % | |||||||||||||||||||||
| Hoover |
33.3 | % | ExxonMobil | Deep Draft Caisson Vessel |
2000 | 4,800 | 2 | 100 | 325 | 6 | % | |||||||||||||||||||||
|
|
|
|||||||||||||||||||||||||||||||
| Total | 64 | |||||||||||||||||||||||||||||||
| (1) | Represents average daily gross oil production for the six months ended June 30, 2015, as a percentage of total production capacity during such period. |
| (2) | The Marlin Hub is the production facility for three fields: Marlin, Dorado and King. |
Since the acquisition of our Holstein, Marlin Hub and Horn Mountain properties from subsidiaries of BP and Shell in November 2012, we have been active in optimizing production from existing wells through well workover and stimulation activities in previously developed formations. The significant production history from these assets, together with extensive reservoir modeling and multiple series of seismic evaluation and interpretation, gives us high confidence in achieving positive results in our planned near-term development drilling activities. For the six months ended June 30, 2015, we averaged 64 MBoe/d of total net sales volumes from our Deepwater GOM assets.
112
Table of Contents
Index to Financial Statements
Our planned development activities associated with our Deepwater GOM producing assets targeting known productive pay sand in these fields are listed below.
| Identified Undeveloped Locations(1) |
||||||||||||||||||||
| Producing Field |
Focus Area | Working Interest |
Operator | Number of Currently Producing Wells |
Number | Projected First Spud |
||||||||||||||
| Holstein |
Green Canyon | 100 | % | FCX O&G | 11 | 9 | 2016 | |||||||||||||
| Marlin Hub |
Mississippi Canyon | |||||||||||||||||||
| Dorado |
100 | % | FCX O&G | 4 | 2 | 2016 | ||||||||||||||
| King |
100 | % | FCX O&G | 4 | 5 | (2) | 2015 | |||||||||||||
| Horn Mountain |
Mississippi Canyon | 100 | % | FCX O&G | 6 | 7 | (3) | 2015 | ||||||||||||
| Lucius |
Keathley Canyon | 25.1 | % | Anadarko | 6 | 10 | 2016 | |||||||||||||
| Ram Powell |
Mississippi Canyon | 31.0 | % | Shell | 8 | 1 | 2015 | |||||||||||||
|
|
|
|
|
|||||||||||||||||
| Total | 39 | 34 | ||||||||||||||||||
| (1) | Of our 34 identified undeveloped locations associated with our Deepwater GOM producing assets, 19 are included in our reserve reports, 15 of which were classified as proved undeveloped locations, prepared by our external, independent petroleum engineering firms as of December 31, 2014. The drilling locations on which we ultimately drill will depend on the availability of capital, regulatory approvals, commodity prices, costs, actual drilling results and other factors. Any drilling activities on these identified undeveloped locations may not be successful and may not result in additions to our existing proved reserves. Successful drilling activities could require substantial additional capital expenditures. For more information, see “Risk Factors—Risks Related to Our Business—Our business plan requires substantial additional capital, which we may be unable to raise on acceptable terms in the future, which may in turn limit our ability to execute our business plan and could lead to a loss of properties and have a material adverse effect on our production, reserves and results of operations.” |
| (2) | Includes a development well drilled in January 2015. |
| (3) | Includes a development well drilled in June 2015 and two development wells drilled in July 2015. |
Holstein
The Holstein field is located in Green Canyon blocks 644, 645 and 688. Our platform has current production from a series of above salt stacked Pliocene reservoirs ranging in total depth from 12,000 to 18,000 feet. In 2014, we commenced a program to redevelop Holstein and successfully drilled two sidetrack wells utilizing our owned platform drilling rig. As of December 31, 2014, and exclusive of reserves attributable to Holstein Deep, our proved reserves for Holstein totaled 33.8 MMBoe, which were comprised of 29.2 MMBbls of oil, 2.4 MMBbls of NGLs and 13.1 Bcf of gas, our probable reserves totaled 10.9 MMBoe, which were comprised of 9.5 MMBbls of oil, 0.8 MMBbls of NGLs and 4.2 Bcf of gas, and our possible reserves totaled 8.7 MMBoe, which were comprised of 7.6 MMBbls of oil, 0.6 MMBbls of NGLs and 3.2 Bcf of gas. Our future plans for Holstein include additional sidetracks and drilling activities to target unswept hydrocarbon accumulations and improve recovery efficiencies. Our development plan is supported by proprietary seismic data acquired in 2013, which allows for a 4-D evaluation of individual reservoirs within the field. In addition, we have made a significant discovery in deeper subsalt Miocene reservoirs at Holstein Deep, and we are developing this discovery by means of a subsea tieback. The Holstein Platform is currently undergoing several modifications, including the installation of flow line heaters, a chemical injection skid, and adding a topside umbilical termination assembly in order to accommodate the subsea tiebacks necessary for developing Holstein Deep. We have also identified multiple additional opportunities in the Green Canyon area that could be tied back to our Holstein production facility with the potential to apply existing subsea enhancement technologies that could increase total recovery efficiencies for the project. For the six months ended June 30, 2015, our Holstein field produced net average sales volumes of 12.6 MBoe/d.
113
Table of Contents
Index to Financial Statements
Marlin Hub
The Marlin Hub is the production facility for three fields: the Marlin Field (S/2 Viosca Knoll block 871 and N/2 Viosca Knoll block 915), the Dorado Field (Viosca Knoll block 914 and S/2 Viosca Knoll block 915) and the King Field (Mississippi Canyon blocks 84, 85 and 129). Activities in the Marlin Hub area have focused on infield drilling at the Dorado and King fields, which are produced through subsea tie back to the Marlin platform at respective distances of approximately two miles and 16 miles. The Dorado and King reservoirs consist of above salt high-quality Miocene sands that are part of a regionally extensive turbidite sand depositional system with a combination of stratigraphic and structural traps. The reservoirs exhibit a combination of pressure depletion and aquifer support. Reservoir changes through time can be tracked using our proprietary 3-D seismic data acquired in 2013 which is compared to earlier 3-D data shot prior to field development. As of December 31, 2014, our proved reserves at Marlin Hub totaled 28.8 MMBoe, which were comprised of 23.1 MMBbls of oil, 2.0 MMBbls of NGLs and 21.7 Bcf of gas, our probable reserves totaled 30.5 MMBoe, which were comprised of 25.4 MMBbls of oil, 1.8 MMBbls of NGLs and 19.5 Bcf of gas, and our possible reserves totaled 44.9 MMBoe, which were comprised of 37.2 MMBbls of oil, 2.8 MMBbls of NGLs and 29.6 Bcf of gas. In December 2014, we successfully drilled a development well at Dorado that encountered 245 net feet of Miocene oil pay. This well was placed on production in March 2015 after a successful production test with gross volumes in excess of seven MBbls of oil per day and eight MMcf of gas per day and continues to produce at strong rates. At King, we drilled a development well in January 2015 and logged 63 net feet of Miocene oil pay. We subsequently sidetracked and completed this well for an optimum oil take point, and we expect to place this well on production in 2015. In second-quarter 2015, we installed new export flow line flex joints and completed other maintenance activities, which will extend the life of the Marlin Platform. Our future plans include installing additional compression for gas lift utilization and drilling additional producing wells both to optimize recovery and target additional resources primarily in the Dorado and King fields. In addition, we have identified prospective drilling at King West Deep. Future wells in the Marlin Hub area can be brought on-line expeditiously through our existing infrastructure and future subsea tiebacks have the potential to utilize existing subsea enhancement technologies that could increase total recovery efficiencies. For the six months ended June 30, 2015, the Marlin Hub area produced net average sales volumes of 24.1 MBoe/d.
114
Table of Contents
Index to Financial Statements
Horn Mountain
The Horn Mountain field is located in Mississippi Canyon blocks 126 and 127. Our producing wells in the Horn Mountain field target formations similar to those in the Marlin Hub area and are located in the same geologic setting as our production from the Dorado and King fields. The currently producing wells use dry trees to connect to the Horn Mountain spar. To enhance our recovery of remaining oil in place, our future development plan anticipates utilizing subsea tieback wells targeting multiple stacked sands. During the three months ended June 30, 2015, the Quebec/Victory well, the first location of this program, was drilled to 14,780 feet and we have logged 355 net feet of oil and gas pay. Upon completion, we plan to put this well on production in 2016. In June 2015, drilling operations commenced at the Kilo/Oscar and Horn Mountain Updip wells. At Kilo/Oscar, the well was drilled to a total depth of 14,250 feet and successfully logged 166 net feet of oil pay. At Horn Mountain Updip, the well was drilled to a total depth of 14,780 feet and successfully logged 112 net feet of oil and gas pay. This infill development drilling program will target hydrocarbon accumulations in the sands found to be productive at Horn Mountain and, in addition to these three wells, consists of the Horn Mountain Northwest, Eland/Zebra, Sable and Lion locations. The following table details the prospects associated with the Horn Mountain Infill Development Program:
| Prospect |
Identified Prospective Area (Acres)(1) |
Projected Spud Date(1) |
Projected First Production(1) |
|||||||||
| Quebec/Victory |
180 | 2015 | 2016 | |||||||||
| Horn Mountain Updip |
449 | 2015 | 2017 | |||||||||
| Kilo/Oscar |
255 | 2015 | 2016 | |||||||||
| Horn Mountain Northwest |
449 | 2018 | 2018 | |||||||||
| Eland/Zebra |
643 | 2017 | 2019 | |||||||||
| Sable |
246 | 2017 | 2019 | |||||||||
| Lion |
520 | 2017 | 2019 | |||||||||
| (1) | Acreage figures, projected spud dates and projected first production dates represent our estimates based on the development plan with assumed drilling success. The identified prospective acres on which we actually drill will depend on the availability of capital, regulatory approvals, commodity prices, costs, actual drilling results and other factors. Any drilling activities we are able to conduct on these identified prospective areas may not be successful and may not result in our adding additional reserves to our existing proved reserves. FCX O&G operates and owns a 100 percent working interest in all prospects. For the six months ended June 30, 2015, our Horn Mountain field produced net average sales volumes of 8.7 MBoe/d. |
As of December 31, 2014, our proved reserves in the Horn Mountain area totaled 38.6 MMBoe, which were comprised of 33.5 MMBbls of oil, 2.4 MMBbls of NGLs and 16.5 Bcf of gas, our probable reserves totaled 12.8 MMBoe, which were comprised of 11.1 MMBbls of oil, 0.8 MMBbls of NGLs and 5.55 Bcf of gas, and our possible reserves totaled 9.8 MMBoe, which were comprised of 8.5 MMBbls of oil, 0.6 MMBbls of NGLs and 4.2 Bcf of gas. We have also identified prospective drilling in deeper horizons, which we refer to as Horn Mountain Deep, which we plan to spud in third-quarter of 2015. In addition, we plan to develop and explore through subsea tiebacks additional seismically driven resource opportunities in the Mississippi Canyon area as well as deeper potential on the Horn Mountain leases. All planned and prospective drilling at Horn Mountain has the potential to utilize existing subsea enhancement technologies that could increase total recovery efficiencies.
Lucius
The Lucius field is located in Keathley Canyon blocks 874, 875, 918, and 919, where Anadarko is the operator and we own a 25.1 percent working interest. In January 2015, we began production from an initial six-well development in the Lucius field operated by Anadarko. Lucius is a world-class subsalt Pliocene and Miocene discovery targeting a series of lower Pliocene- and upper Miocene-sands with high-quality reservoir attributes trapped in a three-way structural closure against salt at total vertical drilling depths of 16,000 to 20,000 feet. In December 2009, Anadarko announced that the discovery well had been drilled to a total vertical depth of approximately 20,000 feet and encountered more than 200 feet of net oil pay in subsalt Pliocene and Miocene
115
Table of Contents
Index to Financial Statements
sands. In January 2010, Anadarko announced a sidetrack delineation well was drilled to a total vertical depth of 20,600 feet and encountered almost 600 feet of net high-quality oil pay with additional gas condensate pay. In 2011, we and the other working interest owners sanctioned the spar construction, with initial development focused primarily on the Pliocene-aged sands with average net pay thickness of 469 feet. The facility is designed to be able to handle third party tie-back production.
In 2011, we entered into a Deepwater Production and Handling Agreement with the producers of the Hadrian South prospect for production handling services for gas and condensate production to the Lucius Spar from the Hadrian South satellite leases by means of a subsea tieback. In 2015, we entered into a Deepwater Production and Handling Agreement with the producers of the Buckskin and Moccasin prospects for production handling services for oil and gas production to the Lucius Spar from the Buckskin and Moccasin satellite leases by means of a subsea tieback. During the six months ended June 30, 2015, the Lucius oil facility reached capacity of 80 MBbls of gross oil per day.
As of December 31, 2014, our proved reserves at Lucius totaled 25.9 MMBoe, which were comprised of 21.7 MMBbls of oil and 25.3 Bcf of gas, our probable reserves totaled 11.2 MMBoe, which were comprised of 9.1 MMBbls of oil and 12.6 Bcf of gas, and our possible reserves totaled 31.9 MMBoe, which were comprised of 27.3 MMBbls of oil, and 27.8 Bcf of gas. In addition, we have identified further drilling opportunities in the Pliocene and Miocene horizons at Lucius. Our Lucius development is an example of how historically we have partnered with third party capital providers to finance development costs related to our Deepwater GOM properties. In 2011, subsequent to the Lucius discovery well, we raised $450 million through the issuance of convertible preferred stock in one of our subsidiaries that holds a portion of our interest at Lucius.
Plains Offshore Operations Inc., one of our subsidiaries in which third parties own a 20 percent equity interest, holds certain of our Deepwater GOM assets, including a 19.998 percent working interest in the Lucius field. See “Business—Redeemable Noncontrolling Interest—Plains Offshore.” We also own a separate 5.125 percent interest in the Lucius field. For the six months ended June 30, 2015, our Lucius field produced net average sales volumes of 12.7 MBoe/d.
Ram Powell
The Ram Powell field is located in Viosca Knoll blocks 911, 912, 913, 955, 956, and 957 where Shell is the operator and we own a 31 percent working interest. We intend to participate in production optimization projects as well as drilling opportunities in the main field pay intervals. Shell’s program is supported by proprietary seismic data acquired in 2013 which allows for a 4-D look at individual reservoirs within the field. Using this data, in March 2015, Shell successfully drilled a development well at Ram Powell logging 106 feet of pay in above salt Miocene reservoirs. The well has been completed and came online in July 2015. As of December 31, 2014, our proved reserves at Ram Powell totaled 2.7 MMBoe, which were comprised of 1.4 MMBbls of oil and 7.7 Bcf of gas, our probable reserves totaled 1.8 MMBoe, which were comprised of 0.9 MMBbls of oil and 5.6 Bcf of gas, and our possible reserves totaled 1.6 MMBoe, which were comprised of 0.8 MMBbls of oil and 4.7 Bcf of gas. For the six months ended June 30, 2015, our Ram Powell field produced net average sales volumes of 2.8 MBoe/d.
Hoover
The Hoover Field is located in Alaminos Canyon blocks 25 and 26, where ExxonMobil is the operator and we own a 33.3 percent working interest. The Hoover Field is developed through platform wells located on the Hoover platform. As of December 31, 2014, our proved reserves in the Hoover field totaled 3.6 MMBoe, which were comprised of 3.2 MMBbls of oil and 2.3 Bcf of gas, our probable reserves totaled 1.9 MMBoe, which were comprised of 1.7 MMBbls of oil and 1.2 Bcf of gas, and our possible reserves totaled 3.5 MMBoe, which were comprised of 3.1 MMBbls of oil and 2.3 Bcf of gas. For the six months ended June 30, 2015, our Hoover field produced net average sales volumes of 2.1 MBoe/d.
116
Table of Contents
Index to Financial Statements
In addition to our activities on our producing fields we own interests in and have been actively developing two discoveries that have been sanctioned for development. Both of these discoveries are located in our Green Canyon focus area and target subsalt Miocene reservoirs.
The following table provides a summary of our active development projects:
| Discovery |
Working Interest |
Operator | Identified Undeveloped Locations(1) |
Projected First Oil |
Focus Area | |||||||||||
| Holstein Deep |
100 | % | FCX O&G | 10 | (2) | 2016 | Green Canyon | |||||||||
| Heidelberg |
12.5 | % | Anadarko | 9 | (3) | 2016 | Green Canyon | |||||||||
|
|
|
|
||||||||||||||
| Total | 19 | |||||||||||||||
| (1) | Of our 19 identified undeveloped locations associated with our Deepwater GOM discoveries sanctioned for development, 12 are included in our reserve reports, 6 of which are classified as proved undeveloped locations, prepared by our external, independent petroleum engineering firms as of December 31, 2014. The drilling locations on which we ultimately drill will depend on the availability of capital, regulatory approvals, commodity prices, costs, actual drilling results and other factors. Any drilling activities on these identified undeveloped locations may not be successful and may not result in adding additional reserves to our existing proved reserves. Successful drilling activities could require substantial additional capital expenditures. For more information, see “Risk Factors—Risks Related to Our Business—Our business plan requires substantial additional capital, which we may be unable to raise on acceptable terms in the future, which may in turn limit our ability to execute our business plan and could lead to a loss of properties and have a material adverse effect on our production, reserves and results of operations.” |
| (2) | Includes three development wells drilled in December 2014, February 2015 and July 2015, respectively. |
| (3) | Includes three development wells drilled by Anadarko in 2014 and through May 31, 2015. |
Holstein Deep
Holstein Deep is a subsalt three-way faulted closure with Middle and Lower Miocene sand objectives. The Holstein Deep development is located in Green Canyon block 599, 643, 644, and 645, approximately four miles west of our Holstein platform in 3,890 feet of water. Holstein Deep is a planned 10-well, three phase project focused on developing the deeper Holstein structure. Three penetrations have been successfully drilled in Green Canyon block 643 into the subsalt Miocene, and have logged on average approximately 500 feet of net pay per well. The initial discovery well and two subsequent near well sidetracks were drilled on this block in 2006 and 2009, respectively.
In December 2014, we achieved successful results from the first Holstein Deep delineation well. This delineation well, which is approximately one mile south of the discovery well, was drilled to a total depth of 31,100 feet and wireline logs and core data confirmed 444 feet of net oil pay with excellent reservoir characteristics and good correlation to the discovery well and previous confirmation sidetrack penetration. In February 2015, we completed drilling the second delineation well, with positive results. This second well encountered 482 feet of net oil pay. The third delineation well was drilled to 29,440 feet and encountered approximately 200 feet of net oil pay. Drilling results from this initial three-well development program successfully established sand continuity across the primary reservoir.
Production from the initial three-well development is expected to begin in 2016 with estimated risk-adjusted gross initial individual well flowrates of 8 MBbls of oil per day. We have procured and plan to install a four-mile dual six inch flexible flowline and riser pipeline system. The subsea tieback system will include an expandable manifold on the ocean floor to accommodate the initial Holstein Deep wells. The project will also have the potential for applying existing subsea enhancement technologies that could increase total project recovery efficiencies. The initial development focuses on the Lower Miocene M-18 sands in two fault blocks and provides the basis for our existing proved, probable and possible reserves in the field.
As of December 31, 2014, we had no proved reserves associated with Holstein Deep, our probable reserves totaled 32.8 MMBoe, which were comprised of 30.4 MMBbls of oil, 1.3 MMBbls of NGLs and 6.8 Bcf of gas, and our possible reserves totaled 71.2 MMBoe, which were comprised of 66.0 MMBbls of oil, 2.7 MMBbls of NGLs and 14.8 Bcf of gas.
117
Table of Contents
Index to Financial Statements
Based on our drilling, logging and coring analysis and seismic review, we believe substantial additional potential exists on our acreage position in addition to the existing identified reserves. We plan to delineate and develop additional wells specifically targeting the middle Miocene-aged M13 E sands. We also plan to target all of the Miocene sands in additional fault blocks. We are able to identify additional potential through seismic interpretation on Green Canyon block 599, 644, and 645. In addition, the Double Mountain prospect drilled by another operator in 2010 in Green Canyon block 555 encountered what we believe to be similar aged Miocene pay, providing additional support for the upside potential we have identified located north of Green Canyon block 643. We believe that when fully developed this project could have the potential to produce up to 75 MBoe/d.
Heidelberg
Heidelberg, sanctioned mid-2013, is a six-well development, targeting the Miocene-aged M15 sand in Green Canyon blocks 859, 903, 904 and 948 that will tie back to the Heidelberg Spar to be installed in Green Canyon block 860. Anadarko is the operator, and we acquired a 12.5 percent working interest in the project in 2014. The initial Heidelberg discovery well was drilled in 2009 and encountered more than 200 net feet of oil pay. Log and pressure data from the discovery and delineation wells indicate excellent quality, continuous and pressure-connected reservoirs with subsalt Miocene oil. Development drilling commenced in third-quarter of 2014; three development wells have been drilled and completion activities on these wells are currently in progress. During fourth-quarter of 2014, installation operations commenced for flow lines, export lines and suction piles for Heidelberg’s mooring system. Fabrication of the main topsides module is complete, the hull is on location and the mooring lines have been completed. The design of the Heidelberg truss spar is based on the Lucius facility and has capacity of 80 MBbls of oil per day.
As of December 31, 2014, our proved reserves at Heidelberg totaled 10.2 MMBoe, which were comprised of 9.6 MMBbls of oil and 3.9 Bcf of gas, our probable reserves totaled 12.3 MMBoe, which were comprised of 11.5 MMBbls of oil and 4.7 Bcf of gas, and our possible reserves totaled 10.4 MMBoe, which were comprised of 9.7 MMBbls of oil, and 4.0 Bcf of gas. The project remains on track for first production in 2016 with anticipated risk-adjusted gross initial individual well flowrates of 10.4 MBbls of oil per day.
Deepwater GOM Discoveries in Pre-Sanction Stage with Potential Development Opportunities
In addition to our discoveries that have been sanctioned for development, we own working interests in several additional significant oil discoveries that could provide additional production reserves and drilling opportunities. These discoveries consist of subsalt Miocene and Lower Tertiary formations located in our Atwater Valley and Keathley Canyon focus areas. These discoveries hold significant potential and the timing of their development will be dependent on finalization of development plans and sanctioning by us and our partners.
118
Table of Contents
Index to Financial Statements
The following table provides a summary of our discoveries that are in the pre-sanctioning phase:
| Discovery |
Working Interest |
Operator | Identified Undeveloped Locations(1) |
Projected First Oil |
Focus Area | |||||||||||
| Vito |
18.67 | % | Shell | 15 | 2020 | Atwater Valley | ||||||||||
| Power Nap |
50 | % | Shell | 5 | 2020 | Atwater Valley | ||||||||||
| Phobos |
50 | % | Anadarko | 9 | 2020 | Keathley Canyon | ||||||||||
|
|
|
|||||||||||||||
| Total | 29 | |||||||||||||||
| (1) | Of our 29 identified undeveloped locations associated with our Deepwater GOM discoveries in the pre-sanctioning stage, none are included in our reserve reports prepared by our external, independent petroleum engineering firms. The drilling locations on which we ultimately drill will depend on the availability of capital, regulatory approvals, commodity prices, costs, actual drilling results and other factors. Neither the Vito, Power Nap, nor Phobos discoveries have been sanctioned for further development by us or our partners. Any drilling activities on these identified undeveloped locations may not be successful and may not result in adding additional reserves to our existing proved reserves. Successful drilling activities could require substantial additional capital expenditures. For more information, see “Risk Factors—Risks Related to Our Business—Our business plan requires substantial additional capital, which we may be unable to raise on acceptable terms in the future, which may in turn limit our ability to execute our business plan and could lead to a loss of properties and have a material adverse effect on our production, reserves and results of operations.” |
Vito
Vito is a deep subsalt Miocene discovery made in July 2009 by Anadarko located in Mississippi Canyon blocks 940, 941, 984 and 985. The discovery well encountered 250 feet of net oil pay in the subsalt Miocene sands. In September 2009, Shell became the operator and drilled additional delineation wells, extending the discovery. A sidetrack delineation well located in Mississippi Canyon block 940 encountered 600 net feet of oil pay in March 2010. The well was drilled to a total depth of 31,000 feet. We acquired an 18.67 percent working interest in 2014. The project is located in 4,200 feet of water.
A successful, four year, six-well Vito exploration and delineation program was completed in March 2013. This delineation program gathered a significant amount of high-quality subsurface well data. Concurrent with the delineation drilling program, seismic imaging of the prospect area was improved with the acquisition of an Ocean Bottom 3-D Nodal Survey in 2011. The main reservoir at Vito is a Lower Miocene Sand Turbidite, designated “VM80.” The VM80 sand is a thick, deep, highly pressured subsalt formation. The Vito development is subject to sanction by the working interest partners estimated to occur in 2016, with estimated first production in 2020. The working interest partners are evaluating alternatives to maximize the recovery of oil from the VM80 sand. Due to variability of fluid composition across the formation, we are reviewing the possibility of implementing a miscible hydrocarbon gas injection. Vito is currently planned as a 15-well development. Initially, all 15 wells will be on production and over time, as the reservoir pressure drops, four of the 15 wells are planned to be converted to gas injection wells. Assuming project sanction, development drilling could commence in 2017.
The Vito development’s infrastructure is anticipated to consist of subsea development wells, clustered around two drill centers located on the Mississippi Canyon block 940, producing oil and injecting gas through three-mile-long flowlines back to a 120 MBoe/d capacity floating production system to be installed on the Mississippi Canyon block 939. The floating production system would be a four-column, semi-submersible platform similar in design to an existing Shell platform.
Power Nap
Power Nap is a three-way structural trap against salt targeting the Miocene sands in Mississippi Canyon block 943 and 944, where Shell is the operator and we acquired a 50 percent working interest from Anadarko in 2014. In December 2014, we participated in the drilling of the exploration well which was drilled to a total depth of 30,970 feet. Wireline logs and core data indicated that the well encountered hydrocarbons in multiple subsalt Miocene sand packages. Shell successfully drilled a sidetrack well to delineate the reservoir and test the downdip limit of the oil accumulation. Delineation drilling activities consisting of two sidetracks have confirmed the
119
Table of Contents
Index to Financial Statements
findings in the initial well and have successfully extended the known oil reservoir downdip. This discovery sits in 4,200 feet of water. The working interest owners are currently evaluating development options for Power Nap and if sanctioning occurs, first production could occur as early as 2020.
Phobos
Phobos is a four-way anticlinal discovery targeting the Lower Tertiary horizons in Sigsbee Escarpment blocks 39, 40, 41, 82, 83 and 84, where Anadarko is the operator. We acquired a 50 percent working interest in Phobos in 2010 from Anadarko and at a government lease sale. This prospect has an identified prospective area of 9,407 acres. In April 2013, we announced that a discovery well encountered more than 250 net feet of pay in the upper portion of the Lower Tertiary reservoir and was drilled to a total vertical drilling depth of 28,675 feet. This discovery sits in 8,500 feet of water. We expect a potential Phobos development to benefit from its close proximity to the Lucius spar. Currently, the working interest owners are evaluating future plans for this discovery. Plains Offshore Operations Inc. holds our working interest in Phobos. See “Business—Redeemable Noncontrolling Interest—Plains Offshore.”
Deepwater GOM Prospect Inventory and Drilling Plans
In addition to the proved, probable and possible reserves and prospective resources associated with our Deepwater GOM producing assets and Deepwater GOM discoveries, we have a large inventory of identified prospects with production and resource potential. Our inventory consists of both above salt and subsalt formations and is focused on resources that upon success we plan to tieback to our Holstein, Horn Mountain, Marlin and Lucius platforms or can be developed in conjunction with our Vito and Power Nap discoveries, should those discoveries be sanctioned for development. Our operational control and remaining primary term lease position for these prospects allows us the ability to modify the timing of when we expect to drill the initial well in these prospects. We target resources primarily in Pliocene and Miocene reservoirs but also have large prospects in the Lower Tertiary.
Our Deepwater GOM prospect inventory consists of interests in 16 prospects, which were identified by seismic imaging and which include 154 undeveloped well locations. The following table provides a summary of prospects and projected spud dates. The commercial success of these prospects would likely lead to a large number of additional drilling opportunities in the future.
| Prospect |
Operator | Working Interest(1) |
Identified Undeveloped Locations(2) |
Projected Spud Year(3) |
Focus Area | |||||||||||
| Deep Sleep |
Shell | 50 | % | 10 | 2015 | Atwater Valley | ||||||||||
| Horn Mountain Deep |
FCX O&G | 100 | % | 6 | 2015 | Mississippi Canyon | ||||||||||
| Sun |
FCX O&G | 100 | % | 14 | 2016 | Atwater Valley | ||||||||||
| Spitfire |
FCX O&G | 100 | % | 20 | 2016 | Atwater Valley | ||||||||||
| Holstein Wilcox |
FCX O&G | 100 | % | 16 | 2017 | Green Canyon | ||||||||||
| Orange |
FCX O&G | 100 | % | 8 | 2017 | Mississippi Canyon | ||||||||||
| Sugar |
FCX O&G | 100 | % | 8 | 2017 | Mississippi Canyon | ||||||||||
| Rose |
FCX O&G | 100 | % | 6 | 2017 | Mississippi Canyon | ||||||||||
| Fiesta |
FCX O&G | 100 | % | 7 | 2017 | Mississippi Canyon | ||||||||||
| Gator |
FCX O&G | 100 | % | 4 | 2017 | Mississippi Canyon | ||||||||||
| Lionhead |
Anadarko | 50 | % | 11 | 2017 | Keathley Canyon | ||||||||||
| King West Deep |
FCX O&G | 100 | % | 8 | 2018+ | Mississippi Canyon | ||||||||||
| Platinum |
FCX O&G | 100 | % | 5 | 2018+ | Mississippi Canyon | ||||||||||
| Peach |
FCX O&G | 100 | % | 8 | 2018+ | Mississippi Canyon | ||||||||||
| Silverfox |
FCX O&G | 100 | % | 16 | 2018+ | Green Canyon | ||||||||||
| Tungsten |
FCX O&G | 100 | % | 7 | 2018+ | Green Canyon | ||||||||||
|
|
|
|||||||||||||||
| Total | 154 | |||||||||||||||
120
Table of Contents
Index to Financial Statements
| (1) | Our working interests are subject to change as a result of unitization or co-development of the applicable block or area with adjacent acreage. Our working interest may increase or decrease based on the extent and productivity of the discovery. |
| (2) | We work with NSAI in assessing our identified undeveloped locations for our prospects. Of our 154 identified undeveloped locations associated with our Deepwater GOM prospect inventory, none are included in our reserve reports as of December 31, 2014. The drilling locations on which we actually drill will depend on the availability of capital, regulatory approvals, commodity prices, costs, actual drilling results, participation of partners and other factors. Drilling activities on these identified undeveloped locations may not be successful and may not result in our adding additional proved reserves to our existing proved reserves. Successful drilling activities could require substantial additional capital expenditures. For more information, see “Risk Factors—Risks Related to Our Business—Our business plan requires substantial additional capital, which we may be unable to raise on acceptable terms in the future, which may in turn limit our ability to execute our business plan and could lead to a loss of properties and have a material adverse effect on our production, reserves and results of operations.” The number of identified undeveloped locations are based upon our P10 estimates. |
| (3) | See “Risk Factors—Risks Related to Our Business—Drilling for and producing oil and gas are high-risk activities with many uncertainties that may result in a total loss of investment or otherwise adversely affect our business, financial condition or results of operations.” |
Deep Sleep
Deep Sleep is a three-way subsalt structural-stratigraphic trap targeting Lower Miocene turbidite sands in Atwater Valley blocks 18 and 19 where Shell is the operator and we own a 50 percent working interest. We acquired this prospect in 2014 from Anadarko, and it is located in close proximity to our Vito and Power Nap discoveries. Deep Sleep was mapped with TGS Freedom/Patriot Rich Azimuth 3-D seismic data. Deep Sleep has an identified prospective area of 4,034 acres. This prospect sits in 4,200 feet of water and targets a total vertical drilling depth of 31,700 feet. We have commenced drilling at Deep Sleep and assuming success and a sanctioning first production could occur as early as 2020.
Horn Mountain Deep
Horn Mountain Deep is a three-way stratigraphic trap targeting the Middle and Lower Miocene in Mississippi Canyon block 127 where we are the operator and own a 100 percent working interest. We acquired this prospect in 2012 from subsidiaries of BP. This prospect has an identified prospective area of 559 acres and is targeting Miocene sands found productive in other Mississippi Canyon area discoveries. Horn Mountain Deep sits in 4,300 feet of water and targets a total vertical drilling depth of 17,000 feet. We anticipate our first well in the Horn Mountain Deep prospect to be spud in 2015. Horn Mountain Deep was mapped with TGS Justice Wide Azimuth and 2013 proprietary 3-D seismic data. We expect first production could occur as early as 2020.
Sun
Sun is a three-way subsalt structural closure targeting the Middle and Lower Miocene turbidite sands in Atwater Valley blocks 153, 197 and 198 where we are the operator and own a 100 percent working interest. We acquired this prospect at the BOEM lease sales in 2014 and 2015. This prospect has an identified prospective area of 4,878 acres and is targeting the same Miocene sands discovered in the Vito and Power Nap discoveries. This prospect sits in 4,800 feet of water and targets a total vertical drilling depth of 31,000 feet. We anticipate our first well in the Sun prospect to be spud in 2016. Sun was mapped with TGS Freedom/Patriot Rich Azimuth 3-D seismic data. We expect first production could occur as early as 2022.
Holstein Wilcox
Holstein Wilcox is a three-way subsalt faulted closure with Eocene and Paleocene (Lower Tertiary) sand objectives in Green Canyon block 644 where we are the operator and own a 100 percent working interest, which we acquired in 2012 from subsidiaries of BP and Shell. Holstein Wilcox in Green Canyon block 644 has an identified prospective area of 1,451 acres and is targeting the lower Wilcox sands found productive in other Green Canyon areas. This prospect sits in 3,600 feet of water and targets a total vertical drilling depth of 33,000 feet. We anticipate our first well in the Holstein Wilcox to be spud in 2017 as an extension to a planned Holstein
121
Table of Contents
Index to Financial Statements
Deep Miocene well. In addition, the Holstein Wilcox is prospective in Green Canyon blocks 556 and 601, which we acquired at the 2015 BOEM lease sale. Holstein Wilcox was mapped with WesternGeco Revolution Coil Full Azimuth and 2013 proprietary 3-D seismic data. We expect first production could occur as early as 2022.
Orange
Orange is a four-way structural closure with stratigraphic trap targeting the Middle Miocene turbidite sands in Mississippi Canyon block 216 where we are the operator and own a 100 percent working interest. We acquired this prospect at the 2014 BOEM lease sale, and it is located approximately seven miles from the Horn Mountain spar. This prospect has an identified prospective area of 1,594 acres and is targeting the same Miocene sands producing at Horn Mountain. Orange sits in 6,000 feet of water and targets a total vertical drilling depth of 15,200 feet. We anticipate our first well in the Orange prospect to be spud in 2017. Orange was mapped with Wide Azimuth 3-D seismic data. We expect first production could occur as early as 2020.
Sugar
Sugar is a three-way structural closure against salt targeting the Middle Miocene turbidite sands in Mississippi Canyon blocks 37 and 82 where we are the operator and own a 100 percent working interest. We acquired this prospect at the 2014 BOEM lease sale, and it is located approximately six miles from the Horn Mountain spar. This prospect has an identified prospective area of 1,715 acres and is targeting the same Miocene sands producing at Horn Mountain. Sugar sits in 4,100 feet of water and targets a total vertical drilling depth of 14,000 feet. We anticipate our first well in the Sugar prospect to be spud in 2017. Sugar was mapped with TGS Justice Wide Azimuth 3-D seismic data. We expect first production could occur as early as 2021.
Rose
Rose is a three-way subsalt structural closure upthrown to regional fault trapping targeting the Middle Miocene turbidite sands in Mississippi Canyon block 81 where we are the operator and own a 100 percent working interest. We acquired this prospect at the 2014 BOEM lease sale and it is located approximately six miles from the Horn Mountain spar. This prospect has an identified prospective area of 1,418 acres and is targeting the same Miocene sands producing at Horn Mountain. Rose sits in 3,690 feet of water and targets a total vertical drilling depth of 17,100 feet. We anticipate our first well in the Rose prospect to be spud in 2017. Rose was mapped with TGS Justice Wide Azimuth 3-D seismic data. We expect first production could occur as early as 2022.
Fiesta
Fiesta is a combination structural and stratigraphic trap targeting the Middle Miocene turbidite sands in Mississippi Canyon blocks 124, 125, and 168 where we are the operator and own a 100 percent working interest. We acquired this prospect at the 2014 BOEM lease sale and it is located approximately seven miles from the Horn Mountain spar. This prospect has an identified prospective area of 1,929 acres. Fiesta sits in 3,910 feet of water and targets a total vertical drilling depth of 16,500 feet. We anticipate our first well in the Fiesta prospect to be spud in 2017. Fiesta was mapped with TGS Justice Wide Azimuth 3-D seismic data. We expect first production could occur as early as 2021.
Gator
Gator is a stratigraphic amplitude anomaly on a structural nose targeting the Middle Miocene in Mississippi Canyon block 343 where we are the operator and own a 100 percent working interest. We acquired this prospect at the 2014 BOEM lease sale, and it is located approximately 18 miles from the Horn Mountain spar. This prospect has an identified prospective area of 2,116 acres and is targeting the same Miocene sands producing at Horn Mountain and Na Kika. Gator sits in 5,213 feet of water and targets a total vertical drilling depth of 19,500 feet. We anticipate our first well in the Gator prospect to be spud in 2017. Gator was mapped with TGS Justice Wide Azimuth 3-D seismic data. We expect first production could occur as early as 2021.
122
Table of Contents
Index to Financial Statements
Lionhead
Lionhead is an eastward extension of the Lucius and Hadrian discoveries targeting upper Pliocene and Miocene-aged sands in Keathley Canyon blocks 876 and 920 and is located approximately four miles from the Lucius spar. Anadarko is the operator and we own a 50 percent working interest of which we acquired 33 percent working interest in the BOEM lease sale in 2010, and a 17 percent working interest from Apache Deepwater in 2014. Lionhead is a three-way structural trap against a large fault and is located in water depth of 7,200 feet. This prospect has an identified prospective area of 3,438 acres. Lionhead was mapped with WesternGeco Revolution Coil Full Azimuth 3-D seismic data and is targeting sands found in the nearby Lucius producing field. The first well is projected to reach a total depth of 23,000 feet. We anticipate our first well in the Lionhead prospect to be spud in 2017. We expect first production could occur as early as 2022 by means of a subsea tieback to Lucius.
King West Deep
King West Deep is a three-way structural closure upthrown to a regional fault targeting Middle and Lower Miocene turbidite sands in Mississippi Canyon blocks 84, 128 and 129. We are the operator and own a 100 percent working interest. We acquired this prospect in 2012 from subsidiaries of BP. King West Deep has an identified prospective area of 2,100 acres and is targeting Miocene-aged sands found productive in other Mississippi Canyon area discoveries. This prospect sits in 5,400 feet of water and targets a total vertical drilling depth of 14,000 feet. We anticipate our first well in the King West Deep prospect to be spud in 2019. King West Deep was mapped with TGS Justice Wide Azimuth and 2013 proprietary 3-D seismic data. We expect first production could occur as early as 2021 and is anticipated to be tied back to the Marlin Hub.
Platinum
Platinum is a three-way closure against salt targeting the Middle Miocene in Mississippi Canyon block 38 and Viosca Knoll block 1000 where we are the operator and own a 100 percent working interest. We acquired this prospect at the 2013 BOEM lease sale, and it is located approximately eight miles from the Horn Mountain spar. This prospect has an identified prospective area of 4,208 acres and is targeting the same Miocene sands producing at Horn Mountain. Platinum sits in 4,000 feet of water and targets a total vertical drilling depth of 15,500 feet. We anticipate our first well to drill the Platinum prospect to be spud in 2018. Platinum was mapped with TGS Justice Wide Azimuth 3-D seismic data. We expect first production could occur as early as 2021.
Peach
Peach is a three-way closure against salt targeting the Middle Miocene in Mississippi Canyon block 36 where we are the operator and own a 100 percent working interest. We acquired this prospect at the 2014 BOEM lease sale and it is located approximately 10 miles from the Horn Mountain spar. This prospect has an identified prospective area of 1,845 acres and is targeting the same Miocene-aged sands found productive at Horn Mountain. Peach sits in 3,375 feet of water and targets a total vertical drilling depth of 18,000 feet. We anticipate our first well in the Peach prospect to be spud in 2019. Peach was mapped with TGS Justice Wide Azimuth 3-D seismic data. We expect first production could occur as early as 2021.
Silverfox
Silverfox is a three-way structural closure against salt prospect targeting the Pliocene in Green Canyon blocks 823, 866 and 867. We are the operator and own a 100 percent working interest in Green Canyon block 866, which we acquired at the BOEM lease sale in 2010. We own a 35 percent working interest in Green Canyon blocks 823 and 867, which we acquired from Apache Deepwater in 2014. This prospect is located approximately 15 miles from the Holstein spar. This prospect is above Miocene pays which are also prospective. This prospect has an identified prospective area of 5,453 acres. Silverfox was mapped by CGGVeritas NAz and WesternGeco Revolution Coil Full Azimuth 3-D seismic data. This prospect sits in 3,300 feet of water and targets a total vertical drilling depth of 25,000 feet. We anticipate our first well in the Silverfox prospect to be spud in 2018. We expect first production could occur as early as 2024.
123
Table of Contents
Index to Financial Statements
Spitfire
Spitfire is a three-way subsalt structural closure targeting the Middle and Lower Miocene turbidite sands in Atwater Valley blocks 148, 149, 150, 151 and 194 where we are the operator and own a 100 percent working interest. We acquired Atwater Valley block 150 at the BOEM lease sale in 2014 and the remaining blocks from Anadarko in 2014. This prospect has an identified prospective area of 7,130 acres and is targeting the same Miocene-aged sands discovered at Vito and Power Nap. Spitfire sits in 4,500 feet of water and targets a total vertical drilling depth of 31,000 feet. We anticipate our first well in the Spitfire prospect to be spud in 2016. Spitfire was mapped with TGS Freedom/Patriot Rich Azimuth 3-D seismic data. We expect first production could occur as early as 2021.
Tungsten
Tungsten is an above salt Pleistocene-aged amplitude play objective in Green Canyon block 600 where we are the operator and own a 100 percent working interest. We acquired this prospect at the 2013 BOEM lease sale, and it is located four miles from the Holstein spar. Tungsten has an identified prospective area of 996 acres. This prospect sits in 3,600 feet of water and targets a total vertical drilling depth of 5,800 feet. We anticipate our first well in the Tungsten prospect to be spud in 2019. Tungsten was mapped with WesternGeco Revolution Coil Full Azimuth and 2013 proprietary 3-D seismic data. We expect first production could occur as early as 2022.
On a continuous basis we add to our undrilled inventory of prospects through a maturation and enhancement process utilizing our industry experience, drilling results and seismic inventory. We intend to add to this undrilled inventory through farm outs, acquisitions and participation in future BOEM lease sales. Also, as part of our exploration efforts, we regularly collaborate with experienced and respected large independent, major integrated and international state owned oil and gas energy companies on geologic and engineering studies covering currently owned leasehold and uncaptured domestic and international acreage. We believe these efforts will enable us to enhance and optimize our undrilled portfolio.
Our prospect generation approach is predicated upon a thorough, basin-wide understanding of the geologic trends within our focus areas through a detailed review of industry drilling results, followed by a rigorous analysis and reprocessing of our basin wide, focused 3-D seismic data. Consistent with our approach and to drive the internal generation and acquisition of new prospects, we have made significant investments in the latest seismic data and seismic imaging technology. Since 2006, we have spent in excess of $300 million on the acquisition, reprocessing and analysis of extensive geophysical data in the Deepwater GOM. We currently own or have licensed 3-D seismic data covering over 5,000 blocks in the Deepwater GOM. Our seismic data base includes the most recent advanced technologies, including wide-azimuth 3-D data. Wide-azimuth 3-D seismic data generates substantially more accurate images than traditional 3-D seismic data, helping to reduce exploration risk. Wide-azimuth 3-D seismic data is critical to understanding of a particular reservoir’s characteristics, including trapping mechanics and fluid migration patterns. Additionally, we utilize 4-D seismic data, which is a series of 3-D seismic surveys repeated over a period of time. Our technical team also regularly makes use of advanced seismic imaging technology including pre-stack depth migration, which is a technique that uses advanced processing algorithms to transform seismic data from a scale of time to a scale of depth.
Our Holstein Deep, Phobos, Highlander, Vito and Power Nap discoveries are evidence of a successful prospect generation approach coupled with advanced seismic data that resulted in discoveries of significant hydrocarbon reservoirs. We believe that these discoveries will add to our proved reserve base over time. We expect to add Holstein Deep and Highlander reserves starting this year. Going forward, we expect that new prospects generated through our exploration efforts will typically target formations with gross hydrocarbon potential in excess of 100 MMBoe. We expect our exploration process and our collaboration with other companies that have comparable technology and technical expertise to continue to provide significant high-quality prospects. Capri and Eagle are two of our long term exploration prospects and are examples of interests
124
Table of Contents
Index to Financial Statements
acquired through BOEM lease sales, that are currently being matured. Future drilling decisions for these or other prospects will be driven by the results of our exploration process and capital budget considerations. In the current commodity price environment we intend to significantly reduce spending on our exploration inventory in the near term.
| Prospect |
Operator | Working Interest(1) |
Identified Undeveloped Locations(2)(3) |
Focus Area | ||||||||
| Capri |
Anadarko | 58.33 | % | 12 | Keathley Canyon | |||||||
| Eagle |
FCX O&G | 100 | % | 15 | Green Canyon | |||||||
| Giverny |
FCX O&G | 100 | % | 10 | Green Canyon | |||||||
| Kanzi |
FCX O&G | 100 | % | 37 | Keathley Canyon | |||||||
|
|
|
|||||||||||
| Total | 74 | |||||||||||
| (1) | Our working interests are subject to change as a result of unitization or co-development of the applicable block or area with adjacent acreage. Our working interest may increase or decrease based on the extent and productivity of the discovery. |
| (2) | We work with NSAI in assessing our identified undeveloped locations for our prospects. Of our 74 identified undeveloped locations associated with our long-term Deepwater GOM inventory, none are included in our reserve reports as of December 31, 2014. The drilling locations on which we actually drill will depend on the availability of capital, regulatory approvals, commodity prices, costs, actual drilling results and other factors. Drilling activities on these identified undeveloped locations may not be successful and may not result in our adding additional proved reserves to our existing proved reserves. Successful drilling activities could require substantial additional capital expenditures. For more information, see “Risk Factors—Risks Related to Our Business—Our business plan requires substantial additional capital, which we may be unable to raise on acceptable terms in the future, which may in turn limit our ability to execute our business plan and could lead to a loss of properties and have a material adverse effect on our production, reserves and results of operations.” The number of identified undeveloped locations are based upon our P10 estimates. |
| (3) | See “Risk Factors—Risks Related to Our Business—Drilling for and producing oil and gas are high-risk activities with many uncertainties that may result in a total loss of investment or otherwise adversely affect our business, financial condition or results of operations.” |
Capri
Capri is a three-way structural closure against salt prospect targeting Pliocene, Upper Miocene and Lower Tertiary in (a) Keathley Canyon blocks 636, 637, 681, 726, and 727 where Anadarko is the operator and we own a 58.33 percent working interest of which we acquired 33.33 percent at the BOEM lease sale in 2010 and 25 percent from Apache Deepwater in 2014 and (b) Keathley Canyon blocks 638 and 682, where we are the operator and own a 100 percent working interest which we acquired from a subsidiary of BP in 2014. This prospect has an identified prospective area of 3,591 acres. Capri is a breached Lower Tertiary trap analogous to the Lucius and Hadrian discoveries. Capri was mapped using proprietarily processed WesternGeco Wide Azimuth 3-D seismic data. This prospect sits in 6,200 feet of water and targets a total vertical drilling depth of 23,000 feet.
Eagle
Eagle is a three-way closure against salt targeting Miocene and Lower Tertiary sands in Green Canyon Blocks 905, 949, 950 and 951 where we are the operator and own a 100 percent working interest. We acquired Green Canyon Blocks 905 and 949 at the BOEM lease sale in 2014 and Green Canyon Blocks 950 and 951 from a subsidiary of BP. in 2014. Eagle has an identified prospective area of 3,890 acres. This prospect sits in 5,400 feet of water and targets a total vertical drilling depth of 30,000 feet. Eagle was mapped with WesternGeco Revolution Coil Full Azimuth 3-D seismic data.
Giverny
Giverny is a three-way structural closure against salt prospect targeting the upper to middle Miocene in Green Canyon blocks 349 and 393 and Atwater Valley Block 353 where we are the operator and own a 100 percent working interest. We acquired this prospect at the BOEM lease sales in 2008 and 2013. Giverny has an
125
Table of Contents
Index to Financial Statements
identified prospective area of 2,971 acres. Giverny was mapped using CGGVeritas Narrow Azimuth and TGS Liberty Wide Azimuth pre-stack, depth-migrated 3-D seismic data. This prospect sits in 4,000 feet of water and targets a total vertical drilling depth of 24,000 feet.
Kanzi
Kanzi is a three-way closure against salt targeting Pliocene and Cretaceous aged formations in Alaminos Canyon Blocks 651, 695, 738, 739, 782, 783, 784, 826, 827, 828 where we are the operator and own a 100 percent working interest. We acquired a portion of this prospect at BOEM lease sales in 2011 and 2012, as well as in an acquisition from Exxon Mobil in 2014. This prospect has an identified prospective area of 12,165 acres. Kanzi sits in 7,000 feet of water and targets a total vertical drilling depth of 28,000 feet. Kanzi was mapped with a merged, proprietarily processed dataset using CGGV NAz and WesternGeco Wide Azimuth 3-D seismic data.
In addition to employing our exploration process and technical capabilities in the U.S., we have in the past explored for hydrocarbons internationally and may do so in the future. Currently, we have licenses to 1,662 square miles of 3-D seismic data covering deepwater areas, offshore Morocco. Further, we have been pre-qualified as a bidder in the upcoming Mexican lease sale and we are in the early stages of evaluating the hydrocarbon potential of Mexico.
Onshore California
As of December 31, 2014, our proved reserves onshore in California totaled 143.7 MMBoe, which were comprised of 138.6 MMBbls of oil, 1.5 MMBbls of NGLs and 21.8 Bcf of gas, our probable reserves totaled 89.2 MMBoe, which were comprised of 85.1 MMBbls of oil, 0.9 MMBbls of NGLs and 19.6 Bcf of gas, and our possible reserves totaled 64.6 MMBoe, which were comprised of 60.1 MMBbls of oil, 1.3 MMBbls of NGLs and 19.3 Bcf of gas. For the six months ended June 30, 2015, we averaged approximately 30.7 MBoe/d of total net production from our onshore California properties. In 2016 we plan to focus our drilling activities in the Cymric field, our largest property in California.
Los Angeles Basin. We hold a 100 percent working interest in the substantial majority of our Los Angeles Basin properties in the Inglewood, Las Cienegas, Montebello, Packard and San Vicente fields. Our Los Angeles Basin properties are characterized by light crude oil (21 to 32 degree American Petroleum Institute, which we refer to as API, gravity) and have well depths ranging from 2,000 feet to over 10,000 feet. These properties include both primary production and secondary recovery using waterflood methods, where water is injected into the reservoir formation to displace residual oil, and produce with high water cuts. For the six months ended June 30, 2015, we averaged approximately 9.6 MBoe/d including 8.6 MBoe/d of crude oil, 0.4 MBoe/d of NGLs and 4.0 MMcfe/d of gas of total net production from our Los Angeles Basin properties.
In 2014, we spent approximately $77 million on capital projects in the Los Angeles Basin, focused on improved waterflood recovery efficiency through infill drilling, producer and injector well recompletions and facility additions and enhancements to process higher fluid volumes.
San Joaquin Valley Basin. We hold a 100 percent working interest in the majority of our San Joaquin Basin properties in the Cymric, Midway Sunset, McKittrick, South Belridge, North Belridge and Arroyo Grande fields. We utilize enhanced oil recovery techniques on these properties, including cyclic steam and steam flooding. The San Joaquin Basin properties are long-lived fields that have heavier oil (12 to 16 degree API gravity) and shallow wells, generally less than 2,000 feet that require enhanced oil recovery techniques, including steam injection, and produce with high water cuts. For the six months ended June 30, 2015, we averaged approximately 21.0 MBoe/d of crude oil total net production from our San Joaquin Basin properties.
126
Table of Contents
Index to Financial Statements
In 2014, we spent $177 million on capital projects in the San Joaquin Basin focused on improved recovery efficiency through infill drilling, well recompletions, facility expansions and enhancements to process higher fluid volumes. During 2014, we drilled 150 wells, including 32 injector wells, in the San Joaquin Basin.
Offshore California
All of our offshore California properties are located in federal waters approximately three to seven miles offshore in the Santa Maria Basin. As of December 31, 2014, our proved reserves offshore in California totaled 9.5 MMBoe, which were comprised of 8.8 MMBbls of oil, 0.1 MMBbls of NGLs and 3.7 Bcf of gas, our probable reserves totaled 5.3 MMBoe, which were comprised of 4.8 MMBbls of oil, 0.02 MMBbls of NGLs and 2.7 Bcf of gas, and our possible reserves totaled 8.2 MMBoe, which were comprised of 7.8 MMBbls of oil, 0.03 MMBbls of NGLs and 2.5 Bcf of gas. For the six months ended June 30, 2015, we averaged approximately 7.9 MBoe/d of total net production from our offshore California properties.
Point Arguello. We hold a 69.3 percent working interest (58 percent net revenue interest) in the Point Arguello Unit, composed of the Hidalgo, Hermosa and Harvest platforms, and the related transportation, processing and marketing infrastructure. We also hold a 100 percent working interest (83.3 percent net revenue interest) in the Electra Prospect, a 4-way closure targeting the Monterey shale of the same pay at Point Arguello and offsets a vertical well that successfully tested the structure by means of a drill stem test.
Point Pedernales. We hold a 100 percent working interest (83 percent net revenue interest) in the Point Pedernales field, which includes the Irene platform that is utilized to access the Federal OCS Monterey Reservoir by extended reach directional wells and support facilities that lie within the onshore Lompoc field. We recently drilled the Point Pedernales A32 development well, reaching total depth of 8,263 feet and logging over 3,000 feet of quality oil pay in the prolific Upper Monterey section, and are currently completing the well. In addition, the Lompoc Diatomite prospect provides incremental resource potential. We are currently in the process of permitting a nine-well pilot program, with further development contingent on success.
We own a substantial portfolio of gas-weighted assets, including a large position in the Haynesville shale in Louisiana, a position in the Inboard Lower Tertiary/Cretaceous gas trend located onshore in South Louisiana, producing properties on the GOM Shelf and a position in the Madden field located in Central Wyoming. We believe our gas-weighted portfolio offers substantial upside upon the return of a more favorable gas price environment. For the six months ended June 30, 2015, our gas-weighted assets produced approximately 233.8 MMcfe/d.
Haynesville Shale
As of December 31, 2014, in the Haynesville shale, we have a non-operated interest in over 1,400 producing wells with an average working interest of 8.5 percent and leases covering 400,000 gross acres (75,000 net acres). The Haynesville shale is characterized by dry gas production from the Jurassic-aged shale formation in Louisiana and eastern Texas, and typical well depth is 10,500 feet. The area has historically been developed with approximately 4,000 foot horizontal wells at a measured total depth of 16,000 feet. Drilling activities in recent years have been reduced to maximize cash flows in a low gas price environment. Our Haynesville shale position has a well inventory of more than 12,000 gross (1,000 net) wells and more than 95 percent of our acreage position is held by production. As of December 31, 2014, our proved reserves in the Haynesville totaled 290.2 Bcf of gas, our probable reserves totaled 142.5 Bcf, and our possible reserves totaled 269.2 Bcf. For the six months ended June 30, 2015, we averaged approximately 127.2 MMcf/d of total net gas production from our Haynesville shale properties.
127
Table of Contents
Index to Financial Statements
Inboard Lower Tertiary/Cretaceous
We have a position in the Inboard Lower Tertiary/Cretaceous gas trend, located onshore in South Louisiana. Based on our geologic review and interpretation of drilling results we believe the geologic formations present are analogous to productive formations in the Deepwater GOM and onshore in the Gulf Coast region.
In second-quarter 2015, the Highlander well, which has been restricted because of limited processing facilities, averaged a gross rate of 22 MMcf per day (approximately 11 MMcf per day net to FM O&G). Production testing in February 2015 indicated a flow rate of 75 MMcf per day (approximately 37 MMcf per day net to us). We are developing additional processing facilities to accommodate the higher flow rates with installation expected by year-end 2015. In July 2015, the Highlander well was shut in for remedial workover operations to address a mechanical issue encountered in the wellbore. A second well location has been identified, and future plans are being considered. We are the operator and have a 72 percent working interest and an approximate 49 percent net revenue interest in Highlander. We have identified multiple additional locations on the Highlander structure, which is located onshore in South Louisiana where we control rights to more than 50,000 gross acres.
GOM Shelf
Our GOM Shelf properties are primarily located on the Outer Continental Shelf in the shallow waters (less than 500 feet of water) of the GOM and onshore in the Gulf Coast area of Louisiana, with drilling depths not exceeding 15,000 feet considered to be traditional shelf prospects. As of December 31, 2014, our proved reserves in the GOM Shelf area totaled 23.9 MMBoe, which were comprised of 9.9 MMBbls of or and 84.2 Bcf of gas.
Madden
As of December 31, 2014, we owned an approximate non-operated 14 percent working interest in the Madden Deep Unit and Lost Cabin Gas Plant located in Central Wyoming. The Madden Deep Unit is a federal unit operated by Conoco Phillips and consists of acreage in the Wind River Basin. The Madden area is characterized by gas production from multiple stratigraphic horizons of the Lower Fort Union, Lance, Mesa Verde and Cody sands and the Madison Dolomite. Production from the Madden Deep Unit is typically found at depths ranging from 5,500 to 25,000 feet. Our gross acreage in the Madden area is approximately 73,000 gross developed acres (approximately 9,300 net developed acres) and 9,000 undeveloped gross acres (approximately 6,100 net undeveloped acres).
As of December 31, 2014, our proved reserves in the Madden area totaled 19.2 MMBoe, which were comprised of 0.01 MMBbls of oil and 114.8 Bcf of gas, our probable reserves totaled 6.1 Bcf of gas, and our possible reserves 17.1 Bcf of gas. For the six months ended June 30, 2015, we averaged approximately 21.9 MMcf/d of total net gas production from our Madden properties. Our Madden area provides us with low-decline stable cash flows with long reserve life.
Morocco
International Exploration (Morocco). FM O&G has a farm-in arrangement to earn interests in exploration blocks located in the Mazagan permit area offshore Morocco. The exploration area covers 2.2 million gross acres in water depths of 4,500 to 9,900 feet. In May 2015, FM O&G commenced drilling the MZ-1 well associated with the Ouanoukrim prospect. In early August 2015, drilling of the well was completed to its targeted depth of below 20,000 feet to evaluate the primary objectives, which did not contain hydrocarbons. As of June 30, 2015, capitalized costs for international oil and gas exploration activities in Morocco approximated $111 million and additional costs have been incurred subsequent to June 30, 2015, all of which will be transferred to the Moroccan full cost pool in third-quarter 2015. FM O&G currently has no proved reserves or production in Morocco.
128
Table of Contents
Index to Financial Statements
We have a number of competitive strengths that we believe will help us to successfully execute our business strategies, including:
| • | We own a world-class asset portfolio and a large inventory of development projects and prospects in the Deepwater GOM. We have a large strategic position in the Deepwater GOM with significant current oil production, strong cash margins and existing infrastructure with excess production and handling capacity. Our Deepwater GOM portfolio includes 310 identified undeveloped locations in the Pliocene, Miocene and Lower Tertiary trends, which we believe offer impactful development and exploration potential. We have focused our capital on high cash margin oil-weighted properties where we receive favorable prices in relation to WTI. We have an extensive inventory of high-quality seismic imaging encompassing our prospects and covering over 5,000 blocks in the Deepwater GOM. |
In addition to current production, we believe that our Deepwater GOM properties have attractive production growth profiles in well-defined areas driven by our key discoveries and identified prospects. Our existing infrastructure enables us to develop resources using subsea tiebacks. This infrastructure position allows us to reduce the time from investment to first production and our capital costs have the potential to be lower when compared to other operators with similar prospects that lack infrastructure capacity. This is evidenced by our recent Dorado well that was brought on-line within five months of spud and our Holstein Deep and Horn Mountain developments, which we expect to begin production in 2016. Our non-operated interests in the Lucius and Heidelberg are expected to provide additional production growth and our discoveries at Vito and Power Nap have a potential to add value upon their potential sanctioning. Our plan for developing our Deepwater GOM portfolio provides opportunities for near-term cash generation, reserve replacement and long-term production growth.
| • | Our California assets provide significant cash flow from stable production. We believe our long-lived reserve base in California should also provide us with relatively stable production and recurring cash flow with significant exposure to improvements in oil prices. Our inventory consists of more than 4,500 future well operations. Given the maturity of our assets, we believe our drilling and development operations in California are predictable and low risk. Our California production is sold locally under long-term contracts with prices based upon regional benchmarks. In response to current oil market conditions, we plan to focus our 2015 operating and capital expenditures in California on high-margin recompletion and well maintenance activities and conduct a moderate level of drilling in 2016 focused on our Cymric field. |
| • | We own an attractively positioned gas portfolio in Louisiana and Wyoming. We own extensive positions in the Haynesville shale formation in Louisiana, a position in the Inboard Lower Tertiary/Cretaceous gas trend located onshore in South Louisiana and a position in the Madden field located in Central Wyoming. Our gas properties in the Haynesville shale formation and in the Inboard Lower Tertiary/Cretaceous trend are geographically located to benefit from expected gas demand growth at existing and planned LNG terminals and petrochemical plants in the Gulf Coast region. Our position in the Madden field provides us with stable production and cash flows with long reserve life. Our large resource and acreage position provides us with the opportunity for significant reserve and production growth on a rapidly scalable basis upon a return of a more favorable gas price environment. |
| • | Experienced management and technical team with proven offshore and onshore expertise. Our senior management team has extensive expertise in the oil and gas industry, with an average of 33 years of experience, many of which have been spent working together in the Deepwater GOM. We believe this experience, along with widespread industry relationships, allows our senior management team to identify attractive acquisition opportunities and evaluate resource potential. We have also assembled a technical team that includes 135 engineers, 62 geologists/geophysicists and 236 petrotechnical professionals with an average of 26 years of experience. We believe our experienced and cohesive management and technical team will be of strategic importance as we continue to expand our future exploration and development plans. |
129
Table of Contents
Index to Financial Statements
| • | Strong financial position. After giving effect to our corporate reorganization and this offering and the use of proceeds therefrom, we will have zero debt, $ million in cash on hand and $ million of available borrowing capacity through bank credit facilities and/or an intercompany loan agreement with our parent FCX. In the future, we will seek to maintain financial flexibility to enable us to most effectively develop our portfolio in the Deepwater GOM, California and other areas. |
Our strategy consists of the following principal elements:
| • | Grow proved reserves and production through measured development of our asset portfolio. We intend to develop our asset portfolio of identified drilling locations at a prudent pace given the current commodity price environment and plan to seek partnerships with third parties to delineate our discoveries and prospects. Capital expenditures for 2015 are currently estimated to total $2.8 billion, with 79 percent of our 2015 capital budget expected to be directed to our focus areas in the Deepwater GOM. We intend to pursue drilling opportunities that offer competitive risk-adjusted rates of return. We believe our near-term investments are low risk based on production history and industry activity in the area and repeatable as a result of well-defined geological properties over a large area. Through the conversion of our resource base to developed reserves, we will seek to increase our proved reserves, production and cash flow while generating favorable returns on invested capital. |
| • | Focus on our high-margin, oil-weighted Deepwater GOM projects. We focus our capital on high cash margin oil-weighted properties in the Deepwater GOM where we receive favorable prices in relation to WTI. Because we have extensive existing infrastructure and facilities with excess production and handling capacity in the Deepwater GOM, our capital allocation strategy is principally focused on drilling and development opportunities that can be tied back to existing facilities. We expect to continue to maintain and grow our reserve and production base through the development of our existing inventory of projects in the Deepwater GOM. |
| • | Utilize our proven technical experience to optimize results and increase returns in the Deepwater GOM. Our senior management and technical team intend to continue to seek ways to maximize hydrocarbon recovery by enhancing our evaluation, drilling, completion and production techniques. We utilize a variety of techniques to increase returns in the Deepwater GOM, including reservoir modeling, pressure maintenance, flow optimization, subsea pumping, and evaluation of seismic data. Continued reprocessing, new acquisitions and improvement in seismic imaging have allowed us to identify additional hydrocarbon potential in previously producing fields as well as in our exploration drilling. Advancements in subsea pumping as well as existing deepwater wellbore lift mechanisms have the potential to allow us to increase the recovery factors from our properties. We regularly evaluate our operating results in order to optimize our performance and make informed decisions about our capital program. |
| • | Maintain a high degree of operational control in order to improve operating and cost efficiencies and leverage relationships with key partners. We seek operational control of our properties in order to enhance returns through operational and cost efficiencies and increase ultimate hydrocarbon recovery by continuous improvement of our drilling techniques, completion methodologies and reservoir evaluation processes. Operational control allows us to more efficiently manage the pace of development activities and the gathering and marketing of our production. Of our estimated 2015 capital budget, 77 percent is related to projects we operate, allowing us to effectively manage the timing and levels of our development spending, overall well costs and operating costs. For properties we operate, in addition to having the ability to control the timing and method of development, we have the ability to partner with third party investors similar to our financing related to our Lucius development. For wells that we do not operate, we seek to join with other experienced and respected companies in the Deepwater GOM, including Anadarko and Shell, with comparable technology and technical expertise. In addition, we benefit from shared information and technology with our working interest partners and believe this enhances our operational results. |
130
Table of Contents
Index to Financial Statements
| • | Maintain a rigorous, ongoing prospect maturation and enhancement process through our technical capabilities. We believe that having seismic data in the Deepwater GOM complemented by an experienced technical team that is capable of reprocessing the data to maximize its benefit is a core requirement for generating and maturing high-quality exploratory prospects. We actively leverage our extensive inventory of seismic data to identify prospects by correlating regional imaging analysis to industry drilling results. We continually enhance our prospect inventory through our technical team’s interpretation and reprocessing of our existing seismic data, our ongoing acquisition of incremental data to augment our data base and our team’s detailed regional sand isopach mapping and analysis and since 2006 have spent in excess of $300 million on acquiring and reprocessing seismic data. We believe these initiatives will allow us to replenish our exploration inventory through maturation of prospects on currently owned leasehold, farmouts or acquisitions from other oil and gas energy companies and participation in future lease sales. In the near term we plan to limit the amount of spending on lease acquisitions and exploration activities. |
| • | Continue enhancing California operations to realize increased cash flow and grow our reserve base. Our management team is focused on continuous improvement of our California operations, both onshore and offshore, and has significant experience in identifying cost efficiencies while maintaining a stable production profile. Our California development plans are focused principally on maintaining stable production levels through continued drilling of conventional, waterflood and steamflood opportunities in the onshore fields. We believe the nature of our asset portfolio in California will continue to provide us with stable production and recurring cash flows in the foreseeable future. |
| • | Execute strategic acquisitions where our operating experience can be applied. We believe that attractive acquisition opportunities will become available and that our management team’s familiarity with our key operating areas and its contacts with the operators in those regions will enable us to identify high-return acquisition opportunities at attractive prices. We focus our acquisition activity where we believe our operational expertise provides the opportunity for meaningful incremental value creation and where our operational methods are most effective. Historically, this approach has allowed us to enter new areas and capture additional opportunities as evidenced by our acquisitions from BP and Shell of the Holstein, Horn Mountain and Marlin assets in 2012, as well as our recent acquisitions from Apache of an initial interest in Heidelberg and an additional interest in Lucius, our recent acquisition from Anadarko of interests in Vito and surrounding acreage, and our regular participation in the BOEM’s Deepwater GOM lease sales. We may selectively make acquisitions on attractive terms that complement our growth and help us achieve economies of scale. |
| • | Maintain financial flexibility to fund growth. We intend to maintain flexibility to fund our long-term growth plan. We expect our cash flows from operating activities, the net proceeds of this offering and our borrowing availability will be sufficient to fund our capital expenditures and other obligations necessary to execute our business plan in the near term. Substantially all of our lease terms allow us to allocate capital among projects in a manner that optimizes both costs and returns. In addition, our lease terms allow us to adjust our capital spending depending on commodity prices and market conditions. We currently have 84 MBbls/d hedged in 2015 with $90 by $70 put spreads. In the future, we plan to opportunistically hedge a portion of our expected production in order to stabilize our cash flows and maintain liquidity. |
Redeemable Noncontrolling Interest—Plains Offshore
One of our consolidated subsidiaries, Plains Offshore Operations Inc., which we refer to as Plains Offshore, holds certain of our Deepwater GOM assets: a 19.998 percent working interest in the Lucius field, our 50.0 percent working interest in the Phobos discovery and working interests in 86 other identified undeveloped locations. As of December 31, 2014, Plains Offshore held 5.3 percent, 3.6 percent and 7.5 percent of our total proved, probable and possible oil and gas reserves, respectively.
131
Table of Contents
Index to Financial Statements
In 2011, we issued (i) 450,000 shares of 8.0% Convertible Preferred Stock in Plains Offshore, which we refer to as the Plains Offshore Preferred Stock, for gross proceeds of $450 million and (ii) non-detachable warrants with an exercise price of $20 per share to purchase in aggregate 9.1 million shares of Plains Offshore’s common stock. In addition, we issued 87 million shares of Plains Offshore Class A common stock, which are being held in escrow until the conversion and cancellation of the Plains Offshore Preferred Stock or the exercise of the warrants. In January 2014, Plains Offshore issued 4.8 million shares of Class A common stock to FM O&G at a price of $20 per share (a total of $96.0 million) and 24,000 shares of Preferred Stock to preferred holders for an aggregate price of $1,000 per share (a total of $24.0 million), together with non-detachable warrants, under the same terms. The Plains Offshore Preferred Stock represents a 20 percent equity interest in Plains Offshore and is entitled to a dividend of eight percent per annum, payable quarterly, of which two percent may be deferred ($37.1 million of accumulated deferred dividends as of June 30, 2015). The preferred holders are entitled to vote on all matters on which Plains Offshore common stockholders are entitled to vote. The shares of Plains Offshore Preferred Stock also fully participate, on an as-converted basis at four times, in cash dividends distributed to any class of common stockholders of Plains Offshore. Plains Offshore has not distributed any dividends to its common stockholders.
The holders of the Plains Offshore Preferred Stock have the right, at any time at their option, to convert any or all of such holder’s shares of Plains Offshore Preferred Stock, and exercise any of the associated non-detachable warrants, into shares of Class A common stock of Plains Offshore, at an initial conversion/exercise price of $20 per share. The conversion price is subject to adjustment as a result of certain events.
At any time on or after November 17, 2016 we may exercise a call right to purchase all, but not less than all, of the outstanding shares of Plains Offshore Preferred Stock and associated nondetachable warrants for cash, at a price equal to the greater of (i) the initial offering price plus any accumulated but unpaid dividends on such shares of Plains Offshore Preferred Stock to the purchase date and (ii) the amount that would be distributed in respect of all conversion shares (shares of Plains Offshore common stock issued upon conversion of shares of Plains Offshore Preferred Stock) upon a liquidation of Plains Offshore. At December 31, 2014 and 2013, the fair values of the non-detachable warrants included in other long-term liabilities in our consolidated balance sheets were $0.2 million and $2.5 million, respectively.
At any time after November 17, 2015 a majority of the preferred holders may cause Plains Offshore to use its commercially reasonable efforts to consummate an exit event. Such an exit event consists of (i) the repurchase of all of the issued and outstanding Plains Offshore Preferred Stock, (ii) a sale of Plains Offshore or (iii) an initial public offering of Plains Offshore. The form of such exit event shall be determined by Plains Offshore in its sole discretion and if Plains Offshore fails to consummate an exit event after having used its commercially reasonable efforts to consummate such exit event, Plains Offshore shall not be required to further pursue such exit event or to pursue any other exit event.
In the event of liquidation of Plains Offshore, each preferred holder is entitled to receive the liquidation preference before any payment or distribution is made on any Plains Offshore junior preferred stock or common stock. A liquidation event includes any of the following events: (i) the liquidation, dissolution or winding up of Plains Offshore, whether voluntary or involuntary, (ii) a sale, consolidation or merger of Plains Offshore in which the stockholders immediately prior to such event do not own at least a majority of the outstanding shares of the surviving entity or (iii) a sale or other disposition of all or substantially all of Plains Offshore’s assets to a person other than us or its affiliates. The liquidation preference, as defined in the stockholders agreement, is equal to (i) the greater of (a) 1.25 times the initial offering price and (b) the sum of (1) the fair value of the shares of common stock issuable upon conversion of the Preferred Stock and (2) the applicable tax adjustment amount, plus (ii) any accrued dividends and accumulated dividends.
The non-detachable warrants may be exercised at any time on the earlier of (i) November 17, 2019, or (ii) a termination event. A termination event is defined as the occurrence of any of (a) the conversion of the Preferred Stock, (b) the redemption of the Preferred Stock, (c) the repurchase by us or any of its affiliates of the Preferred Stock or (d) a liquidation event of Plains Offshore, described above.
132
Table of Contents
Index to Financial Statements
Evaluation and Review of Proved, Probable and Possible Reserves
All of our estimated proved, probable and possible oil and gas reserves at December 31, 2014, 2013 and 2012 are based upon reserve reports prepared by either NSAI or Ryder Scott, our independent petroleum engineering firms. A copy of the independent petroleum engineering firms’ reserve reports as of December 31, 2014, 2013 and 2012 are filed as exhibits to the registration statement of which this prospectus forms a part.
We employ a technical staff of engineers and geoscientists that perform technical analysis of each proved, probable and possible reserves. Our reserve estimates are prepared in accordance with guidelines established by the SEC as prescribed by Regulation S-X, Rule 4-10. The staff estimates, with reasonable certainty, the economically producible oil and gas. The practices for estimating hydrocarbons in place include, but are not limited to, mapping, seismic interpretation of two-dimensional and/or three-dimensional data, core analysis, mechanical properties of formations, thermal maturity, well logs of existing penetrations, correlation of known penetrations, decline curve analysis of producing locations with significant production history, well testing, static bottom hole testing, flowing bottom hole pressure analysis and pressure and rate transient analysis.
Internal Control and Qualifications of Third-Party Engineers and Internal Staff
The technical personnel responsible for preparing the reserve estimates at NSAI and Ryder Scott meet the requirements regarding qualifications, independence, objectivity, and confidentiality set forth in the Standards Pertaining to the Estimating and Auditing of Oil and Gas Reserves Information promulgated by the Society of Petroleum Engineers. Both NSAI and Ryder Scott are independent firms of petroleum engineers, geologists, geophysicists, and petrophysicists; neither firm owns an interest in our properties nor are employed on a contingent fee basis.
Our internal staff of petroleum engineers and geoscience professionals work closely with our independent reserve engineers to ensure the integrity, accuracy and timeliness of data furnished to NSAI and Ryder Scott in their reserves estimation process. Throughout each fiscal year, our technical team meets with representatives of our independent reserve engineers to review properties and discuss methods and assumptions used in preparation of the proved reserves estimates. We provide historical information to the independent reserve engineers for our properties such as ownership interest, oil and gas production, well test data, commodity prices and operating and development costs. The NSAI and Ryder Scott reserve report are reviewed with representatives of NSAI and Ryder Scott and our internal technical staff before dissemination of the information. Additionally, our senior management reviews the NSAI and Ryder Scott reserve report.
Our internal reservoir engineering staff are supervised by our Vice President of Engineering, who has over 38 years of technical experience in petroleum engineering and reservoir evaluation and analysis. This individual directs the activities of our internal reservoir staff for the internal reserve estimation process and also to provide the appropriate data to NSAI and Ryder Scott for our year-end oil and natural gas reserves estimation process.
The preparation of our proved reserve estimates are completed in accordance with our internal control procedures. These procedures, which are intended to ensure reliability of reserve estimations, include the following:
| • | review and verification of historical production data, which data is based on actual production as reported by us; |
| • | review by our Vice President of Engineering of all of our reported proved reserves as annually reported, including the review of all significant reserve changes and all new proved undeveloped reserves additions; |
133
Table of Contents
Index to Financial Statements
| • | direct reporting responsibilities by our Vice President of Engineering to our President and Chief Operating Officer; |
| • | verification of property ownership by our land department; and |
| • | no employee’s compensation is tied to the amount of reserves booked. |
Estimation of Proved Reserves
Our proved reserve volumes have been determined in accordance with the current regulations and guidelines established by the SEC, which require the use of an average price, calculated as the twelve-month average of the first-day-of-the-month historical reference price as adjusted for location and quality differentials, unless prices are defined by contractual arrangements, excluding escalations based upon future conditions and the impact of derivatives. Reference prices for reserve determination are the WTI spot price for crude oil and the Henry Hub spot price for gas. At December 31, 2014, our estimates were based on reference prices of $94.99 per barrel and $4.35 per MMBtu. All of our oil and gas reserves are located in the U.S.
The scope and results of procedures employed by NSAI and Ryder Scott are summarized in their reserve reports that are filed as exhibits to the registration statement of which this prospectus forms a part. For purposes of reserve estimation, we and our independent petroleum engineers used technical and economic data including well logs, geologic maps, seismic data, well test data, production data, historical price and cost information, and property ownership interests. Our reserves have been estimated using deterministic estimates. Standard engineering and geoscience methods were used, or a combination of methods, including performance analysis, volumetric analysis and analogy, which we and our independent petroleum engineers considered to be appropriate and necessary to categorize and estimate reserves in accordance with SEC definitions and regulations. A substantial portion of these reserves are for undeveloped locations; such reserves are based on estimates of reserve volumes and recovery efficiencies along with analogy to properties with similar geologic and reservoir characteristics. Because these estimates depend on many assumptions, any or all of which may differ substantially from actual results, reserve estimates may differ from the quantities of oil and gas that we ultimately recover.
Proved reserves represent quantities of oil and gas, which, by analysis of geoscience and engineering data, can be estimated with reasonable certainty to be economically producible from a given date forward, from known reservoirs, and under existing economic conditions, operating methods and government regulations. The term “reasonable certainty” implies a high degree of confidence that the quantities of oil and gas actually recovered will equal or exceed the estimate.
134
Table of Contents
Index to Financial Statements
Summary of Oil and Gas Proved Reserves
The following table presents our estimated proved oil (inclusive of NGLs) and gas reserves as of the dates indicated, based on the reserve reports prepared by NSAI and Ryder Scott which are filed as exhibits to the registration statement of which this prospectus forms a part:
| Proved Oil and Gas Reserves Estimated at December 31, 2014 |
||||||||||||
| Oil (MMBbls) |
Gas (Bcf)(1) |
Total (MMBoe)(1) |
||||||||||
| Proved Developed: |
||||||||||||
| GOM |
69 | 118 | 89 | |||||||||
| California |
114 | 22 | 118 | |||||||||
| Haynesville/Madden/Other |
1 | 229 | 39 | |||||||||
|
|
|
|
|
|
|
|||||||
| 184 | 369 | 246 | ||||||||||
| Proved Undeveloped: |
||||||||||||
| GOM |
69 | 57 | 79 | |||||||||
| California |
35 | 3 | 35 | |||||||||
| Haynesville/Madden/Other |
— | 181 | 30 | |||||||||
|
|
|
|
|
|
|
|||||||
| 104 | 241 | 144 | ||||||||||
|
|
|
|
|
|
|
|||||||
| Total Proved Reserves |
288 | 610 | 390 | |||||||||
|
|
|
|
|
|
|
|||||||
| (1) | Excludes 19 Bcf of proved reserves as of December 31, 2014 related to the Highlander gas discovery well located in the Inboard Lower Tertiary/Cretaceous trend for which external reserve estimates were completed in March 2015. |
| Proved Oil and Gas Reserves Estimated at December 31, 2013 |
||||||||||||
| Oil (MMBbls) |
Gas (Bcf) |
Total (MMBoe) |
||||||||||
| Proved Developed: |
||||||||||||
| GOM |
73 | 125 | 94 | |||||||||
| California |
126 | 29 | 131 | |||||||||
| Eagle Ford(1) |
36 | 41 | 43 | |||||||||
| Haynesville/Madden/Other |
1 | 228 | 39 | |||||||||
|
|
|
|
|
|
|
|||||||
| 236 | 423 | 307 | ||||||||||
| Proved Undeveloped: |
||||||||||||
| GOM |
64 | 77 | 77 | |||||||||
| California |
56 | 7 | 57 | |||||||||
| Eagle Ford(1) |
14 | 12 | 16 | |||||||||
| Haynesville/Madden/Other |
— | 43 | 7 | |||||||||
|
|
|
|
|
|
|
|||||||
| 134 | 139 | 157 | ||||||||||
|
|
|
|
|
|
|
|||||||
| Total Proved Reserves |
370 | 562 | 464 | |||||||||
|
|
|
|
|
|
|
|||||||
| (1) | In June 2014, we completed the sale of our Eagle Ford shale assets. |
135
Table of Contents
Index to Financial Statements
| Proved Oil and Gas Reserves Estimated at December 31, 2012 |
||||||||||||
| Oil (MMBbls) |
Gas (Bcf) |
Total (MMBoe) |
||||||||||
| Proved Developed: |
||||||||||||
| GOM |
67 | 53 | 76 | |||||||||
| California |
122 | 28 | 127 | |||||||||
| Eagle Ford(1) |
22 | 31 | 27 | |||||||||
| Haynesville/Madden/Other |
2 | 276 | 48 | |||||||||
|
|
|
|
|
|
|
|||||||
| 213 | 388 | 278 | ||||||||||
| Proved Undeveloped: |
||||||||||||
| GOM |
71 | 48 | 79 | |||||||||
| California |
60 | 10 | 61 | |||||||||
| Eagle Ford(1) |
18 | 22 | 22 | |||||||||
| Haynesville/Madden/Other |
— | — | — | |||||||||
|
|
|
|
|
|
|
|||||||
| 149 | 80 | 162 | ||||||||||
|
|
|
|
|
|
|
|||||||
| Total Proved Reserves |
362 | 468 | 440 | |||||||||
|
|
|
|
|
|
|
|||||||
| (1) | In June 2014, we completed the sale of our Eagle Ford shale assets. |
Proved Undeveloped Reserves
As of December 31, 2014, our proved undeveloped reserves were comprised of 104 MMBbls of oil (inclusive of NGLs) and 241 Bcf of gas for a total of 144 MMBoe. Proved undeveloped reserves represented 37 percent of our total proved reserves. With the exception of one planned sidetrack development well in one of our Deepwater GOM properties that cannot be executed until the current producing well depletes, 96 percent of our proved undeveloped reserves are scheduled for development within five years of initial booking, and $3.2 billion (or 95 percent) of our estimated future proved undeveloped capital is associated with the development of those reserves.
Total estimated proved undeveloped reserves of 144 MMBoe at December 31, 2014 decreased by 13 MMBoe from estimated proved undeveloped reserves of 157 MMBoe at December 31, 2013. During the year 2014, we invested $657 million and converted 25 MMBoe from proved undeveloped reserves to proved developed reserves. Partly offsetting the decreases in proved undeveloped reserves during the year 2014 were additions of 16 MMBoe from the acquisition of interests in the Deepwater GOM (including interests in the Lucius and Heidelberg oil fields) and nine MMBoe through extensions and discoveries primarily associated with continued successful development in the Deepwater GOM at Horn Mountain. We also had net upward revisions to proved undeveloped reserves totaling two MMBoe primarily related to the improved gas price realizations in the Haynesville shale play, which was mostly offset by downward revisions resulting from deferred development plans, as well as lower oil price realizations and higher steam-related operating expenses resulting from higher gas prices for certain onshore California properties. In addition, during the year 2014, we sold proved undeveloped reserves totaling 15 MMBoe associated with the Eagle Ford shale properties.
Estimation of Probable Reserves
Probable reserves are those additional reserves that are less certain to be recovered than proved reserves, but which, together with proved reserves, are as likely as not to be recovered. In addition to the uncertainties inherent in estimating quantities and values of proved reserves, probable reserves may be assigned to areas where data control or interpretations of available data are less certain even if the interpreted reservoir continuity of structure or productivity does not meet the reasonably certain criterion. Probable reserves may also be assigned to areas that are structurally higher than the proved area if these areas are in communication with the proved reservoir. Probable reserve estimates also include potential incremental quantities associated with a greater percentage
136
Table of Contents
Index to Financial Statements
recovery of the hydrocarbons in place than assumed for proved reserves. Undeveloped reserves that meet the reasonably certain, economic and other requirements to be classified as proved undeveloped, except that they are not expected to be developed within five years, are classified as probable reserves.
Summary of Oil and Gas Probable Reserves
The following tables present our estimated probable oil (inclusive of NGLs) and gas reserves as of the dates indicated, based on the reserve reports prepared by NSAI and Ryder Scott which are filed as exhibits to the registration statement of which this prospectus forms a part:
| Probable Oil and Gas Reserves Estimated at December 31, 2014 |
||||||||||||
| Oil (MMBbls) |
Gas (Bcf)(1) |
Total (MMBoe)(1) |
||||||||||
| Probable Developed: |
||||||||||||
| GOM |
27 | 33 | 32 | |||||||||
| California |
8 | — | 8 | |||||||||
| Haynesville/Madden/Other |
— | 6 | 1 | |||||||||
|
|
|
|
|
|
|
|||||||
| 35 | 39 | 41 | ||||||||||
| Probable Undeveloped: |
||||||||||||
| GOM |
81 | 75 | 93 | |||||||||
| California |
83 | 22 | 87 | |||||||||
| Haynesville/Madden/Other |
— | 142 | 24 | |||||||||
|
|
|
|
|
|
|
|||||||
| 164 | 239 | 204 | ||||||||||
|
|
|
|
|
|
|
|||||||
| Total Probable Reserves |
199 | 278 | 245 | |||||||||
|
|
|
|
|
|
|
|||||||
| (1) | Excludes 25 Bcf of probable reserves as of December 31, 2014 related to the Highlander gas discovery well located in the Inboard Lower Tertiary/Cretaceous trend for which external reserves were completed in March 2015. |
Estimation of Possible Reserves
Possible reserves are those additional reserves that are less certain to be recovered than probable reserves.
137
Table of Contents
Index to Financial Statements
Summary of Oil and Gas Possible Reserves
The following tables present our estimated possible oil (inclusive of NGLs) and gas reserves as of the dates indicated, based on the reserve reports prepared by NSAI and Ryder Scott which are filed as exhibits to the registration statement of which this prospectus forms a part:
| Possible Oil and Gas Reserves Estimated at December 31, 2014 |
||||||||||||
| Oil (MMBbls) |
Gas (Bcf)(1) |
Total (MMBoe)(1) |
||||||||||
| Possible Developed(2): |
||||||||||||
| GOM |
41 | 45 | 49 | |||||||||
| California |
5 | — | 5 | |||||||||
| Haynesville/Madden/Other |
— | 17 | 3 | |||||||||
|
|
|
|
|
|
|
|||||||
| 46 | 62 | 57 | ||||||||||
| Possible Undeveloped(2): |
||||||||||||
| GOM |
129 | 239 | 169 | |||||||||
| California |
64 | 22 | 67 | |||||||||
| Haynesville/Madden/Other |
— | 269 | 44 | |||||||||
|
|
|
|
|
|
|
|||||||
| 193 | 530 | 281 | ||||||||||
|
|
|
|
|
|
|
|||||||
| Total Possible Reserves |
239 | 592 | 338 | |||||||||
|
|
|
|
|
|
|
|||||||
| (1) | Excludes 53 Bcf of possible reserves as of December 31, 2014 related to the Highlander gas discovery well located in the Inboard Lower Tertiary/Cretaceous trend for which external reserves were completed in March 2015. |
| (2) | We determined possible reserves to be either developed or undeveloped using methodology similar to that used by NSAI and Ryder Scott in the preparation of their reserve reports. |
Reserve engineering is and must be recognized as a subjective process of estimating volumes of economically recoverable oil and gas that cannot be measured in an exact manner. The accuracy of any reserve estimate is a function of the quality of available data and of engineering and geological interpretation. As a result, the estimates of different engineers often vary. In addition, the results of drilling, testing and production may justify revisions of such estimates. Accordingly, reserve estimates often differ from the quantities of oil and gas that are ultimately recovered. Estimates of economically recoverable oil and gas and of future net revenues are based on a number of variables and assumptions, all of which may vary from actual results, including geologic interpretation, prices and future production rates and costs. See “Risk Factors” appearing elsewhere in this prospectus.
Additional information regarding our proved, probable and possible reserves can be found in the reserve reports filed as exhibits to the registration statement of which this prospectus forms a part.
138
Table of Contents
Index to Financial Statements
Oil and Gas Production and Sales
Production and Price History
The following table sets forth information regarding net production of oil, gas and NGLs and certain price and cost information for the periods indicated:
| Year Ended December 31, 2014 | ||||||||||||||||||||
| GOM(1) | California | Haynesville/ Madden/Other |
Eagle Ford(2) |
Total(3) | ||||||||||||||||
| Oil Sales (MBbls) |
19,681 | 13,732 | 222 | 6,481 | 40,116 | |||||||||||||||
| Gas Sales (MMcf) |
||||||||||||||||||||
| Production |
28,700 | 3,558 | 42,364 | 7,410 | 82,032 | |||||||||||||||
| Less: fuel used in our operations |
— | 1,190 | — | — | 1,190 | |||||||||||||||
|
|
|
|
|
|
|
|
|
|
|
|||||||||||
| Sales |
28,700 | 2,368 | 42,364 | 7,410 | 80,842 | |||||||||||||||
|
|
|
|
|
|
|
|
|
|
|
|||||||||||
| NGL Sales (MBbls) |
2,027 | 171 | 35 | 978 | 3,211 | |||||||||||||||
| MBoe |
||||||||||||||||||||
| Production |
26,491 | 14,496 | 7,318 | 8,694 | 56,999 | |||||||||||||||
| Sales |
26,491 | 14,298 | 7,318 | 8,694 | 56,801 | |||||||||||||||
| Average Realizations, Excluding Derivatives |
||||||||||||||||||||
| Oil (per barrel) |
$ | 92.76 | ||||||||||||||||||
| Gas (per MMBtu) |
4.37 | |||||||||||||||||||
| NGLs (per barrel) |
39.73 | |||||||||||||||||||
| Average Cost per Boe |
||||||||||||||||||||
| Lease operating expenses(4) |
$ | 18.00 | ||||||||||||||||||
| Production and ad valorem taxes |
2.08 | |||||||||||||||||||
|
|
|
|||||||||||||||||||
| Cash production costs(5) |
20.08 | |||||||||||||||||||
| (1) | Includes properties in the Deepwater GOM and on the GOM Shelf. |
| (2) | In June 2014, we completed the sale of our Eagle Ford shale assets. |
| (3) | At December 31, 2014, no individual fields represented 15 percent or more of our proved oil and gas reserves. |
| (4) | Reflects costs incurred to operate and maintain wells and related equipment and facilities. |
| (5) | See “Management’s Discussion and Analysis of Financial Condition and Results of Operations” for further discussion of cash production costs per Boe and for a reconciliation to production costs reported in our consolidated financial statements. |
139
Table of Contents
Index to Financial Statements
| April 23, 2013, to December 31, 2013 | ||||||||||||||||||||
| GOM(1) | California | Haynesville/ Madden/Other |
Eagle Ford(2) |
Total(3) | ||||||||||||||||
| Oil Sales (MBbls) |
11,364 | 7,977 | 83 | 7,206 | 26,630 | |||||||||||||||
| Gas Sales (MMcf) |
||||||||||||||||||||
| Production |
17,231 | 2,098 | 26,782 | 8,844 | 54,955 | |||||||||||||||
| Less: fuel used in our operations |
— | 780 | — | — | 780 | |||||||||||||||
|
|
|
|
|
|
|
|
|
|
|
|||||||||||
| Sales |
17,231 | 1,318 | 26,782 | 8,844 | 54,175 | |||||||||||||||
|
|
|
|
|
|
|
|
|
|
|
|||||||||||
| NGL Sales (MBbls) |
1,049 | 97 | 27 | 1,244 | 2,417 | |||||||||||||||
| MBoe |
||||||||||||||||||||
| Production |
15,286 | 8,423 | 4,574 | 9,924 | 38,207 | |||||||||||||||
| Sales |
15,286 | 8,293 | 4,574 | 9,924 | 38,077 | |||||||||||||||
| Average Realizations, Excluding Derivatives |
||||||||||||||||||||
| Oil (per barrel) |
$ | 99.67 | ||||||||||||||||||
| Gas (per MMBtu) |
3.73 | |||||||||||||||||||
| NGLs (per barrel) |
38.20 | |||||||||||||||||||
| Average Cost per Boe |
||||||||||||||||||||
| Lease operating expenses(4) |
$ | 15.18 | ||||||||||||||||||
| Production and ad valorem taxes |
1.96 | |||||||||||||||||||
|
|
|
|||||||||||||||||||
| Cash production costs(5) |
17.14 | |||||||||||||||||||
| (1) | Includes properties in the Deepwater GOM and on the GOM Shelf. |
| (2) | In June 2014, we completed the sale of our Eagle Ford shale assets. |
| (3) | At December 31, 2013, no individual fields represented 15 percent or more of our proved oil and gas reserves. |
| (4) | Reflects costs incurred to operate and maintain wells and related equipment and facilities. |
| (5) | See “Management’s Discussion and Analysis of Financial Condition and Results of Operations” for further discussion of cash production costs per Boe and for a reconciliation to production and delivery costs reported in our consolidated financial statements. |
140
Table of Contents
Index to Financial Statements
| January 1, 2013, to May 31, 2013 | ||||||||||||||||||||
| GOM(1) | California | Haynesville/ Madden/Other |
Eagle Ford(2) |
Total(3) | ||||||||||||||||
| Oil Sales (MBbls) |
7,390 | 5,439 | 71 | 4,800 | 17,700 | |||||||||||||||
| Gas Sales (MMcf) |
||||||||||||||||||||
| Production |
5,710 | 1,507 | 23,444 | 6,001 | 36,662 | |||||||||||||||
| Less: fuel used in our operations |
— | 514 | — | — | 514 | |||||||||||||||
|
|
|
|
|
|
|
|
|
|
|
|||||||||||
| Sales |
5,710 | 993 | 23,444 | 6,001 | 36,148 | |||||||||||||||
|
|
|
|
|
|
|
|
|
|
|
|||||||||||
| NGL Sales (MBbls) |
597 | 70 | 41 | 820 | 1,528 | |||||||||||||||
| MBoe |
||||||||||||||||||||
| Production |
8,938 | 5,760 | 4,020 | 6,620 | 25,338 | |||||||||||||||
| Sales |
8,938 | 5,675 | 4,020 | 6,620 | 25,253 | |||||||||||||||
| Average Realizations, Excluding Derivatives |
||||||||||||||||||||
| Oil (per barrel) |
$ | 104.89 | ||||||||||||||||||
| Gas (per MMBtu) |
3.53 | |||||||||||||||||||
| NGLs (per barrel) |
36.50 | |||||||||||||||||||
| Average Cost per Boe |
||||||||||||||||||||
| Lease operating expenses(4) |
$ | 14.22 | ||||||||||||||||||
| Production and ad valorem taxes |
1.85 | |||||||||||||||||||
|
|
|
|||||||||||||||||||
| Cash production costs(5) |
16.07 | |||||||||||||||||||
| (1) | Includes properties in the Deepwater GOM and on the GOM Shelf. |
| (2) | In June 2014, we completed the sale of our Eagle Ford shale assets. |
| (3) | At December 31, 2013, no individual fields represented 15 percent or more of our proved oil and gas reserves. |
| (4) | Reflects costs incurred to operate and maintain wells and related equipment and facilities. |
| (5) | See “Management’s Discussion and Analysis of Financial Condition and Results of Operations” for further discussion of cash production costs per Boe and for a reconciliation to production and delivery costs reported in our consolidated financial statements. |
141
Table of Contents
Index to Financial Statements
| Year Ended December 31, 2012 | ||||||||||||||||||||
| GOM(1) | California | Haynesville/ Madden/Other |
Eagle Ford(2) |
Total | ||||||||||||||||
| Oil Sales (MBbls) |
1,731 | 13,438 | 228 | 7,288 | 22,685 | |||||||||||||||
| Gas Sales (MMcf) |
||||||||||||||||||||
| Production |
1,261 | 4,128 | 73,688 | 9,395 | 88,472 | |||||||||||||||
| Less: fuel used in our operations |
— | 1,362 | — | — | 1,362 | |||||||||||||||
|
|
|
|
|
|
|
|
|
|
|
|||||||||||
| Sales |
1,261 | 2,766 | 73,688 | 9,395 | 87,110 | |||||||||||||||
|
|
|
|
|
|
|
|
|
|
|
|||||||||||
| NGL Sales (MBbls) |
147 | 195 | 73 | 1,265 | 1,680 | |||||||||||||||
| MBoe |
||||||||||||||||||||
| Production |
2,089 | 14,321 | 12,582 | 10,118 | 39,110 | |||||||||||||||
| Sales |
2,089 | 14,094 | 12,582 | 10,118 | 38,883 | |||||||||||||||
| Average Realizations, Excluding Derivatives |
||||||||||||||||||||
| Oil (per barrel) |
$ | 99.62 | ||||||||||||||||||
| Gas (per MMBtu) |
2.67 | |||||||||||||||||||
| NGLs (per barrel) |
39.35 | |||||||||||||||||||
| Average Cost per Boe |
||||||||||||||||||||
| Lease operating expenses(2) |
$ | 14.37 | ||||||||||||||||||
| Production and ad valorem taxes |
1.90 | |||||||||||||||||||
|
|
|
|||||||||||||||||||
| Cash production costs(3) |
16.27 | |||||||||||||||||||
| (1) | Includes properties in the Deepwater GOM and on the GOM Shelf. |
| (2) | In June 2014, we completed the sale of our Eagle Ford shale assets. |
| (3) | Reflects costs incurred to operate and maintain wells and related equipment and facilities. |
| (4) | See “Management’s Discussion and Analysis of Financial Condition and Results of Operations” for further discussion of cash production costs per Boe and for a reconciliation to production costs reported in our consolidated financial statements. |
Productive Wells
At December 31, 2014, we had working interests in 3,069 gross (2,991 net) active producing oil wells and 1,710 gross (211 net) active producing gas wells. Productive wells consist of producing wells and wells capable of production, including oil wells awaiting connection to production facilities. Gross wells are the total number of producing wells in which we have an interest, and net wells are the sum of our fractional working interests owned in gross wells. One or more completions in the same wellbore are considered one well. If any well in which one of the multiple completions is an oil completion, such well is classified as an oil well. At December 31, 2014, we owned interests in five gross wells containing multiple completions.
Developed and Undeveloped Acreage
At December 31, 2014, we owned interests in oil and gas leases covering 5.0 million gross acres (2.9 million acres net to our interest). Developed acres are acres spaced or assigned to productive wells and do not include undrilled acreage held by production under the terms of the lease. Undeveloped acres are acres on which wells have not been drilled or completed to a point that would permit the production of commercial quantities of oil or gas, regardless of whether such acreage contains proved reserves. A gross acre is an acre in which a working interest is owned. The number of gross acres is the total number of acres in which a working interest is owned. A net acre is deemed to exist when the sum of the fractional ownership working interests in gross acres equals one. The number of net acres is the sum of the fractional working interests owned in gross acres expressed as whole numbers and fractions thereof.
142
Table of Contents
Index to Financial Statements
The following table summarizes, by geographic area, the developed and undeveloped oil and gas acreage in which we held interests at December 31, 2014:
| Developed | Undeveloped | |||||||||||||||
| Gross Acres | Net Acres | Gross Acres | Net Acres | |||||||||||||
| U.S.: |
||||||||||||||||
| Louisiana: |
||||||||||||||||
| Onshore |
403,860 | 81,034 | 207,870 | 160,487 | ||||||||||||
| Offshore |
363,162 | 210,342 | 1,058,752 | 673,251 | ||||||||||||
| Texas: |
||||||||||||||||
| Onshore |
21,526 | 4,358 | 3,760 | 745 | ||||||||||||
| Offshore |
46,080 | 26,850 | — | — | ||||||||||||
| California: |
||||||||||||||||
| Onshore |
60,898 | 60,406 | 63,755 | 39,970 | ||||||||||||
| Offshore |
43,335 | 39,062 | — | — | ||||||||||||
| Wyoming |
80,692 | 13,688 | 65,527 | 51,965 | ||||||||||||
| Nevada |
— | — | 246,073 | 246,073 | ||||||||||||
| Other states |
2,984 | 449 | 217,610 | 165,846 | ||||||||||||
|
|
|
|
|
|
|
|
|
|||||||||
| 1,022,537 | 436,189 | 1,863,347 | 1,338,337 | |||||||||||||
| Africa: |
||||||||||||||||
| Morocco |
— | — | 2,154,014 | 1,120,087 | ||||||||||||
|
|
|
|
|
|
|
|
|
|||||||||
| Total |
1,022,537 | 436,189 | 4,017,361 | 2,458,424 | ||||||||||||
|
|
|
|
|
|
|
|
|
|||||||||
Approximately 35 percent of our total U.S. net undeveloped acres are covered by leases that expire from 2015 to 2017. As a result of the decrease in crude oil prices, we anticipate that the majority of expiring acreage will not be retained by drilling operations or other means.
The exploration permits covering our Morocco acreage expire in 2016; however, we have the ability to extend the exploration permits through 2019.
Drilling Results
The following table provides the total number of wells that we drilled during the periods indicated.
| Year Ended December 31, 2014 |
April 23, 2013, to December 31, 2013 |
January 1, 2013 to May 31, 2013 |
Year Ended December 31, 2012 |
|||||||||||||||||||||||||||||
| Gross | Net | Gross | Net | Gross | Net | Gross | Net | |||||||||||||||||||||||||
| Exploratory |
||||||||||||||||||||||||||||||||
| Productive: |
||||||||||||||||||||||||||||||||
| Oil |
25 | 21 | 40 | 35 | 28 | 20 | 95 | 74 | ||||||||||||||||||||||||
| Gas |
21 | 2 | 25 | 2 | 13 | 7 | 119 | 20 | ||||||||||||||||||||||||
| Dry |
10 | 7 | 1 | 1 | 2 | 2 | 3 | 1 | ||||||||||||||||||||||||
|
|
|
|
|
|
|
|
|
|
|
|
|
|
|
|
|
|||||||||||||||||
| Total |
56 | 30 | 66 | 38 | 43 | 29 | 217 | 95 | ||||||||||||||||||||||||
|
|
|
|
|
|
|
|
|
|
|
|
|
|
|
|
|
|||||||||||||||||
| Development |
||||||||||||||||||||||||||||||||
| Productive: |
||||||||||||||||||||||||||||||||
| Oil |
185 | 175 | 71 | 66 | 86 | 83 | 92 | 79 | ||||||||||||||||||||||||
| Gas |
75 | 10 | 23 | 8 | 13 | 4 | 44 | 6 | ||||||||||||||||||||||||
| Dry |
2 | — | 1 | 1 | — | — | — | — | ||||||||||||||||||||||||
|
|
|
|
|
|
|
|
|
|
|
|
|
|
|
|
|
|||||||||||||||||
| Total |
262 | 185 | 95 | 75 | 99 | 87 | 136 | 85 | ||||||||||||||||||||||||
|
|
|
|
|
|
|
|
|
|
|
|
|
|
|
|
|
|||||||||||||||||
| Total |
318 | 215 | 161 | 113 | 142 | 116 | 353 | 180 | ||||||||||||||||||||||||
|
|
|
|
|
|
|
|
|
|
|
|
|
|
|
|
|
|||||||||||||||||
143
Table of Contents
Index to Financial Statements
In addition to the wells drilled during 2014, there were 39 gross exploratory and 38 gross development wells (eight net exploratory and eight net development wells) in progress at December 31, 2014, including 59 gross wells (seven net wells) in progress in the Haynesville shale play.
General
As of December 31, 2014, we operated properties comprising over 67 percent of our proved reserves. As operator, we design and manage the development of a well and supervise operation and maintenance activities on a day-to-day basis. Independent contractors engaged by us provide all the equipment and personnel associated with these activities. We employ petroleum engineers, geologists and land professionals who work to improve production rates, increase reserves and lower the cost of operating our oil and gas properties.
Marketing and Customers
A substantial portion of our oil reserves are located in California and approximately 24 percent of our production is attributable to heavy crude (generally 21 degree API gravity crude oil or lower). Our heavy crude is primarily sold to Phillips 66, which was spun off from ConocoPhillips effective May 1, 2012. Our current marketing contract with Phillips 66 was effective January 1, 2012 and expires January 1, 2023. The contract covers approximately 89 percent of our California production with prices based upon regional benchmarks that are not linked to NYMEX. During 2014, we received approximately 85 percent of the Brent index price for crude oil sold under the Phillips 66 contract, which represented approximately 30 percent of our total crude oil production.
Our share of oil and gas production from the Deepwater GOM is sold under a series of arm’s length contracts awarded on a competitive bid basis. Crude oil is sold directly to companies with refineries in the Gulf Coast regions of Texas and Louisiana at prices based on widely used industry benchmarks. Gas is processed in one of three large onshore gas plants, where we are paid our contractual share of revenues from the sale of NGLs. We sell and deliver our residue gas to various industrial and energy markets as well as intrastate and interstate pipeline systems. We use a series of pipelines, some of which are ours, to transport our oil and gas production from the platforms to shore. These movements are made under a combination of transportation contracts and tariffs.
Our share of production from the Haynesville shale is sold by Chesapeake under the terms of a fifteen-year contract with a primary term that expires on September 1, 2023. The contract with Chesapeake provides that Chesapeake will sell our production along with its own for which Chesapeake charges a marketing fee.
Prices received for our gas are subject to seasonal variations and other fluctuations. Approximately 40 percent of our gas production is sold monthly based on industry recognized, published index pricing. The remainder is priced daily on the spot market. Fluctuations between spot and index prices can significantly impact the overall differential to the Henry Hub.
144
Table of Contents
Index to Financial Statements
For the year ended December 31, 2014, for the period from April 23, 2013, to December 31, 2013, for the period from January 1, 2013, to May 31, 2013, and for the year ended December 31, 2012, sales to the following purchasers accounted for the percentages of our total revenues as disclosed:
| FCX O&G (Successor) | PXP (Predecessor) |
|||||||||||||||||
| Year Ended December 31, 2014 |
April 23 to December 31, 2013 |
January 1 to May 31, 2013 |
Year Ended December 31, 2012 |
|||||||||||||||
| Phillips 66(1) |
61 | % | 54 | % | 44 | % | 35 | % | ||||||||||
| ConocoPhillips(1) |
(2) | (2) | (2) | 14 | % | |||||||||||||
| Shell Trading (U.S.) Company |
(2) | 11 | % | (2) | (2) | |||||||||||||
| Flint Hills Resources |
(2) | 10 | % | (2) | (2) | |||||||||||||
| Valero Energy Corporation |
(2) | (2) | (2) | 17 | % | |||||||||||||
| (1) | Phillips 66 was spun off from ConocoPhillips on May 1, 2012. On a combined basis, sales to Phillips 66 and ConocoPhillips accounted for 49 percent of our total revenues in 2012. |
| (2) | Sales accounted for less than 10 percent of our total revenues. |
No other purchaser accounted for more than 10 percent of our total revenues. The loss of any single significant purchaser or contract could have an adverse short-term effect; however, we do not believe that the loss of any single significant purchaser or contract would materially affect our business in the long-term. We believe such purchasers could be replaced by other purchasers under contracts with similar terms and conditions. However, their role as the purchaser of a significant portion of our oil production does have the potential to impact our overall exposure to credit risk, either positively or negatively, in that such purchasers may be affected by changes in economic, industry or other conditions. We do not currently require letters of credit or other collateral from the above stated purchasers to support trade receivables. Accordingly, a material adverse change in any such purchaser’s financial condition could adversely impact our ability to collect the applicable receivables, and thereby affect our financial condition.
Transportation
There are a limited number of alternative methods of transportation for our production. A substantial portion of our oil and gas production is transported by pipelines and trucks owned by third parties. The inability or unwillingness of these parties to provide transportation services to us for a reasonable fee could result in us having to find transportation alternatives, increased transportation costs or involuntary curtailment of a significant portion of our oil and gas production, which could have a negative impact on future results of operations or cash flows.
Competition
The oil and gas industry is intensely competitive, and we compete with national and international oil companies, major integrated oil and gas companies, numerous independent oil and gas companies and others. Our ability to identify and successfully develop additional prospects and to discover oil and gas reserves in the future will depend on our ability to evaluate and select suitable properties, consummate transactions and manage our operations in a cost-efficient and effective manner in a highly competitive environment.
Title to Properties
We believe that we have satisfactory title to or rights in all of our producing properties. As is customary in the oil and gas industry, we make minimal investigation of title at the time we acquire undeveloped properties. We make title investigations and receive title opinions of local counsel only before we commence drilling operations. We believe that we have satisfactory title to all of our other assets. Although title to our properties is
145
Table of Contents
Index to Financial Statements
subject to encumbrances in certain cases, we believe that none of these burdens will materially detract from the value of our properties or from our interest therein or will materially interfere with our use in the operation of our business.
Oil and Gas Leases
Our oil and gas properties are subject to customary royalty interests, liens incident to operating agreements, liens for current taxes and other burdens, including other mineral encumbrances and restrictions. We do not believe that any of these burdens materially interfere with our use of the properties in the operation of our business.
Environmental
Our operations and properties are subject to extensive and increasingly stringent federal, state and local laws and regulations relating to environmental protection, including the generation, storage, handling, emission and transportation of materials and the discharge of materials into the environment. To manage these matters, we have developed a robust company-wide environmental, health and safety program overseen by senior management which includes regional and asset specific policies as well as internal audits. The Environmental, Health and Safety department proactively communicates with regulatory authorities and local interests to seek to develop mutually beneficial relationships. The failure to comply with these laws and regulations can result in substantial administrative, civil and criminal penalties. The regulatory burden on the oil and gas industry increases our cost of doing business and, consequently, affects our profitability. Due to the myriad of complex federal, state and local laws and regulations that may affect us directly or indirectly, you should not rely on the following discussion of certain laws and regulations as an exhaustive review of all regulatory considerations affecting our operations.
In addition, our current and future international operations are subject to regulatory requirements. We expect these regulatory requirements to be similar to those of the United States.
We did not incur any material capital expenditures for remediation or pollution control activities for the years ended December 31, 2014, 2013 and 2012. Additionally, we are not aware of any environmental issues or claims that will require material capital expenditures during 2015 or that will otherwise have a material impact on our financial position or results of operations in the future. However, we cannot assure you that the passage of more stringent laws and regulations in the future will not have a negative impact our business activities, financial condition or results of operations.
Non-Hazardous and Hazardous Wastes. The Resource Conservation and Recovery Act or RCRA, and comparable state statutes regulate the generation, transportation, treatment, storage, disposal and cleanup of non-hazardous and hazardous wastes. Although oil and gas waste generally is exempt from regulations as hazardous waste under RCRA, we generate waste as a routine part of our operations that may be subject to RCRA. However, there is no guarantee that the EPA or individual states will not adopt more stringent requirements for the handling of non-hazardous waste or categorize some non-hazardous waste as hazardous in the future. Any such change could result in an increase in our costs to manage and dispose of waste, which could have a material adverse effect on our results of operations and financial position.
Remediation. The Comprehensive Environmental Response, Compensation, and Liability Act, which we refer to as CERCLA, imposes joint and several liability for costs of investigation and remediation and for natural resource damages without regard to fault or legality of the original conduct, on certain classes of persons with respect to the release into the environment of substances designated under CERCLA as hazardous substances. These classes of persons, or so-called potentially responsible parties, which we refer to as PRPs, include the current and certain past owners or operators of a site where the release occurred and anyone who disposed or
146
Table of Contents
Index to Financial Statements
arranged for the disposal of a hazardous substance found at the site. CERCLA also authorizes the EPA and, in some instances, third parties to take actions in response to threats to public health or the environment and to seek to recover from the PRPs the costs of such action. Many states have adopted comparable or more stringent state statutes.
Although CERCLA generally exempts “petroleum” from regulation, in the course of our operations, we have generated and will generate wastes that may fall within CERCLA’s definition of hazardous substances and may have disposed of these wastes at disposal sites owned and operated by others. Not all analogous state statutes provide similar exemptions.
We currently own, lease, or operate numerous properties that have been used for oil and gas exploration and production for many years. Although we believe we have utilized operating and waste disposal practices that were standard in the industry at the time, hazardous substances, wastes or hydrocarbons may have been released on or under the properties owned or leased by us, or on or under other locations, including offsite locations, where such substances have been taken for disposal. In addition, some of these properties have been operated by third parties or by previous owners or operators whose treatment and disposal of hazardous substances, wastes, or hydrocarbons were not under our control. These properties and the substances disposed or released on them may be subject to the RCRA, CERCLA and analogous state laws. In the future, we could be required to remediate property, including groundwater, containing or impacted by previously disposed wastes (including wastes disposed or released by prior owners or operators, or property contamination, including groundwater contamination by prior owners or operators) or to perform remedial plugging operations to prevent future or mitigate existing contamination.
Water Discharges. The Clean Water Act, which we refer to as the CWA, and analogous state laws impose restrictions and strict controls with respect to the discharge of pollutants, including discharges, spills and leaks of produced water and other oil and gas wastes, into regulated waters. The discharge of pollutants into regulated waters is prohibited, except in accordance with the terms of a permit issued by the EPA or an analogous state agency. The CWA also prohibits the discharge of dredge and fill material in regulated waters, including wetlands, unless authorized by a permit issued by the U.S. Army Corps of Engineers. Federal and state regulatory agencies can impose administrative, civil and criminal penalties, as well as require remedial or mitigation measures, for non-compliance with discharge permits or other requirements of the CWA and analogous state laws and regulations. In the event of an unauthorized discharge of wastes, we may be liable for penalties and costs.
The primary federal law related to oil spill liability is the OPA, which amends and augments oil spill provisions of the CWA and imposes certain duties and liabilities on certain “responsible parties” related to the prevention of oil spills and damages resulting from such spills in or threatening United States waters or adjoining shorelines. A liable “responsible party” includes the owner or operator of a facility, vessel or pipeline that is a source of an oil discharge or that poses the substantial threat of discharge, or in the case of offshore facilities, the lessee or permittee of the area in which a discharging facility is located. OPA assigns joint and several liability, without regard to fault, to each liable party for oil removal costs and a variety of public and private damages. Although defenses exist to the liability imposed by OPA, they are limited. In the event of an oil discharge or substantial threat of discharge, we may be liable for costs and damages.
Air Emissions. The Clean Air Act, which we refer to as the CAA, and comparable state laws and regulations govern emissions of various air pollutants through the issuance of permits and the imposition of other requirements. Air emissions from some equipment used in our operations are potentially subject to regulations under the CAA or equivalent state and local regulatory programs, although many small air emission sources are expressly exempt from such regulation or are regulated through general permits or similar generic authorizations. To the extent that these air emissions are regulated, they are generally regulated by permits issued by state regulatory agencies. These permits or authorizations may place restrictions upon our air emissions and may require us to install expensive pollution control equipment. The CAA imposes administrative, civil and criminal penalties, as well as injunctive relief, for failure to comply.
147
Table of Contents
Index to Financial Statements
The EPA has issued final rules to subject oil and gas operations to regulation under the New Source Performance Standards, which we refer to as NSPS, and National Emission Standards for Hazardous Air Pollutants, which we refer to as NESHAPS, programs. The EPA rules include NSPS standards for completions of hydraulically fractured gas wells. Before January 1, 2015, these standards required owners/operators to reduce VOC emissions from gas not sent to the gathering line during well completion either by flaring using a completion combustion device or by capturing the gas using green completions with a completion combustion device. Beginning January 1, 2015, operators must capture the gas and make it available for use or sale, which can be done through the use of green completions. The standards are applicable to new hydraulically fractured wells and also existing wells that are refractured. The finalized regulations also establish specific new requirements for emissions from compressors, controllers, dehydrators, storage tanks, gas processing plants and certain other equipment. Furthermore, November 2014, the EPA proposed to make the National Ambient Air Quality Standard for ozone more stringent. Final rules are expected by 2016. These rules and any revised rules could require modifications to our operations or increase our capital and operating costs.
Climate Change. In December 2009, the EPA published its findings that greenhouse gas emissions present an endangerment to public health and the environment, which has allowed the EPA to adopt and implement regulations that restrict emissions of greenhouse gases under existing provisions of the CAA. Accordingly, the EPA adopted CAA construction and operating permit requirements under the Prevention of Significant Deterioration, which we refer to as PSD, and Title V permitting programs for certain large stationary sources of greenhouse gases. In November 2010, the EPA revised its greenhouse gas reporting rule to include onshore oil and gas production, processing, transmission, storage and distribution facilities. Under these rules, reporting of greenhouse gas emissions from such facilities, including many of our facilities, is required on an annual basis, with reporting beginning in 2012 for emissions occurring in 2011. The EPA also recently announced its intention to take measures to require or encourage reductions in methane emissions from oil and gas operations. Those measures may include the development of NSPS regulations for reducing methane from new and modified oil and gas production sources and gas processing and transmission sources.
Various pieces of legislation to reduce emissions of, or to create cap and trade programs for, greenhouse gases have been proposed by the U.S. Congress over the past several years, but no proposal has yet passed. The United States also is actively participating in international discussions that are currently underway to develop a treaty to replace the Kyoto Protocol after its expiration. In November 2014, President Obama announced that the United States would seek to cut net greenhouse gas emissions 26-28 percent below 2005 levels by 2025 in return for China’s commitment to seek to peak emissions around 2030, with concurrent increases in renewable energy.
More than one-third of the states have already taken legal measures to reduce emissions of greenhouse gases, primarily through the planned development of greenhouse gas emission inventories and/or regional greenhouse gas cap and trade programs. For example, in California, the California Air Resources Board, which we refer to as CARB, developed regulations pursuant to Assembly Bill 32, which we refer to as AB 32 or the California Global Warming Solutions Act of 2006, that are intended to achieve an overall reduction in greenhouse gas emissions to 1990 levels, a 15 percent reduction by 2020. Compliance with these regulations will require certain companies, including us, to periodically secure offsets and allowances, each of which is equal to one metric ton of emissions under the cap and trade program. The price of these instruments varies in accordance with market conditions. The total amount of instruments we owe will vary annually based on the total greenhouse gas emissions registered in any one year and the number of “free allowances” issued by CARB annually. California or other states may also expand environmental programs requiring greenhouse gas reductions and renewable energy mandates. For example, in California, in January 2015, Governor Brown called for increasing the state’s Renewables Portfolio Standard to 50 percent by 2030 and to extend AB 32 to require an 80 percent reduction in greenhouse gas emissions by 2050. Legislation has been introduced in California consistent with these goals (SB 350 and SB 32).
148
Table of Contents
Index to Financial Statements
Passage of climate change legislation by Congress or various states, the adoption of regulations by the EPA or analogous state agencies, or the adoption of any international agreements that regulate or restrict emissions of greenhouse gases (including methane or carbon dioxide) in areas in which we conduct business could have an adverse effect on our operations and the demand for oil and gas.
Hydraulic Fracturing. Hydraulic fracturing is an important and common practice that is used to stimulate production of hydrocarbons, particularly gas, from tight formations such as shales. The process involves the injection of large quantities of water, which contains sand and small amounts of various chemicals, under pressure into the formation to fracture the surrounding rock and stimulate oil and gas production. The process is typically regulated by state oil and gas commissions and agencies, but federal agencies have asserted regulatory authority over the process. For example, in 2012, the EPA published final rules that subject oil and gas operations (production, processing, transmission, storage and distribution) to regulation under the NSPS and NESHAPS programs, which also includes NSPS standards for completions of hydraulically fractured gas wells. Similarly, in May 2014, the EPA issued an advanced notice of proposed rulemaking regarding Toxic Substances Control Act reporting of the chemical substances and mixtures used in hydraulic fracturing. In addition, on March 20, 2015, the BLM released final regulations that require the public disclosure of the chemicals used in hydraulic fracturing and impose certain permitting, testing and other requirements on such operations on federal lands. Federal agencies (including the EPA and the Department of Energy) continue to study hydraulic fracturing and may propose additional regulations. For example, the EPA has commenced a study of the potential environmental effects of hydraulic fracturing on drinking water and groundwater. A final draft of the report was released for peer review and public comment in June 2015. From time to time, legislation has been introduced in Congress to amend the SDWA to eliminate exemptions for most hydraulic fracturing activities.
Similar efforts to review the practice of hydraulic fracturing and impose new regulatory conditions are taking place at the state and local level in states where we operate and may operate in the future. For example, California, Texas and Wyoming as well as other states have adopted or are considering new regulations and statutes pertaining to hydraulic fracturing. These new requirements will (and future regulatory, judiciary and legislative changes, if enacted or adopted, could) create new permitting and financial assurance requirements and require us to adhere to certain construction specifications, fulfill monitoring, reporting and recordkeeping obligations, and meet plugging and abandonment requirements.
The imposition of stringent new regulatory and permitting requirements related to the practice of hydraulic fracturing could significantly increase our cost of doing business, could create adverse effects on our operations, including creating delays related to the issuance of permits, and depending on the specifics of any particular proposal that is enacted, could be material.
Subsurface Injections. The underground injection of wastewater from our operations is subject to the Safe Drinking Water Act, which we refer to as SDWA, as well as analogous state laws and regulations. Under the SDWA, the EPA established the Underground Injection Control, which we refer to as UIC, program which established minimum program requirements for state and local programs regulating underground injection activities. The UIC program includes requirements for permitting, testing, monitoring, recordkeeping, and reporting of injection well activities, as well as a prohibition against the migration of fluid containing any contaminant into underground sources of drinking water. State regulations require companies to obtain a permit from the applicable regulatory agencies to operate underground injection wells. Any leakage from the subsurface portions of injection wells could cause degradation of groundwater resources, potentially resulting in suspension of our UIC permits, issuance of fines and penalties, incurrence of expenditures for remediation of the affected resource and imposition of liability by third-parties claiming damages for alternative water supplies, property damages, and personal injuries.
Endangered and Threatened Species. The Endangered Species Act, which we refer to as the ESA, was established to protect endangered and threatened species. If a species is listed as threatened or endangered, restrictions may be imposed on activities that would harm the species or that would adversely affect that species’
149
Table of Contents
Index to Financial Statements
habitat. Similar protections are offered to migratory birds under the Migratory Bird Treaty Act, and marine mammals under the Marine Mammal Protection Act. A protected habitat designation or the mere presence of threatened or endangered species could result in material restrictions to our use of our leases and may materially delay or prohibit development of our leases. Moreover, as a result of a settlement approved by the U.S. District Court for the District of Columbia in September 2011, the U.S. Fish and Wildlife Service is required to make a determination on listing of more than 250 species as endangered or threatened under the ESA by no later than completion of the agency’s 2017 fiscal year. The designation of previously unprotected species as threatened or endangered in areas where our operations are conducted could cause us to incur increased costs arising from species protection measures or could result in limitations or prohibitions on our exploration and production activities and could have an adverse impact on our ability to develop and produce reserves.
National Environmental Policy Act. Oil and gas exploration and production activities on federal lands may be subject to the National Environmental Policy Act, which we refer to as NEPA, which requires federal agencies, including the Department of Interior, to evaluate major agency actions having the potential to significantly impact the environment. In the course of such evaluations, an agency will prepare an Environmental Assessment that assesses the potential direct, indirect and cumulative impacts of a proposed project and, if necessary, will prepare a more detailed Environmental Impact Statement that may be made available for public review and comment. Exploration and production activities on federal lands require governmental permits that are subject to the requirements of NEPA. This process has the potential to delay or impose additional conditions upon the development of oil and gas projects. Some states, including California, have similar environmental review programs.
BOEM/BSEE. The BOEM and the BSEE have broad authority to regulate our oil and gas operations on offshore leases in federal waters. They must approve and grant permits in connection with our exploration, drilling, development and production plans in federal waters. Additionally, the BOEM/BSEE will implement regulations and “Notices to Lessees” already issued by the BOEM requiring offshore production facilities to meet stringent engineering, construction, safety and environmental specifications, including regulations restricting the flaring or venting of gas, governing the plugging and abandonment of wells, regulating workplace safety, and controlling the removal of production facilities. Under certain circumstances, the BOEM/BSEE may suspend or terminate any of our operations on federal leases. These regulations could increase our costs and may terminate, delay or suspend our operations. The BOEM/BSEE have adopted regulations providing for enforcement actions, including civil penalties, and lease forfeiture or cancellation for failure to comply with regulatory requirements for offshore operations. The Department of the Interior’s Office of Natural Resources Revenue has also established rules governing the calculation of royalties and the valuation of oil produced from federal offshore leases and regulations regarding transportation allowances for offshore production. Delays in the approval or refusal of plans and issuance of permits by the BOEM/BSEE because of staffing, economic, environmental or other reasons (or other actions taken by the BOEM/BSEE under its regulatory authority) could adversely affect our operations.
Surety and Oil Spill Financial Responsibility Requirements. To cover the various obligations of lessees in federal waters, the BOEM/BSEE generally requires that lessees have substantial U.S. assets and net worth or post bonds or other acceptable assurances that such obligations will be met. We are subject to the following types of surety requirements with the BOEM: (i) general lessee or operator’s bonds required to accept title to any lease in federal waters, (ii) supplemental bonding, which is required to be provided by all lessees and specifically covers the plugging and abandonment obligations associated with a lease, and (iii) oil spill financial responsibility, generally provided by operators pursuant to the OPA. The OPA imposes a variety of requirements related to the prevention of and response to oil spills into waters of the United States, including the OCS, which includes the GOM. The OPA subjects operators of offshore leases and owners and operators of oil handling facilities to strict joint and several liability for all containment and cleanup costs and certain other damages arising from a spill, including, but not limited to, the costs of responding to a release of oil, natural resource damages, and economic damages suffered by persons adversely affected by an oil spill. The OPA also requires owners and operators of offshore oil production facilities to establish and maintain evidence of financial
150
Table of Contents
Index to Financial Statements
responsibility to cover costs that could be incurred in responding to an oil spill. The OPA currently requires a minimum financial responsibility demonstration of $35 million for companies operating oil production facilities on the OCS, although the Secretary of Interior may increase this amount up to $150 million in certain situations. The cost of these bonds or other surety when combined with financial assurances could be substantial and there is no assurance that bonds or other surety could be obtained in all cases.
Worker Health and Safety. We are subject to the requirements of the federal Occupational Safety and Health Act, which we refer to as OSHA, and comparable state and local statutes and rules that regulate the protection of the health and safety of workers. In addition, the OSHA hazard communication standard, the EPA emergency planning and community-right-to-know regulations, and similar state and local statutes and rules require that we maintain certain information about hazardous conditions or materials used or produced in our operations and that we provide this information to our employees, government authorities and citizens.
Permits. Our operations are subject to various federal, state and local laws and regulations that include requiring permits for the drilling and operation of wells, and maintaining bonding and insurance requirements to drill, operate, plug and abandon. We are also subject to laws and regulations that require us to restore the surface associated with our wells, regulate the location of wells, the method of drilling and casing wells, the surface use and restoration of properties upon which wells are drilled, the plugging and abandonment of wells, the disposal of fluids and solids used in connection with our operations and air emissions associated with our operations. In certain instances we may also be subject to permit conditions that require us to reabandon an old well as a condition of adding a new injection well. Also, we have permits from numerous jurisdictions to operate crude oil, gas and related pipelines and equipment that run within the boundaries of these governmental jurisdictions. The permits required for various aspects of our operations are subject to enforcement for noncompliance as well as revocation, modification and renewal by issuing authorities.
Other Regulation of the Oil and Gas Industry
The oil and gas industry is extensively regulated by numerous federal, state and local authorities. Legislation affecting the oil and gas industry is under constant review for amendment or expansion, frequently increasing the regulatory burden. Also, numerous departments and agencies, both federal and state, are authorized by statute to issue rules and regulations that are binding on the oil and gas industry and its individual members, some of which carry substantial penalties for failure to comply. Although the regulatory burden on the oil and gas industry increases our cost of doing business and, consequently, affects our profitability, these burdens generally do not affect us any differently or to any greater or lesser extent than they affect other companies in the industry with similar types, quantities and locations of production.
The availability, terms and cost of transportation significantly affect sales of oil and gas. The interstate transportation and sale for resale of oil and gas is subject to federal regulation, including regulation of the terms, conditions and rates for interstate transportation, storage and various other matters, primarily by FERC. Federal and state regulations govern the price and terms for access to oil and gas pipeline transportation. FERC’s regulations for interstate oil and gas transmission in some circumstances may also affect the intrastate transportation of oil and gas.
Although oil and gas prices are currently unregulated, Congress historically has been active in the area of oil and gas regulation. We cannot predict whether new legislation to regulate oil and gas might be proposed, what proposals, if any, might actually be enacted by Congress or the various state legislatures, and what effect, if any, the proposals might have on our operations. Sales of condensate, oil and NGLs are not currently regulated and are made at market prices.
151
Table of Contents
Index to Financial Statements
Drilling and Production. Our operations are subject to various types of regulation at the federal, state and local level. These types of regulation include requiring permits for the drilling of wells, drilling bonds and reports concerning operations. The state, as well as some counties and municipalities, in which we operate also regulate one or more of the following:
| • | the location of wells; |
| • | the method of drilling and casing wells; |
| • | the timing of construction or drilling activities, including seasonal wildlife closures; |
| • | the rates of production or “allowables”; |
| • | the surface use and restoration of properties upon which wells are drilled; |
| • | the plugging and abandonment of wells; and |
| • | notice to, and consultation with, surface owners and other third parties. |
State laws regulate the size and shape of drilling and spacing units or proration units governing the pooling of oil and gas properties. Some states allow forced pooling or integration of tracts to facilitate exploration while other states rely on voluntary pooling of lands and leases. In some instances, forced pooling or unitization may be implemented by third parties and may reduce our interest in the unitized properties. In addition, state conservation laws establish maximum rates of production from oil and gas wells, generally prohibit the venting or flaring of gas and impose requirements regarding the ratability of production. These laws and regulations may limit the amount of oil and gas we can produce from our wells or limit the number of wells or the locations at which we can drill. Moreover, each state generally imposes a production or severance tax with respect to the production and sale of oil, gas and NGLs within its jurisdiction. States do not regulate wellhead prices or engage in other similar direct regulation, but we cannot assure you that they will not do so in the future. The effect of such future regulations may be to limit the amounts of oil and gas that may be produced from our wells, negatively affect the economics of production from these wells or to limit the number of locations we can drill.
Federal, state and local regulations provide detailed requirements for the abandonment of wells, closure or decommissioning of production facilities and pipelines and for site restoration in areas where we operate. The U.S. Army Corps of Engineers and many other state and local authorities also have regulations for plugging and abandonment, decommissioning and site restoration. Although the U.S. Army Corps of Engineers does not require bonds or other financial assurances, some state agencies and municipalities do have such requirements.
Gas Sales and Transportation. Historically, federal legislation and regulatory controls have affected the price of the gas we produce and the manner in which we market our production. FERC has jurisdiction over the transportation and sale for resale of gas in interstate commerce by gas companies under the Natural Gas Act of 1938 and the Natural Gas Policy Act of 1978. Since 1978, various federal laws have been enacted which have resulted in the complete removal of all price and non-price controls for sales of domestic gas sold in “first sales,” which include all of our sales of our own production. Under the Energy Policy Act of 2005, FERC has substantial enforcement authority to prohibit the manipulation of gas markets and enforce its rules and orders, including the ability to assess substantial civil penalties.
FERC also regulates interstate gas transportation rates and service conditions and establishes the terms under which we may use interstate gas pipeline capacity, which affects the marketing of gas that we produce, as well as the revenues we receive for sales of our gas and release of our gas pipeline capacity. Commencing in 1985, FERC promulgated a series of orders, regulations and rule makings that significantly fostered competition in the business of transporting and marketing gas. Today, interstate pipeline companies are required to provide nondiscriminatory transportation services to producers, marketers and other shippers, regardless of whether such shippers are affiliated with an interstate pipeline company. FERC’s initiatives have led to the development of a competitive, open access market for gas purchases and sales that permits all purchasers of gas to buy gas directly from third-party sellers other than pipelines. However, the gas industry historically has been very heavily
152
Table of Contents
Index to Financial Statements
regulated; therefore, we cannot guarantee that the less stringent regulatory approach currently pursued by FERC and Congress will continue indefinitely into the future nor can we determine what effect, if any, future regulatory changes might have on our gas related activities.
Under FERC’s current regulatory regime, transmission services must be provided on an open-access, non-discriminatory basis at cost-based rates or at market-based rates if the transportation market at issue is sufficiently competitive. Gathering service, which occurs upstream of jurisdictional transmission services, is regulated by the states onshore and in state waters. Although its policy is still in flux, FERC has in the past reclassified certain jurisdictional transmission facilities as non-jurisdictional gathering facilities, which has the tendency to increase our costs of transporting gas to point-of-sale locations.
Oil Sales and Transportation. Sales of oil, condensate and NGLs are not currently regulated and are made at negotiated prices. Nevertheless, Congress could reenact price controls in the future.
Our crude oil sales are affected by the availability, terms and cost of transportation. The transportation of oil in common carrier pipelines is also subject to rate regulation. FERC regulates interstate oil pipeline transportation rates under the Interstate Commerce Act and intrastate oil pipeline transportation rates are subject to regulation by state regulatory commissions. The basis for intrastate oil pipeline regulation, and the degree of regulatory oversight and scrutiny given to intrastate oil pipeline rates, varies from state to state. Insofar as effective interstate and intrastate rates are equally applicable to all comparable shippers, we believe that the regulation of oil transportation rates will not affect our operations in any materially different way than such regulation will affect the operations of our competitors.
Further, interstate and intrastate common carrier oil pipelines must provide service on a non-discriminatory basis. Under this open access standard, common carriers must offer service to all shippers requesting service on the same terms and under the same rates. When oil pipelines operate at full capacity, access is governed by prorationing provisions set forth in the pipelines’ published tariffs. Accordingly, we believe that access to oil pipeline transportation services generally will be available to us to the same extent as to our competitors.
State Regulation. Texas regulates the drilling for, and the production, gathering and sale of, oil and gas, including imposing severance taxes and requirements for obtaining drilling permits. Texas generally imposes a 4.6 percent severance tax on oil production and a 7.5 percent severance tax on gas production. States also regulate the method of developing new fields, the spacing and operation of wells and the prevention of waste of gas resources. States may regulate rates of production and may establish maximum daily production allowables from gas wells based on market demand or resource conservation, or both. States do not regulate wellhead prices or engage in other similar direct economic regulation, but we cannot assure you that they will not do so in the future. The effect of these regulations may be to limit the amount of gas that may be produced from our wells and to limit the number of wells or locations we can drill.
The petroleum industry is also subject to compliance with various other federal, state and local regulations and laws. Some of those laws relate to resource conservation and equal employment opportunity. We do not believe that compliance with these laws will have a material adverse effect on us.
Operational Hazards and Insurance
The oil and gas industry involves a variety of operating risks, including the risk of fire, explosions, blowouts, pipe failures and, in some cases, abnormally high pressure formations which could lead to environmental hazards such as oil spills, gas leaks and the discharge of toxic gases. If any of these should occur, we could incur legal defense costs and could be required to pay amounts due to injury, loss of life, damage or destruction to property, natural resources and equipment, pollution or environmental damage, regulatory investigation and penalties and suspension of operations.
153
Table of Contents
Index to Financial Statements
In accordance with what we believe to be industry practice, we maintain insurance against some, but not all, of the operating risks to which our business is exposed. We have insurance policies for property (including leased oil and gas properties), general liability, operational control of certain wells, pollution, commercial auto, umbrella liability, inland marine, workers’ compensation and other coverage. We are self-insured for named windstorms in the GOM. We also have surety bonds associated with environmental and asset retirement obligations, self-insurance bonds for workers’ compensation claims and other bonds to cover additional liabilities.
Most of our insurance coverage includes deductibles that must be met prior to recovery. Additionally, our insurance is subject to exclusion and limitations, and there is no assurance that such coverage will fully or adequately protect us against liability from all potential consequences, damages and losses. Any of these operational hazards could cause a significant disruption to our business. A loss not fully covered by insurance could have a material adverse effect on our financial condition, results of operations and cash flows.
We reevaluate the purchase of insurance, policy terms and limits annually. Future insurance coverage for our industry could increase in cost and may include higher deductibles or retentions. In addition, some forms of insurance may become unavailable in the future or unavailable on terms that we believe are economically acceptable. No assurance can be given that we will be able to maintain insurance in the future at rates that we consider reasonable and we may elect to maintain minimal or no insurance coverage. We may not be able to secure additional insurance or bonding that might be required by new governmental regulations. This may cause us to restrict our operations, which might severely impact our financial condition. The occurrence of a significant event, not fully insured against, could have a material adverse effect on our financial condition and results of operations.
Generally, we also require our third party vendors to sign master service agreements in which they agree to indemnify us for injuries and deaths of the service provider’s employees as well as contractors and subcontractors hired by the service provider.
As of June 30, 2015, we had 1,306 full-time employees, including 62 geologists, 135 engineers and 35 land professionals. Of these full-time employees, 483 are salaried administrative or supervisory employees and 507 work in our corporate headquarters. None of our employees are represented by labor unions or covered by any collective bargaining agreements. We also hire independent contractors and consultants involved in land, technical, regulatory and other disciplines to assist our full-time employees. We consider our relations with our employees to be satisfactory.
Our corporate headquarters is located in Houston, Texas. We also lease additional office space in California and Louisiana. We believe that our facilities are adequate for our current operations.
From time to time, we are a party to ongoing legal proceedings in the ordinary course of business, including workers’ compensation claims, employment-related disputes, commercial disputes, personal injury claims, royalty claims, property damage claims and contract actions. We do not believe the results of these proceedings, individually or in the aggregate, will have a material adverse effect on our business, financial condition, results of operations or liquidity.
154
Table of Contents
Index to Financial Statements
The following table and descriptions set forth information regarding our directors and executive officers as of the consummation of this offering:
| Name |
Age | Position with FM O&G Inc. | ||||
| James R. Moffett |
76 | Chairman of the Board | ||||
| James C. Flores |
55 | Vice-Chairman and Chief Executive Officer | ||||
| Doss R. Bourgeois |
58 | President and Chief Operating Officer | ||||
| Winston M. Talbert |
52 | Executive Vice President and Chief Financial Officer | ||||
| John F. Wombwell |
53 | Executive Vice President, General Counsel and Secretary | ||||
James R. Moffett—Chairman of the Board. Mr. Moffett has served as Chairman of the Board of FM O&G Inc. since June 2015. Mr. Moffett has served as Chairman of the Board of FCX since 1992 and previously served as Chief Executive Officer of FCX from 1995 to 2003. Mr. Moffett previously served as Co-Chairman of the Board of McMoRan from 1998 and President and Chief Executive Officer from 2010, until FCX’s acquisition of McMoRan in 2013. Mr. Moffett received the Horatio Alger Association of Distinguished Americans Award in 1990 and the Norman Vincent Peale Award in 2000 for exceptional humanitarian contributions to society. We believe that Mr. Moffett’s extensive experience in the oil and gas industry qualifies him to serve on our Board of Directors.
James C. Flores—Vice-Chairman and Chief Executive Officer. Mr. Flores has served as Vice Chairman and Chief Executive Officer of FM O&G Inc. since June 2015 and was President from June 2015 to July 2015. Mr. Flores has served as Vice-Chairman of the Board of Directors of FCX and Chief Executive Officer of FCX Oil & Gas Inc. since June 2013 and President of FCX Oil & Gas Inc. from June 2013 until July 2015. He previously served as Chairman of the Board and Chief Executive Officer of PXP, since its inception in December 2002 and President from June 2004 until FCX’s acquisition of PXP in May 2013. Mr. Flores served on the Board of McMoRan from December 2010 until FCX’s acquisition of McMoRan in June 2013. Mr. Flores was also Chairman of the Board of Plains Resources, Inc. (now owned by Vulcan Energy Corporation) from May 2001 to June 2004 and is a current director of Vulcan Energy Corporation. Mr. Flores was also Chief Executive Officer of Plains Resources, Inc. from May 2001 to December 2002 and was Co-founder as well as Chairman, Vice-Chairman and Chief Executive Officer at various times from 1992 until January 2001 of Ocean Energy, Inc., an oil and gas company. We believe that Mr. Flores’s extensive experience in the oil and gas industry qualifies him to serve on our Board of Directors.
Doss R. Bourgeois—President and Chief Operating Officer. Mr. Bourgeois has served as President and Chief Operating Officer of FM O&G Inc. since July 2015 and was Executive Vice President, Exploration and Production of FM O&G Inc. from June 2015 until July 2015. Mr. Bourgeois served as Executive Vice President, Exploration and Production of FCX Oil & Gas Inc. from June 2013 until July 2015, at which time he was appointed President and Chief Operating Officer. He previously served as Executive Vice President, Exploration and Production of PXP from June 2006 to until FCX’s acquisition of PXP in May 2013. Mr. Bourgeois also served as PXP’s Vice President of Development from April 2006 to June 2006 and as PXP’s Vice President Eastern Development Unit from May 2003 to April 2006. Prior to that time, Mr. Bourgeois was Vice President at Ocean Energy, Inc. from August 1993 to May 2003.
Winston M. Talbert—Executive Vice President and Chief Financial Officer. Mr. Talbert has served as Executive Vice President and Chief Financial Officer of FM O&G Inc. since June 2015. Mr. Talbert has served as Executive Vice President and Chief Financial Officer of FCX Oil & Gas Inc. since June 2013 and previously served as Executive Vice President and Chief Financial Officer of PXP from June 2006 until FCX’s acquisition of PXP in May 2013. Mr. Talbert joined PXP in May 2003 as Vice President Finance and Investor Relations and
155
Table of Contents
Index to Financial Statements
in May 2004, Mr. Talbert became Vice President Finance and Treasurer. Prior to joining PXP, Mr. Talbert was Vice President and Treasurer at Ocean Energy, Inc. from August 2001 to May 2003 and Assistant Treasurer from October 1999 to August 2001.
John F. Wombwell—Executive Vice President, General Counsel and Secretary. Mr. Wombwell has served as Executive Vice President, General Counsel and Secretary of FM O&G Inc. since June 2015. Mr. Wombwell has served as Executive Vice President, General Counsel and Secretary of FCX Oil & Gas Inc. since June 2013 and previously served as Executive Vice President, General Counsel and Secretary of PXP from June 2004 until FCX’s acquisition of PXP in May 2013 and as Executive Vice President, General Counsel and Secretary of Plains Resources, Inc. from September 2003 to June 2004. Mr. Wombwell also served on the Board of McMoRan from December 2010 until FCX’s acquisition of McMoRan in June 2013. Mr. Wombwell was previously a partner at the law firm of Andrews Kurth LLP with a practice focused on representing public companies and an executive officer of two public companies listed on the New York Stock Exchange.
Composition of Our Board of Directors
Our Board of Directors currently consists of two members. Immediately prior to the completion of this offering, our Board of Directors will consist of members. Our directors are elected annually to serve until the next annual meeting of stockholders or until their successors are duly elected and qualified.
In evaluating director candidates, we will assess whether a candidate possesses the integrity, judgment, knowledge, experience, skills and expertise that are likely to enhance the Board of Directors’ ability to manage and direct our affairs and business, including, when applicable, to enhance the ability of the committees of the Board of Directors to fulfill their duties.
Status as a Controlled Company
Following the completion of this offering, FCX will continue to control approximately percent of the voting power of our outstanding common stock. As a result, we expect to be a “controlled company” under the rules of the NYSE and, as a result, will qualify for, and may rely on, exemptions from certain corporate governance requirements of the NYSE. Pursuant to the “controlled company” exception to the board of directors and committee composition requirements, we will be exempt from the rules that require that (a) our Board of Directors be comprised of a majority of “independent directors,” (b) our Compensation Committee be comprised solely of “independent directors” and (c) we establish a Nominating and Corporate Governance Committee comprised solely of “independent directors” as defined under the rules of the NYSE. The “controlled company” exception does not modify the independence requirements for the Audit Committee, and we intend to comply with the audit committee requirements of the Sarbanes-Oxley Act and the NYSE, which require that our Audit Committee be composed of at least one independent director at the closing of this offering, a majority of independent directors within 90 days of the closing of this offering and all independent directors within a year of the closing of this offering.
Our Board of Directors has adopted a Principles of Business Conduct, which we refer to as the Code of Conduct, which applies to all directors, officers and employees, including our principal executive officer, principal financial officer and principal accounting officer. The Code of Conduct is available in the Corporate Governance section of our website at www. .com. The contents of our website are not incorporated by reference herein or otherwise a part of this prospectus. The purpose of the Code of Conduct is to promote honest and ethical conduct, including the ethical handling of actual or apparent conflicts of interest between personal and professional relationships, to promote full, fair, accurate, timely and understandable disclosure in periodic reports required to be filed by us, and to promote compliance with all applicable rules and regulations that apply to us and our officers. Amendments to or waivers of our Code of Conduct granted to any of our directors or executive officers will be published promptly on our website.
156
Table of Contents
Index to Financial Statements
Corporate Governance Guidelines
Our Board of Directors has adopted Corporate Governance Guidelines in accordance with the corporate governance rules of the NYSE.
Our Board of Directors has determined that, under NYSE listing standards and taking into account any applicable committee standards and rules under the Exchange Act, is an independent director. Within 90 days of our listing on the NYSE, we will appoint at least one additional independent director. Within one year of the date of effectiveness of the registration statement, we will appoint a third independent director. Messrs. Moffett and Flores are not considered independent under any general listing standards due to their current employment relationship with FCX and us.
Committees of the Board of Directors
Prior to the listing of our Class A common stock on the NYSE, we intend to have an Audit Committee, a Compensation Committee and a Nominating and Corporate Governance Committee, and may have such other committees as the Board of Directors shall determine from time to time. Each of the standing committees of the Board of Directors will have the composition and responsibilities described below.
Audit Committee
will serve as the initial member of our Audit Committee. Within 90 days of our listing on the NYSE we will appoint another independent director to our Audit Committee. Within one year of the date of effectiveness of the registration statement, we will appoint a third independent director to our Audit Committee. Our Board of Directors has determined that is an audit committee financial expert as defined by the SEC. Each member of the Audit Committee meets or will meet criteria for independence of Audit Committee members set forth in Rule 10A-3(b)(1) under the Exchange Act.
The principal duties and responsibilities of the Audit Committee are to assist the Board of Directors in fulfilling its responsibility to oversee management regarding:
| • | the effectiveness of internal control over financial reporting; |
| • | the integrity of our financial statements; |
| • | compliance with legal and regulatory requirements; |
| • | the qualifications and independence of our independent auditors; and |
| • | the performance of our independent auditors and internal audit function. |
Compensation Committee
will serve as the initial member of our Compensation Committee. The principal duties of the Compensation Committee are to assist the Board of Directors in fulfilling its oversight responsibilities by:
| • | discharging the Board of Director’s responsibilities relating to compensation of our executive officers; and |
| • | administering our cash-based and equity-based incentive compensation plans. |
157
Table of Contents
Index to Financial Statements
Nominating and Corporate Governance Committee
will serve as the initial member of our Nominating and Corporate Governance Committee. The principal duties and responsibilities of our Nominating and Corporate Governance Committee are to assist the Board of Directors in fulfilling its oversight responsibilities by:
| • | identifying, formally considering and recommending to the Board of Directors candidates to be nominated for election or re-election to the Board of Directors at each annual meeting of stockholders or as necessary to fill vacancies and newly created directorships; |
| • | monitoring the composition of the Board of Directors and its committees and making formal recommendations to the Board of Directors on membership of the committees; |
| • | maintaining our Corporate Governance Guidelines and recommending to the Board of Directors any desirable changes; |
| • | evaluating the effectiveness of the Board of Directors, its committees and management; and |
| • | overseeing the form and amount of director compensation. |
Compensation Discussion and Analysis
Introduction
For purposes of this prospectus, our executive officers whose compensation is discussed in this compensation discussion and analysis, which we refer to as CD&A, and who we refer to as our named executive officers, which we refer to as NEOs, are:
| • | James R. Moffett, Chairman of the Board; |
| • | James C. Flores, Vice-Chairman, President and Chief Executive Officer; |
| • | Doss R. Bourgeois, Executive Vice President, Exploration and Production; |
| • | Winston M. Talbert, Executive Vice President and Chief Financial Officer; and |
| • | John F. Wombwell, Executive Vice President, General Counsel and Secretary. |
Background
We currently operate as a business unit of FCX and our Chairman of the Board of Directors, Mr. Moffett, and Vice-Chairman, President and Chief Executive, Mr. Flores, are named executive officers of FCX. As a result, the compensation committee of the board of directors of FCX determined the 2014 compensation of our NEOs. Accordingly, the compensation arrangements discussed in this CD&A are those approved by FCX. Following the completion of this offering, we will continue to operate as a majority owned subsidiary of FCX. As a result, the compensation committee of the board of directors of FCX will continue to oversee the compensation programs for some or all of our NEOs. We may also adopt different or new compensation programs or philosophies as our Board of Directors or, as and when applicable, our Compensation Committee, continues to assess our operational and compensation needs and goals going forward.
In addition, pursuant to SEC disclosure requirements, the CD&A below and compensation tables that follow include descriptions and amounts of all of the compensation for our NEOs paid by FCX for 2014. Following the consummation of this offering, Mr. Moffett and Mr. Flores are expected to continue to serve as NEOs of FCX. Compensation for these executives will continue to be paid by FCX and we will be responsible only for an allocated portion of such amounts pursuant to the Shared Services Agreement. For additional information, please read Certain Relationships and Related Party Transactions—Shared Services Agreement. We initially expect for periods immediately following the consummation of this offering that approximately 25 percent of the compensation amounts for Mr. Moffett and approximately 75 percent of the compensation amounts for Mr. Flores will be allocated to us and the remaining portions will be allocated to FCX.
158
Table of Contents
Index to Financial Statements
FCX’s Compensation Programs and Philosophies
Executive Compensation Philosophy
The fundamental principles of FCX’s executive compensation philosophy are to:
| • | Pay for performance by emphasizing performance-based compensation that balances rewards for both short- and long-term results; |
| • | Align compensation with the interests of stockholders and the strategy of its business; and |
| • | Provide a competitive level of compensation to retain talent. |
In order to achieve these goals, FCX’s compensation committee, sometimes referred to herein as the committee, believes that not only should a significant portion of the executive officers’ compensation be performance-based, but also, for FCX’s named executive officers, that such compensation should correspond to the key measures used by FCX’s stockholders in assessing FCX’s value and driving future growth.
Under FCX’s current executive compensation programs, the primary elements of the performance-based pay are (1) annual cash incentive awards, which for FCX’s named executive officers are granted under an annual FCX incentive program, which we refer to as the AIP, that uses financial, operational, safety, environmental and social responsibility metrics to measure performance and (2) awards under FCX’s long-term incentive program, which we refer to as the LTI program, which currently focus on stock price appreciation and total stockholder return.
Overview of Principal Components of Executive Compensation
The principal components of FCX executive officer compensation, which includes Mr. Moffett and Mr. Flores, for 2014 were base salaries, annual incentive awards and long-term incentive awards in the form of performance share units, which we refer to as PSUs, and stock options. The principal components of compensation for our other NEOs were base salaries, annual bonus awards and long-term incentive awards in the form of restricted stock units. In addition, our NEOs receive certain personal benefits and perquisites. The following is an explanation of each principal component of the executive compensation program, including a description of the committee’s compensation decisions for 2014.
Base Salaries
How base salaries support FCX’s compensation philosophy and objectives:
| • | Base salaries help meet the objective of attracting and retaining the key talent and executive officers needed to manage the business successfully. |
| • | Fixed compensation in the form of base salary represents a small portion of executive officers’ compensation, reflecting FCX’s goal to allocate more compensation to the performance-dependent elements of the total compensation package. |
| • | Individual base salary amounts reflect the committee’s judgment with respect to each executive officer’s responsibility, performance, work experience and the individual’s historical salary level. |
| • | The base salaries of Messrs. Moffett and Flores are contractually set pursuant to their employment agreements. |
2014 Highlights: Base Salaries
As part of a redesign of FCX executive compensation program, FCX reduced the base salaries of Mr. Moffett and Mr. Flores by 50 percent, from $2.5 million to $1.25 million. In addition to reducing the level of fixed compensation each of these executives will be entitled to, the salary reductions also resulted in the following:
| • | Under the program, AIP awards are based on a multiple of base salary, and thus the reduced salaries will also operate to reduce future AIP payouts. |
159
Table of Contents
Index to Financial Statements
| • | Under Messrs. Moffett’s and Flores’ respective agreements with the company, their base salaries are components of the calculations determining the cash severance payments each would be eligible to receive upon certain terminations of employment before and after a change in control, and thus those potential benefits have also been reduced. |
No changes were made to the base salaries of Messrs. Bourgeois, Talbert or Wombwell in 2014.
Annual Incentive Awards
Mr. Moffett and Mr. Flores participate in FCX’s executive AIP, which is designed to provide performance-based awards to FCX’s executive officers. Our other NEOs are also eligible to receive cash bonuses targeted at a percentage of the NEO’s base salary and determined in the discretion of the committee, as explained in more detail below.
How the overall design of the 2014 AIP supports FCX’s compensation philosophy and objectives:
| • | It encourages the alignment of executive management with FCX stockholder objectives. |
| • | Its focus on operating cash flow and copper and oil equivalent production volumes reflects FCX’s business goals and objectives, including long-term returns for FCX stockholders, while its inclusion of safety and environmental and social responsibility metrics promote the goals of operating the business in a responsible manner. |
| • | The variability of cash flows associated with changes in commodity prices, fluctuations in production volumes, cost management and other business conditions, closely aligns management and FCX stockholder interests. |
| • | Its cap on awards to 2x the executives’ base salary for Mr. Moffett and Mr. Flores limits the value of awards while providing significant compensation opportunities if FCX’s performance warrants high payouts. |
General Structure of the AIP for FCX Executives in 2014. For 2014, the committee established target performance goals in three categories that it believes effectively measure the performance of FCX, with each category accounting for a specific percentage of the target award. In these categories, the committee chose the following metrics to measure performance:
| Performance Category |
Performance Metrics |
Purpose | ||
| Financial |
Operating Cash Flow Excluding Working Capital Changes | Directly reflects focus on cash generated from FCX’s businesses | ||
| Operational |
Copper Production Volumes | A meaningful indicator of FCX’s operational performance | ||
| Oil Equivalents Production Volumes | A meaningful indicator of FCX’s operational performance | |||
| Safety and Environmental/Social Responsibility |
Safety | Alignment of FCX’s highest priority—safety of its people | ||
| Environmental & Social Responsibility | Supports FCX’s significant focus on working toward sustainable development | |||
Following the end of the year, each performance metric is evaluated against the target goal, with payout levels defined for threshold (70 percent of the target goal), target and maximum (130 percent of the target goal) levels of performance. If performance falls within these levels, a sliding scale is used to determine the appropriate payout.
160
Table of Contents
Index to Financial Statements
2014 Highlights: Annual Incentive Program
| • | The 2014 annual incentive program, which we refer to as the 2014 AIP, represents a significant change from FCX’s prior program, which utilized a “pool concept” that was funded based on specific FCX stockholder approved goals and focused on the committee’s exercise of negative discretion to reduce awards under the pool. Under the new program, each executive participating in the program has a target award based on a multiple of salary, and will earn annual cash awards based on FCX’s performance relative to defined goals established by the committee each year. |
| • | In 2014, annual cash incentive payments for threshold performance will start at 50 percent of target with maximum performance earning 200 percent of target, although the committee retains the right to reduce the payment to 0 percent of target. |
2014 Earned AIP Awards. In February 2015, the committee evaluated FCX’s performance against the AIP targets, which were as follows:
| Performance Category |
Performance Metrics |
Weighting | Target (+/-5%) |
2014 Results |
% of Target Earned |
|||||||||||||
| Financial |
Operating Cash Flow Excluding Working Capital Changes (in billions) | 50.0 | % | $ | 6.7 | $ | 6.9 | 100 | % | |||||||||
| Operational |
Copper Production Volumes (in billions of pounds) | 17.5 | % | 4.0 | 3.9 | 100 | % | |||||||||||
| Oil Equivalents Production Volumes (MMBOE) | 7.5 | % | 53.9 | 56.8 | 100 | % | ||||||||||||
| Safety and Environmental/Social Responsibility |
Safety (TRIR) | 15.0 | % | 0.61 | 0.56 | 100 | % | |||||||||||
| Environmental & Social Responsibility |
10.0 | % | — | — | 100 | % | ||||||||||||
Upon establishment of the Financial and Operational performance goals in February 2014, the committee approved target goals that were consistent with FCX’s budget for the year, and also approved certain adjustments to these goals. Accordingly, the results were adjusted for the following: Indonesia’s export ban and completed asset sales in 2014 (in addition, taxes on the asset sales were excluded from actual results reflected). As a result, FCX performed at the target level for each of the financial and operational metrics and above target for the safety metric; however, the committee elected to maintain the safety component at target.
With regard to the Environmental and Social Responsibility metric, the committee did not set objective targets for 2014, but instead chose to qualitatively assess FCX’s performance in this area following the end of the year. During 2014, the committee developed a scorecard to measure environmental and social responsibility performance for 2015 and used those principles to guide the review of 2014 performance in those areas. The committee considered the environmental performance with respect to environmental penalties, reportable spills and releases, and notices of violation. With regard to the social responsibility category, the committee considered a corporate-level human rights impact assessment to further integrate the UN Guiding Principles on Business and Human Rights into FCX’s programs, investment in community programs, and third-party feedback and recognition of sustainability programs. As a result of its assessment, the committee determined that the executives participating in the AIP had earned 100 percent of the target level of this metric as well.
The target annual incentive award for each of Mr. Moffett and Mr. Flores in 2014 was 100 percent of base salary, or $1.25 million. Accordingly, based on FCX’s overall performance relative to the metrics, Mr. Moffett and Mr. Flores each earned 100 percent of the target payout under the 2014 AIP.
161
Table of Contents
Index to Financial Statements
Bonus Program—Other NEOs. In 2014, Messrs. Bourgeois, Talbert and Wombwell were eligible to receive an annual cash bonus targeted at 100 percent of their base salaries based on the committee’s evaluation of overall performance as well as individual performance considerations. The committee does not establish pre-determined numerical targets with respect to any of these criteria. In addition, these objectives are not specifically weighted in determining whether to award annual incentive payments to executive officers because the relative importance of such objectives may change from year to year and the relative responsibilities of each executive officer in the achievement of each of the objectives may differ. For 2014, based on a subjective assessment of overall performance, each of Messrs. Bourgeois, Talbert and Wombwell received an annual cash incentive award at 100 percent of target level.
The amounts earned by each NEO are reflected in the “Summary Compensation Table” on page 167 under the columns entitled “Non-Equity Incentive Plan Compensation” (reflecting the payout of the financial, operational and safety metrics under the AIP for Messrs. Moffett and Flores) and “Bonus” (reflecting the payout of the environmental and social responsibility metric under the AIP for Messrs. Moffett and Flores and the payout of the annual cash bonuses for Messrs. Bourgeois, Talbert and Wombwell).
Long-Term Incentive Awards
All of our NEOs currently participate in FCX’s LTI program, as further described below. For Messrs. Moffett and Flores, the program is based on the design approved for FCX’s named executive officers generally. Messrs. Bourgeois, Talbert and Wombwell are eligible to receive long-term incentive compensation in the form of cash- and stock-settled restricted stock units in the discretion of the committee.
Under the LTI program for 2014, for FCX’s named executive officers, including Messrs. Moffett and Flores, the committee awarded a combination of stock options and PSUs, as described below.
How long-term incentive awards support FCX’s compensation philosophy and objectives:
| • | Long-term incentives are a variable component of compensation intended to reward executives for success in achieving sustained, long-term profitability and increases in stock value. |
| • | For FCX’s named executive officers, including Messrs. Moffett and Flores, PSU payout is based on FCX’s relative stockholder return compared to its peers over a three-year performance period, thus directly linking executives’ earnings to FCX stockholders’ returns. |
| • | Equity-based long-term incentives also strengthen focus on stock price performance and encourage executive ownership of stock. |
| • | For FCX’s named executive officers, including Messrs. Moffett and Flores, stock options align executives’ interests with those of FCX stockholders as the stock option’s value is dependent on the performance of the stock price. Based on past experience, the committee believes that stock options continue to be an excellent performance-based compensation vehicle that links executive compensation to stockholder return. |
162
Table of Contents
Index to Financial Statements
Stock options vest ratably over a four-year period. The future value of the stock options will be solely dependent on stock price from the grant date. The PSUs vest and pay out in shares of common stock following the end of a three-year performance period based on FCX’s total stockholder return compared to the total stockholder return of its peer group (see the discussion below under the heading—Compensation Processes and Policies—Peer Group for information about the companies in the peer group). Each of Messrs. Moffett and Flores will earn between 0 percent and 200 percent of the target PSU award based on FCX’s rank compared to the peer companies; provided, however, that if FCX’s total stockholder return is equal to or less than 0 percent, the maximum that can be earned is 100 percent of the target award. Earned awards will be determined as specified in the following table:
| FCX Rank |
FCX TSR >0% Performance Share Payout % |
FCX TSR </=0% Performance Share Payout % |
||||||
| 1-2 (>87th percentile) |
200 | % | 100 | % | ||||
| 3 |
180 | % | 100 | % | ||||
| 4 |
160 | % | 100 | % | ||||
| 5 |
140 | % | 100 | % | ||||
| 6 |
120 | % | 100 | % | ||||
| 7-8 (50th-56th percentile) |
100 | % | 100 | % | ||||
| 9 |
80 | % | 80 | % | ||||
| 10 |
60 | % | 60 | % | ||||
| 11 |
40 | % | 40 | % | ||||
| 12-16 (<25th percentile) |
0 | % | 0 | % | ||||
In 2014, Mr. Moffett and Mr. Flores received grants of PSUs and stock options. The aggregate grant date fair value of the target PSUs and stock options awarded was equal to approximately 4x base salary. The awards were equally split between PSUs and stock options.
In 2014, Messrs. Bourgeois, Talbert and Wombwell received grants of restricted stock units, which we refer to as RSUs. The restricted stock units vest ratably over a three year period. The awards were split equally between RSUs that pay out in shares of common stock and RSUs that pay out in cash.
Personal Benefits and Perquisites
In addition to the primary elements of its compensation program discussed above, FCX also provides certain personal benefits and perquisites to its executive officers. In recent years FCX has revised this program to discontinue certain benefits, and will continue to monitor this program and adjust it as FCX deems appropriate. The personal benefits and perquisites currently offered are reflected in the “Summary Compensation Table.” Many of these benefits are designed to provide an added level of security to executives and increase travel efficiencies, thus ensuring the executives’ ready availability on short notice and enabling the executives to focus more time and energy on company matters and driving performance. The committee also recognizes the high degree of integration between the personal and professional lives of these executive officers, and that these benefits ensure the security of the company’s proprietary information by enabling the officers to conduct business while traveling without concern that company information will be compromised.
Retirement Benefits
All of our NEOs participate in a company-sponsored 401(k) plan and receive matching and company contributions on the same basis as other salaried employees. In addition to benefits under FCX’s tax-qualified defined contribution plans, which FCX provides to all qualified employees, FCX also provides a nonqualified defined contribution plan as well as a supplemental executive retirement plan to certain of its officers and other key employees. Mr. Moffett is our only NEO who participates in these nonqualified and supplemental programs.
163
Table of Contents
Index to Financial Statements
Following the consummation of this offering, we will be responsible for 25 percent of the benefit payments to Mr. Moffett under these plans. For additional details regarding these plans and benefit payments, see “—Executive Compensation Tables—Retirement Benefit Programs.”
Change of Control and Severance Benefits
Our NEOs have contractual protections in the event of a change of control, and have also entered into employment agreements with FCX that provide additional severance benefits. FCX believes that severance protections, particularly in the context of a change of control transaction, can play a valuable role in attracting and retaining key executive officers by providing protections commonly provided in the market. In addition, FCX believes these benefits also serve its interest by promoting a continuity of management in the context of an actual or threatened change of control transaction. The existence of these arrangements does not impact FCX’s decisions regarding other components of executive compensation, although FCX considers these severance protections an important part of the executives’ compensation packages.
FCX also believes that the occurrence, or potential occurrence, of a change of control transaction will create uncertainty regarding the continued employment of the executive officers. This uncertainty results from the fact that many change of control transactions result in significant organizational changes, particularly at the senior executive level. In order to encourage certain executive officers to remain employed with the company during an important time when their prospects for continued employment following the transaction are often uncertain, FCX provides certain executive officers with enhanced severance benefits if their employment is terminated by the company without cause or, in certain cases, by the executive in connection with a change of control. Because FCX believes that a termination by the executive for good reason may be conceptually the same as a termination by the company without cause, and because FCX believes that in the context of a change of control, potential acquirors would otherwise have an incentive to constructively terminate the executive’s employment to avoid paying severance, FCX believes it is appropriate to provide severance benefits in these circumstances.
FCX does not believe that executive officers should be entitled to receive cash severance benefits merely because a change of control transaction occurs. The payment of cash severance benefits is only triggered by an actual or constructive termination of employment following a change of control (i.e. a “double trigger”). In addition, beginning with the awards granted in early 2012, FCX’s long-term incentive awards, including the stock options, RSUs and PSUs granted to the executives, provide for accelerated vesting of the award following a change of control only if the recipient also experiences an actual or constructive termination of employment within one year after the change of control.
The terms of the change of control and severance arrangements for each of our NEOs is described in more detail below under the heading—Potential Payments Upon Termination or Change of Control.
Compensation Processes and Policies
Role of Advisors
The FCX compensation committee has engaged Pay Governance LLC (“Pay Governance”) as its independent executive compensation consultant since February 2010. Consistent with the committee’s longstanding policy, Pay Governance will not provide, and has not provided, any services to FCX’s management. As required by SEC rules, the committee has assessed the independence of Pay Governance and concluded that Pay Governance’s work did not raise any conflicts of interest. A representative of Pay Governance attends meetings of the committee and communicates with the committee chair between meetings; however, the committee makes all decisions regarding the compensation of FCX’s executive officers. Pay Governance provides various executive compensation services to the committee, including advising the committee on the principal aspects of FCX’s executive compensation program and evolving industry practices and providing market information and analysis regarding the competitiveness of FCX’s program design, as discussed in more detail below.
164
Table of Contents
Index to Financial Statements
Peer Group
Following FCX’s acquisitions of our business in mid-2013, Pay Governance worked with the committee and management to structure a new peer group that would better align with FCX’s transformation to a natural resources company. The committee sought to identify peers engaged in international mining activities or oil and gas exploration and production activities. The committee recognized that there are a limited number of international public mining companies of a similar size, scale and complexity as the company. The committee also considered the appropriate mix of mining and oil and gas companies and concluded that two-thirds mining and one-third oil and gas was the appropriate balance. In addition, the committee considered key business competitors that FCX has internally tracked for performance and other purposes. The committee determined that the following companies were appropriate peers for FCX to compare both its executive compensation programs and its performance:
| Mining Companies |
Oil and Gas Companies | |
| Anglo American plc |
Anadarko Petroleum Corporation | |
| Antofagasta plc |
Apache Corporation | |
| Barrick Gold Corporation |
ConocoPhillips | |
| BHP Billiton Limited |
Devon Energy Corporation | |
| Glencore plc |
Occidental Petroleum Corporation | |
| Newmont Mining Corporation |
||
| Rio Tinto plc |
||
| Southern Copper Corporation |
||
| Teck Resources Limited |
||
| Vale S.A. |
Stock Ownership
FCX believes that it is important for executive officers to align their interests with the long-term interests of stockholders. With that philosophy in mind, FCX has structured its compensation program to ensure that a portion of executive officers’ compensation is delivered in the form of equity, such as stock options, RSUs and PSUs.
Under FCX’s stock ownership guidelines, each of its executive officers is required to maintain ownership of company stock valued at a certain multiple of base salary. Shares that the executive has pledged, shares held by a spouse or children, and shares due upon the vesting of PSUs are not counted as shares “owned” for purposes of the guidelines. As of December 31, 2014, Messrs. Moffett and Flores had exceeded their target ownership level.
| Executive |
Ownership Requirement |
Actual Ownership Level as of December 31, 2014 (Using 1-year trailing average stock price) |
||||||
| Mr. Moffett |
5x base salary | 43x base salary | ||||||
| Mr. Flores |
5x base salary | 223x base salary | ||||||
These ownership levels reflect Mr. Moffett’s and Mr. Flores’ individual commitments to align their interests with those of FCX stockholders and provide the executives with an incentive to maximize stock value over the long term. Because Messrs. Bourgeois, Talbert and Wombwell are not executive officers of FCX, they are not subject to FCX’s stock ownership guidelines. We expect that our Board of Directors and Compensation Committee will consider appropriate stock ownership guidelines for our company following the consummation of this offering.
165
Table of Contents
Index to Financial Statements
Compensation Clawback Policy
The committee has adopted an incentive compensation clawback policy that would enable FCX to clawback all or a portion of incentive compensation in the event an executive’s misconduct causes FCX to have to issue a restatement of its financial statements, to the extent that such executive’s incentive compensation was based on the misstated financials. The committee will amend the clawback policy, as needed, once the SEC adopts the final implementing rules regarding compensation clawbacks mandated by Dodd-Frank.
Risks Arising from Compensation Policies and Practices
After reviewing its significant compensation programs, FCX’s management and the committee believe that the risks arising from FCX’s compensation policies and practices for employees, including executive officers, are not reasonably likely to have a material adverse effect on FCX. In reaching this conclusion, FCX has taken into account the purpose and structure of these programs and the following design elements of its compensation programs and policies: the balance and amount of annual and long-term compensation elements at the executive and management levels; the use of operating cash flow and production volumes as performance metrics for executives and management level employees, which FCX believes are meaningful indicators of performance; the multi-year vesting of equity awards and three-year performance period of PSUs that promote focus on long-term operational and financial performance; and bonus arrangements for most employees that are not guaranteed and are ultimately at the discretion of either the committee (for executive officers and senior management) or senior management (for other employees). These features, as well as the stock ownership requirements for FCX’s executive officers, result in a compensation program that FCX believes aligns the executives’ interests with those of FCX stockholders and does not promote excessive risk-taking on the part of executives or other employees.
Section 162(m)
Section 162(m) of the Internal Revenue Code (Section 162(m)) limits to $1 million a public company’s annual tax deduction for compensation paid to certain highly compensated executive officers. Qualified performance-based compensation is excluded from this deduction limitation if certain requirements are met. The committee’s policy is to structure compensation awards that will be deductible where doing so will further the purposes of FCX’s executive compensation programs. The committee also considers it important to retain flexibility to design compensation programs that recognize a full range of criteria important to FCX’s success, even where compensation payable under the programs may not be fully deductible. As such, the committee may implement revised or additional compensation programs in the future as it deems necessary to appropriately compensate its executive team.
FCX’s AIP for 2014 was structured under an annual incentive plan which was approved by FCX’s stockholders in 2014. This plan provides the committee the ability to structure annual incentive awards that are designed to qualify as performance-based compensation under Section 162(m), although the committee retains the discretion to structure compensation arrangements outside of the plan that may not be deductible under Section 162(m). The objective performance goals applicable to the financial and operational metrics under the AIP for 2014 were designed to qualify for the exclusion from the deduction limitation under Section 162(m), however, the portion of the 2014 AIP based on safety, environmental and social responsibility has not been designed to be deductible under Section 162(m). With respect to the LTI awards granted in 2014, the stock options and the PSUs were also designed to qualify for the exclusion from the deduction limitation under Section 162(m).
166
Table of Contents
Index to Financial Statements
Executive Compensation Tables
The tables below show information with respect to the compensation paid to or earned by our NEOs for 2014. Following the consummation of this offering, Mr. Moffett and Mr. Flores will continue to serve as named executive officers of FCX and we will be responsible only for an allocated portion of these NEOs’ total compensation, which we initially expect will be 25 percent for Mr. Moffett and 75 percent for Mr. Flores effective immediately following the consummation of this offering. However, pursuant to SEC disclosure requirements, we are presenting the full amount of Mr. Moffett’s and Mr. Flores’ 2014 compensation in the tables below.
Summary Compensation Table
| Name and Principal Position |
Year | Salary(1) | Bonus(2) | Stock Awards(3) |
Option Awards(4) |
Non-Equity Incentive Plan Compensation(5) |
Change in Pension Value and Nonqualified Deferred Compensation Earnings(6) |
All Other Compensation(7) |
Total | |||||||||||||||||||||||||||
| James R. Moffett |
2014 | $ | 1,354,167 | $ | 125,000 | $ | 2,556,265 | $ | 2,489,050 | $ | 1,125,000 | $ | 1,825,857 | $ | 1,102,537 | $ | 10,577,876 | |||||||||||||||||||
| Chairman of the Board |
||||||||||||||||||||||||||||||||||||
| James C. Flores |
2014 | 1,354,167 | 125,000 | 2,556,265 | 2,489,050 | 1,125,000 | — | 624,346 | 8,273,828 | |||||||||||||||||||||||||||
| Vice-Chairman, President and Chief Executive Officer |
||||||||||||||||||||||||||||||||||||
| Doss R. Bourgeois |
2014 | 787,500 | 787,500 | 2,784,600 | — | — | — | 105,483 | 4,465,083 | |||||||||||||||||||||||||||
| Executive Vice President- Exploration and Production |
||||||||||||||||||||||||||||||||||||
| Winston M. Talbert |
2014 | 787,500 | 787,500 | 2,784,600 | — | — | — | 102,428 | 4,462,028 | |||||||||||||||||||||||||||
| Executive Vice President and Chief Financial Officer |
||||||||||||||||||||||||||||||||||||
| John F. Wombwell |
2014 | 787,500 | 787,500 | 2,784,600 | — | — | — | 82,407 | 4,442,007 | |||||||||||||||||||||||||||
| Executive Vice President, General Counsel and Secretary |
||||||||||||||||||||||||||||||||||||
| (1) | The base salaries of Mr. Moffett and Mr. Flores’ were reduced from $2,500,000 to $1,250,000 effective on February 1, 2014. |
| (2) | For Messrs. Moffett and Flores, reflects the portion of the annual incentive award payments attributable to the environmental/social responsibility performance metric under FCX’s AIP. For Messrs. Bourgeois, Talbert and Wombwell, reflects the amount of their annual cash bonus award for 2014. |
| (3) | For Messrs. Moffett and Flores, reflects the aggregate grant date fair value of the award of FCX performance share units (PSUs) granted. The grant date fair value of FCX PSUs was calculated using a Monte-Carlo simulation model. The maximum aggregate grant date value of the 2014 stock awards, assuming maximum payout of the PSUs, is $5,489,080 for each of Mr. Moffett and Mr. Flores. For Messrs. Bourgeois, Talbert and Wombwell, reflects the aggregate grant date fair value of FCX restricted stock units (RSUs) granted. The grant date fair value of FCX stock-settled RSUs and cash-settled RSUs was calculated based on the closing price of FCX’s common stock on the date of grant. |
| (4) | Reflects the aggregate grant date fair value of FCX stock options granted to Mr. Moffett and Mr. Flores, determined using the Black-Scholes-Merton option valuation model. The assumptions used in valuing the option awards made to Messrs. Moffett and Flores were as follows: expected volatility, 36.6 percent; expected life of options, 4.92 years; expected dividend rate, 3.5 percent; and risk-free interest rate, 1.7 percent. |
| (5) | Reflects the annual incentive award payments received under FCX’s 2014 AIP based on the achievement of pre-established goals. |
| (6) | Includes the aggregate change in actuarial present value of FCX’s supplemental executive retirement plan for Mr. Moffett. See the section titled “Retirement Benefit Programs” below for more information. |
| (7) | The amounts reported are shown in the table below and reflect all perquisites and other personal benefits and (A) amounts contributed by FCX to defined contribution plans; and (B) the dollar value of interest credited on dividend equivalents on unvested FCX RSUs. |
The perquisites and other personal benefits reported in the table below include (a) personal financial and tax advice under FCX’s executive services program, (b) for Mr. Moffett, personal use of fractionally owned FCX aircraft, which includes the hourly operating
167
Table of Contents
Index to Financial Statements
rate, fuel costs and incidental fees directly related to the flight, and for our other NEOs, personal use of FCX owned aircraft, which includes maintenance expenses, fuel costs, crew travel expenses, in-flight food and beverage services, parking, ramp and landing fees, airport taxes and similar fees directly related to the flight, (c) personal use of FCX facilities and personnel, (d) personal and business use of FCX owned cars and security services, which includes annual driver compensation and annual car lease and insurance costs, (e) the payment of club dues, and (f) FCX’s premium payments for personal excess liability insurance. The amounts reflect the incremental cost to FCX.
2014 All Other Compensation
| Perquisites and Other Personal Benefits | Additional All Other Compensation | |||||||||||||||||||||||||||||||
| Name |
Financial and Tax Advice |
Aircraft Usage |
Facilities and Personnel |
Security and Cars |
Club Dues | Personal Excess Liability Insurance Premiums |
Plan Contributions |
Interest Credited on Dividend Equivalents |
||||||||||||||||||||||||
| Mr. Moffett |
$ | 20,000 | $ | 517,088 | $ | 208,483 | $ | 55,885 | — | $ | 4,791 | $ | 255,738 | $ | 40,552 | |||||||||||||||||
| Mr. Flores |
20,000 | 528,898 | — | 4,594 | 26,000 | 44,854 | ||||||||||||||||||||||||||
| Mr. Bourgeois |
— | 56,327 | 5,581 | 1,574 | 26,000 | 16,001 | ||||||||||||||||||||||||||
| Mr. Talbert |
— | 52,826 | 6,027 | 1,574 | 26,000 | 16,001 | ||||||||||||||||||||||||||
| Mr. Wombwell |
— | 33,414 | 5,418 | 1,574 | 26,000 | 16,001 | ||||||||||||||||||||||||||
The aggregate incremental cost to FCX of our NEOs’ personal use of aircraft does not include the lost tax deduction for expenses that exceeded the amounts reported as income for each executive, which for fiscal year 2014 was approximately $283,424 for Mr. Moffett with respect to his personal use of fractionally owned FCX aircraft, and approximately $1,245,490 for our other NEOs with respect to their personal use of FCX owned aircraft. Expenses subject to disallowance of deductions in 2014 in connection with the personal use of FCX owned aircraft include fixed costs such as depreciation, some of which may be recovered by FCX in future years upon sale of the aircraft.
Grants of FCX Plan-Based Awards For 2014
| Name |
Grant Date |
Approval Date |
Estimated Future Payouts Under Non-Equity Incentive Plan Awards(1) |
Estimated Future Payouts Under Equity Incentive Plan Awards(2) |
All Other Stock Awards: Number of Shares of Stock or Units(3) |
All Other Option Awards: Number of Securities Underlying Options(4) |
Exercise or Base Price of Option Awards(5) |
Grant Date Fair Value of Stock and Option Awards |
||||||||||||||||||||||||||||||||||||||||
| Threshold | Target | Maximum | Threshold | Target | Maximum | |||||||||||||||||||||||||||||||||||||||||||
| James R. Moffett |
||||||||||||||||||||||||||||||||||||||||||||||||
| AIP |
— | — | $ | 562,500 | $ | 1,125,000 | $ | 2,250,000 | — | — | — | — | — | — | — | |||||||||||||||||||||||||||||||||
| LTIP—PSUs |
02/27/14 | 02/04/14 | — | — | — | 32,800 | 82,000 | 164,000 | — | — | — | $ | 2,556,265 | |||||||||||||||||||||||||||||||||||
| LTIP— Options |
02/04/14 | — | — | — | — | — | — | — | — | 335,000 | $ | 30.94 | 2,489,050 | |||||||||||||||||||||||||||||||||||
| James C. Flores |
||||||||||||||||||||||||||||||||||||||||||||||||
| AIP |
— | — | 562,500 | 1,125,000 | 2,250,000 | — | — | — | — | — | — | — | ||||||||||||||||||||||||||||||||||||
| LTIP—PSUs |
02/27/14 | 02/04/14 | — | — | — | 32,800 | 82,000 | 164,000 | — | — | — | 2,556,265 | ||||||||||||||||||||||||||||||||||||
| LTIP—Options |
02/04/14 | — | — | — | — | — | — | — | — | 335,000 | 30.94 | 2,489,050 | ||||||||||||||||||||||||||||||||||||
| Doss R. Bourgeois RSUs |
02/04/14 | — | — | — | — | — | — | — | 90,000 | — | — | 2,784,600 | ||||||||||||||||||||||||||||||||||||
| Winston M. Talbert RSUs |
02/04/14 | — | — | — | — | — | — | — | 90,000 | — | — | 2,784,600 | ||||||||||||||||||||||||||||||||||||
| John F. Wombwell RSUs |
02/04/14 | — | — | — | — | — | — | — | 90,000 | — | — | 2,784,600 | ||||||||||||||||||||||||||||||||||||
| (1) | Under the 2014 AIP, each of Mr. Moffett and Mr. Flores had a target award based on a multiple of salary, and earned a cash award based on FCX’s performance relative to defined goals established by the compensation committee of FCX. The amounts reported represent the estimated threshold, target and maximum possible annual cash incentive payments that could have been received pursuant to FCX’s 2014 AIP, excluding the 10 percent of the payments attributable to environmental/social responsibility performance, which was evaluated by the compensation committee of FCX on a qualitative basis. The estimated amounts in the “Target” column were calculated by multiplying each of Mr. Moffett’s and Mr. Flores’ target award by 90 percent (to exclude the 10 percent of the payments attributable to environmental/social responsibility performance). The actual cash amount paid in early 2015 to each of Mr. Moffett and Mr. Flores pursuant to the 2014 AIP are set forth in the “Summary Compensation Table.” |
168
Table of Contents
Index to Financial Statements
| (2) | These awards represent PSUs awarded to each of Mr. Moffett and Mr. Flores as part of FCX’s 2014 long-term incentive program. Each of Mr. Moffett and Mr. Flores received 50 percent of his 2014 long-term incentive program award in the form of PSUs. Each PSU granted in 2014 represents a contingent right to receive one share of FCX common stock, with the final number of shares to be issued to Messrs. Moffett and Flores based on FCX’s total stockholder return (TSR) compared to the TSR of FCX’s peer group during the three-year period ending on December 31, 2016. Each of Mr. Moffett and Mr. Flores will earn between 0 percent and 200 percent of the target PSU award based on FCX’s rank compared to the peer companies. |
| (3) | These awards represent RSUs awarded to Messrs. Bourgeois, Talbert and Wombwell in 2014. Each of these NEOs received 50 percent of their award in the form of stock-settled RSUs and 50 percent of their award in the form of cash-settled RSUs. |
| (4) | Each of Messrs. Moffett and Flores received 50 percent of their 2014 long-term incentive program award in the form of options. |
| (5) | The exercise price of each stock option reflected in this table was determined by reference to the closing quoted per share sale price of FCX common stock on the composite tape for NYSE-listed stocks on the grant date. |
Outstanding FCX Equity Awards at December 31, 2014
| Option Awards(1) | Stock Awards(2) | |||||||||||||||||||||||||||||||||||
| Name |
Option Grant Date |
Number of Securities Underlying Unexercised Options Exercisable |
Number of Securities Underlying Unexercised Options Unexercisable |
Option Exercise Price |
Option Expiration Date |
Number of Shares or Units of Stock That Have Not Vested |
Market Value of Shares or Units of Stock That Have Not Vested(3) |
Equity Incentive Plan Awards: Number of Unearned Shares, Units or Other Rights That Have Not Vested |
Equity Incentive Plan Awards: Market or Payout Value of Unearned Shares, Units or Other Rights That Have Not Vested(3) |
|||||||||||||||||||||||||||
| James R. Moffett |
01/31/05 | * | 270,000 | — | $ | 30.830 | 01/31/15 | — | — | 439,798 | $ | 10,273,681 | ||||||||||||||||||||||||
| 01/30/06 | * | 270,000 | — | 36.760 | 01/30/16 | |||||||||||||||||||||||||||||||
| 01/29/07 | * | 243,000 | — | 22.650 | 01/29/17 | |||||||||||||||||||||||||||||||
| 01/28/08 | * | 243,000 | — | 27.860 | 01/28/18 | |||||||||||||||||||||||||||||||
| 02/01/10 | * | 243,000 | — | 29.130 | 02/01/20 | |||||||||||||||||||||||||||||||
| 02/07/11 | * | 243,000 | 27,000 | 31.950 | 02/07/21 | |||||||||||||||||||||||||||||||
| 02/06/12 | * | 216,000 | 54,000 | 24.080 | 02/06/22 | |||||||||||||||||||||||||||||||
| 05/11/07 | 750,000 | — | 36.460 | 05/11/17 | ||||||||||||||||||||||||||||||||
| 02/02/10 | 1,000,000 | — | 36.255 | 02/02/20 | ||||||||||||||||||||||||||||||||
| 02/08/11 | 375,000 | 125,000 | 55.640 | 02/08/21 | ||||||||||||||||||||||||||||||||
| 02/06/12 | 165,000 | 165,000 | 46.730 | 02/06/22 | ||||||||||||||||||||||||||||||||
| 01/29/13 | 112,500 | 337,500 | 35.010 | 01/29/23 | ||||||||||||||||||||||||||||||||
| 02/04/14 | — | 335,000 | 30.940 | 02/04/24 | ||||||||||||||||||||||||||||||||
| James C. Flores |
12/30/10 | * | 1,350 | — | 31.82 | 12/30/20 | 185,568 | $ | 4,334,868 | 32,800 | 766,208 | |||||||||||||||||||||||||
| 06/01/11 | * | 5,400 | — | 32.60 | 06/01/21 | |||||||||||||||||||||||||||||||
| 06/01/12 | * | 5,400 | — | 16.34 | 06/01/22 | |||||||||||||||||||||||||||||||
| 02/04/14 | — | 335,000 | 30.94 | 02/04/24 | ||||||||||||||||||||||||||||||||
| Doss. R. Bourgeois |
— | — | — | — | — | 182,782 | $ | 4,269,787 | — | — | ||||||||||||||||||||||||||
| Winston M. Talbert |
— | — | — | — | — | 182,782 | $ | 4,269,787 | — | — | ||||||||||||||||||||||||||
| John F. Wombwell |
12/30/10 | * | 1,350 | 31.82 | 12/30/20 | 182,782 | $ | 4,269,787 | — | — | ||||||||||||||||||||||||||
| 06/01/11 | * | 5,400 | 32.60 | 06/01/21 | — | — | — | — | ||||||||||||||||||||||||||||
| 06/01/12 | * | 5,400 | 16.34 | 06/01/22 | — | — | — | — | ||||||||||||||||||||||||||||
| * | Represents stock options granted by McMoRan that converted to FCX stock options in connection with FCX’s acquisition of McMoRan on June 3, 2013. |
| (1) | The FCX stock options become exercisable in 25 percent annual increments on each of the first four anniversaries of the date of grant and have a term of 10 years. The FCX stock options granted prior to 2012 will become immediately exercisable in the event of a change in control of FCX, and FCX stock options granted in 2012, 2013 and 2014 will only become immediately exercisable if there is a qualifying termination of employment following a change in control of FCX. |
169
Table of Contents
Index to Financial Statements
| (2) | Represents RSUs and PSUs held by the NEOs, as set forth in the tables below. The RSUs will vest and be paid out in shares of FCX common stock as set forth in the table below, provided that, with respect to the RSUs held by Mr. Moffett, FCX’s average return on investment for the five calendar years preceding the year of vesting is at least 6 percent. In addition, the RSUs held by Mr. Moffett vesting on February 15, 2015 and 2016 are subject to a 20 percent reduction if FCX’s total TSR for the three-year period ending on December 31, 2014 and 2015, respectively, is below the median TSR of a peer group. In accordance with this provision, 20 percent of the RSUs held by Mr. Moffett vesting on February 15, 2015 were forfeited. The full amounts of the RSU grants are reflected in the table below. |
| Name |
RSUs | Vesting Date |
||||||
| Mr. Moffett |
|
106,998 300,000 |
|
|
02/15/15 02/15/16 |
| ||
| Mr. Flores |
|
28,962 28,962 20,916 20,916 |
* * * * |
|
03/31/15 03/31/16 03/31/17 03/31/18 |
| ||
| Mr. Bourgeois |
|
14,481 14,481 10,457 10,457 15,000 15,000 15,000 |
* * * *
|
|
03/31/15 03/31/16 03/31/17 03/31/18 02/15/15 02/15/16 02/15/17 |
| ||
| Mr. Talbert |
|
14,481 14,481 10,457 10,457 15,000 15,000 15,000 |
* * * *
|
|
03/31/15 03/31/16 03/31/17 03/31/18 02/15/15 02/15/16 02/15/17 |
| ||
| Mr. Wombwell |
|
14,481 14,481 10,457 10,457 15,000 15,000 15,000 |
* * * *
|
|
03/31/15 03/31/16 03/31/17 03/31/18 02/15/15 02/15/16 02/15/17 |
| ||
| * | Represents RSUs granted by PXP that converted to FCX RSUs in connection with FCX’s acquisition of PXP on May 31, 2013. |
In addition to the stock-settled RSUs described above, each of Messrs. Flores, Bourgeois, Talbert and Wombwell hold RSUs that will vest and be paid out in cash as follows:
| Name |
RSUs* | Vesting Date |
||||||
| Mr. Flores |
|
42,906 42,906 |
* * |
|
03/31/15 03/31/16 |
| ||
| Mr. Bourgeois |
|
21,453 21,453 15,000 15,000 15,000 |
* *
|
|
03/31/15 03/31/16 02/15/15 02/15/16 02/15/17 |
| ||
| Mr. Talbert |
|
21,453 21,453 15,000 15,000 15,000 |
* *
|
|
03/31/15 03/31/16 02/15/15 02/15/16 02/15/17 |
| ||
| Mr. Wombwell |
|
21,453 21,453 15,000 15,000 15,000 |
* *
|
|
03/31/15 03/31/16 02/15/15 02/15/16 02/15/17 |
| ||
| * | Represents RSUs granted by PXP that converted to FCX RSUs in connection with FCX’s acquisition of PXP on May 31, 2013. |
The PSUs held by Mr. Moffett and Mr. Flores will vest and be paid out in shares of FCX common stock as set forth in the table below. The amounts reported in the table above are based on achieving threshold performance goals, resulting in an award of 40 percent of the target PSU award. Each of Messrs. Moffett and Flores will earn between 0 percent and 200 percent of the target PSU award based on FCX’s TSR compared to the TSR of FCX’s peer group.
| Name |
PSUs | Vesting Date |
||||||||||||||
| Threshold | Target | Maximum | ||||||||||||||
| Mr. Moffett |
32,800 | 82,000 | 164,000 | 03/15/17 | ||||||||||||
| Mr. Flores |
32,800 | 82,000 | 164,000 | 03/15/17 | ||||||||||||
| (3) | The market value of the unvested RSUs and PSUs reflected in this table was based on the $23.36 closing market price per share of FCX common stock on December 31, 2014. |
170
Table of Contents
Index to Financial Statements
Option Exercises and Stock Vested
| Option Awards |
Stock Awards | |||||||||||||||
| Name |
Number of Shares Acquired on Exercise |
Value Realized on Exercise(1) |
Number of Shares Acquired on Vesting(2) |
Value Realized on Vesting(3) |
||||||||||||
| James R. Moffett |
668,500 | $ | 7,962,900 | 46,539 | $ | 1,570,691 | ||||||||||
| James C. Flores |
— | — | 71,868 | 2,376,675 | ||||||||||||
| Doss R. Bourgeois |
— | — | 35,936 | 1,188,404 | ||||||||||||
| Winston M. Talbert |
— | — | 35,936 | 1,188,404 | ||||||||||||
| John F. Wombwell |
— | — | 35,936 | 1,188,404 | ||||||||||||
| (1) | The value realized on exercise of options is based on the difference between FCX’s closing sale price on the date of exercise and the exercise price of each option. |
| (2) | For Mr. Flores, includes 28,962 stock-settled RSUs and 42,906 cash-settled RSUs that vested in 2014. For each of Messrs. Bourgeois, Talbert and Wombwell, includes 14,483 stock-settled RSUs and 21,453 cash-settled RSUs that vested in 2014. |
| (3) | The value realized on vesting of RSUs is based on FCX’s closing sale price on the date of vesting of the RSUs or, if there were no reported sales on such date, on the last preceding date on which any reported sale occurred. |
Nonqualified Defined Contribution Plan. FCX maintains an unfunded nonqualified defined contribution plan, which we refer to as NQDC plan, for the benefit of its executive officers, as well as others. The NQDC plan provides those employees whose earnings in a prior year were in excess of the dollar limit under Section 401(a)(17) of the Internal Revenue Code the ability to defer up to 20 percent of their base salary after deferrals to the ECAP (FCX’s tax-qualified defined contribution plan) have ceased due to qualified plan limits. FCX makes a matching contribution equal to the participant’s deferrals limited to five percent of the participant’s base salary. In addition, in 2014, FCX also made enhanced contributions equal to four percent of eligible compensation (base salary plus 50 percent of bonus) in excess of qualified plan limits for each eligible employee, with employees who met certain age and service requirements in 2000 (including Mr. Moffett) receiving an additional 6 percent contribution. Distribution is made in a lump sum as soon as practicable or if timely elected by the participant, on January 1st of the year following retirement, but no earlier than the date allowable under law following separation from service. Mr. Moffett is our only NEO that participates in FCX’s NQDC plan and the table below sets forth his balances under the NQDC plan as of December 31, 2014.
Nonqualified Deferred Compensation
| Name |
Plan | Executive Contributions in Last Fiscal Year(1) |
Registrant Contributions in Last Fiscal Year(2) |
Aggregate Earnings in Last Fiscal Year(3) |
Aggregate Withdrawals/ Distributions |
Aggregate Balance at Last Fiscal Year End |
||||||||||||||||||
| James R. Moffett |
NQDC plan | $ | 98,875 | $ | 221,238 | $ | 1,067,516 | — | $ | 33,493,162 | ||||||||||||||
| (1) | The amounts reflected in this column are included in the “Salary” column for Mr. Moffett for 2014 reported in the “Summary Compensation Table.” |
| (2) | The amounts reflected in this column are included in the “All Other Compensation” column for Mr. Moffett for 2014 in the “Summary Compensation Table.” |
| (3) | The assets in the NQDC plan are treated as if invested to produce a rate of interest equal to the prime rate, as published in the Federal Reserve Statistical Report at the beginning of each month. For 2014, that rate of interest was equal to 3.25 percent for the entire year and none of the earnings were considered preferential. |
Supplemental Executive Retirement Plan. In February 2004, FCX established an unfunded Supplemental Executive Retirement Plan, which we refer to as SERP, for certain of its executives. The compensation committee of FCX, advised by its independent compensation consultant at that time, approved the SERP, which was then recommended to and approved by the board of FCX. Mr. Moffett is our only NEO that participates in the SERP. The SERP provides for benefits payable in the form of a 100 percent joint and survivor annuity, life
171
Table of Contents
Index to Financial Statements
annuity or an equivalent lump sum. The annuity will equal a percentage of Mr. Moffett’s highest average base pay for any three of the five calendar years immediately preceding Mr. Moffett’s retirement, plus his average bonus for the same three years; provided that the average bonus cannot exceed 200 percent of the average base pay. The percentage used in this calculation is two percent for each year of credited service for FCX and its predecessor beginning in 1981, but capped at 25 years. For Mr. Moffett, who has attained 25 years of credited service, the annuity was fixed as of January 1st of the year in which he completed 25 years of credited service, and will only increase at retirement as a result of mortality and interest adjustments.
The SERP benefit is reduced by the value of all benefits from current and former retirement plans (qualified and nonqualified), sponsored by FCX, by FM Services Company or by any predecessor employer (including FCX’s former parent company), except for benefits produced by accounts funded exclusively by deductions from the participant’s pay. The amounts provided in the table below reflect these reductions. Mr. Moffett is 100 percent vested under the SERP and has elected to receive his SERP benefit in a lump sum.
Pension Benefits
| Name |
Plan Name | Number of Years Credited Service(1) |
Present Value of Accumulated Benefit(2) |
|||||||||
| James R. Moffett |
Supplemental Executive Retirement Plan | 25 | $ | 25,512,137 | ||||||||
| (1) | The years of credited service under the SERP is Mr. Moffett’s years of service with FCX and its predecessor beginning in 1981, but capped at 25 years. |
| (2) | The actuarial present value of the accumulated benefit at the normal retirement date is calculated using the following assumptions: the mortality table described in Revenue Ruling 2001-62 of the IRS, and a 6 percent interest rate. |
Employment Agreements—Messrs. Moffett and Flores. FCX has entered into employment agreements with each of Messrs. Moffett and Flores, which were approved by the compensation committee and the board of FCX. The following describes the general terms of the employment agreements.
Mr. Moffett. Prior to February 1, 2014, the employment agreement with Mr. Moffett provided for a base salary of $2,500,000 per year and eligibility to participate in FCX’s annual incentive plan. Effective February 1, 2014, FCX amended Mr. Moffett’s employment agreement to reduce his base salary to $1,250,000 per year. Mr. Moffett continues to be eligible for all other benefits and compensation generally provided to the most senior executives of FCX. The term of the agreement continues through December 31st, with automatic one-year extensions unless a change of control of FCX occurs or prior written notice is given by the compensation committee of FCX that it does not wish to extend the agreement. In the event of a change of control of FCX during the employment term, Mr. Moffett’s employment will continue for an additional three years following the change of control pursuant to his change of control agreement. Mr. Moffett’s agreement also contains non-competition, nondisclosure and other provisions intended to protect the interests of FCX if he ceases to be employed by FCX.
Mr. Flores. FCX assumed the employment agreement between PXP and Mr. Flores in connection with FCX’s acquisition of PXP on May 31, 2013. Prior to February 1, 2014, the employment agreement with Mr. Flores provided for a base salary of $2,500,000 per year and eligibility to participate in FCX’s annual incentive plan. Effective February 1, 2014, FCX amended Mr. Flores’ employment agreement to reduce his base salary to $1,250,000 per year. Mr. Flores’ employment agreement was also amended to eliminate all tax gross-ups and to eliminate the provision providing for a payout of three times the sum of salary and target annual bonus upon death or disability. Mr. Flores continues to be eligible for all other benefits and compensation generally provided to the most senior executives of FCX. The term of the amended agreement continues through February 2019, with automatic one-year extensions thereafter unless prior written notice is given by the compensation committee of FCX that it does not wish to extend the agreement. In the event of a change of control of FCX, the amended agreement will expire three years following the change of
172
Table of Contents
Index to Financial Statements
control. Mr. Flores’ amended agreement also contains non-competition, nondisclosure and other provisions intended to protect the interests of FCX if he ceases to be employed by FCX.
Employment Agreements—Messrs. Bourgeois, Talbert and Wombwell. These NEOs are parties to employment agreements with FCX, which we anticipate will be assumed and/or modified or replaced with new agreements with us in connection with the consummation of this offering. The terms of any such arrangements have not yet been determined. Prior to the effectiveness of this registration statement, we will disclose, in accordance with the rules and regulations of the SEC, information regarding these arrangements.
Severance Benefits—Mr. Moffett. The employment agreement for Mr. Moffett provides that if FCX terminates Mr. Moffett’s employment without cause or Mr. Moffett terminates employment for good reason, FCX will make certain payments and provide certain benefits to Mr. Moffett, including:
| • | payment of a pro rata bonus for the year in which the termination of employment occurs; |
| • | a cash payment equal to three times the sum of (a) his base salary plus (b) the average of the bonuses paid to him for the immediately preceding three years; |
| • | continuation of insurance and welfare benefits for three years or until he accepts new employment, if earlier; |
| • | acceleration of the vesting and payout of all outstanding stock options and RSUs; and |
| • | under the PSU agreements, in the case of termination without cause, retention of outstanding PSUs, which will vest after the end of the applicable performance period based on achievement of the performance goal. |
Under the employment agreement with Mr. Moffett, “cause” is generally defined as his (a) failure to perform substantially his duties with FCX, (b) breach of the agreement, (c) felony conviction, (d) unauthorized acts resulting in harm to FCX or (e) falsification of financial records. “Good reason” is generally defined as (a) any failure by FCX to materially comply with any of the provisions of the agreement or (b) the assignment to Mr. Moffett of any duties inconsistent in any material respect with Mr. Moffett’s position, authority, duties or responsibilities under the agreement.
If Mr. Moffett’s employment terminates as a result of death, disability or retirement, benefits to Mr. Moffett or his estate include the payment of a pro rata bonus for the year of termination and, in the case of retirement, the continuation of insurance and welfare benefits for three years or until Mr. Moffett accepts new employment, if earlier. Mr. Moffett will also receive an additional year’s vesting on unvested stock options and the vesting and retention of certain outstanding RSUs and PSUs, all as described in the footnotes to the table below.
As a condition to receipt of these severance benefits, which would be paid by FCX, Mr. Moffett must retain in confidence all confidential information known to him concerning FCX’s business. Further, Mr. Moffett has agreed not to compete with FCX for a period of two years after termination of employment.
Severance Benefits—Mr. Flores. The employment agreement with Mr. Flores provides that if Mr. Flores’ employment is terminated without cause or Mr. Flores terminates employment for good reason, he will be entitled to certain payments and benefits, including:
| • | a cash payment equal to three times the sum of (a) his base salary plus (b) his target annual bonus; |
| • | continuation of insurance and welfare benefits for three years or until he accepts new employment, if earlier; |
| • | acceleration of the vesting and payout of all outstanding stock options and RSUs; and |
| • | retention of outstanding PSUs, which will vest after the end of the applicable performance period based on achievement of the performance goal. |
173
Table of Contents
Index to Financial Statements
Under the employment agreement with Mr. Flores, “cause” is generally defined as his (a) failure to perform his reasonably assigned duties with FCX, (b) conduct which is injurious to FCX, (c) conviction of certain crimes or (d) failure to notify FCX of certain conflicts of interest. “Good reason” is defined as (a) the assignment to Mr. Flores of any duties that materially adversely alter the nature or status of Mr. Flores’ office, (b) the failure by FCX to continue in effect any compensation plan that is material to Mr. Flores’ total compensation, (c) the taking of any action by FCX which would materially reduce or deprive Mr. Flores of any material pension, welfare or fringe benefit then enjoyed by Mr. Flores, (d) the relocation of the principal executive offices of Freeport-McMoRan Oil & Gas LLC outside the greater Houston, Texas metropolitan area, (e) the failure to nominate Mr. Flores as a director of FCX or (f) the failure by FCX to obtain a satisfactory agreement from any successor company to assume the agreement.
If Mr. Flores’ employment terminates as a result of death, disability or retirement, benefits to Mr. Flores or his estate include the payment of a pro rata bonus for the year of termination and, in the case of retirement, the continuation of insurance and welfare benefits for three years or until Mr. Flores accepts new employment, if earlier. Pursuant to the terms of the award agreements, Mr. Flores will also receive an additional year’s vesting on unvested stock options and the vesting of certain outstanding RSUs and PSUs as described in the footnotes to the table below.
As a condition to receipt of these severance benefits, Mr. Flores must retain in confidence all confidential information known to him concerning the business of FCX. Further, Mr. Flores has agreed not to compete with FCX for a period of one year after termination of employment.
Change of Control Benefits—Messrs. Moffett and Flores. The change of control agreement for Mr. Moffett and the employment agreement for Mr. Flores provide generally that the terms and conditions of the executive’s employment (including position, compensation and benefits) will not be adversely changed until the third anniversary of a change of control of FCX.
If either of Messrs. Moffett or Flores is terminated without “cause,” as generally defined above, or if the executive terminates for “good reason” during the three-year period after a change of control of FCX, the executive is generally entitled to receive the same payments and benefits that he would receive in the event of a similar termination under the employment agreements, as described above, except that the executive would receive a cash payment calculated as follows:
| • | Mr. Moffett would receive a cash payment equal to three times the sum of Mr. Moffett’s base salary plus the highest bonus paid to him (rather than the average bonus paid to him) for the immediately preceding three fiscal years, and |
| • | Mr. Flores would receive a cash payment equal to three times the sum of Mr. Flores’ base salary plus the greater of (a) his target annual bonus or (b) the highest bonus paid to Mr. Flores for the immediately preceding three fiscal years. |
In addition, in the event of a change of control of FCX, outstanding PSUs would convert into an equivalent number of RSUs based on the target amount, which would vest on the earlier of the last day of the applicable performance period or the date the executive is terminated without cause or terminates for good reason.
These agreements provide “double trigger” benefits meaning that the executives do not receive benefits unless (1) a change of control occurs and (2) employment is terminated. For Mr. Moffett, the term “good reason” includes the failure of the acquirer to provide the executive with substantially the same position, authority, duties and responsibilities held prior to the change of control, in addition to the reasons generally provided above. For Mr. Flores, the term “good reason” includes the failure of FCX to obtain a satisfactory agreement from any acquirer to assume and perform Mr. Flores’ employment agreement, provided that Mr. Flores resigns within one year of the change of control.
If employment terminates as a result of death, disability or retirement following a change of control of FCX, the executive will receive the same benefits described above under “Severance Benefits—Mr. Moffett” and “Severance Benefits—Mr. Flores” in the event of death, disability or retirement.
174
Table of Contents
Index to Financial Statements
If any part of the payments or benefits received by Messrs. Moffett or Flores in connection with a termination following a change of control constitutes an excess parachute payment under Section 4999 of the Internal Revenue Code, the executive will receive the greater of (a) the amount of such payments and benefits reduced so that none of the amount constitutes an excess parachute payment, net of income taxes, or (b) the amount of such payments and benefits, net of income taxes and net of excise taxes under Section 4999 of the Internal Revenue Code.
The confidentiality and non-competition provisions of the executives’ employment agreements continue to apply after a change of control of FCX.
Severance and Change of Control Benefits—Messrs. Bourgeois, Talbert and Wombwell. Prior to FCX’s acquisition of PXP, PXP entered into employment agreements with Messrs. Talbert, Bourgeois and Wombwell. These employment agreements were assumed by FCX upon FCX’s acquisition of PXP and were, at that time, amended pursuant to letter agreements entered into between each of these executives, FCX and PXP. Pursuant to the employment agreements, as amended, Messrs. Bourgeois, Talbert and Wombwell are each entitled to a base salary of not less than $750,000 (currently $787,500) and are eligible for a bonus, with a target of 100 percent of their base salary. Under each executive’s employment agreement, the executive is eligible to participate in all employee incentive compensation plans and to receive all of the fringe benefits and perquisites provided to other senior executives, and the executives are reimbursed for monthly club fees.
Pursuant to the provisions of the employment agreements, as amended, if the executive’s employment is terminated without cause, or the executive resigns for good reason, the executive will be entitled to a lump sum cash payment equal to three times the sum of his base salary and target annual bonus. Also, the executive and his dependents will be entitled to health insurance benefits for up to three years after termination, subject to mitigation if he becomes entitled to health benefits under another plan. In addition, all of the executives’ equity-based awards will become immediately exercisable and payable in full. The executive would also receive such benefits if he resigns or is terminated for any reason within one year following a change in control. However, if following a change of control, (A) the surviving entity requests the executive to remain employed; (B) Mr. Flores is either the President, Chief Executive Officer, or Chairman of the Board; (C) the executive is reporting directly to Mr. Flores, and (D) the surviving entity places all amounts which would otherwise become payable as described in the preceding paragraphs in escrow with a party and terms reasonably acceptable to the executive, then the executive may not resign and receive the compensation described in the preceding paragraph until six months after the date of the change of control. If the executive’s employment is terminated due to the executive’s disability, the executive will generally be entitled to the same benefits as set forth above, except the lump sum cash payment would be equal to one times the sum of his base salary and target annual bonus instead of three times and health benefit continuation would apply for one year.
We do not provide excise tax gross-up protections in any of our change of control arrangements with our executive officers. If any part of the payments or benefits received in connection with a termination following a change of control constitutes an excess parachute payment under Section 4999 of the Internal Revenue Code, the executive will receive the greater of (a) the amount of such payments and benefits reduced so that none of the amount constitutes an excess parachute payment, net of income taxes, or (b) the amount of such payments and benefits, net of income taxes and net of excise taxes under Section 4999 of the Internal Revenue Code.
175
Table of Contents
Index to Financial Statements
Potential Payments Upon Termination or Change of Control
| Name |
Lump Sum Payment |
Restricted Stock Units (Unvested and Accelerated)(1) |
Accumulated Dividends and Interest Payable on Accelerated RSUs |
Performance Share Units (Unvested and Accelerated)(2) |
Accumulated Dividends Payable on Accelerated PSUs |
Health and Welfare Benefits |
Total | Walk-Away Value (Including Value of Vested Benefits)(3) |
||||||||||||||||||||||||
| James R. Moffett |
||||||||||||||||||||||||||||||||
| • Retirement(4) |
n/a | $ | 9,007,569 | $ | 1,389,070 | $ | 1,915,520 | $ | 76,875 | $ | 84,158 | $ | 12,473,192 | $ | 71,651,021 | |||||||||||||||||
| • Death/Disability(4) |
n/a | 9,007,569 | 1,389,070 | 1,915,520 | 76,875 | n/a | 12,389,034 | 71,566,863 | ||||||||||||||||||||||||
| • Termination—Good Reason |
$ | 25,606,232 | 9,007,569 | 1,389,070 | n/a | n/a | 84,158 | 36,087,029 | 95,264,858 | |||||||||||||||||||||||
| • Termination—No Cause |
25,606,232 | 9,007,569 | 1,389,070 | 1,915,520 | 76,875 | 84,158 | 38,079,424 | 97,257,253 | ||||||||||||||||||||||||
| • Termination after Change of Control(5)(6) |
35,988,048 | 9,007,569 | 1,389,070 | 1,915,520 | 76,875 | 84,158 | 48,461,240 | 107,639,069 | ||||||||||||||||||||||||
| James C. Flores |
||||||||||||||||||||||||||||||||
| • Retirement(4) |
n/a | 4,334,868 | 961,610 | 1,915,520 | 76,875 | 79,517 | 7,368,390 | 7,406,298 | ||||||||||||||||||||||||
| • Death/Disability(4) |
n/a | 4,334,868 | 961,610 | 1,915,520 | 76,875 | n/a | 7,288,873 | 7,326,781 | ||||||||||||||||||||||||
| • Termination—Good Reason/No Cause |
7,500,000 | 4,334,868 | 961,610 | 1,915,520 | 76,875 | 79,517 | 14,868,390 | 14,906,298 | ||||||||||||||||||||||||
| • Termination after Change of Control(5) |
7,500,000 | 4,334,868 | 961,610 | 1,915,520 | 76,875 | 79,517 | 14,868,390 | 14,906,298 | ||||||||||||||||||||||||
| Doss R. Bourgeois |
||||||||||||||||||||||||||||||||
| • Retirement |
n/a | n/a | n/a | n/a | n/a | n/a | n/a | n/a | ||||||||||||||||||||||||
| • Death(7) |
n/a | 4,269,787 | 566,320 | n/a | n/a | n/a | 4,836,107 | 4,836,107 | ||||||||||||||||||||||||
| • Disability |
1,575,000 | 4,269,787 | 566,320 | n/a | n/a | 20,563 | 6,431,670 | 6,431,670 | ||||||||||||||||||||||||
| • Termination—Good Reason/No Cause |
4,725,000 | 4,269,787 | 566,320 | n/a | n/a | 67,950 | 9,629,057 | 9,629,057 | ||||||||||||||||||||||||
| • Termination after Change of Control(5) |
4,725,000 | 4,269,787 | 566,320 | n/a | n/a | 67,950 | 9,629,057 | 9,629,057 | ||||||||||||||||||||||||
| Winston M. Talbert |
||||||||||||||||||||||||||||||||
| • Retirement |
n/a | n/a | n/a | n/a | n/a | n/a | n/a | n/a | ||||||||||||||||||||||||
| • Death(7) |
n/a | 4,269,787 | 566,320 | n/a | n/a | n/a | 4,836,107 | 4,836,107 | ||||||||||||||||||||||||
| • Disability |
1,575,000 | 4,269,787 | 566,320 | n/a | n/a | 24,639 | 6,435,746 | 6,435,746 | ||||||||||||||||||||||||
| • Termination—Good Reason/No Cause |
4,725,000 | 4,269,787 | 566,320 | n/a | n/a | 81,310 | 9,642,417 | 9,642,417 | ||||||||||||||||||||||||
| • Termination after Change of Control(5) |
4,725,000 | 4,269,787 | 566,320 | n/a | n/a | 81,310 | 9,642,417 | 9,642,417 | ||||||||||||||||||||||||
| John F. Wombwell |
||||||||||||||||||||||||||||||||
| • Retirement |
n/a | n/a | n/a | n/a | n/a | n/a | n/a | n/a | ||||||||||||||||||||||||
| • Death(7) |
n/a | 4,269,787 | 566,320 | n/a | n/a | n/a | 4,836,107 | 4,874,015 | ||||||||||||||||||||||||
| • Disability |
1,575,000 | 4,269,787 | 566,320 | n/a | n/a | 24,639 | 6,435,746 | 6,473,654 | ||||||||||||||||||||||||
| • Termination—Good Reason/No Cause |
4,725,000 | 4,269,787 | 566,320 | n/a | n/a | 81,310 | 9,642,417 | 9,680,325 | ||||||||||||||||||||||||
| • Termination after Change of Control(5) |
4,725,000 | 4,269,787 | 566,320 | n/a | n/a | 81,310 | 9,642,417 | 9,680,325 | ||||||||||||||||||||||||
| * | “n/a” means that the benefit is not provided to the executive. |
| (1) | The values of the RSUs were determined by multiplying the December 31, 2014 closing price of FCX common stock by the number of RSUs to be vested or retained under each scenario. For additional information, see footnote (5) below. |
| (2) | The values of the PSUs were determined by multiplying the December 31, 2014 closing price of FCX common stock by the number of PSUs to be vested or retained under each scenario. For additional information, see footnote (5) below. |
| (3) | Includes the value of the following benefits as of December 31, 2014: outstanding, in-the-money vested stock options, the aggregate balance of the NQDC plan, and the present value of the SERP. These amounts do not include benefits under FCX’s ECAP or life insurance policies. Mr. Moffett’s executive life insurance policy was surrendered during 2014. |
| (4) | Generally, pursuant to the terms of the stock option agreements, upon termination of the executive’s employment as a result of death, disability or retirement, the unvested portion of any outstanding stock option that would have vested within one year of the date of termination will vest. |
Pursuant to the terms of the RSU agreements outstanding as of December 31, 2014, termination of the executive’s employment as a result of death, disability or retirement will not result in acceleration of vesting of outstanding RSUs and the related dividend equivalent credits. Instead, such grants will not be forfeited and will remain outstanding and vest on the regularly scheduled vesting dates, provided the applicable performance condition is met. The RSUs granted in 2012 and 2013 are subject to a 20 percent reduction if FCX’s total TSR for the three-year period ending on December 31, 2014 and 2015, respectively, is below the median TSR of FCX’s peer group. Because FCX’s total TSR for the three-year period ending on December 31, 2014 was below the median TSR of FCX’s peer group, 20 percent of the RSUs granted in 2012 were forfeited. Accordingly, 80 percent of the RSUs granted in 2012 have been included in the table above. The full amount of RSUs granted in 2013 has been included in the table above. Mr. Flores’ RSUs that were assumed in connection with FCX’s acquisition of PXP would vest in full upon termination of employment as a result of death or disability.
176
Table of Contents
Index to Financial Statements
Pursuant to the terms of the PSU agreements outstanding as of December 31, 2014, termination of the executive’s employment as a result of death will result in acceleration of vesting of the number of outstanding PSUs represented by the target award and the related dividend equivalent credits. Termination of the executive’s employment as a result of disability or retirement will not result in acceleration of vesting of outstanding PSUs and the related dividend equivalent credits. Instead, such grants will not be forfeited and will remain outstanding and vest on the regularly scheduled vesting dates, provided the applicable performance condition is met. The target award of PSUs granted in 2014 has been included in the table above.
| (5) | Certain of the benefits described in the table would be achieved in the event of a change of control of FCX alone, and would not require a termination of the executive’s employment. In particular, pursuant to the terms of FCX’s stock incentive plans and the individual award agreements outstanding as of December 31, 2011, upon a change of control (as defined in the plans) of FCX, all outstanding stock options would immediately vest. In addition, in the event of a change of control of FCX, all restrictions on the outstanding RSUs that were assumed by FCX in connection with FCX’s acquisition of PXP would lapse. However, with respect to the stock options, RSUs and PSUs granted by FCX in 2012, 2013 and 2014, the agreements provide for the benefits described in the table following a change of control of FCX only if the recipient also experiences an actual or constructive termination of employment within one year after the change of control. The amounts stated in the rows titled “Termination after Change of Control” assume the full vesting of options granted in 2012, 2013 and 2014, RSUs granted in 2013 and PSUs granted in 2014. As noted previously, 20 percent of the RSUs granted in 2012 were forfeited due to FCX’s TSR performance during the performance period ended December 31, 2014. Accordingly, 80 percent of the RSUs granted in 2012 have been included in the rows titled “Termination after Change of Control.” |
| (6) | The total payments may be subject to reduction if such payments result in the imposition of an excise tax under Section 280G of the Internal Revenue Code. |
| (7) | Pursuant to the terms of the RSU Agreements outstanding as of December 31, 2014, termination of the executive’s employment as a result of death would result in accelerated vesting of all outstanding RSUs and the related dividend equivalent credits. |
In connection with and prior to the consummation of this offering, we will adopt and FCX, as our sole stockholder, will approve the Freeport-McMoRan Oil & Gas Inc. 2015 Incentive Award Plan, which we refer to as the 2015 Plan, under which we may grant cash and equity-based incentive awards and compensation to eligible service providers in order to attract, motivate and retain the talent for which we compete. The material terms of the 2015 Plan are summarized below.
Eligibility and Administration. Our employees, consultants and directors, and employees, consultants and directors of our parents and subsidiaries will be eligible to receive awards under the 2015 Plan. Following our initial public offering, the 2015 Plan will be administered by our Board of Directors, which may delegate its duties and responsibilities to our Compensation Committee or to other committees of our directors and/or officers, referred to collectively as the plan administrator below), subject to certain limitations that may be imposed under Section 16 of the Securities Exchange Act of 1934, as amended, which we refer to as the Exchange Act, stock exchange rules and other laws, as applicable. The plan administrator will have the authority to make all determinations and interpretations under, prescribe all forms for use with, and adopt rules for the administration of, the 2015 Plan, subject to its express terms and conditions. The plan administrator will also set the terms and conditions of all awards under the 2015 Plan, including any vesting and vesting acceleration conditions.
Limitation on Awards and Shares Available. An aggregate of shares of our Class A common stock will initially be available for issuance under awards granted pursuant to the 2015 Plan. If an award under the 2015 Plan is forfeited, expires or is settled for cash, any shares subject to such award may, to the extent of such forfeiture, expiration or cash settlement, be used again for new grants under the 2015 Plan. Awards granted under the 2015 Plan upon the assumption of, or in substitution for, awards authorized or outstanding under a qualifying equity plan maintained by an entity with which we enter into a merger or similar corporate transaction will not reduce the shares available for grant under the 2015 Plan. No more than shares of Class A common stock may be issued upon the exercise of incentive stock options. Shares issued under the 2015 Plan may be authorized but unissued shares, shares purchased in the open market or treasury shares.
Awards. The 2015 Plan provides for the grant of stock options, including incentive stock options, which we refer to as ISOs, and nonqualified stock options, which we refer to as NSOs, restricted stock, dividend equivalents, restricted stock units, which we refer to as RSUs, stock appreciation rights, which we refer to as SARs, and other stock or cash based awards. No determination has been made as to the types or amounts of
177
Table of Contents
Index to Financial Statements
awards that will be granted to specific individuals pursuant to the 2015 Plan. Certain awards under the 2015 Plan may constitute or provide for a deferral of compensation, subject to Section 409A of the Internal Revenue Code, which may impose additional requirements on the terms and conditions of such awards. All equity awards under the 2015 Plan will be set forth in award agreements, which will detail the terms and conditions of the awards, including any applicable vesting, performance conditions, if any, and payment terms and post- termination exercise limitations. Awards other than cash awards generally will be settled in shares of our Class A common stock, but the plan administrator may provide for cash settlement of any award. A brief description of each award type follows.
| • | Stock Options. Stock options provide for the purchase of shares of our Class A common stock in the future at an exercise price set on the grant date. ISOs, by contrast to NSOs, may provide tax deferral beyond exercise and favorable capital gains tax treatment to their holders if certain holding period and other requirements of the Internal Revenue Code are satisfied. The exercise price of a stock option generally will not be less than 100 percent of the fair market value of the underlying share on the date of grant (or 110 percent in the case of ISOs granted to certain significant stockholders), except with respect to certain substitute options granted in connection with a corporate transaction. The term of a stock option may not be longer than ten years (or five years in the case of ISOs granted to certain significant stockholders). Vesting conditions determined by the plan administrator may apply to stock options and may include continued service, performance and/or other conditions. |
| • | SARs. SARs entitle their holder, upon exercise, to receive from us an amount equal to the appreciation of the shares subject to the award between the grant date and the exercise date. The exercise price of a SAR will generally not be less than 100 percent of the fair market value of the underlying share on the date of grant (except with respect to certain substitute SARs granted in connection with a corporate transaction), and the term of a SAR may not be longer than ten years. Vesting conditions determined by the plan administrator may apply to SARs and may include continued service, performance and/or other conditions. |
| • | Restricted Stock and RSUs. Restricted stock is an award of nontransferable shares of our Class A common stock that remain forfeitable unless and until specified conditions are met, and which may be subject to a purchase price. RSUs are contractual promises to deliver shares of our Class A common stock, or an equivalent amount of cash, in the future, which may also remain forfeitable unless and until specified conditions are met, and may be accompanied by the right to receive the equivalent value of dividends paid on shares of our Class A common stock prior to the delivery of the underlying shares or an equivalent amount of cash. Delivery of the shares or an equivalent amount of cash underlying RSUs may be deferred under the terms of the award or at the election of the participant, if the plan administrator permits such a deferral. Conditions applicable to restricted stock and RSUs may be based on continuing service, the attainment of performance goals and/or such other conditions as the plan administrator may determine. |
| • | Other Stock or Cash Based Awards. Other stock or cash based awards are awards of cash, fully vested shares of our common stock and other awards valued wholly or partially by referring to, or otherwise based on, shares of our common stock. Other stock or cash based awards may be granted to participants and may also be available as a payment form in the settlement of other awards, as standalone payments and as payment in lieu of base salary, bonus, fees or other cash compensation otherwise payable to any individual who is eligible to receive awards. The plan administrator will determine the terms and conditions of other stock or cash based awards, which may include vesting conditions based on continued service, performance and/or other conditions. |
Performance Based Awards. Performance based awards include any of the foregoing awards that are granted subject to vesting and/or payment based on the attainment of specified performance goals or other criteria the plan administrator may determine, which may or may not be objectively determinable. Performance criteria upon which performance goals are established by the plan administrator may include but are not limited to: net earnings or losses (either before or after one or more of interest, taxes, depreciation, amortization, and noncash equity-based compensation expense); gross or net sales or revenue or sales or revenue growth; net
178
Table of Contents
Index to Financial Statements
income (either before or after taxes) or adjusted net income; profits (including but not limited to gross profits, net profits, profit growth, net operation profit or economic profit), profit return ratios or operating margin; budget or operating earnings (either before or after taxes or before or after allocation of corporate overhead and bonus); cash flow (including operating cash flow and free cash flow or cash flow return on capital); return on assets; return on capital or invested capital; cost of capital; return on stockholders’ equity; total stockholder return; return on sales; costs, reductions in costs and cost control measures; expenses; working capital; earnings or loss per share; adjusted earnings or loss per share; price per share or dividends per share (or appreciation in or maintenance of such price or dividends); regulatory achievements or compliance; implementation, completion or attainment of objectives relating to research, development, regulatory, commercial, or strategic milestones or developments; market share; economic value or economic value added models; division, group or corporate financial goals; individual business objectives; production or growth in production; reserves or added reserves; growth in reserves per share; inventory growth; environmental, health and/or safety performance; effectiveness of hedging programs; improvements in internal controls and policies and procedures; customer satisfaction/growth; customer service; employee satisfaction; recruitment and maintenance of personnel; human resources management; supervision of litigation and other legal matters; strategic partnerships and transactions; financial ratios (including those measuring liquidity, activity, profitability or leverage); debt levels or reductions; sales-related goals; financing and other capital raising transactions; cash on hand; acquisition activity; investment sourcing activity; and marketing initiatives, any of which may be measured in absolute terms or as compared to any incremental increase or decrease, peer group results, or market performance indicators or indices.
Provisions in the 2015 Plan Relating to Non-Employee Director Compensation. The 2015 Plan provides that the plan administrator may establish compensation for non-employee directors from time to time subject to the 2015 Plan’s limitations. FCX, as our sole stockholder prior to the consummation of this offering, has approved the initial terms of our director compensation program, which is described below under the heading “—Director Compensation.” Our Board of Directors or our Compensation Committee may modify the non-employee director compensation program from time to time in the exercise of its business judgment, taking into account such factors, circumstances and considerations as it shall deem relevant from time to time, provided that the grant date fair value of any equity awards granted as compensation for services as a non-employee director during any fiscal year may not exceed $ . The plan administrator may make exceptions to this limit for individual non-employee directors in extraordinary circumstances, as the plan administrator may determine in its discretion, provided that the non-employee director receiving such additional compensation would not participate in the decision to award such compensation or in other contemporaneous compensation decisions involving non-employee directors.
Certain Transactions. In connection with certain transactions and events affecting our Class A common stock, including a change in control, or change in any applicable laws or accounting principles, the plan administrator has broad discretion to take action under the 2015 Plan to prevent the dilution or enlargement of intended benefits, facilitate such transaction or event, or give effect to such change in applicable laws or accounting principles. This includes canceling awards, accelerating the vesting of awards, providing for the assumption or substitution of awards by a successor entity, adjusting the number and type of shares available, and replacing or terminating awards under the 2015 Plan. In addition, in the event of certain non-reciprocal transactions with our stockholders, or an “equity restructuring,” the plan administrator will make equitable adjustments to the 2015 Plan and outstanding awards as it deems appropriate to reflect the equity restructuring.
Adjustments, Claw-Back Provisions, Transferability and Participant Payments. The plan administrator may modify award terms, establish subplans and/or adjust other terms and conditions of awards, subject to the share limits described above. All awards will be subject to the provisions of any claw-back policy implemented by our company to the extent set forth in such claw-back policy and/or in the applicable award agreement. With limited exceptions for estate planning, domestic relations orders, certain beneficiary designations and the laws of descent and distribution, awards under the 2015 Plan are generally non-transferable prior to vesting, and are exercisable only by the participant. With regard to tax withholding, exercise price and purchase price obligations arising in connection with awards under the 2015 Plan, the plan administrator may, in its discretion, accept cash or check,
179
Table of Contents
Index to Financial Statements
shares of our Class A common stock that meet specified conditions, a promissory note, a “market sell order” or such other consideration as it deems suitable.
Plan Amendment and Termination. Our Board of Directors may amend awards or amend or terminate the 2015 Plan at any time; however, no amendment, other than an amendment that increases the number of shares available under the 2015 Plan, may materially and adversely affect an award outstanding under the 2015 Plan without the consent of the affected participant. Our Board of Directors is required to obtain stockholder approval of any amendment to the 2015 Plan to the extent necessary to comply with applicable laws. The 2015 Plan will remain in effect until the tenth anniversary of its effective date, unless earlier terminated by our Board of Directors.
Our or our subsidiaries’ officers, employees, consultants or advisors who also serve as directors do not receive additional compensation for their service as directors. Our directors who are not our or our subsidiaries’ officers, employees, consultants or advisors or FCX’s officers or employees, who we refer to as our non-employee directors, will receive cash and equity-based compensation for their services as directors.
As a wholly owned subsidiary of FCX incorporated in 2015, we did not pay or accrue any director compensation for 2014 or prior periods. Our Board of Directors and FCX, as our sole stockholder prior to the consummation of this offering, will approve the initial terms of our non-employee director compensation program, which is expected to consist of the following:
| • | an annual retainer of $ ; |
| • | an additional annual retainer of $ for service as the chair of any standing committee; and |
| • | an annual equity-based award granted under our Plan, having a value as of the grant date of approximately $ . |
Non-employee directors will also receive reimbursement for out-of-pocket expenses associated with attending board or committee meetings and director and officer liability insurance coverage. Each director will be fully indemnified by us for actions associated with being a director to the fullest extent permitted under Delaware law.
Compensation Committee Interlocks and Insider Participation
None of our officers or employees are members of our Compensation Committee.
180
Table of Contents
Index to Financial Statements
CERTAIN RELATIONSHIPS AND RELATED PARTY TRANSACTIONS
In connection with our corporate reorganization, we will engage in certain transactions with FCX and certain of its affiliates. See “Corporate Reorganization” for a description of these transactions.
For so long as FCX continues to own at least 80 percent of the total voting power and value of our common stock, we and our subsidiaries will be included in FCX’s consolidated group for U.S. federal income tax purposes. In addition we and our subsidiaries may also be included in certain consolidated, combined or unitary groups that include FCX and/or certain of its subsidiaries for state and local income tax purposes. Under the Tax Matters Agreement, FCX will prepare pro forma federal income tax returns for us as if we and our subsidiaries filed our own consolidated return, except that while such pro forma federal income tax return generally will include current income, deductions, credits and losses from us (with certain exceptions), it will not include any carrybacks of losses or credits. We will be required to reimburse FCX for any taxes (including, if applicable, the federal alternative minimum tax) shown on the pro forma federal income tax returns as well as our allocable share of any tax liability with respect to any other consolidated, combined or unitary returns in which we (or any of our subsidiaries) are included and that also include FCX or any of its subsidiaries (excluding us and our subsidiaries). Our inclusion in FCX’s consolidated group may result in FCX utilizing certain tax attributes that we generate, including net operating losses and certain deductions relating to our oil and gas exploration activities, and we will receive no compensation from FCX for the use of such attributes. In addition, although FCX may use its tax attributes to cause FCX’s consolidated group to owe no tax, we are nevertheless required to reimburse FCX for any taxes shown on the pro forma federal income tax returns, even though FCX had no cash tax expense for that period.
Due to FCX’s controlling ownership and the provisions in the Tax Matters Agreement, FCX will effectively control all of our tax decisions in connection with any consolidated, combined, unitary or separate income tax returns in which we (or any of our subsidiaries) are included. The Tax Matters Agreement provides that FCX will have sole authority to respond to and conduct all tax proceedings (including tax audits) relating to us with respect to any consolidated, combined, unitary or separate income tax returns in which we (or any of our subsidiaries) are included, to prepare and file all consolidated, combined or unitary income tax returns on our behalf (including the making of any tax elections), and to determine our liability on any pro forma tax returns and our allocable share of liability on any consolidated, combined or unitary tax returns in which we (or any of our subsidiaries) are included. This agreement may result in conflicts of interest between FCX and us. For example, under the Tax Matters Agreement, FCX will be able to choose to contest, compromise or settle any adjustment or deficiency proposed by the relevant taxing authority in a manner that may be beneficial to FCX and detrimental to us.
Although FCX has no plans or intent to effect a spin-off of our stock to FCX stockholders our and FCX’s respective rights, responsibilities and obligations with respect to any possible spin-off are set forth in the Tax Matters Agreement. If FCX were to decide to pursue a possible spin-off, we have agreed to cooperate with FCX and to take any and all actions requested by FCX in connection with such a transaction. The Tax Matters Agreement provides for certain continuing restrictions and covenants applicable to both FCX and us that are intended to preserve the ability for a spin-off to qualify as a tax-free transaction. We and FCX would each be responsible for any taxes resulting from the failure of the spin-off to qualify as a tax-free transaction to the extent such taxes are attributable to, or result from, any act or failure to act by us or FCX, as applicable, or certain transactions involving FCX or us, as applicable, following a spin-off.
Notwithstanding the Tax Matters Agreement, each member of a consolidated group for U.S. federal income tax purposes during any part of a consolidated return year is liable for the consolidated group’s entire tax liability for such year and for any subsequently determined deficiency thereon. Further, in some other jurisdictions, each member of a consolidated, combined or unitary group for state, local or foreign income tax purposes is jointly and severally liable for the state, local or foreign income tax liability of each other member of the consolidated,
181
Table of Contents
Index to Financial Statements
combined or unitary group. Accordingly, for any period in which we were included in the FCX consolidated group for U.S. federal income tax purposes or any other consolidated, combined or unitary group of FCX and/or its subsidiaries, we could be liable in the event that any income tax liability was incurred, but not discharged, by FCX or any other member of any such group.
We and FCX will enter into an intercompany loan agreement under which FCX will provide us with a loan of $ that will bear interest at a rate of percent per annum. The loan will be granted until , 20 during which time FCX will not exercise the right to call in the loan. Upon expiration of the term, the entire loan plus accrued interest will be fully repaid by us unless we reach an agreement with FCX to extend the term of the loan.
We and FCX will enter into a Shared Services Agreement under which FCX will provide and/or make available to us various administrative services and assets, for specified periods beginning on the date of the closing of this offering.
In addition, pursuant to the Shared Services Agreement, FCX will continue to allow us access to certain of its facilities and other property.
In consideration for such services, we will pay FCX fees generally in amounts intended to allow FCX to recover all of its direct and indirect costs incurred in providing those services.
The personnel performing services for us under the Shared Services Agreement will be employees and/or independent contractors of FCX and will not be under our direction or control.
The Shared Services Agreement will also contain customary indemnification provisions.
We and FCX will enter into a transaction agreement, which we refer to as the Transaction Agreement. The Transaction Agreement will govern the transactions under which we will execute our corporate reorganization and will provide for cross-indemnification, among other things. See “Corporate Reorganization.”
We and FCX will enter into a stockholders agreement, which we refer to as the Stockholders Agreement. The Stockholders Agreement will provide certain rights to FCX with respect to the designation of directors for nomination and election to our Board of Directors and approvals over certain actions taken by us, among other things.
Pursuant to the Stockholders Agreement, we have agreed to register the sale of shares of our Class A common stock and Class B common stock under certain circumstances. Any subsequent grants of registration rights will be subordinate to the registration rights of FCX.
Demand Registration Rights. At any time after the closing of this offering, FCX has the right to require us by written notice to register the sale of a number of its shares of our common stock in an underwritten offering. We are required to provide notice of the request within 10 days following the receipt of such demand request to all additional holders of our common stock, who may, in certain circumstances, participate in the registration. FCX has the right to cause an unlimited number of such demand registrations. In no event shall more than one
182
Table of Contents
Index to Financial Statements
demand registration occur during any six-month period or within 180 days (with respect to this offering) or 90 days (with respect to any public offering other than this offering) after the effective date of a final prospectus we file. We may also delay any demand registration by up to 30 days in succession or 60 days in a one year period if such demand registration would materially and adversely affect a pending or proposed transaction by us. Further, we are not obligated to effect any demand registration in which the anticipated aggregate offering price included in such offering is less than $ . FCX will have the right to choose underwriters who are reasonably acceptable to us and will underwrite any such demand registrations.
Once we are eligible to effect a registration on Form S-3, any such demand registration may be for a shelf registration statement at the election of FCX. We will be required to maintain the effectiveness of any such shelf registration statement until all of FCX’s registrable securities have been sold. So long as the proceeds from such a demand registration are anticipated to be at least $ , FCX will have the right to select the underwriters for the registration. Demand registrations by FCX will be subject to FCX’s obligations under the lock-up agreement that they have entered into with the underwriters of this offer. See “Underwriting—Lock-Up Agreements.”
Piggy-back Registration Rights. If, at any time, we propose to register an offering of our common stock (subject to certain exceptions) for our own account, other than a demand registration by FCX, as described above, then we must give at least fifteen days’ notice to all holders of our registrable securities to allow them to include a specified number of their shares in that registration statement. If we propose to register an offering of common stock pursuant to a demand registration by FCX, as described above, no other holders of our registrable securities may participate in such demand registration unless we receive written consent from FCX allowing such participation. To the extent that FCX allows such participation and the underwriters of the demand registration require a limitation on the number of shares which they will underwrite, the number of shares proposed to be offered in the demand registration by holders of our registrable securities other than FCX will be cut-back to comply with the limit set by the underwriters before any shares held by FCX are cut-back.
Conditions and Limitations; Expenses. These registration rights are subject to certain conditions and limitations, including the right of the underwriters to limit the number of shares to be included in a firm commitment underwritten offering and our right to terminate or suspend an offering under certain circumstances. We will generally pay all registration expenses other than any underwriting discounts in connection with our obligations under the Stockholders Agreement, regardless of whether a registration statement is filed or becomes effective or whether any shares of our common stock are sold.
Redeemable Noncontrolling Interest—Plains Offshore
One of our consolidated subsidiaries, Plains Offshore Operations Inc., which we refer to as Plains Offshore, holds certain of our Deepwater GOM assets: a 19.998 percent working interest in the Lucius field, our 50.0 percent working interest in the Phobos discovery and working interests in 86 other identified undeveloped locations. As of December 31, 2014, Plains Offshore held 5.3 percent, 3.6 percent and 7.5 percent of our total proved, probable and possible oil and gas reserves, respectively.
In 2011, we issued (i) 450,000 shares of 8.0% Convertible Preferred Stock in Plains Offshore, which we refer to as the Plains Offshore Preferred Stock, for gross proceeds of $450 million and (ii) non-detachable warrants with an exercise price of $20 per share to purchase in aggregate 9.1 million shares of Plains Offshore’s common stock. In addition, we issued 87 million shares of Plains Offshore Class A common stock, which are being held in escrow until the conversion and cancellation of the Plains Offshore Preferred Stock or the exercise of the warrants. In January 2014, Plains Offshore issued 4.8 million shares of Class A common stock to FM O&G at a price of $20 per share (a total of $96.0 million) and 24,000 shares of Preferred Stock to preferred holders for an aggregate price of $1,000 per share (a total of $24.0 million), together with non-detachable warrants, under the same terms. The Plains Offshore Preferred Stock represents a 20 percent equity interest in Plains Offshore and is entitled to a dividend of eight percent per annum, payable quarterly, of which two percent
183
Table of Contents
Index to Financial Statements
may be deferred ($37.1 million of accumulated deferred dividends as of June 30, 2015). The preferred holders are entitled to vote on all matters on which Plains Offshore common stockholders are entitled to vote. The shares of Plains Offshore Preferred Stock also fully participate, on an as-converted basis at four times, in cash dividends distributed to any class of common stockholders of Plains Offshore. Plains Offshore has not distributed any dividends to its common stockholders.
The holders of the Plains Offshore Preferred Stock have the right, at any time at their option, to convert any or all of such holder’s shares of Plains Offshore Preferred Stock, and exercise any of the associated nondetachable warrants, into shares of Class A common stock of Plains Offshore, at an initial conversion/exercise price of $20 per share. The conversion price is subject to adjustment as a result of certain events.
At any time on or after November 17, 2016 we may exercise a call right to purchase all, but not less than all, of the outstanding shares of Plains Offshore Preferred Stock and associated nondetachable warrants for cash, at a price equal to the greater of (i) the initial offering price plus any accumulated but unpaid dividends on such shares of Plains Offshore Preferred Stock to the purchase date and (ii) the amount that would be distributed in respect of all conversion shares (shares of Plains Offshore common stock issued upon conversion of shares of Plains Offshore Preferred Stock) upon a liquidation of Plains Offshore. At December 31, 2014 and 2013, the fair values of the non-detachable warrants included in other long-term liabilities in our consolidated balance sheets were $0.2 million and $2.5 million, respectively.
At any time after November 17, 2015 a majority of the preferred holders may cause Plains Offshore to use its commercially reasonable efforts to consummate an exit event. Such an exit event consists of (i) the repurchase of all of the issued and outstanding Plains Offshore Preferred Stock, (ii) a sale of Plains Offshore or (iii) an initial public offering of Plains Offshore. The form of such exit event shall be determined by Plains Offshore in its sole discretion and if Plains Offshore fails to consummate an exit event after having used its commercially reasonable efforts to consummate such exit event, Plains Offshore shall not be required to further pursue such exit event or to pursue any other exit event.
In the event of liquidation of Plains Offshore, each preferred holder is entitled to receive the liquidation preference before any payment or distribution is made on any Plains Offshore junior preferred stock or common stock. A liquidation event includes any of the following events: (i) the liquidation, dissolution or winding up of Plains Offshore, whether voluntary or involuntary, (ii) a sale, consolidation or merger of Plains Offshore in which the stockholders immediately prior to such event do not own at least a majority of the outstanding shares of the surviving entity or (iii) a sale or other disposition of all or substantially all of Plains Offshore’s assets to a person other than us or its affiliates. The liquidation preference, as defined in the stockholders agreement, is equal to (i) the greater of (a) 1.25 times the initial offering price and (b) the sum of (1) the fair value of the shares of common stock issuable upon conversion of the Preferred Stock and (2) the applicable tax adjustment amount, plus (ii) any accrued dividends and accumulated dividends.
The non-detachable warrants may be exercised at any time on the earlier of (i) November 17, 2019, or (ii) a termination event. A termination event is defined as the occurrence of any of (a) the conversion of the Preferred Stock, (b) the redemption of the Preferred Stock, (c) the repurchase by us or any of its affiliates of the Preferred Stock or (d) a liquidation event of Plains Offshore, described above.
Policies and Procedures for Review of Related Party Transactions
Pursuant to its charter, our Audit Committee, as well as the Executive Committee of the Board of Directors of FCX, must review and approve all material related party transactions, which include any related party transactions that we would be required to disclose pursuant to Item 404 of Regulation S-K promulgated by the SEC. In determining whether to approve a related party transaction, our Audit Committee will consider a number of factors including whether the related party transaction is on terms and conditions no less favorable to us than may reasonably be expected in arm’s length transactions with unrelated parties.
184
Table of Contents
Index to Financial Statements
We were formed on June 11, 2015 as a subsidiary of Freeport-McMoRan Oil & Gas LLC, which we refer to as FM O&G LLC, an indirect subsidiary of FCX. In connection with the closing of this offering, a corporate reorganization will be completed as described below. Investors in this offering will only receive, and this prospectus only describes the offering of, shares of Class A common stock of Freeport-McMoRan Oil & Gas Inc.
Our corporate reorganization will consist of the following steps:
| • | FM O&G LLC will transfer all of its assets and liabilities to Freeport-McMoRan Exploration & Production LLC, other than existing intercompany or third-party debt obligations and equity interests in its subsidiaries, which we refer to as the FM O&G LLC Subsidiaries; |
| • | FCX Oil & Gas Inc., which we refer to as FCX O&G, the parent of FM O&G LLC, will merge with and into FCX; |
| • | FM O&G LLC will merge with and into FCX; |
| • | FCX will transfer all of its equity interests in the FM O&G LLC Subsidiaries to Freeport-McMoRan Exploration & Production LLC; and |
| • | FCX will transfer all of the equity interests in Freeport-McMoRan Exploration & Production LLC to Freeport-McMoRan Oil & Gas Inc. |
As a result of these steps, we will become a direct subsidiary of FCX. We will operate and control all of the business and affairs of the existing oil and gas business of FCX. Also as a result of these steps, our revolving notes and other long-term debt, including our senior notes, will be eliminated. We refer to the transactions above collectively as the “corporate reorganization.”
We and FCX will enter into the Transaction Agreement detailing the terms of our corporate reorganization and providing for, among other things, indemnification of FCX by us for all liabilities relating to the conduct of the oil and gas business of FCX, and indemnification of us by FCX for all liabilities relating to the conduct of the mining business of FCX, in each case whether arising before or after the closing.
The following diagrams set forth our simplified ownership structure (i) prior to our corporate reorganization and (ii) after giving effect to our corporate reorganization and this offering (assuming no exercise of the underwriters’ option to purchase additional shares). This chart is provided for illustrative purposes only and does not represent all legal entities affiliated with us.
Ownership Structure Prior to Our Corporate Reorganization
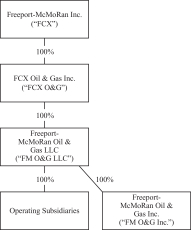
185
Table of Contents
Index to Financial Statements
Ownership Structure After Giving Effect to Our Corporate Reorganization and This Offering(1)
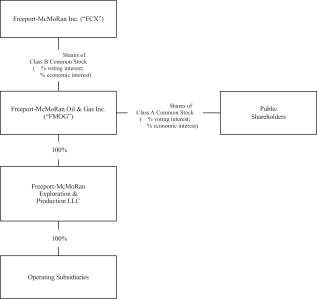
| (1) | Structure chart assumes that the underwriters will not exercise their option to purchase additional shares of Class A common stock from us. The public stockholders will hold percent of our shares of common stock if the underwriters exercise in full their option to purchase additional shares of Class A common stock from us. |
186
Table of Contents
Index to Financial Statements
The following table sets forth the beneficial ownership of our Class A and Class B common stock immediately prior to and after this offering by:
| • | each entity or person known by us to beneficially own more than five percent of our outstanding Class A and Class B common stock; |
| • | each of our Named Executive Officers, which we refer to as NEOs; |
| • | each member of our Board of Directors; and |
| • | all of our directors and executive officers as a group. |
Except as otherwise indicated, the person or entities listed below have sole voting and investment power with respect to all shares of our Class A and Class B common stock beneficially owned by them, except to the extent this power may be shared with a spouse. All information with respect to beneficial ownership has been furnished by the respective directors, NEOs or five percent or more stockholders, as the case may be. Unless otherwise indicated, the address for each listed beneficial owner is 700 Milam, Suite 3100, Houston, Texas 77002.
The amounts and percentages of Class A and Class B common stock beneficially owned are reported on the bases of regulations of the SEC governing the determination of beneficial ownership of securities. Under the rules of the SEC, a person is deemed to be a “beneficial owner” of a security if that person has or shares voting power, which includes the power to vote or direct the voting of such security, or investment power, which includes the power to dispose of or to direct the disposition of such security. Securities that can be so acquired are deemed to be outstanding for purposes of computing such person’s ownership percentage, but not for purposes of computing any other person’s percentage. Under these rules, more than one person may be deemed beneficial owner of the same securities and a person may be deemed to be a beneficial owner of securities as to which such person has no economic interest. Except as otherwise indicated, each of the beneficial owners has, to our knowledge, sole voting and investment power with respect to the indicated shares of common stock.
| Before the Offering | After the Offering | |||||||||||||||||||||
| Common Stock | % of Total Voting Power |
Class A common stock |
Class B common stock |
% of Total Voting Power | ||||||||||||||||||
| Name of Beneficial Owner |
Number | Percentage | Number | Percentage | Number | Percentage | ||||||||||||||||
| Principal Stockholders |
||||||||||||||||||||||
| Freeport-McMoRan |
1,000 | 100 | % | 100 | % | |||||||||||||||||
| Directors and Named Executive Officers |
||||||||||||||||||||||
| James R. Moffett |
— | — | — | |||||||||||||||||||
| James C. Flores |
— | — | — | |||||||||||||||||||
| Doss R. Bourgeois |
— | — | — | |||||||||||||||||||
| Winston M. Talbert |
— | — | — | |||||||||||||||||||
| John F. Wombwell |
— | — | — | |||||||||||||||||||
| Directors and executive officers as a group (5 persons) |
— | — | — | |||||||||||||||||||
| * | Less than one percent. |
187
Table of Contents
Index to Financial Statements
The following is a description of our amended and restated certificate of incorporation and amended and restated by-laws as each will be in effect as of the closing of this offering. The following description is intended as a summary only and is qualified in its entirety by reference to our amended and restated certificate of incorporation and our amended and restated by-laws, copies of which will be filed with the SEC as exhibits to our registration statement on Form S-1, of which this prospectus forms a part.
Pursuant to our amended and restated certificate of incorporation, our authorized capital stock consists of shares of Class A common stock, $0.01 par value per share, shares of Class B common stock, $0.01 par value per share, and shares of preferred stock, $0.01 par value per share. There will be no shares of preferred stock outstanding immediately following the closing of this offering. Upon the effectiveness of our amended and restated certificate of incorporation following the closing of this offering, we will have two classes of common stock.
Common Stock Outstanding
The issued and outstanding shares of common stock are, and the shares of common stock that we may issue in the future will be, validly issued, fully paid and nonassessable.
Voting Rights
Holders of our Class A and Class B common stock have identical rights, provided that, except as required by applicable law, on any matter that is submitted to a vote of our stockholders, holders of our Class A common stock are entitled to one vote per share of Class A common stock and holders of our Class B common stock are entitled to five votes per share of Class B common stock. Holders of shares of Class A and Class B common stock will vote together as a single class on all matters (including the election of directors) submitted to a vote of stockholders, except that (a) so long as any shares of Class A common stock are outstanding, without the affirmative vote of the holders of a majority of the voting power of the outstanding shares of Class A common stock, we may not amend, alter or repeal any provision of our amended and restated certificate of incorporation so as to adversely affect the relative rights, preferences, qualifications, limitations or restrictions of the Class A common stock as compared to those of the Class B common stock and (b) so long as any shares of Class B common stock are outstanding, without the affirmative vote of the holders of a majority of the voting power of the outstanding shares of Class B common stock, we may not amend, alter or repeal any provision of our amended and restated certificate of incorporation so as to adversely affect the relative rights, preferences, qualifications, limitations or restrictions of the Class B common stock as compared to those of the Class A common stock. Holders of Class A and Class B common stock do not have cumulative voting rights in the election of directors.
Dividend Rights; Rights Upon Liquidation
Holders of the Class A and Class B common stock will share ratably in any cash dividend that may from time to time be declared with respect to the common stock by our Board of Directors, subject to the rights, if any, of the holders of any outstanding series of preferred stock. In the event a dividend is paid in the form of shares of common stock or rights to acquire shares of common stock, the holders of Class A common stock will receive Class A common stock, or rights to acquire Class A common stock, as the case may be, and the holders of Class B common stock will receive Class B common stock, or rights to acquire Class B common stock, as the case may be. However, in general and subject to certain limited exceptions, without approval of each class of our
188
Table of Contents
Index to Financial Statements
common stock, we may not pay any dividends or make other distributions with respect to any class of common stock unless at the same time we make a ratable dividend or distribution with respect to each outstanding share of common stock, regardless of class. Under Delaware law, we can only pay dividends either out of “surplus” or out of the current or the immediately preceding year’s net profits. Surplus is defined as the excess, if any, at any given time, of the total assets of a corporation over its total liabilities and statutory capital. The value of a corporation’s assets can be measured in a number of ways and may not necessarily equal their book value. In the event of a voluntary or involuntary liquidation, dissolution or winding up of our company, subject to the rights, if any, of the holders of any outstanding series of preferred stock, the holders of the Class A and Class B common stock will share ratably, according to the number of shares held by them, in our remaining assets, if any.
Equal Status
Except as otherwise described in this prospectus, shares of Class A common stock and Class B common stock will have the same rights and privileges and rank equally, share ratably and be identical in all respect as to all matters.
Other Rights
Shares of Class A and Class B common stock are not redeemable and have no subscription, conversion or preemptive rights.
Transfer Agent
The transfer agent and registrar for our common stock is Computershare Shareowner Services LLC.
NYSE
We intend to apply to list our common stock for quotation on the NYSE under the symbol “FMOG.”
We may issue shares of preferred stock in series and may, at the time of issuance, determine the rights, preferences and limitations of each series. Satisfaction of any dividend preferences of outstanding shares of preferred stock would reduce the amount of funds available for the payment of dividends on shares of Class A and Class B common stock. Holders of shares of preferred stock may be entitled to receive a preference payment in the event of any liquidation, dissolution or winding-up of our company before any payment is made to the holders of shares of Class A and Class B common stock. In some circumstances, the issuance of shares of preferred stock may render more difficult or tend to discourage a merger, tender offer or proxy contest, the assumption of control by a holder of a large block of our securities or the removal of incumbent management. Upon the affirmative vote of a majority of the total number of directors then in office, our Board of Directors, without stockholder approval, may issue shares of preferred stock with voting and conversion rights which could adversely affect the holders of shares of Class A and Class B common stock. The issuance of any shares of preferred stock in the future could adversely affect the rights of the holders of Class A and Class B common stock.
Certain Provisions of Our Amended and Restated Certificate of Incorporation and By-laws
Supermajority Voting/Fair Price Requirements
Our amended and restated certificate of incorporation provides for no supermajority voting or fair price requirements in connection with any interested party transactions so long as FCX holds at least 50 percent of the combined voting power of our common stock. Upon the total voting power beneficially owned by FCX
189
Table of Contents
Index to Financial Statements
becoming less than 50 percent of the combined voting power of our outstanding Class A and Class B common stock, our amended and restated certificate of incorporation provides that the approval of the holders of not less than 66 2/3 percent of our outstanding voting power of our combined common stock is required for:
| • | Any merger or consolidation of our company or any of our subsidiaries with or into any person or entity, or any affiliate of that person or entity, who was within the two years prior to the transaction a beneficial owner of 20 percent or more of our common stock or any class of our common stock, which we refer to as an interested party; |
| • | any merger or consolidation of an interested party with or into our company or any of our subsidiaries; |
| • | any sale, lease, exchange, mortgage, pledge, transfer or other disposition of more than 10 percent of the fair market value of the total assets of our company or any of our subsidiaries in one or more transactions involving an interested party; |
| • | the adoption of any plan or proposal for liquidation or dissolution of our company proposed by or on behalf of any interested party; |
| • | the issuance or transfer by us or any of our subsidiaries of securities having a fair market value of $10 million or more to any interested party; or |
| • | any recapitalization, reclassification, merger or consolidation of our company or any of our subsidiaries that would increase an interested party’s voting power in our company or any of our subsidiaries. |
However, the two-thirds voting requirement will not be applicable if:
| • | our Board of Directors approves the transaction, or approves the acquisition of the common stock that caused the interested party to become an interested party, and the vote includes the affirmative vote of a majority of our directors who are not affiliates of the interested party and who were members of our Board of Directors prior to the time the interested party became the interested party; |
| • | the transaction is solely between us and any of our wholly owned subsidiaries or between any of our wholly owned subsidiaries; or |
| • | the transaction is a merger or consolidation and the consideration to be received by our common stockholders is at least as high as the highest price per share paid by the interested party for our common stock on the date the common stock was last acquired by the interested party or during a period of two years prior. |
Amendments to Supermajority Voting Requirement
Upon the total voting power beneficially owned by FCX becoming less than 50 percent of the combined voting power of our outstanding Class A and Class B common stock, the affirmative vote of at least 66 2/3 percent of the voting power of our common stock is required to amend, alter, change or repeal the provisions in our amended and restated certificate of incorporation providing for the supermajority voting/fair price requirements described above.
Effects of Authorized but Unissued Common Stock and Blank Check Preferred Stock
One of the effects of the existence of authorized but unissued common stock and undesignated preferred stock may be to enable our Board of Directors to make more difficult or to discourage an attempt to obtain control of our company by means of a merger, tender offer, proxy contest or otherwise, and thereby to protect the continuity of management. If, in the due exercise of its fiduciary obligations, the Board of Directors were to determine that a takeover proposal was not in our best interest, such shares could be issued by the Board of Directors without stockholder approval in one or more transactions that might prevent or render more difficult or costly the completion of the takeover transaction by diluting the voting or other rights of the proposed acquirer or
190
Table of Contents
Index to Financial Statements
insurgent stockholder group, by putting a substantial voting bloc in institutional or other hands that might undertake to support the position of the incumbent Board of Directors, by effecting an acquisition that might complicate or preclude the takeover, or otherwise.
In addition, our amended and restated certificate of incorporation grants our Board of Directors broad power to establish the rights and preferences of authorized and unissued shares of preferred stock. The issuance of shares of preferred stock could decrease the amount of earnings and assets available for distribution to holders of shares of common stock. The issuance also may adversely affect the rights and powers, including voting rights, of those holders and may have the effect of delaying, deterring or preventing a change in control of our company.
Advanced Notice of Intention to Nominate a Director
Our by-laws permit a stockholder to nominate a person for election as a director only if written notice of such stockholder’s intent to make a nomination has been delivered to our Secretary not later than the close of business on the 90th day nor earlier than the close of business on the 120th day prior to the first anniversary of the preceding year’s annual meeting. This provision also requires that the notice set forth, among other things, a description of all arrangements or understandings between the nominee and the stockholder pursuant to which the nomination is to be made or the nominee is to be elected and such other information regarding the nominee as would be required to be included in a proxy statement filed pursuant to the proxy rules promulgated under the Exchange Act, had the nominee been nominated by our Board of Directors. Any nomination that fails to comply with these requirements may be disqualified.
Advance Notice of Stockholder Proposals
Our by-laws permit a stockholder proposal to be presented at a stockholders’ meeting only if prior written notice of the proposal is provided to us within the time periods and in the manner specified in the by-laws.
Ability of Stockholder to Call Special Meetings
Our by-laws provide the right of stockholders owning at least fifteen percent of the voting power of our common stock to call a special meeting of stockholders. Except for such stockholders, only the Board of Directors, the chairman of the Board of Directors or the president may call special meetings of the stockholders.
Actions by Written Consent
Until such time as the total voting power beneficially owned by FCX becomes less than 50 percent of the combined voting power of our outstanding shares of Class A and Class B common stock, our by-laws permit our stockholders to take any action required or permitted to be taken at any annual or special meeting of stockholders by written consent of stockholders having not less than a minimum number of votes that would be necessary to authorize or take such action at a meeting at which all shares entitled to vote thereon were present and voted.
Removal of Directors; Filling Vacancies on Board of Directors
Our amended and restated certificate of incorporation provides that any director may be removed, with or without cause, by a vote of the holders of a majority of the voting power of both classes of our common stock, voting together as a single class. Upon the total voting power beneficially owned by FCX becoming less than 50 percent of the combined voting power of our outstanding shares of Class A and Class B common stock, any director may only be removed for cause by a vote of the holders of a majority of the voting power of both classes of our common stock, voting together as a single class. In addition, any vacancies on the Board of Directors resulting from the death, resignation, retirement or removal of a director may be filled by a vote of holders of a majority of the voting power of our common stock voting together as a single class, except that in the case of any vacancy resulting from the death, resignation, retirement or removal of a director appointed by FCX, FCX may, pursuant to the Stockholders Agreement, have the exclusive right to fill such vacancy through appointment
191
Table of Contents
Index to Financial Statements
of a new director. The certificate of incorporation also provides that the remaining directors, regardless of any quorum requirements set out in the amended and restated by-laws, may also fill any vacancy (including any resulting from an increase in the authorized number of directors) by majority vote, unless FCX then has the exclusive right to fill such vacancy pursuant to the Stockholders Agreement.
Amendment of By-Laws
Our amended and restated certificate of incorporation and by-laws provide that the by-laws may be altered, amended, changed or repealed by vote of the stockholders or at any meeting of the Board of Directors by the vote of a majority of the directors present or as otherwise provided by statute.
Limitation of Liability of Directors and Officers
As permitted by the Delaware General Corporation Law, our amended and restated certificate of incorporation includes a provision that eliminates the personal liability of our directors for monetary damages for breach of fiduciary duty as a director, except for liability (1) for any breach of the director’s duty of loyalty to our company or its stockholders, (2) for acts or omissions not in good faith or that involve intentional misconduct or a knowing violation of law, (3) under section 174 of the Delaware General Corporation Law or (4) for any transaction from which the director derived an improper personal benefit. The effect of this provision is to eliminate our rights and our stockholders’ rights to recover monetary damages against a director or officer for breach of a fiduciary duty of care. The provision does not eliminate or limit our right, or the right of a stockholder, to seek non-monetary relief, such as an injunction or rescission. The SEC has taken the position that this provision will have no effect on claims arising under the federal securities laws.
In addition, our amended and restated certificate of incorporation provides for mandatory indemnification rights to the fullest extent permitted by law to any director or executive officer who (because of the fact that he or she is or was our director or officer) is involved in a legal proceeding of any nature. These indemnification rights include reimbursement for expenses incurred by the director or officer in advance of the final disposition of a proceeding according to applicable law. Our amended and restated charter further requires that we serve as the primary indemnitor for all directors on our board appointed by FCX notwithstanding the availability of indemnification from FCX for the same expenses or judgments.
Waiver of the Corporate Opportunity Doctrine
Our amended and restated certificate of incorporation waives our rights under the corporate opportunity doctrine with respect to FCX and its affiliates to the fullest extent permitted by law.
192
Table of Contents
Index to Financial Statements
SHARES ELIGIBLE FOR FUTURE SALE
Future sales of, or the perceived potential for the sale of, our Class A common stock in the public market may have an adverse effect on the market price for our Class A common stock and could impair our ability to raise capital through future sales of our securities. See “Risk Factors—Risks Related to this Offering and Our Common Stock—Future sales of our Class A common stock, or the perception that such future sales may occur, may cause our stock price to decline.”
Upon the completion of this offering, we will have shares of Class A common stock outstanding (or shares of Class A common stock if the underwriters’ option to purchase additional shares of our Class A common stock from us is exercised in full) and shares of Class B common stock outstanding. Of these shares, all of the Class A common stock to be sold in this offering plus any shares sold upon exercise of the underwriters’ option to purchase additional shares of our Class A common stock from us, will be freely tradable without restriction or further registration under the Securities Act, unless the shares are held by any of our “affiliates” as such term is defined in Rule 144 of the Securities Act. All of the shares of Class B common stock outstanding after this offering will be deemed “restricted securities” as such term is defined under Rule 144 because they are owed by an affiliate. The restricted securities were issued and sold by us in private transactions and are eligible for public sale only if registered under the Securities Act or if they qualify for an exemption from registration under Rule 144 or Rule 701 under the Securities Act, which rules are summarized below.
As a result of the lock-up agreements described below and the provisions of Rule 144 and Rule 701 under the Securities Act, shares of our Class B common stock held by FCX and our directors and executive officers will be available for sale in the public market upon the expiration of the lock-up agreements, beginning days after the date of this prospectus and when permitted under Rule 144 or Rule 701.
In general, under Rule 144, a person (or persons whose shares are aggregated) who is not deemed to have been an affiliate of ours at any time during the three months preceding a sale, and who has beneficially owned restricted securities within the meaning of Rule 144 for a least six months (including any period of consecutive ownership of preceding non-affiliated holders) would be entitled to sell those shares, subject only to the availability of current public information about us. A non-affiliated person who has beneficially owned restricted securities within the meaning of Rule 144 for at least one year would be entitled to sell those shares without regard to the provisions of Rule 144.
A person (or persons whose shares are aggregated) who is deemed to be an affiliate of ours and who has beneficially owned restricted securities within the meaning of Rule 144 for at least six months would be entitled to sell within any three-month period a number of shares that does not exceed the greater of one percent of the then outstanding shares of our common stock or the average weekly trading volume of our Class A common stock reported through the NYSE during the four calendar weeks preceding the filing of notice of the sale. Such sales are also subject to certain manner of sale provisions, notice requirements and the availability of current public information about us.
In general, under Rule 701, any of our employees, directors, officers, consultants or advisors who purchases shares from us in connection with a compensatory stock or option plan or other written agreement before the effective date of this offering is entitled to sell such shares 60 days after the effective date of this offering in reliance on Rule 144, without having to comply with the holding period requirement of Rule 144 and, in the case of non-affiliates, without having to comply with the public information, volume limitation or notice filing
193
Table of Contents
Index to Financial Statements
provisions of Rule 144. The SEC has indicated that Rule 701 will apply to typical stock options granted by an issuer before it becomes subject to the reporting requirements of the Exchange Act, along with the shares acquired upon exercise of such options, including exercises after the date of this prospectus.
We have granted FCX registration rights with respect to the shares of outstanding Class B common stock owned by FCX after the closing of this offering. See “Certain Relationships and Related Party Transactions—Stockholders Agreement” for more detail regarding these registration rights.
We, FCX and each of our directors and executive officers have agreed that, subject to certain exceptions, without the prior written consent of Barclays Capital Inc., we and they will not, directly or indirectly, for a period of days after the date of the offering, offer, pledge, sell, contract to sell or otherwise transfer or dispose of any shares of our common stock or any other securities convertible into or exercisable or exchangeable for our common stock. For additional information, see “Underwriting.”
194
Table of Contents
Index to Financial Statements
MATERIAL U.S. FEDERAL INCOME TAX CONSEQUENCES TO NON-U.S. HOLDERS OF OUR CLASS A COMMON STOCK
The following discussion is a summary of the material U.S. federal income tax consequences to Non-U.S. Holders (as defined below) of the purchase, ownership and disposition of our Class A common stock issued pursuant to this offering, but does not purport to be a complete analysis of all potential tax effects. The effects of other U.S. federal tax laws, such as estate and gift tax laws, and any applicable state, local or non-U.S. tax laws are not discussed. This discussion is based on the U.S. Internal Revenue Code of 1986, as amended, which we refer to as the Code, Treasury Regulations promulgated thereunder, judicial decisions, and published rulings and administrative pronouncements of the U.S. Internal Revenue Service, which we refer to as the IRS, in each case in effect as of the date hereof. These authorities may change or be subject to differing interpretations. Any such change or differing interpretation may be applied retroactively in a manner that could adversely affect a Non-U.S. Holder of our Class A common stock. We have not sought and will not seek any rulings from the IRS regarding the matters discussed below. There can be no assurance the IRS or a court will not take a contrary position to that discussed below regarding the tax consequences of the purchase, ownership and disposition of our Class A common stock.
This discussion is limited to Non-U.S. Holders that hold our Class A common stock as a “capital asset” within the meaning of Section 1221 of the Code (generally, property held for investment). This discussion does not address all U.S. federal income tax consequences relevant to a Non-U.S. Holder’s particular circumstances, including the impact of the Medicare contribution tax on net investment income. In addition, it does not address consequences relevant to Non-U.S. Holders subject to special rules, including, without limitation:
| • | U.S. expatriates and former citizens or long-term residents of the United States; |
| • | persons subject to the alternative minimum tax; |
| • | persons holding our Class A common stock as part of a hedge, straddle or other risk reduction strategy or as part of a conversion transaction or other integrated investment; |
| • | banks, insurance companies, and other financial institutions; |
| • | brokers, dealers or traders in securities; |
| • | “controlled foreign corporations,” “passive foreign investment companies,” and corporations that accumulate earnings to avoid U.S. federal income tax; |
| • | partnerships or other entities or arrangements treated as partnerships for U.S. federal income tax purposes (and investors therein); |
| • | tax-exempt organizations or governmental organizations; |
| • | persons deemed to sell our Class A common stock under the constructive sale provisions of the Code; |
| • | persons who hold or receive our Class A common stock pursuant to the exercise of any employee stock option or otherwise as compensation; and |
| • | tax-qualified retirement plans. |
If an entity treated as a partnership for U.S. federal income tax purposes holds our Class A common stock, the tax treatment of a partner in the partnership will depend on the status of the partner, the activities of the partnership and certain determinations made at the partner level. Accordingly, partnerships holding our Class A common stock and the partners in such partnerships should consult their tax advisors regarding the U.S. federal income tax consequences to them.
THIS DISCUSSION IS FOR INFORMATIONAL PURPOSES ONLY AND IS NOT TAX ADVICE. INVESTORS SHOULD CONSULT THEIR TAX ADVISORS WITH RESPECT TO THE APPLICATION OF THE U.S. FEDERAL INCOME TAX LAWS TO THEIR PARTICULAR
195
Table of Contents
Index to Financial Statements
SITUATIONS AS WELL AS ANY TAX CONSEQUENCES OF THE PURCHASE, OWNERSHIP AND DISPOSITION OF OUR CLASS A COMMON STOCK ARISING UNDER THE U.S. FEDERAL ESTATE OR GIFT TAX LAWS OR UNDER THE LAWS OF ANY STATE, LOCAL OR NON-U.S. TAXING JURISDICTION OR UNDER ANY APPLICABLE INCOME TAX TREATY.
Definition of a Non-U.S. Holder
For purposes of this discussion, a “Non-U.S. Holder” is any beneficial owner of our Class A common stock that is neither a “U.S. person” nor an entity treated as a partnership for U.S. federal income tax purposes. A U.S. person is any person that, for U.S. federal income tax purposes, is or is treated as any of the following:
| • | an individual who is a citizen or resident of the United States; |
| • | a corporation (or other entity classified as a corporation for U.S. federal income tax purposes) created or organized under the laws of the United States, any state thereof, or the District of Columbia; |
| • | an estate, the income of which is subject to U.S. federal income tax regardless of its source; or |
| • | a trust that (1) is subject to the primary supervision of a U.S. court and the control of one or more “United States persons” (within the meaning of Section 7701(a)(30) of the Code), or (2) has a valid election in effect to be treated as a United States person for U.S. federal income tax purposes. |
As described in the section entitled “Dividend Policy” we do not anticipate declaring or paying dividends to holders of our Class A common stock in the foreseeable future. However, if we do make distributions of cash or property on our Class A common stock, such distributions will constitute dividends for U.S. federal income tax purposes to the extent paid from our current or accumulated earnings and profits, as determined under U.S. federal income tax principles. Amounts not treated as dividends for U.S. federal income tax purposes will constitute a return of capital and first be applied against and reduce a Non-U.S. Holder’s adjusted tax basis in its Class A common stock, but not below zero. Any excess will be treated as capital gain and will be treated as described below under “—Sale or Other Taxable Disposition.” Because we believe that we are a “United States real property holding corporation” (see the discussion under “—Sale or Other Taxable Disposition” below), any distribution by us to a Non-U.S. Holder that is not treated as a dividend may be subject to U.S. withholding at a rate of not less than 10 percent, regardless of whether such portion is subject to U.S. federal income tax in the hands of the Non-U.S. Holder. A Non-U.S. Holder may obtain a refund of any excess withheld amounts by filing an appropriate claim for refund with the IRS.
Subject to the discussion below on effectively connected income, dividends paid to a Non-U.S. Holder of our Class A common stock will be subject to U.S. federal withholding tax at a rate of 30 percent of the gross amount of the dividends (or such lower rate specified by an applicable income tax treaty, provided the Non-U.S. Holder furnishes a valid IRS Form W-8BEN or W-8BEN-E (or other applicable documentation) certifying qualification for the lower treaty rate). A Non-U.S. Holder that does not timely furnish the required documentation, but that qualifies for a reduced treaty rate, may obtain a refund of any excess amounts withheld by timely filing an appropriate claim for refund with the IRS. Non-U.S. Holders should consult their tax advisors regarding their entitlement to benefits under any applicable income tax treaty.
If dividends paid to a Non-U.S. Holder are effectively connected with the Non-U.S. Holder’s conduct of a trade or business within the United States (and, if required by an applicable income tax treaty, the Non-U.S. Holder maintains a permanent establishment in the United States to which such dividends are attributable), the Non-U.S. Holder will be exempt from the U.S. federal withholding tax described above. To claim the exemption, the Non-U.S. Holder must furnish to the applicable withholding agent a valid IRS Form W-8ECI, certifying that the dividends are effectively connected with the Non-U.S. Holder’s conduct of a trade or business within the United States.
196
Table of Contents
Index to Financial Statements
Any such effectively connected dividends will be subject to U.S. federal income tax on a net income basis at the regular graduated rates. A Non-U.S. Holder that is a corporation also may be subject to a branch profits tax at a rate of 30 percent (or such lower rate specified by an applicable income tax treaty) on such effectively connected dividends, as adjusted for certain items. Non-U.S. Holders should consult their tax advisors regarding any applicable tax treaties that may provide for different rules.
Sale or Other Taxable Disposition
A Non-U.S. Holder will not be subject to U.S. federal income tax on any gain realized upon the sale or other taxable disposition of our Class A common stock unless:
| • | the gain is effectively connected with the Non-U.S. Holder’s conduct of a trade or business within the United States (and, if required by an applicable income tax treaty, the Non-U.S. Holder maintains a permanent establishment in the United States to which such gain is attributable); |
| • | the Non-U.S. Holder is a nonresident alien individual present in the United States for 183 days or more during the taxable year of the disposition and certain other requirements are met; or |
| • | our Class A common stock constitutes a U.S. real property interest, which we refer to as USRPI, by reason of our status as a U.S. real property holding corporation, which we refer to as USRPHC, for U.S. federal income tax purposes. |
Gain described in the first bullet point above generally will be subject to U.S. federal income tax on a net income basis at the regular graduated rates. A Non-U.S. Holder that is a corporation also may be subject to a branch profits tax at a rate of 30 percent (or such lower rate specified by an applicable income tax treaty) on such effectively connected gain, as adjusted for certain items.
A Non-U.S. Holder described in the second bullet point above will be subject to U.S. federal income tax at a rate of 30 percent (or such lower rate specified by an applicable income tax treaty) on any gain derived from the sale, which may be offset by certain U.S. source capital losses of the Non-U.S. Holder (even though the individual is not considered a resident of the United States), provided the Non-U.S. Holder has timely filed U.S. federal income tax returns with respect to such losses.
With respect to the third bullet point above, we believe that we currently are, and expect to remain for the foreseeable future, a USRPHC for U.S. federal income tax purposes. However, so long as our Class A common stock is “regularly traded on an established securities market,” a Non-U.S. Holder will be subject to U.S. federal net income tax on a disposition of our Class A common stock only if the Non-U.S. Holder actually or constructively holds or held (at any time during the shorter of the five-year period preceding the date of disposition or the Non-U.S. Holder’s holding period) more than five percent of our Class A common stock. If our Class A common stock is not considered to be so traded, a Non-U.S. Holder generally would be subject to U.S. federal income tax on the gain realized on a disposition of our Class A common stock and generally would be required to file a U.S. federal income tax return, and a 10 percent withholding tax would apply to the gross proceeds from such sale.
Non-U.S. Holders should consult their tax advisors regarding potentially applicable income tax treaties that may provide for different rules.
Information Reporting and Backup Withholding
Payments of dividends on our Class A common stock will not be subject to backup withholding, provided the applicable withholding agent does not have actual knowledge or reason to know the holder is a United States person and the holder either certifies its non-U.S. status, such as by furnishing a valid IRS Form W-8BEN, W-8BEN-E or W-8ECI, or otherwise establishes an exemption. However, information returns are required to be
197
Table of Contents
Index to Financial Statements
filed with the IRS in connection with any dividends on our Class A common stock paid to the Non-U.S. Holder, regardless of whether any tax was actually withheld. In addition, proceeds of the sale or other taxable disposition of our Class A common stock within the United States or conducted through certain U.S.-related brokers generally will not be subject to backup withholding or information reporting, if the applicable withholding agent receives the certification described above and does not have actual knowledge or reason to know that such holder is a United States person, or the holder otherwise establishes an exemption. Proceeds of a disposition of our Class A common stock conducted through a non-U.S. office of a non-U.S. broker generally will not be subject to backup withholding or information reporting.
Copies of information returns that are filed with the IRS may also be made available under the provisions of an applicable treaty or agreement to the tax authorities of the country in which the Non-U.S. Holder resides or is established.
Backup withholding is not an additional tax. Any amounts withheld under the backup withholding rules may be allowed as a refund or a credit against a Non-U.S. Holder’s U.S. federal income tax liability, provided the required information is timely furnished to the IRS.
Additional Withholding Tax on Payments Made to Foreign Accounts
Withholding taxes may be imposed under Sections 1471 to 1474 of the Code (such Sections commonly referred to as the Foreign Account Tax Compliance Act, which we refer to as FATCA) on certain types of payments made to non-U.S. financial institutions and certain other non-U.S. entities. Specifically, a 30 percent withholding tax may be imposed on dividends on, or gross proceeds from the sale or other disposition of, our Class A common stock paid to a “foreign financial institution” or a “non-financial foreign entity” (each as defined in the Code), unless (1) the foreign financial institution undertakes certain diligence and reporting obligations, (2) the non-financial foreign entity either certifies it does not have any “substantial United States owners” (as defined in the Code) or furnishes identifying information regarding each substantial United States owner, or (3) the foreign financial institution or non-financial foreign entity otherwise qualifies for an exemption from these rules. If the payee is a foreign financial institution and is subject to the diligence and reporting requirements in (1) above, it must enter into an agreement with the U.S. Department of the Treasury requiring, among other things, that it undertake to identify accounts held by certain “specified United States persons” or “United States-owned foreign entities” (each as defined in the Code), annually report certain information about such accounts, and withhold 30 percent on certain payments to non-compliant foreign financial institutions and certain other account holders. Foreign financial institutions located in jurisdictions that have an intergovernmental agreement with the United States governing FATCA may be subject to different rules.
Under the applicable Treasury Regulations, withholding under FATCA generally applies to payments of dividends on our Class A common stock, and will apply to payments of gross proceeds from the sale or other disposition of such stock on or after January 1, 2017.
Prospective investors should consult their tax advisors regarding the potential application of withholding under FATCA to their investment in our Class A common stock.
198
Table of Contents
Index to Financial Statements
Barclays Capital Inc. is acting as the representative of the underwriters, and Barclays Capital Inc., and are the joint book-running managers of this offering. Under the terms of an underwriting agreement, which is filed as an exhibit to the registration statement of which this prospectus forms a part, each of the underwriters named below has severally agreed to purchase from us the respective number of shares of Class A common stock shown opposite its name below:
| Underwriters |
Number of Shares | |
| Barclays Capital Inc. |
||
|
| ||
| Total |
||
|
|
The underwriting agreement provides that the underwriters’ obligation to purchase shares of Class A common stock depends on the satisfaction of the conditions contained in the underwriting agreement including:
| • | the obligation to purchase all of the shares of Class A common stock offered hereby (other than those shares of Class A common stock covered by their option to purchase additional shares as described below), if any of the shares are purchased; |
| • | the representations and warranties made by us to the underwriters are true; |
| • | there is no material change in our business or the financial markets; and |
| • | we deliver customary closing documents to the underwriters. |
The following table summarizes the underwriting discounts and commissions we will pay to the underwriters. These amounts are shown assuming both no exercise and full exercise of the underwriters’ option to purchase additional shares. The underwriting fee is the difference between the initial price to the public and the amount the underwriters pay to us for the shares.
| No Exercise | Full Exercise | |||||||
| Per share |
$ | $ | ||||||
| Total |
$ | $ | ||||||
The representative of the underwriters has advised us that the underwriters propose to offer the shares of Class A common stock directly to the public at the public offering price on the cover of this prospectus and to selected dealers, which may include the underwriters, at such offering price less a selling concession not in excess of $ per share. After the offering, the representative may change the offering price and other selling terms. Sales of shares made outside of the United States may be made by affiliates of the underwriters.
The expenses of the offering that are payable by us are estimated to be $ million (excluding underwriting discounts and commissions).
Option to Purchase Additional Shares
We have granted the underwriters an option exercisable for 30 days after the date of the underwriting agreement, to purchase, from time to time, in whole or in part, up to an aggregate of shares of Class A
199
Table of Contents
Index to Financial Statements
common stock at the public offering price less the underwriting discount. This option may be exercised if the underwriters sell more than shares of Class A common stock in connection with this offering. To the extent that this option is exercised, each underwriter will be obligated, subject to certain conditions, to purchase its pro rata portion of these additional shares based on the underwriter’s underwriting commitment in the offering as indicated in the table at the beginning of this Underwriting section.
We, FCX and each of our directors and executive officers have agreed that without the prior written consent of Barclays Capital Inc., we and they will not directly or indirectly, (1) offer for sale, sell, pledge, or otherwise dispose of (or enter into any transaction or device that is designed to, or could be expected to, result in the disposition by any person at any time in the future of) any shares of Class A or Class B common stock (including, without limitation, shares of Class A or Class B common stock that may be deemed to be beneficially owned by us or them in accordance with the rules and regulations of the SEC and shares of Class A or Class B common stock that may be issued upon exercise of any options or warrants) or securities convertible into or exercisable or exchangeable for Class A or Class B common stock, (2) enter into any swap or other derivatives transaction that transfers to another, in whole or in part, any of the economic consequences of ownership of Class A or Class B common stock, (3) make any demand for or exercise any right or file or cause to be filed a registration statement, including any amendments thereto, with respect to the registration of any Class A or Class B common stock or securities convertible, exercisable or exchangeable into Class A or Class B common stock or any of our other securities or (4) publicly disclose the intention to do any of the foregoing for a period of days after the date of this prospectus.
These restrictions do not apply to, among other things:
| • | the sale of Class A or Class B common stock pursuant to the underwriting agreement; |
| • | issuances of Class A or Class B common stock by us pursuant to any employee benefit plan in effect as of the date of the underwriting agreement, provided that such Class A or Class B common stock will be subject to the -day restricted period; |
| • | the filing of one or more registration statements on Form S-8 relating to any employee benefit plan in effect as of the date of the underwriting agreement; and |
| • | issuances of Class A or Class B common stock or other securities issued in connection with any acquisition of assets or acquisition of not less than a majority or controlling portion of the equity of another entity, provided that (1) the aggregate number of shares issued pursuant to this clause does not exceed five percent of the total number of outstanding shares of Class A or Class B common stock immediately following the issuance and sale of the shares of Class A or Class B common stock in this offering and (2) the recipient of any such shares of Class A or Class B common stock or securities issued pursuant to this clause during the -day restricted period described above enters into a lock-up agreement for the remainder of the restricted period. |
If:
| • | during the last 17 days of the -day restricted period, we issue an earnings release or material news or a material event relating to us occurs; or |
| • | prior to the expiration of the -day restricted period, we announce that we will release earnings results during the 16-day period beginning on the last day of the -day period, |
the -day restricted period described above will be extended (and the restrictions above will continue to apply) until the expiration of the 18-day period beginning on the issuance of the earnings release or the announcement of the material news or occurrence of the material event, unless Barclays Capital Inc., in its sole discretion, confirms to us in writing that such extension will not be required.
200
Table of Contents
Index to Financial Statements
Barclays Capital Inc., in its sole discretion, may release the Class A or Class B common stock and other securities subject to the lock-up agreements described above in whole or in part at any time with or without notice. When determining whether or not to release Class A or Class B common stock and other securities from lock-up agreements, Barclays Capital Inc. will consider, among other factors, the holder’s reasons for requesting the release, the number of shares of Class A or Class B common stock and other securities for which the release is being requested and market conditions at the time.
Prior to this offering, there has been no public market for our Class A common stock. The initial public offering price was determined by negotiations between the representative and us. In determining the initial public offering price of our common stock, the representative considered:
| • | the history and prospects for the industry in which we compete; |
| • | our financial information; |
| • | the ability of our management and our business potential and earning prospects; |
| • | the prevailing securities markets at the time of this offering; and |
| • | the recent market prices of, and the demand for, publicly traded shares of generally comparable companies. |
We have agreed to indemnify the underwriters against certain liabilities, including liabilities under the Securities Act and liabilities incurred in connection with the directed share program referred to below, and to contribute to payments that the underwriters may be required to make for these liabilities.
At our request, the underwriters have reserved for sale at the initial public offering price up to shares of Class A common stock offered hereby for officers, directors, employees and certain other persons associated with us. The number of shares of Class A common stock available for sale to the general public will be reduced to the extent such persons purchase such reserved shares. Any reserved shares not so purchased will be offered by the underwriters to the general public on the same basis as the other shares offered hereby.
Stabilization, Short Positions and Penalty Bids
The representative may engage in stabilizing transactions, short sales and purchases to cover positions created by short sales, and penalty bids or purchases for the purpose of pegging, fixing or maintaining the price of the Class A common stock, in accordance with Regulation M under the Exchange Act:
| • | Stabilizing transactions permit bids to purchase the underlying security so long as the stabilizing bids do not exceed a specified maximum. |
| • | A short position involves a sale by the underwriters of shares in excess of the number of shares the underwriters are obligated to purchase in the offering, which creates the syndicate short position. This short position may be either a covered short position or a naked short position. In a covered short position, the number of shares involved in the sales made by the underwriters in excess of the number of shares they are obligated to purchase is not greater than the number of shares that they may purchase by exercising their option to purchase additional shares. In a naked short position, the number of shares involved is greater than the number of shares in their option to purchase additional shares. The underwriters may close out any short position by either exercising their option to purchase additional shares and/or purchasing shares in the open market. In determining the source of shares to close out the |
201
Table of Contents
Index to Financial Statements
| short position, the underwriters will consider, among other things, the price of shares available for purchase in the open market as compared to the price at which they may purchase shares through their option to purchase additional shares. A naked short position is more likely to be created if the underwriters are concerned that there could be downward pressure on the price of the shares in the open market after pricing that could adversely affect investors who purchase in the offering. |
| • | Syndicate covering transactions involve purchases of the Class A common stock in the open market after the distribution has been completed in order to cover syndicate short positions. |
| • | Penalty bids permit the representative to reclaim a selling concession from a syndicate member when the Class A common stock originally sold by the syndicate member is purchased in a stabilizing or syndicate covering transaction to cover syndicate short positions. |
These stabilizing transactions, syndicate covering transactions and penalty bids may have the effect of raising or maintaining the market price of our Class A common stock or preventing or retarding a decline in the market price of the Class A common stock. As a result, the price of the Class A common stock may be higher than the price that might otherwise exist in the open market. These transactions may be effected on the NYSE or otherwise and, if commenced, may be discontinued at any time.
Neither we nor any of the underwriters make any representation or prediction as to the direction or magnitude of any effect that the transactions described above may have on the price of the Class A common stock. In addition, neither we nor any of the underwriters make representation that the representative will engage in these stabilizing transactions or that any transaction, once commenced, will not be discontinued without notice.
A prospectus in electronic format may be made available on the Internet sites or through other online services maintained by one or more of the underwriters and/or selling group members participating in this offering, or by their affiliates. In those cases, prospective investors may view offering terms online and, depending upon the particular underwriter or selling group member, prospective investors may be allowed to place orders online. The underwriters may agree with us to allocate a specific number of shares for sale to online brokerage account holders. Any such allocation for online distributions will be made by the representative on the same basis as other allocations.
Other than the prospectus in electronic format, the information on any underwriter’s or selling group member’s website and any information contained in any other website maintained by an underwriter or selling group member is not part of the prospectus or the registration statement of which this prospectus forms a part, has not been approved and/or endorsed by us or any underwriter or selling group member in its capacity as underwriter or selling group member and should not be relied upon by investors.
We intend to apply to list our Class A common stock for quotation on the NYSE under the symbol “FMOG.” The underwriters will undertake to sell the shares of Class A common stock in this offering to a minimum of 400 beneficial owners in round lots of 100 or more units to meet the NYSE distribution requirements for trading.
The underwriters have informed us that they do not intend to confirm sales to discretionary accounts without the prior specific written approval of the customer.
202
Table of Contents
Index to Financial Statements
If you purchase shares of Class A common stock offered in this prospectus, you may be required to pay stamp taxes and other charges under the laws and practices of the country of purchase, in addition to the offering price listed on the cover page of this prospectus.
The underwriters and their respective affiliates are full service financial institutions engaged in various activities, which may include sales and trading, commercial and investment banking, advisory, investment management, investment research, principal investment, hedging, market making, brokerage and other financial and non-financial activities and services. The underwriters and their affiliates have in the past, and may in the future, perform investment banking, commercial banking, advisory and other services for us and our respective affiliates from time to time for which they have received, and may in the future receive, customary fees and expenses.
In addition, in the ordinary course of their various business activities, the underwriters and their respective affiliates may make or hold a broad array of investments and actively trade debt and equity securities (or related derivative securities) and financial instruments (including bank loans) for their own account and for the accounts of their customers. Such investment and securities activities may involve securities and instruments of ours or our affiliates. The underwriters and their affiliates may also make investment recommendations or publish or express independent research views in respect of such securities or financial instruments and may hold, or recommend to clients that they acquire, long or short positions in such securities and instruments.
European Economic Area
This document is not a prospectus for the purposes of the Prospectus Directive (as defined below).
In relation to each Member State of the European Economic Area which has implemented the Prospectus Directive (as defined below), each, a Relevant Member State, with effect from and including the date on which the Prospectus Directive is implemented in that Relevant Member State, or the Relevant Implementation Date, an offer to the public of any shares of our Class A common stock which are the subject of the offering contemplated by this prospectus supplement, may not be made in that Relevant Member State other than:
| (a) | to any legal entity which is a qualified investor as defined in the Prospectus Directive; |
| (b) | to fewer than 100 or, if the Relevant Member State has implemented the relevant provision of the 2010 PD Amending Directive (as defined below), 150, natural or legal persons (other than qualified investors as defined in the Prospectus Directive), as permitted under the Prospectus Directive, subject to obtaining the prior consent of the Initial Purchasers for any such offer; or |
| (c) | in any other circumstances fully within Article 3(2) of the Prospectus Directive, |
provided that no such offer of our Class A common stock shall result in a requirement for the publication by us or any underwriter of a prospectus pursuant to Article 3 of the Prospectus Directive.
For the purposes of this provision, the expression an “offer to the public” in relation to any shares of our Class A common stock in any Relevant Member State means the communication in any form and by any means of sufficient information on the terms of the offer and our Class A common stock to be offered so as to enable an investor to decide to purchase or subscribe for our Class A common stock, as the same may be varied in that Relevant Member State by any measure implementing the Prospectus Directive in that Relevant Member State and the expression “Prospectus Directive” means Directive 2003/71/EC (and amendments thereto, including the 2010 PD Amending Directive, to the extent implemented in the Relevant Member State), and includes any relevant implementing measure in each Relevant Member State and the expression “2010 PD Amending Directive” means Directive 2010/73/EU.
203
Table of Contents
Index to Financial Statements
United Kingdom
This prospectus supplement is only being distributed to, and is only directed at, persons in the United Kingdom that are qualified investors within the meaning of Article 2(1)(e) of the Prospectus Directive, which we refer to as Qualified Investors, that are also (i) investment professionals falling within Article 19(5) of the Financial Services and Markets Act 2000 (Financial Promotion) Order 2005, which we refer to as the Order, or (ii) high net worth entities, falling within Article 49(2)(a) to (d) of the Order, and (iii) any other person to whom it may lawfully be communicated pursuant to the Order, all such persons which we refer to together as relevant persons. This prospectus supplement and its contents are confidential and should not be distributed, published or reproduced (in whole or in part) or disclosed by recipients to any other persons in the United Kingdom. Any investment activity to which this prospectus supplement relates will only be available to, and will only be engaged with, relevant persons. Any person in the United Kingdom that is not a relevant person should not act or rely on this document or any of its contents.
All applicable provisions of the Financial Services and Markets Act 2000 (as amended) must be complied with in respect to anything done by any person in relation to our Class A common stock in, from or otherwise involving the United Kingdom.
Switzerland
This document, as well as any other material relating to the shares which are the subject of the offering contemplated by this prospectus supplement, do not constitute an issue prospectus pursuant to Article 652a and/or 1156 of the Swiss Code of Obligations. The shares will not be listed on the SIX Swiss Exchange and, therefore, the documents relating to the shares, including, but not limited to, this document, do not claim to comply with the disclosure standards of the listing rules of the SIX Swiss Exchange. The shares are being offered in Switzerland by way of a private placement, i.e., to a small number of selected investors only, without any public offer and only to investors who do not purchase the shares with the intention to distribute them to the public. The investors will be individually approached by the issuer from time to time. This document, as well as any other material relating to the shares, is personal and confidential and do not constitute an offer to any other person. This document may only be used by those investors to whom it has been handed out in connection with the offering described herein and may neither directly nor indirectly be distributed or made available to other persons without express consent of the issuer. It may not be used in connection with any other offer and shall in particular not be copied and/or distributed to the public in (or from) Switzerland.
Hong Kong
The shares of our Class A common stock offered hereby may not be offered or sold in Hong Kong, by means of any document, other than (a) to “professional investors” as defined in the Securities and Futures Ordinance (Cap. 571, Laws of Hong Kong) and any rules made under that Ordinance, or (b) in other circumstances which do not result in the document being a “prospectus” as defined in the Companies Ordinance (Cap. 32, Laws of Hong Kong), or which do not constitute an offer to the public within the meaning of that Ordinance. No advertisement, invitation or document relating to the shares of our Class A common stock offered hereby may be issued or may be in the possession of any person for the purpose of the issue, whether in Hong Kong or elsewhere, which is directed at, or the contents of which are likely to be read by, the public in Hong Kong (except if permitted to do so under the laws of Hong Kong) other than with respect to the shares of our Class A common stock offered hereby which are intended to be disposed of only to persons outside Hong Kong or only to “professional investors” as defined in the Securities and Futures Ordinance (Cap. 571, Laws of Hong Kong) or any rules made under that Ordinance.
204
Table of Contents
Index to Financial Statements
Singapore
This prospectus supplement has not been registered as a prospectus with the Monetary Authority of Singapore. Accordingly, this prospectus supplement and any other document or material in connection with the offer or sale, or invitation for subscription or purchase, of the shares of our Class A common stock offered hereby may not be circulated or distributed, nor may the shares be offered or sold, or be made the subject of an invitation for subscription or purchase, whether directly or indirectly, to persons in Singapore other than (i) to an institutional investor under Section 274 of the Securities and Future Act, Chapter 289 of Singapore, which we refer to as the SFA, (ii) to a “relevant person” as defined in Section 275(2) of the SFA, or any person pursuant to Section 275 (1A), and in accordance with the conditions, specified in Section 275 of the SFA or (iii) otherwise pursuant to, and in accordance with the conditions of, any other applicable provision of the SFA.
Where the shares of our Class A common stock offered hereby are subscribed and purchased under Section 275 of the SFA by a relevant person which is:
| (a) | a corporation (which is not an accredited investor (as defined in Section 4A of the SFA)) the sole business of which is to hold investments and the entire share capital of which is owned by one or more individuals, each of whom is an accredited investor; or |
| (b) | a trust (where the trustee is not an accredited investor (as defined in Section 4A of the SFA)) whose sole whole purpose is to hold investments and each beneficiary is an accredited investor, shares, debentures and units of shares and debentures of that corporation or the beneficiaries’ rights and interest (howsoever described) in that trust shall not be transferable within six months after that corporation or that trust has acquired the shares under Section 275 of the SFA except |
| (i) | to an institutional investor under Section 274 of the SFA or to a relevant person (as defined in Section 275(2) of the SFA) and in accordance with the conditions, specified in Section 275 of the SFA; |
| (ii) | (in the case of a corporation) where the transfer arises from an offer referred to in Section 275(1A) of the SFA, or (in the case of a trust) where the transfer arises from an offer that is made on terms that such rights or interests are acquired at a consideration of not less than $200,000 (or its equivalent in a foreign currency) for each transaction, whether such amount is to be paid for in cash or by exchange of securities or other assets; |
| (iii) | where no consideration is or will be given for the transfer; or |
| (iv) | where the transfer is by operation of law. |
By accepting this prospectus supplement, the recipient hereof represents and warrants that he is entitled to receive it in accordance with the restrictions set forth above and agrees to be bound by limitations contained herein. Any failure to comply with these limitations may constitute a violation of law.
Japan
The securities have not been and will not be registered under the Financial Instruments and Exchange Law of Japan, which we refer to as the Financial Instruments and Exchange Law, and each underwriter has agreed that it will not offer or sell any securities, directly or indirectly, in Japan or to, or for the benefit of, any resident of Japan (which term as used herein means any person resident in Japan, including any corporation or other entity organized under the laws of Japan), or to others for re-offering or resale, directly or indirectly, in Japan or to a resident of Japan, except pursuant to an exemption from the registration requirements of, and otherwise in compliance with, the Financial Instruments and Exchange Law and any other applicable laws, regulations and ministerial guidelines of Japan.
205
Table of Contents
Index to Financial Statements
Australia
No prospectus or other disclosure document (as defined in the Corporations Act 2001 (Cth) of Australia, which we refer to as the Corporations Act) in relation to the Class A common stock has been or will be lodged with the Australian Securities & Investments Commission, which we refer to as ASIC. This document has not been lodged with ASIC and is only directed to certain categories of exempt persons. Accordingly, if you receive this document in Australia:
| (a) | you confirm and warrant that you are either: |
| (i) | a “sophisticated investor” under section 708(8)(a) or (b) of the Corporations Act; |
| (ii) | a “sophisticated investor” under section 708(8)(c) or (d) of the Corporations Act and that you have provided an accountant’s certificate to us which complies with the requirements of section 708(8)(c)(i) or (ii) of the Corporations Act and related regulations before the offer has been made; |
| (iii) | a person associated with the company under section 708(12) of the Corporations Act; or |
| (iv) | a “professional investor” within the meaning of section 708(11)(a) or (b) of the Corporations Act, and to the extent that you are unable to confirm or warrant that you are an exempt sophisticated investor, associated person or professional investor under the Corporations Act any offer made to you under this document is void and incapable of acceptance; and |
| (b) | you warrant and agree that you will not offer any of the Class A common stock for resale in Australia within 12 months of that Class A common stock being issued unless any such resale offer is exempt from the requirement to issue a disclosure document under section 708 of the Corporations Act. |
206
Table of Contents
Index to Financial Statements
The validity of our Class A common stock offered by this prospectus will be passed upon for us by Latham & Watkins LLP, Houston, Texas. Certain legal matters in connection with this offering will be passed upon for the underwriters by Andrews Kurth LLP, Houston, Texas.
The consolidated financial statements of FCX Oil & Gas Inc. at December 31, 2014 and 2013 and for the year ended December 31, 2014 and period from April 23, 2013 to December 31, 2013, appearing in this Prospectus and Registration Statement have been audited by Ernst & Young LLP, independent registered public accounting firm, as set forth in its report thereon appearing elsewhere herein, and are included in reliance upon such report given on the authority of such firm as experts in accounting and auditing.
The consolidated financial statements of PXP for the period from January 1, 2013, to May 31, 2013, and the year ended December 31, 2012, included in this prospectus have been so included in reliance on the report of PricewaterhouseCoopers LLP, an independent registered public accounting firm, given on the authority of said firm as experts in auditing and accounting.
The consolidated financial statements of McMoRan Exploration Co. (an equity method investment to PXP) at June 3, 2013, and December 31, 2012, and for the period from January 1, 2013, to June 3, 2013, and for the year ended December 31, 2012, appearing in this Prospectus and Registration Statement have been audited by Ernst & Young LLP, independent registered accounting firm, as set forth in its report thereon appearing elsewhere herein, and are included in reliance upon such report given on the authority of such firm as experts in accounting and auditing.
The information included in this prospectus regarding estimated quantities of proved, probable and possible reserves, the future net revenues from those reserves and their present value is based on reserve reports prepared by Netherland, Sewell & Associates Inc. and Ryder Scott Company, L.P., our independent petroleum engineers. These estimates are included in this prospectus in reliance upon the authority of such firm as an expert in these matters.
WHERE YOU CAN FIND MORE INFORMATION
We have filed with the SEC a registration statement under the Securities Act with respect to the shares of our Class A common stock offered by this prospectus. This prospectus, filed as part of the registration statement, does not contain all of the information set forth in the registration statement or the exhibits and schedules thereto as permitted by the rules and regulations of the SEC. For further information about us and our Class A common stock, you should refer to the registration statement. This prospectus summarizes provisions that we consider material of certain contracts and other documents to which we refer you. Because the summaries may not contain all of the information that you may find important, you should review the full text of those documents. A copy of the registration statement, and the exhibits and schedules thereto, may be inspected without charge at the public reference facilities maintained by the SEC at 100 F Street NE, Washington, D.C. 20549. Copies of these materials may be obtained, upon payment of a duplicating fee, from the Public Reference Room of the SEC at 100 F Street NE, Washington, D.C. 20549. Please call the SEC at 1-800-SEC-0330 for further information on the operation of the Public Reference Room. The SEC maintains a website that contains reports, proxy and information statements and other information regarding registrants that file electronically with the SEC. The address of the SEC’s website is www.sec.gov.
As a result of the offering, we will become subject to full information requirements of the Exchange Act. We will fulfill our obligations with respect to such requirements by filing periodic reports and other information with the SEC. We intend to furnish our stockholders with annual reports containing financial statements certified by an independent public accounting firm.
207
Table of Contents
Index to Financial Statements
Following is a glossary of selected terms used throughout this prospectus that are technical in nature:
3-D seismic data. Seismic data which has been digitally recorded, processed and analyzed in a manner that permits three-dimensional displays of geologic structures.
Acreage held by production. Acreage covered by a mineral lease that perpetuates a company’s right to operate a property as long as the property produces a minimum paying quantity of oil or gas.
API gravity. A system of classifying oil based on its specific gravity, whereby the greater the gravity, the lighter the oil.
Average net pay thickness. The average vertical extent of the effective hydrocarbon-bearing rock (expressed in feet).
Barrel or Bbl. One stock tank barrel, or 42 U.S. gallons liquid volume (used in reference to crude oil or other liquid hydrocarbons).
Barrel of Oil Equivalent or Boe. One stock tank barrel equivalent of oil, calculated by converting gas volumes to equivalent oil barrels at a ratio of six thousand cubic feet to one barrel of oil.
Bbl/d. One Bbl per day.
Bcf. One billion cubic feet of gas.
Bcf/d. One Bcf per day.
Block. A small geographic area within an Outer Continental Shelf (OCS) planning area identified on and by reference to an Official Protraction Diagram and which serves as the legal description for leasing and administrative purposes. In the Gulf of Mexico OCS Region, a block is typically in the form of a square containing 5,000 acres to 5,760 acres, about nine square miles.
Blowouts. Accidents resulting from loss of hydraulic well control while conducting drilling operations.
Boe/d. One barrel of oil equivalent per day.
British thermal unit or Btu. One British thermal unit is the amount of heat required to raise the temperature of one pound of water by one degree Fahrenheit.
Completion. The installation of permanent equipment for production of oil or gas, or, in the case of a dry well, the reporting to the appropriate authority that the well has been abandoned.
Condensate. A mixture of hydrocarbons that exists in the gaseous phase at original reservoir temperature and pressure, but that, when produced, is in the liquid phase at surface pressure and temperature.
Cratering. The collapse of the circulation system dug around the drilling rig for the prevention of blowouts.
Delineation. The process of placing a number of wells in various parts of a reservoir to determine its boundaries and production characteristics.
Deterministic estimate. The method of estimating reserves or resources is called deterministic when a single value for each parameter (from the geoscience, engineering, or economic data) in the reserves calculation is used in the reserves estimation procedure.
Developed acreage. The number of acres that are allocated or assignable to productive wells or wells capable of production.
Developed reserves. Developed reserves are reserves of any category that can be expected to be recovered: (i) through existing wells with existing equipment and operating methods or in which the cost of the required equipment is relatively minor compared to the cost of a new well; and (ii) through installed extraction equipment and infrastructure operational at the time of the reserves estimate if the extraction is by means not involving a well.
208
Table of Contents
Index to Financial Statements
Development well. A well drilled within the proved area of an oil or gas reservoir to the depth of a stratigraphic horizon known to be productive.
Differential. An adjustment to the price of oil or gas from an established spot market price to reflect differences in the quality and/or location of oil or gas.
Discovery well. The first oil or gas well drilled in a new field. The discovery well is the well that is drilled to reveal the actual presence of a petroleum-bearing reservoir. Subsequent wells are called development wells.
Dry tree. An assembly of well equipment that is located on the platform rather than on the seabed.
Exploratory well. A well drilled to find a new field or to find a new reservoir in a field previously found to be productive of oil or gas in another reservoir.
Field. An area consisting of a single reservoir or multiple reservoirs all grouped on or related to the same individual geological structural feature and/or stratigraphic condition. There may be two or more reservoirs in a field that are separated vertically by intervening impervious, strata, or laterally by local geologic barriers, or by both. Reservoirs that are associated by being in overlapping or adjacent fields may be treated as a single or common operational field. The geological terms “structural feature” and “stratigraphic condition” are intended to identify localized geological features as opposed to the broader terms of basins, trends, provinces, plays, areas-of-interest, etc.
GAAP. Accounting principles generally accepted in the United States.
Gas. Natural gas.
Gross well or gross acre. A well or acre in which we own a working interest. The numbers of gross wells is the total number of wells in which we own a working interest.
Horizon. A zone of a particular formation; that part of a formation of sufficient porosity and permeability to form a petroleum reservoir.
Horizontal drilling. A drilling technique used in certain formations where a well is drilled vertically to a certain depth and then drilled at a right angle within a specified interval.
Infill development drilling. The process of drilling wells into the same pool as known producing wells so that oil or gas does not have to travel as far through the formation.
Injection well. A well employed for the introduction into an underground stratum of water, gas or other fluid under pressure.
Isopach mapping. Mapping the variations in the thickness of a particular sedimentary bed and the interval or spacing between one sedimentary bed and another.
LIBOR. London Interbank Offered Rate.
Light crude oil. A relatively expensive crude oil with a high API gravity characterized by low relative density and viscosity. Light crude oils require lower levels of processing to produce high value products such as gasoline and diesel.
LNG. Liquefied natural gas.
MBbl. One thousand Bbls.
MBbls/d. One thousand Bbls per day.
MMBbl. One million Bbls.
MBoe. One thousand Boes.
MBoe/d. One thousand Boes per day.
MMBoe. One million Boes.
MMBtu. One million Btus.
MMcf. One million cubic feet of gas.
209
Table of Contents
Index to Financial Statements
MMcfe/d. One million cubic feet equivalent per day.
NGLs. Hydrocarbons (primarily ethane, propane, butane and natural gasolines) which have been extracted from wet gas and become liquid under various combinations of increasing pressure and lower temperature.
Net revenue interest. An interest in a revenue stream net of all other interests burdening that stream, such as a lessor’s royalty and any overriding royalties. For example, if a lessor executes a lease with a one-eighth royalty, the lessor’s net revenue interest is 12.5 percent and the lessee’s net revenue interest is 87.5 percent.
Net well or net acre. Deemed to exist when the sum of the fractional ownership working interests in gross wells or acres equals one. The number of net wells or acres is the sum of the fractional working interests owned in gross wells or acres expressed as whole numbers and fractions of whole numbers.
NYMEX. The New York Mercantile Exchange.
Operator. The entity responsible for the exploration, development and production of a well or lease.
P10. Estimates that have at least 10 percent likelihood of occurring based on current information.
Pay. Reservoir rock containing crude oil or gas.
Play. A geographic area with hydrocarbon potential.
Possible reserves. Possible reserves are those additional reserves that are less certain to be recovered than probable reserves.
Present value of future net revenues (PV-10). The estimated future gross revenue to be generated from the production of proved reserves, net of estimated production and future development and abandonment costs, using prices and costs in effect at the determination date, before income taxes, and without giving effect to non-property-related expenses, discounted to a present value using an annual discount rate of 10 percent in accordance with the guidelines of the SEC.
Probable reserves. Reserves that are less certain to be recovered than proved reserves but that, together with proved reserves, are as likely as not to be recovered.
Producing well. A well that is producing hydrocarbons in sufficient quantities such that proceeds from the sale of the production exceed production expenses and taxes.
Productive well. A well that is found to be capable of producing hydrocarbons in sufficient quantities such that proceeds from the sale of the production exceed production expenses and taxes.
Prospective resources. Potentially recoverable resources from undiscovered accumulations.
Proved developed reserves. Proved reserves that can be expected to be recovered:
| i. | Through existing wells with existing equipment and operating methods or in which the cost of the required equipment is relatively minor compared with the cost of a new well; or |
| ii. | Through installed extraction equipment and infrastructure operational at the time of the reserves estimate if the extraction is by means not involving a well. |
Proved reserves. Proved reserves represent quantities of oil and gas, which, by analysis of geoscience and engineering data, can be estimated with reasonable certainty to be economically producible from a given date forward, from known reservoirs, and under existing economic conditions, operating methods and government regulations.
Proved undeveloped reserves (PUDs). Proved reserves that are expected to be recovered from new wells on undrilled acreage, or from existing wells where a relatively major expenditure is required for recompletion.
Reserves on undrilled acreage shall be limited to those directly offsetting development spacing areas that are reasonably certain of production when drilled, unless evidence using reliable technology exists that establishes reasonable certainty of economic producibility at greater distances.
210
Table of Contents
Index to Financial Statements
Undrilled locations can be classified as having undeveloped reserves only if a development plan has been adopted indicating that they are scheduled to be drilled within five years, unless the specific circumstances justify a longer time.
Under no circumstances can estimates for proved undeveloped reserves be attributable to any acreage for which an application of fluid injection or other improved recovery technique is contemplated, unless such techniques have been proved effective by actual projects in the same reservoir or an analogous reservoir, or by other evidence using reliable technology establishing reasonable certainty.
Reasonable certainty. If deterministic estimates are used, reasonable certainty means a high degree of confidence that the quantities will be recovered. If probabilistic methods are used, there should be at least a 90 percent probability that the quantities actually recovered will equal or exceed the estimate. A high degree of confidence exists if the quantity is much more likely to be achieved than not, and, as changes due to increased availability of geoscience (geological, geophysical and geochemical), engineering and economic data are made to estimated ultimate recovery with time, reasonably certain estimated ultimate recovery is much more likely to increase or remain constant than to decrease.
Reserves. Reserves are estimated remaining quantities of oil and gas and related substances anticipated to be economically producible, as of a given date, by application of development projects to known accumulations. In addition, there must exist, or there must be a reasonable expectation that there will exist, the legal right to produce or a revenue interest in the production, installed means of delivering oil and gas or related substances to market and all permits and financing required to implement the project. Reserves should not be assigned to adjacent reservoirs isolated by major, potentially sealing, faults until those reservoirs are penetrated and evaluated as economically producible. Reserves should not be assigned to areas that are clearly separated from a known accumulation by a non-productive reservoir (i.e., absence of reservoir, structurally low reservoir or negative test results). Such areas may contain prospective resources (i.e., potentially recoverable resources from undiscovered accumulations).
Reservoir. A porous and permeable underground formation containing a natural accumulation of producible oil and/or gas that is confined by impermeable rock or water barriers and is individual and separate from other reservoirs.
Resources. Resources are quantities of oil and gas estimated to exist in naturally occurring accumulations. A portion of the resources may be estimated to be recoverable, and another portion may be considered to be unrecoverable. Resources include both discovered and undiscovered accumulations.
Royalty interest. An interest in an oil and gas lease that gives the owner of the interest the right to receive a portion of the production from the leased acreage (or of the proceeds of the sale thereof), but generally does not require the owner to pay any portion of the costs of drilling or operating the wells on the leased acreage. Royalties may be either landowner’s royalties, which are reserved by the owner of the leased acreage at the time the lease is granted, or overriding royalties, which are usually reserved by an owner of the leasehold in connection with a transfer to a subsequent owner.
Sands. Sandstone or other sedimentary rocks.
SEC. The United States Securities and Exchange Commission.
Secondary recovery. An artificial method or process used to restore or increase production from a reservoir after the primary production by the natural producing mechanism and reservoir pressure has experienced partial depletion. Gas injection and waterflooding are examples of this technique.
Shale. A fine-grained, clastic sedimentary rock composed of mud that is a mix of flakes of clay minerals and tiny fragments of other minerals.
Sidetrack well. A well that has been redrilled to create a secondary wellbore by means of directional control and intentional deviation from the original wellbore.
Spud. The very beginning of drilling operations of a new well, occurring when the drilling bit penetrates the surface utilizing a drilling rig capable of drilling the well to the authorized total depth.
211
Table of Contents
Index to Financial Statements
Standardized measure. The present value, discounted at 10 percent per year, of estimated future net revenues from the production of proved reserves, computed by applying sales prices used in estimating proved oil and gas reserves to the year-end quantities of those reserves in effect as of the dates of such estimates and held constant throughout the productive life of the reserves (except for consideration of future price changes to the extent provided by contractual arrangements in existence at year-end), and deducting the estimated future costs to be incurred in developing, producing and abandoning the proved reserves (computed based on year-end costs and assuming continuation of existing economic conditions). Future income taxes are calculated by applying the appropriate year-end statutory federal and state income tax rates, with consideration of future tax rates already legislated, to pre-tax future net cash flows, net of the tax basis of the properties involved and utilization of available tax carryforwards related to proved oil and gas reserves.
Subsea tie back. A connection between a new hydrocarbon discovery and an existing production facility.
Trend. A region of oil and/or gas production, the geographic limits of which have not been fully defined, having geological characteristics that have been ascertained through supporting geological, geophysical or other data to contain the potential for oil and/or gas reserves in a particular formation or series of formations.
Undeveloped acreage or undeveloped locations. Lease acreage or locations on which wells have not been drilled or completed to a point that would permit the production of economic quantities of oil or gas regardless of whether the acreage or locations contain proved reserves.
Undeveloped reserves. Undeveloped reserves are reserves of any category that are expected to be recovered from new wells on undrilled acreage, or from existing wells where a relatively major expenditure is required for recompletion. Reserves on undrilled acreage shall be limited to those directly offsetting development spacing areas that are reasonably certain of production when drilled, unless evidence using reliable technology exists that establishes reasonable certainty of economic producibility at greater distances. Undrilled locations can be classified as having undeveloped reserves only if a development plan has been adopted indicating that they are scheduled to be drilled within five years, unless the specific circumstances justify a longer time. Under no circumstances shall estimates for undeveloped reserves be attributable to any acreage for which an application of fluid injection or other improved recovery technique is contemplated, unless such techniques have been proved effective by actual projects in the same reservoir or an analogous reservoir, or by other evidence using reliable technology establishing reasonable certainty.
Unit of production. Method of computing depreciation or depletion based on quantities produced in relation to reserves.
Unswept fault block. A block that has not yet been subjected to displacement techniques that displace oil from the existing reservoir toward a well.
Working interest. An interest in an oil and gas lease that gives the owner of the interest the right to drill for and produce oil and gas on the leased acreage and requires the owner to pay a share of the costs of drilling and production operations.
WTI. West Texas Intermediate crude oil, which is a light, sweet crude oil, characterized by an American Petroleum Institute gravity, which we refer to as API gravity, between 39 and 41 and a sulfur content of approximately 0.4 weight percent that is used as a benchmark for other crude oils.
212
Table of Contents
Index to Financial Statements
INDEX TO CONSOLIDATED FINANCIAL STATEMENTS
F-1
Table of Contents
Index to Financial Statements
Freeport-McMoRan Oil & Gas Inc.
UNAUDITED PRO FORMA CONDENSED CONSOLIDATED FINANCIAL STATEMENTS
The following unaudited pro forma condensed consolidated financial statements (the Pro Forma Financial Statements) of Freeport-McMoRan Oil & Gas Inc. (FM O&G Inc., the Company, we, our or us) are based on the historical condensed consolidated financial statements of FCX Oil & Gas Inc. (FCX O&G), adjusted to reflect the pro forma effects of the following transactions:
| • | Expected Sale of Equity Securities. The Pro Forma Financial Statements reflect the effects of (i) the completion of the expected sale of equity securities as described in “The Offering,” assuming the issuance and sale by the Company of shares of Class A common stock at an offering price of $ per share, generating estimated net proceeds of $ after deducting estimated underwriting discounts and commissions along with other estimated offering expenses; (ii) the use of proceeds as described in “Use of Proceeds”; and (iii) the proposed corporate reorganization that will be completed in connection with the closing of the proposed offering, which consists of the following steps: |
| – | Freeport-McMoRan Oil & Gas LLC (FM O&G), a subsidiary of FCX O&G, will transfer all of its assets and liabilities to Freeport-McMoRan Exploration & Production LLC, other than existing intercompany or third-party debt obligations and equity interests in its subsidiaries, which we refer to as the FM O&G LLC Subsidiaries; |
| – | FCX O&G and FM O&G will merge with and into Freeport-McMoRan Inc. (FCX); |
| – | FCX will transfer all of its equity interests in the FM O&G LLC Subsidiaries to Freeport-McMoRan Exploration & Production LLC (FMEP), and thereafter will transfer all of its equity interest in FMEP to us. |
The proposed corporate reorganization is considered a transaction among entities under common control and, therefore, results in no adjustment to the recorded basis in assets and liabilities.
| • | Eagle Ford Shale Divestment. On June 20, 2014, FCX O&G and certain of its subsidiaries completed the divestment of its Eagle Ford shale assets and liabilities to a subsidiary of Encana Corporation for cash consideration of $3.1 billion, before closing adjustments from the April 1, 2014, effective date. |
FCX O&G’s working interest in these properties generated total sales volumes of 52.6 thousand barrels of oil equivalent per day during first-quarter 2014 and had 59.0 million barrels of oil equivalent of estimated proved reserves as of December 31, 2013.
The Company follows the full cost method of accounting for its oil and gas properties. Under full cost accounting rules, the proceeds were recorded as a reduction of capitalized oil and gas properties, with no gain or loss recognition, except for $83.7 million of deferred tax expense recorded with the allocation of goodwill (for which deferred taxes were not previously provided) to the Eagle Ford shale properties. No adjustment was made with respect to the historical deferred tax expense included in the FCX O&G historical statement of operations for the year ended December 31, 2014.
The unaudited pro forma condensed consolidated statements of operations for the six months ended June 30, 2015, and for the year ended December 31, 2014, have been prepared based on FCX O&G’s historical consolidated statements of operations for such periods, included elsewhere in this prospectus, and the unaudited pro forma condensed consolidated balance sheet has been prepared based on FCX O&G’s historical consolidated balance sheet at June 30, 2015, also included elsewhere in this prospectus. The pro forma effects of the transactions above are included in the Pro Forma Financial Statements to the extent that these transactions are not fully reflected in FCX O&G’s historical financial statements. The unaudited pro forma condensed consolidated statement of operations for the six months ended June 30, 2015, gives effect to the expected sale of equity securities as if the sale had occurred on January 1, 2014; the unaudited pro forma condensed consolidated
F-2
Table of Contents
Index to Financial Statements
statement of operations for the year ended December 31, 2014, gives effect to the expected sale of equity securities and the Eagle Ford shale divestment as if the transactions had occurred on January 1, 2014; and the unaudited pro forma condensed consolidated balance sheet gives effect to the expected sale of equity securities as if it had occurred on June 30, 2015. The effect of the Eagle Ford shale divestment was reflected in FCX O&G’s historical balance sheet at June 30, 2015.
Pursuant to the U.S. Securities and Exchange Commission (SEC) rules for pro forma financial statements, no pro forma adjustments may be made with respect to nonrecurring charges or credits that result directly from these transactions. Accordingly, in the unaudited pro forma condensed consolidated statements of operations, pro forma adjustments have been made to include only adjustments that are directly attributable to the transactions described above and are factually supportable and expected to have a continuing impact.
The Pro Forma Financial Statements are provided for informational purposes only and do not purport to represent what the actual results of operations or financial position would have been if these transactions had occurred on the dates assumed. Our management believes the assumptions used to prepare the Pro Forma Financial Statements provide a reasonable basis for presenting the significant effects directly attributable to the transactions described above.
The Pro Forma Financial Statements and accompanying note should be read together with FCX O&G’s financial statements for the year ended December 31, 2014, and for the six months ended June 30, 2015, included elsewhere in this prospectus.
F-3
Table of Contents
Index to Financial Statements
Freeport-McMoRan Oil & Gas Inc.
UNAUDITED PRO FORMA CONDENSED CONSOLIDATED BALANCE SHEET
AT JUNE 30, 2015
(in thousands)
| FCX O&G Historical |
Pro Forma Adjustments |
FM O&G Inc. Pro Forma |
||||||||||||||
| ASSETS | ||||||||||||||||
| Current Assets |
||||||||||||||||
| Cash and cash equivalents |
$ | 6,575 | $ | — | A | $ | ||||||||||
| Other current assets |
916,475 | — | ||||||||||||||
|
|
|
|
|
|
|
|||||||||||
| 923,050 | — | |||||||||||||||
|
|
|
|
|
|
|
|||||||||||
| Property and Equipment, at cost |
||||||||||||||||
| Oil and natural gas properties – full cost method |
||||||||||||||||
| Subject to amortization |
18,797,158 | — | ||||||||||||||
| Not subject to amortization |
9,308,050 | — | ||||||||||||||
| Other property and equipment |
425,135 | — | ||||||||||||||
|
|
|
|
|
|
|
|||||||||||
| 28,530,343 | — | |||||||||||||||
| Less allowance for depreciation, depletion, amortization and impairment |
(14,190,924 | ) | — | |||||||||||||
|
|
|
|
|
|
|
|||||||||||
| 14,339,419 | — | |||||||||||||||
|
|
|
|
|
|
|
|||||||||||
| Other Assets |
190,663 | — | ||||||||||||||
|
|
|
|
|
|
|
|||||||||||
| $ | 15,453,132 | $ | — | $ | ||||||||||||
|
|
|
|
|
|
|
|||||||||||
| LIABILITIES AND EQUITY | ||||||||||||||||
| Current Liabilities |
$ | 1,066,436 | $ | — | $ | |||||||||||
|
|
|
|
|
|
|
|||||||||||
| Long-Term Debt |
||||||||||||||||
| Revolving notes - Freeport-McMoRan Inc. |
5,916,048 | (5,916,048 | ) | B | — | |||||||||||
| Other long-term debt |
2,554,002 | (2,554,002 | ) | B | — | |||||||||||
|
|
|
|
|
|
|
|||||||||||
| 8,470,050 | (8,470,050 | ) | — | |||||||||||||
|
|
|
|
|
|
|
|||||||||||
| Deferred Income Taxes |
725,921 | — | B | |||||||||||||
|
|
|
|
|
|
|
|||||||||||
| Other Long-Term Liabilities |
||||||||||||||||
| Asset retirement obligations |
1,075,521 | — | ||||||||||||||
| Other |
67,272 | — | ||||||||||||||
|
|
|
|
|
|
|
|||||||||||
| 1,142,793 | — | |||||||||||||||
|
|
|
|
|
|
|
|||||||||||
| Redeemable Noncontrolling Interest |
||||||||||||||||
| Preferred stock of subsidiary |
757,586 | — | ||||||||||||||
|
|
|
|
|
|
|
|||||||||||
| Stockholders’ Equity |
||||||||||||||||
| Common stock |
— | — | A | |||||||||||||
| Additional paid-in capital |
11,174,825 | — | A | |||||||||||||
| — | B | |||||||||||||||
| Accumulated deficit |
(7,884,806 | ) | — | |||||||||||||
| Accumulated other comprehensive income |
327 | — | ||||||||||||||
|
|
|
|
|
|
|
|||||||||||
| 3,290,346 | — | |||||||||||||||
|
|
|
|
|
|
|
|||||||||||
| $ | 15,453,132 | $ | — | $ | ||||||||||||
|
|
|
|
|
|
|
|||||||||||
The accompanying note is an integral part of these financial statements.
F-4
Table of Contents
Index to Financial Statements
Freeport-McMoRan Oil & Gas Inc.
UNAUDITED PRO FORMA CONDENSED CONSOLIDATED STATEMENT OF OPERATIONS
FOR THE SIX MONTHS ENDED JUNE 30, 2015
(in thousands, except outstanding shares)
| FCX O&G Historical |
Pro Forma Adjustments |
FM O&G Inc. Pro Forma |
||||||||||||||
| Revenues |
||||||||||||||||
| Oil and gas sales |
$ | 1,001,765 | $ | — | $ | |||||||||||
| Oil derivatives and other operating revenues |
66,823 | — | ||||||||||||||
|
|
|
|
|
|
|
|||||||||||
| 1,068,588 | — | |||||||||||||||
| Costs and Expenses |
||||||||||||||||
| Production costs |
564,648 | — | ||||||||||||||
| Depreciation, depletion and amortization |
1,014,589 | — | ||||||||||||||
| Impairment of oil and gas properties |
5,787,415 | — | ||||||||||||||
|
|
|
|
|
|
|
|||||||||||
| Total cost of sales |
7,366,652 | — | ||||||||||||||
| General and administrative |
102,526 | — | ||||||||||||||
|
|
|
|
|
|
|
|||||||||||
| 7,469,178 | — | |||||||||||||||
|
|
|
|
|
|
|
|||||||||||
| Loss from Operations |
(6,400,590 | ) | — | |||||||||||||
|
|
|
|
|
|
|
|||||||||||
| Interest expense, net |
30,243 | (29,606 | ) | C | 637 | |||||||||||
| Interest expense - Freeport-McMoRan Inc. |
54,701 | (54,701 | ) | C | — | |||||||||||
| Other income |
(740 | ) | — | |||||||||||||
|
|
|
|
|
|
|
|||||||||||
| (Loss) Income Before Income Taxes |
(6,484,794 | ) | 84,307 | |||||||||||||
| Income tax (benefit) expense |
(2,052,036 | ) | — | D | ||||||||||||
|
|
|
|
|
|
|
|||||||||||
| Net (Loss) Income |
(4,432,758 | ) | — | |||||||||||||
| Net income attributable to noncontrolling interest in the form of preferred stock of subsidiary |
(20,302 | ) | — | |||||||||||||
|
|
|
|
|
|
|
|||||||||||
| Net (Loss) Income Attributable to Common Stockholders |
$ | (4,453,060 | ) | $ | — | $ | ||||||||||
|
|
|
|
|
|
|
|||||||||||
| Net Loss per Common Share - Basic and Diluted |
$ | (40,482 | ) | |||||||||||||
|
|
|
|
|
|||||||||||||
| Weighted-Average Common Shares Outstanding - Basic and Diluted |
110 | |||||||||||||||
|
|
|
|
|
|||||||||||||
The accompanying note is an integral part of these financial statements.
F-5
Table of Contents
Index to Financial Statements
Freeport-McMoRan Oil & Gas Inc.
UNAUDITED PRO FORMA CONDENSED CONSOLIDATED STATEMENT OF OPERATIONS
FOR THE YEAR ENDED DECEMBER 31, 2014
(in thousands, except outstanding shares)
| FCX O&G Historical |
Eagle Ford Shale Divestment Adjustments |
Pro Forma Adjustments |
FM O&G Inc. Pro Forma |
|||||||||||||||||||||
| Revenues |
||||||||||||||||||||||||
| Oil and gas sales |
$ | 4,202,184 | $ | (709,989 | ) | E | $ | — | $ | |||||||||||||||
| Oil derivatives and other operating revenues |
507,522 | — | — | |||||||||||||||||||||
|
|
|
|
|
|
|
|
|
|||||||||||||||||
| 4,709,706 | (709,989 | ) | — | |||||||||||||||||||||
| Costs and Expenses |
||||||||||||||||||||||||
| Production costs |
1,236,733 | (113,283 | ) | E | — | |||||||||||||||||||
| Depreciation, depletion and amortization |
2,291,074 | (312,376 | ) | F | — | |||||||||||||||||||
| Impairment of oil and gas properties |
3,737,281 | — | — | |||||||||||||||||||||
|
|
|
|
|
|
|
|
|
|||||||||||||||||
| Total cost of sales |
7,265,088 | (425,659 | ) | — | ||||||||||||||||||||
| General and administrative |
207,772 | — | — | |||||||||||||||||||||
| Goodwill impairment |
1,716,571 | — | — | |||||||||||||||||||||
|
|
|
|
|
|
|
|
|
|||||||||||||||||
| 9,189,431 | (425,659 | ) | — | |||||||||||||||||||||
|
|
|
|
|
|
|
|
|
|||||||||||||||||
| Loss from Operations |
(4,479,725 | ) | (284,330 | ) | — | |||||||||||||||||||
|
|
|
|
|
|
|
|
|
|||||||||||||||||
| Interest expense, net |
186,569 | 3,438 | G | (187,011 | ) | C | 2,996 | |||||||||||||||||
| Interest expense - Freeport-McMoRan Inc. |
54,698 | (15,713 | ) | G | (38,985 | ) | C | — | ||||||||||||||||
| Gain on early extinguishment of debt |
(78,014 | ) | — | — | ||||||||||||||||||||
| Other income |
(7,479 | ) | — | — | ||||||||||||||||||||
|
|
|
|
|
|
|
|
|
|||||||||||||||||
| (Loss) Income Before Income Taxes |
(4,635,499 | ) | (272,055 | ) | 225,996 | |||||||||||||||||||
| Income tax (benefit) expense |
(1,065,888 | ) | (103,136 | ) | D | D | ||||||||||||||||||
|
|
|
|
|
|
|
|
|
|||||||||||||||||
| Net (Loss) Income |
(3,569,611 | ) | (168,919 | ) | ||||||||||||||||||||
| Net income attributable to noncontrolling interest in the form of preferred stock of subsidiary |
(39,826 | ) | — | — | ||||||||||||||||||||
|
|
|
|
|
|
|
|
|
|||||||||||||||||
| Net (Loss) Income Attributable to Common Stockholders |
$ | (3,609,437 | ) | $ | (168,919 | ) | $ | |||||||||||||||||
|
|
|
|
|
|
|
|
|
|||||||||||||||||
| Net Loss per Common Share - Basic and Diluted |
$ | (34,375 | ) | |||||||||||||||||||||
|
|
|
|
|
|||||||||||||||||||||
| Weighted-Average Common Shares Outstanding - Basic and Diluted |
105 | |||||||||||||||||||||||
|
|
|
|
|
|||||||||||||||||||||
The accompanying note is an integral part of these financial statements.
F-6
Table of Contents
Index to Financial Statements
Freeport-McMoRan Oil & Gas Inc.
NOTE TO UNAUDITED PRO FORMA CONDENSED CONSOLIDATED FINANCIAL STATEMENTS
Note 1 – Pro Forma Adjustments
The unaudited pro forma condensed consolidated balance sheet includes the following adjustments:
| A. | Reflects the completion of this offering (assuming the issuance and sale by the Company of shares of Class A common stock at an offering price of $ per share, which represents the mid-point of the price range set forth on the cover page of this prospectus, generating estimated net proceeds of $ after deducting underwriting discounts and other estimated offering related fees and expenses) and the use of proceeds from this offering as described in “Use of Proceeds.” Assumes that the underwriters do not exercise their option to purchase additional shares of Class A common stock. |
| B. | Adjustments reflect the elimination of the revolving notes and other long-term debt, consisting of senior notes, as part of the proposed corporate reorganization. Additionally, this reflects the deferred taxes associated with the debt that Freeport-McMoRan Inc. is assuming upon completion of this offering. |
The unaudited pro forma condensed consolidated statement of operations includes the following adjustments:
| C. | Reflects adjustments to interest expense related to pro forma debt structure changes associated with the proposed corporate reorganization, as described in Note B above, and incremental interest on borrowings under a new revolver of $ . Borrowings under the new revolver bear interest at variable rates and are subject to interest rate risk. A 1/8 percent change in the interest rate would result in a change in interest expense related to variable rate financing of $ for the six months ended June 30, 2015, and $ million for the year ended December 31, 2014. |
| D. | Reflects the pro forma adjustment to income tax benefit based upon the U.S. federal statutory rate of 35 percent and a 2.9 percent weighted average state statutory tax rate (net of the federal benefit). |
| E. | Reflects the reversal of revenues and direct operating expenses, including accretion of the asset retirement obligations, attributable to the Eagle Ford shale divestment. |
| F. | Adjusts depreciation, depletion and amortization expense (DD&A) for (i) the reduction in DD&A associated with production volumes attributable to the Eagle Ford shale properties and (ii) the revision to FCX O&G’s DD&A rate reflecting the Eagle Ford shale properties’ reserve volumes sold and the related reduction in capitalized costs. The pro forma DD&A rate averaged $40.52 per barrel of oil equivalent for the year ended December 31, 2014. As a result of the reduction in DD&A, an increase in impairment of oil and gas properties of $313.7 million was estimated during the year ended December 31, 2014. Pursuant to SEC rules for pro forma financial statements, no pro forma adjustment was made with respect to the additional impairment of oil and gas properties. |
| G. | Reflects incremental interest expense of $3.4 million to reverse interest capitalized on the divested Eagle Ford shale properties and a decrease of interest expense of $15.7 million to reflect the use of a portion of the proceeds from the sale to pay a portion of the revolving notes with FCX. |
F-7
Table of Contents
Index to Financial Statements
(Successor)
CONSOLIDATED BALANCE SHEETS (Unaudited)
(in thousands, except share amounts)
| June 30, 2015 |
December 31, 2014 |
|||||||
| ASSETS | ||||||||
| Current Assets |
||||||||
| Cash and cash equivalents |
$ | 6,575 | $ | 2,116 | ||||
| Accounts receivable |
276,554 | 393,728 | ||||||
| Commodity derivative contracts |
173,582 | 315,512 | ||||||
| Inventories |
418,925 | 279,500 | ||||||
| Deferred income taxes |
17,774 | 4,044 | ||||||
| Prepaid expenses and other current assets |
29,640 | 29,948 | ||||||
|
|
|
|
|
|||||
| 923,050 | 1,024,848 | |||||||
|
|
|
|
|
|||||
| Property and Equipment, at cost |
||||||||
| Oil and natural gas properties – full cost method |
||||||||
| Subject to amortization |
18,797,158 | 16,547,266 | ||||||
| Not subject to amortization |
9,308,050 | 10,086,937 | ||||||
| Other property and equipment |
425,135 | 411,211 | ||||||
|
|
|
|
|
|||||
| 28,530,343 | 27,045,414 | |||||||
| Less allowance for depreciation, depletion, amortization and impairment |
(14,190,924 | ) | (7,400,160 | ) | ||||
|
|
|
|
|
|||||
| 14,339,419 | 19,645,254 | |||||||
|
|
|
|
|
|||||
| Other Assets |
190,663 | 183,900 | ||||||
|
|
|
|
|
|||||
| $ | 15,453,132 | $ | 20,854,002 | |||||
|
|
|
|
|
|||||
| LIABILITIES AND EQUITY | ||||||||
| Current Liabilities |
||||||||
| Accounts payable |
$ | 732,898 | $ | 955,768 | ||||
| Royalties and revenues payable |
60,927 | 76,045 | ||||||
| Interest payable |
41,824 | 41,746 | ||||||
| Asset retirement obligations |
111,496 | 119,528 | ||||||
| Other current liabilities |
119,291 | 161,736 | ||||||
|
|
|
|
|
|||||
| 1,066,436 | 1,354,823 | |||||||
|
|
|
|
|
|||||
| Long-Term Debt |
||||||||
| Revolving notes – Freeport-McMoRan Inc. |
5,916,048 | 4,588,228 | ||||||
| Other long-term debt |
2,554,002 | 2,568,382 | ||||||
|
|
|
|
|
|||||
| 8,470,050 | 7,156,610 | |||||||
|
|
|
|
|
|||||
| Deferred Income Taxes |
725,921 | 2,763,478 | ||||||
|
|
|
|
|
|||||
| Other Long-Term Liabilities |
||||||||
| Asset retirement obligations |
1,075,521 | 1,010,201 | ||||||
| Other |
67,272 | 83,622 | ||||||
|
|
|
|
|
|||||
| 1,142,793 | 1,093,823 | |||||||
|
|
|
|
|
|||||
| Commitments and Contingencies (Note 11) |
||||||||
| Redeemable Noncontrolling Interest |
||||||||
| Preferred stock of subsidiary |
757,586 | 751,504 | ||||||
| Stockholder’s Equity |
||||||||
| Common stock, $0.01 par value, 110 shares issued and outstanding at June 30, 2015, and December 31, 2014 |
— | — | ||||||
| Additional paid-in capital |
11,174,825 | 11,164,998 | ||||||
| Accumulated deficit |
(7,884,806 | ) | (3,431,746 | ) | ||||
| Accumulated other comprehensive income |
327 | 512 | ||||||
|
|
|
|
|
|||||
| 3,290,346 | 7,733,764 | |||||||
|
|
|
|
|
|||||
| $ | 15,453,132 | $ | 20,854,002 | |||||
|
|
|
|
|
|||||
The accompanying Notes to the Consolidated Financial Statements are an integral part of these consolidated financial statements.
F-8
Table of Contents
Index to Financial Statements
FCX Oil & Gas Inc.
(Successor)
CONSOLIDATED STATEMENTS OF OPERATIONS (Unaudited)
(in thousands, except outstanding shares)
| Three Months Ended June 30, |
Six Months Ended June 30, |
|||||||||||||||
| 2015 | 2014 | 2015 | 2014 | |||||||||||||
| Revenues |
||||||||||||||||
| Oil sales |
$ | 492,031 | $ | 1,210,364 | $ | 877,012 | $ | 2,422,308 | ||||||||
| Gas sales |
62,492 | 95,342 | 124,753 | 193,740 | ||||||||||||
| Derivatives |
||||||||||||||||
| Oil |
6,227 | (68,477 | ) | 58,047 | (104,462 | ) | ||||||||||
| Gas |
— | (1,690 | ) | — | (15,814 | ) | ||||||||||
|
|
|
|
|
|
|
|
|
|||||||||
| Total oil and gas revenues |
560,750 | 1,235,539 | 1,059,812 | 2,495,772 | ||||||||||||
| Other operating revenues |
8,039 | 565 | 8,776 | 1,226 | ||||||||||||
|
|
|
|
|
|
|
|
|
|||||||||
| 568,789 | 1,236,104 | 1,068,588 | 2,496,998 | |||||||||||||
|
|
|
|
|
|
|
|
|
|||||||||
| Costs and Expenses |
||||||||||||||||
| Lease operating expenses |
196,206 | 244,021 | 399,219 | 474,434 | ||||||||||||
| Production and ad valorem taxes |
14,861 | 39,298 | 32,155 | 80,236 | ||||||||||||
| Gathering and transportation expenses |
38,614 | 30,516 | 72,042 | 57,652 | ||||||||||||
| Accretion |
12,884 | 11,875 | 25,510 | 23,694 | ||||||||||||
| Other operating expense |
19,456 | 3,235 | 35,722 | 4,101 | ||||||||||||
|
|
|
|
|
|
|
|
|
|||||||||
| 282,021 | 328,945 | 564,648 | 640,117 | |||||||||||||
| Depreciation, depletion and amortization |
484,719 | 615,386 | 1,014,589 | 1,231,831 | ||||||||||||
| Impairment of oil and gas properties |
2,683,234 | — | 5,787,415 | — | ||||||||||||
|
|
|
|
|
|
|
|
|
|||||||||
| Total cost of sales |
3,449,974 | 944,331 | 7,366,652 | 1,871,948 | ||||||||||||
| General and administrative |
48,425 | 59,853 | 102,526 | 116,699 | ||||||||||||
|
|
|
|
|
|
|
|
|
|||||||||
| 3,498,399 | 1,004,184 | 7,469,178 | 1,988,647 | |||||||||||||
|
|
|
|
|
|
|
|
|
|||||||||
| (Loss) Income from Operations |
(2,929,610 | ) | 231,920 | (6,400,590 | ) | 508,351 | ||||||||||
|
|
|
|
|
|
|
|
|
|||||||||
| Interest expense, net |
18,206 | 59,645 | 30,243 | 120,041 | ||||||||||||
| Interest expense – Freeport-McMoRan Inc. |
29,345 | 13,951 | 54,701 | 30,005 | ||||||||||||
| Gain on early extinguishment of debt |
— | (6,015 | ) | — | (6,015 | ) | ||||||||||
| Other expense (income) |
149 | (2,559 | ) | (740 | ) | (4,145 | ) | |||||||||
|
|
|
|
|
|
|
|
|
|||||||||
| (Loss) Income Before Income Taxes |
(2,977,310 | ) | 166,898 | (6,484,794 | ) | 368,465 | ||||||||||
| Income tax expense (benefit) |
||||||||||||||||
| Current |
1,063 | 195,801 | 1,066 | 179,105 | ||||||||||||
| Deferred |
(771,167 | ) | (84,944 | ) | (2,053,102 | ) | 10,675 | |||||||||
|
|
|
|
|
|
|
|
|
|||||||||
| Net (Loss) Income |
(2,207,206 | ) | 56,041 | (4,432,758 | ) | 178,685 | ||||||||||
| Net income attributable to noncontrolling interest in the form of preferred stock of subsidiary |
(10,181 | ) | (9,948 | ) | (20,302 | ) | (19,760 | ) | ||||||||
|
|
|
|
|
|
|
|
|
|||||||||
| Net (Loss) Income Attributable to Common Stockholder |
$ | (2,217,387 | ) | $ | 46,093 | $ | (4,453,060 | ) | $ | 158,925 | ||||||
|
|
|
|
|
|
|
|
|
|||||||||
| Net (Loss) Income per Common Share – Basic and Diluted |
$ | (20,158 | ) | $ | 456 | $ | (40,482 | ) | $ | 1,589 | ||||||
|
|
|
|
|
|
|
|
|
|||||||||
| Weighted-Average Common Shares Outstanding – Basic and Diluted |
110 | 101 | 110 | 100 | ||||||||||||
|
|
|
|
|
|
|
|
|
|||||||||
The accompanying Notes to the Consolidated Financial Statements are an integral part of these consolidated financial statements.
F-9
Table of Contents
Index to Financial Statements
FCX Oil & Gas Inc.
(Successor)
CONSOLIDATED STATEMENTS OF COMPREHENSIVE (LOSS) INCOME (Unaudited)
(in thousands)
| Three Months Ended June 30, |
Six Months Ended June 30, |
|||||||||||||||
| 2015 | 2014 | 2015 | 2014 | |||||||||||||
| Net (Loss) Income |
$ | (2,207,206 | ) | $ | 56,041 | $ | (4,432,758 | ) | $ | 178,685 | ||||||
| Other Comprehensive (Loss) Income, net of taxes: |
||||||||||||||||
| Postretirement benefit plan: |
||||||||||||||||
| Gains arising during the period |
— | — | (312 | ) | — | |||||||||||
| Amortization of unrecognized amounts included in net periodic benefit costs |
(2 | ) | 7 | (4 | ) | 14 | ||||||||||
| Postretirement benefit plan related tax expense |
1 | (2 | ) | 131 | (5 | ) | ||||||||||
|
|
|
|
|
|
|
|
|
|||||||||
| (1 | ) | 5 | (185 | ) | 9 | |||||||||||
|
|
|
|
|
|
|
|
|
|||||||||
| Comprehensive (Loss) Income |
(2,207,207 | ) | 56,046 | (4,432,943 | ) | 178,694 | ||||||||||
| Comprehensive income attributable to noncontrolling interest in the form of preferred stock of subsidiary |
(10,181 | ) | (9,948 | ) | (20,302 | ) | (19,760 | ) | ||||||||
|
|
|
|
|
|
|
|
|
|||||||||
| Comprehensive (Loss) Income Attributable to Common Stockholder |
$ | (2,217,388 | ) | $ | 46,098 | $ | (4,453,245 | ) | $ | 158,934 | ||||||
|
|
|
|
|
|
|
|
|
|||||||||
The accompanying Notes to the Consolidated Financial Statements are an integral part of these consolidated financial statements.
F-10
Table of Contents
Index to Financial Statements
FCX Oil & Gas Inc.
(Successor)
CONSOLIDATED STATEMENTS OF CASH FLOWS (Unaudited)
(in thousands)
| Six Months Ended June 30, |
||||||||
| 2015 | 2014 | |||||||
| CASH FLOWS FROM OPERATING ACTIVITIES |
|
|||||||
| Net (loss) income |
$ | (4,432,758) | $ | 178,685 | ||||
| Adjustments to reconcile net (loss) income to net cash provided by operating activities: |
||||||||
| Depreciation, depletion and amortization |
1,014,589 | 1,231,831 | ||||||
| Impairment of oil and gas properties |
5,787,415 | — | ||||||
| Amortization of debt fair value adjustments |
(14,381 | ) | (37,240 | ) | ||||
| Stock-based compensation |
22,199 | 31,424 | ||||||
| Accretion |
25,510 | 23,694 | ||||||
| Net (gains) losses on crude oil and natural gas derivative contracts |
(58,047 | ) | 120,276 | |||||
| Payments for asset retirement obligations |
(27,346 | ) | (44,243 | ) | ||||
| Deferred income tax (benefit) expense |
(2,053,102 | ) | 10,675 | |||||
| Gain on early extinguishment of debt |
— | (6,015 | ) | |||||
| Other, net |
25,282 | (1,045 | ) | |||||
| Changes in working capital, excluding amounts from acquisitions and dispositions: |
||||||||
| Accounts receivable and other current assets |
101,607 | (71,638 | ) | |||||
| Accounts payable and other current liabilities |
(65,818 | ) | 100,590 | |||||
| Accounts payable and interest payable to Freeport-McMoRan Inc. |
16,213 | 422 | ||||||
| Derivative settlements |
216,660 | (116,443 | ) | |||||
| Stock-based compensation |
(24,013 | ) | (20,918 | ) | ||||
| Income taxes receivable/payable |
1,066 | 179,105 | ||||||
|
|
|
|
|
|||||
| Net cash provided by operating activities |
535,076 | 1,579,160 | ||||||
|
|
|
|
|
|||||
| CASH FLOWS FROM INVESTING ACTIVITIES |
||||||||
| Additions to oil and gas properties |
(1,719,963 | ) | (1,007,816 | ) | ||||
| Acquisition of oil and gas properties |
(65,321 | ) | (1,341,779 | ) | ||||
| Additions to other property and equipment |
(13,175 | ) | (11,691 | ) | ||||
| Capitalized interest |
(33,883 | ) | (47,750 | ) | ||||
| Net proceeds from sales of other oil and gas properties |
4,349 | 3,044,121 | ||||||
| Cash held in escrow |
— | (414,381 | ) | |||||
| Other, net |
(5,918 | ) | 25,748 | |||||
|
|
|
|
|
|||||
| Net cash (used in) provided by investing activities |
(1,833,911 | ) | 246,452 | |||||
|
|
|
|
|
|||||
| CASH FLOWS FROM FINANCING ACTIVITIES |
||||||||
| Borrowings from revolving notes – Freeport-McMoRan Inc. |
2,282,919 | 2,408,200 | ||||||
| Repayments of revolving notes – Freeport-McMoRan Inc. |
(955,100 | ) | (4,247,851 | ) | ||||
| Principal payments of long-term debt |
— | (223,913 | ) | |||||
| Distributions to Freeport-McMoRan Inc. |
(7,019 | ) | — | |||||
| Capital contribution from Freeport-McMoRan Inc. |
— | 231,000 | ||||||
| Proceeds from issuance of noncontrolling interest in the form of preferred stock of subsidiary |
— | 24,000 | ||||||
| Distributions to holders of noncontrolling interest in the form of preferred stock of subsidiary |
(14,220 | ) | (14,040 | ) | ||||
| Other, net |
(3,286 | ) | (2,463 | ) | ||||
|
|
|
|
|
|||||
| Net cash provided by (used in) financing activities |
1,303,294 | (1,825,067 | ) | |||||
|
|
|
|
|
|||||
| Net increase in cash and cash equivalents |
4,459 | 545 | ||||||
| Cash and cash equivalents at beginning of period |
2,116 | 871 | ||||||
|
|
|
|
|
|||||
| Cash and cash equivalents at end of period |
$ | 6,575 | $ | 1,416 | ||||
|
|
|
|
|
|||||
The accompanying Notes to the Consolidated Financial Statements are an integral part of these consolidated financial statements.
F-11
Table of Contents
Index to Financial Statements
FCX Oil & Gas Inc.
(Successor)
CONSOLIDATED STATEMENT OF EQUITY (Unaudited)
(in thousands, except share amounts)
| Common Stock | Additional Paid-in Capital |
Accumulated Deficit |
Accumulated Other Comprehensive Income (Loss) |
Total Stockholder’s Equity |
||||||||||||||||||||
| Number of Shares |
At Par Value |
|||||||||||||||||||||||
| Balance at December 31, 2014 |
110 | $ | — | $ | 11,164,998 | $ | (3,431,746) | $ | 512 | $ | 7,733,764 | |||||||||||||
| Distributions to Freeport-McMoRan Inc. |
— | — | (7,019 | ) | — | — | (7,019 | ) | ||||||||||||||||
| Stock-based compensation |
— | — | 15,780 | — | — | 15,780 | ||||||||||||||||||
| Net loss attributable to common stockholder |
— | — | — | (4,453,060 | ) | — | (4,453,060 | ) | ||||||||||||||||
| Other comprehensive loss |
— | — | — | — | (185 | ) | (185 | ) | ||||||||||||||||
| Other |
— | — | 1,066 | — | — | 1,066 | ||||||||||||||||||
|
|
|
|
|
|
|
|
|
|
|
|
|
|||||||||||||
| Balance at June 30, 2015 |
110 | $ | — | $ | 11,174,825 | $ | (7,884,806 | ) | $ | 327 | $ | 3,290,346 | ||||||||||||
|
|
|
|
|
|
|
|
|
|
|
|
|
|||||||||||||
The accompanying Notes to the Consolidated Financial Statements are an integral part of these consolidated financial statements.
F-12
Table of Contents
Index to Financial Statements
FCX Oil & Gas Inc.
(Successor)
NOTES TO CONSOLIDATED FINANCIAL STATEMENTS (Unaudited)
Note 1 — Organization, Basis of Presentation and Summary of Significant Accounting Policies
Organization. FCX Oil & Gas Inc. (FCX O&G, us, our, we) was incorporated on April 23, 2013, and is a wholly owned subsidiary of Freeport-McMoRan Inc. (FCX). FCX O&G, through its wholly owned subsidiary Freeport-McMoRan Oil & Gas LLC (FM O&G), a limited liability company, is engaged in the upstream oil and natural gas business, which acquires, explores for, develops and produces oil and natural gas. On May 31, 2013, FCX acquired Plains Exploration & Production Company (PXP), which merged into FM O&G and was contributed to us. We are the successor to PXP. On June 3, 2013, FCX acquired McMoRan Exploration Co. (McMoRan), which became a wholly owned subsidiary of FM O&G.
Our upstream oil and natural gas activities are located in the United States (U.S.), primarily onshore and offshore California, in the Gulf of Mexico (GOM) and the Gulf Coast Region. We are also participating in an exploration program offshore the Kingdom of Morocco.
Basis of Presentation. Our financial statements include the accounts of all of our consolidated subsidiaries. We consolidate entities where we have the ability to control or direct the operating and financial decisions of the entity or where we directly or indirectly have more than 50 percent of the voting rights that give us the rights to control significant management decisions. The determination of our ability to control, direct or exert significant influence over an entity involves the use of judgment. All intercompany transactions have been eliminated.
These unaudited interim financial statements do not include all of the information and disclosures required by generally accepted accounting principles (GAAP) in the U.S. Therefore, this information should be read in conjunction with our audited financial statements for the year ended December 31, 2014. The information furnished herein reflects all adjustments that are, in the opinion of management, necessary for a fair statement of the results for the interim periods reported. With the exception of the oil and gas properties impairment discussed below and the related tax charge to establish a deferred tax valuation allowance, all such adjustments are, in the opinion of management, of a normal recurring nature. Operating results for the three and six months ended June 30, 2015, are not necessarily indicative of the results that may be expected for the year ending December 31, 2015.
Oil and Gas Properties. Under the U.S. Securities and Exchange Commission’s (SEC) full cost accounting rules, we review the carrying value of our oil and gas properties each quarter on a country-by-country basis. Under these rules, capitalized costs of oil and gas properties (net of accumulated depreciation, depletion, amortization and impairments and related deferred income taxes) for each cost center may not exceed a “ceiling” equal to:
| • | the present value, discounted at 10 percent, of estimated future net cash flows from the related proved oil and natural gas reserves, net of estimated future income taxes; plus |
| • | the cost of unproved properties not being amortized; plus |
| • | the lower of cost or estimated fair value of the related unproved properties included in the costs being amortized (net of related tax effects). |
These rules require that we price our future oil and gas production at the twelve-month average of the first-day-of-the-month historical reference prices as adjusted for location and quality differentials. Our reference prices are West Texas Intermediate (WTI) for oil and the Henry Hub spot price for natural gas. Such prices are utilized except where different prices are fixed and determinable from applicable contracts for the remaining term of those contracts, excluding derivatives. The estimated future net cash flows also exclude future cash outflows associated with settling asset retirement obligations (ARO) included in the net book value of the oil and gas properties. The rules require an impairment if the capitalized costs exceed this “ceiling.”
F-13
Table of Contents
Index to Financial Statements
At June 30, 2015, and March 31, 2015, net capitalized costs with respect to our proved U.S. oil and gas properties exceeded the related ceiling test limitation; therefore, impairment charges of $2.7 billion were recorded in second-quarter 2015 and $5.8 billion for the first six months of 2015, primarily because of the lower twelve-month average of the first-day-of-the-month historical reference oil price and higher capitalized costs at such dates. The SEC requires that the twelve-month average of the first-day-of-the-month historical reference oil price be used in determining the ceiling amount under its full cost accounting rules. This price (using WTI as the reference oil price) was $71.68 per barrel at June 30, 2015 (the twelve-month average was $82.72 per barrel at March 31, 2015).
Note 2 — Disposition, Acquisitions and Other
Eagle Ford Shale Disposition. On June 20, 2014, we completed the sale of our Eagle Ford shale assets to a subsidiary of Encana Corporation for cash consideration of $3.1 billion, before closing adjustments from the April 1, 2014, effective date. Under full cost accounting rules, the proceeds were recorded as a reduction of capitalized oil and gas properties, with no gain or loss recognition, except for $57.6 million of deferred tax expense recorded in connection with the allocation of $220.8 million of goodwill (for which deferred taxes were not previously provided) to the Eagle Ford shale assets. Approximately $1.3 billion of proceeds from this transaction was placed in a like-kind exchange escrow and was used to reinvest into additional Deepwater GOM oil and gas interests, as discussed below. The remaining proceeds were used to repay debt.
Deepwater GOM Asset Acquisitions. On June 30, 2014, we completed the acquisition of interests in the Deepwater GOM from a subsidiary of Apache Corporation, including interests in the Lucius and Heidelberg oil fields and several exploration leases, for $918.0 million ($451.2 million for oil and gas properties subject to amortization and $476.9 million for costs not subject to amortization, including transaction costs and $10.1 million of ARO). The Deepwater GOM acquisition was funded by the like-kind exchange escrow.
Lucius Redetermination. In second-quarter 2014, as required by the unit participation agreement with the Lucius and Hadrian working interest partners, the working interests of all partners in the Lucius development were redetermined. As a result, the Plains Offshore Operations Inc. (Plains Offshore) working interest in the Lucius development was reduced from 23.33 percent to 19.998 percent. This reduction in working interest percentage resulted in Plains Offshore receiving cash from the partners of $88.5 million, which was credited to the full cost pool in our consolidated balance sheets. On the consolidated statements of cash flow, the cash received was treated as a reduction to capital expenditures, under the caption additions to oil and gas properties. As a result of the June 2014 Deepwater GOM acquisition and the redetermination of the working interests, FCX O&G’s combined ownership in the Lucius development increased to 25.1 percent.
Note 3 — Redeemable Noncontrolling Interest
Redeemable noncontrolling interest represents the ownership interest held by third parties in the net assets of our consolidated subsidiary, Plains Offshore, in the form of convertible preferred stock (Preferred Stock) and associated non-detachable warrants. Plains Offshore holds certain of our oil and gas properties and assets located in the GOM in water depths of 500 feet or more, including a 19.998 percent working interest in the Lucius development.
During the six months ended June 30, 2015, Plains Offshore declared quarterly dividends on the original and secondary issuances of Preferred Stock of $20.3 million, or $42.85 per share for the original issuance and $40.83 per share for the secondary issuance ($30.00 per share was paid in cash, with the remaining dividend payments deferred). As of June 30, 2015, we have deferred a total of $37.1 million of declared preferred stock dividends.
F-14
Table of Contents
Index to Financial Statements
The following table presents a reconciliation of changes in redeemable noncontrolling interest for the six months ended June 30, 2015 (in thousands):
| Noncontrolling interest at December 31, 2014 |
$ | 751,504 | ||
| Net income attributable to noncontrolling interest in the form of preferred stock of subsidiary |
20,302 | |||
| Distributions to holders of noncontrolling interest in the form of preferred stock of subsidiary |
(14,220 | ) | ||
|
|
|
|||
| Noncontrolling interest at June 30, 2015 |
$ | 757,586 | ||
|
|
|
At June 30, 2015, and December 31, 2014, the fair value of the non-detachable warrants included in other long-term liabilities in our consolidated balance sheets was $16.3 thousand and $0.2 million, respectively.
Note 4 — Related Party Transactions
Transactions between FCX O&G and FCX have been identified in these consolidated financial statements as related party transactions. During the three and six months ended June 30, 2015, FCX allocated expenses to us of $4.1 million and $8.2 million, respectively, for certain administrative costs and $0.5 million and $4.3 million, respectively, for executive stock-based compensation from FCX. During the three and six months ended June 30, 2014, FCX allocated expenses to us of $5.0 million and $10.6 million, respectively, for certain administrative costs and $1.3 million and $4.7 million, respectively, for executive stock-based compensation from FCX. At June 30, 2015, we owed FCX $40.3 million, of which $27.8 million was included in current liabilities and $12.5 million was included in other long-term liabilities in our consolidated balance sheet. At December 31, 2014, we owed FCX $23.8 million, of which $10.7 million was included in current liabilities and $13.1 million was included in other long-term liabilities in our consolidated balance sheet.
Issuance of Common Stock. From time to time, we receive cash contributions from FCX and, in exchange, issue common shares to FCX. We are authorized to issue one additional share of our common stock to FCX for each $200.0 million of capital contribution; provided, however, that no fractional shares of common stock shall be issued.
FCX—Revolving Notes. We are a borrower under intercompany revolving notes with FCX under which FCX will lend us a maximum of $9.0 billion. In February 2015, our borrowing capacity under the FCX revolving notes was increased from $8.0 billion to $9.0 billion, with all other terms and conditions remaining the same. FCX has committed not to demand repayment within the one-year period following the date of these financial statements. At June 30, 2015, and December 31, 2014, we owed FCX $5.9 billion and $4.6 billion, respectively, under the revolving notes.
Note 5 — Other Long-Term Debt
At June 30, 2015, and December 31, 2014, other long-term debt consisted of (in thousands):
| June 30, 2015 | December 31, 2014 |
|||||||
| FCX Bank Term Loan |
$ | — | $ | — | ||||
| FCX Revolving Credit Facility |
— | — | ||||||
| 6.125% Senior Notes due 2019 |
252,717 | 254,530 | ||||||
| 6 1⁄2% Senior Notes due 2020 |
665,982 | 669,927 | ||||||
| 6.625% Senior Notes due 2021 |
282,703 | 284,252 | ||||||
| 6.75% Senior Notes due 2022 |
490,593 | 493,251 | ||||||
| 6 7⁄8% Senior Notes due 2023 |
862,007 | 866,422 | ||||||
|
|
|
|
|
|||||
| $ | 2,554,002 | $ | 2,568,382 | |||||
|
|
|
|
|
|||||
F-15
Table of Contents
Index to Financial Statements
FCX Bank Term Loan and Revolving Credit Facility. In February 2013, FCX entered into an agreement for a $4.0 billion unsecured bank term loan (Term Loan) in connection with the acquisitions of PXP and McMoRan. Upon closing the PXP acquisition, FCX borrowed $4.0 billion under the Term Loan, and FM O&G joined the Term Loan as a borrower and is fully liable for all obligations under the Term Loan, both severally and jointly with FCX.
FM O&G is a borrower under FCX’s senior unsecured revolving credit facility (FCX Revolving Credit Facility) and is fully liable for all obligations under the FCX Revolving Credit Facility, both severally and jointly with the other borrowers thereunder.
In February 2015, the FCX Term Loan and Revolving Credit Facility were modified to amend the maximum total leverage ratio. In addition, the Term Loan amortization schedule was extended such that, as amended, the Term Loan’s scheduled payments total $204.6 million in 2016, $272.0 million in 2017, $1.0 billion in 2018, $313.5 million in 2019 and $1.3 billion in 2020, compared with the previous amortization schedule of $650.0 million in 2016, $200.0 million in 2017 and $2.2 billion in 2018.
At June 30, 2015, FCX had $985.0 million outstanding and $41.9 million of letters of credit issued under the FCX Revolving Credit Facility, resulting in availability of approximately $3.0 billion, of which approximately $1.5 billion could be used for additional letters of credit.
At June 30, 2015, FM O&G had not entered into any agreements with FCX to pay a portion of the FCX Term Loan, nor does it expect to pay any amounts on behalf of FCX.
PXP Senior Notes. The senior notes outstanding at June 30, 2015, and December 31, 2014, had a total face value of $2.3 billion, respectively. The difference between the carrying amount and the face amount was $211.6 million and $226.0 million at June 30, 2015, and December 31, 2014, respectively, which represented the unamortized fair value adjustments recorded in connection with the purchase price allocation when PXP was acquired by FCX.
In April 2014, FM O&G redeemed $210.0 million of the aggregate principal amount of the outstanding 6.625% Senior Notes due 2021. In accordance with the terms of the senior notes, the redemption was funded with cash contributions from FCX in exchange for additional equity in us. Holders of these senior notes received the principal amount together with the redemption premium and accrued and unpaid interest to the redemption date. As a result of the redemption, we recorded a gain on early extinguishment of debt of $6.0 million during the three months ended June 30, 2014.
Note 6 — Derivative Contracts
General
We do not enter into derivative instruments for speculative trading purposes. We have derivative financial instruments to manage our exposure to commodity price risk on sales of oil and gas production, as a result of the acquisition of PXP. We present the fair value of our derivative contracts on a net basis where the right of offset is provided for in our counterparty agreements.
We are exposed to various market risks, including volatility in oil and natural gas commodity prices and interest rates. The level of derivative activity we engage in depends on our view of market conditions, available derivative prices and operating strategy. A variety of derivative instruments, such as swaps, collars, puts, calls and various combinations of these instruments, may be utilized to manage our exposure to the volatility of oil and natural gas commodity prices. Currently, we do not use derivatives to manage our interest rate risk. The interest rate on our revolving notes with FCX is variable, while our senior notes are at fixed rates.
F-16
Table of Contents
Index to Financial Statements
All derivative instruments are recorded in our consolidated balance sheets at fair value. The derivative instruments we have in place are not designated as hedging instruments. Accordingly, the changes in fair value, both realized and unrealized, are recognized in revenues in our consolidated statements of operations. Cash flows are only impacted to the extent the actual settlements under the contracts result in remitting a payment to or receiving a payment from the counterparty. Net settlements receivable associated with our derivative instruments totaled $33.0 million and $48.1 million at June 30, 2015, and December 31, 2014, respectively.
For put options, we defer payment of the premium for the instrument. The deferred option premiums and accrued interest associated with put options totaled $106.3 million and $210.4 million at June 30, 2015, and December 31, 2014, respectively, which were included in our consolidated balance sheets as a reduction to the fair value of the put options.
Refer to Note 7 for further discussion on the fair value measurement of our derivative contracts.
As of June 30, 2015, we had the following outstanding crude oil option contracts, all of which settle monthly and cover approximately 15.5 million barrels over the remainder of 2015:
| 2015 Period |
Instrument Type |
Daily Volumes (barrels) |
Average Price (per barrel) (1) |
Weighted- Average Deferred Premium |
Index | |||||
| July – December |
Put options (2) | 84,000 | $90.00 Floor with a $70.00 Limit | $ 6.889 | Brent |
| (1) | The average prices do not reflect any premiums to purchase the put options. |
| (2) | If the index price is less than the per barrel floor, we receive the difference between the per barrel floor and the index price up to a maximum of $20 per barrel less the option premium. If the index price is at or above the per barrel floor, we pay only the option premium. |
Balance Sheets
At June 30, 2015, and December 31, 2014, we had the following outstanding commodity derivative contracts recorded in our consolidated balance sheets (in thousands):
| Estimated Fair Value | ||||||||||
| Instrument Type |
Balance Sheet Classification |
June 30, 2015 |
December 31, 2014 |
|||||||
| Crude oil puts |
Commodity derivative contracts - current assets | $ | 173,582 | $ | 315,512 | |||||
|
|
|
|
|
|||||||
The following table presents quantitative information about our commodity derivative contracts, all of which are offset in our consolidated balance sheets as of June 30, 2015, and December 31, 2014 (in thousands):
| Gross Amounts Recognized |
Gross Amounts Offset |
Net Amounts Presented in the Consolidated Balance Sheets |
Net Amount | |||||||||||||
| As of June 30, 2015 |
||||||||||||||||
| Assets |
$ | 173,582 | $ | — | $ | 173,582 | $ | 173,582 | ||||||||
| Liabilities |
— | — | — | — | ||||||||||||
|
|
|
|
|
|
|
|
|
|||||||||
| $ | 173,582 | $ | — | $ | 173,582 | $ | 173,582 | |||||||||
|
|
|
|
|
|
|
|
|
|||||||||
| As of December 31, 2014 |
||||||||||||||||
| Assets |
$ | 315,512 | $ | — | $ | 315,512 | $ | 315,512 | ||||||||
| Liabilities |
— | — | — | — | ||||||||||||
|
|
|
|
|
|
|
|
|
|||||||||
| $ | 315,512 | $ | — | $ | 315,512 | $ | 315,512 | |||||||||
|
|
|
|
|
|
|
|
|
|||||||||
F-17
Table of Contents
Index to Financial Statements
Statements of Operations
During the three and six months ended June 30, 2015 and 2014, net gains (losses) recognized in our consolidated statements of operations for commodity derivative transactions that were not designated as hedge transactions were as follows (in thousands):
| Three Months Ended June 30, | Six Months Ended June 30, | |||||||||||||||
| 2015 | 2014 | 2015 | 2014 | |||||||||||||
| Oil |
$ | 6,227 | $ | (68,477 | ) | $ | 58,047 | $ | (104,462 | ) | ||||||
| Gas |
— | (1,690 | ) | — | (15,814 | ) | ||||||||||
|
|
|
|
|
|
|
|
|
|||||||||
| $ | 6,227 | $ | (70,167 | ) | $ | 58,047 | $ | (120,276 | ) | |||||||
|
|
|
|
|
|
|
|
|
|||||||||
Credit Risk
We generally do not require collateral or other security to support derivative instruments subject to credit risk. However, the agreements with each of the counterparties to our derivative instruments contain netting provisions within the agreements. If a default occurs under the agreements, the non-defaulting party can offset the amount payable to the defaulting party under the derivative contracts with the amount due from the defaulting party. As a result of the netting provisions under the agreements, our maximum amount of loss due to credit risk is limited to the net amounts due from the counterparties under the derivative contracts. As of June 30, 2015, the maximum amount of credit exposure associated with derivative transactions was $206.9 million.
Contingent Features
As of June 30, 2015, the counterparties to our commodity derivative contracts consisted of seven financial institutions. In connection with the acquisition of PXP, FCX agreed to guarantee all of our obligations under our commodity derivative contracts. Therefore, we are not generally required to post additional collateral under our derivative agreements.
Certain of our derivative agreements contain cross-acceleration provisions relative to our debt agreements in excess of $175.0 million. If we were to default on any of these debt agreements, it would be a violation of these provisions, and the counterparties to our derivative agreements could request immediate payment on derivative instruments that are in a net liability position at that time. As of June 30, 2015, we were in a net asset position with all of the counterparties to our derivative instruments.
Note 7 — Fair Value Measurements of Assets and Liabilities
Fair value accounting guidance includes a hierarchy that prioritizes the inputs to valuation techniques used to measure fair value. The hierarchy gives the highest priority to unadjusted quoted prices in active markets for identical assets or liabilities (Level 1 inputs), then to significant observable inputs (Level 2 inputs) and the lowest priority to unobservable inputs (Level 3 inputs).
We determine the appropriate fair-value level for each financial asset and liability on a quarterly basis and recognize any transfers at the end of the reporting period. During the three months ended June 30, 2015, we did not have any transfers in or out of Level 1, 2 or 3.
F-18
Table of Contents
Index to Financial Statements
A summary of the carrying amount and fair value amount of our financial instruments as of June 30, 2015, and December 31, 2014, follows (in thousands):
| At June 30, 2015 | ||||||||||||||||||||
| Carrying Amount |
Fair Value | |||||||||||||||||||
| Total | Level 1 | Level 2 | Level 3 | |||||||||||||||||
| Assets |
||||||||||||||||||||
| Current Assets: |
||||||||||||||||||||
| Cash and cash equivalents (1) |
$ | 6,575 | $ | 6,575 | $ | 6,575 | $ | — | $ | — | ||||||||||
| Crude oil puts (2) |
173,582 | 173,582 | — | — | 173,582 | |||||||||||||||
|
|
|
|
|
|
|
|
|
|
|
|||||||||||
| $ | 180,157 | $ | 180,157 | $ | 6,575 | $ | — | $ | 173,582 | |||||||||||
|
|
|
|
|
|
|
|
|
|
|
|||||||||||
| Liabilities |
||||||||||||||||||||
| Non-Current Liabilities: |
||||||||||||||||||||
| Other long-term debt (3) |
$ | 2,554,002 | $ | 2,501,113 | $ | — | $ | 2,501,113 | $ | — | ||||||||||
|
|
|
|
|
|
|
|
|
|
|
|||||||||||
| $ | 2,554,002 | $ | 2,501,113 | $ | — | $ | 2,501,113 | $ | — | |||||||||||
|
|
|
|
|
|
|
|
|
|
|
|||||||||||
| At December 31, 2014 | ||||||||||||||||||||
| Carrying Amount |
Fair Value | |||||||||||||||||||
| Total | Level 1 | Level 2 | Level 3 | |||||||||||||||||
| Assets |
||||||||||||||||||||
| Current Assets: |
||||||||||||||||||||
| Cash and cash equivalents (1) |
$ | 2,116 | $ | 2,116 | $ | 2,116 | $ | — | $ | — | ||||||||||
| Crude oil puts (2) |
315,512 | 315,512 | — | — | 315,512 | |||||||||||||||
|
|
|
|
|
|
|
|
|
|
|
|||||||||||
| $ | 317,628 | $ | 317,628 | $ | 2,116 | $ | — | $ | 315,512 | |||||||||||
|
|
|
|
|
|
|
|
|
|
|
|||||||||||
| Liabilities |
||||||||||||||||||||
| Non-Current Liabilities: |
||||||||||||||||||||
| Other long-term debt (3) |
$ | 2,568,382 | $ | 2,583,822 | $ | — | $ | 2,583,822 | $ | — | ||||||||||
|
|
|
|
|
|
|
|
|
|
|
|||||||||||
| $ | 2,568,382 | $ | 2,583,822 | $ | — | $ | 2,583,822 | $ | — | |||||||||||
|
|
|
|
|
|
|
|
|
|
|
|||||||||||
| (1) | Our cash and cash equivalents consist primarily of money market mutual funds and are classified as Level 1 under the fair value hierarchy. |
| (2) | Crude oil options are net of deferred premiums and accrued interest of $106.3 million and $210.4 million at June 30, 2015, and December 31, 2014, respectively. |
| (3) | Senior notes are classified as Level 2 under the fair value hierarchy as the inputs utilized for the measurement are quoted, unadjusted prices from over-the-counter markets. |
The estimated fair value amounts of financial instruments have been determined using available market information and valuation methodologies described below.
The carrying value for cash and cash equivalents approximates fair value because of their short-term nature and generally negligible credit losses. Valuations utilizing techniques whose significant inputs are unobservable and require a significant degree of judgment are classified as Level 3 under the fair value hierarchy. Our revolving notes with FCX would have been classified as Level 3 under the fair value hierarchy as the variable interest rate does not reflect our entity-specific credit risk. The credit-adjusted fair value of our revolving notes with FCX is not practicable to estimate as we are not a publicly traded company and do not have a standalone credit rating.
The fair value of our crude oil put derivative instruments was estimated using an option pricing model, which uses various observable inputs, including Intercontinental Exchange Holdings, Inc. crude oil prices, volatilities, interest rates and contract terms. We adjust the valuations for credit quality, using the counterparties’
F-19
Table of Contents
Index to Financial Statements
credit quality for asset balances (which considers the impact of netting agreements on counterparty credit risk, including whether the position with the counterparty is a net asset or a net liability). For asset balances, we use the credit default swap value for counterparties when available or the spread between the risk-free interest rate and the yield on the counterparties’ publicly traded debt for similar maturities. Our crude oil puts are classified within Level 3 of the fair value hierarchy because the inputs used in the valuation model were not observable for the full term of the instruments. The significant unobservable inputs used in the fair value measurement of the crude oil puts are implied volatilities and deferred premiums. Significant increases (decreases) in implied volatilities in isolation would result in a significantly higher (lower) fair value measurement. As of June 30, 2015, the implied volatilities for our crude oil puts ranged from 28 percent to 41 percent, with a weighted average of 32 percent. The deferred premiums totaled a weighted average of $6.89 per barrel at June 30, 2015.
The following table summarizes the changes in our most significant Level 3 instruments, crude oil put options, for the six months ended June 30, 2015 (in thousands):
| Fair value at December 31, 2014 |
$ | 315,512 | ||||
| Net realized gains |
21,036 | (1) | ||||
| Net unrealized gains included in earnings related to assets and liabilities still held at the end of the period |
36,378 | (2) | ||||
| Net settlement receipts |
(199,344 | ) | (3) | |||
|
|
|
|||||
| Fair value at June 30, 2015 |
$ | 173,582 | ||||
|
|
|
| (1) | Includes net realized gains of $21.3 million recorded in revenues, partially offset by $0.3 million of interest expense associated with the deferred premiums. |
| (2) | Includes unrealized gains of $36.8 million recorded in revenues, partially offset by $0.4 million of interest expense associated with the deferred premiums. |
| (3) | Includes interest payments of $2.2 million. |
Note 8 — Asset Retirement Obligations
The following table reflects the changes in our ARO during the six months ended June 30, 2015 (in thousands):
| Asset retirement obligations at December 31, 2014 |
$ | 1,129,729 | ||
| Property dispositions |
(1,663 | ) | ||
| Settlements (1) |
(33,183 | ) | ||
| Change in estimate (1) |
23,523 | |||
| Accretion expense |
25,510 | |||
| Asset retirement additions (1) |
43,101 | |||
|
|
|
|||
| Asset retirement obligations at June 30, 2015 |
$ | 1,187,017 | ||
|
|
|
| (1) | Primarily associated with our GOM properties. |
F-20
Table of Contents
Index to Financial Statements
Note 9 — Stock-Based Compensation
Stock-based compensation is charged to expense or capitalized based on the nature of the employee’s activities. Stock-based compensation for the three and six months ended June 30, 2015 and 2014, were as follows (in thousands):
| Three Months Ended June 30, |
Six Months Ended June 30, |
|||||||||||||||
| 2015 | 2014 | 2015 | 2014 | |||||||||||||
| Stock-based compensation included in: |
||||||||||||||||
| General and administrative |
$ | 8,821 | $ | 14,883 | $ | 17,970 | $ | 24,939 | ||||||||
| Lease operating expenses |
2,881 | 5,570 | 4,229 | 6,485 | ||||||||||||
| Capitalized to oil and natural gas properties |
7,283 | 10,491 | 11,634 | 15,737 | ||||||||||||
|
|
|
|
|
|
|
|
|
|||||||||
| Total stock-based compensation including capitalization |
$ | 18,985 | $ | 30,944 | $ | 33,833 | $ | 47,161 | ||||||||
|
|
|
|
|
|
|
|
|
|||||||||
We do not grant stock-based payment awards to our employees; rather stock-based awards are granted to our employees by FCX. Additionally, FCX allocates stock-based compensation costs to us for a portion of the equity awards granted to FCX corporate personnel who provide services to us. General and administrative expenses included allocated stock-based compensation expense from FCX of $0.5 million and $4.3 million for the three and six months ended June 30, 2015, and $1.3 million and $4.7 million for the three and six months ended June 30, 2014.
At June 30, 2015, there was $76.3 million of total unrecognized compensation cost related to unvested stock-based compensation arrangements that is expected to be recognized over a weighted-average period of approximately 1.46 years.
Note 10 — Income Taxes
Income tax (benefit) expense during interim periods is based on the estimated annual effective income tax rate plus any significant unusual or infrequently occurring items, which are recorded in the period that the specific item occurs. For the six months ended June 30, 2015 and 2014, our effective tax rate was 32 percent (benefit) and 52 percent (expense) of pre-tax income, respectively.
The variance in our effective tax rate (benefit) for the six months ended June 30, 2015, from the 35 percent U.S. federal statutory rate resulted primarily from federal and state net operating loss valuation allowances established as a result of the ceiling test impairment, partially offset by the estimated tax benefit of state income taxes. Additionally, income tax (benefit) for the six months ended June 30, 2015, included a deferred tax benefit of $2.2 billion related to the ceiling test impairment.
The variance in our effective tax rate for the six months ended June 30, 2014, from the 35 percent U.S. federal statutory rate resulted primarily from the estimated tax effects of permanent differences, including (i) deferred tax expense recorded in connection with the allocation of $220.8 million of goodwill (for which deferred taxes were not previously provided) to the Eagle Ford shale assets and (ii) state income taxes partially offset by the domestic production activities deduction.
Note 11 — Commitments and Contingencies
Operating Risks and Insurance Coverage. Our operations are subject to all of the risks normally incident to the exploration for and the production of oil and natural gas, including well blowouts, cratering, explosions, oil spills, releases of gas or well fluids, fires, pollution and releases of toxic gas, each of which could result in damage to or destruction of oil and natural gas wells, production facilities or other property or injury to persons. Our operations in California, including transportation of oil by pipelines within the city and county of Los Angeles, are especially susceptible to damage from earthquakes and involve increased risks of personal injury,
F-21
Table of Contents
Index to Financial Statements
property damage and marketing interruptions because of the population density of southern California. We maintain coverage for earthquake damages in California but this coverage may not provide for the full effect of damages that could occur and we may be subject to additional liabilities. Although we maintain insurance coverage considered to be customary in the industry, we are not fully insured against all risks, either because insurance is not available or because of high premium costs. We are self-insured for named windstorms in the GOM. The occurrence of a significant event that is not fully insured against could have a material adverse effect on our financial position. Our insurance does not cover every potential risk associated with operating our pipelines, including the potential loss of significant revenues. Consistent with insurance coverage generally available to the industry, our insurance policies provide limited coverage for losses or liabilities relating to pollution, resulting from sudden and accidental occurrences.
In the event we make a claim under our insurance policies, we will be subject to the credit risk of the insurers. Volatility and disruption in the financial and credit markets may adversely affect the credit quality of our insurers and impact their ability to pay out claims.
Other Commitments and Contingencies. We are a defendant in various lawsuits arising in the ordinary course of our business. While the outcome of these lawsuits cannot be predicted with certainty and could have a material adverse effect on our financial position, we do not believe that the outcome of these legal proceedings, individually or in the aggregate, will have a material adverse effect on our financial condition.
Note 12 — Supplemental Cash Flow Information
Noncash additions to oil and gas properties of $65.0 million and $34.3 million for the six months ended June 30, 2015 and 2014, respectively, related to our ARO.
At June 30, 2015, and December 31, 2014, accrued capital expenditures included in accounts payable in our consolidated balance sheets were $483.2 million and $706.1 million, respectively.
Note 13 — Subsequent Events
International Exploration (Morocco). In May 2015, we commenced drilling the MZ-1 well associated with the Ouanoukrim prospect offshore Morocco. In early August 2015, drilling of the well was completed to its targeted depth below 20,000 feet to evaluate the primary objectives, which did not contain hydrocarbons. As of June 30, 2015, capitalized costs for international oil and gas exploration activities in Morocco approximated $111 million and additional costs have been incurred subsequent to June 30, 2015, all of which will be transferred to the Moroccan full cost pool in third-quarter 2015. We currently have no proved reserves or production in Morocco.
We evaluated events after June 30, 2015, and through August 10, 2015, the date the financial statements were issued, and determined any events or transactions occurring during this period that would require recognition or disclosure are appropriately addressed in these financial statements.
F-22
Table of Contents
Index to Financial Statements
Report of Independent Registered Public Accounting Firm
The Board of Directors and Stockholder of FCX Oil & Gas Inc.
We have audited the accompanying consolidated balance sheets of FCX Oil & Gas Inc. (successor) as of December 31, 2014 and 2013, and the related consolidated statements of operations, comprehensive (loss) income, cash flows and equity for the year ended December 31, 2014 and the period from April 23, 2013 to December 31, 2013. These financial statements are the responsibility of the Company’s management. Our responsibility is to express an opinion on these financial statements based on our audits.
We conducted our audits in accordance with the standards of the Public Company Accounting Oversight Board (United States). Those standards require that we plan and perform the audit to obtain reasonable assurance about whether the financial statements are free of material misstatement. We were not engaged to perform an audit of the Company’s internal control over financial reporting. Our audits included consideration of internal control over financial reporting as a basis for designing audit procedures that are appropriate in the circumstances, but not for the purpose of expressing an opinion on the effectiveness of the Company’s internal control over financial reporting. Accordingly, we express no such opinion. An audit also includes examining, on a test basis, evidence supporting the amounts and disclosures in the financial statements, assessing the accounting principles used and significant estimates made by management, and evaluating the overall financial statement presentation. We believe that our audits provide a reasonable basis for our opinion.
In our opinion, the financial statements referred to above present fairly, in all material respects, the consolidated financial position of FCX Oil & Gas Inc. at December 31, 2014 and 2013, and the consolidated results of its operations and its cash flows for the year ended December 31, 2014 and the period from April 23, 2013 to December 31, 2013, in conformity with U.S. generally accepted accounting principles.
/s/ Ernst & Young LLP
Houston, Texas
June 23, 2015
F-23
Table of Contents
Index to Financial Statements
(Successor)
(in thousands, except share amounts)
| December 31, | ||||||||
| 2014 | 2013 | |||||||
| ASSETS | ||||||||
| Current Assets |
||||||||
| Cash and cash equivalents |
$ | 2,116 | $ | 871 | ||||
| Accounts receivable |
393,728 | 568,129 | ||||||
| Commodity derivative contracts |
315,512 | — | ||||||
| Inventories |
279,500 | 57,167 | ||||||
| Deferred income taxes |
4,044 | 130,087 | ||||||
| Prepaid expenses and other current assets |
29,948 | 50,105 | ||||||
|
|
|
|
|
|||||
| 1,024,848 | 806,359 | |||||||
|
|
|
|
|
|||||
| Property and Equipment, at cost |
||||||||
| Oil and natural gas properties – full cost method |
||||||||
| Subject to amortization |
16,547,266 | 13,828,664 | ||||||
| Not subject to amortization |
10,086,937 | 10,887,242 | ||||||
| Other property and equipment |
411,211 | 287,393 | ||||||
|
|
|
|
|
|||||
| 27,045,414 | 25,003,299 | |||||||
| Less allowance for depreciation, depletion, amortization and impairment |
(7,400,160 | ) | (1,364,822 | ) | ||||
|
|
|
|
|
|||||
| 19,645,254 | 23,638,477 | |||||||
|
|
|
|
|
|||||
| Goodwill |
— | 1,915,982 | ||||||
| Other Assets |
183,900 | 36,891 | ||||||
|
|
|
|
|
|||||
| $ | 20,854,002 | $ | 26,397,709 | |||||
|
|
|
|
|
|||||
| LIABILITIES AND EQUITY | ||||||||
| Current Liabilities |
||||||||
| Accounts payable |
$ | 955,768 | $ | 502,762 | ||||
| Commodity derivative contracts |
— | 198,590 | ||||||
| Royalties and revenues payable |
76,045 | 169,157 | ||||||
| Interest payable |
41,746 | 101,092 | ||||||
| Asset retirement obligations |
119,528 | 59,579 | ||||||
| Other current liabilities |
161,736 | 117,289 | ||||||
|
|
|
|
|
|||||
| 1,354,823 | 1,148,469 | |||||||
|
|
|
|
|
|||||
| Long-Term Debt |
||||||||
| Revolving notes - Freeport-McMoRan Inc. |
4,588,228 | 3,409,936 | ||||||
| Other long-term debt |
2,568,382 | 6,703,384 | ||||||
|
|
|
|
|
|||||
| 7,156,610 | 10,113,320 | |||||||
|
|
|
|
|
|||||
| Deferred Income Taxes |
2,763,478 | 3,886,540 | ||||||
|
|
|
|
|
|||||
| Other Long-Term Liabilities |
||||||||
| Asset retirement obligations |
1,010,201 | 1,068,850 | ||||||
| Commodity derivative contracts |
— | 114,516 | ||||||
| Other |
83,622 | 48,377 | ||||||
|
|
|
|
|
|||||
| 1,093,823 | 1,231,743 | |||||||
|
|
|
|
|
|||||
| Commitments and Contingencies (Note 11) |
||||||||
| Redeemable Noncontrolling Interest |
||||||||
| Preferred stock of subsidiary |
751,504 | 715,938 | ||||||
| Stockholder’s Equity |
||||||||
| Common stock, $0.01 par value, 110 and 100 shares issued |
— | — | ||||||
| Additional paid-in capital |
11,164,998 | 9,123,971 | ||||||
| (Accumulated deficit) retained earnings |
(3,431,746 | ) | 177,691 | |||||
| Accumulated other comprehensive income |
512 | 37 | ||||||
|
|
|
|
|
|||||
| 7,733,764 | 9,301,699 | |||||||
|
|
|
|
|
|||||
| $ | 20,854,002 | $ | 26,397,709 | |||||
|
|
|
|
|
|||||
The accompanying Notes to the Consolidated Financial Statements are an integral part of these consolidated financial statements.
F-24
Table of Contents
Index to Financial Statements
FCX Oil & Gas Inc.
(Successor)
CONSOLIDATED STATEMENTS OF OPERATIONS
(in thousands, except outstanding shares)
| Year Ended December 31, 2014 |
April 23, 2013, to December 31, 2013 |
|||||||
| Revenues |
||||||||
| Oil sales |
$ | 3,848,602 | $ | 2,746,736 | ||||
| Gas sales |
353,582 | 201,940 | ||||||
| Derivatives |
||||||||
| Oil |
512,322 | (343,928 | ) | |||||
| Gas |
(7,965 | ) | 9,726 | |||||
|
|
|
|
|
|||||
| Total oil and gas revenues |
4,706,541 | 2,614,474 | ||||||
| Other operating revenues |
3,165 | 1,492 | ||||||
|
|
|
|
|
|||||
| 4,709,706 | 2,615,966 | |||||||
|
|
|
|
|
|||||
| Costs and Expenses |
||||||||
| Lease operating expenses |
897,879 | 513,225 | ||||||
| Production and ad valorem taxes |
118,015 | 74,569 | ||||||
| Gathering and transportation expenses |
124,337 | 64,582 | ||||||
| Accretion |
47,392 | 25,588 | ||||||
| Other operating expense |
49,110 | 4,405 | ||||||
|
|
|
|
|
|||||
| 1,236,733 | 682,369 | |||||||
| Depreciation, depletion and amortization |
2,291,074 | 1,363,618 | ||||||
| Impairment of oil and gas properties |
3,737,281 | — | ||||||
|
|
|
|
|
|||||
| Total cost of sales |
7,265,088 | 2,045,987 | ||||||
| General and administrative |
207,772 | 119,842 | ||||||
| Goodwill impairment |
1,716,571 | — | ||||||
|
|
|
|
|
|||||
| 9,189,431 | 2,165,829 | |||||||
|
|
|
|
|
|||||
| (Loss) Income from Operations |
(4,479,725 | ) | 450,137 | |||||
|
|
|
|
|
|||||
| Interest expense, net |
186,569 | 140,099 | ||||||
| Interest expense - Freeport-McMoRan Inc. |
54,698 | 40,653 | ||||||
| Gain on early extinguishment of debt |
(78,014 | ) | (9,877 | ) | ||||
| Other income |
(7,479 | ) | (7,660 | ) | ||||
|
|
|
|
|
|||||
| (Loss) Income Before Income Taxes |
(4,635,499 | ) | 286,922 | |||||
| Income tax (benefit) expense |
||||||||
| Current |
(28,793 | ) | 63,317 | |||||
| Deferred |
(1,037,095 | ) | 24,130 | |||||
|
|
|
|
|
|||||
| Net (Loss) Income |
(3,569,611 | ) | 199,475 | |||||
| Net income attributable to noncontrolling interest in |
(39,826 | ) | (21,784 | ) | ||||
|
|
|
|
|
|||||
| Net (Loss) Income Attributable to Common Stockholder |
$ | (3,609,437 | ) | $ | 177,691 | |||
|
|
|
|
|
|||||
| Net (Loss) Income per Common Share - Basic and Diluted |
$ | (34,375 | ) | $ | 1,776 | |||
|
|
|
|
|
|||||
| Weighted-Average Common Shares Outstanding - Basic and Diluted |
105 | 100 | ||||||
|
|
|
|
|
|||||
The accompanying Notes to the Consolidated Financial Statements are an integral part of these consolidated financial statements.
F-25
Table of Contents
Index to Financial Statements
FCX Oil & Gas Inc.
(Successor)
CONSOLIDATED STATEMENTS OF COMPREHENSIVE (LOSS) INCOME
(in thousands)
| Year Ended December 31, 2014 |
April 23, 2013, to December 31, 2013 |
|||||||
| Net (Loss) Income |
$ | (3,569,611 | ) | $ | 199,475 | |||
| Other Comprehensive Income (Loss), net of taxes: |
||||||||
| Postretirement benefit plan: |
||||||||
| Gains arising during the period |
777 | 549 | ||||||
| Prior service costs arising during the period |
— | (490 | ) | |||||
| Amortization of unrecognized amounts included in net periodic benefit costs |
4 | — | ||||||
| Postretirement benefit plan related tax expense |
(306 | ) | (22 | ) | ||||
|
|
|
|
|
|||||
| 475 | 37 | |||||||
|
|
|
|
|
|||||
| Comprehensive (Loss) Income |
(3,569,136 | ) | 199,512 | |||||
| Comprehensive income attributable to noncontrolling interest in the form of preferred stock of subsidiary |
(39,826 | ) | (21,784 | ) | ||||
|
|
|
|
|
|||||
| Comprehensive (Loss) Income Attributable to Common Stockholder |
$ | (3,608,962 | ) | $ | 177,728 | |||
|
|
|
|
|
|||||
The accompanying Notes to the Consolidated Financial Statements are an integral part of these consolidated financial statements.
F-26
Table of Contents
Index to Financial Statements
FCX Oil & Gas Inc.
(Successor)
CONSOLIDATED STATEMENTS OF CASH FLOWS
(in thousands)
| Year Ended December 31, 2014 |
April 23, 2013, to December 31, 2013 |
|||||||
| CASH FLOWS FROM OPERATING ACTIVITIES |
||||||||
| Net (loss) income |
$ | (3,569,611 | ) | $ | 199,475 | |||
| Adjustments to reconcile net (loss) income to net cash provided by operating activities: |
||||||||
| Depreciation, depletion and amortization |
2,291,074 | 1,363,618 | ||||||
| Impairment of oil and gas properties |
3,737,281 | — | ||||||
| Amortization of debt fair value adjustments |
(62,948 | ) | (42,761 | ) | ||||
| Stock-based compensation |
37,679 | 30,970 | ||||||
| Accretion |
47,392 | 25,588 | ||||||
| Goodwill impairment |
1,716,571 | — | ||||||
| Net (gains) losses on crude oil and natural gas derivative contracts |
(504,357 | ) | 334,202 | |||||
| Payments for asset retirement obligations |
(73,656 | ) | (64,050 | ) | ||||
| Deferred income tax (benefit) expense |
(1,037,095 | ) | 24,130 | |||||
| Gain on early extinguishment of debt |
(78,014 | ) | (9,877 | ) | ||||
| Other, net |
1,771 | (9,766 | ) | |||||
| Decreases (increases) in working capital, excluding amounts from acquisitions and dispositions: |
||||||||
| Accounts receivable and other current assets |
217,214 | 8,967 | ||||||
| Accounts payable and other current liabilities |
(35,027 | ) | (71,456 | ) | ||||
| Accounts payable and interest payable to Freeport-McMoRan Inc. |
30,072 | (8,704 | ) | |||||
| Derivative settlements |
(178,561 | ) | (12,763 | ) | ||||
| Stock-based compensation |
(25,816 | ) | (3,331 | ) | ||||
| Income taxes receivable/payable |
(61,293 | ) | 51,260 | |||||
|
|
|
|
|
|||||
| Net cash provided by operating activities |
2,452,676 | 1,815,502 | ||||||
|
|
|
|
|
|||||
| CASH FLOWS FROM INVESTING ACTIVITIES |
||||||||
| Additions to oil and gas properties |
(2,642,680 | ) | (1,173,544 | ) | ||||
| Acquisition of Deepwater Gulf of Mexico interests |
(1,426,277 | ) | — | |||||
| Acquisition of other oil and gas properties |
(462,726 | ) | (182,723 | ) | ||||
| Additions to other property and equipment |
(25,067 | ) | (22,162 | ) | ||||
| Capitalized interest |
(93,577 | ) | (72,568 | ) | ||||
| Net proceeds from sale of Eagle Ford shale assets |
2,910,258 | — | ||||||
| Net proceeds from sales of other oil and gas properties |
35,456 | 32,122 | ||||||
| Other, net |
37,036 | 37,384 | ||||||
|
|
|
|
|
|||||
| Net cash used in investing activities |
(1,667,577 | ) | (1,381,491 | ) | ||||
|
|
|
|
|
|||||
| CASH FLOWS FROM FINANCING ACTIVITIES |
||||||||
| Principal payments of long-term debt |
(3,994,041 | ) | (716,552 | ) | ||||
| Borrowings from revolving notes - Freeport-McMoRan Inc. |
7,194,643 | 3,198,357 | ||||||
| Repayments of revolving notes - Freeport-McMoRan Inc. |
(6,016,351 | ) | (2,894,684 | ) | ||||
| Issuance of common stock to Freeport-McMoRan Inc. |
2,038,693 | — | ||||||
| Proceeds from issuance of noncontrolling interest in the form of preferred stock of subsidiary |
24,000 | — | ||||||
| Distributions to holders of noncontrolling interest in the form of preferred stock of subsidiary |
(28,260 | ) | (20,261 | ) | ||||
| Other, net |
(2,538 | ) | — | |||||
|
|
|
|
|
|||||
| Net cash used in financing activities |
(783,854 | ) | (433,140 | ) | ||||
|
|
|
|
|
|||||
| Net increase in cash and cash equivalents |
1,245 | 871 | ||||||
| Cash and cash equivalents, beginning of period |
871 | — | ||||||
|
|
|
|
|
|||||
| Cash and cash equivalents, end of period |
$ | 2,116 | $ | 871 | ||||
|
|
|
|
|
|||||
The accompanying Notes to the Consolidated Financial Statements are an integral part of these consolidated financial statements.
F-27
Table of Contents
Index to Financial Statements
FCX Oil & Gas Inc.
(Successor)
CONSOLIDATED STATEMENTS OF EQUITY
(in thousands, except share amounts)
| Common Stock | Capital in Excess of Par Value |
Retained Earnings (Accumulated Deficit) |
Accumulated Other Comprehensive Income |
Total Stockholders’ Equity |
||||||||||||||||||||
| Number of Shares |
At Par Value |
|||||||||||||||||||||||
| Balance at April 23, 2013 |
— | $ | — | $ | — | $ | — | $ | — | $ | — | |||||||||||||
| Issuance of common stock to Freeport-McMoRan Inc. |
100 | — | — | — | — | — | ||||||||||||||||||
| Freeport-McMoRan Inc. contribution of Freeport-McMoRan Oil & Gas LLC investment |
— | — | 6,638,899 | — | — | 6,638,899 | ||||||||||||||||||
| Distribution of investment in McMoRan Exploration Co. to Freeport-McMoRan Inc. |
— | — | (779,340 | ) | — | — | (779,340 | ) | ||||||||||||||||
| Freeport-McMoRan Inc. contribution of McMoRan Exploration Co. investment |
— | — | 3,515,300 | — | — | 3,515,300 | ||||||||||||||||||
| FCX capital contribution - purchase of McMoRan Exploration Co. preferred stock |
— | — | 685 | — | — | 685 | ||||||||||||||||||
| McMoRan Exploration Co. royalty trust conversions |
— | — | 108,468 | — | — | 108,468 | ||||||||||||||||||
| Distribution of pre-merger tax attributes to Freeport-McMoRan Inc. |
— | — | (434,464 | ) | — | — | (434,464 | ) | ||||||||||||||||
| Contribution of current tax payable from Freeport-McMoRan Inc. |
— | — | 63,317 | — | — | 63,317 | ||||||||||||||||||
| Stock-based compensation |
— | — | 11,106 | — | — | 11,106 | ||||||||||||||||||
| Net income attributable to common stockholder |
— | — | — | 177,691 | — | 177,691 | ||||||||||||||||||
| Other comprehensive income |
— | — | — | — | 37 | 37 | ||||||||||||||||||
|
|
|
|
|
|
|
|
|
|
|
|
|
|||||||||||||
| Balance at December 31, 2013 |
100 | — | 9,123,971 | 177,691 | 37 | 9,301,699 | ||||||||||||||||||
| Issuance of common stock to Freeport-McMoRan Inc. |
10 | — | 2,038,693 | — | — | 2,038,693 | ||||||||||||||||||
| Distribution of current tax receivable to Freeport-McMoRan Inc. |
— | — | (29,482 | ) | — | — | (29,482 | ) | ||||||||||||||||
| Stock-based compensation |
— | — | 31,816 | — | — | 31,816 | ||||||||||||||||||
| Net loss attributable to common stockholder |
— | — | — | (3,609,437 | ) | — | (3,609,437 | ) | ||||||||||||||||
| Other comprehensive income |
— | — | — | — | 475 | 475 | ||||||||||||||||||
|
|
|
|
|
|
|
|
|
|
|
|
|
|||||||||||||
| Balance at December 31, 2014 |
110 | $ | — | $ | 11,164,998 | $ | (3,431,746 | ) | $ | 512 | $ | 7,733,764 | ||||||||||||
|
|
|
|
|
|
|
|
|
|
|
|
|
|||||||||||||
The accompanying Notes to the Consolidated Financial Statements are an integral part of these consolidated financial statements.
F-28
Table of Contents
Index to Financial Statements
FCX Oil & Gas Inc.
(Successor)
NOTES TO CONSOLIDATED FINANCIAL STATEMENTS
Note 1 — Organization, Basis of Presentation and Summary of Significant Accounting Policies
Organization. FCX Oil & Gas Inc. (FCX O&G, us, our, we) was incorporated on April 23, 2013, and is a wholly owned subsidiary of Freeport-McMoRan Inc. (FCX). FCX O&G, through its wholly owned subsidiary Freeport-McMoRan Oil & Gas LLC (FM O&G), a limited liability company, is engaged in the upstream oil and natural gas business, which acquires, explores for, develops and produces oil and natural gas. On May 31, 2013, FCX acquired Plains Exploration & Production Company (PXP), which merged into FM O&G and was contributed to us. We are the successor to PXP. On June 3, 2013, FCX acquired McMoRan Exploration Co. (McMoRan), which became a wholly owned subsidiary of FM O&G. As further discussed in Note 2, the results included in these financial statements for the period from April 23, 2013, to December 31, 2013, include PXP’s results beginning June 1, 2013, and McMoRan’s results beginning June 4, 2013. Our oil and gas operations commenced on June 1, 2013.
Our upstream oil and natural gas activities are located in the United States (U.S.), primarily onshore and offshore California, in the Gulf of Mexico (GOM) and the Gulf Coast Region. We are also participating in an exploration program offshore the Kingdom of Morocco.
Basis of Presentation. Our financial statements include the accounts of all of our consolidated subsidiaries. We consolidate entities where we have the ability to control or direct the operating and financial decisions of the entity or where we directly or indirectly have more than 50 percent of the voting rights that give us the rights to control significant management decisions. The determination of our ability to control, direct or exert significant influence over an entity involves the use of judgment. All intercompany transactions have been eliminated.
FCX’s May 31, 2013, acquisition of PXP and June 3, 2013, acquisition of McMoRan have been accounted for under the acquisition method of accounting, with FCX as the acquirer (refer to Note 2 for further discussion). The guidance prescribes that the basis of the assets acquired, liabilities assumed and redeemable noncontrolling interest recognized be recorded at the acquisition-date fair values. The fair value estimates were based on, but not limited to, quoted market prices, where available; expected future cash flows based on estimated reserve quantities; costs to produce and develop reserves; current replacement cost for similar capacity for certain fixed assets; market rate assumptions for contractual obligations; appropriate discount rates and growth rates; and crude oil and natural gas forward prices. The excess of the total consideration over the estimated fair value of the amounts assigned to the identifiable assets acquired, liabilities assumed and redeemable noncontrolling interest was recorded as goodwill.
Use of Estimates. The preparation of FCX O&G’s financial statements in conformity with accounting principles generally accepted in the U.S. requires management to make estimates and assumptions that affect the reported amounts in these financial statements and accompanying notes. Significant estimates made by management include: (i) oil and natural gas reserves; (ii) depreciation, depletion and amortization (DD&A); (iii) asset impairment; (iv) amounts and timing of transfers from oil and gas properties not subject to amortization into the full cost pool; (v) redeemable noncontrolling interest in the form of preferred stock of a subsidiary; (vi) deferred taxes and valuation allowances; (vii) asset retirement obligations (ARO), (viii) determination of the fair value of assets acquired, liabilities assumed and redeemable noncontrolling interest, and recognition of goodwill and deferred taxes in connection with business combinations; and (ix) valuation of derivative instruments. Although management believes these estimates are reasonable, changes in facts and circumstances or discovery of new information may result in revisions of estimates, and actual results may differ from these estimates.
F-29
Table of Contents
Index to Financial Statements
Oil and Gas Properties. We follow the full cost method of accounting specified by the U.S. Securities and Exchange Commission’s (SEC) rules whereby all costs associated with property acquisition, exploration and development activities are capitalized into a cost center on a country-by-country basis. Such costs include internal general and administrative expense, such as payroll and related benefits and costs directly attributable to employees engaged in acquisition, exploration and development activities. General and administrative costs totaling $143.0 million in 2014 and $67.1 million for the period from April 23, 2013, to December 31, 2013, were capitalized as oil and gas properties subject to amortization. General and administrative costs associated with production, operations, marketing and general corporate activities are charged to expense as incurred. Capitalized costs, along with our estimated future costs to develop proved reserves and asset retirement costs that are not already included in oil and gas properties, net of related salvage value, are amortized to expense under the unit-of-production (UOP) method using engineers’ estimates of the related, by country proved oil and gas reserves.
The costs of unproved oil and gas properties are excluded from amortization until the properties are evaluated. Costs are transferred into the amortization base on an ongoing basis as the properties are evaluated and proved oil and natural gas reserves are established or impairment is determined. Unproved oil and gas properties are assessed periodically, at least annually, to determine whether impairment has occurred. We assess oil and gas properties on an individual basis or as a group if properties are individually insignificant. The assessment considers the following factors, among others: intent to drill, remaining lease term, geological and geophysical evaluations, drilling results and activity, the assignment of proved reserves and the economic viability of development if proved reserves are assigned. During any period in which these factors indicate an impairment, the cumulative drilling costs incurred to date for such property and all or a portion of the associated leasehold costs are transferred to the full cost pool and are then subject to amortization. The transfer of costs into the amortization base involves a significant amount of judgment and may be subject to changes over time based on drilling plans and results, geological and geophysical evaluations, the assignment of proved oil and natural gas reserves, availability of capital and other factors. Costs not subject to amortization consist primarily of capitalized costs incurred for undeveloped acreage and wells in progress pending determination, together with capitalized interest for these projects. The ultimate evaluation of the properties will occur over a period of several years. Interest costs totaling $87.4 million in 2014 and $68.9 million for the period from April 23, 2013, to December 31, 2013, were capitalized on oil and gas properties not subject to amortization and in the process of development.
Proceeds from the sale of oil and gas properties are accounted for as reductions to capitalized costs unless the reduction causes a significant change in proved reserves, which absent other factors, is generally described as a 25 percent or greater change, and significantly alters the relationship between capitalized costs and proved reserves attributable to a cost center, in which case a gain or loss is recognized.
Under the SEC’s full cost accounting rules, we review the carrying value of our oil and gas properties each quarter on a country-by-country basis. Under these rules, capitalized costs of oil and gas properties (net of accumulated DD&A and impairments and related deferred income taxes) for each cost center may not exceed a “ceiling” equal to:
| • | the present value, discounted at 10 percent, of estimated future net cash flows from the related proved oil and natural gas reserves, net of estimated future income taxes; plus |
| • | the cost of unproved properties not being amortized; plus |
| • | the lower of cost or estimated fair value of the related unproved properties included in the costs being amortized (net of related tax effects). |
These rules require that we price our future oil and gas production at the twelve-month average of the first-day-of-the-month historical reference prices as adjusted for location and quality differentials. Our reference prices are West Texas Intermediate (WTI) for oil and the Henry Hub spot price for natural gas. Such prices are
F-30
Table of Contents
Index to Financial Statements
utilized except where different prices are fixed and determinable from applicable contracts for the remaining term of those contracts, excluding derivatives. The estimated future net cash flows also exclude future cash outflows associated with settling ARO included in the net book value of the oil and gas properties. The rules require an impairment if the capitalized costs exceed this “ceiling.”
At September 30, 2014, and December 31, 2014, the net capitalized costs with respect to our U.S. oil and gas properties exceeded the related ceiling; therefore, impairment charges of $3.7 billion were recorded in 2014, primarily because of higher capitalized costs and the lower twelve-month average of the first-day-of-the-month historical reference oil price at such dates. Because the ceiling limitation uses a twelve-month historical average price, if WTI oil prices remain below the twelve-month average of $94.99 per barrel at December 31, 2014, the ceiling limitation will decrease, resulting in potentially significant additional ceiling test impairments of our oil and gas properties during 2015. In addition, increases in capitalized costs subject to amortization, negative reserve revisions or other factors could result in additional impairments. Refer to Note 13 for further discussion of additional impairment charges recorded in the first quarter of 2015.
Asset Retirement Obligations. Substantially all of our oil and gas leases require that, upon termination of economic production, the working interest owners plug and abandon non-producing wellbores, remove platforms, tanks, production equipment and flow lines, and restore the wellsite. The fair value of the legal obligation is initially estimated based on discounted cash flow estimates and is accreted to full value over time. The ARO and related asset retirement costs (ARC) (included in oil and gas properties) are recognized in the period in which the well is drilled or acquired, and the ARC are amortized on a UOP basis together with other capitalized costs. Refer to Note 8 for further discussion.
At least annually, we review our ARO estimates for changes in projected timing of abandonment costs, changes in cost estimates and additional ARO incurred during the period.
Cash and Cash Equivalents. Cash and cash equivalents consist primarily of highly liquid money market mutual funds purchased with maturities of three months or less that hold U.S. government securities and demand deposits with financial institutions. The money market mutual funds are available to us upon demand.
Inventories. Inventories primarily consist of materials and supplies that are stated at the lower of weighted-average cost or market. Materials and supplies inventories to be utilized in operations in excess of twelve months are classified as long-term.
Revenue Recognition. Oil and gas revenue from our interests in producing wells is recognized upon delivery and passage of title, net of any royalty interests or other profit interests in the produced product. Oil sales are primarily under contracts with prices based upon regional benchmarks. Approximately 40 percent of gas sales for the year ended December 31, 2014, were priced monthly using industry recognized, published index pricing, and the remainder is priced daily on the spot market. Gas revenue is recorded using the sales method for gas imbalances. If our sales of production volumes for a well exceed our portion of the estimated remaining recoverable reserves of the well, a liability is recorded. No receivables are recorded for those wells on which we have taken less than our ownership share of production unless the amount taken by other parties exceeds the estimate of their remaining reserves. We had no material gas imbalances at December 31, 2014 and 2013.
Goodwill. Goodwill has an indefinite useful life and is not amortized, but rather is tested for impairment at least annually during the fourth quarter, unless events occur or circumstances change between annual tests that would more likely than not reduce the fair value of a related reporting unit below its carrying value. Impairment occurs when the carrying amount of goodwill exceeds its implied fair value. We generally use a discounted cash flow model to determine if the carrying value of a reporting unit, including goodwill, is less than the fair value of the reporting unit. We have determined that for the purpose of performing an impairment test, we have one reporting unit, our U.S. oil and gas properties. When a sale of oil and gas properties occurs, goodwill is allocated to that property based on the relationship of the fair value of the property sold to the total reporting unit’s fair
F-31
Table of Contents
Index to Financial Statements
value. A significant sale of oil and gas properties may represent a triggering event that requires goodwill to be evaluated for impairment. Events affecting crude oil and natural gas prices caused a decrease in the fair value of our reporting unit in 2014, which resulted in the full impairment of goodwill. Refer to Note 2 for further discussion.
Stock-Based Compensation. We do not grant stock-based payment awards to our employees, rather stock-based awards are granted to our employees by FCX. Stock-based compensation is measured at the grant date, based on the calculated fair value of the award for equity-classified awards and is remeasured each reporting period for liability-classified awards. Stock-based compensation is recognized over the requisite employee service period (generally the vesting period of the grant) and based on the number of awards ultimately expected to vest (i.e., reduced for estimated forfeitures). Refer to Note 9 for further discussion.
Redeemable Noncontrolling Interest. Noncontrolling interest in the form of preferred stock of subsidiary represents third-party ownership in the net assets of our consolidated subsidiary, Plains Offshore Operations Inc. (Plains Offshore), in the form of convertible perpetual preferred stock and associated non-detachable warrants. The preferred stock is classified as temporary equity because of its redemption features. The non-detachable warrants are considered to be embedded derivative instruments for accounting purposes and have been assessed as not being clearly and closely related to the preferred stock. Refer to Note 3 for further discussion.
Business Segment Information. We acquire, explore for, develop and produce oil and natural gas primarily in the U.S. We determine our operating segments on a country-by-country basis, which is how management monitors the business. Accordingly, we have one operating segment, our oil and natural gas operations in the U.S.
Our international activities consist of an exploration program offshore the Kingdom of Morocco that has no proved reserves, oil and natural gas production or sales. Capitalized costs not subject to amortization for our Moroccan operations totaled $38.3 million and $15.3 million as of December 31, 2014 and 2013, respectively. Accordingly, no geographic data is presented for our Moroccan operations.
Earnings Per Common Share. Basic and diluted net (loss) income per share were computed by utilizing net (loss) income attributable to common stockholder, after taking into account the effect of dividends on preferred stock of subsidiary.
Recent Accounting Pronouncements. In May 2014, the Financial Accounting Standards Board (FASB) issued an Accounting Standards Update (ASU), which outlines a single comprehensive model and supersedes most of the current revenue recognition guidance. We are evaluating this new guidance, but do not expect it to have a significant impact on our current revenue recognition policies. The FASB is considering a one year deferral of the effective date that would permit public entities to apply the new revenue standard for annual and interim reporting periods beginning after December 15, 2017. Early adoption would be permitted, but not before the original effective date (i.e., annual and interim reporting periods beginning after December 15, 2016).
Note 2 — Disposition, Acquisitions and Other
Eagle Ford Shale Disposition. On June 20, 2014, we completed the sale of our Eagle Ford shale assets to a subsidiary of Encana Corporation for cash consideration of $3.1 billion, before closing adjustments from the April 1, 2014, effective date. Under full cost accounting rules, the proceeds were recorded as a reduction of capitalized oil and gas properties, with no gain or loss recognition, except for $83.7 million of deferred tax expense recorded in connection with the allocation of $220.8 million of goodwill (for which deferred taxes were not previously provided) to the Eagle Ford shale assets. Approximately $1.3 billion of proceeds from this transaction was placed in a like-kind exchange escrow and was used to reinvest into additional oil and gas interests, as discussed below. The remaining proceeds were used to repay debt.
F-32
Table of Contents
Index to Financial Statements
Deepwater GOM Asset Acquisitions. On June 30, 2014, we completed the acquisition of interests in the Deepwater GOM from a subsidiary of Apache Corporation, including interests in the Lucius and Heidelberg oil fields and several exploration leases, for $918.0 million ($451.2 million for oil and gas properties subject to amortization and $476.9 million for costs not subject to amortization, including transaction costs and $10.1 million of ARO). The Deepwater GOM acquisition was funded by the like-kind exchange escrow.
On September 8, 2014, we completed the acquisition of additional Deepwater GOM interests for $495.5 million, including an interest in the Vito oil discovery and a significant nearby lease position on which we have subsequently made the Power Nap discovery. Based on preliminary valuations, and including purchase price adjustments and transaction costs, we recorded capitalized costs for oil and gas properties not subject to amortization of $509.0 million. This acquisition was funded in part with the remaining $414.4 million of funds from the like-kind exchange escrow.
Gulf of Mexico Lease Sale. In March 2014, we were named the high bidder on 20 tracts at the Central Gulf of Mexico Oil and Gas Lease Sale 231 held by the U.S. Bureau of Ocean Energy Management (BOEM) and were awarded the leases. The sum of our high bids was $330.3 million, which was paid in July 2014.
PXP and McMoRan Acquisitions. The acquisitions of PXP and McMoRan have been accounted for under the acquisition method, with FCX as the acquirer. The fair values of the assets acquired, liabilities assumed and redeemable noncontrolling interest have been pushed down to FM O&G and reflected as a contribution from FCX in the consolidated statements of equity.
The final fair values of the assets acquired, liabilities assumed and redeemable noncontrolling interest recognized by FCX in conjunction with the acquisitions of PXP and McMoRan recorded in the books and records of FM O&G are as follows (in thousands):
| PXP | McMoRan | Eliminations | Total | |||||||||||||
| Current assets |
$ | 1,193,031 | $ | 97,803 | $ | — | $ | 1,290,834 | ||||||||
| Oil and natural gas properties - full cost method |
||||||||||||||||
| Subject to amortization |
11,447,070 | 751,369 | — | 12,198,439 | ||||||||||||
| Not subject to amortization |
9,401,325 | 1,710,370 | — | 11,111,695 | ||||||||||||
| Other property and equipment |
260,525 | 1,006 | — | 261,531 | ||||||||||||
| Investment in McMoRan (1) |
848,130 | — | (848,130 | ) | — | |||||||||||
| Other assets |
11,859 | 383,073 | — | 394,932 | ||||||||||||
| Current liabilities |
(906,229 | ) | (174,127 | ) | — | (1,080,356 | ) | |||||||||
| Debt (current and long-term) (2) (3) |
(10,630,418 | ) | (620,160 | ) | — | (11,250,578 | ) | |||||||||
| Deferred income taxes (4) |
(3,917,426 | ) | — | — | (3,917,426 | ) | ||||||||||
| Other long-term liabilities |
(799,158 | ) | (261,913 | ) | — | (1,061,071 | ) | |||||||||
| Redeemable noncontrolling interest (5) |
(707,672 | ) | (259,123 | ) | — | (966,795 | ) | |||||||||
|
|
|
|
|
|
|
|
|
|||||||||
| Total fair value, excluding goodwill |
6,201,037 | 1,628,298 | (848,130 | ) | 6,981,205 | |||||||||||
| Goodwill |
437,862 | 1,499,482 | — | 1,937,344 | ||||||||||||
|
|
|
|
|
|
|
|
|
|||||||||
| Total purchase price |
$ | 6,638,899 | $ | 3,127,780 | $ | (848,130 | ) | $ | 8,918,549 | |||||||
|
|
|
|
|
|
|
|
|
|||||||||
| (1) | PXP owned 51 million shares of McMoRan common stock. Upon the acquisition of McMoRan, each outstanding share of McMoRan common stock was converted into a right to receive $14.75 in cash and 1.15 units of a royalty trust, which holds a 5 percent overriding royalty interest in future production from McMoRan’s Inboard Lower Tertiary/Cretaceous exploration prospects that existed as of December 5, 2012, the date of the McMoRan merger agreement. McMoRan conveyed the royalty interests to the royalty trust |
F-33
Table of Contents
Index to Financial Statements
| immediately prior to the effective time of the merger, and they were carved out of the mineral interests that were acquired by FCX and not considered part of purchase consideration. Subsequent to McMoRan’s acquisition by FCX, FCX contributed ownership in all the outstanding shares of McMoRan to FM O&G, at which point McMoRan became FM O&G’s wholly owned subsidiary. Our investment in McMoRan common stock was subsequently eliminated, and we consolidated the operations of McMoRan as part of our oil and natural gas operations beginning June 4, 2013. |
| (2) | PXP’s long-term debt, including current portion, which was assumed as part of the acquisition of PXP by FCX, included $6.5 billion of senior notes with an acquisition-date fair value of $7.2 billion and $3.5 billion outstanding under PXP’s credit facility. On May 31, 2013, FCX repaid the credit facility. |
| (3) | McMoRan’s long-term debt, including current portion, which was assumed as part of the acquisition of McMoRan by FCX, included $67.8 million of 5 1⁄4% Convertible Senior Notes due October 2013 (5 1⁄4% Convertible Senior Notes) with an acquisition-date fair value of $68.5 million, $300.0 million of 11 7⁄8% Senior Notes due November 2014 (11 7⁄8% Senior Notes) with an acquisition-date fair value of $314.1 million, and $200.0 million of 4% Convertible Senior Notes due December 2017 (4% Convertible Senior Notes) with an acquisition-date fair value of $237.5 million. During 2013, the 4% Convertible Senior Notes and 5 1⁄4% Convertible Senior Notes were converted into FM O&G’s equity, and the 11 7⁄8% Senior Notes were redeemed. |
| (4) | Deferred income taxes have been recognized based on the estimated fair value adjustments to net assets using a 38 percent tax rate, which reflected the 35 percent federal statutory rate and a 3 percent weighted-average of the applicable statutory state tax rates (net of federal benefit). |
| (5) | McMoRan’s redeemable noncontrolling interest, which was assumed as part of the acquisition of McMoRan by FCX, included 8% Convertible Perpetual Preferred Stock with an acquisition-date fair value of $30.0 million and 5.75% Convertible Perpetual Preferred Stock with an acquisition-date fair value of $229.1 million (collectively, the McMoRan Preferred Stock). The enhanced make-whole conversion rates triggered by the acquisition of McMoRan by FCX expired on July 9, 2013. A total of $259.1 million of McMoRan Preferred Stock was converted during the year ended December 31, 2013, primarily at the make-whole conversion rates for which holders received cash of $228.2 million and 17.7 million royalty trust units with an acquisition-date fair value of $30.9 million. |
The fair value measurement of the oil and gas properties, ARO included in other liabilities and redeemable noncontrolling interests were based, in part, on significant inputs not observable in the market and thus represents a Level 3 (lowest priority to unobservable inputs) measurement. The fair value measurement of long-term debt, including the current portion, was based on prices obtained from a readily available pricing source and thus represents a Level 2 (significant observable inputs) measurement.
Goodwill arose from the acquisition of PXP by FCX principally from the requirement to recognize deferred taxes on the difference between the fair value and the tax basis of the acquired assets. Goodwill arose from the acquisition of McMoRan by FCX principally because of limited drilling activities to date and the absence of production history and material reserve data associated with the very large estimated geologic potential of an emerging trend targeting deep-seated structures in the shallow waters of the GOM and onshore analogous to large discoveries in the Deepwater GOM and other proven basins’ prospects. Goodwill recorded in connection with these acquisitions was not deductible for income tax purposes.
F-34
Table of Contents
Index to Financial Statements
A summary of changes in the carrying amount of goodwill during the periods ended December 31, 2014 and 2013, is as follows (in thousands):
| Contribution of PXP |
$ | 436,691 | ||
| Contribution of McMoRan |
1,479,291 | |||
|
|
|
|||
| Goodwill at December 31, 2013 |
1,915,982 | |||
| Finalization of purchase price allocation (1) |
21,362 | |||
| Disposal of Eagle Ford shale assets |
(220,773 | ) | ||
| Impairment of goodwill |
(1,716,571 | ) | ||
|
|
|
|||
| Goodwill at December 31, 2014 |
$ | — | ||
|
|
|
| (1) | During the second quarter of 2014, FCX finalized its purchase price allocations, which resulted in a net increase of $20.0 million to oil and gas properties, an increase of $21.3 million to goodwill and a net decrease of $41.3 million to deferred income tax asset. These adjustments were a result of new information that became available after the acquisition date, but prior to the close of the measurement period. |
During the fourth quarter of 2014, we conducted our annual goodwill impairment assessment, which resulted in a goodwill impairment charge of $1.7 billion for the full carrying value of goodwill. Crude oil prices and our estimates of oil reserves at December 31, 2014, represent the most significant assumptions used in our evaluation of goodwill (i.e., Level 3 measurement). Forward strip Brent oil prices used in our estimates at December 31, 2014, ranged from approximately $62 per barrel to $80 per barrel for the years 2015 through 2021, compared with a range from approximately $90 per barrel to $98 per barrel at the acquisition date.
Lucius Redetermination. In the second quarter of 2014, as required by the unit participation agreement with the Lucius and Hadrian working interest partners, the working interests of all partners in the Lucius development were redetermined. As a result, the Plains Offshore working interest in the Lucius development was reduced from 23.33 percent to 19.998 percent. This reduction in working interest percentage resulted in Plains Offshore receiving cash from the partners of $88.5 million, which was credited to the full cost pool in our consolidated balance sheets. On the consolidated statements of cash flow, the cash received was treated as a reduction to capital expenditures, under the caption, additions to oil and gas properties. As a result of the June 2014 Deepwater GOM acquisition and the redetermination of the working interests, FCX O&G’s combined ownership in the Lucius development was 25.1 percent at December 31, 2014.
F-35
Table of Contents
Index to Financial Statements
Note 3 — Redeemable Noncontrolling Interest
The following table presents a reconciliation of changes in redeemable noncontrolling interest for the year ended December 31, 2014, and for the period from June 1, 2013, to December 31, 2013 (in thousands):
| Noncontrolling Interest PXP |
Noncontrolling Interest McMoRan (1) |
Total | ||||||||||
| Contribution from Freeport McMoRan Inc. at June 1, 2013 |
$ | 707,672 | $ | — | $ | 707,672 | ||||||
| Acquisition of McMoRan |
— | 259,123 | 259,123 | |||||||||
| Conversions of McMoRan Preferred Stock |
— | (259,130 | ) | (259,130 | ) | |||||||
| Net income attributable to noncontrolling interest in the form of preferred stock of subsidiary |
21,766 | 18 | 21,784 | |||||||||
| Distributions to holders of noncontrolling interest in the form of preferred stock of subsidiary |
(13,500 | ) | (11 | ) | (13,511 | ) | ||||||
|
|
|
|
|
|
|
|||||||
| Noncontrolling interest at December 31, 2013 |
$ | 715,938 | $ | — | $ | 715,938 | ||||||
| Issuance of additional shares of preferred stock |
24,000 | — | 24,000 | |||||||||
| Net income attributable to noncontrolling interest in the form of preferred stock of subsidiary |
39,826 | — | 39,826 | |||||||||
| Distributions to holders of noncontrolling interest in the form of preferred stock of subsidiary |
(28,260 | ) | — | (28,260 | ) | |||||||
|
|
|
|
|
|
|
|||||||
| Noncontrolling interest at December 31, 2014 |
$ | 751,504 | $ | — | $ | 751,504 | ||||||
|
|
|
|
|
|
|
|||||||
| (1) | Refer to Note 2 - PXP and McMoRan acquisitions for further discussion. |
Redeemable Noncontrolling Interest - PXP. In 2011, PXP issued (i) 450,000 shares of Plains Offshore 8% Convertible Preferred Stock (Preferred Stock) for gross proceeds of $450.0 million and (ii) non-detachable warrants to purchase in aggregate 9.1 million shares of Plains Offshore’s common stock with an exercise price of $20 per share. In addition, Plains Offshore issued 87 million shares of Plains Offshore Class A common stock, which will be held in escrow until the conversion and cancellation of the Preferred Stock or the exercise of the warrants. In January 2014, Plains Offshore issued 4.8 million shares of Class A common stock to FM O&G at a price of $20 per share (a total of $96.0 million) and 24,000 shares of Preferred Stock to preferred holders for an aggregate price of $1,000 per share (a total of $24.0 million), together with non-detachable warrants, under the same terms. Plains Offshore holds certain oil and gas properties and assets located in the GOM in water depths of 500 feet or more, including the Lucius oil field and the Phobos prospect. The Preferred Stock represents a 20 percent equity interest in Plains Offshore and pays quarterly cash dividends of 6 percent per year with an additional 2 percent per year dividend that may be deferred and accumulated until paid. There were $31.1 million and $19.7 million of deferred accumulated dividends as of December 31, 2014 and 2013, respectively. The holders of the Preferred Stock (preferred holders) are entitled to vote on all matters on which Plains Offshore common stockholders are entitled to vote. The shares of Preferred Stock also fully participate, on an as-converted basis at four times, in cash dividends distributed to any class of common stockholders of Plains Offshore. Plains Offshore has not distributed any dividends to its common stockholders.
The preferred holders have the right, at any time at their option, to convert any or all of such holders’ shares of Preferred Stock and exercise any of the associated non-detachable warrants into shares of Class A common stock of Plains Offshore, at an initial conversion/exercise price of $20 per share; the conversion price is subject to adjustment as a result of certain events. Furthermore, Plains Offshore has the right to convert all or a portion of the outstanding shares of Preferred Stock if certain events occur more than 180 days after an initial public offering or a qualified public offering of Plains Offshore. FM O&G also has a right to purchase shares of Plains Offshore preferred stock, common stock and warrants under certain circumstances in order to permit the consolidation of Plains Offshore for federal income tax purposes. Additionally, at any time on or after
F-36
Table of Contents
Index to Financial Statements
November 17, 2016, FM O&G may exercise a call right to purchase all, but not less than all, of the outstanding shares of Preferred Stock and associated non-detachable warrants for cash, at a price equal to the liquidation preference described below. At any time after November 17, 2015, a majority of the preferred holders may cause Plains Offshore to use its commercially reasonable efforts to consummate an exit event.
An exit event, means, at the sole option of Plains Offshore (i) the purchase by FM O&G or the redemption by Plains Offshore of all the preferred stock, warrants and common stock held by the preferred holders for the aggregate fair value thereof; (ii) a sale of Plains Offshore or a sale of all or substantially all of its assets, in each case in an arms’ length transaction with a third party, at the highest price available after reasonable marketing efforts by Plains Offshore; or (iii) a qualified initial public offering, which is an underwritten public offering that results in gross proceeds (before any underwriters’ discount and commissions and expenses of such offering) to Plains Offshore of at least $250.0 million. In the event that Plains Offshore fails to consummate an exit event prior to the applicable exit event deadline, the conversion price of the Preferred Stock and the exercise price of the warrants will immediately and automatically be adjusted such that all issued and outstanding shares of Preferred Stock on an as-converted basis taken together with shares of Plains Offshore common stock issuable upon exercise of the warrants, in the aggregate, will constitute 49 percent of the common equity securities of Plains Offshore on a fully diluted basis. In addition, FM O&G would be required to purchase $300.0 million of junior preferred stock in Plains Offshore.
In the event of liquidation of Plains Offshore, each preferred holder is entitled to receive the liquidation preference before any payment or distribution is made on any Plains Offshore junior preferred stock or common stock. A liquidation event includes any of the following events: (i) the liquidation, dissolution or winding up of Plains Offshore, whether voluntary or involuntary, (ii) a sale, consolidation or merger of Plains Offshore in which the stockholders immediately prior to such event do not own at least a majority of the outstanding shares of the surviving entity, or (iii) a sale or other disposition of all or substantially all of Plains Offshore’s assets to a person other than us or its affiliates. The liquidation preference, as defined in the stockholders’ agreement, is equal to (i) the greater of (a) 1.25 times the initial offering price and (b) the sum of (1) the fair value of the shares of common stock issuable upon conversion of the Preferred Stock and (2) the applicable tax adjustment amount, plus (ii) any accrued dividends and accumulated dividends.
The non-detachable warrants may be exercised at any time on the earlier of (i) November 17, 2019, or (ii) a termination event. A termination event is defined as the occurrence of any of (a) the conversion of the Preferred Stock, (b) the redemption of the Preferred Stock, (c) the repurchase by us or any of its affiliates of the Preferred Stock or (d) a liquidation event of Plains Offshore, described above.
The non-detachable warrants are considered to be embedded derivative instruments for accounting purposes and have been assessed as not being clearly and closely related to the Preferred Stock. Therefore, the warrants are classified as a long-term liability in our consolidated balance sheets and are adjusted to fair value each reporting period with adjustments recorded in other income (expense). The fair value measurement of the warrants is based on significant inputs not observable in the market and thus represents a Level 3 measurement. At December 31, 2014 and 2013, the fair values of the non-detachable warrants included in other long-term liabilities in our consolidated balance sheets were $0.2 million and $2.5 million, respectively.
The Preferred Stock of Plains Offshore is classified as temporary equity because of its redemption features and is therefore reported as “redeemable noncontrolling interest” outside of permanent equity in our consolidated balance sheets. Remeasurement of the redeemable noncontrolling interest represents its initial carrying amount adjusted for any noncontrolling interest’s share of net income (loss) or changes to the redemption value. Additionally, the carrying amount will be further increased by amounts representing dividends not currently declared or paid, but which are payable under the redemption features described above. Future mark-to-market adjustments to the redemption value, subject to a minimum balance of the original recorded value ($707.7 million) on May 31, 2013, shall be reflected in retained earnings, or in the absence of retained earnings, by charges against additional paid-in capital and earnings per share. Changes in the redemption value are accreted
F-37
Table of Contents
Index to Financial Statements
over the period from the date FCX acquired PXP to the earliest redemption date. The redemption value has not exceeded the original recorded value; therefore, no amounts have been accreted.
During the year ended December 31, 2014, Plains Offshore declared quarterly dividends on the original issuance of Preferred Stock of $37.9 million, or $84.22 per share ($60.00 per share was paid in cash, with the remaining dividend payments deferred). Additionally, Plains Offshore declared quarterly dividends on the secondary issuance of Preferred Stock of $1.7 million, or $70.46 per share ($52.50 per share was paid in cash, with the remaining dividend payments deferred). As of December 31, 2014, we had deferred a total of $31.1 million of declared preferred stock dividends.
In May 2013, Plains Offshore declared quarterly dividends on the Preferred Stock of $9.2 million, or $20.54 per share ($15.00 per share was paid in cash in June 2013, with the remaining dividend payments deferred). Subsequent to the acquisition of PXP by FCX, during the period from June 1, 2013, to December 31, 2013, Plains Offshore declared quarterly dividends on the Preferred Stock of $18.6 million, or $41.41 per share ($30.00 per share was paid in cash, with the remaining dividend payments deferred).
Note 4 — Related Party Transactions
Transactions between FCX O&G and FCX have been identified in these consolidated financial statements as related party transactions. During the year ended December 31, 2014, FCX allocated expenses to us of $20.2 million for certain administrative costs and $5.5 million for executive stock-based compensation from FCX. There were no allocations from FCX during the period from April 23, 2013, to December 31, 2013, as such costs were directly incurred by us and reflected within our results of operations during this period. At December 31, 2014, we owed FCX $23.8 million, of which $10.7 million was included in current liabilities and $13.1 million was included in other long-term liabilities in our consolidated balance sheet. At December 31, 2013, we owed FCX $4.1 million, of which $1.2 million was included in current liabilities and $2.9 million was included in other long-term liabilities in our consolidated balance sheet.
Issuance of Common Stock. From time to time, we receive cash contributions from FCX and, in exchange, issue common shares to FCX. We are authorized to issue one additional share of our common stock to FCX for each $200.0 million of capital contribution; provided, however, that no fractional shares of common stock shall be issued. During 2014, we issued 10 common shares to FCX for $2.0 billion of cash contributions.
FCX - Revolving Notes. We are a borrower under intercompany revolving notes with FCX under which FCX will lend us a maximum of $8.0 billion (borrowing capacity increased to $9.0 billion in February 2015, refer to Note 13 for further discussion). Amounts borrowed under the revolving notes bear interest at a floating rate per annum equal to the applicable rate, which is based on London Interbank Offered Rate (LIBOR), plus the higher of: (i) 1.75 percent or (ii) the current applicable rate defined under FCX’s Revolving Credit Agreement. Accrued and unpaid interest on the outstanding loans is due to FCX on the last business day of each quarter. These notes will mature on the date that is the earlier of either (a) demand by FCX or (b) the fifteenth anniversary of the date of these notes, at which point the final payment will be equal to (i) all outstanding principal plus (ii) all accrued and unpaid interest. FCX has committed not to demand repayment within the one-year period following the date of these financial statements. At December 31, 2014 and 2013, we owed FCX $4.6 billion and $3.4 billion, respectively, under the revolving notes.
F-38
Table of Contents
Index to Financial Statements
Note 5 — Other Long-Term Debt
At December 31, 2014 and 2013, long-term debt consisted of (in thousands):
| December 31, | ||||||||
| 2014 | 2013 | |||||||
| FCX Bank Term Loan |
$ | — | $ | — | ||||
| FCX Revolving Credit Facility |
— | — | ||||||
| 6.125% Senior Notes due 2019 |
254,530 | 816,857 | ||||||
| 8.625% Senior Notes due 2019 |
— | 447,121 | ||||||
| 7.625% Senior Notes due 2020 |
— | 336,198 | ||||||
| 6 1⁄2% Senior Notes due 2020 |
669,927 | 1,647,110 | ||||||
| 6.625% Senior Notes due 2021 |
284,252 | 659,161 | ||||||
| 6.75% Senior Notes due 2022 |
493,251 | 1,111,105 | ||||||
| 6 7⁄8% Senior Notes due 2023 |
866,422 | 1,685,832 | ||||||
|
|
|
|
|
|||||
| $ | 2,568,382 | $ | 6,703,384 | |||||
|
|
|
|
|
|||||
FCX Bank Term Loan. In February 2013, FCX entered into an agreement for a $4.0 billion unsecured bank term loan (Term Loan) in connection with the acquisitions of PXP and McMoRan. Upon closing the PXP acquisition, FCX borrowed $4.0 billion under the Term Loan, and FM O&G joined the Term Loan as a borrower and is fully liable for all obligations under the Term Loan, both severally and jointly with FCX. At FCX’s option, the Term Loan bears interest at either an adjusted LIBOR or an alternate base rate (ABR) (as defined under the FCX Term Loan agreement) plus a spread determined by reference to FCX’s credit ratings (effective February 11, 2015, LIBOR plus 1.75 percent or ABR plus 0.75 percent; previously LIBOR plus 1.50 percent or ABR plus 0.50 percent). At December 31, 2014, FCX had $3.1 billion outstanding under the Term Loan and FM O&G had not entered into any agreements with FCX to pay a portion of the Term Loan, nor does it expect to pay any amounts on behalf of FCX. In February 2015, the Term Loan was amended (refer to Note 13 for further discussion).
FCX Revolving Credit Facility. FM O&G is a borrower under FCX’s senior unsecured revolving credit facility (FCX Revolving Credit Facility) and is fully liable for all obligations under the FCX Revolving Credit Facility, both severally and jointly with the other borrowers thereunder. In May 2014, FM O&G, PT Freeport Indonesia (PT-FI, a consolidated subsidiary of FCX) and FCX amended the $3.0 billion FCX Revolving Credit Facility to extend the maturity date one year to May 31, 2019, and increase the aggregate facility amount from $3.0 billion to $4.0 billion, with $500.0 million available to PT-FI. At December 31, 2014, there were no borrowings and $45.0 million of letters of credit issued under the FCX Revolving Credit Facility, resulting in availability of approximately $4.0 billion, of which $1.5 billion could be used for additional letters of credit. In February 2015, the FCX Revolving Credit Facility was amended (refer to Note 13 for further discussion).
Interest on the FCX Revolving Credit Facility (effective February 11, 2015, LIBOR plus 1.75 percent or ABR plus 0.75 percent; previously LIBOR plus 1.50 percent or ABR plus 0.50 percent) is determined by reference to FCX’s credit rating.
PXP Senior Notes. At May 31, 2013, in connection with the acquisition of PXP, FCX guaranteed PXP’s unsecured senior notes. The unsecured senior notes had a stated value of $6.5 billion, which was increased by $716.3 million to reflect the acquisition-date fair market value of these senior notes. The senior notes outstanding at December 31, 2014 and 2013, had a total face value of $2.3 billion and $6.1 billion, respectively. The $226.0 million and $653.4 million differences between the carrying amount and the face amount at December 31, 2014 and 2013, respectively, represented the unamortized fair value adjustments recorded in connection with the purchase price allocation when PXP was acquired by FCX. The fair value adjustments are being amortized over the term of the senior notes and recorded as a reduction of interest expense using the effective interest rate method. These senior notes are redeemable in whole or in part, at our option, at make-whole redemption prices
F-39
Table of Contents
Index to Financial Statements
prior to the dates stated below, and beginning on the dates stated below at specified redemption prices. Upon completion of the acquisition of PXP, FCX guaranteed these senior notes resulting in an investment-grade rating for these senior notes. The table below summarizes the senior notes outstanding as of December 31, 2014:
| Debt Instrument |
Date | |
| 6.125% Senior Notes due 2019 |
June 15, 2016 | |
| 6 1⁄2% Senior Notes due 2020 |
November 15, 2015 | |
| 6.625% Senior Notes due 2021 |
May 1, 2016 | |
| 6.75% Senior Notes due 2022 |
February 1, 2017 | |
| 6 7⁄8% Senior Notes due 2023 |
February 15, 2018 |
Early Debt Extinguishment. FM O&G redeemed certain of our senior notes during the year ended December 31, 2014, as follows (in thousands):
| Principal Amount |
Purchase Accounting Fair Value Adjustments |
Book Value | (Loss) Gain on Early Extinguishment |
|||||||||||||
| 6.125% Senior Notes due 2019 |
$ | 513,078 | $ | 40,135 | $ | 553,213 | $ | (1,941 | ) | |||||||
| 8.625% Senior Notes due 2019 |
400,000 | 41,648 | 441,648 | 24,397 | ||||||||||||
| 7.625% Senior Notes due 2020 |
300,000 | 31,386 | 331,386 | 13,937 | ||||||||||||
| 6 1⁄2% Senior Notes due 2020 |
882,974 | 78,910 | 961,884 | 9,884 | ||||||||||||
| 6.625% Senior Notes due 2021 |
338,544 | 31,237 | 369,781 | 3,507 | ||||||||||||
| 6.75% Senior Notes due 2022 |
551,465 | 56,926 | 608,391 | 7,614 | ||||||||||||
| 6 7⁄8% Senior Notes due 2023 |
721,524 | 84,222 | 805,746 | 20,616 | ||||||||||||
|
|
|
|
|
|
|
|
|
|||||||||
| $ | 3,707,585 | $ | 364,464 | $ | 4,072,049 | $ | 78,014 | |||||||||
|
|
|
|
|
|
|
|
|
|||||||||
In accordance with the terms of these senior notes, the redemptions were funded with cash contributions from FCX to FCX O&G and from FCX O&G to FM O&G in exchange for additional equity. Holders of these senior notes received the principal amount together with the redemption premium and accrued and unpaid interest to the redemption date.
Maturities. As of December 31, 2014, we had aggregate total maturities of long-term debt maturing within the next five years of $236.9 million, all in 2019.
Note 6 — Derivative Contracts
General
We do not enter into derivative instruments for speculative trading purposes. We have derivative financial instruments to manage our exposure to commodity price risk on sales of oil and gas production, as a result of the acquisition of PXP. We present the fair value of our derivative contracts on a net basis where the right of offset is provided for in our counterparty agreements.
We are exposed to various market risks, including volatility in oil and natural gas commodity prices and interest rates. The level of derivative activity we engage in depends on our view of market conditions, available derivative prices and operating strategy. A variety of derivative instruments, such as swaps, collars, puts, calls and various combinations of these instruments, may be utilized to manage our exposure to the volatility of oil and natural gas commodity prices. Currently, we do not use derivatives to manage our interest rate risk. The interest rate on our revolving notes with FCX is variable, while our senior notes are at fixed rates.
All derivative instruments are recorded in our consolidated balance sheets at fair value. The derivative instruments we have in place are not designated as hedging instruments. Accordingly, the changes in fair value, both realized and unrealized, are recognized in revenues in our consolidated statements of operations. Cash flows
F-40
Table of Contents
Index to Financial Statements
are only impacted to the extent the actual settlements under the contracts result in remitting a payment to or receiving a payment from the counterparty. Net settlements receivable (payable) associated with our derivative instruments totaled $48.1 million and $(7.8) million at December 31, 2014 and 2013, respectively.
For put options, we defer payment of the premium for the instrument. The deferred option premiums and accrued interest associated with put options totaled $210.4 million and $444.3 million at December 31, 2014 and 2013, respectively, which were included in our consolidated balance sheets as a reduction of the fair value of the put options.
Refer to Note 7 for further discussion on the fair value measurement of our derivative contracts.
As of December 31, 2014, we had the following outstanding crude oil option contracts, all of which settle monthly and cover approximately 30.7 million barrels of oil in 2015:
| 2015 Period |
Instrument |
Daily |
Average |
Weighted- |
Index | |||||
| January - December |
Put options (2) | 84,000 | $90.00 Floor with a $70.00 Limit | $ 6.889 | Brent |
| (1) | The average strike prices do not reflect any premiums to purchase the put options. |
| (2) | If the index price is less than the per barrel floor, we receive the difference between the per barrel floor and the index price up to a maximum of $20 per barrel less the option premium. If the index price is at or above the per barrel floor, we pay only the option premium. |
Balance Sheets
At December 31, 2014 and 2013, we had the following outstanding commodity derivative contracts recorded in our consolidated balance sheets (in thousands):
| Estimated Fair Value December 31, |
||||||||||
| Instrument Type |
Balance Sheet Classification |
2014 | 2013 | |||||||
| Crude oil puts |
Commodity derivative contracts - current assets (liabilities) | $ | 315,512 | $ | (194,988 | ) | ||||
| Natural gas swaps |
Commodity derivative contracts - current liabilities | — | (3,602 | ) | ||||||
| Crude oil puts |
Commodity derivative contracts - non-current liabilities | — | (114,516 | ) | ||||||
|
|
|
|
|
|||||||
| Total derivative instruments |
$ | 315,512 | $ | (313,106 | ) | |||||
|
|
|
|
|
|||||||
F-41
Table of Contents
Index to Financial Statements
The following table presents quantitative information about our commodity derivative contracts, all of which are offset in our consolidated balance sheets as of December 31, 2014 and 2013 (in thousands):
| Gross Amounts Recognized |
Gross Amounts Offset |
Net Amounts Presented in the Consolidated Balance Sheets |
Net Amount | |||||||||||||
| As of December 31, 2014 |
||||||||||||||||
| Assets |
$ | 315,512 | $ | — | $ | 315,512 | $ | 315,512 | ||||||||
| Liabilities |
— | — | — | — | ||||||||||||
|
|
|
|
|
|
|
|
|
|||||||||
| $ | 315,512 | $ | — | $ | 315,512 | $ | 315,512 | |||||||||
|
|
|
|
|
|
|
|
|
|||||||||
| As of December 31, 2013 |
||||||||||||||||
| Assets |
$ | — | $ | — | $ | — | $ | — | ||||||||
| Liabilities |
(313,106 | ) | — | (313,106 | ) | (313,106 | ) | |||||||||
|
|
|
|
|
|
|
|
|
|||||||||
| $ | (313,106 | ) | $ | — | $ | (313,106 | ) | $ | (313,106 | ) | ||||||
|
|
|
|
|
|
|
|
|
|||||||||
Statements of Operations
During the year ended December 31, 2014, and for the period from April 23, 2013, to December 31, 2013, net gains (losses) recognized in our consolidated statements of operations for commodity derivative transactions that were not designated as hedge transactions were as follows (in thousands):
| Year Ended December 31, 2014 |
April 23, 2013, to December 31, 2013 |
|||||||
| Oil |
$ | 512,322 | $ | (343,928 | ) | |||
| Gas |
(7,965 | ) | 9,726 | |||||
|
|
|
|
|
|||||
| $ | 504,357 | $ | (334,202 | ) | ||||
|
|
|
|
|
|||||
Credit Risk
We generally do not require collateral or other security to support derivative instruments subject to credit risk. However, the agreements with each of the counterparties to our derivative instruments contain netting provisions within the agreements. If a default occurs under the agreements, the non-defaulting party can offset the amount payable to the defaulting party under the derivative contracts with the amount due from the defaulting party. As a result of the netting provisions under the agreements, our maximum amount of loss due to credit risk is limited to the net amounts due from the counterparties under the derivative contracts. As of December 31, 2014, the maximum amount of credit exposure associated with derivative transactions was $364.2 million.
Contingent Features
As of December 31, 2014, the counterparties to our commodity derivative contracts consisted of seven financial institutions. In connection with the acquisition of PXP, FCX agreed to guarantee all of our obligations under our commodity derivative contracts. Therefore, we are not generally required to post additional collateral under our derivative agreements.
Certain of our derivative agreements contain cross-acceleration provisions relative to our debt agreements in excess of $175.0 million. If we were to default on any of these debt agreements, it would be a violation of these provisions, and the counterparties to our derivative agreements could request immediate payment on derivative instruments that are in a net liability position at that time. As of December 31, 2014, we were in a net asset position with all of the counterparties to our derivative instruments.
F-42
Table of Contents
Index to Financial Statements
Note 7 — Fair Value Measurements of Assets and Liabilities
Fair value accounting guidance includes a hierarchy that prioritizes the inputs to valuation techniques used to measure fair value. The hierarchy gives the highest priority to unadjusted quoted prices in active markets for identical assets or liabilities (Level 1 inputs), then to significant observable inputs (Level 2 inputs) and the lowest priority to unobservable inputs (Level 3 inputs).
We determine the appropriate fair-value level for each financial asset and liability on a quarterly basis and recognize any transfers at the end of the reporting period. During 2014, we did not have any transfers in or out of Level 1, 2 or 3.
A summary of the carrying amount and fair value amount of our financial instruments as of December 31, 2014 and 2013, follows (in thousands):
| At December 31, 2014 | ||||||||||||||||||||
| Carrying Amount |
Fair Value | |||||||||||||||||||
| Total | Level 1 | Level 2 | Level 3 | |||||||||||||||||
| Assets |
||||||||||||||||||||
| Current Assets: |
||||||||||||||||||||
| Cash and cash equivalents (1) |
$ | 2,116 | $ | 2,116 | $ | 2,116 | $ | — | $ | — | ||||||||||
| Crude oil puts (2) |
315,512 | 315,512 | — | — | 315,512 | |||||||||||||||
|
|
|
|
|
|
|
|
|
|
|
|||||||||||
| $ | 317,628 | $ | 317,628 | $ | 2,116 | $ | — | $ | 315,512 | |||||||||||
|
|
|
|
|
|
|
|
|
|
|
|||||||||||
| Liabilities |
||||||||||||||||||||
| Non-Current Liabilities: |
||||||||||||||||||||
| Other long-term debt (3) |
$ | 2,568,382 | $ | 2,583,822 | $ | — | $ | 2,583,822 | $ | — | ||||||||||
|
|
|
|
|
|
|
|
|
|
|
|||||||||||
| $ | 2,568,382 | $ | 2,583,822 | $ | — | $ | 2,583,822 | $ | — | |||||||||||
|
|
|
|
|
|
|
|
|
|
|
|||||||||||
| At December 31, 2013 | ||||||||||||||||||||
| Carrying Amount |
Fair Value | |||||||||||||||||||
| Total | Level 1 | Level 2 | Level 3 | |||||||||||||||||
| Assets |
||||||||||||||||||||
| Current Assets: |
||||||||||||||||||||
| Cash and cash equivalents (1) |
$ | 871 | $ | 871 | $ | 871 | $ | — | $ | — | ||||||||||
|
|
|
|
|
|
|
|
|
|
|
|||||||||||
| $ | 871 | $ | 871 | $ | 871 | $ | — | $ | — | |||||||||||
|
|
|
|
|
|
|
|
|
|
|
|||||||||||
| Liabilities |
||||||||||||||||||||
| Current Liabilities: |
||||||||||||||||||||
| Crude oil puts (2) |
$ | 194,988 | $ | 194,988 | $ | — | $ | — | $ | 194,988 | ||||||||||
| Natural gas swaps |
3,602 | 3,602 | — | 3,602 | — | |||||||||||||||
| Non-Current Liabilities: |
||||||||||||||||||||
| Other long-term debt (3) |
6,703,384 | 6,696,790 | — | 6,696,790 | — | |||||||||||||||
| Crude oil puts (2) |
114,516 | 114,516 | — | — | 114,516 | |||||||||||||||
|
|
|
|
|
|
|
|
|
|
|
|||||||||||
| $ | 7,016,490 | $ | 7,009,896 | $ | — | $ | 6,700,392 | $ | 309,504 | |||||||||||
|
|
|
|
|
|
|
|
|
|
|
|||||||||||
| (1) | Our cash and cash equivalents consist primarily of money market mutual funds and are classified as Level 1 under the fair value hierarchy. |
| (2) | Crude oil options are net of deferred premiums and accrued interest of $210.4 million and $444.3 million at December 31, 2014 and 2013, respectively. |
| (3) | Senior notes are classified as Level 2 under the fair value hierarchy as the inputs utilized for the measurement are quoted, unadjusted prices from over-the-counter markets. |
F-43
Table of Contents
Index to Financial Statements
The estimated fair value amounts of financial instruments have been determined using available market information and valuation methodologies described below.
The carrying value for cash and cash equivalents approximates fair value because of their short-term nature and generally negligible credit losses. Valuations utilizing techniques whose significant inputs are unobservable and require a significant degree of judgment are classified as Level 3 under the fair value hierarchy. Our revolving notes with FCX would have been classified as Level 3 under the fair value hierarchy as the variable interest rate does not reflect our entity-specific credit risk. The credit-adjusted fair value of our revolving notes with FCX is not practicable to estimate as we are not a publicly traded company and do not have a standalone credit rating.
The fair value of our crude oil put derivative instruments was estimated using an option pricing model, which uses various observable inputs, including Intercontinental Exchange Holdings, Inc. crude oil prices, volatilities, interest rates and contract terms. The fair value of our natural gas swap derivative instruments were estimated using a pricing model that has various observable inputs, including New York Mercantile Exchange price quotations, interest rates and contract terms (classified within Level 2 of the fair value hierarchy). We adjust the valuations for credit quality, using the counterparties’ credit quality for asset balances (which considers the impact of netting agreements on counterparty credit risk, including whether the position with the counterparty is a net asset or a net liability). For asset balances, we use the credit default swap value for counterparties when available or the spread between the risk-free interest rate and the yield on the counterparties’ publicly traded debt for similar maturities. Our crude oil puts are classified within Level 3 of the fair value hierarchy because the inputs used in the valuation model were not observable for substantially the full term of the instruments. The significant unobservable inputs used in the fair value measurement of the crude oil puts are implied volatilities and deferred premiums. Significant increases (decreases) in implied volatilities in isolation would result in a significantly higher (lower) fair value measurement. As of December 31, 2014, the implied volatilities for our crude oil puts ranged from 34 percent to 53 percent, with a weighted-average of 39 percent. The deferred premiums totaled a weighted-average of $6.89 per barrel at December 31, 2014.
The following table summarizes the changes in our most significant Level 3 instruments, crude oil put options, for the year ended December 31, 2014, and for the period from April 23, 2013, to December 31, 2013 (in thousands):
| Year Ended December 31, 2014 |
April 23, 2013, to December 31, 2013 |
|||||||
| Fair value at beginning of period |
$ | (309,504 | ) | $ | — | |||
| Fair value assumed in acquisitions |
— | (83,379 | ) | |||||
| Net realized losses |
(41,795 | ) (1) | (37,850 | ) (1) | ||||
| Net unrealized gains (losses) included in earnings related to assets and liabilities still held at the end of the period |
430,028 | (2) | (229,941 | ) (2) | ||||
| Settlement payments |
236,783 | (3) | 41,666 | (3) | ||||
|
|
|
|
|
|||||
| Fair value at end of period |
$ | 315,512 | $ | (309,504 | ) | |||
|
|
|
|
|
|||||
| (1) | Includes net realized losses of $40.7 million and $37.4 million recorded in revenues for the year ended December 31, 2014, and for the period from April 23, 2013, to December 31, 2013, respectively, and $1.1 million and $0.5 million of interest expense associated with the deferred premiums for the year ended December 31, 2014, and for the period from April 23, 2013, to December 31, 2013, respectively. |
| (2) | Includes unrealized gains of $431.7 million and unrealized losses of $227.7 million recorded in revenues for the year ended December 31, 2014, and for the period from April 23, 2013, to December 31, 2013, respectively, and $1.7 million and $2.3 million of interest expense associated with the deferred premiums for the year ended December 31, 2014, and for the period from April 23, 2013, to December 31, 2013, respectively. |
| (3) | Includes interest payments of $4.7 million and $0.5 million for the year ended December 31, 2014, and for the period from April 23, 2013, to December 31, 2013, respectively. |
F-44
Table of Contents
Index to Financial Statements
Note 8 — Asset Retirement Obligations
The following table reflects the changes in our ARO during the year ended December 31, 2014, and during the period from April 23, 2013, to December 31, 2013 (in thousands):
| Year Ended December 31, 2014 |
April 23, 2013, to December 31, 2013 |
|||||||
| Asset retirement obligations at beginning of period |
$ | 1,128,429 | $ | — | ||||
| Liabilities incurred in acquisition of PXP |
— | 740,768 | ||||||
| Liabilities incurred in acquisition of McMoRan |
— | 288,202 | ||||||
| Liabilities incurred in other acquisitions |
20,229 | — | ||||||
| Property dispositions |
(18,695 | ) | (3,312 | ) | ||||
| Settlements (1) |
(74,675 | ) | (62,968 | ) | ||||
| Change in estimate |
(2,181 | ) | 104,963 | (2) | ||||
| Accretion expense |
47,392 | 25,588 | ||||||
| Asset retirement additions |
29,230 | 35,188 | ||||||
|
|
|
|
|
|||||
| Asset retirement obligations at end of period |
$ | 1,129,729 | $ | 1,128,429 | ||||
|
|
|
|
|
|||||
| (1) | Settlements were primarily associated with our GOM properties. |
| (2) | Primarily associated with our GOM properties. |
Note 9 — Stock-Based and Other Compensation Plans
FCX grants equity awards, which may include restricted stock awards, restricted stock units (RSUs), share awards, performance units, performance shares, stock options and stock appreciation rights (SARs) on such terms and conditions as it may decide in its discretion, to our employees. Prior to May 31, 2013, and June 3, 2013, PXP and McMoRan, respectively, had outstanding equity awards which, upon the acquisitions of PXP and McMoRan by FCX, were either converted into awards based on shares of FCX common stock (Legacy Equity Awards) or vested and settled in shares of FCX common stock or cash. Additionally, FCX allocates stock-based compensation costs to us for a portion of the equity awards granted to FCX corporate personnel who provide services to us.
Upon an event constituting a change in control coupled with employee termination within one year of such change as defined in the FCX plans, and for a change in control as defined in PXP and McMoRan plans for Legacy Equity Awards, all unvested SARs and stock options will become immediately exercisable in full. In addition, in such an event, unless otherwise determined by FCX or employee agreement, generally all other awards will vest and all restrictions on such awards will lapse. FCX may, at its discretion, issue new shares or use treasury shares to satisfy vesting requirements.
F-45
Table of Contents
Index to Financial Statements
Stock-based compensation is charged to expense or capitalized based on the nature of the employee’s activities, and for the year ended December 31, 2014, and for the period from April 23, 2013, to December 31, 2013, was as follows (in thousands):
| Year Ended December 31, 2014 |
April 23, 2013, to December 31, 2013 |
|||||||
| Stock-based compensation included in: |
||||||||
| General and administrative |
$ | 31,078 | (1) | $ | 22,257 | |||
| Lease operating expenses |
6,601 | 8,713 | ||||||
| Capitalized to oil and natural gas properties |
23,131 | 12,979 | ||||||
|
|
|
|
|
|||||
| Total stock-based compensation including capitalization |
$ | 60,810 | $ | 43,949 | ||||
|
|
|
|
|
|||||
| (1) | Included $5.5 million of allocated stock-based compensation from FCX. |
Stock-based compensation charged to expense for the year ended December 31, 2014, and for the period from April 23, 2013, to December 31, 2013, was as follows (in thousands):
| Year Ended December 31, 2014 |
April 23, 2013, to December 31, 2013 |
|||||||
| Charged to expense |
$ | 37,679 | $ | 30,970 | ||||
| Tax benefit |
(14,284 | ) | (11,643 | ) | ||||
|
|
|
|
|
|||||
| $ | 23,395 | $ | 19,327 | |||||
|
|
|
|
|
|||||
At December 31, 2014, there was $58.5 million of total unrecognized compensation cost related to unvested stock-based compensation arrangements that is expected to be recognized over a weighted-average period of approximately 1.3 years.
Our stock-based compensation liability for Legacy Equity Awards at December 31, 2014, totaled $31.3 million, $17.0 million of which was included in other long-term liabilities, and at December 31, 2013, totaled $52.8 million, $19.8 million of which was included in other long-term liabilities. Our stock-based compensation liability for equity awards granted by FCX is included in amounts owed to our affiliates (refer to Note 4 for further discussion).
SARs. SAR grants generally vest ratably over three years and expire within five years after the date of grant. These awards are similar to stock options, but are settled in cash rather than in shares of FCX common stock and are classified as liability awards. The fair value for these awards is determined using the Black-Scholes-Merton option valuation method and remeasured at each reporting date until the date of settlement. Stock-based compensation is recognized on a straight-line basis over the vesting period.
Stock-settled RSUs. Stock-settled RSUs generally vest over periods ranging from three to five years of service and are classified as intercompany equity with FCX. Stock-settled RSUs represent the right to receive FCX common stock when vesting occurs. The fair value for these awards is based on the closing market price of FCX common stock on the date of grant. Stock-based compensation is recognized using the graded-vesting method over the vesting period.
Cash-settled RSUs. Cash-settled RSUs generally vest over periods ranging from three to five years of service and are classified as liability awards. Cash-settled RSUs represent the right to receive a cash payment derived from FCX common stock closing prices. The fair value for these awards is determined and remeasured using the closing market price of FCX common stock at each reporting date until the vesting date. Stock-based compensation is recognized using the graded-vesting method over the vesting period.
F-46
Table of Contents
Index to Financial Statements
Stock Options. Stock option grants generally vest ratably over periods ranging from one to four years of service, expire within ten years after the grant date and are classified as intercompany equity with FCX. Stock options represent the right to receive FCX common stock at specified exercise prices after vesting occurs. The fair value for these awards is determined using the Black-Scholes-Merton option valuation method on the date of grant. Stock-based compensation is recognized on a straight-line basis over the vesting period.
Other
Postretirement Benefits. As a result of the acquisition of McMoRan by FCX, we recorded liabilities for certain health care and life insurance benefits (Other Benefits) to retired employees. At December 31, 2014 and 2013, the benefit obligation associated with Other Benefits consisted of a current portion of $0.3 million and $0.4 million (included in other current liabilities), respectively, and a long-term portion of $3.6 million and $4.1 million (included in other long-term liabilities), respectively. We have the right to modify or terminate these benefits. Included in accumulated other comprehensive income are the following amounts that have not been recognized in net periodic benefit costs associated with the Other Benefits: unrecognized actuarial gains of $1.3 million ($0.8 million net of tax) and $0.6 million ($0.3 million net of tax) at December 31, 2014 and 2013, respectively; and unrecognized prior service costs of $0.5 million ($0.3 million net of tax) at December 31, 2014 and 2013. The total amount expected to be recognized into net periodic costs in 2015 associated with these prior service credits and actuarial gains and losses is not material to FCX O&G.
Defined Contribution Plans. We have two 401(k) defined contribution plans (PXP Plan and McMoRan Plan, respectively). We match 100 percent of an employee’s contribution (subject to certain limitations) for the PXP Plan and the McMoRan Plan. Additionally, we contribute amounts totaling either 4 percent or 10 percent of an employee’s pay, depending on a combination of an employee’s age and years of service for the McMoRan Plan. For the year ended December 31, 2014, and for the period from April 23, 2013, to December 31, 2013, we made contributions totaling $22.2 million and $10.7 million, respectively, to these defined contribution plans.
Note 10 — Income Taxes
Our taxable income or loss is included in the consolidated U.S. federal income tax returns filed by FCX. FCX and FCX O&G have not entered into a tax sharing agreement. The estimated annual effective tax rate and related income tax obligations reflected in these statements are calculated using the separate return method, under which income taxes are calculated as if FCX O&G was filing its own separate tax returns. As a result, certain net operating losses (and other tax attributes) are characterized as realized or generated by FCX O&G when the tax attributes may or may not have been utilized or generated in the consolidated FCX tax returns.
FCX does not settle cash tax liabilities among its subsidiaries. Therefore, current taxes reported under the separate return method are accounted for as either a capital contribution or a distribution. In addition, at the time of the acquisition of PXP by FCX, all the pre-merger tax attributes of PXP (primarily net operating loss and tax credit carryforwards) were transferred to FCX. The transfer of the deferred tax assets associated with these attributes are reflected in the consolidated statements of equity as a reduction of equity.
For the year ended December 31, 2014, and for the period from April 23, 2013, to December 31, 2013, our (loss) income before income taxes by location consisted of (in thousands):
| Year Ended December 31, 2014 |
April 23, 2013, to December 31, 2013 |
|||||||
| U.S. |
$ | (4,634,887 | ) | $ | 287,009 | |||
| Foreign |
(612 | ) | (87 | ) | ||||
|
|
|
|
|
|||||
| $ | (4,635,499 | ) | $ | 286,922 | ||||
|
|
|
|
|
|||||
F-47
Table of Contents
Index to Financial Statements
For the year ended December 31, 2014, and for the period from April 23, 2013, to December 31, 2013, our income tax (benefit) expense consisted of (in thousands):
| Year Ended December 31, 2014 |
April 23, 2013, to December 31, 2013 |
|||||||
| Current |
||||||||
| U.S. Federal |
$ | (42,336 | ) | $ | 44,529 | |||
| State |
13,543 | 18,788 | ||||||
|
|
|
|
|
|||||
| (28,793 | ) | 63,317 | ||||||
|
|
|
|
|
|||||
| Deferred |
||||||||
| U.S. Federal |
(827,442 | ) | 62,060 | |||||
| State |
(209,653 | ) | (37,930 | ) | ||||
|
|
|
|
|
|||||
| (1,037,095 | ) | 24,130 | ||||||
|
|
|
|
|
|||||
| $ | (1,065,888 | ) | $ | 87,447 | ||||
|
|
|
|
|
|||||
Our deferred income taxes at December 31, 2014 and 2013, consist of the tax effect of differences related to the timing of recognition of certain types of costs as follows (in thousands):
| December 31, | ||||||||
| 2014 | 2013 | |||||||
| Deferred Tax Assets |
||||||||
| Net operating loss carryforward |
$ | 386,122 | $ | 348,410 | ||||
| Asset retirement obligations |
154,242 | 151,263 | ||||||
| Derivative contracts, stock-based compensation and other |
118,358 | 213,804 | ||||||
| Debt fair value adjustments |
97,626 | 278,948 | ||||||
|
|
|
|
|
|||||
| Deferred tax assets |
756,348 | 992,425 | ||||||
| Valuation allowance |
(5,488 | ) | (27,068 | ) | ||||
|
|
|
|
|
|||||
| Net Deferred Tax Asset |
$ | 750,860 | $ | 965,357 | ||||
|
|
|
|
|
|||||
| Deferred Tax Liabilities |
||||||||
| Derivative contracts |
$ | (120,518 | ) | $ | — | |||
| Net oil and gas acquisition, exploration and development operations and other |
(3,392,026 | ) | (4,721,810 | ) | ||||
|
|
|
|
|
|||||
| Deferred Tax Liability |
(3,512,544 | ) | (4,721,810 | ) | ||||
|
|
|
|
|
|||||
| Net Deferred Tax Liability |
$ | (2,761,684 | ) | $ | (3,756,453 | ) | ||
|
|
|
|
|
|||||
| Current Asset |
$ | 4,044 | $ | 130,087 | ||||
| Current Liability |
(2,250 | ) | — | |||||
| Long-term Liability |
(2,763,478 | ) | (3,886,540 | ) | ||||
|
|
|
|
|
|||||
| Net Deferred Tax Liability |
$ | (2,761,684 | ) | $ | (3,756,453 | ) | ||
|
|
|
|
|
|||||
F-48
Table of Contents
Index to Financial Statements
Tax carryforwards at December 31, 2014, which are available for future utilization on income tax returns, are as follows (in thousands):
| Amount | Expiration | |||||||
| Federal - FCX O&G and Consolidated Subsidiaries |
||||||||
| Net operating loss - regular tax |
$ | 704,616 | 2023 - 2034 | |||||
| Net operating loss - alternative minimum tax |
784,765 | 2022 - 2034 | ||||||
| Federal - Plains Offshore |
||||||||
| Net operating loss - regular tax |
$ | 316,801 | 2031 - 2034 | |||||
| Net operating loss - alternative minimum tax |
105,340 | 2031 - 2034 | ||||||
| State - FCX O&G and Consolidated Subsidiaries |
||||||||
| Net operating loss |
$ | 551,135 | 2015 - 2034 | |||||
Set forth below is a reconciliation between the income tax (benefit) expense computed at the U.S. federal statutory rate to FCX O&G’s effective tax rate for the year ended December 31, 2014, and for the period from April 23, 2013, to December 31, 2013 (in thousands):
| Year Ended December 31, 2014 |
April 23, 2013, to December 31, 2013 |
|||||||||||||||
| Amount | Percent | Amount | Percent | |||||||||||||
| U.S. federal statutory tax rate |
$ (1,622,425 | ) | 35 | % | $ | 100,423 | 35 | % | ||||||||
| State income taxes, net of federal benefit |
(127,474 | ) (1) | 3 | (12,442 | ) (2) | (4 | ) | |||||||||
| Goodwill impairment |
600,800 | (13 | ) | — | — | |||||||||||
| Proceeds from sale of Eagle Ford shale assets charged to goodwill |
77,270 | (2 | ) | — | — | |||||||||||
| Other items, net |
5,941 | — | (534 | ) | (1 | ) | ||||||||||
|
|
|
|
|
|
|
|
|
|||||||||
| Income tax (benefit) expense on (loss) income before income taxes |
$ (1,065,888 | ) | 23 | % | $ | 87,447 | 30 | % | ||||||||
|
|
|
|
|
|
|
|
|
|||||||||
| (1) | Includes a net benefit of $56.7 million related to changes in U.S. state income tax filing positions. |
| (2) | Includes a net benefit of $16.3 million related to the revaluation of state deferred tax liabilities as a result of the acquisition of McMoRan by FCX. |
Tax Relationship with Plains Offshore. As of December 31, 2014 and 2013, Plains Offshore was not consolidated with FCX or FCX O&G for U.S. federal income tax purposes. Plains Offshore files a separate U.S. federal tax return and has its own U.S. federal tax loss carryforwards and other tax attributes. Plains Offshore may or may not be combined with us and our other subsidiaries for state tax filing purposes dependent upon the applicable state tax rules. FM O&G and Plains Offshore have entered into a Tax Matters Agreement (TMA) which governs Plains Offshore’s and our respective rights, responsibilities, and obligations with respect to the filing of tax returns, payment of taxes, conduct of tax audits and certain other tax matters.
Under the TMA, Plains Offshore is obligated to reimburse us for its share of taxes that are paid by us and can receive payment from us for any of Plains Offshore’s tax attributes utilized by us related to our tax returns filed on a consolidated, combined or unitary basis including Plains Offshore but only to the extent and at such time as Plains Offshore would have paid the tax or utilized such attributes on a separate return basis. To the extent Plains Offshore files tax returns which are not consolidated, combined or unitary with us, Plains Offshore pays its tax liabilities directly to the applicable taxing authority.
Tax Loss and Credit Carryovers. Certain of our U.S. and state tax loss and credit carryovers are, or may become, subject to federal or state income tax limitations as to the amount that can be used each year. We do not expect these limitations to materially impact our ability to utilize these losses.
F-49
Table of Contents
Index to Financial Statements
Valuation Allowance. In assessing the realizability of deferred tax assets, we consider whether it is more likely than not that some portion or all of the related deferred tax benefits will not be realized. We consider the scheduled reversal of deferred tax assets, projected future income and tax planning strategies in making the assessment of whether it is more likely than not that some portion or all of our deferred tax assets will not be realized. Based on this assessment as of December 31, 2014 and 2013, we had valuation allowances of approximately $5.5 million and $27.1 million, respectively, related to deferred state tax assets. The $21.6 million decrease in the valuation allowance during the year ended December 31, 2014, was primarily the result of a decrease in state net operating loss carryforwards.
Tax Uncertainties. We account for uncertain income tax positions using a threshold and measurement criteria for the financial statement recognition and measurement of a tax position taken or expected to be taken in a tax return. Our policy associated with uncertain tax positions is to record accrued interest in interest expense and accrued penalties in other income and expenses rather than in the provision for income taxes. As of December 31, 2014 and 2013, we had no material uncertain tax liabilities.
FCX O&G is included in FCX’s 2013 U.S. federal income tax return, which is currently under examination by the Internal Revenue Service (IRS). Prior to the merger with FCX, PXP and McMoRan filed income tax returns in the U.S. federal and various state and foreign jurisdictions. As of December 31, 2014, except as discussed below, neither PXP nor McMoRan are under examination by the IRS. PXP is no longer subject to U.S. federal income tax examinations for years prior to 2007 except for certain tax credit carryforwards generated before 2007, but utilized after 2006. McMoRan is no longer subject to U.S. federal income tax examinations for years prior to 2010, except for certain net operating loss carryforwards. In October 2013, the IRS conducted a limited scope review of certain elements of PXP’s 2008, 2009 and 2010 tax returns. As a part of that review, we agreed to an extension of the statute of limitations for both the 2008 and 2009 PXP tax years until December 2015.
PXP is currently under audit by the state of California with regard to its 2007 and 2008 California income tax returns. Fieldwork on this audit was completed in 2013, and these tax periods are currently subject to ongoing appeals procedure with the state of California. Neither PXP nor McMoRan are currently under examination in any other state. In all states except California and Louisiana, neither PXP nor McMoRan are subject to state income tax examinations by the relevant tax authorities for years prior to 2010. For California, PXP is no longer subject to state income tax examinations for years prior to 2007 except for certain California tax loss and credit carryforwards generated before 2007, but utilized after 2006. For Louisiana, PXP and McMoRan are no longer subject to state income tax examinations for years prior to 2010 except for certain Louisiana tax loss carryforwards generated before 2009, but utilized after 2008.
Note 11 — Commitments, Contingencies and Industry Concentration
Commitments and Contingencies
Operating Leases. Our operating leases relate primarily to obligations associated with office facilities. Future non-cancellable commitments related to these leases are as follows (in thousands):
| 2015 |
$ | 20,568 | ||
| 2016 |
22,645 | |||
| 2017 |
23,082 | |||
| 2018 |
17,321 | |||
| 2019 |
5,267 | |||
| Thereafter |
16,724 | |||
|
|
|
|||
| $ | 105,607 | |||
|
|
|
F-50
Table of Contents
Index to Financial Statements
Total expenses related to such leases were $26.2 million and $15.1 million in the year ended December 31, 2014, and for the period from April 23, 2013, to December 31, 2013, respectively.
Contractual Obligations. We have entered into various commitments and operating agreements associated with, among other things, oil and natural gas exploration, development and production activities, gathering and transportation, drilling rig and oilfield and other services. At December 31, 2014, aggregate future obligations under these agreements, described below, total $2.6 billion, with approximately $1.2 billion in 2015, $778.2 million in 2016, $518.7 million in 2017, $32.0 million in 2018, $27.5 million in 2019 and $92.7 million thereafter.
We have contracted with an affiliate of Noble Corporation for the Noble Sam Croft and Noble Tom Madden new-build drillships that support our Deepwater GOM drilling activity, which are included in our contractual obligations. The drillship contracts for the Noble Sam Croft and the Noble Tom Madden each provide for firm three-year commitments, which began in the third and fourth quarters of 2014, respectively, at rates of $0.6 million per day. Such rates are subject to standard reimbursement and contractual escalation provisions. The drillship contracts each required us to pay $24.1 million for mobilization.
We also contracted for an existing drillship assigned to us from a third party, which further supported our Deepwater GOM drilling activity. The drillship contract provided for an assignment period, including mobilization, from May 2014 through its release in February 2015 at rates of $0.6 million per day.
In May 2014, we contracted with an affiliate of Rowan Companies plc for the Rowan Relentless new-build drillship that will support our Deepwater GOM drilling activity. The drillship contract for the Rowan Relentless provides for a firm two-year commitment that commenced in June 2015 at a rate of approximately $0.6 million per day. Such rates are subject to standard reimbursement and contractual provisions.
Through our recent acquisition of an interest in the Vito oil discovery, located in the Deepwater GOM, we joined the Vito working interest partners in their unit participation and unit operating agreement. Per the agreements, we have a commitment, in addition to our aggregate future contractual obligations, to share in our portion of certain remaining costs under the exploration plan for exploratory drilling, long-lead equipment orders and detailed engineering work, which totaled $125.4 million at December 31, 2014.
Through our recent acquisition of an interest in the Heidelberg oil field, located in the Deepwater GOM, we joined the Heidelberg working interest partners in their unit participation and unit operating agreement. As a result, we have entered into various agreements with guaranteed fixed minimum monthly fees for long-term oil transportation services with third parties at Heidelberg totaling $43.9 million over the period 2016 through 2028. Per the agreements, we have a commitment, in addition to our aggregate future contractual obligations, to share in our portion of certain remaining costs under the development plan for construction and installation of the production facility and subsea infrastructure, long-lead equipment orders and detailed engineering work, which totaled $80.4 million at December 31, 2014.
Through our ownership in Lucius, located in the Deepwater GOM, we joined the Lucius and Hadrian working interest partners and executed a unit participation and unit operating agreement effective June 1, 2011. As part of the agreements, we have agreed to share in our portion of certain costs for construction and installation of the production facility and subsea infrastructure, long-lead equipment orders and detailed engineering work and have a commitment, in addition to our aggregate future contractual obligations, which totaled $37.7 million at December 31, 2014.
We entered into various agreements with third parties totaling $206.1 million for long-term oil and natural gas gathering and transportation services at the Lucius oil field. In 2014, we began paying guaranteed fixed minimum monthly fees and will pay additional variable gathering fees based upon actual throughput.
F-51
Table of Contents
Index to Financial Statements
In December 2014, we terminated certain of our drilling rig rental agreements and incurred $27.8 million in associated charges, which was recognized in other operating expense in our consolidated statements of operations.
Offshore Morocco Exploration. We have executed, with Pura Vida Energy, a farm-in arrangement in exploration blocks located in the Mazagan permit area offshore Morocco. We are operator of the permit area and have agreed to fund 100 percent of defined exploration activities in exchange for a 52 percent working interest. Our agreement to fund the exploration activities includes a commitment to fund and drill two wells, subject to a maximum carry commitment of $215.0 million (excluding a $15.0 million payment to farm-in to Pura Vida Energy’s working interest). Office Nationale des Hydrocarbures et des Mines, the Moroccan national oil company, holds a 25 percent working interest and is carried for defined exploration work throughout the exploration phase of the permits. The exploration area covers 2.2 million gross acres in water depths of 4,500 to 9,900 feet. The exploration permits covering our Morocco acreage expire in 2016; however, we have the ability to extend the exploration permits through 2019.
In February 2014, we entered into a rig share agreement with Kosmos Energy Ventures for the use of a drillship to drill two planned wells in the Mazagan permit area offshore Morocco. Under the rig share agreement, two slots have been assigned to us at a rate of approximately $0.7 million per day (included within our maximum carry commitment with Pura Vida Energy). Drilling commenced for the first of these slots in May 2015. The second slot is expected to commence drilling in late 2015 or early 2016. The rig share agreement further requires us to pay a proportionate share of rig mobilization and demobilization fees, as well as other costs incidental to the preparation, testing and operation of the drillship.
Environmental Matters. As an owner or lessee and operator of oil and natural gas properties, we are subject to various federal, state and local laws and regulations relating to discharge of materials into, and protection of, the environment. Often these regulations are more stringent on older properties that were operated before the regulations came into effect such as some of our properties in California that have operated for over 100 years. We have established policies for continuing compliance with environmental laws and regulations. We also maintain insurance coverage for environmental matters which we believe is customary in the industry, but we are not fully insured against all environmental risks. There can be no assurance that current or future local, state or federal rules and regulations will not require us to spend material amounts to comply with such rules and regulations. At December 31, 2014 and 2013, we had no known environmental obligations for which accruals would be necessary.
Surety and Oil Spill Financial Responsibility Requirements. As a lessee in the Deepwater GOM, we must comply with regulations set forth by the BOEM and the Bureau of Safety and Environmental Enforcement (BSEE), (together BOEM/BSEE), and hold any bonds, or provide the financial assurances, required for our leases in federal waters. To cover the various obligations of lessees in federal waters, the BOEM/BSEE generally requires that lessees have substantial U.S. assets and net worth or post bonds or other acceptable assurances that such obligations will be met. We are subject to the following types of surety requirements with BOEM: (i) general lessee or operator’s bonds required to accept title to any lease in federal waters, (ii) supplemental bonding, which is required to be provided by all lessees and specifically covers the plugging and abandonment obligations associated with a lease, and (iii) oil spill financial responsibility, generally provided by operators pursuant to the Oil Pollution Act of 1990 as amended (OPA). The OPA imposes a variety of requirements related to the prevention of and response to oil spills into waters of the U.S., including the Outer Continental Shelf, which includes the GOM. The OPA subjects operators of offshore leases and owners and operators of oil handling facilities to strict joint and several liability for all containment and cleanup costs and certain other damages arising from a spill, including, but not limited to, the costs of responding to a release of oil, natural resource damages, and economic damages suffered by persons adversely affected by an oil spill. The OPA also requires owners and operators of offshore oil production facilities to establish and maintain evidence of financial responsibility to cover costs that could be incurred in responding to an oil spill. The OPA currently requires a minimum financial responsibility demonstration of $35 million for companies operating oil production facilities on the Outer Continental Shelf, although the Secretary of Interior may increase this amount up to $150 million in certain situations. The cost of these bonds or other surety could be substantial and there is no assurance that bonds or other surety could be obtained in all cases.
F-52
Table of Contents
Index to Financial Statements
Plugging, Abandonment and Remediation Obligations. Consistent with normal industry practices, substantially all of our oil and natural gas leases require that, upon termination of economic production, the working interest owners plug and abandon non-producing wellbores, remove platforms, tanks, production equipment and flow lines and restore the wellsite. Typically, when producing oil and natural gas assets are purchased, the purchaser assumes the obligation to plug and abandon wells and facilities that are part of such assets. However, in some instances, we have received an indemnity with respect to those costs. We cannot be assured that we will be able to collect on these indemnities.
Third parties have retained the majority of the obligations for abandoning these acquired properties, which include the Point Arguello Unit, offshore California, where the companies from which we purchased our interests retained responsibility for: (1) removing, dismantling and disposing of the existing offshore platforms; (2) removing and disposing of all existing pipelines; and (3) removing, dismantling, disposing and remediating all existing onshore facilities. We are responsible for our 69.3 percent share of other abandonment costs which primarily consist of well bore abandonments, conductor removals and site cleanup and restoration.
In connection with the sale of certain properties offshore California in 2004, we have the responsibility for certain abandonment costs, including removing, dismantling and disposing of the 11 existing offshore platforms. The present value of such abandonment costs at December 31, 2014, $107.4 million ($162.7 million undiscounted), was included in our ARO. In addition, we guarantee the performance of the purchaser with respect to the remaining abandonment obligations related to the properties ($84.3 million). To secure its abandonment obligations, the purchaser of the properties is required to periodically deposit funds into an escrow account. At December 31, 2014, the escrow account had a balance of $27.0 million. The fair value of our guarantee at December 31, 2014, ($0.5 million) considered the payment/performance risk of the purchaser and was included in other long-term liabilities in our consolidated balance sheet.
In connection with McMoRan’s August 2007 acquisition of certain properties in the GOM Shelf from Newfield Exploration Company (Newfield), McMoRan assumed and agreed to indemnify Newfield from certain potential obligations, including environmental obligations, by establishing an escrow fund. Subsequent to the acquisition of McMoRan by FCX, FCX O&G reached an agreement with Newfield to terminate this escrow requirement upon guarantee of these potential obligations by FCX, and in December 2013, Newfield terminated its escrow funding requirement. In June 2014, the escrow account was closed, and we received the remaining balance of $19.8 million.
Operating Risks and Insurance Coverage. Our operations are subject to all of the risks normally incident to the exploration for and the production of oil and natural gas, including well blowouts, cratering, explosions, oil spills, releases of gas or well fluids, fires, pollution and releases of toxic gas, each of which could result in damage to or destruction of oil and natural gas wells, production facilities or other property or injury to persons. Our operations in California, including transportation of oil by pipelines within the city and county of Los Angeles, are especially susceptible to damage from earthquakes and involve increased risks of personal injury, property damage and marketing interruptions because of the population density of southern California. We maintain coverage for earthquake damages in California but this coverage may not provide for the full effect of damages that could occur and we may be subject to additional liabilities. Although we maintain insurance coverage considered to be customary in the industry, we are not fully insured against all risks, either because insurance is not available or because of high premium costs. We are self-insured for named windstorms in the GOM. The occurrence of a significant event that is not fully insured against could have a material adverse effect on our financial position. Our insurance does not cover every potential risk associated with operating our pipelines, including the potential loss of significant revenues. Consistent with insurance coverage generally available to the industry, our insurance policies provide limited coverage for losses or liabilities relating to pollution resulting from sudden and accidental occurrences.
In the event we make a claim under our insurance policies, we will be subject to the credit risk of the insurers. Volatility and disruption in the financial and credit markets may adversely affect the credit quality of our insurers and impact their ability to pay out claims.
F-53
Table of Contents
Index to Financial Statements
Guarantee of FCX’s Senior Notes. On May 31, 2013, FM O&G agreed to fully and unconditionally guarantee on a senior basis both jointly and severally, FCX’s outstanding $500.0 million of 2.15% Senior Notes due 2017, $1.5 billion of 2.375% Senior Notes due 2018, $1.0 billion of 3.100% Senior Notes due 2020, $2.0 billion of 3.55% Senior Notes due 2022, $2.0 billion of 3.875% Senior Notes due 2023 and $2.0 billion of 5.450% Senior Notes due 2043.
On November 14, 2014, FM O&G agreed to fully and unconditionally guarantee on a senior basis both jointly and severally, FCX’s outstanding $750.0 million of 2.30% Senior Notes due 2017, $600.0 million of 4.00% Senior Notes due 2021, $850.0 million of 4.55% Senior Notes due 2024 and $800.0 million of 5.40% Senior Notes due 2034. The guarantee is an unsecured obligation of the guarantor and ranks equal in right of payment with all existing and future indebtedness of FM O&G, including indebtedness under the FCX Revolving Credit Facility. The guarantee ranks senior in right of payment with all of FM O&G’s future subordinated obligations and is effectively subordinated in right of payment to any debt of FM O&G’s subsidiaries. In the future, FM O&G’s guarantee may be released or terminated for certain obligations under the following circumstances: (i) all or substantially all of the equity interests or assets of FM O&G are sold to a third party; or (ii) FM O&G no longer has any obligations under any FM O&G senior notes or any refinancing thereof and no longer guarantees any obligations of (and is no longer a co-borrower under) FCX under the FCX Revolving Credit Facility, the Term Loan or any other senior debt.
At December 31, 2014 and 2013, we had not recorded any liabilities associated with these guarantees.
Other Commitments and Contingencies. We are a defendant in various lawsuits arising in the ordinary course of our business. While the outcome of these lawsuits cannot be predicted with certainty and could have a material adverse effect on our financial position, we do not believe that the outcome of these legal proceedings, individually or in the aggregate, will have a material adverse effect on our financial condition.
Industry Concentration
Financial instruments that potentially subject us to concentrations of credit risk consist principally of accounts receivable with respect to our oil and natural gas operations and commodity derivative instruments. For the year ended December 31, 2014, sales to Phillips 66 Company represented approximately 61 percent of total revenues. For the period from April 23, 2013, to December 31, 2013, sales to Phillips 66 Company, Shell Trading (US) Company and Flint Hills Resources, LP represented approximately 55 percent, 11 percent and 10 percent, respectively, of total revenues.
Note 12 — Supplemental Cash Flow Information
Cash payments for interest and income taxes for the year ended December 31, 2014, and for the period from April 23, 2013, to December 31, 2013, were as follows (in thousands):
| Year Ended December 31, 2014 |
April 23, 2013, to December 31, 2013 |
|||||||
| Cash payments for interest (net of capitalized interest) |
$ | 365,245 | $ | 231,492 | ||||
| Cash payments for income taxes |
32,500 | 12,057 | ||||||
Noncash additions to oil and gas properties of $28.6 million for the year ended December 31, 2014, related to our ARO. Noncash additions to oil and gas properties of $1.1 billion for the period from April 23, 2013, to December 31, 2013, related to our ARO, which were attributable to the acquisitions of PXP and McMoRan by FCX.
At December 31, 2014 and 2013, accrued capital expenditures included in accounts payable in our consolidated balance sheets were $706.1 million and $340.5 million, respectively.
F-54
Table of Contents
Index to Financial Statements
The merger of PXP into FM O&G and the contribution of McMoRan by FCX were noncash transactions of $6.6 billion and $3.1 billion, respectively, in 2013. Subsequent to the merger of PXP, but prior to the contribution of McMoRan by FCX in 2013, we distributed our investment in McMoRan ($779.3 million, net of deferred tax liabilities) to FCX in a noncash transaction.
Note 13 — Subsequent Events
FCX – Revolving Note. In February 2015, our borrowing capacity under the FCX revolving notes was increased from $8.0 billion to $9.0 billion, with all other terms and conditions remaining the same.
FCX Revolving Credit Facility and Term Loan. In February 2015, the FCX Revolving Credit Facility and Term Loan were modified to amend the maximum total leverage ratio. In addition, the Term Loan amortization schedule was extended such that, as amended, the Term Loan’s scheduled payments total $204.6 million in 2016, $272.0 million in 2017, $1.0 billion in 2018, $313.5 million in 2019 and $1.3 billion in 2020, compared with the previous amortization schedule of $650.0 million in 2016, $200.0 million in 2017 and $2.2 billion in 2018.
Plains Offshore Dividend. During the three months ended March 31, 2015, Plains Offshore declared quarterly dividends on the original and secondary issuances of Preferred Stock of $10.1 million, or $21.36 per share for the original issuance and $20.36 per share for the secondary issuance ($15.00 per share was paid in cash, with the remaining dividend payments deferred).
In May 2015, Plains Offshore declared quarterly dividends on the original and secondary issuances of Preferred Stock of $10.2 million, or $21.49 per share for the original issuance and $20.47 per share for the secondary issuance ($15.00 per share was paid in cash, with the remaining dividend payments deferred).
Impairment of Oil and Gas Properties. At March 31, 2015, the net capitalized costs with respect to our U.S. oil and gas properties exceeded the related ceiling; therefore, an impairment charge of $3.1 billion was recorded in the first quarter of 2015, primarily because of the lower twelve-month average of the first-day-of-the-month historical reference oil price and higher capitalized costs at March 31, 2015. The SEC requires that the twelve-month average of the first-day-of-the-month historical reference oil price be used in determining the ceiling amount under its full cost accounting rules. The price (using WTI as the reference oil price) was $82.72 per barrel at March 31, 2015 (the twelve-month average was $94.99 per barrel at December 31, 2014).
Because the ceiling limitation uses a twelve-month historical average price, if WTI oil prices remain below the twelve-month average of $82.72 per barrel, the ceiling limitation will decrease, resulting in potentially significant additional ceiling test impairments of our oil and gas properties during the remainder of 2015. The twelve-month average WTI oil price was $71.68 per barrel at June 1, 2015.
Inboard Lower Tertiary Farthest Gate – Dry Hole. In May 2015, we completed our assessment of the Farthest Gate West well and commenced plug and abandonment activities. Accordingly, the well costs and leasehold costs of approximately $120.1 million as of March 31, 2015, and subsequent well costs and plug and abandonment activities incurred will be transferred to the full cost pool in the second quarter of 2015. No proved reserves were identified.
We have evaluated subsequent events after December 31, 2014, and through June 23, 2015, the date the financial statements were issued, and determined any events or transactions occurring during this period that would require recognition or disclosure are appropriately addressed in these financial statements.
Note 14 — Oil and Natural Gas Activities (Unaudited)
Oil and gas activities commenced on June 1, 2013, following FCX’s acquisition of PXP on May 31, 2013. FCX acquired McMoRan and contributed it to us on June 3, 2013. McMoRan’s results are included beginning June 4, 2013.
F-55
Table of Contents
Index to Financial Statements
Costs Incurred
The following table summarizes the costs incurred for our oil and natural gas acquisition, exploration and development activities during the year ended December 31, 2014, and for the period from April 23, 2013, to December 31, 2013 (in thousands):
| Year Ended December 31, 2014 |
April 23, 2013, to December 31, 2013 |
|||||||
| Property acquisition costs |
||||||||
| Proved properties |
$ | 463,251 | $ | 12,204,601 | (1) | |||
| Unproved properties |
1,460,052 | 11,259,095 | (2) | |||||
| Exploration costs |
1,481,637 | 501,912 | ||||||
| Development costs |
1,270,123 | 854,209 | ||||||
|
|
|
|
|
|||||
| $ | 4,675,063 | $ | 24,819,817 | |||||
|
|
|
|
|
|||||
| (1) | Includes $12.2 billion from the acquisitions of PXP and McMoRan. |
| (2) | Includes $11.1 billion from the acquisitions of PXP and McMoRan. |
These amounts included changes in ARO of $(27.5) million in 2014 and $1.1 billion for the period from April 23, 2013, to December 31, 2013 (including $1.0 billion assumed in the acquisitions of PXP and McMoRan); capitalized general and administrative expense of $143.0 million in 2014 and $67.1 million for the period from April 23, 2013, to December 31, 2013; and capitalized interest of $87.4 million in 2014 and $68.9 million for the period from April 23, 2013, to December 31, 2013.
Capitalized Costs
The following table presents the aggregate capitalized costs subject to amortization relating to our oil and natural gas acquisition, exploration and development activities and the aggregate related accumulated DD&A as of December 31, 2014 and 2013 (in thousands):
| December 31, | ||||||||
| 2014 | 2013 | |||||||
| Properties subject to amortization |
$ | 16,547,266 | $ | 13,828,664 | ||||
| Accumulated DD&A and impairment |
(7,359,719 | )(1) | (1,357,359 | ) | ||||
|
|
|
|
|
|||||
| $ | 9,187,547 | $ | 12,471,305 | |||||
|
|
|
|
|
|||||
| (1) | Includes $3.7 billion of impairment charges. Refer to Note 1 for further discussion. |
Our average DD&A rate per barrel of oil equivalent (BOE) was $39.74 (excluding impairment charges) during the year ended December 31, 2014, and $35.54 for the period from April 23, 2013, to December 31, 2013.
F-56
Table of Contents
Index to Financial Statements
Costs Not Subject to Amortization
The following table summarizes the categories of costs comprising the amount of unproved properties not subject to amortization by the year in which such costs were incurred (in thousands):
| Total | Year Ended December 31, 2014 |
April 23, 2013, to December 31, 2013 |
||||||||||
| U.S. |
||||||||||||
| Onshore |
||||||||||||
| Acquisition costs |
$ | 2,303,537 | $ | 18,224 | $ | 2,285,313 | ||||||
| Exploration costs |
121,637 | 119,141 | 2,496 | |||||||||
| Capitalized interest |
26,354 | 21,819 | 4,535 | |||||||||
| Offshore |
||||||||||||
| Acquisition costs |
7,093,000 | 1,412,821 | 5,680,179 | |||||||||
| Exploration costs |
428,872 | 386,559 | 42,313 | |||||||||
| Capitalized interest |
75,257 | 39,430 | 35,827 | |||||||||
| International |
||||||||||||
| Offshore |
||||||||||||
| Acquisition costs |
15,000 | — | 15,000 | |||||||||
| Exploration costs |
23,280 | 23,008 | 272 | |||||||||
| Capitalized interest |
— | — | — | |||||||||
|
|
|
|
|
|
|
|||||||
| $ | 10,086,937 | $ | 2,021,002 | $ | 8,065,935 | |||||||
|
|
|
|
|
|
|
|||||||
We anticipate that 48 percent of the costs not subject to amortization at December 31, 2014, will be transferred to the amortization base over the next five years and the majority of the remainder in the next seven to ten years. The timing of these transfers into our amortization base will impact our full cost ceiling test and our DD&A rate.
Approximately 35 percent of the total U.S. net undeveloped acres is covered by leases that expire from 2015 to 2017. As a result of the decrease in crude oil prices, our current plans anticipate that the majority of the expiring acreage will not be retained by drilling operations or other means. The exploration permits covering our Morocco acreage expire in 2016; however, we have the ability to extend the exploration permits through 2019. Over 95 percent of the acreage in the Haynesville shale play in Louisiana is currently held by production or held by operations.
Results of Operations for Oil and Gas Producing Activities
Our results of operations from oil and gas producing activities for the year ended December 31, 2014, and for the period from April 23, 2013, to December 31, 2013, presented below exclude non-oil and gas revenues, general and administrative expense, goodwill impairment, interest expense and interest income. Income tax benefit (expense) was determined by applying the statutory rates to pre-tax operating results (in thousands):
| Year Ended December 31, 2014 |
April 23, 2013, to December 31, 2013 |
|||||||
| Revenues from oil and gas producing activities |
$ | 4,709,706 | $ | 2,615,966 | ||||
| Production and delivery costs |
(1,236,733 | ) | (682,369 | ) | ||||
| DD&A |
(2,265,079 | ) | (1,357,359 | ) | ||||
| Impairment of oil and gas properties |
(3,737,281 | ) | — | |||||
| Income tax benefit (expense) (based on our statutory tax rate) |
958,890 | (216,418 | ) | |||||
|
|
|
|
|
|||||
| Results of operations from producing activities |
$ | (1,570,497 | ) | $ | 359,820 | |||
|
|
|
|
|
|||||
F-57
Table of Contents
Index to Financial Statements
Proved Oil and Natural Gas Reserve Information
The following information summarizes the net proved reserves of oil (including condensate and natural gas liquids (NGLs)) and natural gas and the standardized measure as described below. All of our oil and natural gas reserves are located in the U.S.
Management believes the reserve estimates presented herein are reasonable and prepared in accordance with guidelines established by the SEC as prescribed in Regulation S-X, Rule 4-10. However, there are numerous uncertainties inherent in estimating quantities and values of proved reserves and in projecting future rates of production and the amount and timing of development expenditures, including many factors beyond our control. Reserve engineering is a subjective process of estimating the recovery from underground accumulations of oil and natural gas that cannot be measured in an exact manner, and the accuracy of any reserve estimate is a function of the quality of available data and of engineering and geological interpretation and judgment. Because all oil and natural gas reserve estimates are to some degree subjective, the quantities of oil and natural gas that are ultimately recovered, production and operating costs, the amount and timing of future development expenditures and future crude oil and natural gas sales prices may all differ from those assumed in these estimates. In addition, different reserve engineers may make different estimates of reserve quantities and cash flows based upon the same available data. Therefore, the standardized measure of discounted future net cash flows (Standardized Measure) shown below represents estimates only and should not be construed as the current market value of the estimated reserves attributable to our oil and gas properties. In this regard, the information set forth in the following tables includes revisions of reserve estimates attributable to proved properties acquired from PXP and McMoRan, and reflect additional information from subsequent development activities, production history of the properties involved and any adjustments in the projected economic life of such properties resulting from changes in product prices.
Historically, the market price for California crude oil differs from the established market indices in the U.S. primarily because of the higher transportation and refining costs associated with heavy oil. In recent years, California market prices had strengthened substantially against these indices, primarily due to increasing world demand and declining domestic supplies of both Alaska and California crude oil. This trend has reversed of late, however, because of increasing production from U.S. shale plays and other non-Organization of the Petroleum Exporting Countries, low refinery utilization and high West Coast inventory levels. Approximately 39 percent of our oil and natural gas reserve volumes are attributable to properties in California where differentials to the reference prices have been volatile as a result of these factors.
The market price for GOM crude oil differs from WTI as a result of a large portion of our production being sold under a Heavy Louisiana Sweet based pricing. Approximately 35 percent of our December 31, 2014, oil and natural gas reserve volumes are attributable to properties in the GOM where oil price realizations are generally higher because of these marketing contracts.
F-58
Table of Contents
Index to Financial Statements
Estimated Quantities of Oil and Natural Gas Reserves
The following table sets forth certain data pertaining to our proved, proved developed and proved undeveloped reserves, all of which are in the U.S., for the year ended December 31, 2014, and for the period from April 23, 2013, to December 31, 2013:
| Oil (MBbl) (1) (2) |
Gas (MMcf) (1) |
Total (MBOE) (1) |
||||||||||
| 2014 |
||||||||||||
| Proved Reserves: |
||||||||||||
| Balance at beginning of year |
370,060 | 561,707 | 463,678 | |||||||||
| Extensions and discoveries |
10,072 | 35,463 | 15,983 | |||||||||
| Acquisitions of reserves in-place |
14,003 | 9,072 | 15,515 | |||||||||
| Revision of previous estimates |
(9,475 | ) | 140,075 | 13,871 | ||||||||
| Sale of reserves in-place (3) |
(53,035 | ) | (54,112 | ) | (62,055 | ) | ||||||
| Production |
(43,327 | ) | (82,033 | ) | (56,999 | ) | ||||||
|
|
|
|
|
|
|
|||||||
| Balance at end of year |
288,298 | 610,172 | 389,993 | |||||||||
|
|
|
|
|
|
|
|||||||
| Proved Developed Reserves, December 31, 2014 |
184,477 | 369,513 | 246,062 | |||||||||
|
|
|
|
|
|
|
|||||||
| Proved Undeveloped Reserves, December 31, 2014 |
103,821 | 240,659 | 143,931 | |||||||||
|
|
|
|
|
|
|
|||||||
| April 23, 2013, to December 31, 2013 |
||||||||||||
| Proved Reserves: |
||||||||||||
| Balance at beginning of period |
— | — | — | |||||||||
| Extensions and discoveries |
20,177 | 20,312 | 23,562 | |||||||||
| Acquisitions of reserves in-place (4) |
368,028 | 625,488 | 472,277 | |||||||||
| Revision of previous estimates |
11,378 | (26,417 | ) | 6,975 | ||||||||
| Sale of reserves in-place |
(476 | ) | (2,721 | ) | (930 | ) | ||||||
| Production |
(29,047 | ) | (54,955 | ) | (38,206 | ) | ||||||
|
|
|
|
|
|
|
|||||||
| Balance at end of period |
370,060 | 561,707 | 463,678 | |||||||||
|
|
|
|
|
|
|
|||||||
| Proved Developed Reserves, December 31, 2013 |
236,565 | 422,504 | 306,982 | |||||||||
|
|
|
|
|
|
|
|||||||
| Proved Undeveloped Reserves, December 31, 2013 |
133,495 | 139,203 | 156,696 | |||||||||
|
|
|
|
|
|
|
|||||||
| (1) | MBbls = thousand barrels; MMcf = million cubic feet; MBOE = thousand BOE. |
| (2) | Includes 10 million BOE (MMBbls) of NGL proved reserves (7 MMBbls of developed and 3 MMBbls of undeveloped) at December 31, 2014, and 20 MMBbls of NGL proved reserves (14 MMBbls of developed and 6 MMBbls of undeveloped) at December 31, 2013. |
| (3) | For the year ended December 31, 2014, we sold reserves in-place primarily related to our Eagle Ford properties. |
| (4) | For the period from April 23, 2013, to December 31, 2013, we acquired reserves in-place primarily related to the acquisition of PXP and McMoRan by FCX. |
For the year ended December 31, 2014, we had a total of 16 MMBOE of extensions and discoveries, including 8 MMBOE in the Deepwater GOM, primarily associated with the continued successful development at Horn Mountain and 5 MMBOE in the Haynesville shale play resulting from continued successful drilling that extended and developed our proved acreage. For the period from April 23, 2013, to December 31, 2013, we had a total of 24 MMBOE of extensions and discoveries, including 16 MMBOE in the Eagle Ford shale play resulting from continued successful drilling that extended and developed our proved acreage and 5 MMBOE in the Deepwater GOM, primarily associated with the previously drilled Holstein Deep development acquired during 2013.
F-59
Table of Contents
Index to Financial Statements
For the year ended December 31, 2014, we had net positive revisions of 14 MMBOE primarily related to improved gas price realizations in both the Haynesville shale play and Madden field, as well as continued improved performance in the Eagle Ford shale play prior to the disposition, partially offset by the downward revisions of certain proved undeveloped reserves resulting from deferred development plans, as well as lower oil price realizations and higher steam-related operating expenses resulting from higher natural gas prices in certain of our onshore California properties. For the period from April 23, 2013, to December 31, 2013, we had net positive revisions of 7 MMBOE primarily related to improved performance at certain of our onshore California and Deepwater GOM properties, partially offset by performance reductions primarily related to certain other of our Deepwater GOM properties and the Haynesville shale play.
For the year ended December 31, 2014, we acquired reserves in-place totaling 16 MMBOE from the acquisition of interests in the Deepwater GOM, including interests in the Lucius and Heidelberg oil fields.
For the year ended December 31, 2014, we sold reserves in-place totaling 62 MMBOE primarily related to our Eagle Ford properties.
Standardized Measure
The Standardized Measure (discounted at 10 percent) of proved oil and natural gas reserves has been developed as of December 31, 2014 and 2013, in accordance with SEC guidelines. We estimated the quantity of proved oil and natural gas reserves and the future periods in which they are expected to be produced based on year-end economic conditions. Estimates of future net revenues from our proved oil and gas properties and the present value thereof were made using the twelve-month average of the first-day-of-the-month historical reference prices as adjusted for location and quality differentials, which are held constant throughout the life of the oil and gas properties, except where such guidelines permit alternate treatment, including the use of fixed and determinable contractual price escalations (excluding the impact of crude oil derivative contracts). Future gross revenues were reduced by estimated future operating costs (including production and ad valorem taxes) and future development and abandonment costs, all of which were based on current costs in effect at December 31, 2014 and 2013, and held constant throughout the life of the oil and gas properties. Future income taxes were calculated by applying the statutory federal and state income tax rate to pre-tax future net cash flows, net of the tax basis of the respective oil and gas properties and utilization of our available tax carryforwards related to its oil and gas operations.
Excluding the impact of crude oil derivative contracts, the average realized sales prices used in our reserve reports as of December 31, 2014 and 2013, were $93.20 and $99.67 per barrel of crude oil, respectively, and $4.35 and $3.64 per one thousand cubic feet (Mcf) of natural gas, respectively.
The following table sets forth the Standardized Measure related to our proved oil and natural gas reserves as of December 31, 2014 and 2013 (in thousands):
| December 31, | ||||||||
| 2014 | 2013 | |||||||
| Future cash inflows |
$ | 29,503,502 | $ | 38,901,364 | ||||
| Future production expense |
(10,990,842 | ) | (12,773,761 | ) | ||||
| Future development costs (1) |
(6,447,857 | ) | (6,480,177 | ) | ||||
| Future income tax expense |
(2,408,191 | ) | (4,875,784 | ) | ||||
|
|
|
|
|
|||||
| Future net cash flows |
9,656,612 | 14,771,642 | ||||||
| Discounted at 10 percent per year |
(3,164,121 | ) | (5,316,727 | ) | ||||
|
|
|
|
|
|||||
| Standardized Measure |
$ | 6,492,491 | $ | 9,454,915 | ||||
|
|
|
|
|
|||||
| (1) | Includes estimated asset retirement costs of $1.8 billion at December 31, 2014 and 2013. |
F-60
Table of Contents
Index to Financial Statements
The following table summarizes the principal sources of changes in the Standardized Measure for the year ended December 31, 2014, and for the period from April 23, 2013, to December 31, 2013 (in thousands):
| Year Ended December 31, 2014 |
April 23, 2013, to December 31, 2013 |
|||||||
| Balance at beginning of period |
$ | 9,454,915 | $ | — | ||||
| Changes during the period: |
||||||||
| Reserves acquired in the acquisitions of PXP and McMoRan |
— | 14,466,570 | ||||||
| Sales, net of production expenses |
(3,061,952 | ) | (2,296,302 | ) | ||||
| Net changes in sales and transfer prices, net of production expenses |
(2,875,165 | ) | (458,611 | ) | ||||
| Extensions, discoveries and improved recoveries |
193,478 | 752,184 | ||||||
| Changes in estimated future development costs |
(497,708 | ) | (1,190,650 | ) | ||||
| Previously estimated development costs incurred during the year |
982,212 | 578,048 | ||||||
| Sales of reserves in-place |
(1,322,746 | ) | (11,650 | ) | ||||
| Other purchases of reserves in-place |
487,484 | — | ||||||
| Revisions of quantity estimates |
398,228 | 102,089 | ||||||
| Accretion of discount |
1,195,215 | 701,023 | ||||||
| Net change in income taxes |
1,538,530 | (3,187,786 | ) | |||||
|
|
|
|
|
|||||
| Total changes |
(2,962,424 | ) | 9,454,915 | |||||
|
|
|
|
|
|||||
| Balance at end of period |
$ | 6,492,491 | $ | 9,454,915 | ||||
|
|
|
|
|
|||||
F-61
Table of Contents
Index to Financial Statements
Report of Independent Registered Public Accounting Firm
To the Board of Directors and Stockholder of FCX Oil & Gas Inc.
In our opinion, the accompanying consolidated statements of income, of equity and of cash flows for the period from January 1, 2013 to May 31, 2013 and for the year ended December 31, 2012 present fairly, in all material respects, the results of operations and cash flows of Plains Exploration & Production Company and its subsidiaries (Predecessor) for the period from January 1, 2013 to May 31, 2013 and for the year ended December 31, 2012, in conformity with accounting principles generally accepted in the United States of America. These financial statements are the responsibility of the Company’s management. Our responsibility is to express an opinion on these financial statements based on our audits. We conducted our audits of these statements in accordance with the standards of the Public Company Accounting Oversight Board (United States). Those standards require that we plan and perform the audit to obtain reasonable assurance about whether the financial statements are free of material misstatement. An audit includes examining, on a test basis, evidence supporting the amounts and disclosures in the financial statements, assessing the accounting principles used and significant estimates made by management, and evaluating the overall financial statement presentation. We believe that our audits provide a reasonable basis for our opinion.
/s/ PricewaterhouseCoopers LLP
Houston, Texas
June 23, 2015
F-62
Table of Contents
Index to Financial Statements
PLAINS EXPLORATION & PRODUCTION COMPANY
(Predecessor)
CONSOLIDATED STATEMENTS OF INCOME
(in thousands, except per share data)
| January 1, 2013, to May 31, 2013 |
Year Ended December 31, 2012 |
|||||||
| Revenues |
||||||||
| Oil sales |
$ | 1,912,258 | $ | 2,325,922 | ||||
| Gas sales |
127,398 | 232,441 | ||||||
| Other operating revenues |
2,146 | 6,944 | ||||||
|
|
|
|
|
|||||
| 2,041,802 | 2,565,307 | |||||||
|
|
|
|
|
|||||
| Costs and Expenses |
||||||||
| Lease operating expenses |
317,673 | 484,727 | ||||||
| Production and ad valorem taxes |
46,640 | 73,873 | ||||||
| Gathering and transportation expenses |
41,686 | 73,852 | ||||||
| General and administrative |
73,025 | 157,022 | ||||||
| Acquisition and merger related costs |
36,335 | 42,151 | ||||||
| Depreciation, depletion and amortization |
873,445 | 1,101,108 | ||||||
| Accretion |
16,723 | 16,944 | ||||||
| Other operating expense (income) |
8,438 | (27 | ) | |||||
|
|
|
|
|
|||||
| 1,413,965 | 1,949,650 | |||||||
|
|
|
|
|
|||||
| Income from Operations |
627,837 | 615,657 | ||||||
| Other Expense (Income) |
||||||||
| Interest expense, net |
232,361 | 297,539 | ||||||
| Debt extinguishment costs |
18,052 | 8,388 | ||||||
| Loss on mark-to-market derivative contracts |
24,688 | 2,879 | ||||||
| Gain on investment measured at fair value |
(29,907 | ) | (206,552 | ) | ||||
| Other income |
(396 | ) | (694 | ) | ||||
|
|
|
|
|
|||||
| Income Before Income Taxes |
383,039 | 514,097 | ||||||
| Income tax expense (benefit) |
||||||||
| Current |
5,619 | (4,102 | ) | |||||
| Deferred |
102,897 | 175,412 | ||||||
|
|
|
|
|
|||||
| Net Income |
274,523 | 342,787 | ||||||
| Net income attributable to noncontrolling interest in the form of preferred stock of subsidiary |
(18,371 | ) | (36,367 | ) | ||||
|
|
|
|
|
|||||
| Net Income Attributable to Common Stockholders |
$ | 256,152 | $ | 306,420 | ||||
|
|
|
|
|
|||||
| Earnings per Common Share |
||||||||
| Basic |
$ | 1.96 | $ | 2.36 | ||||
| Diluted |
$ | 1.93 | $ | 2.32 | ||||
| Weighted-Average Common Shares Outstanding |
||||||||
| Basic |
130,522 | 129,925 | ||||||
|
|
|
|
|
|||||
| Diluted |
132,818 | 131,867 | ||||||
|
|
|
|
|
|||||
See notes to consolidated financial statements.
F-63
Table of Contents
Index to Financial Statements
PLAINS EXPLORATION & PRODUCTION COMPANY
(Predecessor)
CONSOLIDATED STATEMENTS OF CASH FLOWS
(in thousands)
| January 1, 2013, to May 31, 2013 |
Year Ended December 31, 2012 |
|||||||
| CASH FLOWS FROM OPERATING ACTIVITIES |
||||||||
| Net income |
$ | 274,523 | $ | 342,787 | ||||
| Items not affecting cash flows from operating activities |
||||||||
| Depreciation, depletion and amortization |
873,445 | 1,101,108 | ||||||
| Accretion |
16,723 | 16,944 | ||||||
| Deferred income tax expense |
102,897 | 175,412 | ||||||
| Debt extinguishment costs |
(4,903 | ) | 4,160 | |||||
| Loss on mark-to-market derivative contracts |
24,688 | 2,879 | ||||||
| Gain on investment measured at fair value |
(29,907 | ) | (206,552 | ) | ||||
| Non-cash compensation |
23,793 | 60,247 | ||||||
| Other non-cash items |
12,061 | 8,270 | ||||||
| Changes in assets and liabilities from operating activities |
||||||||
| Accounts receivable and other assets |
45,934 | (244,610 | ) | |||||
| Accounts payable and other current liabilities |
(17,226 | ) | 85,638 | |||||
| Stock-based compensation |
(24,703 | ) | (18,652 | ) | ||||
| Income taxes receivable/payable |
(895 | ) | 3,160 | |||||
|
|
|
|
|
|||||
| Net cash provided by operating activities |
1,296,430 | 1,330,791 | ||||||
|
|
|
|
|
|||||
| CASH FLOWS FROM INVESTING ACTIVITIES |
||||||||
| Additions to oil and gas properties |
(781,667 | ) | (1,854,255 | ) | ||||
| Acquisition of oil and gas properties |
(41,779 | ) | (51,051 | ) | ||||
| Gulf of Mexico Acquisition |
— | (5,895,878 | ) | |||||
| Proceeds from sales of oil and gas properties and related assets, net of costs and expenses |
76 | 67,619 | ||||||
| Derivative settlements |
(17,286 | ) | 42,894 | |||||
| Additions to other property and equipment |
(46,881 | ) | (12,584 | ) | ||||
| Other |
(1,591 | ) | — | |||||
|
|
|
|
|
|||||
| Net cash used in investing activities |
(889,128 | ) | (7,703,255 | ) | ||||
|
|
|
|
|
|||||
| CASH FLOWS FROM FINANCING ACTIVITIES |
||||||||
| Borrowings from revolving credit facilities |
5,168,922 | 9,479,075 | ||||||
| Repayments of revolving credit facilities |
(5,263,100 | ) | (8,644,075 | ) | ||||
| Proceeds from five-year term loan |
— | 730,331 | ||||||
| Proceeds from seven-year term loan |
— | 1,220,533 | ||||||
| Principal payments of long-term debt |
(171,180 | ) | (156,182 | ) | ||||
| Proceeds from issuance of senior notes |
— | 3,750,000 | ||||||
| Costs incurred in connection with financing arrangements |
(697 | ) | (130,261 | ) | ||||
| Purchase of treasury stock |
— | (88,490 | ) | |||||
| Distributions to holders of noncontrolling interest in the form of preferred stock of subsidiary |
(6,750 | ) | (27,000 | ) | ||||
|
|
|
|
|
|||||
| Net cash (used in) provided by financing activities |
(272,805 | ) | 6,133,931 | |||||
|
|
|
|
|
|||||
| Net increase (decrease) in cash and cash equivalents |
134,497 | (238,533 | ) | |||||
| Cash and cash equivalents, beginning of period |
180,565 | 419,098 | ||||||
|
|
|
|
|
|||||
| Cash and cash equivalents, end of period |
$ | 315,062 | $ | 180,565 | ||||
|
|
|
|
|
|||||
See notes to consolidated financial statements.
F-64
Table of Contents
Index to Financial Statements
PLAINS EXPLORATION & PRODUCTION COMPANY
(Predecessor)
CONSOLIDATED STATEMENTS OF EQUITY
(in thousands)
| Common Stock | Additional Paid In Capital |
Retained Earnings |
Treasury Stock | Total Stockholders’ Equity |
Noncontrolling Interest in the Form of Preferred Stock of Subsidiary |
Total Equity |
||||||||||||||||||||||||||||||
| Shares | Amount | Shares | Amount | |||||||||||||||||||||||||||||||||
| Balance at January 1, 2012 |
143,924 | $ | 1,439 | $ | 3,434,928 | $ | 337,991 | (13,302 | ) | $ | (509,722 | ) | $ | 3,264,636 | $ | 430,596 | $ | 3,695,232 | ||||||||||||||||||
| Net income |
— | — | — | 306,420 | — | — | 306,420 | 36,367 | 342,787 | |||||||||||||||||||||||||||
| Stock-based compensation |
— | — | 33,892 | — | — | — | 33,892 | — | 33,892 | |||||||||||||||||||||||||||
| Treasury stock purchases |
— | — | — | — | (2,390 | ) | (88,490 | ) | (88,490 | ) | — | (88,490 | ) | |||||||||||||||||||||||
| Issuance of treasury stock for restricted stock awards |
— | — | (30,994 | ) | (6,994 | ) | 733 | 37,988 | — | — | — | |||||||||||||||||||||||||
| Distributions to holders of noncontrolling interest in the form of preferred stock of subsidiary |
— | — | — | — | — | — | — | (27,000 | ) | (27,000 | ) | |||||||||||||||||||||||||
| Exercise of stock options and other |
— | — | — | (6 | ) | — | 26 | 20 | — | 20 | ||||||||||||||||||||||||||
|
|
|
|
|
|
|
|
|
|
|
|
|
|
|
|
|
|
|
|||||||||||||||||||
| Balance at December 31, 2012 |
143,924 | 1,439 | 3,437,826 | 637,411 | (14,959 | ) | (560,198 | ) | 3,516,478 | 439,963 | 3,956,441 | |||||||||||||||||||||||||
| Net income |
— | — | — | 256,152 | — | — | 256,152 | 18,371 | 274,523 | |||||||||||||||||||||||||||
| Issuance of treasury stock for restricted stock awards |
— | — | (25,237 | ) | (1,241 | ) | 531 | 26,478 | — | — | — | |||||||||||||||||||||||||
| Distributions to holders of noncontrolling interest in the form of preferred stock of subsidiary |
— | — | — | — | — | — | — | (13,501 | ) | (13,501 | ) | |||||||||||||||||||||||||
| Stock-based compensation |
— | — | 9,656 | — | — | — | 9,656 | 9,656 | ||||||||||||||||||||||||||||
| Other |
— | — | — | — | — | 3 | 3 | — | 3 | |||||||||||||||||||||||||||
|
|
|
|
|
|
|
|
|
|
|
|
|
|
|
|
|
|
|
|||||||||||||||||||
| Balance at May 31, 2013 |
143,924 | $ | 1,439 | $ | 3,422,245 | $ | 892,322 | (14,428 | ) | $ | (533,717 | ) | $ | 3,782,289 | $ | 444,833 | $ | 4,227,122 | ||||||||||||||||||
|
|
|
|
|
|
|
|
|
|
|
|
|
|
|
|
|
|
|
|||||||||||||||||||
See notes to consolidated financial statements.
F-65
Table of Contents
Index to Financial Statements
PLAINS EXPLORATION & PRODUCTION COMPANY
NOTES TO CONSOLIDATED FINANCIAL STATEMENTS
Note 1 — Summary of Significant Accounting Policies
General. Plains Exploration & Production Company, a Delaware corporation formed in 2002 (PXP, the Company, us, our, or we), was an independent energy company engaged in the upstream oil and gas business. On May 31, 2013, Freeport-McMoRan Inc. (FCX), acquired PXP, which was then merged into Freeport-McMoRan Oil & Gas LLC (FM O&G), a wholly owned subsidiary of FCX Oil & Gas Inc. (FCX O&G) and successor to PXP. Our upstream oil and gas business acquires, develops, explores for and produces oil and gas located in the United States (U.S.).
Our consolidated statements of income, equity and cash flows include the accounts of all our consolidated subsidiaries. We consolidate entities when we have the ability to control or direct the operating and financial decisions of the entity or when we have a significant interest in the entity that gives us the ability to direct the activities that are significant to that entity. The determination of our ability to control, direct or exert significant influence over an entity involves the use of judgment. All significant intercompany transactions have been eliminated.
Use of Estimates. The preparation of financial statements in conformity with generally accepted accounting principles requires management to make estimates and assumptions that affect the reported amounts of assets and liabilities and disclosure of contingent assets and liabilities at the date of the financial statements and the reported amounts of revenues and expenses during the reporting period. Significant estimates made by management include: (1) oil and natural gas reserves; (2) depreciation, depletion and amortization (DD&A); (3) amounts and timing of transfers from oil and gas properties not subject to amortization; (4) valuation of our investment; (5) determination of fair value of assets acquired and liabilities assumed and recording of goodwill and deferred taxes, if any, in connection with business combinations; (6) noncontrolling interest in the form of preferred stock of subsidiary; (7) income taxes; (8) accrued assets and liabilities; (9) stock-based compensation; (10) asset retirement obligations (ARO); and (11) valuation of derivative instruments. Although management believes these estimates are reasonable, changes in facts and circumstances or discovery of new information may result in revised estimates, and actual results may differ from these estimates.
Oil and Gas Properties. We follow the full cost method of accounting specified by the U.S. Securities and Exchange Commission’s (SEC) rules whereby all costs associated with property acquisition, exploration and development activities are capitalized in a cost center on a country-by-country basis. Such costs include internal general and administrative costs, such as payroll and related benefits and costs directly attributable to employees engaged in acquisition, exploration and development activities. General and administrative costs associated with production, operations, marketing and general corporate activities are expensed as incurred. Capitalized costs, along with our estimated future costs to develop proved reserves and asset retirement costs that are not already included in oil and gas properties, net of related salvage value, are amortized to expense by the unit-of-production (UOP) method using engineers’ estimates of proved oil and natural gas reserves. The costs of unproved oil and gas properties are excluded from amortization until the properties are evaluated. Interest is capitalized on oil and natural gas properties not subject to amortization and in the process of development. See Note 16 – Oil and Natural Gas Activities – Capitalized Costs. Proceeds from the sale of oil and natural gas properties are accounted for as reductions to capitalized costs unless such sales cause a significant change in the relationship between capitalized costs and proved reserves of oil and gas attributable to a cost center, in which case a gain or loss is recognized.
Under the SEC’s full cost accounting rules, we review the carrying value of our oil and gas properties each quarter on a country-by-country basis. Under these rules capitalized costs of oil and gas properties (net of accumulated DD&A and related deferred income taxes) for each cost center may not exceed a “ceiling” equal to:
| • | the present value, discounted at 10 percent, of estimated future net cash flows from proved oil and gas reserves, net of estimated future income taxes; plus |
F-66
Table of Contents
Index to Financial Statements
| • | the cost of unproved properties not being amortized; plus |
| • | the lower of cost or estimated fair value of unproved properties included in the costs being amortized (net of related tax effects). |
These rules generally require that we price our future oil and gas production at the twelve-month average of the first-day-of-the-month reference prices as adjusted for location and quality differentials. Our reference prices are West Texas Intermediate (WTI) for oil and the Henry Hub spot price for gas. Such prices are utilized except where different prices are fixed and determinable from applicable contracts for the remaining term of those contracts, excluding derivatives. The estimated future net cash flows also exclude future cash flows associated with settling ARO included in the net book value of the oil and gas properties. The rules require an impairment if our capitalized costs exceed this “ceiling.”
During the first quarter of 2012, as a result of low natural gas prices, our assessment of the unproved property in the Haynesville shale area indicated an impairment and accumulated costs of approximately $483 million were transferred to the full cost pool.
Asset Retirement Obligation. We record the fair value of a liability for a legal obligation to retire an asset in the period in which the liability is incurred with an offsetting increase to proved oil and gas properties. For oil and gas properties, this is the period in which the well is drilled or acquired. A legal obligation is a liability that a party is required to settle as a result of an existing or enacted law, statute, ordinance or contract. Each period we accrete the liability to its then present value and depreciate the capitalized cost over the useful life of the related asset.
Cash and Cash Equivalents. Cash and cash equivalents consist primarily of highly liquid money market mutual funds that hold U.S. government securities and demand deposits with financial institutions. The mutual funds are available to us upon demand. There were no outstanding checks that had not been presented for payment in accounts payable at May 31, 2013, and December 31, 2012.
Federal and State Income Taxes. We recognize deferred tax liabilities and assets for expected future tax consequences of events that have been included in the financial statements or tax returns. Under this method, deferred tax liabilities and assets are determined based on the difference between the financial statement and tax bases of assets and liabilities using tax rates in effect for the year in which the differences are expected to reverse. A valuation allowance is established to reduce deferred tax assets if it is more likely than not that some portion or all of the related tax benefits will not be realized.
We have also established a recognition threshold and measurement attribute for a tax position taken or expected to be taken in a tax return. The tax benefit from an uncertain tax position is recognized when it is more likely than not, based on the technical merits of the position, that the position will be sustained on examination by the taxing authorities. Additionally, the amount of the tax benefit recognized is the largest amount of benefit that has a greater than 50 percent likelihood of being realized upon ultimate settlement. Furthermore, we recognize potential penalties and interest related to unrecognized tax benefits as a component of income tax expense. See Note 11 – Income Taxes.
Revenue Recognition. Oil and gas revenue from our interests in producing wells is recognized upon delivery and passage of title using the sales method for gas imbalances, net of any royalty interests or other profit interests in the produced product. If our sales of production volumes for a well exceed our portion of the estimated remaining recoverable reserves of the well, a liability is recorded. No receivables are recorded for those wells on which we have taken less than our ownership share of production unless the amount taken by other parties exceeds the estimate of their remaining reserves. We had no material gas imbalances at May 31, 2013, and December 31, 2012.
F-67
Table of Contents
Index to Financial Statements
Derivative Financial Instruments. We use various derivative instruments to manage our exposure to commodity price risk on sales of oil and gas production. We do not enter into derivative instruments for speculative trading purposes. We present the fair value of our derivative contracts on a net basis where the right of offset is provided for in our counterparty agreements. See Note 6 – Commodity Derivative Contracts.
Investment. We have elected to measure our investment at fair value with changes in fair value included in our consolidated statements of income. If we had not elected the fair value method, the investment would have qualified for the equity method of accounting, under which our proportionate share of the investee’s income would have been reported in our consolidated statements of income. See Note 7 – Investment and Note 8 – Fair Value Measurements of Assets and Liabilities.
Fair Value. Fair value is the amount that would be received from the sale of an asset or paid for the transfer of a liability in an orderly transaction between market participants. The authoritative guidance characterizes inputs used in determining fair value according to a hierarchy that prioritizes inputs based upon the degree to which they are observable. The three levels of the fair value hierarchy are as follows:
| • | Level 1 – Valuations utilizing quoted, unadjusted prices for assets or liabilities in active markets for identical assets or liabilities as of the reporting date. This is the most reliable evidence of fair value and does not require a significant amount of judgment. |
| • | Level 2 – Valuations utilizing market-based inputs that are directly or indirectly observable but not considered Level 1 quoted prices, including quoted prices for similar instruments in active markets; quoted prices for identical or similar instruments in markets that are not active; or valuation techniques whose inputs are observable. If the asset or liability has a specified contractual term, the Level 2 input must be observable for substantially the full term of the asset or liability. |
| • | Level 3 – Valuations utilizing techniques whose significant inputs are unobservable. This provides the least objective evidence of fair value and requires a significant degree of judgment. |
A financial instrument’s level within the fair value hierarchy is based on the lowest level of input that is significant to the fair value measurement. We estimate the fair values of our derivative instruments and investment and determine their placement within the fair value hierarchy levels as described above. See Note 8 – Fair Value Measurements of Assets and Liabilities.
Noncontrolling Interest in the Form of Preferred Stock of Subsidiary. Noncontrolling interest in the form of preferred stock of subsidiary represents third-party ownership in the net assets of our consolidated subsidiary Plains Offshore Operations Inc., or Plains Offshore, in the form of convertible perpetual preferred stock and associated non-detachable warrants, which are classified as permanent equity since redemption for cash of the preferred stock is within our control. See Note 4 – Noncontrolling Interest in the Form of Preferred Stock of Subsidiary.
Business Segment Information. We acquire, develop, explore for and produce oil and gas in the U.S. We allocate capital resources on a project-by-project basis across our entire asset base to maximize profitability and measure financial performance as a single enterprise and not on an area-by-area basis. Accordingly, we have one operating segment, our oil and gas operations.
Stock-Based Compensation. Our stock-based compensation cost is measured based on the fair value of the award on the grant date and remeasured each reporting period for liability-classified awards. The compensation cost is recognized net of estimated forfeitures over the requisite service period. See Note 10 – Stock-Based and Other Compensation Plans.
F-68
Table of Contents
Index to Financial Statements
Note 2 — Merger with Freeport-McMoRan Inc.
On May 31, 2013, FCX acquired PXP for approximately $6.6 billion in cash and stock. PXP stockholders received, for each share of PXP common stock they owned, 0.6531 shares of FCX common stock and $25.00 in cash, equivalent to total consideration of $50.00 per PXP share.
Pursuant to the terms of the merger, each restricted share of PXP common stock outstanding and each stock-settled PXP restricted stock unit outstanding and granted or contractually promised as of the date of the merger (the “RSUs”) (except for certain RSUs held by each of PXP’s named executive officers identified below) became fully vested and converted into the right to receive, at the election of the holder, the cash consideration or the stock consideration. Certain stock-settled RSUs held by each of PXP’s named executive officers as of the date of the merger became fully vested and were converted into the right to receive cash consideration or stock consideration, subject to the terms and conditions set forth in certain letter agreements among each such named executive officer, FCX and PXP. Each cash-settled RSU became fully vested and converted into the right to receive the cash consideration. Each stock appreciation right relating to shares of PXP common stock outstanding and unexercised became fully vested and converted into a stock appreciation right relating to shares of FCX common stock. Each compensatory equity award granted or issued by PXP after the date of the merger and prior to the effective time of the merger converted into the same type of award covering shares of FCX common stock.
In connection with the merger of PXP with FCX, stock-based compensation expense of $208.4 million, including the related Federal Insurance Contributions Act (FICA) tax associated with those awards discussed above, was accelerated. These expenses (i.e., expenses incurred as a result of the consummation of the change in control event that occurred on May 31, 2013) are not included in the consolidated statements of income presented herein for the period January 1, 2013, to May 31, 2013. Such contingent expenses related to a change in control event are considered “on-the-line” and presentations of such in the consolidated statements of income are not a requirement.
Note 3 — Acquisitions
Gulf of Mexico
During the fourth quarter of 2012, we completed the acquisition of certain oil and gas interests in and near the Holstein, Diana, Hoover, Horn Mountain, Marlin, Dorado, King and Ram Powell Fields located in the Gulf of Mexico from BP, subject to customary post-closing adjustments. After pre-closing adjustments from the effective date of October 1, 2012, which resulted in a reduction to the $5.55 billion purchase price of approximately $191.0 million, PXP paid $5.36 billion in cash, which included the deposit of $555.0 million previously paid to BP Exploration & Production Inc., and BP America Production Company, or BP. In December 2012, we recorded a net reduction of approximately $45.0 million to the purchase price primarily associated with oil and gas revenues between the effective and closing dates.
During the fourth quarter of 2012, we also completed the acquisition of the 50% working interest in the Holstein Field located in the Gulf of Mexico from Shell Offshore, Inc., or Shell, subject to customary post-closing adjustments. After pre-closing adjustments from the effective date of October 1, 2012, which resulted in a reduction to the $560.0 million purchase price of approximately $27.9 million, PXP paid $532.1 million in cash.
We funded these Gulf of Mexico acquisitions, collectively the Gulf of Mexico Acquisition, primarily with our revolving line of credit and term loan credit facilities, collectively the Amended Credit Facility, and the issuance of senior notes. Transaction costs of approximately $66.0 million, including (i) $31.8 million of commitment fees and related expenses associated with a new senior unsecured bridge credit facility, or Bridge Credit Facility, which was recorded as interest expense because we did not borrow under the Bridge Credit Facility, (ii) a $20.0 million fee that we paid in connection with an amendment to our existing stockholders agreements with the preferred investors of Plains Offshore to limit certain exclusivity provisions and (iii) certain investment, advisory, legal and other acquisition related fees, have been expensed.
F-69
Table of Contents
Index to Financial Statements
We accounted for the Gulf of Mexico Acquisition, effective October 1, 2012, as acquisitions of businesses under purchase accounting rules. The assets acquired and liabilities assumed related to the Gulf of Mexico Acquisition were recorded at their fair values as of the closing date on November 30, 2012. The fair values below are subject to our determination of ARO and fair values of assets acquired and liabilities assumed that have not been completed as of May 31, 2013. These and other estimates are subject to change as additional information becomes available and is assessed by us and BP and Shell, respectively, and agreement is reached on the respective final settlement statements. The consideration paid for the Gulf of Mexico Acquisition and the assets acquired and liabilities assumed recognized at the acquisition date are shown below (in thousands):
| BP | Shell | Total | ||||||||||
| Cash consideration |
$ | 5,363,300 | $ | 532,578 | $ | 5,895,878 | ||||||
|
|
|
|
|
|
|
|||||||
| Fair value of assets acquired and liabilities assumed: |
||||||||||||
| Accounts receivable |
$ | 41,186 | $ | — | $ | 41,186 | ||||||
| Inventories |
7,754 | — | 7,754 | |||||||||
| Other current assets |
— | 2,410 | 2,410 | |||||||||
| Oil and natural gas properties |
||||||||||||
| Subject to amortization |
3,836,558 | 298,615 | 4,135,173 | |||||||||
| Not subject to amortization |
1,768,348 | 278,709 | 2,047,057 | |||||||||
| Asset retirement obligation |
(290,546 | ) | (47,156 | ) | (337,702 | ) | ||||||
|
|
|
|
|
|
|
|||||||
| Net assets acquired |
$ | 5,363,300 | $ | 532,578 | $ | 5,895,878 | ||||||
|
|
|
|
|
|
|
|||||||
Under the acquisition method of accounting, the purchase price is allocated to the assets acquired and liabilities assumed based on their estimated fair values, with any excess of the purchase price over the estimated fair value of the identifiable net assets acquired recorded as goodwill. Based on the purchase price allocation, no goodwill was recognized.
We recorded revenues and expenses attributable to the Gulf of Mexico Acquisition beginning on the closing date of November 30, 2012. Revenues and earnings attributable to the Gulf of Mexico Acquisition included in our consolidated statements of income for the period from January 1, 2013, to May 31, 2013, and for the year ended December 31, 2012, were $196.2 million and $39.4 million, respectively.
Unaudited Pro Forma Impact of Gulf of Mexico Acquisition
The following unaudited pro forma financial information has been prepared to reflect the pro forma effect of the Gulf of Mexico Acquisition, the issuance of senior notes and the use of proceeds from the amended credit facility. We believe the assumptions used provide a reasonable basis for representing the pro forma significant effects directly attributable to the Gulf of Mexico Acquisition and its associated financing. The unaudited pro forma information assumes such transaction occurred on January 1, 2012. The unaudited pro forma information does not purport to represent what our results of operations would have been if such transactions had occurred on such dates (in thousands):
| January 1, 2012, to May 31, 2012 |
Year Ended December 31, 2012 |
|||||||
| Revenues |
$ | 1,810,647 | $ | 4,328,678 | ||||
| Net income from continuing operations |
387,266 | 881,078 | ||||||
| Net income attributable to common stockholders |
378,250 | 844,711 | ||||||
F-70
Table of Contents
Index to Financial Statements
Note 4 — Noncontrolling Interest in the Form of Preferred Stock of Subsidiary
In October 2011, we entered into a securities purchase agreement with EIG Global Energy Partners, or EIG, pursuant to which we received $430.2 million of net cash proceeds in November 2011, upon closing of the transaction, in exchange for a 20 percent equity interest in Plains Offshore. Plains Offshore holds certain of our oil and natural gas properties and assets located in the U.S. Gulf of Mexico in water depths of 500 feet or more, including the Lucius oil field and the Phobos exploration prospect and excluding the properties acquired from BP and Shell. Under the agreement and upon closing of the transaction, Plains Offshore issued to EIG managed funds and accounts, or the EIG Funds (i) 450,000 shares of Plains Offshore 8 percent convertible perpetual preferred stock and (ii) non-detachable warrants to purchase in aggregate 9,121,000 shares of Plains Offshore’s common stock with an exercise price of $20 per share. In addition, Plains Offshore issued 87 million shares of Plains Offshore Class A common stock, which will be held in escrow until the conversion and cancellation of the preferred stock or the exercise of the warrants held by EIG. The preferred stock pays quarterly cash dividends of 6 percent per annum and an additional 2 percent per annum dividend. The 2 percent dividend may be deferred and accumulated quarterly until paid. The shares of preferred stock also fully participate, on an as-converted basis at four times, in cash dividends distributed to any class of common stockholders of Plains Offshore.
The preferred holders have the right, at any time at their option, to convert any or all of such holder’s preferred stock and exercise any of the associated non-detachable warrants into shares of Class A common stock of Plains Offshore, at an initial conversion/exercise price of $20 per share; the conversion price is subject to adjustment as a result of certain events. Furthermore, under the terms of the securities purchase agreement, Plains Offshore has the right to convert all or a portion of the outstanding shares of preferred stock if certain events occur more than 180 days after an initial public offering or a qualified public offering of Plains Offshore. We have a right to purchase shares of preferred stock, common stock and warrants under certain circumstances in order to permit the consolidation of Plains Offshore for federal income tax purposes. Additionally, at any time on or after November 17, 2016, we may exercise a call right to purchase all, but not less than all, of the outstanding preferred stock and associated non-detachable warrants for cash, at a price equal to the liquidation preference described below.
At any time after November 17, 2015, a majority of the preferred holders may cause Plains Offshore to use its commercially reasonable efforts to consummate an exit event. An exit event, as defined in the stockholders agreement, means, at the sole option of Plains Offshore (i) the purchase by us or the redemption by Plains Offshore of all the preferred stock, warrants and common stock held by the EIG Funds for the aggregate fair value thereof, or the repurchase option; (ii) a sale of Plains Offshore or a sale of all or substantially all of its assets, in each case in an arms’ length transaction with a third party, at the highest price available after reasonable marketing efforts by Plains Offshore; or (iii) a qualified initial public offering. Under the repurchase option, the form of consideration shall be at our sole discretion, which could be (a) cash, (b) our shares of registered, freely-tradable common stock (valued at 95 percent of the average closing sale price) or (c) a combination of (a) and (b) above. In the event that Plains Offshore fails to consummate an exit event prior to the applicable exit event deadline, the conversion price of the preferred stock and the exercise price of the warrants will immediately and automatically be adjusted such that all issued and outstanding shares of preferred stock on an as-converted basis taken together with shares of common stock issuable upon exercise of the warrants, in the aggregate, will constitute 49 percent of the common equity securities of Plains Offshore on a fully diluted basis. In addition, we will be required to purchase $300 million of junior preferred stock in Plains Offshore. If this occurs, our cash expenditures relating to the assets of Plains Offshore will approximate the cash contribution made by EIG to Plains Offshore. Plains Offshore must use the proceeds to repay its senior credit facility. See Note 5 – Interest Expense and Debt Extinguishment Cost.
The preferred holders are entitled to vote on all matters on which common stockholders are entitled to vote. Each holder is entitled to one vote for each share that such holder would be entitled to receive if such holder’s shares of preferred stock were converted into common shares on the record date set by the board of directors for such vote. Prior to an initial public offering, the holders have preemptive rights with respect to certain issuances
F-71
Table of Contents
Index to Financial Statements
of equity securities of Plains Offshore. In the event that we or any of our affiliates intend to transfer any of their common shares to an unaffiliated third-party purchaser, each other equity holder will have certain tag along rights.
In the event of liquidation of Plains Offshore, each preferred holder is entitled to receive the liquidation preference before any payment or distribution is made on any junior or common stock. A liquidation event includes any of the following events: (i) the liquidation, dissolution or winding up of Plains Offshore, whether voluntary or involuntary, (ii) a sale, consolidation or merger of Plains Offshore in which the stockholders immediately prior to such event do not own at least a majority of the outstanding shares of the surviving entity, or (iii) a sale or other disposition of all or substantially all of Plains Offshore’s assets to a person other than us or our affiliates. The liquidation preference is equal to (i) the greater of (a) 1.25 times the initial offering price and (b) the sum of (1) the fair market value of the shares of common stock issuable upon conversion of the preferred stock and (2) the applicable tax adjustment amount, plus (ii) any accrued dividends and accumulated dividends.
The non-detachable warrants may be exercised at any time on the earlier of (i) the eighth anniversary of the original issue date or (ii) a termination event. Under the terms of the securities purchase agreement, a termination event is defined as the occurrence of any of (a) the conversion of the preferred stock, (b) the redemption of the preferred stock, (c) the repurchase by us or any of our affiliates of the preferred stock or (d) a liquidation event described above. The non-detachable warrants are considered to be embedded instruments for accounting purposes as the instrument cannot be both legally detached and separately exercised from the host preferred stock, nor can the non-detachable warrants be transferred or sold without also transferring the ownership in the preferred stock.
During the period from January 1, 2013, through May 31, 2013, Plains Offshore declared quarterly dividends of approximately $9.2 million, or $20.43 per share of preferred stock, $15.00 per share of which was paid in cash with the remaining deferred.
Plains Offshore Stock Issuance Subsequent Event. In January 2014, Plains Offshore issued 4.8 million shares of Class A common stock to FM O&G at a price of $20 per share (a total of $96.0 million) and 24,000 shares of Preferred Stock to preferred holders for an aggregate price of $1,000 per share (a total of $24.0 million), together with non-detachable warrants, under the same terms as described above.
Note 5 — Interest Expense and Debt Extinguishment Costs
Revolving Line of Credit. The effective interest rate on borrowings under our revolving line of credit was 4.50 percent and 2.55 percent at May 31, 2013, and December 31, 2012, respectively.
Five-Year Term Loan. The effective interest rate on our five-year term loan was 5.25 percent and 3.31 percent at May 31, 2013, and December 31, 2012, respectively.
Seven-Year Term Loan. The effective interest rate on our seven-year term loan was 5.25 percent and 4.00 percent at May 31, 2013, and December 31, 2012, respectively.
Short-Term Credit Facility. The weighted-average interest rate on borrowings under our short-term facility was 1.9 percent and 1.5 percent for the period from January 1, 2013, to May 31, 2013, and for the year ended December 31, 2012, respectively.
Debt Extinguishment Costs. During the period from January 1, 2013, to May 31, 2013, we recognized $18.1 million of debt extinguishment costs related to the redemption of our 10% Senior Notes in February 2013. During 2012, we recognized $8.4 million of debt extinguishment costs, including $5.2 million in connection with the retirement of the remaining aggregate principal amounts of our then outstanding 7 3⁄4% Senior Notes and 7% Senior Notes and $3.2 million in connection with the amended credit facility (which consisted of the revolving line of credit, and the five-year and seven-year term loans).
F-72
Table of Contents
Index to Financial Statements
Note 6 — Commodity Derivative Contracts
General
We are exposed to various market risks, including volatility in oil and natural gas commodity prices and interest rates. The level of derivative activity we engage in depends on our view of market conditions, available derivative prices and operating strategy. A variety of derivative instruments, such as swaps, collars, puts, calls and various combinations of these instruments, may be utilized to manage our exposure to the volatility of oil and natural gas commodity prices. Currently, we do not use derivatives to manage our interest rate risk. The interest rate on our amended credit facility is variable, while our senior notes are at fixed rates.
The derivative instruments we have in place are not designated as hedging instruments. Accordingly, the changes in fair value, both realized and unrealized, are recognized in our consolidated statements of income as a gain or loss on mark-to-market derivative contracts. Cash flows are only impacted to the extent the actual settlements under the contracts result in making a payment to or receiving a payment from the counterparty.
For put options, we typically pay a premium, which is deferred, to the counterparty in exchange for the sale of the instrument. If the index price is below the floor price of the put option, we receive the difference between the floor price and the index price multiplied by the contract volumes less the option premium. If the index price settles at or above the floor price of the put option, we pay only the option premium. The deferred option premiums and accrued interest associated with put options totaled $483.6 million and $511.3 million at May 31, 2013, and December 31, 2012, respectively, which was included as a component of the fair value of the put options.
In a typical collar transaction, if the floating price based on a market index is below the floor price in the derivative contract, we receive from the counterparty an amount equal to this difference multiplied by the specified volume. If the floating price exceeds the ceiling price, we must pay the counterparty an amount equal to the difference multiplied by the specified volume. We may pay a premium to the counterparty in exchange for a certain floor or ceiling. Any premium reduces amounts we would receive under the floor or increases amounts we would pay above the ceiling. If the floating price exceeds the floor price and is less than the ceiling price, then no payment, other than the premium, is required. If we have less production than the volumes specified under the collar transaction when the floating price exceeds the ceiling price, we must make payments against which there are no offsetting revenues from production.
Under a swap contract, the counterparty is required to make a payment to us if the index price for any settlement period is less than the fixed price, and we are required to make a payment to the counterparty if the index price for any settlement period is greater than the fixed price. The amount we receive or pay is the difference between the index price and the fixed price multiplied by the contract volumes. If we have less production than the volumes specified under the swap transaction when the index price exceeds the fixed price, we must make payments against which there are no offsetting revenues from production.
See Note 8 – Fair Value Measurements of Assets and Liabilities, for additional discussion on the fair value measurement of our derivative contracts.
F-73
Table of Contents
Index to Financial Statements
As of May 31, 2013, we had the following outstanding commodity derivative contracts, all of which settle monthly:
| Period |
Instrument Type |
Daily Volumes (1) |
Average Price (per barrel) (2) |
Weighted- Average Deferred Premium (per barrel) |
Index | |||||||||||
| Sales of Crude Oil Production |
||||||||||||||||
| 2013 |
||||||||||||||||
| Jun - Dec |
Swap contracts (3) | 40,000 | $109.23 | — | Brent | |||||||||||
| Jun - Dec |
Put options (4) | 13,000 | $100.00 Floor with an $80.00 Limit | $ | 6.80 | Brent | ||||||||||
| Jun - Dec |
Three-way collars (5) | 25,000 | $100.00 Floor with an $80.00 Limit | — | Brent | |||||||||||
| $124.29 Ceiling | ||||||||||||||||
| Jun - Dec |
Three-way collars (5) | 5,000 | $90.00 Floor with a $70.00 Limit | — | Brent | |||||||||||
| $126.08 Ceiling | ||||||||||||||||
| Jun - Dec |
Put options (4) | 17,000 | $90.00 Floor with a $70.00 Limit | $ | 6.25 | Brent | ||||||||||
| 2014 |
||||||||||||||||
| Jan - Dec |
Put options (4) | 5,000 | $100.00 Floor with an $80.00 Limit | $ | 7.11 | Brent | ||||||||||
| Jan - Dec |
Put options (4) | 30,000 | $95.00 Floor with a $75.00 Limit | $ | 6.09 | Brent | ||||||||||
| Jan - Dec |
Put options (4) | 75,000 | $90.00 Floor with a $70.00 Limit | $ | 5.74 | Brent | ||||||||||
| 2015 |
||||||||||||||||
| Jan - Dec |
Put options (4) | 84,000 | $90.00 Floor with a $70.00 Limit | $ | 6.89 | Brent | ||||||||||
| Sales of Natural Gas Production |
||||||||||||||||
| 2013 |
||||||||||||||||
| Jun - Dec |
Swap contracts (3) | 110,000 | $4.27 | — | Henry Hub | |||||||||||
| 2014 |
||||||||||||||||
| Jan - Dec |
Swap contracts (3) | 100,000 | $4.09 | — | Henry Hub | |||||||||||
| (1) | Derivative contracts for crude oil are measured in barrels (Bbls) and derivative contracts for natural gas are measured in one million British thermal units (MMBtu). |
| (2) | The average strike prices do not reflect any premiums to purchase the put options. |
| (3) | If the index price is less than the fixed price, we receive the difference between the fixed price and the index price. We pay the difference between the index price and the fixed price if the index price is greater than the fixed price. |
| (4) | If the index price is less than the per barrel floor, we receive the difference between the per barrel floor and the index price up to a maximum of $20 per barrel less the option premium. If the index price is at or above the per barrel floor, we pay only the option premium. |
| (5) | If the index price is less than the per barrel floor, we receive the difference between the per barrel floor and the index price up to a maximum of $20 per barrel. We pay the difference between the index price and the per barrel ceiling if the index price is greater than the per barrel ceiling. If the index price is at or above the per barrel floor but at or below the per barrel ceiling, no cash settlement is required. |
F-74
Table of Contents
Index to Financial Statements
Net Cash Payments and Receipts
During the period from January 1, 2013, to May 31, 2013, and for the year ended December 31, 2012, cash (payments) receipts for derivatives were as follows (in thousands):
| January 1, 2013, to May 31, 2013 |
Year Ended December 31, 2012 |
|||||||
| Oil derivatives settlements |
$ | (27,891 | ) | $ | (8,060 | ) | ||
| Natural gas derivatives |
10,605 | 50,954 | ||||||
|
|
|
|
|
|||||
| $ | (17,286 | ) | $ | 42,894 | ||||
|
|
|
|
|
|||||
Credit Risk
We generally do not require collateral or other security to support derivative instruments subject to credit risk. However, the agreements with each of the counterparties to our derivative instruments contain netting provisions within the agreements. If a default occurs under the agreements, the non-defaulting party can offset the amount payable to the defaulting party under the derivative contracts with the amount due from the defaulting party under the derivative contracts. As a result of the netting provisions under the agreements, our maximum amount of loss due to credit risk is limited to the net amounts due from the counterparties under the derivative contracts. As of May 31, 2013, the maximum amount of credit exposure associated with derivative transactions was $60.8 million.
Contingent Features
As of May 31, 2013, the counterparties to our commodity derivative contracts consisted of nine financial institutions. In connection with the acquisition of PXP, FCX agreed to guarantee all of our obligations under our commodity derivative contracts. Therefore, we are not generally required to post additional collateral under our derivative agreements.
Certain of our derivative agreements contain cross-default and acceleration provisions relative to our debt agreements in excess of $175.0 million. If we were to default on any of these debt agreements, it would be a violation of these provisions, and the counterparties to our derivative agreements could request immediate payment on derivative instruments that are in a net liability position at that time.
Note 7 — Investment
At May 31, 2013, and December 31, 2012, we owned 51.0 million shares of McMoRan Exploration Co. (McMoRan) common stock, approximately 31.2 percent and 31.5 percent, respectively, of its common shares outstanding. McMoRan was a publicly traded oil and natural gas exploration and production company engaged in the exploration, development and production of natural gas and oil in the U.S., specifically offshore in the shallow waters of the Gulf of Mexico Shelf and onshore in the Gulf Coast area.
We were deemed to exercise significant influence over the operating and investing policies of McMoRan but did not have control. We elected to measure our equity investment in McMoRan at fair value, and the change in fair value of our investment is recognized as a gain or loss on investment measured at fair value in our consolidated statements of income. We believe that using fair value as a measurement basis for our investment is useful to our investors because our earnings on the investment will be dependent on the fair value on the date we divest the shares.
During the period from January 1, 2013, to May 31, 2013, and the year ended December 31, 2012, we recorded unrealized gains of $29.9 million and $206.6 million, respectively, on our investment.
F-75
Table of Contents
Index to Financial Statements
McMoRan followed the successful efforts method of accounting for its oil and natural gas activities. Under this method of accounting, all costs associated with oil and gas lease acquisition, successful exploratory wells and all development wells were capitalized and amortized on a UOP basis over the remaining life of proved developed reserves and proved reserves on a field basis. Unproved leasehold costs were capitalized pending the results of exploration efforts. Exploration costs, including geological and geophysical expenses, exploratory dry holes and delay rentals, were charged to expense when incurred. Below is summarized financial information of our proportionate share of McMoRan’s results of operations (in thousands):
| January 1, 2013 to May 31, 2013 (1) |
Year Ended December 31, 2012 (2) |
|||||||
| Results of Operations |
||||||||
| Revenues |
$ | 42,883 | $ | 118,720 | ||||
| Operating loss |
(541,502 | ) | (28,868 | ) | ||||
| Loss from continuing operations |
(542,008 | ) | (30,565 | ) | ||||
| Net loss applicable to common stock |
(549,314 | ) | (45,855 | ) | ||||
| (1) | Amounts are based on McMoRan’s audited financial statements dated June 23, 2015, the most recent audited financial information available, and represent our 31.2 percent equity ownership in McMoRan as of May 31, 2013. |
| (2) | Amounts are based on McMoRan’s Form 8-K dated January 18, 2013, and represent our 31.5 percent equity ownership in McMoRan as of December 31, 2012. |
Subsequent Event. On June 3, 2013, FCX acquired McMoRan. Total consideration for the acquisition approximated $3.1 billion. Subsequent to acquisition, McMoRan became a wholly owned subsidiary of FM O&G. Our investment in McMoRan common stock was subsequently eliminated, and we consolidated the operations of McMoRan as part of our oil and natural gas operations beginning June 4, 2013.
Note 8 — Fair Value Measurements of Assets and Liabilities
Authoritative guidance on fair value measurements defines fair value, establishes a framework for measuring fair value and stipulates the related disclosure requirements. We follow a three-level hierarchy, prioritizing and defining the types of inputs used to measure fair value.
Commodity Derivative Contracts. The fair value amounts of our put and collar derivative instruments are estimated using an option-pricing model, which uses various inputs including Intercontinental Exchange Holdings, Inc. (ICE) price quotations, volatilities, interest rates and contract terms. The fair value of our swap derivative instruments are estimated using a pricing model that has various observable inputs, including New York Mercantile Exchange (NYMEX) and ICE price quotations, interest rates and contract terms. We adjust the valuations for credit quality, using the counterparties’ credit quality for asset balances and our credit quality for liability balances. For asset balances, we use the credit default swap value for counterparties when available or the spread between the risk-free interest rate and the yield on the counterparties’ publicly traded debt for similar maturities. We consider the impact of netting agreements on counterparty credit risk, including whether the position with the counterparty is a net asset or net liability.
We classify derivatives that have identical assets or liabilities with quoted, unadjusted prices in active markets as Level 1. We classify derivatives as Level 2 if the inputs used in the valuation model are directly or indirectly observable for substantially the full term of the instrument; however, if the significant inputs are not observable for substantially the full term of the instrument, we classify those derivatives as Level 3. We determine whether the market for our derivative instruments is active or inactive based on transaction volume for such instruments and classify as Level 3 those instruments that are not actively traded. For these inputs, we utilize pricing and volatility information from other instruments with similar characteristics and extrapolate and/or interpolate data between data points for thinly traded instruments.
F-76
Table of Contents
Index to Financial Statements
As of May 31, 2013, our commodity derivative contracts are classified as follows:
| • | Our 2013 and 2014 natural gas swaps, our 2013 crude oil swaps and certain of our 2013 crude oil puts are classified as Level 2 instruments. |
| • | Our 2013 crude oil collars, certain of our crude oil puts and our 2014 and 2015 crude oil puts are classified as Level 3 instruments. |
Investment. On May 31, 2013, we determined the fair value of our investment using McMoRan’s closing stock price of $16.63, which we believe is consistent with the exit price notion and is representative of what a market participant would pay for McMoRan’s common stock in an arm’s length transaction. As of May 31, 2013, our investment in McMoRan was classified as Level 1 since the fair value was determined by utilizing quoted prices in active markets. On December 31, 2012, we utilized a time value of money analysis to determine an implied discount rate. The implied discount is determined by utilizing a risk-free interest rate based on the U.S. Treasury Strip rate with a maturity date corresponding to the expected close of the merger. As of December 31, 2012, our investment in McMoRan was classified as Level 3 since the fair value was determined by utilizing significant inputs that were unobservable.
We determine the appropriate level for each financial asset and liability on a quarterly basis and recognize any transfers at the beginning of the reporting period.
The following table presents quantitative information about Level 3 inputs used in the fair value measurement of our commodity derivative contracts as of May 31, 2013 (in thousands):
| Quantitative Information About Level 3 Fair Value Measurements | ||||||||||
| Fair Value |
Valuation Technique |
Unobservable Input |
Range (Weighted Average) | |||||||
| May 31, 2013 |
||||||||||
| Commodity derivative contracts (1) |
||||||||||
| Crude oil puts |
$ | 373,595 | Option pricing model | Implied volatility | 19% - 70%(23%) | |||||
| Crude oil collars |
21,613 | Option pricing model | Implied volatility | 19% - 70%(27%) | ||||||
| (1) | Represents the range of implied volatility associated with the forward commodity prices used in the valuation of our derivative contracts. We have determined that a market participant would use a similar volatility curve when pricing similar commodity derivative contracts. |
The significant unobservable inputs used in the fair value measurement of our commodity derivative contracts are implied volatilities. Significant increases (decreases) in implied volatilities in isolation would result in a significantly higher (lower) fair value measurement.
F-77
Table of Contents
Index to Financial Statements
The following table presents a reconciliation of changes in fair value of financial assets and liabilities classified as Level 3 for the period from January 1, 2013, to May 31, 2013, and for the year ended December 31, 2012 (in thousands):
| January 1, 2013, to May 31, 2013 |
Year Ended December 31, 2012 |
|||||||||||||||
| Commodity Derivatives (1) |
Investments | Commodity Derivatives (1) |
Investments | |||||||||||||
| Fair value at beginning of period |
$ | 29,604 | $ | 818,223 | $ | 114,096 | $ | 611,671 | ||||||||
| Transfers into Level 3 (2) |
416,447 | — | 149 | — | ||||||||||||
| Transfers out of Level 3 (3) |
— | (848,130 | ) | (52,540 | ) | — | ||||||||||
| Purchases |
— | — | 12,830 | — | ||||||||||||
| Realized and unrealized gains and losses included in earnings (4) |
(50,843 | ) | 29,907 | 23,917 | 206,552 | |||||||||||
| Settlements |
— | — | (68,848 | ) | — | |||||||||||
|
|
|
|
|
|
|
|
|
|||||||||
| Fair value at end of period |
$ | 395,208 | $ | — | $ | 29,604 | $ | 818,223 | ||||||||
|
|
|
|
|
|
|
|
|
|||||||||
| Change in unrealized gains and losses relating to assets and liabilities held as of the end of the period (4) |
$ | (43,908 | ) | $ | 29,907 | $ | 16,774 | $ | 206,552 | |||||||
|
|
|
|
|
|
|
|
|
|||||||||
| (1) | Excludes deferred option premiums and interest. |
| (2) | During the period from January 1, 2013, to May 31, 2013, the inputs used to value certain of our 2013 and 2014 crude oil puts, and our 2015 crude oil puts were significantly unobservable and those contracts were transferred from Level 2 to Level 3. During the year ended December 31, 2012, the inputs used to value certain of our 2012 crude oil collars were significantly unobservable and those contracts were transferred from Level 2 to Level 3. |
| (3) | During the period from January 1, 2013, to May 31, 2013, the inputs used to value our investment in McMoRan were directly observable using quoted prices in active markets and our investment was transferred out of Level 3 and into Level 1. During the year ended December 31, 2012, the inputs used to value certain of our 2012 crude oil collars and certain of our 2013 crude oil puts were directly or indirectly observable and those contracts were transferred from Level 3 to Level 2. |
| (4) | Realized and unrealized gains and losses included in earnings for the period are reported as (loss) gain on mark-to-market derivative contracts and gain (loss) on investment measured at fair value in our consolidated statements of income for our commodity derivative contracts and our investment, respectively. |
Note 9 — Asset Retirement Obligation
The following table reflects the changes in our ARO during the period from January 1, 2013, to May 31, 2013, and for the year ended December 31, 2012 (in thousands):
| January 1, 2013, to May 31, 2013 |
Year Ended December 31, 2012 |
|||||||
| Asset retirement obligations at beginning of period |
$ | 584,501 | $ | 238,381 | ||||
| Liabilities incurred in acquisitions (1) |
— | 337,702 | ||||||
| Property dispositions and other |
— | (1,954 | ) | |||||
| Settlements |
(691 | ) | (4,565 | ) | ||||
| Change in estimate |
— | (7,427 | ) | |||||
| Accretion expense |
16,723 | 16,944 | ||||||
| Asset retirement additions |
3,413 | 5,420 | ||||||
|
|
|
|
|
|||||
| Asset retirement obligations at end of period (2) |
$ | 603,946 | $ | 584,501 | ||||
|
|
|
|
|
|||||
| (1) | During the year ended December 31, 2012, we recorded $337.7 million of additional abandonment liabilities in connection with the Gulf of Mexico Acquisition. See Note 3—Acquisitions. |
| (2) | $18.7 million and $18.5 million are included in other current liabilities at May 31, 2013, and December 31, 2012, respectively. |
F-78
Table of Contents
Index to Financial Statements
Note 10 — Stock-Based and Other Compensation Plans
We have three stock incentive plans: the 2004 Stock Incentive Plan, or 2004 Plan, which provides for a maximum of 8.4 million shares available for awards; the 2006 Incentive Plan, or the 2006 Plan, which provides for cash-settled stock-based awards; and the 2010 Incentive Award Plan, or the 2010 Plan, which provides for a maximum of 5.0 million shares available for awards. In September 2012, the Company’s 2002 Stock Incentive Plan expired per its terms along with the remaining ungranted awards. Our 2004 Plan and 2010 Plan provide for the grant of stock options and other awards (including performance units, performance shares, share awards, restricted stock, stock-settled RSUs and SARs) to our directors, officers, employees, consultants and advisors. The 2006 Plan provides for the grant of cash-settled SARs and cash-settled RSUs to non-officer employees and was amended in January 2012 to allow officers to participate in the plan. Our compensation committee may grant options and SARs on such terms, including vesting and payment forms, as it deems appropriate in its discretion, however, no option or SAR may be exercised more than ten years after its grant date, and the purchase price for incentive stock options and non-qualified stock options may not be less than 100 percent of the fair market value of our common stock on the date of grant. The compensation committee may grant restricted stock awards, RSUs, share awards, performance units and performance shares on such terms and conditions as it may decide in its discretion.
Upon an event constituting a “change in control” (as defined in the plans) of PXP, all SARs will become immediately exercisable in full. In addition, in such an event, unless otherwise determined by our compensation committee, or employee agreement, generally all other awards will vest and all restrictions on such awards will lapse. We may, at our discretion, issue new shares or use treasury shares to satisfy vesting requirements. Upon the closing of the merger, an event constituting a change in control occurred. See Note 2 – Merger with Freeport-McMoRan Inc. The disclosures and tables that follow are based on the existing terms of our stock-based compensation awards and do not reflect any impact of the Freeport-McMoRan Merger Agreement.
Stock-based compensation is measured at the grant date based on the calculated fair value of the award and for liability-classified awards is remeasured each reporting period. Stock-based compensation is recognized over the requisite employee service period (generally the vesting period of the grant). Stock-based compensation is expensed or capitalized based on the nature of the employee’s activities, and for the period from January 1, 2013, to May 31, 2013, and for the year ended December 31, 2012, was as follows (in thousands):
| January 1, 2013, to May 31, 2013 |
Year Ended December 31, 2012 |
|||||||
| Stock-based compensation included in: |
||||||||
| General and administrative |
$ | 21,935 | $ | 49,907 | ||||
| Lease operating expenses |
1,858 | 10,340 | ||||||
| Oil and natural gas properties |
8,825 | 18,543 | ||||||
|
|
|
|
|
|||||
| Total stock-based compensation including capitalization |
$ | 32,618 | $ | 78,790 | ||||
|
|
|
|
|
|||||
Stock-based compensation charged to expense for the period from January 1, 2013, to May 31, 2013, and for the year ended December 31, 2012, was as follows (in thousands):
| January 1, 2013, to May 31, 2013 |
Year Ended December 31, 2012 |
|||||||
| Charged to expense |
$ | 23,793 | $ | 60,247 | ||||
| Tax benefit |
(8,982 | ) | (22,532 | ) | ||||
|
|
|
|
|
|||||
| $ | 14,811 | $ | 37,715 | |||||
|
|
|
|
|
|||||
F-79
Table of Contents
Index to Financial Statements
At May 31, 2013, there was $298.4 million of total unrecognized compensation cost related to unvested stock-based compensation arrangements that is expected to be recognized over a weighted-average period of approximately 3.4 years.
SARs
SAR grants generally vest ratably over three years or 100 percent at the end of three years and expire within five years after the date of grant. These awards are similar to stock options, but are settled in cash rather than in shares of common stock and are classified as liability awards. Compensation cost for these awards is determined using a fair-value method and remeasured at each reporting date until the date of settlement. Compensation cost for those awards is based on the number of SARs ultimately expected to vest and has been reduced for estimated forfeitures.
The following table summarizes the status of our SARs at May 31, 2013, and the changes during the five-month period then ended:
| Number of SARs (thousands) |
Weighted- Average Exercise Price |
Aggregate Intrinsic Value ($ thousands) |
Weighted- Average Remaining Contractual Life (years) |
|||||||||||||
| Outstanding at January 1, 2013 |
2,219 | $ | 41.15 | |||||||||||||
| Granted |
622 | 47.70 | ||||||||||||||
| Exercised |
(548 | ) | 34.80 | |||||||||||||
| Forfeited or expired |
(632 | ) | 50.65 | |||||||||||||
|
|
|
|||||||||||||||
| Outstanding at May 31, 2013 |
1,661 | 42.09 | $ | 11,912 | 2.0 | |||||||||||
|
|
|
|
|
|
|
|||||||||||
| Exercisable at May 31, 2013 |
1,043 | 38.77 | $ | 11,168 | 0.6 | |||||||||||
|
|
|
|
|
|
|
|||||||||||
The total intrinsic value of SARs exercised during the period from January 1, 2013, to May 31, 2013, and for the year ended December 31, 2012, was $7.1 million and $18.6 million, respectively. The weighted-average grant date fair value per share for SARs granted during the period from January 1, 2013, to May 31, 2013, and for the year ended December 31, 2012, was $16.88 and $17.11, respectively.
We estimate the fair value of SARs granted using the Black-Scholes valuation model. The following assumptions were applied to grants during the period from January 1, 2013, to May 31, 2013, and for the year ended December 31, 2012:
| January 1, 2013, to May 31, 2013 |
Year Ended December 31, 2012 | |||
| Expected life (in years) |
1-4 | 1-4 | ||
| Volatility |
35.6% - 44.3% | 40.3% - 45.8% | ||
| Risk-free interest rate |
0.1% - 0.8% | 0.2% - 0.5% | ||
| Dividend yield |
0.0% | 0.0% |
The expected life represents the period of time that SARs granted are expected to be outstanding. We use historical experience with exercise and post-vesting exercise behavior to determine the expected life of the SARs granted. Expected volatility is based on the historical volatility of our common stock and other factors. The risk-free interest rate is based on the U.S. Treasury rate with a maturity date corresponding to the SARs’ expected life.
F-80
Table of Contents
Index to Financial Statements
Restricted Stock and Stock-settled RSUs
Our stock compensation plans allow grants of restricted stock and stock-settled RSUs. Restricted stock is issued on the grant date but is restricted as to transferability. Stock-settled RSU awards represent the right to receive common stock when vesting occurs.
Restricted stock and stock-settled RSU grants generally vest over periods ranging from one to five years of service. Compensation cost for these awards is based on the closing market price of our common stock on the date of grant. Compensation cost for these awards is based on the awards ultimately expected to vest and has been reduced for estimated forfeitures.
The following table summarizes the status of our restricted stock and stock-settled RSUs at May 31, 2013, and the changes during the five-month period then ended:
| Number of Awards (thousands) |
Weighted- Average Grant Date Fair Value Price |
Aggregate Intrinsic Value ($ thousands) |
Weighted- Average Remaining Contractual Life (years) |
|||||||||||||
| Nonvested at January 1, 2013 |
5,757 | $ | 43.11 | |||||||||||||
| Granted |
867 | 48.27 | ||||||||||||||
| Vested |
(822 | ) | 47.53 | |||||||||||||
| Vested or deferred |
(89 | ) | 38.65 | |||||||||||||
|
|
|
|||||||||||||||
| Nonvested at May 31, 2013 |
5,713 | 44.96 | $ | 279,294 | 3.8 | |||||||||||
|
|
|
|
|
|
|
|||||||||||
The total intrinsic value of restricted stock and stock-settled RSUs vested during the period from January 1, 2013, to May 31, 2013, and for the year ended December 31, 2012, was $42.5 million and $56.4 million, respectively. The intrinsic value was based upon the closing price of common stock on the date restricted stock and stock-settled RSUs vested. The weighted-average grant date fair value of stock-settled RSUs granted during the year ended December 31, 2012, was $42.56 per share.
In 2006, we granted 300,000 stock-settled RSUs to certain executives that vested upon change in control (as defined). As the conditions to the closing of the merger with Freeport-McMoRan as described in the Freeport-McMoRan Merger Agreement have not been satisfied, our assessment at this time is that change in control is not probable, and no compensation cost has been recognized for these awards.
The nonvested shares in the tables above include 1.6 million shares that were deemed granted in 2005 for accounting purposes under the 2004 Plan in accordance with the provisions of our Long-Term Retention and Deferred Compensation Plan. The plan allows certain executive officers to defer awards of equity compensation and in lieu thereof, an equivalent number of stock-settled RSUs available under stockholder-approved plans will be credited to an account for the executive. Under the terms of this plan, certain executives were granted the right under the 2004 Plan to receive annual RSU grants beginning in 2005 and continuing until 2014. Each annual credit is subject to continued service by the executive and all such future grants are deemed granted in 2005 for the purpose of determining stock-based compensation expense. The grants have varying vesting dates from 2013 through 2015, but payment of vested stock-settled RSUs will be generally deferred until September 30, 2015, subject to certain exceptions. At May 31, 2013, 1.2 million nonvested shares had been granted and 0.4 million nonvested shares will be granted thereafter in 2013 and in 2014.
In addition, under the terms of our Long-Term Retention and Deferred Compensation Plan, annual grants may be increased if certain common stock price targets are achieved. We used a Monte-Carlo simulation model to estimate the value and number of RSUs expected to be granted in the future. This model involves forecasting potential future stock price paths based on the expected return on the common stock and its volatility, then calculating the number of RSUs expected to be granted based on the results of the simulations.
F-81
Table of Contents
Index to Financial Statements
The following assumptions were used with respect to the Monte-Carlo simulation model:
| Expected annual return |
9.80 | % | ||
| Expected daily return |
0.04 | % | ||
| Daily standard deviation |
2.09 | % |
We estimated that 0.4 million restricted units would be granted as a result of achieving the common stock price targets. Such units had a weighted-average fair value of $46.61 per unit, an aggregate fair value of $18.7 million and a weighted-average remaining contractual life of six years.
The tables above also include 1.0 million stock-settled RSUs deemed granted in 2008 for accounting purposes. An executive was granted the right to receive five annual grants of 200,000 stock-settled RSUs beginning in September 2015 and continuing until 2019. Each annual grant is subject to continued service by the executive. The first three annual grants will each vest in full in 2020, and the fourth and fifth annual grants will each vest ratably over a three-year period from the date of the grant. The grant date for accounting purposes for all 1.0 million of these stock-settled RSUs is March 2008.
At certain times a sufficient number of shares are not available for issuance under our stock compensation plans to satisfy all awards deemed granted for accounting purposes. At such times, we have reclassified and accounted for as liability awards the number of shares deemed granted in excess of available shares, until such time that the number of available shares is increased to a sufficient level to satisfy such awards, at which point the awards are reclassified back to equity awards.
Cash-settled RSUs
Our stock compensation plan allows grants of cash-settled RSUs. These awards are similar to stock-settled RSUs, but are settled in cash rather than in shares of common stock and are classified as liability awards. Cash-settled RSU awards represent the right to receive cash payment equal to the average of our common stock closing price for the five trading days immediately prior to vesting.
Cash-settled RSUs generally vest over periods ranging from three to five years of service. Compensation cost for these awards is determined and remeasured by the closing market price of our common stock at each reporting date until the vesting date, when it is settled in cash. Compensation cost for these awards is based on the awards ultimately expected to vest and has been reduced for estimated forfeitures.
The following table summarizes the status of our cash-settled RSUs at May 31, 2013, and the changes during the five-month period then ended:
| Number of Awards (thousands) |
Weighted- Average Grant Date Fair Value Price |
Aggregate Intrinsic Value ($ thousands) |
Weighted- Average Remaining Contractual Life (years) |
|||||||||||||
| Nonvested at January 1, 2013 |
1,426 | $ | 43.06 | |||||||||||||
| Granted |
1,586 | 46.95 | ||||||||||||||
| Vested |
(373 | ) | 43.17 | |||||||||||||
| Forfeited |
(8 | ) | 45.25 | |||||||||||||
|
|
|
|||||||||||||||
| Nonvested at May 31, 2013 |
2,631 | 45.39 | $ | 128,652 | 3.0 | |||||||||||
|
|
|
|
|
|
|
|||||||||||
The total intrinsic value of cash-settled RSUs vested for the period from January 1, 2013, to May 31, 2013, was $17.6 million. The intrinsic value was based upon the average closing price of common stock on the cash-settled RSUs vesting date.
F-82
Table of Contents
Index to Financial Statements
We granted 225,000 cash-settled RSUs for the period from January 1, 2013, to May 31, 2013, and for the year ended December 31, 2012, that are subject to a market condition in which the price performance of PXP’s common stock is compared to an average of two peer indices. Based on the performance, these units may settle upon vesting at 0 percent to 150 percent of the number of awards granted as determined by linear interpolation. The first market-condition period was reached as of December 31, 2012. Based on the performance of PXP’s common stock, 34,000 additional unvested cash-settled RSUs were awarded and vested in the period from January 1, 2013, to May 31, 2013.
We used a Monte-Carlo simulation model to estimate the fair value of the cash-settled RSUs subject to the market condition. This model involves forecasting potential future stock price paths based on the expected return on our common stock and the indices and their volatility, then calculating the fair value of RSUs to be granted based on the results of the simulations. On the grant date, we estimated the units granted in the period from January 1, 2013, to May 31, 2013, had a weighted-average fair value of $40.17 per unit, an aggregate fair value of $9.0 million and a weighted-average remaining contractual life of 2.1 years. On the grant date, we estimated the units granted in the year ended December 31, 2012, had a weighted-average fair value of $43.41 per unit, an aggregate fair value of $9.8 million and a weighted-average remaining contractual life of 2.1 years.
The following assumptions were used with respect to the Monte-Carlo simulation model:
| January 1, 2013, to May 31, 2013 |
Year Ended December 31, 2012 |
|||||||
| Risk-free interest rate |
0.44 | % | 0.41 | % | ||||
| Expected volatility |
44.62 | % | 51.60 | % | ||||
| Expected term (in years) |
2.90 | 2.90 | ||||||
We have certain awards that have vested, but the issuance of those common shares has been deferred. During the period from January 1, 2013, to May 31, 2013, and for the year ended December 31, 2012, approximately 89,176 and 308,000 common shares, respectively, vested and were deferred resulting in a total of approximately 1,443,080 deferred common shares at May 31, 2013. These common shares will be issued upon the earliest of a change in control, the deferral date or the recipient’s retirement or death.
Other
We have a 401(k) defined contribution plan whereby we have matched 100 percent of an employee’s contribution (subject to certain limitations in the plan). For the period from January 1, 2013, to May 31, 2013, we made cash contributions totaling $8.7 million. For the year ended December 31, 2012, we made cash contributions totaling $11.6 million and accrued a supplemental contribution of $2.7 million, which was paid in 2013.
Note 11 — Income Taxes
For the period from January 1, 2013, to May 31, 2013, and for the year ended December 31, 2012, our geographic source of income (loss) before income taxes consisted of (in thousands):
| January 1, 2013, to May 31, 2013 |
Year Ended December 31, 2012 |
|||||||
| U.S. |
$ | 383,036 | $ | 514,272 | ||||
| Non U.S. |
3 | (175 | ) | |||||
|
|
|
|
|
|||||
| $ | 383,039 | $ | 514,097 | |||||
|
|
|
|
|
|||||
F-83
Table of Contents
Index to Financial Statements
For the period from January 1, 2013, to May 31, 2013, and for the year ended December 31, 2012, our income tax expense (benefit) consisted of (in thousands):
| January 1, 2013, to May 31, 2013 |
Year Ended December 31, 2012 |
|||||||
| Current |
||||||||
| U.S. Federal |
$ | 4,334 | $ | (3,000 | ) | |||
| State |
1,285 | (1,102 | ) | |||||
|
|
|
|
|
|||||
| 5,619 | (4,102 | ) | ||||||
|
|
|
|
|
|||||
| Deferred |
||||||||
| U.S. Federal |
153,828 | 199,615 | ||||||
| State |
(50,931 | ) | (24,203 | ) | ||||
|
|
|
|
|
|||||
| 102,897 | 175,412 | |||||||
|
|
|
|
|
|||||
| $ | 108,516 | $ | 171,310 | |||||
|
|
|
|
|
|||||
Tax carryforwards at May 31, 2013, which are available for future utilization on income tax returns, are as follows (in thousands):
| Amount | Expiration | |||||
| FEDERAL - PXP and Consolidated Subsidiaries |
||||||
| Alternative minimum tax (AMT) credit |
$ | 6,270 | — | |||
| Enhanced oil recovery credit |
35,424 | 2025 | ||||
| Net operating loss - regular tax |
756,669 | 2031 - 2032 | ||||
| Net operating loss - AMT tax |
257,863 | 2031 - 2032 | ||||
| FEDERAL - Plains Offshore |
||||||
| Net operating loss - regular tax |
$ | 211,747 | 2031 - 2033 | |||
| Net operating loss - AMT tax |
43,988 | 2031 - 2033 | ||||
| STATE - PXP and Combined Subsidiaries |
||||||
| AMT credit |
$ | 521 | — | |||
| Enhanced oil recovery credit |
22,296 | 2016 - 2020 | ||||
| Net operating loss - regular tax |
1,349,200 | 2021 - 2032 | ||||
| Net operating loss - AMT tax |
319,199 | 2031 - 2032 | ||||
Set forth below is a reconciliation between the income tax provision computed at the U.S. statutory rate on income before income taxes and the income tax provision in the consolidated statements of income (in thousands):
| January 1, 2013, to May 31, 2013 |
Year Ended December 31, 2012 |
|||||||||||||||
| Amount | Percent | Amount | Percent | |||||||||||||
| U.S. federal income tax provision at statutory rate |
$ | 134,064 | 35 | % | $ | 179,933 | 35 | % | ||||||||
| State income taxes, net of federal expense |
(32,118 | )(1) | (8 | ) | (25,305 | )(2) | (5) | |||||||||
| Non-deductible expenses |
990 | — | 14,852 | 3 | ||||||||||||
| Uncertain tax positions |
— | — | 698 | — | ||||||||||||
| Other |
5,580 | 1 | 1,132 | — | ||||||||||||
|
|
|
|
|
|
|
|
|
|||||||||
| Income tax expense on income before income taxes |
$ | 108,516 | 28 | % | $ | 171,310 | 33 | % | ||||||||
|
|
|
|
|
|
|
|
|
|||||||||
| (1) | Includes a net tax benefit of $45.2 million related to the reduction of state deferred tax liabilities as a result of the termination of a tax partnership. |
| (2) | Includes a net tax benefit of $31.5 million related to the reduction of state deferred tax liabilities as a result of the Gulf of Mexico Acquisition. |
F-84
Table of Contents
Index to Financial Statements
Tax Relationship with Plains Offshore. As of May 31, 2013, and December 31, 2012, Plains Offshore was not consolidated with us for federal income tax purposes. Plains Offshore files a separate federal tax return and has its own federal tax loss carryforwards and other tax attributes. Plains Offshore may or may not be combined with us and our other subsidiaries for state tax filing purposes dependent upon the applicable state tax rules. We and Plains Offshore have entered into a Tax Matters Agreement, or TMA, which governs Plains Offshore’s and our respective rights, responsibilities, and obligations with respect to the filing of tax returns, payment of taxes, conduct of tax audits and certain other tax matters.
Under the TMA, Plains Offshore is obligated to reimburse us for its share of taxes that are paid by us and can receive payment from us for any Plains Offshore tax attributes utilized by us related to our tax returns filed on a consolidated, combined or unitary basis including Plains Offshore but only to the extent and at such time as Plains Offshore would have paid the tax or utilized such attributes on a separate return basis. To the extent Plains Offshore files tax returns which are not consolidated, combined or unitary with us, Plains Offshore pays its tax liabilities directly to the applicable taxing authority.
Tax Loss and Credit Carryovers. Certain of our U.S. and state tax loss and credit carryovers are, or may become, subject to federal or state income tax limitations as to the amount that can be used each year. We do not expect these limitations to materially impact our ability to utilize these losses.
Valuation Allowance. In assessing the realizability of deferred tax assets, we consider whether it is more likely than not that some portion or all of the related deferred tax benefits will not be realized. We consider the scheduled reversal of deferred tax liabilities, projected future income and tax planning strategies in making the assessment of whether it is more likely than not that some portion or all of our deferred tax assets will not be realized. Based on this assessment as of May 31, 2013, and December 31, 2012, no valuation allowances were necessary.
Other Tax Matters. We did not record a tax benefit related to non-cash employee compensation for January 1, 2013, to May 31, 2013, and for the year ended December 31, 2012, since we did not recognize an incremental tax benefit due to a net operating loss carryforward. As the Company utilizes its net operating loss in future periods, a tax benefit of $6.8 million will be credited to additional paid-in capital as a result of the non-cash employee compensation that vested between January 1, 2011 and May 31, 2013.
Unrecognized Tax Benefits. Our balance of net unrecognized tax benefits did not change during the period from January 1, 2013, to May 31, 2013. During 2012, our balance of net unrecognized tax benefits increased by $0.7 million related to certain state tax positions under audit and later decreased by $0.7 million when these same state tax audits were concluded.
We do not anticipate a change in our balance of net unrecognized tax benefits over the next twelve months. Included in the balance at May 31, 2013, is approximately $6.9 million that would affect our effective tax rate if recognized. The difference between this amount and the $7.3 million ending balance of gross unrecognized tax benefits represents the federal benefit of state tax positions.
We had approximately $2.9 million and $2.5 million of accrued interest on unrecognized tax benefits as of May 31, 2013, and December 31, 2012, respectively. We did not have any accrued penalties related to unrecognized tax benefits for the period from January 1, 2013, to May 31, 2013, and for the year ended December 31, 2012.
We file income tax returns in the U.S. federal and various state and foreign jurisdictions. As of May 31, 2013, we are not under examination by the Internal Revenue Service (IRS) and are no longer subject to U.S. federal income tax examinations for years prior to 2007 except for certain tax credit carryforwards generated before 2007, but utilized after 2006. In October 2013, the IRS conducted a limited scope review of certain
F-85
Table of Contents
Index to Financial Statements
elements of PXP’s 2008, 2009, and 2010 tax returns. As a part of that review, we agreed to an extension of the statute of limitations for both the 2008, and 2009 PXP tax years until December 2015.
We are currently undergoing an audit by the state of California with regard to our 2007 and 2008 California income tax returns. We are not currently under examination in any other states. In all states except California and Louisiana, we are no longer subject to state income tax examinations by the relevant tax authorities for years prior to 2009. For California, we are no longer subject to state income tax examinations for years prior to 2007, except for certain California tax loss and credit carryforwards generated before 2007 but utilized after 2006. For Louisiana, we are no longer subject to state income tax examinations for years prior to 2009 except for certain Louisiana tax loss carryforwards generated before 2009, but utilized after 2008.
Note 12 — Commitments, Contingencies and Industry Concentration
Commitments and Contingencies
Operating Leases. Our operating leases relate primarily to obligations associated with aircraft and office facilities. Future non-cancellable commitments related to these leases are as follows (in thousands):
| 2013 |
$ | 8,591 | ||
| 2014 |
15,492 | |||
| 2015 |
14,482 | |||
| 2016 |
13,792 | |||
| 2017 |
14,270 | |||
| Thereafter |
30,588 | |||
|
|
|
|||
| $ | 97,215 | |||
|
|
|
Total expenses related to such leases were $6.3 million and $13.9 million for the period from January 1, 2013, to May 31, 2013, and for the year ended December 31, 2012, respectively.
Contractual Obligations. We have entered into various commitments and operating agreements associated with, among other things, oil and natural gas exploration, development and production activities, gathering and transportation, drilling rig and oilfield and other services. At May 31, 2013, aggregate future obligations under these agreements, described below, total $2.0 billion, of which approximately $157.1 million is expected to be paid in the remainder of 2013, $129.7 million in 2014, $475.0 million in 2015, $534.3 million in 2016, $485.3 million in 2017 and $183.8 million thereafter.
We have contracted with an affiliate of Noble Corporation for the Noble Sam Croft and Noble Tom Madden new-build drillships that will support our deepwater Gulf of Mexico drilling activity, which are included in our contractual obligations. The drilling contracts for the Noble Sam Croft and the Noble Tom Madden each provide for a firm three-year commitment that began in the fourth quarter of 2014 and first quarter of 2015, respectively, at rates of $0.6 million per day. Such rates are subject to standard reimbursement and contractual escalation provisions. The drilling contracts each further require us to pay $24.0 million for mobilization.
We have also contracted for an existing drillship to be assigned to us from a third party, which will further support our deepwater Gulf of Mexico drilling activity. The drilling contract provided for a 270 day assignment period including mobilization began in mid-2014 at rates of $0.6 million per day.
Through our ownership in Lucius, located in the deepwater U.S. Gulf of Mexico, we joined the Lucius and Hadrian working interest partners and executed a unit participation and unit operating agreement effective June 1, 2011. As part of the agreements, we have agreed to share in our portion of certain costs for construction and installation of the production facility and subsea infrastructure, long-lead equipment orders and detailed engineering work and have a commitment totaling $161.4 million as of May 31, 2013, remaining under the development plan.
F-86
Table of Contents
Index to Financial Statements
Plains Offshore and its partners have entered into various agreements with third parties totaling $199.1 million for long-term oil and natural gas gathering and transportation services at the Lucius oil field. Beginning in 2014, Plains Offshore will pay guaranteed fixed minimum monthly fees plus additional variable gathering fees based upon actual throughput. The commitments of Plains Offshore under the oil gathering agreements are guaranteed by FM O&G.
We have commitments for hydraulic fracturing services, coil tubing services and drilling rig contracts with terms from one year up to three years primarily to perform our Eagle Ford shale drilling program.
Offshore Morocco Exploration. In 2013, PXP entered into a definitive agreement to participate in an exploration program offshore the Kingdom of Morocco. We have assumed all the rights, responsibilities and obligations of PXP under the agreement. We made a cash payment of $15.0 million to farm-in to Pura Vida Energy’s 75 percent working interest in the approximate 2.7 million-acre Mazagan permit area in the Essaouira Basin offshore Morocco. We earned a 52 percent working interest and act as operator in exchange for funding 100 percent of the costs of certain specified exploration activities that include a commitment to fund and drill two wells, and various additional exploration operations subject to a maximum of $215.0 million.
Environmental Matters. As an owner or lessee and operator of oil and natural gas properties, we are subject to various federal, state and local laws and regulations relating to discharge of materials into, and protection of, the environment. Often these regulations are more burdensome on older properties that were operated before the regulations came into effect such as some of our properties in California that have operated for over 100 years. We have established policies for continuing compliance with environmental laws and regulations. We also maintain insurance coverage for environmental matters which we believe is customary in the industry, but we are not fully insured against all environmental risks. There can be no assurance that current or future local, state or federal rules and regulations will not require us to spend material amounts to comply with such rules and regulations.
In California, the California Air Resources Board, or CARB, has developed regulations pursuant to the California Global Warming Solutions Act of 2006, or Assembly Bill 32, that are intended to achieve an overall reduction in greenhouse gas emissions to 1990 levels, a 15 percent reduction by 2020. Because several of our operations emit greenhouse gases in excess of 25,000 metric tons per year, various operations in California are subject to the requirements of this program. In October 2011, CARB adopted the final Cap and Trade regulation which is intended to implement the Cap and Trade Program under Assembly Bill 32. The regulation established three separate three-year compliance periods as follows: 2012 to 2014, 2015 to 2017 and 2018 to 2020. The regulation required regulated entities to “true up” their emission offset obligations by the end of each three-year obligation period. Due to time constraints on implementing the Cap and Trade Program, the regulation included a provision which would forego the requirement of regulated entities to surrender compliance instruments for their emissions the first year of the first compliance period. The first year that required regulated entities to surrender compliance instruments was for 2013 emissions, and we are in the process of acquiring our required allowances. Compliance with these regulations require companies to periodically secure instruments known as offsets and allowances, each of which is equal to one metric ton of emissions under the Cap and Trade program. The price of these instruments will vary in accordance with market conditions. The total amount of instruments we owe will vary annually based on the total greenhouse gas emissions registered in any one year and the number of “free allowances” issued by CARB annually. In November 2012, CARB held the first public auction of allowance instruments for regulated entities to begin meeting their compliance obligations. The settling price in the auction placed the price at $10.09 per allowance. In 2011, our California properties subject to regulation under Assembly Bill 32 emitted 955,000 metric tons of greenhouse gas emissions. In 2012, we were issued 644,000 free allowances by CARB based on estimated emissions using our 2011 verified emissions data.
Surety and Oil Spill Financial Responsibility Requirements. As a lessee in the deepwater U.S. Gulf of Mexico, we must comply with regulations set forth by the U.S. Bureau of Ocean Energy Management (“BOEM”) and the Bureau of Safety and Environmental Enforcement (“BSEE”), (together “BOEM/BSEE”), and hold any
F-87
Table of Contents
Index to Financial Statements
bonds, or provide the financial assurances, required for our leases in federal waters. To cover the various obligations of lessees in federal waters, the BOEM/BSEE generally requires that lessees have substantial U.S. assets and net worth or post bonds or other acceptable assurances that such obligations will be met. We are subject to the following types of surety requirements with BOEM: (i) general lessee or operator’s bonds required to accept title to any lease in federal waters, (ii) supplemental bonding, which is required to be provided by all lessees and specifically covers the plugging and abandonment obligations associated with a lease, and (iii) oil spill financial responsibility, generally provided by operators pursuant to the Oil Pollution Act of 1990 as amended (“OPA”). The OPA imposes a variety of requirements related to the prevention of and response to oil spills into waters of the U.S., including the Outer Continental Shelf, which includes the U.S. Gulf of Mexico. The OPA subjects operators of offshore leases and owners and operators of oil handling facilities to strict joint and several liability for all containment and cleanup costs and certain other damages arising from a spill, including, but not limited to, the costs of responding to a release of oil, natural resource damages, and economic damages suffered by persons adversely affected by an oil spill. The OPA also requires owners and operators of offshore oil production facilities to establish and maintain evidence of financial responsibility to cover costs that could be incurred in responding to an oil spill. The OPA currently requires a minimum financial responsibility demonstration of $35 million for companies operating oil production facilities on the Outer Continental Shelf, although the Secretary of Interior may increase this amount up to $150 million in certain situations. The cost of these bonds or other surety could be substantial and there is no assurance that bonds or other surety could be obtained in all cases.
Plugging, Abandonment and Remediation Obligations. Consistent with normal industry practices, substantially all of our oil and natural gas leases require that, upon termination of economic production, the working interest owners plug and abandon non-producing wellbores, remove platforms, tanks, production equipment and flow lines and restore the wellsite. We estimate our remaining 2013 cash expenditures related to plugging, abandonment and remediation will be approximately $18.7 million. Typically, when producing oil and natural gas assets are purchased, the purchaser assumes the obligation to plug and abandon wells and facilities that are part of such assets. However, in some instances, we have received an indemnity with respect to those costs. We cannot be assured that we will be able to collect on these indemnities.
Although our offshore California properties have a shorter reserve life, third parties have retained the majority of the obligations for abandoning these properties, which include the Point Arguello Unit, offshore California, where the companies from which we purchased our interests retained responsibility for: (1) removing, dismantling and disposing of the existing offshore platforms; (2) removing and disposing of all existing pipelines; and (3) removing, dismantling, disposing and remediating all existing onshore facilities. We are responsible for our 69.3 percent share of other abandonment costs which primarily consist of well bore abandonments, conductor removals and site cleanup and preparation.
In connection with PXP’s sale of certain properties offshore California in December 2004, we have the responsibility for certain abandonment costs, including removing, dismantling and disposing of the existing offshore platforms. The present value of such abandonment costs, $94.7 million ($151.3 million undiscounted), is included in our AROs. In addition, we guarantee the performance of the purchaser with respect to the remaining abandonment obligations related to the properties ($84.3 million). To secure its abandonment obligations, the purchaser of the properties is required to periodically deposit funds into an escrow account. At May 31, 2013, the escrow account had a balance of $23.9 million. The fair value of our guarantee at May 31, 2013 ($0.3 million), considers the payment/performance risk of the purchaser and is classified as other long-term liabilities.
Operating Risks and Insurance Coverage. Our operations are subject to all of the risks normally incident to the exploration for and the production of oil and natural gas, including well blowouts, cratering, explosions, oil spills, releases of gas or well fluids, fires, pollution and releases of toxic gas, each of which could result in damage to or destruction of oil and natural gas wells, production facilities or other property or injury to persons. Our operations in California, including transportation of oil by pipelines within the city and county of Los Angeles, are especially susceptible to damage from earthquakes and involve increased risks of personal
F-88
Table of Contents
Index to Financial Statements
injury, property damage and marketing interruptions because of the population density of southern California. We maintain coverage for earthquake damages in California but this coverage may not provide for the full effect of damages that could occur and we may be subject to additional liabilities. Although we maintain insurance coverage considered to be customary in the industry, we are not fully insured against all risks, either because insurance is not available or because of high premium costs. We are self-insured for named windstorms in the Gulf of Mexico. The occurrence of a significant event that is not fully insured against could have a material adverse effect on our financial position. Our insurance does not cover every potential risk associated with operating our pipelines, including the potential loss of significant revenues. Consistent with insurance coverage generally available to the industry, our insurance policies provide limited coverage for losses or liabilities relating to pollution, resulting from sudden and accidental occurrences.
In the event we make a claim under our insurance policies, we will be subject to the credit risk of the insurers. Volatility and disruption in the financial and credit markets may adversely affect the credit quality of our insurers and impact their ability to pay out claims.
Firm Delivery Commitments. Beginning in December 2012, we have oil and gas production volume delivery commitments. If we are unable to meet the commitments to deliver this production, our maximum financial commitment at May 31, 2013, would be $47.7 million over the remaining contract term. We currently have sufficient reserves and production capacity to fulfill this commitment. As of May 31, 2013, our delivery commitments for the next five years and thereafter were as follows:
| Oil (MBbl) |
||||
| 2013 |
2,019 | |||
| 2014 |
4,473 | |||
| 2015 |
5,475 | |||
| 2016 |
5,490 | |||
| 2017 |
5,010 | |||
| Thereafter |
— | |||
|
|
|
|||
| 22,467 | ||||
|
|
|
|||
Shareholder Class Actions. Beginning on December 5, 2012, 26 purported shareholder class actions were filed challenging the merger of the Company with FCX and the McMoRan Merger. The lawsuits were filed against PXP, FCX and McMoRan, and the boards of these companies as well as certain other named individuals. The shareholder class actions generally allege that the boards of these companies breached fiduciary duties and adversely affected shareholders by approving the PXP merger and the McMoRan merger.
On April 7, 2015, the Delaware Court of Chancery approved the settlement of FCX’s consolidated stockholder derivative litigation captioned In Re Freeport-McMoRan Copper & Gold Inc. Derivative Litigation, No. 8145-VCN, and awarded the plaintiffs’ legal fees and expenses. This settlement resolved all pending derivative claims against directors and officers of FCX, the terms of which are not material to PXP or its successor.
During the first quarter of 2015, insurers under FCX’s directors and officers liability insurance policies funded an escrow account with the $115 million settlement amount, and in May 2015, Credit Suisse funded an additional $10 million to the escrow account. Proceeds from the escrow account, net of plaintiffs’ legal fees and expenses, were released to FCX in May 2015. As a result and in accordance with the approved settlement terms, FCX expects the Board to declare a special dividend of approximately $115 million ($0.11 per share) that would be payable in early August 2015, corresponding with the timing of FCX’s next regular quarterly dividend.
F-89
Table of Contents
Index to Financial Statements
Other Commitments and Contingencies. We are a defendant in various lawsuits arising in the ordinary course of our business. While the outcome of these lawsuits cannot be predicted with certainty and could have a material adverse effect on our financial position, we do not believe that the outcome of these legal proceedings, individually or in the aggregate, will have a material adverse effect on our financial condition.
Industry Concentration
Financial instruments that potentially subject us to concentrations of credit risk consist principally of accounts receivable with respect to our oil and natural gas operations and commodity derivative instruments.
During the period from January 1, 2013, to May 31, 2013, and for the year ended December 31, 2012, sales to the following purchasers accounted for the percentages of our total revenues as follows:
| January 1, 2013, to May 31, 2013 |
Year Ended December 31, 2012 |
|||||||
| ConocoPhillips |
— | (1) | 14 | % | ||||
| Phillips 66 |
44 | % | 35 | % | ||||
| Valero Energy Corporation |
— | (1) | 17 | % | ||||
| (1) | Sales accounted for less than 10 percent of our total revenues. |
During the period from January 1, 2013, to May 31, 2013, and for the year ended December 31, 2012, no other purchaser accounted for more than 10% of our total revenues.
Note 13 — Supplemental Cash Flow Information
Cash payments (receipts) for interest and income taxes were as follows (in thousands):
| January 1, 2013, to May 31, 2013 |
Year Ended December 31, 2012 |
|||||||
| Cash payments for interest (net of capitalized interest) |
$ | 227,198 | $ | 194,917 | ||||
| Cash payments (receipts) for income taxes |
6,177 | (8,030 | ) | |||||
At May 31, 2013, and December 31, 2012, accrued capital expenditures were $270.8 million and $225.2 million, respectively.
Common stock and treasury shares issued in connection with our compensation plans were as follows (in thousands):
| January 1, 2013, to May 31, 2013 |
Year Ended December 31, 2012 |
|||||||
| Shares (1) |
531 | 733 | ||||||
|
|
|
|
|
|||||
| Amount (1) |
$ | 25,240 | $ | 31,014 | ||||
|
|
|
|
|
|||||
| (1) | The number of shares is net of shares withheld for employee taxes, and the amount is based on the grant date price. |
Noncash oil and gas property reductions and additions included non-cash additions to oil and gas properties of $3.4 million and $350.7 million for the period from January 1, 2013, to May 31, 2013, and for the year ended December 31, 2012, respectively, related to our AROs. The 2012 noncash additions to oil and gas properties are primarily attributable to obligations assumed in connection with the Gulf of Mexico Acquisition.
F-90
Table of Contents
Index to Financial Statements
Certain of our commodity derivative contracts include deferred premiums to be paid to the counterparty based on the settlement terms specified in the contract. During 2012, we entered into derivative contracts with deferred premiums of $470.7 million. In connection with our February 2012 derivative transactions, we converted 5,000 barrels of oil per day (BOPD) of Brent crude oil put option contracts for 2013 to three-way collars and eliminated approximately $11.3 million of deferred premiums and interest.
Note 14 — Equity
Pursuant to the terms of the Freeport-McMoRan Merger Agreement, on the closing of the merger, all outstanding PXP common stock was converted into the right to receive, at the election of the holder, the cash consideration or the stock consideration, subject to the proration specified within the Freeport-McMoRan Merger Agreement. See Note 2 – Merger with Freeport-McMoRan Inc. The disclosures and tables that follow are based on the existing terms of our equity and do not reflect any impact of the Freeport-McMoRan Merger Agreement.
Earnings Per Common Share
Weighted-average common shares outstanding for computing basic and diluted earnings per share were as follows (in thousands):
| January 1, 2013, to May 31, 2013 |
Year Ended December 31, 2012 |
|||||||
| Common shares outstanding - basic |
130,522 | 129,925 | ||||||
| Unvested restricted stock, restricted stock units and stock options |
2,296 | 1,942 | ||||||
|
|
|
|
|
|||||
| Common shares outstanding - diluted |
132,818 | 131,867 | ||||||
|
|
|
|
|
|||||
Included in computing our basic earnings per common share are certain awards that have vested, but, at the election of the award recipients, the issuance of those common shares has been deferred. For the year ended December 31, 2012, 0.2 million restricted stock units (none for the period from January 1, 2013, to May 31, 2013) were excluded in computing diluted earnings per common share because they were antidilutive based on the treasury stock method.
In computing our earnings per share for the period from January 1, 2013, to May 31, 2013, and for the year ended December 31, 2012, we decreased our reported net income by $18.4 million and $36.4 million, respectively, for preferred stock dividends attributable to the noncontrolling interest associated with our consolidated subsidiary Plains Offshore. We owned 100 percent of the common shares of Plains Offshore during the period from January 1, 2013, to May 31, 2013, and for the year ended December 31, 2012, and because Plains Offshore had a net loss for the period from January 1, 2013, to May 31, 2013, and for the year ended December 31, 2012, we did not allocate any undistributed earnings to the noncontrolling interest preferred stock. In the event that Plains Offshore has net income in future periods, we will be required to allocate distributed and undistributed earnings between the common and preferred shares of Plains Offshore.
Note 15 — Consolidating Financial Statements
We are the issuer of 7 5⁄8% Senior Notes due 2018, 6 1⁄8% Senior Notes, 8 5⁄8% Senior Notes, 7 5⁄8% Senior Notes due 2020, 6 1⁄2% Senior Notes, 6 5⁄8% Senior Notes, 6 3⁄4% Senior Notes and 6 7⁄8% Senior Notes as of May 31, 2013, which are jointly and severally guaranteed by certain of our existing domestic subsidiaries (referred to as “Guarantor Subsidiaries”). In the future, a subsidiary guarantor’s guarantee may be released or terminated under the following circumstances: (i) in connection with any sale or other disposition of all or substantially all of the assets of that subsidiary guarantor; (ii) in connection with any sale or other disposition of all the capital stock of that subsidiary guarantor; (iii) if designated to be an unrestricted subsidiary; (iv) upon
F-91
Table of Contents
Index to Financial Statements
legal defeasance or satisfaction and discharge of the indenture; (v) upon the liquidation or dissolution of that subsidiary guarantor provided no default or event of default has occurred or is continuing; or (vi) at such time as that subsidiary guarantor does not have outstanding any guarantee of any of our or any of our other subsidiary guarantors’ indebtedness (other than the notes) in excess of $10.0 million in aggregate principal amount. Certain of our subsidiaries do not guarantee these Senior Notes (referred to as “Non-Guarantor Subsidiaries”).
The following financial information presents consolidating financial statements, which include:
| • | PXP (the “Issuer”); |
| • | the Guarantor Subsidiaries on a combined basis; |
| • | the Non-Guarantor Subsidiaries on a combined basis; |
| • | elimination entries necessary to consolidate the Issuer, Guarantor Subsidiaries and Non-Guarantor Subsidiaries; and |
| • | PXP on a consolidated basis. |
F-92
Table of Contents
Index to Financial Statements
PLAINS EXPLORATION & PRODUCTION COMPANY
(Predecessor)
CONDENSED CONSOLIDATING STATEMENT OF INCOME
JANUARY 1, 2013, to MAY 31, 2013
(in thousands)
| Issuer | Guarantor Subsidiaries |
Non- Guarantor Subsidiaries |
Intercompany Eliminations |
Consolidated | ||||||||||||||||
| Revenues |
||||||||||||||||||||
| Oil sales |
$ | 1,027,793 | $ | 884,465 | $ | — | $ | — | $ | 1,912,258 | ||||||||||
| Gas sales |
25,322 | 102,076 | — | — | 127,398 | |||||||||||||||
| Other operating revenues |
280 | 1,866 | — | — | 2,146 | |||||||||||||||
|
|
|
|
|
|
|
|
|
|
|
|||||||||||
| 1,053,395 | 988,407 | — | — | 2,041,802 | ||||||||||||||||
|
|
|
|
|
|
|
|
|
|
|
|||||||||||
| Costs and Expenses |
||||||||||||||||||||
| Production costs |
235,609 | 169,285 | 1,105 | — | 405,999 | |||||||||||||||
| General and administrative |
87,519 | 18,536 | 3,305 | — | 109,360 | |||||||||||||||
| DD&A and accretion |
287,181 | 431,224 | 233 | 171,530 | 890,168 | |||||||||||||||
| Other operating expense |
1,088 | 7,350 | — | — | 8,438 | |||||||||||||||
|
|
|
|
|
|
|
|
|
|
|
|||||||||||
| 611,397 | 626,395 | 4,643 | 171,530 | 1,413,965 | ||||||||||||||||
|
|
|
|
|
|
|
|
|
|
|
|||||||||||
| Income (Loss) from Operations |
441,998 | 362,012 | (4,643 | ) | (171,530 | ) | 627,837 | |||||||||||||
| Other Income (Expense) |
||||||||||||||||||||
| Equity in earnings of subsidiaries |
59,580 | — | — | (59,580 | ) | — | ||||||||||||||
| Interest expense |
(101,915 | ) | (127,299 | ) | (3,147 | ) | — | (232,361 | ) | |||||||||||
| Debt extinguishment costs |
(18,052 | ) | — | — | — | (18,052 | ) | |||||||||||||
| Loss on mark-to-market derivative contracts |
(24,688 | ) | — | — | — | (24,688 | ) | |||||||||||||
| Gain on investment measured at fair value |
29,907 | — | — | — | 29,907 | |||||||||||||||
| Other income |
336 | 54 | 6 | — | 396 | |||||||||||||||
|
|
|
|
|
|
|
|
|
|
|
|||||||||||
| Income (Loss) Before Income Taxes |
387,166 | 234,767 | (7,784 | ) | (231,110 | ) | 383,039 | |||||||||||||
| Income tax (expense) benefit |
(131,014 | ) | (34,601 | ) | 5,188 | 51,911 | (108,516 | ) | ||||||||||||
|
|
|
|
|
|
|
|
|
|
|
|||||||||||
| Net Income (Loss) |
256,152 | 200,166 | (2,596 | ) | (179,199 | ) | 274,523 | |||||||||||||
| Net income attributable to noncontrolling interest in the form of preferred stock of subsidiary |
— | — | (18,371 | ) | — | (18,371 | ) | |||||||||||||
|
|
|
|
|
|
|
|
|
|
|
|||||||||||
| Net Income (Loss) Attributable to Common Shareholders |
$ | 256,152 | $ | 200,166 | $ | (20,967 | ) | $ | (179,199 | ) | $ | 256,152 | ||||||||
|
|
|
|
|
|
|
|
|
|
|
|||||||||||
F-93
Table of Contents
Index to Financial Statements
PLAINS EXPLORATION & PRODUCTION COMPANY
(Predecessor)
CONDENSED CONSOLIDATING STATEMENT OF INCOME
YEAR ENDED DECEMBER 31, 2012
(in thousands)
| Issuer | Guarantor Subsidiaries |
Non- Guarantor Subsidiaries |
Intercompany Eliminations |
Consolidated | ||||||||||||||||
| Revenues |
||||||||||||||||||||
| Oil sales |
$ | 2,024,231 | $ | 301,691 | $ | — | $ | — | $ | 2,325,922 | ||||||||||
| Gas sales |
34,357 | 198,084 | — | — | 232,441 | |||||||||||||||
| Other operating revenues |
1,179 | 5,765 | — | — | 6,944 | |||||||||||||||
|
|
|
|
|
|
|
|
|
|
|
|||||||||||
| 2,059,767 | 505,540 | — | — | 2,565,307 | ||||||||||||||||
|
|
|
|
|
|
|
|
|
|
|
|||||||||||
| Costs and Expenses |
||||||||||||||||||||
| Production costs |
448,530 | 182,616 | 1,306 | — | 632,452 | |||||||||||||||
| General and administrative |
117,531 | 73,792 | 7,850 | — | 199,173 | |||||||||||||||
| DD&A and accretion |
461,258 | 224,632 | 534 | 431,628 | 1,118,052 | |||||||||||||||
| Impairment of oil and gas properties |
— | 1,189,867 | — | (1,189,867 | ) | — | ||||||||||||||
| Other operating expense (income) |
3,511 | (3,538 | ) | — | — | (27 | ) | |||||||||||||
|
|
|
|
|
|
|
|
|
|
|
|||||||||||
| 1,030,830 | 1,667,369 | 9,690 | (758,239 | ) | 1,949,650 | |||||||||||||||
|
|
|
|
|
|
|
|
|
|
|
|||||||||||
| Income (Loss) from Operations |
1,028,937 | (1,161,829 | ) | (9,690 | ) | 758,239 | 615,657 | |||||||||||||
| Other (Expense) Income |
||||||||||||||||||||
| Equity in earnings of subsidiaries |
(394,676 | ) | — | — | 394,676 | — | ||||||||||||||
| Interest expense |
(91,069 | ) | (200,952 | ) | (5,518 | ) | — | (297,539 | ) | |||||||||||
| Debt extinguishment costs |
(8,388 | ) | — | — | — | (8,388 | ) | |||||||||||||
| Loss on mark-to-market derivative contracts |
(2,879 | ) | — | — | — | (2,879 | ) | |||||||||||||
| Gain on investment measured at fair value |
206,552 | — | — | — | 206,552 | |||||||||||||||
| Other income |
304 | 356 | 34 | — | 694 | |||||||||||||||
|
|
|
|
|
|
|
|
|
|
|
|||||||||||
| Income (Loss) Before Income Taxes |
738,781 | (1,362,425 | ) | (15,174 | ) | 1,152,915 | 514,097 | |||||||||||||
| Income tax (expense) benefit |
(432,361 | ) | 532,866 | 9,592 | (281,407 | ) | (171,310 | ) | ||||||||||||
|
|
|
|
|
|
|
|
|
|
|
|||||||||||
| Net Income (Loss) |
306,420 | (829,559 | ) | (5,582 | ) | 871,508 | 342,787 | |||||||||||||
| Net income attributable to noncontrolling interest in the form of preferred stock of subsidiary |
— | — | (36,367 | ) | — | (36,367 | ) | |||||||||||||
|
|
|
|
|
|
|
|
|
|
|
|||||||||||
| Net Income (Loss) Attributable to Common Shareholders |
$ | 306,420 | $ | (829,559 | ) | $ | (41,949 | ) | $ | 871,508 | $ | 306,420 | ||||||||
|
|
|
|
|
|
|
|
|
|
|
|||||||||||
F-94
Table of Contents
Index to Financial Statements
PLAINS EXPLORATION & PRODUCTION COMPANY
(Predecessor)
CONDENSED CONSOLIDATING STATEMENT OF CASH FLOWS
JANUARY 1, 2013, to MAY 31, 2013
(in thousands)
| Issuer | Guarantor Subsidiaries |
Non- Guarantor Subsidiaries |
Intercompany Eliminations |
Consolidated | ||||||||||||||||
| CASH FLOWS FROM OPERATING ACTIVITIES |
||||||||||||||||||||
| Net income (loss) |
$ | 256,152 | $ | 200,166 | $ | (2,596 | ) | $ | (179,199 | ) | $ | 274,523 | ||||||||
| Items not affecting cash flows from operating activities |
||||||||||||||||||||
| DD&A and accretion |
287,181 | 431,224 | 233 | 171,530 | 890,168 | |||||||||||||||
| Equity in earnings of subsidiaries |
(59,580 | ) | — | — | 59,580 | — | ||||||||||||||
| Deferred income tax expense (benefit) |
196,963 | (38,696 | ) | (3,581 | ) | (51,789 | ) | 102,897 | ||||||||||||
| Debt extinguishment costs |
(4,903 | ) | — | — | — | (4,903 | ) | |||||||||||||
| Loss on mark-to-market derivative contracts |
24,688 | — | — | — | 24,688 | |||||||||||||||
| Gain on investment measured at fair value |
(29,907 | ) | — | — | — | (29,907 | ) | |||||||||||||
| Non-cash compensation |
19,929 | 3,864 | — | — | 23,793 | |||||||||||||||
| Other non-cash items |
12,061 | — | — | — | 12,061 | |||||||||||||||
| Change in assets and liabilities from operating activities |
||||||||||||||||||||
| Accounts receivable and other assets |
(13,745 | ) | 57,496 | 2,183 | — | 45,934 | ||||||||||||||
| Accounts payable and other liabilities |
(59,770 | ) | (51,104 | ) | 14,723 | 54,222 | (41,929 | ) | ||||||||||||
| Income taxes receivable/payable |
(895 | ) | — | — | — | (895 | ) | |||||||||||||
|
|
|
|
|
|
|
|
|
|
|
|||||||||||
| Net cash provided by operating activities |
628,174 | 602,950 | 10,962 | 54,344 | 1,296,430 | |||||||||||||||
|
|
|
|
|
|
|
|
|
|
|
|||||||||||
| CASH FLOWS FROM INVESTING ACTIVITIES |
||||||||||||||||||||
| Additions to oil and gas properties |
(582,886 | ) | (41,353 | ) | (157,428 | ) | — | (781,667 | ) | |||||||||||
| Acquisition of oil and gas properties |
(16,746 | ) | (1,572 | ) | (23,461 | ) | — | (41,779 | ) | |||||||||||
| Proceeds from sales of oil and gas properties, net of costs and expenses |
76 | — | — | — | 76 | |||||||||||||||
| Derivative settlements |
(17,286 | ) | — | — | — | (17,286 | ) | |||||||||||||
| Other |
(15,000 | ) | (31,347 | ) | (2,125 | ) | — | (48,472 | ) | |||||||||||
|
|
|
|
|
|
|
|
|
|
|
|||||||||||
| Net cash used in investing activities |
(631,842 | ) | (74,272 | ) | (183,014 | ) | — | (889,128 | ) | |||||||||||
|
|
|
|
|
|
|
|
|
|
|
|||||||||||
| CASH FLOWS FROM FINANCING ACTIVITIES |
||||||||||||||||||||
| Borrowings from revolving credit facilities |
5,168,922 | — | — | — | 5,168,922 | |||||||||||||||
| Repayments of revolving credit facilities |
(5,263,100 | ) | — | — | — | (5,263,100 | ) | |||||||||||||
| Principal payments of long-term debt |
(171,180 | ) | — | — | — | (171,180 | ) | |||||||||||||
| Costs incurred in connection with financing arrangements |
(697 | ) | — | — | — | (697 | ) | |||||||||||||
| Distributions to holders of noncontrolling interest in the form of preferred stock of subsidiary |
— | — | (6,750 | ) | — | (6,750 | ) | |||||||||||||
| Investment in and advances to affiliates |
556,328 | (528,678 | ) | 26,694 | (54,344 | ) | — | |||||||||||||
|
|
|
|
|
|
|
|
|
|
|
|||||||||||
| Net cash provided by (used in) financing activities |
290,273 | (528,678 | ) | 19,944 | (54,344 | ) | (272,805 | ) | ||||||||||||
|
|
|
|
|
|
|
|
|
|
|
|||||||||||
| Net increase (decrease) in cash and cash equivalents |
286,605 | — | (152,108 | ) | — | 134,497 | ||||||||||||||
| Cash and cash equivalents, beginning of period |
11,722 | — | 168,843 | — | 180,565 | |||||||||||||||
|
|
|
|
|
|
|
|
|
|
|
|||||||||||
| Cash and cash equivalents, end of period |
$ | 298,327 | $ | — | $ | 16,735 | $ | — | $ | 315,062 | ||||||||||
|
|
|
|
|
|
|
|
|
|
|
|||||||||||
F-95
Table of Contents
Index to Financial Statements
PLAINS EXPLORATION & PRODUCTION COMPANY
(Predecessor)
CONDENSED CONSOLIDATING STATEMENT OF CASH FLOWS
YEAR ENDED DECEMBER 31, 2012
(in thousands)
| Issuer | Guarantor Subsidiaries |
Non- Guarantor Subsidiaries |
Intercompany Eliminations |
Consolidated | ||||||||||||||||
| CASH FLOWS FROM OPERATING ACTIVITIES |
||||||||||||||||||||
| Net income (loss) |
$ | 306,420 | $ | (829,559 | ) | $ | (5,582 | ) | $ | 871,508 | $ | 342,787 | ||||||||
| Items not affecting cash flows from operating activities |
||||||||||||||||||||
| DD&A, accretion and impairment |
461,258 | 1,414,499 | 534 | (758,239 | ) | 1,118,052 | ||||||||||||||
| Equity in earnings of subsidiaries |
394,676 | — | — | (394,676 | ) | — | ||||||||||||||
| Deferred income tax expense (benefit) |
362,818 | (461,848 | ) | (6,966 | ) | 281,408 | 175,412 | |||||||||||||
| Debt extinguishment costs |
4,160 | — | — | — | 4,160 | |||||||||||||||
| Loss on mark-to-market derivative contracts |
2,879 | — | — | — | 2,879 | |||||||||||||||
| Gain on investment measured at fair value |
(206,552 | ) | — | — | — | (206,552 | ) | |||||||||||||
| Non-cash compensation |
49,563 | 10,684 | — | — | 60,247 | |||||||||||||||
| Other non-cash items |
8,260 | (116 | ) | 126 | — | 8,270 | ||||||||||||||
| Change in assets and liabilities from operating activities |
||||||||||||||||||||
| Accounts receivable and other assets |
(101,534 | ) | (137,942 | ) | (5,134 | ) | — | (244,610 | ) | |||||||||||
| Accounts payable and other liabilities |
49,756 | 8,575 | 8,655 | — | 66,986 | |||||||||||||||
| Income taxes receivable/payable |
3,160 | — | — | — | 3,160 | |||||||||||||||
|
|
|
|
|
|
|
|
|
|
|
|||||||||||
| Net cash provided by (used in) operating activities |
1,334,864 | 4,293 | (8,367 | ) | 1 | 1,330,791 | ||||||||||||||
|
|
|
|
|
|
|
|
|
|
|
|||||||||||
| CASH FLOWS FROM INVESTING ACTIVITIES |
||||||||||||||||||||
| Additions to oil and gas properties |
(1,387,151 | ) | (264,530 | ) | (202,574 | ) | — | (1,854,255 | ) | |||||||||||
| Acquisition of oil and gas properties |
(21,217 | ) | — | (29,834 | ) | — | (51,051 | ) | ||||||||||||
| Gulf of Mexico Acquisition |
— | (5,895,878 | ) | — | — | (5,895,878 | ) | |||||||||||||
| Proceeds from sales of oil and gas properties, net of costs and expenses |
67,619 | — | — | — | 67,619 | |||||||||||||||
| Derivative settlements |
42,894 | — | — | — | 42,894 | |||||||||||||||
| Other |
(8,322 | ) | (4 | ) | (4,258 | ) | — | (12,584 | ) | |||||||||||
|
|
|
|
|
|
|
|
|
|
|
|||||||||||
| Net cash used in investing activities |
(1,306,177 | ) | (6,160,412 | ) | (236,666 | ) | — | (7,703,255 | ) | |||||||||||
|
|
|
|
|
|
|
|
|
|
|
|||||||||||
| CASH FLOWS FROM FINANCING ACTIVITIES |
||||||||||||||||||||
| Borrowings from revolving credit facilities |
9,479,075 | — | — | — | 9,479,075 | |||||||||||||||
| Repayments of revolving credit facilities |
(8,644,075 | ) | — | — | — | (8,644,075 | ) | |||||||||||||
| Proceeds from term loans |
1,950,864 | — | — | — | 1,950,864 | |||||||||||||||
| Principal payments of long-term debt |
(156,182 | ) | — | — | — | (156,182 | ) | |||||||||||||
| Proceeds from issuance of Senior Notes |
3,750,000 | — | — | — | 3,750,000 | |||||||||||||||
| Costs incurred in connection with financing arrangements |
(130,261 | ) | — | — | — | (130,261 | ) | |||||||||||||
| Purchase of treasury stock |
(88,490 | ) | — | — | — | (88,490 | ) | |||||||||||||
| Distributions to holders of noncontrolling interest in the form of preferred stock of subsidiary |
— | — | (27,000 | ) | — | (27,000 | ) | |||||||||||||
| Investment in and advances to affiliates |
(6,181,085 | ) | 6,156,113 | 24,973 | (1 | ) | — | |||||||||||||
|
|
|
|
|
|
|
|
|
|
|
|||||||||||
| Net cash (used in) provided by financing activities |
(20,154 | ) | 6,156,113 | (2,027 | ) | (1 | ) | 6,133,931 | ||||||||||||
|
|
|
|
|
|
|
|
|
|
|
|||||||||||
| Net increase (decrease) in cash and cash equivalents |
8,533 | (6 | ) | (247,060 | ) | — | (238,533 | ) | ||||||||||||
| Cash and cash equivalents, beginning of period |
3,189 | 6 | 415,903 | — | 419,098 | |||||||||||||||
|
|
|
|
|
|
|
|
|
|
|
|||||||||||
| Cash and cash equivalents, end of period |
$ | 11,722 | $ | — | $ | 168,843 | $ | — | $ | 180,565 | ||||||||||
|
|
|
|
|
|
|
|
|
|
|
|||||||||||
F-96
Table of Contents
Index to Financial Statements
Note 16 — Oil and Natural Gas Activities (Unaudited)
Investment
At May 31, 2013, and December 31, 2012, we owned 51.0 million shares of McMoRan common stock, approximately 31.2 percent and 31.5 percent, respectively, of its common shares outstanding. We acquired the McMoRan common stock and other consideration in exchange for all of our interests in our Gulf of Mexico leasehold located in less than 500 feet of water.
McMoRan followed the successful efforts method of accounting for its oil and natural gas activities. See Note 7 – Investment.
Costs Incurred
Our oil and natural gas acquisition, exploration and development activities were conducted in the U.S. The following table summarizes the costs incurred for the period from January 1, 2013, to May 31, 2013, and the year ended December 31, 2012 (in thousands):
| January 1, 2013, to May 31, 2013 |
Year Ended December 31, 2012 |
|||||||
| Consolidated entities |
||||||||
| Property acquisition costs |
||||||||
| Unproved properties |
||||||||
| Gulf of Mexico Acquisition |
$ | — | $ | 2,047,057 | ||||
| Other |
40,040 | 55,571 | ||||||
| Proved properties |
||||||||
| Gulf of Mexico Acquisition |
— | 4,135,173 | ||||||
| Other |
56,620 | 3,827 | ||||||
| Exploration costs(1) |
318,910 | 1,078,986 | ||||||
| Development costs |
498,641 | 829,090 | ||||||
|
|
|
|
|
|||||
| $ | 914,211 | $ | 8,149,704 | |||||
|
|
|
|
|
|||||
| Entity’s share of equity investee(2) |
||||||||
| Property acquisition costs |
||||||||
| Unproved properties |
$ | — | $ | — | ||||
| Proved properties |
— | — | ||||||
| Exploration costs |
35,442 | 162,150 | ||||||
| Development costs |
841 | 6,708 | ||||||
|
|
|
|
|
|||||
| $ | 36,283 | $ | 168,858 | |||||
|
|
|
|
|
|||||
| (1) | Exploration costs are related to exploratory activities as defined for accounting purposes and include the drilling of exploratory wells primarily in the Eagle Ford Shale and acquisition of seismic data. |
| (2) | Amounts relate to our equity investment in McMoRan and are for the period from January 1, 2013, to May 31, 2013, and the year ended December 31, 2012, respectively. |
Amounts presented include capitalized general and administrative expense of $46.4 million and $93.5 million for the period from January 1, 2013, to May 31, 2013, and the year ended December 31, 2012, respectively; and capitalized interest expense of $10.7 million and $49.1 million for the period from January 1, 2013, to May 31, 2013, and the year ended December 31, 2012, respectively.
During the first quarter of 2012, as a result of the low natural gas prices, our assessment of the unproved property in the Haynesville shale area indicated an impairment, and accumulated costs of approximately $483 million were transferred to the full cost pool.
F-97
Table of Contents
Index to Financial Statements
Results of Operations for Oil and Gas Producing Activities
The results of operations from oil and gas producing activities below exclude non-oil and gas revenues, general and administrative expense, interest charges and interest income. Income tax expense was determined by applying the statutory rates to pre-tax operating results (in thousands):
| January 1, 2013, to May 31, 2013 |
Year Ended December 31, 2012 |
|||||||
| Consolidated entities |
||||||||
| Revenues from oil and gas producing activities |
$ | 2,041,802 | $ | 2,565,307 | ||||
| Production costs |
(414,437 | ) | (632,425 | ) | ||||
| DD&A and accretion |
(873,408 | ) | (1,097,240 | ) | ||||
| Income tax expense (based on our statutory tax rate) |
(284,619 | ) | (312,530 | ) | ||||
|
|
|
|
|
|||||
| Results of operations from producing activities |
$ | 469,338 | $ | 523,112 | ||||
|
|
|
|
|
|||||
| Entity’s share of equity investee(1) |
||||||||
| Revenues from oil and gas producing activities |
$ | 41,173 | $ | 114,343 | ||||
| Production costs |
(20,571 | ) | (48,869 | ) | ||||
| Exploration Expense |
(557,089 | ) | (40,318 | ) | ||||
| DD&A and accretion |
(9,226 | ) | (40,203 | ) | ||||
| Impairment of oil and gas properties |
(6,550 | ) | (14,549 | ) | ||||
| Insurance recoveries |
— | 387 | ||||||
| Gain on sale of oil and gas properties |
23,952 | 12,743 | ||||||
| Income tax benefit (expense) (based on our statutory tax rate) |
— | — | ||||||
|
|
|
|
|
|||||
| Results of operations from producing activities |
$ | (528,311 | ) | $ | (16,466 | ) | ||
|
|
|
|
|
|||||
| (1) | Amounts relate to our equity investment in McMoRan and are for the period from January 1, 2013, to May 31, 2013, and the year ended December 31, 2012, respectively. |
Supplemental Reserve Information
The following information summarizes our net proved reserves of oil (including condensate and natural gas liquids) and gas and the standardized measure as described below. All of our reserves are located in the U.S. The following table sets forth certain information with respect to all of our proved reserves that for May 31, 2013, were prepared by us and not audited by an independent petroleum engineer. For December 31, 2012, all of our proved reserves were based upon reserve reports prepared by the independent petroleum engineers of Netherland, Sewell & Associates, Inc., or NSA.
Management believes the reserve estimates presented herein are reasonable and prepared in accordance with guidance established by the SEC as prescribed in Regulation S-X, Rule 4-10. However, there are numerous uncertainties inherent in estimating quantities and values of proved reserves and in projecting future rates of production and the amount and timing of development expenditures, including many factors beyond our control. Reserve engineering is a subjective process of estimating the recovery from underground accumulations of oil and gas that cannot be measured in an exact manner, and the accuracy of any reserve estimate is a function of the quality of available data and of engineering and geological interpretation and judgment. Because all oil and natural gas reserve estimates are to some degree subjective, the quantities of oil and gas that are ultimately
F-98
Table of Contents
Index to Financial Statements
recovered, production and operating costs, the amount and timing of future development expenditures and future oil and gas sales prices may all differ from those assumed in these estimates. In addition, different reserve engineers may make different estimates of reserve quantities and cash flows based upon the same available data. Therefore, the standardized measure of discounted future net cash flows (Standardized Measure) shown below represents estimates only and should not be construed as the current market value of the estimated oil and gas reserves attributable to our properties. In this regard, the information set forth in the following tables includes revisions of reserve estimates attributable to proved properties included in the preceding year’s estimates. Such revisions reflect additional information from subsequent development activities, production history of the properties involved and any adjustments in the projected economic life of such properties resulting from changes in product prices.
Decreases in the prices of oil and natural gas have had, and could have in the future, an adverse effect on the carrying value of our proved reserves, reserve volumes and our revenues, profitability and cash flows. Our reference prices are the WTI spot price of $90.87 per Bbl for oil and the Henry Hub spot price of $3.30 per MMBtu for gas.
Historically, the market price for California crude oil differs from the established market indices in the U.S. because of the higher transportation and refining costs associated with heavy oil. Recently, however, the California market prices has strengthened relative to NYMEX and WTI primarily as a result of increasing world demand and declining domestic supplies of both Alaska and California crude oil. Approximately 41 percent of our May 31, 2013, reserve volumes are attributable to properties in California where differentials to the reference prices have been volatile as a result of these factors.
Estimated Quantities of Oil and Natural Gas Reserves
The following table sets forth certain data pertaining to our proved, proved developed and proved undeveloped reserves for the period from January 1, 2013, to May 31, 2013, and the year ended December 31, 2012:
| Oil (MBbl)(1) |
Gas MMcf(1) |
Total MBOE(1) |
||||||||||
| May 31, 2013 |
||||||||||||
| Consolidated entities |
||||||||||||
| Proved reserves: |
||||||||||||
| Balance at beginning of year |
362,431 | 468,025 | 440,435 | |||||||||
| Extensions and discoveries |
5,953 | 6,886 | 7,101 | |||||||||
| Acquisitions of reserves in-place |
— | — | — | |||||||||
| Revision of previous estimates |
5,241 | 56,481 | 14,654 | |||||||||
| Sale of reserves in-place |
— | — | — | |||||||||
| Production |
(19,228 | ) | (36,662 | ) | (25,338 | ) | ||||||
|
|
|
|
|
|
|
|||||||
| Balance at end of period |
354,397 | 494,730 | 436,852 | |||||||||
|
|
|
|
|
|
|
|||||||
| Proved Developed Reserves, May 31, 2013 |
209,034 | 411,307 | 277,585 | |||||||||
|
|
|
|
|
|
|
|||||||
| Proved Undeveloped Reserves, May 31, 2013 |
145,363 | 83,423 | 159,267 | |||||||||
|
|
|
|
|
|
|
|||||||
| Entity’s share of equity investee (2) |
||||||||||||
| Proved reserves: |
||||||||||||
| Balance at beginning of year |
4,406 | 42,819 | 11,542 | |||||||||
| Extensions and discoveries |
— | — | — | |||||||||
| Acquisitions of reserves in-place |
— | — | — | |||||||||
| Revision of previous estimates |
280 | 3,843 | 921 | |||||||||
| Sale of reserves in-place |
(34 | ) | (2,802 | ) | (501 | ) | ||||||
| Production |
(358 | ) | (2,655 | ) | (801 | ) | ||||||
|
|
|
|
|
|
|
|||||||
| Balance at end of period |
4,294 | 41,205 | 11,161 | |||||||||
|
|
|
|
|
|
|
|||||||
| Proved Developed Reserves, May 31, 2013 |
3,829 | 30,572 | 8,924 | |||||||||
|
|
|
|
|
|
|
|||||||
| Proved Undeveloped Reserves, May 31, 2013 |
465 | 10,633 | 2,237 | |||||||||
|
|
|
|
|
|
|
|||||||
| (1) | MBbls = thousand barrels; MMcf = million cubic feet; MBOE = thousand BOE. |
| (2) | Amounts relate to our equity investment in McMoRan and are for the period from January 1, 2013, to May 31, 2013, and the year ended December 31, 2012, respectively. |
F-99
Table of Contents
Index to Financial Statements
| Oil (MBbl) |
Gas (MMcf) |
Total (MBOE) |
||||||||||
| December 31, 2012 |
||||||||||||
| Consolidated entities |
||||||||||||
| Proved reserves: |
||||||||||||
| Balance at beginning of year |
244,030 | 1,001,311 | 410,915 | |||||||||
| Extensions and discoveries |
45,690 | 79,057 | 58,866 | |||||||||
| Acquisitions of reserves in-place |
113,154 | 79,359 | 126,381 | |||||||||
| Revision of previous estimates |
(15,003 | ) | (596,183 | ) | (114,368 | ) | ||||||
| Sale of reserves in-place |
(1,075 | ) | (7,047 | ) | (2,249 | ) | ||||||
| Production |
(24,365 | ) | (88,472 | ) | (39,110 | ) | ||||||
|
|
|
|
|
|
|
|||||||
| Balance at end of year |
362,431 | 468,025 | 440,435 | |||||||||
|
|
|
|
|
|
|
|||||||
| Proved Developed Reserves, December 31, 2012 |
213,169 | 388,008 | 277,837 | |||||||||
|
|
|
|
|
|
|
|||||||
| Proved Undeveloped Reserves, December 31, 2012 |
149,262 | 80,017 | 162,598 | |||||||||
|
|
|
|
|
|
|
|||||||
| Entity’s share of equity investee (1) |
||||||||||||
| Proved reserves: |
||||||||||||
| Balance at beginning of year |
5,446 | 47,896 | 13,428 | |||||||||
| Extensions and discoveries |
45 | 4,479 | 791 | |||||||||
| Acquisitions of reserves in-place |
— | — | — | |||||||||
| Revision of previous estimates |
324 | 4,745 | 1,115 | |||||||||
| Sale of reserves in-place |
(441 | ) | (4,285 | ) | (1,155 | ) | ||||||
| Production |
(968 | ) | (10,016 | ) | (2,637 | ) | ||||||
|
|
|
|
|
|
|
|||||||
| Balance at end of year |
4,406 | 42,819 | 11,542 | |||||||||
|
|
|
|
|
|
|
|||||||
| Proved Developed Reserves, December 31, 2012 |
3,957 | 31,417 | 9,193 | |||||||||
|
|
|
|
|
|
|
|||||||
| Proved Undeveloped Reserves, December 31, 2012 |
449 | 11,402 | 2,349 | |||||||||
|
|
|
|
|
|
|
|||||||
| (1) | Amounts relate to our equity investment in McMoRan and are for the period from January 1, 2013, to May 31, 2013, and the year ended December 31, 2012, respectively. |
Revisions of Previous Estimates
For the period from January 1, 2013, to May 31, 2013, we had net positive revisions of 15 million barrels of oil equivalent (MMBOE), primarily related to higher natural gas prices impacting our Haynesville shale properties and improved performance at our Eagle Ford shale and Marlin Hub properties, partially offset by negative revisions at certain of our onshore California properties.
For the year ended December 31, 2012, we had net negative revisions of 114 MMBOE. Approximately 95 MMBOE, or 83 percent, of these revisions were related to the continued decline in natural gas prices during 2012, which most significantly impacted our Haynesville shale and Madden properties.
Acquisition of Reserves in-Place
For the year ended December 31, 2012, proved reserves acquired in the Gulf of Mexico Acquisition were 126 MMBOE.
Extensions and Discoveries
For the period from January 1, 2013, to May 31, 2013, we had a total of 7 MMBOE of extensions and discoveries, primarily in the Eagle Ford Shale resulting from continued successful drilling during 2013 that extended and developed our proved acreage.
F-100
Table of Contents
Index to Financial Statements
For the year ended December 31, 2012, we had a total of 59 MMBOE of extensions and discoveries, including 42 MMBOE in the Eagle Ford shale resulting from continued successful drilling during 2012 that extended and developed our proved acreage and 10 MMBOE in the deepwater Gulf of Mexico resulting from successful appraisal drilling in the Lucius oil field.
Standardized Measure of Discounted Future Net Cash Flows
The Standardized Measure of discounted future net cash flows relating to proved crude oil and natural gas reserves is presented below (in thousands):
| May 31, 2013 |
December 31, 2012 |
|||||||
| Consolidated entities |
||||||||
| Future cash inflows |
$ | 36,755,421 | $ | 38,584,092 | ||||
| Future development costs (1) |
(4,498,375 | ) | (4,921,679 | ) | ||||
| Future production expense |
(10,039,285 | ) | (11,126,583 | ) | ||||
| Future income tax expense |
(6,054,485 | ) | (5,650,467 | ) | ||||
|
|
|
|
|
|||||
| Future net cash flows |
16,163,276 | 16,885,363 | ||||||
| Discounted at 10 percent per year |
(6,205,263 | ) | (6,860,913 | ) | ||||
|
|
|
|
|
|||||
| Standardized Measure |
$ | 9,958,013 | $ | 10,024,450 | ||||
|
|
|
|
|
|||||
| Entity’s share of equity investee (2) |
||||||||
| Future cash inflows |
$ | 520,402 | $ | 532,611 | ||||
| Future development costs (1) |
(130,627 | ) | (139,101 | ) | ||||
| Future production expense |
(141,994 | ) | (145,938 | ) | ||||
| Future income tax expense |
— | — | ||||||
|
|
|
|
|
|||||
| Future net cash flows |
247,781 | 247,572 | ||||||
| Discounted at 10 percent per year |
(79,487 | ) | (80,524 | ) | ||||
|
|
|
|
|
|||||
| Standardized Measure |
$ | 168,294 | $ | 167,048 | ||||
|
|
|
|
|
|||||
| (1) | Included estimated asset retirement costs of $1.2 billion for the period from January 1, 2013, to May 31, 2013, and the year ended December 31, 2013. |
| (2) | Amounts relate to our equity investment in McMoRan and are for the period from January 1, 2013, to May 31, 2013, and the year ended December 31, 2012, respectively. |
The Standardized Measure (discounted at 10 percent) from production of proved reserves was developed as follows:
1. An estimate was made of the quantity of proved reserves and the future periods in which they are expected to be produced based on year-end economic conditions.
2. In accordance with SEC guidelines, the engineers’ estimates of future net revenues from our proved properties and the present value thereof are made using the twelve-month average of the first-day-of-the-month historical reference prices as adjusted for location and quality differentials, which are held constant throughout the life of the properties, except where such guidelines permit alternate treatment, including the use of fixed and determinable contractual price escalations. We use various derivative instruments to manage our exposure to commodity prices (excluding the impact of derivative contracts). Arrangements in effect at May 31, 2013, and December 31, 2012, are discussed in Note 6 – Commodity Derivative Contracts. Excluding the impact of derivative contracts, the realized sales prices used in the reserve reports as of May 31, 2013, and December 31, 2012, were $99.28 and $103.06 per barrel of oil, respectively, and $3.25 and $2.71 per Mcf of gas, respectively.
F-101
Table of Contents
Index to Financial Statements
3. Future gross revenues were reduced by estimated future operating costs (including production and ad valorem taxes) and future development and abandonment costs, all of which were based on current costs in effect at May 31, 2013, and December 31, 2012, and held constant throughout the life of the properties.
4. Future income taxes were calculated by applying the statutory federal and state income tax rate to pre-tax future net cash flows, net of the tax basis of the respective properties involved and utilization of available tax carryforwards related to oil and gas operations.
The following table summarizes the principal sources of changes in the Standardized Measure for the period from January 1, 2013, to May 31, 2013, and the year ended December 31, 2012 (in thousands):
| January 1, 2013, to May 31, 2013 |
Year Ended December 31, 2012 |
|||||||
| Consolidated entities |
||||||||
| Balance at beginning of period |
$ | 10,024,450 | $ | 5,134,181 | ||||
| Changes during the period: |
||||||||
| Sales, net of production expenses |
(1,633,657 | ) | (1,925,912 | ) | ||||
| Net changes in sales and transfer prices, net of production expenses |
(242,059 | ) | 1,239,493 | |||||
| Extensions, discoveries and improved recoveries |
221,827 | 1,535,524 | ||||||
| Changes in estimated future development costs |
(31,187 | ) | 837,067 | |||||
| Previously estimated development costs incurred during the period |
493,351 | 631,682 | ||||||
| Sales of reserves in-place |
— | (31,015 | ) | |||||
| Purchases of reserves in-place |
— | 5,863,947 | ||||||
| Revisions of quantity estimates |
765,834 | (3,091,327 | ) | |||||
| Accretion of discount |
640,663 | 793,732 | ||||||
| Net change in income taxes |
(281,209 | ) | (962,922 | ) | ||||
|
|
|
|
|
|||||
| Total changes |
(66,437 | ) | 4,890,269 | |||||
|
|
|
|
|
|||||
| Balance at end of period |
$ | 9,958,013 | $ | 10,024,450 | ||||
|
|
|
|
|
|||||
| Entity’s share of equity investee (1) |
||||||||
| Balance at beginning of period |
$ | 165,457 | $ | 261,082 | ||||
| Changes during the period: |
||||||||
| Sales, net of production expenses |
(25,775 | ) | (65,608 | ) | ||||
| Net changes in sales and transfer prices, net of production expenses |
(3,291 | ) | (52,461 | ) | ||||
| Extensions, discoveries and improved recoveries |
— | 85 | ||||||
| Changes in estimated future development costs |
(2,189 | ) | (13,655 | ) | ||||
| Previously estimated development costs incurred during the period |
842 | 30,716 | ||||||
| Sales of reserves in-place |
(5,016 | ) | (21,701 | ) | ||||
| Purchases of reserves in-place |
— | — | ||||||
| Revisions of quantity estimates |
21,721 | 2,482 | ||||||
| Accretion of discount |
16,545 | 26,108 | ||||||
| Net change in income taxes |
— | — | ||||||
|
|
|
|
|
|||||
| Total changes |
2,837 | (94,034 | ) | |||||
|
|
|
|
|
|||||
| Balance at end of period |
$ | 168,294 | $ | 167,048 | ||||
|
|
|
|
|
|||||
| (1) | Amounts relate to our equity investment in McMoRan and are for the period from January 1, 2013, to May 31, 2013, and the year ended December 31, 2012, respectively. |
F-102
Table of Contents
Index to Financial Statements
Report of Independent Registered Public Accounting Firm
To the Board of Directors and Stockholder of FCX Oil & Gas Inc.
We have audited the accompanying consolidated balance sheets of McMoRan Exploration Co. as of June 3, 2013 and December 31, 2012, and the related consolidated statements of operations, comprehensive loss, cash flows, and changes in stockholders’ (deficit) equity for the period from January 1, 2013 through June 3, 2013 and the year ended December 31, 2012. These financial statements are the responsibility of the Company’s management. Our responsibility is to express an opinion on these financial statements based on our audits.
We conducted our audits in accordance with the standards of the Public Company Accounting Oversight Board (United States). Those standards require that we plan and perform the audit to obtain reasonable assurance about whether the financial statements are free of material misstatement. An audit includes examining, on a test basis, evidence supporting the amounts and disclosures in the financial statements. An audit also includes assessing the accounting principles used and significant estimates made by management, as well as evaluating the overall financial statement presentation. We believe that our audits provide a reasonable basis for our opinion.
In our opinion, the financial statements referred to above present fairly, in all material respects, the consolidated financial position of McMoRan Exploration Co. at June 3, 2013 and December 31, 2012, and the consolidated results of its operations and its cash flows for the period from January 1, 2013 through June 3, 2013 and the year ended December 31, 2012, in conformity with U.S. generally accepted accounting principles.
| /s/ Ernst & Young LLP |
New Orleans, Louisiana
June 23, 2015
F-103
Table of Contents
Index to Financial Statements
(In thousands, except share related amounts)
| June 3, 2013 |
December 31, 2012 |
|||||||
| ASSETS |
||||||||
| Current assets: |
||||||||
| Cash and cash equivalents |
$ | 28,881 | $ | 114,867 | ||||
| Accounts receivable |
50,444 | 52,548 | ||||||
| Inventories |
14,910 | 28,532 | ||||||
| Prepaid expenses |
4,112 | 15,186 | ||||||
| Current assets from discontinued operations, including restricted cash of $473 |
869 | 2,013 | ||||||
|
|
|
|
|
|||||
| Total current assets |
99,216 | 213,146 | ||||||
| Property, plant and equipment, net |
669,246 | 2,394,522 | ||||||
| Restricted cash and other |
62,350 | 61,319 | ||||||
| Deferred financing costs and other |
5,497 | 7,696 | ||||||
| Long-term assets from discontinued operations |
439 | 439 | ||||||
|
|
|
|
|
|||||
| Total assets |
$ | 836,748 | $ | 2,677,122 | ||||
|
|
|
|
|
|||||
| LIABILITIES AND STOCKHOLDERS’ (DEFICIT) EQUITY |
||||||||
| Current liabilities: |
||||||||
| Accounts payable |
$ | 52,592 | $ | 83,937 | ||||
| Accrued liabilities |
79,276 | 131,648 | ||||||
| Accrued interest and dividends payable |
7,110 | 14,433 | ||||||
| Current portion of asset retirement obligations |
41,132 | 57,336 | ||||||
| 5 1⁄4% convertible senior notes |
67,832 | 67,832 | ||||||
| Current liabilities from discontinued operations, including sulphur reclamation costs |
1,807 | 2,328 | ||||||
|
|
|
|
|
|||||
| Total current liabilities |
249,749 | 357,514 | ||||||
| 11.875% senior notes |
300,000 | 300,000 | ||||||
| 4% convertible senior notes |
190,365 | 189,470 | ||||||
| Asset retirement obligations |
199,073 | 188,245 | ||||||
| Other long-term liabilities |
15,154 | 17,204 | ||||||
| Other long-term liabilities from discontinued operations, including sulphur reclamation costs |
26,081 | 21,478 | ||||||
|
|
|
|
|
|||||
| Total liabilities |
980,422 | 1,073,911 | ||||||
|
|
|
|
|
|||||
| Commitments and contingencies (Note 13) |
||||||||
| Stockholders’ (deficit) equity |
||||||||
| Preferred stock, par value $0.01, 50,000,000 shares authorized, 712,082 shares issued and outstanding (liquidation preference) (Note 7) |
712,082 | 712,082 | ||||||
| Common stock, par value $0.01, 300,000,000 shares authorized, 166,121,133 shares and 164,754,966 shares issued and outstanding, respectively |
1,661 | 1,648 | ||||||
| Capital in excess of par value of common stock |
2,166,873 | 2,167,796 | ||||||
| Accumulated deficit |
(2,970,787 | ) | (1,227,743 | ) | ||||
| Accumulated other comprehensive income |
159 | 176 | ||||||
| Common stock held in treasury, 2,835,390 shares and 2,650,589 shares, at cost, respectively |
(53,662 | ) | (50,748 | ) | ||||
|
|
|
|
|
|||||
| Total stockholders’ (deficit) equity |
(143,674 | ) | 1,603,211 | |||||
|
|
|
|
|
|||||
| Total liabilities and stockholders’ (deficit) equity |
$ | 836,748 | $ | 2,677,122 | ||||
|
|
|
|
|
|||||
The accompanying Notes to the Consolidated Financial Statements are an integral part of these consolidated financial statements.
F-104
Table of Contents
Index to Financial Statements
McMoRan EXPLORATION CO.
CONSOLIDATED STATEMENTS OF OPERATIONS
(In thousands, except per share amounts)
| January 1, 2013, to June 3, 2013 |
Year Ended December 31, 2012 |
|||||||
| Revenues: |
||||||||
| Oil and natural gas |
$ | 131,965 | $ | 362,995 | ||||
| Service |
5,479 | 13,893 | ||||||
|
|
|
|
|
|||||
| Total revenues |
137,444 | 376,888 | ||||||
| Costs and expenses: |
||||||||
| Production and delivery costs |
65,932 | 155,141 | ||||||
| Depletion, depreciation and amortization expense |
50,565 | 173,817 | ||||||
| Exploration expenses (Note 4) |
1,785,542 | 127,994 | ||||||
| General and administrative expense |
47,586 | 52,977 | ||||||
| Insurance recoveries |
— | (1,229 | ) | |||||
| Gain on sale of oil and gas properties |
(76,768 | ) | (40,453 | ) | ||||
| Main Pass Energy HubTM costs |
169 | 287 | ||||||
|
|
|
|
|
|||||
| Total costs and expenses |
1,873,026 | 468,534 | ||||||
|
|
|
|
|
|||||
| Operating loss |
(1,735,582 | ) | (91,646 | ) | ||||
| Loss on debt exchange |
— | (5,955 | ) | |||||
| Other (expense) income, net |
(1,622 | ) | 568 | |||||
|
|
|
|
|
|||||
| Loss from continuing operations before income taxes |
(1,737,204 | ) | (97,033 | ) | ||||
| Income tax benefit (expense) |
— | — | ||||||
|
|
|
|
|
|||||
| Loss from continuing operations |
(1,737,204 | ) | (97,033 | ) | ||||
| Loss from discontinued operations |
(5,840 | ) | (7,261 | ) | ||||
|
|
|
|
|
|||||
| Net loss |
(1,743,044 | ) | (104,294 | ) | ||||
| Preferred dividends on convertible preferred stock |
(17,578 | ) | (41,276 | ) | ||||
|
|
|
|
|
|||||
| Net loss applicable to common stock |
$ | (1,760,622 | ) | $ | (145,570 | ) | ||
|
|
|
|
|
|||||
| Basic and diluted net loss per share of common stock: |
||||||||
| Net loss from continuing operations |
$ | (10.77 | ) | $ | (0.86 | ) | ||
| Net loss from discontinued operations |
(0.04 | ) | (0.04 | ) | ||||
|
|
|
|
|
|||||
| Net loss per share of common stock |
$ | (10.81 | ) | $ | (0.90 | ) | ||
|
|
|
|
|
|||||
| Average common shares outstanding: |
||||||||
| Basic and diluted |
162,916 | 161,702 | ||||||
|
|
|
|
|
|||||
The accompanying Notes to the Consolidated Financial Statements are an integral part of these consolidated financial statements.
F-105
Table of Contents
Index to Financial Statements
McMoRan EXPLORATION CO.
CONSOLIDATED STATEMENTS OF COMPREHENSIVE LOSS
(In thousands)
| January 1, 2013, to June 3, 2013 |
Year Ended December 31, 2012 |
|||||||
| Net loss |
$ | (1,743,044 | ) | $ | (104,294 | ) | ||
| Other comprehensive loss: |
||||||||
| Amortization of previously unrecognized pension components, net |
(17 | ) | (40 | ) | ||||
|
|
|
|
|
|||||
| Comprehensive loss |
(1,743,061 | ) | (104,334 | ) | ||||
| Preferred dividends on convertible preferred stock |
(17,578 | ) | (41,276 | ) | ||||
|
|
|
|
|
|||||
| Comprehensive loss applicable to common stock |
$ | (1,760,639 | ) | $ | (145,610 | ) | ||
|
|
|
|
|
|||||
The accompanying Notes to the Consolidated Financial Statements are an integral part of these consolidated financial statements.
F-106
Table of Contents
Index to Financial Statements
McMoRan EXPLORATION CO.
CONSOLIDATED STATEMENTS OF CASH FLOWS
(In thousands)
| January 1, 2013, to June 3, 2013 |
Year Ended December 31, 2012 |
|||||||
| Cash flows from operating activities: |
||||||||
| Net loss |
$ | (1,743,044 | ) | $ | (104,294 | ) | ||
| Adjustments to reconcile net loss to net cash provided by operating activities: |
||||||||
| Loss from discontinued operations |
5,840 | 7,261 | ||||||
| Depletion, depreciation and amortization expense |
50,565 | 173,817 | ||||||
| Exploration drilling and related expenditures |
1,771,248 | 93,506 | ||||||
| Loss on debt exchange |
— | 5,955 | ||||||
| Fair value reduction to inventory |
11,385 | 2,800 | ||||||
| Compensation expense associated with stock-based awards |
5,648 | 17,445 | ||||||
| Asset retirement obligations, net of prepayments by third parties |
(11,269 | ) | (76,615 | ) | ||||
| Increase in restricted cash |
(2,685 | ) | (5,006 | ) | ||||
| Gain on sale of oil and gas properties |
(76,768 | ) | (40,453 | ) | ||||
| Other |
(398 | ) | 68 | |||||
| Decrease (increase) in working capital: |
||||||||
| Accounts receivable |
1,252 | 20,821 | ||||||
| Accounts payable and accrued liabilities |
(16,093 | ) | (59,719 | ) | ||||
| Inventories |
2,238 | 4,941 | ||||||
| Prepaid expenses |
11,075 | 2,450 | ||||||
|
|
|
|
|
|||||
| Net cash provided by continuing operations |
8,994 | 42,977 | ||||||
| Net cash used in discontinued operations |
(498 | ) | (9,327 | ) | ||||
|
|
|
|
|
|||||
| Net cash provided by operating activities |
8,496 | 33,650 | ||||||
|
|
|
|
|
|||||
| Cash flows from investing activities: |
||||||||
| Exploration, development and other capital expenditures |
(161,422 | ) | (505,132 | ) | ||||
| Proceeds from sale of oil and gas properties |
78,967 | 56,679 | ||||||
|
|
|
|
|
|||||
| Net cash used in continuing operations |
(82,455 | ) | (448,453 | ) | ||||
| Net cash from discontinued operations |
— | — | ||||||
|
|
|
|
|
|||||
| Net cash used in investing activities |
(82,455 | ) | (448,453 | ) | ||||
|
|
|
|
|
|||||
| Cash flows from financing activities: |
||||||||
| Dividends paid on convertible preferred stock |
(20,608 | ) | (41,295 | ) | ||||
| Payment of 5 1⁄4% convertible senior notes |
— | (345 | ) | |||||
| Proceeds from exercise of stock options and other |
8,581 | 2,547 | ||||||
|
|
|
|
|
|||||
| Net cash used in continuing operations |
(12,027 | ) | (39,093 | ) | ||||
| Net cash from discontinued operations |
— | — | ||||||
|
|
|
|
|
|||||
| Net cash used in financing activities |
(12,027 | ) | (39,093 | ) | ||||
|
|
|
|
|
|||||
| Net decrease in cash and cash equivalents |
(85,986 | ) | (453,896 | ) | ||||
| Cash and cash equivalents at beginning of period |
114,867 | 568,763 | ||||||
|
|
|
|
|
|||||
| Cash and cash equivalents at end of period |
$ | 28,881 | $ | 114,867 | ||||
|
|
|
|
|
|||||
| Interest paid |
$ | 24,821 | $ | 50,386 | ||||
|
|
|
|
|
|||||
The accompanying Notes to the Consolidated Financial Statements are an integral part of these consolidated financial statements.
F-107
Table of Contents
Index to Financial Statements
McMoRan EXPLORATION CO.
CONSOLIDATED STATEMENTS OF CHANGES IN STOCKHOLDERS’ (DEFICIT) EQUITY
(In thousands, except share related amounts)
| January 1, 2013, to June 3, 2013 |
Year Ended December 31, 2012 |
|||||||
| 8% Convertible Perpetual Preferred Stock: |
||||||||
| Balance at beginning of year, representing 12,082 shares in 2013 and 13,999 shares in 2012 |
$ | 12,082 | $ | 13,999 | ||||
| Shares converted in privately negotiated transactions, representing 1,917 shares in 2012 |
— | (1,917 | ) | |||||
|
|
|
|
|
|||||
| Balance at end of period, representing 12,082 shares in 2013 and 2012 |
12,082 | 12,082 | ||||||
|
|
|
|
|
|||||
| 5.75% Convertible Perpetual Preferred Stock: |
||||||||
| Balance at end of period, representing 700,000 shares in 2013 and 2012 |
700,000 | 700,000 | ||||||
|
|
|
|
|
|||||
| Common Stock: |
||||||||
| Balance at beginning of year, representing 164,754,966 shares in 2013 and 163,940,835 shares in 2012 |
1,648 | 1,639 | ||||||
| Preferred stock conversions, representing 280,160 shares in 2012 |
— | 3 | ||||||
| Exercise of stock options and other, representing 1,366,167 shares in 2013 and 533,971 shares in 2012 |
13 | 6 | ||||||
|
|
|
|
|
|||||
| Balance at end of period, representing 166,121,133 shares in 2013 and 164,754,966 shares in 2012 |
1,661 | 1,648 | ||||||
|
|
|
|
|
|||||
| Capital in Excess of Par Value: |
||||||||
| Balance at beginning of year |
2,167,796 | 2,178,775 | ||||||
| Debt premium on 5 1⁄4% convertible senior notes (Note 6) |
— | 5,786 | ||||||
| Preferred stock conversions |
— | 1,914 | ||||||
| Stock-based compensation expense |
14,667 | 17,445 | ||||||
| Exercise of stock options |
1,988 | 5,152 | ||||||
| Preferred stock dividends |
(17,578 | ) | (41,276 | ) | ||||
|
|
|
|
|
|||||
| Balance at end of period |
2,166,873 | 2,167,796 | ||||||
|
|
|
|
|
|||||
| Accumulated Deficit: |
||||||||
| Balance at beginning of year |
(1,227,743 | ) | (1,123,449 | ) | ||||
| Net loss |
(1,743,044 | ) | (104,294 | ) | ||||
|
|
|
|
|
|||||
| Balance at end of period |
(2,970,787 | ) | (1,227,743 | ) | ||||
|
|
|
|
|
|||||
| Accumulated Other Comprehensive Income: |
||||||||
| Balance at beginning of year |
176 | 216 | ||||||
| Amortization of previously unrecognized pension components, net |
(17 | ) | (40 | ) | ||||
|
|
|
|
|
|||||
| Balance at end of period |
159 | 176 | ||||||
|
|
|
|
|
|||||
| Common Stock Held in Treasury: |
||||||||
| Balance at beginning of year, representing 2,650,589 shares in 2013 and 2,611,591 shares in 2012 |
(50,748 | ) | (48,216 | ) | ||||
| Tender of 184,801 shares in 2013 and 38,998 shares in 2012 associated with the exercise of stock options and the vesting of restricted stock |
(2,914 | ) | (2,532 | ) | ||||
|
|
|
|
|
|||||
| Balance at end of period, representing 2,835,390 shares in 2013 and 2,650,589 shares in 2012 |
(53,662 | ) | (50,748 | ) | ||||
|
|
|
|
|
|||||
| Total stockholders’ (deficit) equity |
$ | (143,674 | ) | $ | 1,603,211 | |||
|
|
|
|
|
|||||
The accompanying Notes to the Consolidated Financial Statements are an integral part of these consolidated
financial statements.
F-108
Table of Contents
Index to Financial Statements
McMoRan EXPLORATION CO.
NOTES TO CONSOLIDATED FINANCIAL STATEMENTS
Note 1 — SUMMARY OF SIGNIFICANT ACCOUNTING POLICIES
Basis of Presentation. The consolidated financial statements of McMoRan Exploration Co. (McMoRan), a Delaware corporation, are prepared in accordance with United States (U.S.) generally accepted accounting principles. McMoRan’s consolidated financial statements include the accounts of those subsidiaries where McMoRan directly or indirectly has more than 50 percent of the voting rights and where the right to participate in significant management decisions is not shared with other stockholders, including its two wholly owned subsidiaries, McMoRan Oil & Gas LLC (MOXY) and Freeport-McMoRan Energy LLC (Freeport Energy). MOXY conducts all of McMoRan’s oil and gas operations. The long-term business objective of Freeport Energy is to maximize the value of the offshore structures used in the former sulphur operations, which may include the pursuit of a multifaceted energy services facility at the Main Pass Energy Hub TM (MPEH™) project located at Main Pass Block 299 (Main Pass) in the Gulf of Mexico (GOM).
McMoRan’s investments in unincorporated legal entities represented by undivided interests in other oil and gas joint ventures and partnerships engaged in oil and gas exploration, development and production activities are pro rata consolidated, whereby a proportional share of each joint venture’s and partnership’s assets, liabilities, revenues and expenses are included in the consolidated financial statements in accordance with McMoRan’s working and net revenue interests in each joint venture and partnership.
All significant intercompany transactions have been eliminated.
McMoRan’s previously discontinued sulphur operations are presented as such, and the major classes of assets and liabilities related to its former sulphur business are separately shown for the periods presented.
Nature of Operations. McMoRan is an oil and gas exploration and production company engaged directly through its subsidiaries, joint ventures or partnerships with other entities in the exploration, development, production and marketing of crude oil and natural gas. McMoRan’s operations are located entirely in the U.S., offshore in the GOM and onshore in the Gulf Coast region (primarily Louisiana and Texas).
McMoRan’s production of oil and natural gas involves lifting oil and natural gas to the surface and gathering, treating and processing hydrocarbons to extract liquids (primarily ethane, propane, butane and natural gasolines) from natural gas. McMoRan’s production costs include all costs incurred to operate or maintain its wells and related equipment and facilities. Examples of these costs include:
| • | labor costs to operate the wells and related equipment and facilities; |
| • | repair and maintenance costs, including costs associated with re-establishing production from a geological structure that has previously produced; |
| • | material, supplies, and fuel consumed and services utilized in operating the wells and related equipment and facilities, including marketing and transportation costs; and |
| • | property taxes and insurance applicable to proved properties and wells and related equipment and facilities. |
Use of Estimates. The preparation of McMoRan’s financial statements in conformity with U.S. generally accepted accounting principles require management to make estimates and assumptions that affect the amounts reported in these consolidated financial statements and the accompanying notes to the consolidated financial statements. The more significant estimates include asset retirement obligations (ARO) and environmental obligations, useful lives for depletion, depreciation and amortization, estimates of proved oil and natural gas reserves and related future cash flows and the carrying value of long-lived assets. Actual results could differ from those estimates.
F-109
Table of Contents
Index to Financial Statements
Cash and Cash Equivalents. Highly liquid investments purchased with an original maturity of three months or less are considered cash equivalents (excluding certain restricted cash, Note 13).
Accounts Receivable. The majority of McMoRan’s accounts receivable result from oil and natural gas sales or joint interest billings to third parties in the energy industry. McMoRan’s counterparty credit losses have historically been minimal.
Inventories. Product inventories totaled $0.5 million at June 3, 2013 and $0.8 million at December 31, 2012, consisting of crude oil production from Main Pass. Materials and supplies inventory totaled $14.4 million at June 3, 2013 and $27.7 million at December 31, 2012 and represents the cost of supplies to be used in McMoRan’s drilling activities, primarily drilling pipe and tubulars. A portion of the cost of such inventory will be reimbursed to McMoRan by joint operating partners as future well drilling activity utilizes these materials. McMoRan’s inventories are stated at the lower of weighted-average cost or market which required McMoRan to reduce the carrying value of its inventories by approximately $11.4 million during the period from January 1, 2013, through June 3, 2013. During the year ended December 31, 2012, McMoRan reduced the carrying value of its inventories by approximately $2.8 million to reflect its determination of items that were deemed to have no future utility. Reductions to inventory carrying values are included in production and delivery costs on the consolidated statements of operations.
Property, Plant and Equipment. McMoRan follows the successful efforts method of accounting for its oil and natural gas exploration and development activities. Costs associated with drilling and development activities are included as a use of investing cash flow in the consolidated statements of cash flows.
| • | Geological and geophysical costs and costs of retaining unproved properties and undeveloped properties are charged to expense as incurred and are included as a use of operating cash flow in the consolidated statements of cash flows. |
| • | Costs of exploratory wells are capitalized pending determination of whether they have discovered proved reserves. |
| * | The costs of exploratory wells that have found oil and natural gas reserves that cannot be classified as proved when drilling is completed, continue to be capitalized as long as the well has found a sufficient quantity of reserves to justify its completion as a producing well and sufficient progress is being made in assessing the proved reserves and the economic and operating viability of the project. Management evaluates progress on such wells on a quarterly basis. |
| * | Drilling costs that no longer meet the criteria for continued capitalization under U.S. generally accepted accounting principles, but for which management intends to pursue development activities, are charged to depletion, depreciation and amortization expense. |
| * | If proved reserves are not discovered, the related drilling costs are charged to exploration expense. |
| • | Acquisition costs of leases and development activities are capitalized. |
| • | Other exploration costs are charged to expense as incurred. |
| • | Depletion, depreciation and amortization expense is determined on a field-by-field basis using the units-of-production method, with depletion, depreciation and amortization rates for leasehold acquisition costs based on estimated proved reserves and depletion, depreciation and amortization rates for well and related facility costs based on proved developed reserves associated with each field. The depletion, depreciation and amortization rates are revised whenever required but, at a minimum, are assessed semi-annually. Any such revisions are accounted for prospectively as a change in accounting estimate. |
| • | The costs of maintenance and repairs are expensed when incurred. |
| • | Gains or losses from dispositions of McMoRan’s interests in oil and gas properties are included in earnings under the following conditions: |
| * | All or part of an interest owned is sold to an unrelated third party; if only part of an interest is sold, there is no substantial uncertainty about the recoverability of cost applicable to the interest retained; and |
F-110
Table of Contents
Index to Financial Statements
| * | McMoRan has no substantial obligation for future performance (e.g. drilling a well(s) or operating the property without proportional reimbursement of costs relating to the interest sold). |
| • | Interest expense allocable to significant unproved leasehold costs and in progress exploration and development projects is capitalized until the assets are ready for their intended use. Interest expense capitalized by McMoRan totaled $22.4 million in the period from January 1, 2013, through June 3, 2013, and $56.5 million in the year ended December 31, 2012. |
Sulphur Assets. McMoRan’s remaining sulphur property, plant and equipment is carried at the lower of cost or estimated net realizable value (Note 9).
Asset Impairment. Costs of unproved oil and gas properties are assessed periodically and a loss is recognized if the properties are deemed impaired. When events or circumstances indicate that proved oil and gas property carrying amounts might not be recoverable from estimated future undiscounted cash flows, a reduction of the carrying amount to estimated fair value is required. McMoRan estimates the fair value of its properties (derived from Level 3 inputs) using estimated future cash flows based on proved and risk-adjusted probable and possible oil and natural gas reserves as estimated by McMoRan. Future cash flows are determined using published period-end forward market prices adjusted for property-specific price basis differentials, net of estimated future production and development costs and excluding estimated asset retirement and abandonment expenditures. If the undiscounted cash flows indicate that the property is impaired, McMoRan discounts the future cash flows using a discount factor that considers market participants’ expected rates of return for similar type assets if acquired under current market conditions.
The determination of oil and gas reserve estimates is a subjective process, and the accuracy of any reserve estimate depends on the quality of available data and the application of engineering and geological interpretation and judgment. Estimates of economically recoverable reserves and future net cash flows depend on a number of variable factors and assumptions that are difficult to predict and may vary considerably from actual results. In particular, reserve estimates for wells with limited or no production history are less reliable than those based on actual production. Subsequent evaluation of the same reserves may result in variations in estimated reserves and related estimates of future cash flows, and these variations may be substantial. If the capitalized costs of an individual oil and gas property exceed the related estimated future net cash flows, an impairment charge to reduce the capitalized costs to the property’s estimated fair value is required (Note 4).
Revenue Recognition and Gas Balancing. McMoRan generally sells crude oil and natural gas under short-term agreements at prevailing market prices. Revenue for the sale of crude oil and natural gas is recognized when title passes to the customer, when prices are fixed or determinable and collection is reasonably assured. Natural gas revenues involving partners in natural gas wells are recognized when the natural gas is sold using the entitlements method of accounting and are based on McMoRan’s net working interests. When McMoRan receives a volume in excess of its net working interests, it records a liability and under deliveries are recorded as receivables. At June 3, 2013, McMoRan had natural gas imbalance receivables valued at $2.4 million for under deliveries and liabilities valued at $4.7 million for over deliveries. At December 31, 2012, McMoRan had natural gas imbalance receivables valued at $2.6 million for under deliveries and liabilities valued at $3.4 million for over deliveries.
Service Revenue. McMoRan records the gross amount of reimbursements for costs from third parties as service revenues whenever McMoRan is the primary obligor with respect to the source of such costs, has discretion in the selection of how the related service costs are incurred and when it has assumed the credit risk associated with the reimbursement for such service costs. The service costs associated with these third-party reimbursements are also recorded within the applicable cost and expense line item in the consolidated financial statements.
McMoRan’s service revenues have been generated primarily through fees for processing third-party oil and gas production, other third party management fees and standardized industry (COPAS) overhead charges McMoRan receives as operator of oil and gas properties.
F-111
Table of Contents
Index to Financial Statements
Environmental and ARO. McMoRan incurs costs for environmental programs and projects. Expenditures pertaining to future revenues from operations are capitalized. Expenditures resulting from the remediation of conditions caused by past operations that do not contribute to future revenue generation are charged to expense. Liabilities are recognized for remedial activities when the efforts are probable and the costs can be reasonably estimated. ARO cost estimates are by their nature imprecise and can be expected to be revised over time because of a number of factors, including changes in ARO plans, cost estimates, governmental regulations, technology and inflation.
McMoRan uses estimates derived from information provided by in-house engineers and third-party specialists in determining its estimated ARO under multiple probability-assessed scenarios reflecting a range of possible outcomes considering the future costs to be incurred, the scope of work to be performed and the timing of such expenditures (Note 13).
Earnings Per Share. Basic net loss per share of common stock is calculated by dividing McMoRan’s net loss applicable to continuing operations, net loss from discontinued operations, and net loss applicable to common stock by the weighted-average number of common shares outstanding during the periods presented. For purposes of earnings per share computations, the net loss applicable to continuing operations is net of preferred stock dividends and related charges (Notes 7 and 8).
Stock-Based Compensation. Compensation cost recognized includes compensation cost for all stock option awards granted based on the grant-date fair value and restricted stock units granted which are estimated in accordance with U.S. generally accepted accounting principles. McMoRan recognizes compensation costs for awards that vest over several years on a straight-line basis over the vesting period. McMoRan’s stock-based awards provide for an additional year of vesting after an employee retires. For awards to retirement-eligible employees, McMoRan records one year of amortization of the awards’ estimated fair value on the date of grant because the grantee has earned that one year vesting benefit under the terms of McMoRan’s stock options plans based on length of service. McMoRan includes estimated forfeitures in its compensation cost and updates the estimated forfeiture rate through the final vesting date of the awards (Note 10).
McMoRan currently recognizes no income tax benefits for deductions resulting from the exercise of stock options because all of its net deferred tax assets, including significant net operating loss carryforwards, have been reserved with a full valuation allowance (Note 11).
Note 2 — DIVESTITURES OF OIL AND GAS PROPERTIES
On January 28, 2013, McMoRan completed the sale of certain properties in the Breton Sound area to Century Exploration New Orleans, LLC (Century). Consideration consisted of the assumption of related abandonment obligations by Century of approximately $4.6 million and payment by McMoRan to Century of $0.6 million in cash (the Century Sale). The Century Sale was effective October 1, 2012.
On January 17, 2013, McMoRan completed the sale of its Laphroaig field to Energy XXI Limited for cash consideration, after closing adjustments, of $80 million and the assumption of approximately $0.6 million of related abandonment obligations. The transaction was effective January 1, 2013.
The combined net cash proceeds from the 2013 divestiture transactions referred to above totaled $79.4 million and assumed ARO totaled $5.2 million. McMoRan recorded gains totaling approximately $76.6 million in the period from January 1, 2013, through June 3, 2013, in connection with the Century Sale and the sale of the Laphroaig field.
On November 13, 2012, McMoRan completed the sale of a package of GOM oil and gas properties in the Eugene Island area (the Eugene Island Assets), for net cash consideration of $29.8 million (after closing adjustments) and the assumption of related ARO. The transaction was effective July 1, 2012.
F-112
Table of Contents
Index to Financial Statements
On October 2, 2012, McMoRan completed the sale of three GOM shelf oil and gas properties in the West Delta and Mississippi Canyon areas (the Assets) for net cash consideration of $26.1 million (after closing adjustments) and the assumption of related ARO. The transaction was effective July 1, 2012.
The combined net cash proceeds from the 2012 divestiture transactions referred to above totaled $55.9 million and assumed ARO totaled $45.6 million. McMoRan recorded net gains totaling $39.7 million in 2012 in connection with these transactions.
Note 3 — ACCOUNTS RECEIVABLE AND MAJOR CUSTOMERS
The components of accounts receivable follow (in thousands):
| June 3, 2013 | December 31, 2012 |
|||||||
| Accounts receivable: |
||||||||
| Customers |
$ | 32,408 | $ | 28,901 | ||||
| Joint interest partners |
15,730 | 20,252 | ||||||
| Other |
2,306 | 3,395 | ||||||
|
|
|
|
|
|||||
| Total accounts receivable |
$ | 50,444 | $ | 52,548 | ||||
|
|
|
|
|
|||||
Sales of McMoRan’s oil and natural gas production to individual customers representing 10 percent or more of its total consolidated oil and gas revenues in the period from January 1, 2013, through June 3, 2013, and the year ended December 31, 2012, is as follows:
| Individual Customer |
January 1, 2013, to June 3, 2013 |
Year Ended December 31, 2012 |
||||||
| A |
48 | % | 43 | % | ||||
| B |
17 | % | 16 | % | ||||
| C |
12 | % | <10 | % | ||||
All of McMoRan’s customers are located in the U.S. McMoRan does not believe the loss of any of these purchasers would have a material adverse effect on its operations because oil and natural gas is a commodity in demand and alternative purchasers, if needed, are readily available.
Note 4 — PROPERTY, PLANT AND EQUIPMENT
The components of net property, plant and equipment follow (in thousands):
| June 3, 2013 | December 31, 2012 | |||||||
| Oil and gas property, plant and equipment |
$ | 2,495,485 | $ | 4,238,921 | ||||
| Other |
30 | 30 | ||||||
|
|
|
|
|
|||||
| 2,495,515 | 4,238,951 | |||||||
| Accumulated depletion, depreciation and amortization |
(1,826,269 | ) | (1,844,429 | ) | ||||
|
|
|
|
|
|||||
| Property, plant and equipment, net |
$ | 669,246 | $ | 2,394,522 | ||||
|
|
|
|
|
|||||
F-113
Table of Contents
Index to Financial Statements
The components of McMoRan’s depletion, depreciation and amortization expense are summarized below (in thousands):
| January 1, 2013, to June 3, 2013 |
Year Ended December 31, 2012 |
|||||||
| Depletion and depreciation expense |
$ | 25,202 | $ | 96,067 | ||||
| Accretion expense (Note 13) |
4,368 | 31,562 | ||||||
| Impairment charges/losses |
20,995 | 46,188 | ||||||
|
|
|
|
|
|||||
| Total depletion, depreciation and amortization expense |
$ | 50,565 | $ | 173,817 | ||||
|
|
|
|
|
|||||
McMoRan recorded impairment charges during the period from January 1, 2013, through June 3, 2013, of $21.0 million primarily because of well performance reserve revisions. McMoRan recorded impairment charges for the year ended December 31, 2012, of $46.2 million to reduce net carrying values of certain of its oil and gas properties to fair value primarily because of negative revisions to estimated proved undeveloped reserves for one property, well performance issues, higher than anticipated recompletion costs for a certain property, a decline in market prices earlier in 2012, and other economic factors (Note 13).
At June 3, 2013, prior to the consideration of subsequent events, McMoRan had unproved property costs and costs for in-progress exploratory wells totaling $2.1 billion. McMoRan follows the successful efforts method of accounting, under which exploratory drilling costs continue to be capitalized when a well has found a sufficient quantity of reserves to justify its completion as a producing well and the enterprise is making sufficient progress assessing the reserves and the economic and operating viability of the project. Additionally, Accounting Standards Codification 932-360-35-21 requires that information that becomes available after the end of the period, but before the financial statements are issued or are available to be issued, is taken into account in evaluating conditions that existed at the balance sheet date, including in assessing unproved properties and in determining whether an exploratory well has found proved reserves.
In accordance with these requirements, $1.8 billion in well costs and associated unproved property costs related to seven wells in-progress at June 3, 2013, but subsequently determined to be unsuccessful were charged to exploration expenses in these financial statements, as follows: $198.9 million associated with the Lafitte well, whose lease expired in June of 2013; $151.4 million associated with the Blackbeard West No. 1 and No. 2 wells, which were determined to be non-productive in the fourth quarter of 2014 following noncommercial results at the No. 2 well; $313.3 million associated with the Blackbeard East well, whose lease unit was allowed to expire on December 31, 2014, following noncommercial results at the Blackbeard West No. 2 well; $1.1 billion associated with the Davy Jones No. 1 and No. 2 wells, which both had unsuccessful flow test attempts and were determined to be non-productive in 2014; and $47.5 million associated with the Hurricane Deep well, which was geologically similar to the Davy Jones No. 1 and No. 2 wells and was determined to be non-productive in the fourth quarter of 2014.
McMoRan had unproved property costs and costs for in-progress exploratory wells totalling $286.7 million at June 3, 2013, after consideration of these subsequent events.
F-114
Table of Contents
Index to Financial Statements
Note 5 — OTHER ASSETS AND OTHER LIABILITIES
McMoRan defers its financing costs associated with its debt instruments and amortizes the costs over the terms of the related instruments. The components of deferred financing costs follow (in thousands):
| June 3, 2013 | December 31, 2012 | |||||||||||||||||||||||
| Gross Carrying Amount |
Accumulated Amortization |
Net | Gross Carrying Amount |
Accumulated Amortization |
Net | |||||||||||||||||||
| 5 1⁄4% Convertible senior notes |
$ | 6,323 | $ | (6,304 | ) | $ | 19 | $ | 6,323 | $ | (6,281 | ) | $ | 42 | ||||||||||
| 11.875% senior notes |
8,055 | (6,393 | ) | 1,662 | 8,055 | (5,904 | ) | 2,151 | ||||||||||||||||
| Revolving credit facility |
13,162 | (10,614 | ) | 2,548 | 13,162 | (10,270 | ) | 2,892 | ||||||||||||||||
| 4% Convertible senior notes |
1,563 | (543 | ) | 1,020 | 1,563 | (448 | ) | 1,115 | ||||||||||||||||
|
|
|
|
|
|
|
|
|
|
|
|
|
|||||||||||||
| $ | 29,103 | $ | (23,854 | ) | $ | 5,249 | $ | 29,103 | $ | (22,903 | ) | $ | 6,200 | |||||||||||
|
|
|
|
|
|
|
|
|
|
|
|
|
|||||||||||||
As of June 3, 2013, and December 31, 2012, other long-term assets includes approximately $0.2 million and $1.5 million, respectively, of prepaid drilling rig costs which are amortized as a component of contractual rig charges over the term of the contract.
The components of other long-term liabilities follow (in thousands):
| June 3, 2013 | December 31, 2012 | |||||||
| Advances from third parties for future abandonment costs (Note 13) |
$ | 8,403 | $ | 9,873 | ||||
| Employee postretirement medical liability (Note 10) |
3,287 | 3,416 | ||||||
| Liability for management services (Note 12) |
2,886 | 2,886 | ||||||
| Nonqualified pension plan liability |
578 | 933 | ||||||
| Accrued workers compensation and group insurance |
— | 96 | ||||||
|
|
|
|
|
|||||
| $ | 15,154 | $ | 17,204 | |||||
|
|
|
|
|
|||||
Note 6 — LONG-TERM DEBT
The components of McMoRan’s long-term debt follow (in thousands):
| June 3, 2013 | December 31, 2012 | |||||||
| Revolving credit facility (matures June 2016) |
$ | — | $ | — | ||||
| 11.875% senior notes (due November 2014) |
300,000 | 300,000 | ||||||
| 4% convertible senior notes (due December 2017), net of discount of $9,635 and $10,530, respectively |
190,365 | 189,470 | ||||||
| 5 1⁄4% convertible senior notes (due October 2013) |
67,832 | 67,832 | ||||||
|
|
|
|
|
|||||
| Total debt |
558,197 | 557,302 | ||||||
| Less current maturities |
(67,832 | ) | (67,832 | ) | ||||
|
|
|
|
|
|||||
| Long-term debt |
$ | 490,365 | $ | 489,470 | ||||
|
|
|
|
|
|||||
F-115
Table of Contents
Index to Financial Statements
McMoRan’s scheduled debt maturities were $67.8 million in 2013; $300.0 million in 2014; none in 2015 or 2016; $200.0 million in 2017; and none thereafter.
Variable Rate Senior Secured Revolving Credit Facility. The variable rate senior secured revolving credit facility (credit facility) matures on June 30, 2016. The credit facility’s borrowing capacity is $150 million. There were no borrowings outstanding under the credit facility as of June 3, 2013, although a $100 million letter of credit (LOC) in favor of a third party beneficiary for ARO surety was outstanding against the facility. In January 2013, McMoRan reached agreement with the beneficiary to suspend the LOC requirement through June 30, 2013.
Availability under the credit facility was subject to a borrowing base calculated from estimates of MOXY’s oil and natural gas reserves, which is subject to redetermination by its lenders semi-annually each April and October. In the fourth quarter of 2012, in connection with the semi-annual redetermination of McMoRan’s borrowing base, McMoRan’s lenders affirmed the $150 million borrowing base subject to a continuing priority lien on $35 million of cash deposited in a separate deposit account until the next redetermination. In February 2013, after giving effect to McMoRan’s sales of oil and gas properties in January 2013 (Note 2), the amount of cash subject to priority lien was increased to $60 million. Use of the cash is unrestricted; however, to the extent McMoRan uses any portion of the cash prior to completion of the next redetermination, the borrowing base would be reduced on a dollar for dollar basis. The credit facility was secured by (1) substantially all the oil and gas properties of MOXY and its subsidiaries and (2) a pledge of McMoRan’s ownership interest in MOXY and MOXY’s ownership interest in each of its wholly owned subsidiaries.
Interest on the credit facility accrued at the London Interbank Offered Rate (LIBOR) plus 2.00 percent, subject to increases or decreases based on usage as a percentage of the borrowing base. Fees associated with the letters of credit and the unused commitment fee are also subject to increases or decreases in the same manner. There were no borrowings under the credit facility in the period from January 1, 2013, through June 3, 2013, or the year ended December 31, 2012. Interest expense on the credit facility (including amortization of deferred financing costs and other facility fees) totaled $0.7 million in the period from January 1, 2013, through June 3, 2013, and $4.0 million in the year ended December 31, 2012.
The credit facility contained covenants and other restrictions customary for oil and gas borrowing base credit facilities, including limitations on debt, liens, dividends, voluntary redemptions of debt, investments, asset sales and transactions with affiliates. In addition, the credit facility requires that McMoRan maintain certain financial tests, including a leverage test (Total Debt to EBITDAX, as those terms are defined in the credit facility, for the preceding four quarters), and a current ratio test (current assets to current liabilities, subject to certain adjustments as of the end of the quarter).
11.875% Senior Notes. On November 14, 2007, McMoRan completed the sale of $300 million of 11.875% senior notes (11.875% notes). The 11.875% notes were due on November 15, 2014 and were unconditionally guaranteed on a senior basis by MOXY and its subsidiaries. The indenture governing the 11.875% notes contained restrictions, including restrictions on incurring debt, creating liens, selling assets and entering into certain transactions with affiliates. The covenants also restricted McMoRan’s ability to pay certain cash dividends on common stock, repurchase or redeem common or preferred equity, prepay subordinated debt and make certain investments. Interest expense on the senior notes totaled $15.6 million and $36.8 million during the period from January 1, 2013, through June 3, 2013, and for the year ended December 31, 2012, respectively, including amortization of related deferred financing costs of $0.5 million and $1.2 million, respectively. The estimated fair value of the 11.875% notes (derived from level 2 inputs) was $314.1 million at June 3, 2013, and $320.3 million at December 31, 2012.
4% Convertible Senior Notes. On December 30, 2010, McMoRan completed a private placement of $200 million of 4% convertible senior notes (4% convertible notes) due December 30, 2017, concurrent with the 5.75% convertible preferred stock offerings (Note 7) and the acquisition of Plains Exploration & Production
F-116
Table of Contents
Index to Financial Statements
Company’s (PXP) shallow water GOM assets (PXP Acquisition). The 4% convertible notes were unsecured with semi-annual interest payments payable on February 15 and August 15 of each year.
The terms of the 4% convertible notes were negotiated in September 2010, and the closing for the 4% convertible notes was contingent upon the approval by McMoRan’s stockholders of Freeport-McMoRan Inc’s (FCX) investment in the 5.75% preferred stock offering (Note 7) and the PXP Acquisition. The Notes closed on December 30, 2010, the date of stockholder approval of the other concurrent transactions. Because the value of McMoRan’s common stock on the closing date ($17.18 per share) exceeded the conversion price ($16 per share) for the convertible notes issued, the 4% convertible notes included a beneficial conversion option. With respect to the 4% convertible notes, the intrinsic value of the beneficial conversion option was recognized as a $14.8 million debt discount, which was being accreted through McMoRan’s earnings as adjustments to interest expense through the debt maturity date, and a $14.8 million increase to McMoRan’s additional paid-in-capital. McMoRan incurred approximately $1.6 million of debt issuance costs associated with the 4% convertible notes. The estimated fair value of the 4% convertible notes (derived from Level 2 inputs) was $237.5 million at June 3, 2013, and $224.7 million at December 31, 2012.
5 1⁄4% Convertible Senior Notes. On October 6, 2004, McMoRan completed a private placement of $140 million of 5 1⁄4% convertible senior notes due October 6, 2011 (2011 5 1⁄4% convertible notes). Net proceeds from the 2011 5 1⁄4% convertible notes, after fees and expenses, totaled $134.4 million, of which $21.2 million was used to purchase U.S. government securities to be held in escrow to pay the first six semi-annual interest payments on the notes.
During 2008, McMoRan privately negotiated transactions to induce the conversion of $40.2 million of the 2011 5 1⁄4% convertible notes into approximately 2.4 million shares of McMoRan’s common stock.
On October 6, 2011, McMoRan completed an offer to exchange $68.2 million aggregate principal amount of 2011 5 1⁄4% convertible notes in exchange for an equal principal amount of newly issued 5 1⁄4% Convertible Senior Notes due October 6, 2012 (2012 5 1⁄4% convertible notes). McMoRan repaid $6.5 million of the remaining principal amount of 2011 5 1⁄4% convertible notes, which matured in accordance with their terms on October 6, 2011. The terms of the 2012 5 1⁄4% convertible notes were substantially the same as the terms of the 2011 5 1⁄4% convertible notes, except that the 2012 5 1⁄4% convertible notes had a maturity date of October 6, 2012.
On September 13, 2012, McMoRan completed an offer to exchange $67.8 million aggregate principal amount of 2012 5 1⁄4% convertible notes for an equal principal amount of newly issued 5 1⁄4% Convertible Senior Notes due October 6, 2013 (2013 5 1⁄4% convertible notes). McMoRan repaid $0.3 million of the remaining principal amount of 2012 5 1⁄4% convertible notes, which matured in accordance with their terms on October 6, 2012. The terms of the 2013 5 1⁄4% convertible notes are substantially the same as the terms of the 2012 5 1⁄4% convertible notes, except that the 2013 5 1⁄4% convertible notes have a maturity date of October 6, 2013. The impact of this exchange transaction, which was recorded as a debt extinguishment in the third quarter of 2012, resulted in a loss on debt exchange of $6.0 million (derived from Level 2 inputs). Debt extinguishment accounting was applied to the 2012 note exchange transaction as the change in fair value of the embedded conversion option between the previous notes exchanged and the new notes exceeded ten percent of the face value of the notes prior to the exchange.
The estimated fair value of the 2013 5 1⁄4% convertible notes (derived from Level 2 inputs) was $68.5 million at June 3, 2013, and $69.0 million at December 31, 2012.
The fair value measures determined by McMoRan for purposes of its accounting and disclosures associated with its debt instruments are derived from inputs related to observable market transactions of instruments with comparable terms and similar issuer characteristics.
F-117
Table of Contents
Index to Financial Statements
Long-Term Debt Subsequent Events. Subsequent to June 3, 2013, in connection with FCX’s acquisition of McMoRan (Note 15), the credit facility was terminated, all of the 11.875% notes were redeemed, and holders of the 4% convertible notes and 2013 5 1⁄4% convertible notes converted their notes into merger consideration during the remainder of 2013.
Note 7 — PREFERRED STOCK OFFERINGS
On December 30, 2010, McMoRan completed the private placement of $700 million of 5.75% convertible perpetual preferred stock (5.75% preferred stock) concurrent with the 4% senior note offering (Note 6) and the PXP Acquisition. FCX, an affiliate of McMoRan (Note 13), purchased $500 million of the 5.75% preferred stock and $200 million was purchased by institutional investors.
The 5.75% preferred stock was recorded at the liquidation preference value ($1,000 per share). Cumulative annual dividends accrued at 5.75% of the liquidation preference, payable quarterly on February 15, May 15, August 15 and November 15 of each year, which commenced on February 15, 2011.
In June 2009, McMoRan completed concurrent public offerings of 15.5 million shares of common stock at $5.75 per share and 86,250 shares of 8% convertible perpetual preferred stock (8% preferred stock) with an offering price of $1,000 per share. The net proceeds from these offerings, after deducting underwriters’ discounts and other expenses, were approximately $168.3 million.
The 8% preferred stock was recorded at the liquidation preference value ($1,000 per share), and dividends were paid quarterly.
During 2012, 1,917 shares of McMoRan’s 8% preferred stock with a liquidation preference of $1.9 million were converted into approximately 0.3 million shares of McMoRan common stock (at a conversion rate equal to 146.1454 shares of common stock per share of 8% preferred stock). At June 3, 2013, and December 31, 2012, 12,082 shares of McMoRan’s 8% preferred stock remained outstanding.
Preferred Stock Offerings Subsequent Events. Subsequent to June 3, 2013, $500 million of the 5.75% preferred stock owned by FCX was canceled in connection with its acquisition of McMoRan. Additionally, because of enhanced “make-whole” conversion rates triggered by FCX’s acquisition of McMoRan, the remaining 5.75% preferred stock and the 8% preferred stock were all converted into merger consideration during the remainder of 2013.
Note 8 — EARNINGS PER SHARE
McMoRan had a net loss from continuing operations for the period from January 1, 2013, through June 3, 2013, and for the year ended December 31, 2012. Accordingly, the incremental shares of common stock that would have been issued upon exercise of stock options, as well as the assumed conversion of McMoRan’s 5.75% preferred stock, 8% preferred stock, 4% convertible notes and 5 1⁄4% convertible notes have been excluded from the diluted net loss per share calculation for both periods because they were considered to be anti-dilutive, meaning their inclusion would have reduced the reported amount of net loss per share. The excluded common share amounts are summarized below (in thousands):
| January 1, 2013, to June 3, 2013 |
Year Ended December 31, 2012 |
|||||||
| In-the-money stock options a, b |
863 | 1,006 | ||||||
| Shares issuable upon assumed conversion of: |
||||||||
| 5.75% preferred stock c |
43,750 | 43,750 | ||||||
| 8% preferred stock d |
1,766 | 1,925 | ||||||
| 4% convertible notes e |
12,500 | 12,500 | ||||||
| 5 1⁄4% convertible notes f |
4,092 | 4,092 | ||||||
F-118
Table of Contents
Index to Financial Statements
| a. | McMoRan uses the treasury stock method to determine the amount of in-the-money stock options to include in its diluted earnings per share calculation. |
| b. | Represents stock options with an exercise price less than the average market price for McMoRan’s common stock for the periods presented. |
| c. | Amount represents total equivalent common stock shares assuming conversion of 5.75% preferred stock (Note 7). Preferred dividends totaled $17.2 million and $40.3 million in the period from January 1, 2013, through June 3, 2013, and the year ended December 31, 2012, respectively. |
| d. | Amount represents total equivalent common stock shares assuming conversion of 8% preferred stock (Note 7). Preferred dividends totaled $0.4 million and $1.0 million in the period from January 1, 2013, through June 3, 2013, and the year ended December 31, 2012, respectively. |
| e. | Amount represents total equivalent common stock shares assuming conversion of 4% convertible notes (Note 6). There was no net interest expense on the 4% convertible notes in the period from January 1, 2013, to June 3, 2013, or in the year ending December 31, 2012. |
| f. | Amount represents total equivalent common stock shares assuming conversion of 5 1⁄4% convertible notes (Note 6). There was no net interest expense on the 5 1⁄4% convertible notes in the period from January 1, 2013, to June 3, 2013, or in the year ending December 31, 2012. |
Outstanding stock options excluded from the computation of diluted net loss per share of common stock because their exercise prices were greater than the average market price of McMoRan’s common stock during the periods presented are as follows:
| January 1, 2013, to June 3, 2013 |
Year Ended December 31, 2012 |
|||||||
| Outstanding options (in thousands) |
5,088 | 11,604 | ||||||
| Average exercise price |
$ | 17.78 | $15.77 | |||||
Note 9 — DISCONTINUED OPERATIONS
In November 1998, McMoRan acquired Freeport Energy, a business engaged in the purchasing, transporting, terminaling, processing, and marketing of recovered sulphur and the production of oil reserves at Main Pass. Prior to August 31, 2000, Freeport Energy was also engaged in the mining of sulphur. In June 2002, Freeport Energy sold substantially all of its remaining sulphur assets. As discussed in Note 1, all of McMoRan’s sulphur operations and major classes of assets and liabilities are classified as discontinued operations in the consolidated financial statements. All of McMoRan’s sulphur results are included in the consolidated statements of operations within the caption “Loss from discontinued operations.”
The table below provides a summary of the discontinued results of operations (in thousands):
| January 1, 2013, to June 3, 2013 |
Year Ended December 31, 2012 |
|||||||
| Accretion and other sulphur abandonment and contingency obligations |
$ | 4,616 | $ | 6,711 | ||||
| Caretaking costs - Port Sulphur |
473 | 1,117 | ||||||
| Environmental remediation activities, net of insurance and other reimbursements |
51 | (2,018 | ) | |||||
| Sulphur retiree costs |
114 | 1,072 | ||||||
| General and administrative and legal |
480 | 130 | ||||||
| Insurance |
111 | 222 | ||||||
| Other |
(5 | ) | 27 | |||||
|
|
|
|
|
|||||
| Loss from discontinued operations |
$ | 5,840 | $ | 7,261 | ||||
|
|
|
|
|
|||||
F-119
Table of Contents
Index to Financial Statements
Exit From Sulphur Business. In connection with the June 2002 sale of assets, McMoRan agreed to be responsible for certain related historical environmental obligations and also agreed to indemnify the purchaser from certain potential liabilities with respect to the historical sulphur operations engaged in by Freeport Sulphur and its predecessor and successor companies, including ARO. In addition, McMoRan assumed, and agreed to indemnify the purchaser from certain potential obligations, including environmental obligations, other than liabilities existing and identified as of the closing of the sale associated with historical oil and gas operations undertaken by the Freeport-McMoRan companies prior to the 1997 merger of FCX and IMC Global Inc. Cumulative legal fees and related settlement amounts incurred since 2002 with respect to this indemnification total $1.4 million (Note 13).
Sulphur Abandonment Obligations. McMoRan is currently meeting its financial obligations relating to the future abandonment of its former Main Pass sulphur facilities with Bureau of Safety and Environmental Enforcement of the United States Department of the Interior (BSEE) using financial assurances from MOXY. McMoRan and its subsidiaries’ ongoing compliance with applicable BSEE requirements will be subject to meeting certain financial and other criteria.
Note 10 — EMPLOYEE BENEFITS
Stock-Based Awards. At June 3, 2013, McMoRan had three stockholder-approved stock incentive plans. Under each plan, McMoRan is authorized to issue a fixed number of stock-based awards, which include stock options, stock appreciation rights, restricted stock, restricted stock units (RSUs) and other stock-based awards that are issuable in or valued by McMoRan common shares. Below is a summary of McMoRan’s stock incentive plans.
|
Plan |
Authorized number of stock-based awards |
Shares available for grant at June 3, 2013 |
||||||
| 2008 Stock Incentive Plan (2008 Plan) |
11,500,000 | 1,676,497 | ||||||
| 2005 Stock Incentive Plan (2005 Plan) |
3,500,000 | 75,125 | ||||||
| 2004 Director Compensation Plan (2004 Directors Plan) |
175,000 | 1,000 | ||||||
Restricted Stock Units. Under McMoRan’s incentive plans, its Board of Directors did not grant any RSUs in the period from January 1, 2013, through June 3, 2013, and granted 30,000 RSUs in the year ended December 31, 2012. The RSUs are converted ratably into an equivalent number of shares of McMoRan common stock on the first three anniversaries of the grant date, except for RSUs granted to the non-management directors, which vest incrementally over the first four anniversaries of the grant date. RSUs converted into common stock totaled 5,424 shares in the period from January 1, 2013, through June 3, 2013, and 29,207 shares in 2012. Upon issuance of the RSUs, unearned compensation equivalent to the market value at the date of grant is recorded over the three or four-year vesting period of each respective grant as stockholders’ equity and is charged to expense over the same period. McMoRan charged approximately $0.2 million and $0.4 million of this deferred compensation to expense in the period from January 1, 2013, through June 3, 2013, and for the year ended December 31, 2012, respectively.
Stock Options. McMoRan’s Board of Directors grants stock options under its stock incentive plans. Except for certain awards described below, the stock options become exercisable in 25 percent annual increments beginning one year from the date of grant and expire ten years after the date of grant.
F-120
Table of Contents
Index to Financial Statements
On January 28, 2013, McMoRan’s Board of Directors granted 928,000 stock options to its employees at an exercise price of $15.91 per share (the 2013 stock options). The weighted average per share fair value of the 2013 stock options was $10.42. A summary of stock options outstanding and activity during the periods from January 1, 2013, to June 3, 2013, and the year ended December 31, 2012, follows:
| January 1, 2013, to June 3, 2013 |
Year Ended December 31, 2012 |
|||||||||||||||
| Number of Options |
Weighted- Average Option Price |
Number of Options |
Weighted- Average Option Price |
|||||||||||||
| Beginning of year |
14,042,250 | $ | 14.25 | 13,265,500 | $ | 14.15 | ||||||||||
| Granted |
928,000 | 15.91 | 2,073,500 | 12.76 | ||||||||||||
| Exercised |
(1,515,625 | ) | 8.97 | (656,250 | ) | 7.86 | ||||||||||
| Expired/forfeited |
(109,500 | ) | 18.73 | (640,500 | ) | 13.98 | ||||||||||
|
|
|
|
|
|||||||||||||
| End of period |
13,345,125 | 14.92 | 14,042,250 | 14.25 | ||||||||||||
|
|
|
|
|
|||||||||||||
| Exercisable at end of period |
10,318,625 | 10,669,875 | ||||||||||||||
|
|
|
|
|
|||||||||||||
The total intrinsic value of options exercised during the period from January 1, 2013, through June 3, 2013, was $13.6 million, and in the year ended December 31, 2012 was $5.2 million. The weighted-average fair value per share of shares vested during the period from January 1, 2013, through June 3, 2013, was $10.42, and in the year ended December 31, 2012, was $10.97. The total intrinsic value of all McMoRan options outstanding at June 3, 2013, was $199.1 million with a weighted-average remaining life of six years. The total intrinsic value of exercisable options totaled $74.6 million at June 3, 2013. The exercisable options had a weighted average remaining life of six years and a weighted average exercise price of $14.94.
The Co-Chairmen of McMoRan’s Board of Directors and McMoRan’s Treasurer agreed to forgo all cash compensation during the period from January 1, 2013, through June 3, 2013, and the year ended December 31, 2012. For the year ended December 31, 2012, in lieu of cash compensation, McMoRan granted the Co-Chairmen and Treasurer stock options that are immediately exercisable upon grant and have a term of ten years. These grants to the Co-Chairmen and Treasurer totaled 445,000 options at an exercise price of $13.00 per share in February 2012. The Co-Chairmen and Treasurer also received additional grants totaling 380,000 stock options in February 2012 (with the same respective periods’ exercise prices stated above), all of which vest ratably over a four-year period. There were no immediately vested 2013 stock options granted in the period from January 1, 2013, through June 3, 2013, nor were any stock options granted to McMoRan’s Co-Chairmen or Treasurer.
Compensation cost charged against earnings for stock-based awards is shown below (in thousands):
| January 1, 2013, to June 3, 2013 |
Year Ended December 31, 2012 |
|||||||
| Cost of options awarded to employees (including directors) a |
$ | 4,950 | $ | 15,094 | ||||
| Cost of options awarded to non-employees |
533 | 1,917 | ||||||
| Cost of restricted stock units |
165 | 434 | ||||||
|
|
|
|
|
|||||
| Total stock-based compensation cost |
$ | 5,648 | $ | 17,445 | ||||
|
|
|
|
|
|||||
| a. | Includes $4.0 million of compensation charges associated with immediately vested stock options granted to certain executive officers (including McMoRan’s Co-Chairmen and Treasurer) during the year ended December 31, 2012. Also includes $1.0 million and $2.0 million of compensation charges related to stock options granted to retirement-eligible employees, which resulted in one-year’s compensation expense being immediately recognized at the date of the stock option grant during the period from January 1, 2013 through June 3, 2013, and the year ended December 31, 2012, respectively. |
F-121
Table of Contents
Index to Financial Statements
A summary of the classification of stock-based compensation by financial statement line item for the period from January 1, 2013, through June 3, 2013, and for the year ended December 31, 2012, is as follows (in thousands):
| January 1, 2013, to June 3, 2013 |
Year Ended December 31, 2012 |
|||||||
| General and administrative expense |
$ | 4,107 | $ | 9,755 | ||||
| Exploration expenses |
1,533 | 7,651 | ||||||
| Main Pass Energy Hub TM costs |
8 | 39 | ||||||
|
|
|
|
|
|||||
| Total stock-based compensation cost |
$ | 5,648 | $ | 17,445 | ||||
|
|
|
|
|
|||||
As of June 3, 2013, total compensation cost related to nonvested, granted stock option awards not yet recognized in earnings was approximately $19.3 million, which is expected to be recognized over a weighted-average period of one year. Certain outstanding stock options fully vest in accordance with change of control provisions in the respective stock option agreements.
The fair value of option awards is estimated on the date of grant using a Black-Scholes option valuation model. Expected volatility is based on implied volatilities from the historical volatility of McMoRan’s stock, and to a lesser extent, on traded options on McMoRan’s common stock. McMoRan uses historical data to estimate option exercise, forfeitures and expected life of the options. The risk-free interest rate is based on Federal Reserve rates in effect for bonds with maturity dates equal to the expected term of the option at the date of grant. McMoRan has not paid, and at June 3, 2013, was not permitted to pay, cash dividends on its common stock. The weighted-average fair value of stock options granted and assumptions used to value stock option awards during the period from January 1, 2013, through June 3, 2013, and the year ended December 31, 2012, are noted in the following table:
| January 1, 2013, to June 3, 2013 |
Year Ended December 31, 2012 |
|||||||
| Weighted-average fair value of stock options granted |
$ | 10.42 | $ | 8.49 | a | |||
| Expected and weighted-average volatility |
69.07 | % | 72.13 | % | ||||
| Expected life of options (in years) |
6.96 | 6.88 | a | |||||
| Risk-free interest rate |
1.39 | % | 1.31 | % | ||||
| a. | Excludes stock options that were granted in 2012 with immediate vesting (445,000 shares, including 400,000 shares granted to the Co-Chairmen in lieu of cash compensation for the year ended December 31, 2012). There were no stock options that were granted with immediate vesting during the period from January 1, 2013, through June 3, 2013. The expected life and fair value of stock options for the year ended December 31, 2012, for such option awards are as follows: |
| Year Ended December 31, 2012 |
||||
| Expected life (in years) |
7.73 | |||
| Fair value of stock option on date of grant |
$ | 9.04 | ||
F-122
Table of Contents
Index to Financial Statements
Other Benefits. McMoRan provides certain health care and life insurance benefits (Other Benefits) to retired employees. McMoRan has the right to modify or terminate these benefits. For the period from January 1, 2013, through June 3, 2013, the health care trend rate used for Other Benefits was 8.0 percent decreasing ratably annually until reaching 4.3 percent in 2028. For the year ended December 31, 2012, the health care trend rate used for Other Benefits was 8.0 percent, decreasing ratably annually until reaching 4.5 percent in 2029. A one-percentage-point increase or decrease in assumed health care cost trend rates would not have a significant impact on service or interest costs. Information on the Other Benefits plan follows (in thousands):
| January 1, 2013, to June 3, 2013 |
Year Ended December 31, 2012 |
|||||||
| Change in benefit obligation: |
||||||||
| Benefit obligation at beginning of year |
$ | (3,841 | ) | $ | (4,155 | ) | ||
| Service cost |
(30 | ) | (63 | ) | ||||
| Interest cost |
(59 | ) | (153 | ) | ||||
| Actuarial gains (losses) |
(345 | ) | — | |||||
| Participant contributions |
— | (207 | ) | |||||
| Benefits paid |
198 | 737 | ||||||
|
|
|
|
|
|||||
| Benefit obligation at end of period |
(4,077 | ) | (3,841 | ) | ||||
|
|
|
|
|
|||||
| Change in plan assets: |
||||||||
| Fair value of plan assets at beginning of year |
— | — | ||||||
| Return on plan assets |
— | — | ||||||
| Employer/participant contributions |
198 | 737 | ||||||
| Benefits paid |
(198 | ) | (737 | ) | ||||
|
|
|
|
|
|||||
| Fair value of plan assets at end of period |
— | — | ||||||
|
|
|
|
|
|||||
| Funded status |
$ | (4,077 | ) | $ | (3,841 | ) | ||
|
|
|
|
|
|||||
| Weighted-average assumptions: |
||||||||
| Discount rate |
3.6 | % | 3.6 | % | ||||
| Expected return on plan assets |
— | — | ||||||
| Rate of compensation increase |
— | — | ||||||
Expected benefit payments for the Other Benefits plan approximate $0.4 million in each of the three years ending December 31, 2015, $0.3 million in the years ending December 31, 2016 and 2017, and a total of $1.2 million during the five years thereafter. The components of net periodic benefit cost for McMoRan’s plans follow (in thousands):
| January 1, 2013, to June 3, 2013 |
Year Ended December 31, 2012 |
|||||||
| Service cost |
$ | 30 | $ | 63 | ||||
| Interest cost |
59 | 153 | ||||||
| Return on plan assets |
— | — | ||||||
| Amortization of prior service costs |
(17 | ) | (40 | ) | ||||
|
|
|
|
|
|||||
| Net periodic costs |
$ | 72 | $ | 176 | ||||
|
|
|
|
|
|||||
Included in accumulated other comprehensive income at June 3, 2013, are prior service costs of less than $0.1 million that have not been recognized in net periodic benefit costs associated with the Other Benefits. The total amount expected to be recognized into net periodic costs in 2013 associated with these prior service credits and actuarial gains and losses is immaterial.
McMoRan has an employee savings plan under Section 401(k) of the Internal Revenue Code. The plan allows eligible employees to contribute up to 75 percent of their pre-tax compensation, subject to certain limits
F-123
Table of Contents
Index to Financial Statements
prescribed by the Internal Revenue Code. McMoRan matches 100 percent of each employees’ contribution up to a maximum of 5 percent of each employees’ annual basic compensation amount. In this plan, participants exercise control and direct the investment of their contributions and account balances among various investment options. In connection with the termination of its defined benefits plan, McMoRan enhanced the savings plan for substantially all its employees. Pursuant to the enhancements, McMoRan contributes amounts to individual employee accounts totaling either 4 percent or 10 percent of each employee’s pay, depending on a combination of each employee’s age and years of service with McMoRan. Participants who were actively employed on January 1, 2009, became fully vested in the matching contributions. Plan participants vest in McMoRan’s enhanced contributions upon completing three years of service with McMoRan. For employees whose eligible compensation exceeds certain levels, McMoRan provides an unfunded defined contribution plan. The balance of this liability totaled $0.2 million on June 3, 2013, and $0.6 million on December 31, 2012.
McMoRan’s results of operations reflect charges to expense totaling $0.5 million in the period from January 1, 2013, through June 3, 2013, and $1.0 million in the year ended December 31, 2012, for its aggregate matching contributions for the Section 401(k) savings plan and the defined contribution plan. Additionally, McMoRan has other employee benefit plans, certain of which are related to McMoRan’s performance, which costs are recognized currently in general and administrative expense.
McMoRan also has a contractual obligation to reimburse a third party for a portion of its postretirement benefit costs relating to certain former retired sulphur employees (Note 12).
Employee Benefits Subsequent Events. On June 3, 2013, in connection with FCX’s acquisition of McMoRan and under the terms of the stock incentive plans, all unvested options and restricted stock, excluding the 2013 stock options, became fully vested and exercisable upon the change of control with respect to McMoRan’s ownership. However, specifically with respect to FCX’s acquisition of McMoRan, McMoRan’s executive officers waived their rights to the accelerated vesting provisions of the McMoRan stock options they held (Note 15).
Note 11 — INCOME TAXES
McMoRan has a net deferred tax asset of $1,108.8 million as of June 3, 2013, resulting from net operating loss carryforwards and other temporary differences related to McMoRan’s activities. McMoRan has provided a valuation allowance, including $44.5 million associated with McMoRan’s discontinued sulphur operations, for the full amount of these net deferred tax assets. McMoRan’s effective tax rate would be impacted in future periods to the extent these deferred tax assets are recognized. McMoRan will continue to assess whether or not its deferred tax assets can be recognized based on operating results in future periods. McMoRan has no material uncertain tax positions as of June 3, 2013.
As of June 3, 2013, and December 31, 2012, McMoRan had federal tax net operating loss carryforwards (NOLs) of $1,007.5 million and $952.9 million, respectively, and state tax NOLs of $421.5 million and $341.8 million, respectively. These NOLs are scheduled to expire in varying amounts between tax years 2013 through 2033.
Federal tax regulations impose certain annual limitations on the utilization of NOLs from prior periods when a defined level of change in the stock ownership of certain stockholders is exceeded. If a corporation has a statutorily defined change of ownership, its ability to use its existing NOLs could be limited by Section 382 of the Internal Revenue Code depending upon the level of future taxable income generated in a given year and other factors. McMoRan determined that such a change of ownership occurred during 2010, which, depending upon the amounts and timing of future taxable income generated, may limit McMoRan’s ability to use its existing NOLs to fully offset taxable income in individual future periods.
F-124
Table of Contents
Index to Financial Statements
Interest or penalties associated with income taxes are recorded as components of the provision for income taxes, although no such amounts have been recognized in the financial statements. Currently, McMoRan’s major taxing jurisdictions are the U.S. (federal) and Louisiana. Tax periods open to audit for McMoRan primarily include federal and Louisiana income tax returns subsequent to 2008. NOLs amounts prior to this time are also subject to audit.
The components of McMoRan’s deferred tax assets at June 3, 2013, and December 31, 2012, follow (in thousands):
| June 3, 2013 | December 31, 2012 | |||||||
| Federal and state net operating loss carryforwards |
$ | 372,751 | $ | 349,479 | ||||
| Property, plant and equipment |
581,341 | (4,626 | ) | |||||
| ARO reserves |
91,698 | 92,055 | ||||||
| Deferred compensation, postretirement and pension benefits and accrued liabilities |
48,695 | 50,033 | ||||||
| Other, net |
14,288 | 7,716 | ||||||
| Less: valuation allowance |
(1,108,773 | ) | (494,657 | ) | ||||
|
|
|
|
|
|||||
| Net deferred tax asset |
$ | — | $ | — | ||||
|
|
|
|
|
|||||
Reconciliations of the differences between income taxes computed at the federal statutory tax rate and the income taxes recorded follow (in thousands):
| January 1, 2013, to June 3, 2013 |
Year Ended December 31, 2012 |
|||||||
| Income tax benefit computed at the federal statutory income tax rate |
$ | 610,065 | $ | 36,503 | ||||
| Change in valuation allowance |
(614,116 | ) | (36,585 | ) | ||||
| State NOLs (not impacting federal tax) |
4,144 | 2,146 | ||||||
| Other |
(93 | ) | (2,064 | ) | ||||
|
|
|
|
|
|||||
| Total income tax benefit (provision) |
$ | — | $ | — | ||||
|
|
|
|
|
|||||
Note 12 — TRANSACTIONS WITH AFFILIATES
FM Services Company, a wholly owned subsidiary of FCX and a company with which McMoRan shares certain common executive management, provides McMoRan with certain administrative, financial and other services on a contractual basis. These service costs, which include related overhead amounts, including rent for the New Orleans, Louisiana corporate headquarters, totaled $4.2 million in the period from January 1, 2013, through June 3, 2013, and $7.7 million in 2012. Management believes these costs do not differ materially from the costs that would have been incurred had the relevant personnel providing the services been employed directly by McMoRan. At June 3, 2013, and December 31, 2012, McMoRan had an obligation to fund $2.9 million of FM Services costs for both periods, primarily reflecting long-term employee pension and postretirement medical obligations (Notes 5 and 10).
On December 30, 2010, FCX purchased 500,000 shares of McMoRan’s 5.75% preferred stock (Note 7).
On December 5, 2012, McMoRan signed a definitive merger agreement under which FCX would acquire McMoRan for approximately $3.4 billion in cash, or $2.1 billion net of the 36 percent McMoRan ownership interest held by FCX and PXP (Note 15). The merger was completed on June 3, 2013 (Note 15).
F-125
Table of Contents
Index to Financial Statements
Note 13 — COMMITMENTS AND CONTINGENCIES
Oil and Gas Operations. As of June 3, 2013, McMoRan has $81.3 million of estimated commitments related to its planned oil and gas exploration and development activities, including costs related to projects currently in progress, inventory purchase commitments and other exploration expenditures. Included in this amount is $2.7 million of expenditures for drilling rig contract charges anticipated to be expended over the next year which McMoRan expects to share with its partners in its exploration program.
Long-Term Contracts and Operating Leases. McMoRan’s primary operating leases involve renting office space in two buildings in Houston, Texas, which expire in April 2014 and July 2014, and office space in Lafayette, Louisiana, which expires in November 2015. At June 3, 2013, McMoRan’s total minimum annual contractual charges aggregated $3.0 million, with payments totaling $1.5 million in the remainder of 2013, $1.5 million in 2014 and $0.1 million in 2015. Rent expense, including rent allocated to McMoRan by FM Services (Note 12), totaled $1.3 million in the period from January 1, 2013, through June 3, 2013, and $3.0 million in the year ended December 31, 2012.
Other Liabilities. Freeport Energy has a contractual obligation to reimburse a third party a portion of its postretirement benefit costs relating to certain retired former sulphur employees of Freeport Energy. This contractual obligation totaled $1.8 million at both June 3, 2013, and December 31, 2012, including $0.5 million in current liabilities from discontinued operations for both dates. A third-party actuarial consultant assesses the estimated related future costs associated with this contractual liability on an annual basis using current health care trend costs and incorporating changes made to the underlying benefit plans of the third party. The annual assessment at year end 2012 used an initial health care cost trend rate of 8.0 percent in 2012 decreasing ratably to 4.5 percent in 2029. McMoRan applied a discount rate of 8.5 percent at December 31, 2012, to the consultant’s future cost estimates. McMoRan increased the liability by $0.8 million at December 31, 2012, primarily due to estimated increases in future health claim costs resulting from higher than expected actual health claim reimbursements and higher health trend costs. Future revisions to this estimate resulting from changes in assumptions or actual results varying from projected results will be recorded in earnings.
Environmental and ARO. McMoRan has made, and will continue to make, expenditures for the protection of the environment. McMoRan is subject to contingencies as a result of environmental laws and regulations. Present and future environmental laws and regulations applicable to McMoRan’s operations could require substantial capital expenditures or could adversely affect its operations in other ways that cannot be predicted at this time. Cumulative legal fees and related settlement amounts incurred with respect to historical oil and gas liabilities McMoRan assumed from IMC Global since 2002 total approximately $1.4 million as of June 3, 2013. No additional amounts were recorded because no specific liability requiring McMoRan to fund any material future amounts was identified and assessed to be probable.
McMoRan’s estimates of existing asset retirement obligations involve inherent uncertainties and are subject to change over time as a result of several factors, including, without limitation, changes in the industry’s regulatory environment, changes in the cost and availability of required equipment and expertise to complete the work, changes in timing, and changes in scope that are identified as ARO projects progress. McMoRan revises its ARO estimates, as appropriate, when such changes in estimates become known.
For the period from January 1, 2013, through June 3, 2013, and the year ended December 31, 2012, McMoRan recorded approximately ($0.6) million and $17.6 million to accretion expense, respectively, related to revisions for changes in estimates for certain ongoing ARO projects. Additionally, during the year ended December 31, 2012, McMoRan recorded approximately $7.7 million of adjustments for certain longer term producing properties, the impact of which increased property, plant and equipment.
Revisions made for certain properties depending upon the respective circumstances include consideration of the following: (1) the inclusion of estimates for new properties; (2) changes in the projected timing of certain
F-126
Table of Contents
Index to Financial Statements
ARO costs because of changes in the estimated timing of the depletion of the related proved reserves for McMoRan’s oil and gas properties and new estimates for the timing of the ARO for the structures comprising the MPEHTM project and former sulphur facilities at Main Pass; (3) changes in the ARO costs based on revised estimates of future reclamation work to be performed; and (4) when applicable, changes in McMoRan’s credit-adjusted, risk-free interest rate. McMoRan’s credit adjusted, risk-free interest rates ranged from 4.2 percent to 8.2 percent at June 3, 2013, and December 31, 2012. At June 3, 2013, McMoRan’s estimated undiscounted ARO, including inflation and market risk premiums, totaled $354.5 million, including $38.1 million associated with its remaining sulphur obligations. A rollforward of McMoRan’s consolidated discounted asset retirement obligations (including both current and long term liabilities) follows (in thousands):
| January 1, 2013, to June 3, 2013 |
Year Ended December 31, 2012 |
|||||||
| Oil and Natural Gas |
||||||||
| Asset retirement obligations at beginning of year |
$ | 245,580 | $ | 326,394 | ||||
| Liabilities settled |
(3,530 | ) | (76,217 | ) | ||||
| Scheduled accretion expense a |
4,923 | 14,005 | ||||||
| Asset retirement obligations assumed |
— | 3,040 | ||||||
| Properties sold |
(6,267 | ) | (45,640 | ) | ||||
| Revision for changes in estimate - charged to operations a |
(555 | ) | 17,556 | |||||
| Revision for changes in estimate - adjustments to property, plant and equipment, net |
— | 7,663 | ||||||
| Other, net |
54 | (1,221 | ) | |||||
|
|
|
|
|
|||||
| Asset retirement obligations at end of period |
$ | 240,205 | $ | 245,580 | ||||
|
|
|
|
|
|||||
| Sulphur |
||||||||
| Asset retirement obligations at beginning of year |
$ | 17,435 | $ | 17,745 | ||||
| Liabilities settled |
(260 | ) | (4,145 | ) | ||||
| Scheduled accretion expense b |
459 | 1,093 | ||||||
| Revision for changes in estimate b |
4,157 | 2,742 | ||||||
|
|
|
|
|
|||||
| Asset retirement obligations at end of period |
$ | 21,791 | $ | 17,435 | ||||
|
|
|
|
|
|||||
| a. | Accretion expense and other charges to operations are included within depletion, depreciation and amortization expense in the consolidated statements of operations. |
| b. | Included within loss from discontinued operations. |
At June 3, 2013, McMoRan had $3.4 million in restricted investments associated with third party prepayments of their share of future abandonment costs and $58.9 million held in escrow associated with surety funding requirements in favor of a third party related to a portion of the ARO assumed in a 2007 oil and gas property acquisition. McMoRan is required to make quarterly installment payments under this arrangement totaling $5.0 million per year until certain requirements under the arrangement are met. These restricted funds are classified as long-term restricted cash in the consolidated balance sheets.
Litigation. McMoRan may from time to time be involved in various legal proceedings of a character normally incident to the ordinary course of its business. Management believes that potential liability from any of these pending or threatened proceedings will not have a material adverse effect on McMoRan’s financial condition or results of operations.
Between December 11, 2012, and December 26, 2012, ten putative class actions challenging FCX’s acquisition of McMoRan (Note 15) were filed on behalf of all McMoRan stockholders by purported McMoRan stockholders. Nine were filed in the Court of Chancery of the State of Delaware (the “Delaware Court of
F-127
Table of Contents
Index to Financial Statements
Chancery”). On January 9, 2013, one of the actions was voluntarily dismissed by the plaintiff. On January 25, 2013, the Court of Chancery consolidated the remaining eight actions into a single action, In re McMoRan Exploration Co. Stockholder Litigation, No. 8132-VCN. One action was also filed on December 19, 2012, in the Civil District Court for the Parish of Orleans of the State of Louisiana, Langley v. Moffett et al., No. 2012-11904. The actions named some or all of the following defendants: McMoRan and its directors, FCX, the Gulf Coast Ultra Deep Royalty Trust, INAVN Corp., a wholly-owned subsidiary of FCX (the “merger sub”), another subsidiary of FCX, and PXP. The lawsuits allege, among other things, that members of the McMoRan Board of Directors breached their fiduciary duties to McMoRan’s stockholders because they, among other things, pursued their own interests at the expense of stockholders, failed to maximize stockholder value with respect to FCX’s acquisition of McMoRan, and that FCX, the merger sub and PXP aided and abetted that breach of fiduciary duties. The consolidated Delaware action also asserted breach of contracts claims against FCX and PXP derivatively on behalf of McMoRan. These lawsuits seek, among other things, an injunction barring or rescinding FCX’s acquisition of McMoRan, damages, and attorney’s fees and costs.
In addition, between December 14, 2012, and March 5, 2013, fourteen derivative actions challenging FCX’s acquisition of McMoRan and/or FCX’s acquisition of PXP were filed on behalf of FCX by purported FCX stockholders. Eleven were filed in the Delaware Court of Chancery and three were filed in the Superior Court of the State of Arizona, County of Maricopa (the “Arizona Superior Court”). On January 25, 2013, the Court of Chancery consolidated the Delaware actions into a single action, In re Freeport-McMoRan Copper & Gold, Inc. Derivative Litigation, No. 8145-VCN. On January 17, 2013, the Arizona Superior Court consolidated two of the Arizona actions into In re Freeport-McMoRan Derivative Litigation, No. CV2012-018351. A third Arizona complaint, Harris v. Adkerson et al., No. CV2013-004163, filed on January 16, 2013, had not yet been consolidated. The defendants in these lawsuits included directors and certain officers of FCX, two FCX subsidiaries, McMoRan and certain of McMoRan’s directors and officers, and PXP and certain of PXP’s directors. These lawsuits allege, among other things, that the FCX directors breached their fiduciary duties to FCX’s stockholders because they, among other things, pursued their own interests at the expense of stockholders in approving FCX’s acquisition of McMoRan and FCX’s acquisition of PXP. These lawsuits further alleged that the other defendants aided and abetted that breach of fiduciary duties. These lawsuits seek, among other things, an injunction barring or rescinding both FCX’s acquisition of McMoRan and FCX’s acquisition of PXP and requiring submission of both FCX’s acquisition of McMoRan and FCX’s acquisition of PXP to a vote of FCX stockholders, damages, and attorneys’ fees and costs. The McMoRan and FCX defendants believed the lawsuits were without merit and intended to defend vigorously against them.
The McMoRan plaintiffs filed a motion for preliminary injunction. The FCX plaintiffs told the court that they do not intend to file a motion for preliminary injunction. McMoRan believed the lawsuits are without merit and intended to defend vigorously against them.
Litigation Subsequent Events. On April 19, 2013, the Louisiana Civil District Court granted defendants’ motion to stay the action captioned Langley v. Moffett et al., No. 2012-11904, Civil District Court for the Parish of Orleans of the State of Louisiana, filed December 19, 2012, pending the resolution of the consolidated action brought by McMoRan stockholders in the Delaware Court of Chancery captioned In re McMoRan Exploration Co. Stockholder Litigation, No. 8132-VCN. On June 28, 2013, the parties in the consolidated action entered into a settlement agreement and on October 16, 2013, the Delaware Court of Chancery entered an order approving the settlement, the terms of which are not material to McMoRan. As a result of the settlement of the consolidated Delaware action, the Louisiana action was dismissed on April 11, 2014.
On April 7, 2015, the Delaware Court of Chancery approved the settlement of FCX’s consolidated stockholder derivative litigation captioned In re Freeport-McMoRan Copper & Gold Inc. Derivative Litigation, No. 8145-VCN, and awarded the plaintiffs’ legal fees and expenses.
F-128
Table of Contents
Index to Financial Statements
Note 14 — MAIN PASS ENERGY HUBTM PROJECT
McMoRan’s long-term business objective of the MPEHTM is to repurpose some of the offshore structures used in its former sulphur operations located at Main Pass in the GOM, 38 miles east of Venice, Louisiana. Currently, Freeport Energy is engaged in efforts to utilize the MPEH™ as a potential deepwater port facility/terminal to receive, store, condition and liquefy domestic natural gas for export as LNG. Natural gas would be received by a pipeline at MPEHTM , processed and then transferred to on-site floating liquefaction storage and offloading vessels for liquefaction and offloading to LNG transport vessels for export to foreign locations. MPEH™ is located close to significant Gulf Coast natural gas production and numerous interstate pipelines and offshore gathering systems. The project would utilize existing offshore structures of the MPEHTM deepwater port, which was approved by the U.S. Maritime Administration in 2007 as a deepwater port for the importation and regasification of LNG, conditioning of natural gas to produce NGLs, and storage of natural gas in salt caverns. Modification of the Main Pass facilities to accommodate use as an LNG export facility would require additional permit approvals.
On January 4, 2013, the Department of Energy authorized MPEHTM to export domestically produced LNG by vessel from the proposed MPEHTM to any country that has or subsequently enters into a free trade agreement (FTA) with the U.S. The approval allows export of up to 24 million tonnes of LNG per annum (3.2 Bcf per day) for a 30-year term, beginning on the earlier of the date of first export or 8 years from the date the authorization is issued (January 4, 2021), pursuant to one or more long-term contracts with third parties that do not exceed the term of the authorization. A non-FTA application, seeking approval to export to countries without FTAs with the U.S., was submitted in February 2013. MPEHTM is currently the only project being pursued under Maritime Administration jurisdiction.
McMoRan is engaged in studies to define the MPEHTM project and related permitting requirements and is seeking third party funding required to support the significant capital investments involved in the MPEHTM project. The ultimate outcome of its efforts to develop the MPEHTM project and obtain additional third party financing to fund the MPEHTM project is subject to various uncertainties, many of which are beyond McMoRan’s control.
The costs associated with the establishment of the MPEHTM project have been charged to expense in the consolidated statements of operations. These costs will continue to be charged to expense until commercial feasibility is established. McMoRan incurred costs for the MPEH™ project totaling $0.2 million for the period from January 1, 2013, through June 3, 2013, and $0.3 million in 2012.
Note 15 — MERGER AGREEMENT
FCX acquired McMoRan on June 3, 2013. McMoRan stockholders received per-share consideration of $14.75 in cash and 1.15 units in the Gulf Coast Ultra Deep Royalty Trust (merger consideration), which holds a five percent overriding royalty interest in future production from McMoRan’s Inboard Lower Tertiary/Cretaceous exploration prospects that existed as of December 5, 2012, the date of the merger agreement. McMoRan conveyed the royalty interests to the royalty trust immediately prior to the effective time of the merger, and they were “carved out” of the mineral interests that were acquired by FCX.
On June 3, 2013, in connection with FCX’s acquisition of McMoRan and under the terms of the stock incentive plans, all unvested options and restricted stock, excluding the 2013 stock options, became fully vested and exercisable upon the change of control with respect to McMoRan’s ownership. However, specifically with respect to FCX’s acquisition of McMoRan, McMoRan’s executive officers waived their rights to the accelerated vesting provisions of the McMoRan stock options they held. Stock-based compensation expense associated with the change of control totaled $9.6 million and is not included in the consolidated statement of operations.
F-129
Table of Contents
Index to Financial Statements
Note 16 — SUPPLEMENTARY OIL AND GAS INFORMATION (UNAUDITED)
McMoRan’s oil and gas exploration, development and production activities are primarily conducted offshore in the GOM and onshore in the Gulf Coast region of the U.S. Supplementary information presented below is prepared in accordance with requirements prescribed by U.S. generally accepted accounting principles.
Oil and Gas Capitalized Costs
| January 1, 2013, to June 3, 2013 |
Year Ended December 31, 2012 |
|||||||
| (In thousands) | ||||||||
| Unproved properties |
$ | 286,665 | $ | 1,962,441 | ||||
| Proved properties |
2,208,820 | 2,276,480 | ||||||
|
|
|
|
|
|||||
| Subtotal |
2,495,485 | 4,238,921 | ||||||
| Less accumulated depreciation and amortization |
(1,826,269 | ) | (1,844,429 | ) | ||||
|
|
|
|
|
|||||
| Net oil and gas properties |
$ | 669,216 | $ | 2,394,492 | ||||
|
|
|
|
|
|||||
Costs Incurred in Oil and Natural Gas Property Acquisition, Exploration and Development Activities
| January 1, 2013, to June 3, 2013 |
Year Ended December 31, 2012 |
|||||||
| (In thousands) | ||||||||
| Exploration costs |
$ | 113,596 | $ | 514,761 | ||||
| Development costs |
2,697 | 21,295 | ||||||
|
|
|
|
|
|||||
| $ | 116,293 | $ | 536,056 | |||||
|
|
|
|
|
|||||
The following table reflects the net changes in McMoRan’s capitalized exploratory well drilling costs (in thousands):
| January 1, 2013, to June 3, 2013 |
Year Ended December 31, 2012 |
|||||||
| Beginning of year |
$ | 1,121,351 | $ | 689,661 | ||||
| Additions to capitalized exploratory well costs |
50,198 | 471,804 | ||||||
| Amounts charged to expense |
(1,034,918 | ) | (40,114 | ) | ||||
|
|
|
|
|
|||||
| End of period |
$ | 136,631 | $ | 1,121,351 | ||||
|
|
|
|
|
|||||
Proved Oil and Natural Gas Reserves. Proved oil and natural gas reserves as of June 3, 2013, have been estimated by McMoRan and as of December 31, 2012, have been estimated by Ryder Scott Company, L.P., in accordance with the guidelines established by the Securities and Exchange Commission (SEC) as set forth in Rule 4-10 (a) (6), (22), (26) and (31). All estimates of oil and natural gas reserves are inherently imprecise and subject to change as new technical information about the properties is obtained. Estimates of proved reserves for wells with little or no production history are less reliable than those based on a long production history. Subsequent evaluation of the same reserves may result in variations, which may be substantial. Revisions of proved reserves represent changes in previous estimates of proved reserves resulting from new information obtained from production history, additional development drilling and/or changes in other factors, including economic considerations. Discoveries and extensions represent additions to proved reserves resulting from
F-130
Table of Contents
Index to Financial Statements
(1) extensions of proved acreage of previously discovered reservoirs through additional drilling in periods subsequent to initial discovery, and (2) discovery of new fields with proved reserves or of new reservoirs of proved reserves in old fields. Substantially all of McMoRan’s proved reserves are located offshore in the GOM. Oil and natural gas liquids (NGLs), are stated in thousands of barrels (MBbls) and natural gas in millions of cubic feet (MMcf).
| Gas (MMcf) |
Oil (MBbls) |
NGLs (MBbls) |
||||||||||
| Proved Reserves: |
||||||||||||
| January 1, 2012 |
152,051 | 14,441 | 2,848 | |||||||||
| Revisions of previous estimates a |
15,064 | (199 | ) | 1,226 | ||||||||
| Discoveries and extensions b |
14,219 | 143 | — | |||||||||
| Production |
(31,797 | ) | (2,107 | ) | (965 | ) | ||||||
| Sales of reserves (Note 2) |
(13,604 | ) | (1,399 | ) | — | |||||||
| Purchase of reserves |
— | — | — | |||||||||
|
|
|
|
|
|
|
|||||||
| December 31, 2012 |
135,933 | c | 10,879 | 3,109 | ||||||||
| Revisions of previous estimates a |
12,317 | 431 | 468 | |||||||||
| Discoveries and extensions |
— | — | — | |||||||||
| Production |
(8,510 | ) | (776 | ) | (372 | ) | ||||||
| Sales of reserves (Note 2) |
(8,982 | ) | (103 | ) | (6 | ) | ||||||
| Purchase of reserves |
— | — | — | |||||||||
|
|
|
|
|
|
|
|||||||
| June 3, 2013 |
130,758 | c | 10,431 | 3,199 | ||||||||
|
|
|
|
|
|
|
|||||||
| Proved developed reserves: |
||||||||||||
| January 1, 2012 |
123,626 | 13,353 | 2,220 | |||||||||
| December 31, 2012 |
99,736 | 10,114 | 2,447 | |||||||||
| June 3, 2013 |
97,988 | 9,711 | 2,563 | |||||||||
| a. | Revisions of previous estimates primarily due to performance revisions at Flatrock and Long Point. |
| b. | Includes 12,203 MMcf of natural gas and 122 MBbls of oil associated with the Lineham Creek onshore ultra-deep exploratory well. |
| c. | At June 3, 2013, and December 31, 2012, McMoRan had natural gas imbalances of 0.5 Bcfe for under deliveries for both dates, and 0.7 Bcfe and 0.5 Bcfe for over deliveries, respectively which are not reflected in the above reserve quantities. |
Standardized Measure of Discounted Future Net Cash Flows
McMoRan’s standardized measure of discounted future net cash flows (Standardized Measure) and changes therein relating to proved oil and natural gas reserves were computed using reserve valuations based on regulations and parameters prescribed by the SEC. SEC regulations require the use of average prices during the 12-month period prior to the reporting date. The weighted average of these prices for all properties with proved reserves was $104.55 per barrel of oil, $36.47 per barrel of NGLs and $3.52 per Mcf of natural gas at June 3, 2013, and $106.68 per barrel of oil, $46.56 per barrel of NGLs and $2.84 per Mcf of natural gas at December 31, 2012.
| June 3, 2013 | December 31, 2012 | |||||||
| (In thousands) | ||||||||
| Future cash inflows |
$ | 1,667,955 | $ | 1,690,828 | ||||
| Future costs applicable to future cash flows: |
||||||||
| Production costs |
(455,109 | ) | (463,294 | ) | ||||
| Development and abandonment costs |
(418,676 | ) | (441,591 | ) | ||||
| Future income taxes a |
— | — | ||||||
|
|
|
|
|
|||||
| Future net cash flows |
794,170 | 785,943 | ||||||
| Discount for estimated timing of net cash flows (10% discount rate) b |
(254,765 | ) | (255,632 | ) | ||||
|
|
|
|
|
|||||
| $ | 539,405 | $ | 530,311 | |||||
|
|
|
|
|
|||||
| a. | At June 3, 2013, and December 31, 2012, McMoRan’s available tax benefits directly related to its oil and gas operations exceeded its pretax future net cash flows under the Standardized Measure. |
F-131
Table of Contents
Index to Financial Statements
| b. | Amount reflects application of required 10 percent discount rate to both the estimated future income taxes and estimated future net cash flows associated with production of the estimated proved reserves. |
Changes in Standardized Measure of Discounted Future Net Cash Flows
| January 1, 2013, to June 3, 2013 |
Year Ended December 31, 2012 |
|||||||
| (In thousands) | ||||||||
| Beginning of period |
$ | 530,311 | $ | 828,831 | ||||
| Revisions: |
||||||||
| Accretion of discount |
53,031 | 82,883 | ||||||
| Changes in prices |
(10,548 | ) | (166,543 | ) | ||||
| Change in reserve quantities |
69,619 | 7,879 | ||||||
| Other changes, including revised estimates of development |
(7,015 | ) | (43,348 | ) | ||||
| Discoveries and extensions, less related costs |
— | 269 | ||||||
| Development costs incurred during the year |
2,698 | 97,511 | ||||||
| Change in future income taxes |
— | — | ||||||
| Revenues, less production costs |
(82,613 | ) | (208,280 | ) | ||||
| Purchases reserves in place |
— | — | ||||||
| Sales of reserves in place |
(16,078 | ) | (68,891 | ) | ||||
|
|
|
|
|
|||||
| Total changes |
9,094 | (298,520 | ) | |||||
|
|
|
|
|
|||||
| End of period |
$ | 539,405 | $ | 530,311 | ||||
|
|
|
|
|
|||||
F-132
Table of Contents
Index to Financial Statements
Shares
Freeport-McMoRan Oil & Gas Inc.
Class A Common Stock
Prospectus
, 2015
Barclays
Through and including , 2015 (the 25th day after the date of this prospectus), all dealers that effect transactions in these securities, whether or not participating in this offering, may be required to deliver a prospectus. This is in addition to the dealers’ obligations to deliver a prospectus when acting as underwriters and with respect to their unsold allotments or subscriptions.
Table of Contents
Index to Financial Statements
PART II
INFORMATION NOT REQUIRED IN PROSPECTUS
ITEM 13. Other Expenses of Issuance and Distribution
The following table sets forth an itemized statement of the amounts of all expenses (excluding underwriting discounts and commissions) payable by us in connection with the registration of the Class A common stock offered hereby. With the exception of the SEC registration fee and the FINRA filing fee, the amounts set forth below are estimates.
| SEC registration fee |
$ | 11,620 | ||
| FINRA filing fee |
15,500 | |||
| NYSE listing fee |
* | |||
| Accounting fees and expenses |
* | |||
| Legal fees and expenses |
* | |||
| Printing and engraving expenses |
* | |||
| Transfer agent and registrar fees |
* | |||
| Miscellaneous |
* | |||
|
|
|
|||
| Total |
* | |||
|
|
|
| * | To be provided by amendment. |
ITEM 14. Indemnification of Directors and Officers
Section 145 of the DGCL permits a Delaware corporation to indemnify its officers, directors and other corporate agents to the extent and under the circumstances set forth therein. Our amended and restated certificate of incorporation and our amended and restated by-laws will provide that we will indemnify any person who was or is a party or is threatened to be made a party to any threatened, pending or completed action, suit or proceeding whether civil, criminal, administrative or investigative, by reason of the fact that he is or was our director or officer, or is or was serving at our request as a director, officer, employee or agent of another corporation, partnership, joint venture, trust or other enterprise, in accordance with provisions corresponding to Section 145 of the DGCL. These indemnification provisions may be sufficiently broad to permit indemnification of our executive officers and directors for liabilities, including reimbursement of expenses incurred, arising under the Securities Act.
Pursuant to Section 102(b)(7) of the DGCL, our amended and restated certificate of incorporation will eliminate the personal liability of a director to us or our stockholders for monetary damages for a breach of fiduciary duty as a director, except for liabilities arising:
| • | from any breach of the director’s duty of loyalty to us or our stockholders; |
| • | from acts or omissions not in good faith or which involve intentional misconduct or a knowing violation of law; |
| • | under Section 174 of the DGCL; and |
| • | from any transaction from which the director derived an improper personal benefit. |
The above discussion of Section 145 of the DGCL and of our amended and restated certificate of incorporation and our amended and restated by-laws is not intended to be exhaustive and is respectively qualified in its entirety by Section 145 of the DGCL, our amended and restated certificate of incorporation and our amended and restated by-laws.
II-1
Table of Contents
Index to Financial Statements
As permitted by Section 145 of the DGCL, we will carry primary and excess insurance policies insuring our directors and officers against certain liabilities they may incur in their capacity as directors and officers. Under the policies, the insurer, on our behalf, may also pay amounts for which we granted indemnification to our directors and officers.
In addition, the underwriting agreement that will be filed as Exhibit 1.1 to this Registration Statement will provide that the underwriters will indemnify us and our executive officers and directors for certain liabilities related to this offering, including liabilities arising under the Securities Act.
ITEM 15. Recent Sales of Unregistered Securities
In connection with our incorporation on June 11, 2015, under the laws of the State of Delaware, we issued 1,000 shares of our common stock to Freeport-McMoRan Inc. for an aggregate purchase price of $10.00. These securities were offered and sold by us in reliance upon the exemption from the registration requirements provided by Section 4(2) of the Securities Act.
ITEM 16. Exhibits and Financial Statement Schedules
| (a) | Exhibits |
| Exhibit Number |
Description | |
| 1.1* | Form of Underwriting Agreement. | |
| 3.1* | Form of Amended and Restated Certificate of Incorporation of Freeport-McMoRan Oil & Gas Inc. | |
| 3.2* | Form of Amended and Restated By-laws of Freeport-McMoRan Oil & Gas Inc. | |
| 5.1* | Opinion of Latham & Watkins LLP as to the legality of the securities being registered. | |
| 10.1* | Form of Tax Matters Agreement. | |
| 10.2* | Form of Intercompany Loan Agreement. | |
| 10.3* | Form of Transaction Agreement. | |
| 10.4* | Form of Shared Services Agreement. | |
| 10.5* | Form of Stockholders Agreement. | |
| 10.6+* | Freeport-McMoRan Oil & Gas Inc. 2015 Incentive Stock Plan. | |
| 10.7† | Crude Oil Purchase Agreement, dated January 1, 2012, between Plains Exploration & Production Company and ConocoPhillips Company (incorporated by reference to Exhibit 10.1 to the Quarterly Report on Form 10-Q/A of Plains Exploration & Production Company filed with the SEC on September 22, 2011 (File No. 001-31470)). | |
| 10.8† | First Amendment, dated January 1, 2014, to the Crude Oil Purchase Agreement dated January 1, 2012, between Freeport-McMoRan Oil & Gas LLC (formerly Plains Exploration & Production Company) and ConocoPhillips Company (incorporated by reference to Exhibit 10.23 to the Annual Report on Form 10-K of Freeport-McMoRan Inc. filed with the SEC on February 27, 2015 (File No. 001-11307-01)). | |
| 10.9† | Second Amendment, dated July 1, 2014, to the Crude Oil Purchase Agreement dated January 1, 2012, between Freeport-McMoRan Oil & Gas LLC and ConocoPhillips Company (incorporated by reference to Exhibit 10.24 to the Annual Report on Form 10-K of Freeport-McMoRan Inc. filed with the SEC on February 27, 2015 (File No. 001-11307-01)). | |
II-2
Table of Contents
Index to Financial Statements
| Exhibit Number |
Description | |
| 10.10** | Certificate of Designation of 8.0% Convertible Preferred Stock of Plains Offshore Operations Inc. | |
| 10.11** | Amendment No. 1 to Certificate of Designation of 8.0% Convertible Preferred Stock of Plains Offshore Operations Inc. | |
| 10.12** | Stockholders Agreement, dated November 17, 2011, by and among Plains Offshore Operations Inc., Plains Exploration & Production Company, PXP Resources LLC and Investors set forth on Schedule A thereto. | |
| 10.13** | First Amendment to the Stockholders Agreement, dated as of December 22, 2011, by and among Plains Offshore Operations Inc., Plains Exploration & Production Company, PXP Resources LLC and Investors set forth on Schedule A thereto. | |
| 10.14** | Second Amendment to the Stockholders Agreement, dated as of January 31, 2012, by and among Plains Offshore Operations Inc., Plains Exploration & Production Company, PXP Resources LLC and Investors set forth on Schedule A thereto. | |
| 10.15** | Waiver Agreement, dated as of August 16, 2012, by and among Plains Offshore Operations Inc., Plains Exploration & Production Company, PXP Resources LLC and Investors set forth on Schedule A thereto. | |
| 10.16** | Second Waiver Agreement, dated as of October 15, 2012, by and among Plains Offshore Operations Inc., Plains Exploration & Production Company, PXP Resources LLC and Investors set forth on Schedule A thereto. | |
| 10.17** | Consent and Fourth Amendment to the Stockholders Agreement, dated as of January 15, 2014, by and among Plains Offshore Operations Inc., Plains Exploration & Production Company, PXP Resources LLC and Investors set forth on Schedule A thereto. | |
| 10.18+ | Amended and Restated Executive Employment Agreement, dated effective as of December 2, 2008, between Freeport-McMoRan Copper & Gold Inc. and James R. Moffett (incorporated by reference to Exhibit 10.28 to the Annual Report on Form 10-K of Freeport-McMoRan Copper & Gold Inc. filed with the SEC on February 26, 2009 (File No. 001-11307-01)). | |
| 10.19+ | Amended and Restated Change of Control Agreement, dated effective as of December 2, 2008, between Freeport-McMoRan Copper & Gold Inc. and James R. Moffett (incorporated by reference to Exhibit 10.29 to the Annual Report on Form 10-K of Freeport-McMoRan Copper & Gold Inc. filed with the SEC on February 26, 2009 (File No. 001-11307-01)). | |
| 10.20+ | Letter Agreement, dated February 27, 2014, between Freeport-McMoRan Copper & Gold Inc. and James R. Moffett (incorporated by reference to Exhibit 10.2 to the Current Report on Form 8-K of Freeport-McMoRan Copper & Gold Inc. filed with the SEC on March 3, 2014 (File No. 001-11307-01)). | |
| 10.21+* | Form of Employment Agreement of James R. Moffett. | |
| 10.22+ | Amended and Restated Employment Agreement, dated February 27, 2014, between Freeport-McMoRan Copper & Gold Inc. and James C. Flores (incorporated by reference to Exhibit 10.3 to the Current Report on Form 8-K of Freeport-McMoRan Copper & Gold Inc. filed with the SEC on March 3, 2014 (File No. 001-11307-01)). | |
| 10.23+* | Form of Employment Agreement of James C. Flores. | |
| 10.24+ | Amended and Restated Employment Agreement, effective as of November 8, 2006, between Plains Exploration & Production Company and Doss R. Bourgeois (incorporated by reference to Exhibit 10.21 to the Annual Report on Form 10-K of Plains Exploration & Production Company filed with the SEC on February 27, 2008 (File No. 001-31470)). | |
II-3
Table of Contents
Index to Financial Statements
| Exhibit Number |
Description | |
| 10.25+ | Letter Agreement, dated as of December 5, 2012, by and among Doss R. Bourgeois, Plains Exploration & Production Company and Freeport-McMoRan Copper & Gold Inc. (incorporated by reference to Exhibit 10.3 to the Current Report on Form 8-K of Plains Exploration & Production Company filed with the SEC on December 6, 2012 (File No. 001-31470)). | |
| 10.26+* | Form of Employment Agreement of Doss R. Bourgeois. | |
| 10.27+ | Amended and Restated Employment Agreement, effective as of November 8, 2006, between Plains Exploration & Production Company and Winston M. Talbert (incorporated by reference to Exhibit 10.20 to the Annual Report on Form 10-K of Plains Exploration & Production Company filed with the SEC on February 27, 2008 (File No. 001-31470)). | |
| 10.28+ | Letter Agreement, dated as of December 5, 2012, by and among Winston M. Talbert, Plains Exploration & Production Company and Freeport-McMoRan Copper & Gold Inc. (incorporated by reference to Exhibit 10.4 to the Current Report on Form 8-K of Plains Exploration & Production Company filed with the SEC on December 6, 2012 (File No. 001-31470)). | |
| 10.29+* | Form of Employment Agreement of Winston M. Talbert. | |
| 10.30+ | Amended and Restated Employment Agreement, effective as of June 9, 2004, between Plains Exploration & Production Company and John F. Wombwell (incorporated by reference to Exhibit 10.19 to the Annual Report on Form 10-K of Plains Exploration & Production Company filed with the SEC on February 27, 2008 (File No. 001-31470)). | |
| 10.31+ | Letter Agreement, dated as of December 5, 2012, by and among John F. Wombwell, Plains Exploration & Production Company and Freeport-McMoRan Copper & Gold Inc. (incorporated by reference to Exhibit 10.5 to the Current Report on Form 8-K of Plains Exploration & Production Company filed with the SEC on December 6, 2012 (File No. 001-31470)). | |
| 10.32+* | Form of Employment Agreement of John F. Wombwell. | |
| 21.1* | Subsidiaries of Freeport-McMoRan Oil & Gas Inc. | |
| 23.1** | Consent of Ernst & Young LLP. | |
| 23.2** | Consent of PricewaterhouseCoopers LLP. | |
| 23.3** | Consent of Ernst & Young LLP. | |
| 23.4** | Consent of Netherland, Sewell & Associates, Inc. | |
| 23.5** | Consent of Ryder Scott Company, L.P. | |
| 23.6* | Consent of Latham & Watkins LLP (included in Exhibit 5.1). | |
| 24.1** | Power of Attorney (included on signature page to the Registration Statement). | |
| 99.1** | Report of Netherland, Sewell & Associates, Inc. for Freeport-McMoRan Oil & Gas LLC proved, probable and possible reserves at December 31, 2014. | |
| 99.2*** | Report of Ryder Scott Company, L.P. for Freeport-McMoRan Oil & Gas LLC proved, probable and possible reserves at December 31, 2014. | |
| 99.3*** | Report of Netherland, Sewell & Associates, Inc. for Freeport-McMoRan Oil & Gas LLC’s proved and probable reserves at December 31, 2013. | |
| 99.4*** | Report of Ryder Scott Company, L.P. for Freeport-McMoRan Oil & Gas LLC’s proved and probable reserves at December 31, 2013. | |
| 99.5*** | Report of Netherland, Sewell & Associates, Inc. for Plains Exploration & Production Company’s proved and probable reserves at December 31, 2012. | |
II-4
Table of Contents
Index to Financial Statements
| Exhibit Number |
Description | |
| 99.6*** | Report of Netherland, Sewell & Associates, Inc. for Plains Exploration & Production Company’s proved reserves in the Haynesville Shale of Louisiana and Texas at December 31, 2012. | |
| * | To be filed by amendment. |
| ** | Filed herewith. |
| *** | Previously filed. |
| + | Management contract or compensatory plan, contract or arrangement. |
| † | Certain portions have been omitted pursuant to a confidential treatment request. Omitted information has been filed separately with the SEC. |
ITEM 17. Undertakings
The undersigned registrant hereby undertakes to provide to the underwriter at the closing specified in the underwriting agreement certificates in such denominations and registered in such names as required by the underwriters to permit prompt delivery to each purchaser.
Insofar as indemnification for liabilities arising under the Securities Act of 1933 may be permitted to directors, officers and controlling persons of the registrant pursuant to the foregoing provisions, or otherwise, the registrant has been advised that in the opinion of the Securities and Exchange Commission such indemnification is against public policy as expressed in the Act and is, therefore, unenforceable. In the event that a claim for indemnification against such liabilities (other than the payment by the registrant of expenses incurred or paid by a director, officer or controlling person of the registrant in the successful defense of any action, suit or proceeding) is asserted by such director, officer or controlling person in connection with the securities being registered, the registrant will, unless in the opinion of its counsel the matter has been settled by controlling precedent, submit to a court of appropriate jurisdiction the question whether such indemnification by it is against public policy as expressed in the Act and will be governed by the final adjudication of such issue.
The undersigned registrant hereby undertakes that:
| (1) | For purposes of determining any liability under the Securities Act of 1933, the information omitted from the form of prospectus filed as part of this registration statement in reliance upon Rule 430A and contained in a form of prospectus filed by the registrant pursuant to Rule 424(b) (1) or (4) or 497(h) under the Securities Act shall be deemed to be part of this registration statement as of the time it was declared effective. |
| (2) | For the purpose of determining any liability under the Securities Act of 1933, each post-effective amendment that contains a form of prospectus shall be deemed to be a new registration statement relating to the securities offered therein, and the offering of such securities at that time shall be deemed to be the initial bona fide offering thereof. |
II-5
Table of Contents
Index to Financial Statements
SIGNATURES
Pursuant to the requirements of the Securities Act of 1933, as amended, the registrant has duly caused this registration statement to be signed on its behalf by the undersigned, thereunto duly authorized in the City of Houston, State of Texas, on August 10, 2015.
| Freeport-McMoRan Oil & Gas Inc. | ||
| By: | ||
| /s/ Winston M. Talbert | ||
| Winston M. Talbert Executive Vice President and Chief Financial Officer | ||
Pursuant to the requirements of the Securities Act of 1933, as amended, this registration statement has been signed below by the following persons in the capacities and the dates indicated.
| Signature |
Title |
Date | ||
| * James R. Moffett |
Chairman of the Board of Directors | August 10, 2015 | ||
| * James C. Flores |
Vice-Chairman of the Board of Directors and Chief Executive Officer (Principal Executive Officer) |
August 10, 2015 | ||
| /s/ Winston M. Talbert Winston M. Talbert |
Executive Vice President and Chief Financial Officer (Principal Financial Officer and Principal Accounting Officer) |
August 10, 2015 | ||
| *By: | /s/ Winston M. Talbert | |
| Winston M. Talbert | ||
| Attorney-in-fact | ||
II-6
Table of Contents
Index to Financial Statements
INDEX TO EXHIBITS
| Exhibit Number |
Description | |
| 1.1* | Form of Underwriting Agreement. | |
| 3.1* | Form of Amended and Restated Certificate of Incorporation of Freeport-McMoRan Oil & Gas Inc. | |
| 3.2* | Form of Amended and Restated By-laws of Freeport-McMoRan Oil & Gas Inc. | |
| 5.1* | Opinion of Latham & Watkins LLP as to the legality of the securities being registered. | |
| 10.1* | Form of Tax Matters Agreement. | |
| 10.2* | Form of Intercompany Loan Agreement. | |
| 10.3* | Form of Transaction Agreement. | |
| 10.4* | Form of Shared Services Agreement. | |
| 10.5* | Form of Stockholders Agreement. | |
| 10.6+* | Freeport-McMoRan Oil & Gas Inc. 2015 Incentive Stock Plan. | |
| 10.7† | Crude Oil Purchase Agreement, dated January 1, 2012, between Plains Exploration & Production Company and ConocoPhillips Company (incorporated by reference to Exhibit 10.1 to the Quarterly Report on Form 10-Q/A of Plains Exploration & Production Company filed with the SEC on September 22, 2011 (File No. 001-31470)). | |
| 10.8† | First Amendment, dated January 1, 2014, to the Crude Oil Purchase Agreement dated January 1, 2012, between Freeport-McMoRan Oil & Gas LLC (formerly Plains Exploration & Production Company) and ConocoPhillips Company (incorporated by reference to Exhibit 10.23 to the Annual Report on Form 10-K of Freeport-McMoRan Inc. filed with the SEC on February 27, 2015 (File No. 001-11307-01)). | |
| 10.9† | Second Amendment, dated July 1, 2014, to the Crude Oil Purchase Agreement dated January 1, 2012, between Freeport-McMoRan Oil & Gas LLC and ConocoPhillips Company (incorporated by reference to Exhibit 10.24 to the Annual Report on Form 10-K of Freeport-McMoRan Inc. filed with the SEC on February 27, 2015 (File No. 001-11307-01)). | |
| 10.10** | Certificate of Designation of 8.0% Convertible Preferred Stock of Plains Offshore Operations Inc. | |
| 10.11** | Amendment No. 1 to Certificate of Designation of 8.0% Convertible Preferred Stock of Plains Offshore Operations Inc. | |
| 10.12** | Stockholders Agreement, dated November 17, 2011, by and among Plains Offshore Operations Inc., Plains Exploration & Production Company, PXP Resources LLC and Investors set forth on Schedule A thereto. | |
| 10.13** | First Amendment to the Stockholders Agreement, dated as of December 22, 2011, by and among Plains Offshore Operations Inc., Plains Exploration & Production Company, PXP Resources LLC and Investors set forth on Schedule A thereto. | |
| 10.14** | Second Amendment to the Stockholders Agreement, dated as of January 31, 2012, by and among Plains Offshore Operations Inc., Plains Exploration & Production Company, PXP Resources LLC and Investors set forth on Schedule A thereto. | |
| 10.15** | Waiver Agreement, dated as of August 16, 2012, by and among Plains Offshore Operations Inc., Plains Exploration & Production Company, PXP Resources LLC and Investors set forth on Schedule A thereto. | |
II-7
Table of Contents
Index to Financial Statements
| Exhibit Number |
Description | |
| 10.16** | Second Waiver Agreement, dated as of October 15, 2012, by and among Plains Offshore Operations Inc., Plains Exploration & Production Company, PXP Resources LLC and Investors set forth on Schedule A thereto. | |
| 10.17** | Consent and Fourth Amendment to the Stockholders Agreement, dated as of January 15, 2014, by and among Plains Offshore Operations Inc., Plains Exploration & Production Company, PXP Resources LLC and Investors set forth on Schedule A thereto. | |
| 10.18+ | Amended and Restated Executive Employment Agreement, dated effective as of December 2, 2008, between Freeport-McMoRan Copper & Gold Inc. and James R. Moffett (incorporated by reference to Exhibit 10.28 to the Annual Report on Form 10-K of Freeport-McMoRan Copper & Gold Inc. filed with the SEC on February 26, 2009 (File No. 001-11307-01)). | |
| 10.19+ | Amended and Restated Change of Control Agreement, dated effective as of December 2, 2008, between Freeport-McMoRan Copper & Gold Inc. and James R. Moffett (incorporated by reference to Exhibit 10.29 to the Annual Report on Form 10-K of Freeport-McMoRan Copper & Gold Inc. filed with the SEC on February 26, 2009 (File No. 001-11307-01)). | |
| 10.20+ | Letter Agreement, dated February 27, 2014, between Freeport-McMoRan Copper & Gold Inc. and James R. Moffett (incorporated by reference to Exhibit 10.2 to the Current Report on Form 8-K of Freeport-McMoRan Copper & Gold Inc. filed with the SEC on March 3, 2014 (File No. 001-11307-01)). | |
| 10.21+* | Form of Employment Agreement of James R. Moffett. | |
| 10.22+ | Amended and Restated Employment Agreement, dated February 27, 2014, between Freeport-McMoRan Copper & Gold Inc. and James C. Flores (incorporated by reference to Exhibit 10.3 to the Current Report on Form 8-K of Freeport-McMoRan Copper & Gold Inc. filed with the SEC on March 3, 2014 (File No. 001-11307-01)). | |
| 10.23+* | Form of Employment Agreement of James C. Flores. | |
| 10.24+ | Amended and Restated Employment Agreement, effective as of November 8, 2006, between Plains Exploration & Production Company and Doss R. Bourgeois (incorporated by reference to Exhibit 10.21 to the Annual Report on Form 10-K of Plains Exploration & Production Company filed with the SEC on February 27, 2008 (File No. 001-31470)). | |
| 10.25+ | Letter Agreement, dated as of December 5, 2012, by and among Doss R. Bourgeois, Plains Exploration & Production Company and Freeport-McMoRan Copper & Gold Inc. (incorporated by reference to Exhibit 10.3 to the Current Report on Form 8-K of Plains Exploration & Production Company filed with the SEC on December 6, 2012 (File No. 001-31470)). | |
| 10.26+* | Form of Employment Agreement of Doss R. Bourgeois. | |
| 10.27+ | Amended and Restated Employment Agreement, effective as of November 8, 2006, between Plains Exploration & Production Company and Winston M. Talbert (incorporated by reference to Exhibit 10.20 to the Annual Report on Form 10-K of Plains Exploration & Production Company filed with the SEC on February 27, 2008 (File No. 001-31470)). | |
| 10.28+ | Letter Agreement, dated as of December 5, 2012, by and among Winston M. Talbert, Plains Exploration & Production Company and Freeport-McMoRan Copper & Gold Inc. (incorporated by reference to Exhibit 10.4 to the Current Report on Form 8-K of Plains Exploration & Production Company filed with the SEC on December 6, 2012 (File No. 001-31470)). | |
| 10.29+* | Form of Employment Agreement of Winston M. Talbert. | |
II-8
Table of Contents
Index to Financial Statements
| Exhibit Number |
Description | |
| 10.30+ | Amended and Restated Employment Agreement, effective as of June 9, 2004, between Plains Exploration & Production Company and John F. Wombwell (incorporated by reference to Exhibit 10.19 to the Annual Report on Form 10-K of Plains Exploration & Production Company filed with the SEC on February 27, 2008 (File No. 001-31470)). | |
| 10.31+ | Letter Agreement, dated as of December 5, 2012, by and among John F. Wombwell, Plains Exploration & Production Company and Freeport-McMoRan Copper & Gold Inc. (incorporated by reference to Exhibit 10.5 to the Current Report on Form 8-K of Plains Exploration & Production Company filed with the SEC on December 6, 2012 (File No. 001-31470)). | |
| 10.32+* | Form of Employment Agreement of John F. Wombwell. | |
| 21.1* | Subsidiaries of Freeport-McMoRan Oil & Gas Inc. | |
| 23.1** | Consent of Ernst & Young LLP. | |
| 23.2** | Consent of PricewaterhouseCoopers LLP. | |
| 23.3** | Consent of Ernst & Young LLP. | |
| 23.4** | Consent of Netherland, Sewell & Associates, Inc. | |
| 23.5** | Consent of Ryder Scott Company, L.P. | |
| 23.6* | Consent of Latham & Watkins LLP (included in Exhibit 5.1). | |
| 24.1** | Power of Attorney (included on signature page to the Registration Statement). | |
| 99.1** | Report of Netherland, Sewell & Associates, Inc. for Freeport-McMoRan Oil & Gas LLC’s proved, probable and possible reserves at December 31, 2014. | |
| 99.2*** | Report of Ryder Scott Company, L.P. for Freeport-McMoRan Oil & Gas LLC’s proved, probable and possible reserves at December 31, 2014. | |
| 99.3*** | Report of Netherland, Sewell & Associates, Inc. for Freeport-McMoRan Oil & Gas LLC’s proved and probable reserves at December 31, 2013. | |
| 99.4*** | Report of Ryder Scott Company, L.P. for Freeport-McMoRan Oil & Gas LLC’s proved and probable reserves at December 31, 2013. | |
| 99.5*** | Report of Netherland, Sewell & Associates, Inc. for Plains Exploration & Production Company’s proved and probable reserves at December 31, 2012. | |
| 99.6*** | Report of Netherland, Sewell & Associates, Inc. for Plains Exploration & Production Company’s proved reserves in the Haynesville Shale of Louisiana and Texas at December 31, 2012. | |
| * | To be filed by amendment. |
| ** | Filed herewith. |
| *** | Previously filed. |
| + | Management contract or compensatory plan, contract or arrangement. |
| † | Certain portions have been omitted pursuant to a confidential treatment request. Omitted information has been filed separately with the SEC. |
II-9