Attached files
| file | filename |
|---|---|
| 8-K - 8-K - RCS Capital Corp | v417437_8k.htm |
| EX-99.1 - EXHIBIT 99.1 - RCS Capital Corp | v417437_ex99-1.htm |
Exhibit 99.2

American Realty Capital 1 August 2015 RCS Capital Announces Strategic Initiatives and Second Quarter 2015 Financial & Operating Results
1
2 2 Forward - Looking Statements Certain statements made in this presentation are forward - looking statements . Those statements include statements regarding the intent, belief or current expectations of RCS Capital Corporation (“us,” “our,” “RCAP ” or the “Company”) and members of its management team, as well as the assumptions on which such statements are based, and generally are identified by the use of words such as “may,” “will,” “seeks,” “anticipates,” “believes,” “estimates,” “expects,” “plans,” “intends,” “should” or similar expressions . Actual results may differ materially from those contemplated by such forward - looking statements . Further, forward - looking statements speak only as of the date they are made, and we undertake no obligation to update or revise forward - looking statements to reflect changed assumptions, the occurrence of unanticipated events or changes to future operating results over time, unless required by law . The following are some of the possible risks and uncertainties, although not all risks and uncertainties, that could cause our actual results to differ materially from those presented in our forward - looking statements : the impact on our business of the events relating to American Realty Capital Properties, Inc . announcement concerning errors in its financial statements our ability to integrate our recently acquired businesses into our existing businesses ; whether and when we will be able to realize the anticipated benefits from our recent acquisitions ; significant dilution could result from future issuances of our Class A common stock ; future sales of our Class A common stock could lower the market price of our Class A common stock ; adverse developments in the direct investment program industry ; deterioration in the business environment in the specific sectors of the economy in which we focus or a decline in the market for securities of companies within these sectors ; substantial fluctuations in our financial results ; our ability to retain our senior professionals and key management personnel of our recently acquired businesses ; pricing and other competitive pressures ; changes in laws and regulations and industry practices that adversely affect our business ; incurrence of losses in the future ; competition from larger firms ; limitations on our access to capital ; malfunctioning or failure in our operations and infrastructure ; failure to achieve and maintain effective internal controls ; and the factors included in our most recent Annual Report on Form 10 - K and any subsequent Quarterly Reports on Form 10 - Q or Current Reports on Form 8 - K .
2

3 2 Disclaimer This presentation also contains estimates and information concerning our industry, including market position, market size, and growth rates of the markets in which we participate, that are based on industry publications and reports . This information involves a number of assumptions and limitations, and you are cautioned not to give undue weight to these estimates . We have not independently verified the accuracy or completeness of the data contained in these industry publications and reports . The industry in which we operate is subject to a high degree of uncertainty and risk due to variety of factors, including those described in the “Risk Factors” section of the Company’s Annual Report on Form 10 - K and any subsequent Quarterly Reports on Form 10 - Q or Current Reports on Form 8 - K and “Forward Looking Statements” . These and other factors could cause results to differ materially from those expressed in these publications and reports .
3

American Realty Capital Strategic Initiatives 4 2
4

5 Executive Summary RCS Capital Announced a Series of Strategic Transactions Designed to Enhance Shareholder Value and Re - Focus the Company on its Core Retail Advice Business • Sale of Wholesale Distribution b usiness and related activities to an affiliate of Apollo Global Management (“Apollo”) for $25 million in cash, subject to adjustment • $37.5 Million Preferred Equity Investment by: - $25.0 million from Apollo Global Management - $12.5 million from affiliates of Luxor Capital Group • Ter mination of management agreement with RCS Capital Management, LLC to simplify governance • New Committee of the Board to evaluate additional opportunities to enhance shareholder value
5

6 Sale of RCS Capital’s Wholesale Distribution Division Sale to Affiliate of Apollo Global Management (NYSE: APO) • Upon closing of the sale to an affiliate of Apollo Global Management (“Apollo”), Apollo will contribute the Wholesale Distribution business to a newly created company, AR Global Investments • AR Global Investments will be owned 60% by Apollo, 40% by AR Capital, LLC • Included in Sale: - Wholesale Division – Wholesale Broker - Dealer - Strategic Capital – Wholesale Broker - Dealer - American National Stock Transfer – Transfer Agent • RCS Capital Retains: - Retail Advice – Cetera Financial Group - RCS Investment Banking and Capital Markets – Strategic advice, syndicate, and underwriting - Investment Management – Hatteras Funds • Sale subject to regulatory approvals and expected to close in 2015
6
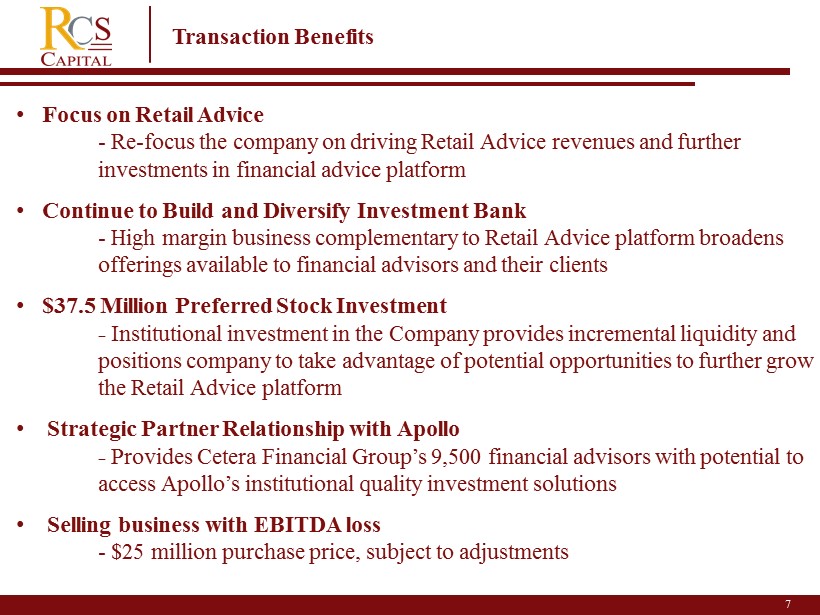
7 Transaction Benefits • Focus on Retail Advice - Re - focus the company on driving Retail Advice revenues and further investments in financial advice platform • Continue to Build and Diversify Investment Bank - High margin business complementary to Retail Advice platform broadens offerings available to financial advisors and their clients • $37.5 Million Preferred Stock Investment - Institutional investment in the Company provides incremental liquidity and positions company to take advantage of potential opportunities to further grow the Retail Advice platform • Strategic Partner Relationship with Apollo - Provides Cetera Financial Group’s 9,500 financial advisors with potential to access Apollo’s institutional quality investment solutions • Selling business with EBITDA loss - $25 million purchase price, subject to adjustments
7

• Alignment of Interests: Aligns interests of management team and shareholders by internalizing management functions, terminating the management agreement, and dissolving RCS Capital Management, LLC • RCS Capital to issue 3.0 million Class A shares 1 to Luxor and approximately 2.6 million Class A shares to the original members of RCS Capital Management, LLC in connection with the termination of the management agreement • Eliminates Future Economic Leakage: Eliminates Management and incentive fees. Future retained earnings can be used for growth initiatives including expansion of Retail Advice division 8 Termination of Agreement with RCS Capital Management
8

• Revamped Board to Consist of three Independent Directors, three Insiders, one Luxor Appointee, two Apollo Appointees – Brian D. Jones resigning from Board • Apollo to Add two Directors to RCS Capital’s Board of Directors – Marc Rowan, Co - Founder and Senior Managing Director of Apollo – Anthony Civale , Lead Partner and COO of Apollo Credit 9 Changes to RCS Capital’s Board of Directors New Board Structure Mark Auerbach 1,2 Marc Rowan 5 Anthony Civale 5 Jeff Brown 3 Tom McMillen Peter Budko 4 Michael Weil 4 Doug Wood Larry Roth 4 1 Non - Executive Chairman 2 Head of Audit Committee 3 Luxor Capital Appointed 4 Insider, member of RCAP Holdings 5 Apollo Appointees
9

• August 6, 2015 announcement of significant transactions and initiatives • $37.5 million preferred equity investment to be completed this month • Board of Directors changes effective at the time of the preferred investment • Sale of RCS Capital’s Wholesale Division to close following regulatory (FINRA) approval and satisfaction of all closing conditions 10 Timeline of Events
10

American Realty Capital Operating Results 11 2
11

12 RCS Capital Company and Financial Overview (1) See slide 30 for Non - GAAP Measure Disclosure (2) Excludes Corporate and Other, and Investment Research segments (3) According to SNL Financial, as measured by total value of announced transactions (4) Excludes intercompany transactions (5) Direct investment programs are vehicles which invest primarily in tangible assets through publicly registered investment vehi cle s (e.g., non - listed real estate investment trusts, non - listed business development companies, and other direct participation programs). Liquid investment programs offered through Hatteras Key Metrics: 2Q’15 1Q’15 Revenue Breakdown by Segment – 2Q 2015 (2) ($ in millions) Total Revenue: $704.7M (4) Gross Revenue: $678.4M $625.6M Adjusted EBITDA (1) : $26.9M $28.4M Assets Under Administration: $238.7M $240.3B Financial Advisors: 9,505 9,539 Retail Clients: 2.5M 2.5M Company Overview Leading integrated financial services company focused on providing services and support to independent advisors and a suite of best - in - class investment solutions to retail investors • Retail Advice : Second largest independent financial advisor network ; 9 , 505 current advisors ; 267 financial advisors recruited representing $ 33 . 1 million in trailing 12 - month Gross Dealer Concession (“GDC ”) ; $ 21 . 5 million increase in Net GDC for the quarter • Wholesale Distribution : D istribution of liquid and illiquid direct investment programs ( 5 ) ; $ 1 . 3 billion total equity raised in 2 Q 2015 ; $ 342 million total equity raised in July 2015 ; $ 2 . 7 billion total equity raised year - to - date through July • Investment Banking & Capital Markets : Well - positioned for expected M&A and liquidity activity ; Expanding syndication and underwriting capabilities ; # 4 real estate mergers and acquisitions advisor in the U . S . in two - year period 2013 and 2014 ( 3 ) • Investment Management : A leading liquid alternatives fund manager with $ 2 . 0 billion of Assets Under Management (“AUM”) Avg Fully Diluted Share Count: 97.3M 93.7M EBITDA Breakdown by Segment – 2Q 2015 (2) ($ in millions) Adjusted EBITDA: $26.9M Assets Under Management: $47.2B $46.5B Retail Advice $529.0M 75.1% Wholesale Distribution $107.2M 15.2% Investment Banking & Capital Markets $21.8M 3.1% Investment Management $12.3M 1.7% -$10.0 -$5.0 $0.0 $5.0 $10.0 $15.0 $20.0 $25.0 $30.0 Independent Retail Advice $26.5M Wholesale Distribution ($5.4M) Investment Banking $10.7M Investment Management $0.8M Segment Contribution
12

13 Second Quarter 2015 Financial & Operating Highlights (1) See slide 30 for Non - GAAP Measure Disclosure (2) Excludes $33.0 million non - cash revenue for the second quarter 2015 recognized from fair market value accounting of embedded der ivatives in securities issued in connection with the Cetera financing (3) Retention rate based on annualized regrettable attrition in the quarter divided by trailing 12 month GDC (ex - current quarter) (4) Based on regrettable attrition Note: 2Q 2014 results are pro forma Adjusted Net Income: • Adjusted Net Income of $16.2 million, or $0.17 per fully diluted share Net Income (Loss) (GAAP): • Net Income of ($66.1) million, or ($1.11) per fully diluted share Adjusted EBITDA (1) : • Adjusted EBITDA of $26.9 million, or $32.3 million excluding Wholesale division • Retail Adjusted EBITDA of $26.5 million • Investment Banking / Capital Markets Adjusted EBITDA of $10.7 Million Revenue: • Revenue of $645.4 million (2) Assets Under Administration: • Assets Under Administration of $238.7 billion, u p 11.4% from the year - ago quarter Assets Under Management: • Assets Under Management of $47.2 billion, up 19.8% from the year - ago quarter Advisors: • 9,505 independent retail financial advisors servicing over 2.5 million clients Advisor Retention: • 97.5% annualized advisor retention based on trailing 12 - month GDC (3) • Continued focus on profitable advisor retention and recruiting Advisor Recruitment: • 267 financial advisors recruited representing $33.1 million in GDC • $21.5 million in net recruited GDC compared to $23.5 million in the prior quarter (4) • GDC from advisors recruited 184% higher than advisors who left the platform (4) Balance Sheet: • Net secured debt decreased by $20 million during the quarter as a result of increased cash and principle amortization payment • Agreed with first and second lien lenders to amend certain leverage ratio covenants in addition to other modifications Cash: • $194.7 million of cash and equivalents at the end of the second quarter, inclusive of regulatory capital
13

14 2 (1) Producing Advisors, excludes licensed home office advisors (2) Reflects assets in internal advisory programs (3) Trailing 12 - months (4) Represents funds from new accounts and additional funds deposited into existing advisory accounts that are custodied in our fee - based advisory platforms, less account attrition and funds withdrawn from advisory accounts (5) Excludes the impact of allocated corporate overhead expenses Key Retail Advice Metrics Gross Recruited GDC (3) ($M): $33.1 $24.2 36.8% Net New Advisory Assets (4) ($M): $613.8 $1,052 (45.8%) AUM (2) ($B): $47.2 $39.4 19.8% Net Recruited GDC (3) ($M): $21.5 $6.3 241% Retail Advice Adjusted EBITDA Margin Significant Margin Expansion Opportunities • Cash sweep revenue • Levered to rising interest rates • 100 bps Fed Funds rate increase adds approximately $65 - $130 million EBITDA • Transition to FDIC - based programs expected in Q 4 2015 • Historically low levels (< 4 % ) of client assets held in cash • Penetration of higher margin advisory assets • Incremental operating efficiencies • Natural margin expansion on organic revenue growth • Future acquisitions generating incremental EBITDA • Normalization of DPP and annuity sales Retail Expansion Opportunities: Successful Recruiting & Retention and Margin Expansion (5) Total Advisors (1) : 9,505 9,200 3.3% Retention Rate: 97.5% 97.0% 0.5% AUA ($B ): $238.7 $214.2 11.4% Q2’15 Q2’14 Change Q2’15 Q2’14 Change 5.1% 6.5% 7.4% 6.4% 7.1% 5.0% 0.0% 2.5% 5.0% 7.5% 10.0% Q1 2014 Q2 2014 Q3 2014 Q4 2014 Q1 2015 Q2 2015
14

15 Growing GDC Through High - Quality Advisor Recruitment We expect meaningful percentage GDC growth from recruiting to continue in 2015 ($ millions) ($ thousands) Q3 20 14 Q4 2014 Q1 2015 Q2 2015 Avg GDC / Recruited Advisor $ 77.8 $ 139.9 $110.4 $124.1 Avg GDC / Attrited Advisor $ 54.3 $ 42.4 $77.9 $85.4 Note: Based on 12 - month trailing regrettable GDC $6.2 $20.9 $ 23.5 $21.5 $0.0 $5.0 $10.0 $15.0 $20.0 $25.0 Q3 2014 Q4 2014 Q1 2015 Q2 2015 Net Recruited GDC
15

16 S 2Q 2015 Retail Advice: A Diversified Platform Financial Advisors: 9,505 Revenues : $529.0 Million Client AUA: $238.7 Billion Transactional Commission Revenues by Product (1) Includes Direct Participation Programs 26% 49% 20% 5% Brokerage Direct Advisory Third Party 2,525 1,199 1,292 1,783 458 327 253 791 408 263 206 Cetera Networks Cetera Advisors Cetera Specialists Cetera Institutions ICH Summit JP Turner First Allied Legend VSR Girard 24% 32% 2% 33% 9% Trails Advisory Fees Asset Based Fees Transactional Commissions Transaction and Other 17% 40% 4% 23% 15% 1% Mutual Funds Annuities Other Insurance Alternatives General Securities Other (1)
16

17 Rising Interest Rates Would Improve Annual EBITDA • Currently, less than 4% of AUA is in client cash sweep accounts earning approximately 10 basis points • As interest rates rise, money market allocations have the potential to increase to historic levels of approximately 8% of AUA • Annualized Revenue/EBITDA contribution for the second quarter 2015 from sweep income is approximately $8.0 million • We anticipate realizing between 60% and 80 % of the 100 basis point rate rise as incremental revenue / EBITDA (before any benefit from an increase in cash accounts) • We will begin movement of assets into higher margin FDIC programs in the fourth quarter 2015 Based on Current Assets Under Administration, A 100 Basis Point Increase in Interest Rates Would Result in Approximately $64 Million to $ 128 Million Annual EBITDA $0 $30 $60 $90 $120 $150 10 bps 30 bps 50 bps 70 bps 90 bps 110 bps 4% Cash Sweep / AUA 8% Cash Sweep / AUA Fed Funds Effective Rate Sweep Income ($mm) (current rate) (1) (1) Based on average cash sweep assets as of June 30, 2015. Assumes realizing 70% of the 100 basis point rate rise as incrementa l r evenue / EBITDA. $19.2 $8.0 $16.0 $38.4 $60.8 $30.4 $41.6 $83.2 $52.8 $105.6 $64.0 $128.0
17

18 2 Wholesale Equity Capital Raised 2015 Equity Capital Raised – Diversifying Products Sold ($ millions) $275 $327 $476 $457 (1) Source: Robert A. Stanger & Co $431 $407 $180.8 $232.2 $343.0 $342.7 $323.4 $296.4 $207.7 $57.5 $68.1 $90.4 $87.0 $72.3 $79.0 $80.7 $36.8 $26.7 $42.8 $27.3 $35.0 $31.8 $53.9 $0.0 $100.0 $200.0 $300.0 $400.0 $500.0 $600.0 January February March April May June July RCS Capital Strategic Capital Hatteras & Other Income Funds $342
18

American Realty Capital Appendix 19 2
19

20 RCS Capital: Consolidated Financial Results ($ in thousands) Pro Forma June 30, 2015 June 30, 2014 % Change Total Revenue (a) $678,366 $884,218 -23.3% Cost of Sales Third-party commissions 50,848 170,582 Third-party reallowance 8,209 36,553 Internal commissions 11,807 33,171 Retail commissions 409,101 392,819 Investment fee expense 6,387 8,212 Technology service fee cost 812 - Total Cost of Sales 487,164 641,337 -24.0% Compensation and benefits 65,593 60,186 Non-comp operating expenses 214,679 138,999 Depreciation and Amortization 29,152 28,031 Total G&A Expenses 309,424 227,216 36.2% Pre-tax net income / (loss) (118,222) 15,665 Taxes (b) (47,289) 6,266 Net Income (70,933) $9,399 -854.7% Addbacks for EBITDA Provision for Income taxes (47,289) 6,266 Interest 18,603 18,633 Depreciation & Amortization 29,151 27,359 EBITDA (70,468) $61,657 6.5% Non-cash equity compensation 6,748 19,465 Acquisition and integration related expenses 9,179 23,471 Capitalized advisor compensation 3,333 4,345 Change in contingent consideration (54,023) 262 Change in the fair value of embedded derivative contracts (32,966) (58,453) Goodwill and intangible assets impairment 156,801 - Professional fees 4,918 1,173 Other 3,419 19,851 Adjusted EBITDA (c) 26,941 $71,771 -62.5% Adjusted Net Income Net Income ($70,933) $9,399 Non-cash equity compensation (net of tax) 4,049 11,679 Acquisition and integration related expenses (net of tax) 5,507 14,083 Capitalized advisor compensation (net of tax) 2,000 2,607 Change in contingent consideration (net of tax) (32,414) 157 Change in the fair value of embedded derivative contracts (net of tax) (19,780) (35,072) Professional fees (net of tax) 2,951 704 Other (net of tax) 3,898 13,957 Goodwill and intangible assets impairment (net of tax) 94,081 - Amortization of Intangibles 26,810 25,109 Adjusted Net Income $16,169 $42,623 -62.1% Three Months Ended (a) Includes $33.0 million non-cash revenue for the second quarter 2015 and $58.5 million non-cash revenue for the second quarter 2015 recognized from fair market value accounting of embedded derivatives Note: Pro forma reflects results as if all acquisitions were consummated on January 1, 2014, with the exception of VSR, Girard, and Docupace, which are reflected as of their acquisition dates (c) Please see complete notes to consolidated adjusted EBITDA on page 30 (b) Assumes 40% tax rate, which may differ from the effective tax rate used to compute GAAP net income. We use an assumed tax rate in order to make the year over year results comparable as the pro forma period has no effective tax rate
20

21 Bridging EBITDA to Cash EPS – 2Q 2015 (1) Other primarily includes capitalized advisor compensation, change in contingent consideration, as well as other non - recurring pr ofessional service fees (2) EPS based on weighted average as of 6/30/2015 of 97.3 million fully diluted shares Note: Assumes 40% tax rate which may differ from the periodic effective tax rate ($ in millions except per share data) Net Income Adjusted Net Income 2Q 2015 Adjusted EBITDA $26.9 2Q 2015 Net Income ($70.9) ( - ) Non - cash equity compensation $6.7 Plus: Share - based compensation (net of tax) $4.0 ( - ) Transaction costs $9.2 Plus: Amortization of acquired intangibles $26.8 ( - ) Fair Value Attributable to Derivative ($33.0) Plus: Goodwill and intangible assets impairment $94.1 ( - ) Goodwill and intangible assets impairment $156.8 Plus: Acquisition & integration expense (net of tax) $5.5 ( - ) Other (1) ($42.3) Plus: Fair Value Attributable to Derivative (net of tax) ($19.8) 2Q 2015 EBITDA ($70.5) Plus: Other (net of tax) ($23.5) 2Q 2015 Adjusted Net Income $16.2 Less: D&A $29.1 2Q 2015 Adjusted EPS (2) (Non - GAAP) $0.17 Less: Interest $18.6 2Q 2015 EBT ($118.2) Less: Taxes ($47.3 ) 2Q 2015 Net Income ($70.9) 2Q 2015 Net Income Per Share (1) (Non - GAAP) ($0.73)
21

22 Revenue Commentary ($ millions) Q2’15 Q1’15 Retail $529.0 $503.6 Acquisition of VSR and Girard & h igher asset management fees Wholesale $107.2 $89.1 Higher equity capital raise Inv Banking & Cap Mkts $21.8 $18.8 Global Net Lease listing on NYSE Investment Management $12.3 $13.4 Lower Assets Under Management Other (1) $34.5 $24.2 Non - cash embedded derivative gain Intercompany Eliminations (2) ($26.4) ($23.5) Total $678.4 $625.6 Adjusted EBITDA (4) ($ millions) Q2’15 Q1’15 Retail $26.5 $35.7 Wholesale ($5.4) ($10.3) Inv Banking & Cap Mkts $10.7 $5.8 Investment Management $0.8 $1.4 Other (3) ($5.7) ($4.2) Total $26.9 $28.4 Operating Results (1) $33.0 million first quarter non - cash revenue recognized from embedded derivative fair market value accounting along with corporate and other, and investment research segments (2) Wholesale products sold through RCS Capital retail platform (3) Represents Corporate & Other and Investment Research (4) See slide 29 for Non - GAAP Measure Disclosure
22

23 Retail Advice Segment Financial Results ▪ Retail Advice Revenue for the second quarter was $ 529 . 0 million ▪ Advisor Fee and Services Revenue, which includes both client advisory fees and administrative fees, was $ 166 . 3 million for the second quarter ▪ Commission - Based Revenue, which includes transactional commissions and “trails,” was $ 303 . 4 million for the second quarter ▪ Asset - Based Revenue, which includes strategic partner, cash sweep, and mutual fund networking fees, was $ 10 . 5 million for the second quarter ▪ Transaction - Based Revenue, which includes ticket and other trading charges, advisor fees, other account fees (e . g . , IRA fees) and other revenue, was $ 48 . 8 million for the second quarter ($ in thousands) Pro Forma June 30, 2015 June 30, 2014 % Change Total Revenue $528,981 $494,514 7.0% Total Cost of Sales 409,101 392,819 4.1% Compensation and benefits 44,675 41,480 Non-comp operating expenses 90,284 83,365 Depreciation and Amortization 23,608 24,625 Total G&A Expenses 158,567 149,470 6.1% Pre-tax net income / (loss) (38,687) (47,775) Taxes (a) (15,475) (19,110) Net Income (23,212) ($28,665) -19.0% Addbacks for EBITDA Provision for Income taxes (15,475) (19,110) Interest 197 - Depreciation & Amortization 23,608 23,953 EBITDA (14,882) ($23,822) -37.5% Non-cash equity compensation 1,006 14,974 Acquisition and integration related expenses 7,090 18,363 Capitalized advisor compensation 3,333 4,345 Change in contingent consideration (17) 262 Change in the fair value of embedded derivative contracts - - Goodwill and intangible assets impairment 26,230 - Professional fees 2,709 1,173 Other 1,031 16,952 Adjusted EBITDA (b) 26,500 $32,247 -17.8% Adjusted Net Income Net Income (23,212) ($28,665) Non-cash equity compensation (net of tax) 603 8,984 Acquisition and integration related expenses (net of tax) 4,254 11,018 Capitalized advisor compensation (net of tax) 2,000 2,607 Change in contingent consideration (net of tax) (10) 157 Change in the fair value of embedded derivative contracts (net of tax) - - Professional fees (net of tax) 1,626 704 Other (net of tax) 618 10,171 Goodwill and intangible assets impairment (net of tax) 15,738 - Amortization of Intangibles 21,492 21,798 Adjusted Net Income 23,109 $26,774 -13.7% Three Months Ended (a) Assumes 40% tax rate, which may differ from the effective tax rate used to compute GAAP net income. We use an assumed tax rate in order to make the year over year results comparable as the pro forma period has no effective tax rate (b) Please see complete notes to consolidated adjusted EBITDA on page 30
23

24 Wholesale Distribution Segment Financial Results ▪ Wholesale Revenue was $ 107 . 2 million for the second quarter ▪ Equity Capital Raise : $ 1 . 3 billion for second quarter 2015 ; $ 342 million for July 2015 ; $ 2 . 7 billion year - to - date ($ in thousands) Pro Forma June 30, 2015 June 30, 2014 % Change Total Revenue $107,249 $324,984 -67.0% Cost of Sales Third-party commissions 70,703 219,803 Third-party reallowance 12,383 36,553 Internal Commissions 11,807 33,171 Retail Commissions - - Investment fee expense - - Technology service fee cost - - Total Cost of Sales 94,893 289,527 -67.2% Compensation and benefits 7,572 7,332 Non-comp operating expenses 146,188 18,430 Depreciation and Amortization 3,543 2,039 Total G&A Expenses 157,304 27,801 465.8% Pre-tax net income / (loss) (144,947) 7,656 Taxes (a) (57,979) 3,062 Net Income (86,968) $4,594 -1993.3% Addbacks for EBITDA Provision for Income taxes (57,979) 3,062 Interest - 6 Depreciation & Amortization 3,543 2,040 EBITDA (141,404) $9,702 -1557.5% Non-cash equity compensation 4,488 3,357 Acquisition and integration related expenses 40 90 Capitalized advisor compensation - - Change in contingent consideration - - Change in the fair value of embedded derivative contracts - - Goodwill and intangible assets impairment 130,571 - Professional fees 21 - Other 909 316 Adjusted EBITDA (b) (5,375) $13,465 -139.9% Adjusted Net Income Net Income ($86,968) $4,594 Non-cash equity compensation (net of tax) 2,693 2,014 Acquisition and integration related expenses (net of tax) 24 54 Capitalized advisor compensation (net of tax) - - Change in contingent consideration (net of tax) - - Change in the fair value of embedded derivative contracts (net of tax) - - Professional fees (net of tax) 12 - Other (net of tax) 545 189 Goodwill and intangible assets impairment (net of tax) 78,343 - Amortization of Intangibles 3,478 2,000 Adjusted Net Income ($1,873) $8,851 -121.2% Three Months Ended (a) Assumes 40% tax rate, which may differ from the effective tax rate used to compute GAAP net income. We use an assumed tax rate in order to make the year over year results comparable as the pro forma period has no effective tax rate (b) Please see complete notes to consolidated adjusted EBITDA on page 30
24

25 Investment Banking, Capital Markets, and Transaction Management Services Segment Financial Results ▪ Investment Banking and Capital Markets Revenue was $ 21 . 8 million for the second quarter ▪ Investment Banking Revenue was $ 7 . 0 million for the second quarter ▪ Transaction Management Revenue was $ 7 . 5 million for the second quarter ▪ Transfer Agent Revenue was $ 5 . 7 million for the second quarter ($ in thousands) Pro Forma June 30, 2015 June 30, 2014 % Change Total Revenue $21,815 $39,101 -44.2% Total Cost of Sales 812 - N/A Compensation and benefits 5,552 4,587 Non-comp operating expenses 5,666 9,801 Depreciation and Amortization 480 3 Total G&A Expenses 11,698 14,391 -18.7% Pre-tax net income / (loss) 9,305 24,710 Taxes (a) 3,722 9,884 Net Income 5,583 $14,826 -62.3% Addbacks for EBITDA Provision for Income taxes 3,722 9,884 Interest 3 - Depreciation & Amortization 481 3 EBITDA 9,789 $24,713 -60.4% Non-cash equity compensation 275 526 Acquisition and integration related expenses 60 - Capitalized advisor compensation - - Change in contingent consideration - - Change in the fair value of embedded derivative contracts - - Goodwill and intangible assets impairment - - Professional fees 437 - Other 155 23 Adjusted EBITDA (b) 10,716 $25,262 -57.6% Adjusted Net Income Net Income $5,583 $14,826 Non-cash equity compensation (net of tax) 165 315 Acquisition and integration related expenses (net of tax) 36 - Capitalized advisor compensation (net of tax) - - Change in contingent consideration (net of tax) - - Change in the fair value of embedded derivative contracts (net of tax) - - Professional fees (net of tax) 262 - Other (net of tax) 93 15 Goodwill and intangible assets impairment (net of tax) - - Amortization of Intangibles 426 - Adjusted Net Income $6,565 $15,156 -56.7% Three Months Ended (a) Assumes 40% tax rate, which may differ from the effective tax rate used to compute GAAP net income. We use an assumed tax rate in order to make the year over year results comparable as the pro forma period has no effective tax rate (b) Please see complete notes to consolidated adjusted EBITDA on page 30
25
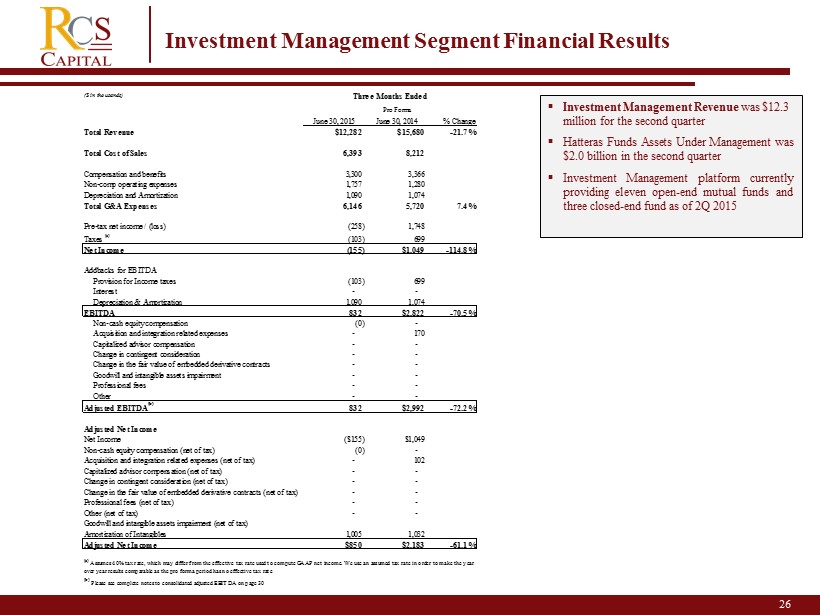
26 Investment Management Segment Financial Results ▪ Investment Management Revenue was $12.3 million for the second quarter ▪ Hatteras Funds Assets Under Management was $ 2 . 0 billion in the second quarter ▪ Investment Management platform currently providing eleven open - end mutual funds and three closed - end fund as of 2 Q 2015 ($ in thousands) Pro Forma June 30, 2015 June 30, 2014 % Change Total Revenue $12,282 $15,680 -21.7% Total Cost of Sales 6,393 8,212 Compensation and benefits 3,300 3,366 Non-comp operating expenses 1,757 1,280 Depreciation and Amortization 1,090 1,074 Total G&A Expenses 6,146 5,720 7.4% Pre-tax net income / (loss) (258) 1,748 Taxes (a) (103) 699 Net Income (155) $1,049 -114.8% Addbacks for EBITDA Provision for Income taxes (103) 699 Interest - - Depreciation & Amortization 1,090 1,074 EBITDA 832 $2,822 -70.5% Non-cash equity compensation (0) - Acquisition and integration related expenses - 170 Capitalized advisor compensation - - Change in contingent consideration - - Change in the fair value of embedded derivative contracts - - Goodwill and intangible assets impairment - - Professional fees - - Other - - Adjusted EBITDA (b) 832 $2,992 -72.2% Adjusted Net Income Net Income ($155) $1,049 Non-cash equity compensation (net of tax) (0) - Acquisition and integration related expenses (net of tax) - 102 Capitalized advisor compensation (net of tax) - - Change in contingent consideration (net of tax) - - Change in the fair value of embedded derivative contracts (net of tax) - - Professional fees (net of tax) - - Other (net of tax) - - Goodwill and intangible assets impairment (net of tax) Amortization of Intangibles 1,005 1,032 Adjusted Net Income $850 $2,183 -61.1% Three Months Ended (a) Assumes 40% tax rate, which may differ from the effective tax rate used to compute GAAP net income. We use an assumed tax rate in order to make the year over year results comparable as the pro forma period has no effective tax rate (b) Please see complete notes to consolidated adjusted EBITDA on page 30
26

27 Weighted Average Shares Outstanding Reconciliation (Share count in thousands) Cash $195 Debt (Net Par Value) First Lien Debt (L+650) $539 Second Lien Debt (L+1050) $150 Convertible Notes (5.0%) $120 Promissory Note (8.0%) $15 First Lien Revolving Facility (Prime+6.50%) $24 Preferred Stock Convertible Preferred (7.0%) $114 Perpetual Preferred (11.0%) $152 Post Transaction Preferred Stock Convertible Preferred (11.0%) $12 Convertible Preferred (11.0%) $25 Date Issued Shares Issued RCAP Historical 1/1/2014 2,500 RCAP Historical 2/11/2014 24,000 RCAP Historical 3/17/2014 RCAP Historical 3/31/2014 Equity Issuance Shares Issued in Public Offering 6/6/2014 21,469 Greenshoe follow on offering 6/18/2014 870 Acquisition Consideration Various 16,355 Convertible Stock Conversion Various 5,406 RSU & Stock Plan Various 3,136 Primary Shares Outstanding 75,553 Trupoly-contingent consideration Various 104 JP Turner-contingent consideration Various 357 Docupace Various 2,484 VSR-contingent considerations Various 812 Girard-contingent consideration Various 208 Warrants Various 391 RSUs issued under the FA RSU Plan 2nd & 3rd Tranches (participating) Various 185 Luxor Put Option Various 2,632 Convertible Notes Various 5,666 Convertible Preferred Stock Various 8,934 Fully Diluted Shares Outstanding 6/30/2015 97,324 1,816 Fully Diluted Shares Outstanding 6/30/2015 97,324 Post Transaction Primary Shares Issued Various 5,609 Convertible Preferred Stock Various 7,500 Post Transaction Fully Diluted Shares Outstanding 6/30/2015 110,433
27

28 2 Non - GAAP Measure Disclosure We use EBITDA, adjusted EBITDA and adjusted net income, which are non - GAAP measures, as supplemental measures of our performance that are not required by, or presented in accordance with GAAP . None of the non - GAAP measures should be considered as an alternative to any other performance measure derived in accordance with GAAP . We use EBITDA, adjusted EBITDA and adjusted net income as an integral part of our report and planning processes and as one of the primary measures to, among other things : • monitor and evaluate the performance of our business operations; • facilitate management’s internal comparisons of the historical operating performance of our business operations; • facilitate management’s external comparisons of the results of our overall business to the historical operating performance of other com pan ies that may have different capital structures and debt levels; • analyze and evaluate financial and strategic planning decisions regarding future operating investments; • provide useful information to investors regarding financial and business trends related to our results of operations; and • plan for and prepare future annual operating budgets and determine appropriate levels of operating investments. We define EBITDA as earnings before taxes, depreciation and amortization and interest . We define adjusted EBITDA as earnings before taxes, depreciation and amortization, interest, adjusted to exclude equity - based compensation, acquisition - and integration - related expenses (including allocated employee compensation and related costs in connection with integration activities), amortization of capitalized advisor costs, change in contingent and deferred consideration and other items as indicated below . We define adjusted net income as net income attributable to the Company (using the effective tax rate) and adjusted to exclude equity - based compensation, acquisition related expenses, amortization of capitalized advisor compensation, change in contingent and deferred consideration, amortization of intangible assets and other items . We believe similarly titled, but not necessarily similarly comprised, measures are frequently used by securities analysts, investors and other interested parties in the evaluation of companies in our industry, many of which present EBITDA, adjusted EBITDA and adjusted net income and other similar metrics when reporting their financial results . Our presentation of EBITDA, adjusted EBITDA and adjusted net income should not be construed to imply that our future results will be unaffected by unusual or nonrecurring items .
28
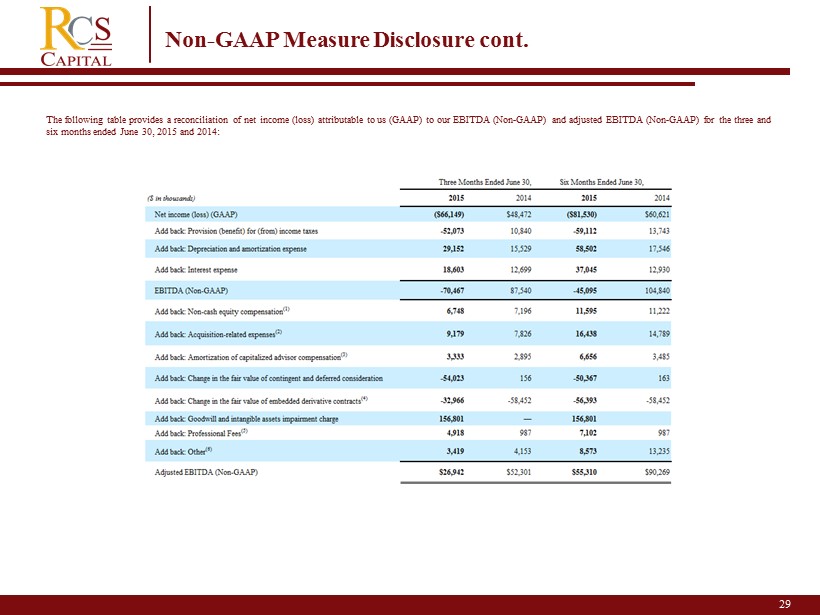
29 2 Non - GAAP Measure Disclosure cont. The following table provides a reconciliation of net income (loss) attributable to us (GAAP) to our EBITDA (Non - GAAP) and adjust ed EBITDA (Non - GAAP) for the three and six months ended June 30, 2015 and 2014 :
29

30 2 Non - GAAP Measure Disclosure cont. (1) Includes compensation expense related to restricted stock and other equity grants, which are amortized over the vesting period . (2) Includes accounting, legal, consulting and other professional fee incurred in connection with completed or terminated acquisitions and integration - related expenses, which include allocated compensation and related costs of officers and employees of the Company based on estimated time engaged in integration - related activities . Third party acquisition and integration - related expenses comprise $ 9 , 085 thousand and $ 14 , 691 thousand of the adjustment and allocated employee compensation and related costs comprise $ 94 thousand and $ 1 , 747 thousand of the adjustment in the three and six months ended June 30 , 2015 , respectively . For the third and fourth quarters of quarters of 2014 , third party acquisition and integration - related expenses comprise $ 3 , 699 thousand and $ 11 , 418 thousand of the adjustment and allocated employee compensation and related costs comprise $ 3 , 400 thousand and $ 1 , 826 thousand of the adjustment . Allocated employee compensation and related costs include employees that were employed prior to such acquisitions and we expect may continue their employment following the integration . These officers and employees may continue in the employ of the Company after completion of the acquisition and integration - related activities, and their compensation and related costs generally were not affected by their acquisition and integration related activities . The Company believes that it was required to incur additional expenses by having third party professionals and service providers perform tasks on behalf of the Company that could not be performed by such officers and employees due to the fact they were actively involved in these acquisition and integration related activities . (3) Consists of amortization of the principal amount of forgivable promissory notes from financial advisors . (4) See the discussion under the caption “Liquidity and Capital Resources – Off - Balance Sheet Arrangements 3” in our Annual Report o n Form 10 - K/A filed with the Securities and Exchange Commission on April 2, 2015. (5) Consists of fees for professional services that the Company believes are outside the normal course of business and not indicative of the Company’s ongoing operations, including legal costs for certain regulatory or internal examinations and investigations and certain litigations . The professional fees for the six months of June 30 , 2015 also include matters relating to the Company’s retail business that arose in connection with activities of prior owners in which the Company no longer engages, which the Company believes are not part of its normal business operations, consisting of (i) $ 282 thousand for legal fees and losses relating to claims associated with sale by prior owners of interests in certain venture capital funds (an activity in which the Company is no longer engaged) and $ 1 , 619 thousand for losses from impermissible trading activities of one trader . For the third and fourth quarters of quarters of 2014 , the Company included $ 3 , 045 thousand and $ 62 , 496 thousand, respectively, of professional fees that it believed were outside the normal course of business as part of Other . (6) Includes for the three months ended June 30 , 2015 , $ 350 thousand of fees payable to our internal and independent auditors relating to the Company’s financial statements for 2014 , which exceeded original estimate and which the Company believes results from first year implementation of internal controls relating to Sarbanes - Oxley Act of 2002 , first year implementation of internal audit functions, and transfer of auditing services from the Company’s predecessor auditor to the Company’s current auditors . For the six months ended June 30 , 2015 , Other also includes $ 2 , 546 thousand of excess professional fees . Also , includes $ 1 , 624 thousand of start - up costs for the three months ended June 30 , 2015 and an additional $ 1 , 472 thousand for the six months ended June 30 , 2015 relating to the first quarter of 2015 relating to costs related to the development of new businesses ventures . These expenses consist of employee, travel and entertainment costs . For the third and fourth quarters of quarters of 2014 , the Company included $ 1 , 951 thousand and $ 3 , 912 thousand, respectively, of start - up costs as part of Other .
30

31 2 Non - GAAP Measure Disclosure cont. Also includes for the six months ended June 30 , 2015 $ 131 thousand of costs incurred during the first quarter of 2015 for Sarbanes Oxley compliance relating to the establishment of systems required to meet certain Sarbanes Oxley requirements due to establishing systems for Sarbanes Oxley compliance with respect to acquired companies . The Company’s external Sarbanes Oxley accountants establish the fee attributable to Sarbanes Oxley compliance allocable to the Company and certain of its subsidiaries and the Company has estimated the percentage of such fees that relates to establishing the systems needed to satisfy Sarbanes Oxley requirements . Includes for the three and six months ended June 30, 2014, the OPP bonus. In evaluating Adjusted EBITDA, you should be aware that in the future we may incur expenses that are the same as or similar to some of the adjustments in this presentation . Our presentation of Adjusted EBITDA should not be construed as an inference that our future results will be unaffected by unusual or non - recurring items or other items discussed herein, some of which may be the same or different from those described above . The non - GAAP measures have limitations as analytical tools, and you should not consider any of these measures in isolation or as a substitute for analyses of our income or cash flows as reported under GAAP . Some of these limitations are : • they do not reflect our cash expenditures, or future requirements for capital expenditures, or contractual commitments ; • they do not reflect changes in, or cash requirements for, our working capital needs ; • they do not reflect the significant interest expense, or the cash requirements necessary to service interest or principal payments, on our debt ; and • depreciation and amortization and impairment charges are non - cash expense items that are reflected in our statements of cash flows . In addition, other companies in our industry may calculate these measures differently than we do, limiting their usefulness as a comparative measure . We compensate for these limitations by relying primarily on our GAAP results and using the non - GAAP measures only for supplemental purposes . Please see our consolidated financial statements and the related notes thereto . The Bank Facilities and our convertible notes include covenants and other provisions based on a definition of EBITDA, which we refer to as “Covenant EBITDA,” that differs from the definition of EBITDA described above . Furthermore, our Series B Preferred Stock and our Series C Preferred Stock also include covenants and other provisions based on a definition of EBITDA that differs from both the definition of EBITDA described above and Covenant EBITDA, which is defined in the Series B COD and the Series C COD, as LTM, or last twelve months, Adjusted EBITDA . Covenant EBITDA is used, among other things, in calculating the Leverage Ratio, First Lien Leverage Ratio, Secured Leverage Ratio and Fixed Charge Covenant Ratio, as defined in the Bank Facilities, in calculating similar ratios in the indenture governing the convertible notes . These ratios are used under both agreements as part of covenants relating to, among other things, incurrence of debt and payment of dividends and distributions .
31

32 2 Non - GAAP Measure Disclosure cont. Covenant EBITDA is only generally comparable to EBITDA and adjusted EBITDA . Under the Bank Facilities and the indenture governing the convertible notes, Covenant EBITDA is similar to EBITDA, subject to certain additional adjustments, including further adjustments to add back (i) equity - based compensation and other non - cash charges and extraordinary, nonrecurring or unusual losses or expenses ; (ii) fees and expenses incurred in connection with equity issuances and debt incurrences, and certain fees and expenses incurred in connection with the financing of the acquisition of Cetera, the acquisitions of Cetera, Hatteras, ICH, Summit and J . P . Turner and Permitted Acquisitions (as defined in the Bank Facilities), which, in the aggregate (other than fees and expenses for the financing of the acquisition of Cetera and the recent acquisitions to the extent scheduled), do not exceed 10 % of Covenant EBITDA for the relevant period ; (iii) certain projected net cost savings and synergies related to the acquisitions of Cetera, Hatteras, ICH, Summit and J . P . Turner and the financing of the acquisition of Cetera based on actions to be taken within 18 months ; and (iv) projected net cost savings and synergies related to other acquisitions and asset sales permitted under the credit agreement based on actions to be taken within 12 months, which, in the aggregate and prior to giving effect to such net cost savings and synergies, do not exceed 10 % of Covenant EBITDA for the four quarters preceding the relevant determination date . The adjustments made to EBITDA to derive adjusted EBITDA are similar to the adjustments made to EBITDA to derive Covenant EBITDA, but there are also differences that could lead the results to not be comparable under certain circumstances, such as the differences in adjustments made to add back acquisition related expenses . In addition, LTM Adjusted EBITDA is used as part of the covenants relating to incurrence of debt in the Series B COD and the Series C COD . LTM Adjusted EBITDA is similar to EBITDA, subject to certain additional adjustments, including further adjustments for employee share - based compensation expense, acquisition and integration related expenses and equity issuance and related offering costs . The adjustments made to EBITDA to derive adjusted EBITDA are similar to the adjustments made to EBITDA to derive LTM Adjusted EBITDA, but there are also differences that could lead the results to not be comparable under certain circumstances, such as the adjustment made to add back integration related expenses . We also use Core Earnings, a non - GAAP measure, to calculate the incentive fee payable to RCS Capital Management under our services agreement . While Core Earnings includes certain adjustments for non - cash items, it is based on after - tax GAAP net income and also includes adjustments for items such as unrealized gains or losses recorded for the period and the payment of incentive fees . Accordingly, Core Earnings is not comparable to EBITDA or adjusted EBITDA .
32

American Realty Capital 33
33