Attached files
| file | filename |
|---|---|
| EX-99.1 - PRESS RELEASE - PennyMac Mortgage Investment Trust | pmt_8k-ex9901.htm |
| 8-K - CURRENT REPORT - PennyMac Mortgage Investment Trust | pmt_8k-080515.htm |
Exhibit 99.2

PennyMac Mortgage Investment Trust August 5, 2015 Second Quarter 2015 Earnings Report

2Q15 Earnings Report 2 This presentation contains forward - looking statements within the meaning of Section 21 E of the Securities Exchange Act of 1934 , as amended, regarding management’s beliefs, estimates, projections and assumptions with respect to, among other things, the Company’s financial results, future operations, business plans and investment strategies, as well as industry and market conditions, all of which are subject to change . Words like “believe,” “expect,” “anticipate,” “promise,” “plan,” and other expressions or words of similar meanings, as well as future or conditional verbs such as “will,” “would,” “should,” “could,” or “may” are generally intended to identify forward - looking statements . Actual results and operations for any future period may vary materially from those projected herein, from past results discussed herein, or illustrative examples provided herein . Factors which could cause actual results to differ materially from historical results or those anticipated include, but are not limited to : changes in our investment objectives or investment or operational strategies ; volatility in our industry, the debt or equity markets, the general economy or the residential finance and real estate markets ; changes in general business, economic, market, employment and political conditions or in consumer confidence ; declines in residential real estate or significant changes in U . S . housing prices or activity in the U . S . housing market ; availability of, and level of competition for, attractive risk - adjusted investment opportunities in residential mortgage loans and mortgage - related assets that satisfy our investment objectives ; concentration of credit risks to which we are exposed ; the degree and nature of our competition ; our dependence on our manager and servicer, potential conflicts of interest with such entities, and the performance of such entities ; availability, terms and deployment of short - term and long - term capital ; unanticipated increases or volatility in financing and other costs ; the performance, financial condition and liquidity of borrowers ; incomplete or inaccurate information or documentation provided by customers or counterparties, or adverse changes in the financial condition of our customers and counterparties ; the quality and enforceability of the collateral documentation evidencing our ownership and rights in the assets in which we invest ; increased rates of delinquency, default and/or decreased recovery rates on our investments ; increased prepayments of the mortgages and other loans underlying our mortgage - backed securities and other investments ; the degree to which our hedging strategies may protect us from interest rate volatility ; our failure to maintain appropriate internal controls over financial reporting ; our ability to comply with various federal, state and local laws and regulations that govern our business ; changes in legislation or regulations or the occurrence of other events that impact the business, operations or prospects of government agencies, mortgage lenders and/or publicly - traded companies ; the creation of the Consumer Financial Protection Bureau, or CFPB, and enforcement of its rules ; changes in government support of homeownership ; changes in government or government - sponsored home affordability programs ; changes in governmental regulations, accounting treatment, tax rates and similar matters (including changes to laws governing the taxation of real estate investment trusts, or REITs ; limitations imposed on our business and our ability to satisfy complex rules for us to qualify as a REIT for U . S . federal income tax purposes and qualify for an exclusion from the Investment Company Act of 1940 and the ability of certain of our subsidiaries to qualify as REITs or as taxable REIT subsidiaries for U . S . federal income tax purposes and our ability and the ability of our subsidiaries to operate effectively within the limitations imposed by these rules ; and the effect of public opinion on our reputation . You should not place undue reliance on any forward - looking statement and should consider all of the uncertainties and risks described above, as well as those more fully discussed in reports and other documents filed by the Company with the Securities and Exchange Commission from time to time . The Company undertakes no obligation to publicly update or revise any forward - looking statements or any other information contained herein, and the statements made in this presentation are current as of the date of this presentation only . Forward - Looking Statements

3 Second Quarter Highlights • Net income of $28.1 million on net investment income of $69.8 million – Diluted earnings per share of $0.36; return on equity of 7% – Dividend of $ 0.61 per share declared on June 25, 2015 – Book value per share declined to $20.39 at June 30, 2015 • Segment pretax results: Investment Activities: $ 19.9 million; Correspondent Production: $5.2 million; tax benefit of $3.0 million • Significant new investments in mortgage servicing rights (MSRs) and excess servicing spread (ESS) – Added $ 32 million in new MSR investments resulting from PMT’s correspondent production activities – Invested $ 141 million in ESS on bulk and flow acquisitions of Agency MSRs by PennyMac Financial Services, Inc. (NYSE: PFSI) related to $15.8 billion in unpaid principal balance (UPB) – MSR and ESS investments, related to $ 82.7 billion in UPB, grew to $754 million at June 30 • Notable investment activity after quarter end: – Completed previously announced acquisition of $75 million in ESS from bulk Ginnie Mae MSRs totaling $8.5 billion in UPB – Completed deliveries into inaugural credit risk transfer transaction with Fannie Mae on $1.1 billion of PMT’s correspondent production 2Q15 Earnings Report

4 Second Quarter Highlights (cont'd) • Expanded use of recently completed financing structures, including approximately $240 million in MSR and ESS financing and $138 million in advances from the Federal Home Loan Bank of Des Moines outstanding at quarter end • Continued strong cash flows from PMT’s existing investments, including $128.7 million in cash proceeds generated from the liquidation of mortgage loans and REO – Net cash flow from existing investments, after all operating expenses and repayment of corresponding debt, was $60.4 million (1) • Second quarter results from distressed loan investments was in the range of our targeted returns • Interest rate sensitive strategies underperformed, with negative impact totaling approximately $10 million from actual prepayments in excess of modeled expectations related to our MSR and ESS investments and a widening in mortgage - backed securities spreads to interest rate swaps • We believe that PMT demonstrated good progress during the quarter towards achieving our long - term targeted returns 2Q15 Earnings Report (1) Please see page 31 in the appendix for a reconciliation of this non - GAAP financial measure to the most directly comparable GAAP financial measure

5 Second Quarter Income and Return Contributions by Strategy 2Q15 Earnings Report • Distressed performance in line with expectations – see page 20 for details • Valuation gains on MSR and ESS due to higher interest rates, offset by losses in MBS portfolios – Valuation gains moderated by actual prepayments higher than expected; losses on MBS include a widening in spreads to interest rate swaps • Agency MBS and Non - Agency senior MBS retained for their inversely correlated interest rate sensitivity to ESS and MSRs (1) Includes income offset by any associated hedges (2) Income contribution is net of any direct expenses associated with investments (e.g., loan fulfillment fees, loan servicing fe es) (3) MSR, ESS and distressed loan strategies include an allocation of exchangeable senior notes and associated expenses (4) Management’s internal allocation of equity. Amounts represent weighted averages during the period ($ in millions) Income Contribution (2)(3) Equity Allocated (4) Annualized Return on Equity (ROE) Distressed loan investments 30.0$ 918$ 13.1% Interest rate sensitive strategies (1) : Correspondent production 7.2$ MSRs 4.2$ ESS (incl. recapture) 12.2$ Agency MBS (4.4)$ Non-Agency MBS (incl. jumbo) (8.3)$ Net interest rate sensitive strategies 10.9$ 496$ 8.8% Cash & short term investments 0.2$ 127$ 0.6% Management fees & corporate expenses 16.0$ Income tax benefit (3.0)$ Net income 28.1$ 1,541$ 7.3%
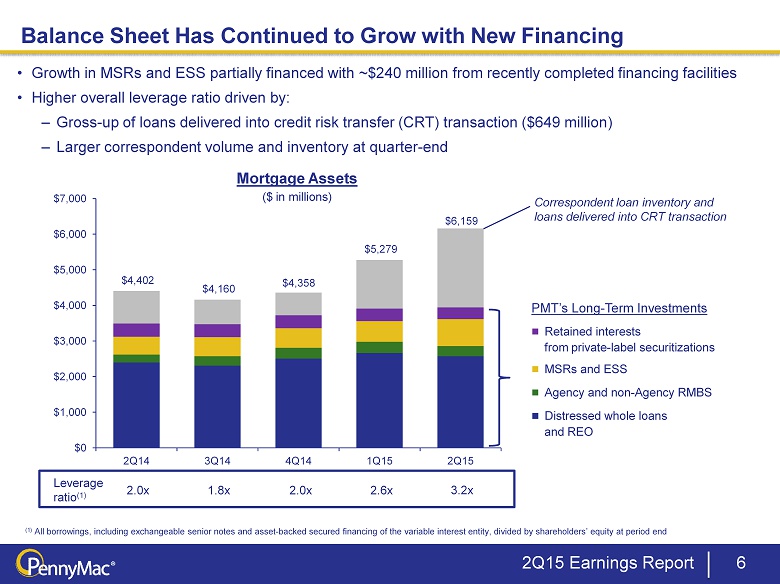
Correspondent loan inventory and loans delivered into CRT transaction PMT’s L ong - Term Investments Ŷ Retained interests from private - label securitizations Ŷ MSRs and ESS Ŷ Agency and non - Agency RMBS Ŷ Distressed whole loans and REO 6 Balance Sheet Has Continued to Grow with New Financing Leverage ratio (1) 2.0x 1.8x 2 .0x 2.6x 3.2x (1) All borrowings, including exchangeable senior notes and asset - backed secured financing of the variable interest entity, divided by shareholders’ equity at period end Mortgage Assets ($ in millions) 2Q15 Earnings Report • Growth in MSRs and ESS partially financed with ~$240 million from recently completed financing facilities • Higher overall leverage ratio driven by: – Gross - up of loans delivered into credit risk transfer (CRT) transaction ($649 million) – Larger correspondent volume and inventory at quarter - end $4,402 $4,160 $4,358 $5,279 $6,159 $0 $1,000 $2,000 $3,000 $4,000 $5,000 $6,000 $7,000 2Q14 3Q14 4Q14 1Q15 2Q15
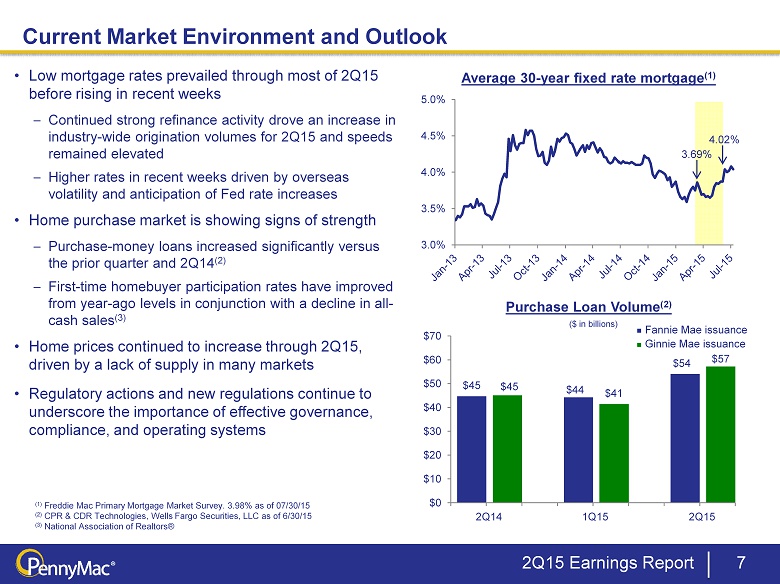
3.0% 3.5% 4.0% 4.5% 5.0% 7 Current Market Environment and Outlook 2Q15 Earnings Report Average 30 - year fixed rate mortgage (1) • Low mortgage rates prevailed through most of 2Q15 before rising in recent weeks – Continued strong refinance activity drove an increase in industry - wide origination volumes for 2Q15 and speeds remained elevated – Higher rates in recent weeks driven by overseas volatility and anticipation of Fed rate increases • Home purchase market is showing signs of strength – Purchase - money loans increased significantly versus the prior quarter and 2Q14 (2) – First - time homebuyer participation rates have improved from year - ago levels in conjunction with a decline in all - cash sales (3) • Home prices continued to increase through 2Q15, driven by a lack of supply in many markets • Regulatory actions and new regulations continue to underscore the importance of effective governance, compliance, and operating systems (1) Freddie Mac Primary Mortgage Market Survey. 3.98% as of 07/30/15 (2) CPR & CDR Technologies, Wells Fargo Securities, LLC as of 6/30/15 ( 3 ) National Association of Realtors® Purchase Loan Volume (2) 3.69% 4.02% $45 $45 $44 $41 $54 $57 $0 $10 $20 $30 $40 $50 $60 $70 2Q14 2Q15 1Q15 ($ in billions) Ŷ Fannie Mae issuance Ŷ Ginnie Mae issuance
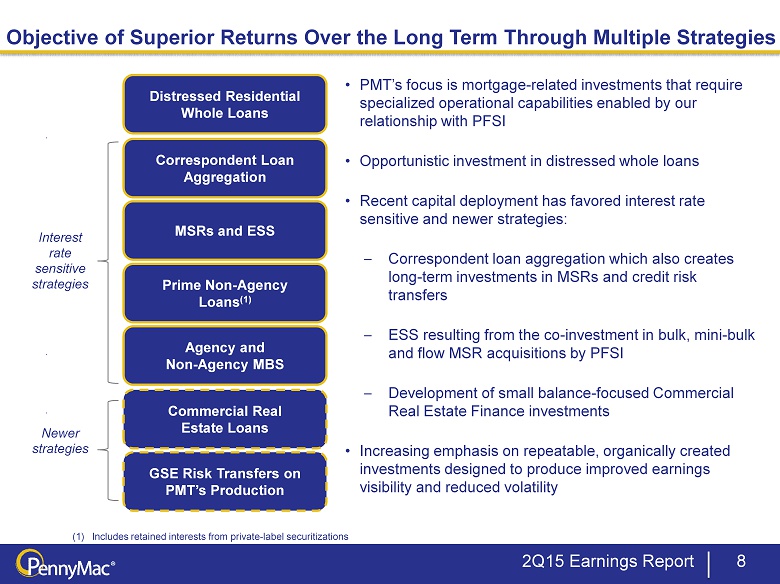
Objective of Superior Returns Over the Long Term Through Multiple Strategies 2Q15 Earnings Report 8 Correspondent Loan Aggregation MSRs and ESS Prime Non - Agency Loans (1) Commercial Real Estate Loans Distressed Residential Whole Loans • PMT’s focus is mortgage - related investments that require specialized operational capabilities enabled by our relationship with PFSI • Opportunistic investment in distressed whole loans • Recent capital deployment has favored interest rate sensitive and newer strategies: – Correspondent loan aggregation which also creates long - term investments in MSRs and credit risk transfers – ESS resulting from the co - investment in bulk, mini - bulk and flow MSR acquisitions by PFSI – Development of small balance - focused Commercial Real Estate Finance investments • Increasing emphasis on repeatable, organically created investments designed to produce improved earnings visibility and reduced volatility GSE Risk Transfers on PMT’s Production Agency and Non - Agency MBS Interest rate s ensitive strategies Newer strategies (1) Includes retained interests from private - label securitizations

Targeted Returns of PMT’s Strategies 9 MSRs and ESS Prime Non - Agency Loans (2) Agency and Non - Agency MBS Distressed Residential Whole Loans Correspondent Loan Aggregation GSE Risk Transfers on PMT’s Production Commercial Real Estate Loans 2Q15 Earnings Report Targeted Unlevered Yield Targeted Gross Pretax Return on Equity (1) 6% - 8% 10 bps - 15 bps of production 4% - 6% 2% - 6% 7.5% - 12% (incl. expected recapture contribution) 6% - 7.5% 4.5% - 7% Note: This slide presents examples for illustrative purposes only, using PMT’s base case assumptions (e.g., for credit perfor man ce, prepayment speeds, financing economics). Actual results may differ materially. Please refer to the disclaimers on slide 2. (1) Gross return contribution net of estimated direct expenses associated with each strategy (e.g., loan servicing fees, loan ful fi llment fees). Gross return contribution does not include an allocation of management fees, corporate operating and other administrative expenses. PMT may employ hedge strategies that reduce gross retur n of certain strategies. Certain strategies are subject to tax expense associated with the taxable REIT subsidiary. (2) Includes retained interests from private - label securitizations 12% - 16% 26% - 36% 8% - 13% 6% - 12% 9% - 16% 11% - 14% 11% - 18% Newer strategies Interest rate sensitive strategies – i ncludes investments with offsetting exposures

GSE Risk Transfer Investments Ongoing MSR Investment Correspondent Production PMT Creates Attractive Investments Through Its Unique Correspondent Business 10 2Q15 Earnings Report • Opportunity to invest in credit risk on loans delivered by PMT to Fannie Mae – designed to capture benefits of PMT’s high - quality correspondent production • Investment is a certificated security that can be financed PMT’s Correspondent Business • Attractive returns from the acquisition, aggregation and sale or securitization of newly originated loans • High - quality Agency - eligible loans with financing advance rates over 90 % • Short holding period and debt financing results in limited equity requirement • MSRs result from the securitization of the aggregated loans through Fannie Mae or Freddie Mac • Attractive yield on investment results from interest rate / prepayment risk in addition to some operational and credit risk • Return on equity enhanced through leverage provided by PMT’s MSR financing facility
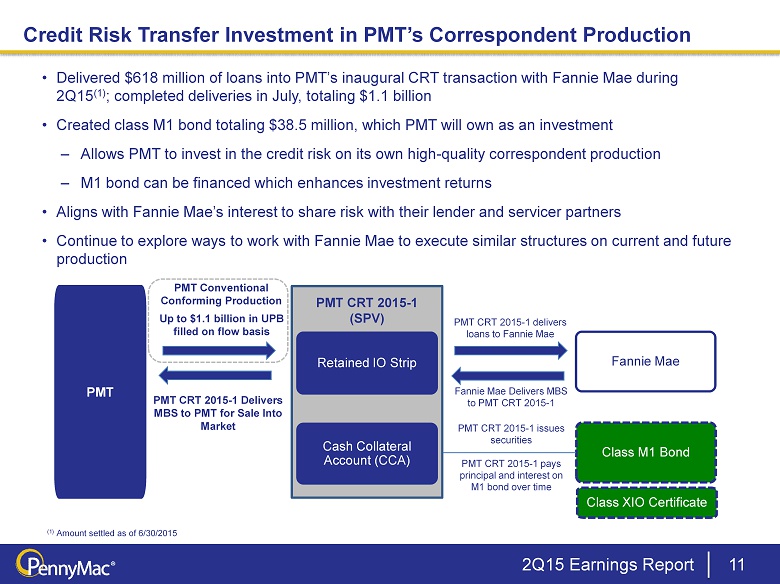
Credit Risk Transfer Investment in PMT’s Correspondent Production 11 2Q15 Earnings Report • Delivered $618 million of loans into PMT’s inaugural CRT transaction with Fannie Mae during 2Q15 (1) ; completed deliveries in July, totaling $1.1 billion • Created class M1 bond totaling $38.5 million, which PMT will own as an investment – Allows PMT to invest in the credit risk on its own high - quality correspondent production – M1 bond can be financed which enhances investment returns • Aligns with Fannie Mae’s interest to share risk with their lender and servicer partners • Continue to explore ways to work with Fannie Mae to execute similar structures on current and future production (1) Amount settled as of 6/30/2015 PMT CRT 2015 - 1 (SPV) PMT Conventional Conforming Production Retained IO Strip Fannie Mae Cash Collateral Account (CCA) Class M1 Bond PMT CRT 2015 - 1 delivers loans to Fannie Mae PMT CRT 2015 - 1 pays principal and interest on M1 bond over time PMT CRT 2015 - 1 issues securities Up to $1.1 billion in UPB filled on flow basis PMT CRT 2015 - 1 Delivers MBS to PMT for Sale Into Market PMT Fannie Mae Delivers MBS to PMT CRT 2015 - 1 Class XIO Certificate

Mortgage Investment Activities
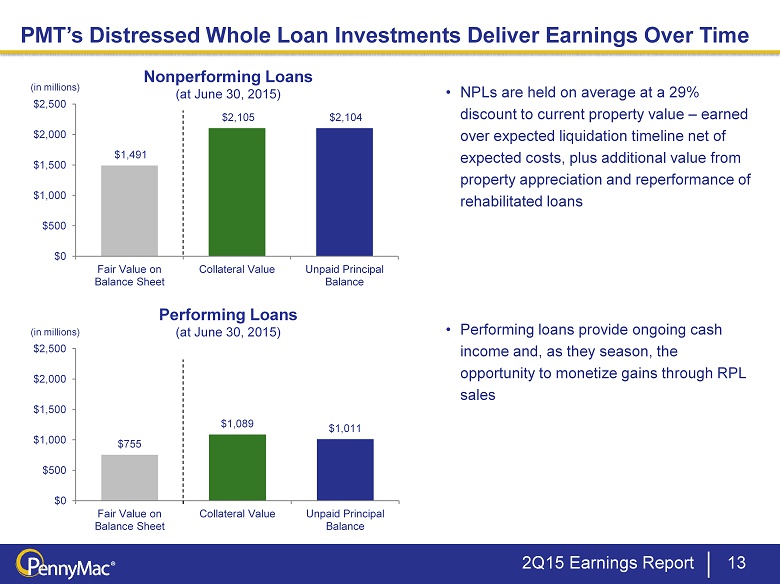
$755 $1,089 $1,011 $0 $500 $1,000 $1,500 $2,000 $2,500 Fair Value on Balance Sheet Collateral Value Unpaid Principal Balance $1,491 $2,105 $2,104 $0 $500 $1,000 $1,500 $2,000 $2,500 Fair Value on Balance Sheet Collateral Value Unpaid Principal Balance 13 Nonperforming Loans (at June 30, 2015) Performing Loans (at June 30, 2015) • NPLs are held on average at a 29% discount to current property value – earned over expected liquidation timeline net of expected costs, plus additional value from property appreciation and reperformance of rehabilitated loans • Performing loans provide ongoing cash income and, as they season, the opportunity to monetize gains through RPL sales PMT’s Distressed Whole Loan Investments Deliver Earnings Over Time (in millions) (in millions) 2Q15 Earnings Report
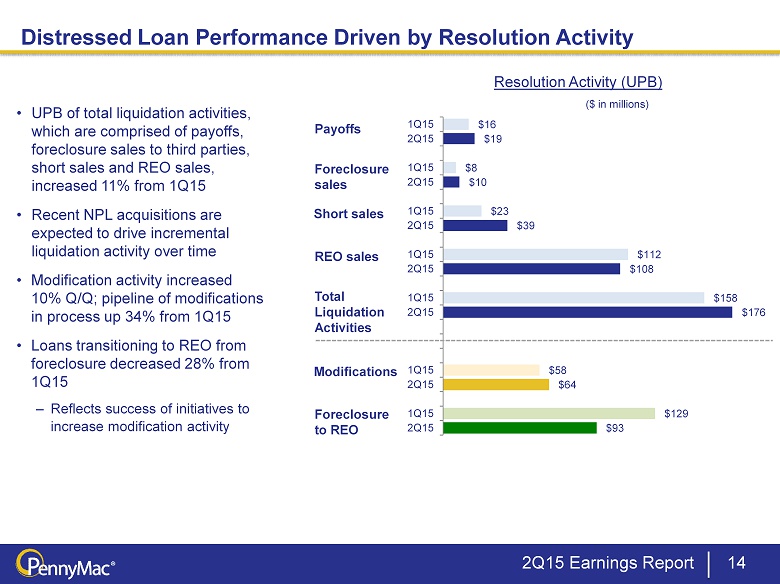
$16 $19 $8 $10 $23 $39 $112 $108 $158 $176 $58 $64 $129 $93 1Q15 2Q15 1Q15 2Q15 1Q15 2Q15 1Q15 2Q15 1Q15 2Q15 1Q15 2Q15 1Q15 2Q15 2Q15 Earnings Report 14 Distressed Loan Performance Driven by Resolution Activity • UPB of total liquidation activities, which are comprised of payoffs, foreclosure sales to third parties, short sales and REO sales, increased 11% from 1Q15 • Recent NPL acquisitions are expected to drive incremental liquidation activity over time • Modification activity increased 10% Q/Q; pipeline of modifications in process up 34% from 1Q15 • Loans transitioning to REO from foreclosure decreased 28% from 1Q15 – Reflects success of initiatives to increase modification activity Payoffs Foreclosure sales Short sales REO sales Modifications Foreclosure t o REO ($ in millions) Resolution Activity (UPB) Total Liquidation Activities
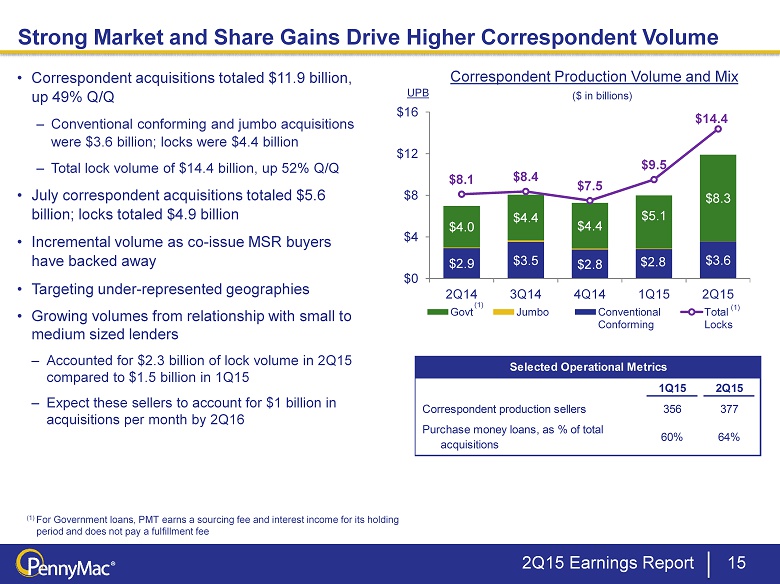
$2.9 $3.5 $2.8 $2.8 $3.6 $4.0 $4.4 $4.4 $5.1 $8.3 $8.1 $8.4 $7.5 $9.5 $14.4 $0 $4 $8 $12 $16 2Q14 3Q14 4Q14 1Q15 2Q15 Govt Jumbo Conventional Conforming Total Locks • Correspondent acquisitions totaled $11.9 billion, up 49% Q/Q – Conventional conforming and jumbo acquisitions were $3.6 billion; locks were $4.4 billion – Total lock volume of $14.4 billion, up 52% Q/Q • July correspondent acquisitions totaled $5.6 billion ; locks totaled $4.9 billion • Incremental volume as co - issue MSR buyers have backed away • Targeting under - represented geographies • Growing volumes from relationship with small to medium sized lenders – Accounted for $2.3 billion of lock volume in 2Q15 compared to $1.5 b illion in 1Q15 – Expect these sellers to account for $ 1 billion in acquisitions per month by 2Q16 Correspondent Production Volume and Mix Strong Market and Share Gains Drive Higher Correspondent Volume (1) For Government loans, PMT earns a sourcing fee and interest income for its holding period and does not pay a fulfillment fee ($ in billions) UPB (1) (1) 2Q15 Earnings Report 15 Correspondent production sellers Selected Operational Metrics 2Q15 377 1Q15 356 Purchase money loans, as % of total acquisitions 60% 64%
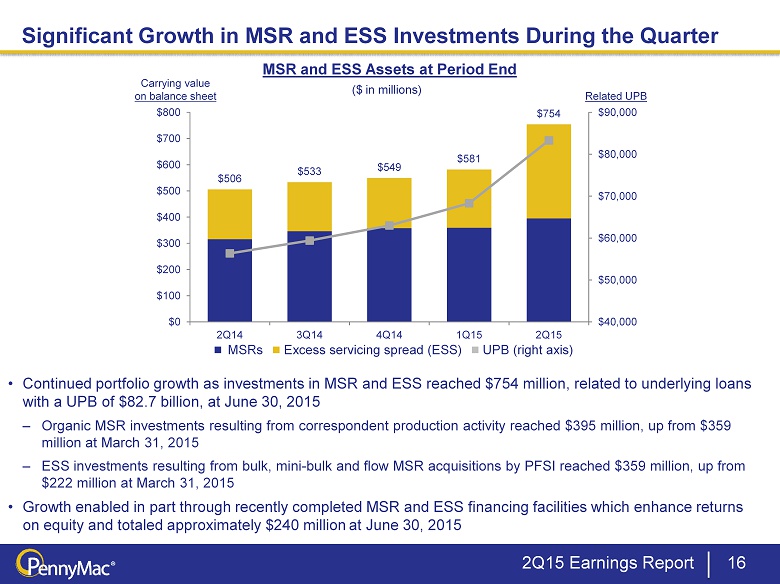
Significant Growth in MSR and ESS Investments During the Quarter 16 ($ in millions) • Continued portfolio growth as investments in MSR and ESS reached $754 million, related to underlying loans with a UPB of $82.7 billion, at June 30, 2015 – Organic MSR investments resulting from correspondent production activity reached $395 million, up from $359 million at March 31, 2015 – ESS investments resulting from bulk, mini - bulk and flow MSR acquisitions by PFSI reached $359 million, up from $222 million at March 31, 2015 • Growth enabled in part through recently completed MSR and ESS financing facilities which enhance returns on equity and totaled approximately $240 million at June 30, 2015 MSR and ESS Assets at Period End Carrying value on balance sheet Related UPB Ŷ MSRs Ŷ Excess servicing spread (ESS) Ŷ UPB (right axis) 2Q15 Earnings Report $506 $533 $549 $581 $754 $40,000 $50,000 $60,000 $70,000 $80,000 $90,000 $0 $100 $200 $300 $400 $500 $600 $700 $800 2Q14 3Q14 4Q14 1Q15 2Q15

Financial Results

18 Pretax Income (Loss) by Operating Segment Note: Figures may not sum exactly due to rounding 2Q15 Earnings Report Investment Correspondent Total Pretax ($ in millions) Activities Production Income 2Q14 70.9$ 2.4$ 73.3$ 3Q14 55.1$ 2.8$ 57.9$ 4Q14 11.0$ 0.9$ 11.9$ 1Q15 (8.2)$ 4.4$ (3.8)$ 2Q15 19.9$ 5.2$ 25.1$

19 Investment Activities Segment Results • Segment revenue increased 149% Q/Q: – Net gain on investments increased significantly Q/Q, driven by: o Improved valuation gains on distressed loans o Gains on ESS due to lower projected prepayments and $1.5 million in recapture income o Valuation losses on MBS portfolios resulted from higher rates – Net interest income decreased 2% Q/Q, driven by a $0.3 million decrease in capitalized interest from loan modifications (2) – Net servicing fee revenue increased 63% Q/Q driven by: o Higher servicing fee revenue o MSR impairment reversals and fair value gains due to lower projected prepayments, offset by hedge losses • Expenses were flat Q/Q : – Loan servicing fees increased 7% due to servicing portfolio growth – Incentive fees declined due to PMT’s reduced performance (1) Servicing fees include both special servicing for PMT’s distressed portfolio and subservicing for PMT’s mortgage servicing rights (2) Capitalized interest from loan modifications increases interest income and generally reduces gains from loan valuations 2Q15 Earnings Report Quarter Ended ($ in thousands) June 30, 2015 March 31, 2015 Revenues: Net gain on investments: Mortgage loans at fair value 30,068$ 17,186$ Mortgage loans held by variable interest entity net of asset-backed secured financing (6,955) (6,642) Mortgage-backed securities (9,089) (850) Excess spread investment 8,590 (6,247) 22,614 3,447 Net interest income Interest income 36,336 33,573 Interest expense 24,976 21,926 11,360 11,647 Net loan servicing fees 13,017 8,001 Other 13 (4,241) Total revenues 47,004 18,854 Expenses: Servicing and Management fees payable to PennyMac Financial Services, Inc. (1) Other 9,675 9,724 Total expenses 27,138 27,093 Pretax income (loss) 19,866$ (8,239)$ 17,463 17,369
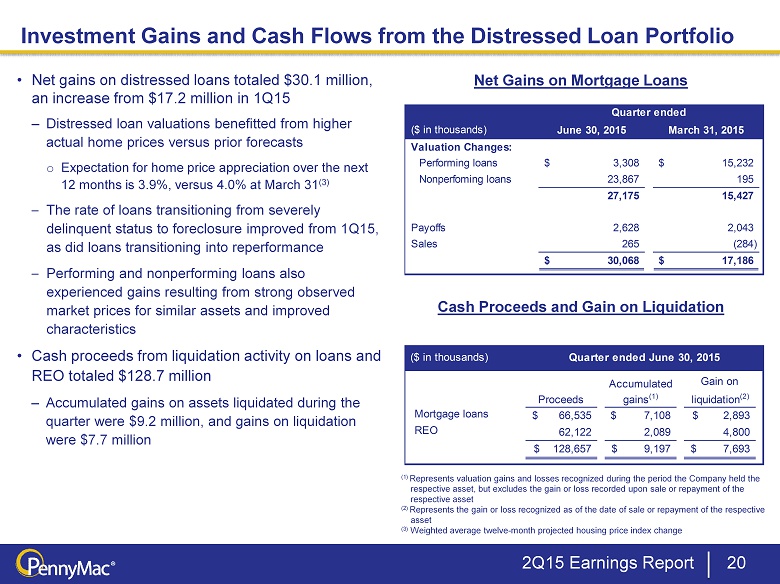
20 Investment Gains and Cash Flows from the Distressed Loan Portfolio • Net gains on distressed loans totaled $30.1 million, an increase from $17.2 million in 1Q15 – Distressed loan valuations benefitted from higher actual home prices versus prior forecasts o Expectation for home price appreciation over the next 12 months is 3.9%, versus 4.0% at March 31 (3) – The rate of loans transitioning from severely delinquent status to foreclosure improved from 1Q15, as did loans transitioning into reperformance – Performing and nonperforming loans also experienced gains resulting from strong observed market prices for similar assets and improved characteristics • Cash proceeds from liquidation activity on loans and REO totaled $ 128.7 million – Accumulated gains on assets liquidated during the quarter were $9.2 million, and gains on liquidation were $7.7 million Net Gains on Mortgage Loans Cash Proceeds and Gain on Liquidation (1) Represents valuation gains and losses recognized during the period the Company held the respective asset, but excludes the gain or loss recorded upon sale or repayment of the respective asset (2) Represents the gain or loss recognized as of the date of sale or repayment of the respective asset (3) Weighted average twelve - month projected housing price index change 2Q15 Earnings Report ($ in thousands) June 30, 2015 March 31, 2015 Valuation Changes: Performing loans 3,308$ 15,232$ Nonperfoming loans 23,867 195 27,175 15,427 Payoffs 2,628 2,043 Sales 265 (284) 30,068$ 17,186$ Quarter ended ($ in thousands) Quarter ended June 30, 2015 Gain on Proceeds liquidation (2) Mortgage loans 66,535$ 7,108$ 2,893$ REO 62,122 2,089 4,800 128,657$ 9,197$ 7,693$ Accumulated gains (1)
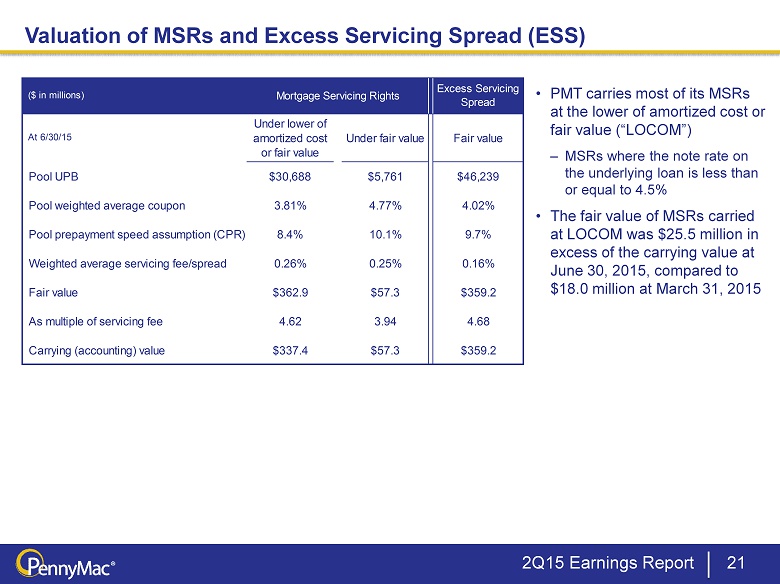
21 Valuation of MSRs and Excess Servicing Spread (ESS) • PMT carries most of its MSRs at the lower of amortized cost or fair value (“LOCOM”) – MSRs where the note rate on the underlying loan is less than or equal to 4.5% • The fair value of MSRs carried at LOCOM was $25.5 million in excess of the carrying value at June 30, 2015, compared to $18.0 million at March 31, 2015 2Q15 Earnings Report At 6/30/15 Under lower of amortized cost or fair value Under fair value Fair value Pool UPB $30,688 $5,761 $46,239 Pool weighted average coupon 3.81% 4.77% 4.02% Pool prepayment speed assumption (CPR) 8.4% 10.1% 9.7% Weighted average servicing fee/spread 0.26% 0.25% 0.16% Fair value $362.9 $57.3 $359.2 As multiple of servicing fee 4.62 3.94 4.68 Carrying (accounting) value $337.4 $57.3 $359.2 ($ in millions) Mortgage Servicing Rights Excess Servicing Spread

($ in thousands) Quarter Ended June 30, 2015 As % of Interest Rate Lock Commitments (1) Quarter Ended March 31, 2015 As % of Interest Rate Lock Commitments (1) Revenues: Net gain on mortgage loans acquired for sale 11,175$ 0.25% 10,160$ 0.29% Net interest income 4,234 0.10% 3,292 0.09% Other income 7,352 0.17% 5,351 0.15% 22,761$ 0.51% 18,803$ 0.54% Expenses: Loan fulfillment, servicing, and management fees payable to PennyMac Financial Services, Inc. Other 1,754 0.04% 1,214 0.03% 17,539$ 0.39% 14,384$ 0.41% Pretax income 5,222$ 0.12% 4,419$ 0.13% 15,785$ 0.36% 13,170$ 0.38% Correspondent Production Segment Results 22 • Segment revenue totaled $22.8 million, a 22% increase from 1Q15 – Net gain on mortgage loans increased 10% Q/Q; conventional conforming and jumbo lock volumes increased 27% Q/Q – Continued strong competition in the conventional conforming loan market and normalization of industry capacity resulted in margin reduction versus 1Q15 • Fulfillment fee expense increased $3.2 million Q/Q driven by higher acquisition volume; average fulfillment fee paid for the quarter was 43bp , down from 45bp in 1Q15 (2) (1) Conventional conforming and jumbo interest rate lock commitments. (2) Fulfillment fees are based on funding volumes. Contractual fulfillment fee is in general 0.50% of the funding of conventional and jumbo loans, subject to reductions at specified volumes and discretionary reductions by PFSI . Note: Figures may not sum exactly due to rounding (2) 2Q15 Earnings Report (2)

Appendix
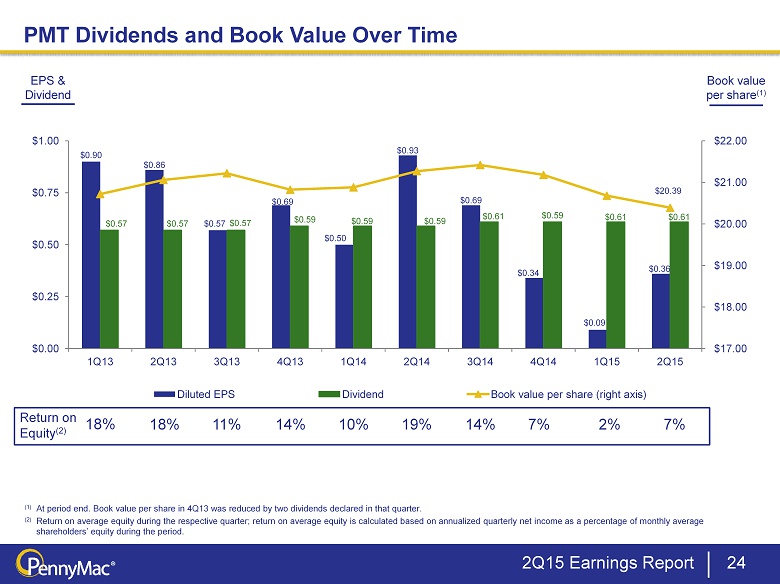
24 PMT Dividends and Book Value Over Time 18% 11% 14% 10% 19% 14% 7% 7% Return on Equity (2) (1) At period end. Book value per share in 4Q13 was reduced by two dividends declared in that quarter. ( 2) Return on average equity during the respective quarter; return on average equity is calculated based on annualized quarterly net income as a percentage of monthly average shareholders’ equity during the period. 2% 18% Book value per share (1) EPS & Dividend 2Q15 Earnings Report $0.90 $0.86 $0.57 $0.69 $0.50 $0.93 $0.69 $0.34 $0.09 $0.36 $0.57 $0.57 $0.57 $0.59 $0.59 $0.59 $0.61 $0.59 $0.61 $0.61 $20.39 $17.00 $18.00 $19.00 $20.00 $21.00 $22.00 $0.00 $0.25 $0.50 $0.75 $1.00 1Q13 2Q13 3Q13 4Q13 1Q14 2Q14 3Q14 4Q14 1Q15 2Q15 Diluted EPS Dividend Book value per share (right axis)
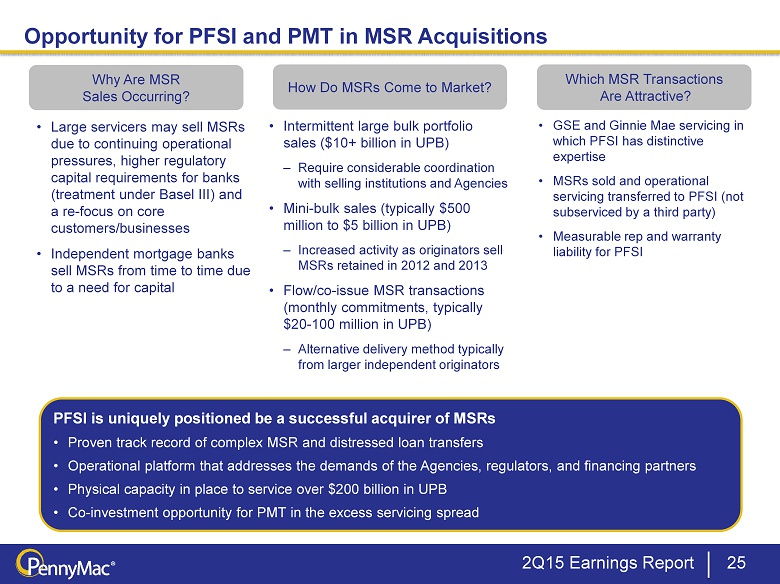
Opportunity for PFSI and PMT in MSR Acquisitions 25 Why Are MSR Sales Occurring? How Do MSRs Come to Market? • Large servicers may sell MSRs due to continuing operational pressures, higher regulatory capital requirements for banks (treatment under Basel III) and a re - focus on core customers/businesses • Independent mortgage banks sell MSRs from time to time due to a need for capital • Intermittent large bulk portfolio sales ($10+ billion in UPB) – Require considerable coordination with selling institutions and Agencies • Mini - bulk sales (typically $500 million to $5 billion in UPB) – Increased activity as originators sell MSRs retained in 2012 and 2013 • Flow/co - issue MSR transactions (monthly commitments, typically $ 20 - 100 million in UPB) – Alternative delivery method typically from larger independent originators Which MSR Transactions Are Attractive? • GSE and Ginnie Mae servicing in which PFSI has distinctive expertise • MSRs sold and operational servicing transferred to PFSI (not subserviced by a third party) • Measurable rep and warranty liability for PFSI PFSI is uniquely positioned be a successful acquirer of MSRs • Proven track record of complex MSR and distressed loan transfers • Operational platform that addresses the demands of the Agencies, regulators, and financing partners • Physical capacity in place to service over $200 billion in UPB • Co - investment opportunity for PMT in the excess servicing spread 2Q15 Earnings Report
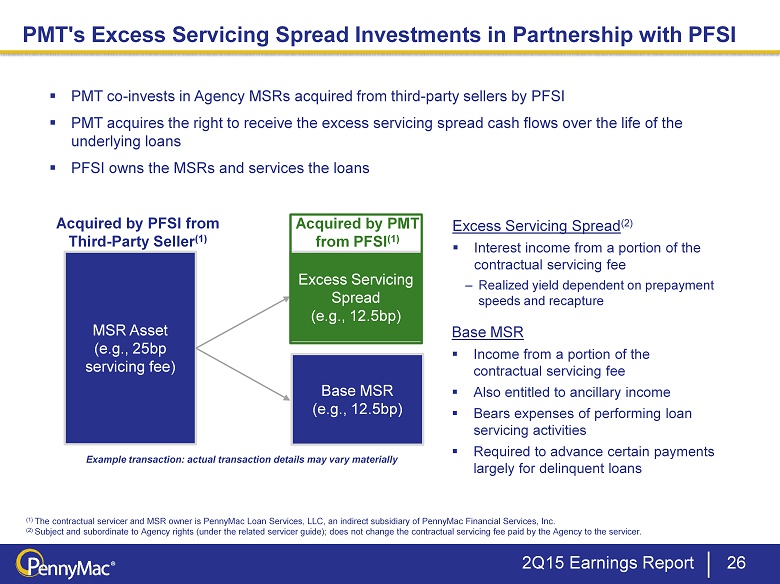
PMT's Excess Servicing Spread Investments in Partnership with PFSI 26 (1) The contractual servicer and MSR owner is PennyMac Loan Services, LLC, an indirect subsidiary of PennyMac Financial Services, Inc. (2) Subject and subordinate to Agency rights (under the related servicer guide); does not change the contractual servicing fee pa id by the Agency to the servicer. Excess Servicing Spread (e.g., 12.5bp) MSR Asset (e.g., 25bp servicing fee) Acquired by PFSI from Third - Party Seller (1) ▪ PMT co - invests in Agency MSRs acquired from third - party sellers by PFSI ▪ PMT acquires the right to receive the excess servicing spread cash flows over the life of the underlying loans ▪ PFSI owns the MSRs and services the loans Excess Servicing Spread (2) ▪ Interest income from a portion of the contractual servicing fee – Realized yield dependent on prepayment speeds and recapture Base MSR ▪ Income from a portion of the contractual servicing fee ▪ Also entitled to ancillary income ▪ Bears expenses of performing loan servicing activities ▪ Required to advance certain payments largely for delinquent loans Base MSR (e.g., 12.5bp) Acquired by PMT from PFSI (1) Example transaction: actual transaction details may vary materially 2Q15 Earnings Report
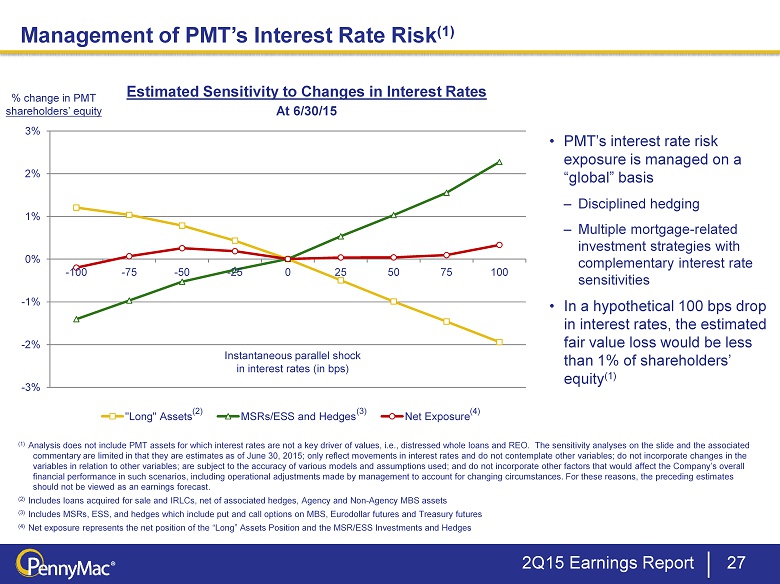
(2) • PMT’s interest rate risk exposure is managed on a “global” basis – Disciplined hedging – Multiple mortgage - related investment strategies with complementary interest rate sensitivities • In a hypothetical 100 bps drop in interest rates, the estimated fair value loss would be less than 1% of shareholders’ equity (1) Management of PMT’s Interest Rate Risk (1) 27 Estimated Sensitivity to Changes in Interest Rates % change in PMT shareholders’ equity At 6/30/15 (1) Analysis does not include PMT assets for which interest rates are not a key driver of values, i.e ., distressed whole loans and REO. The sensitivity analyses on the slide and the associated commentary are limited in that they are estimates as of June 30, 2015; only reflect movements in interest rates and do not contemplate other variables; do not incorporate changes in the variables in relation to other variables; are subject to the accuracy of various models and assumptions used; and do not inco rpo rate other factors that would affect the Company’s overall financial performance in such scenarios, including operational adjustments made by management to account for changing circums tan ces. For these reasons, the preceding estimates should not be viewed as an earnings forecast . ( 2) Includes loans acquired for sale and IRLCs, net of associated hedges, Agency and Non - Agency MBS assets ( 3) Includes MSRs, ESS, and hedges which include put and call options on MBS, Eurodollar futures and Treasury futures (4) Net exposure represents the net position of the “Long” Assets Position and the MSR/ESS Investments and Hedges (3) (4) Instantaneous parallel shock in interest rates (in bps) 2Q15 Earnings Report - 3% - 2% - 1% 0% 1% 2% 3% - 100 - 75 - 50 - 25 0 25 50 75 100 "Long" Assets MSRs/ESS and Hedges Net Exposure
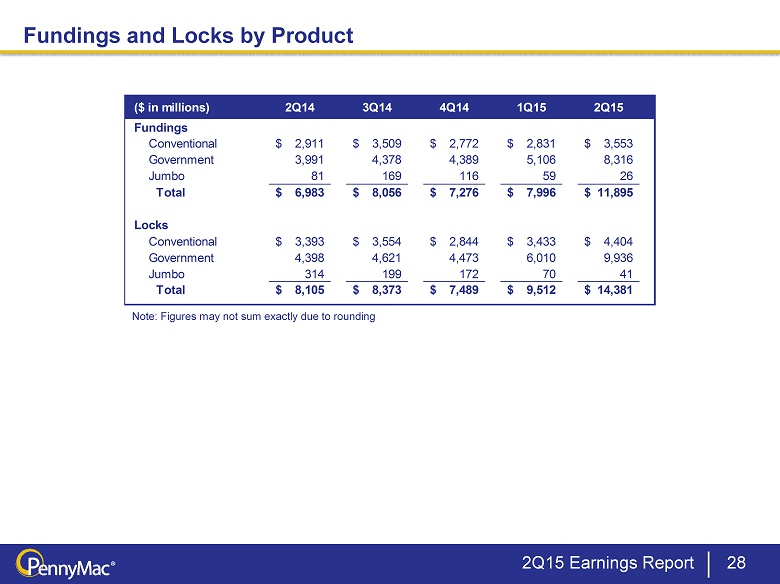
Fundings and Locks by Product 28 Note: Figures may not sum exactly due to rounding 2Q15 Earnings Report ($ in millions) 2Q14 3Q14 4Q14 1Q15 2Q15 Fundings Conventional 2,911$ 3,509$ 2,772$ 2,831$ 3,553$ Government 3,991 4,378 4,389 5,106 8,316 Jumbo 81 169 116 59 26 Total 6,983$ 8,056$ 7,276$ 7,996$ 11,895$ Locks Conventional 3,393$ 3,554$ 2,844$ 3,433$ 4,404$ Government 4,398 4,621 4,473 6,010 9,936 Jumbo 314 199 172 70 41 Total 8,105$ 8,373$ 7,489$ 9,512$ 14,381$
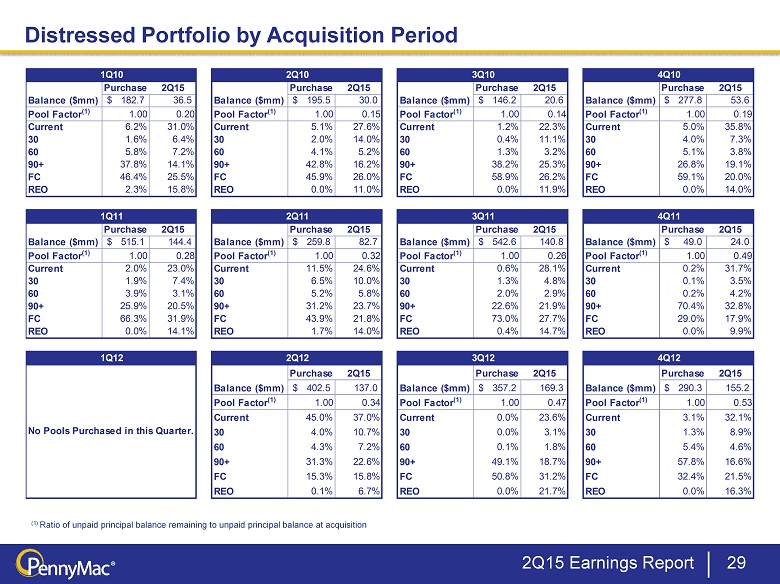
Distressed Portfolio by Acquisition Period 29 (1) Ratio of unpaid principal balance remaining to unpaid principal balance at acquisition 2Q15 Earnings Report Purchase 2Q15 Purchase 2Q15 Purchase 2Q15 Purchase 2Q15 Balance ($mm) 182.7$ 36.5 Balance ($mm) 195.5$ 30.0 Balance ($mm) 146.2$ 20.6 Balance ($mm) 277.8$ 53.6 Pool Factor (1) 1.00 0.20 Pool Factor (1) 1.00 0.15 Pool Factor (1) 1.00 0.14 Pool Factor (1) 1.00 0.19 Current 6.2% 31.0% Current 5.1% 27.6% Current 1.2% 22.3% Current 5.0% 35.8% 30 1.6% 6.4% 30 2.0% 14.0% 30 0.4% 11.1% 30 4.0% 7.3% 60 5.8% 7.2% 60 4.1% 5.2% 60 1.3% 3.2% 60 5.1% 3.8% 90+ 37.8% 14.1% 90+ 42.8% 16.2% 90+ 38.2% 25.3% 90+ 26.8% 19.1% FC 46.4% 25.5% FC 45.9% 26.0% FC 58.9% 26.2% FC 59.1% 20.0% REO 2.3% 15.8% REO 0.0% 11.0% REO 0.0% 11.9% REO 0.0% 14.0% Purchase 2Q15 Purchase 2Q15 Purchase 2Q15 Purchase 2Q15 Balance ($mm) 515.1$ 144.4 Balance ($mm) 259.8$ 82.7 Balance ($mm) 542.6$ 140.8 Balance ($mm) 49.0$ 24.0 Pool Factor (1) 1.00 0.28 Pool Factor (1) 1.00 0.32 Pool Factor (1) 1.00 0.26 Pool Factor (1) 1.00 0.49 Current 2.0% 23.0% Current 11.5% 24.6% Current 0.6% 28.1% Current 0.2% 31.7% 30 1.9% 7.4% 30 6.5% 10.0% 30 1.3% 4.8% 30 0.1% 3.5% 60 3.9% 3.1% 60 5.2% 5.8% 60 2.0% 2.9% 60 0.2% 4.2% 90+ 25.9% 20.5% 90+ 31.2% 23.7% 90+ 22.6% 21.9% 90+ 70.4% 32.8% FC 66.3% 31.9% FC 43.9% 21.8% FC 73.0% 27.7% FC 29.0% 17.9% REO 0.0% 14.1% REO 1.7% 14.0% REO 0.4% 14.7% REO 0.0% 9.9% Purchase 2Q15 Purchase 2Q15 Purchase 2Q15 Balance ($mm) 402.5$ 137.0 Balance ($mm) 357.2$ 169.3 Balance ($mm) 290.3$ 155.2 Pool Factor (1) 1.00 0.34 Pool Factor (1) 1.00 0.47 Pool Factor (1) 1.00 0.53 Current 45.0% 37.0% Current 0.0% 23.6% Current 3.1% 32.1% 30 4.0% 10.7% 30 0.0% 3.1% 30 1.3% 8.9% 60 4.3% 7.2% 60 0.1% 1.8% 60 5.4% 4.6% 90+ 31.3% 22.6% 90+ 49.1% 18.7% 90+ 57.8% 16.6% FC 15.3% 15.8% FC 50.8% 31.2% FC 32.4% 21.5% REO 0.1% 6.7% REO 0.0% 21.7% REO 0.0% 16.3% No Pools Purchased in this Quarter. 1Q12 2Q12 3Q12 4Q12 1Q10 2Q10 3Q10 4Q10 1Q11 2Q11 3Q11 4Q11
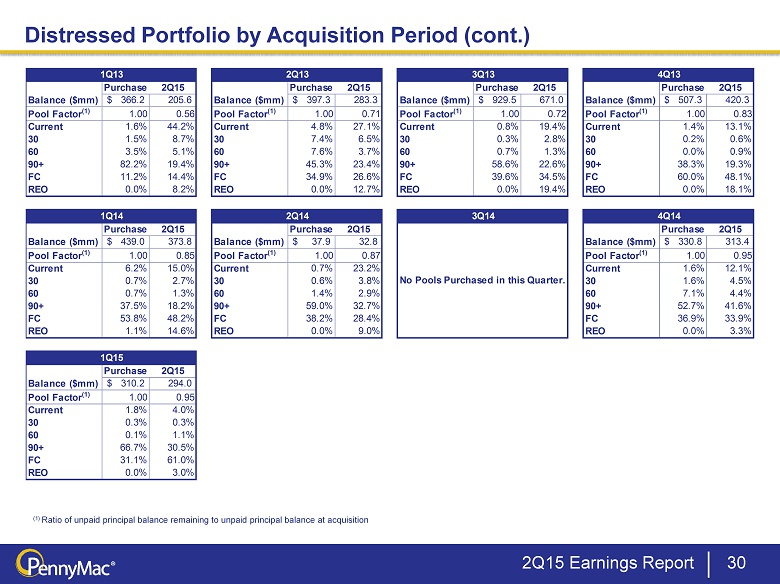
Distressed Portfolio by Acquisition Period (cont.) 30 (1) Ratio of unpaid principal balance remaining to unpaid principal balance at acquisition 2Q15 Earnings Report Purchase 2Q15 Purchase 2Q15 Purchase 2Q15 Purchase 2Q15 Balance ($mm) 366.2$ 205.6 Balance ($mm) 397.3$ 283.3 Balance ($mm) 929.5$ 671.0 Balance ($mm) 507.3$ 420.3 Pool Factor (1) 1.00 0.56 Pool Factor (1) 1.00 0.71 Pool Factor (1) 1.00 0.72 Pool Factor (1) 1.00 0.83 Current 1.6% 44.2% Current 4.8% 27.1% Current 0.8% 19.4% Current 1.4% 13.1% 30 1.5% 8.7% 30 7.4% 6.5% 30 0.3% 2.8% 30 0.2% 0.6% 60 3.5% 5.1% 60 7.6% 3.7% 60 0.7% 1.3% 60 0.0% 0.9% 90+ 82.2% 19.4% 90+ 45.3% 23.4% 90+ 58.6% 22.6% 90+ 38.3% 19.3% FC 11.2% 14.4% FC 34.9% 26.6% FC 39.6% 34.5% FC 60.0% 48.1% REO 0.0% 8.2% REO 0.0% 12.7% REO 0.0% 19.4% REO 0.0% 18.1% Purchase 2Q15 Purchase 2Q15 Purchase 2Q15 Balance ($mm) 439.0$ 373.8 Balance ($mm) 37.9$ 32.8 Balance ($mm) 330.8$ 313.4 Pool Factor (1) 1.00 0.85 Pool Factor (1) 1.00 0.87 Pool Factor (1) 1.00 0.95 Current 6.2% 15.0% Current 0.7% 23.2% Current 1.6% 12.1% 30 0.7% 2.7% 30 0.6% 3.8% 30 1.6% 4.5% 60 0.7% 1.3% 60 1.4% 2.9% 60 7.1% 4.4% 90+ 37.5% 18.2% 90+ 59.0% 32.7% 90+ 52.7% 41.6% FC 53.8% 48.2% FC 38.2% 28.4% FC 36.9% 33.9% REO 1.1% 14.6% REO 0.0% 9.0% REO 0.0% 3.3% Purchase 2Q15 Balance ($mm) 310.2$ 294.0 Pool Factor (1) 1.00 0.95 Current 1.8% 4.0% 30 0.3% 0.3% 60 0.1% 1.1% 90+ 66.7% 30.5% FC 31.1% 61.0% REO 0.0% 3.0% 1Q14 2Q14 3Q14 4Q14 1Q13 2Q13 3Q13 4Q13 No Pools Purchased in this Quarter. 1Q15

(1,653) 241,981 271,587 - 26,737 Purchase of excess servicing spread 140,875 46,412 13,246 9,253 52,867 Purchase of real estate acquired in settlement of loans - - - - - Settlements of derivative financial instruments (2,912) 13,466 2,557 (1,906) 9,526 Margin deposits and restricted cash 20,211 15,792 (4,678) 5,803 (27,311) Net decrease in short-term investments (12,532) (94,951) 102,448 (67,001) 13,115 Sale of mortgage-backed securities at fair value - - (68,284) - - Bulk sale of mortgage loans at fair value (1,074) (939) - (65,688) (70,284) 187,557$ 155,542$ 148,621$ 130,268$ 137,549$ Other adjustments: Debt repayment on investment liquidations/sales (2) (126,254)$ (103,031)$ (95,462)$ (77,323)$ (82,182)$ Servicing fees (3) 25,887$ 22,629$ 23,020$ 20,300$ 19,156$ Net interest income from Investment Activities (4) 11,360$ 11,647$ 17,948$ 15,149$ 25,949$ Less capitalized interest (9,921)$ (10,209)$ (26,045)$ (10,452)$ (19,537)$ Expenses (5) (28,203)$ (26,067)$ (27,837)$ (31,704)$ (33,675)$ Net cash flows from existing investments 60,426$ 50,511$ 40,245$ 46,238$ 47,260$ Quarter Ended