Attached files
| file | filename |
|---|---|
| EX-99.1 - EX-99.1 - Gogo Inc. | d67236dex991.htm |
| 8-K - FORM 8-K - Gogo Inc. | d67236d8k.htm |
 2nd Quarter 2015 Earnings Results Michael Small – Chief Executive Officer Norman Smagley – Chief Financial Officer August 6, 2015 Exhibit 99.2 |
 ©2014 Gogo Inc. and Affiliates. Proprietary & Confidential.
2 SAFE HARBOR STATEMENT 2 Safe Harbor Statement This presentation contains “forward-looking statements” within the meaning of Section 27A of the Securities Act of
1933 and Section 21E of the Securities Exchange Act of
1934 that are based on management’s beliefs and assumptions and on information currently available to management. Most forward-looking statements contain words that identify them as forward-looking, such as “anticipates,” “believes,” “continues,”
“could,” “seeks,” “estimates,” “expects,” “intends,” “may,” “plans,” “potential,” “predicts,” “projects,” “should,” “will,” “would” or similar expressions and the
negatives of those terms that relate to future events. Forward-looking statements involve known and unknown risks, uncertainties and other factors that may cause Gogo’s actual results, performance or achievements to be materially different from any projected results, performance or achievements expressed or implied by the forward-looking statements. Forward-looking
statements represent the beliefs and assumptions of Gogo
only as of the date of this presentation and Gogo undertakes no obligation to update or revise publicly any such forward-looking statements, whether as a result of new information, future events or otherwise. As such, Gogo’s future results may vary from any
expectations or goals expressed in, or implied by, the
forward-looking statements included in this presentation, possibly to a material degree. Gogo cannot assure you that the assumptions made in preparing any of the forward-looking statements will prove accurate or
that any long-term financial or operational
goals and targets will be realized. In particular, the availability and performance of certain technology solutions yet to be implemented by the Company set forth in this presentation represent aspirational long-term goals based on current expectations. For a discussion of some of the important
factors that could cause Gogo’s results to differ
materially from those expressed in, or implied by, the forward-looking statements included in this presentation, investors should refer to the disclosure contained under the headings “Risk Factors” and “Cautionary Note Regarding Forward-Looking Statements” in the
Company’s Annual Report on Form 10-K filed with the SEC on February 27, 2015. Note to Certain Operating and Financial Data In addition to disclosing financial results that are determined in accordance with U.S. generally accepted accounting principles (“GAAP”), Gogo also discloses in this presentation certain non-GAAP financial information, including Adjusted EBITDA and Cash CapEx. These financial measures are
not recognized measures under GAAP,
and when analyzing our performance or liquidity, as applicable, investors should (i) use Adjusted EBITDA in addition to, and not as an alternative to, net loss attributable to common stock as a measure of operating results, and (ii) use Cash CAPEX in addition to, and not as an alternative
to, consolidated capital expenditures when evaluating our
liquidity. In
addition,
this presentation contains various customer metrics and operating data, including numbers of aircraft or units online, that are based on internal company data, as well as information relating to the commercial and business aviation market, and our position within those markets. While
management believes such information
and data are reliable, they have not been verified by an independent source and there are inherent challenges and limitations involved in compiling data across various geographies and from various sources. |
 ©2014 Gogo Inc. and Affiliates. Proprietary & Confidential.
3 EXECUTING ON OUR GLOBAL OPPORTUNITY 3 Connected aircraft 70%+ win rate since 2Ku announcement It is real It is big It is underway Flying on over 50% of connected commercial aircraft worldwide Note: Based on management estimates as of 6/30/2015 |
 ©2014 Gogo Inc. and Affiliates. Proprietary & Confidential.
4 GOGO LEADS THE INDUSTRY 4 Innovative platforms & services Most connected aircraft Best network solutions |
 ©2014 Gogo Inc. and Affiliates. Proprietary & Confidential.
5 WINNING AIRCRAFT 5 Signed definitive agreement with GOL Large full fleet award of 140 aircraft 500+ 2Ku aircraft awarded since April 2014 Demonstrates importance of 2Ku in the tropical region GOL selected three products: - in-flight connectivity, - wireless in-flight entertainment, - and Gogo’s newest product: Gogo TV |
 ©2014 Gogo Inc. and Affiliates. Proprietary & Confidential.
6 ADDING MORE BANDWIDTH 6 2Ku commercial launch is expected by year-end 2015 2Ku brings more capacity to North America 2Ku wins on cost, coverage, capacity and reliability |
 ©2014 Gogo Inc. and Affiliates. Proprietary & Confidential.
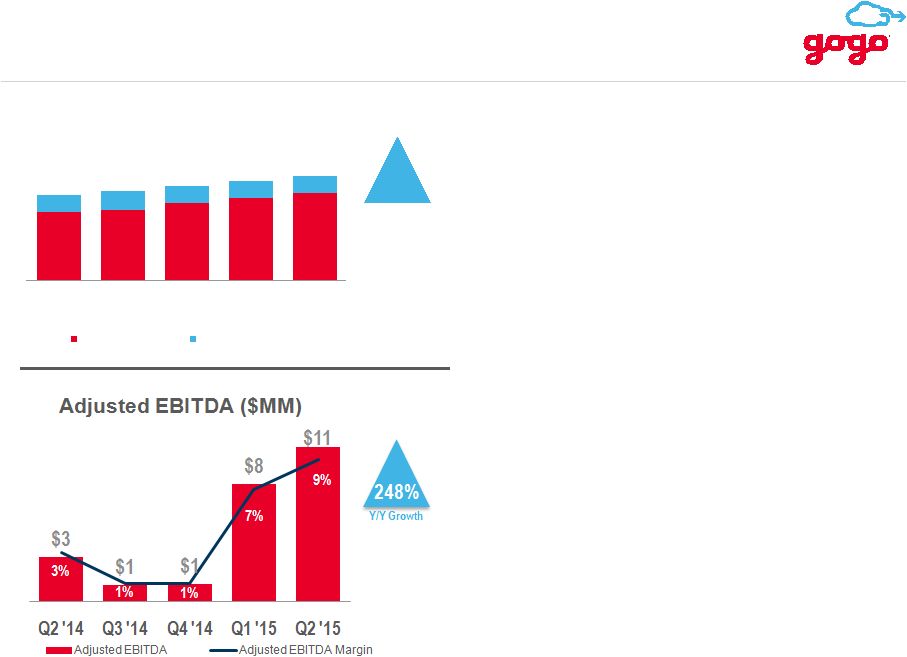
7 HITTING OUR NUMBERS 7 Revenue up 22% to $121 million Adjusted EBITDA up 248% to $10.8 million CA-NA + BA combined segment profit up 31% to $29 million Q2 2015 Strong Financial Results: |
 ©2014 Gogo Inc. and Affiliates. Proprietary & Confidential.
8 HITTING OUR NUMBERS 8 Added nearly 300 aircraft online in CA & BA CA added ~120 aircraft with Gogo Vision BA shipped 227 ATG units Segmentation strategy gains traction - Average of more than 3 per day Q2 2015 Strong Operating Performance: |
 ©2014 Gogo Inc. and Affiliates. Proprietary & Confidential.
9 KEY PRIORITIES 9 Bring 2Ku online Increase bandwidth to unlock ARPA Increase scale advantage |
 ©2014 Gogo Inc. and Affiliates. Proprietary & Confidential.
10 Q2 2015 RECORD REVENUE & ADJUSTED EBITDA 10 $79 $82 $90 $95 $101 $20 $22 $20 $20 $20 Q2 '14 Q3 '14 Q4 '14 Q1 '15 Q2 '15 Total Revenue ($MM) Service Revenue Equipment Revenue 22% Y/Y Growth • Q2 2015 record revenue quarter • Service revenue exceeds $100 million, up 28% y/y • CA-NA + BA segment profit up 31% y/y to $29 million • Q2 2015 record Adjusted EBITDA of $10.8 million, 9% margin $100 $121 $109 $104 $116 Note: Minor differences exist due to rounding |
 ©2014 Gogo Inc. and Affiliates. Proprietary & Confidential.
11 CA-NA STRONG REVENUE & ARPA GROWTH 11 $62 $62 $68 $72 $75 Q2 '14 Q3 '14 Q4 '14 Q1 '15 Q2 '15 Service Revenue ($MM) 22% Y/Y Growth • Service revenue driven by: - 13% y/y growth in ARPA - 9% y/y growth in aircraft online • ARPA growth continues: - Changes in pricing - Growth in Gogo Vision revenue - Regional jet additions impact ARPA $115 $115 $122 $121 $127 $5 $6 $9 $14 $9 Q2 '14 Q3 '14 Q4 '14 Q1 '15 Q2 '15 Annualized ARPA Connectivity Revenue Other Service Revenue 13% Y/Y Growth Note: Minor differences exist due to rounding (1)Other service revenue includes content filtering, VoIP access for airlines’ flight crews, portal development services,
operations-oriented communications services, third-party
advertising, e-commerce revenue share arrangements and partner co-branding and reseller arrangements. $120 $122 $131 $134 $136 (1) |
 ©2014 Gogo Inc. and Affiliates. Proprietary & Confidential.
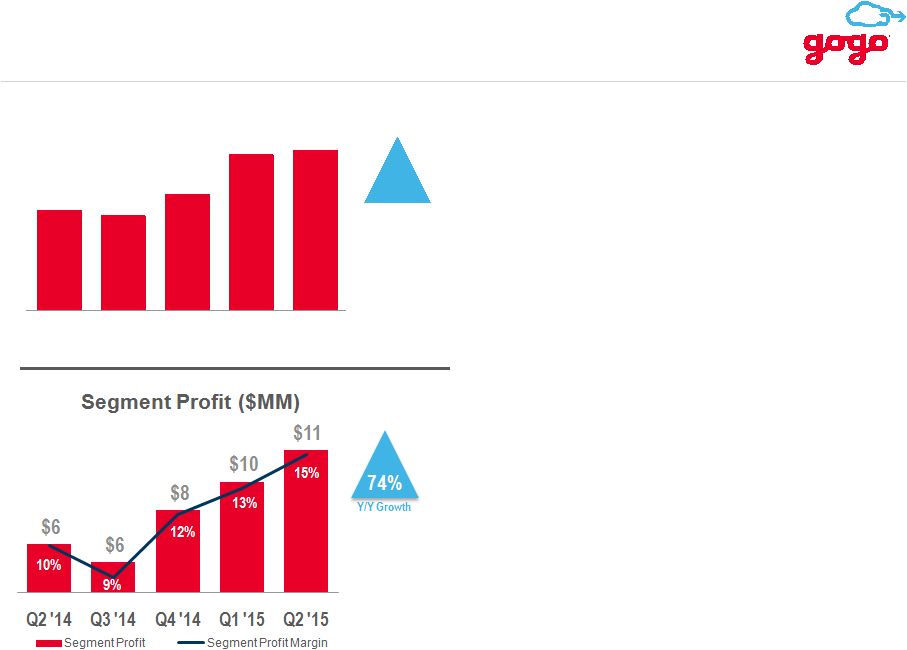
12 CA-NA AIRCRAFT ONLINE & SEGMENT PROFIT GROWTH 12 9% Y/Y Growth Note: Minor differences exist due to rounding • 105 aircraft installed • 56 aircraft retired by airlines • Strong operating leverage continues • Segment profit margin expands to 15% Q2 '14 Q3 '14 Q4 '14 Q1 '15 Q2 '15 Aircraft Online (End of Period) 2,249 2,200 2,098 2,044 2,058 |
 ©2014 Gogo Inc. and Affiliates. Proprietary & Confidential.
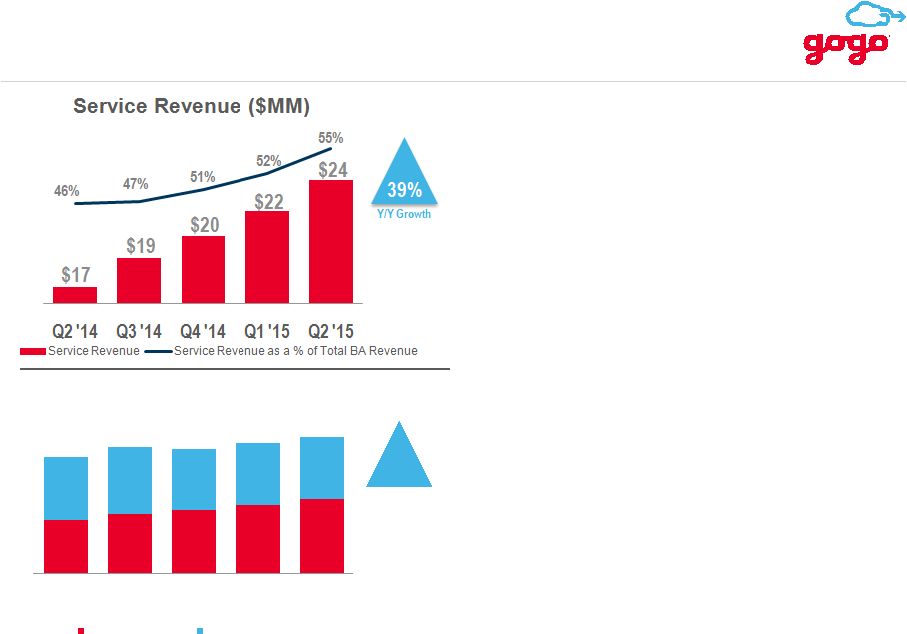
13 BA SERVICE REVENUE & ATG AIRCRAFT ONLINE GROWTH 13 • Service revenue increased 39% y/y to record $24 million • Service revenue continues strong growth track record • Total revenue reaches new record $17 $19 $20 $22 $24 $20 $21 $19 $20 $20 Q2 '14 Q3 '14 Q4 '14 Q1 '15 Q2 '15 Total Revenue ($MM) Service Revenue Equipment Revenue 17% Y/Y Growth $37 $43 $40 $40 $42 Note: Minor differences exist due to rounding |
 ©2014 Gogo Inc. and Affiliates. Proprietary & Confidential.
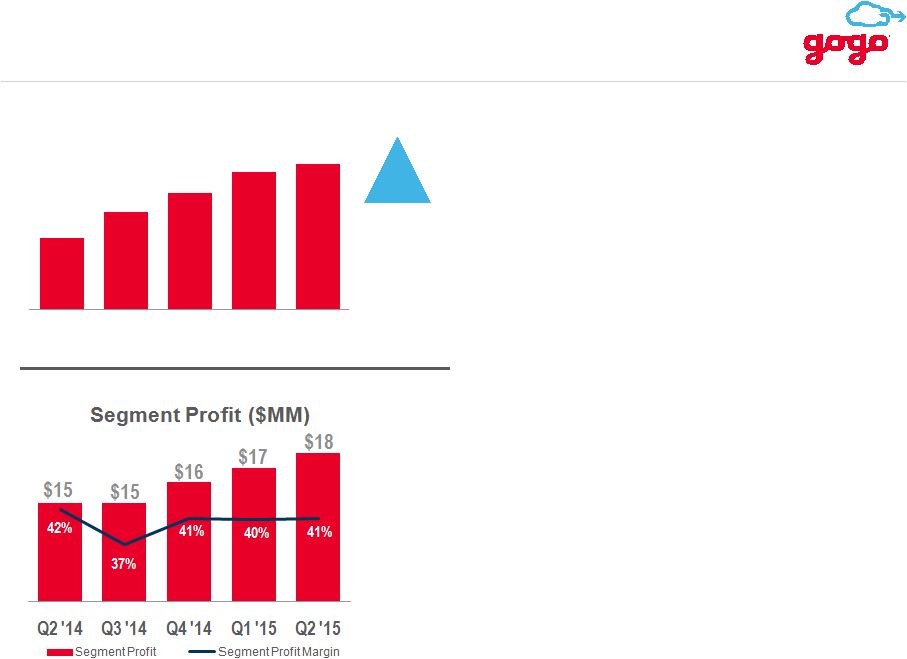
14 BA REVENUE & SEGMENT PROFIT GROWTH 14 • ATG aircraft online increased 31% y/y to nearly 3,200 • ATG service ARPU of $2,200+ per month • Q2 2015 segment profit up 13% y/y, 41% margin 2,415 2,637 2,797 2,983 3,170 Q2 '14 Q3 '14 Q4 '14 Q1 '15 Q2 '15 ATG Aircraft Online (End of Period) 31% Y/Y Growth |
 ©2014 Gogo Inc. and Affiliates. Proprietary & Confidential.
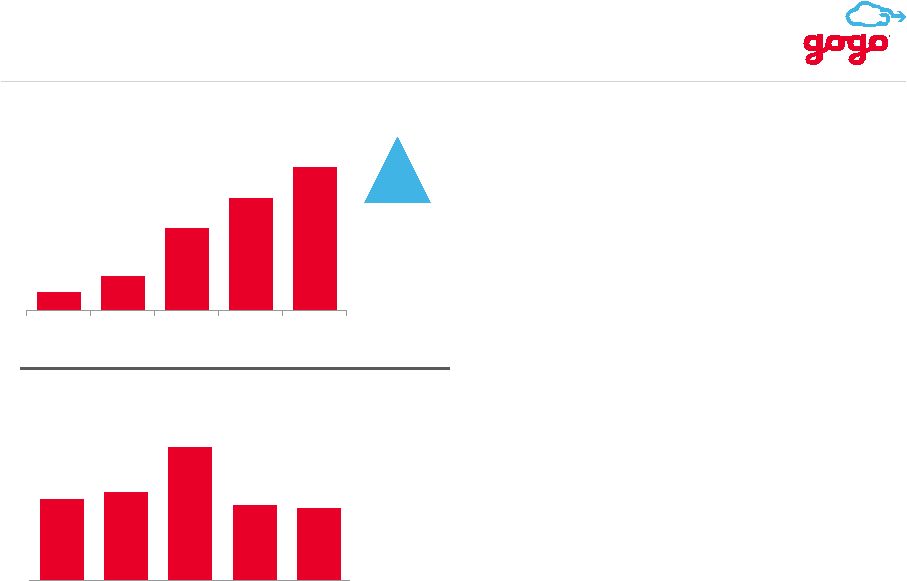
$19 $19 $23 $18 $18 Q2 '14 Q3 '14 Q4 '14 Q1 '15 Q2 '15 CA-ROW Segment Loss ($MM) 15 FOCUS ON INTERNATIONAL EXPANSION 15 19 35 85 116 148 Q2 '14 Q3 '14 Q4 '14 Q1 '15 Q2 '15 Satellite Aircraft Online (End of Period) 28% Q/Q Growth • Installed 32 Ku-based aircraft • Revenue of $2.3 million, up from $0.3 million in Q2’14 • Y/Y decrease in segment loss due to lower cost of service |
 ©2014 Gogo Inc. and Affiliates. Proprietary & Confidential.
16 CONSOLIDATED CASH CAPEX & CASH BALANCE 16 $27 $30 $12 $32 $23 Q2 '14 Q3 '14 Q4 '14 Q1 '15 Q2 '15 Cash CapEx ($MM) • Q2 ’15 Y/Y changes in capital expenditures: Increased airborne equipment proceeds Decreased ATG network spend • Strong cash position $196 $243 $211 $400 $392 Q2 '14 Q3 '14 Q4 '14 Q1 '15 Q2 '15 Cash Balance ($MM) Y/Y Decrease $4MM Note: Minor differences exist due to rounding. Cash balance is end of period. |
 ©2014 Gogo Inc. and Affiliates. Proprietary & Confidential.
17 2015 GUIDANCE 17 Revenue $485 - $505 million CA-NA $300 - $320 million BA $170 - $180 million CA-ROW $10 - $15 million Adjusted EBITDA at higher end of $15 - $25 million Cash CAPEX $100 - $120 million |
 ©2014 Gogo Inc. and Affiliates. Proprietary & Confidential.
18 STRONG Q2 FINANCIAL PERFORMANCE 18 Strong service revenue growth Strong operating leverage Growth in profitability |
 Q&A **** **** **** **** **** **** **** **** **** **** ************************************ ******************************** |
 Appendix ************************* ************************* ************************* ************************* ************************* ************************* ************************* ************************* ****************** **** **** **** **** **** **** **** **** *** |
 ©2014 Gogo Inc. and Affiliates. Proprietary & Confidential.
21 ADJUSTED EBITDA RECONCILIATION ($MM) 2009 2010 2011 2012 2013 2014 Q1 2014 Q2 2014 Q3 2014 Q4 2015 Q1 2015 Q2 Net Income (142) (140) (18) (96) (146) (17) (19) (25) (24) (20) (25) Interest Income (0) (0) (0) (0) (0) (0) (0) (0) (0) (0) (0) Interest Expense 30 – 1 9 29 7 7 9 9 10 16 Income Tax Provision – 3 1 1 1 – – – – – – Depreciation & Amortization 22 31 33 37 56 16 15 17 17 19 21 EBITDA (91) (106) 16 (49) (60) 6 4 2 2 9 12 Fair Value Derivative Adjustments – 33 (59) (10) 36 – – – – – – Class A and Class B Senior Convertible Preferred Stock Return – 18 31 52 29 – – – – – – Accretion of Preferred Stock – 9 10 10 5 – – – – – – Stock-based Compensation Expense 1 2 2 4 6 2 2 3 3 3 3 Loss on Extinguishment of Debt 2 – – – – – – – – – – Write Off of Deferred Equity Financing Costs – – – 5 – – – – – – – Amortization of Deferred Airborne Lease Incentives – (1) (1) (4) (8) (3) (3) (4) (4) (4) (5) Adjusted EBITDA (89) (45) (1) 9 8 5 3 1 1 8 11 Note: Minor differences exist due to rounding |
 ©2014 Gogo Inc. and Affiliates. Proprietary & Confidential.
22 CASH CAPEX RECONCILIATION ($MM) 2009 2010 2011 2012 2013 2014 Q1 2014 Q2 2014 Q3 2014 Q4 2015 Q1 2015 Q2 Purchases of Property and Equipment (69) (33) (33) (67) (105) (32) (28) (35) (37) (53) (33) Acquisition of Intangible Assets (Capitalized Software) (8) (7) (10) (12) (16) (4) (5) (5) (3) (4) (4) Consolidated Capital Expenditures (77) (40) (43) (79) (121) (36) (33) (41) (40) (57) (37) Change in Deferred Airborne Lease Incentives – 9 11 18 9 5 3 5 17 9 7 Amortization of Deferred Airborne Lease Incentives – 1 1 4 8 3 3 3 4 4 5 Landlord Incentives – – – – – – – 2 7 12 3 Cash CapEx (77) (30) (31) (58) (104) (29) (27) (30) (12) (32) (23) Note: Minor differences exist due to rounding |