Attached files
| file | filename |
|---|---|
| 8-K - FORM 8-K - CECO ENVIRONMENTAL CORP | d23042d8k.htm |
| EX-99.1 - EXHIBIT 99.1 - CECO ENVIRONMENTAL CORP | d23042dex991.htm |
 Exhibit
99.2 |
 Non-GAAP Financial Information
CECO is providing the non-GAAP historical financial measures in this presentation, as the Company believes that these figures are helpful in allowing individuals to better assess the ongoing nature of CECO’s core operations. A "non-GAAP financial measure" is a numerical measure of a company's historical financial performance that excludes amounts that are included in the most directly comparable measure calculated and presented in the GAAP statement of operations. Non-GAAP gross margin, non-GAAP operating income, non-GAAP net income, non-GAAP adjusted EBITDA, non-GAAP gross profit margin, non-GAAP operating margin, non-GAAP earnings per basic and diluted share, as we present them in the financial data included in this presentation, have been adjusted to exclude the effects of expenses related to property, plant, and equipment valuation adjustments, acquisition and integration expense activities including retention, legal, accounting, banking, amortization and earnout expenses, the impact of foreign currency remeasurement and the associated tax benefit of these charges. Management believes that these items are not necessarily indicative of the Company’s ongoing operations and their exclusion provides individuals with additional information to compare the Company's results over multiple periods. Additionally, management utilizes this information to evaluate its ongoing financial performance. Our financial statements may continue to be affected by items similar to those excluded in the non-GAAP adjustments described above, and exclusion of these items from our non-GAAP financial measures should not be construed as an inference that all such costs are unusual or infrequent. Non-GAAP gross margin, non-GAAP operating income, non-GAAP net income, non-GAAP adjusted EBITDA, non-GAAP gross profit margin, non-GAAP operating margin, and non-GAAP earnings per basic and diluted shares are not calculated in accordance with GAAP, and should be considered supplemental to, and not as a substitute for, or superior to, financial measures calculated in accordance with GAAP. Non-GAAP financial measures have limitations in that they do not reflect all of the costs associated with the operations of our business as determined in accordance with GAAP. As a result, you should not consider these measures in isolation or as a substitute for analysis of CECO’s results as reported under GAAP. In accordance with the requirements of Regulation G issued by the Securities and Exchange Commission, non-GAAP gross margin, non- GAAP operating income, non-GAAP net income, non-GAAP adjusted EBITDA, non-GAAP gross profit margin, non-GAAP operating margin, and non-GAAP earnings per basic and diluted share stated in the tables above are reconciled to the most directly comparable GAAP financial measures. Free cash flow has limitations due to the fact that it does not represent the residual cash flow available for discretionary expenditures, since it does not take into account debt service requirements or other non-discretionary expenditures that are not deducted from the measure. Adjusted EBITDA and Free Cash Flow are not calculated in accordance with GAAP, and should be considered supplemental to, and not as a substitute for, or superior to, financial measures calculated in accordance with GAAP Additionally, CECO cautions investors that the non-GAAP financial measures used by the Company may not be comparable to similarly titled measures of other companies. Safe Harbor Statement 2 |
 Forward-looking Statements
Any statements contained in this presentation other than statements of historical fact, including statements about management’s beliefs and expectations, are forward-looking statements and should be evaluated as such. These statements are made on the basis of management’s views and assumptions regarding future events and business performance. Words such as “estimate,” “believe,” “anticipate,” “expect,” “intend,” “plan,” “target,” “project,” “should,” “may,” “will” and similar expressions are intended to identify forward- looking statements. Forward-looking statements (including oral representations) involve risks and uncertainties that may cause actual results to differ materially from any future results, performance or achievements expressed or implied by such statements. These risks and uncertainties include, but are not limited to: our ability to successfully complete the acquisition of PMFG; our ability to successfully integrate acquired businesses and realize the synergies from acquisitions, including PMFG, as well as a number of factors related to our business including economic and financial market conditions generally and economic conditions in CECO’s service areas; dependence on fixed price contracts and the risks associated therewith, including actual costs exceeding estimates and method of accounting for contract revenue; fluctuations in operating results from period to period due to seasonality of the business; the effect of growth on CECO’s infrastructure, resources, and existing sales; the ability to expand operations in both new and existing markets; the potential for contract delay or cancellation; changes in or developments with respect to any litigation or investigation; the potential for fluctuations in prices for manufactured components and raw materials; the substantial amount of debt incurred in connection with our recent acquisitions and our ability to repay or refinance it or incur additional debt in the future; the impact of federal, state or local government regulations; economic and political conditions generally; and the effect of competition in the product recovery, air pollution control and fluid handling and filtration industries. These and other risks and uncertainties are discussed in more detail in CECO’s filings with the Securities and Exchange Commission, including our reports on Form 10-K and Form 10-Q. Many of these risks are beyond management’s ability to control or predict. Should one or more of these risks or uncertainties materialize, or should the assumptions prove incorrect, actual results may vary in material aspects from those currently anticipated. Investors are cautioned not to place undue reliance on such forward-looking statements as they speak only to our views as of the date the statement is made. All forward-looking statements attributable to CECO or persons acting on behalf of CECO are expressly qualified in their entirety by the cautionary statements and risk factors contained in this presentation and CECO’s respective filings with the Securities and Exchange Commission. Furthermore, forward-looking statements speak only as of the date they are made. Except as required under the federal securities laws or the rules and regulations of the Securities and Exchange Commission, CECO undertakes no obligation to update or review any forward-looking statements, whether as a result of new information, future events or otherwise. Safe Harbor Statement 3 |
 Important
Information for Investors and Stockholders This
communication does not constitute an offer to sell or the solicitation of an offer to buy securities or a solicitation of any vote or approval. This communication is not a substitute for the prospectus/proxy statement that CECO and PMFG will file with the SEC. Investors in CECO or PMFG are urged to read the prospectus/proxy statement, which will contain important information, including detailed risk factors, when it becomes available. The prospectus/proxy statement and other documents that will be filed by CECO and PMFG with the SEC will be available free of charge at the SEC’s website, www.sec.gov, or by directing a request when such a filing is made to (1) CECO Environmental Corp., by mail at 4625 Red Bank Road Suite 200, Cincinnati, Ohio 45227, Attention: Investor Relations, by telephone at 800-333-5475 or by going to CECO’s Investor page on its corporate website at www.cecoenviro.com; or (2) PMFG, Inc. by mail at 14651 North Dallas Parkway Suite 500, Dallas, Texas 75254, Attention: Investor Relations, by telephone at 877- 879-7634, or by going to PMFG, Inc.’s Investors page on its corporate website at www.pmfginc.com. A final prospectus/proxy statement will be mailed to CECO’s stockholders and shareholders of PMFG. Safe Harbor Statement 4 Proxy Solicitation CECO and PMFG, and certain of their respective directors, executive officers and other members of management and employees may be deemed participants in the solicitation of proxies in connection with the proposed transactions. Information about the directors and executive officers of CECO is set forth in the proxy statement for CECO’s 2015 annual meeting of stockholders and CECO’s 10-K for the year ended December 31, 2014. Information about the directors and executive officers of PMFG is set forth in the proxy statement for PMFG’s 2014 annual meeting of shareholders and PMFG’s Form 10-K for the year ended June 28, 2014. Investors may obtain additional information regarding the interests of such participants in the proposed transactions by reading the prospectus/proxy statement for such proposed transactions when it becomes available. |
 |
 6 • Revenue Growth – Revenue of $87 million, up 31% year-over-year – Organic revenue is up 4.5% in 1H15 using constant FX
– Organic revenue was flat for Q215 vs last year – 1H15 revenue $168 million vs $123 million in prior year • Bookings / Backlog Trends – 2Q15 bookings of $75 million up 29% year-over-year – Organic bookings up 4% for 1H15 – Organic bookings in 2Q15 are flat – Backlog of $140 consistent with at year end • EPS Growth – GAAP EPS for 2Q15 of $0.08 compared with $0.17 in 2Q14 – Non-GAAP EPS for 2Q15 of $0.32 vs. $0.25 in 2Q14 2Q15 Financial Highlights |
 7 • Non-GAAP Gross Margin – Gross margin of 31% in Q215 compared with 26% in Q1, primarily attributable to: • Aftermarket mix, higher OE GP, business improvement and project execution • Non-GAAP Operating Margin – Operating margins improved to 14.2% in Q215 vs 9.3% in Q1 and 10.4% in Q414 – SG&A betterment at 16.6% and will increase slightly in Q3 and Q4 • Adjusted EBITDA – Adjusted EBITDA of $13.5 million, up from $11.0 million in prior year – 1H15 adjusted EBITDA of $22.1 million, up from $20.4 million in prior year 2Q15 Quarterly Financial Highlights |
 Business
Conditions & Strategic Review 8
• Overall end markets are unchanged with the exception of China and we are executing on our Sales Excellence
and initiatives • Environmental segment continues to gain momentum; China has slowed • Global refinery activity is strong • Energy segment ; global natural gas power generation business is strong and traditional power is picking up internationally, but remains soft domestically • Fluid Handling and Filtration segment is on track with a strong 2H expected • Aftermarket sales strategies continue to gain momentum • Integration of Zhongli, Emtrol-Buell, and HEE-Duall are 100% complete and we are very pleased with the performance of these businesses • The team is now ready for the CECO-PMFG total integration process • The acquisition of PMFG is a significant strategic event, closing in September |
 9 Strong strategic fit, environmental and energy related portfolios 1. Key step towards becoming the market leader in natural gas power gen 3. Enhances global footprint, particularly in China, Europe and the Middle East 5. 4. Provides access to attractive end markets to drive long-term growth 6. Brings a leading portfolio of highly engineered product offerings 8. Poised to benefit from a balanced portfolio and diverse end markets 7. Grows aftermarket & recurring revenue opportunity with $5B installed base 2. Poised to achieve significant sales and $15 million in cost synergies Announcement of Proposed Acquisition of PMFG, Inc. - Key Transaction Benefits & Strategic Rationale 9. We anticipate the acquisition will close in Q3 |
 CECO and
PMFG – Technology Leaders in
Comprehensive Solutions for the Natural
Gas Turbine Peerless Mfg. Co. Emission Control Systems 64MW Simple-Cycle CT 10 Peerless SCRs is a world
leader in selective catalytic
reduction emission control
systems Aarding-Effox are experts in exhaust systems, dampers, diverters & acoustical abatement systems Aarding Stack & Silencer Peerless Emissions Control Systems Aarding-Effox Diverter Damper & Expansion Joints Aarding Steam Vent Silencer Gas Turbine Exhaust Aarding Bypass System Including Silencers |
 11 CECO and PMFG – Technology Leaders in Environmental-Industrial Silencers Design, Engineering and Manufacturing of Silencers for Full Range of Industrial Applications |
 12 CECO-PMFG Combination Will Provide a Stronger-Larger- More Profitable Asian Region Platform for the Future |
 |
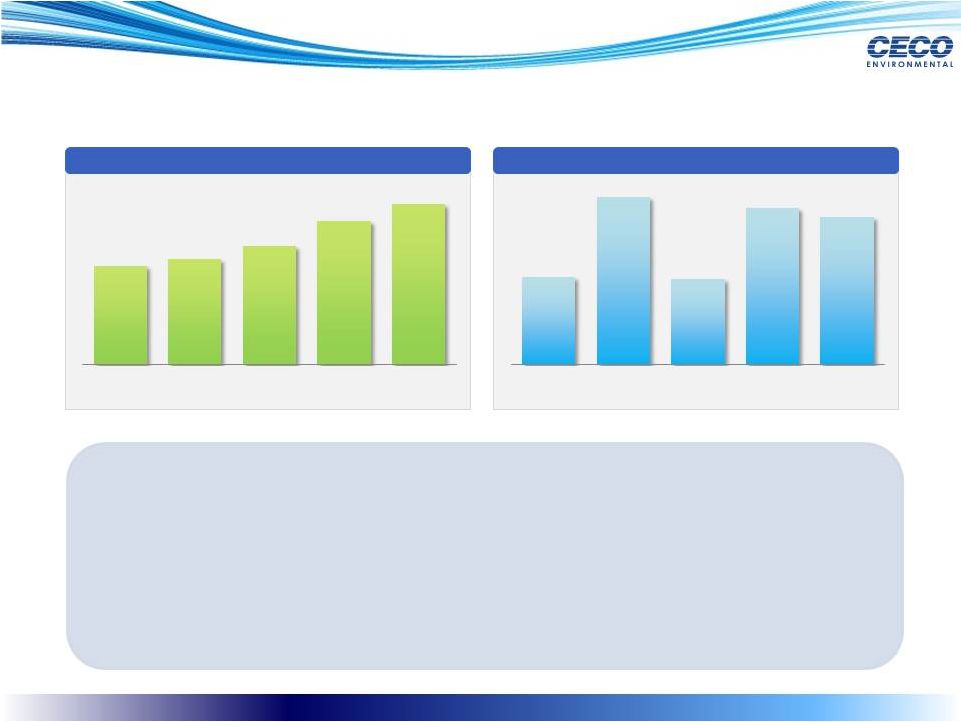
 $66.6 $63.3 $76.1 $81.0 $86.9 2Q14 3Q14 4Q14 1Q15 2Q15 14 • Record revenue of $87 million, up 31% y/y and 8% sequentially • 1H15 organic growth was up 4.5% and on a constant currency basis, organic revenue was flat for 2Q15 • Gains in revenue are driven by a combination of organic growth, sales excellence, and revenue from acquisitions ($ in millions) 2Q15 Quarterly Financial Highlights Revenue |
 Backlog $96.0 $106.2 $140.1 $153.0 $140.3 2Q14 3Q14 4Q14 1Q15 2Q15 ($ in millions) 15 2Q15 Quarterly Financial Highlights $57.7 $69.9 $63.7 $93.9 $74.6 2Q14 3Q14 4Q14 1Q15 2Q15 Bookings • Organic bookings are up 4.5% 1H and flat in Q2, following a very strong 1Q15 • Solid 2Q15 backlog of $140.3 million • 2Q15 bookings of $75 million vs $57.7 million a year ago |
 32.3% 33.6% 29.8% 26.2% 30.7% 2Q14 3Q14 4Q14 1Q15 2Q15 16 2Q15 Financial Highlights Non-GAAP Gross Margin • Gross margin increased to 30.7% in Q2 due to mix changes, operational excellence, and aftermarket • Operating margin of 14.2% in Q2 vs. 9.3% in Q1 showing excellent improvement • Exceeded Q2 margin expectations due to various favorable factors • Good SG&A control at 16.6% for 1H15 14.9% 12.9% 10.9% 9.3% 14.2% 2Q14 3Q14 4Q14 1Q15 2Q15 Non-GAAP Operating Margin |
 $11.0 $9.4 $8.9 $8.6 $13.5 2Q14 3Q14 4Q14 1Q15 2Q15 17 Adjusted EBITDA • Adjusted EBITDA of $13.5 million in 2Q15 vs $8.6 million 1Q15 and $11.0 million in the prior year • Non-GAAP EPS of $0.32, up from $0.21 in 1Q15 and up from $0.25 in 2Q14 • 1H15 Non-GAAP EPS $0.53 vs $0.44 in 1H14 • We have consistently excluded FX re-measurement in 2015 and 2014 Non-GAAP EPS Note: See supplemental slide for adjusted EBITDA reconciliation and important disclosures
regarding CECO’s use of adjusted EBITDA. ($ in
millions) 2Q15 Quarterly Financial Highlights
$0.25 $0.25 $0.22 $0.21 $0.32 2Q14 3Q14 4Q14 1Q15 2Q15 |
 $32.9 $27.7 $40.3 $41.7 $41.8 2Q14 3Q14 4Q14 1Q15 2Q15 18 Environmental Segment Revenue • Revenue of $41.8 million was up 27% y/y • Bookings of $31.0 million in 2Q15, up 17.4% y/y • Aftermarket continues to gain momentum • July booking of U.S. Refinery project totaling $14.5 million • Expect a stronger 2H both domestically and in Asia $26.4 $24.6 $33.3 $51.2 $31.0 2Q14 3Q14 4Q14 1Q15 2Q15 Bookings ($ in millions) 2nd Quarter Results |
 19 Revenue • Revenue of $27.3 million was up 62.5% y/y • Revenue is up 12% sequentially • Aftermarket and retrofit opportunities continue to grow • The Energy segment continues to expand globally • Aarding, Effox and Zhongli are all on track and doing well Bookings Energy Segment ($ in millions) 2nd Quarter Results $16.8 $18.0 $20.2 $24.3 $27.3 2Q14 3Q14 4Q14 1Q15 2Q15 $14.8 $28.4 $14.6 $26.5 $25.0 2Q14 3Q14 4Q14 1Q15 2Q15 |
 20 Revenue • Organic revenue of $17.7 million, up 16.4% sequentially, 6.0% y/y • Organic bookings of $18.6 million, up 14.8% sequentially • Margin expansion and operational excellence continuing on plan • Aftermarket is accelerating • Added strategic sales leadership resources in 1H Bookings Fluid Handling & Filtration Segment ($ in millions) 2nd Quarter Results $16.7 $17.6 $15.9 $15.2 $17.7 2Q14 3Q14 4Q14 1Q15 2Q15 $16.6 $16.7 $15.8 $16.2 $18.6 2Q14 3Q14 4Q14 1Q15 2Q15 |
 21 12/31/2011 12/31/2012 12/31/2013 12/31/2014 6/30/2015 Cash & Equivalents $ 12.7 $ 23.0 $ 22.7 $ 19.4 $ 17.1 Total Assets $ 79.3 $ 94.1 $348.5 $414.4 $416.7 Total Bank Debt $ 0.0 $ 0.0 $ 89.1 $112.4 $111.7 Shareholders’Equity $ 43.0 $ 62.0 $170.4 $181.2 $180.6 Current Assets Current Liabilities Net Working Capital $ 53.5 $(23.6) $ 29.9 $ 64.3 $(27.5) $ 36.8 $124.8 $(59.3) $ 65.5 $143.0 $(75.4) $ 67.6 Balance Sheet . Selected Balance Sheet Information Note: Balance Sheet figures presented as reported in Company filings $152.0 $(83.8) $ 68.2 Balance Sheet Detail ($ in millions) Net Debt to Pro Forma EBITDA = 2.00 Leverage Ratio |
 Supplemental 22 |
 23 Non-GAAP Gross Margin ($ in millions) Annual Q1 Q2 Q3 Q4 Annual Q1 Q2 YTD TTM 2013 2014 2014 2014 2014 2014 2015 2015 2015 2015 Gross profit as reported in accordance with GAAP $61.6 $19.7 $21.4 $21.1 $22.6 $84.8 $21.0 $26.6 $47.6 $91.3 Gross profit margin in accordance with GAAP 31.2% 34.4% 32.1% 33.3% 29.7% 32.2% 25.9% 30.6% 28.4% 29.7% Inventory valuation adjustment 1.1 - - - - - - - - - Plant, property and equipment valuation adjustment 0.2 0.2 0.1 0.2 0.1 $0.6 0.2 0.1 0.3 0.6 Non-GAAP gross margin $62.9 $19.9 $21.5 $21.3 $22.7 $85.4 $21.2 $26.7 $47.9 $91.9 Non- GAAP Gross profit margin 31.9% 34.8% 32.3% 33.6% 29.8% 32.4% 26.2% 30.7% 28.5% 29.9% |
 24 Non-GAAP Operating Margin ($ in millions) Annual Q1 Q2 Q3 Q4 Annual Q1 Q2 YTD TTM 2013 2014 2014 2014 2014 2014 2015 2015 2015 2015 Operating income as reported in accordance with GAAP $7.0 $5.5 $7.2 $5.2 $3.8 $21.7 $3.0 $4.5 $7.5 $16.5 Operating margin in accordance with GAAP 3.5% 9.6% 10.8% 8.2% 5.0% 8.2% 3.7% 5.2% 4.5% 5.4% Inventory valuation adjustment 1.1 - - - - - - - - - Plant, property and equipment valuation adjustment 0.2 0.2 0.1 0.2 0.1 0.6 0.2 0.1 0.3 0.6 Acquisition and integration expenses 7.2 0.1 0.2 0.1 0.9 1.3 0.3 1.0 1.3 2.3 Amortization and earn-out expenses 6.8 2.5 2.4 2.4 2.8 10.1 4.0 6.7 10.7 15.9 Legal reserves 3.5 - - 0.3 - 0.3 - - - 0.3 Non-GAAP operating income $25.8 $8.3 $9.9 $8.2 $7.6 $34.0 $7.5 $12.3 $19.8 $35.6 Non-GAAP Operating margin 13.1% 14.5% 14.9% 12.9% 10.0% 12.9% 9.3% 14.2% 11.8% 11.6% |
 25 Non-GAAP NI & EBITDA ($ in millions) Annual Annual Annual Annual Annual Q1 Q2 Q3 Q4 Annual Q1 Q2 YTD TTM 2009 2010 2011 2012 2013 2014 2014 2014 2014 2014 2015 2015 2015 2015 Net income as reported in accordance with GAAP $(15.0) $2.1 $8.3 $10.9 $6.6 $3.0 $4.5 $3.7 $1.9 $13.1 $0.2 $2.1 $2.3 $7.9 Inventory valuation adjustment - - - - 1.1 - - - - - - - $- $- Plant, property and equipment valuation adjustment - - - - 0.2 0.2 0.1 0.2 0.1 0.6 0.2 0.1 $0.3 $0.6 Acquisition and integration expenses - - - - 7.2 0.1 0.2 0.1 0.9 1.3 0.3 1.0 $1.3 $2.3 Amortization and earn-out expenses - - - - 6.8 2.5 2.4 2.4 2.8 10.1 4.0 6.7 $10.7 $15.9 Legal reserves - - - - 3.5 - - 0.3 - 0.3 - - $- $0.3 Foreign currency remeasurement - - - - (1.1) - - 1.7 1.2 2.9 2.7 (0.6) $2.1 $5.0 Tax benefit of expenses - - - - (4.6) (0.8) (0.7) (1.2) (1.0) (3.7) (1.7) (0.8) $(2.5) $(4.7) Non-GAAP net income $(15.0) $2.1 $8.3 $10.9 $19.7 $5.0 $6.5 $7.2 $5.9 $24.6 $5.7 $8.5 $14.2 $27.3 Depreciation 2.5 1.8 1.4 1.2 1.6 0.8 0.7 0.8 0.8 3.1 0.7 0.6 $1.3 $2.9 Non-cash stock compensation 1.0 0.9 0.7 0.7 1.1 0.3 0.4 0.5 0.5 1.7 0.4 0.5 $0.9 $1.9 Goodwill impairment 17.1 - - - - - - - - - - - $- $- Other (income)/expense 0.8 0.1 (0.5) 0.1 0.1 0.1 0.1 (0.2) (0.6) (0.6) (1.0) 0.1 $(0.9) $(1.7) Interest expense 1.3 1.2 1.1 1.2 1.5 0.7 0.8 0.7 0.9 3.1 1.0 1.2 $2.2 $3.8 Income tax expense (3.1) 1.4 3.4 4.5 4.5 2.5 2.5 0.4 1.4 6.8 1.8 2.6 $4.4 $6.2 Non-GAAP EBITDA $4.6 $7.5 $14.4 $18.6 $28.5 $9.4 $11.0 $9.4 $8.9 $38.7 $8.6 $13.5 $22.1 $40.4 Basic Shares Outstanding 20,116,991 25,606,352 25,643,508 25,691,884 26,057,831 25,750,972 26,271,316 26,283,529 26,277,456 26,076,140 Diluted Shares Outstanding 20,719,951 26,115,512 26,107,648 26,129,427 26,467,984 26,196,901 26,598,799 26,627,051 26,643,857 26,455,815 Earnings (loss) per share: Basic $0.33 $0.12 $0.18 $0.14 $0.07 $0.51 $0.01 $0.08 $0.09 $0.30 Diluted $0.32 $0.12 $0.17 $0.14 $0.07 $0.50 $0.01 $0.08 $0.09 $0.30 Non-GAAP earnings per share: Basic $0.98 $0.20 $0.25 $0.28 $0.22 $0.95 $0.22 $0.32 $0.54 $1.04 Diluted $0.95 $0.19 $0.25 $0.28 $0.22 $0.94 $0.21 $0.32 $0.53 $1.03 |
 26 ($ in Millions) CECO Reported Pro-forma (Recent Acquisitions) CECO Standalone PMFG Pro-forma CECO Combined GAAP Revenues $263.2 $64.7 $327.9 $158.1 $ 486.0 GAAP Gross profit $84.8 $13.6 $98.4 $45.7 $144.1 SG&A as reported in accordance with GAAP $51.4 $6.6 $58.0 $51.5 $109.5 GAAP Net income $13.1 $8.1 $21.2 ($33.1) ($11.9) Amortization and earn-out expenses $10.1 - $10.1 $0.9 $11.0 Other (1) $5.1 $0.3 $5.4 $26.5 $31.9 Tax benefit of expenses ($3.7) - ($3.7) ($2.2) ($5.9) Non-GAAP net income $24.6 $8.4 $33.0 ($7.8) $25.2 Depreciation $3.1 - $3.1 $1.8 $4.9 Non-cash stock compensation $1.7 - $1.7 $1.1 $2.8 Other (income)/expense ($0.6) - ($0.6) ($0.1) ($0.7) Interest expense $3.1 - $3.1 $1.8 $4.9 Income tax expense $6.8 - $6.8 1.1 $7.9 Non GAAP Adjusted EBITDA $38.7 $8.4 $47.1 ($2.1) $45.0 Non-GAAP Adjusted EBITDA (with Synergies) $60.0 GAAP to Non-GAAP Adjusted EBITDA Reconciliation (Twelve Months ended 12/31/2014) (1) Includes plant, property and equipment (PPE) valuation adjustments, acquisition and integration expenses, legal reserves and
foreign currency re-measurement |