Attached files
| file | filename |
|---|---|
| 8-K - FORM 8-K - PUBLIC SERVICE ENTERPRISE GROUP INC | d17140d8k.htm |
| EX-99 - EX-99 - PUBLIC SERVICE ENTERPRISE GROUP INC | d17140dex99.htm |
 Public
Service Enterprise Group PSEG Earnings Conference Call
2 nd Quarter 2015 July 31, 2015 EXHIBIT 99.1 |
| 1 Forward-Looking Statement • adverse changes in the demand for or the price of the capacity and energy that we sell into wholesale electricity markets,
• adverse changes in energy industry law, policies and regulation, including market structures and transmission planning,
• any inability of our transmission and distribution businesses to obtain adequate and timely rate relief and regulatory approvals from federal and
state regulators, •
changes in federal and state environmental regulations and enforcement that could
increase our costs or limit our operations, •
changes in nuclear regulation and/or general developments in the nuclear power
industry, including various impacts from any accidents or incidents experienced at our facilities or by others in the industry, that could limit operations of our nuclear generating units,
• actions or activities at one of our nuclear units located on a multi-unit site that might adversely affect our ability to continue to operate
that unit or other units located at the same site,
• any inability to manage our energy obligations, available supply and risks, • adverse outcomes of any legal, regulatory or other proceeding, settlement, investigation or claim applicable to us and/or the energy industry, • any deterioration in our credit quality or the credit quality of our counterparties,
• availability of capital and credit at commercially reasonable terms and conditions and our ability to meet cash needs,
• changes in the cost of, or interruption in the supply of, fuel and other commodities necessary to the operation of our generating
units, •
delays in receipt of necessary permits and approvals for our construction and
development activities, •
delays or unforeseen cost escalations in our construction and development
activities, •
any inability to achieve, or continue to sustain, our expected levels of operating
performance, •
any equipment failures, accidents, severe weather events or other incidents that impact
our ability to provide safe and reliable service to our customers, and any inability to obtain sufficient insurance coverage or recover proceeds of insurance with respect to such events,
• acts of terrorism, cybersecurity attacks or intrusions that could adversely impact our businesses,
• increases in competition in energy supply markets as well as for transmission projects,
• any inability to realize anticipated tax benefits or retain tax credits, • challenges associated with recruitment and/or retention of a qualified workforce,
• adverse performance of our decommissioning and defined benefit plan trust fund investments and changes in funding requirements,
• changes in technology, such as distributed generation and micro grids, and greater reliance on these technologies, and
• changes in customer behaviors, including increases in energy efficiency, net-metering and demand response.
All of the forward-looking statements made in this report are qualified by these
cautionary statements and we cannot assure you that the results or developments anticipated by management will be realized or even if realized, will have the expected consequences to, or effects on, us or our business prospects, financial
condition or results of operations. Readers are cautioned not to place
undue reliance on these forward-looking statements in making any investment decision. Forward-looking statements made in this report apply only as of the date of this report. While we may elect to update forward-looking statements from time to time, we specifically disclaim any obligation to do
so, even if internal estimates change, unless otherwise required by
applicable securities laws. The forward-looking statements contained in this report are intended to qualify for
the safe harbor provisions of Section 27A of the Securities Act of 1933, as amended, and Section 21E of the Securities Exchange Act of 1934, as amended.
Certain of the matters discussed in this report about our and our
subsidiaries' future performance, including, without limitation, future revenues, earnings, strategies, prospects, consequences and all other statements that are not purely historical constitute “forward-looking statements” within the meaning of
the Private Securities Litigation Reform Act of 1995. Such
forward-looking statements are subject to risks and uncertainties, which could cause actual results to differ materially from those anticipated. Such statements are based on management's beliefs as well as assumptions made by and information currently available to management. When used herein, the words
“anticipate,” “intend,” “estimate,” “believe,” “expect,” “plan,” “should,” “hypothetical,” “potential,” “forecast,”
“project,” variations of such words and similar expressions are intended to identify forward-looking statements. Factors that may cause actual results to differ are often presented with the forward-looking statements themselves. Other factors that could cause actual
results to differ materially from those contemplated in any
forward-looking statements made by us herein are discussed in filings we make with the United States Securities and Exchange Commission (SEC), including our Annual Report on Form 10-K and subsequent reports on Form 10-Q and Form 8-K and available on our website: http://www.pseg.com. These
factors include, but are not limited to: |
 2 GAAP Disclaimer PSEG presents Operating Earnings and Adjusted Earnings Before Interest, Taxes, Depreciation
and Amortization (EBITDA) in addition to its Net Income reported in accordance with
accounting principles generally accepted in the United States (GAAP).
Operating Earnings and Adjusted EBITDA are non-GAAP financial
measures that differ from Net Income. Operating Earnings exclude gains or
losses associated with Nuclear Decommissioning Trust (NDT), Mark-to-Market (MTM) accounting, and other material one-time items. PSEG presents Operating Earnings
because management believes that it is appropriate for investors to consider results
excluding these items in addition to the results reported in accordance
with GAAP. PSEG believes that the non-GAAP financial measure of
Operating Earnings provides a consistent and comparable measure of
performance of its businesses to help shareholders understand performance trends. PSEG is presenting Adjusted EBITDA because it provides investors with additional information to
compare our business performance to other companies and understand performance trends.
Adjusted EBITDA excludes the same items as our Operating Earnings measure
as well as income tax expense, interest expense, depreciation and
amortization and major maintenance expense
costs at Power’s fossil generation facilities. This information is not intended to be viewed as an alternative to GAAP information. The last two slides in this presentation (Slides A and B)
include a list of items excluded from Net Income to reconcile to Operating Earnings and
Adjusted EBITDA with a reference to that slide included on each of the
slides where the non-GAAP information appears.
These materials and other financial releases can be found on the pseg.com website under
the investor tab, or at http://investor.pseg.com/
|
 PSEG
2015 Q2 Review
Ralph Izzo Chairman, President and Chief Executive Officer |
 4 Q2 Earnings Summary $ millions (except EPS) 2015 2014 Operating Earnings $ 289 $ 245 Reconciling Items, Net of Tax 56 (33) Net Income $ 345 $ 212 EPS from Operating Earnings* $ 0.57 $ 0.49 Quarter ended June 30 * See Slide A for Items excluded from Net Income to reconcile to Operating Earnings. |
 5 First Half 2015 Earnings Summary $ millions (except EPS) 2015 2014 Operating Earnings $ 818 $ 760 Reconciling Items, Net of Tax 113 (162) Net Income $ 931 $ 598 EPS from Operating Earnings* $ 1.61 $ 1.50 Six months ended June 30
* See Slide A for Items excluded from Net Income to reconcile to Operating
Earnings. |
 6 PSEG – Q2 2015 Highlights Earnings on Track Operating earnings of $0.57 vs. $0.49 per share in Q2 2014, up 16% Increased earnings contribution from PSE&G’s investment in Transmission
Updating full-year 2015 Operating Earnings guidance to $2.80 - $2.95 per share – assuming normal weather and plant operations for the balance of the year Operating Review PSEG Power generating output up by 10% vs. Q2 2014 PSE&G placed the full 500 kV Susquehanna-Roseland line into service in May
PSEG Disciplined Capital Investment
Gas System Modernization Program Filing – PSE&G’s $1.6 billion program over the next 5 years to modernize its gas system; Public hearings completed Announced the Keys CCGT New Build in Maryland: 755 MW unit targeted for 2018; Estimated cost of $825 to $875 million Artificial Island – PJM final decision assigns PSE&G a portion of the upgrade project; Program will increase transmission spend by ~$100 - $130 million over next four years Market Developments FERC issues order supporting PJM’s Capacity Performance product; continuing process
of defining parameters for transition auctions to include demand response and energy
efficiency |
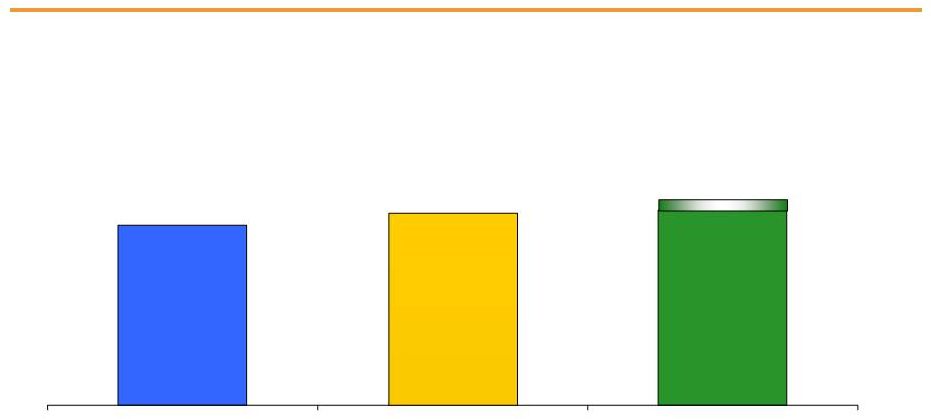 7 $2.80 - $2.95E $2.58 * See Slide A for Items excluded from Net Income to reconcile to Operating Earnings. E = Estimate.
$2.76
Full-year 2015 guidance update reflects the strength of results for both businesses
for the first half of the year, and assumes normal weather and unit
operations PSEG –
Updating 2015 Operating Earnings Guidance
2014 Operating Earnings*
2015 Operating Earnings Guidance
2013 Operating Earnings* |
 PSEG
2015 Q2 Operating Company Review
Caroline Dorsa EVP and Chief Financial Officer |
 9 Q2 Operating Earnings by Subsidiary Operating Earnings Earnings per Share $ millions (except EPS) 2015 2014 2015 2014 PSE&G $ 167 $ 151 $ 0.33 $ 0.30 PSEG Power 110 87 0.22 0.17 PSEG Enterprise/Other 12 7 0.02 0.02 Operating Earnings* $ 289 $ 245 $ 0.57 $ 0.49 Quarter ended June 30 * See Slide A for Items excluded from Net Income to reconcile to Operating Earnings. |
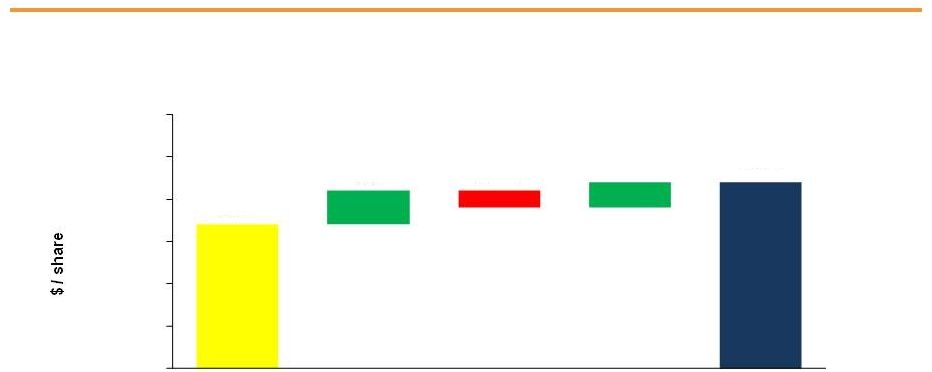
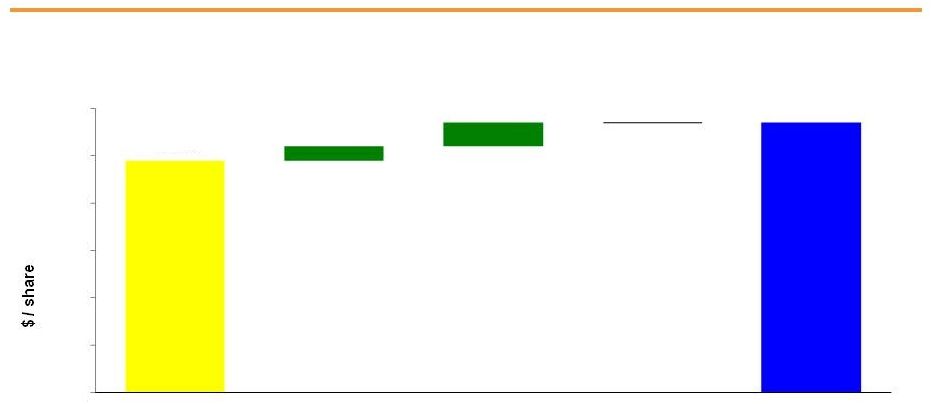 10 PSEG EPS Reconciliation – Q2 2015 versus Q2 2014 Q2 2015 Operating Earnings* Q2 2014 Operating Earnings* PSEG Power PSE&G Enterprise/ Other * See Slide A for Items excluded from Net Income to reconcile to Operating Earnings.
Re-Contracting & Lower
Cost to Serve 0.10
Higher Volume 0.02 Capacity (0.08) O&M (0.01) D&A (0.01) Taxes & Other 0.03 Transmission Net Earnings 0.04 Gas Volume 0.01 Electric Volume & Demand 0.01 Distribution O&M (0.02) Taxes & Other (0.01) $0.49 0.03 0.05 0.00 $0.57 0.00 0.10 0.20 0.30 0.40 0.50 0.60 |
 11 First Half Operating Earnings by Subsidiary Operating Earnings Earnings per Share $ millions (except EPS) 2015 2014 2015 2014 PSE&G $ 409 $ 365 $ 0.80 $ 0.72 PSEG Power 388 380 0.77 0.75 PSEG Enterprise/Other 21 15 0.04 0.03 Operating Earnings* $ 818 $ 760 $ 1.61 $ 1.50 Six months ended June 30 •See Slide A for Items excluded from Net Income to reconcile to Operating Earnings. |
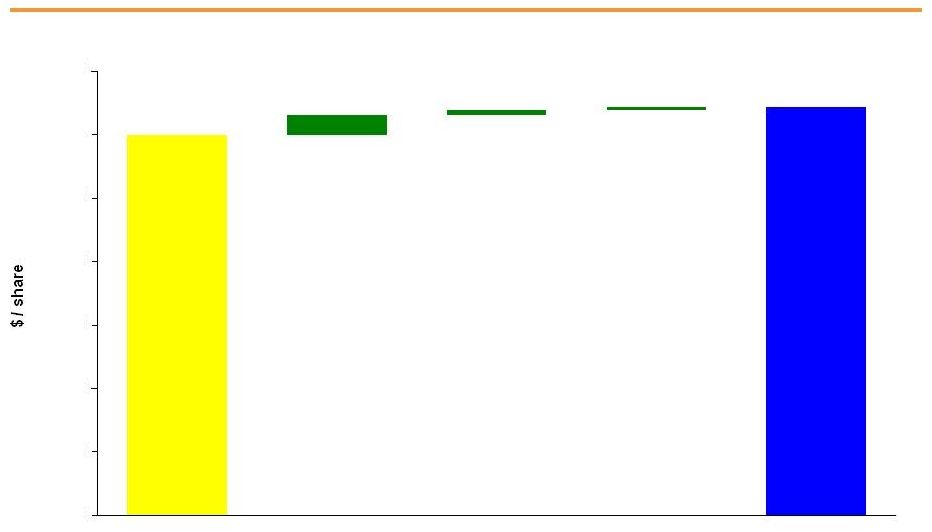 12 PSEG EPS Reconciliation – First Half 2015 versus First Half 2014 YTD 2015 Operating Earnings* YTD 2014 Operating Earnings* Re-Contracting & Lower Cost to Serve 0.14 Gas Send-Out & Fixed Cost Recovery 0.04 Higher Volume 0.02 Capacity (0.18) O&M (0.02) D&A (0.01) Taxes & Other 0.03 PSEG Power Transmission Net Earnings 0.07 Gas Volume & Demand 0.02 Electric Volume & Demand 0.01 Distribution O&M (0.01) Taxes & Other (0.01) PSE&G Enterprise/ Other PSEG Long Island * See Slide A for Items excluded from Net Income to reconcile to Operating Earnings.
$1.61 0.01 0.02 0.08 $1.50 0.00 0.25 0.50 0.75 1.00 1.25 1.50 1.75 |
 PSE&G 2015 Q2 Review |
 14 PSE&G – Q2 EPS Summary $ millions (except EPS) Q2 2015 Q2 2014 Variance Operating Revenues $ 1,466 $ 1,435 $ 31 Operating Expenses Energy Costs 544 565 (21) Operation & Maintenance 368 362 6 Depreciation & Amortization 234 217 17 Total Operating Expenses 1,146 1,144 2 Operating Earnings/Net Income $ 167 $ 151 $ 16 EPS from Operating Earnings/Net Income $ 0.33 $ 0.30 $ 0.03 |
 15 PSE&G EPS Reconciliation – Q2 2015 versus Q2 2014 Transmission Net Earnings 0.04 Gas Volume 0.01 Electric Volume & Demand 0.01 Higher Pension Expense (0.01) Distribution O&M (0.01) Taxes & Other (0.01) Q2 2014 Operating Earnings* Q2 2015 Operating Earnings* * Operating Earnings is equal to Net Income. $0.30 0.06 $0.33 (0.03) 0.00 0.10 0.20 0.30 0.40 |
 16 PSE&G – Monthly Weather Data +40% Q2 2015 vs. Q2 2014 +19% Q2 2015 vs. Normal 34 1,836 2,943 84 579 2,771 171 813 3,060 0 500 1000 1500 2000 2500 3000 3500 4000 4500 April May June 2015 2014 Normal 2015 vs. 2014 vs. Normal PSE&G Monthly Temperature Humidity Index (THI) |
 17 PSE&G – Q2 2015 Operating Highlights Operations Gas System Modernization Program public hearings concluded PJM final decision on Artificial Island/FERC 1000 project assigned PSE&G ~$100 - $130 million of the overall transmission upgrades PSE&G residential gas customers to benefit from another proposed rate reduction this October 1,
estimated to save the average gas customer another $52 per year if approved by the BPU,
bringing total gas customer savings of 47% (~$792) since
2009 Regulatory and Market
Environment PSE&G made $1.3 billion of capital expenditures in the YTD period ended June 30
Updating PSE&G’s forecast of operating earnings for the full year to $760 - $775 million from $735 - $775 million PSE&G issued $350 million, 3.00% secured Medium-Term Notes (MTNs) due May 2025 and
$250 million, 4.05% secured MTNs due May 2045
Financial Q2 2015 weather was warmer than Q2 2014 and warmer than normal Economy slowly improving, weather normalized electric sales up 0.2% in Q2: Residential demand
up 0.6% and commercial sector up 0.6% in Q2, offset by industrial sales
Gas deliveries (weather normalized) up 2.7% YTD, continue to benefit from decline in
supply costs |
 PSEG
Power 2015 Q2 Review |
 19 PSEG Power – Q2 EPS Summary $ millions (except EPS) Q2 2015 Q2 2014 Variance Operating Revenues $ 1,025 $ 986 $ 39 Operating Earnings 110 87 23 Reconciling Items, Net of Tax** 56 (33) 89 Net Income $ 166 $ 54 $ 112 EPS from Operating Earnings* $ 0.22 $ 0.17 $ 0.05 * See Slide A for Items excluded from Net Income to reconcile to Operating Earnings.
**Includes the financial impact from Mark-to-Market positions with forward
delivery months. |
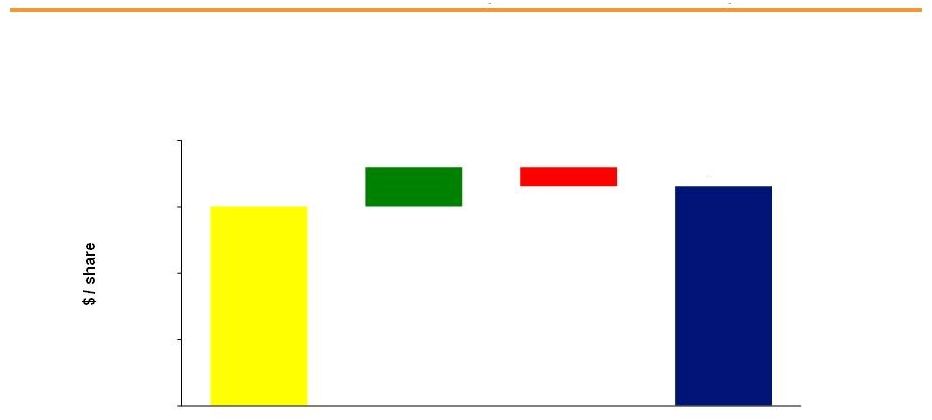
 20 Re-Contracting & Lower Cost to Serve 0.10 Higher Volume 0.02 Capacity (0.08) PSEG Power EPS Reconciliation – Q2 2015 versus Q2 2014 Q2 2015 Operating Earnings* Q2 2014 Operating Earnings* O&M (0.01) D&A (0.01) * See Slide A for Items excluded from Net Income to reconcile to Operating Earnings.
Taxes & Other $0.17 0.04 0.03 $0.22 (0.02) 0.00 0.05 0.10 0.15 0.20 0.25 0.30 |
 PSEG Power’s Adjusted EBITDA - Q2 2015, YTD and Full-Year 2015 Guidance Three Months Ended June 30, Six Months (YTD) Ended June 30, Full-Year 2015 Guidance ($ in millions) 2015 2014 2015 2014 Low High Operating Earnings** $110 $87 $388 $380 $620 $680 Add: Fossil Major Maintenance, pre-tax 52 49 101 107 115 115 Depreciation & Amortization, pre-tax 75 73 152 146 305 305 Interest Expense, pre-tax 32 29 63 60 125 125 Income Taxes 32 38 223 234 380 420 Adjusted EBITDA $301 $276 $927 $927 $1,545E $1,645E 21 PSEG Power - Adjusted EBITDA* * See Slide B for a reconciliation of Adjusted EBITDA to Operating Earnings and Net Income. E = Estimate.
** See Slide A for Items excluded from Net Income to reconcile to
Operating Earnings; Includes the financial impact from Mark-to-Market positions with forward delivery months. |
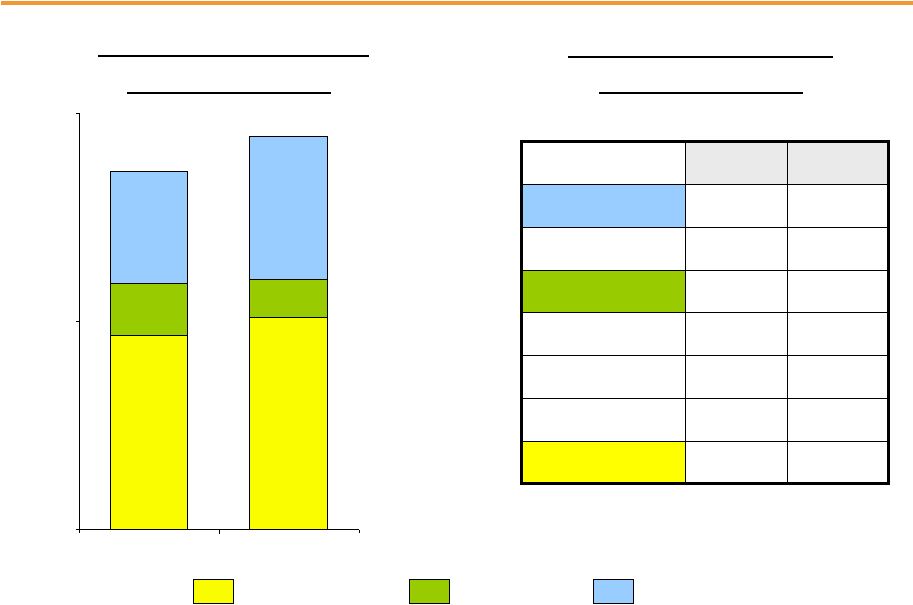 22 PSEG Power – Q2 2015 Generation Measures 6,538 7,129 3,788 4,831 1,273 1,724 0 7,000 14,000 2014 2015 Quarter ended June 30 Total Nuclear Total Coal** Oil & Natural Gas Generation by Fuel (GWh)* 12,050 Quarter ended June 30 * Excludes Solar and Kalaeloa. ** Includes figures for Pumped Storage; also includes Natural Gas fuel switching intervals.
2014 2015 Combined Cycle PJM and NY 49% 61% Coal** NJ (Coal/Gas) 14% 3% PA 80% 73% CT 4% 0% Nuclear 81% 86% 13,233 Fleet Capacity Factors (%) |
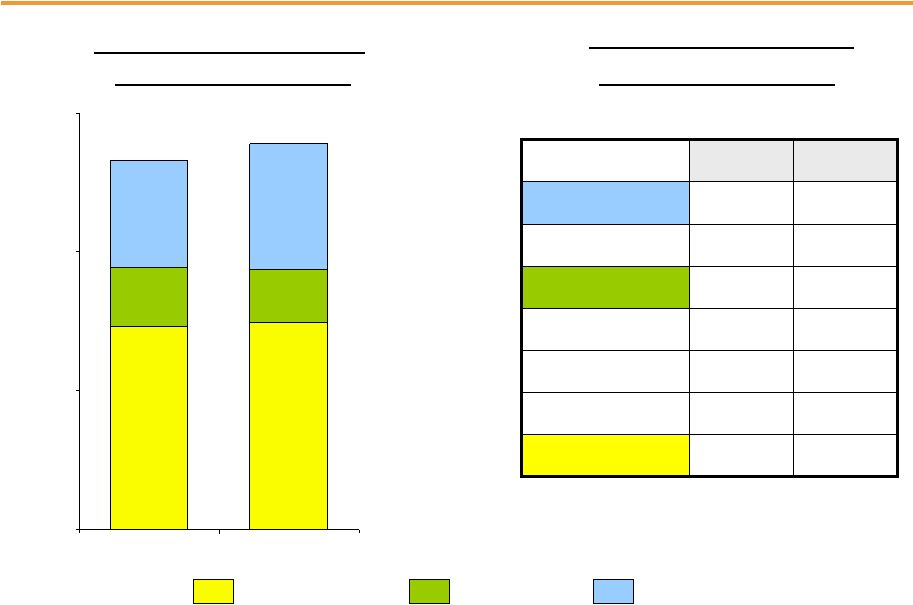 23 PSEG Power – YTD 2015 Generation Measures 14,588 14,961 9,007 4,266 3,803 7,764 0 10,000 20,000 30,000 2014 2015 Six Months ended June 30 Total Nuclear Total Coal** Oil & Natural Gas * Excludes Solar and Kalaeloa. ** Includes figures for Pumped Storage; also includes Natural Gas fuel switching intervals.
Generation by Fuel (GWh)*
27,771 26,618 Six Months ended June 30 Fleet Capacity Factors (%) 2014 2015 Combined Cycle PJM and NY 48% 58% Coal** NJ (Coal/Gas) 17% 9% PA 81% 82% CT 38% 34% Nuclear 90% 91% |
 24 PSEG Power – Fuel Costs Quarter ended June 30 ($ millions) 2014 2015 Coal $40 $30 Oil & Gas 119 82 Total Fossil 159 112 Nuclear 47 51 Total Fuel Cost $206 $163 Total Generation (GWh) 12,050 13,233 $ / MWh 17.10 12.32 PSEG Power – Fuel Costs YTD June 30 ($ millions) 2014 2015 Coal $127 $112 Oil & Gas 484 329 Total Fossil 611 441 Nuclear 109 106 Total Fuel Cost $720 $547 Total Generation (GWh) 26,618 27,771 $ / MWh 27.05 19.70 |
 25 PSEG Power – Gross Margin Performance $40 $43 Quarter ended June 30 Wholesale energy prices affected by over-supply of natural gas and constraints on electric
transmission line Increase of $4/MWh in average hedge price Q2 year-over-year capacity prices reset on June 1 to ~$168/MW-day and remain stable for the next two
capacity years; HEDD peaking capacity retired in Q2 2015
Fuel flexibility and access to lower cost Marcellus gas continue to benefit
margin Q2 2015 Regional Performance
Region Gross Margin ($M) 2015 Performance PJM $487 Re-contracting, higher hedge prices, higher volumes and lower gas costs offset the decline in capacity pricing and market pricing. New England $18 Higher hedge value offset lower volume and lower prices. New York $26 Higher volume offset lower prices. PSEG Power Gross Margin ($/MWh) $42 $0 $10 $20 $30 $40 $50 2013 2014 2015 |
 26 Hedging Update Contracted Energy* * Hedge percentages and prices as of June 30, 2015. Revenues of full requirement load deals based on contract price, including renewable
energy credits, ancillary, and transmission components
but excluding capacity. Hedges include positions with MTM accounting treatment and options. Jul-Dec 2015 2016 2017 Volume TWh 18 37 37 Base Load % Hedged 100% 85-90% 50-55% (Nuclear and Base Load Coal) Price $/MWh $53 $51 $50 Volume TWh 11 19 18 Intermediate Coal, Combined % Hedged 30-35% 0% 0% Cycle, Peaking Price $/MWh $53 -- -- Volume TWh 25-30 55-57 55-57 Total % Hedged 70-75% 55-60% 30-35% Price $/MWh $53 $51 $50 |
 27 PSEG Power – Q2 2015 Operating Highlights Q2 output up 10%; average capacity factor achieved by nuclear fleet 86%, CCGTs achieved 61%
Uprates completed at Peach Bottom (~65 MW) and Advanced Gas Path (~31MW) at Bergen
2 Dispatch of coal units affected by decline in price of gas
Operations Financial Regulatory and Market Environment PSEG Power’s average capacity pricing for the 2015/2016 capacity year reset to $168 MW/day on June 1
Access to Marcellus gas continues to benefit the fleet’s cost of gas
FERC approved PJM’s revised CP auction parameters for the Base Residual Auction
(BRA); Transition auctions delayed to allow participation of DR and
EE The 2018/2019 RPM auction on schedule; results due August 21
Acquired the Keys 755 MW gas fired combined cycle generating station in
Maryland; construction has begun with completion expected in 2018,
at an estimated investment of $825 million to $875 million Power made
capital expenditure of $360 million in the YTD period ended June 30
Power’s total debt as a percentage of capital was 31% at June 30 Moody’s affirmed PSEG Power’s Baa1 senior debt rating and Stable outlook in May S&P affirmed PSEG Power’s senior unsecured debt rating of BBB+ and revised the outlook
to Stable from Positive in May |
 PSEG |
 29 PSEG Financial Highlights Updating full-year 2015 operating earnings guidance to $2.80 - $2.95 per share Focused on maintaining operating efficiency and customer reliability PSE&G expected to contribute over 50% of 2015 operating earnings Infrastructure Spend PSE&G T&D spend for 2015 expected to be $2.6 billion Utility’s Gas System Modernization Program (GSMP) filed with the BPU in February;
Proposal supports spend of $1.6 billion over 5 years to replace aging cast
iron and unprotected steel pipes
Keys CCGT in Maryland expected on-line in 2018 expands Power’s geographic
base GSMP, Keys and Artificial Island potentially increase PSEG’s
existing $13 billion, 2015-2019E capital program by up to $2.2
billion Financial position remains strong
Positive cash from Power and increasing cash flow from operations at PSE&G supports
dividend growth and funds capital spending program without the need to
issue equity Debt as a percentage of capitalization was 42% at June 30
Increased common dividend 5.4% in February to indicative annual rate of
$1.56 per share
Increasing regulated earnings mix supports dividend growth
|
 30 PSEG 2015 Updated Guidance for Operating Income – by Subsidiary and PSEG Power Adjusted EBITDA $ millions (except EPS) 2015E 2014 PSE&G $760 - $775 $725 PSEG Power $620 - $680 $642 PSEG Enterprise/Other $40 - $45 $33 Operating Earnings* $1,420 - $1,500 $1,400 Earnings per Share $2.80 - $2.95E $2.76 Anticipates Another Year of Growth in Operating Earnings $ millions (except EPS) 2015E 2014 PSEG Power $1,545 - $1,645 $1,584 * See Slide A for Items excluded from Net Income to reconcile to Operating Earnings; Includes the financial impact from
Mark-to-Market positions with forward delivery months. **
See Slide B for a reconciliation of Adjusted EBITDA to Operating Earnings and Net Income. E = Estimate. PSEG Power Adjusted EBITDA** |
 PSEG
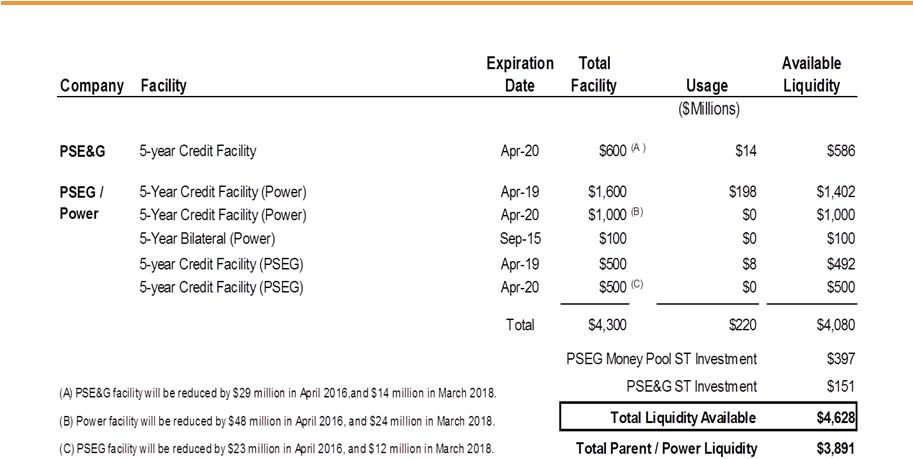
Liquidity as of June 30, 2015 31 |
 A Items Excluded from Net Income to Reconcile to Operating Earnings Please see Slide 2 for an explanation of PSEG’s use of Operating Earnings as a non-GAAP financial measure
and how it differs from Net Income.
2015 2014 2015 2014 2014 2013 Operating Earnings 289 $ 245 $ 818 $ 760 $ 1,400 $ 1,309 $ Gain (Loss) on Nuclear Decommissioning Trust (NDT) Fund Related Activity (PSEG Power) 1 14 3 23 68 40 Gain (Loss) on Mark-to-Market (MTM) (a) (PSEG Power) 28 (42) 8 (174) 66 (74) Storm O&M, net of insurance recoveries (PSEG Power) 27 (5) 102 (11) (16) (32) Net Income 345 $ 212 $ 931 $ 598 $ 1,518 $ 1,243 $ Fully Diluted Average Shares Outstanding (in Millions) 508 508 508 508 508 508 Operating Earnings 0.57 $ 0.49 $ 1.61 $ 1.50 $ 2.76 $ 2.58 $ Gain (Loss) on NDT Fund Related Activity (PSEG Power) - 0.02 - 0.04 0.13 0.08 Gain (Loss) on MTM (a) (PSEG Power) 0.06 (0.08) 0.02 (0.34) 0.13 (0.14) Storm O&M, net of insurance recoveries (PSEG Power) 0.05 (0.01) 0.20 (0.02) (0.03) (0.07) Net Income 0.68 $ 0.42 $ 1.83 $ 1.18 $ 2.99 $ 2.45 $ (a) Includes the financial impact from positions with forward delivery months. June 30, June 30, ($ Millions, Unaudited) PUBLIC SERVICE ENTERPRISE GROUP INCORPORATED Reconciling Items, net of tax Three Months Ended Year Ended Six Months Ended Consolidated Operating Earnings Reconciliation December 31, ($ Per Share Impact - Diluted, Unaudited) |
 B Items Excluded from Net Income to Reconcile to Operating Earnings and Adjusted EBITDA Please see Slide 2 for an explanation of PSEG’s use of Operating Earnings and Adjusted EBITDA as non-GAAP
financial measures and how they differ from Net Income.
2015 2014 2015 2014 Adjusted EBITDA 301 $ 276 $ 927 $ 927 $ 1,584 $ Fossil Major Maintenance, pre-tax (52) (49) (101) (107) (144) Depreciation and Amortization, pre-tax (b) (75) (73) (152) (146) (291) Interest Expense, pre-tax (b) (32) (29) (63) (60) (120) Income Taxes (b) (32) (38) (223) (234) (387) Operating Earnings 110 $ 87 $ 388 $ 380 $ 642 $ Gain (Loss) on NDT Fund Related Activity, pre-tax 3 30 10 49 138 Gain (Loss) on MTM, pre-tax (a) 48 (70) 14 (293) 111 Storm O&M, net of insurance recoveries, pre-tax 45 (9) 172 (19) (27) Income Taxes related to Operating Earnings reconciling items (40) 16 (83) 101 (104) Net Income 166 $ 54 $ 501 $ 218 $ 760 $ (a) Includes the financial impact from positions with forward delivery months. (b) Excludes amounts related to Operating Earnings reconciling items ($ Millions, Unaudited) Six Months Ended June 30, Reconciling Items Three Months Ended Year Ended December 31, 2014 June 30, PSEG Power Adjusted EBITDA Reconcilation |