Attached files
| file | filename |
|---|---|
| 8-K - FORM 8-K - MUTUALFIRST FINANCIAL INC | v416797_8-k.htm |
Exhibit 99

KBW 2015 Community Bank Investor Conference July 28, 2015
MutualFirst Financial, Inc. Symbol: MFSF Chris Cook CPA, MBA, SVP Treasurer & CFO -------- c hris.cook@bankwithmutual.com Dave Heeter President & CEO -------- dave.heeter@bankwithmutual.com
Forward Looking Statement This presentation contains statements which constitute forward looking statements within the meaning of the Private Securities Litigation Reform Act of 1995. These statements may appear in a number of places in this presentation and include statements regarding the intent, belief, outlook, estimate or expectations of the company, its directors or its officers primarily with respect to future events and the future financial performance of the company, including but not limited to preliminary estimated ProForma combined financial information. Readers of this presentation are cautioned that any such forward looking statements are not guarantees of future events or performance and involve risk and uncertainties, and that actual results may differ materially from those in the forward looking statements as a result of various factors. These factors include, but are not limited to, the loss of deposits and loan demand to competitors; substantial changes in financial markets; changes in real estate values and the real estate market; regulatory changes; or other risk factors discussed in the latest SEC form 10 - k. The Company does not undertake – and specifically disclaims any obligation – to publicly release the result of any revisions which may be made to any forward - looking statements to reflect events or circumstances after the date of such statements or to reflect the occurrence of anticipated or unanticipated events.
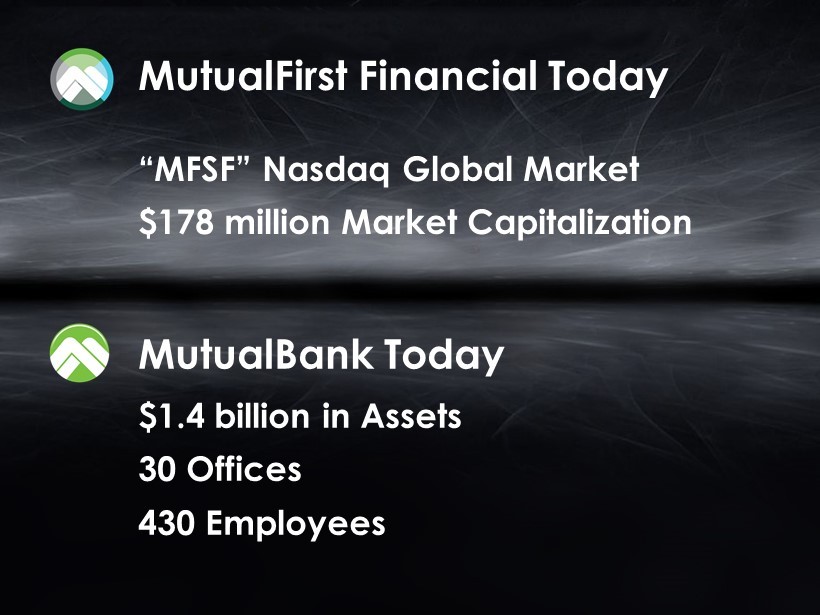
MutualFirst Financial Today “MFSF” Nasdaq Global Market $178 million Market Capitalization $1.4 billion in Assets 30 Offices 430 Employees MutualBank Today
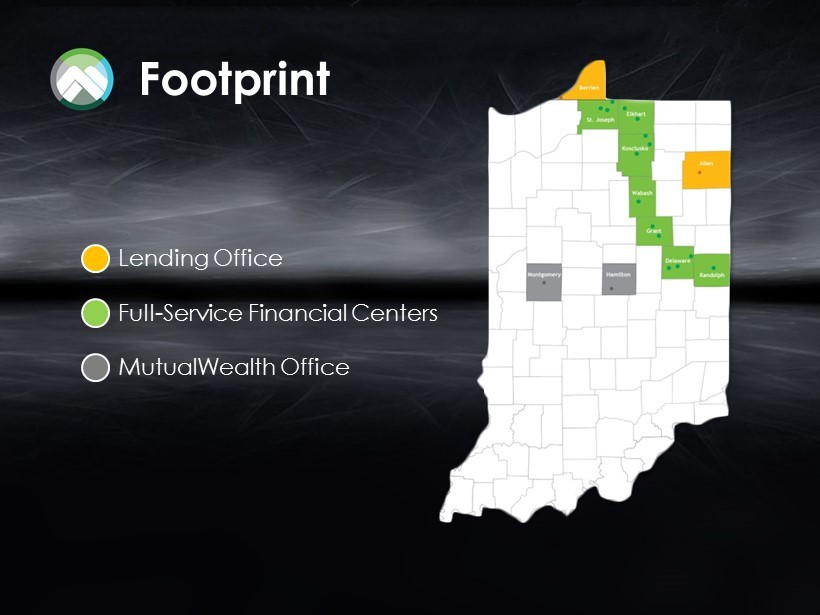
Footprint Lending Office MutualWealth Office Full - Service Financial Centers
2014 ACQUISITIONS Completed two acquisitions that enhance non - interest income

Financial Trends
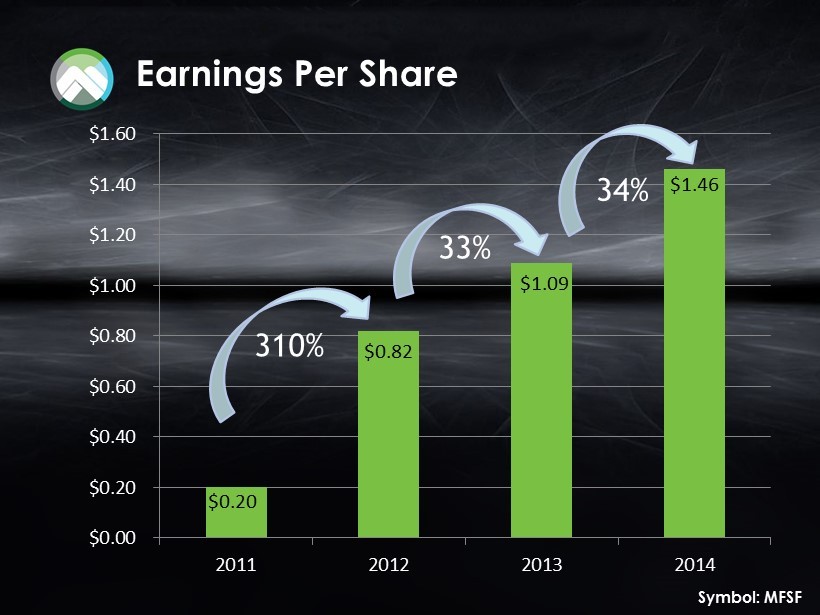
Earnings Per Share $0.20 $0.82 $1.09 $1.46 $0.00 $0.20 $0.40 $0.60 $0.80 $1.00 $1.20 $1.40 $1.60 2011 2012 2013 2014 310% 33% 34% Symbol: MFSF
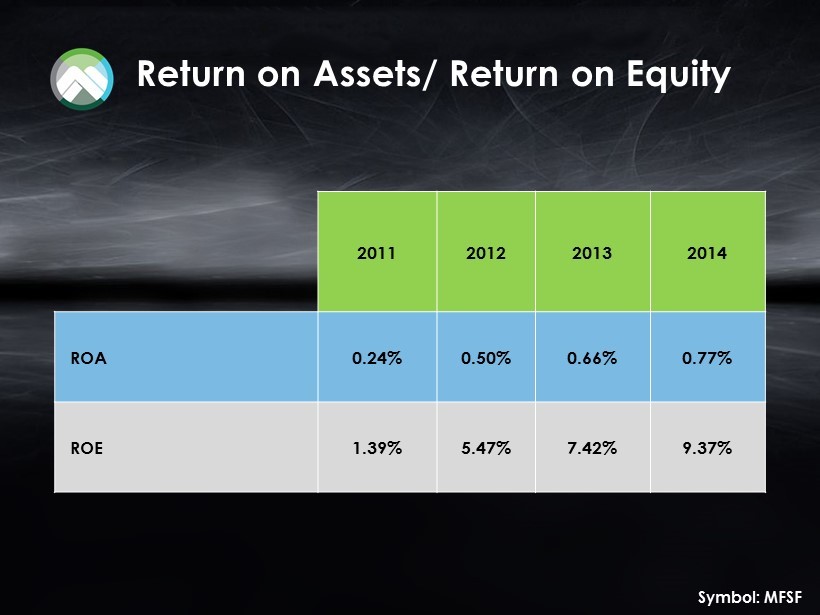
Return on Assets/ Return on Equity 2011 2012 2013 2014 ROA 0.24% 0.50% 0.66% 0.77% ROE 1.39% 5.47% 7.42% 9.37% Symbol: MFSF
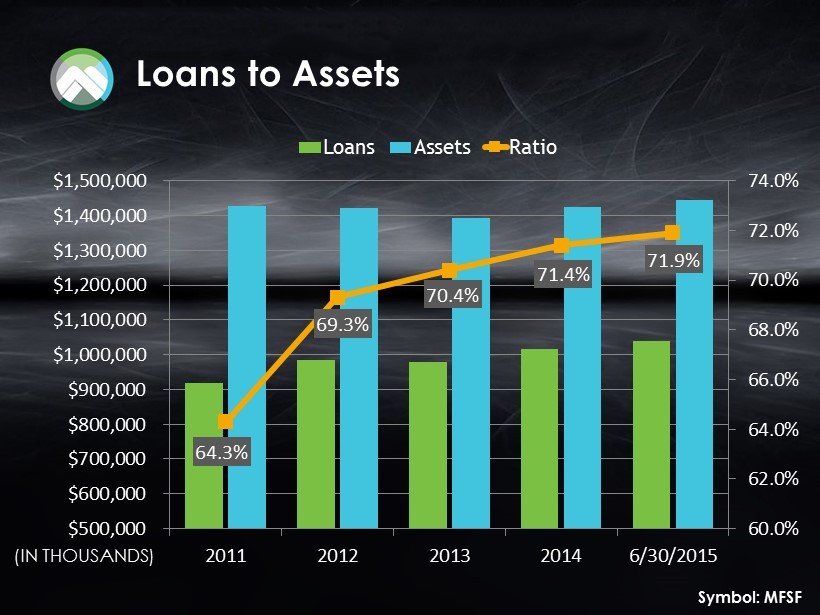
Loans to Assets 64.3% 69.3% 70.4% 71.4% 71.9% 60.0% 62.0% 64.0% 66.0% 68.0% 70.0% 72.0% 74.0% $500,000 $600,000 $700,000 $800,000 $900,000 $1,000,000 $1,100,000 $1,200,000 $1,300,000 $1,400,000 $1,500,000 2011 2012 2013 2014 6/30/2015 Loans Assets Ratio (IN THOUSANDS) Symbol: MFSF
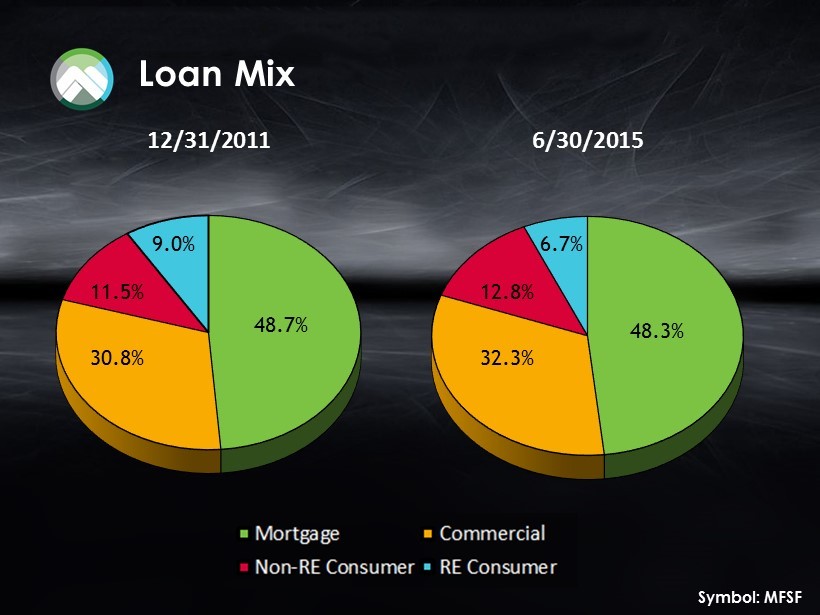
Loan Mix 12/31/2011 6/30/2015 48.7% 9.0% 11.5% 30.8% 48.3% 6.7% 12.8% 32.3% Symbol: MFSF
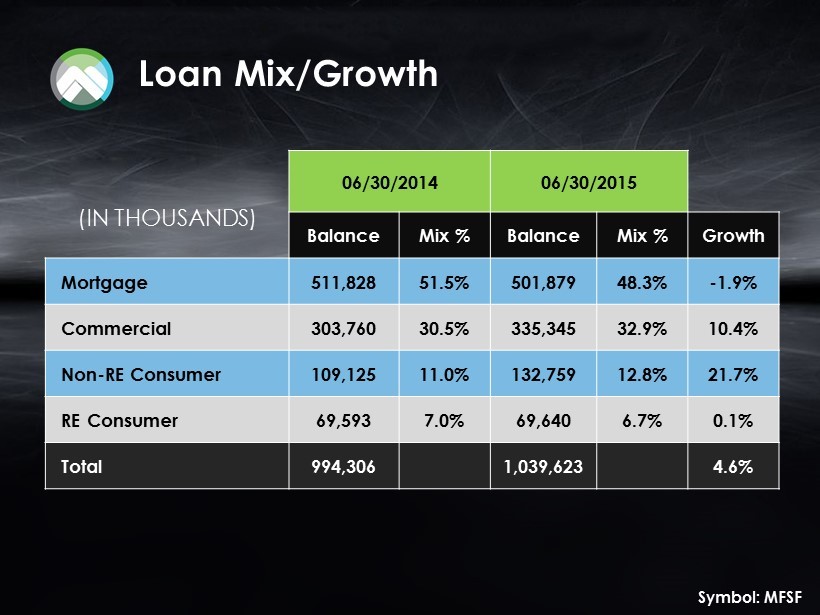
Loan Mix/Growth (IN THOUSANDS) 06/30/2014 06/30/2015 Balance Mix % Balance Mix % Growth Mortgage 511,828 51.5% 501,879 48.3% - 1.9% Commercial 303,760 30.5% 335,345 32.9% 10.4% Non - RE Consumer 109,125 11.0% 132,759 12.8% 21.7% RE Consumer 69,593 7.0% 69,640 6.7% 0.1% Total 994,306 1,039,623 4.6% Symbol: MFSF
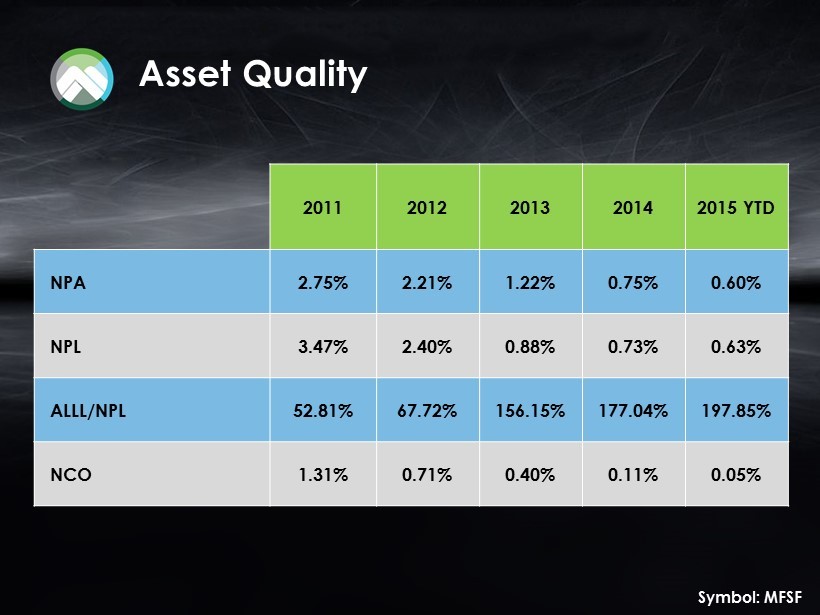
Asset Quality 2011 2012 2013 2014 2015 YTD NPA 2.75% 2.21% 1.22% 0.75% 0.60% NPL 3.47% 2.40% 0.88% 0.73% 0.63% ALLL/NPL 52.81% 67.72% 156.15% 177.04% 197.85% NCO 1.31% 0.71% 0.40% 0.11% 0.05% Symbol: MFSF
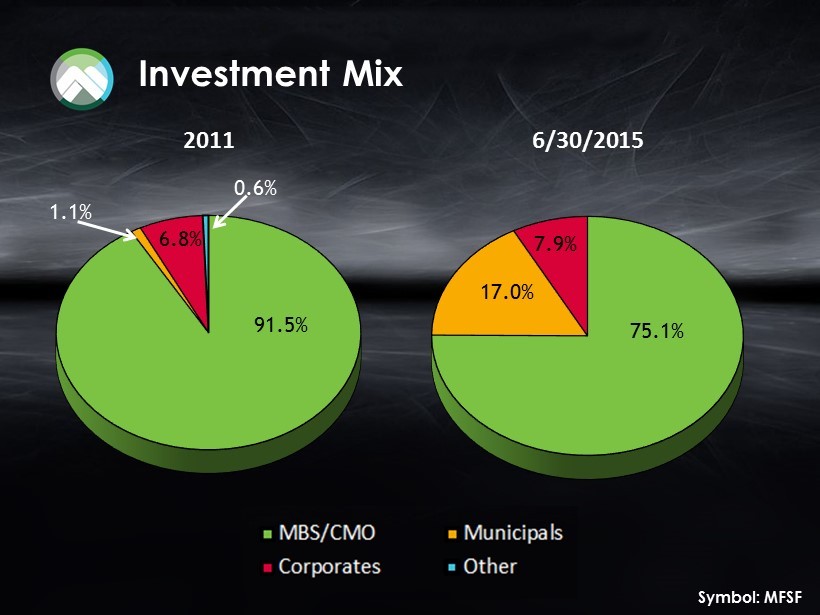
Investment Mix 2011 6/30/2015 91.5% 6.8% 1.1% 0.6% 75.1% 17.0% 7.9% Symbol: MFSF
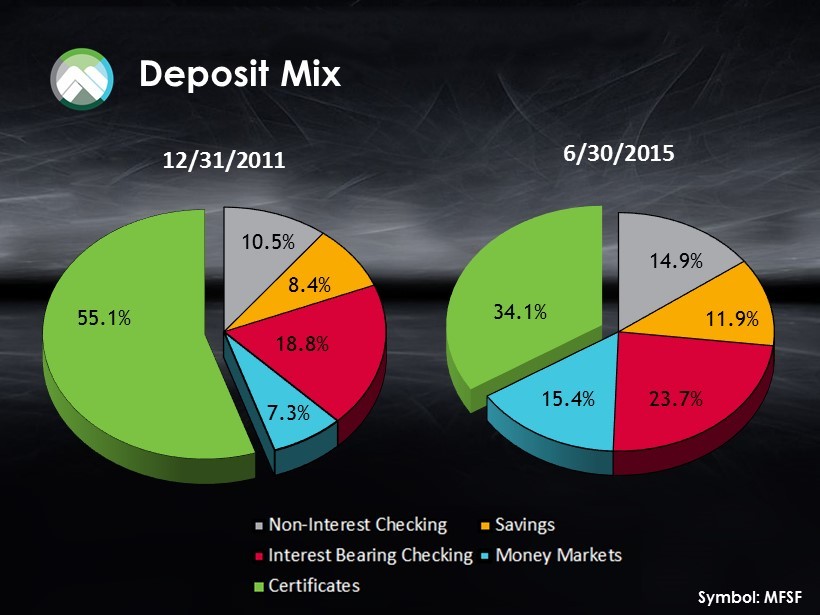
Deposit Mix 12/31/2011 6/30/2015 55.1% 18.8% 7.3% 8.4% 10.5% 34.1% 15.4% 23.7% 11.9% 14.9% Symbol: MFSF
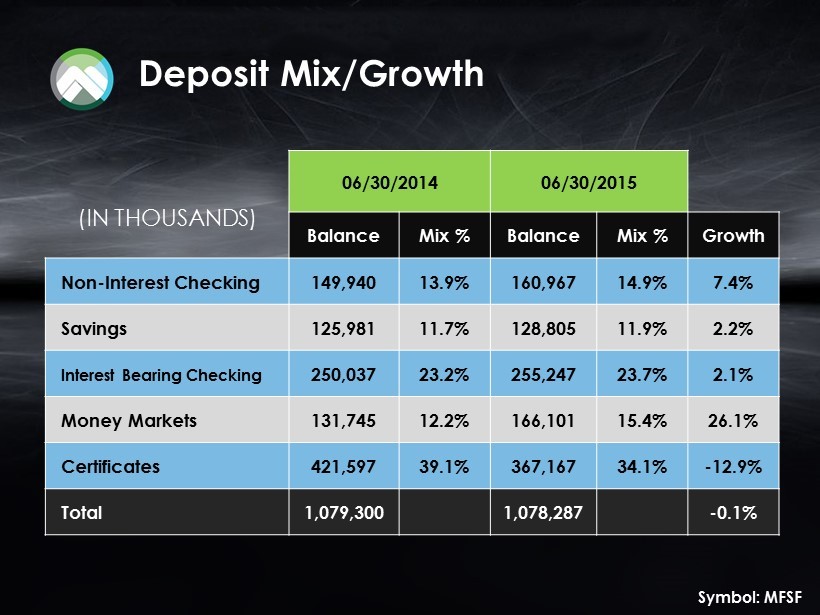
Deposit Mix/Growth (IN THOUSANDS) 06/30/2014 06/30/2015 Balance Mix % Balance Mix % Growth Non - Interest Checking 149,940 13.9% 160,967 14.9% 7.4% Savings 125,981 11.7% 128,805 11.9% 2.2% Interest Bearing Checking 250,037 23.2% 255,247 23.7% 2.1% Money Markets 131,745 12.2% 166,101 15.4% 26.1% Certificates 421,597 39.1% 367,167 34.1% - 12.9% Total 1,079,300 1,078,287 - 0.1% Symbol: MFSF
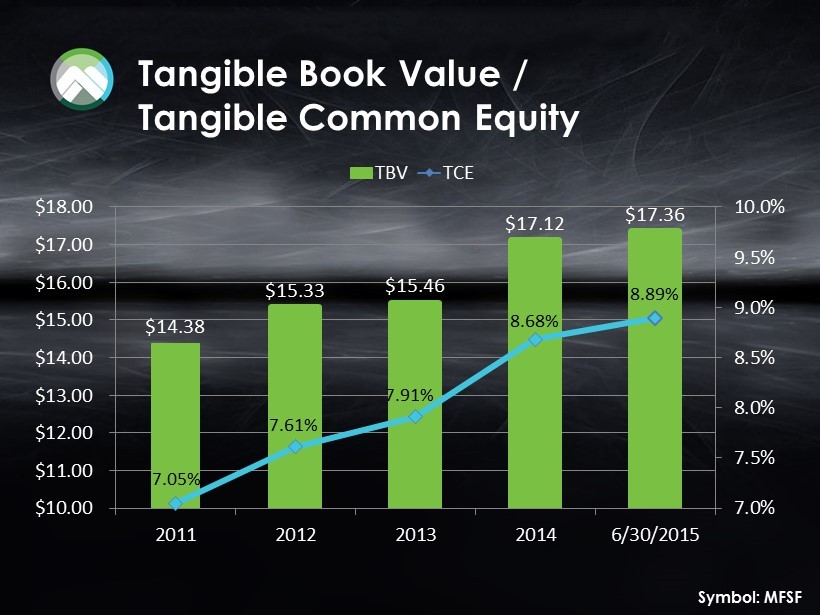
Tangible Book Value / Tangible Common Equity $14.38 $15.33 $15.46 $17.12 $17.36 7.05% 7.61% 7.91% 8.68% 8.89% 7.0% 7.5% 8.0% 8.5% 9.0% 9.5% 10.0% $10.00 $11.00 $12.00 $13.00 $14.00 $15.00 $16.00 $17.00 $18.00 2011 2012 2013 2014 6/30/2015 TBV TCE Symbol: MFSF
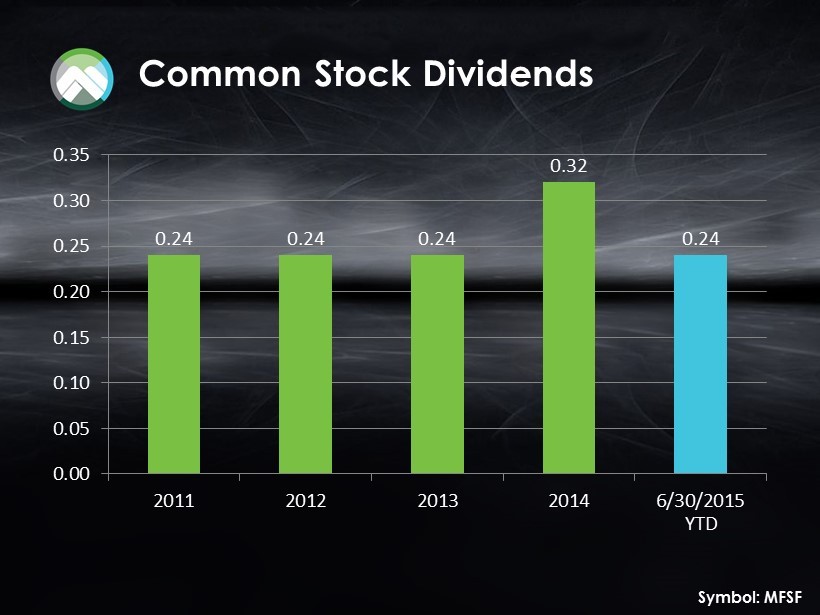
Common Stock Dividends 0.24 0.24 0.24 0.32 0.24 0.00 0.05 0.10 0.15 0.20 0.25 0.30 0.35 2011 2012 2013 2014 6/30/2015 Symbol: MFSF YTD
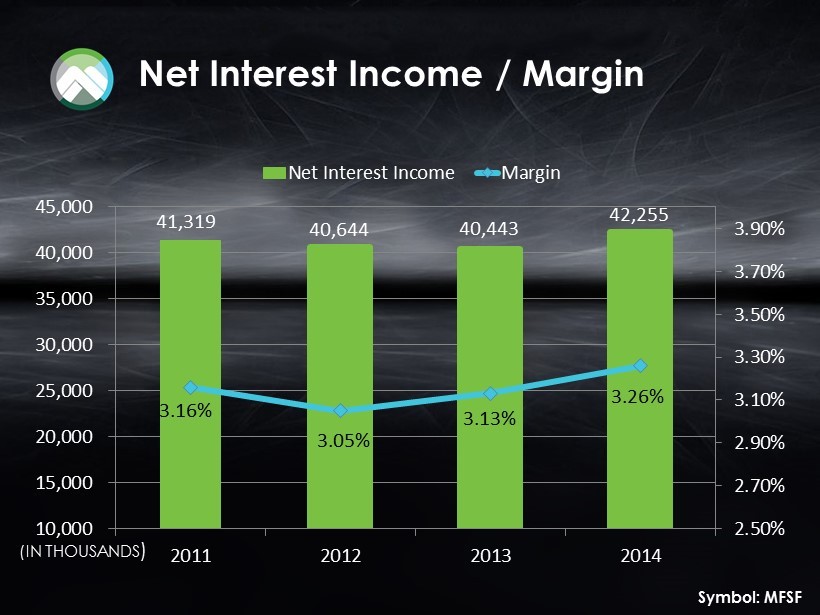
Net Interest Income / Margin 41,319 40,644 40,443 42,255 3.16% 3.05% 3.13% 3.26% 2.50% 2.70% 2.90% 3.10% 3.30% 3.50% 3.70% 3.90% 10,000 15,000 20,000 25,000 30,000 35,000 40,000 45,000 2011 2012 2013 2014 Net Interest Income Margin (IN THOUSANDS ) Symbol: MFSF
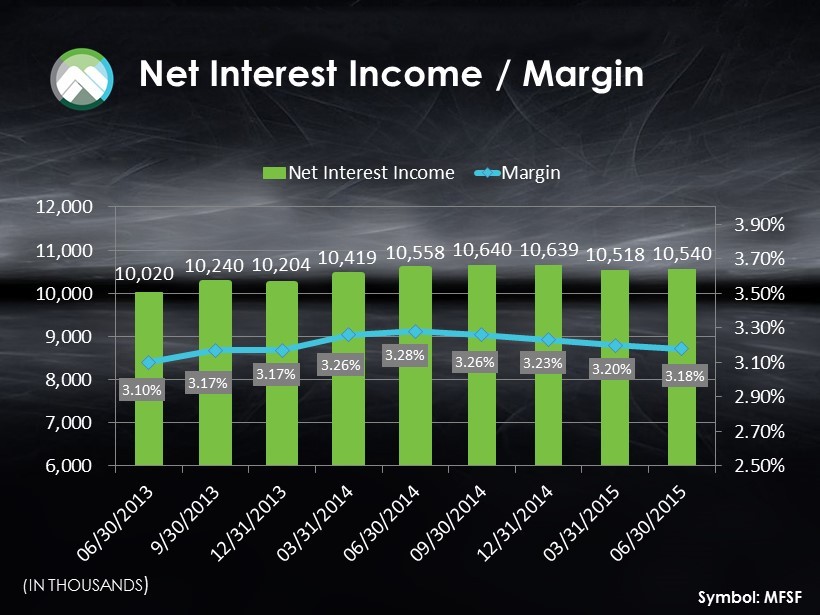
Net Interest Income / Margin 10,020 10,240 10,204 10,419 10,558 10,640 10,639 10,518 10,540 3.10% 3.17% 3.17% 3.26% 3.28% 3.26% 3.23% 3.20% 3.18% 2.50% 2.70% 2.90% 3.10% 3.30% 3.50% 3.70% 3.90% 6,000 7,000 8,000 9,000 10,000 11,000 12,000 Net Interest Income Margin (IN THOUSANDS ) Symbol: MFSF
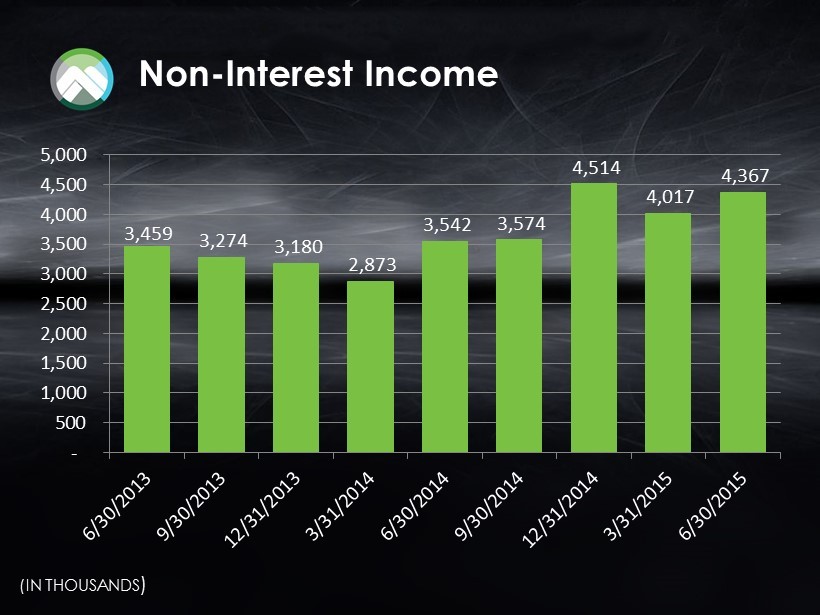
Non - Interest Income 3,459 3,274 3,180 2,873 3,542 3,574 4,514 4,017 4,367 - 500 1,000 1,500 2,000 2,500 3,000 3,500 4,000 4,500 5,000 (IN THOUSANDS )
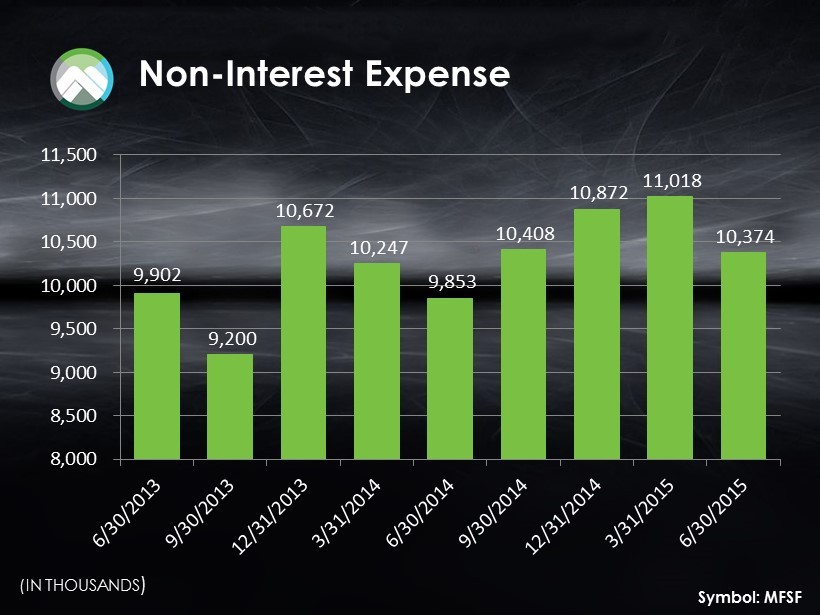
Non - Interest Expense 9,902 9,200 10,672 10,247 9,853 10,408 10,872 11,018 10,374 8,000 8,500 9,000 9,500 10,000 10,500 11,000 11,500 (IN THOUSANDS ) Symbol: MFSF
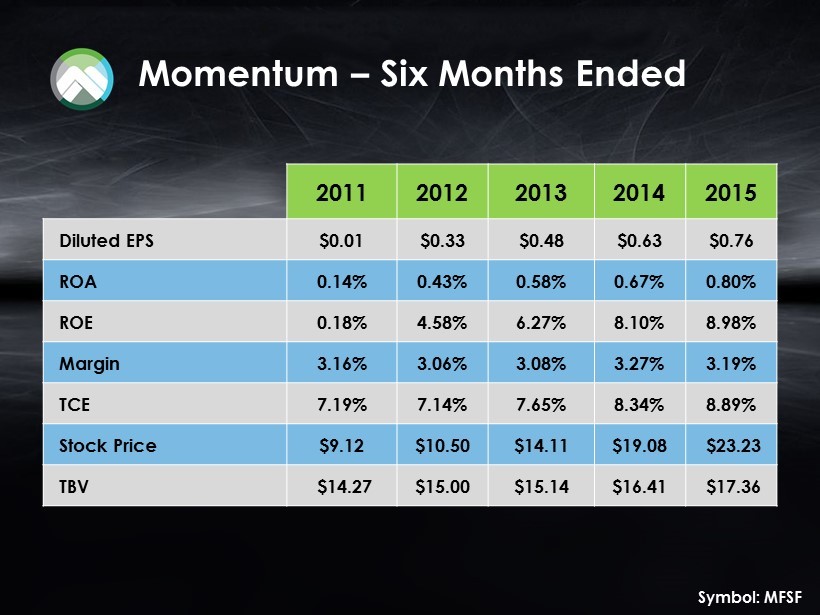
Momentum – Six Months Ended 2011 2012 2013 2014 2015 Diluted EPS $0.01 $0.33 $0.48 $0.63 $0.76 ROA 0.14% 0.43% 0.58% 0.67% 0.80% ROE 0.18% 4.58% 6.27% 8.10% 8.98% Margin 3.16% 3.06% 3.08% 3.27% 3.19% TCE 7.19% 7.14% 7.65% 8.34% 8.89% Stock Price $9.12 $10.50 $14.11 $19.08 $23.23 TBV $14.27 $15.00 $15.14 $16.41 $17.36 Symbol: MFSF

Traction & Movement 2015 - 2019 Strategic Plan

Where are we going? MutualVision How do we get there? MutualWay What are the rules of the road? MutualValues Strategic Plan

MutualVision We exist to help people live better lives While our specific route may change, our ultimate destination will not. Strategic Plan
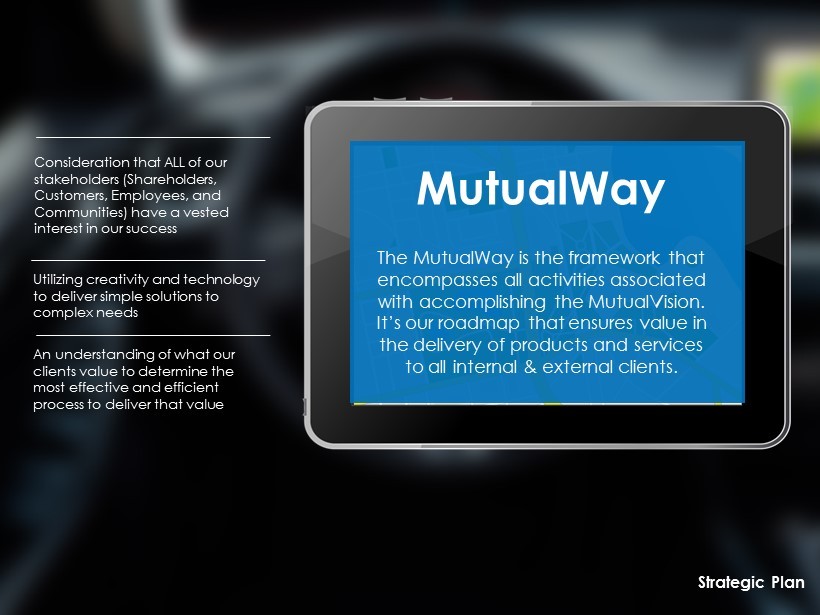
MutualWay The MutualWay is the framework that encompasses all activities associated with accomplishing the MutualVision. It’s our roadmap that ensures value in the delivery of products and services to all internal & external clients. Consideration that ALL of our stakeholders (Shareholders , Customers , Employees, and Communities) have a vested interest in our success Utilizing creativity and technology to deliver simple solutions to complex needs An understanding of what our clients value to determine the most effective and efficient process to deliver that value Strategic Plan

CHARACTER Any success that jeopardizes our integrity is worthless. Even when it’s difficult , we exercise the highest standard of ethics and seek to do the right thing, always. COMPASSION People don’t care about how much you know until they know how much you care. In other words, compassion is THE prerequisite to building trusted, loyal, and beneficial relationships with balance to all stakeholders. COMPETITION Like the most successful athletes, the most successful companies, are highly competitive. Our ultimate reward is the satisfaction of knowing that we’ve done our absolute best. CLASS Every experience stakeholders have with us, whether it’s in person, with advertising or online, will impact their perception of MutualBank. Therefore , we ensure that every M utualBank touch - point maintains and improves our reputation in the marketplace. MutualValues Strategic Plan

Our engine is the combination of all of our business components required to deliver quality products and services. They provide the horsepower needed to help people live better lives. Risk Management Strategic Plan

Risk Management They include: • Employees • Culture • Technology • Data • Delivery Systems • Infrastructure • Risk Management • Presence Strategic Plan
Financial Centers Phone Delivery Channels Strategic Plan

Online Mobile Delivery Channels Strategic Plan

Focus Areas

Our focus areas are the three broad categories of products and services we offer. They are the “lanes” we accelerate in and they all work together on the road to help people live better lives. Strategic Plan

Strategic Plan

Focus Area Goals FOCUS AREA GOALS TO REACH IN 5 YEARS Strategic Plan

Focus Area Goals • Grow Consumer Loan Balances • Grow Mortgage Market Share in Each of Our Markets • Grow Active DDA Accounts • Grow Annual Investment Income PERSONAL BANKING Strategic Plan

Focus Area Goals Increase Outstanding Loan Balances COMMERCIAL & BUSINESS BANKING Strategic Plan

Focus Area Goals WEALTH MANAGEMENT Strategic Plan • Increase Gross Revenue • Maintain Operating Margin
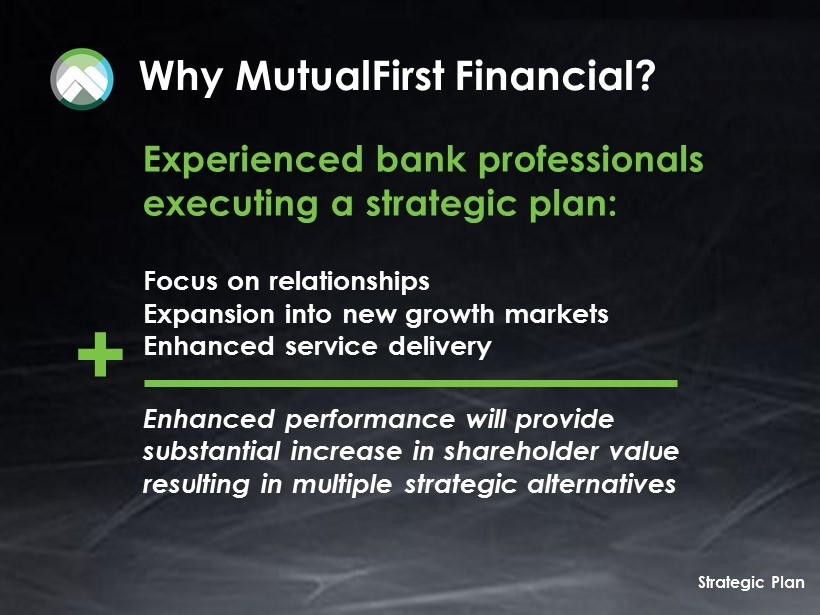
Strategic Plan Why MutualFirst Financial? Focus on relationships Expansion into new growth markets Enhanced service d elivery Enhanced performance will provide substantial increase in shareholder value resulting in multiple strategic alternatives Experienced bank professionals executing a strategic plan: +
KBW 2015 Community Bank Investor Conference July 28, 2015 Symbol: MFSF