Attached files
| file | filename |
|---|---|
| EX-99.1 - EXHIBIT 99.1 - FIRST BANCORP /PR/ | a51152719ex99_1.htm |
| 8-K - FIRST BANCORP. 8-K - FIRST BANCORP /PR/ | a51152719.htm |
Exhibit 99.2

Financial Results 2Q 2015
Forward-Looking Statements
This presentation contains “forward-looking statements” concerning First
BanCorp’s (the “Corporation”) future economic performance. The words or
phrases “would be,” “will allow,” “intends to,” “will likely result,”
“are expected to,” “expect,” “anticipate,” “look forward,” “should,”
“believes” and similar expressions are meant to identify
“forward-looking statements” within the meaning of Section 27A of the
Private Securities Litigation Reform Act of 1995, and are subject to the
safe harbor created by such section. The Corporation wishes to caution
readers not to place undue reliance on any such “forward-looking
statements,” which speak only as of the date made, and to advise readers
that various factors, including, but not limited to, uncertainty about
whether the Corporation and FirstBank Puerto Rico (“FirstBank” or “the
Bank”) will be able to fully comply with the written agreement dated
June 3, 2010 that the Corporation entered into with the Federal Reserve
Bank of New York (the “FED”) and the order dated June 2, 2010 (the
“Order”)that FirstBank entered into with the FDIC and the Office of the
Commissioner of Financial Institutions of Puerto Rico that, among other
things, require FirstBank to maintain certain capital levels and reduce
its special mention, classified, delinquent and non-performing assets;
the risk of being subject to possible additional regulatory actions;
uncertainty as to the availability of certain funding sources, such as
retail brokered CDs; the Corporation’s reliance on brokered CDs and its
ability to obtain, on a periodic basis, approval from the FDIC to issue
brokered CDs to fund operations and provide liquidity in accordance with
the terms of the Order; the risk of not being able to fulfill the
Corporation’s cash obligations or resume paying dividends to the
Corporation’s stockholders in the future due to the Corporation’s
inability to receive approval from the FED to receive dividends from
FirstBank or FirstBank’s failure to generate sufficient cash flow to
make a dividend payment to the Corporation; the strength or weakness of
the real estate markets and of the consumer and commercial credit
sectors and their impact on the credit quality of the Corporation’s
loans and other assets, including the Corporation’s construction and
commercial real estate loan portfolios, which have contributed and may
continue to contribute to, among other things, the high levels of
non-performing assets, charge-offs and the provision expense and may
subject the Corporation to further risk from loan defaults and
foreclosures; adverse changes in general economic conditions in the
United States and in Puerto Rico, including the interest rate scenario,
market liquidity, housing absorption rates, real estate prices and
disruptions in the U.S. capital markets, which may reduce interest
margins, impact funding sources and affect demand for all of the
Corporation’s products and services and the value of the Corporation’s
assets; an adverse change in the Corporation’s ability to attract new
clients and retain existing ones; a decrease in demand for the
Corporation’s products and services and lower revenues and earnings
because of the continued recession in Puerto Rico and the current fiscal
problems and budget deficit of the Puerto Rico government; uncertainty
about regulatory and legislative changes for financial services
companies in Puerto Rico, the United States and the U.S. and British
Virgin Islands, which could affect the Corporation’s financial
performance and could cause the Corporation’s actual results for future
periods to differ materially from prior results and anticipated or
projected results; uncertainty about the effectiveness of the various
actions undertaken to stimulate the United States economy and stabilize
the United States’ financial markets, and the impact such actions may
have on the Corporation’s business, financial condition and results of
operations; changes in the fiscal and monetary policies and regulations
of the federal government, including those determined by the Federal
Reserve System, the FDIC, government-sponsored housing agencies and
regulators in Puerto Rico and the U.S. and British Virgin Islands; the
risk of possible failure or circumvention of controls and procedures and
the risk that the Corporation’s risk management policies may not be
adequate; the risk that the FDIC may further increase the deposit
insurance premium and/or require special assessments to replenish its
insurance fund, causing an additional increase in the Corporation’s
non-interest expense; risks of not being able to recover the assets
pledged to Lehman Brothers Special Financing, Inc.; the impact on the
Corporation’s results of operations and financial condition associated
with acquisitions and dispositions; a need to recognize additional
impairments on financial instruments or goodwill relating to
acquisitions; risks that downgrades in the credit ratings of the
Corporation’s long-term senior debt will adversely affect the
Corporation’s ability to access necessary external funds; the impact of
the Dodd-Frank Wall Street Reform and Consumer Protection Act on the
Corporation’s businesses, business practices and cost of operations; and
general competitive factors and industry consolidation. The Corporation
does not undertake, and specifically disclaims any obligation, to update
any “forward-looking statements” to reflect occurrences or unanticipated
events or circumstances after the date of such statements except as
required by the federal securities laws. Investors should refer to the
Corporation’s Annual Report on Form 10-K for the year ended December 31,
2013 for a discussion of such factors and certain risks and
uncertainties to which the Corporation is subject.2

Agenda Second Quarter 2015 Highlights Aurelio Alemán, President & Chief Executive Officer Second Quarter 2015 Results of Operations Orlando Berges, Executive Vice President & Chief Financial Officer Questions & Answers 3

Key Highlights 4
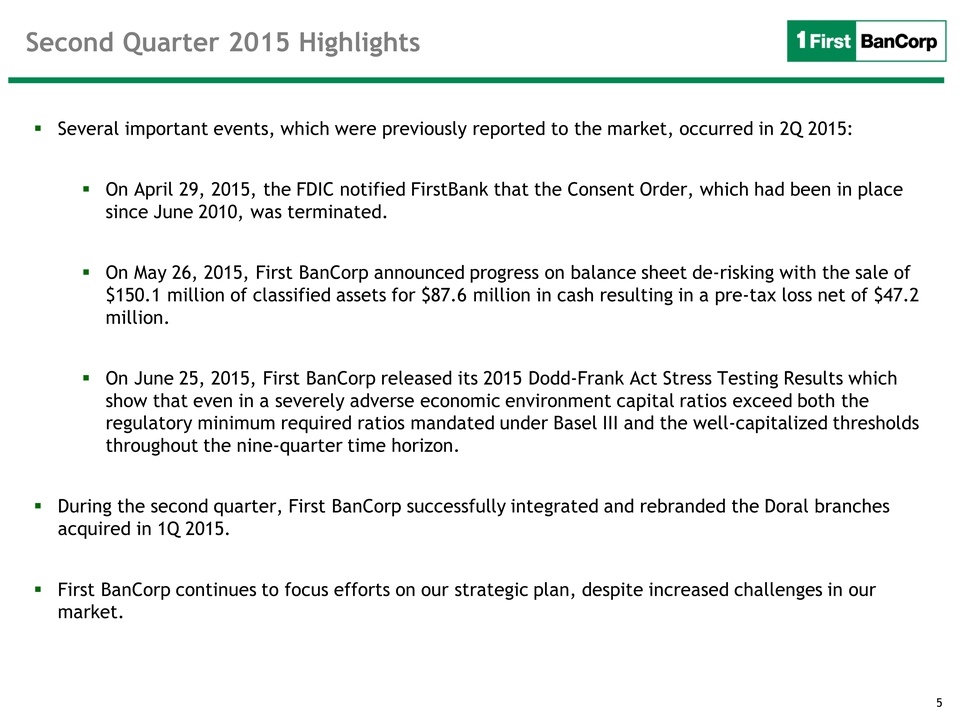
Several important
events, which were previously reported to the market, occurred in 2Q
2015: On April 29, 2015, the FDIC notified FirstBank that the Consent
Order, which had been in place since June 2010, was terminated. On May
26, 2015, First BanCorp announced progress on balance sheet de-risking
with the sale of $150.1 million of classified assets for $87.6 million
in cash resulting in a pre-tax loss net of $47.2 million. On June 25,
2015, First BanCorp released its 2015 Dodd-Frank Act Stress Testing
Results which show that even in a severely adverse economic environment
capital ratios exceed both the regulatory minimum required ratios
mandated under Basel III and the well-capitalized thresholds throughout
the nine-quarter time horizon. During the second quarter, First BanCorp
successfully integrated and rebranded the Doral branches acquired in 1Q
2015. First BanCorp continues to focus efforts on our strategic plan,
despite increased challenges in our market. Second Quarter 2015
Highlights 5
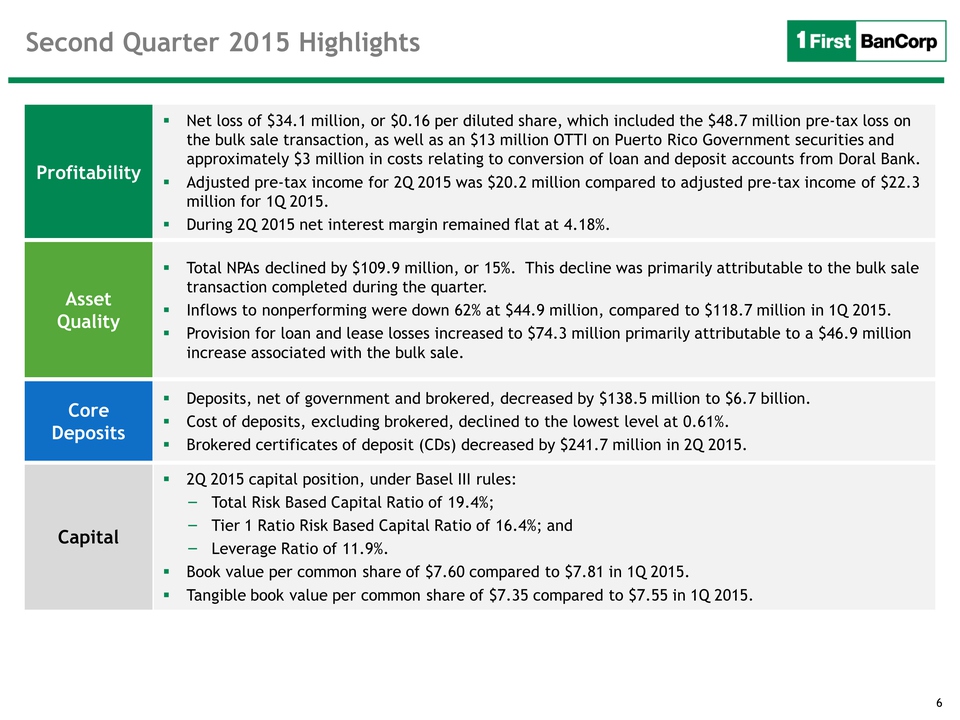
Profitability Net loss of
$34.1 million, or $0.16 per diluted share, which included the $48.7
million pre-tax loss on the bulk sale transaction, as well as an $13
million OTTI on Puerto Rico Government securities and approximately $3
million in costs relating to conversion of loan and deposit accounts
from Doral Bank. Adjusted pre-tax income for 2Q 2015 was $20.2 million
compared to adjusted pre-tax income of $22.3 million for 1Q 2015. During
2Q 2015 net interest margin remained flat at 4.18%. Asset Quality Total
NPAs declined by $109.9 million, or 15%. This decline was primarily
attributable to the bulk sale transaction completed during the quarter.
Inflows to nonperforming were down 62% at $44.9 million, compared to
$118.7 million in 1Q 2015. Provision for loan and lease losses increased
to $74.3 million primarily attributable to a $46.9 million increase
associated with the bulk sale. Core Deposits Deposits, net of government
and brokered, decreased by $138.5 million to $6.7 billion. Cost of
deposits, excluding brokered, declined to the lowest level at 0.61%.
Brokered certificates of deposit (CDs) decreased by $241.7 million in 2Q
2015. Capital 2Q 2015 capital position, under Basel III rules: Total
Risk Based Capital Ratio of 19.4%; Tier 1 Ratio Risk Based Capital Ratio
of 16.4%; and Leverage Ratio of 11.9%. Book value per common share of
$7.60 compared to $7.81 in 1Q 2015. Tangible book value per common share
of $7.35 compared to $7.55 in 1Q 2015. 6
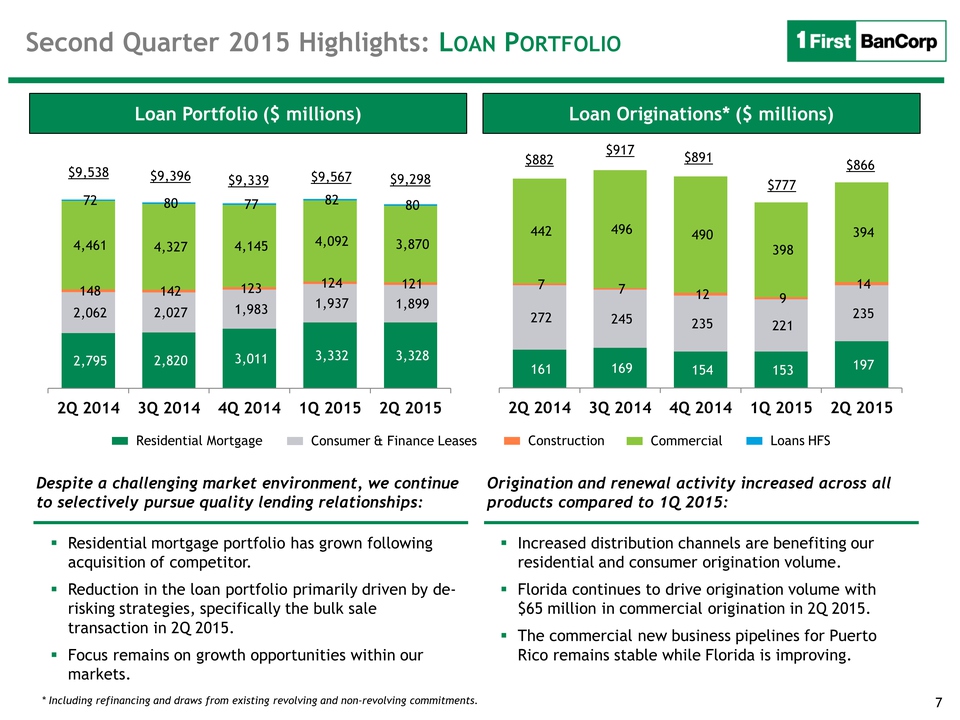
Loan Portfolio ($ millions)
2,795 2,820 3,011 3,332 3,328 2,062 2,027 1,983 1,937 1,899 148 142 123
124 121 4,461 4,327 4,145 4,092 3,870 72 80 77 82 80 2Q 2014 3Q 2014 4Q
2014 1Q 2015 2Q 2015$9,538 $9,396 $9,339 $9,567 161 169 154 153 197 272
245 235 221 235 7 7 12 9 14 442 496 490 398 394 2Q 2014 3Q 2014 4Q 2014
1Q 2015 2Q 2015$882 $917 $891 $777 Residential Mortgage Consumer &
Finance Leases Construction Commercial Loans HFS Residential mortgage
portfolio has grown following acquisition of competitor. Reduction in
the loan portfolio primarily driven by de-risking strategies,
specifically the bulk sale transaction in 2Q 2015. Focus remains on
growth opportunities within our markets. Increased distribution channels
are benefiting our residential and consumer origination volume. Florida
continues to drive origination volume with $65 million in commercial
origination in 2Q 2015. The commercial new business pipelines for Puerto
Rico remains stable while 7
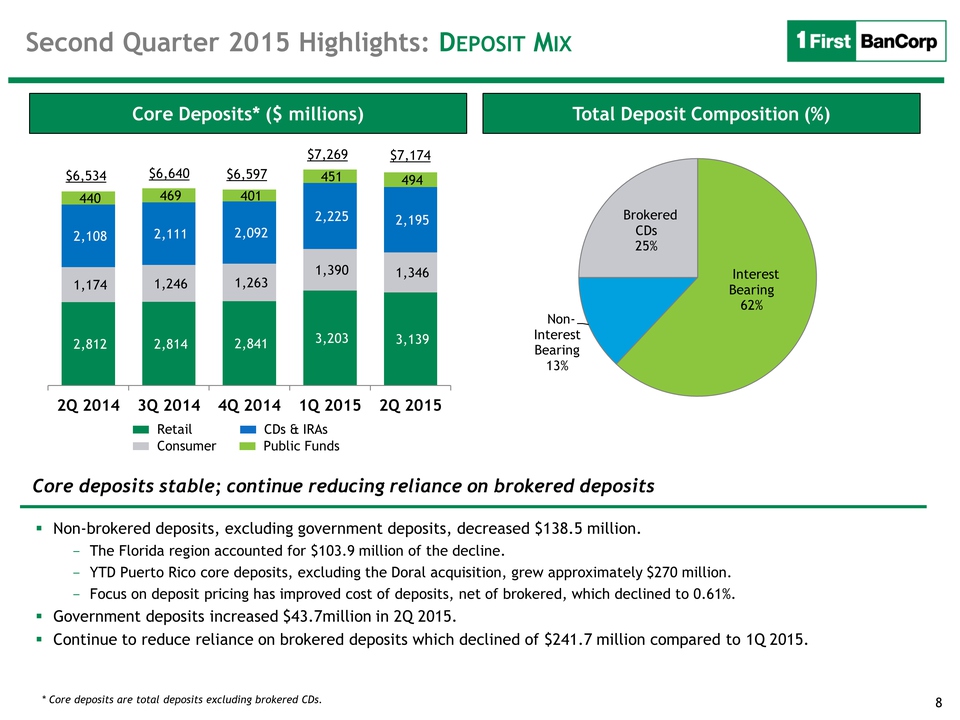
Core Deposits* ($ millions)
2,812 2,814 2,841 3,203 3,139 1,174 1,246 1,263 1,390 1,346 2,108 2,111
2,092 2,225 2,195 440 469 401 451 494 2Q 2014 3Q 2014 4Q 2014 1Q 2015 2Q
2015 * Core deposits are total deposits excluding brokered CDs. $6,534
$6,640 $6,597 $7,269 Total Deposit Composition(%) Interest Bearing 62%
Non-Interest Bearing 13% Brokered CDs 25% Non-brokered deposits,
excluding government deposits, decreased $138.5 million. The Florida
region accounted for $103.9 million of the decline. YTD Puerto Rico core
deposits, excluding the Doral acquisition, grew approximately $270
million. Focus on deposit pricing has improved cost of deposits, net of
brokered, which declined to 0.61%. Government deposits increased
$43.7million in 2Q 2015. Continue to reduce reliance on brokered
deposits which declined of $241.7 million compared to 1Q 2015. 8
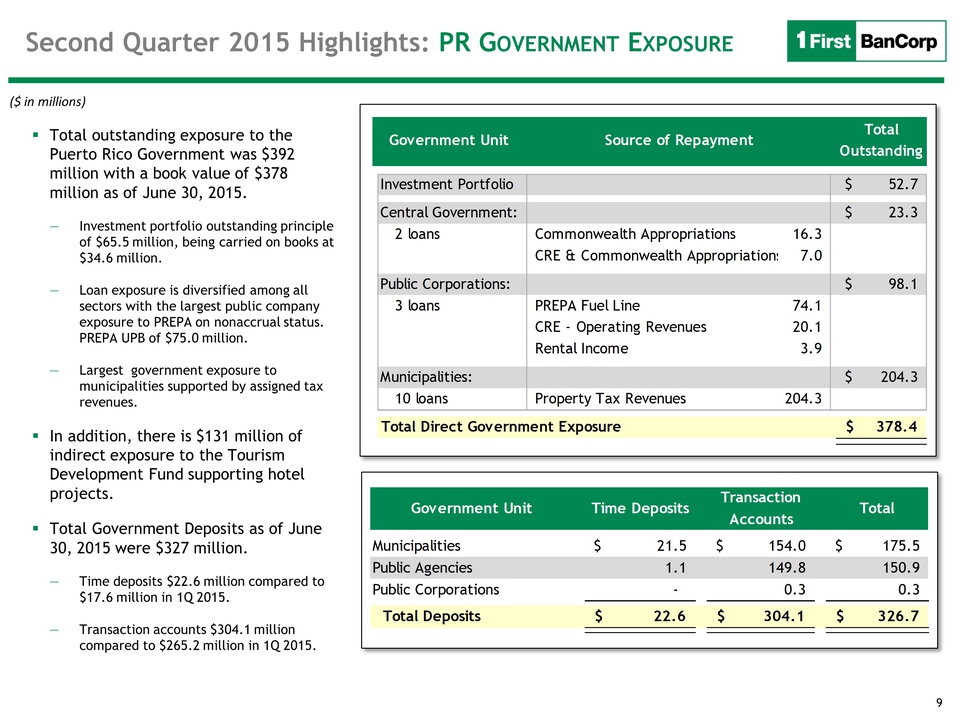
9 Second Quarter 2015
Highlights: PR GOVERNMENT EXPOSURE Total outstanding exposure to the
Puerto Rico Government was $392 million with a book value of $378
million as of June 30, 2015. Investment portfolio outstanding principle
of $65.5 million, being carried on books at $34.6 million. Loan exposure
is diversified among all sectors with the largest public company
exposure to PREPA on nonaccrual status. PREPA UPB of $75.0 million.
Largest government exposure to municipalities supported by assigned tax
revenues. In addition, there is $131 million of indirect exposure to the
Tourism Development Fund supporting hotel projects. Total Government
Deposits as of June 30, 2015 were $327 million. Time deposits $22.6
million compared to $17.6 million in 1Q 2015. Transaction accounts
$304.1 million compared to $265.2 million in 1Q 2015. ($ in millions)
Government UnitTime DepositsTransaction AccountsTotalMunicipalities21.5$
154.0$ 175.5$ Public Agencies1.1 149.8 150.9 Public Corporations- 0.3
0.3 Total Deposits22.6$ 304.1$ 326.7$ Investment Portfolio52.7$ Central
Government:23.3$ 2 loans16.37.0Public Corporations:98.1$ 3 loans74.1CRE
- Operating Revenues20.13.9Municipalities:204.3$ 10 loans204.3Total
Direct Government Exposure378.4$ Government UnitSource of RepaymentTotal
OutstandingProperty Tax RevenuesCommonwealth AppropriationsCRE &
Commonwealth AppropriationsPREPA Fuel LineRental Income

Results of Operations 10
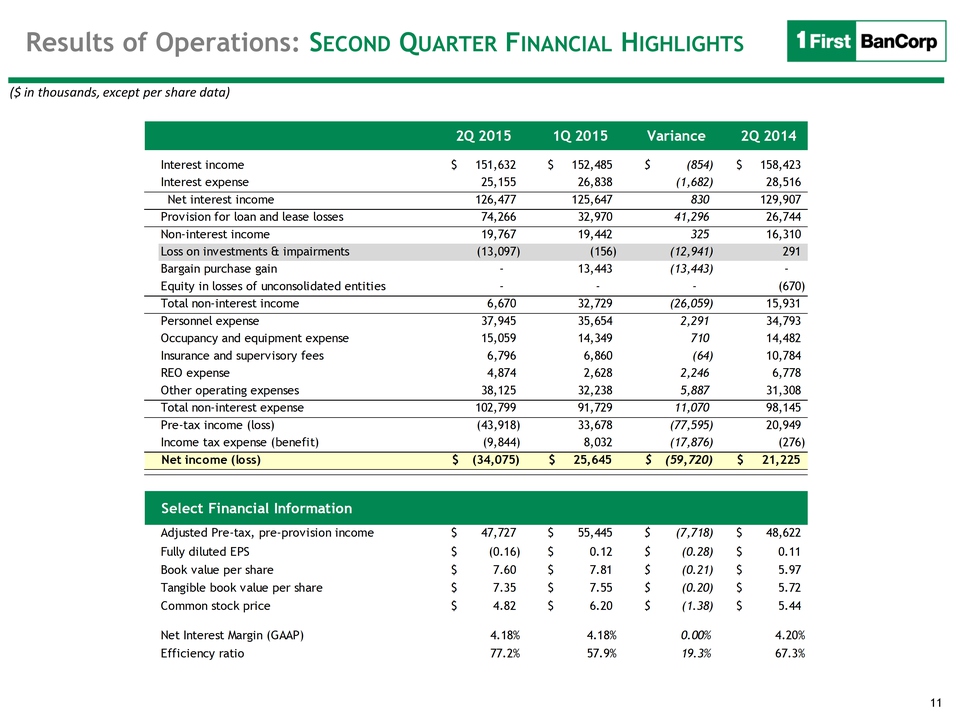
Results of Operations:
SECOND QUARTER FINANCIAL HIGHLIGHTS ($ in thousands, except per share
data) Select Financial Information 2Q 20151Q 2015Variance2Q 2014Interest
income151,632$ 152,485$ (854)$ 158,423$ Interest expense25,155 26,838
(1,682) 28,516 Net interest income126,477 125,647 830 129,907 Provision
for loan and lease losses74,266 32,970 41,296 26,744 Non-interest
income19,767 19,442 325 16,310 Loss on investments & impairments(13,097)
(156) (12,941) 291 Bargain purchase gain- 13,443 (13,443) - Equity in
losses of unconsolidated entities- - - (670) Total non-interest
income6,670 32,729 (26,059) 15,931 Personnel expense37,945 35,654 2,291
34,793 Occupancy and equipment expense15,059 14,349 710 14,482 Insurance
and supervisory fees6,796 6,860 (64) 10,784 REO expense4,874 2,628 2,246
6,778 Other operating expenses38,125 32,238 5,887 31,308 Total
non-interest expense102,799 91,729 11,070 98,145 Pre-tax income
(loss)(43,918) 33,678 (77,595) 20,949 Income tax expense
(benefit)(9,844) 8,032 (17,876) (276) Net income (loss)(34,075)$ 25,645$
(59,720)$ 21,225$ Select Financial InformationAdjusted Pre-tax,
pre-provision income47,727$ 55,445$ (7,718)$ 48,622$ Fully diluted
EPS(0.16)$ 0.12$ (0.28)$ 0.11$ Book value per share7.60$ 7.81$ (0.21)$
5.97$ Tangible book value per share7.35$ 7.55$ (0.20)$ 5.72$ Common
stock price4.82$ 6.20$ (1.38)$ 5.44$ Net Interest Margin
(GAAP)4.18%4.18%0.00%4.20%Efficiency ratio77.2%57.9%19.3%67.3% 11
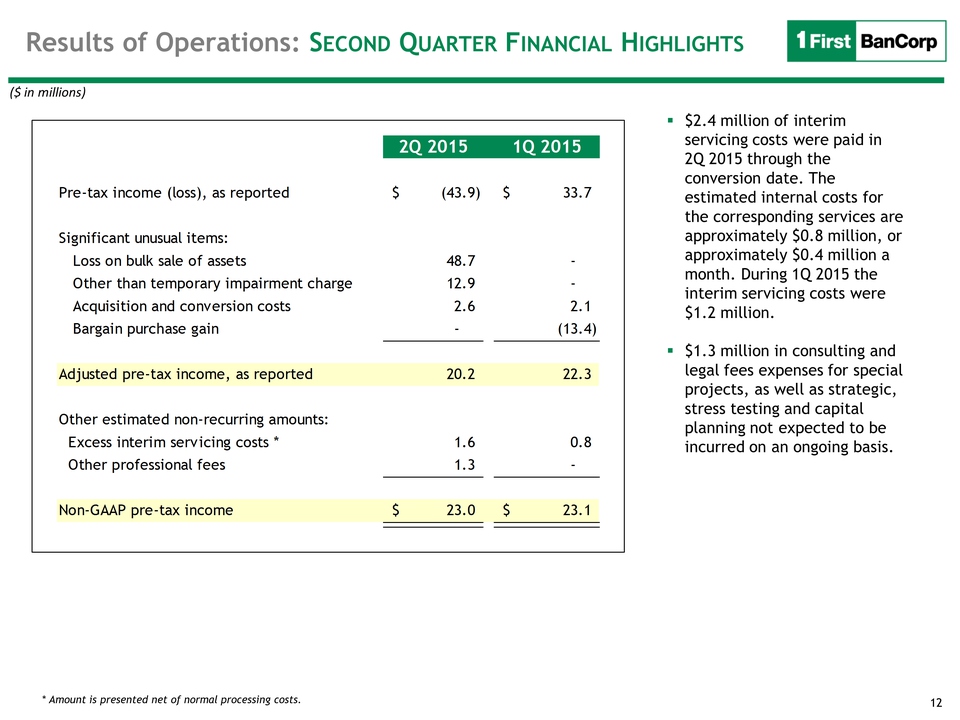
12 Results of
Operations: SECOND QUARTER FINANCIAL HIGHLIGHTS ($ in millions) $2.4
million of interim servicing costs were paid in 2Q 2015 through the
conversion date. The estimated internal costs for the corresponding
services are approximately $0.8 million, or approximately $0.4 million a
month. During 1Q 2015 the interim servicing costs were $1.2 million.
$1.3 million in consulting and legal fees expenses for special projects,
as well as strategic, stress testing and capital planning not expected
to be incurred on an ongoing basis. * Amount is presented net of normal
processing costs. 2Q 20151Q 2015Pre-tax income (loss), as
reported(43.9)$ 33.7$ Significant unusual items: Loss on bulk sale of
assets48.7 - Other than temporary impairment charge12.9 - Acquisition
and conversion costs2.6 2.1 Bargain purchase gain- (13.4) Adjusted
pre-tax income, as reported20.2 22.3 Other estimated non-recurring
amounts: Excess interim servicing costs *1.6 0.8 Other professional
fees1.3 - Non-GAAP pre-tax income23.0$ 23.1$
13 Key Highlights
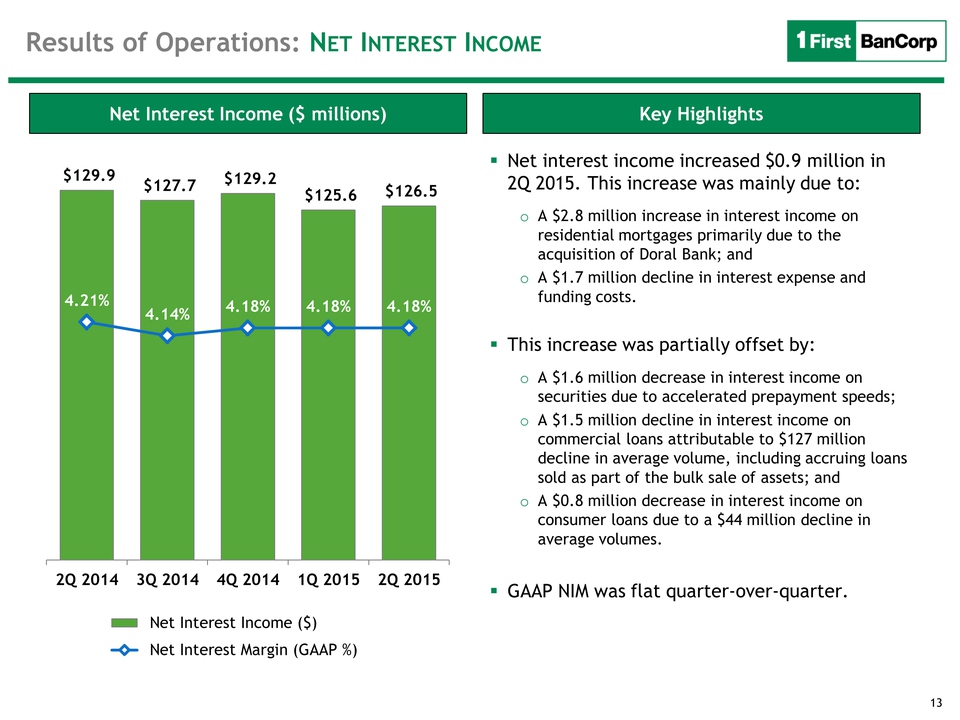
Net Interest Income ($ millions) $129.9 $127.7 $129.2 $125.6 $126.5
4.21% 4.14% 4.18% 4.18% 4.18% 2Q 2014 3Q 2014 4Q 2014 1Q 2015 2Q 2015
Net Interest Income ($) Net Interest Margin (GAAP %) Net interest income
increased $0.9 million in 2Q 2015. This increase was mainly due to: A
$2.8 million increase in interest income on residential mortgages
primarily due to the acquisition of Doral Bank; and A $1.7 million
decline in interest expense and funding costs. This increase was
partially offset by: A $1.6 million decrease in interest income on
securities due to accelerated prepayment speeds; A $1.5 million decline
in interest income on commercial loans attributable to $127 million
decline in average volume, including accruing loans sold as part of the
bulk sale of assets; and A $0.8 million decrease in interest income on
consumer loans due to a $44 million decline in average volumes. GAAP NIM
was flat quarter-over-quarter. Results of Operations: NET INTEREST INCOME
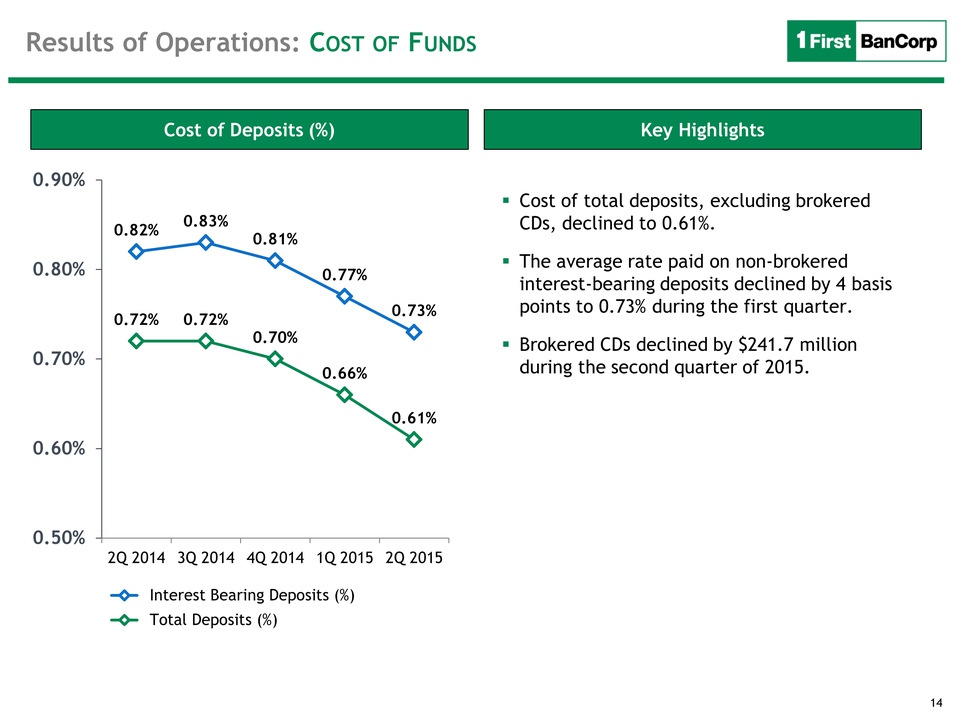
14 Key Highlights Cost of
Deposits (%) 0.82% 0.83% 0.81% 0.77% 0.73% 0.72% 0.72% 0.70% 0.66% 0.61%
0.50% 0.60% 0.70% 0.80% 0.90% 2Q 2014 3Q 2014 4Q 2014 1Q 2015 2Q 2015
Interest Bearing Deposits (%) Total Deposits (%) Cost of total deposits,
excluding brokered CDs, declined to 0.61%. The average rate paid on
non-brokered interest-bearing deposits declined by 4 basis points to
0.73% during the first quarter. Brokered CDs declined by $241.7 million
during the second quarter of 2015. Results of Operations: COST OF FUNDS
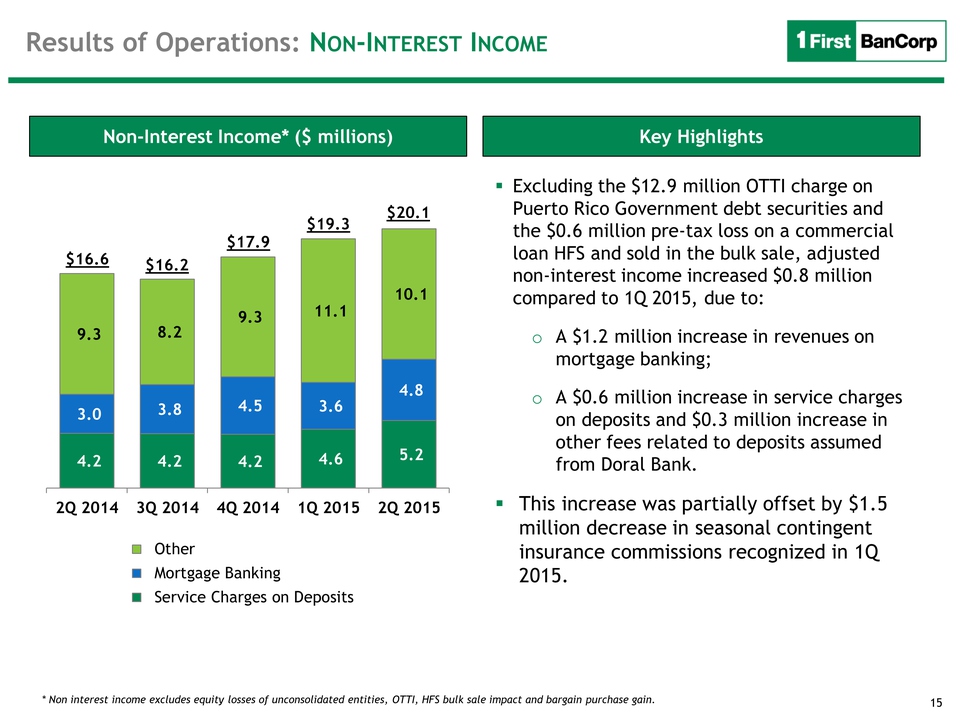
Non-Interest Income* ($
millions) 4.2 4.2 4.2 4.6 5.2 3.0 3.8 4.5 3.6 4.8 9.3 8.2 9.3 11.1 10.1
2Q 2014 3Q 2014 4Q 2014 1Q 2015 2Q 2015 Other Mortgage Banking Service
Charges on Deposits * Non interest income excludes equity losses of
unconsolidated entities, OTTI, HFS bulk sale impact and bargain purchase
gain. Excluding the $12.9 million OTTI charge on Puerto Rico Government
debt securities and the $0.6 million pre-tax loss on a commercial loan
HFS and sold in the bulk sale, adjusted non-interest income increased
$0.8 million compared to 1Q 2015, due to: A $1.2 million increase in
revenues on mortgage banking; A $0.6 million increase in service charges
on deposits and $0.3 million increase in other fees related to deposits
assumed from Doral Bank. This increase was partially offset by $1.5
million decrease in seasonal contingent insurance commissions recognized
in 1Q 15
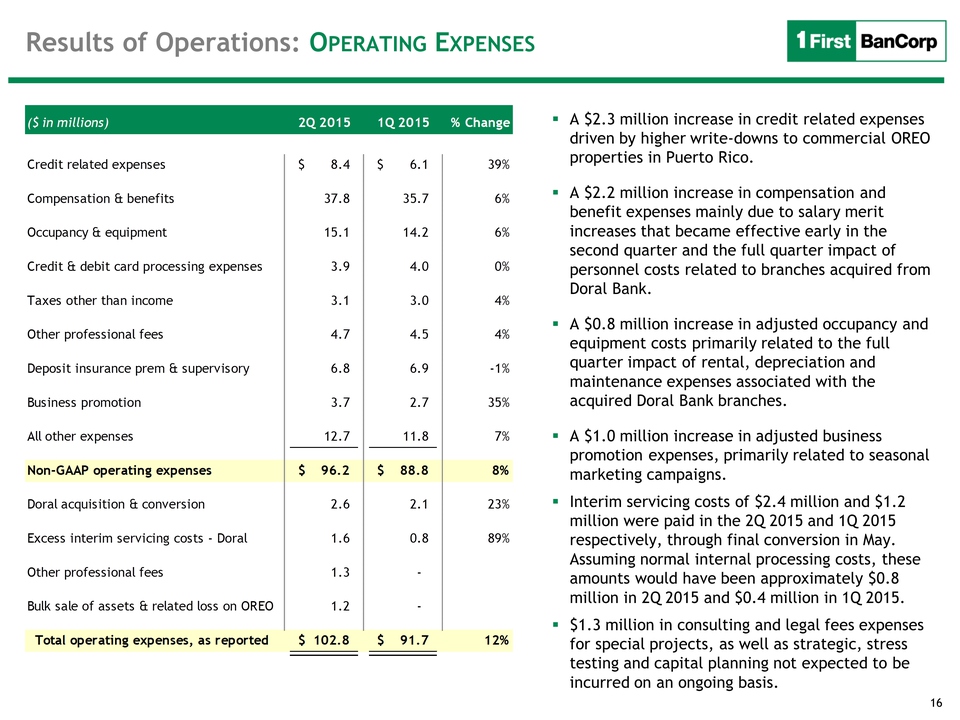
Results of Operations:
OPERATING EXPENSES A $2.3 million increase in credit related expenses
driven by higher write-downs to commercial OREO properties in Puerto
Rico. A $2.2 million increase in compensation and benefit expenses
mainly due to salary merit increases that became effective early in the
second quarter and the full quarter impact of personnel costs related to
branches acquired from Doral Bank. A $0.8 million increase in adjusted
occupancy and equipment costs primarily related to the full quarter
impact of rental, depreciation and maintenance expenses associated with
the acquired Doral Bank branches. A $1.0 million increase in adjusted
business promotion expenses, primarily related to seasonal marketing
campaigns. Interim servicing costs of $2.4 million and $1.2 million were
paid in the 2Q 2015 and 1Q 2015 respectively, through final conversion
in May. Assuming normal internal processing costs, these amounts would
have been approximately $0.8 million in 2Q 2015 and $0.4 million in 1Q
2015. $1.3 million in consulting and legal fees expenses for special
projects, as well as strategic, stress testing and capital planning not
expected to be incurred on an ongoing basis. ($ in millions)2Q 20151Q
2015% ChangeCredit related expenses8.4$ 6.1$ 39%Compensation &
benefits37.8 35.7 6%Occupancy & equipment15.1 14.2 6%Credit & debit card
processing expenses3.9 4.0 0%Taxes other than income3.1 3.0 4%Other
professional fees4.7 4.5 4%Deposit insurance prem & supervisory6.8 6.9
-1%Business promotion3.7 2.7 35%All other expenses12.7 11.8 7%Non-GAAP
operating expenses96.2$ 88.8$ 8%Doral acquisition & conversion2.6 2.1
23%Excess interim servicing costs - Doral1.6 0.8 89%Other professional
fees1.3 - Bulk sale of assets & related loss on OREO1.2 - Total
operating expenses, as reported102.8$ 91.7$ 12% 16
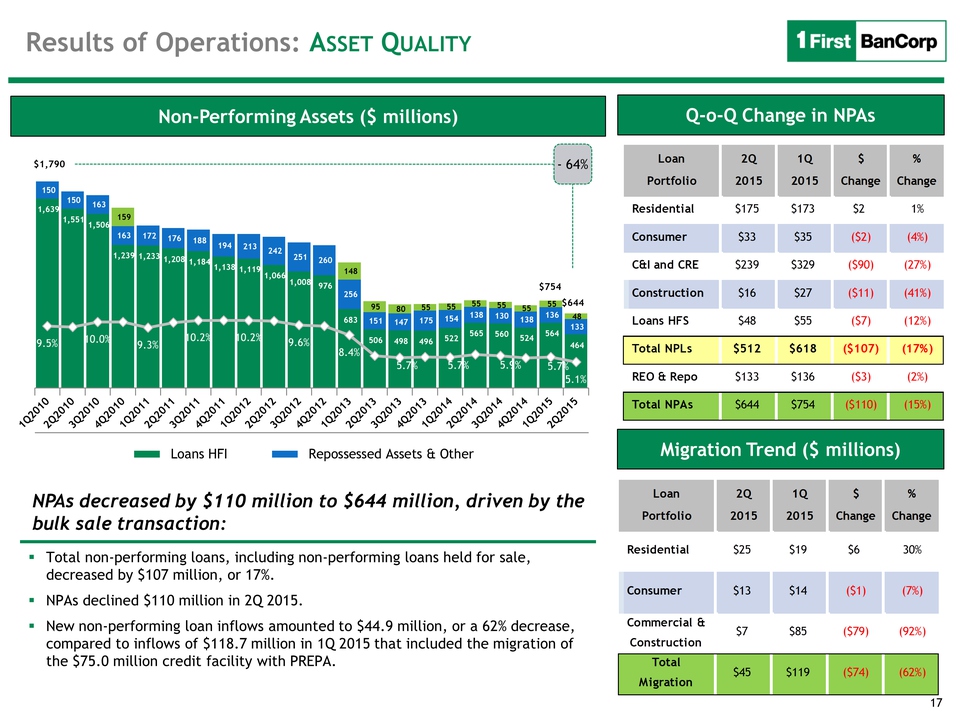
17 Non-Performing Assets ($
millions) 1,639 1,551 1,506 1,239 1,233 1,208 1,184 1,138 1,119 1,066
1,008 976 683 506 498 496 522 565 560 524 564 464 150 150 163 163 172
176 188 194 213 242 251 260 256 151 147 175 154 138 130 138 136 133 159
148 95 80 55 55 55 55 55 55 48 9.5% 10.0% 9.3% 10.2% 10.2% 9.6% 8.4%
5.7% 5.7% 5.9% 5.7% 5.1% Loans HFI Repossessed Assets & Other $1,790
$754 - 64% Total non-performing loans, including non-performing loans
held for sale, decreased by $107 million, or 17%. NPAs declined $110
million in 2Q 2015. New non-performing loan inflows amounted to $44.9
million, or a 62% decrease, compared to inflows of $118.7 million in 1Q
2015 that included the migration of the $75.0 million credit facility
with PREPA. NPAs decreased by $110 million to $644 million, driven by
the bulk sale transaction: Results of Operations: ASSET QUALITY Q-o-Q
Change in NPAs Migration Trend ($ millions) $644
Loan2Q1Q$%Portfolio20152015ChangeChangeResidential$175$173$21%Consumer$33$35($2)(4%)C&I
and CRE$239$329($90)(27%)Construction$16$27($11)(41%)Loans
HFS$48$55($7)(12%)Total NPLs$512$618($107)(17%)REO &
Repo$133$136($3)(2%)Total
NPAs$644$754($110)(15%)Loan2Q1Q$%Portfolio20152015ChangeChangeResidential$25$19$630%Consumer$13$14($1)(7%)$7$85($79)(92%)$45$119($74)(62%)Commercial
& ConstructionTotal Migration
18 Key Highlights
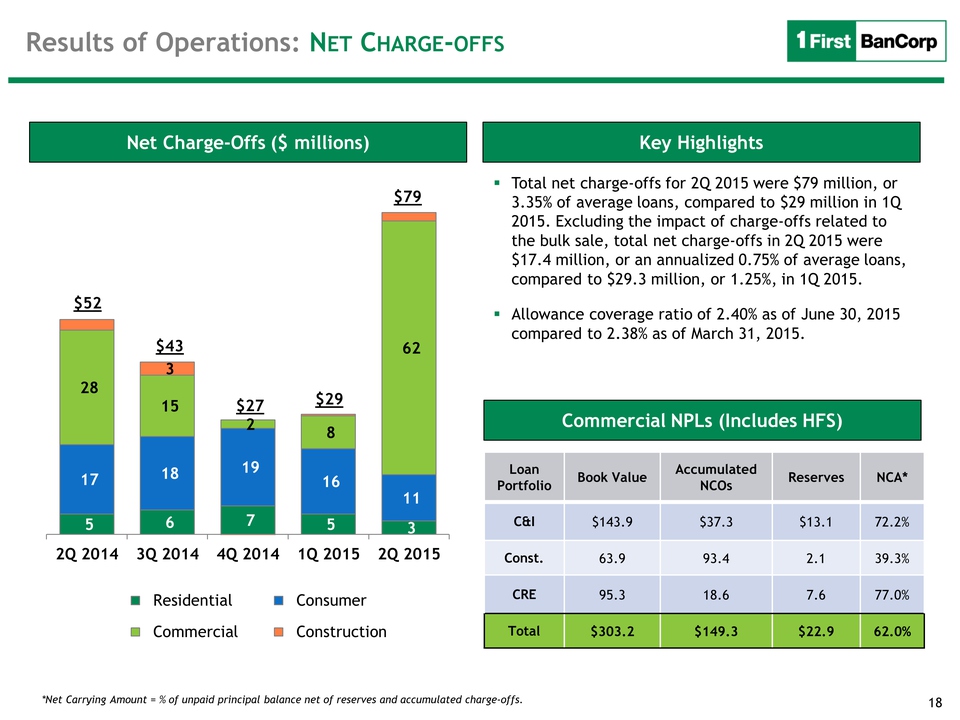
Net Charge-Offs ($ millions) 6 5 17 18 19 16 11 28 15 8 62 2Q 2014 3Q
2014 4Q 2014 1Q 2015 2Q 2015 Residential Consumer Commercial
Construction Total net charge-offs for 2Q 2015 were $79 million, or
3.35% of average loans, compared to $29 million in 1Q 2015. Excluding
the impact of charge-offs related to the bulk sale, total net
charge-offs in 2Q 2015 were $17.4 million, or an annualized 0.75% of
average loans, compared to $29.3 million, or 1.25%, in 1Q 2015.
Allowance coverage ratio of 2.40% as of June 30, 2015 compared to 2.38%
as of March 31, 2015. Loan Portfolio Book Value Accumulated NCOs
Reserves NCA* C&I $143.9 $37.3 $13.1 72.2% Const. 63.9 93.4 2.1 39.3%
CRE 95.3 18.6 7.6 77.0% Total $303.2 $149.3 $22.9 62.0% $52 $43 $27 $29
Commercial NPLs (Includes HFS) *Net Carrying Amount = % of unpaid
principal balance net of reserves and accumulated charge-offs. Results
of Operations: NET CHARGE-OFFS $79
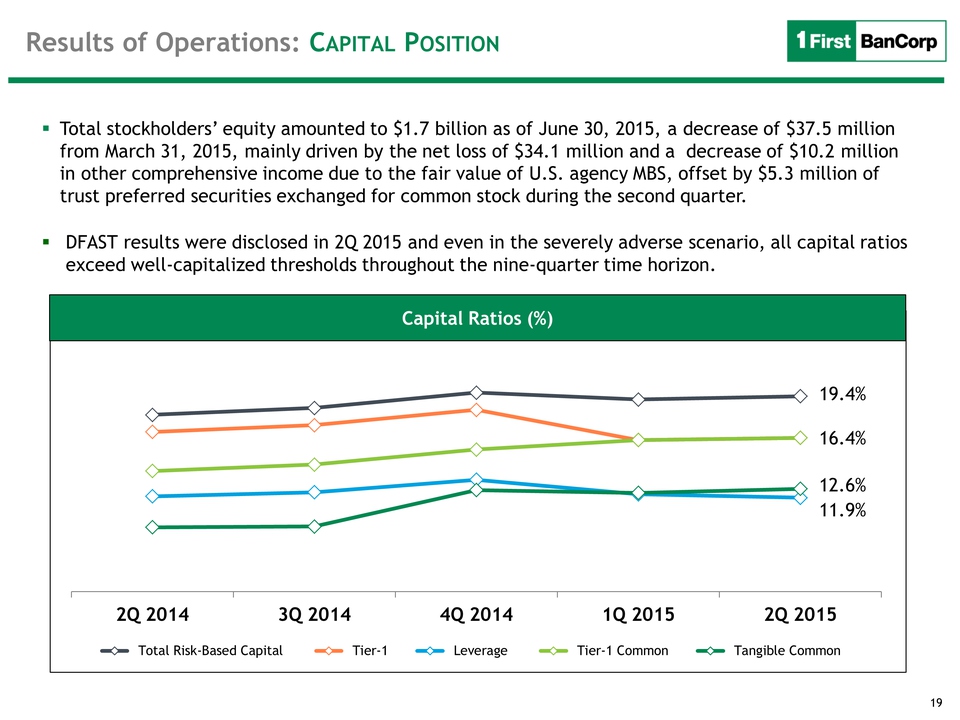
19 Results of Operations:
CAPITAL POSITION Capital Ratios (%) Total stockholders’ equity amounted
to $1.7 billion as of June 30, 2015, a decrease of $37.5 million from
March 31, 2015, mainly driven by the net loss of $34.1 million and a
decrease of $10.2 million in other comprehensive income due to the fair
value of U.S. agency MBS, offset by $5.3 million of trust preferred
securities exchanged for common stock during the second quarter. DFAST
results were disclosed in 2Q 2015 and even in the severely adverse
scenario, all capital ratios exceed well-capitalized thresholds
throughout the nine-quarter time horizon. Capital Ratios (%) 19.4% 11.9%
16.4% 12.6% 2Q 2014 3Q 2014 4Q 2014 1Q 2015 2Q 2015 Total Risk-Based
Capital Tier-1 Leverage Tier-1 Common Tangible Common
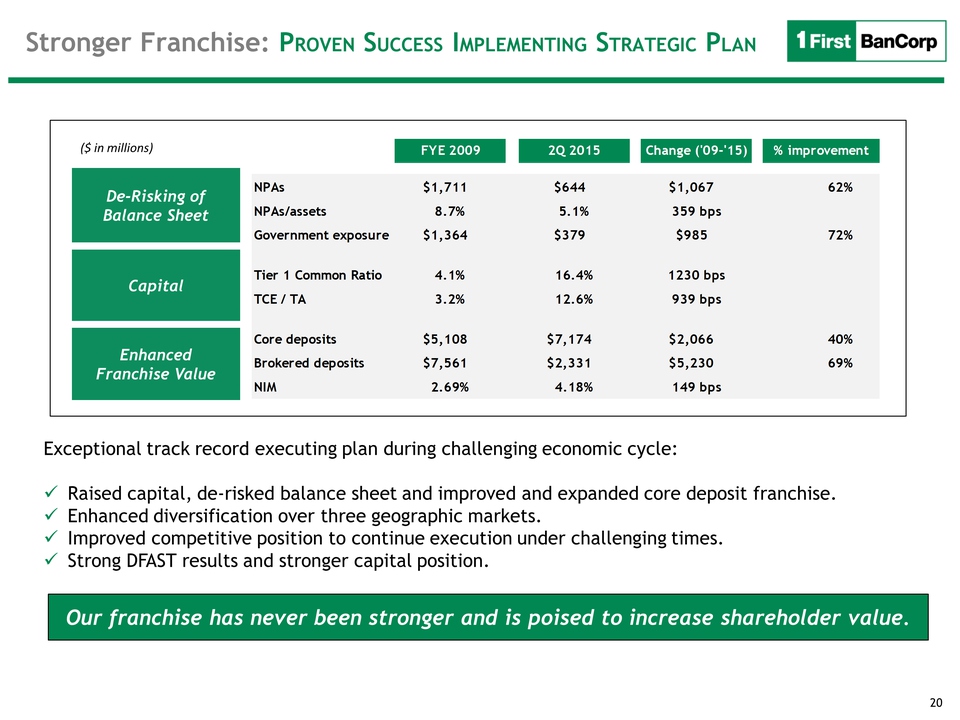
20 Capital Ratios
(%) Exceptional track record executing plan during challenging economic
cycle: Raised capital, de-risked balance sheet and improved and expanded
core deposit franchise. Enhanced diversification over three geographic
markets. Improved competitive position to continue execution under
challenging times. Strong DFAST results and stronger capital position.
Stronger Franchise: PROVEN SUCCESS IMPLEMENTING STRATEGIC PLAN
De-Risking of Balance Sheet Capital Enhanced Franchise Value ($ in
millions) Our franchise has never been stronger and is poised to
increase shareholder value. FYE 20092Q 2015Change ('09-'15)%
improvementNPAs$1,711$644$1,06762%NPAs/assets8.7%5.1%359 bpsGovernment
exposure$1,364$379$98572%Tier 1 Common Ratio4.1%16.4%1230 bpsTCE /
TA3.2%12.6%939 bpsCore deposits$5,108$7,174$2,06640%Brokered
deposits$7,561$2,331$5,23069%NIM2.69%4.18%149 bps

Q & A 21

Exhibits 22
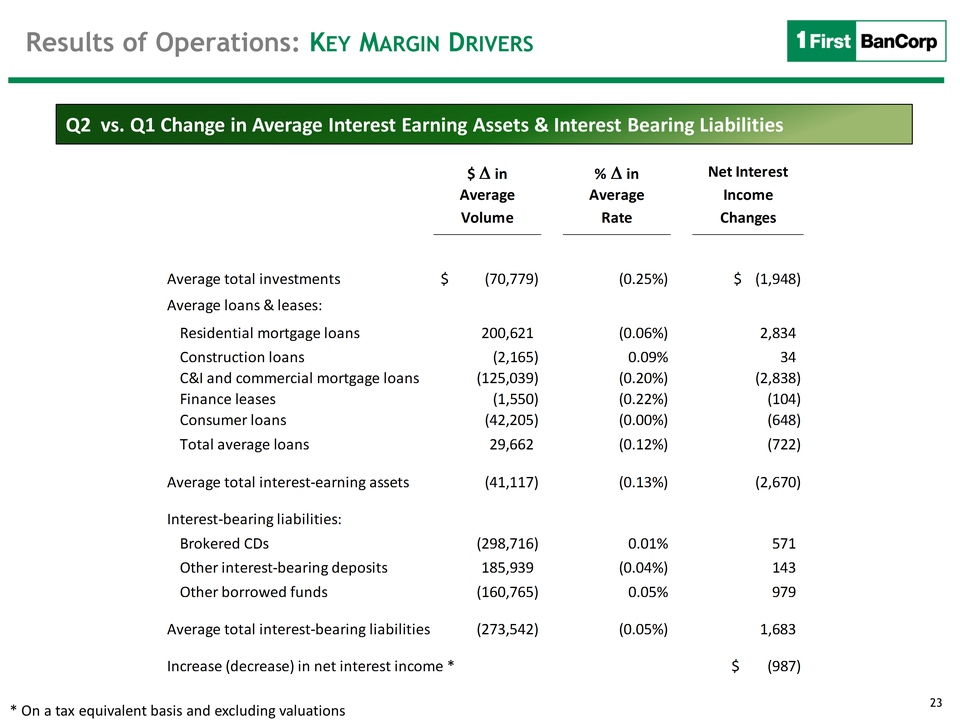
23 Results of Operations:
KEY MARGIN DRIVERS Q2 vs. Q1 Change in Average Interest Earning Assets &
Interest Bearing Liabilities * On a tax equivalent basis and excluding
valuations $ Δ in % Δ in AverageAverageVolumeRateAverage total
investments(70,779)$ (0.25%)(1,948)$ Average loans & leases:Residential
mortgage loans200,621 (0.06%)2,834 Construction loans(2,165) 0.09%34 C&I
and commercial mortgage loans(125,039) (0.20%)(2,838) Finance
leases(1,550) (0.22%)(104) Consumer loans(42,205) (0.00%)(648) Total
average loans29,662 (0.12%)(722) Average total interest-earning
assets(41,117) (0.13%)(2,670) Interest-bearing liabilities:Brokered
CDs(298,716) 0.01%571 Other interest-bearing deposits185,939 (0.04%)143
Other borrowed funds(160,765) 0.05%979 Average total interest-bearing
liabilities(273,542) (0.05%)1,683 Increase (decrease) in net interest
income *(987)$ Net InterestIncomeChanges
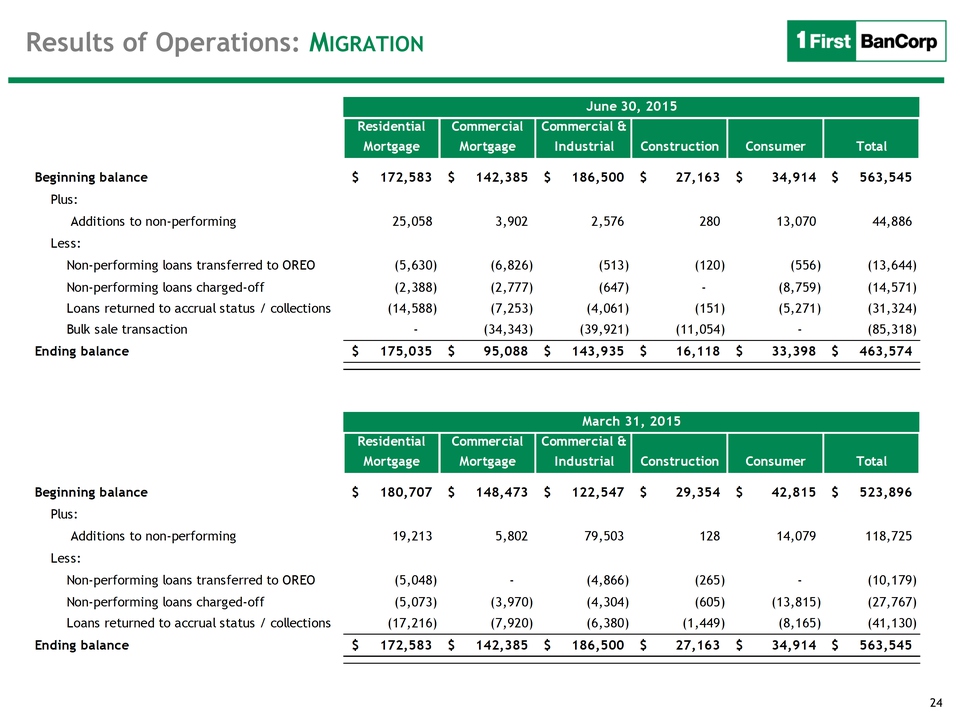
24 Results of Operations:
MIGRATION Residential MortgageCommercial MortgageCommercial &
IndustrialConstructionConsumerTotalBeginning balance172,583$ 142,385$
186,500$ 27,163$ 34,914$ 563,545$ Plus: Additions to
non-performing25,058 3,902 2,576 280 13,070 44,886 Less: Non-performing
loans transferred to OREO(5,630) (6,826) (513) (120) (556) (13,644)
Non-performing loans charged-off(2,388) (2,777) (647) - (8,759) (14,571)
Loans returned to accrual status / collections(14,588) (7,253) (4,061)
(151) (5,271) (31,324) Bulk sale transaction- (34,343) (39,921) (11,054)
- (85,318) Ending balance175,035$ 95,088$ 143,935$ 16,118$ 33,398$
463,574$ Residential MortgageCommercial MortgageCommercial &
IndustrialConstructionConsumerTotalBeginning balance180,707$ 148,473$
122,547$ 29,354$ 42,815$ 523,896$ Plus: Additions to
non-performing19,213 5,802 79,503 128 14,079 118,725 Less:
Non-performing loans transferred to OREO(5,048) - (4,866) (265) -
(10,179) Non-performing loans charged-off(5,073) (3,970) (4,304) (605)
(13,815) (27,767) Loans returned to accrual status / collections(17,216)
(7,920) (6,380) (1,449) (8,165) (41,130) Ending balance172,583$ 142,385$
186,500$ 27,163$ 34,914$ 563,545$ March 31, 2015June 30, 2015
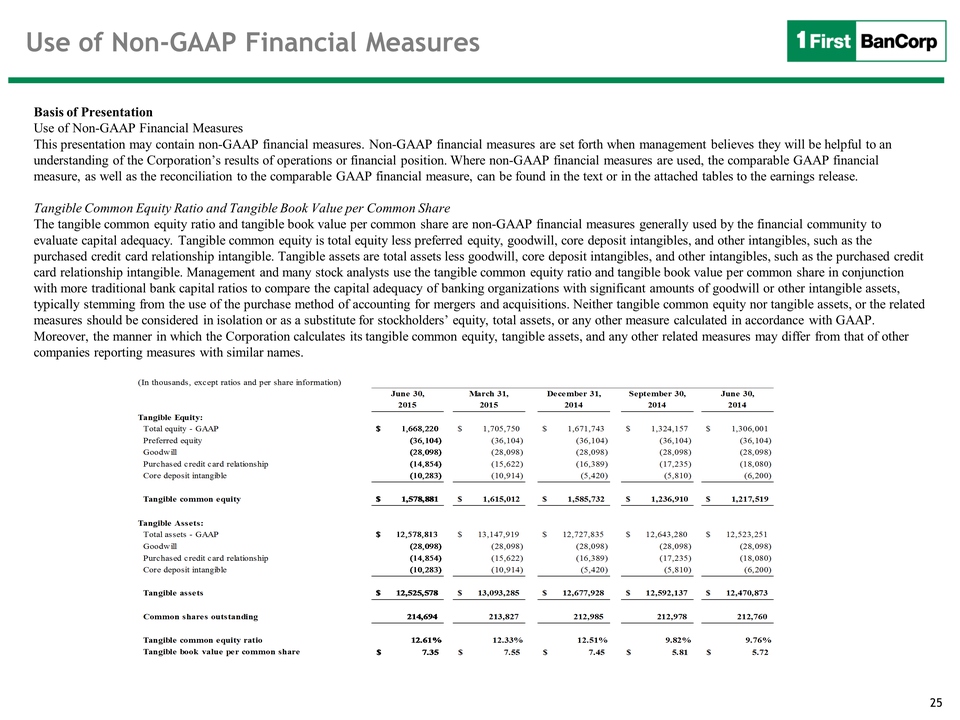
25 Use of Non-GAAP
Financial Measures Basis of Presentation Use of Non-GAAP Financial
Measures This presentation may contain non-GAAP financial measures.
Non-GAAP financial measures are set forth when management believes they
will be helpful to an understanding of the Corporation’s results of
operations or financial position. Where non-GAAP financial measures are
used, the comparable GAAP financial measure, as well as the
reconciliation to the comparable GAAP financial measure, can be found in
the text or in the attached tables to the earnings release. Tangible
Common Equity Ratio and Tangible Book Value per Common Share The
tangible common equity ratio and tangible book value per common share
are non-GAAP financial measures generally used by the financial
community to evaluate capital adequacy. Tangible common equity is total
equity less preferred equity, goodwill, core deposit intangibles, and
other intangibles, such as the purchased credit card relationship
intangible. Tangible assets are total assets less goodwill, core deposit
intangibles, and other intangibles, such as the purchased credit card
relationship intangible. Management and many stock analysts use the
tangible common equity ratio and tangible book value per common share in
conjunction with more traditional bank capital ratios to compare the
capital adequacy of banking organizations with significant amounts of
goodwill or other intangible assets, typically stemming from the use of
the purchase method of accounting for mergers and acquisitions. Neither
tangible common equity nor tangible assets, or the related measures
should be considered in isolation or as a substitute for stockholders’
equity, total assets, or any other measure calculated in accordance with
GAAP. Moreover, the manner in which the Corporation calculates its
tangible common equity, tangible assets, and any other related measures
may differ from that of other companies reporting measures with similar
names. (In thousands, except ratios and per share information)June
30,March 31,December 31,September 30,June 30,20152015201420142014Total
equity - GAAP $ 1,668,220 $ 1,705,750 $ 1,671,743 $ 1,324,157 $
1,306,001 Preferred
equity(36,104)(36,104)(36,104)(36,104)(36,104)Goodwill(28,098)(28,098)(28,098)(28,098)(28,098)Purchased
credit card relationship (14,854) (15,622) (16,389) (17,235)
(18,080)Core deposit
intangible(10,283)(10,914)(5,420)(5,810)(6,200)Tangible common equity $
1,578,881 $ 1,615,012 $ 1,585,732 $ 1,236,910 $ 1,217,519 Total assets -
GAAP $ 12,578,813 $ 13,147,919 $ 12,727,835 $ 12,643,280 $ 12,523,251
Goodwill(28,098)(28,098)(28,098)(28,098)(28,098)Purchased credit card
relationship (14,854) (15,622) (16,389) (17,235) (18,080)Core deposit
intangible (10,283)(10,914)(5,420)(5,810)(6,200)Tangible assets $
12,525,578 $ 13,093,285 $ 12,677,928 $ 12,592,137 $ 12,470,873 Common
shares outstanding 214,694 213,827 212,985 212,978 212,760 Tangible
common equity ratio12.61%12.33%12.51%9.82%9.76%Tangible book value per
common share7.35$ 7.55$ 7.45$ 5.81$ 5.72$ Tangible Equity:Tangible
Assets:
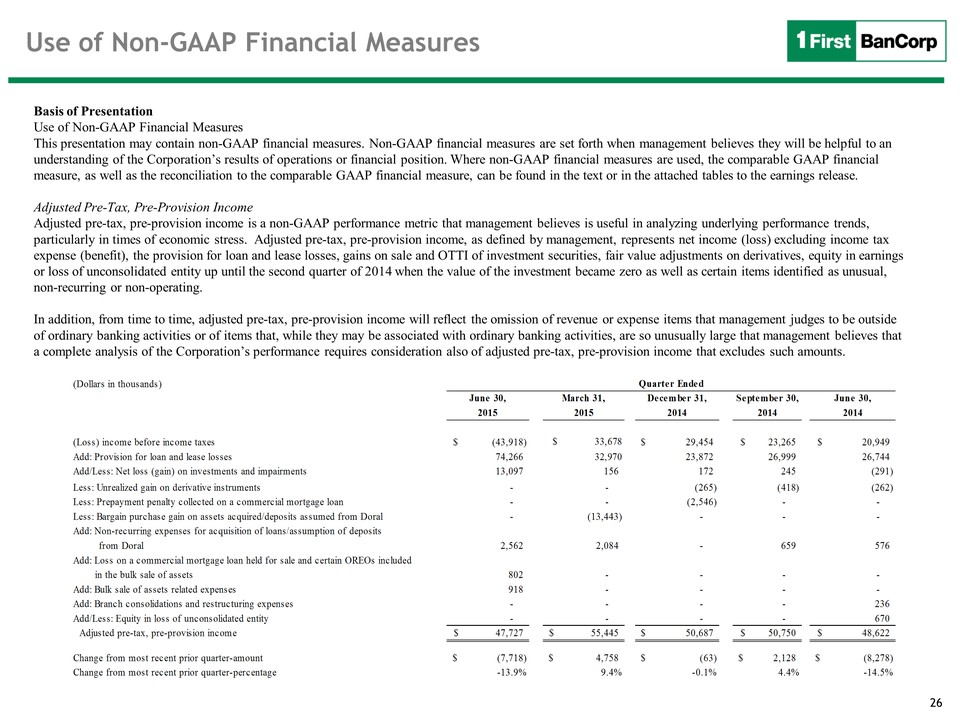
26 Use of Non-GAAP Financial Measures Basis of PresentationUse of Non-GAAP Financial Measures This presentation may contain non-GAAP financial measures. Non-GAAP financial measures are set forth when management believes they will be helpful to an understanding of the Corporation’s results of operations or financial position. Where non-GAAP financial measures are used, the comparable GAAP financial measure, as well as the reconciliation to the comparable GAAP financial measure, can be found in the text or in the attached tables to the earnings release.Adjusted Pre-Tax, Pre-Provision IncomeAdjusted pre-tax, pre-provision income is a non-GAAP performance metric that management believes is useful in analyzing underlying performance trends, particularly in times of economic stress. Adjusted pre-tax, pre-provision income, as defined by management, represents net income (loss) excluding income tax expense (benefit), the provision for loan and lease losses, gains on sale and OTTI of investment securities, fair value adjustments on derivatives, equity in earnings or loss of unconsolidated entity up until the second quarter of 2014 when the value of the investment became zero as well as certain items identified as unusual, non-recurring or non-operating. In addition, from time to time, adjusted pre-tax, pre-provision income will reflect the omission of revenue or expense items that management judges to be outside of ordinary banking activities or of items that, while they may be associated with ordinary banking activities, are so unusually large that management believes that a complete analysis of the Corporation’s performance requires consideration also of adjusted pre-tax, pre-provision income that excludes such amounts. (Dollars in thousands) June 30, March 31, December 31, September 30, June 30, 2015 2015 2014 2014 2014 (Loss) income before income taxes $ (43,918) $ 33,678 $ 2 9,454 $ 23,265 $ 2 0,949 Add: Provision for loan and lease losses 74,266 32,970 23,872 26,999 26,744 Add/Less: Net loss (gain) on investments and impairments 13,097 156 172 245 (291) Less: Unrealized gain on derivative instruments - - (265) (418) (262) Less: Prepayment penalty collected on a commercial mortgage loan - - (2,546) - - Less: Bargain purchase gain on assets acquired/deposits assumed from Doral - (13,443) - - - Add: Non-recurring expenses for acquisition of loans/assumption of deposits from Doral 2 ,562 2,084 - 659 576 Add: Loss on a commercial mortgage loan held for sale and certain OREOs included in the bulk sale of assets 802 - - - - Add: Bulk sale of assets related expenses 918 - - - - Add: Branch consolidations and restructuring expenses - - - - 236 Add/Less: Equity in loss of unconsolidated entity - - - - 670 Adjusted pre-tax, pre-provision income $ 47,727 $ 55,445 $ 50,687 $ 50,750 $ 4 8,622 Change from most recent prior quarter-amount $ (7,718) $ 4 ,758 $ (63) $ 2,128 $ (8,278) Change from most recent prior quarter-percentage -13.9% 9.4% -0.1% 4.4% -14.5% Quarter Ended