Attached files
| file | filename |
|---|---|
| EX-4.1 - EX-4.1 - Conifer Holdings, Inc. | a2225447zex-4_1.htm |
| EX-3.2 - EX-3.2 - Conifer Holdings, Inc. | a2225447zex-3_2.htm |
| EX-23.2 - EX-23.2 - Conifer Holdings, Inc. | a2225447zex-23_2.htm |
| EX-1.1 - EX-1.1 - Conifer Holdings, Inc. | a2225447zex-1_1.htm |
| EX-23.1 - EX-23.1 - Conifer Holdings, Inc. | a2225447zex-23_1.htm |
| EX-3.4 - EX-3.4 - Conifer Holdings, Inc. | a2225447zex-3_4.htm |
| EX-5.1 - EX-5.1 - Conifer Holdings, Inc. | a2225447zex-5_1.htm |
| EX-10.1.3 - EX-10.1.3 - Conifer Holdings, Inc. | a2225447zex-10_13.htm |
Use these links to rapidly review the document
TABLE OF CONTENTS
CONIFER HOLDINGS, INC. AND SUBSIDIARIES
As filed with the Securities and Exchange Commission on July 30, 2015.
Registration No. 333-205448
UNITED STATES
SECURITIES AND EXCHANGE COMMISSION
Washington, D.C. 20549
Amendment No. 1
to
FORM S-1
REGISTRATION STATEMENT
UNDER
THE SECURITIES ACT OF 1933
Conifer Holdings, Inc.
(Exact name of Registrant as specified in its charter)
| Michigan (State or other jurisdiction of incorporation or organization) |
6331 (Primary Standard Industrial Classification Code Number) |
27-1298795 (I.R.S. employer identification no.) |
550 West Merrill Street, Suite 200
Birmingham, Michigan 48009
(248) 559-0840
(Address, including zip code, and telephone number, including area code, of Registrant's principal executive offices)
James G. Petcoff
Chairman and Chief Executive Officer
550 West Merrill Street, Suite 200
Birmingham, Michigan 48009
(248) 559-0840
(Name, address, including zip code, and telephone number, including area code, of agent for service)
| Copies to: | ||
Donald J. Kunz, Esq. Honigman Miller Schwartz and Cohn LLP 2290 First National Building 660 Woodward Avenue Detroit, Michigan 48226 (313) 465-7454 |
Michael Groll, Esq. Willkie Farr & Gallagher LLP 787 Seventh Avenue New York, New York 10019 (212) 728-8000 |
|
Approximate date of commencement of proposed sale to the public:
As soon as practicable after the effective date of this registration statement.
If any of the securities being registered on this form are to be offered on a delayed or continuous basis pursuant to Rule 415 under the Securities Act of 1933, as amended (the "Securities Act"), check the following box. o
If this form is filed to register additional securities for an offering pursuant to Rule 462(b) under the Securities Act, check the following box and list the Securities Act registration statement number of the earlier effective registration statement for the same offering. o
If this form is a post-effective amendment filed pursuant to Rule 462(c) under the Securities Act, check the following box and list the Securities Act registration statement number of the earlier effective registration statement for the same offering. o
If this form is a post-effective amendment filed pursuant to Rule 462(d) under the Securities Act, check the following box and list the Securities Act registration statement number of the earlier effective registration statement for the same offering. o
Indicate by check mark whether registrant is a large accelerated filer, an accelerated filer, a non-accelerated filer, or a smaller reporting company. See the definitions of "large accelerated filer," "accelerated filer," and "smaller reporting company" in Rule 12b-2 of the Exchange Act. (check one): o Large accelerated filer, o Accelerated filer, ý Non-accelerated filer (do not check if a smaller reporting company) or o Smaller reporting company.
CALCULATION OF REGISTRATION FEE
| Title of Each Class of Securities To Be Registered |
Amount To Be Registered(1) |
Proposed Maximum Aggregate Offering Price(2) |
Amount of Registration Fee(3) |
|||
|---|---|---|---|---|---|---|
| Common Stock, no par value | 5,290,000 | $68,770,000 | $7,992.00 | |||
- (1)
- Includes
the additional shares that the underwriters have the option to purchase to cover over-allotments, if any.
- (2)
- Estimated
solely for the purpose of computing the amount of the registration fee pursuant to Rule 457(a) under the Securities Act of 1933, as
amended.
- (3)
- The Registrant previously paid $6,391.00 of the registration fee in connection with the initial filing of this registration statement.
The registrant hereby amends this registration statement on such date or dates as may be necessary to delay its effective date until the registrant shall file a further amendment which specifically states that this registration statement shall thereafter become effective in accordance with Section 8(a) of the Securities Act of 1933, as amended, or until the registration statement shall become effective on such date as the Securities and Exchange Commission, acting pursuant to such Section 8(a), may determine.
| Preliminary Prospectus | Subject to Completion, dated July 30, 2015 |
The information in this preliminary prospectus is not complete and may be changed. We may not sell these securities until the registration statement filed with the Securities and Exchange Commission is effective. This preliminary prospectus is not an offer to sell these securities and it is not soliciting an offer to buy these securities in any state or other jurisdiction where the offer or sale is not permitted.
4,600,000 Shares

Conifer Holdings, Inc.
Common Stock
$ per share
This is the initial public offering of Conifer Holdings, Inc. We are offering 4,600,000 shares of our common stock. We anticipate that the initial public offering price of our common stock will be between $11.00 and $13.00 per share.
Prior to this offering, there has been no public market for our common stock. We have applied to list our common stock on the NASDAQ under the symbol "CNFR."
We are an "emerging growth company" as defined by the Jumpstart Our Business Startups Act of 2012 and, as such, we have elected to comply with certain reduced public company reporting requirements for this prospectus and future filings.
Investing in our common stock involves a high degree of risk. See "Risk Factors" beginning on page 16.
| |
Per Share |
Total |
|||||
|---|---|---|---|---|---|---|---|
|
|
|||||||
| Initial public offering price | $ | $ | |||||
Underwriting discounts and commissions(1) |
$ |
$ |
|||||
Proceeds, before expenses, to us |
$ |
$ |
|||||
- (1)
- In addition to underwriting discounts and commissions payable by us, we have agreed to reimburse the underwriters for certain expenses. See "Underwriting."
We have granted the underwriters a 30-day option to purchase a total of up to 690,000 additional shares of common stock on the same terms and conditions set forth above.
The underwriters expect to deliver shares of common stock to purchasers on our about , 2015.
Neither the Securities and Exchange Commission nor any state securities commission has approved or disapproved of these securities or determined if this prospectus is truthful or complete. Any representation to the contrary is a criminal offense.
| BMO Capital Markets | Raymond James | |
Sandler O'Neill+Partners, L.P. |
William Blair |
Prospectus dated , 2015.
i
Unless otherwise indicated, information contained in this prospectus concerning our industry and the markets in which we operate, including our general expectations and market position, market opportunity and market share, is based on information from our own management estimates and research, as well as from industry and general publications and research, surveys and studies conducted by third parties. Management estimates are derived from publicly available information, our knowledge of our industry and assumptions based on such information and knowledge, which we believe to be reasonable. Assumptions and estimates of our and our industry's future performance are necessarily subject to a high degree of uncertainty and risk due to a variety of factors, including those described in "Risk Factors." These and other factors could cause our future performance to differ materially from our assumptions and estimates. See "Special Note Regarding Forward-Looking Statements."
"Conifer Insurance Company," "American Colonial Insurance Company," "White Pine Insurance Company" and our green Conifer logo are the subject of either a trademark registration or an application for registration in the United States. Other brands, names and trademarks contained in this prospectus are the property of their respective owners. Solely for convenience, trademarks and tradenames referred to in this prospectus appear without the ® and ™ symbols, but those references are not intended to indicate, in any way, that we will not assert, to the fullest extent under applicable law, our rights or that the applicable owner will not assert its rights, to these trademarks and tradenames.
ii
This summary highlights information contained elsewhere in this prospectus. This summary does not contain all of the information you should consider before investing in our common stock. You should read this entire prospectus carefully, especially the section in this prospectus entitled "Risk Factors" beginning on page 16 and our financial statements and the related notes thereto appearing at the end of this prospectus, before making an investment decision. As used in this prospectus, unless the context otherwise requires, references to "Conifer," "Conifer Holdings," "the Company," "our Company," "we," "us," and "our" refer to Conifer Holdings, Inc., a Michigan corporation, and, where appropriate, its subsidiaries. References to any year herein refer to the 12 months ended December 31 of the year indicated. For the definitions of certain terms used in this prospectus, see "Glossary of Industry and Other Terms."
Business Overview
Our Company
Conifer Holdings, Inc. is a Michigan-based insurance holding company formed in 2009. Through our insurance subsidiaries, we offer insurance coverage in both specialty commercial and specialty personal product lines. Many of our products are targeted to profitable classes of policyholders that are underserved by other insurers. We market and sell these insurance products through a growing network of over 4,500 independent agents that distribute our policies through their approximately 2,200 sales offices writing business in 44 states. We are focused on growing our business in non-commoditized property and casualty insurance markets, while maintaining underwriting discipline and a conservative investment strategy. Our commercial lines and personal lines business accounted for 65% and 35%, respectively, of net earned premiums for the three months ended March 31, 2015 and 62% and 38%, respectively, of our net earned premiums for the year ended December 31, 2014.
We have substantial expertise in serving the unique commercial insurance needs of owner-operated businesses in the following markets:
- •
- Hospitality, such as restaurants, bars, taverns, and bowling centers (that require, among other lines, liquor liability insurance), as
well as small grocery and convenience stores;
- •
- Artisan contractors, such as plumbers, painters, carpenters, electricians and other independent contractors;
- •
- Security service providers, such as companies that provide security guard services, security alarm products and services, and private
investigative services; and
- •
- Automobile repair and used car facilities.
In our commercial lines business, we seek to differentiate ourselves and provide value to small business owner-operators by bundling different insurance products that meet a significant portion of their insurance needs. For example, in the hospitality market we offer property, casualty, and liquor liability, as well as, in some jurisdictions, workers' compensation coverage. The breadth of our specialty commercial insurance products enables our small business customers, many of whom do not have dedicated risk management personnel, and their agents, to save the administrative costs and time required to seek coverage for these items from separate insurers. As such, we compete for commercial lines business based on our flexible product offerings and customer service, rather than on pricing alone. Our target commercial lines customer has an average account size of $5,000 in premium.
We also have substantial expertise in providing specialty homeowners' insurance products to targeted customers that are often underserved by larger carriers or other established providers of homeowners' insurance. Our personal lines products include primarily the following:
- •
- Catastrophic coverage, including hurricane and wind coverage, to underserved homeowners in Florida, Hawaii and Texas; and
1
- •
- Dwelling insurance tailored for owners of lower value homes, which we currently offer in Illinois and Indiana and plan to introduce in other geographic markets including Texas, Louisiana, North Carolina and South Carolina.
In our personal lines business, we target homeowners in need of specific catastrophe coverage or dwelling insurance that are currently underserved by the insurance market, due to the modest value of their homes or the exposure to natural catastrophes in their geographic area. Because these homeowners are underserved, this portion of the market is typically subject to less pricing pressure from larger nationwide insurers that offer a more commoditized product. We believe our underwriting expertise enables us to compete effectively in these markets by evaluating and appropriately pricing risk. In addition, we believe our willingness to meet these underserved segments of the personal lines insurance market fosters deeper relationships with, and increased loyalty from, the agents who distribute our products. Our target personal lines customer has an average account size of $1,200 in premium.
Overall, we seek a balance of our premiums earned between commercial and personal lines to better diversify our business and mitigate the potential cyclical nature of either market. In serving these markets, we write business on both an admitted and excess & surplus ("E&S") basis. Insurance companies writing on an admitted basis are licensed by the states in which they sell policies and are required to offer policies using premium rates and forms that are typically filed with state insurance regulators. Non-admitted carriers writing in the E&S market are not bound by most of the rate and form regulations imposed on standard market companies, allowing them the flexibility to change the coverage offered and the rate charged without the time constraints and financial costs associated with the filing process. Our corporate structure allows us to offer both admitted and E&S products in select markets through either Conifer Insurance Company ("CIC") or White Pine Insurance Company ("WPIC"). Our experience with specialty insurance products enables us to react to new market opportunities and underwrite multiple specialty lines.
While we will pursue top line premium growth, we do not do so at the expense of losing underwriting discipline. Our underwriters have the experience and institutional flexibility to recognize when to exit certain products in favor of more profitable opportunities as insurance market conditions dictate. The following charts summarize our gross written premiums by type, line of business and state for the years indicated therein.
| 2014 Gross Written Premium ("GWP") by Type | 2014 GWP by Line of Business | |
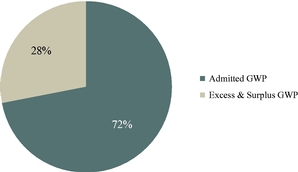
|

|
2
| GWP Growth by State | GWP by Customer Type and Year | |

|
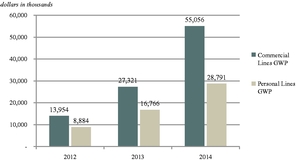
|
Our Growth and Operating Strategies
We believe that our operating strategies significantly contribute to our recent growth in gross written premiums and position us to write profitable business in both hard insurance markets (where industry capital is constricted, competition is low, and premium rates are rising) and soft insurance markets (where industry capital is rising, competition is high and premium rates are falling). Our operating strategies include our:
- •
- Focus on underserved markets. We focus on providing
specialty insurance products to targeted policyholders in underserved markets. We believe that most of our small business customers, many of which are owner-operated, value the efficiency of dealing
with a single insurer for multiple products. By targeting small to medium sized accounts, we add value to the business owner directly without competing solely on price, as is often the case in markets
with many larger competitors.
- •
- Deep understanding of the business and regulatory landscapes of our
markets. The competition for insurance business and the regulatory operating environment vary significantly from state to state. Our
business plan is to identify market opportunities in particular jurisdictions where due to regulatory conditions, our insurance products can profitably suit the needs of our potential customers. We
focus on tailoring our business to concentrate on the geographic markets and regulatory environments with the greatest opportunities for growth and profitability.
- •
- Emphasis on flexibility. We offer coverage to our
insureds both on an admitted and E&S basis. We primarily utilize CIC to write E&S lines in various states and WPIC to write policies on an admitted basis. We believe this flexibility enables us to
pivot quickly between admitted and E&S policies as customer needs and regulatory conditions dictate.
- •
- Strong relationships with our agents. We seek to develop
strong relationships with our independent agents and provide them with competitive products to offer policyholders, responsive service and attractive commissions. Our senior management has personal
and professional relationships with many of our agents that predate the establishment of our company. Over the course of these relationships, we believe we have established a reputation as a nimble
and entrepreneurial partner. We understand that short turn-around times and responsiveness to our agents' needs increase their business and aid in making Conifer a partner of choice. We believe our
agents understand that we view them as key partners in risk selection that help us serve our ultimate client—the insured.
- •
- Premium growth in existing markets. We expect to grow our overall premium volume by appointing new independent agents in our existing markets. Since we commenced operations in 2009, we have appointed over 4,500 independent agents to our agency network. In addition to expanding our network of agents, we also expect to increase the volume of business we write
3
- •
- Expanding geographically. Our plans include growing our
business geographically on a targeted basis. For example, in the next twelve months, we plan to expand our current writings in both commercial and personal lines in several states, including Texas,
Louisiana, Colorado, Kentucky, Nevada, North Carolina and South Carolina.
- •
- Engaging in complementary acquisitions. Our senior
management team is experienced in reviewing potential acquisition opportunities and has successfully closed many transactions in the insurance industry. This experience leads to a streamlined review
process and ability to complete effective due diligence. We focus on logical acquisitions for existing business lines where we add value by re-underwriting books of business, reducing expenses or
expanding offerings to our current agent and customer base. We currently have no plans for any specific acquisitions.
- •
- Conservative risk management with an emphasis on lowering volatility. We focus on the risk/reward of insurance underwriting, while maintaining a prudent investment policy. We employ conservative risk management practices and opportunistically purchase reinsurance to minimize our exposure to liability for individual risks. In addition, we seek to maintain a diversified liquid investment portfolio to reduce overall balance sheet volatility. As of March 31, 2015, our investments primarily including short-term fixed income investments with an average credit rating of "AA" and an average duration of 3.5 years.
with our existing agents. Growing our gross written premiums will help reduce our expense ratio given our largely fixed-cost expense base.
Our Competitive Strengths
We believe we have the following competitive strengths:
- •
- Talented underwriters with broad expertise. Our
underwriters have significant experience managing account profitability across market cycles. With an average of over 23 years of experience, our senior underwriters possess the required
expertise to respond appropriately to market forces. Given our focus on underserved markets, we believe that our underwriters' experience sets us apart from many of our competitors.
- •
- Controlled and Disciplined Underwriting. We underwrite
substantially all policies to our specific guidelines and, in the limited circumstances in which we utilize managing general agencies (which are wholesale insurance intermediaries with the authority
to accept placements from, and often to appoint, retail agents on behalf of an insurer), these agencies are subject to our guidelines while we retain final underwriting authority. Our technology
systems are designed to further limit the ability of these agencies, as well as our own underwriters, from significantly straying from these guidelines. We customize the coverages we offer, and
continually monitor our markets and react to changes in our markets by adjusting our pricing, product structures and underwriting guidelines. By tailoring the terms and conditions of our policies, we
align our actual underwriting risk with the profit of each insurance account that we write.
- •
- Proactive claims handling. We have a proactive claims
handling philosophy that utilizes an internal team of experienced attorneys employed by the Company to manage or supervise all of our claims from inception until resolution. We believe our claims
handling process, coupled with our customized claims handling management system, has contributed favorably to our loss ratios and positive litigation experience over time. Once we determine a claim is
covered by the underlying policy, our proactive management of claims reinforces our relationships with our customers and agents by demonstrating our willingness to defend our insureds aggressively and
help them mitigate losses.
- •
- Proven management team. In 1987, our chairman and chief executive officer, James G. Petcoff, founded North Pointe Insurance Company (later reorganized into North Pointe Holdings Corporation) ("North Pointe") offering mainly liquor liability policies to hospitality risks including restaurants, bars and taverns. During his time at North Pointe, Mr. Petcoff successfully
4
- •
- Ability to leverage technology to drive efficiency. As a relatively new insurance company, we are not burdened with inefficient legacy systems. We utilize a web-based system that seeks to achieve greater organizational efficiency in our company. Leveraging the infrastructure of programmers and support staff of third-party vendors allows our in-house business analysts to focus on new product development and product roll-out. We believe this reduces our time to market for new products, enhances services for insureds, increases our ability to capture data, and reduces cost.
managed, took public and ultimately sold the company to a global property and casualty writer based in Australia. Our senior management team has an average of over 25 years' experience in the insurance industry, including an average of 16 years with Conifer and North Pointe—almost exclusively with small and growing companies. Our senior management team has successfully created, managed and grown numerous insurance companies and books of business, and has longstanding relationships with our many independent agents and policyholders in our targeted markets.
Recent Developments
Repurchase of Issued and Outstanding Shares of Preferred Stock
Concurrent with the closing of this initial public offering, the Company will repurchase all of its issued and outstanding shares of preferred stock for aggregate consideration of $6.3 million. Immediately following the repurchase, and also upon the closing of this offering, certain preferred shareholders have agreed to use $3.1 million of their proceeds to purchase common stock in a private placement at the same price per share of common stock to be sold in this offering, resulting in a net cash payment of $3.2 million to repurchase the preferred stock. Assuming an initial offering price per share of $12.00, a total of 257,567 additional shares of common stock would be sold to such preferred shareholders, although the actual number of shares may vary depending on the initial offering price. An initial offering price of less than $12.00 per share, the midpoint of the per share price range set forth in this prospectus, will result in a greater number of shares being sold to such preferred shareholders, which will have a greater dilutive effect on investors in this offering. For more information, see "Description of Capital Stock—Repurchase of Issued and Outstanding Preferred Stock."
Restricted Stock Unit Awards
In connection with this offering, we will grant an aggregate of 333,333 restricted stock units under our 2015 Omnibus Incentive Plan to our executive officers and other employees at the per share price of this offering. The total value of such awards, which will vest in five equal installments commencing on the first anniversary of the grant date, will be approximately $4.0 million, $2.0 million of which will be granted to our named executive officers, based upon an assumed initial offering price of $12.00 per share, the midpoint of the per share price range set forth in this prospectus. See "Executive Compensation—Equity Awards Granted to our Named Executive Officers."
Preliminary Unaudited June 30, 2015 Consolidated Financial Information
The preliminary unaudited consolidated financial information as of and for the three months ended June 30, 2015 has been prepared by and is the responsibility of management. Management prepared this estimated unaudited consolidated financial information in good faith based upon our internal reporting as of and for the three months ended June 30, 2015. These estimates are preliminary and represent the most current information available to us. These preliminary estimates have not been subject to the completion of our financial closing procedures. As such, the unaudited consolidated financial information set forth below is subject to final adjustments and other items that may be identified until the time the consolidated financial results for the period indicated above are finalized. Our actual consolidated financial results as of and for the three months ended June 30, 2015 may be different from the preliminary estimates and these differences could be material. These estimates
5
should not be viewed as a substitute for our full unaudited condensed consolidated financial statements prepared in accordance with U.S. generally accepted accounting principles ("U.S. GAAP").
In addition, Deloitte & Touche LLP, our independent registered public accounting firm, has not audited, reviewed, compiled or performed any procedures on this preliminary consolidated financial information, and accordingly, does not express an opinion or other form of assurance with respect to this preliminary unaudited consolidated financial information. Accordingly, you should not place undue reliance upon the preliminary information furnished in this section. This preliminary unaudited consolidated financial information is not necessarily indicative of results to be expected for any future period. See "Risk Factors" and "Special Note Regarding Forward-Looking Statements and Industry Data."
This preliminary unaudited consolidated financial information should also be read in conjunction with "Management's Discussion and Analysis of Financial Condition and Results of Operations", "Business" and our consolidated financial statements and the related notes thereto included elsewhere in this prospectus.
| |
Three Months Ended June 30, |
||||||
|---|---|---|---|---|---|---|---|
| (in thousands, except per share data and ratios) |
Estimated 2015 |
2014 | |||||
| |
(unaudited) |
||||||
Gross written premiums |
$ | 23,059 | $ | 19,001 | |||
Net written premiums |
15,941 | 16,692 | |||||
Net earned premiums |
15,115 | 13,957 | |||||
Net income (loss) |
630 | (1,525 | ) | ||||
Net income (loss) attributable to Conifer |
579 | (1,536 | ) | ||||
Net income (loss) allocable to common shareholders |
366 | (1,552 | ) | ||||
Income (loss) per share allocable to common shareholders, basic and diluted |
$ | 0.09 | $ | (0.66 | ) | ||
Weighted average common shares outstanding, basic and diluted |
4,050,042 | 2,357,220 | |||||
Total shareholders' equity attributable to Conifer |
51,090 |
27,012 |
|||||
Other Data |
|||||||
Shareholders' equity per common share outstanding(1) |
$ | 11.07 | $ | 10.49 | |||
Loss ratio(2) |
58 | % | 67 | % | |||
Expense ratio(3) |
40 | % | 47 | % | |||
Combined ratio(4) |
98 | % | 114 | % | |||
All common stock share and per share amounts for all periods presented have been adjusted retroactively to reflect the 10.2-to-1 stock split, effected in the form of a stock dividend, to be effectuated immediately prior to the effectiveness of the initial public offering contemplated in this prospectus.
- (1)
- Shareholders'
equity per common share outstanding is shareholders' equity attributable to Conifer (less preferred stock) divided by the number of common
shares outstanding at period end.
- (2)
- The
loss ratio is the ratio, expressed as a percentage, of net losses and loss adjustment expenses to net earned premiums and other income.
- (3)
- The expense ratio is the ratio, expressed as a percentage, of policy acquisition costs and operating expenses to net earned premiums and other income.
6
- (4)
- The combined ratio is the sum of the loss ratio and the expense ratio. A combined ratio under 100% indicates an underwriting profit. A combined ratio over 100% indicates an underwriting loss.
Comparison of the Three Months Ended June 30, 2015 to the Three Months Ended June 30, 2014 (Unaudited)
Gross written premiums increased $4.1 million for the three months ended June 30, 2015 as compared to the same period in 2014. The increase in gross written premiums was attributable to increased premiums among most of our lines of business, offset by a reduction in premium volume in the Midwest homeowners line and the personal automobile line (which is in run-off).
Net written premiums are lower due to the 25% quota share reinsurance arrangement entered into on December 31, 2014.
The loss ratio continued to trend lower in the second quarter as a result of fewer property losses in 2015 as compared to 2014, as well as fewer losses in the personal automobile line as the business trails off.
The expense ratio improved as premium volume increased relative to the expense base, partially offset by the negative impact from the quota share arrangement.
Our Structure
The chart below displays our corporate structure as it pertains to our holding company and significant operating subsidiaries.
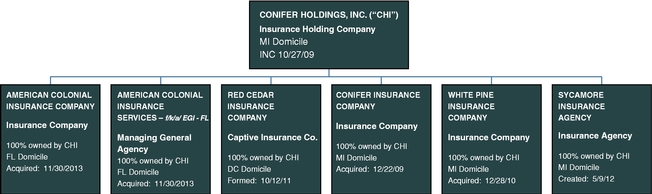
The entities set forth above serve the following functions:
- •
- Conifer Holdings, Inc. ("CHI") is a holding company that provides management and
related operational support for each of our subsidiaries.
- •
- Conifer Insurance Company ("CIC") is a property and casualty insurance company that
generally writes policies on an E&S basis.
- •
- White Pine Insurance Company ("WPIC") is a property and casualty insurance company
that generally writes policies on an admitted basis.
- •
- Red Cedar Insurance Company ("RCIC") is a pure captive insurance company, which we
define as an insurance company that only writes insurance exclusively for our operating insurance companies and does not place or write any insurance business on behalf of third parties.
- •
- American Colonial Insurance Company ("ACIC") is a property and casualty insurance
company that focuses on personal line products, including homeowners' insurance.
- •
- American Colonial Insurance Services ("ACIS") is a managing general agency that processes the majority of the business written by ACIC in Florida.
7
- •
- Sycamore Insurance Agency, Inc. ("SIAI") is an insurance agency that primarily acts as a broker for policies written through CIC with retail agents and as an insurance agency for policies CIC, WPIC or ACIC may write directly with insureds.
Summary Risk Factors
Investing in our common stock involves significant risks and uncertainties. You should carefully consider the risks and uncertainties discussed under the section titled "Risk Factors" elsewhere in this prospectus before making a decision to invest in our common stock. If any of these risks and uncertainties occurs, our business, financial condition or results of operations may be materially adversely affected. In such case, the trading price of our common stock would likely decline and you may lose all or a part of your investments. Below is a summary of some of the principal risks we face:
- •
- the occurrence of severe weather conditions and other catastrophes;
- •
- the cyclical nature of the insurance industry, resulting in periods during which we may experience excess underwriting capacity and
unfavorable premium rates;
- •
- our ability to obtain reinsurance coverage at reasonable prices or on terms that adequately protect us;
- •
- a decline in our financial strength rating resulting in a reduction of new or renewal business;
- •
- our ability to manage our growth effectively;
- •
- exposure to credit risk, interest rate risk and other market risk in our investment portfolio;
- •
- competition within the property and casualty insurance industry;
- •
- the inherent uncertainty of estimating reserves and the possibility that incurred losses may be greater than our loss and loss
adjustment expense reserves;
- •
- inaccurate estimates and judgments in our risk management may expose us to greater risks than intended;
- •
- the potential loss of key members of our management team or key employees and our ability to attract and retain personnel;
- •
- potential effects on our business of emerging claim and coverage issues;
- •
- losses in our investment portfolio;
- •
- new or additional government or market regulations;
- •
- sale of investments at a loss to meet our liquidity needs;
- •
- our underwriters and other associates could take excessive risks;
- •
- losses resulting from reinsurance counterparties failing to pay us on reinsurance claims;
- •
- the potential impact of internal or external fraud, operational errors, systems malfunctions or cybersecurity incidents;
- •
- an adverse outcome in a legal action that we are or may become subject to in the course of our insurance operations;
- •
- failure to maintain effective internal controls in accordance with Sarbanes-Oxley; and
- •
- the trading price of our common stock is likely to be volatile, and you might not be able to sell your shares at or above the initial public offering price.
8
Corporate Information
We were incorporated in October 2009 as Conifer Holdings, Inc., a Michigan corporation. We are headquartered in Birmingham, Michigan. Our principal executive offices are located at 550 W. Merrill Street, Suite 200, Birmingham, Michigan 48009. Our telephone number is (248) 559-0840. Our corporate website address is www.coniferinsurance.com. The information contained in, or that can be accessed through, our website is not part of, and shall not be deemed to be a part of, this prospectus.
Implications of Being an Emerging Growth Company
As a company with less than $1.0 billion in revenue during our last fiscal year, we qualify as an "emerging growth company" as defined in the Jumpstart Our Business Startups Act (the "JOBS Act"), enacted in April 2012. An "emerging growth company" may take advantage of reduced reporting requirements that are otherwise applicable to public companies. These provisions include, but are not limited to:
- •
- being permitted to present only two years of audited financial statements and only two years of related disclosure in our
"Management's Discussion and Analysis of Financial Condition and Results of Operations" ("MD&A") in this prospectus (though we chose to include three years of financial statements and related
disclosures in the MD&A);
- •
- not being required to comply with the auditor attestation requirements of Section 404 of the Sarbanes-Oxley Act of 2002, as
amended (the "Sarbanes-Oxley Act");
- •
- the ability to use an extended transition period for complying with new or revised accounting standards, which we have irrevocably
elected not to avail ourselves of;
- •
- reduced disclosure obligations regarding executive compensation in our periodic reports, proxy statements and registration statements;
and
- •
- exemptions from the requirements of holding a nonbinding advisory vote on executive compensation and shareholder approval of any golden parachute payments not previously approved.
We may take advantage of these provisions until the last day of our fiscal year following the fifth anniversary of the date of the first sale of our common equity securities pursuant to an effective registration statement under the Securities Act of 1933, as amended (the "Securities Act"), which such fifth anniversary will occur in 2020. However, if certain events occur prior to the end of such five-year period, including if we become a "large accelerated filer," our gross revenues for any fiscal year equal or exceed $1.0 billion or we issue more than $1.0 billion of non-convertible debt in any three-year period, we will cease to be an emerging growth company prior to the end of such five-year period.
We have elected to take advantage of certain of the reduced disclosure obligations in this prospectus and may elect to take advantage of other reduced reporting requirements in future filings. As a result, the information that we provide to our shareholders may be different than you might receive from other public reporting companies in which you hold equity interests.
9
Common stock offered by us |
4,600,000 shares | |
Common stock to be outstanding after this offering |
8,907,609 shares |
|
Over-allotment option |
690,000 shares |
|
Use of proceeds |
We estimate that we will receive net proceeds from this offering of approximately $49.8 million, based on an assumed initial public offering price of $12.00 per share, the midpoint of the per share price range indicated on the front cover of this prospectus, after deducting underwriting discounts and commissions and estimated offering expenses payable by us. |
|
|
We plan to use approximately $17.1 million (the estimated balance on our revolving credit facility (the "Revolver") plus accrued interest upon completion of this offering) of the net proceeds from this offering to pay down our debt, approximately $6.3 million (or $3.2 million after netting out the proceeds from the common stock purchase described below) to repurchase outstanding preferred stock and pay accrued preferred dividends, and the remainder to fund the growth of our operating subsidiaries and for general corporate purposes. See the section titled "Use of Proceeds." |
|
Risk Factors |
You should read carefully "Risk Factors" in this prospectus for a discussion of factors that you should consider before deciding to invest in our common stock. |
|
Proposed NASDAQ symbol |
CNFR |
Except as otherwise indicated, all information in this prospectus is based upon 4,050,042 shares of common stock outstanding and 60,600 shares of preferred stock outstanding as of March 31, 2015 and:
- •
- excludes 1,377,000 shares of common stock reserved under our 2015 Omnibus Incentive Plan;
- •
- excludes the repurchase of 60,600 of our outstanding shares of preferred stock, including accrued preferred stock dividends, from the
use of $6.3 million (or $3.2 million after netting the proceeds received by us from the sale of common shares described below) of our net proceeds from this offering;
- •
- excludes the sale of 257,567 shares of common stock, assuming an offering price of $12.00, the midpoint of the per share price
range set forth in this prospectus, to the holders of 29,550 shares of our preferred stock that have agreed to sell their preferred stock and to purchase shares of common stock at the initial
offering price;
- •
- assumes the filing of our amended and restated articles of incorporation and the effectiveness of our amended and restated bylaws,
which will occur immediately prior to the completion of this offering;
- •
- assumes no purchase of shares in this offering by our officers and directors;
- •
- assumes no exercise by the underwriters of their option to purchase additional shares;
- •
- excludes the issuance of restricted stock units upon the consummation of the offering; and
- •
- includes the effect of the 10.2-to-1 stock split, effected in the form of a stock dividend, as described under the heading "Description of Capital Stock."
10
SUMMARY CONSOLIDATED FINANCIAL DATA
The following tables set forth summary (i) historical consolidated financial data and (ii) unaudited pro forma condensed consolidated financial data of Conifer Holdings, Inc. and Subsidiaries as of the dates and for the periods indicated. This information should be read in conjunction with the sections of this prospectus entitled "Selected Consolidated Financial and Other Data," "Management's Discussion and Analysis of Financial Condition and Results of Operations," and our historical consolidated financial statements and the related notes and unaudited pro forma condensed consolidated financial information and the related notes thereto included elsewhere in this prospectus.
Summary Historical Consolidated Financial Data
The summary historical consolidated financial data as of and for the years ended December 31, 2014 and 2013, and for the year ended December 31, 2012 were derived from our audited consolidated financial statements and related notes thereto included elsewhere in this prospectus. We have derived the summary historical consolidated financial data as of December 31, 2012 from our audited consolidated balance sheet which is not included in this prospectus. The summary historical consolidated financial data as of and for the three months ended March 3l, 2015 and for the three months ended March 31, 2014 were derived from our unaudited condensed consolidated financial statements and related notes thereto included elsewhere in this prospectus. In the opinion of our management, the unaudited condensed consolidated financial statements have been prepared on the same basis as our audited consolidated financial statements and include all adjustments, consisting of normal recurring adjustments, necessary for a fair presentation of our financial position and results of operations as of such dates and for such periods. Results for the interim periods are not necessarily indicative of the results to be expected for the full year. In addition, these historical results are not necessarily indicative of results to be expected for any future period.
11
| |
Three Months Ended March 31, |
Year Ended December 31, | ||||||||||||||
|---|---|---|---|---|---|---|---|---|---|---|---|---|---|---|---|---|
| |
2015 | 2014 | 2014 | 2013 | 2012 | |||||||||||
| |
(dollars in thousands, except for per share data) |
|||||||||||||||
Operating Results: |
||||||||||||||||
Gross written premiums(1) |
$ | 21,204 | $ | 17,667 | $ | 83,847 | $ | 44,087 | $ | 22,838 | ||||||
Ceded written premiums(2) |
(7,538 | ) | (958 | ) | (17,548 | ) | (6,439 | ) | (543 | ) | ||||||
| | | | | | | | | | | | | | | | | |
Net written premiums |
$ | 13,666 | $ | 16,709 | $ | 66,299 | $ | 37,648 | $ | 22,295 | ||||||
| | | | | | | | | | | | | | | | | |
| | | | | | | | | | | | | | | | | |
| | | | | | | | | | | | | | | | | |
Net earned premiums |
$ | 14,493 | $ | 12,675 | $ | 57,528 | $ | 27,629 | $ | 16,934 | ||||||
Net investment income |
486 | 220 | 1,175 | 1,000 | 1,072 | |||||||||||
Net realized investment gains |
145 | 91 | 417 | 299 | 1,273 | |||||||||||
Gains from acquisitions(3) |
— | — | — | 3,714 | — | |||||||||||
Other income |
489 | 532 | 1,809 | 834 | 309 | |||||||||||
| | | | | | | | | | | | | | | | | |
Total revenue |
15,613 | 13,518 | 60,929 | 33,476 | 19,588 | |||||||||||
| | | | | | | | | | | | | | | | | |
Losses and loss adjustment expenses, net |
8,570 | 10,576 | 40,730 | 15,824 | 7,591 | |||||||||||
Policy acquisition costs |
2,595 | 3,231 | 14,696 | 7,667 | 4,652 | |||||||||||
Operating expenses |
3,692 | 2,894 | 12,139 | 9,161 | 6,520 | |||||||||||
Interest expense |
244 | 129 | 584 | 541 | 428 | |||||||||||
| | | | | | | | | | | | | | | | | |
Total expenses |
15,101 | 16,830 | 68,149 | 33,193 | 19,191 | |||||||||||
| | | | | | | | | | | | | | | | | |
Income (loss) before income taxes |
512 | (3,312 | ) | (7,220 | ) | 283 | 397 | |||||||||
Income tax expense (benefit) |
— | (118 | ) | (281 | ) | 3 | (16 | ) | ||||||||
| | | | | | | | | | | | | | | | | |
Net income (loss) |
512 | (3,194 | ) | (6,939 | ) | 280 | 413 | |||||||||
Less net income (loss) attributable to noncontrolling interest |
49 | 35 | (4 | ) | (69 | ) | — | |||||||||
| | | | | | | | | | | | | | | | | |
Net income (loss) attributable to Conifer |
$ | 463 | $ | (3,229 | ) | $ | (6,935 | ) | $ | 349 | $ | 413 | ||||
| | | | | | | | | | | | | | | | | |
| | | | | | | | | | | | | | | | | |
| | | | | | | | | | | | | | | | | |
Net income (loss) allocable to common shareholders |
$ | 250 | $ | (3,240 | ) | $ | (7,200 | ) | $ | 349 | $ | 413 | ||||
| | | | | | | | | | | | | | | | | |
| | | | | | | | | | | | | | | | | |
| | | | | | | | | | | | | | | | | |
Income (loss) per share allocable to common shareholders, basic and diluted(4) |
$ | 0.06 | $ | (1.51 | ) | $ | (2.69 | ) | $ | 0.20 | $ | 0.24 | ||||
| | | | | | | | | | | | | | | | | |
| | | | | | | | | | | | | | | | | |
| | | | | | | | | | | | | | | | | |
Weighted average common shares outstanding—basic and diluted(4) |
4,040,872 | 2,138,776 | 2,672,440 | 1,749,626 | 1,741,517 | |||||||||||
| | | | | | | | | | | | | | | | | |
| | | | | | | | | | | | | | | | | |
| | | | | | | | | | | | | | | | | |
12
| |
At March 31, | At December 31, | |||||||||||
|---|---|---|---|---|---|---|---|---|---|---|---|---|---|
| |
2015 | 2014 | 2013 | 2012 | |||||||||
| |
(dollars in thousands, except for ratios) |
||||||||||||
Balance Sheet Data: |
|||||||||||||
Cash and invested assets |
$ | 124,021 | $ | 123,726 | $ | 68,445 | $ | 54,618 | |||||
Reinsurance recoverables |
6,814 | 5,139 | 4,394 | 7,978 | |||||||||
Goodwill and intangible assets |
2,257 | 2,275 | 2,349 | 985 | |||||||||
Total assets |
165,753 | 163,738 | 96,856 | 73,712 | |||||||||
Unpaid losses and loss adjustment expenses |
32,987 | 31,531 | 28,908 | 24,843 | |||||||||
Unearned premiums |
43,612 | 43,381 | 26,505 | 11,905 | |||||||||
Senior debt |
28,212 | 27,562 | 13,087 | 11,987 | |||||||||
Total liabilities |
113,879 | 113,460 | 75,605 | 52,097 | |||||||||
Preferred stock(5) |
— | 6,119 | — | — | |||||||||
Total shareholders' equity attributable to Conifer |
51,848 | 44,182 | 21,270 | 21,615 | |||||||||
Other Data: |
|||||||||||||
Shareholders' equity per common share outstanding(4)(6) |
$ | 11.28 | $ | 11.06 | $ | 12.16 | $ | 12.35 | |||||
Regulatory capital and surplus(7) |
$ | 66,795 | $ | 65,974 | $ | 34,817 | $ | 35,600 | |||||
| |
Three Months Ended March 31, |
Year Ended December 31, |
||||||||||||||
|---|---|---|---|---|---|---|---|---|---|---|---|---|---|---|---|---|
GAAP Underwriting Ratios:
|
2015 | 2014 | 2014 | 2013 | 2012 | |||||||||||
Loss ratio(8) |
57 | % | 80 | % | 69 | % | 56 | % | 44 | % | ||||||
Expense ratio(9) |
42 | % | 46 | % | 45 | % | 59 | % | 65 | % | ||||||
| | | | | | | | | | | | | | | | | |
Combined ratio(10) |
99 | % | 126 | % | 114 | % | 115 | % | 109 | % | ||||||
| | | | | | | | | | | | | | | | | |
- (1)
- The
amount received or to be received for insurance policies written or assumed by us during a specific period of time without reduction for acquisition
costs, reinsurance costs or other deductions.
- (2)
- The
amount of written premiums ceded to (reinsured by) other insurers.
- (3)
- The
Company recognized a gain on the accounting for the acquisition of EGI Insurance Services, Inc. and MLBA Mutual Insurance Company in 2013. The
acquisitions were accounted for as a bargain purchase.
- (4)
- All
common stock shares and per share amounts for all periods presented have been adjusted retroactively to reflect the 10.2-to-1 stock split, effected in
the form of a stock dividend, to be effectuated immediately prior to the effectiveness of the initial public offering as contemplated in this prospectus.
- (5)
- In
March 2015, the Company reclassified the carrying amount of its preferred stock of $6,180 from temporary equity to permanent equity as the redemption of
the preferred stock is within the Company's control.
- (6)
- Shareholders'
equity per common share outstanding is shareholders' equity attributable to Conifer (less preferred stock for the March 31, 2015
calculation) divided by the number of common shares outstanding.
- (7)
- For
our insurance subsidiaries, the excess of assets over liabilities as determined in accordance with statutory accounting principles as determined by the
National Association of Insurance Commissioners.
- (8)
- The
loss ratio is the ratio, expressed as a percentage, of net losses and loss adjustment expenses to net earned premiums and other income.
- (9)
- The
expense ratio is the ratio, expressed as a percentage, of policy acquisition costs and operating expenses to net earned premiums and other income.
- (10)
- The combined ratio is the sum of the loss ratio and the expense ratio. A combined ratio under 100% indicates an underwriting profit. A combined ratio over 100% indicates an underwriting loss.
13
Summary Unaudited Pro Forma Condensed Consolidated Financial Data
The unaudited pro forma condensed consolidated financial data as of and for the three months ended March 31, 2015 and for the year ended December 31, 2014 has been derived from the unaudited pro forma condensed consolidated financial information included elsewhere in this prospectus. Refer to "Unaudited Pro Forma Condensed Consolidated Financial Information." The unaudited pro forma condensed consolidated financial data is based on our historical consolidated financial statements and related notes included elsewhere in this prospectus. The unaudited pro forma adjustments are based on available information and assumptions that management believes are reasonable. The unaudited pro forma condensed consolidated balance sheet as of March 31, 2015 and the unaudited pro forma condensed consolidated statements of operations for the three months ended March 31, 2015 and for the year ended December 31, 2014 are presented on a pro forma basis to give effect, in each case, to (i) the exit of the personal automobile product line, (ii) the issuance of the shares of our common stock in this offering and the subsequent use of proceeds, (iii) the issuance of the shares of common stock to certain holders of preferred stock that have agreed to use the cash received from the sale of their preferred stock to purchase shares of common stock, at the per share price of this offering, and (iv) the issuance of the restricted stock units to be granted at the per share price of this offering as if they occurred on March 31, 2015 for balance sheet adjustments and January 1, 2014 for statements of operations adjustments.
The unaudited pro forma condensed consolidated financial data is for informational purposes only, and is not intended to represent what our financial position or results of operations would be after giving effect to (i) the exit of the personal automobile product line, (ii) the issuance of the shares of our common stock in this offering and the subsequent use of proceeds, (iii) the issuance of the shares of common stock to certain holders of preferred stock who have agreed to use the cash received from the sale of their preferred stock to purchase shares of common stock, and (iv) the issuance of the restricted stock units to be granted at the per share price of this offering or to indicate our financial position or results of operations for any future period.
14
| |
Pro Forma | ||||||
|---|---|---|---|---|---|---|---|
| |
Three Months Ended March 31, 2015 |
Year Ended December 31, 2014 |
|||||
| |
(dollars in thousands, except per share amounts) |
||||||
Statements of Operations Data |
|||||||
Revenue |
|||||||
Gross written premiums |
$ | 20,403 | $ | 75,469 | |||
Ceded written premiums |
(7,538 | ) | (17,548 | ) | |||
Change in net unearned premiums |
211 | (11,987 | ) | ||||
| | | | | | | | |
Net earned premiums |
13,076 | 45,934 | |||||
Net investment income |
486 | 1,175 | |||||
Net realized investment gains |
145 | 417 | |||||
Other income |
433 | 1,246 | |||||
| | | | | | | | |
Total revenue |
14,140 | 48,772 | |||||
Expenses |
|||||||
Losses and loss adjustment expenses, net |
7,068 | 30,285 | |||||
Policy acquisition costs |
2,359 | 12,347 | |||||
Operating expenses |
3,698 | 11,204 | |||||
Interest expense |
108 | 277 | |||||
| | | | | | | | |
Total expenses |
13,233 | 54,113 | |||||
| | | | | | | | |
Income (loss) before income taxes |
907 | (5,341 | ) | ||||
Income tax expense (benefit) |
— | (281 | ) | ||||
| | | | | | | | |
Net income (loss) |
907 | (5,060 | ) | ||||
Less net income (loss) attributable to noncontrolling interest |
49 | (4 | ) | ||||
| | | | | | | | |
Net income (loss) attributable to Conifer |
$ | 858 | $ | (5,056 | ) | ||
| | | | | | | | |
| | | | | | | | |
| | | | | | | | |
Net income (loss) allocable to common shareholders |
$ |
858 |
$ |
(5,056 |
) |
||
| | | | | | | | |
| | | | | | | | |
| | | | | | | | |
Income (loss) per share allocable to common shareholders, basic and diluted |
$ | 0.14 | $ | (1.08 | ) | ||
| | | | | | | | |
| | | | | | | | |
| | | | | | | | |
Weighted average common shares outstanding, |
|||||||
Basic |
6,099,670 | 4,664,571 | |||||
| | | | | | | | |
| | | | | | | | |
| | | | | | | | |
Diluted |
6,108,004 | 4,664,571 | |||||
| | | | | | | | |
| | | | | | | | |
| | | | | | | | |
| |
Pro Forma | |||
|---|---|---|---|---|
| |
At March 31, 2015 | |||
| |
(dollars in thousands) |
|||
Balance Sheet Data |
||||
Cash and invested assets |
$ | 151,072 | ||
Reinsurance recoverables |
6,814 | |||
Goodwill and intangible assets |
2,257 | |||
Total assets |
191,993 | |||
Unpaid losses and loss adjustment expenses |
29,287 | |||
Unearned premiums |
42,649 | |||
Senior debt |
10,750 | |||
Total liabilities |
92,459 | |||
Total shareholders' equity attributable to Conifer |
99,508 | |||
15
Investing in our common stock involves a high degree of risk. You should carefully consider the risks described below, as well as the other information in this prospectus, including our financial statements and the related notes and "Management's Discussion and Analysis of Financial Condition and Results of Operations," before deciding whether to invest in our common stock. The occurrence of any of the events or developments described below could harm our business, financial condition, results of operations and growth prospects. In such an event, the market price of our common stock could decline and you may lose all or part of your investment. Additional risks and uncertainties not presently known to us or that we currently deem immaterial also may impair our business operations.
Risks Related to Our Business and Industry
The property and casualty insurance business is historically cyclical, and we may experience periods with excess underwriting capacity and unfavorable premium rates, which could adversely affect our business.
Historically, insurers have experienced significant fluctuations in operating results due to competition, frequency and severity of catastrophic events, levels of capacity, adverse trends in litigation, regulatory constraints, general economic conditions and other factors. We have experienced these types of fluctuations during our Company's brief history. The supply of insurance is related to prevailing prices, the level of insured losses and the level of capital available to the industry that, in turn, may fluctuate in response to changes in rates of return on investments being earned in the insurance industry. As a result, the insurance business historically has been a cyclical industry characterized by periods of intense price competition due to excessive underwriting capacity as well as periods when shortages of capacity increased premium levels. Demand for insurance depends on numerous factors, including the frequency and severity of catastrophic events, levels of capacity, the introduction of new capital providers, and general economic conditions. All of these factors fluctuate and may contribute to price declines generally in the insurance industry.
We cannot predict with certainty whether market conditions will improve, remain constant or deteriorate. Negative market conditions may impair our ability to underwrite insurance at rates we consider appropriate and commensurate relative to the risk assumed. If we cannot underwrite insurance at appropriate rates, our ability to transact business will be materially and adversely affected. Any of these factors could lead to an adverse effect on our business, financial condition and results of operations.
We may be unable to obtain reinsurance coverage at reasonable prices or on terms that provide us adequate protection.
We purchase reinsurance in many of our lines of business to help manage our exposure to insurance risks that we underwrite and to reduce volatility in our results.
The availability and cost of reinsurance are subject to prevailing market conditions, both in terms of price and available capacity, each of which can affect our business volume and profitability. The availability of reasonably affordable reinsurance is a critical element of our business plan. One important way we utilize reinsurance is to reduce volatility in claims payments by limiting our exposure to losses from large risks. Another way we use reinsurance is to purchase substantial protection against concentrated losses when we enter new markets. As a result, our ability to manage volatility and avoid significant losses, expand into new markets or grow by offering insurance to new kinds of enterprises may be limited by the unavailability of reasonably priced reinsurance. We may not be able to obtain reinsurance on acceptable terms or from entities with satisfactory creditworthiness. In such event, if we are unwilling to accept the terms or credit risk of potential reinsurers, we would have to reduce the level of our underwriting commitments, which would reduce our revenues.
16
Many reinsurance companies have begun to exclude certain coverages from, or alter terms in, the reinsurance contracts we enter into with them. Some exclusions relate to risks that we cannot in turn exclude from the policies we write due to business or regulatory constraints. In addition, reinsurers are imposing terms, such as lower per occurrence and aggregate limits, on direct insurers that do not wholly cover the risks written by these direct insurers. As a result, we, like other direct insurance companies, write insurance policies which to some extent do not have the benefit of reinsurance protection. These gaps in reinsurance protection expose us to greater risk and greater potential losses. For example, certain reinsurers have excluded coverage for terrorist acts or priced such coverage at unreasonably high rates. See also "Business—Purchase of Reinsurance."
Severe weather conditions and other catastrophes may result in an increase in the number and amount of claims we incur.
Our property insurance business is exposed to the risk of severe weather conditions and other catastrophes. Catastrophes can be caused by various events, including natural events such as hurricanes, winter weather, tornadoes, windstorms, earthquakes, hailstorms, severe thunderstorms and fires and other events such as explosions or riots. For example, while previously profitable, our Midwest homeowners line incurred significant underwriting losses in 2014 and 2013 due to the extreme cold weather experienced across the nation in these winters and significant hailstorms in 2014. Also, because we are increasing the amount of homeowners insurance that we write in Florida, Hawaii and Texas and other catastrophe exposed states, we have become subject to greater risk due to hurricanes and other tropical storms.
The incidence and severity of catastrophes and severe weather conditions are inherently unpredictable. The extent of losses from a catastrophe is a function of both the total amount of insured exposure in the area affected by the event and the severity of the event. Insurance companies are not permitted to reserve for a catastrophe until it has occurred. Severe weather conditions and catastrophes can cause losses in our property lines and generally result in both an increase in the number of claims incurred and an increase in the dollar amount of each claim asserted, which might require us to increase our reserves and cause our liquidity and financial condition to deteriorate. In addition, our inability to obtain reinsurance coverage at reasonable rates and in amounts adequate to mitigate the risks associated with severe weather conditions and other catastrophes could have a material adverse effect on our business and results of operation.
A decline in our financial strength rating may result in a reduction of new or renewal business.
Participants in the insurance industry use ratings from independent ratings agencies, such as A.M. Best Company, Inc. ("A.M. Best") and Demotech, Inc. ("Demotech"), as an important means of assessing the financial strength and quality of insurers. In setting their ratings, both A.M. Best and Demotech utilize a quantitative and qualitative analysis of a company's balance sheet strength, operating performance and business profile. These analyses include comparisons to peers and industry standards as well as assessments of operating plans, philosophy and management. For A.M. Best, the ratings range from A++, or superior, to F for in liquidation. Demotech's ratings range from "A" (unsurpassed) to M (moderate). As of the date of this prospectus, A.M. Best has assigned financial strength ratings of B++ to CIC (the fifth highest rating level out of sixteen rating levels) and B+ for WPIC (the sixth highest out of sixteen). ACIC is not currently rated by A.M. Best. A rating of B++ for CIC and a rating of B+ for WPIC means A.M. Best considers both companies to have a "good" ability to meet their ongoing insurance obligations, i.e., to pay claims. Each of CIC, WPIC and ACIC are rated "A" by Demotech (the third highest rating level out of six rating levels) as of the date of this prospectus. A financial stability rating of "A" from Demotech indicates "exceptional" financial stability related to maintaining surplus at an acceptable level.
17
A.M. Best and Demotech assign ratings that are intended to provide an independent opinion of an insurance company's ability to meet its obligations to policyholders and such ratings are not evaluations directed to investors. A.M. Best and Demotech periodically review our ratings and may revise them downward or revoke them at their sole discretion based primarily on their analyses of our balance sheet strength (including capital adequacy and loss and loss adjustment expense reserve adequacy), operating performance and business profile. Factors that could affect such analyses include but are not limited to:
- •
- if we change our business practices from our organizational business plan in a manner that no longer supports A.M. Best's or
Demotech's rating;
- •
- if unfavorable financial, regulatory or market trends affect us, including excess market capacity;
- •
- if our losses exceed our loss reserves;
- •
- if we have unresolved issues with government regulators;
- •
- if we are unable to retain our senior management or other key personnel;
- •
- if our investment portfolio incurs significant losses; or
- •
- if A.M. Best or Demotech alters its capital adequacy assessment methodology in a manner that would adversely affect our rating.
These and other factors could result in a downgrade of our rating. A downgrade of our rating could cause our current and future agents, retail brokers and insureds to choose other, more highly-rated competitors. A downgrade of this rating could also increase the cost or reduce the availability of reinsurance to us.
In addition, in view of the earnings and capital pressures recently experienced by many financial institutions, including insurance companies, it is possible that rating organizations will heighten the level of scrutiny that they apply to such institutions, will increase the frequency and scope of their credit reviews, will request additional information from the companies that they rate and may increase the capital and other requirements employed in the rating organizations' models for maintenance of certain ratings levels. It is possible that such reviews of us may result in adverse ratings consequences, which could have a material adverse effect on our financial condition and results of operations. A downgrade or withdrawal of any rating could severely limit or prevent us from writing new and renewal insurance contracts. A downgrade of our rating by A.M. Best could also have adverse consequences under our credit agreement.
We may not be able to manage our growth effectively.
We intend to grow our business in the future, which could require additional capital, systems development and skilled personnel. We cannot assure you that we will be able to locate profitable business opportunities, meet our capital needs, expand our systems and our internal controls effectively, allocate our human resources optimally, identify qualified employees or agents or incorporate effectively the components of any businesses we may acquire in our effort to achieve growth. The failure to manage our growth effectively and maintain underwriting discipline could have a material adverse effect on our business, financial condition and results of operations.
Our investment portfolio is subject to significant market and credit risks, which could result in an adverse impact on our financial condition or results of operations.
Our results of operations depend, in part, on the performance of our investment portfolio. We seek to hold a diversified portfolio of investments that is managed by professional investment advisory management firms in accordance with our investment policy and routinely reviewed by our Investment
18
Committee. However, our investments are subject to general economic conditions and market risks as well as risks inherent to particular securities.
Our primary market risk exposures are to changes in interest rates and equity prices. See "Quantitative and Qualitative Disclosures About Market Risk." As of December 31, 2014 our tax equivalent book yield for our fixed income portfolio was 1.91%. For 2014, our dollar weighted average tax equivalent book yield on our fixed income portfolio was 1.97%. In recent years, interest rates have been at or near historic lows. A protracted low interest rate environment would continue to place pressure on net investment income, particularly related to fixed income securities and short-term investments, which, in turn, may adversely affect our operating results. Our investment portfolio consists primarily of (i) U.S. federal, state and local government bonds, (ii) asset-backed, mortgage-backed and corporate obligation securities and (iii) equity securities. Future increases in interest rates could cause the values of our fixed income securities portfolios to decline, with the magnitude of the decline depending on the duration of our portfolio and the amount by which interest rates increase. Some fixed income securities have call or prepayment options, which represent possible reinvestment risk in declining rate environments. Other fixed income securities such as mortgage-backed and asset-backed securities carry prepayment risk or, in a rising interest rate environment, may not pre-pay as quickly as expected. In addition, individual securities in our fixed income securities portfolio are subject to credit risk and default. Downgrades in the credit ratings of fixed maturities can have a significant negative effect on the market valuation of such securities.
In the event of another financial crisis, such as experienced in 2008 and 2009, we could incur substantial realized and unrealized investment losses in future periods, which would have an adverse impact on our financial condition, results of operations, debt and financial strength ratings, insurance subsidiaries' capital liquidity and ability to access capital markets.
The value of our investment portfolio is subject to the risk that certain investments may default or become impaired due to deterioration in the financial condition of one or more issuers of the securities held, or due to deterioration in the financial condition of an insurer that guarantees an issuer's payments of such investments. Such defaults and impairments could reduce our net investment income and result in realized investment losses.
We also invest in equity securities. These securities are carried on the balance sheet at fair market value and are subject to potential losses and declines in market value. Our equity invested assets totaled just over $4 million at December 31, 2014. These investments were designed to provide diversification of risk and enhance the return on the overall portfolio.
Risks for all types of securities are managed through application of our investment policy, which establishes investment parameters that include but are not limited to maximum percentages of investment in certain types of securities and minimum levels of credit quality, which we believe are within guidelines established by the National Association of Insurance Commissioners ("NAIC") and various state insurance departments, as applicable.
Although we seek to preserve our capital, we cannot be certain that our investment objectives will be achieved, and results may vary substantially over time. In addition, although we seek to employ investment strategies that are not correlated with our insurance exposures, losses in our investment portfolio may occur at the same time as underwriting losses and, therefore, exacerbate the adverse effect of the losses on us.
We operate in a highly competitive environment and we may not continue to be able to compete effectively against larger or more well-established business rivals.
We face competition from other insurance companies, including both specialty and standard insurance companies and underwriting agencies, as well as from diversified financial services companies
19
that are larger than we are and that have greater financial, marketing and other resources than we do. Some of these competitors also have longer experience and more market recognition than we do in certain lines of business.
In particular, competition in the insurance industry is based on many factors, including price of coverage, the general reputation and perceived financial strength of the company, relationships with brokers, terms and conditions of products offered, ratings assigned by independent rating agencies, speed of claims payment and reputation, and the experience and reputation of the members of our underwriting team in the particular lines of insurance we seek to underwrite. See "Business—Competition."
A number of new, proposed or potential legislative or industry developments could further increase competition in our industry. These developments include:
- •
- An increase in capital-raising by companies in our lines of business, which could result in new entrants to our markets and an excess
of capital in the industry;
- •
- The deregulation of commercial insurance lines in certain states and the possibility of federal regulatory reform of the insurance
industry, which could increase competition from standard carriers for our E&S lines of insurance business; and
- •
- Changing practices caused by the Internet may lead to greater competition in the insurance business. Among the possible changes are shifts in the way in which admitted and E&S insurance is purchased. If our distribution model was to be significantly altered by changes in the way admitted and E&S risks were marketed, including, without limitation, through use of the Internet, it could have a material adverse effect on our premiums, underwriting results and profits.
There is no assurance that we will be able to continue to compete successfully in the insurance market. Increased competition in our market could result in a change in the supply and/or demand for insurance, affect our ability to price our products at risk-adequate rates and retain existing business, or underwrite new business on favorable terms. If this increased competition so limits our ability to transact business, our operating results could be adversely affected.
Our actual incurred losses may be greater than our loss and loss adjustment expense reserves, which could have a material adverse effect on our financial condition and results of operations.
Our financial condition and results of operations depend upon our ability to assess accurately the potential losses and loss adjustment expenses under the terms of the insurance policies we underwrite. Reserves do not represent an exact calculation of liability. Rather, reserves represent an estimate of what we expect the ultimate settlement and administration of claims will cost us, and our ultimate liability may be greater or less than our current estimate. These estimates are based on our assessment of facts and circumstances then known, as well as estimates of future trends in claim severity, claim frequency, judicial theories of liability and other factors. These variables are affected by both internal and external events that could increase our exposure to losses, including changes in actuarial projections, claims handling procedures, inflation, severe weather, climate change, economic and judicial trends, and legislative changes. We continually monitor reserves using new information on reported claims and a variety of statistical techniques to update our current estimate.
In the insurance industry, there is always the risk that reserves may prove inadequate. It is possible for insurance companies to underestimate the cost of claims. Our estimates could prove to be low, and this underestimation could have a material adverse effect on our financial strength.
20
Among the uncertainties we encounter in establishing our reserves for losses and related expenses in connection with our insurance businesses are:
- •
- When we write "occurrence" policies, we are obligated to pay covered claims, up to the contractually agreed amount, for any covered
loss that occurs while the policy is in force. Accordingly, claims may arise many years after a policy has lapsed.
- •
- Even when a claim is received (irrespective of whether the policy is a "claims made" or "occurrence" basis form), it may take
considerable time to fully appreciate the extent of the covered loss suffered by the insured and, consequently, estimates of loss associated with specific claims can increase over time.
- •
- New theories of liability are enforced retroactively from time to time by courts. See also "—The effect of emerging claim
and coverage issues on our business is uncertain."
- •
- Volatility in the financial markets, economic events, weather events and other external factors may result in an increase in the
number of claims and the severity of the claims reported. In addition, elevated inflationary conditions would, among other things, drive loss costs to increase.
- •
- If claims became more frequent, even if we had no liability for those claims, the cost of evaluating these potential claims could
escalate beyond the amount of the reserves we have established. If we enter new lines of business, or as a result of new theories of claims, we may encounter an increase in claims frequency and
greater claims handling costs than we had anticipated.
- •
- Estimation of incurred but not reported ("IBNR") losses is a complex and inherently uncertain process which involves a considerable degree of judgment and expertise, which adds to the overall difficulty of estimating loss reserves.
If any of our insurance reserves should prove to be inadequate for the reasons discussed above, or for any other reason, we will be required to increase reserves, resulting in a reduction in our net income and shareholders' equity in the period in which the deficiency is identified. Future loss experience substantially in excess of established reserves could also have a material adverse effect on future earnings and liquidity and financial rating, which would affect our ability to attract business and could affect our ability to retain or hire qualified personnel.
Our risk management is based on estimates and judgments that are subject to significant uncertainties.
Our approach to risk management relies on subjective variables that entail significant uncertainties. For example, we rely heavily on estimates of probable maximum losses for certain events that are generated by computer-run models. In addition, we rely on historical data and scenarios in managing credit and interest rate risks in our investment portfolio. These estimates, models, data and scenarios may not produce accurate predictions and consequently, we could incur losses both in the risks we underwrite and to the value of our investment portfolio.
Small changes in assumptions, which depend heavily on our judgment and foresight, can have a significant impact on the modeled outputs. Although we believe that these probabilistic measures provide a meaningful indicator of the relative risk of certain events and changes to our business overtime, these measures do not predict our actual exposure to, nor guarantee our successful management of, future losses that could have a material adverse effect on our financial condition and results of operations.
21
Any debt service obligations will reduce the funds available for other business purposes, and the terms and covenants relating to our current and future indebtedness could adversely impact our financial performance and liquidity.
As of March 31, 2015, we had an aggregate amount of $28.2 million outstanding under our revolving line of credit and our two term loans, combined. To the extent we incur additional debt in the future for acquisitions, capital expenditures, working capital or otherwise, we will be subject to risks typically associated with debt financing, such as insufficient cash flow to meet required debt service payment obligations and the inability to refinance existing indebtedness. Our credit facility consists of a $17.5 million revolving note (the "Revolver"), which matures August 1, 2016, and two term notes of $7.5 million (the "2014 Term Note") and $5.0 million (the "Original Term Note"). The 2014 Term Note matures September 29, 2019 and the Original Term Note matures July 1, 2018. The interest rate on the Revolver and the Original Term Note at March 31, 2015 was LIBOR (as defined in the credit facility) plus 2.75%. The interest rate on the 2014 Term Note is LIBOR plus 3.25%. At March 31, 2015, we had $17.5 million of borrowings outstanding under the Revolver and had $38,000 of additional borrowing availability under the Revolver.
The Credit Facility contains various restrictive covenants that relate to the Company's shareholders' equity, premiums-to-capital and surplus ratios, fixed-charge coverage ratio, and certain other metrics such as risk-based capital ratios. Certain of the Company's insurance company subsidiaries are also required to maintain minimum A.M. Best ratings.
At December 31, 2014, the Company was in compliance with all of its Credit Facility covenants except as follows: the Company's chairman's ownership fell below the required 50% to 45.6%, the debt service coverage ratio fell below 1.20-to-1.0 to 1.09-to-1.0, the Company's tangible net worth was below the covenant minimum by $800,000 and certain other metrics fell outside a required range.
The Company received waivers for these covenant breaches as of December 31, 2014. The Company expects to meet the debt covenant requirements going forward based upon a combination of amendments to the Credit Facility, effective May 4, 2015, the modification we made to the terms of the preferred stock, effective March 2015 (which requires the preferred stock to be classified as equity for the tangible net worth covenant, see Note 23 to the audited consolidated financial statements included in this prospectus) and improved cash flows from operations. However, if we are unable to meet debt covenant requirements or to obtain future waivers regarding such failures, we could be in breach of our credit agreement. Any such breach could cause significant disruption to our operations, including a requirement to immediately repay our indebtedness, and would have severe adverse effects on our liquidity and financial flexibility.
If we are unable to retain key management and employees or recruit other qualified personnel, we may be adversely affected.
We believe that our future success depends, in large part, on our ability to retain our experienced management team and key employees, particularly our chairman and chief executive officer, James G. Petcoff. There can be no assurance that we can attract and retain the necessary employees to conduct our business activities on a timely basis or at all. Our competitors may offer more favorable compensation arrangements to our key management or employees to incentivize them to leave our Company. Furthermore, our competitors may make it more difficult for us to hire their personnel by offering excessive compensation arrangements to certain employees to induce them not to leave their current employment and bringing litigation against employees who do leave (and possibly us as well) to join us. We do not have employment agreements with any of our executive officers or employees. The loss of any of our executive officers or other key personnel, or our inability to recruit and retain additional qualified personnel as we grow, could materially and adversely affect our business and results of operations, and could prevent us from fully implementing our growth strategies.
22
Adverse economic factors, including recession, inflation, periods of high unemployment or lower economic activity could result in the sale of fewer policies than expected or an increase infrequency or severity of claims and premium defaults or both, which, in turn, could affect our growth and profitability.
Factors, such as business revenue, economic conditions, the volatility and strength of the capital markets and inflation can all affect the business and economic environment in which we operate. These same factors affect our ability to generate revenue and profits. In an economic downturn that is characterized by higher unemployment, declining spending and reduced corporate revenues, the demand for insurance products is adversely affected, which directly affects our premium levels and profitability. Negative economic factors may also affect our ability to receive the appropriate rate for the risk we insure with our policyholders and may adversely affect the number of policies we can write, including with respect to our opportunities to underwrite profitable business. In an economic downturn, our customers may have less need for insurance coverage, cancel existing insurance policies, modify their coverage or not renew with us. Existing policyholders may exaggerate or even falsify claims to obtain higher claims payments. These outcomes would reduce our underwriting profit to the extent these factors are not reflected in the rates we charge.
We distribute our insurance products through a select group of agents, several of which account for a significant portion of our business, and there can be no assurance that such relationships will continue, or if they do continue, that the relationship will be on favorable terms to us. In addition, reliance on agents subjects us to their credit risk.
Our distribution model depends almost entirely on the agencies that distribute our products. In 2014, three select agencies accounted for approximately 48% of our gross written premiums in our personal lines, and four select agencies accounted for approximately 30% of our gross written premiums in our commercial lines. We cannot assure you that these relationships, or our relationships with any of our agencies will continue. Even if the relationships do continue, they may not be on terms that are profitable for us. The termination of a relationship with one or more significant agents could result in lower direct written premiums and could have a material adverse effect on our results of operations or business prospects.
Certain premiums from policyholders, where the business is produced by agents, are collected directly by the agents and forwarded to our insurance subsidiaries. In certain jurisdictions, when the insured pays its policy premium to these agents for payment on behalf of our insurance subsidiaries, the premiums might be considered to have been paid under applicable insurance laws and regulations. Accordingly, the insured would no longer be liable to us for those amounts, whether or not we have actually received the premiums from that agent. Consequently, we assume a degree of credit risk associated with agents. Where necessary, we review the financial condition of potential new agents before we agree to transact business with them. Although failures by agents to remit premiums have not been material to date, there may be instances where agents collect premiums but do not remit them to us and we may be required under applicable law to provide the coverage set forth in the policy despite the absence of premiums.
Because the possibility of these events depends in large part upon the financial condition and internal operations of our agents (which in most cases is not public information), we are not able to quantify the exposure presented by this risk. If we are unable to collect premiums from agents in the future, underwriting profits may decline and our financial condition and results of operations could be materially and adversely affected.
23
We are subject to extensive regulation, which may adversely affect our ability to achieve our business objectives. In addition, if we fail to comply with these regulations, we may be subject to penalties, including fines and suspensions, which may adversely affect our financial condition and results of operations.
Our admitted insurance subsidiaries are subject to extensive regulation, primarily by Michigan (the domiciliary state for CIC and WPIC), Florida (the domiciliary state for American Colonial Insurance Company ("ACIC")), and to a lesser degree, the other jurisdictions in which we operate. Most insurance regulations are designed to protect the interests of insurance policyholders, as opposed to the interests of shareholders. These regulations generally are administered by a department of insurance in each state and relate to, among other things, authorizations to write certain lines of business, capital and surplus requirements, reserve requirements, rate and form approvals, investment and underwriting limitations, affiliate transactions, dividend limitations, cancellation and non-renewal of policies, changes in control, solvency and a variety of other financial and non-financial aspects of our business. These laws and regulations are regularly re-examined and any changes in these laws and regulations or new laws may be more restrictive, could make it more expensive to conduct business or otherwise adversely affect our operations. State insurance departments also conduct periodic examinations of the affairs of insurance companies and require the filing of annual and other reports relating to financial condition, holding company issues and other matters. These regulatory requirements may impose timing and expense or other constraints that could adversely affect our ability to achieve some or all of our business objectives.
In addition, regulatory authorities have broad discretion to deny or revoke licenses for various reasons, including the violation of regulations. In some instances, where there is uncertainty as to applicability, we follow practices based on our interpretations of regulations or practices that we believe are generally followed by the industry. These practices may turn out to be different from the interpretations of regulatory authorities. If we do not have the requisite licenses and approvals or do not comply with applicable regulatory requirements, insurance regulatory authorities could preclude or temporarily suspend us from carrying on some or all of our activities or otherwise penalize us. This could adversely affect our ability to operate our business.
Virtually all states require insurers licensed to do business in that state to bear a portion of the loss suffered by some insureds as the result of impaired or insolvent insurance companies or to bear a portion of the cost of insurance for high-risk or uninsured individuals. Depending on state law, insurers can be assessed up to 2% of premium written for the relevant line of insurance in that state. In addition, states have from time to time passed legislation that has the effect of limiting the ability of insurers to manage catastrophe risk, such as legislation limiting insurers' ability to increase rates and prohibiting insurers from withdrawing from catastrophe-exposed areas. The effect of these arrangements could materially adversely affect our results of operations.
The admitted market is subject to more state regulation than the E&S market, particularly with regard to rate and form filing requirements, restrictions on the ability to exit lines of business, premium tax payments and membership in various state associations, such as guaranty funds. Some states have deregulated their commercial insurance markets. We cannot predict the effect that further deregulation would have on our business, financial condition or results of operations.
The NAIC has developed a system to test the adequacy of statutory capital of U.S.-based insurers, known as risk-based capital or "RBC," that many states have adopted. This system establishes the minimum amount of risk-based capital necessary for a company to support its overall business operations. It identifies property-casualty insurers that may be inadequately capitalized by looking at certain inherent risks of each insurer's assets and liabilities and its mix of net written premiums. Insurers falling below a calculated threshold may be subject to varying degrees of regulatory action, including supervision, rehabilitation or liquidation. Failure to maintain adequate risk-based capital at the required levels could adversely affect the ability of our insurance subsidiaries to maintain regulatory
24
authority to conduct their business. See "Certain Regulatory Considerations—Insurance Regulation—State Regulation."
In addition, the various state insurance regulators have increased their focus on risks within an insurer's holding company system that may pose enterprise risk to the insurer. In 2012, the NAIC adopted significant changes to the insurance holding company act and regulations (the "NAIC Amendments"). The NAIC Amendments, when adopted by the various states, are designed to respond to perceived gaps in the regulation of insurance holding company systems in the United States. One of the major changes is a requirement that an insurance holding company system's ultimate controlling person submit annually to its lead state insurance regulator an "enterprise risk report" that identifies activities, circumstances or events involving one or more affiliates of an insurer that, if not remedied properly, are likely to have a material adverse effect upon the financial condition or liquidity of the insurer or its insurance holding company system as a whole. Other changes include requiring a controlling person to submit prior notice to its domiciliary insurance regulator of a divestiture of control, having detailed minimum requirements for cost sharing and management agreements between an insurer and its affiliates and expanding of the agreements between an insurer and its affiliates to be filed with its domiciliary insurance regulator. The NAIC Amendments must be adopted by the individual state legislatures and insurance regulators in order to be effective. Each of Michigan and Florida, i.e., our two main domiciliary states for both our CIC and WPIC subsidiaries, include a form of the enterprise risk report requirement.
In 2012, the NAIC also adopted the Risk Management and Own Risk and Solvency Assessment Model Act (the "ORSA Model Act"). The ORSA Model Act, when adopted by the various states, will require an insurance holding company system's Chief Risk Officer to submit annually to its lead state insurance regulator an Own Risk and Solvency Assessment Summary Report ("ORSA"). The ORSA is a confidential internal assessment appropriate to the nature, scale and complexity of an insurer, conducted by that insurer of the material and relevant risks identified by the insurer associated with an insurer's current business plan and the sufficiency of capital resources to support those risks. The ORSA Model Act must be adopted by the individual state legislature and insurance regulators in order to be effective. While Michigan has not formally passed the ORSA requirement, both Michigan and Florida have implemented a form "F" filing requirement that is the initial response to the ORSA Model Act.
We cannot predict the impact, if any, that the NAIC Amendments, compliance with the ORSA Model Act or any other regulatory requirements may have on our business, financial condition or results of operations.
The failure of any of the loss limitations or exclusions we employ, or changes in other claims or coverage issues, could have a material adverse effect on our financial condition or results of operations.
Although we seek to mitigate our loss exposure through a variety of methods, the future is inherently unpredictable. It is difficult to predict the timing, frequency and severity of losses with statistical certainty. It is not possible to completely eliminate our exposure to un-forecasted or unpredictable events and, to the extent that losses from such risks occur, our financial condition and results of operations could be materially adversely affected.
For instance, various provisions of our policies, such as limitations or exclusions from coverage or choice of forum, which have been negotiated to limit our risks, may not be enforceable in the manner we intend. At the present time, we employ a variety of endorsements to our policies that limit exposure to known risks. As industry practices and legal, judicial, social and other conditions change, unexpected and unintended issues related to claims and coverage may emerge. These issues may adversely affect our business by either extending coverage beyond the underwriting intent or by increasing the size or number of claims.
25
In addition, we design our E&S lines' policy terms to manage our exposure to expanding theories of legal liability like those which have given rise to claims for lead paint, asbestos, mold, construction defects and environmental matters. Many of the policies we issue also include conditions requiring the prompt reporting of claims to us and entitle us to decline coverage in the event of a violation of that condition. Also, many of our policies limit the period during which a policyholder may bring a claim under the policy, which in many cases is shorter than the statutory period under which such claims can be brought against our policyholders. While these exclusions and limitations help us assess and reduce our loss exposure and help eliminate known exposures to certain risks, it is possible that a court or regulatory authority could nullify or void an exclusion or legislation could be enacted modifying or barring the use of such endorsements and limitations. These types of governmental actions could result in higher than anticipated losses and loss adjustment expenses, which could have a material adverse effect on our financial condition or results of operations. In some instances, these changes may not become apparent until sometime after we have issued insurance policies that are affected by the changes. As a result, the full extent of liability under our insurance contracts may not be known for many years after a contract is issued.
We cannot predict the effect, if any, climate change may have on the risks we insure.
Various scientists, environmentalists, international organizations and regulators believe that global climate change has added, and will continue to add, to the unpredictability, frequency and severity of natural disasters (including, but not limited to, hurricanes, tornados, freezes, droughts, other storms and fires) in certain parts of the world including where we underwrite business. In response to this belief, a number of legal and regulatory measures as well as social initiatives have been introduced in an effort to reduce greenhouse gas and other carbon emissions, which may be chief contributors to global climate change. We cannot predict the impact that changing climate conditions, if any, will have on our results of operations or financial condition. Moreover, we cannot predict how legal, regulatory and social responses to concerns about global climate change will impact our business. To the extent climate change does increase the unpredictability, frequency or severity of natural disasters, we may face increased claims, which could have a material adverse effect on our financial position, results of operations and cash flows.
The effect of emerging claim and coverage issues on our business is uncertain.
As industry practices and legal, judicial, social and other environmental conditions change, unexpected and unintended issues related to claims and coverage may emerge. These issues may adversely affect our business by either broadening coverage beyond our underwriting intent or by increasing the number or size of claims. In some instances, these changes may not become apparent until sometime after we have issued insurance contracts that are affected by the changes. As a result, the full extent of liability under our insurance contracts may not be known for many years after a contract is issued.
Three examples of unanticipated risks that have affected the overall insurance industry are:
- •
- Apportionment of liability for ground settlement assigned to subcontractors who may have been involved in mundane tasks (such as
installing sheetrock in a home).
- •
- Court decisions, such as the 1995 Montrose decision in California that read policy exclusions narrowly so as to expand coverage,
thereby requiring insurers to create and write new exclusions.
- •
- Asbestos liability applied to manufacturers of products and contractors who installed those products.
26
While not all of these examples have directly affected our business, similarly disruptive unanticipated risks could arise in the select markets in which we compete, and would have a disproportionate and adverse effect on our financial condition and results of operations.
Part of our growth strategy involves expansion into areas with a history of severe catastrophic events, the occurrence of which could have a materially adverse effect on our business, financial condition, and results of operations.
Part of our growth strategy involves expanding our property and casualty lines of business into areas of Hawaii, Florida, and Texas that have historically experienced severe catastrophic events such as hurricanes, tornados, and other severe weather events. While we believe that geographic diversification and disciplined underwriting will mitigate our overall exposure, severe weather events are inherently unpredictable. Contemporaneous or near contemporaneous catastrophic events across these geographies, each of which has a history of severe catastrophic events, would have a materially adverse effect on our business, financial condition, and results of operations.
We may become subject to additional government or market regulation which may have a material adverse impact on our business.
Market disruptions like those experienced during the credit-driven financial market collapse in 2008, as well as the dramatic increase in the capital allocated to alternative asset management during recent years, have led to increased governmental as well as self-regulatory scrutiny of the insurance industry in general. In addition, certain legislation proposing greater regulation of the industry is periodically considered by governing bodies of some jurisdictions, and the credit-driven equity market collapse may increase the likelihood that some increased regulation of the industry is mandated.
Our business could be adversely affected by changes in state laws, including those relating to asset and reserve valuation requirements, surplus requirements, limitations on investments and dividends, enterprise risk and risk-based capital requirements and, at the federal level, by laws and regulations that may affect certain aspects of the insurance industry, including proposals for preemptive federal regulation. The U.S. federal government generally has not directly regulated the insurance industry except for certain areas of the market, such as insurance for flood, nuclear and terrorism risks. However, the federal government has undertaken initiatives or considered legislation in several areas that may affect the insurance industry, including tort reform and corporate governance. The Dodd-Frank Wall Street Reform and Consumer Protection Act (the "Dodd-Frank Act") also established the Federal Insurance Office, which is authorized to study, monitor and report to Congress on the insurance industry and to recommend that the Financial Stability Oversight Council (the "FSOC") designate an insurer as an entity posing risks to U.S. financial stability in the event of the insurer's material financial distress or failure. In December 2013, the Federal Insurance Office issued a report on alternatives to modernize and improve the system of insurance regulation in the United States, including increasing national uniformity through either a federal charter or effective action by the states. Any additional regulations established as a result of the Dodd-Frank Act or actions in response to the Federal Insurance Office Report could increase our costs of compliance or lead to disciplinary action. In addition, legislation has been introduced from time to time that, if enacted, could result in the federal government assuming a more direct role in the regulation of the insurance industry, including federal licensing in addition to or in lieu of state licensing and reinsurance for natural catastrophes. We are unable to predict whether any legislation will be enacted or any regulations will be adopted, or the effect any such developments could have on our business, financial condition or results of operations.
It is impossible to predict what, if any, changes in the regulations applicable to us, the markets in which we operate, trade and invest or the counterparties with which we do business may be instituted in the future. Any such regulation could have a material adverse impact on our business.
27
Our operating results have in the past varied from quarter to quarter and may not be indicative of our long-term prospects.
Our operating results are subject to fluctuation and have historically varied from quarter to quarter. We expect our quarterly results to continue to fluctuate in the future due to a number of factors, including the general economic conditions in the markets where we operate, the frequency of occurrence or severity of catastrophic or other insured events, fluctuating interest rates, claims exceeding our loss reserves, competition in our industry, deviations from expected renewal rates of our existing policies and contracts, adverse investment performance and the cost of reinsurance coverage.
In particular, we seek to underwrite products and make investments to achieve favorable returns on common shareholders' equity over the long term. In addition, our opportunistic nature and focus on long-term growth in common shareholders' equity may result in fluctuations in total premiums written from period to period as we concentrate on underwriting contracts that we believe will generate better long-term, rather than short-term, results. Accordingly, our short-term results of operations may not be indicative of our long-term prospects.
We could be forced to sell investments to meet our liquidity requirements.
We invest the premiums we receive from our insureds until they are needed to pay policyholder claims or until they are recognized as profits. Consequently, we seek to manage the duration of our investment portfolio based on the duration of our loss and loss adjustment expense reserves to ensure sufficient liquidity and avoid having to liquidate securities to fund claims. Risks such as inadequate loss and loss adjustment reserves or unfavorable trends in litigation could potentially result in the need to sell investments to fund these liabilities. Such sales could result in significant realized losses depending on the conditions of the general market, interest rates and credit issues with individual securities.
We are subject to credit risk with regard to our reinsurance counterparties.
Although reinsurance makes the assuming reinsurer liable to us to the extent of the risk ceded, we are not relieved of our primary liability to our insureds as the direct insurer. At December 31, 2014, our reinsurance recoverables on paid and unpaid losses and ceded unearned premiums from our three largest reinsurers was $12.6 million in the aggregate. We cannot be sure that our reinsurers will pay all reinsurance claims on a timely basis or at all. For example, reinsurers may default in their financial obligations to us as the result of insolvency, lack of liquidity, operational failure, fraud, asserted defenses based on agreement wordings or the principle of utmost good faith, asserted deficiencies in the documentation of agreements or other reasons. The failure of a reinsurer to pay us does not lessen our contractual obligations to insureds. If a reinsurer fails to pay the expected portion of a claim or claims, our net losses might increase substantially and adversely affect our financial condition. Any disputes with reinsurers regarding coverage under reinsurance contracts could be time-consuming, costly and uncertain of success.
Downgrades to the credit ratings of our reinsurance counterparties may result in the reduction of rating agency capital credit provided by those reinsurance contracts and could, therefore, result in a downgrade of our own credit ratings. We evaluate each reinsurance claim based on the facts of the case, historical experience with the reinsurer on similar claims and existing case law and include any amounts deemed uncollectible from the reinsurer in our reserve for uncollectible reinsurance. See also "Business—Purchase of Reinsurance."
28
We, or agents we have appointed, may act based on inaccurate or incomplete information regarding the accounts we underwrite, or such agents may exceed their authority or commit fraud when binding policies on our behalf.
We, and our very select few managing general agencies and other agents who have the ability to bind our policies, rely on information provided by insureds or their representatives when underwriting insurance policies. While we may make inquiries to validate or supplement the information provided, we may make underwriting decisions based on incorrect or incomplete information. It is possible that we will misunderstand the nature or extent of the activities or facilities and the corresponding extent of the risks that we insure because of our reliance on inadequate or inaccurate information. If any such agents exceed their authority or engage in fraudulent activities, our financial condition and results of operations could be adversely affected.
Our associates could take excessive risks, which could negatively affect our financial condition and business.
As an insurance enterprise, we are in the business of binding certain risks. The associates who conduct our business, including executive officers and other members of management, underwriters, sales managers, investment professionals, product managers, sales agents, and other associates do so in part by making decisions and choices that involve exposing us to risk. These include decisions such as setting underwriting guidelines and standards, product design and pricing, determining which business opportunities to pursue and other decisions. We endeavor, in the design and implementation of our compensation programs and practices, to avoid giving our associates incentives to take excessive risks. Associates may, however, take such risks regardless of the structure of our compensation programs and practices. Similarly, although we employ controls and procedures designed to monitor associates' business decisions and prevent us from taking excessive risks, these controls and procedures may not be effective. If our associates take excessive risks, the impact of those risks could have a material adverse effect on our financial condition and business operations.
We may require additional capital in the future, which may not be available or available only on unfavorable terms.
Our future capital requirements depend on many factors, including our ability to write new and renewal business successfully and to establish premium rates and reserves at levels sufficient to cover losses. Our ability to underwrite depends largely upon the expected quality of our claims paying process and our perceived financial strength as estimated by potential insureds, agents, brokers, other intermediaries and independent rating agencies. To the extent that our existing capital is insufficient to fund our future operating requirements, cover claim losses, or satisfy ratings agencies in order to maintain a satisfactory rating, we may need to raise additional capital in the future through offerings of debt or equity securities or otherwise to:
- •
- fund liquidity needs caused by underwriting or investment losses;
- •
- replace capital lost in the event of significant reinsurance losses or adverse reserve developments;
- •
- satisfy letters of credit or guarantee bond requirements that may be imposed by our clients or by regulators;
- •
- meet rating agency or regulatory capital requirements; or
- •
- respond to competitive pressures.
Any equity or debt financing, if available at all, may be on terms that are unfavorable to us. Further, any additional capital raised through the sale of equity could dilute your ownership interest in
29
the Company and may cause the value of our shares to decline. Additional capital raised through the issuance of debt may result in creditors having rights, preferences and privileges senior or otherwise superior to those of the holders of our shares and may limit our flexibility in operating our business and make it more difficult to obtain capital in the future. Disruptions, uncertainty, or volatility in the capital and credit markets may also limit our access to capital required to operate our business. If we are not able to obtain adequate capital, our business, financial condition and results of operations could be materially adversely affected.
We rely on our systems and employees, and those of certain third-party vendors and service providers in conducting our operations, and certain failures, including internal or external fraud, operational errors, systems malfunctions, or cyber-security incidents, could materially adversely affect our operations.
We are exposed to many types of operational risk, including the risk of fraud by employees and outsiders, clerical and recordkeeping errors and computer or telecommunications systems malfunctions. Our business depends on our ability to process a large number of increasingly complex transactions. If any of our operational, accounting, or other data processing systems fail or have other significant shortcomings, we could be materially adversely affected. Similarly, we depend on our employees. We could be materially adversely affected if one or more of our employees cause a significant operational breakdown or failure, either as a result of human error or intentional sabotage or fraudulent manipulation of our operations or systems.
Third parties with whom we do business, including vendors that provide services or security solutions for our operations, could also be sources of operational and information security risk to us, including from breakdowns, failures, or capacity constraints of their own systems or employees. Any of these occurrences could diminish our ability to operate our business, or cause financial loss, potential liability to insureds, inability to secure insurance, reputational damage or regulatory intervention, which could materially adversely affect us.
We rely mainly on operating systems of third-party providers to issue policies, pay claims, and complete various internal processes. We may be subject to disruptions of such operating systems arising from events that are wholly or partially beyond our control, which may include, for example, electrical or telecommunications outages, natural or man-made disasters, such as earthquakes, hurricanes, floods or tornados, or events arising from terrorist acts. Such disruptions may give rise to losses in service to insureds and loss or liability to us. In addition, there is the risk that our controls and procedures as well as our business continuity, disaster recovery and data security systems prove to be inadequate. The computer systems and network systems we and others use could be vulnerable to unforeseen problems. These problems may arise in both our internally developed systems and the systems of third-party service providers. In addition, our computer systems and network infrastructure present security risks and could be susceptible to hacking, computer viruses or data breaches. Any such failure could affect our operations and could materially adversely affect our results of operations by requiring us to expend significant resources to correct the defect, as well as by exposing us to litigation or losses not covered by insurance. Although we have business continuity plans and other safeguards in place, our business operations may be adversely affected by significant and widespread disruption to our physical infrastructure or operating systems and those of third-party service providers that support our business.
Our operations rely on the secure processing, transmission and storage of confidential information in our computer systems and networks. Our technologies, systems and networks may become the target of cyber-attacks or information security breaches that could result in the unauthorized release, gathering, monitoring, misuse, loss or destruction of our or our insureds' confidential, proprietary and other information, or otherwise disrupt our or our insureds' or other third parties' business operations, which in turn may result in legal claims, regulatory scrutiny and liability, reputational damage, the incurrence of costs to eliminate or mitigate further exposure and the loss of customers. Although to date we have not experienced any material losses relating to cyber-attacks or other information security
30
breaches, there can be no assurance that we will not suffer such losses in the future. Our risk and exposure to these matters remains heightened because of, among other things, the evolving nature of these threats and the outsourcing of some of our business operations. As a result, cyber-security and the continued development and enhancement of our controls, processes and practices designed to protect our systems, computers, software, data and networks from attack, damage or unauthorized access remain a priority. As cyber-threats continue to evolve, we may be required to expend significant additional resources to continue to modify or enhance our protective measures or to investigate and remediate any information security vulnerabilities.
Disruptions or failures in the physical infrastructure or operating systems that support our business and customers, or cyber-attacks or security breaches of the networks, systems or devices that our customers use to access our products and services could result in customer attrition, regulatory fines, penalties or intervention, reputational damage, reimbursement or other compensation costs, and/or additional compliance costs, any of which could materially adversely affect our financial condition or results of operations.
If we are unable to underwrite risks accurately and charge competitive yet profitable rates to our policyholders, our business, financial condition and results of operations will be adversely affected.
In general, the premiums for our insurance policies are established at the time a policy is issued and, therefore, before all of our underlying costs are known. Like other insurance companies, we rely on estimates and assumptions in setting our premium rates. Establishing adequate premium rates is necessary, together with investment income, to generate sufficient revenue to offset losses, loss adjustment expenses ("LAE") and other underwriting costs and to earn a profit. If we do not accurately assess the risks that we assume, we may not charge adequate premiums to cover our losses and expenses, which would adversely affect our results of operations and our profitability. Alternatively, we could set our premiums too high, which could reduce our competitiveness and lead to lower revenues.
Pricing involves the acquisition and analysis of historical loss data and the projection of future trends, loss costs and expenses, and inflation trends, among other factors, for each of our products in multiple risk tiers and many different markets. In order to accurately price our policies, we:
- •
- collect and properly analyze a substantial volume of data from our insureds;
- •
- develop, test and apply appropriate actuarial projections and rating formulas;
- •
- closely monitor and timely recognize changes in trends; and
- •
- project both frequency and severity of our insureds' losses with reasonable accuracy.
We seek to implement our pricing accurately in accordance with our assumptions. Our ability to undertake these efforts successfully and, as a result, accurately price our policies, is subject to a number of risks and uncertainties, including:
- •
- insufficient or unreliable data;
- •
- incorrect or incomplete analysis of available data;
- •
- uncertainties generally inherent in estimates and assumptions;
- •
- our failure to implement appropriate actuarial projections and rating formulas or other pricing methodologies;
- •
- regulatory constraints on rate increases; and
- •
- our failure to accurately estimate investment yields and the duration of our liability for loss and loss adjustment expenses; and unanticipated court decisions, legislation or regulatory action.
31
If actual renewals of our existing contracts do not meet expectations, our premiums written in future years and our future results of operations could be materially adversely affected.
The majority of our contracts are written for a one-year term. In our financial forecasting process, we make assumptions about the renewal of our prior year's contracts. The insurance industry has historically been a cyclical business with intense competition, often based on price. If actual renewals do not meet expectations or if we choose not to write a renewal because of pricing conditions, our premiums written in future years and our future operations would be materially adversely affected.
We may change our underwriting guidelines or our strategy without shareholder approval.
Our management has the authority to change our underwriting guidelines or our strategy without notice to our shareholders and without shareholder approval. As a result, we may make fundamental changes to our operations without shareholder approval, which could result in our pursuing a strategy or implementing underwriting guidelines that may be materially different from the strategy or underwriting guidelines described in the section titled "Business" or elsewhere in this prospectus.
Litigation and legal proceedings against our subsidiaries could have a material adverse effect on our business, financial condition and/or results of operations.
As an insurance holding company, our subsidiaries are named as defendants in various legal actions in the ordinary course of business. We believe that the outcome of presently pending matters, individually and in the aggregate, will not have a material adverse effect on our consolidated financial position, operating results or liquidity. However, the outcomes of lawsuits cannot be predicted and, if determined adversely, could require us to pay significant damage amounts or to change aspects of our operations, which could have a material adverse effect on our financial results.
Changes in accounting practices and future pronouncements may materially affect our reported financial results.
Developments in accounting practices may require us to incur considerable additional expenses to comply, particularly if we are required to prepare information relating to prior periods for comparative purposes or to apply the new requirements retroactively. The impact of changes in current accounting practices and future pronouncements cannot be predicted but may affect the calculation of net income, shareholders' equity and other relevant financial statement line items.
In particular, the U.S. Financial Accounting Standards Board (the "FASB") and the International Accounting Standards Board (the "IASB" and together with the FASB, the "Boards") continue to work jointly on an insurance contract project, although the Boards acknowledge that the resulting standards will not converge. The Boards both issued proposals during 2013 regarding accounting and reporting updates and guidance for insurance contracts which could result in a material change from the current insurance accounting models towards more fair value-based models. The FASB decided that the core accounting framework will remain essentially unchanged for property-casualty insurers, although the required financial statements disclosures will be enhanced.
Additionally, the Boards continue to develop a comprehensive model for accounting and reporting of financial instruments, which may lead to further recognition of fair value changes through net income and changes in the way impairments are measured. Changes resulting from these two projects could have a significant impact on the earnings of insurance industry participants. There remains uncertainty with respect to the final outcome of these two projects.
Further, our U.S. insurance subsidiaries are required to comply with statutory accounting principles ("SAP"). SAP and various components of SAP (such as actuarial reserving methodology) are subject to constant review by the NAIC and its task forces and committees, as well as state insurance
32
departments, in an effort to address emerging issues and otherwise improve financial reporting. Various proposals are pending before committees and task forces of the NAIC, some of which, if enacted, could have negative effects on insurance industry participants. The NAIC continuously examines existing laws and regulations in the United States. We cannot predict whether or in what form such reforms will be enacted and, if so, whether the enacted reforms will positively or negatively affect us.
In addition, the NAIC Accounting Practices and Procedures manual provides that state insurance departments may permit insurance companies domiciled in their jurisdiction to depart from SAP by granting them permitted accounting practices. We cannot predict whether or when the insurance departments of the states of domicile of our competitors may permit them to utilize advantageous accounting practices that depart from SAP, the use of which may not be permitted by the insurance departments of the states of domicile of our U.S. insurance subsidiaries. We can give no assurance that future changes to SAP or components of SAP or the grant of permitted accounting practices to our competitors will not have a negative impact on us.
If Michigan or Florida significantly increases the assessments our insurance companies are required to pay, our financial condition and results of operations will suffer.
Our insurance companies are subject to assessments in Michigan (the domiciliary state for CIC and WPIC) or Florida (the domiciliary state for ACIC) for various purposes, including the provision of funds necessary to fund the operations of the various insurance departments and the state funds that pay covered claims under certain policies written by impaired, insolvent or failed insurance companies. These assessments are generally set based on an insurer's percentage of the total premiums written in the insurer's state within a particular line of business. As our insurance subsidiaries grow, our share of any potential assessments may increase. We cannot predict with certainty the amount of future assessments because they depend on factors outside our control, such as insolvencies of other insurance companies. Significant assessments could result in higher than expected operating expenses and have an adverse effect on our financial condition or results of operations.
Our use of third-party claims administrators in certain lines of business may result in higher losses and loss adjustment expenses.
Since the beginning of our operations in 2009, we have handled all claims using employed staff, including in-house attorneys with litigation experience. As we grow and enter new lines of business, we may use third-party claims administrators and contract employees to administer claims subject to the supervision of our in-house counsel to supplement our internal claims personnel from time to time. It is possible that these contract employees and third-party claims administrators may achieve less desirable results on claims than has historically been the case for our internal counsel, which could result in significantly higher losses and loss adjustment expenses in those lines of business.
Risks Related to Our Initial Public Offering and Ownership of Our Common Stock
There is no existing market for our common stock and we do not know if one will develop. This could impede your ability to sell your shares or depress the market price of our common stock.
Prior to this offering, there was no public market for shares of our common stock. We cannot predict the extent to which investor interest in our common stock will lead to the development of an active trading market on NASDAQ or how liquid that market might become. If an active trading market does not develop, you may have difficulty selling any of our common stock that you buy. The initial public offering price will be determined through negotiations between us and the representatives of our underwriters and might bear no relationship to the price at which our common stock will trade following the completion of this offering. Consequently, you may not be able to sell our common stock at prices equal to or greater than the price you paid in this offering or at all.
33
The price of our common stock may fluctuate significantly and you could lose all or part of your investment.
The trading price of our common stock following this offering is likely to be highly volatile and could be subject to wide fluctuations in response to various factors, some of which are beyond our control, including, without limitation:
- •
- the occurrence of severe weather conditions and other catastrophes;
- •
- our operating and financial performance relative to similar companies;
- •
- publication of research reports or news stories about us, our competitors, or our industry, or positive or negative recommendations or
withdrawal of research coverage by securities analysts;
- •
- the public's reaction to our press releases, our other public announcements and our filings with the SEC;
- •
- announcements by us or our competitors of acquisitions, business plans, or commercial relationships;
- •
- any major change in our board of directors or senior management;
- •
- sales of our common stock by us, our directors, executive officers and principal shareholders;
- •
- adverse market reaction to any indebtedness we may incur or securities we may issue in the future;
- •
- short sales, hedging, and other derivative transactions in our common stock;
- •
- the market's reaction to our reduced disclosure as a result of being an emerging growth company under the JOBS Act;
- •
- our quarterly or annual earnings or those of other companies in our industry;
- •
- exposure to capital market risks related to changes in interest rates, realized investment losses, credit spreads, equity prices,
foreign exchange rates and performance of insurance-linked investments;
- •
- our creditworthiness, financial condition, performance and prospects;
- •
- our dividend policy and whether dividends on our common shares have been, and are likely to be, declared and paid from time to time;
- •
- actual or anticipated growth rates relative to our competitors;
- •
- perceptions of the investment opportunity associated with our common stock relative to other investment alternatives;
- •
- speculation by the investment community regarding our business;
- •
- catastrophes that are perceived by investors as affecting the insurance market in general;
- •
- changes in government regulation;
- •
- general market, economic and political conditions;
- •
- changes in conditions or trends in our industry, geographies or customers;
- •
- changes in accounting standards, policies, guidance, interpretations or principles;
- •
- arrival and departure of key personnel; and
- •
- threatened or actual litigation.
34
In addition, the stock market in general, and the market for insurance companies in particular, has experienced extreme price and volume fluctuations that have often been unrelated or disproportionate to the operating performance of those companies. These fluctuations might be even more pronounced in the trading market for our stock shortly following this offering. Securities class action litigation has often been instituted against companies following periods of volatility in the overall market and in the market price of a company's securities. This litigation, if instituted against us, could result in substantial costs, divert our management's attention and resources, and harm our business, operating results, and financial condition.
As a result of the factors described above, investors in our common stock may not be able to resell their shares at or above the initial public offering price or may not be able to resell them at all. These market and industry factors may materially reduce the market price of our common stock, regardless of our operating performance. In addition, price volatility may be greater if the public float and the trading volume of our common stock are low.
We cannot assure you that we will declare or pay dividends on our common shares in the future so any returns may be limited to the value of our stock.
We currently anticipate that we will retain future earnings for the development, operation and expansion of our business and do not anticipate declaring or paying any cash dividends for the foreseeable future. Any return to shareholders will therefore be limited to the appreciation of their stock. In addition, certain regulatory concerns limit our ability to pay dividends even if we were to determine such dividends were appropriate at this stage of our business development. Because we are a holding company that has no substantial operations of our own, we rely primarily on cash dividends or distributions from our subsidiaries to pay our operating expenses and dividends to shareholders. The payment of dividends by our insurance subsidiaries is limited under the laws and regulations of their respective domicile. These regulations stipulate the maximum amount of annual dividends or other distributions available to shareholders without prior approval of the relevant regulatory authorities. As a result of such regulations, we may not be able to pay our operating expenses as they become due and our payment of future dividends to shareholders may be limited.
In addition, any determination to declare or pay future dividends to our shareholders will be at the discretion of our board of directors and will depend on a variety of factors, including (1) our financial condition, liquidity, results of operations (including our ability to generate cash flow in excess of expenses and our expected or actual net income), retained earnings and collateral and capital requirements, (2) general business conditions, (3) legal, tax and regulatory limitations, (4) contractual prohibitions and other restrictions, (5) the effect of a dividend or dividends upon our financial strength ratings and (6) any other factors that our board of directors deems relevant. See "Dividend Policy."
Our principal shareholders and management own a significant percentage of our stock and will be able to exert significant control over matters subject to shareholder approval.
Prior to this offering, our executive officers, directors, 5% shareholders and their affiliates owned approximately 77.6% of our voting stock as of July 30, 2015 (or 75.6% after giving effect to the preferred stock transactions described herein), and, upon the closing of this offering, that same group will hold approximately 36.6% of our outstanding voting stock (assuming no exercise of the underwriters' over-allotment option) based on the assumed initial public offering price of $12.00 per share. Therefore, even after this offering, these shareholders will have the ability to influence us through their ownership position. These shareholders may be able to determine all matters requiring shareholder approval. For example, these shareholders may be able to control elections of directors, amendments of our organizational documents, or approval of any merger, sale of assets, or other major corporate transaction. This may prevent or discourage unsolicited acquisition proposals or offers for our common stock that you may feel are in your best interest as one of our shareholders.
35
If you purchase our common stock in this offering, you will incur immediate dilution in the book value of your shares.
The initial public offering price is higher than the pro forma net tangible book value per share of our common stock. Investors purchasing common stock in this offering will pay a price per share that exceeds the book value of our tangible assets after subtracting our liabilities. As a result, investors purchasing common stock in this offering will incur immediate dilution of $1.18 per share, based on the assumed initial public offering price of $12.00 per share. Further, investors purchasing common stock in this offering will contribute approximately 52.4% of the total amount invested by shareholders since our inception, but will own only approximately 51.6% of the shares of common stock outstanding after giving effect to this offering.
This dilution is due to our investors who purchased shares prior to this offering having possibly paid substantially less when they purchased their shares than the price offered to the public in this offering. The per share dilution described above gives effect to the issuance of common shares to certain holders of our preferred stock that have agreed to use the cash to be received from the sale of their preferred stock to purchase common stock at the per share price of this offering upon the closing of this offering. In the event the actual offering price is less than $12.00 per share, the midpoint of the per share price range in this prospectus, more shares will be issued to such holders and the dilution to new investors would increase. In addition, we expect to award approximately $4.0 million in restricted stock units to certain executive officers and other employees upon completion of this offering. This issuance will cause further dilution to investors in this offering. As a result of the dilution to investors purchasing shares in this offering, investors may receive significantly less than the purchase price paid in this offering, if anything, in the event of our liquidation. For a further description of the dilution that you will experience immediately after this offering, see "Dilution."
We are an emerging growth company, and we cannot be certain if the reduced reporting requirements applicable to emerging growth companies will make our common stock less attractive to investors.
We are an emerging growth company, as defined in the JOBS Act. For as long as we continue to be an emerging growth company, we may take advantage of exemptions from various reporting requirements that are applicable to other public companies that are not emerging growth companies, including not being required to comply with the auditor attestation requirements of Section 404 of the Sarbanes-Oxley Act, reduced disclosure obligations regarding executive compensation in this prospectus and our periodic reports and proxy statements and exemptions from the requirements of holding nonbinding advisory votes on executive compensation and shareholder approval of any golden parachute payments not previously approved. We could be an emerging growth company for up to five years following the year in which we complete this offering, although circumstances could cause us to lose that status earlier, including if we are deemed to be a "large accelerated filer," as defined under the Exchange Act before that time or if we have total annual gross revenue of $1.0 billion or more during any fiscal year before that time, in which cases we would no longer be an emerging growth company as of the following fiscal year or, if we issue more than $1.0 billion in non-convertible debt during any three year period before that time, we would cease to be an emerging growth company immediately.
Even after we no longer qualify as an emerging growth company, we may still qualify as a "smaller reporting company" which would allow us to take advantage of many of the same exemptions from disclosure requirements including not being required to comply with the auditor attestation requirements of Section 404 of the Sarbanes-Oxley Act and reduced disclosure obligations regarding executive compensation in this prospectus and our periodic reports and proxy statements. We cannot predict if investors will find our common stock less attractive because we may rely on these exemptions. If some investors find our common stock less attractive as a result, there may be a less active trading market for our common stock and our stock price may be more volatile.
36
Under the JOBS Act, emerging growth companies can also delay adopting new or revised accounting standards until such time as those standards apply to private companies. We have irrevocably elected not to avail ourselves of this exemption from new or revised accounting standards and, therefore, will be subject to the same new or revised accounting standards as other public companies that are not emerging growth companies. As a result, changes in rules of U.S. generally accepted accounting principles or their interpretation, the adoption of new guidance or the application of existing guidance to changes in our business could significantly affect our financial position and results of operations.
We will incur significant increased costs as a result of operating as a public company, and our management will be required to devote substantial time to new compliance initiatives.
As a public company, we will incur significant legal, accounting and other expenses that we did not incur as a private company. After completion of this offering, we will be subject to the reporting requirements of the Exchange Act, which will require, among other things, that we file with the SEC, annual, quarterly and current reports with respect to our business and financial condition and therefore will need to have the ability to prepare financial statements that are compliant with all SEC reporting requirements on a timely basis. In addition, we will be subject to other reporting and corporate governance requirements, including certain requirements of NASDAQ and certain provisions of the Sarbanes-Oxley Act and the regulations promulgated thereunder, which will impose significant compliance obligations upon us.
The Sarbanes-Oxley Act and the Dodd-Frank Act, as well as new rules subsequently implemented by the SEC and NASDAQ, have increased regulation of, and imposed enhanced disclosure and corporate governance requirements on, public companies. Our efforts to comply with these evolving laws, regulations and standards will increase our operating costs and divert management's time and attention from revenue-generating activities.
These changes will also place significant additional demands on our finance and accounting staff and on our financial accounting and information systems. We may in the future hire additional accounting and financial staff with appropriate public company reporting experience and technical accounting knowledge. Other expenses associated with being a public company include increases in auditing, accounting and legal fees and expenses, investor relations expenses, increased directors' fees and director and officer liability insurance costs, registrar and transfer agent fees and listing fees, as well as other expenses. As a public company, we will be required, among other things, to:
- •
- prepare and file periodic reports and distribute other shareholder communications, in compliance with the federal securities laws and
requirements of NASDAQ;
- •
- define and expand the roles and the duties of our board of directors and its committees;
- •
- institute more comprehensive compliance, investor relations and internal audit functions; and
- •
- evaluate and maintain our system of internal control over financial reporting, and report on management's assessment thereof, in compliance with rules and regulations of the SEC and the Public Company Accounting Oversight Board.
We may not be successful in implementing these requirements, and implementing them could materially adversely affect our business. The increased costs will decrease our net income or increase our consolidated net loss, and may require us to reduce costs in other areas of our business or increase the prices of our products or services. For example, we expect these rules and regulations to make it more difficult and more expensive for us to obtain director and officer liability insurance and we may be required to incur substantial costs to maintain the same or similar coverage. We cannot predict or estimate the amount or timing of additional costs we may incur to respond to these requirements. The
37
impact of these requirements could also make it more difficult for us to attract and retain qualified persons to serve on our board of directors, our board committees or as executive officers.
In addition, if we fail to implement the required controls with respect to our internal accounting and audit functions, our ability to report our results of operations on a timely and accurate basis could be impaired. If we do not implement the required controls in a timely manner or with adequate compliance, we might be subject to sanctions or investigation by regulatory authorities, such as the SEC or NASDAQ. Any such action could harm our reputation and the confidence of investors in, and clients of, our company and could negatively affect our business and cause the price of our shares to decline.
Failure to maintain effective internal controls in accordance with the Sarbanes-Oxley Act could have a material adverse effect on our business share price.
As a public company with SEC reporting obligations, we will be required to document and test our internal control procedures to satisfy the requirements of Section 404(b) of the Sarbanes-Oxley Act, which will require, beginning with our first Annual Report on Form 10-K to be filed after our first full year as a public company, annual assessments by management of the effectiveness of our internal control over financial reporting. We are an emerging growth company, and thus we are exempt from the auditor attestation requirement of Section 404(b) of the Sarbanes-Oxley Act until such time as we no longer qualify as an emerging growth company. Regardless of whether we qualify as an emerging growth company, we will still need to implement substantial control systems and procedures in order to satisfy the reporting requirements under the Exchange Act and applicable requirements, among other items. During the course of our assessment, we may identify deficiencies that we are unable to remediate in a timely manner. Testing and maintaining our internal control over financial reporting may also divert management's attention from other matters that are important to the operation of our business. We may not be able to conclude on an ongoing basis that we have effective internal control over financial reporting in accordance with Section 404(b) of the Sarbanes-Oxley Act. If we conclude that our internal control over financial reporting is not effective, we cannot be certain as to the timing of completion of our evaluation, testing and remediation actions or its effect on our operations because there is presently no precedent available by which to measure compliance adequacy. Moreover, any material weaknesses or other deficiencies in our internal control over financial reporting may impede our ability to file timely and accurate reports with the SEC. Any of the above could cause investors to lose confidence in our reported financial information or our common share listing on NASDAQ to be suspended or terminated, which could have a negative effect on the trading price of our shares.
Sales of a substantial number of shares of our common stock by our existing shareholders in the public market could cause our stock price to fall.
If our existing shareholders sell, or indicate an intention to sell, substantial amounts of our common stock in the public market after the lock-up agreements and other legal restrictions on resale discussed in this prospectus lapse, the trading price of our common stock could decline. Based on shares of our common stock outstanding as of July 30, 2015, upon the closing of this offering we will have a total of 8,907,609 shares of common stock outstanding, assuming no exercise of the underwriters' over-allotment option. Of these shares, only the shares of common stock sold in this offering by us, plus any shares sold upon exercise of the underwriters' over-allotment option, will be freely tradable without restriction in the public market immediately following this offering. BMO Capital Markets Corp. and Raymond James & Associates, Inc., however, may, in their sole discretion, permit our officers, directors and other shareholders who are subject to these lock-up agreements to sell shares prior to the expiration of the lock-up agreements.
We expect that the lock-up agreements pertaining to this offering will expire 180 days from the date of this prospectus. Upon completion of this offering, 979,036 of our common shares will be
38
eligible for sale subject to the requirements of Rule 144, in addition to the 4,600,000 shares included in this offering, or 5,290,000 if the underwriters exercise their overallotment option. After the lock-up agreements expire, up to an additional 3,328,573 shares of common stock will be eligible for sale in the public market, which shares are held by directors, executive officers and other affiliates and will be subject to volume limitations under Rule 144 under the Securities Act. In addition, shares of common stock that are either subject to outstanding options or reserved for future issuance under our employee benefit plans will become eligible for sale in the public market to the extent permitted by the provisions of various vesting schedules, the lock-up agreements and Rule 144 under the Securities Act. If these additional shares of common stock are sold, or if it is perceived that they will be sold, in the public market, the trading price of our common stock could decline.
Future sales and issuances of our common stock or rights to purchase common stock, including pursuant to our equity incentive plans, could result in additional dilution of the percentage ownership of our shareholders and could cause our stock price to fall.
We expect that significant additional capital may be needed in the future to continue our planned operations, and additional costs associated with operating a public company. To raise capital, we may sell common stock, convertible securities or other equity securities in one or more transactions at prices and in a manner we determine from time to time. If we sell common stock, convertible securities or other equity securities, investors may be materially diluted by subsequent sales. Such sales may also result in material dilution to our existing shareholders, and new investors could gain rights, preferences and privileges senior to the holders of our common stock, including shares of common stock sold in this offering.
We could be subject to securities class action litigation.
In the past, securities class action litigation has often been brought against a company following a decline in the market price of its securities. This risk is especially relevant for us because insurance companies have experienced significant stock price volatility in recent years. If we face such litigation, it could result in substantial costs and a diversion of management's attention and resources, which could harm our business.
We have broad discretion in the use of the net proceeds from this offering and may not use them effectively.
Our management will have broad discretion in the application of the net proceeds from this offering, including for any of the purposes described in the section entitled "Use of Proceeds," and you will not have the opportunity as part of your investment decision to assess whether the net proceeds are being used appropriately. Because of the number and variability of factors that will determine our use of the net proceeds from this offering, their ultimate use may vary substantially from their currently intended use. Our management might not apply our net proceeds in ways that ultimately increase the value of your investment. We expect to use the net proceeds from this offering to pay down our senior credit facility, repurchase our outstanding preferred stock, increase the surplus of our operating entities thereby allowing us to grow and write more premiums overall and for general corporate purposes. The failure by our management to apply these funds effectively could harm our business. If we do not invest or apply the net proceeds from this offering in ways that enhance shareholder value, we may fail to achieve expected financial results, which could cause our stock price to decline.
39
Certain provisions of our corporate governance documents and Michigan law could discourage, delay or prevent a merger or acquisition at a premium price.
Our amended and restated articles of incorporation and bylaws will contain provisions that may make the acquisition of our Company more difficult without the approval of our board of directors (our "Board"). These include provisions that, among other things:
- •
- permit the Board to issue up to 10 million shares of preferred stock, with any rights, preferences and privileges as they may
determine (including the right to approve an acquisition or other change in control);
- •
- provide that the authorized number of directors may be fixed only by the Board in accordance with our amended and restated bylaws;
- •
- do not provide for cumulative voting rights (therefore allowing the holders of a majority of the shares entitled to vote in any
election of directors to elect all of the directors standing for election);
- •
- provide that all vacancies and newly created directorships may be filled by the affirmative vote of a majority of directors then in
office, even if less than a quorum;
- •
- prohibit removal of directors without cause;
- •
- prohibit shareholders from calling special meetings of shareholders;
- •
- requires unanimous consent for shareholders to take action by written consent without approval of the action by our Board;
- •
- provide that shareholders seeking to present proposals before a meeting of shareholders or to nominate candidates for election as
directors at a meeting of shareholders must provide advance notice in writing and also comply with specified requirements related to the form and content of a shareholder's notice;
- •
- require at least 80% supermajority shareholder approval to alter, amend or repeal certain provisions of our amended and restated
articles of incorporation; and
- •
- require at least 80% supermajority shareholder approval in order for shareholders to adopt, amend or repeal our amended and restated bylaws.
These provisions may frustrate or prevent any attempts by our shareholders to replace or remove our current management by making it more difficult for shareholders to replace members of the Board of Directors, which is responsible for appointing members of our management.
In addition, the 2015 Omnibus Incentive Plan permits the Board or a committee thereof to accelerate, vest or cause the restrictions to lapse with respect to outstanding equity awards, in the event of, or immediately prior to, a change in control. Such vesting or acceleration could discourage the acquisition of our Company.
We could also become subject to certain anti-takeover provisions under Michigan law which may discourage, delay or prevent someone from acquiring us or merging with us, whether or not an acquisition or merger is desired by or beneficial to our shareholders. If a corporation's board of directors chooses to "opt in" to certain provisions of Michigan Law, such corporation may not, in general, engage in a business combination with any beneficial owner, directly or indirectly, of 10% of the corporation's outstanding voting shares unless the holder has held the shares for five years or more or, among other things, the board of directors has approved the business combination. Our Board of Directors has not elected to be subject to this provision, but could do so in the future. Any provision of our amended and restated articles of incorporation or bylaws or Michigan law that has the effect of delaying or deterring a change in control could limit the opportunity for our shareholders to receive a
40
premium for their shares, and could also affect the price that some investors are willing to pay for our common stock otherwise.
Our amended and restated bylaws designate the courts of the State of Michigan located in Oakland County and the United States District Court in the Eastern District of Michigan as the sole and exclusive forum for certain types of actions and proceedings that may be initiated by our shareholders, which could limit our shareholders' ability to obtain a favorable judicial forum for disputes with us or our directors, officers or other employees and could discourage lawsuits with respect to such claims.
Our amended and restated bylaws provide that, with certain limited exceptions, unless we consent in writing to the selection of an alternative forum, the courts of the State of Michigan located in Oakland County and the United States District Court in the Eastern District of Michigan will be the sole and exclusive forum for any shareholder (including any beneficial owner) to bring (i) any derivative action or proceeding brought on our behalf, (ii) any action asserting a claim of breach of fiduciary duty owed by any director or officer of the Company owed to us or our shareholders, (iii) any action asserting a claim against us or any director or officer of the Company arising pursuant to any provision of the MBCA or our amended and restated bylaws, or (iv) any action asserting a claim against the Company or any director or officer of the Company otherwise governed by the State of Michigan's internal affairs doctrine. Any person or entity purchasing or otherwise acquiring any interest in shares of our capital stock is deemed to have received notice of and consented to the foregoing provisions. This choice of forum provision may limit a shareholder's ability to bring a claim in a judicial forum that it finds favorable for disputes with us or our directors, officers or other employees, which may discourage such lawsuits against us and our directors, officers and employees. Alternatively, if a court were to find this choice of forum provision inapplicable to, or unenforceable in respect of, one or more of the specified types of actions or proceedings, we may incur additional costs associated with resolving such matters in other jurisdictions, which could adversely affect our business, financial condition or results of operations.
If securities or industry analysts do not publish research or publish inaccurate or unfavorable research about our business, our stock price and trading volume could decline.
The trading market for our common stock will depend in part on the research and reports that securities or industry analysts publish about us or our business. Securities and industry analysts do not currently, and may never, publish research on our company. If no securities or industry analysts commence coverage of our company, the trading price for our stock would likely be negatively impacted. In the event securities or industry analysts initiate coverage, if one or more of the analysts who covers us downgrades our stock or publishes inaccurate or unfavorable research about our business, our stock price may decline. If one or more of these analysts ceases coverage of our company or fails to publish reports on us regularly, demand for our stock could decrease, which might cause our stock price and trading volume to decline.
41
SPECIAL NOTE REGARDING FORWARD-LOOKING STATEMENTS AND INDUSTRY DATA
This prospectus, including the sections titled "Summary," "Risk Factors," "Management's Discussion and Analysis of Financial Condition and Results of Operations," and "Business," contains forward-looking statements. Forward-looking statements convey our current expectations or forecasts of future events. All statements contained in this prospectus, other than statements of historical fact, are forward-looking. You can identify forward-looking statements by terminology such as "anticipates," "believes," "can," "continue," "could," "estimates," "expects," "intends," "may," "plans," "predicts," "potential," "seeks," "should," "will," or "would," or the negative of these terms, or similar expressions.
There are a number of important factors that could cause our actual results to differ materially from the results anticipated by these forward-looking statements. These important factors include, but are not limited to:
- •
- the occurrence of severe weather conditions and other catastrophes;
- •
- the cyclical nature of the insurance industry, resulting in periods during which we may experience excess underwriting capacity and
unfavorable premium rates;
- •
- our ability to obtain reinsurance coverage at reasonable prices or on terms that adequately protect us;
- •
- a decline in our financial strength rating resulting in a reduction of new or renewal business;
- •
- our ability to manage our growth effectively;
- •
- exposure to credit risk, interest rate risk and other market risk in our investment portfolio;
- •
- competition within the property and casualty insurance industry;
- •
- the inherent uncertainty of estimating reserves and the possibility that incurred losses may be greater than our loss and loss
adjustment expense reserves;
- •
- inaccurate estimates and judgments in our risk management may expose us to greater risks than intended;
- •
- the potential loss of key members of our management team or key employees and our ability to attract and retain personnel;
- •
- potential effects on our business of emerging claim and coverage issues;
- •
- losses in our investment portfolio;
- •
- additional government or market regulation;
- •
- a forced sale of investments to meet our liquidity needs;
- •
- our underwriters and other associates could take excessive risks;
- •
- losses resulting from reinsurance counterparties failing to pay us on reinsurance claims;
- •
- the potential impact of internal or external fraud, operational errors, systems malfunctions or cybersecurity incidents;
- •
- an adverse outcome in a legal action that we are or may become subject to in the course of our insurance operations;
- •
- failure to maintain effective internal controls in accordance with Sarbanes-Oxley; and
42
- •
- other factors those that we discuss in this prospectus in the sections titled "Risk Factors" and "Management's Discussion and Analysis of Financial Condition and Results of Operations" in this prospectus.
You should read these factors and the other cautionary statements made in this prospectus as being applicable to all related forward-looking statements wherever they appear in this prospectus. If one or more of these factors materialize, or if any underlying assumptions prove incorrect, our actual results, performance or achievements may vary materially from any future results, performance or achievements expressed or implied by these forward-looking statements. The forward-looking statements contained in this prospectus are excluded from the safe harbor protection provided by the Private Securities Litigation Reform Act of 1995 and Section 27A of the Securities Act which does not extend to initial public offerings. We undertake no obligation to update publicly any forward-looking statements, whether as a result of new information, future events or otherwise, except as required by law.
Unless otherwise indicated, information contained in this prospectus concerning our industry and the markets in which we operate, including our general expectations and market position, market opportunity, and market share, is based on information from various sources (including industry publications, surveys and forecasts, and our internal research), on assumptions that we have made, which we believe are reasonable, based on those data and other similar sources and on our knowledge of the markets for our services. While we believe the market position, market opportunity, and market share information included in this prospectus is generally reliable, such information is inherently imprecise. In addition, projections, assumptions, and estimates of our future performance and the future performance of the industry in which we operate are necessarily subject to a high degree of uncertainty and risk due to a variety of factors, including those described in "Risk Factors" and elsewhere in this prospectus. These and other factors could cause results to differ materially from those expressed in the estimates included in this prospectus.
43
We estimate that the net proceeds to us from this offering will be approximately $49.8 million, based upon an assumed initial public offering price of $12.00 per share, the midpoint of the per share price range set forth on the cover page of this prospectus, after deducting underwriting discounts and commissions and estimated offering expenses payable by us. If the underwriters exercise their over-allotment option in full, the net proceeds to us will be approximately $57.5 million. A $1.00 increase (decrease) in the assumed initial public offering price of $12.00 per share would increase (decrease) the net proceeds to us from this offering by approximately $4.3 million, assuming the number of shares offered by us, as set forth on the cover page of this prospectus, remains the same and after deducting underwriter discounts and estimated offering expenses payable by us.
We expect to use $17.1 million (the estimated balance on our Revolver plus accrued interest upon completion of this offering) of the net proceeds from this offering to pay down our senior debt, $6.3 million (or $3.2 million after netting out the proceeds from preferred shareholders who have agreed to use such proceeds to purchase common stock) to repurchase outstanding preferred stock and pay accrued preferred stock dividends and the balance of the proceeds to fund the growth of our operating subsidiaries and for general corporate purposes. Our preferred stock is perpetual, bears interest at 10% per year on the original issue price, and accrues paid-in-kind ("PIK") interest at 4% per year, compounded quarterly. The PIK interest is payable upon redemption.
In September 2014, the Company entered into an amended and restated credit agreement which increased the total amount available to borrow under the Revolver from $10 million to $17.5 million and provided for a new term note for $7.5 million. The additional borrowings were invested in our operating insurance subsidiaries to support their continued growth.
Our credit facility consists of our $17.5 million Revolver, which matures August 1, 2016, and two term notes of $7.5 million (the "2014 Term Note") and $5.0 million (the "Original Term Note"). The 2014 Term Note matures September 29, 2019 and the Original Term Note matures July 1, 2018. The interest rate of the Revolver and the Original Term Note at December 31, 2014 and March 31, 2015 was LIBOR (as defined in the credit facility) plus 2.75%. The interest rate of the 2014 Term Note is LIBOR plus 3.25%. At March 31, 2015, we had $28.2 million of borrowings outstanding under our credit facility, with $17.5 million of borrowings on the Revolver. We had $38,000 of borrowings availability under the Revolver at March 31, 2015.
44
Neither Michigan law nor our amended and restated articles of incorporation requires our board of directors to declare dividends on our common stock. We are a holding company that has no substantial operations of our own, and we rely primarily on cash dividends or distributions from our subsidiaries to pay our operating expenses and dividends to shareholders. The payment of dividends by our insurance subsidiaries is limited under the laws and regulations of their respective domicile. These regulations stipulate the maximum amount of annual dividends or other distributions available to shareholders without prior approval of the relevant regulatory authorities. Any future determination to declare cash dividends on our common stock will be made at the discretion of our board of directors and will depend on our financial condition, results of operations, capital requirements, general business conditions and other factors that our board of directors may deem relevant. We have not historically paid dividends and do not anticipate paying cash dividends on our common stock for the foreseeable future.
45
The following table sets forth our capitalization as of March 31, 2015, (i) on an actual basis and (ii) on an "as adjusted" basis giving effect to:
- •
- the repurchase of 60,600 shares of our outstanding preferred stock, including accrued preferred stock dividends, from the use
of $6.3 million (or $3.2 million after netting out the proceeds from the common stock purchase described above) of our net proceeds from this offering and the payment of accrued
preferred stock dividends;
- •
- the sale of 4,600,000 shares of common stock in this offering at an assumed initial public offering price of $12.00 per share,
the midpoint of the per share price range set forth on the cover page of this prospectus, and after deducting estimated underwriting discounts and commissions and estimated offering expenses of
$1.5 million payable by us;
- •
- the sale of 257,255 shares of common stock to the holders of 29,550 shares of our preferred stock that have agreed to
sell their preferred stock and to purchase shares of common stock at the initial public offering price, assumed to be $12.00 per share, and proceeds of $3.1 million from the sale thereof; and
- •
- the use of $17.6 million of our net proceeds from this offering to repay outstanding indebtedness, plus accrued interest, on the Revolver.
A $1.00 increase (decrease) in the assumed initial public offering price of $12.00 per share would increase or decrease the net proceeds to us from this offering by approximately $4.3 million, assuming the number of shares offered by us, as listed on the cover of this prospectus, remains the same.
The as adjusted information set forth in the table below is for illustrative purposes only and will adjust based on the actual initial public offering price and other terms of this offering determined at pricing.
You should read the information in this table together with our consolidated financial statements and related notes, the sections entitled "Use of Proceeds," "Selected Consolidated Financial and Other
46
Data," "Management's Discussion and Analysis of Financial Condition and Results of Operations" and the other information appearing elsewhere in this prospectus.
| |
As of March 31, 2015 |
||||||
|---|---|---|---|---|---|---|---|
| |
Actual | As Adjusted(2) |
|||||
| |
(dollars in thousands) |
||||||
Senior debt(1): |
|||||||
Revolver |
$ | 17,462 | $ | — | |||
Term Note |
3,500 | 3,500 | |||||
2014 Term Note |
7,250 | 7,250 | |||||
| | | | | | | | |
Total senior debt |
28,212 | 10,750 | |||||
| | | | | | | | |
Shareholders' equity: |
|||||||
Preferred stock, no par value, 1,000,000 shares authorized; 60,600 shares issued and outstanding; none issued and outstanding, as adjusted |
6,180 | — | |||||
Common stock, no par value, 12,240,000 shares authorized; 12,240,000 authorized, as adjusted; 4,050,042 shares issued and outstanding; 8,907,297 shares issued and outstanding, as adjusted(3) |
46,656 | 99,574 | |||||
Accumulated deficit |
(2,632 | ) | (1,710 | ) | |||
Accumulated other comprehensive income |
1,644 | 1,644 | |||||
| | | | | | | | |
Total shareholders' equity attributable to Conifer |
51,848 | 99,508 | |||||
Noncontrolling interest |
26 | 26 | |||||
| | | | | | | | |
Total equity |
51,874 | 99,534 | |||||
| | | | | | | | |
Total capitalization |
$ | 80,086 | $ | 110,284 | |||
| | | | | | | | |
| | | | | | | | |
| | | | | | | | |
- (1)
- Actual
senior debt includes a revolving credit facility and two amortizing term loans under a credit agreement with a bank. The commitment under the
Revolver provides for $17.5 million in borrowings with interest at LlBOR plus 2.75% or the lender's prime rate plus 1%. The term notes require quarterly principal and interest payments. See
Note 8 to our unaudited condensed consolidated financial statements and Note 11 to our audited consolidated financial statements included elsewhere in the prospectus for additional
information about our senior debt.
- (2)
- The
"as adjusted" basis also gives effect to the exit of the personal automobile product line that had the net impact of decreasing accumulated deficit by
$922 as discussed in the "Unaudited Pro Forma Condensed Consolidated Financial Information."
- (3)
- Shares issued and outstanding, as adjusted, reflects the 257,255 common shares that would have been issued to the preferred shareholders who have agreed to use the proceeds from the repurchase of their preferred stock to purchase common stock, assuming an initial offering price of $12.00 per share, had such transactions occurred on March 31, 2015. Based on the repurchase price of the preferred shares, plus accrued dividends, as of completion of this offering, 257,567 common shares will be issued to such preferred shareholders, assuming an initial offering price of $12.00.
47
As of March 31, 2015, we had net tangible book value of approximately $49.6 million, or $12.25 per share of common stock. Net tangible book value per share represents total tangible assets less total liabilities divided by the number of shares of common stock outstanding. After giving effect to (i) the repurchase of the shares of preferred stock and payment of accrued preferred stock dividends in cash and (ii) the additional number of common shares that will be sold to certain holders of our preferred stock that have agreed to use the cash to be received from the sale of their preferred stock to purchase shares of common stock at the per share price of this offering upon the closing of this offering, our pro forma tangible book value as of March 31, 2015 would have been approximately $46.5 million, or $10.80 per share. Dilution in net tangible book value per share to new investors in this offering represents the difference between the amount per share paid by purchasers of shares of common stock in this offering and the pro forma net tangible book value per share of common stock immediately after the completion of this offering. After giving effect to the sale of the 4,600,000 shares of common stock offered by us in this offering at an assumed initial public offering price of $12.00 per share, the midpoint of the per share price range set forth on the cover page of this prospectus, and after deducting the estimated underwriting discounts and commissions and estimated offering expenses of $1.5 million payable by us, our pro forma as adjusted net tangible book value would have been $96.4 million, or $10.82 per share of common stock. This represents an immediate increase in net tangible book value of $0.02 per share to existing shareholders and an immediate dilution of $1.18 per share to new investors in our common stock. The following table illustrates this dilution on a per share basis:
Assumed initial public offering price per share |
$ | 12.00 | |||||
Pro forma net tangible book value per share as of March 31, 2015 before giving effect to this offering |
$ | 10.80 | |||||
Increase in net tangible book value per share attributable to new investors |
$ | 0.02 | |||||
| | | | | | | | |
Pro forma as adjusted net tangible book value per share after giving effect to this offering |
$ | 10.82 | |||||
| | | | | | | | |
Dilution per share to new investors in this offering |
$ | 1.18 | |||||
| | | | | | | | |
| | | | | | | | |
| | | | | | | | |
Each $1.00 increase (decrease) in the assumed public offering price per share of common stock would increase (decrease) the pro forma as adjusted net tangible book value by $4.3 million and the net tangible book value dilution to investors in this offering by $0.51 per share, assuming the number of shares offered by us, as set forth on the cover page of this prospectus, remains the same and after deducting estimated underwriting discounts and commissions and estimated offering expenses.
If the underwriters exercise their option to purchase additional shares of our common stock in full, the pro forma as adjusted net tangible book value per share after this offering would be $10.84 per share, and the dilution in pro forma as adjusted net tangible book value per share to new investors in this offering would be $1.16 per share.
The following table summarizes, on a pro forma basis as of March 31, 2015 and after giving effect to the offering, based on an assumed initial public offering price of $12.00 per share, the differences between existing shareholders and new investors with respect to the number of shares of common stock
48
purchased from us, the total consideration paid to us and the average price per share paid (in thousands, except per share data and percentages).
| |
|
|
Total Consideration |
|
||||||||||||
|---|---|---|---|---|---|---|---|---|---|---|---|---|---|---|---|---|
| |
Shares Purchased | |
||||||||||||||
| |
Average Price Per Share |
|||||||||||||||
| |
Number | Percent | Amount | Percent | ||||||||||||
Existing shareholders(1) |
4,307,297 | 48.4 | % | $ | 50,195 | 47.6 | % | $ | 11.65 | |||||||
New investors |
4,600,000 | 51.6 | % | $ | 55,200 | 52.4 | % | $ | 12.00 | |||||||
| | | | | | | | | | | | | | | | | |
Total |
8,907,297 | 100.0 | % | $ | 105,395 | 100.0 | % | |||||||||
| | | | | | | | | | | | | | | | | |
| | | | | | | | | | | | | | | | | |
| | | | | | | | | | | | | | | | | |
- (1)
- The number of shares purchased by existing shareholders includes 257,255 shares sold to holders of our preferred stock that have agreed to sell their preferred stock and to purchase shares of common stock at an assumed initial public offering price of $12.00 per share.
If the underwriters exercise their over-allotment option in full, our existing shareholders would own 44.9% and our new investors would own 55.1% of the total number of shares of our common stock outstanding after this offering.
The number of shares of common stock outstanding set forth in the foregoing calculations is based on 4,050,042 shares of common stock outstanding as of March 31, 2015 after giving effect to the additional number of common shares that will be sold to certain holders of our preferred stock that have agreed to use the cash to be received from the sale of their preferred stock to purchase 257,255 shares of common stock at the per share price of this offering upon the closing of this offering. Based on the repurchase price of the preferred shares, plus accrued dividends as of the completion of this offering, 257,567 common shares will be issued to such preferred shareholders, assuming an initial offering price of $12.00. In the event the actual offering price is less than $12.00 per share, more shares will be issued to such holders and the dilution to new investors would increase. The foregoing calculations also exclude additional common shares reserved for future grant or issuance under our 2015 Omnibus Incentive Plan.
49
SELECTED CONSOLIDATED FINANCIAL AND OTHER DATA
The following tables set forth selected consolidated historical financial information of Conifer Holdings, Inc. and Subsidiaries as of the dates and for the periods indicated. The selected financial data as of and for the years ended December 31, 2014 and 2013, and for the year ended December 31, 2012 were derived from our audited consolidated financial statements and related notes thereto included elsewhere in this prospectus. We have derived the selected financial data as of December 31, 2012 from our audited consolidated balance sheet which is not included in this prospectus. The selected financial data as of and for the three months ended March 3l, 2015 and for the three months ended March 31, 2014 were derived from our unaudited condensed consolidated financial statements and related notes thereto included elsewhere in this prospectus. In the opinion of our management, the unaudited condensed consolidated financial statements have been prepared on the same basis as our audited consolidated financial statements and include all adjustments, consisting of normal recurring adjustments, necessary for a fair presentation of our financial position and results of operations as of such dates and for such periods. Results for the interim periods are not necessarily indicative of the results to be expected for the full year.
These historical results are not necessarily indicative of results to be expected for any future period. The following financial information should be read in conjunction with "Management's
50
Discussion and Analysis of Financial Condition and Results of Operations," "Business" and our consolidated financial statements and the related notes thereto included elsewhere in this prospectus.
| |
Three Months Ended March 31, |
Year Ended December 31, | ||||||||||||||
|---|---|---|---|---|---|---|---|---|---|---|---|---|---|---|---|---|
| |
2015 | 2014 | 2014 | 2013 | 2012 | |||||||||||
| |
(dollars in thousands, except for per share data) |
|||||||||||||||
Operating Results: |
||||||||||||||||
Gross written premiums(1) |
$ | 21,204 | $ | 17,667 | $ | 83,847 | $ | 44,087 | $ | 22,838 | ||||||
Ceded written premiums(2) |
(7,538 | ) | (958 | ) | (17,548 | ) | (6,439 | ) | (543 | ) | ||||||
| | | | | | | | | | | | | | | | | |
Net written premiums |
$ | 13,666 | $ | 16,709 | $ | 66,299 | $ | 37,648 | $ | 22,295 | ||||||
| | | | | | | | | | | | | | | | | |
| | | | | | | | | | | | | | | | | |
| | | | | | | | | | | | | | | | | |
Net earned premiums |
$ | 14,493 | $ | 12,675 | $ | 57,528 | $ | 27,629 | $ | 16,934 | ||||||
Net investment income |
486 | 220 | 1,175 | 1,000 | 1,072 | |||||||||||
Net realized investment gains |
145 | 91 | 417 | 299 | 1,273 | |||||||||||
Gains from acquisitions(3) |
— | — | — | 3,714 | — | |||||||||||
Other income |
489 | 532 | 1,809 | 834 | 309 | |||||||||||
| | | | | | | | | | | | | | | | | |
Total revenue |
15,613 | 13,518 | 60,929 | 33,476 | 19,588 | |||||||||||
| | | | | | | | | | | | | | | | | |
Losses and loss adjustment expenses, net |
8,570 | 10,576 | 40,730 | 15,824 | 7,591 | |||||||||||
Policy acquisition costs |
2,595 | 3,231 | 14,696 | 7,667 | 4,652 | |||||||||||
Operating expenses |
3,692 | 2,894 | 12,139 | 9,161 | 6,520 | |||||||||||
Interest expense |
244 | 129 | 584 | 541 | 428 | |||||||||||
| | | | | | | | | | | | | | | | | |
Total expenses |
15,101 | 16,830 | 68,149 | 33,193 | 19,191 | |||||||||||
| | | | | | | | | | | | | | | | | |
Income (loss) before income taxes |
512 | (3,312 | ) | (7,220 | ) | 283 | 397 | |||||||||
Income tax expense (benefit) |
— | (118 | ) | (281 | ) | 3 | (16 | ) | ||||||||
| | | | | | | | | | | | | | | | | |
Net income (loss) |
512 | (3,194 | ) | (6,939 | ) | 280 | 413 | |||||||||
Less net income (loss) attributable to noncontrolling interest |
49 | 35 | (4 | ) | (69 | ) | — | |||||||||
| | | | | | | | | | | | | | | | | |
Net income (loss) attributable to Conifer |
$ | 463 | $ | (3,229 | ) | $ | (6,935 | ) | $ | 349 | $ | 413 | ||||
| | | | | | | | | | | | | | | | | |
| | | | | | | | | | | | | | | | | |
| | | | | | | | | | | | | | | | | |
Net income (loss) allocable to common shareholders |
$ | 250 | $ | (3,240 | ) | $ | (7,200 | ) | $ | 349 | $ | 413 | ||||
| | | | | | | | | | | | | | | | | |
| | | | | | | | | | | | | | | | | |
| | | | | | | | | | | | | | | | | |
Income (loss) per share allocable to common shareholders, basic and diluted(4) |
$ | 0.06 | $ | (1.51 | ) | $ | (2.69 | ) | $ | 0.20 | $ | 0.24 | ||||
| | | | | | | | | | | | | | | | | |
| | | | | | | | | | | | | | | | | |
| | | | | | | | | | | | | | | | | |
Weighted average common shares outstanding, basic and diluted(4) |
4,040,872 | 2,138,776 | 2,672,440 | 1,749,626 | 1,741,517 | |||||||||||
| | | | | | | | | | | | | | | | | |
| | | | | | | | | | | | | | | | | |
| | | | | | | | | | | | | | | | | |
51
| |
At March 31, | At December 31, | |||||||||||
|---|---|---|---|---|---|---|---|---|---|---|---|---|---|
| |
2015 | 2014 | 2013 | 2012 | |||||||||
| |
(dollars in thousands, except for ratios) |
||||||||||||
Balance Sheet Data: |
|||||||||||||
Cash and invested assets |
$ | 124,021 | $ | 123,726 | $ | 68,445 | $ | 54,618 | |||||
Reinsurance recoverables |
6,814 | 5,139 | 4,394 | 7,978 | |||||||||
Goodwill and intangible assets |
2,257 | 2,275 | 2,349 | 985 | |||||||||
Total assets |
165,753 | 163,738 | 96,856 | 73,712 | |||||||||
Unpaid losses and loss adjustment expenses |
32,987 | 31,531 | 28,908 | 24,843 | |||||||||
Unearned premiums |
43,612 | 43,381 | 26,505 | 11,905 | |||||||||
Senior debt |
28,212 | 27,562 | 13,087 | 11,987 | |||||||||
Total liabilities |
113,879 | 113,460 | 75,605 | 52,097 | |||||||||
Preferred stock(5) |
— | 6,119 | — | — | |||||||||
Total shareholders' equity attributable to Conifer |
51,848 | 44,182 | 21,270 | 21,615 | |||||||||
Other Data: |
|||||||||||||
Shareholders' equity per common share outstanding(4)(6) |
$ | 11.28 | $ | 11.06 | $ | 12.16 | $ | 12.35 | |||||
Regulatory capital and surplus(7) |
$ | 66,795 | $ | 65,974 | $ | 34,817 | $ | 35,600 | |||||
| |
Three Months Ended March 31, |
Year Ended December 31, |
||||||||||||||
|---|---|---|---|---|---|---|---|---|---|---|---|---|---|---|---|---|
GAAP Underwriting Ratios:
|
2015 | 2014 | 2014 | 2013 | 2012 | |||||||||||
Loss ratio(8) |
57 | % | 80 | % | 69 | % | 56 | % | 44 | % | ||||||
Expense ratio(9) |
42 | % | 46 | % | 45 | % | 59 | % | 65 | % | ||||||
| | | | | | | | | | | | | | | | | |
Combined ratio(10) |
99 | % | 126 | % | 114 | % | 115 | % | 109 | % | ||||||
| | | | | | | | | | | | | | | | | |
- (1)
- The
amount received or to be received for insurance policies written or assumed by us during a specific period of time without reduction for acquisition
costs, reinsurance costs or other deductions.
- (2)
- The
amount of written premiums ceded to (reinsured by) other insurers.
- (3)
- The
Company recognized a gain on the accounting for the acquisition of EGI Insurance Services, Inc. and MBLA Mutual Insurance Company in 2013. The
acquisitions were accounted for as a bargain purchase.
- (4)
- All
common stock shares and per share amounts for all periods presented have been adjusted retroactively to reflect the 10.2-to-1 stock split, effected in
the form of a stock dividend, to be effectuated immediately prior to the effectiveness of the initial public offering as contemplated in this prospectus.
- (5)
- In
March 2015, the Company reclassified the carrying amount of its preferred stock of $6,180 from temporary equity to permanent equity as the redemption of
the preferred stock is within the Company's control.
- (6)
- Shareholders'
equity per common share outstanding is shareholders' equity attributable to Conifer (less preferred stock for the March 31, 2015
calculation) divided by the number of common shares outstanding.
- (7)
- For
our insurance subsidiaries, the excess of assets over liabilities as determined in accordance with statutory accounting principles as determined by the
National Association of Insurance Commissioners.
- (8)
- The
loss ratio is the ratio, expressed as a percentage, of net losses and loss adjustment expenses to net earned premiums and other income.
- (9)
- The
expense ratio is the ratio, expressed as a percentage, of policy acquisition costs and operating expenses to net earned premiums and other income.
- (10)
- The combined ratio is the sum of the loss ratio and the expense ratio. A combined ratio under 100% indicates an underwriting profit. A combined ratio over 100% indicates an underwriting loss.
52
UNAUDITED PRO FORMA CONDENSED CONSOLIDATED FINANCIAL INFORMATION
In January 2015, we notified our insurance regulator in the State of Florida of our intent to stop writing non-standard personal automobile policies. We discontinued offering and writing new policies on January 27, 2015, but will continue to service existing policies, pay claims and perform other administrative services until existing policies expire and all claims are paid (a process we refer to as "run-off"). We expect the run-off to be substantially complete by the end of 2016. The Company has no plans to provide or write this insurance coverage in the future. We received approval to discontinue offering non-standard personal automobile insurance policies from the State of Florida in April 2015 and had ceased all writings by June 1, 2015. Furthermore, in early 2014, we stopped writing non-standard personal automobile insurance in Illinois. These transactions are referred to herein as "exit of the personal automobile product line."
In addition, we intend to use the proceeds from this offering to repurchase the outstanding shares of preferred stock and to pay accrued preferred stock dividends, to repay outstanding indebtedness under our credit facility (specifically, the Revolver), and the remainder to fund the growth of our operating subsidiaries and for general corporate purposes. Additionally, certain holders of our preferred stock have agreed to use cash to be received from the sale of their preferred stock to purchase shares of common stock at the per share price of this offering. In connection with the contemplated initial public offering, the company will grant an aggregate of 333,333 restricted stock units, under the 2015 Omnibus Incentive Plan, to executive officers and other employees at the per share price of this offering. These transactions are referred to herein as "initial public offering transactions."
The unaudited pro forma condensed consolidated balance sheet at March 31, 2015 gives effect to (i) the exit of the personal automobile product line and (ii) the initial public offering transactions as if they had occurred on March 31, 2015. The unaudited pro forma condensed consolidated statement of operations for the three months ended March 31, 2015 and the year ended December 31, 2014 are presented as if the exit of the personal automobile product line and initial public offering transactions were consummated on January 1, 2014.
The unaudited pro forma condensed consolidated financial information is based on the historical consolidated financial position and results of operations of the Company. The following should be read in conjunction with the Company's historical consolidated financial statements and related notes thereto included in this prospectus.
The unaudited pro forma condensed consolidated financial information was prepared in accordance with Article 11 of Regulation S-X. The pro forma adjustments are based on available information and assumptions that we believe are reasonable. Such adjustments are estimates and are subject to change. Actual results may be materially different than the pro forma information presented herein.
The unaudited pro forma condensed consolidated financial information is provided for informational purposes only and are not intended to represent or be indicative of the consolidated financial position or results of operations that would have been reported had the exit of the personal automobile product line and the initial public offering transactions been completed as of the dates presented, and should not be taken as representative of the future consolidated financial position or results of operations.
53
Unaudited Pro Forma Condensed Consolidated Balance Sheet
As of March 31, 2015
| |
Conifer Holdings, Inc. Historical |
Exit Personal Automobile Product Line (Adjustments— Note 2) |
|
Total | Initial Public Offering Transactions (Adjustments— Note 2) |
|
Conifer Holdings, Inc. Pro Forma |
||||||||||||
|---|---|---|---|---|---|---|---|---|---|---|---|---|---|---|---|---|---|---|---|
| |
(dollars in thousands) |
|
|||||||||||||||||
Assets |
|||||||||||||||||||
Investment securities |
$ | 104,840 | $ | 104,840 | — | $ | 104,840 | ||||||||||||
Cash |
19,181 | (3,441) | (2a) | 15,740 | 51,311 | (2d) | 46,232 | ||||||||||||
|
(6,332) | (2e) | |||||||||||||||||
|
3,087 | (2f) | |||||||||||||||||
|
(17,574) | (2g) | |||||||||||||||||
Premiums and agents' balances receivable, net |
12,926 | (630) | (2a) | 12,296 | — | 12,296 | |||||||||||||
Reinsurance recoverables on unpaid losses |
4,590 | — | 4,590 | — | 4,590 | ||||||||||||||
Reinsurance recoverables on paid losses |
2,224 | — | 2,224 | — | 2,224 | ||||||||||||||
Ceded unearned premiums |
10,567 | — | 10,567 | — | 10,567 | ||||||||||||||
Deferred policy acquisition costs |
6,120 | (41) | (2b) | 6,079 | — | 6,079 | |||||||||||||
Intangible assets, net |
1,153 | — | 1,153 | — | 1,153 | ||||||||||||||
Goodwill |
1,104 | — | 1,104 | — | 1,104 | ||||||||||||||
Other assets |
3,048 | — | 3,048 | (140) | (2d) | 2,908 | |||||||||||||
| | | | | | | | | | | | | | | | | | | | |
Total assets |
$ | 165,753 | $ | (4,112) | $ | 161,641 | $ | 30,352 | $ | 191,993 | |||||||||
| | | | | | | | | | | | | | | | | | | | |
| | | | | | | | | | | | | | | | | | | | |
| | | | | | | | | | | | | | | | | | | | |
Liabilities and Equity |
|||||||||||||||||||
Liabilities: |
|||||||||||||||||||
Unpaid loss and loss adjustment expenses |
$ | 32,987 | $ | (3,700) | (2a) | $ | 29,287 | $ | — | $ | 29,287 | ||||||||
Unearned premiums |
43,612 | (963) | (2c) | 42,649 | — | 42,649 | |||||||||||||
Reinsurance premiums payable |
4,403 | — | 4,403 | — | 4,403 | ||||||||||||||
Senior debt |
28,212 | — | 28,212 | (17,462) | (2g) | 10,750 | |||||||||||||
Accounts payable and accrued expenses |
3,517 | (143) | (2a) | 3,374 | (112) | (2g) | 3,262 | ||||||||||||
Other liabilities |
1,148 | (228) | (2a) | 920 | 1,340 | (2d) | 2,108 | ||||||||||||
|
(152) | (2e) | |||||||||||||||||
| | | | | | | | | | | | | | | | | | | | |
Total liabilities |
113,879 | (5,034) | 108,845 | (16,386) | 92,459 | ||||||||||||||
Shareholders' equity: |
|
|
|||||||||||||||||
Preferred stock |
6,180 | — | 6,180 | (6,180) | (2e) | — | |||||||||||||
Common stock, no par value |
46,656 | — | 46,656 | 49,831 | (2d) | 99,574 | |||||||||||||
|
3,087 | (2f) | |||||||||||||||||
Retained earnings (accumulated deficit) |
(2,632) | (41) | (2b) | (1,710) | — | (1,710) | |||||||||||||
|
963 | (2c) | |||||||||||||||||
Accumulated other comprehensive income |
1,644 | — | 1,644 | — | 1,644 | ||||||||||||||
| | | | | | | | | | | | | | | | | | | | |
Total shareholders' equity attributable to Conifer |
51,848 | 922 | 52,770 | 46,738 | 99,508 | ||||||||||||||
Noncontrolling interest |
26 | — | 26 | — | 26 | ||||||||||||||
| | | | | | | | | | | | | | | | | | | | |
Total equity |
51,874 | 922 | 52,796 | 46,738 | 99,534 | ||||||||||||||
| | | | | | | | | | | | | | | | | | | | |
Total liabilities and equity |
$ | 165,753 | $ | (4,112) | $ | 161,641 | $ | 30,352 | $ | 191,993 | |||||||||
| | | | | | | | | | | | | | | | | | | | |
| | | | | | | | | | | | | | | | | | | | |
| | | | | | | | | | | | | | | | | | | | |
See notes to unaudited pro forma condensed consolidated financial information.
54
Unaudited Pro Forma Condensed Consolidated Statement of Operations
Three Months Ended March 31, 2015
| |
Conifer Holdings, Inc. Historical |
Exit Private Passenger Automobile Product Line (Adjustments— Note 3) |
|
Total | Initial Public Offering Transactions (Adjustments— Note 3) |
|
Conifer Holdings, Inc. Pro Forma |
|
|||||||||||||
|---|---|---|---|---|---|---|---|---|---|---|---|---|---|---|---|---|---|---|---|---|---|
| |
(dollars in thousands, except per share amounts) |
|
|||||||||||||||||||
Revenue |
|||||||||||||||||||||
Gross written premiums |
$ | 21,204 | $ | (801) | (3a) | $ | 20,403 | $ | — | $ | 20,403 | ||||||||||
Ceded written premiums |
(7,538 | ) | — | (7,538 | ) | — | (7,538 | ) | |||||||||||||
Change in net unearned premiums |
827 | (616) | (3a) | 211 | — | 211 | |||||||||||||||
| | | | | | | | | | | | | | | | | | | | | | |
Net earned premiums |
14,493 | (1,417) | 13,076 | — | 13,076 | ||||||||||||||||
Net investment income |
486 | — | 486 | — | 486 | ||||||||||||||||
Net realized investment gains |
145 | — | 145 | — | 145 | ||||||||||||||||
Other income |
489 | (56) | (3a) | 433 | — | 433 | |||||||||||||||
| | | | | | | | | | | | | | | | | | | | | | |
Total revenue |
15,613 | (1,473) | 14,140 | — | 14,140 | ||||||||||||||||
Expenses |
|
|
|
||||||||||||||||||
Losses and loss adjustment expenses, net |
8,570 | (1,502) | (3a) | 7,068 | — | 7,068 | |||||||||||||||
Policy acquisition costs |
2,595 | (236) | (3a) | 2,359 | — | 2,359 | |||||||||||||||
Operating expenses |
3,692 | (194) | (3a) | 3,498 | 200 | (3b) | 3,698 | ||||||||||||||
Interest expense |
244 | — | 244 | (136) | (3c) | 108 | |||||||||||||||
| | | | | | | | | | | | | | | | | | | | | | |
Total expenses |
15,101 | (1,932) | 13,169 | 64 | 13,233 | ||||||||||||||||
| | | | | | | | | | | | | | | | | | | | | | |
Income (loss) before income taxes |
512 | 459 | 971 | (64) | 907 | ||||||||||||||||
Income tax expense (benefit) |
— | — | — | — | (3e) | — | |||||||||||||||
| | | | | | | | | | | | | | | | | | | | | | |
Net income (loss) |
512 | 459 | 971 | (64) | 907 | ||||||||||||||||
Less net income attributable to noncontrolling interest |
49 | — | 49 | — | 49 | ||||||||||||||||
| | | | | | | | | | | | | | | | | | | | | | |
Net income attributable to Conifer |
$ | 463 | $ | 459 | $ | 922 | $ | (64) | $ | 858 | |||||||||||
| | | | | | | | | | | | | | | | | | | | | | |
| | | | | | | | | | | | | | | | | | | | | | |
| | | | | | | | | | | | | | | | | | | | | | |
Net income allocable to common shareholders |
$ | 250 | $ | 858 | (3d) | ||||||||||||||||
| | | | | | | | | | | | | | | | | | | | | | |
| | | | | | | | | | | | | | | | | | | | | | |
| | | | | | | | | | | | | | | | | | | | | | |
Income per share allocable to common shareholders, basic and diluted (Note 5) |
$ | 0.06 | $ | 0.14 | |||||||||||||||||
| | | | | | | | | | | | | | | | | | | | | | |
| | | | | | | | | | | | | | | | | | | | | | |
| | | | | | | | | | | | | | | | | | | | | | |
Weighted average common shares outstanding, |
|||||||||||||||||||||
Basic |
4,040,872 | 6,099,670 | |||||||||||||||||||
| | | | | | | | | | | | | | | | | | | | | | |
| | | | | | | | | | | | | | | | | | | | | | |
| | | | | | | | | | | | | | | | | | | | | | |
Diluted |
4,040,872 | 6,108,004 | |||||||||||||||||||
| | | | | | | | | | | | | | | | | | | | | | |
| | | | | | | | | | | | | | | | | | | | | | |
| | | | | | | | | | | | | | | | | | | | | | |
See notes to unaudited pro forma condensed consolidated financial information.
55
Unaudited Pro Forma Condensed Consolidated Statement of Operations
Year ended December 31, 2014
| |
Conifer Holdings, Inc. Historical |
Exit Personal Automobile Product Line (Adjustments— Note 4) |
|
Total | Initial Public Offering Transactions (Adjustments— Note 4) |
|
Conifer Holdings, Inc. Pro Forma |
|
|||||||||||||
|---|---|---|---|---|---|---|---|---|---|---|---|---|---|---|---|---|---|---|---|---|---|
| |
(dollars in thousands, except per share amounts) |
|
|||||||||||||||||||
Revenue |
|||||||||||||||||||||
Gross written premiums |
$ | 83,847 | $ | (8,378 | ) | (4a) | $ | 75,469 | $ | — | $ | 75,469 | |||||||||
Ceded written premiums |
(17,548 | ) | — | (17,548 | ) | — | (17,548) | ||||||||||||||
Change in net unearned premiums |
(8,771 | ) | (3,216 | ) | (4a) | (11,987 | ) | — | (11,987) | ||||||||||||
| | | | | | | | | | | | | | | | | | | | | | |
Net earned premiums |
57,528 | (11,594 | ) | 45,934 | — | 45,934 | |||||||||||||||
Net investment income |
1,175 | — | 1,175 | — | 1,175 | ||||||||||||||||
Net realized investment gains |
417 | — | 417 | — | 417 | ||||||||||||||||
Other income |
1,809 | (563 | ) | (4a) | 1,246 | — | 1,246 | ||||||||||||||
| | | | | | | | | | | | | | | | | | | | | | |
Total revenue |
60,929 | (12,157 | ) | 48,772 | — | 48,772 | |||||||||||||||
Expenses |
|
|
|
||||||||||||||||||
Losses and loss adjustment expenses, net |
40,730 | (10,445 | ) | (4a) | 30,285 | — | 30,285 | ||||||||||||||
Policy acquisition costs |
14,696 | (2,349 | ) | (4a) | 12,347 | — | 12,347 | ||||||||||||||
Operating expenses |
12,139 | (1,735 | ) | (4a) | 10,404 | 800 | (4b) | 11,204 | |||||||||||||
Interest expense |
584 | — | 584 | (307) | (4c) | 277 | |||||||||||||||
| | | | | | | | | | | | | | | | | | | | | | |
Total expenses |
68,149 | (14,529 | ) | 53,620 | (493) | 54,113 | |||||||||||||||
| | | | | | | | | | | | | | | | | | | | | | |
Income (loss) before income taxes |
(7,220 | ) | 2,372 | (4,848 | ) | (493) | (5,341) | ||||||||||||||
Income tax expense (benefit) |
(281 | ) | — | (281 | ) | — | (4e) | (281) | |||||||||||||
| | | | | | | | | | | | | | | | | | | | | | |
Net income (loss) |
(6,939 | ) | 2,372 | (4,567 | ) | (493) | (5,060) | ||||||||||||||
Less net loss attributable to noncontrolling interest |
(4 | ) | — | (4 | ) | — | (4) | ||||||||||||||
| | | | | | | | | | | | | | | | | | | | | | |
Net income (loss) attributable to Conifer |
$ | (6,935 | ) | $ | 2,372 | $ | (4,563 | ) | $ | (493) | $ | (5,056) | |||||||||
| | | | | | | | | | | | | | | | | | | | | | |
| | | | | | | | | | | | | | | | | | | | | | |
| | | | | | | | | | | | | | | | | | | | | | |
Net loss allocable to common shareholders |
$ | (7,200 | ) | $ | (5,056) | (4d) | |||||||||||||||
| | | | | | | | | | | | | | | | | | | | | | |
| | | | | | | | | | | | | | | | | | | | | | |
| | | | | | | | | | | | | | | | | | | | | | |
Loss per share allocable to common shareholders, basic and diluted (Note 5) |
$ | (2.69 | ) | $ | (1.08) | ||||||||||||||||
| | | | | | | | | | | | | | | | | | | | | | |
| | | | | | | | | | | | | | | | | | | | | | |
| | | | | | | | | | | | | | | | | | | | | | |
Weighted average common shares outstanding, basic and diluted |
2,672,440 | 4,664,571 | |||||||||||||||||||
| | | | | | | | | | | | | | | | | | | | | | |
| | | | | | | | | | | | | | | | | | | | | | |
| | | | | | | | | | | | | | | | | | | | | | |
See notes to unaudited pro forma condensed consolidated financial information.
56
NOTES TO UNAUDITED PRO FORMA CONDENSED CONSOLIDATED FINANCIAL
INFORMATION
(dollars in thousands, except per share amounts)
Note 1—Basis of Presentation
The accompanying unaudited pro forma condensed consolidated financial information presents the pro forma condensed financial position and results of operations based upon the historical consolidated financial statements of the Company, as adjusted to reflect (i) the exit of the non-standard personal automobile product line and (ii) the initial public offering transactions, after giving effect to these events and the pro forma adjustments described in the notes. The unaudited pro forma condensed consolidated balance sheet as of March 31, 2015 and the unaudited pro forma condensed consolidated statement of operations for the three months ended March 31, 2015 have been prepared using our unaudited condensed consolidated financial statements for the three months ended March 31, 2015. The unaudited pro forma condensed consolidated statement of operations for the year ended December 31, 2014 has been prepared using our audited consolidated statement of operations for the year ended December 31, 2014. As such, these accompanying unaudited pro forma condensed consolidated financial information should also be read in conjunction with these unaudited and audited consolidated financial statements specifically noted above. The historical financial data has been adjusted to give pro forma effect to events that are (i) directly attributable to the transactions described above and (ii) factually supportable. In addition, the unaudited pro forma condensed consolidated statements of operations only includes adjustments that are expected to have a continuing impact on the operating results. We believe our exit of the personal automobile product line is not a discontinued operation under the guidance of ASU No. 2014-08, "Reporting Discontinued Operations and Disclosures of Disposals of Components of an Entity," therefore the unaudited pro forma condensed consolidated statements of operations are presented for the most recent year ended December 31, 2014 and three month period ended March 31, 2015.
The unaudited pro forma condensed consolidated balance sheet and pro forma condensed consolidated statements of operations adjustments do not give effect to additional costs and expenses that may be incurred during the run-off period of the personal automobile product line, as such additional costs and expenses would not be factually supportable under Article 11 of Regulation S-X.
Note 2—Unaudited Pro Forma Condensed Consolidated Balance Sheet Adjustments as of March 31, 2015
- a)
- Reflects
the adjustment to pay-off in cash the liabilities, net of collection of cash from assets, attributable to the personal automobile product line
during the run-off period.
- b)
- Reflects
the adjustment to write-off deferred policy acquisition costs attributable to personal automobile product line.
- c)
- Reflects
the adjustment to reverse premiums that have been collected and will be recognized as revenue when earned during the run-off period.
- d)
- Reflects the adjustment for the net proceeds received in the sale of 4,600,000 common shares in this initial public offering at an assumed initial public offering price of $12.00 per share, the midpoint of the per share price range set forth on the cover page of this prospectus, and after deducting estimated underwriting discounts and commissions, and estimated offering expenses payable by us. Included in the consolidated balance sheet are $140 of costs directly related to the offering. We incurred $1,340 of additional offering related costs subsequent to March 31, 2015. This adjustment includes the recognition of the additional costs incurred and the reclassification of the total amount to be charged to common stock.
57
NOTES TO UNAUDITED PRO FORMA CONDENSED CONSOLIDATED FINANCIAL
INFORMATION (Continued)
(dollars in thousands, except per share amounts)
Note 2—Unaudited Pro Forma Condensed Consolidated Balance Sheet Adjustments as of March 31, 2015 (Continued)
- e)
- Reflects
the adjustment for the repurchase of 60,600 shares of our outstanding preferred stock at the original purchase price plus all accrued and unpaid
preferred dividends from the use of $6,332 of net proceeds from this initial public offering.
- f)
- Reflects
the adjustment for the cash to be received to purchase 257,255 shares of common stock at the initial public offering price, assumed to be $12.00 per
share, the midpoint of the per share price range, from certain holders of our preferred stock that have agreed to use the cash to be received from the sale of their preferred stock to purchase shares
of common stock at the per share price of this offering.
- g)
- Reflects the adjustment for the repayment of $17,574 of the outstanding indebtedness, including accrued interest, net of an accrual for a commitment fee that would have been charged on the Revolver, from the use of net proceeds from this initial public offering.
Note 3—Unaudited Pro Forma Condensed Consolidated Statement of Operations Adjustments for the Three Months Ended March 31, 2015
- a)
- Reflects
the adjustment to remove the results of operations of the personal automobile product line.
- b)
- Reflects
the grant of restricted stock units to be settled in shares of common stock with a total value of such awards of $4.0 million. The Company
will grant 333,333 restricted stock units to executive officers and other employees at the per share price in this offering, assuming an initial offering price of $12.00 per share, the midpoint of the
per share price range set forth in this prospectus. The restricted stock units vest in five equal annual installments, commencing on the first anniversary from the date of grant. The adjustment was
$200 for the three months ended March 31, 2015. For purposes of the pro forma condensed consolidated statement of operations, the expense is recognized as if the grant date was
January 1, 2014.
- c)
- To
eliminate the Company's historical interest expense of $145, net of a commitment fee that would have been charged, related to the outstanding indebtedness
on the Revolver, which will be repaid from the use of net proceeds from this initial public offering.
- d)
- To
eliminate the dividends on preferred stock of $213 in determining net loss allocable to common shareholders resulting from the repurchase of the
outstanding preferred stock from the use of net proceeds from this initial public offering.
- e)
- There was no adjustment to income tax expense as any income tax provision would be offset by the valuation allowance.
Note 4—Unaudited Pro Forma Condensed Consolidated Statement of Operations Adjustments for the Year Ended December 31, 2014
- a)
- Reflects
the adjustment to remove the results of operations of the personal automobile product line.
- b)
- Reflects the grant of restricted stock units to be settled in shares of common stock with a total value of such awards of $4.0 million. The Company will grant 333,333 restricted stock units to executive officers and other employees at the per share price in this offering, assuming an initial offering price of $12.00 per share, the midpoint of the per share price range set forth in this prospectus. The restricted stock units vest in the five equal annual installments, commencing on the first anniversary from the date of grant. The adjustment was $800 for the year ended December 31, 2014. For purposes of the pro forma condensed consolidated statement of operations, the expense is recognized as if the grant date was January 1, 2014.
58
NOTES TO UNAUDITED PRO FORMA CONDENSED CONSOLIDATED FINANCIAL
INFORMATION (Continued)
(dollars in thousands, except per share amounts)
Note 4—Unaudited Pro Forma Condensed Consolidated Statement of Operations Adjustments for the Year Ended December 31, 2014 (Continued)
- c)
- To
eliminate the Company's historical interest expense of $332, net of a commitment fee that would have been charged, related to the outstanding indebtedness
on the Revolver, which will be repaid from the use of net proceeds from this initial public offering.
- d)
- To
eliminate the dividends on preferred stock of $265 in determining net loss allocable to common shareholders resulting from the repurchase of the
outstanding preferred stock from the use of net proceeds from this initial public offering.
- e)
- There was no adjustment to income tax expense as any income tax provision would be offset by the valuation allowance.
59
NOTES TO UNAUDITED PRO FORMA CONDENSED CONSOLIDATED FINANCIAL
INFORMATION (Continued)
(dollars in thousands, except per share amounts)
Note 5—Unaudited Pro Forma Income (Loss) Per Share Allocable to Common Shareholders
Pro forma income (loss) per share allocable to common shareholders, basic and diluted, and pro forma weighted average common shares outstanding, basic and diluted, are based on the historical weighted average number of our common shares outstanding, basic and diluted, for the respective year ended December 31, 2014 and three month period ended March 31, 2015, adjusted only for the additional number of common shares issued in this offering for: (i) the proceeds from which were used to repurchase shares of preferred stock, including accrued preferred stock dividends, and (ii) repay the outstanding indebtedness on the Revolver, including accrued interest, as if these shares had been issued and outstanding as of January 1, 2014, the beginning of the earliest year presented. The pro forma income (loss) per share allocable to common shareholders, basic and diluted, also gives effect to the elimination of preferred stock dividends on the outstanding preferred stock repurchased with the use of net proceeds from this offering and the grant of 333,333 restricted stock units in connection with this offering. Net income (loss) attributable to Conifer and the weighted average common shares used in calculating basic and diluted pro forma income (loss) per share allocable to common shareholders is as follows:
| |
Pro Forma | ||||||
|---|---|---|---|---|---|---|---|
| |
Three Months Ended March 31, 2015 |
Year Ended December 31, 2014 |
|||||
| |
(dollars in thousands except per share amounts) |
||||||
Numerator: |
|||||||
Net income (loss) attributable to Conifer; proforma numerator for basic and diluted income (loss) per share |
$ | 858 | $ | (5,056 | ) | ||
| | | | | | | | |
Denominator: |
|||||||
Historical weighted average common shares |
4,040,872 | 2,672,440 | |||||
Additional number of common shares to: |
|||||||
Repurchase preferred shares and pay accured dividends totaling $6,332 at price of $12.00 per share |
527,652 | 527,652 | |||||
Repay the balance on the Revolver, including accured interest, of $17,574 at price of $12.00 per share |
1,464,479 | 1,464,479 | |||||
Vested restricted shares |
66,667 | — | |||||
| | | | | | | | |
Pro forma weighted average common shares, basic |
6,099,670 | 4,664,571 | |||||
| | | | | | | | |
Weighted average diluted potential shares—non-vested restricted stock units |
8,334 | — | |||||
| | | | | | | | |
Pro forma weighted average common shares, diluted |
6,108,004 | 4,664,571 | |||||
| | | | | | | | |
| | | | | | | | |
| | | | | | | | |
Pro forma income (loss) per share allocable to common shareholders, basic and diluted |
$ | 0.14 | $ | (1.08 | ) | ||
| | | | | | | | |
| | | | | | | | |
| | | | | | | | |
Restricted stock units that are expected to be granted in connection with the offering have been reflected in the calculation of pro forma diluted income (loss) per share allocable to common shareholders using the treasury stock method. In applying the treasury stock method, the Company has assumed that the weighted average share price during the period is equal to the offering price. The restricted stock units have been excluded from the calculation of pro forma diluted income (loss) per share for the year ended December 31, 2014 because they are not dilutive.
All common stock shares and per share amounts for all periods presented have been adjusted retroactively to reflect the 10.2-to-1 stock split, effected in the form of a stock dividend, to be effectuated immediately prior to the effectiveness of the initial public offering as contemplated in this prospectus.
60
MANAGEMENT'S DISCUSSION AND ANALYSIS OF
FINANCIAL CONDITION AND RESULTS OF OPERATIONS
The following discussion and analysis of our financial condition and results of operations should be read in conjunction with "Selected Consolidated Financial and Other Data" and our consolidated financial statements and related notes included elsewhere in this prospectus. Furthermore, the statements included herein that are not based solely on historical facts are "forward looking statements." Such forward-looking statements are based on current expectations and assumptions that are subject to risks and uncertainties. Our actual results could differ materially from those anticipated by us in these forward-looking statements as a result of various factors, including those discussed below and elsewhere in this prospectus, particularly under the section titled "Risk Factors."
Overview
We are an insurance holding company and market and service our product offerings through specialty commercial and specialty personal insurance business lines. Our growth has been significant since our founding in 2009. Our gross premium written increased from $14.0 million in 2011, to $83.8 million in 2014. We were constrained by a non-compete agreement to which our chief executive officer was subject until late 2012. Our growth in gross written premium accelerated in 2013 and 2014 following the expiration of the non-compete agreement which allowed us to pursue key markets and relationships that were previously restricted. In 2014, we raised $28.5 million in total new common equity, including $13.6 million from existing employees to support this growth in premium.
Our commercial lines gross written premium grew 101.5% in the year ended December 31, 2014 as compared to 2013, all from organic growth. Even though commercial property losses were significantly higher than our target, largely attributable to weather-related losses in 2014, the total commercial lines calendar year loss ratio was 56% in 2014, with an accident year loss ratio of less than 60%. Our commercial lines experienced favorable reserve development in 2013 and 2012 of $5.5 million and $4.4 million, respectively, reducing our calendar year loss ratios to 35.0% and 31.6% in 2013 and 2012, respectively. While favorable, the reserve development in 2014 was insignificant.
We are licensed to write insurance in 28 states as an admitted carrier, and we are authorized to write insurance as an excess and surplus lines carrier in 43 states. We currently offer our insurance products in 44 states, with ongoing initiatives to selectively enter additional states. For the years ended December 31, 2014 and 2013, 29% and 13%, respectively, of our gross written premiums related to policies issued to customers in Florida, 17% and 16%, respectively, of our gross written premiums related to policies issued to customers in Michigan and 15% and 23%, respectively, of our gross written premiums related to customers in Pennsylvania.
Our revenues are principally derived from premiums earned from our insurance operations. We also generate other revenues through investment income and other income which consists of installment fees and policy issuance fees generally related to the business we write. Our expenses consist primarily of losses and loss adjustment expenses, agents' commissions and other underwriting and administrative expenses. Our operations are organized into two insurance businesses: commercial insurance lines and personal insurance lines.
Through our commercial insurance lines, we offer coverage for both commercial property and commercial liability. Within these two main lines we offer coverage for property, commercial multi-peril as part of commercial property and general liability and liquor liability as a part of commercial liability. We also offer coverage for commercial automobiles and workers compensation. Our insurance policies are sold to targeted small and mid-sized businesses on a single or multiple-coverage basis. During the years ended December 31, 2014, 2013, and 2012, our commercial lines accounted for 62%, 57%, and 69%, respectively, of our net earned premiums.
61
Through our personal insurance lines, we offer non-standard homeowners insurance and dwelling fire insurance products to individuals in numerous states. Our Midwest homeowners insurance line comprises dwelling insurance tailored for owners of lower value homes, which we currently offer in Illinois and Indiana. Our specialty homeowners products include wind exposed coverage, including hurricane and wind coverage to underserved homeowners in Florida, Hawaii, and Texas. We also offer personal automobile insurance products. However, all personal automobile products are in run-off by May 2015. During the years ended December 31, 2014, 2013 and 2012, our personal lines accounted for 38%, 43% and 31%, respectively, of our net earned premiums.
Our personal lines gross written premium grew 71.7% in the year ended December 31, 2014 as compared to 2013, largely driven by a $5.5 million assumption of premium from Citizens Property Insurance Corporation ("Citizens"), a Florida state-supported insurer, through participation in a legislatively-enacted "depopulation program," as further described below. The 2014 calendar year loss ratio for our personal lines was 88.7% as compared to 82.9% in 2013. The increase was driven largely by higher than expected weather-related losses from our Midwestern homeowners line.
In late 2012, our underwriting and marketing team increased from 22 people as of December 31, 2011 to 41 people by the end of 2013 and 50 people at December 31, 2014. Claims staff increased from six people at December 31, 2011, to 29 people as of December 31, 2014, which include in-house attorneys who are a key factor in our business strategy. We also invested significantly in technology and related support areas as we built the Company's insurance platform. Except in limited circumstances, the costs associated with our investment in building the insurance company infrastructure are typically expensed in the periods in which they are incurred. Accordingly, our expense ratios were higher in previous periods and are currently trending down as premium volume grows. We believe that our platform is scalable and will allow us to significantly increase premium volume with limited additional compensation or operating expenses.
From our founding until late 2012, we were restricted from entering certain lines of business due to a non-compete agreement entered into by our chairman and chief executive officer in connection with the sale of North Pointe. While these restrictions were in place, we pursued a number of other opportunities until the non-compete expired. Some of these opportunities, such as the liquor liability and other commercial business (outside the non-compete) have performed to our expectations. Other business, such as the personal automobile line have not performed to our underwriting standards and as a result, we are fully exiting the personal automobile lines business. Personal automobile, alone, generated a loss of $2.4 million representing 29% of our underwriting loss generated in the year ended December 31, 2014. Midwest homeowners was another line that underperformed to our standards, contributing a loss of $3.9 million representing 48% of our total company wide underwriting loss in 2014, despite having historically performed better. Both of these lines combined (Midwest homeowners and personal automobile) generated 77% of our total company wide underwriting loss in 2014. We have substantial expertise in Midwest homeowners and implemented significant modifications to our underwriting guidelines. For example, we added a non-structural damage exclusion in Illinois and reduced the number of prior claims allowed for homeowners policies. We also removed unprofitable agents and eliminated certain broad coverage forms. For example, we eliminated certain broad perils dwelling and fire forms in both Indiana and Illinois and eliminated certain broad perils homeowners forms in Illinois only. We also raised rates for our Midwest homeowners policies in both Indiana and Illinois by an average of 8% in 2014. We expect that with the underwriting changes recently implemented, our loss ratios should return to levels more in line with historical norms of 2013 and 2012.
On November 30, 2013, we acquired American Colonial Insurance Company ("ACIC") along with its parent holding company and agency affiliate. We saw this as an opportunity to acquire a platform for our Florida homeowners and other wind exposed business. After a one year evaluation we determined that the potential margins of ACIC's personal automobile business would underperform
62
our targets and we put the personal automobile business into run-off. We received approval from the State of Florida in April 2015 to cease all personal automobile writings and ceased all writings by June 1, 2015. Our last expected Florida personal lines policy will expire at the end of 2015. Furthermore, in early 2014, we stopped writing our personal automobile line of business for individuals in Illinois.
In 2014, we expanded our writings in our historically profitable Texas homeowners line, and entered the Florida and Hawaii homeowners market. Our management team's prior experience in these property lines was an important component of our decision to expand our product offerings in these markets.
In December 2014, we began writing Florida homeowners business by assuming $5.5 million of premium from Citizens as part of its depopulation program. Citizens is a Florida state-sponsored insurer that provides homeowners insurance to Florida residences that cannot find coverage in the voluntary market. Insurance companies, such as ours, can enter into a policy assumption agreement with Citizens to reduce the number of policies Citizens has acquired. We are able to select from the existing Citizens in-force book of business based on various underwriting criteria that we find acceptable. Upon assuming this premium we become the primary insurer to the policyholders as if we were the original insurer. We are only responsible for claims occurring on or after the assumption date. We expect to perform additional assumptions from Citizens in the near future as well as expanding by directly writing through an agency force.
Our financial results also include revenue and expenses that are not allocated to a specific operating line of business, such as (1) investment income and investment gains and losses, (2) corporate interest expense, and (3) general corporate overhead expenses. We do not allocate our investment portfolio to specific lines of business.
We continued to grow premiums in the first quarter of 2015 and have seen a reduction in our loss ratio of 22.9 percentage points in the first quarter of 2015 compared to the first quarter of 2014. In addition, premium volume is beginning to increase in the Florida homeowners line with $1.7 million of gross earned premium in the first quarter of 2015. Commercial lines has seen similar improvement as the weather-related property losses were substantially lower in the first quarter of 2015 as compared to the first quarter of 2014.
As a capital strategy to support our premium growth, CIC and WPIC entered into a quota share reinsurance agreement effective December 31, 2014. A quota share reinsurance agreement is an agreement between an insurer and a reinsurer whereby the reinsurer pays an agreed-upon percentage of all losses the insurer sustains, in exchange for a percentage of the premium subject to the agreement. The reinsurer also typically pays a commission to the insurer to offset expenses incurred by the insurer on the subject premium. The quota share reinsurance arrangement allows us to grow while utilizing the balance sheet of a reinsurer when our growth outpaces our capital. For the first quarter of 2015, this agreement resulted in $3.9 million of additional ceded earned premiums, $2.0 million of additional ceded losses and loss adjustment expenses and $1.5 million of additional earned ceding commission, which reduces policy acquisition costs. Our underwriting gain in the first quarter of 2015 was $434,000 lower as a result of this arrangement. In the first quarter of 2015, both our loss and expense ratios were higher by 1.1%, each, due to the impact of the quota share agreement, resulting in a combined ratio that was higher by 2.2%. We expect to terminate this quota share arrangement no later than upon the closing of this offering, as we expect the improvement in our balance sheet to reduce our need for third party balance sheet support.
63
Results of Operations
Three Months Ended March 31, 2015 Compared to Three Months Ended March 31, 2014
The following table summarizes our results for the three months ended March 31, 2015 and 2014:
| |
Three Months Ended March 31, |
|
|
||||||||||
|---|---|---|---|---|---|---|---|---|---|---|---|---|---|
| |
$ Change |
% Change |
|||||||||||
| |
2015 | 2014 | |||||||||||
| |
(dollars in thousands) |
||||||||||||
Gross written premiums |
$ | 21,204 | $ | 17,667 | 3,537 | 20.0 | % | ||||||
| | | | | | | | | | | | | | |
| | | | | | | | | | | | | | |
| | | | | | | | | | | | | | |
Net written premiums |
$ | 13,666 | $ | 16,709 | (3,043 | ) | (18.2 | )% | |||||
| | | | | | | | | | | | | | |
| | | | | | | | | | | | | | |
| | | | | | | | | | | | | | |
Net earned premiums |
$ | 14,493 | $ | 12,675 | 1,818 | 14.3 | % | ||||||
Other income |
489 | 532 | (43 | ) | (8.1 | )% | |||||||
Losses and loss adjustment expenses, net |
8,570 |
10,576 |
(2,006 |
) |
(19.0 |
)% |
|||||||
Policy acquisition costs |
2,595 | 3,231 | (636 | ) | (19.7 | )% | |||||||
Operating expenses |
3,692 | 2,894 | 798 | 27.6 | % | ||||||||
| | | | | | | | | | | | | | |
Underwriting gain (loss) |
125 | (3,494 | ) | 3,619 | * | ||||||||
Net investment income |
486 | 220 | 266 | 120.9 | % | ||||||||
Net realized investment gains |
145 | 91 | 54 | 59.3 | % | ||||||||
Interest expense |
244 | 129 | 115 | 89.1 | % | ||||||||
| | | | | | | | | | | | | | |
Income (loss) before taxes |
512 | (3,312 | ) | 3,824 | * | ||||||||
Income tax (benefit) expense |
— | (118 | ) | 118 | 100.0 | % | |||||||
| | | | | | | | | | | | | | |
Net income (loss) |
$ | 512 | $ | (3,194 | ) | 3,706 | * | ||||||
| | | | | | | | | | | | | | |
| | | | | | | | | | | | | | |
| | | | | | | | | | | | | | |
GAAP Underwriting Ratios: |
|||||||||||||
Loss ratio |
57.2 | % | 80.1 | % | |||||||||
Expense ratio |
42.0 | % | 46.4 | % | |||||||||
| | | | | | | | | | | | | | |
Combined ratio |
99.2 | % | 126.5 | % | |||||||||
| | | | | | | | | | | | | | |
- *
- Percentage change is not meaningful
64
Premiums
Our premiums are presented below for the three months ended March 31, 2015 and 2014:
| |
Three Months Ended March 31, |
|
|
||||||||||
|---|---|---|---|---|---|---|---|---|---|---|---|---|---|
| |
$ Change |
% Change |
|||||||||||
| |
2015 | 2014 | |||||||||||
| |
(dollars in thousands) |
||||||||||||
Gross Written Premiums |
|||||||||||||
Commerical lines |
$ | 15,742 | $ | 9,977 | $ | 5,765 | 57.8 | % | |||||
Personal lines |
5,462 | 7,690 | (2,228 | ) | (29.0 | )% | |||||||
| | | | | | | | | | | | | | |
Total |
$ | 21,204 | $ | 17,667 | $ | 3,537 | 20.0 | % | |||||
| | | | | | | | | | | | | | |
| | | | | | | | | | | | | | |
| | | | | | | | | | | | | | |
Net Written Premiums |
|||||||||||||
Commerical lines |
$ | 9,854 | $ | 9,119 | $ | 735 | 8.1 | % | |||||
Personal lines |
3,812 | 7,590 | (3,778 | ) | (49.8 | )% | |||||||
| | | | | | | | | | | | | | |
Total |
$ | 13,666 | $ | 16,709 | $ | (3,043 | ) | (18.2 | )% | ||||
| | | | | | | | | | | | | | |
| | | | | | | | | | | | | | |
| | | | | | | | | | | | | | |
Net Earned Premiums |
|||||||||||||
Commerical lines |
$ | 9,488 | $ | 6,362 | $ | 3,126 | 49.1 | % | |||||
Personal lines |
5,005 | 6,313 | (1,308 | ) | (20.7 | )% | |||||||
| | | | | | | | | | | | | | |
Total |
$ | 14,493 | $ | 12,675 | $ | 1,818 | 14.3 | % | |||||
| | | | | | | | | | | | | | |
| | | | | | | | | | | | | | |
| | | | | | | | | | | | | | |
Gross written premiums increased 20% in the first quarter of 2015 as compared to the first quarter of 2014. This increase was mainly driven by continued growth in our commercial lines. Of the $5.8 million increase in gross written premium for commercial lines, $3.8 million was generated by our commercial multi-peril and other liability products in our owner-operated, small business target market and $1.3 million was generated from our commercial automobile line.
The premium decrease in our personal lines products was primarily due to our exiting of the personal automobile line and the underwriting and marketing changes made to our Midwest homeowners line in late 2014. We implemented underwriting, pricing and marketing changes to our Midwest homeowners line in late 2014 that resulted in the termination of a number of agencies and we expect those changes to result in reduced premium volume, as well as improved results, in the near term. Personal automobile gross written premiums were $0.8 million and $3.3 million in the first quarters of 2015 and 2014, respectively, a decrease of $2.5 million, or 76%. We expect there to be no written premiums in the nonstandard automobile lines after June 2015. Midwest homeowners gross written premiums were $1.6 million and $2.0 million in the first quarters of 2015 and 2014, respectively, decreasing by $0.4 million, or 20%.
The decrease in gross written premium from the personal automobile and Midwest homeowners lines was partially offset by an increase in the gross written premium in our specialty homeowners lines. Our specialty homeowners lines increased by $0.6 million, or 27%, in the first quarter of 2015 as compared to the first quarter of 2014. The increase was attributable to growth in all three areas of our specialty homeowners lines, including Florida homeowners, Texas homeowners and hurricane-only Hawaii homeowners.
Net written premiums decreased in the first quarter of 2015 as compared to the first quarter of 2014 despite the increase in gross written premiums, due to the addition of a quota share reinsurance agreement that we entered into on December 31, 2014. Under this agreement, we ceded $4.8 million of written premium, reducing our net written premiums by 26% in the first quarter of 2015. Almost all
65
our business lines are included in this agreement, other than the Florida homeowners and the personal automobile business.
Ceded earned premiums as a percent of gross earned premiums were 31% in the first quarter of 2015, and 12% in the first quarter of 2014. This increase was substantially attributable to the quota share reinsurance agreement.
Net earned premiums are earned ratably over the term of the policy, whereas written premiums are reflected on the effective date of the policy. All commercial lines and homeowners products have annual policies and premiums under them are earned evenly over one year. Almost all personal automobile policies are six month term policies, under which premiums are earned over a six month period. The resulting net earned premiums are impacted by the gross and ceded written premiums, earned ratably over time.
Other income
Substantially all other income is derived from policies we write and represents additional charges to policyholders for services outside of the premium charge, such as installment billing or policy issuance costs. Other income decreased by 8% in the first quarter of 2015 as compared to the first quarter of 2014 as a result of reduced premium volume in our personal automobile and Midwest homeowners lines. The reduction in other income from the personal lines business was partially offset by an increase in other income in the commercial lines business.
Losses and Loss Adjustment Expenses
The tables below detail our losses and loss adjustment expenses ("LAE") and loss ratios for the three months ended March 31, 2015 and 2014.
Three months ended March 31, 2015
|
Commercial Lines |
Personal Lines |
Total | |||||||
|---|---|---|---|---|---|---|---|---|---|---|
| |
(dollars in thousands) |
|||||||||
Accident year net losses and LAE |
$ | 5,374 | $ | 3,161 | $ | 8,535 | ||||
Net (favorable) adverse development |
(57 | ) | 92 | 35 | ||||||
| | | | | | | | | | | |
Calendar year net loss and LAE |
$ | 5,317 | $ | 3,253 | $ | 8,570 | ||||
| | | | | | | | | | | |
| | | | | | | | | | | |
| | | | | | | | | | | |
Accident year loss ratio |
54.6 | % | 61.6 | % | 57.0 | % | ||||
Net (favorable) adverse development |
(0.5 | )% | 1.8 | % | 0.2 | % | ||||
| | | | | | | | | | | |
Calendar year loss ratio |
54.1 | % | 63.4 | % | 57.2 | % | ||||
| | | | | | | | | | | |
Three months ended March 31, 2014
|
Commercial Lines |
Personal Lines |
Total | |||||||
|---|---|---|---|---|---|---|---|---|---|---|
| |
(dollars in thousands) |
|||||||||
Accident year net losses and LAE |
$ | 5,899 | $ | 5,119 | $ | 11,018 | ||||
Net (favorable) adverse development |
(276 | ) | (166 | ) | (442 | ) | ||||
| | | | | | | | | | | |
Calendar year net loss and LAE |
$ | 5,623 | $ | 4,953 | $ | 10,576 | ||||
| | | | | | | | | | | |
| | | | | | | | | | | |
| | | | | | | | | | | |
Accident year loss ratio |
88.9 | % | 77.9 | % | 83.4 | % | ||||
Net (favorable) adverse development |
(4.2 | )% | (2.6 | )% | (3.3 | )% | ||||
| | | | | | | | | | | |
Calendar year loss ratio |
84.7 | % | 75.3 | % | 80.1 | % | ||||
| | | | | | | | | | | |
Net losses and LAE decreased $2.0 million, or 19%, in the first quarter of 2015 as compared to the first quarter of 2014. This decrease was due, in part, to a $0.5 million decrease in Midwest homeowners resulting from our underwriting changes in late 2014, and the impact of the quota share reinsurance agreement. Additionally, part of the decrease was due to a $1.9 million decrease in the
66
personal automobile line resulting from our efforts to exit this line. Partially offsetting the effects of the lower loss ratios and quota share reinsurance were increases to net losses and LAE due to increases in net earned premium from the growth in our business.
The Company's calendar year loss ratios were 57.2% and 80.1% for the three months ended March 31, 2015 and 2014, respectively. The decreased loss ratio was mainly the result of lower losses in Midwest homeowners and commercial multi-peril. Both lines experienced losses that were historically higher in 2014 due to weather-related property damage.
In the first quarter of 2015, there was $207,000 of favorable development in the workers compensation product line that is included in other commercial lines and there was $195,000 of adverse development in the commercial automobile line. Overall reserve development in the first quarter of 2015, was minimal. In first quarter of 2014, there was $247,000 and $149,000 of favorable reserve development in the personal automobile and other liability lines, respectively. Total reserve development in the first quarter of 2014 was favorable by $442,000.
Losses and loss adjustment expenses also decreased as a result of the quota share reinsurance agreement entered into on December 31, 2014. Losses and LAE ceded under the quota share reinsurance agreement in the first quarter of 2015 were $2.0 million as compared to $0 for the same period in 2014. However, the quota share reinsurance agreement added approximately 1.1 percentage points to the 2015 loss ratio, as the ceded earned premium was greater as a percentage than the ceded losses under the quota share agreement.
Expense Ratio
Our expense ratio is calculated by dividing the sum of policy acquisition costs and other underwriting and operating expenses by the sum of net earned premiums and other income. We use the expense ratio to evaluate the operating efficiency of our consolidated operations and each segment. Costs that cannot be readily identifiable as a direct cost of a segment or product line remain in Corporate and Other for segment reporting purposes.
The table below provides the expense ratio by major component.
| |
Three Months Ended March 31, |
||||||
|---|---|---|---|---|---|---|---|
| |
2015 | 2014 | |||||
Commercial Lines |
|||||||
Policy acquisition costs |
17.7 | % | 25.5 | % | |||
Operating expenses |
15.0 | % | 16.2 | % | |||
| | | | | | | | |
Total |
32.7 | % | 41.7 | % | |||
| | | | | | | | |
Personal Lines |
|||||||
Policy acquisition costs |
16.7 | % | 23.4 | % | |||
Operating expenses |
8.0 | % | 9.2 | % | |||
| | | | | | | | |
Total |
24.7 | % | 32.6 | % | |||
| | | | | | | | |
Corporate and Other |
|||||||
Operating expenses |
12.1 | % | 9.2 | % | |||
Consolidated |
|||||||
Policy acquisition costs |
17.3 | % | 24.5 | % | |||
Operating expenses |
24.7 | % | 21.9 | % | |||
| | | | | | | | |
Total |
42.0 | % | 46.4 | % | |||
| | | | | | | | |
67
Our expense ratio decreased 4.4 percentage points in the three months ended March 31, 2015 as compared to 2014, due to our premium volume growth rate exceeding the increase in the cost of our infrastructure. The improved efficiency was partly offset by the impact of the quota share reinsurance agreement, which reduced net earned premiums in the first quarter of 2015 by $3.9 million, causing the expense ratio to increase by 1.1 percentage points.
Policy Acquisition Costs
Policy acquisition costs are costs we incur to issue policies, which include commissions, premium taxes, underwriting reports and underwriter compensation costs. The Company offsets direct commissions with ceded commissions from reinsurers. The percentage of policy acquisition costs to net earned premiums and other income was 17.3% and 24.5% for the three months ended March 31, 2015 and 2014, respectively. The reduction in the ratio was primarily due to the impact of the quota share reinsurance agreement. The quota share reinsurance agreement includes a ceding commission equal to 37.0% of the ceded premiums. The ceding commission is recorded as a reduction to acquisition costs. The ceding commission recorded in the first quarter of 2015 was $1.8 million. To a lesser extent, policy acquisition costs were also reduced by the change in the mix of business. The Illinois automobile business, which had a high acquisition cost ratio, went into run-off in early 2014. Now that it has substantially run-off, there are no more acquisition costs from this line.
Operating Expenses
Operating expenses consist primarily of employee compensation, information technology and occupancy costs, such as rent and utilities. Operating expenses as a percent of net earned premiums and other income was 24.7% and 21.9% for the first quarter of 2015 and 2014, respectively. The increased ratio was due to the quota share reinsurance agreement which lowered net earned premiums. Before the impact of the quota share reinsurance, this ratio was 19.5% and 21.9%, for the first quarter of 2015 and 2014, respectively. The operating expense ratio (excluding the impact of the quota share reinsurance) is lower as premiums earned increased on a less variable expense structure.
Underwriting Results
We measure the performance of our consolidated results, in part, based on our underwriting gain or loss. The following table provides the underwriting gain or loss for the three months ended March 31, 2015 and 2014.
68
| |
Three Months Ended March 31, |
|
|
||||||||||
|---|---|---|---|---|---|---|---|---|---|---|---|---|---|
| |
$ Change |
% Change |
|||||||||||
| |
2015 | 2014 | |||||||||||
| |
(dollars in thousands) |
||||||||||||
Commercial Lines |
|||||||||||||
Commercial multiple peril |
$ | 501 | $ | (2,133 | ) | $ | 2,634 | * | |||||
Other liability |
344 | 227 | 117 | 52 | % | ||||||||
Commercial automobile |
106 | 134 | (28 | ) | (21 | )% | |||||||
Other |
359 | 13 | 346 | * | |||||||||
| | | | | | | | | | | | | | |
Total |
1,310 | (1,759 | ) | 3,069 | * | ||||||||
Personal Lines |
|||||||||||||
Midwest homeowners |
184 | (339 | ) | 523 | * | ||||||||
Specialty homeowners |
882 | 107 | 775 | 724 | % | ||||||||
Personal automobile |
(456 | ) | (286 | ) | (170 | ) | 59 | % | |||||
| | | | | | | | | | | | | | |
Total |
610 | (518 | ) | 1,128 | * | ||||||||
Corporate and Other |
(1,795 |
) |
(1,217 |
) |
(578 |
) |
(48 |
)% |
|||||
| | | | | | | | | | | | | | |
Total |
$ | 125 | $ | (3,494 | ) | $ | 3,619 | * | |||||
| | | | | | | | | | | | | | |
| | | | | | | | | | | | | | |
| | | | | | | | | | | | | | |
- *
- Percentage change is not meaningful
There was a significant improvement in underwriting results in the first three months of 2015 as compared to 2014. The largest contributors to the improved underwriting results included improvements to the loss ratio in Midwest homeowners and commercial multiple peril products which had substantially fewer property losses in 2015, the run-off of the personal automobile business which improved the mix of our business and more premium volume on the existing expense structure. The improvements in the underwriting results were partially offset by the $434,000 reduction in underwriting gain attributable to the quota share reinsurance agreement referred to earlier.
Investment Income
Net investment income increased by $266,000 for the three months ended March 31, 2015 as compared to 2014, primarily from the growth of the investment portfolio. Average invested assets for the first quarter of 2015 was $105.0 million as compared to $58.0 million in 2014, an increase of $47.0 million, or 81%. The increase in the portfolio was primarily due to the Company raising additional capital of $28.5 million from sales of common stock and $6.1 million from sales of preferred stock. The Company also increased borrowings on senior debt by $14.5 million. In 2013, the Company increased borrowings on senior debt of $1.1 million.
The portfolio's average quality was AA at March 31, 2015. The portfolio produced a tax equivalent book yield of 2.10% and 2.22% for the three months ended March 31, 2015 and 2014, respectively. The decrease in book yield in 2015 compared to 2014 is a result of continued lower reinvestment rates related to the decline in the interest rate environment. As investments mature, the Company attempts to increase yield through the purchase of longer dated securities. The average duration of the fixed maturity portfolio decreased from 3.6 years at March 31, 2014 compared to 3.5 years at March 31, 2015 as a result of reinvestment activity.
Interest Expense
Interest expense was $244,000 and $129,000 for the three months ended March 31, 2015 and 2014, respectively. In September 2014, the Company entered into an amendment to its credit agreement to
69
provide for a five-year term loan of $7.5 million and increase the commitment under its credit facility from $10 million to $17.5 million. Interest expense increased due to the additional outstanding debt which was $28.2 million and $12.8 million at March 31, 2015 and 2014, respectively. The additional borrowings were contributed to the insurance companies to allow for further growth and fund current operations.
Income Tax Expense
The Company has established a valuation allowance against 100% of the net deferred tax assets at March 31, 2015 and 2014. Due to the valuation allowance offsetting the net operating loss carryforwards, we expect no income tax expense to be generated on our pre-tax income throughout 2015. For the three months ended March 31, 2014, the income tax benefit of $118,000 relates to the impact of changes to net unrealized gains during the quarter which tax effect is included in the change in other comprehensive income and the corresponding change to the valuation allowance is reflected in the income statement as a deferred tax benefit.
Year Ended December 31, 2014 Compared to Year Ended December 31, 2013
The following table summarizes our results for the years ended December 31, 2014 and 2013:
| |
Year Ended December 31, |
|
|
||||||||||
|---|---|---|---|---|---|---|---|---|---|---|---|---|---|
| |
$ Change |
% Change |
|||||||||||
| |
2014 | 2013 | |||||||||||
| |
(dollars in thousands) |
||||||||||||
Gross written premium |
$ | 83,847 | $ | 44,087 | 39,760 | 90.2 | % | ||||||
| | | | | | | | | | | | | | |
| | | | | | | | | | | | | | |
| | | | | | | | | | | | | | |
Net written premium |
$ | 66,299 | $ | 37,648 | 28,651 | 76.1 | % | ||||||
| | | | | | | | | | | | | | |
| | | | | | | | | | | | | | |
| | | | | | | | | | | | | | |
Net earned premium |
$ | 57,528 | $ | 27,629 | 29,899 | 108.2 | % | ||||||
Other income |
1,809 | 834 | 975 | 116.9 | % | ||||||||
Losses and loss adjustment expenses |
40,730 |
15,824 |
24,906 |
157.4 |
% |
||||||||
Policy acquisition costs |
14,696 | 7,667 | 7,029 | 91.7 | % | ||||||||
Operating expenses |
12,139 | 9,161 | 2,978 | 32.5 | % | ||||||||
| | | | | | | | | | | | | | |
Underwriting loss |
(8,228 | ) | (4,189 | ) | (4,039 | ) | 96.4 | % | |||||
Net investment income |
1,175 |
1,000 |
175 |
17.5 |
% |
||||||||
Net realized investment gains |
417 | 299 | 118 | 39.5 | % | ||||||||
Gain from acquisitions |
— | 3,714 | (3,714 | ) | (100.0 | )% | |||||||
Interest expense |
584 | 541 | 43 | 7.9 | % | ||||||||
| | | | | | | | | | | | | | |
Income (loss) before taxes |
(7,220 | ) | 283 | (7,503 | ) | * | |||||||
Income tax (benefit) expense |
(281 | ) | 3 | (284 | ) | * | |||||||
| | | | | | | | | | | | | | |
Net income (loss) |
$ | (6,939 | ) | $ | 280 | (7,219 | ) | * | |||||
| | | | | | | | | | | | | | |
| | | | | | | | | | | | | | |
| | | | | | | | | | | | | | |
GAAP Underwriting Ratios: |
|||||||||||||
Loss ratio |
68.6 | % | 55.6 | % | |||||||||
Expense ratio |
45.3 | % | 59.1 | % | |||||||||
| | | | | | | | | | | | | | |
Combined ratio |
113.9 | % | 114.7 | % | |||||||||
| | | | | | | | | | | | | | |
- *
- Percentage change is not meaningful
70
Premiums
Our premiums are presented below for the years ended December 31, 2014 and 2013:
| |
Year Ended December 31, |
|
|
||||||||||
|---|---|---|---|---|---|---|---|---|---|---|---|---|---|
| |
$ Change |
% Change |
|||||||||||
| |
2014 | 2013 | |||||||||||
| |
(dollars in thousands) |
||||||||||||
Gross Written Premium |
|||||||||||||
Commerical lines |
$ | 55,056 | $ | 27,321 | $ | 27,735 | 101.5 | % | |||||
Personal lines |
28,791 | 16,766 | 12,025 | 71.7 | % | ||||||||
| | | | | | | | | | | | | | |
Total |
$ | 83,847 | $ | 44,087 | $ | 39,760 | 90.2 | % | |||||
| | | | | | | | | | | | | | |
| | | | | | | | | | | | | | |
| | | | | | | | | | | | | | |
Net Written Premium |
|||||||||||||
Commerical lines |
$ | 40,958 | $ | 22,633 | $ | 18,325 | 81.0 | % | |||||
Personal lines |
25,341 | 15,015 | 10,326 | 68.8 | % | ||||||||
| | | | | | | | | | | | | | |
Total |
$ | 66,299 | $ | 37,648 | $ | 28,651 | 76.1 | % | |||||
| | | | | | | | | | | | | | |
| | | | | | | | | | | | | | |
| | | | | | | | | | | | | | |
Net Earned Premium |
|||||||||||||
Commerical lines |
$ | 35,749 | $ | 15,720 | $ | 20,029 | 127.4 | % | |||||
Personal lines |
21,779 | 11,909 | 9,870 | 82.9 | % | ||||||||
| | | | | | | | | | | | | | |
Total |
$ | 57,528 | $ | 27,629 | $ | 29,899 | 108.2 | % | |||||
| | | | | | | | | | | | | | |
| | | | | | | | | | | | | | |
| | | | | | | | | | | | | | |
Gross written premium increased significantly across our commercial and personal lines in 2014. Of the $27.7 million increase in gross written premium in our commercial lines, $17.7 million was attributable to our commercial multi-peril and other liability products in our owner-operated, small business target market and $8.5 million was attributable to our commercial automobile line. Our commercial lines growth was primarily generated from expansion of our existing products. In addition, the Company grew geographically and entered ten additional states in 2014, as compared to 2013, accounting for $1.2 million of additional premiums.
The increase in gross premium for our personal lines business was primarily due to a $5.5 million assumption of premium for the Florida homeowners business from Citizens, the acquisition of American Colonial, and a $2.8 million increase in our existing Texas homeowners business. All of these premiums were generated by specialty homeowners products. The increased premiums in personal lines business was partially offset by a decline in premium volume from our Midwest homeowners line and personal automobile products near the end of 2014 as we made significant changes to both programs. We implemented underwriting, pricing and marketing changes to our Midwest homeowners line in late 2014 that resulted in the termination of a number of agencies and we expect those changes to result in reduced premium volume, as well as improved results, in the near term.
In early 2014, we discontinued writing our personal automobile line of business in Illinois. On January 26, 2015, we also discontinued writing new policies in our personal automobile line of business in Florida. We received approval from the Florida Office of Insurance Regulation to cease writing all renewal personal automobile business beginning in the second quarter of 2015. Personal automobile premiums increased compared to 2013, which stemmed from the acquisition of ACIC in late 2013.
We have no plans to write non-standard automobile policies at this time. We continue, however, to be responsible for paying claims and performing other administrative services with respect to the run-off of our existing non-standard automobile policies. Personal automobile insurance represented approximately 20% of our net earned premiums from operations for the year ended December 31, 2014. Our personal automobile business contributed $2.4 million of loss to our underwriting results in 2014, which represented 29% of our total underwriting loss for the year.
71
Net written premium grew slightly less than gross written premium as a result of the addition of a quota share reinsurance arrangement entered into on December 31, 2014. The quota share reinsurance arrangement allows us to grow while utilizing the balance sheet of a reinsurer when our growth outpaces our capital. Under this agreement, we ceded 25% of the subject premium, net of other reinsurance, and ceded 25% of our losses for the layer within our existing retention, which will be for losses up to $500,000.
All of our business is included in this quota share agreement, with the exceptions of the Florida homeowners and the personal automobile business. The net unearned premiums, as of December 31, 2014, were subject to this treaty which caused more ceded written premium and consequently reduced the overall increase in net written premium as compared to gross written premium. The quota share reinsurance agreement had no impact on earned premiums in 2014 or 2013.
Our average reinsurance rates were lower in 2014 as compared to 2013. Ceded earned premiums as a percent of gross earned premiums were 14.1% in 2014, and 16.0% in 2013. This favorable decrease is a result of an overall softer reinsurance market pricing and our larger premium volume in 2014, which allowed us improved efficiency due to our increased scale.
Net earned premiums are earned ratably over the term of the policy whereas written premium are reflected on the effective date of the policy. All commercial lines and homeowners products have annual policies and thus they are earned evenly over one year. Almost all personal automobile policies are six month policies, which are earned over a six month period.
Other income
Substantially all other income is derived from policies we write and represents additional charges to policyholders for services outside of the premium charge, such as installment billing or policy issuance costs. Approximately 30% and 20% of our other income was derived from the Florida personal automobile and Midwest homeowners lines, respectively, for the year ended December 31, 2014. Other income grew by 117% in 2014 as compared to 2013 as a result of the growth in premium volume in personal automobile, Midwest homeowners and commercial multi-peril.
Losses and Loss Adjustment Expenses
The table below details our losses and loss adjustment expenses ("LAE") and loss ratios for the years ended December 31, 2014 and 2013.
Year ended December 31, 2014
|
Commercial Lines |
Personal Lines |
Total | |||||||
|---|---|---|---|---|---|---|---|---|---|---|
| |
(dollars in thousands) |
|||||||||
Accident year net losses and LAE |
$ | 21,803 | $ | 20,120 | $ | 41,923 | ||||
Net (favorable) adverse development |
(1,182 | ) | (11 | ) | (1,193 | ) | ||||
| | | | | | | | | | | |
Calendar year net losses and LAE |
$ | 20,621 | $ | 20,109 | $ | 40,730 | ||||
| | | | | | | | | | | |
| | | | | | | | | | | |
| | | | | | | | | | | |
Accident year loss ratio |
59.5 | % | 88.7 | % | 70.7 | % | ||||
Net (favorable) adverse development |
(3.3 | )% | — | (2.1 | )% | |||||
| | | | | | | | | | | |
Calendar year loss ratio |
56.2 | % | 88.7 | % | 68.6 | % | ||||
| | | | | | | | | | | |
72
Year ended December 31, 2013
|
Commercial Lines |
Personal Lines |
Total | |||||||
|---|---|---|---|---|---|---|---|---|---|---|
| |
(dollars in thousands) |
|||||||||
Accident year net losses and LAE |
$ | 11,144 | $ | 9,700 | $ | 20,844 | ||||
Net (favorable) adverse development |
(5,516 | ) | 496 | (5,020 | ) | |||||
| | | | | | | | | | | |
Calendar year net losses and LAE |
$ | 5,628 | $ | 10,196 | $ | 15,824 | ||||
| | | | | | | | | | | |
| | | | | | | | | | | |
| | | | | | | | | | | |
Accident year loss ratio |
69.3 | % | 78.8 | % | 73.2 | % | ||||
Net (favorable) adverse development |
(34.3 | )% | 4.1 | % | (17.6 | )% | ||||
| | | | | | | | | | | |
Calendar year loss ratio |
35.0 | % | 82.9 | % | 55.6 | % | ||||
| | | | | | | | | | | |
The 2014 accident year loss ratio of 70.7% is comprised of the commercial lines accident year 2014 loss ratio of 59.5% and the personal lines accident year 2014 loss ratio of 88.7%.
The Company's losses and LAE increased from $15.8 million for the year ended December 31, 2013 to $40.7 million for the year ended December 31, 2014. This $24.9 million increase is largely a consequence of our increased level of business activity in 2014 as compared to 2013, as reflected by the growth in our net earned premiums of 108% from 2013 to 2014. Holding all other factors constant and assuming losses proportionate to the net earned premium growth experienced, an increase of $17.1 million in losses would have been expected for the year ended December 31, 2014. Included in the increased losses from this growth was twelve months of ACIC activity in 2014, compared to only one month of activity from ACIC in 2013, as it was acquired on November 30, 2013. The effect of twelve months of ACIC contributed $7.9 million to the increase in losses in 2014.
Additional increases in losses and LAE were attributable to weather-related losses in excess of what we would expect to occur based on our historical experience. Total weather-related losses were $7.3 million in 2014, consisting of $4.4 million attributable to personal lines and $2.9 million attributable to commercial lines. The primary cause of these excessive losses was the "polar vortex" occurring in the Midwestern and Eastern United States in the winter of 2014, which included sustained record-low temperatures and snow fall that triggered a high frequency of property claims. Our Midwest homeowners' line was also impacted by an increase in non-weather related losses during 2014. As a result of the increased losses in Midwest homeowners, we increased Midwestern homeowners rates by an average of 8% in both Indiana and Illinois and terminated a number of agents with poor performing results. We also modified our underwriting guidelines to add non-structural damage exclusions in Illinois, reduce the number of prior claims allowed for certain homeowners policies, and eliminate certain broad coverage forms. Most of these changes took effect on or before January 1, 2015.
The increase in losses and LAE resulted in an increase in our calendar year loss ratio from 55.6% for the year ended December 31, 2013 to 68.6% for the year ended December 31, 2014. The ACIC personal automobile business contributed four percentage points to the increased loss ratio in 2014. This business is now in run-off. The greater-than-normal weather-related losses also contributed to the increased calendar loss ratio. The non-standard personal automobile and Midwest homeowners lines together contributed 14.4 percentage points to the consolidated calendar year loss ratio for 2014.
Partially offsetting those increases in our loss ratios was a reduction in the loss ratio in specialty homeowners, which was 77.1% in 2013, and decreased to 34.2% in 2014. The decrease in the specialty homeowners loss ratio was partially due to a decrease in our ceded reinsurance rate and partially due to a decrease in the reported severity of claims during 2014. Our ceded reinsurance rate decreased as a result of a softer reinsurance market and efficiencies in reinsurance purchasing generated from our growth. As our premium volume has increased and we have added another year of loss experience, reinsurers are able to better estimate their exposure and spread the risk over a larger premium volume. This allows the reinsurers to charge less per premium dollar, generating efficiencies for us. Also, as we have grown, we have retained more of the risk which reduces the overall cost of reinsurance.
73
In 2014 and 2013, commercial lines reported favorable development mostly from our commercial liability products. The 2013 redundancy included $4.8 million of favorable development from the 2008-2012 accident years, and the 2014 redundancy included $0.6 million of favorable development relating to the 2008-2012 accident years. The favorable reserve development was primarily due to better-than-expected settlement valuations within the commercial liability lines.
Expense Ratio
Our expense ratio is calculated by dividing the sum of policy acquisition costs and operating expenses by the sum of net earned premiums and other income. We use the expense ratio to evaluate the operating efficiency of our consolidated operations. Costs that cannot be readily identifiable as a direct cost of a product line remain in Corporate and Other.
The table below provides the expense ratio by major component.
| |
Years Ended December 31, | ||||||
|---|---|---|---|---|---|---|---|
| |
2014 | 2013 | |||||
Commercial Lines |
|||||||
Policy acquisition costs |
25.1 | % | 24.7 | % | |||
Operating expenses |
12.5 | % | 30.3 | % | |||
| | | | | | | | |
Total |
37.6 | % | 55.0 | % | |||
Personal Lines |
|||||||
Policy acquisition costs |
24.2 | % | 30.0 | % | |||
Operating expenses |
10.8 | % | 5.6 | % | |||
| | | | | | | | |
Total |
35.0 | % | 35.6 | % | |||
Corporate and Other |
|||||||
Operating expenses |
8.6 | % | 12.6 | % | |||
| | | | | | | | |
Total |
8.6 | % | 12.6 | % | |||
Consolidated |
|||||||
Policy acquisition costs |
24.8 | % | 26.9 | % | |||
Operating expenses |
20.5 | % | 32.2 | % | |||
| | | | | | | | |
Total |
45.3 | % | 59.1 | % | |||
| | | | | | | | |
| | | | | | | | |
| | | | | | | | |
Our expense ratio decreased 13.8 percentage points for the year ended December 31, 2014 as compared to 2013, due to the premium volume growth rate well exceeding the increase in the cost of our infrastructure. As our earned premiums grow year-over-year on an expense structure that is less variable to premium volume, we expect this trend to continue in the near future, but at a slower pace.
Policy Acquisition Costs
Policy acquisition costs are costs we incur to issue policies, which include commissions, premium taxes, underwriting reports, and underwriter compensation costs. The Company offsets the direct commissions it pays with ceded commissions it receives from reinsurers. The percentage of policy acquisition costs to net earned premiums and other income was 24.8% and 26.9% for 2014 and 2013, respectively. The reduction in the ratio was mostly due to the personal automobile product line. The Illinois automobile business went into run-off in early 2014 as we no longer plan to write policies for this line. The premium volume from the Illinois business was replaced with the Florida automobile business acquired in late 2013. The Florida automobile business had a significantly lower commission rate than the Illinois automobile business.
74
Also contributing to the improvement in policy acquisition costs were small reductions in expense ratios as seen across most lines as efficiencies improved in the underwriting department. These efficiencies are the result of prior policies written entering the renewal stage, as renewal policies are less expensive to underwrite than new policies.
Operating Expenses
Operating expenses consist primarily of employee compensation and occupancy costs, such as rent and utilities. These costs are largely fixed and, therefore, do not vary significantly with premium volume. The expense ratio for Corporate and Other is calculated by dividing operating expenses by consolidated net earned premiums and other income. The reduction in the expense ratio was substantially driven by the increased premium volume. Since 2012, we have invested heavily in our infrastructure and highly qualified personnel to execute our growth strategy. Necessarily, those costs are incurred prior to our writing sufficient premium to support that expense structure. As we continue to grow we expect the expense ratio to continue to decline as our current infrastructure and personnel is adequate, with minimal additional operating costs, to write substantially more premium volume.
Underwriting Results
We measure the performance of our consolidated results, in part, based on our underwriting gain or loss. The following table provides the underwriting gain or (loss) for the years ended December 31, 2014 and 2013.
| |
Years Ended December 31, |
|
|
||||||||||
|---|---|---|---|---|---|---|---|---|---|---|---|---|---|
| |
$ Change |
% Change |
|||||||||||
| |
2014 | 2013 | |||||||||||
| |
(dollars in thousands) |
||||||||||||
Commercial Lines |
|||||||||||||
Commercial multiple peril |
$ | 749 | $ | (798 | ) | $ | 1,547 | * | |||||
Other liability |
1,740 | 2,863 | (1,123 | ) | (39 | )% | |||||||
Commercial automobile |
(223 | ) | (14 | ) | (209 | ) | * | ||||||
Other |
5 | (440 | ) | 445 | * | ||||||||
| | | | | | | | | | | | | | |
Total |
2,271 | 1,611 | 660 | 41 | % | ||||||||
Personal Lines |
|||||||||||||
Midwest homeowners |
(3,912 | ) | (209 | ) | (3,703 | ) | * | ||||||
Specialty homeowners |
922 | (390 | ) | 1,312 | * | ||||||||
Personal automobile |
(2,376 | ) | (1,683 | ) | (693 | ) | (41 | )% | |||||
| | | | | | | | | | | | | | |
Total |
(5,366 | ) | (2,282 | ) | (3,084 | ) | (135 | )% | |||||
Corporate and Other |
(5,133 |
) |
(3,518 |
) |
(1,615 |
) |
(46 |
)% |
|||||
| | | | | | | | | | | | | | |
Total |
$ | (8,228 | ) | $ | (4,189 | ) | $ | (4,039 | ) | (96 | )% | ||
| | | | | | | | | | | | | | |
| | | | | | | | | | | | | | |
| | | | | | | | | | | | | | |
- *
- Percentage change is not meaningful
The increase in total underwriting loss was substantially driven by increased losses in the Midwest homeowners product line and our personal automobile lines as well as increased costs in Corporate and Other. The additional costs in Corporate and Other reflects additional personnel and office space necessary to further our growth plans. As discussed earlier, a significant re-underwriting effort has taken place in Midwest homeowners and all personal automobile business is now in run-off. The Midwest homeowners and personal automobile business accounted for $6.3 million of the $8.2 million, or 76%, of the underwriting loss.
There was less favorable reserve development in 2014 as compared to 2013. Our Commercial lines accident year loss ratios trended favorably, moving from 69.3% in 2013, to 59.5%, in 2014. The accident ratio for the personal lines trended upward, moving from 78.8% in 2013, to 88.7% in 2014, mostly generated from increased losses in Midwest homeowners and the personal automobile business. Our personal lines generally experiences a smaller variance between its calendar year loss ratio and its accident year loss ratio due to the short tail of the business as compared to the liability business within our commercial lines business.
75
Investment Income
Our investment portfolio is generally highly liquid and 80.2%, 77.3% and 75.0% of the portfolio consisted of readily marketable, investment-grade fixed-income securities as of December 31, 2014, 2013 and 2012, respectively. The remainder of the portfolio is comprised of highly rated equity securities and money market funds. Net investment income is primarily comprised of interest earned and dividends paid on these securities, net of related investment expenses, and excludes realized gains and losses.
Net investment income increased by $175,000 for the year ended December 31, 2014 as compared to 2013, primarily from the growth of the investment portfolio. Average invested assets for 2014 was $81.2 million compared to $53.9 million for 2013, an increase of $27.3 million, or 50.6%. The increase in the portfolio was primarily due to the Company raising additional capital of $28.5 million from common stock and $6.1 million from preferred stock issuances. The Company also increased borrowings on senior debt by $14.5 million.
The portfolio's average quality was AA and produced a tax equivalent book yield of 1.91% and 2.12% for the years ended December 31, 2014 and 2013, respectively. The decrease in book yield in 2014 compared to 2013 is a result of continued lower reinvestment rates related to the decline in the interest rate market. The average duration of the fixed maturity portfolio decreased from 3.4 at December 31, 2013 to 3.1 at December 31, 2014 as a result of reinvestment activity.
Interest Expense
Interest expense was $584,000 and $541,000 for the years ended December 31, 2014 and 2013, respectively. In September 2014, the Company entered into an amendment to its credit agreement to provide for a five-year term loan of $7.5 million and increased the commitment under its credit facility from $10.0 million to $17.5 million. Interest expense increased due to the additional term loan and increased borrowings under its line of credit of approximately $8 million in the fourth quarter of 2014. The additional borrowings were contributed to our insurance company subsidiaries to allow for further growth and fund current operations.
Interest expense was $541,000 and $428,000 for the years ended December 31, 2013 and 2012, respectively. The increase in interest expense was attributable to a higher amount of outstanding borrowings under the Company's credit facility in 2013, mainly to fund current operations.
Income Tax Expense
We reported an income tax benefit of $281,000 in 2014, as compared to an income tax expense of $3,000 in 2013. The 2014 income tax benefit primarily relates to the impact of changes to net unrealized gains during the year in which tax effect is included in the change in other comprehensive income and the corresponding change to the valuation allowance is reflected in the statement of operations as a deferred tax benefit.
The Company has established a $6.9 million valuation allowance against 100% of the net deferred tax assets for 2014 and a $4.6 million valuation allowance for 2013. Included in our deferred tax assets is $6.9 million relating to net operating loss carryforwards in 2014, $2.2 million of which are expected to expire without realization due to Internal Revenue Code Section 382 limitations.
76
Year Ended December 31, 2013 Compared to Year Ended December 31, 2012
The following table summarizes our results for the years ended December 31, 2013 and 2012:
| |
Years Ended December 31, |
|
|
||||||||||
|---|---|---|---|---|---|---|---|---|---|---|---|---|---|
| |
$ Change |
% Change |
|||||||||||
| |
2013 | 2012 | |||||||||||
| |
(dollars in thousands) |
||||||||||||
Gross written premiums |
$ |
44,087 |
$ |
22,838 |
21,249 |
93.0 |
% |
||||||
| | | | | | | | | | | | | | |
| | | | | | | | | | | | | | |
| | | | | | | | | | | | | | |
Net written premiums |
$ | 37,648 | $ | 22,295 | 15,353 | 68.9 | % | ||||||
| | | | | | | | | | | | | | |
| | | | | | | | | | | | | | |
| | | | | | | | | | | | | | |
Net earned premiums |
$ | 27,629 | $ | 16,934 | 10,695 | 63.2 | % | ||||||
Other income |
834 | 309 | 525 | 169.9 | % | ||||||||
Losses and loss adjustment expenses |
15,824 | 7,591 | 8,233 | 108.5 | % | ||||||||
Policy acquisition costs |
7,667 | 4,652 | 3,015 | 64.8 | % | ||||||||
Operating expenses |
9,161 | 6,520 | 2,641 | 40.5 | % | ||||||||
| | | | | | | | | | | | | | |
Underwriting loss |
(4,189 | ) | (1,520 | ) | (2,669 | ) | 175.6 | % | |||||
Net investment income |
1,000 |
1,072 |
(72 |
) |
(6.7 |
)% |
|||||||
Net realized investment gains |
299 | 1,273 | (974 | ) | (76.5 | )% | |||||||
Gain from acquisition |
3,714 | — | 3,714 | * | |||||||||
Interest expense |
541 | 428 | 113 | 26.4 | % | ||||||||
| | | | | | | | | | | | | | |
Income before taxes |
283 | 397 | (114 | ) | (28.7 | )% | |||||||
Income tax expense (benefit) |
3 | (16 | ) | 19 | * | ||||||||
| | | | | | | | | | | | | | |
Net income |
$ | 280 | $ | 413 | (133 | ) | (32.2 | )% | |||||
| | | | | | | | | | | | | | |
| | | | | | | | | | | | | | |
| | | | | | | | | | | | | | |
Ratios: |
|||||||||||||
Loss ratio |
55.6 | % | 44.0 | % | |||||||||
Expense ratio |
59.1 | % | 64.8 | % | |||||||||
| | | | | | | | | | | | | | |
Combined ratio |
114.7 | % | 108.8 | % | |||||||||
| | | | | | | | | | | | | | |
- *
- Percentage change is not meaningful
77
Premiums
Our premiums are presented below for the years ended December 31, 2013 and 2012:
| |
Years Ended December 31, |
|
|
||||||||||
|---|---|---|---|---|---|---|---|---|---|---|---|---|---|
| |
$ Change |
% Change |
|||||||||||
| |
2013 | 2012 | |||||||||||
| |
(dollars in thousands) |
||||||||||||
Gross Written Premiums |
|||||||||||||
Commerical lines |
$ | 27,321 | $ | 13,954 | $ | 13,367 | 95.8 | % | |||||
Personal lines |
16,766 | 8,884 | 7,882 | 88.7 | % | ||||||||
| | | | | | | | | | | | | | |
Total |
$ | 44,087 | $ | 22,838 | $ | 21,249 | 93.0 | % | |||||
| | | | | | | | | | | | | | |
| | | | | | | | | | | | | | |
| | | | | | | | | | | | | | |
Net Written Premiums |
|||||||||||||
Commerical lines |
$ | 22,633 | $ | 13,574 | $ | 9,059 | 66.7 | % | |||||
Personal lines |
15,015 | 8,721 | 6,294 | 72.2 | % | ||||||||
| | | | | | | | | | | | | | |
Total |
$ | 37,648 | $ | 22,295 | $ | 15,353 | 68.9 | % | |||||
| | | | | | | | | | | | | | |
| | | | | | | | | | | | | | |
| | | | | | | | | | | | | | |
Net Earned Premiums |
|||||||||||||
Commerical lines |
$ | 15,720 | $ | 11,621 | $ | 4,099 | 35.3 | % | |||||
Personal lines |
11,909 | 5,313 | 6,596 | 124.1 | % | ||||||||
| | | | | | | | | | | | | | |
Total |
$ | 27,629 | $ | 16,934 | $ | 10,695 | 63.2 | % | |||||
| | | | | | | | | | | | | | |
| | | | | | | | | | | | | | |
| | | | | | | | | | | | | | |
We experienced significant growth in our business for the year ended December 31, 2013 as compared to 2012. Gross written premium increased by 93% in 2013, as compared to 2012. Mr. Petcoff's non-compete agreement expired in late 2012, which allowed us to pursue key markets and relationships that were restricted by the non-compete arrangement, including much of the well-understood North Pointe business. We expanded in existing markets, including all three personal lines products, Midwest homeowners, specialty homeowners, and personal automobile in Illinois. These were three lines that were not subject to the non-compete restrictions in 2012 or earlier. Our growth was also attributable to the hiring of additional highly experienced underwriting and claims staff we were previously restricted from hiring under Mr. Petcoff's non-compete agreement.
In 2013, net written premium increased at a slower rate than gross written premium due to an increase in reinsurance rates. Ceded earned premiums went from 6.0% of gross earned premiums in 2012 to 16.0% in 2013. This was due to the added catastrophe exposure from both the growing book of Texas homeowners business as well as growth in the commercial property business in Florida.
Other income
Other income grew by 170% in the year ended December 31, 2013 as compared to 2012, which is mostly attributable to the growth in premium volume of our Midwest homeowners and commercial multi-peril lines of business. Personal lines and commercial lines generated 48% and 43%, respectively, of the other income for the year ended December 31, 2013. The proportion of other income between personal and commercial lines was similar in 2012.
78
Losses and Loss Adjustment Expenses
The tables below detail our losses and loss adjustment expenses and loss ratios by line of business for the years ended December 31, 2013 and 2012.
Year ended December 31, 2013
|
Commercial Lines |
Personal Lines |
Total | |||||||
|---|---|---|---|---|---|---|---|---|---|---|
| |
(dollars in thousands) |
|||||||||
Accident year net losses and LAE |
$ |
11,144 |
$ |
9,700 |
$ |
20,844 |
||||
Net (favorable) adverse development |
(5,516 | ) | 496 | (5,020 | ) | |||||
| | | | | | | | | | | |
Calendar year net losses and LAE |
$ | 5,628 | $ | 10,196 | $ | 15,824 | ||||
| | | | | | | | | | | |
| | | | | | | | | | | |
| | | | | | | | | | | |
Accident year loss ratio |
69.3 | % | 78.8 | % | 73.2 | % | ||||
Net (favorable) adverse development |
(34.3 | )% | 4.1 | % | (17.6 | )% | ||||
| | | | | | | | | | | |
Calendar year loss ratio |
35.0 | % | 82.9 | % | 55.6 | % | ||||
| | | | | | | | | | | |
Year ended December 31, 2012
|
Commercial Lines |
Personal Lines |
Total | |||||||
|---|---|---|---|---|---|---|---|---|---|---|
| |
(dollars in thousands) |
|||||||||
Accident year net losses and LAE |
$ |
8,066 |
$ |
3,881 |
$ |
11,947 |
||||
Net (favorable) adverse development |
(4,352 | ) | (4 | ) | (4,356 | ) | ||||
| | | | | | | | | | | |
Calendar year net losses and LAE |
$ | 3,714 | $ | 3,877 | $ | 7,591 | ||||
| | | | | | | | | | | |
| | | | | | | | | | | |
| | | | | | | | | | | |
Accident year loss ratio |
68.6 | % | 70.8 | % | 69.3 | % | ||||
Net (favorable) adverse development |
(37.0 | )% | (0.1 | )% | (25.3 | )% | ||||
| | | | | | | | | | | |
Calendar year loss ratio |
31.6 | % | 70.7 | % | 44.0 | % | ||||
| | | | | | | | | | | |
The Company's calendar year loss ratio was 55.6% and 44.0% in 2013 and 2012, respectively. Both 2013 and 2012, benefited from favorable reserve development of $5.0 million and $4.4 million, respectively. The favorable reserve development was substantially all from the commercial liability lines due to better-than-expected settlement values.
The increased calendar year loss ratio in the personal lines was the result of higher losses in both Midwest homeowners and personal automobile products. The accident year loss ratio for our personal lines in 2013 was 78.8%, as compared to 70.8% in 2012.
79
Expense Ratio
The table below provides the expense ratio by major component.
| |
Years Ended December 31, | ||||||
|---|---|---|---|---|---|---|---|
| |
2013 | 2012 | |||||
Commercial Lines |
|||||||
Policy acquisition costs |
24.7 | % | 24.6 | % | |||
Operating expenses |
30.3 | % | 20.9 | % | |||
| | | | | | | | |
Total |
55.0 | % | 45.5 | % | |||
Personal Lines |
|||||||
Policy acquisition costs |
30.0 | % | 32.2 | % | |||
Operating expenses |
5.6 | % | 5.5 | % | |||
| | | | | | | | |
Total |
35.6 | % | 37.7 | % | |||
Corporate and Other |
|||||||
Operating expenses |
12.6 | % | 21.8 | % | |||
| | | | | | | | |
Total |
12.6 | % | 21.8 | % | |||
Consolidated |
|||||||
Policy acquisition costs |
26.9 | % | 27.0 | % | |||
Operating expenses |
32.2 | % | 37.8 | % | |||
| | | | | | | | |
Total |
59.1 | % | 64.8 | % | |||
| | | | | | | | |
| | | | | | | | |
| | | | | | | | |
Our expense ratio decreased 5.7 percentage points in 2013 as compared to 2012. This is a continuing trend as our earned premiums grow year-over-year on an expense structure that is less variable to premium volume. Policy acquisition costs contributed approximately the same amount to the expense ratio in both 2013 and 2012.
80
Underwriting Results
The following table provides the underwriting gain or (loss) by component for the years ended December 31, 2013 and 2012.
| |
Years Ended December 31, |
|
|
||||||||||
|---|---|---|---|---|---|---|---|---|---|---|---|---|---|
| |
$ Change |
% Change |
|||||||||||
| |
2013 | 2012 | |||||||||||
| |
(dollars in thousands) |
||||||||||||
Commercial Lines |
|||||||||||||
Commercial multi-peril |
$ | (798 | ) | $ | 1,825 | $ | (2,623 | ) | * | ||||
Other liability |
2,863 | 815 | 2,048 | 251 | % | ||||||||
Commercial automobile |
(14 | ) | 68 | (82 | ) | (121 | )% | ||||||
Other |
(440 | ) | (11 | ) | (429 | ) | * | ||||||
| | | | | | | | | | | | | | |
Total |
1,611 | 2,697 | (1,086 | ) | (40 | )% | |||||||
Personal Lines |
|||||||||||||
Midwest homeowners |
(209 | ) | (5 | ) | (204 | ) | * | ||||||
Specialty homeowners |
(390 | ) | 2 | (392 | ) | * | |||||||
Personal automobile |
(1,683 | ) | (455 | ) | (1,228 | ) | 270 | % | |||||
| | | | | | | | | | | | | | |
Total |
(2,282 | ) | (458 | ) | (1,824 | ) | 398 | % | |||||
Corporate and Other |
(3,518 |
) |
(3,759 |
) |
241 |
(6 |
)% |
||||||
| | | | | | | | | | | | | | |
Total |
$ | (4,189 | ) | $ | (1,520 | ) | $ | (2,669 | ) | 176 | % | ||
| | | | | | | | | | | | | | |
| | | | | | | | | | | | | | |
| | | | | | | | | | | | | | |
- *
- Percentage change is not meaningful
The increase in total underwriting loss was substantially driven by increased losses in the Illinois personal automobile line as well as increased property losses on our commercial multi-peril line. As discussed earlier, all personal automobile business is now in run-off.
The commercial line business' accident year loss ratios remained about the same in 2013 and 2012, running at 69.3% and 68.6%, respectively. The accident year loss ratio for our personal lines trended upward, moving from 70.8% in 2012, to 78.8% in 2013, mostly generated from increased losses in our personal automobile business.
Investment Income
Net investment income decreased by $72,000 for the year ended December 31, 2013 as compared to 2012, primary due to lower reinvestment rates related to the continued decline in the interest rate market. In 2012, the Company capitalized on the unrealized gains on investments and increased short-term investments for planned acquisitions throughout 2013.
Average invested assets for 2013 was $53.9 million compared to $49.9 million for 2012, an increase of $4.0 million or 8.1%. The portfolio's tax equivalent book yield was 2.45% and 2.12% for the years ended December 31, 2013 and 2012, respectively. The decrease in yield relates to the lower reinvestment rates. The average duration of the fixed maturity portfolio increased from 3.2 at December 31, 2012 to 3.4 at December 31, 2013.
Interest Expense
Interest expense was $541,000 and $428,000 for the years ended December 31, 2013 and 2012, respectively. The increase in interest expense was attributable to a higher amount of outstanding borrowings under the Company's credit facility in 2013, mainly to fund current operations.
81
Income Tax Expense
Income tax expense or benefit remained a de minimis component of net income in both 2013 and 2012 as the Company has established a valuation allowance against 100% of the net deferred tax assets for 2013 and 2012.
Liquidity and Capital Resources
Sources and Uses of Funds
We conduct business principally through our insurance subsidiaries. As a result, our ability to pay dividends to shareholders, meet our debt payment obligations and pay our taxes and administrative expenses is dependent on intercompany service agreements with, and dividends from, our subsidiaries. Our insurance company subsidiaries are subject to extensive regulation by insurance regulatory agencies in each state in which they do business, including restrictions on the amount of dividends they can pay to their shareholder. Conifer Holdings, Inc. and certain of its subsidiaries are not insurance companies and, therefore, are not subject to the same level of regulation as our insurance company subsidiaries.
The holding company and our other non-insurance companies provide management and administration services for our insurance company subsidiaries pursuant to intercompany service agreements. These services include providing management, marketing, offices and equipment, and premium collection, for which our insurance companies pay our non-insurance companies fees based on a percentage of our gross premiums written. In exchange for providing these intercompany services, our non-insurance companies recorded revenues of $10.0 million, $6.3 million and $2.9 million for the years ended December 31, 2014, 2013 and 2012, respectively, and $3.0 million and $2.3 million for the three months ended March 31, 2015 and 2014, respectively. Our non-insurance companies also receive commission revenue for performing agency services for our insurance companies. Our non-insurance companies are required to pay the unaffiliated third party agents with these proceeds. Our non-insurance companies received commission revenue from our insurance companies, net of commissions paid to unaffiliated agents of $1.9 million, $300,000 and $0 for the years ended December 31, 2014, 2013 and 2012, respectively, and $290,000 and $452,000 for the three months ended March 31, 2015 and 2014, respectively. Our non-insurance companies also derive nonaffiliated revenues from installment fees, commissions from nonaffiliated insurance carriers, and other income which totaled $1.3 million, $200,000 and $0 for the years ended December 31, 2014, 2013 and 2012, respectively, and $370,000 and $405,000 for the three months ended March 31, 2015 and 2014, respectively. There were no material non-cash components of our non-insurance company revenues. All of the agreements between our regulated insurance company subsidiaries and our non-insurance company subsidiaries have been approved by the applicable regulators.
The primary obligations of the holding company and our non-insurance companies are salary and administration expenses and debt service obligations. Our non-insurance companies incurred salary and administrative expenses totaling $14.7 million, $8.0 million and $3.6 million for the years ended December 31, 2014, 2013 and 2012, respectively, and $4.3 million and $3.1 million for the three months ended March 31, 2015 and 2014, respectively. Our minimum principal and interest payments on our bank debt were $1.8 million, $800,000 and $400,000 for the years ended December 31, 2014, 2013 and 2012, respectively, and $744,000 and $379,000 for the three months ended March 31, 2015 and 2014, respectively. We anticipate that a portion of the proceeds received from this offering will be used to repay our current debt. Our current policy is to pay no dividends on our common stock, thereby retaining all earnings for general corporate purposes.
State insurance laws restrict the ability of our insurance company subsidiaries to declare dividends to us. These subsidiaries may not make an "extraordinary dividend" until 30 days after the applicable insurance department has received notice of the intended dividend and has either approved the dividend or not objected to it within the 30-day period.
82
In Michigan and Florida, an extraordinary dividend is defined as any dividend or distribution of cash or other property whose fair market value, together with that of other dividends and distributions made within the preceding 12 months, exceeds the greater of 10.0% of the insurance company's surplus as of the preceding December 31 or the insurance company's net income for the 12-month period ending the preceding December 31, in each case determined in accordance with statutory accounting practices. In addition, an insurance company's remaining surplus after payment of a dividend or other distribution to shareholder affiliates must be both reasonable in relation to its outstanding liabilities and adequate to meet its financial needs. Under the insurance laws, our insurance companies may pay dividends, in aggregate, of $2.8 million in 2015, without prior regulatory approval. The Michigan and Florida departments of insurance retain the right to deny any dividend, extraordinary or otherwise. We are required to provide notice for an ordinary dividend and request prior approval on all extraordinary dividend distributions from CIC, WPIC and ACIC.
Our insurance and non-insurance operating subsidiaries' principal sources of funds are insurance premiums, investment income, proceeds from the maturity and sale of invested assets and installment fees. These funds are primarily used to pay claims, commissions, employee compensation, taxes and other operating expenses, and to service debt, purchase investments and pay dividends to us.
We generally expect to pay claims and other expenses from operating cash flows. Historically, cash and cash equivalents (i.e., investments having an original maturity of 90 days or less) have comprised at least 10% of our investment portfolio, and our current investment guidelines require us to maintain this level of liquidity. We also seek to stagger the maturities of our investments so that we have access to maturing instruments on a regular basis. In addition, we seek to invest at least 70% of our investment portfolio in highly liquid, fixed-income securities having an average duration of less than four years. We believe that managing our cash and investments in the foregoing manner limits our exposure to losses resulting from the untimely sale of securities due to unanticipated cash requirements.
Cash Flows
Net cash used in operating activities for the three months ended March 31, 2015 was $1.4 million as compared to net cash provided by operating activities of $475,000 for 2014. The increase in cash used in operations was attributable to $5.3 million of ceded premiums paid on the quota share reinsurance agreement entered into on December 31, 2014, and an increase in operating costs. The increase in cash used in operating activities was partially offset by increased gross premium volume.
Net cash provided by investing activities for the three months ended March 31, 2015 was $864,000 which represents a fluctuation in investment activity.
Net cash used in investing activities for the three months ended March 31, 2014 was $4.8 million and was attributable to an increase in net investments into fixed maturity securities of $11.5 million.
Net cash provided by financing activities for the three months ended March 31, 2015 was $1.3 million which was primarily attributable to a $750,000 issuance of common stock and $900,000 of additional net senior debt borrowings.
Net cash provided by financing activities for the three months ended March 31, 2014 was $6.7 million which was primarily attributable to $6.3 million raised through the issuance of common stock and $640,000 raised through the issuance of preferred stock.
Net cash provided by operating activities for the year ended December 31, 2014 was $6.3 million as compared to $2.5 million for 2013, an increase of $3.8 million. The increase in cash from operations was attributable to increased premium volume. The increase in cash was partially offset by an increase in losses and other operating expenses.
Net cash provided by operating activities for the year ended December 31, 2013 was $2.5 million as compared to $1.3 million for 2012, an increase of $1.2 million. The increase in cash from operations was attributable to increased premium volume. The increase in cash was partially offset by an increase in losses and other operating expenses.
83
Net cash used in investing activities for the year ended December 31, 2014 was $47.7 million and was primarily attributable to net investments into fixed maturity securities of $38.3 million and short term investments of $7.5 million.
Net cash provided by investing activities for the year ended December 31, 2013 was $3.7 million and was partially attributable to receiving $8.8 million from acquisitions, net of cash paid. The increase in cash received was partially offset by net investments into fixed maturity securities of $5.5 million.
Net cash used by investing activities for the year ended December 31, 2012 was $0.8 million and was primarily attributable to net investments into short-term investments.
Net cash provided by financing activities for the year ended December 31, 2014 was $48.6 million which was primarily attributable to $28.5 million of cash raised through the issuance of common stock, $6.1 million from the issuance of preferred stock and $14.5 million of additional net senior debt borrowings.
Net cash provided by financing activities for the year ended December 31, 2013 was $1.2 million which was primarily attributable to additional net senior debt borrowings.
Net cash provided by financing activities for the year ended December 31, 2012 was $1.4 million which was primarily attributable to the issuance of a $1.0 million note payable and a $0.5 million draw on the revolving senior debt facility.
We believe that existing cash and investment balances, as well as cash flows from operations, will be adequate to meet our capital and liquidity needs and the needs of each of our subsidiaries during the 12-month period following the date of this offering. We currently anticipate meeting our long-term capital and liquidity needs through a combination of cash flows from operations and possible future debt or equity financings. No assurances can be given, however, that we will generate cash flows from operations sufficient to meet our ongoing financial requirements or that debt or equity financing will be available to us upon acceptable terms, if at all, in the future.
Capital Constraints
Our ability to write additional insurance policies is dependent largely on the statutory leverage of our insurance company subsidiaries. The Michigan insurance department requires insurance companies to maintain a gross premium writings-to-surplus ratio under 3-to-1. The Florida insurance department requires that its domestic insurance companies maintain a net premiums-to-surplus ratio rather than a gross premiums-to-surplus ratio, and has a lower threshold of 2.5-to-1. Statutory surplus is defined as total assets less total liabilities of our insurance companies in accordance with statutory accounting principles.
CIC's gross premiums written to statutory capital and surplus ratios as of December 31, 2014 and 2013 were 1.7-to-1 and 1.9-to-1, respectively, and WPIC's gross premiums written to statutory capital and surplus ratios as of December 31, 2014 and 2013 were 1.6-to-1 and 1.0-to-1, respectively. In the past, we have had to limit our writing of new policies to remain within the permissible range of statutory surplus imposed by our regulators.
We intend to contribute a portion of the net proceeds that we receive from this offering to our insurance company subsidiaries, which will increase their statutory surplus levels.
The NAIC's model law for risk-based capital provides formulas to determine the amount of capital that an insurance company needs to ensure that it has an acceptable expectation of not becoming financially impaired. As of December 31, 2014, each of our insurance companies had risk-based capital levels in excess of an amount that would require any regulatory intervention.
84
Outstanding Debt
Senior Credit Facility. We are party to a $30.0 million senior credit facility with Comerica Bank that was amended and restated on September 29, 2014. This credit facility currently consists of a $7.5 million five-year term note, a $5.0 million five-year term note and a $17.5 million revolving credit note expiring on August 1, 2016. We had $0.9 million available under the Revolver as of December 31, 2014.
Our total senior debt was $27.6 million as of December 31, 2014 as compared to $13.1 million as of December 31, 2013. The increase in senior debt was attributable to contributions to our operating subsidiaries to support growth.
Our current senior credit facility requires quarterly principal payments of $0.5 million on the term notes and quarterly interest payments on both the term notes and the revolving credit note. The credit facility provides for interest at (i) 275 basis points over 30-day LIBOR for both the $5.0 million note and our $17.5 million revolver and (ii) 325 basis points plus 30-day LIBOR on our $7.5 million note.
The senior credit facility is collateralized by substantially all of our assets, including the stock of our non-insurance company subsidiaries (but excluding the stock of our insurance company subsidiaries).
The credit facility requires that we comply with various financial and other covenants, including requirements that we maintain an A.M. Best rating of no less than "B+" for certain of our insurance company subsidiaries, and that we maintain the following financial ratios for each insurance company subsidiary:
- •
- adjusted capital and surplus in excess of 300% of authorized control level risk-based capital as of each fiscal year end; and
- •
- a ratio of net premiums written to statutory capital and surplus of not more than 2.0 to 1.0 and a ratio of gross premiums written to statutory capital and surplus of not more than 3.0 to 1.0.
In addition, our senior credit facility contains negative covenants restricting our ability to, among other things, enter into a merger or consolidation, sell, lease or otherwise dispose of our assets, acquire the stock or assets of another entity. We are currently in compliance with all the covenants under our senior credit facility. For the 12-month period ended December 31, 2014 we were in compliance with all the covenants under the senior credit facility that we had in place at that time except as follows: our chairman's ownership fell below the required 50% to 45.6%, our debt service coverage ratio fell below 1.20-to-1.0 to 1.09-to-1.0, our tangible net worth was below the covenant minimum by $800,000 and two of our insurance companies had other metrics that fell outside of an agreed upon range. We consequently requested and received waivers of the breaches of these covenants from our senior lender effective December 31, 2014. We expect to meet the debt covenant requirements going forward based upon a combination of amendments to the Credit Facility, effective May 4, 2015 (which removed covenants relating to certain previously required metrics) and June 29, 2015 (reducing our chairman's required threshold to 33% or 20% in the case of an initial public offering), a modification to the preferred stock, effective March 2015 and improved cash flows from operations. The modification to the preferred stock will allow it to qualify as equity for the tangible net worth covenant.
We intend to pay down approximately $17.1 million of our senior credit facility out of the net proceeds of the offering. See "Use of Proceeds."
85
Contractual Obligations and Commitments
The following table summarizes information about our contractual obligations. The minimum future annual payments under these agreements as of December 31, 2014 were as follows:
| |
Estimated payment dates | |||||||||||||||
|---|---|---|---|---|---|---|---|---|---|---|---|---|---|---|---|---|
| |
Total | 2015 | 2016 - 2017 | 2018 - 2019 | Thereafter | |||||||||||
| |
(dollars in thousands) |
|||||||||||||||
Gross unpaid losses and loss adjustment expenses |
$ | 31,531 | $ | 16,130 | $ | 11,648 | $ | 3,271 | $ | 482 | ||||||
Credit facility(2) |
29,649 | 2,869 | 21,862 | 4,918 | — | |||||||||||
Operating leases |
6,146 | 791 | 1,552 | 1,178 | 2,625 | |||||||||||
Contingent payments on acquisitions(3) |
173 | 173 | — | — | — | |||||||||||
Purchase obligations(4) |
4,578 | 1,308 | 2,616 | 654 | — | |||||||||||
| | | | | | | | | | | | | | | | | |
Total obligations |
$ | 72,077 | $ | 21,271 | $ | 37,678 | $ | 10,021 | $ | 3,107 | ||||||
| | | | | | | | | | | | | | | | | |
| | | | | | | | | | | | | | | | | |
| | | | | | | | | | | | | | | | | |
In preparing the contractual obligations table, we made the following estimates and assumptions:
- (1)
- The
estimated unpaid loss and loss adjustment expense payments were made using estimates based on historical payment patterns. However, future payments may
be different than historical payment patterns.
- (2)
- Includes
senior debt principal payments and estimated interest on our Credit Facility which is comprised of a Revolver and two Term Loans. The Company's
$17.5 million Revolver expires in August 2016. In the above table, the outstanding borrowings of $16.6 million at December 31, 2014 are shown in 2016, with interest of LIBOR plus
2.75% on the outstanding balance and the annual commitment fee of 0.2% of 1% on the unused balance shown in each applicable year. The $5.0 million five-year Term Loan is due in July 2018. It
requires quarterly principal payments of $250,000 plus accrued interest. The Term Loan bears interest at LIBOR plus 2.75%. Interest on the Term Loan beyond one-year were calculated using LIBOR rate as
of December 31, 2014, with the assumption that interest rates would remain flat over the remainder of the period that the Term Loan is outstanding. The $7.5 million five-year 2014 Term
Loan is due in October 2019. It requires quarterly principal payments ranging from $250,000 to $500,000 plus accrued interest. The 2014 Term Loan bears interest at LIBOR plus 3.25%. Interest on the
2014 Term Loan beyond one-year were calculated using LIBOR rate as of December 31, 2014, with the assumption that interest rates would remain flat over the remainder of the period that the 2014
Term Loan is outstanding.
- (3)
- Includes
estimated additional amounts due to the Sellers' on the Company's 2013 acquisitions. Refer to Note 3, "Acquisitions" to the consolidated
financial statements for information related to these acquisitions.
- (4)
- Includes estimated future payments under the software license agreement relating to our policy issuance system. This agreement requires minimum monthly payments of $40,000, and is variable with premium volume. The future payment assumptions are based on the current monthly payment as of December 31, 2014, with no assumption of increased premium volume. The software license agreement expires on July 1, 2018.
Quantitative and Qualitative Disclosures About Market Risk
Market risk is the potential economic loss principally arising from adverse changes in the fair value of financial instruments. We believe that interest rate risk and credit risk are the two types of market risk to which we are principally exposed.
86
Interest Rate Risk
Our investment portfolio consists principally of investment-grade, fixed-income securities, all of which are classified as available for sale. Accordingly, the primary market risk exposure to our debt securities is interest rate risk. In general, the fair market value of a portfolio of fixed-income securities increases or decreases inversely with changes in market interest rates, while net investment income realized from future investments in fixed-income securities increases or decreases along with interest rates. In addition, some of our fixed-income securities have call or prepayment options. This could subject us to reinvestment risk should interest rates fall and issuers call their securities, requiring us to reinvest at lower interest rates. We attempt to mitigate this interest rate risk by investing in securities with varied maturity dates and by managing the duration of our investment portfolio to a defined range of three to four years. The effective duration of our portfolio as of December 31, 2014 was 3.1 years.
The table below summarizes our interest rate risk. It illustrates the sensitivity of the fair value of fixed-income investments, classified as fixed maturity securities and short-term investments, to selected hypothetical changes in interest rates as of December 31, 2014. The selected scenarios are not predictions of future events, but rather illustrate the effect that events may have on the fair value of the fixed-income portfolio and shareholders' equity.
| |
|
|
Hypothetical Percentage Increase (Decrease) in |
||||||||||
|---|---|---|---|---|---|---|---|---|---|---|---|---|---|
Hypothetical Change in Interest Rates As of December 31, 2004 |
Estimated Fair Value |
Estimated Change in Fair Value |
Fair Value | Shareholders' Equity |
|||||||||
| |
(dollars in thousands) |
||||||||||||
200 basis point increase |
$ |
94,972 |
$ |
(6,179 |
) |
(6.1 |
)% |
(14.0 |
)% |
||||
100 basis point increase |
$ | 98,016 | $ | (3,135 | ) | (3.1 | )% | (7.1 | )% | ||||
No change |
$ | 101,151 | $ | — | — | — | |||||||
100 basis point decrease |
$ | 103,448 | $ | 2,297 | 2.3 | % | 5.2 | % | |||||
200 basis point decrease |
$ | 104,955 | $ | 3,804 | 3.8 | % | 8.6 | % | |||||
Credit Risk
An additional exposure to our fixed-income securities portfolio is credit risk. We attempt to manage our credit risk by investing only in investment-grade securities. In addition, we comply with applicable statutory requirements which limit the portion of our total investment portfolio that we can invest in any one security.
We are subject to credit risks with respect to our reinsurers. Although a reinsurer is liable for losses to the extent of the coverage which it assumes, our reinsurance contracts do not discharge our insurance companies from primary liability to each policyholder for the full amount of the applicable policy, and consequently our insurance companies remain obligated to pay claims in accordance with the terms of the policies regardless of whether a reinsurer fulfills or defaults on its obligations under the related reinsurance agreement. To mitigate our credit risk to reinsurance companies, we attempt to select financially strong reinsurers with an A.M. Best rating of "A–" or better and continue to evaluate their financial condition throughout the duration of our agreements. See "Business—Purchase of Reinsurance."
At December 31, 2014, the net amounts due us, including prepaid reinsurance, from reinsurers was $14.7 million. We believe all amounts recorded as due from reinsurers are recoverable.
Effects of Inflation
We do not believe that inflation has a material effect on our results of operations, except for the effect that inflation may have on interest rates and claims costs. We consider the effects of inflation in
87
pricing and estimating reserves for unpaid losses and loss adjustment expenses. The actual effects of inflation on our results are not known until claims are ultimately settled. In addition to general price inflation, we are exposed to a long-term upward trend in the cost of judicial awards for damages.
Critical Accounting Policies and Estimates
We identified the accounting estimates below as critical to the understanding of our financial position and results of operations. Critical accounting estimates are defined as those estimates that are both important to the portrayal of our financial condition and results of operations and which require us to exercise significant judgment. We use significant judgment concerning future results and developments in applying these critical accounting estimates and in preparing our consolidated financial statements. These judgments and estimates affect the reported amounts of assets, liabilities, revenues and expenses and the disclosure of material contingent assets and liabilities. Actual results may differ materially from the estimates and assumptions used in preparing the consolidated financial statements. We evaluate our estimates regularly using information that we believe to be relevant. For a detailed discussion of our accounting policies, see our notes to consolidated financial statements included elsewhere in this prospectus.
Loss and Loss Adjustment Expense Reserves
Our recorded loss and LAE reserves represent management's best estimate of unpaid loss and LAE at each balance sheet date, based on information, facts and circumstances known at that time. Our loss and LAE reserves reflect our estimates at the balance sheet date of the following items:
- •
- Case reserves, which are unpaid loss and LAE amounts we expect to pay for losses that have been reported; and
- •
- Incurred but not reported (IBNR) reserves, which are (1) unpaid loss and LAE amounts we expect to pay for losses that have been incurred but not yet reported; and (2) the expected development of losses and LAE on open reported cases.
We do not discount the loss and LAE reserves for the time value of money.
Case reserves for reported losses and LAE are initially set by our claims personnel. When a claim is reported to us, our claims department completes a case-basis valuation and establishes a case reserve for the estimated amount of the ultimate payment as soon as practicable and after it has sufficient information to form a judgment about the probable ultimate losses and LAE associated with that claim, with a goal of setting the case reserve at the ultimate expected loss and LAE amount. Our claims department update their case-basis valuations upon receipt of additional information. The case reserve is based primarily upon an evaluation of the following factors:
- •
- the type of loss;
- •
- the severity of injury or damage;
- •
- our knowledge of the circumstances surrounding the claim;
- •
- the jurisdiction of the occurrence;
- •
- policy provisions related to the claim;
- •
- expenses intended to cover the ultimate cost of settling claims, including investigation and defense of lawsuits resulting from such
claims, costs of outside adjusters and experts, and all other expenses which are identified to the case; and
- •
- any other information considered pertinent to estimating the indemnity and expense exposure presented by the claim.
88
IBNR reserves are determined by subtracting case reserves from total estimated loss and LAE reserves, which are based on the ultimate expected losses and LAE less paid loss and LAE. Our actuarial department develops estimated ultimate loss and LAE on a quarterly basis. Our reserve review committee (which includes our Chief Executive Officer, President, Chief Financial Officer, other members of executive management, and key actuarial, underwriting and claims personnel) meets each quarter to review our actuaries' estimated ultimate expected loss and LAE.
The carried reserves reflect management's best estimate of the outstanding loss and LAE liabilities. Management arrives at this estimate after reviewing both the internal and external analyses.
We use several generally accepted actuarial methods to develop estimated ultimate loss and LAE estimates by line of business and accident year. This process relies on the basic assumption that past experience, adjusted for the effects of current developments and likely trends, is a reasonable basis for predicting future outcomes. These methods utilize various inputs, including but not limited to:
- •
- written and earned premiums;
- •
- paid and reported losses and LAE;
- •
- expected initial loss and LAE ratio, which is the ratio of incurred losses and LAE to earned premiums; and
- •
- expected claim reporting and payout patterns based on our own loss experience and supplemented with insurance industry data where applicable.
The principal standard actuarial methods used by our actuaries for their comprehensive reviews include:
- •
- Loss ratio method—This method uses loss and LAE ratios for prior accident years, adjusted for current trends, to determine
an appropriate expected loss and LAE ratio for a given accident year;
- •
- Loss development methods—Loss development methods assume that the losses and LAE yet to emerge for an accident year are
proportional to the paid or reported loss and LAE amounts observed to-date. The paid loss development method uses losses and LAE paid to date, while the reported loss development method uses losses
and LAE reported to date;
- •
- Bornheutter-Ferguson method—This method is a combination of the loss ratio and loss development methods, where the loss
development factor is given more weight as an accident year matures; and
- •
- Frequency/severity method—This method projects claim counts and average cost per claim on a paid or reported basis for high frequency, low severity products.
Our actuaries give different weights to each of these methods based upon the amount of historical experience data by line of business and by accident year, and based on judgment as to what method is believed to result in the most accurate estimate. The application of each method by line of business and by accident year may change in the future if it is determined that a different emphasis for each method would result in more accurate estimates.
Our actuaries also analyze several diagnostic measures by line of business and accident year, including but not limited to: reported and closed frequency and severity, claim reporting and claim closing patterns, paid and incurred loss ratio development, and ratios of paid loss and LAE to incurred loss and LAE. After the actuarial methods and diagnostic measures have been performed and analyzed, our actuaries use their judgment and expertise to select an estimated ultimate loss and LAE by line of business and by accident year.
89
Our actuaries also estimate an IBNR reserve for our unallocated LAE not specifically identified to a particular claim, namely our internal claims department salaries and associated general overhead and administrative expenses associated with the adjustment and processing of claims. These estimates, which are referred to as uncollected loss adjustment expenses (ULAE) reserves, are based on internal cost studies and analyses reflecting the relationship of unallocated LAE paid to actual paid and incurred losses. We select factors that are applied to case reserves and IBNR reserve estimates in order to estimate the amount of unallocated LAE reserves applicable to estimated loss reserves at the balance sheet date.
We allocate the applicable portion of our estimated loss and LAE reserves to amounts recoverable from reinsurers under ceded reinsurance contracts and report those amounts separately from our loss and LAE reserves as an asset on our balance sheet.
The estimation of ultimate liability for losses and LAE is a complex, imprecise and inherently uncertain process, and therefore involves a considerable degree of judgment and expertise. Our loss and LAE reserves do not represent an exact measurement of liability, but are estimates based upon various factors, including but not limited to:
- •
- actuarial projections of what we, at a given time, expect to be the cost of the ultimate settlement and administration of claims
reflecting facts and circumstances then known;
- •
- estimates of future trends in claims severity and frequency;
- •
- assessment of asserted theories of liability; and
- •
- analysis of other factors, such as variables in claims handling procedures, economic factors, and judicial and legislative trends and actions.
Most or all of these factors are not directly or precisely quantifiable, particularly on a prospective basis, and are subject to a significant degree of variability over time. In addition, the establishment of loss and LAE reserves makes no provision for the broadening of coverage by legislative action or judicial interpretation or for the extraordinary future emergence of new types of losses not sufficiently represented in our historical experience or which cannot yet be quantified. As a result, an integral component of our loss and LAE reserving process is the use of informed subjective estimates and judgments about our ultimate exposure to losses and LAE. Accordingly, the ultimate liability may be more or less than the current estimate. The effects of change in the estimated loss and LAE reserves are included in the results of operations in the period in which the estimate is revised.
Our reserves consist entirely of reserves for property and liability losses, consistent with the coverages provided for in the insurance policies directly written or assumed by us under reinsurance contracts. Occasionally, several years may elapse between the occurrence of an insured loss, the reporting of the loss to us and our payment of the loss. The level of IBNR reserves in relation to total reserves depends upon the characteristics of the specific line of business, particularly related to the speed with which claims are reported and outstanding claims are paid. Lines of business for which claims are reported slowly will have a higher percentage of IBNR reserves than lines of business that report and settle claims more quickly.
90
The following table shows the ratio of IBNR reserves to total reserves net of reinsurance recoverables as of December 31, 2014:
Line of Business
|
Case Reserves |
IBNR Reserves |
Total Reserves |
Ratio of IBNR to Total Reserves |
|||||||||
|---|---|---|---|---|---|---|---|---|---|---|---|---|---|
| |
(dollars in thousands) |
||||||||||||
Commercial Lines |
|||||||||||||
Commercial multi-peril |
$ | 7,313 | $ | 6,232 | $ | 13,545 | 46 | % | |||||
Other liability |
1,641 | 2,157 | 3,797 | 57 | % | ||||||||
Commercial automobile |
686 | 570 | 1,256 | 45 | % | ||||||||
Other |
323 | 578 | 901 | 64 | % | ||||||||
| | | | | | | | | | | | | | |
Total commercial lines |
9,963 | 9,537 | 19,499 | 49 | % | ||||||||
| | | | | | | | | | | | | | |
Personal Lines |
|||||||||||||
Midwest homeowners |
1,570 | 375 | 1,945 | 19 | % | ||||||||
Specialty homeowners |
217 | 143 | 360 | 40 | % | ||||||||
Personal automobile |
4,643 | 1,859 | 6,502 | 29 | % | ||||||||
| | | | | | | | | | | | | | |
Total personal lines |
6,430 | 2,378 | 8,808 | 27 | % | ||||||||
| | | | | | | | | | | | | | |
Total lines |
$ | 16,393 | $ | 11,914 | $ | 28,307 | 42 | % | |||||
| | | | | | | | | | | | | | |
| | | | | | | | | | | | | | |
| | | | | | | | | | | | | | |
Although we believe that our reserve estimates are reasonable, it is possible that our actual loss and LAE experience may not conform to our assumptions and may, in fact, vary significantly from our assumptions. Accordingly, the ultimate settlement of losses and the related LAE may vary significantly from the estimates included in our financial statements. We continually review our estimates and adjust them as we believe appropriate as our experience develops or new information becomes known to us. Such adjustments are included in current operations.
Our loss and LAE reserves do not represent an exact measurement of liability, but are estimates. The most significant assumptions affecting our IBNR reserve estimates are the loss development factors applied to paid losses and case reserves to develop IBNR by line of business and accident year. Although historical loss development provides us with an indication of future loss development, it typically varies from year to year. Thus, for each accident year within each line of business we select one loss development factor out of a range of historical factors.
We generated a sensitivity analysis of our net reserves which represents reasonably likely levels of variability in our selected loss development factors. We believe the most meaningful approach to the sensitivity analysis is to vary the loss development factors that drive the ultimate loss and LAE estimates. We applied this approach on an accident year basis, reflecting the reasonably likely differences in variability by level of maturity of the underlying loss experience for each accident year. Generally, the most recent accident years are characterized by more unreported losses and less information available for settling claims, and have more inherent uncertainty than the reserve estimates for more mature accident years. Therefore, we used variability factors of plus or minus 10% for the most recent accident year, 5% for the preceding accident year, and 2.5% for the second preceding accident year. There is minimal expected variability for accident years at four or more years' maturity.
The following table displays ultimate net loss and LAE and net loss and LAE reserves by accident year for the year ended December 31, 2014. We applied the sensitivity factors to each accident year amount and have calculated the amount of potential net loss and LAE reserve change and the impact on 2014 reported pretax income and on net income and shareholders' equity at December 31, 2014. We believe it is not appropriate to sum the illustrated amounts as it is not reasonably likely that each accident year's reserve estimate assumptions will vary simultaneously in the same direction to the full
91
extent of the sensitivity factor. We also believe that such changes to our reserve balance would not have a material impact on our liquidity.
| |
Ultimate Loss and LAE Sensitivity Factor |
December 31, 2014 Ultimate Loss and LAE |
December 31, 2014 Loss and LAE Reserves |
Potential Impact on 2014 Pre-Tax Income |
Potential Impact on 2014 Net Income and December 31, 2014 Shareholders' Equity |
|||||||||||
|---|---|---|---|---|---|---|---|---|---|---|---|---|---|---|---|---|
| |
(dollars in thousands) |
|||||||||||||||
Increased Ultimate Losses & LAE |
||||||||||||||||
Accident Year 2014 |
10.0 | % | $ | 41,012 | $ | 17,790 | $ | (4,101 | ) | $ | (4,101 | ) | ||||
Accident Year 2013 |
5.0 | % | 26,077 | 5,743 | (1,304 | ) | (1,304 | ) | ||||||||
Accident Year 2012 |
2.5 | % | 14,735 | 2,625 | (368 | ) | (368 | ) | ||||||||
All Prior Accident Years |
0.0 | % | 2,149 | — | — | |||||||||||
Decreased Ultimate Losses & LAE |
||||||||||||||||
Accident Year 2014 |
(10.0 | )% | 41,012 | 17,790 | 4,101 | 4,101 | ||||||||||
Accident Year 2013 |
(5.0 | )% | 26,077 | 5,743 | 1,304 | 1,304 | ||||||||||
Accident Year 2012 |
(2.5 | )% | 14,735 | 2,625 | 368 | 368 | ||||||||||
All Prior Accident Years |
(0.0 | )% | 2,149 | — | — | |||||||||||
Investment Valuation and Impairment
We carry fixed maturity and equity securities classified as available-for-sale at fair value, and unrealized gains and losses on such securities, net of any deferred taxes, are reported as a separate component of accumulated other comprehensive income. We do not have any securities classified as trading or held-to-maturity.
We evaluate our available-for-sale investments regularly to determine whether there have been declines in value that are other-than-temporary. Our outside investment managers assist us in this evaluation. When we determine that a security has experienced an other-than-temporary impairment, the impairment loss is recognized as a realized investment loss.
We consider a number of factors in assessing whether an impairment is other-than-temporary, including (1) the amount and percentage that current fair value is below cost or amortized cost, (2) the length of time that the fair value has been below cost or amortized cost and (3) recent corporate developments or other factors that may impact an issuer's near term prospects. In addition, for fixed maturity securities, we also consider the credit quality ratings for the securities, with a special emphasis on securities downgraded to below investment grade. We also consider our intent to sell available-for-sale fixed maturity securities in an unrealized loss position, and if it is more likely than not that we will be required to sell these securities before a recovery in fair value to their cost or amortized cost basis. For equity securities, we evaluate the near-term prospect of these investments in relation to the severity and duration of the impairment, and we consider our ability and intent to hold these investments until they recover their fair value.
As of December 31, 2014 and 2013, our investment portfolio had aggregate gross unrealized losses of $282,000 and $920,000, respectively. We did not consider any of our investments in an unrealized loss position as other than temporarily impaired as we concluded that the unrealized losses were attributable to interest rate fluctuations and not to the diminution in the ability of the issuers to pay or other factors that may other-than-temporarily-impair the investments. We did not recognize an impairment loss on any of our investments in 2014, 2013 or 2012.
92
Fair values are measured in accordance with ASC 820, Fair Value Measurements. The guidance establishes a framework for measuring fair value and a three-level hierarchy based upon the quality of inputs used to measure fair value. The three levels of the fair value hierarchy are: (1) Level 1: inputs are based on quoted prices (unadjusted) in active markets for identical assets or liabilities, (2) Level 2: inputs are other than quoted prices that are observable for the asset or liabilities, either directly or indirectly, for substantially the full term of the asset or liability and (3) Level 3: unobservable inputs that are supported by little or no market activity. The unobservable inputs represent the Company's best assumption of how market participants would price the assets or liabilities.
The fair values of fixed maturity securities and equity securities have been determined using fair value prices provided by our investment manager, who utilizes internationally recognized independent pricing services. The prices provided by the independent pricing services are generally based on observable market data in active markets (e.g., broker quotes and prices observed for comparable securities).
The values for publicly-traded equity securities are generally based on Level 1 inputs which use the market approach valuation technique. The values for fixed maturity securities generally incorporate significant Level 2 inputs. The carrying value of cash and short-term investments approximate their fair values due to their short-term maturity.
We review fair value prices provided by our outside investment managers for reasonableness by comparing the fair values provided by the managers to those provided by our investment custodian. We also review and monitor changes in unrealized gains and losses. We obtain an understanding of the methods, models and inputs used by our investment managers and independent pricing services, and controls are in place to validate that prices provided represent fair values. Our control process includes, initial and ongoing evaluation of the methodologies used, a review of specific securities and an assessment for proper classification within the fair value hierarchy.
Income Taxes
Our income tax expense, deferred tax assets and liabilities, and liabilities for unrecognized tax benefits reflect management's best assessment of estimated current and future taxes to be paid. We are subject to income taxes in the United States and numerous state jurisdictions. Significant judgments and estimates are required in determining the consolidated income tax expense.
Deferred income taxes arise from temporary differences between the tax basis of assets and liabilities and their reported amounts in the financial statements, which will result in taxable or deductible amounts in the future. In evaluating our ability to recover our deferred tax assets within the jurisdiction from which they arise, we consider all available positive and negative evidence, including scheduled reversals of deferred tax liabilities, projected future taxable income, tax-planning strategies, and results of recent operations. In projecting future taxable income, we begin with historical results adjusted for the results of discontinued operations and incorporate assumptions about the amount of future state and federal pretax operating income adjusted for items that do not have tax consequences. The assumptions about future taxable income require significant judgment and are consistent with the plans and estimates we are using to manage the underlying businesses. In evaluating the objective evidence that historical results provide, we consider three years of cumulative operating income or loss.
As of December 31, 2014, we have federal and state income tax net operating loss ("NOL") carryforwards of $20.3 million and $8.1 million, respectively, which will expire at various dates from 2019 through 2034. Of the federal NOL amount, $8.9 million are subject to limitations under Section 382 of the Internal Revenue Code. These net NOL carryforwards are limited in the amount that can be utilized in any one year and may expire before they are realized. We expect that $6.3 million ($2.2 million, net of tax) of these NOL carryforwards will expire before utilized.
93
The carrying value of our gross deferred tax asset for the NOL carryforwards is equal to the total NOL carryforward amount times the current tax rate of 34%, and was $7.1 million and $5.2 million as of December 31, 2014 and 2013, respectively. Total gross deferred tax assets were $9.8 million and $7.4 million as of December 31, 2014 and 2013. A valuation allowance of $6.9 million and $4.6 million has been recorded against the gross deferred tax assets as of December 31, 2014 and 2013, respectively, as there is currently insufficient evidence to support the recoverability of those deferred tax assets in accordance with ASC 740, Income Taxes.
If, in the future, our assumptions under the guidance changes and we determine we can support the recoverability of a portion of the deferred tax assets, the tax benefits relating to any reversal of the valuation allowance on deferred tax assets as of December 31, 2014, will be accounted for as a reduction of income tax expense and as an increase in equity. Changes in tax laws and rates may affect recorded deferred tax assets and liabilities and our effective tax rate in the future.
Off-Balance Sheet Arrangements
We do not have any off-balance sheet arrangements.
Recent Accounting Pronouncements
Recently Issued Accounting Guidance
In May 2015, the FASB issued ASU No. 2015-09, Disclosures about Short-Duration Contracts, which requires enhanced disclosures about an insurance entity's initial claim estimates and subsequent adjustments to those estimates, methodologies and judgments in estimating claims, and the timing, frequency and severity of claims. The enhanced disclosures will be effective for annual reporting periods beginning after December 15, 2015 and interim periods thereafter. Early adoption is permitted. The enhanced disclosures under the new guidance will be provided in the Company's consolidated financial statements for the year ended December 31, 2016, as required.
In August 2014, the FASB issued ASU No. 2014-15, "Presentation of Financial Statements—Going Concern (Subtopic 205-40)," which requires management to evaluate, at each annual and interim reporting period, whether there is substantial doubt about the Company's ability to continue as a going concern within one year after the date the financial statements are issued and provide related footnote disclosures. The standard is effective for the annual period ending after December 15, 2016 and for the annual and interim periods thereafter. Early adoption is permitted. This standard is not expected to have a material impact on the Company's financial statements.
94
Property and casualty ("P&C") insurance companies provide insurance coverage under a policy in exchange for premiums paid by the customer. An insurance policy is a contract between the insurance company and the insured under which the insurance company agrees to pay for losses suffered by the insured, or a third-party claimant, that are covered under the contract.
We write both property and casualty insurance. Property insurance covers a policyholder whose property (such as a home, automobile or business facility) is damaged or destroyed by a covered peril. The loss is the reduction in the value of the property being insured after the covered risk has occurred. Casualty, also known as liability, insurance covers a policyholder's liability resulting from a covered peril in the form of an act or omission that causes bodily injury or property damage to a third party. In casualty insurance, the loss is the amount of the claim or payment made on the policyholder's behalf. We write property and casualty insurance for businesses and professional organizations (which we refer to as commercial lines) and for individuals (which we refer to as personal lines).
We write insurance with both short-tail and long-tail liability. Short-tail liability is liability for losses which become known to the policyholder and are reported to the insurance company within a short period of time, generally within the policy period or within one or two years of expiration. Conversely, longer-tail liability is liability for losses that may take many years before they become known to the policyholder and are reported as claims. We consider our property, homeowners and automobile damage coverages to be short-tail, because we generally know, by policy expiration or shortly thereafter whether a loss has occurred. We consider our general liability and liquor liability coverages to be longer tail because losses under these coverages may not to be reported to us for several years after the loss has occurred.
Most property and casualty insurance policies are purchased from insurance companies that are licensed to write insurance in the state in which the policy was sold. These insurers are admitted to do business in the state by its insurance department, and therefore are generally known as admitted companies. Admitted companies' insurance rates and forms are regulated by state insurance departments. Policies written on an admitted basis in a given state have the general backing of the individual state insolvency fund as a backstop in the event that the admitted carrier writing the policies goes out of business.
In contrast, non-admitted companies, also known as excess and surplus line ("E&S") companies, are not admitted in the particular state. The E&S market functions as a supplemental market that often covers hard to place, higher risk and unique classes of business that generally fit outside admitted companies' underwriting guidelines. Because E&S insurers are generally not subject to the rate and form regulations of state insurance regulators specifically, these insurers have more flexibility to use policy forms and rates that they believe are appropriate for the risks they underwrite and accept. This freedom of rate and form allows the unique qualities of the underlying risk to be fully evaluated and underwritten and provides the E&S insurer with greater flexibility to customize pricing and terms and conditions to meet the needs of the insured. Competition in the E&S market tends to focus less on price than in the standard lines insurance market and more on other value-based considerations such as policy availability, terms of coverage, customer service and underwriting expertise.
One or more of our insurance company subsidiaries are licensed as admitted companies in 28 states and the District of Columbia, and authorized as E&S companies in 43 states and the District of Columbia.
P&C Insurance Cycle
The broader P&C insurance market has long been subject to market cycles. "Soft" markets occur when the supply of insurance capital in a given market or territory is greater than the amount of
95
insurance capital demanded by all potential insureds in that market. When this occurs, insurance prices tend to decline and policy terms and conditions become more favorable to the insured.
Conversely there are periods when there is not enough insurance capital capacity in the market to meet the needs of potential insureds, leading to a "hard" market where insurance prices generally rise and policy terms and conditions become more favorable to the insurer. The E&S insurance industry cycles generally track the overall insurance market cycle; however, there are some variations. For example, during hard markets, where insurance capacity becomes restricted, or in response to a major industry event or loss, a significant amount of premiums flow from the admitted market to the E&S market. In these circumstances, admitted market carriers tend to become more conservative and restrictive and write only the business they feel most comfortable underwriting and tend to avoid exposures and risks that are more complex.
96
Our Company
We are a Michigan-based insurance holding company formed in 2009. Through our insurance subsidiaries, we offer insurance coverage in both specialty commercial and specialty personal product lines. Many of our products are targeted to profitable classes of policyholders that are underserved by other insurers. We market and sell these insurance products through a growing network of over 4,500 independent agents that distribute our policies through their approximately 2,200 sales offices writing business in 44 states. We are focused on growing our business in non-commoditized property and casualty insurance markets, while maintaining underwriting discipline and a conservative investment strategy. Our commercial lines and personal lines business accounted for 65% and 35% respectively, of our net earned premiums for the three months ended March 31, 2015 and 62% and 38%, respectively, of our net earned premiums for the year ended December 31, 2014.
We have substantial expertise in serving the unique commercial insurance needs of owner-operated businesses in the following markets:
- •
- Hospitality, such as restaurants, bars, taverns, and bowling centers (that require, among other lines, liquor liability insurance), as
well as small grocery and convenience stores;
- •
- Artisan contractors, such as plumbers, painters, carpenters, electricians and other independent contractors;
- •
- Security service providers, such as companies that provide security guard services, security alarm products and services, and private
investigative services; and
- •
- Automobile repair and used car facilities.
In our commercial lines business, we seek to differentiate ourselves and provide value to small business owner-operators by bundling different insurance products that meet a significant portion of their insurance needs. For example, in the hospitality market we offer property, casualty, and liquor liability, as well as, in some jurisdictions, workers' compensation coverage. The breadth of our specialty commercial insurance products enables our small business customers, many of whom do not have dedicated risk management personnel, and their agents, to save the administrative costs and time required to seek coverage for these items from separate insurers. As such, we compete for commercial lines business based on our flexible product offerings and customer service, rather than on pricing alone. Our target commercial lines has an average account size of $5,000 in premium.
We also have substantial expertise in providing specialty homeowners' insurance products to targeted customers that are often underserved by larger carriers or other established providers of homeowners' insurance. Our personal lines products include primarily the following:
- •
- Catastrophic coverage, including hurricane and wind coverage, to underserved homeowners in Florida, Hawaii and Texas; and
- •
- Dwelling insurance tailored for owners of lower value homes, which we currently offer in Illinois and Indiana and plan to introduce in other geographic markets including Texas, Louisiana, North Carolina and South Carolina.
In our personal lines business, we target homeowners in need of specific catastrophe coverage or dwelling insurance that are currently underserved by the insurance market, due to the modest value of their homes or the exposure to natural catastrophes in their geographic area. Because these homeowners are underserved, this portion of the market is typically subject to less pricing pressure from larger nationwide insurers that offer a more commoditized product. We believe our underwriting expertise enable us to compete effectively in these markets by evaluating and appropriately pricing risk. In addition, we believe our willingness to meet these underserved segments of the personal lines
97
insurance market fosters deeper relationships with, and increased loyalty from, the agents who distribute our products. Our target personal lines customer has an average account size of $1,200 in premium.
Overall, we seek a balance of our premiums earned between commercial and personal lines to better diversify our business and help mitigate the potential cyclical nature of either market. In serving these markets, we write business on both an admitted and E&S basis. Insurance companies writing on an admitted basis are licensed by the states in which they sell policies and are required to offer policies using premium rates and forms that are typically filed with state insurance regulators. Non-admitted carriers writing in the E&S market are not bound by most of the rate and form regulations imposed on standard market companies, allowing them the flexibility to change the coverage offered and the rate charged without the time constraints and financial costs associated with the filing process. Our corporate structure allows us to offer both admitted and E&S products in select markets through either CIC (which writes primarily on an E&S basis) or WPIC (which writes on an admitted basis). Our experience with specialty insurance products enables us to react to new market opportunities and underwrite multiple specialty lines.
While we will pursue top line premium growth, we do not do so at the expense of losing underwriting discipline. Our underwriters have the experience and institutional flexibility to recognize when to exit certain products in favor of more profitable opportunities as insurance market conditions dictate. The following charts summarize our gross written premiums by type, line of business and state for the years indicated therein.
| 2014 Gross Written Premium ("GWP") by Type | 2014 GWP by Line of Business | |

|
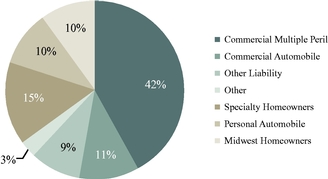
|
|
GWP Growth by State |
GWP by Customer Type and Year |
|
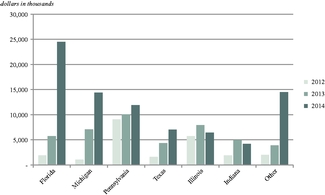
|
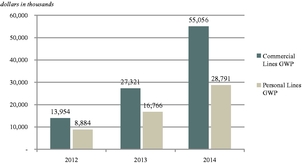
|
98
Our History
Our Company was incorporated in Michigan on October 27, 2009 and commenced operations in late 2009. We are a holding company that conducts business through the insurance companies and other entities described below.
On December 21, 2009, in anticipation of entering the specialty insurance market, we acquired American Equable, Inc. ("Equable"), a domestic property and casualty insurer incorporated in Michigan. On February 26, 2010, Equable changed its name to Conifer Insurance Company as we began to focus our business on providing specialty insurance products for specific niches of the property and casualty insurance markets. CIC currently writes specialty insurance products in 39 of the 43 states in which we are qualified to write policies on an E&S basis, and in time, we expect to add additional licensing in order to ultimately provide insurance products in all 50 states.
In December 2010, we purchased Mid-Continent Insurance Company ("Mid-Continent"), a specialty insurer domiciled in Pennsylvania. In June 2011, Mid-Continent was re-domiciled to Michigan and in August 2011 changed its name to White Pine Insurance Company. WPIC writes similar lines of property and casualty business as CIC does, but writes those policies on an admitted basis. WPIC is currently admitted in 28 states and writes policies in 14 states. We anticipate that WPIC will ultimately add additional licenses in order to provide insurance products in all 50 states. Our ability to write policies on an admitted basis through WPIC and on an E&S basis through CIC allows us the flexibility to provide coverage on either basis as market and regulatory conditions dictate.
In October 2011, we formed a pure captive insurance company domiciled in the District of Columbia called Red Cedar Insurance Company ("RCIC"). RCIC writes insurance exclusively for our operating insurance companies and does not place or write any insurance business on behalf of third party insurers. Our insurance captive enables us the flexibility to take a mezzanine layer of reinsurance exclusively for CIC and WPIC. The mezzanine layer represents a middle reinsurance layer above the underlying operating subsidiary retention of CIC or WPIC, and below our outside reinsurers' participation. Our ability to maintain this mezzanine layer through RCIC helps us maintain surplus in our operating entities by shifting some of our retained per policy risk to the captive in exchange for a portion of the applicable premium.
In May 2012, we formed an insurance agency, Sycamore Insurance Agency, Inc. ("SIAI"). SIAI allows some of our non-surplus lines agency partners to write business on a surplus lines basis with CIC and allows us to earn fee income on select business that we write.
In November 2013, WPIC acquired EGI Insurance Services, Inc., which owned American Colonial Insurance Company and EGI Insurance Services of Florida. ACIC was a Florida domestic insurance company that wrote personal automobile coverage exclusively in Florida as well as EGI Insurance Services of Florida, a Florida managing general agency that served that business exclusively in Florida. In January 2014, we reorganized the business into American Colonial Insurance Services ("ACIS"), a managing general agency directly owned by us. Today, ACIC and ACIS primarily write specialty homeowners' policies in the state of Florida. We anticipate adding additional licenses to provide specialty homeowners' policies in several other jurisdictions.
Our concentration on the specialty insurance market was deliberately targeted based on the prior experience of our senior management. In 1987, our chairman and chief executive officer, James G. Petcoff, started North Pointe, which offered mainly liquor liability policies to hospitality risks companies, including restaurants, bars and taverns. North Pointe engaged in similar lines of business as our current operations and was led by many of our same officers and directors. North Pointe and its subsidiaries were sold to QBE Holdings, Inc. in April of 2008. We continue to leverage the relationships with agencies, trade groups and other market participants cultivated over many years by our senior management during their experience with North Pointe.
99
The chart below displays our corporate structure as it pertains to our holding company and significant operating subsidiaries.
Market Opportunity
Our Growth and Operating Strategies
We believe that our operating strategies significantly contribute to our recent growth in gross written premiums and position us to write profitable business in both hard and soft insurance markets. Our operating strategies include our:
- •
- Focus on underserved markets. We focus on providing
specialty insurance products to targeted policyholders in underserved markets. We believe that most of our small business customers, many of which are owner-operated, value the efficiency of dealing
with a single insurer for multiple products. By targeting small to medium sized accounts, we add value to the business owner directly without competing solely on price, as is often the case in markets
with many larger competitors.
- •
- Deep understanding of the business and regulatory landscapes of our
markets. The competition for insurance business and the regulatory operating environment vary significantly from state to state. Our
business plan is to identify market opportunities in particular jurisdictions where due to regulatory conditions, our insurance products can profitably suit the needs of our potential customers. We
focus on tailoring our business to concentrate on the geographic markets and regulatory environments with the greatest opportunities for growth and profitability.
- •
- Emphasis on flexibility. We offer coverage to our
insureds both on an admitted and E&S basis. We primarily utilize our subsidiary CIC to write E&S lines in various states and our subsidiary WPIC to write policies on an admitted basis. We believe this
flexibility enables us to pivot quickly between admitted and E&S policies as customer needs and regulatory conditions dictate.
- •
- Strong relationships with our agents. We seek to develop
strong relationships with our independent agents and provide them with competitive products to offer policyholders, responsive service and attractive commissions. Our senior management has personal
and professional relationships with many of our agents that predate the establishment of our company. Over the course of these relationships, we believe we have established a reputation as a nimble
and entrepreneurial partner. We understand that short turn-around times and responsiveness to our agents' needs increase their business and aid in making Conifer a partner of choice. We believe our
agents understand that we view them as key partners in risk selection that help us serve our ultimate client—the insured.
- •
- Premium growth in existing markets. We expect to grow our overall premium volume by appointing new independent agents in our existing markets. Since we commenced operations in 2009, we have appointed over 4,500 independent agents to our agency network. In addition to
100
- •
- Expanding geographically. Our plans include growing our
business geographically on a targeted basis. For example, in the next twelve months, we plan to expand our current writings in both commercial and personal lines in several states, including Texas,
Louisiana, Colorado, Kentucky, Nevada, North Carolina and South Carolina.
- •
- Engaging in complementary acquisitions. Our senior
management team is experienced in reviewing potential acquisition opportunities and has successfully closed many transactions in the insurance industry. This experience leads to a streamlined review
process and ability to complete effective due diligence. We focus on logical acquisitions for existing business lines where we add value by re-underwriting books of business, reducing expenses or
expanding offerings to our current agent and customer base. We currently have no plans for any specific acquisitions.
- •
- Conservative risk management with an emphasis on lowering volatility. We focus on the risk/reward of insurance underwriting, while maintaining a prudent investment policy. We employ conservative risk management practices and opportunistically purchase reinsurance to minimize our exposure to liability for individual risks. In addition, we seek to maintain a diversified liquid investment portfolio to reduce overall balance sheet volatility. As of March 31, 2015, our investments primarily including short-term fixed income investments with an average credit rating of "AA" and an average duration of 3.5 years.
expanding our network of agents, we also expect to increase the volume of business we write with our existing agents. Growing our gross written premiums will help reduce our expense ratio given our largely fixed-cost expense base.
Our Competitive Strengths
We believe we have the following competitive strengths:
- •
- Talented underwriters with broad expertise. Our
underwriters have significant experience managing account profitability across market cycles. With an average of over 23 years of experience, our senior underwriters possess the required
expertise to respond appropriately to market forces. Given our focus on underserved markets, we believe that our underwriters' experience sets us apart from many of our competitors.
- •
- Controlled and Disciplined Underwriting. We underwrite
substantially all policies to our specific guidelines and, in the limited circumstances in which we utilize managing general agencies, these agencies are subject to our guidelines while we retain
final underwriting authority. Our technology systems are designed to further limit the ability of these agencies, as well as our own underwriters, from significantly straying from these guidelines. We
customize the coverages we offer, and continually monitor our markets and react to changes in our markets by adjusting our pricing, product structures and underwriting guidelines. By tailoring the
terms and conditions of our policies, we align our actual underwriting risk with the profit of each insurance account that we write.
- •
- Proactive claims handling. We have a proactive claims
handling philosophy that utilizes an internal team of experienced attorneys employed by the Company to manage or supervise all of our claims from inception until resolution. We believe our claims
handling process, coupled with our customized claims handling management system, has contributed favorably to our loss ratios and positive litigation experience over time. Once we determine a claim is
covered by the underlying policy, our proactive management of claims reinforces our relationships with our customers and agents by demonstrating our willingness to defend our insureds aggressively and
help them mitigate losses.
- •
- Proven management team. In 1987, our chairman and chief executive officer, James G. Petcoff, founded North Pointe offering mainly liquor liability policies to hospitality risks including
101
- •
- Ability to leverage technology to drive efficiency. As a relatively new insurance company, we are not burdened with inefficient legacy systems. We utilize a web-based system that seeks to achieve greater organizational efficiency in our company. Leveraging the infrastructure of programmers and support staff of third-party vendors allows our in-house business analysts to focus on new product development and product roll-out. We believe this reduces our time to market for new products, enhances services for insureds, increases our ability to capture data, and reduces cost.
restaurants, bars and taverns. During his time at North Pointe, Mr. Petcoff successfully managed, took public and ultimately sold the company to a global property and casualty writer based in Australia. Our senior management team has an average of over 25 years' experience in the insurance industry, including an average of 16 years with Conifer and North Pointe—almost exclusively with small and growing companies. Our senior management team has successfully created, managed and grown numerous insurance companies and books of business, and has longstanding relationships with our many independent agents and policyholders in our targeted markets.
Our Product Lines
The following table shows our net earned premiums by product line for each of the periods indicated:
| |
Year Ended December 31, (dollars in thousands) |
||||||||||||||||||
|---|---|---|---|---|---|---|---|---|---|---|---|---|---|---|---|---|---|---|---|
| |
2014 | 2013 | 2012 | ||||||||||||||||
| |
Amount | % of Total |
Amount | % of Total |
Amount | % of Total |
|||||||||||||
Commercial lines: |
|||||||||||||||||||
Commercial multi-peril |
$ | 24,246 | 42 | % | $ | 11,699 | 43 | % | $ | 8,094 | 48 | % | |||||||
Other liability |
5,373 | 9 | % | 3,358 | 12 | % | 2,882 | 17 | % | ||||||||||
Commercial automobile |
4,564 | 8 | % | 678 | 2 | % | 641 | 4 | % | ||||||||||
Other |
1,566 | 3 | % | (15 | ) | — | % | 4 | — | % | |||||||||
| | | | | | | | | | | | | | | | | | | | |
Total commercial lines |
35,749 | 62 | % | 15,720 | 57 | % | 11,621 | 69 | % | ||||||||||
Personal lines: |
|||||||||||||||||||
Midwest homeowners |
6,495 | 12 | % | 3,895 | 14 | % | 1,273 | 8 | % | ||||||||||
Specialty homeowners |
3,651 | 6 | % | 1,153 | 4 | % | 235 | 1 | % | ||||||||||
Personal automobile |
11,633 | 20 | % | 6,861 | 25 | % | 3,805 | 22 | % | ||||||||||
| | | | | | | | | | | | | | | | | | | | |
Total personal lines |
21,779 | 38 | % | 11,909 | 43 | % | 5,313 | 31 | % | ||||||||||
| | | | | | | | | | | | | | | | | | | | |
Total net earned premiums |
$ |
57,528 |
100 |
% |
$ |
27,629 |
100 |
% |
$ |
16,934 |
100 |
% |
|||||||
| | | | | | | | | | | | | | | | | | | | |
| | | | | | | | | | | | | | | | | | | | |
| | | | | | | | | | | | | | | | | | | | |
Commercial Insurance Products
Our specialty commercial insurance lines consist primarily of coverages for both Commercial Property and Commercial Liability. Within those two main components we offer coverages for property, commercial multi-peril as part of Commercial Property and general liability and liquor liability as a part of Commercial Liability. We also offer coverage for Commercial Automobiles and Workers Compensation. Our insurance policies are sold to targeted small and mid-sized businesses on a single or multiple-coverage basis. During the years ended December 31, 2014, 2013, and 2012 our Commercial Lines accounted for 62%, and 57%, and 69%, respectively, of our net earned premiums from continuing operations.
102
Commercial Multi-Peril. In many instances, we bundle our policies into a product which we refer to as commercial multi-peril. Commercial multi-peril, also known as CMP, is composed of two or more coverages including property, general liability, commercial automobile, and boiler and machinery and is tailored to the policyholder's needs. Our typical policy for CMP has a $1.0 million limit, but we have the ability to write umbrella coverage over our basic limits through a reinsurer. Commercial Multi-Peril insurance represented approximately 42% of our net earned premiums from continuing operations for the year ended December 31, 2014.
Other Liability. Within our Other Liability commercial lines, we offer general liability coverage. General liability covers a policyholder's liability resulting from a covered risk in the form of an act or omission of the policyholder that causes bodily injury or property damage to a third party. Our general liability policies usually provide for defense and related expenses in addition to per occurrence and aggregate policy limits. Our general liability insurance policies have varying limits, with the majority of our policies having limits of $1.0 million or less.
Also included in other liability are our liquor liability products. Liquor liability laws require a business that sells alcoholic beverages to be responsible for bodily injury or property damage caused by its customers to a third party. Insurance coverage for this exposure is referred to as liquor liability insurance. This coverage may be offered as part of package or as a stand-alone product. Our liquor liability insurance policies provide limits generally ranging from $50,000 to $300,000 per occurrence. Other Liability insurance represented approximately 9% of our premiums earned for the year ended December 31, 2014.
Commercial Automobile. Commercial automobile policies provide physical damage and other liability coverage for activities involving company-owned vehicles. For example, in our artisan/small contractor business a work vehicle that supports an artisan would be covered under a commercial automobile policy. Our commercial automobile premiums accounted for 8% of our net earned premiums from continuing operations for the year ended December 31, 2014.
Other. Our other commercial line consists primarily of workers compensation. Workers compensation covers an insured from claims arising from injury or disease related to employment and occurs while employee is engaged in work-related activities. We do service larger accounts, but our target market is generally smaller accounts under $5,000 in premium, non-catastrophic, and focusing on the service, retail, and manufacturing accounts. While we do write some business on a standalone basis, we typically write workers compensation to support our other commercial lines business and may include it in a package product to better serve our insureds. Workers compensation insurance represented approximately 3% of our net earned premiums from continuing operations for the year ended December 31, 2014.
Personal Insurance Products
We also offer selected specialty personal insurance products. We currently offer non-standard homeowners insurance and dwelling fire insurance products to individuals in numerous states. Our Midwest homeowners insurance comprises dwelling insurance tailored for owners of lower value homes, which we currently offer in Illinois and Indiana. Our Specialty homeowners products include catastrophic coverage, including hurricane and wind coverage to underserved homeowners in Florida, Hawaii, and Texas. We also offer personal automobile insurance products (which we currently are in the process of winding down). During the years ended December 31, 2014, 2013 and 2012, our personal lines accounted for approximately 38%, 43% and 31%, respectively, of our net earned premiums.
Midwest Homeowners. Non-standard homeowners' insurance and dwelling fire insurance provides coverage to homeowners who find it difficult to obtain coverage from standard carriers due to various factors including the age of the home, its replacement value and/or location. Our Midwest Homeowners line typically offers coverage with property limits ranging from $75,000 to $150,000 and
103
personal liability limits ranging from $100,000 to $300,000. The dwelling fire insurance line provides individual owners with property coverage and primarily basic perils coverage, with no liability coverage attached. Homeowners and Dwelling Fire insurance represented approximately 12% of our net earned premiums from continuing operations for the year ended December 31, 2014.
Specialty Homeowners. Our Specialty homeowners products include catastrophic coverage (including hurricane and wind coverage) to underserved homeowners in Florida, Hawaii and Texas. Our average property limits for Florida are $200,000 to $250,000, for Hawaii $300,000 to $375,000 and Texas is $200,000 to $250,000. Florida and Texas policies include full homeowners coverage written mainly on special peril HO3 or HO6 policy forms. Our Hawaiian business is hurricane only where the storm must be a Category 1 hurricane at the time the storm makes landfall for coverage to apply. Our management's experience with North Pointe previously owning and managing a Florida homeowners company during the storms of 2005 has positioned us well for understanding the risks and rewards of writing wind exposed premiums. Specialty homeowners insurance represented approximately 6% of our net earned premiums for 2014.
Personal Automobile. Non-standard personal automobile insurance provides coverage to drivers who find it difficult to obtain insurance from standard insurance companies. In general, customers in the non-standard market pay higher premiums for comparable coverage than customers who qualify for the standard market. Typically, our non-standard personal automobile insurance policies were issued for six months and for the minimum limits of coverage mandated by state law.
In early 2014, we stopped writing this line of business for individuals in Illinois. On January 26, 2015, we also discontinued writing new business in this line in Florida. We have no plans to write any more non-standard automobile policies at this time. We continue, however, to be responsible for paying claims and performing other administrative services with respect to the run-off of our non-standard automobile policies. Non-standard automobile insurance represented approximately 20% of our net earned premiums from operations for the year ended December 31, 2014. Despite exiting these lines of business, we still expect to grow our overall gross written premium in 2015 from our 2014 levels.
Agency Services
Our agency services allow us to help our agents place business with us when they may not be able to write business as a surplus lines broker. Additionally, it provides us a source of fee income. Our insurance agencies, SIAI and ACIS, provide agency and managing general agency services through our affiliate insurance companies. In addition, SIAI is a 50% owner of a small wholesale agency, Venture Agency Holdings, Inc. that owns a retail agency placing small commercial risks mainly for alarm and security guard markets. The brokerage operation writes commercial insurance primarily with our affiliated insurance companies and also with some insurance companies with several unaffiliated insurance carriers. The agencies and brokerage earned gross commissions of approximately $700,000 from unaffiliated carriers for the year ended December 31, 2014.
104
Geographic Distribution
The following table illustrates the geographic distribution, by state, of gross written premiums for the indicated years:
| |
Year Ended December 31, |
|||||||||
|---|---|---|---|---|---|---|---|---|---|---|
| |
2014 | 2013 | 2012 | |||||||
U.S. State |
||||||||||
Florida |
29 | % | 13 | % | 7 | % | ||||
Michigan |
17 | % | 16 | % | 6 | % | ||||
Pennsylvania |
15 | % | 23 | % | 40 | % | ||||
Texas |
10 | % | 10 | % | 6 | % | ||||
Indiana |
8 | % | 11 | % | 9 | % | ||||
Illinois |
5 | % | 19 | % | 26 | % | ||||
Ohio |
4 | % | 2 | % | 2 | % | ||||
All others |
12 | % | 6 | % | 4 | % | ||||
With the recent Florida premium de-population assumptions completed in December of 2014 and February 2015, we have launched our Florida wind-exposed homeowners business. At the same time, we rolled out our voluntary Florida homeowners product to select agents across the state, as well. When coupled with our increased commercial production from several Florida-based offices, Florida has seen considerable premium growth overall in the last two years. We expect this trend to continue. With additional underwriters joining us in our Michigan office in 2013, we have experienced corresponding premium growth in our core commercial lines in Michigan as well. Moreover, having placed our non-standard automobile line in Illinois into run-off, there was an expected downturn in premiums written in that line for that state as evidenced in the table above. The decline in our gross written premiums in Pennsylvania as a percentage of our total gross written premiums is primarily attributable to the disproportionate growth in Florida and Michigan.
Marketing and Distribution
Independent agents are our main distribution source. The selection of an insurance company by a business or individual is strongly influenced by the business or individual's agent. We seek to maintain favorable relationships with our select group of agents. Our distribution philosophy is to treat our agents as partners, and we provide them with competitive products, personal service (including quick quote turnaround times) and attractive commissions. We believe these factors contribute to our positive agency retention, and we expect to maintain high agency retention as we continue to add agencies to our network.
In 2014, our top four select agencies accounted for approximately 30% of our gross written premiums in our commercial lines, and our top three select agencies accounted for approximately 48% of our gross written premiums in our personal lines. We have long term relationships with each of these agencies. We expect a reduction in our concentration in these agencies in future periods as we on-board relationships with additional agencies as part of our growth plan. Our insurance companies have always marketed and distributed their products mainly through an independent agency network, but we also utilize very few managing general agents and certain key wholesalers where appropriate.
We pay competitive commissions in accordance with the custom of the marketplace. Over the last several years, we have paid commission rates that typically range from 9% for workers compensation to 33% for the discontinued non-standard auto book in Illinois. We recruit our producers through word-of-mouth, advertisement, our existing network of agents across several states, as well as direct contacts initiated by agents. We direct our marketing efforts through our offices in Michigan, Florida and Pennsylvania.
105
We view our agents as key partners in risk selection. We actively solicit their input regarding improving our business methods and consult with them in developing new commercial products and entering new customer markets. At the same time, we take careful measure to appropriately control and monitor our agents' operations. Controls placed on our agents, brokers or sales personnel include on-site visits by marketing personnel. Controls also include constant review of the quality of business, loss experience and other mechanisms. For example, in our commercial lines, we take a conservative approach to offering binding authority, which allows our agents to commit us to a policy, to our agents. When binding authority is granted, we restrict such authority to a specific set of guidelines that are provided to agents beforehand. Binding authority is typically only granted to agency partners who have had a history of working with us in the past. Even in these limited circumstances in which we grant binding authority, our underwriters review each risk and follow up with the agent regarding any missing or questionable pieces of underwriting information. In the vast majority of agency relationships, however, binding authority is not granted to the agent and we retain all binding authority.
In addition to marketing to individual agents, we formed SIAI to review select opportunities to write select business on a direct basis. SIAI also owns a small agency in South Carolina placing small commercial risks mainly for alarm and security guard markets.
Underwriting
We are focused on underwriting profitability and effective enterprise risk management. With an average of over 15 years of experience, our senior underwriters have the experience to properly manage account profitability across market cycles.
Our focus in the hospitality industry centers on small to medium-sized businesses. Our underwriting philosophy for our specialty commercial risks in this industry is to look at each risk individually and selectively before writing any policies. Our objective remains collecting sufficient premium to cover the inherent risk for any policy written. This focus necessitates evaluating markets and appropriate pricing risk in order to compete effectively.
We remain focused on the small to medium sized well-operated business where the owner is often an on-site operator concerned with running the business efficiently and safely. We understand the risks associated with the smaller enterprises and, due to lighter competition, believe we can receive a fair premium to compensate for the risk taken.
With respect to property coverages, particularly for the commercial lines, we believe it is important to focus on the profitability of the insureds' business as well as the traditional risk factors. Therefore, in addition to obtaining inspections on commercial packages written, we strive to understand the insureds' business operations and bottom line to verify the underlying business is an acceptable risk. This philosophy, developed over many years of operational experience by our senior management and underwriters, has proven effective for us.
All commercial and personal policy applications are underwritten according to established guidelines that have been provided to our independent agency force. These guidelines are further supported by our information technology system, which we have designed to allow only certain policies that fit within our guidelines. Our underwriting department directs our underwriting efforts for all of our insurance companies. Our underwriting staff has substantial industry experience in matching policy terms, conditions, and pricing to the risk profiles of our policyholders, thereby improving our ability to achieve profitability in the product lines we write.
Commercial Lines. In writing commercial lines policies, we frequently employ tailored limiting endorsements, rating surcharges and customized limits to align our product offerings to the risk profile of the class and the specific policyholder being underwritten. Furthermore, we consistently monitor our markets so that we are able to quickly implement changes in pricing, underwriting guidelines and product offerings as necessary to remain competitive. We generally do not pursue commercial product lines where competition is based primarily on price. We augment our own internally-developed pricing
106
models with benchmark rates and policy terms set forth by the Insurance Services Office, or ISO. The ISO system is a widely recognized industry resource for common and centralized rates and forms. It provides advisory ratings, statistical and actuarial services, sample policy provisions and other services to its members.
Personal Lines. We employ internal product managers to review our position relative to our competition, create better segmentation of pricing and originate premium rate changes as appropriate. Consistent with industry practice, we grant our personal lines agents limited binding authority within our specific guidelines. Once a completed application and premium payment are submitted to us, the application is bound but still reviewed for final approval. If the agent has underwritten and submitted the account according to our guidelines, we process the application as complete. If our guidelines have not been followed, the application may be cancelled or updated and re-submitted for further underwriting review. If the agent does not submit the minimum down payment, we allow for a specific notice and cure period, then process or cancel as appropriate.
In 2014, 76% of our underwriting losses originated from two lines of business: our Midwest homeowners line, and our subsequently discontinued personal automobile business. These losses were primarily due to extreme weather events experienced during the winter of 2013-2014, during which our Midwest homeowners line generated an underwriting loss of approximately $3.9 million, representing 48% of our total company wide underwriting loss for 2014.
In efforts to improve our underwriting performance in our Midwest homeowners line, we reduced the number of unprofitable agents, raised rates where applicable, tightened our underwriting standards by reducing the available forms that we were writing in that line of business, and applied additional policy exclusions wherever possible. We expect these underwriting enhancements to reduce our premiums written in this product line overall and significantly improve our prospects for profitability going forward.
In addition to our losses in the Midwest homeowners line, we experienced losses in our personal automobile business in 2014. Although our Illinois nonstandard automobile business was already in run-off in 2014, we re-underwrote our book of Florida non-standard auto business. Those efforts were unsuccessful and we ultimately decided to exit that line of business. We filed a plan of exit with the State of Florida, stopped writing new business in January 2015, and recently started non-renewing the existing auto business as well. Personal auto contributed 29% of the total company wide underwriting loss for 2014. The personal lines automobile business run-off is proceeding as planned and we expect will be largely completed before year end.
Having taken significant underwriting measures to improve our Midwest homeowners business and by running off our personal lines automobile business, we are better positioned for underwriting profitability in our personal lines going forward.
Claims
We believe that effective claims management is important to our success, allowing us to cost-effectively pay valid claims, while vigorously defending those claims that lack merit. Our claims department consisted of 35 claims professionals, located in Michigan, Florida, Pennsylvania and Tennessee, who have an average of 18 years of claims experience in the property-casualty industry as of July 30, 2015. To this end, we utilize a proactive claims handling philosophy and seek to internally manage or supervise all of our claims from inception until settlement. By handling our claims internally, we can quickly assess claims, improve communication with our policyholders and claimants and better control our claims management costs.
Over the last year, we have hired a growing number of other experienced claims professionals to develop and support our expanding premium and customer base. We have hired several in-house attorneys with considerable legal experience in trying cases primarily in the lines of business upon which we concentrate. Included among these attorneys is our head in-house litigator, who consults on
107
all trials and has 21 years of experience. We also have hired numerous seasoned property and liability adjusters as well as additional support staff to allow us to manage our claims exposures more carefully, across all markets. Many of these claims professionals worked previously at North Pointe and have brought their unique skill sets to us to help support many of the same product lines.
In addition, each of our claims professionals utilize a network of independent local adjusters and appraisers to assist with specific aspects of claims investigations, such as securing witness statements and conducting appraisals in states where it is practical to do so. These outside vendors are compensated based on pre-negotiated fee schedules to lower overall costs.
Any new claims personnel are trained by our claims' professionals, including managers, attorneys, and claims representatives. In addition, our claims personnel are required to pursue insurance claims education classes on various topics where applicable. We train claims personnel to operate in good faith throughout the claims process. Finally, among other items, we train our claims personnel to use several sophisticated computer systems in order to combat fraudulent or exaggerated claims.
Claims personnel are organized by line of business, with specific managers assigned as supervisors for each line of business. Weekly staff meetings of supervisors and managers take place in order to facilitate communication on relevant claims issues, as well as any administrative issues. In addition, departmental managers perform random monthly audits of claims files. Reserving and payment authority levels of claims personnel are set by our senior vice president of claims and our president. Those limits of authority are then set and restricted accordingly in our Claims Information computer systems, to ensure compliance with these authority limits. All of our insurance claims personnel are paid on a salary basis.
Initial claim reserves are set and determined using our statistical averages of paid indemnity and loss adjusting expenses by line of business. After reviewing statistical data and consulting with our internal actuary, our senior vice president of claims, together with other members of management, set initial reserves by line of business. Once initial reserves have been set, reserves are evaluated periodically as specific claim information changes to generate management's overall best estimate of reserves. In addition, claim reviews with in-house adjusters and attorneys provide a regular opportunity to review the adequacy of reserves. Changes to claims reserves are made by senior management based on claim developments and input from these attorneys and adjusters. Typically a full ground up reserve analysis is completed in the third quarter each year with a roll forward to a final review for year end. Additionally, we utilize an in-house, experienced and fully credentialed actuary to support our financial efforts.
The Company's loss ratio was 68.6% and 55.6% in 2014 and 2013, respectively. The increased loss ratio was the result of higher losses in Midwest homeowners and personal automobile products, and less favorable prior year reserve development in 2014 as compared to 2013.
Purchase of Reinsurance
We routinely purchase reinsurance for our commercial and personal lines to reduce volatility by limiting our exposure to large losses and to provide capacity for growth. In a reinsurance transaction, an insurance company transfers, or cedes, all or part of its exposure in return for a portion of the premium. Our companies remain legally responsible for the entire obligation to policyholders, irrespective of any reinsurance coverage we may purchase.
CIC and WPIC entered into an excess of loss multi-line reinsurance agreement effective January 1, 2015 through a reinsurance intermediary. An excess of loss agreement is a form of reinsurance that indemnifies the insurance company (or ceding company) for the portion of a loss that exceeds its own retention. A multiline excess of loss agreement typically includes several different lines of business within the agreement.
108
The treaty (or reinsurance agreement between parties) covers commercial property and casualty losses up to $1.0 million in excess of a $500,000 retention in the first layer. The second layer covers property losses up to $2.0 million and includes coverage for workers compensation and casualty clash in the layer also. Clash coverage is a type of reinsurance that provides us additional coverage in the event that one casualty loss event results in two or more claims from our insured policy holders. We purchase clash reinsurance to further protect our balance sheet. Clash coverage typically reduces the potential maximum loss on either a single risk or a large number of risks.
The company also purchases a workers compensation and casualty clash treaty with limits up to $20.0 million in excess of the $2.0 million underlying coverage.
ACIC, CIC and WPIC have entered into an excess of loss reinsurance agreement with a major reinsurance carrier for property coverage in excess of a $300,000 retention up to $3.0 million for homeowners and dwelling fire business. This treaty became effective November 1, 2014.
CIC and WPIC have commercial umbrella treaties for commercial lines business in the form of a 90% quota share. A quota share reinsurance agreement is an agreement between an insurer and a reinsurer whereby the reinsurer pays an agreed-upon percentage of all losses the insurer sustains, regardless of type. In turn, the insurer compensates the reinsurer for this agreement in the form of a percentage of the premiums written for the applicable lines covered and reinsurance period.
ACIC, CIC and WPIC also have an agreement with a large reinsurer for a property facultative facility for risks with property total insured values above $2.0 million for commercial lines and $3.0 million for personal lines. Facultative reinsurance is where a reinsurer negotiates an individual reinsurance agreement for every policy it will reinsure on a case by case basis. On July 1, 2015, ACIC, CIC and WPIC entered into an excess of loss treaty for property values from $2.0 million to $4.0 million, to replace much of the facultative reinsurance cover.
CIC and WPIC have a reinsurance agreement in the form of a 100% quota share with another reinsurer for the small number of equipment breakdown, employment practices liability and data compromise coverages we occasionally bundle with our other products for certain customers.
All three insurance company subsidiaries, on an aggregate basis, are covered for property catastrophe losses up to $100.0 million excess of a $6.0 million retention for the first event. We also purchased second and third event property catastrophe coverage at a $1.0 million retention. Our catastrophe reinsurance coverage provides $100.0 million of protection, which corresponds to the 1 in 200 year probable maximum loss. This treaty renews effective June 1, 2016.
Finally, CIC and WPIC entered into a 25% quota share with a reinsurer for coverage net of the previously mentioned treaties. This quota share was made effective December 31, 2014. If we successfully complete this offering, we expect that the additional capital on our balance sheet will enable us to eliminate this quota share.
Typically, we pay claims from our own funds and then seek reimbursement from the reinsurer. Accordingly, we are subject to credit exposure with respect to losses ceded to the extent that any reinsurer is unable or unwilling to meet the obligations ceded by us under reinsurance treaties. The ability to collect on reinsurance is subject to many factors, including the solvency of the counterparty and their interpretation of contract language and other factors. We currently have no disputes with any reinsurer and we are not aware of any credit problems with any of our reinsurers.
For 2014, our top ten reinsurers represented nearly 100% of our total ceded reinsurance recoverables, and all of these reinsurance recoverables were from reinsurers with an A.M. Best rating of "A" (Excellent) or better or are collateralized with letters of credit or by a trust agreement. The following table sets forth, for 2014, our ten most significant reinsurers by amount of reinsurance
109
recoverables on paid losses and loss adjustment expense reserves and prepaid reinsurance premiums pertaining to each such reinsurer as well as its A.M. Best rating as of December 31, 2014:
Reinsurer
|
Reinsurance Recoverable as of December 31, 2014 |
A.M. Best Rating | |||
|---|---|---|---|---|---|
| |
(dollars in thousands) |
|
|||
Swiss Reinsurance America Corporation |
$ | 9,122 | A+ | ||
General Reinsurance Corporation |
2,825 | A++ | |||
Munich Reinsurance America |
698 | A+ | |||
Hartford Steamboiler |
680 | A++ | |||
Arch Reinsurance Ltd |
494 | A+ | |||
Platinum Underwriters Holdings, Ltd |
287 | A | |||
Toa Reinsurance of America |
236 | A+ | |||
QBE Reinsurance Corporation |
182 | A | |||
Hannover Re |
76 | A+ | |||
Scor Reinsurance Company |
31 | A | |||
| | | | | | |
Top 10 Total |
14,631 | ||||
Other(1) |
21 | Unrated | |||
| | | | | | |
Total |
$ | 14,652 | |||
| | | | | | |
| | | | | | |
| | | | | | |
- (1)
- Because these reinsurers are unrated, we are collateralized by each reinsurer for the recoverable amounts.
Reserve for Insurance Claims
The Company underwrites risk and establishes actual and estimated reserves for insurance claims under policies that are written. Our gross reserves for insurance claims, shown as unpaid LAE on our consolidated balance sheets, consist of liabilities for reported claims ("case reserves") and liabilities for losses that have been incurred but not yet reported ("IBNR reserves"). Our IBNR reserves also cover potential movement in claims already reported. Our net reserves reflect the offset of reinsurance recoverable due to us from third party reinsurers, based upon the contractual terms of our reinsurance agreements. In the normal course of our business, we cede a portion of our premium to reinsurers through treaty and facultative reinsurance agreements. Although reinsurance does not discharge us from liability to our policyholders, we participate in reinsurance agreements to limit our loss exposure and to protect against catastrophic losses.
Our recorded reserves represent management's best estimate of unpaid losses and loss adjustment expense. The process of estimating our reserves is inherently uncertain and involves a considerable degree of judgment involving our management review and actuarial processes. The estimate of our reserves is increased or decreased as more information becomes known about the frequency and severity of losses for individual years. We believe our review process is effective, such that any required changes in reserves are recognized in the period of change as soon as the need for the change is evident. Refer to "Critical Accounting Estimates—Reserves" included in Management's Discussion and Analysis for a full discussion of our reserving policies and procedures. See also "Risk Factors—Our actual incurred losses may be greater than our loss and loss adjustment expense reserves, which could have a material adverse effect on our financial condition and results of operations."
In evaluating whether the reserves for unpaid losses and LAE are reasonable, it is necessary to project future loss and LAE payments. Our carried reserves are based on the total estimated ultimate loss and LAE less paid loss and LAE. We do not discount the loss and LAE reserves for the time value of money. We also do not make any explicit provision for the effects of any factors that are expected to cause future changes in claim severities.
Our unpaid loss and LAE consist of reserves for property and liability losses, consistent with the coverages provided for in the insurance policies directly written or assumed by us under reinsurance
110
contracts. Occasionally, several years may elapse between the occurrence of an insured loss, the reporting of the loss to us and our payment of the loss. The estimation of ultimate liability for losses and LAE is an inherently uncertain process, requiring the use of informed estimates and judgments. Our loss and LAE reserves are estimates, and do not represent an exact measurement of liability. Although we believe that our reserve estimates are reasonable, it is possible that our actual loss experience may not conform to our assumptions and may vary significantly from our assumptions. Accordingly, the ultimate settlement of losses and the related LAE may vary significantly from the estimates included in our financial statements. We review our estimates quarterly and adjust them as we believe appropriate as our loss experience develops or new information becomes known to us. Such adjustments are included in current results of operations.
We have historically considered available industry data in establishing our unpaid loss and LAE reserves for those lines in which our own historical data was not extensive enough either in terms of the number of years of loss experience or the size of our data pool. Statistics regarding industry loss experience generally include risks which we do not cover, such as environmental and asbestos liabilities, or the industry data is not specific enough to our particular specialty lines. In circumstances where we believe industry loss experience is less useful, we have accorded it less weight in establishing our reserves. As our historical data for a particular line of business increases, both in terms of the number of years of loss experience and the size of our data pool, we will increasingly accord greater weight to our own loss experience rather than industry loss experience in establishing our reserves. There have been no significant changes in key assumptions utilized in the analyses and calculations of our reserves during 2014, 2013 or 2012.
For a further discussion of how we determine our loss and LAE reserves and the uncertainty surrounding those estimates, see "Management Discussion and Analysis—Critical Accounting Policies—Loss and Loss Adjustment Expense Reserves" in this prospectus.
Reconciliation of Unpaid Losses and Loss Adjustment Expenses
We establish a reserve for both reported and unreported covered losses that are unpaid, which includes estimates of both future payments of losses and related LAE. The following table represents changes in our aggregate reserves during 2014, 2013 and 2012:
| |
December 31, | |||||||||
|---|---|---|---|---|---|---|---|---|---|---|
| |
2014 | 2013 | 2012 | |||||||
Gross reserves—beginning of year |
$ | 28,908 | $ | 24,843 | $ | 29,574 | ||||
Less reinsurance recoverables on unpaid losses |
3,953 | 7,296 | 12,410 | |||||||
| | | | | | | | | | | |
Net reserves—beginning of year |
24,955 | 17,547 | 17,164 | |||||||
| | | | | | | | | | | |
Net reserve additions from acquisitions |
— |
6,021 |
— |
|||||||
Add: incurred losses and loss adjustment expenses, net of reinsurance: |
||||||||||
Current year |
41,923 | 20,844 | 11,947 | |||||||
Prior years |
(1,193 | ) | (5,020 | ) | (4,356 | ) | ||||
| | | | | | | | | | | |
Total net incurred losses and loss adjustment expenses |
40,730 | 15,824 | 7,591 | |||||||
| | | | | | | | | | | |
Deduct: loss and loss adjustment expense payments, net of reinsurance: |
||||||||||
Current year |
24,134 | 9,093 | 3,772 | |||||||
Prior years |
13,244 | 5,344 | 3,436 | |||||||
| | | | | | | | | | | |
Total net loss and loss adjustment expense payments |
37,378 | 14,437 | 7,208 | |||||||
| | | | | | | | | | | |
Net reserves—end of year |
28,307 | 24,955 | 17,547 | |||||||
Plus reinsurance recoverables on unpaid losses |
3,224 | 3,953 | 7,296 | |||||||
| | | | | | | | | | | |
Gross reserves—end of year |
$ | 31,531 | $ | 28,908 | $ | 24,843 | ||||
| | | | | | | | | | | |
| | | | | | | | | | | |
| | | | | | | | | | | |
111
The following table presents a breakdown of our reserve redundancies or deficiencies by line of business:
| |
2014 | 2013 | 2012 | |||||||||||||||||||
|---|---|---|---|---|---|---|---|---|---|---|---|---|---|---|---|---|---|---|---|---|---|---|
| |
(dollars in thousands) | |||||||||||||||||||||
Lines of Business
|
Net Reserves at Beginning of Year |
Increase (Decrease) in Estimate of Beginning of Year Net Reserves |
Net Reserves at Beginning of Year |
Acquisitions | Increase (Decrease) in Estimate of Beginning of Year Net Reserves |
Net Reserves at Beginning of Year |
Increase (Decrease) in Estimate of Beginning of Year Net Reserves |
|||||||||||||||
Commercial multi-peril |
$ | 8,939 | $ | (703 | ) | $ | 8,914 | $ | 150 | $ | (2,870 | ) | $ | 9,965 | $ | (3,781 | ) | |||||
Other liability |
4,147 | (509 | ) | 5,709 | 1,004 | (2,642 | ) | 6,415 | (577 | ) | ||||||||||||
Commercial automobile |
78 | (1 | ) | 44 | — | (4 | ) | 128 | 6 | |||||||||||||
Other |
198 | 31 | — | — | — | — | — | |||||||||||||||
| | | | | | | | | | | | | | | | | | | | | | | |
Total Commercial Lines |
13,362 | (1,182 | ) | 14,666 | 1,192 | (5,516 | ) | 16,509 | (4,352 | ) | ||||||||||||
| | | | | | | | | | | | | | | | | | | | | | | |
Midwest homeowners |
926 |
548 |
436 |
— |
(77 |
) |
100 |
(55 |
) |
|||||||||||||
Specialty homeowners |
635 | (9 | ) | 47 | — | — | — | — | ||||||||||||||
Personal automobile |
10,032 | (550 | ) | 2,399 | 4,829 | 573 | 556 | 51 | ||||||||||||||
| | | | | | | | | | | | | | | | | | | | | | | |
Total Personal Lines |
11,593 | (11 | ) | 2,881 | 4,829 | 496 | 656 | (4 | ) | |||||||||||||
| | | | | | | | | | | | | | | | | | | | | | | |
Total Lines |
$ | 24,955 | $ | (1,193 | ) | $ | 17,547 | $ | 6,021 | $ | (5,020 | ) | $ | 17,164 | $ | (4,356 | ) | |||||
| | | | | | | | | | | | | | | | | | | | | | | |
| | | | | | | | | | | | | | | | | | | | | | | |
| | | | | | | | | | | | | | | | | | | | | | | |
During 2014, there was $1.2 million of favorable development in prior accident years, a result of favorable settlements of claims, generated mostly from our commercial liability lines, in the 2011, 2012 and 2013 accident years. We experienced improved claims settlement as we implemented more rigorous claims procedures and we hired more experienced in-house defense attorneys and claims adjusters. The $0.5 million of adverse development in our Midwest homeowners business in 2014 was due to greater than expected weather-related losses occurring in late 2013. The $0.6 million of favorable development in personal auto was primarily due to $0.7 million of favorable development in our Florida personal auto business from the 2012 and 2013 accident years offset by $0.2 million of adverse development in our Illinois personal auto business from the 2012 accident year. The favorable development in our Florida personal auto business was primarily due to faster than expected settlement of older claims, which has allowed us to reduce our IBNR estimates for those accident years. The adverse development in our Illinois personal auto business was primarily due to greater than expected severity on some older claims.
During 2013, there was $5.0 million of favorable development in prior accident years, which was generated from $5.4 million of favorable reserve development in the commercial liability lines offset by $0.5 million of adverse development in our total personal lines. The $5.5 million of favorable development in our commercial liability lines consisted of $2.9 million attributable to commercial multi-peril and $2.6 million from other liability, primarily related to the 2008-2012 accident years. The $0.5 million adverse development in personal auto was primarily due to larger than expected settlements on reported claims from the 2011 and 2012 accident years.
During 2012, there was $4.4 million of favorable development in prior accident years, of which $3.8 million was primarily generated in our commercial multi-peril liability lines. The favorable development was primarily attributable to a reduction in IBNR due to faster than expected claim settlements. The remaining $0.6 million favorable development in commercial property was primarily due to favorable claims settlements during the year.
Conditions and trends that have affected the development of loss reserves in the past may not necessarily occur in the future. Accordingly, it may not be appropriate to extrapolate future
112
redundancies or deficiencies based on the table. Our ultimate liability may be greater or less than current reserves. In the insurance industry, there is always the risk that reserves may prove inadequate. See "Risk Factors—Our actual incurred losses may be greater than our loss and loss adjustment expense reserves, which could have a material adverse effect on our financial condition and results of operations."
Loss Reserve Development
The following table presents the development of our loss and LAE reserves from 2009 through 2014, net of reinsurance recoverables.
| |
Year Ended December 31, | ||||||||||||||||||
|---|---|---|---|---|---|---|---|---|---|---|---|---|---|---|---|---|---|---|---|
| |
2009 | 2010 | 2011 | 2012 | 2013 | 2014 | |||||||||||||
| |
(dollars in thousands) |
||||||||||||||||||
Net liability for losses and loss expenses |
$ | 911 | $ | 18,795 | $ | 17,164 | $ | 17,547 | $ | 24,955 | $ | 28,307 | |||||||
Liability re-estimated as of: |
|||||||||||||||||||
One year later |
764 | 16,565 | 12,807 | 13,508 | 23,763 | ||||||||||||||
Two years later |
593 | 13,071 | 9,870 | 13,601 | |||||||||||||||
Three years later |
495 | 10,300 | 10,038 | ||||||||||||||||
Four years later |
452 | 10,698 | |||||||||||||||||
Five years later |
434 | ||||||||||||||||||
Net cumulative redundancy (deficiency) |
$ | 477 | $ | 8,096 | $ | 7,126 | $ | 3,947 | $ | 1,193 | |||||||||
| | | | | | | | | | | | | | | | | | | | |
| | | | | | | | | | | | | | | | | | | | |
| | | | | | | | | | | | | | | | | | | | |
Cumulative amount of net liability paid as of: |
|||||||||||||||||||
One year later |
253 | 4,112 | 3,383 | 5,186 | 13,245 | ||||||||||||||
Two years later |
315 | 6,277 | 6,092 | 9,106 | |||||||||||||||
Three years later |
426 | 8,302 | 7,917 | ||||||||||||||||
Four years later |
434 | 9,372 | |||||||||||||||||
Five years later |
434 | ||||||||||||||||||
Gross liability-end of year |
911 | 32,047 | 29,574 | 24,843 | 28,908 | 31,532 | |||||||||||||
Reinsurance recoverable on unpaid losses |
— | 13,252 | 12,410 | 7,296 | 3,952 | 3,224 | |||||||||||||
| | | | | | | | | | | | | | | | | | | | |
Net liability-end of year |
911 | 18,795 | 17,164 | 17,547 | 24,955 | 28,307 | |||||||||||||
Gross liability re-estimated-latest |
434 | 20,024 | 16,921 | 18,836 | 27,985 | ||||||||||||||
Reinsurance recoverable on unpaid losses re-estimated-latest |
— | 9,326 | 6,883 | 5,235 | 4,221 | ||||||||||||||
| | | | | | | | | | | | | | | | | | | | |
Net liability re-estimated-latest |
434 | 10,698 | 10,038 | 13,601 | 23,763 | ||||||||||||||
Gross cumulative redundancy (deficiency) |
$ | 477 | $ | 12,023 | $ | 12,654 | $ | 6,007 | $ | 924 | |||||||||
| | | | | | | | | | | | | | | | | | | | |
| | | | | | | | | | | | | | | | | | | | |
| | | | | | | | | | | | | | | | | | | | |
Note—Data from 2009 relates only to American Equable, Inc., which is now known as CIC. The 2010 data column includes CIC and WPIC. The 2011 and 2012 data columns include CIC and WPIC. The 2013 and 2014 data columns include all insurance subsidiaries as of December 31, 2014.
The first line of the table presents the unpaid loss and LAE reserves at December 31 for each year, including the IBNR reserve. For example, as of December 31, 2010, it was estimated that $18.8 million would be a sufficient reserve to settle all claims not already settled that had occurred prior to December 31, 2010, whether reported or unreported to our insurance subsidiaries.
The next section of the table sets forth the re-estimates of incurred losses from later years, including payments, for the years indicated. For example, as reflected in that section of the table, the original reserve of $18.8 million was re-estimated to be $10.7 million at December 31, 2014. The
113
increase/decrease from the original estimate would generally be a combination of factors, including, but not limited to:
- •
- Reserves being settled for amounts different from the original estimates;
- •
- Reserves being increased or decreased for individual claims that remain open as more information becomes known about those individual
claims; and
- •
- More or fewer claims being reported after December 31, 2010, than had been expected to be reported before that date.
The "cumulative redundancy (deficiency)" represents, as of December 31, 2014, the difference between the latest re-estimated liability and the reserves as originally estimated. A redundancy means that the original estimate was higher than the current estimate for reserves; a deficiency means that the original estimate is lower than the current estimate for reserves. For example, the $18.8 million of reserves established at December 31, 2010, were re-estimated to $10.7 million at December 31, 2014. Accordingly, it was re-estimated that the reserves which were established as of December 31, 2010, included a redundancy of $8.1 million.
The first section of the following table shows, by year, the cumulative amounts of losses and LAE paid as of the end of each succeeding year. For example, with respect to the net loss and LAE reserve of $18.8 million as of December 31, 2010, $9.4 million was actually paid in the settlement of claims by December 31, 2014 (four years later).
Information with respect to the cumulative development of gross loss and LAE reserves (that is, without deduction for reinsurance ceded) appears at the bottom portion of the table.
We have maintained adequate overall reserves for each of the last five years. We believe that our practice of setting adequate case reserves, staffing experienced in-house attorneys, and considering industry loss data in setting our reserves has been a contributing factor to our reserve redundancies. As our historical data for a particular line of business increases, both in terms of the number of years of loss experience and the size of our data pool, we will increasingly rely upon our own loss experience rather than industry loss experience in establishing our loss and LAE reserves. We plan to continue to apply reserving practices consistent with historical methodologies.
Cash and Investments
Our investment strategy is to invest in marketable and liquid investment grade securities.
We employ outside money managers with significant expertise in investing specifically for insurance companies to help manage our investment portfolio based on investment guidelines initially approved by our board of directors and administered by our finance committee. Our board reviews these guidelines annually, and our finance committee reviews our investments and their performance once per quarter. Our key objectives in developing our investment guidelines include maintaining sufficient liquidity to meet our insurance operation obligations, ensuring capital preservation, and maximizing total return on the portfolio.
Our investment portfolio consists primarily of investment-grade fixed-income instruments and equity securities listed on major exchanges. We believe our investment portfolio is highly liquid, and we manage it to have a relatively short duration.
As of March 31, 2015 our total invested assets were $104.8 million. These assets were split 96% fixed maturity securities and short-term investments and 4% equity. Our option adjusted duration (which assumes the earliest possible trigger of any put or call features on our long term investments) was 3.5 years. Our overall average credit quality for our fixed income securities was AA, and our tax
114
equivalent book yield was 2.10%. At March 31, 2015, we had a total unrealized gain in the portfolio of approximately $2.4 million (including gains for both fixed income and equity).
We utilize benchmarking to track our managers progress toward our investment goals. For example, the current Conifer fixed income benchmark is a customized blend of Barclays indices. It is currently comprised of a blend of the following: US Mortgage Backed Securities weighted at 25%, 1-5 year US Government notes weighted at 30%, 1-5 year US Corporate notes weighted at 35% and 1-10 year Municipal Bonds weighted at 10%.
The average duration of this benchmark is approximately 3.3 years, which is consistent with our risk tolerance for interest rate exposure. Additionally, the allocation of 10% to Municipal securities is in line with our capacity to take advantage of tax-free income.
Our portfolio is not subject to foreign exchange risk, and we do not utilize options or otherwise leverage our portfolio. In addition, we employ stringent diversification rules to minimize concentration of risk.
Our cash and investment portfolio totaled $123.7 million and $68.4 million as of December 31, 2014 and 2013, respectively, and is summarized as follows:
| |
2014 | 2013 | |||||||||||
|---|---|---|---|---|---|---|---|---|---|---|---|---|---|
| |
Amount | Percent of Portfolio |
Amount | Percent of Portfolio |
|||||||||
| |
|
|
(Dollars in thousands) |
|
|||||||||
Fixed maturity securities: |
|||||||||||||
U.S. government obligations |
$ | 5,941 | 5 | % | $ | 3,407 | 5 | % | |||||
State and local government |
10,961 | 9 | % | 9,235 | 13 | % | |||||||
Corporate debt |
30,949 | 25 | % | 10,736 | 16 | % | |||||||
Commercial mortgage and asset- backed |
36,554 | 29 | % | 20,777 | 31 | % | |||||||
| | | | | | | | | | | | | | |
Total fixed maturity securities |
84,405 | 68 | % | 44,155 | 65 | % | |||||||
Equity securities, common stock |
4,084 |
3 |
% |
3,712 |
5 |
% |
|||||||
Short-term investments |
16,749 | 14 | % | 9,282 | — | % | |||||||
Cash |
18,488 | 15 | % | 11,296 | 30 | % | |||||||
| | | | | | | | | | | | | | |
Total |
$ | 123,726 | 100 | % | $ | 68,445 | 100 | % | |||||
| | | | | | | | | | | | | | |
| | | | | | | | | | | | | | |
| | | | | | | | | | | | | | |
For additional related information, see information Note 4 of the Consolidated Financial Statements and "Management's Discussion and Analysis" included elsewhere in this prospectus.
Insurance Cycle Management and Growth
As discussed under "Insurance Industry Overview," the insurance and reinsurance business is cyclical in nature, with "hard" and "soft" cycles. Hard markets occur when insurance underwriters limit their exposure in a line of business or across their entire portfolio. When underwriters exercise restraint, insurance buyers are forced to pay more to induce underwriters to cover their risks. A hard market can also be created by economic expansions when capital committed to backing insurance policies does not grow as fast as demand for insurance. There is generally a correlation between interest rates and the willingness of insurance companies to commit their capital to writing insurance. When fixed income yields are low, insurance companies need to raise insurance prices to improve underwriting results in order to offset loss of investment income.
We are currently in a growth phase for our business overall. In both our commercial and personal lines, we are experiencing growth in premiums driven by rate increases as well as increases in policy
115
count and exposures. The table below shows the increases in gross written premiums we have achieved in our Commercial and Personal Lines from 2012 through 2014.
| |
December 31, | |
||||||||||||||||||||
|---|---|---|---|---|---|---|---|---|---|---|---|---|---|---|---|---|---|---|---|---|---|---|
| |
(dollars in thousands) | |
||||||||||||||||||||
| |
2014 | 2013 | 2012 | |
||||||||||||||||||
| |
$ | % | $ | % change |
$ | % change |
Cumulative change for |
|||||||||||||||
Gross written premiums |
||||||||||||||||||||||
Commercial lines |
$ |
55,056 |
66 |
% |
$ |
27,321 |
102 |
% |
$ |
13,954 |
96 |
% |
295 |
% |
||||||||
Personal lines |
28,791 | 34 | % | 16,766 | 72 | % | 8,884 | 89 | % | 224 | % | |||||||||||
| | | | | | | | | | | | | | | | | | | | | | | |
Total |
$ | 83,847 | 100 | % | $ | 44,087 | 90 | % | $ | 22,838 | 93 | % | 267 | % | ||||||||
| | | | | | | | | | | | | | | | | | | | | | | |
| | | | | | | | | | | | | | | | | | | | | | | |
| | | | | | | | | | | | | | | | | | | | | | | |
E&S policies can be more sensitive to hard and soft markets. We have, therefore, sought to diversify this business by geography, line of business and also revenue stream. While we have been growing our business, and achieving rate increases for several periods through December 31, 2014, there will likely be periods in the future where our growth moderates, stagnates or turns negative.
Traditionally, admitted insurance lines have also been susceptible to market cycles, though to a lesser degree. We believe this trend is continuing. We seek to mitigate these trends by writing lines of business in which we best understand the market trends utilizing our underwriting experience, by purchasing reinsurance and by tailoring the amount of insurance we write as the market dictates.
Competition
The property and casualty insurance industry is highly competitive, and except for certain regulatory considerations, there are relatively few barriers to entry. In this fragmented market, we compete with both large national insurance providers and smaller regional specialty insurance companies on the basis of customer service, coverages offered, claims handling, price, agent commission and financial strength ratings. Many of our competitors have higher ratings, more capital, greater resources and additional access to capital than we do. They may offer a wider range of products and services than we do and may cover larger geographic markets. It is possible that new entrants to our markets may arise and create additional competition, leading to potentially lower prices and/or higher limits offered. To remain competitive our strategies includes, among other measures: (i) focusing on underserved markets; (ii) maintaining a deep understanding of the business and regulatory landscape of our markets; (iii) placing an emphasis on flexibility in both the markets in which compete and writing policies on an admitted and E&S basis; (iv) focusing on strong relationships with our agents; (v) increasing our premiums written in existing markets; (vi) expanding geographically in a prudent manner; (viii) engaging in complementary acquisitions; and (ix) emphasizing a conservative risk management approach.
Properties
We lease office space in Birmingham, Michigan, where our principal executive office is located. We also lease offices in Jacksonville, Longwood and Miami, Florida; Somerset, Pennsylvania; Charleston, South Carolina; and Waco, Texas. We believe that our facilities are adequate for our current needs and that suitable additional or substitute space will be available as needed.
Employees
As of December 31, 2014, we had 113 employees. All of our employees are full time. Our employees are not subject to any collective bargaining agreement and we are not aware of any current efforts to implement such an agreement. We believe we have good working relations with our employees.
116
Intellectual Property
We claim service mark rights to our trade names and corporate logos and have either a U.S. registration or U.S. applications for registration with the U.S. Patent and Trademark Office for such trade names and corporate logos. Such registrations and applications protect our intellectual property from confusingly similar use. We monitor our trademarks and service marks and protect them from unauthorized use as necessary.
We use a licensed system for policy administration in our underwriting, claims management and financial statement generation. The license has a term that expires in July 2018. We believe that we can utilize other available systems and technologies in the event that the license is not renewed upon expiration.
Legal Proceedings
We are party to legal proceedings which arise in the ordinary course of business. We believe that the outcome of such matters, individually and in the aggregate, will not have a material adverse effect on our consolidated financial position, operating results or liquidity.
Ratings
Insurance companies can apply to receive a financial strength rating from ratings services like A.M. Best and Demotech. In setting their ratings, these agencies utilize a quantitative and qualitative analysis of a company's balance sheet strength, operating performance and business profile. These analyses include comparisons to peers and industry standards as well as assessments of operating plans, philosophy and management. The ratings of A.M. Best range from A++, or superior, to F for in liquidation. Demotech's ratings range from "A" (unsurpassed) to M (moderate). As of the date of this prospectus, A.M. Best has assigned financial strength ratings of B++ to CIC (the fifth highest rating level out of sixteen rating levels) and B+ for WPIC (the sixth highest out of sixteen). ACIC is not currently rated by A.M. Best. A rating of B++ for CIC and a rating of B+ for WPIC means A.M. Best considers both companies to have a "good" ability to meet their ongoing insurance obligations, i.e., to pay claims. Each of CIC, WPIC and ACIC are rated "A" by Demotech (the third highest rating level out of six rating levels) as of the date of this prospectus. A financial stability rating of "A" from Demotech indicates "exceptional" financial stability related to maintaining surplus at an acceptable level. These ratings reflect A.M. Best's and Demotech's opinions of the applicable insurance company subsidiary's ability to meet its obligations to policyholders and is not directed toward investors.
Our current insurance company ratings have allowed us to continue to grow our business and expand our products and services to numerous states. Although not all of our insurance business is rating sensitive, if our ratings were to decline, it may impact our ability to write a high volume of premiums in certain lines we would otherwise target, and could slow our overall growth as a result. Conversely, if our ratings were to improve, we believe that several new markets could be available to us, thereby potentially accelerating our growth. In addition, our credit facility contains certain covenants relating to our ratings. Accordingly, if our ratings were to deteriorate, our liquidity and financial flexibility would be adversely affected.
Regulatory Environment
General
The insurance industry is highly regulated. State insurance laws and regulations are complex and each jurisdiction's requirements are different. State insurance regulators generally have broad administrative power with respect to all aspects of the insurance business.
117
Our insurance companies and our other affiliates are subject to regulation by insurance regulatory agencies in each state in which they operate. This regulation is designed for the protection of our policyholders rather than our shareholders. The regulatory requirements and restrictions include or involve the following:
- •
- prior approval of the change in control of our company or our insurance companies;
- •
- approval of the policy forms and premium rates of our insurance companies writing admitted business;
- •
- standards of solvency, including statutory and risk-based capital requirements establishing the minimum amount of capital and surplus
that must be maintained by our insurance companies;
- •
- restrictions concerning which assets of our insurance companies are admissible for purposes of calculating their capital and surplus;
- •
- licensing of insurers, their agents and various other insurance-related entities;
- •
- advertising and marketing practices;
- •
- restrictions on the nature, quality and concentration of the investments of our insurance companies;
- •
- assessments by guaranty associations;
- •
- restrictions on the ability of our insurance companies to pay dividends to us;
- •
- restrictions on transactions between our insurance companies and their affiliates;
- •
- restrictions on the size of risks insurable under a single policy;
- •
- rules requiring deposits for the benefit of policyholders;
- •
- rules requiring certain methods of accounting;
- •
- periodic examinations of our operations and finances;
- •
- claims practices;
- •
- rules prescribing the form and content of records of financial condition required to be filed; and
- •
- rules requiring adequate reserves for unearned premium, losses and loss expense, or for other purposes.
Dividends
We are a holding company with no business operations of our own. Consequently, our ability to pay dividends to shareholders, meet our debt payment obligations and pay our taxes and administrative expenses is largely dependent on intercompany service agreements with, and dividends from, our subsidiaries. Our key operating subsidiaries are insurance companies with significant regulation and restrictions with regards to paying dividends. See "Liquidity and Capital Resources—Capital Constraints," included in this prospectus.
Insolvency Funds and Associations, Mandatory Pools and Insurance Facilities
Most states require admitted property and casualty insurance companies to become members of insolvency funds or associations which generally protect policyholders against the insolvency of the admitted insurance companies. Members of the fund or association must contribute to the payment of certain claims made against insolvent insurance companies through annual assessments. The annual
118
assessments required in any one year will vary from state to state, and are subject to various maximum assessments per line of insurance.
To sell homeowners insurance in Florida, insurance companies must purchase reinsurance from the Florida Hurricane Catastrophe Fund ("FHCF"). At their option, insurance companies must purchase reinsurance of at least 45% of policy limits from the FHCF. The FHCF is a state-administered reinsurance program in Florida providing mandatory reinsurance for hurricane losses to any insurer writing covered policies—including homeowners insurance—in Florida. The FHCF charges each participating insurer an actuarially indicated premium for the reinsurance it provides, which generally corresponds to the insurer's market share as of June in the year in which coverage is sought. The FHCF policy year stretches from June 1st of the following year. In addition, if the revenue generated through the premiums charged by the FHCF is insufficient to fund the obligations, costs and expenses of the FHCF, the Florida Office of Insurance Regulation may levy an emergency assessment on all property and casualty insurers doing business in Florida. Insurers may pass this assessment through to their policyholders, but insurers are not responsible for assessments that are uncollectible from their policyholders.
Risk-Based Capital
Risk-Based Capital ("RBC") is a method of measuring the minimum amount of capital appropriate for an insurance carrier to support its overall business operations in consideration of its size and risk profile.
RBC generally limits the amount of risk a company can take. It requires a company with a higher amount of risk to hold a higher amount of capital. RBC is intended to be a minimum regulatory capital standard and not necessarily the full amount of capital that an insurer would want to hold to meet its safety and competitive objectives. In addition, RBC is just one of the tools that give regulators legal authority to take control of an insurance company.
The minimum threshold for capital for RBC calculation purposes is known as the Authorized Control Level ("ACL"). The Total Adjusted Capital Level of an insurance company is the numerator and the ACL is the denominator. If the ratio is greater than 3 to 1 the requirement is generally considered met.
We believe that we have sufficient capital to meet the RBC requirements that our state insurance regulators expect.
Captive Insurance Company Regulation
We organized and activated RCIC as a captive insurance subsidiary in October 2011. RCIC is organized and licensed as a pure captive insurance company under the laws of the District of Columbia. Our captive insurance company assumes only the risks of its parent and/or affiliated companies.
Generally, captive insurance companies are not subject to the same degree of regulation as are other insurance companies. For example, the laws and regulations applicable to non-captive insurance companies domiciled in the District of Columbia do not apply to captive insurance companies domiciled in the District of Columbia. As a result, RCIC will not be subject to, among other things, the District's rate and form filing requirements, guaranty fund assessments, or insurance regulatory trust fund assessments. However, RCIC is required to file an annual report with the Commissioner of the District of Columbia Department of Insurance, Securities and Banking and will be subject to periodic financial examinations by the Commissioner's office. Moreover, RCIC's investments will be subject to review and possible disapproval by the Commissioner's office. RCIC is also subject to minimum capital and surplus requirements for captive insurance companies and premium taxes levied by the District of Columbia.
119
Executive Officers and Directors
The following table sets forth information regarding our executive officers and directors (ages as of July 30, 2015):
Name
|
Age | Position | ||
|---|---|---|---|---|
James G. Petcoff |
59 | Chief Executive Officer, Chairman of the Board of Directors | ||
Brian J. Roney |
51 | President | ||
Nicholas J. Petcoff |
34 | Executive Vice President, Secretary, Director | ||
Andrew Petcoff |
31 | Senior Vice President, Marketing | ||
Harold Meloche |
54 | Chief Financial Officer, Treasurer | ||
Mark McCammon |
42 | Director | ||
Jorge Morales |
60 | Director | ||
Joseph Sarafa |
60 | Director | ||
R. Jamison Williams, Jr. |
74 | Director |
Set forth below are the biographies of the executive officers and directors, which describe their business experience during at least the past five years, as well as a discussion of the specific experience, qualifications, attributes and skills that led to the Board's conclusion that each director should continue to serve on the Board.
James G. Petcoff, our Chairman and Chief Executive Officer since our incorporation in 2009, has over 35 years of experience in the insurance industry. Prior to 2009, Mr. Petcoff founded North Pointe in 1986, where he served President, Chief Executive Officer and Chairman of the Board until its April 2008 sale to QBE Holdings Inc. From 1999 to August 2004, he also has served as a director of Rentrak Corp., a Nasdaq-listed company based in Portland, Oregon that leased videocassettes, DVDs and video games to video specialty stores and other retailers. From 1980 to 1986, he served as an employee and in management positions at independent commercial insurance agencies. Mr. Petcoff graduated with a B.A. degree from Michigan State University in 1977, an M.B.A. degree from University of Detroit in 1980 and a J.D. degree from University of Detroit School of Law in 1992.
Mr. Petcoff has led the Company as our principal executive officer, Chairman of the Board of Directors and a director since our incorporation. He has a unique perspective and understanding of our business, culture and history, having led our Company and North Pointe through many economic cycles and operational initiatives. His day-to-day leadership of the Company gives him critical insights into our operations, strategy and competition, and he facilitates the Board's ability to perform its oversight function. Mr. Petcoff also possesses in-depth knowledge of, and key relationships in, the insurance industry on a national basis.
Brian J. Roney, our President since April 2010, has over 16 years of experience in the insurance industry and over 26 years of experience in financial services. Prior to this position, he served as Executive Vice President and Treasurer for First Mercury Financial Corporation from April 2008 until April 2010. Previously, he served as chief financial officer for North Pointe from May 2006 until April 2008. He joined North Pointe in 1999 and was given responsibility for mergers and acquisitions, personal lines planning, business planning and special projects. Before joining North Pointe in 1999, he worked for ten years in the securities industry as Managing Director of Corporate Syndicate with Roney and Co., a Michigan-based broker dealer (and its successors), where he specialized in public and private offerings for investment banking clients. He was a principal of Roney and Co. prior to its sale in 1999. Mr. Roney graduated with a B.A. degree from the University of Notre Dame in 1986 and with an M.B.A. degree from the University of Detroit in 1988.
Nicholas J. Petcoff has served as our Executive Vice President and a director since 2009. He previously served at Home Pointe Insurance Company, an affiliate of North Pointe, from 2005 until
120
2006 as the underwriting manager of personal lines and from 2006 until 2008 as Vice President of Home Pointe Insurance Company, with responsibility for all personal insurance lines at North Pointe. From 2004 to 2005, he served as a risk analyst for Guy Carpenter & Co. He graduated with a BBA in finance from the University of Notre Dame in 2004 and with a M.B.A. degree from Loyola University Chicago in 2010. Nicholas Petcoff is the son of our chairman and chief executive officer, James G. Petcoff.
Mr. Petcoff's underwriting and operational experience brings to our Board detailed insights on the day-to-day operational issues of the Company.
Andrew D. Petcoff has served as our Senior Vice President of Marketing since 2009. Mr. Petcoff has over 8 years of experience in the insurance industry. Prior to 2009, he served as a risk analyst at Guy Carpenter & Co. from 2007 until 2009. Prior to his time at Guy Carpenter & Co., he served as a specialty underwriter for North Pointe from 2005 until 2007. He graduated with a B.A. in general business from Mt. St. Mary's University in 2005 and with a M.B.A. degree from Loyola University Maryland in 2012. Andrew Petcoff is the son of our chairman and chief executive officer, James G. Petcoff.
Harold Meloche has served as our Chief Financial Officer and Treasurer since May 2013. Mr. Meloche has over 21 years of experience in the insurance industry. Prior to his appointment as Chief Financial Officer, Mr. Meloche was President of XM Consulting, Inc., a consulting firm that provided CFO-level services and M&A consulting services to insurance companies and other firms in the insurance industry, from September 2009 to May 2013. From 2006 through 2009, Mr. Meloche served as Executive Director of External Reporting and Controls for GMAC, LLC and Controller of GMAC Insurance. Mr. Meloche also served in various roles at North Pointe and its affiliates from 1999 through 2006, including as chief accounting officer and chief financial officer for North Pointe's pre-initial public offering parent, Queensway Financial Services, Ltd., and thereafter as treasurer of North Pointe. Prior to joining North Pointe, Mr. Meloche was a financial audit manager at PricewaterhouseCoopers, LLC which he joined in 1993. Mr. Meloche graduated with a B.S. in Business Administration from S.U.N.Y New Paltz in 1986 and an M.S. in Professional Accountancy from Walsh College in 1993.
Mark McCammon has served as one of our directors since 2013. Since 2000, Mr. McCammon has been the managing partner of Strength Capital where he is primarily responsible for investment sourcing and valuation, transaction structuring, the securing of acquisition financing, fundraising and all administrative activities. Prior to 2000, Mr. McCammon worked in the equity division at T. Rowe Price Associates from 1996 to 1998 and in the Corporate Finance department at Goldman Sachs & Co from 1994 to 1996. At T. Rowe Price, he was a research analyst focused on large growth companies. At Goldman Sachs, Mr. McCammon spent his time split between corporate finance and mergers and acquisitions. Additionally, he worked at Graham Partners, a private equity firm in Wayne, Pennsylvania. He is also a member of the Board of Trustees at Walsh College. He has a B.S. degree in Finance from Miami University in Oxford, Ohio and is a Chartered Financial Analyst (CFA). Mark received his M.B.A. degree from Harvard Business School.
Mr. McCammon's extensive experience in the merger and acquisition area and strong financial background bring valuable strategic and financial insights to our Board.
Jorge J. Morales has served as one of our directors since 2010. He previously served as a director of North Pointe from 1988 until 2008. Since 1998, he has been the Chief Executive Officer of CNI, Inc. a company that manufactures and distributes trim for automobiles. He has previously served as the president of two employee staffing organizations—MMS, Inc. from 1997 to 1998, and HR Alliance, Inc. from 2003 to 2007. Mr. Morales graduated with a B.A. degree in Accounting from Oakland University in 1979.
121
Mr. Morales' executive management experience across a broad range of industries brings important expertise regarding operational and management issues considered by our Board.
Joseph D. Sarafa has served as one of our directors since 2012. Mr. Sarafa has been a practicing lawyer for 31 years. Since 2010 he has been a partner with the firm Moothart & Sarafa, P.C.. From 2002 until 2009 he was of counsel with the law firm of Cummings, McClorey, Davis & Acho, P.L.C. From 1986 through 2002, he was the President of the Associated Food Dealers of Michigan. Mr. Sarafa graduated with a B.S. degree from The University of Michigan in 1977 and a J.D. degree from the University of Detroit-School of Law in 1982.
Mr. Sarafa's legal experience and years of providing counsel to a broad range of industries brings important expertise in the areas of governance, compliance, and regulatory issues to our Board.
R. Jamison Williams Jr. Mr. Williams has served as one of our directors since 2009. He is a practicing attorney at Williams, Williams, Rattner & Plunkett, a law firm he founded in 1972. He is a director of several private foundations and private companies. Mr. Williams' legal practice focuses on mergers and acquisitions, financings and restructurings.
Mr. Williams brings extensive experience in a wide variety of transactions to our Board. In addition, his legal judgment and experience assists our Board in its consideration of various governance and strategic issues.
Board Composition
Our Board of Directors currently consists of six directors, two of whom currently serve as executive officers.
Director Independence
Staggered Board
Our restated articles of incorporation and restated bylaws that will be in effect upon the completion of this offering provide for a classified board of directors consisting of three classes of directors, each serving staggered three-year terms. Our directors will be divided among the three classes as follows:
- •
- Class I directors, whose initial term will expire at the annual meeting of shareholders to be held in fiscal year 2016, will
consist of Messrs Sarafa and Williams;
- •
- Class II directors, whose initial term will expire at the annual meeting of shareholders to be held in fiscal year 2017, will
consist of Messrs McCammon and Nicholas Petcoff; and
- •
- Class III directors, whose initial term will expire at the annual meeting of shareholders to be held in fiscal year 2018, will consist of Messrs Morales and James Petcoff.
Directors in a particular class will be elected for three-year terms at the annual meeting of shareholders in the year in which their terms expire. As a result, only one class of directors will be elected at each annual meeting of our shareholders, with the other classes continuing for the remainder of their respective three-year terms. Each director's term continues until the election and qualification of his successor, or his earlier death, resignation or removal.
Our restated articles of incorporation and restated bylaws that will be in effect upon the completion of this offering provide that our board of directors or our shareholders may fill vacant directorships. Any additional directorships resulting from an increase in the authorized number of directors would be distributed among the three classes so that, as nearly as possible, each class would consist of one-third of the authorized number of directors.
122
The classification of our board of directors may have the effect of delaying or preventing changes in our control or management. See "Description of Capital Stock: Anti-Takeover Effects of Certain Provisions of our Amended and Restated Articles of Incorporation and Bylaws and Michigan Law."
Committees of Our Board of Directors
Our board of directors has established four standing committees to assist it in carrying out its responsibilities: the Audit Committee, the Compensation Committee, the Nominating and Corporate Governance Committee, and the Finance and Investment Committee. Each of the Audit Committee, the Compensation Committee, the Finance and Investment Committee and the Nominating and Corporate Governance Committee operates under its own written charter adopted by our board of directors, which charters will be amended effective upon the consummation of the offering to comply with the applicable rules and regulations of the SEC and NASDAQ. Prior to the consummation of this offering, the Audit Committee, the Compensation Committee, the Finance and Investment Committee and the Nominating and Corporate Governance Committee charters will be available without charge on the investor relations portion of our website, the contents of which are not a part, and shall not be deemed to be a part, of this prospectus. The membership of each committee upon consummation of this offering, and the function of each of the committees, are described below.
Audit Committee
Upon the consummation of this offering, our Audit Committee will consist of Mr. Mark McCammon (Chairperson), Mr. Joseph Sarafa and Mr. Richard Williams. Mr. Mark McCammon has been identified by our board of directors as an "audit committee financial expert" as that term is defined Item 407(d)(5) of Regulation S-K. The Audit Committee assists our board of directors in fulfilling its oversight responsibilities relating to:
- •
- the integrity of our financial statements and our financial reporting process;
- •
- internal and external auditing and the independent registered public accounting firm's qualifications and independence;
- •
- the performance of an internal audit function and our independent registered public accounting firm;
- •
- the integrity of our systems of internal accounting and financial controls; and
- •
- our compliance with legal and regulatory requirements.
In so doing, the Audit Committee is responsible for maintaining free and open communication between the committee, the independent registered public accounting firm and our management. In this role, the Audit Committee is empowered to investigate any matter brought to its attention with full access to all books, records, facilities and personnel of our Company and has the power to retain outside counsel or other experts for this purpose.
The Audit Committee has direct responsibility for the appointment, compensation, retention and oversight of our independent registered public accounting firm. The Audit Committee meets in executive session with the independent registered public accounting firm periodically.
The Audit Committee will be responsible for approving all transactions with related persons. The Audit Committee periodically reviews and approves or ratifies a summary of transactions with related persons as prepared by management. To the extent any new transactions may arise during the course of the year, management discusses such transactions with the Audit Committee. All transactions with related persons in 2014 were approved or ratified by the Audit Committee.
123
Compensation Committee
Upon the consummation of this offering, the members of the Compensation Committee will consist of Mr. Morales (Chairperson), and Mr. Sarafa. The Compensation Committee assists our board of directors with reviewing the performance of our management in achieving corporate goals and objectives and assuring that our executives are compensated effectively in a manner consistent with our strategy, competitive practice and the requirements of the appropriate regulatory bodies. Toward that end, the Compensation Committee, among other responsibilities, makes recommendations to our board of directors regarding director and executive officer compensation, equity-based compensation plans and executive benefit plans. The Compensation Committee also administers the Company's incentive plans.
Nominating and Corporate Governance Committee
Upon the consummation of this offering, the members of the Nominating and Corporate Governance Committee will consist of Mr. Sarafa (Chairperson) and Mr. Nicholas Petcoff. Among other responsibilities, the Nominating and Corporate Governance Committee identifies individuals qualified to become board members, recommend to the board of directors the director nominees for the next annual meeting of shareholders and recommend to the board of directors individuals from time to time to fill vacancies on the board of directors.
The Nominating and Corporate Governance Committee will have the responsibility for, among things, identifying and recommending candidates to the board of directors for election to our board of directors, reviewing the composition of the board of directors and its committees, developing and recommending to the board of directors corporate governance guidelines that are applicable to us and overseeing board of directors evaluations.
Finance and Investment Committee
Upon consummation of this offering, the members of our Finance and Investment Committee will consist of Mr. James Petcoff (Chairperson) and Messrs. Williams and Roney. The Finance and Investment Committee establishes and oversees the implementation of our overall investment policy.
Compensation Committee Interlocks and Insider Participation
None of our executive officers currently serves, or in the past year has served, as a member of the board of directors or compensation committee of any entity that has one or more executive officers serving on our board of directors or Compensation Committee.
Code of Conduct
We have a Code of Conduct applicable to our directors, officers and employees that complies with the requirements of applicable rules and regulations of the SEC and NASDAQ. This code is designed to deter wrongdoing and to promote:
- •
- honest and ethical conduct, including the ethical handling of actual or apparent conflicts of interest between personal and
professional relationships;
- •
- full, fair, accurate, timely and understandable disclosure in reports and documents that we file with, or submit to, the SEC and in
other public communications made by us;
- •
- compliance with applicable governmental laws, rules and regulations;
- •
- prompt internal reporting to an appropriate person or persons identified in the Code of Business Conduct and Ethics of violations of
the Code of Business Conduct and Ethics; and
- •
- accountability for adherence to the Code of Conduct.
124
Upon completion of this offering, our Code of Conduct will be available on the investor relations portion of our website.
Director Compensation
Historically, our directors have been paid $500 per meeting attended. Upon completion of this offering, we intend to design a compensation program for our non-employee directors in conformity with public company practice. We expect that compensation for our non-employee directors will include an annual retainer and potentially, an equity component under our 2015 Omnibus Incentive Plan described below.
Conifer Holdings, Inc. 2015 Omnibus Incentive Plan (the "2015 Omnibus Incentive Plan")
Our Board of Directors adopted the 2015 Omnibus Incentive Plan effective March 4, 2015. The following summary describes the material terms of the omnibus plan. This summary is not a complete description of all provisions of the omnibus plan and is qualified in its entirety by reference to the omnibus plan, which has been filed as an exhibit to the registration statement of which this prospectus is a part.
Overview. The omnibus plan is intended to attract, reward and retain highly competent employees, directors and consultants, to provide additional incentives to such persons by aligning their interests with those of the Company and to promote the success of our business.
Administration. The omnibus plan is administered by a committee, which consists of the Board of Directors, or if designated by the Board of Directors, the compensation committee of the Board of Directors. Subject to the terms of the omnibus plan, the committee has the authority in its discretion to: (a) determine the fair market value; (b) select the types of grants to be awarded and the service providers to whom awards may be granted; (c) determine the number of shares to be covered by each award granted; (d) determine whether, to what extent, and under what circumstances an award may be settled in cash, shares, other securities, other awards, or other property; (e) approve forms of award agreements; (f) determine and amend, in a manner consistent with the terms of the omnibus plan, the terms and conditions of any award granted hereunder, based on such factors as the committee, in its sole discretion, shall determine; (g) construe and interpret the terms of the omnibus plan and award agreements; (h) correct any defect, supply any omission, or reconcile any inconsistency in the omnibus plan or any award agreement in the manner and to the extent it shall deem desirable to carry out the purposes of the omnibus plan; (i) prescribe, amend, and rescind rules and regulations relating to the omnibus plan; (j) authorize withholding arrangements pursuant to the omnibus plan; (k) authorize any person to execute on our behalf any instrument required to effect the grant of an award granted by the committee; (l) accelerate the vesting of an award; (m) determine the treatment of awards in connection with any adjustment described the omnibus plan; (n) amend any award after the grant date, including, but not limited to, the exercise price for an option, and (o) take all other action as the committee otherwise deems necessary or advisable for administering the omnibus plan and effectuating its purposes.
Authorized Shares. Initially, there are 1,377,000 common shares reserved for issuance under the omnibus plan. See "Executive Compensation—Equity Awards Granted to our Named Executive Officers" for information regarding restricted stock units to be issued under our 2015 Omnibus Incentive Plan upon consummation of this offering.
Type of Awards. The omnibus plan provides for the awards of options, restricted shares and units and other equity based awards. The terms of the awards are described below.
Options. The omnibus plan permits the granting of incentive stock options and non-qualified option awards. No option shall have a term in excess of ten years from the grant date. In the case of
125
any incentive stock option granted to a 10% shareholder, the term of such incentive stock option shall not exceed five years from the grant date. The exercise price per share of an option shall be determined in the sole discretion of the committee and shall not be less than 100% of the fair market value per share on the grant date. In the case of any incentive stock option granted to a 10% shareholder the exercise price per share of such incentive stock option shall not be less than 110% of the fair market value per share on the grant date.
Notwithstanding an option's designation, to the extent that incentive stock options are exercisable for the first time by the participant during any calendar year with respect to shares whose aggregate fair market value exceeds $100,000, options having a value in excess of $100,000 shall be treated as non-qualified options. For this purpose, fair market value is measured as of the grant date and incentive stock options are taken into account in the order in which they were granted consistent with applicable law. The committee determines the acceptable form of consideration for exercising an option, including the method of payment. In the case of an incentive stock option, the committee determines the acceptable form of consideration at the time of grant. Consideration may be paid by cash, check, or other cash equivalent approved by the committee. The committee may impose blackout periods on the exercise of any option to the extent required by applicable laws.
Restricted Stock Awards. The omnibus plan permits the granting of restricted stock awards, which includes restricted stock and restricted stock units, which consist of the right to a grant of shares upon the lapse of certain restrictions ("RSUs"). Pursuant to the omnibus plan the restriction period, the number of shares granted, the purchase price paid for such shares, and other conditions and limitations applicable to each award of restricted shares or RSUs are determined by the committee and stated in the award agreement. Unless the committee determines otherwise, we will hold restricted shares as escrow agent until the restrictions on such shares have lapsed. Prior to the end of the restricted period, restricted shares or RSUs may not be sold, transferred, pledged, assigned, or otherwise alienated or hypothecated. Restricted shares covered by an award made under the omnibus plan shall be released from escrow, and shall become fully transferable, as soon as practicable after the restriction period ends, and in any event no later than 21/2 months after the end of the tax year in which the restriction period ends. During the restriction period, service providers holding restricted shares or RSUs are entitled to receive all dividends and other distributions paid with respect to such shares, unless otherwise provided in the award agreement.
Other Equity-Based Awards. The committee has the right to grant other awards based upon or payable in shares with such terms and conditions as the committee may determine, including deferred stock units, unrestricted shares, the grant of shares upon the achievement of a performance objective and the grant of securities convertible into shares.
Adjustments. If any extraordinary dividend or other extraordinary distribution occurs in respect of the shares, or any reclassification, recapitalization, stock split, reverse stock split, reorganization, merger, consolidation, split-up, spin-off, combination, repurchase, or exchange of our shares or other securities or any similar, unusual or extraordinary corporate transaction, including a change in control, occurs. The committee will, in such manner and to such extent as it deems appropriate and equitable:
(a) proportionately adjust any or all of (i) the number and type of shares that thereafter may be made the subject of awards, (ii) the number, amount and type of shares subject to any or all outstanding awards, (iii) the grant, purchase, or exercise price of any or all outstanding awards, (iv) the securities, cash or other property deliverable upon exercise of any outstanding awards or (v) the performance standards appropriate to any outstanding awards, or
(b) in the case of an extraordinary dividend or other distribution, recapitalization, reclassification, merger, reorganization, consolidation, combination, sale of assets, split up, exchange, or spin off make provision for (i) a cash payment, (ii) the substitution or exchange of any or all outstanding awards, (iii) the cash, securities or property deliverable to the holder of any
126
or all outstanding awards based upon the distribution or consideration payable with respect to shares upon or in respect of such event, (iv) all vested options to be exercised by a date certain in connection with such event at which time these stock rights shall terminate, provided participants are given advance written notice or (v) a combination of the foregoing, which may vary among participants.
The committee shall value awards as it deems reasonable in the event of a cash settlement and, in the case of options or similar stock rights, may base such settlement solely upon the excess if any of the per Share amount payable upon or in respect of such event over the exercise price of the award. The committee's determination is final and conclusive.
Eligibility and Share Limitations. The committee may grant awards under the omnibus plan in substitution for stock and stock-based awards held by employees, directors, consultants or advisors of another corporation in connection with a merger, consolidation or similar transaction. If an award is exercised, in whole or in part, by tender of shares or if our tax withholding obligation is satisfied by withholding shares, the number of shares deemed to have been issued under the omnibus plan shall be the net number of shares actually issued upon such exercise. In no event shall the number of shares issued upon the exercise of incentive stock options exceed 40,000 shares. If an award: (i) expires; (ii) is terminated, surrendered, or canceled without having been exercised in full; or (iii) is otherwise forfeited in whole or in part, then the unissued shares that were subject to such award and/or such surrendered, canceled, or forfeited shares becomes available for future grant or sale under the effective omnibus plan, subject however, in the case of incentive stock options, to any limitations under the Internal Revenue Code of 1986, as amended (the "Code").
Change in Control. Except as otherwise determined by the committee in accordance the omnibus plan and as set forth in an applicable award agreement or under a participant's employment agreement with the employer, in the event an employer terminates a participant's employment without cause within a twelve month period following a change in control, (a) all outstanding stock options held by such participant shall become vested and exercisable; and (b) all restrictions on restricted shares held by such participant shall lapse. All determinations are made by the committee in its sole discretion.
Forfeiture Provisions. If the participant's termination of employment or service, as applicable, is terminated by an employer for cause, no portion of any unvested option may be exercised, and any vested option will immediately expire and be forfeited upon such termination. In addition, the committee may provide, by rule or regulation or in any award agreement, or may determine in any individual case, the circumstances in which awards shall be exercised, vested, paid or forfeited in the event a participant ceases to be a service provider prior to the end of a performance period, restriction period or the exercise, vesting or settlement of such award. Unless otherwise determined by the committee if, with respect to any award, (a) a participant's termination of employment or service, as applicable, occurs before the end of the restriction period or the vesting date applicable to such award or (b) any performance objectives are not achieved in whole or in part by the end of the period for measuring such performance objectives, then all such then unvested and/or unearned awards shall be forfeited by the participant.
Amendment and Termination. The omnibus plan terminates upon the earliest to occur of (i) the tenth anniversary of board approval of the omnibus plan, which is March 4, 2025; (ii) the date on which all shares available for issuance under the omnibus plan have been issued as fully vested shares; or (iii) an earlier date determined by the board pursuant to its authority. The board or the committee may at any time amend, alter, suspend, or terminate the omnibus plan in its discretion, without consent. However, no amendment may adversely impair the rights of grantees with respect to outstanding awards, unless required to comply with an applicable law or mutually agreed otherwise between the participant and the committee; any such agreement must be in writing and signed by the participant and the company. Amendments will be submitted for shareholder approval to the extent required by the code or other applicable laws, rules or regulations. Termination of the omnibus plan shall not affect the committee's ability to exercise the powers granted to it thereunder with respect to awards granted under the omnibus plan prior to the date of such termination.
127
Summary Compensation Table
The following table shows the compensation earned by James G. Petcoff, Brian J. Roney and Nicholas J. Petcoff (collectively, the "named executive officers") for the years ended December 31, 2014 and 2013.
Name and Principal Position
|
Year | Salary ($) | Bonus ($) | All Other Compensation ($) |
Total ($) | |||||||||||
|---|---|---|---|---|---|---|---|---|---|---|---|---|---|---|---|---|
James G. Petcoff |
2014 | 350,000 | 30,000 | — | 380,000 | |||||||||||
Chief Executive Officer and Chairman of the Board of Directors of the Corporation |
2013 | 333,333 | 140,000 | — | 473,333 | |||||||||||
Brian J. Roney |
2014 | 300,000 | 30,000 | — | 330,000 | |||||||||||
President of the Corporation |
2013 | 289,583 | 140,000 | — | 429,583 | |||||||||||
Nicholas J. Petcoff |
2014 | 300,000 | 30,000 | — | 330,000 | |||||||||||
Executive Vice President, Secretary and Director of the Corporation |
2013 | 289,583 | 140,000 | — | 429,583 | |||||||||||
Narrative Disclosure to Summary Compensation Table
Compensation Determinations
This section explains the base salary and other benefits and perquisites provided to our named executive officers in 2014. Our compensation committee has historically determined our overall named executive officer compensation philosophy and related matters as a private company. In the future, the objectives, design and payouts of our named executive officer compensation program following this offering may, over time, vary significantly from our historical practices.
Base Salary
Our compensation committee determines the base salaries for each of our named executive officers, as referenced above. Generally, we aim to set executive base salaries near the middle range of the salaries that we have observed for executives in similar positions with similar responsibilities. We pay our named executive officers an annual base salary in cash. Base salaries are reviewed annually by the compensation committee and recommendations of increase are made after such evaluations.
As a privately-held company, we believe we have been able to develop competitive compensation packages to attract qualified candidates to fill our most critical positions without entering into written employment agreements. We do not intend to enter into written employment agreements with our named executive officers following completion of this offering, but may do so in the future. We expect our compensation program to change significantly following this offering, and our compensation committee will have the authority to engage compensation consultants to design an appropriate compensation plan.
Bonus
Our compensation committee historically has not utilized a strict formula in its determination of the annual bonus typically paid to our named executive officers. Rather, the compensation committee, with input from our chief executive officer with respect to bonuses for our other named executive officers, takes into account individual performance, company performance, and market conditions as a whole.
128
Other Benefits and Perquisites
None of our named executive officers receive benefits or perquisites in excess of $10,000 or which are otherwise not available to our employees generally.
Equity Awards Granted to our Named Executive Officers
In connection with this offering, we will grant an aggregate of 333,333 restricted share units under our 2015 Omnibus Incentive Plan to our executive officers and certain other employees, based upon an assumed initial offering price of $12.00 per share, the midpoint of the per share price range set forth in this prospectus.
On the date of consummation of this offering, our named executive officers will receive restricted share units equal in value to $2.0 million, based upon the initial public offering price of our common shares. The table below sets forth the number of restricted share units that each of our named executive officers will receive on the date of consummation of this offering, based upon the assumed initial public offering price of $12.00.
Name
|
Restricted Share Units |
|||
|---|---|---|---|---|
James G. Petcoff |
83,333 | (1) | ||
Brian J. Roney |
41,667 | (1) | ||
Nicholas J. Petcoff |
41,667 | (1) | ||
- (1)
- Vesting will occur in five equal annual installments commencing on the first anniversary of the grant date.
2014 Outstanding Equity Awards at Fiscal Year-End
None of our named executive officers had outstanding equity awards as of December 31, 2014.
Severance and Change in Control Benefits
We do not provide severance benefits to any of our named executive officers. Therefore, none of our named executive officers would have received any severance benefits in connection with a termination of employment as of December 31, 2014. Similarly, none of our named executive officers hold options or other restricted equity the vesting of which would be triggered upon a change in control.
129
CERTAIN RELATIONSHIPS AND RELATED PARTY TRANSACTIONS
Since July 30, 2012, there has not been any transaction or series of similar transactions to which we were or are a party in which the amount involved exceeded $120,000 and in which any of our directors, executive officers, holders of more than 5% of any class of our voting securities, or any member of the immediate family of any of the foregoing persons, had a direct or indirect material interest, other than compensation arrangements with directors and executive officers, which are described where required in the section titled "Management," and the transactions described below.
Policies and Procedures for Related Person Transactions
Prior to the consummation of this offering, we intend to adopt a related person transactions policy pursuant to which our executive officers, directors and principal shareholders, including their immediate family members, will not be permitted to enter into a related person transaction with us without the consent of our Audit Committee, another independent committee of our board or the full board. Any request for us to enter into a transaction with an executive officer, director, principal shareholder or any of such persons' immediate family members, in which the amount involved exceeds $120,000, will be required to be presented to our Audit Committee for review, consideration and approval. All of our directors, executive officers and employees will be required to report to our Audit Committee any such related person transaction. In approving or rejecting the proposed transaction, our Audit Committee will take into account, among other factors it deems appropriate, whether the proposed related person transaction is on terms no less favorable than terms generally available to an unaffiliated third-party under the same or similar circumstances, the extent of the related person's interest in the transaction and, if applicable, the impact on a director's independence. Under the policy, if we should discover related person transactions that have not been approved, our Audit Committee will be notified and will determine the appropriate action, including ratification, rescission or amendment of the transaction. Such policies were not in place when the related person transactions below were approved.
Related Party Transactions
Related Party Indebtedness
In December 2012, the Company borrowed $1 million from Brian Roney, our President, bearing an interest rate of 12% annually, with interest payable quarterly and maturing on January 26, 2014. This note was redeemed in exchange for the issuance of 82,252 shares of common stock at the per share value paid by other investors in private offerings of common stock that we undertook in the first half of 2014, pursuant to which $500,000 was redeemed for 41,126 shares of common stock on January 31, 2014 and the remaining $500,000 was converted into 41,126 shares of common stock on June 30, 2014.
In September 2014 and October 2014 James Petcoff, our Chief Executive Officer, and Brian Roney, our President, each provided us with a short term loan, in amounts of $1.6 million and $0.7 million respectively. We repaid each of the loans in full in late October 2014.
Other Family Relationships
We employ Andrew Petcoff, the son of our chairman and chief executive officer, James G. Petcoff, as our Senior Vice President of Marketing. In this capacity, Andrew Petcoff leads our marketing efforts and directs our personal insurance lines operations, which mainly focuses on homeowners insurance. He has also served as Senior Vice President of Marketing for CIC since 2009, Senior Vice President of Marketing for WPIC since 2010, President of Sycamore Insurance Agency, Inc. since May 2012, as President of both American Colonial Holdings, Inc. and American Colonial Insurance Services, Inc. and a director of American Colonial Insurance Company since November 2013 and its President since March 2015. Andrew Petcoff earned $191,667 in base salary compensation for his services during fiscal year 2014, and received a bonus of $30,000 pursuant to the Compensation Committee's administration of our bonus program. In addition, we expect to grant Andrew Petcoff restricted stock units under our 2015 Omnibus Incentive Plan with a value of $500,000 upon the consummation of this offering. Such restricted stock units will vest in five equal increments beginning on the first anniversary of the grant date.
130
The following table and footnotes set forth information with respect to the beneficial ownership of our common stock as of July 30, 2015, subject to certain assumptions set forth in the footnote and as adjusted to reflect the sale of the shares of common stock offered in the public offering under this prospectus for:
- •
- Each shareholder, or group of affiliated shareholders, who we know beneficially owns more than 5% of the outstanding shares of our
common stock;
- •
- Each of our named executive officers;
- •
- Each of our current directors; and
- •
- All of our current directors and current executive officers as a group.
Beneficial ownership of shares is determined under the rules of the SEC and generally includes any shares over which a person exercises sole or shared voting or investment power. Except as indicated by footnote, and subject to applicable community property laws, we believe each person identified in the table possesses sole voting and investment power with respect to all shares of common stock beneficially owned by them. Shares of common stock subject to options currently exercisable or exercisable within 60 days of July 30, 2015, are deemed to be outstanding for calculating the number and percentage of outstanding shares of the person holding such options, but are not deemed to be outstanding for calculating the percentage ownership of any other person. None of the 333,333 restricted stock units we expect to issue upon consummation of the offering will vest within 60 days of July 30, 2015, and accordingly are not reflected in the table below.
Applicable percentage ownership before and after this offering in the following table is based on 4,050,042 shares of common stock outstanding as of July 30, 2015, and also assumes the repurchase of 60,600 shares of our preferred stock, including dividend payments, for cash and certain holders use of such cash from the repurchase to purchase 257,567 shares of common stock (assuming an initial offering price of $12.00), resulting in 8,907,609 shares of common stock outstanding after completion of this offering.
Unless otherwise indicated and subject to applicable community property laws, to our knowledge, each shareholder named in the following table possesses sole voting and investment power over the shares listed, except for those jointly owned with that person's spouse. Unless otherwise noted below,
131
the address of each person listed on the table is c/o 550 W. Merrill Street, Suite 200, Birmingham, Michigan 48009.
| |
Shares of Common Stock Owned Before this Offering |
Shares of Common Stock Owned After this Offering |
|||||||||||
|---|---|---|---|---|---|---|---|---|---|---|---|---|---|
Name
|
Number | Percent | Number | Percent | |||||||||
5% shareholders: |
|||||||||||||
Strength Capital Partners(1) |
886,799 | 20.6 | % | 886,799 | 10.0 | % | |||||||
Named executive officers and directors: |
|||||||||||||
James G. Petcoff(2) |
1,907,184 | 44.3 | % | 1,907,184 | 21.4 | % | |||||||
Brian J. Roney |
205,312 | 4.8 | % | 205,312 | 2.3 | % | |||||||
Nicholas J. Petcoff |
35,700 | * | 35,700 | * | |||||||||
Harold Meloche |
16,442 | * | 16,442 | * | |||||||||
Andrew Petcoff |
24,816 | * | 24,816 | * | |||||||||
Mark McCammon(3) |
895,020 | 20.8 | % | 895,020 | 10.0 | % | |||||||
Joseph D. Sarafa |
7,854 | * | 7,854 | * | |||||||||
R. Jamison Williams, Jr.(4) |
165,505 | 3.8 | % | 165,505 | 1.9 | % | |||||||
Jorge J. Morales. |
— | — | % | — | — | % | |||||||
All executive officers and directors as a group (9 persons) |
3,257,833 | 75.6 | % | 3,257,833 | 36.6 | % | |||||||
- *
- Less
than 1%
- (1)
- Includes
153,000 common shares held by Strength Capital Partners II, L.P., 414,508 common shares held by Strength Capital
Partners III—Special Situations, 319,291 common shares held by Strength Capital Partners III—Special Situations (AIV) L.P.
- (2)
- Represents
1,907,184 shares held by the James G. Petcoff Revocable Trust.
- (3)
- Includes
886,799 shares held by Strength Capital Partners, of which Mr. McCammon is a managing director and may be deemed to have beneficial
ownership.
- (4)
- Represents 165,505 shares held by the Richard Jamison Williams Revocable Trust.
132
The following discussion is a summary of the terms of our capital stock and certain provisions of our amended and restated articles of incorporation and bylaws following amendments that we intend to make in connection with this offering, as well as certain applicable provisions of Michigan law. This summary does not purport to be complete and is qualified in its entirety by the provisions of our restated articles of incorporation and amended and restated bylaws, copies of which are filed with the SEC as exhibits to the registration statement of which this prospectus is a part.
Immediately following the closing of this offering, our authorized capital stock will consist of 100,000,000 shares of common stock, no par value per share, and 10,000,000 shares of preferred stock, undesignated. In that connection, on July 22, 2015, our Board of Directors approved a 10.2-for-1 stock split, effective immediately prior to the effectiveness of the registration statement to which this prospectus is a part. Unless otherwise indicated, all share and per share amounts included in this prospectus have been adjusted retroactively to give effect to that stock split.
Repurchase of Issued and Outstanding Preferred Stock
Prior to this offering and as of July 30, 2015, there were 4,050,052 shares of our common stock outstanding that were held of record by 124 shareholders and 60,600 shares of our preferred stock outstanding that were held of record by 24 shareholders.
Pursuant to agreements effective on or before July 1, 2015, the holders of all of our issued and outstanding preferred stock agreed to sell to us their shares of preferred stock on the closing date of this offering at a price equal to the original issuance price for that preferred stock, plus the sum of all accrued and unpaid preferred stock dividends. In addition, pursuant to agreements entered into on or before July 1, 2015, the holders of 29,550 shares (or 48.8%) of our issued and outstanding preferred stock agreed, in a separate private placement transaction, to use the proceeds from the sale of these shares, including dividend payments, to purchase from us, on the closing of this offering, shares of our common stock, at the same per share price as the common stock is being offered to the public in this offering. As a result of these transactions, following the closing of this offering we will pay $6.3 to holders of shares of preferred stock to repurchase such shares and we will have no shares of preferred stock issued and outstanding. Additionally, we will issue on the closing date a total of 257,567 shares of common stock to former holders of our preferred stock that have agreed to use such cash to purchase shares of common stock at a price of $ per share. See "Use of proceeds." After giving effect to the proceeds from the sale of shares in the private offering to our preferred holders, the net effect will be a use of $3.2 million from the proceeds of this offering to retire our preferred stock.
Authorized Capitalization
The following description summarizes certain important terms of our capital stock, as they are expected to be in effect immediately prior to the completion of this offering. We expect to amend our existing amended and restated articles of incorporation and bylaws such that they will reflect the descriptions of those charter documents below. Because it is only a summary, it does not contain all the information that may be important to you. For a complete description of the matters set forth in this section titled "Description of Capital Stock," you should refer to our amended and restated certificate of incorporation and amended and restated bylaws, which are included as exhibits to the registration statement of which this prospectus forms a part, and to the applicable provisions of Michigan law.
Preferred Stock
Our amended and restated articles of incorporation will authorize us to issue up to 10,000,000 shares of preferred stock, 60,600 of which will be designated as perpetual preferred stock
133
(until their repurchase, as described above) and will include the rights and preferences applicable to our existing preferred stock, as described below:
Voting Rights
None of our preferred shareholders are entitled to vote or consent to any action pertaining to our Company, except where there is (i) an amendment, alteration or repeal of any provision of our articles of incorporation or bylaws that alters or changes the powers, preferences or other special rights or privileges, or restrictions of the preferred shareholders or (ii) any authorization or any designation, whether by reclassification or otherwise, of any new class or series of shares or any other securities convertible into equity securities ranking senior to the preferred stock in right of redemption, liquidation preference or dividend. In such cases, prior written consent of 80% of the outstanding preferred shareholders is required for any such amendment or authorization.
Dividend Rights
Our preferred stock earns current interest at the annual rate of ten percent based on the original purchase price of $100.00, payable quarterly on the first day of each June, September, December and March while such preferred stock is issued and outstanding (the "Preferred Dividend") and paid-in-kind interest that accrues and is capitalized on the original purchase price ("PIK Interest") at the annual rate of four percent, compounded quarterly on the first day of each June, September, December and March while such preferred stock is issued and outstanding. Both the Preferred Dividend and the PIK Interest are cumulative. The PIK Interest is payable in cash at the time of any redemption of the preferred stock.
No dividend may be paid upon or declared and set apart for any shares of our common shares if the board of directors fails to pay in full cash all cumulative Preferred Dividends required to be paid to the preferred shareholders and accrues and capitalizes all PIK Interest owing to the preferred shareholders.
Rights Upon Liquidation
In the event of any liquidation, dissolution or winding up of our affairs, after payment of our debts and other liabilities, each preferred shareholder will be entitled to be paid out of our net assets available for distribution to our shareholders and in preference to any payment to any holder of common shares, an amount equal to the original purchase price plus any accumulated and as yet unpaid Preferred Dividends and PIK Interest (the "Liquidation Preference"). If the assets to be distributed to the preferred shareholders are insufficient to permit payment of the full Liquidation Preference, then all of our net assets will be distributed ratably among the preferred shareholders in proportion to the then applicable Liquidation Preference with respect to such preferred share. Upon payment of the Liquidation Preference in full, the remaining assets will be distributed among the common shareholders on a pro rata basis.
Redemption Rights and Restrictions
All or any part of the preferred stock may be redeemed after one year from the date of issuance, at our option, upon thirty days prior notice to the preferred shareholders and the payment of the original purchase price plus any accumulated and unpaid Preferred Dividends and PIK Interest. Redemption must be authorized by the affirmative vote of the majority of our board of directors and a majority vote of the board members who do not hold any preferred stock.
If less than all of the preferred stock is to be redeemed, then the preferred stock will be redeemed on a pro rata basis. At and after the date of the notice of redemption, all rights of the shareholders
134
with respect to such preferred stock that have been called for redemption shall cease, except for the right to receive the redemption price.
Our board of directors may redeem shares of any other class of stock at such price and upon such terms as may be agreed upon between the board of directors and the selling shareholder(s); provided, however, that no shares of any class of stock other than the preferred stock may be redeemed as long as there remain shares of preferred stock outstanding without the prior written consent of the shareholders of a majority of the outstanding preferred stock.
We may create additional classes or series of preferred stock. Our board of directors is authorized, subject to limitations prescribed by Michigan law, to issue additional preferred stock in one or more series, to establish from time to time the number of shares to be included in each series, to redeem such shares and to fix the designation, powers, preferences and rights of the shares of each series and any of its qualifications, limitations or restrictions, in each case without further vote or action by our shareholders. Our board of directors can also increase or decrease the number of shares of any series of preferred stock, but not below the number of shares of that series then outstanding, without any further vote or action by our shareholders. Our board of directors may authorize the issuance of preferred stock with voting or conversion rights that could adversely affect the voting power or other rights of the holders of our common shares. The issuance of preferred stock, while providing flexibility in connection with possible acquisitions and other corporate purposes, could, among other things, have the effect of delaying, deferring or preventing a change in control of our Company and might adversely affect the market price of our common stock and the voting and other rights of the holders of our common stock.
Common Stock
Our amended and restated articles of incorporation will authorize us to issue up to 100,000,000 shares of common stock.
Voting Rights
Each holder of our common stock will be entitled to one vote per share on all matters submitted to a vote of the shareholders, including the election of directors. Our amended and restated articles of incorporation and bylaws will not provide for cumulative voting rights. As a result, the holders of a majority of the shares entitled to vote in any election of directors will be able to elect all of the directors standing for election, if they should so choose.
Dividend Rights
Subject to preferences that may be applicable to any then outstanding preferred stock, the holders of our common stock will be entitled to receive dividends, if any, as may be declared from time to time by the Board of Directors out of legally available funds.
Rights Upon Liquidation
In the event of our liquidation, dissolution or winding up, holders of our common stock will be entitled to share ratably in the net assets legally available for distribution to shareholders after the payment of all of our debts and other liabilities, subject to the satisfaction of any liquidation preference granted to the holders of any outstanding shares of preferred stock.
Other Rights and Preferences
As of this offering, holders of our common stock will have no preemptive, conversion or subscription rights, and there will be no redemption or sinking fund provisions applicable to our
135
common stock. The rights, preferences and privileges of our common stock will be subject to, and may be adversely affected by, the rights, preferences and privileges of any series of preferred stock that we may issue in the future.
Fully Paid and Nonassessable
All of our outstanding shares are, and the shares to be issued in this offering will be, duly authorized, validly issued, fully paid and nonassessable.
Anti-Takeover Effects of Certain Provisions of Our Amended and Restated Articles of Incorporation and Bylaws and Michigan Law
Our amended and restated articles of incorporation and bylaws will contain certain provisions that could have the effect of delaying, deterring or preventing another party from acquiring control of us, and therefore could adversely affect the market price of our common stock. These provisions and certain provisions of the Michigan Business Corporation Act (as it may be amended from time to time, the "MBCA"), which are summarized below, may also discourage coercive takeover practices and inadequate takeover bids, and are designed, in part, to encourage persons seeking to acquire control of us to negotiate first with our Board of Directors. We believe that the benefits of increased protection of our potential ability to negotiate more favorable terms with an unfriendly or unsolicited acquirer outweigh the disadvantages of potentially discouraging a proposal to acquire us.
Amended and Restated Articles of Incorporation and Bylaws
Following this offering, our amended and restated articles of incorporation and bylaws will contain provisions that:
- •
- permit the Board of Directors to issue up to 10,000,000 shares of preferred stock, with any rights, preferences and privileges
as they may determine (including the right to approve an acquisition or other change in control);
- •
- provide that the authorized number of directors may be fixed only by the Board of Directors in accordance with our amended and
restated bylaws;
- •
- do not provide for cumulative voting rights (therefore allowing the holders of a majority of the shares entitled to vote in any
election of directors to elect all of the directors standing for election);
- •
- divide our Board of Directors into three staggered classes;
- •
- provide that all vacancies and newly created directorships may be filled by the affirmative vote of a majority of directors then in
office, even if less than a quorum;
- •
- prohibit removal of directors without cause;
- •
- prohibit shareholders from calling special meetings of shareholders;
- •
- require unanimous consent for shareholders to take action by written consent without approval of the action by our Board of Directors;
- •
- provide that shareholders seeking to present proposals before a meeting of shareholders or to nominate candidates for election as
directors at a meeting of shareholders must provide advance notice in writing and also comply with specified requirements related to the form and content of a shareholder's notice;
- •
- require at least 80% supermajority shareholder approval to alter, amend or repeal certain provisions of our amended and restated articles of incorporation; and
136
- •
- require at least 80% supermajority shareholder approval in order for shareholders to adopt, amend or repeal our amended and restated bylaws.
The provisions of our amended and restated articles of incorporation and bylaws, effective upon the closing of this offering, could have the effect of discouraging others from attempting hostile takeovers and, as a consequence, they might also inhibit temporary fluctuations in the market price of our common stock that often result from actual or rumored hostile takeover attempts. These provisions might also have the effect of preventing changes in our management. It is possible that these provisions could make it more difficult to accomplish transactions that our shareholders might otherwise deem to be in their best interests.
Michigan Business Corporation Act
We may also opt-in to the provisions of Chapter 7A of the MBCA. In general, subject to certain exceptions, Chapter 7A of the MBCA prohibits a Michigan corporation from engaging in a "business combination" with an "interested shareholder" for a period of five years following the date that such shareholder became an interested shareholder, unless: (i) prior to such date, the Board of Directors of directors approved the business combination; or (ii) on or subsequent to such date, the business combination is approved by at least 90% of the votes of each class of the corporation's stock entitled to vote and by at least two-thirds of such voting stock not held by the interested shareholder or such shareholder's affiliates. The MBCA defines a "business combination" to include certain mergers, consolidations, dispositions of assets or shares and recapitalizations. An "interested shareholder" is defined by the MBCA to include a beneficial owner, directly or indirectly, of 10% or more of the voting power of the outstanding voting shares of the corporation. While our Board of Directors to date has not elected to opt-in to these provisions, any future decision to do so could have an anti-takeover effect.
Limitation on Liability and Indemnification of Officers and Directors
Our amended and restated articles will eliminate the liability of our directors for monetary damages to the fullest extent under the MBCA and other applicable law. The MBCA permits a corporation to eliminate or limit a director's liability to the corporation or its shareholders for money damages for any action taken or any failure to take any action as a director, except liability for:
- •
- the amount of a financial benefit received by a director to which he is not entitled;
- •
- any intentional infliction of harm on the corporation or its shareholders;
- •
- any illegal distributions to shareholders or the making of improper loans as provided in Section 551 of the MBCA; and
- •
- any intentional criminal act.
The limitation of liability in our amended and restated articles of incorporation will not affect the availability of equitable remedies such as injunctive relief or rescission, nor will it limit the liability of our directors under federal securities laws.
Our amended and restated bylaws will generally require us to indemnify our officers and directors to the fullest extent permitted by law, and to advance expenses incurred by our directors and officers prior to the final disposition of any action or proceeding arising by reason of the fact that any such person is or was our agent. In addition, our amended and restated bylaws will permit us to provide such other indemnification and advancement of expenses to our other employees and agents as permitted by law and authorized by the Board of Directors from time to time. We will also have the power to secure insurance on behalf of any director, officer, employee or other agent for any liability
137
arising out of his or her status as such, regardless of whether we would have the power to indemnify such person against such liability pursuant to our amended and restated bylaws.
The limitation of liability and indemnification provisions in our amended and restated articles of incorporation and bylaws may discourage our shareholders from bringing lawsuits against our directors for breach of their fiduciary duties. They may also reduce the likelihood of derivative litigation against our directors and officers, even though an action, if successful, might benefit us and our shareholders. A shareholder's investment may be harmed to the extent we pay the costs of settlement and damage awards against directors and officers pursuant to these indemnification provisions.
At present, there is no pending litigation or proceeding involving any of our directors or executive officers as to which indemnification is required or permitted, and we are not aware of any threatened litigation or proceeding that may result in a claim for indemnification.
Choice of Forum
Our amended and restated bylaws will provide that the courts of the State of Michigan located in Oakland County and the United States District Court for the Eastern District of Michigan will be the exclusive forum for: any derivative action or proceeding brought on our behalf; any action asserting a claim of breach of fiduciary duty owed by any of our directors, officers or employees to us or our shareholders; any action asserting a claim against us arising pursuant to the MBCA; or any actions asserting a claim otherwise governed by the State of Michigan's internal affairs doctrine. The enforceability of similar choice of forum provisions has been challenged in legal proceedings, and it is possible that a court could find these types of provisions to be inapplicable or unenforceable.
Transfer Agent and Registrar
Our transfer agent and registrar for our common stock is American Stock Transfer & Trust Company, LLC. The transfer agent's address is 6201 15th Avenue, Brooklyn, NY 11219, and its telephone number is (800) 937-5449.
Listing
We have applied to list our common stock on NASDAQ under the symbol "CNFR".
138
Credit Agreement
We have a total senior credit facility of $30,000,000 with Comerica Bank ("Comerica"). The original loan facility was dated April 30, 2010. The most current agreement is the Amended and Restated credit agreement as of September 29, 2014. The senior credit facility is collateralized by substantially all of our assets, including the stock of our non-insurance company subsidiaries (but excluding the stock of our insurance company subsidiaries). As of March 31, 2015 our total senior debt outstanding was $28.2 million.
Our credit facility consists of a $17,500,000 Revolver and two separate term notes. Our master revolving note has a maturity date of August 1, 2016 and typically renews each year. We are subject to a quarterly unused line fee of 0.2% that Comerica collects for the unused portion of the line. We may prepay all or part of the outstanding balance of the Prime-based advances under the revolving credit note as provided in the note itself. As of March 31, 2015, we had $17.6 million outstanding under the Revolver (inclusive of $0.1 million of accrued interest). In the second and third quarters of 2015, we made an aggregate of $0.5 million in repayments on the Revolver.
The "Term Note" is our first amortizing note that was dated March 5, 2013 in the principal amount of $5,000,000. The Term Note maturity date is July 1, 2018. This note is amortizing and we may make quarterly payments of principal and interest. The second note is the 2014 Term Note in the amount of $7,500,000. The 2014 Term Note maturity date is September 29, 2019. This note is also amortizing and we may make quarterly payments of principal and interest as required. Either note may be prepaid in whole or in part at any time upon (5) days prior written notice to the Bank without premium or penalty. All prepayments shall be applied to principal installments in the inverse order of their respective maturities.
We are subject to numerous affirmative covenants, such as for example maintaining total adjusted capital above 300%, as well as negative covenants such as we will not materially alter the character of our business from that conducted as of the date of the credit agreement. 75 days after the end of each quarter, we are required to submit to Comerica a covenant compliance certificate.
139
SHARES ELIGIBLE FOR FUTURE SALE
Prior to this offering, there has been no public market for our common stock. Future sales of substantial amounts of our common stock in the public market could reduce prevailing market prices. Furthermore, since a substantial number of shares will be subject to contractual and legal restrictions on resale as described below, sales of substantial amounts of our common stock in the public market after these restrictions lapse could adversely affect the prevailing market price and our ability to raise equity capital in the future.
Upon completion of this offering, we will have outstanding an aggregate of 8,907,609 shares of common stock, assuming no exercise of the underwriters' over-allotment option and no exercise of outstanding options. Of these shares, all of the shares sold in this offering will be freely tradable without restriction or further registration under the Securities Act, unless these shares are purchased by affiliates. The remaining 4,307,609 shares of common stock held by existing shareholders are restricted securities. Restricted securities may be sold in the public market only if registered or if the transaction qualifies for an exemption from registration described below under Rule 144 promulgated under the Securities Act.
As a result of the contractual restrictions described below and subject to the provisions of Rule 144 the restricted shares will be available for sale in the public market as follows:
- •
- 979,036 shares will be eligible for sale upon completion of this offering;
- •
- 3,328,573 shares will be eligible for sale upon the expiration of the lock-up agreements, described below, beginning 180 days after the date of this prospectus; and
Lock-Up Agreements and Obligations
All of our officers, directors and certain shareholders, who together hold 77.3% of our outstanding common stock, have agreed not to offer, pledge, sell, contract to sell, sell any option or contract to purchase, purchase any option or contract to sell, grant any option, right, or warrant to purchase, lend or otherwise transfer or dispose of, directly or indirectly, any shares of our common stock or any securities convertible into shares or exercisable or exchangeable for shares of our common stock, or enter into any swap or other arrangement for transfer to another, in whole or in part, any of the economic consequences of ownership of our common stock, for a period of at least 180 days after the date of this prospectus, except for bona fide gifts to immediate family members, transfers to family trusts or distributions from trusts, distributions to affiliate or conversion or exercises of derivative securities provided that the shares underlying such derivative securities are held subject to such resale restrictions. Transfers or dispositions can be made sooner only under the conditions described above or with the prior written consent of BMO Capital Markets Corp. and Raymond James & Associates, Inc. BMO Capital Markets Corp. and Raymond James & Associates, Inc. may release any of the shares subject to these lock-up agreements at any time without notice.
In addition, each grant agreement under our 2015 Omnibus Incentive Plan issued by us contains restrictions similar to those set forth in the lock-up agreements described above limiting the disposition of securities issuable pursuant to those plans for a period of at least 180 days following the date of this prospectus.
10b5-1 Plans
After the offering, certain of our employees, including our executive officers, and/or directors may enter into written trading plans that are intended to comply with Rule 10b5-1 under the Securities Exchange Act of 1934. Sales under these trading plans would not be permitted until the expiration of the lock-up agreements relating to the offering described above.
140
Rule 144
In general, under Rule 144 as currently in effect, once we have been subject to public company reporting requirements for 90 days, a person (or persons whose shares are aggregated) who is not deemed to have been an affiliate of ours at any time during the three months preceding a sale, and who has beneficially owned restricted securities within the meaning of Rule 144 for a least six months (including any period of consecutive ownership of preceding non-affiliated holders) would be entitled to sell those shares, subject only to the availability of current public information about us. A non-affiliated person who has beneficially owned restricted securities within the meaning of Rule 144 for at least one year would be entitled to sell those shares without regard to the provisions of Rule 144.
In general, under Rule 144 as currently in effect, once we have been subject to public company reporting requirements for 90 days, our affiliates or persons selling shares on behalf of our affiliates who own shares that were acquired from us or an affiliate of ours at least six months prior to the proposed sale are entitled to sell upon expiration of the lock up agreements described above, within any three-month period beginning 90 days after the date of this prospectus, a number of shares that does not exceed the greater of:
- •
- 1% of the number of shares of common stock then outstanding, which will equal approximately 89,076 shares immediately after
this offering; and
- •
- The average weekly trading volume of the common stock during the four calendar weeks preceding the filing of a notice on Form 144 with respect to such sale.
Sales under Rule 144 by our affiliates or persons selling shares on behalf of our affiliates are also subject to certain manner of sale provisions and notice requirements and to the availability of current public information about us.
Form S-8 Registration Statements
Following the completion of this offering, we intend to file one or more registration statements on Form S-8 under the Securities Act to register the shares of our common stock that are issuable pursuant to our 2015 Omnibus Incentive Plan. See the section titled "Management—Equity Benefit Plans." Subject to the lock-up agreements described above, other contractual lock-up obligations set forth in the grant agreements under each such plan and any applicable vesting restrictions, shares registered under these registration statements will be available for resale in the public market immediately upon the effectiveness of these registration statements, except with respect to Rule 144 volume limitations that apply to our affiliates.
141
MATERIAL U.S. FEDERAL TAX CONSEQUENCES
TO NON-U.S. HOLDERS OF COMMON STOCK
This section summarizes the material U.S. federal income and estate tax consequences of the ownership and disposition of our common stock by a non-U.S. holder. For purposes of this summary, a "non-U.S. holder" is any beneficial owner that for U.S. federal income tax purposes is not a U.S. person and is not an entity treated as a partnership for U.S. federal income tax purposes. The term "U.S. person" means:
- •
- an individual citizen or resident of the United States;
- •
- a corporation or entity treated as a corporation for U.S. federal income tax purposes, created or organized under the laws of the
United States or any state, including the District of Columbia;
- •
- an estate whose income is subject to U.S. income tax regardless of source; or
- •
- a trust (i) whose administration is subject to the primary supervision of a court within the United States and which has one or more U.S. persons who have authority to control all substantive decisions of the trust or (ii) which has a valid election in effect under applicable U.S. Treasury regulations to be treated as a U.S. person.
Generally, an individual may be treated as a resident of the United States in any calendar year for U.S. federal income tax purposes by, among other ways, being present in the United States for at least 31 days in that calendar year and for an aggregate of at least 183 days during a three-year period ending in the current calendar year. For purposes of this calculation, such individual would count all of the days in which the individual was present in the current year, one-third of the days present in the immediately preceding year, and one-sixth of the days present in the second preceding year. Residents are taxed for U.S. federal income tax purposes as if they were citizens of the United States.
This summary does not consider the tax consequences for partnerships, entities classified as a partnership for U.S. federal income tax purposes, or persons who hold their interests through a partnership or other entity classified as a partnership for U.S. federal income tax purposes. If a partnership, including any entity treated as a partnership for U.S. federal income tax purposes, is a beneficial owner of common stock, the tax treatment of a partner in the partnership will depend upon the status of the partner and the activities of the partnership. Partnerships that are beneficial owners of our common stock, and partners in such partnerships, should consult their tax advisors regarding the tax consequences to them of the ownership and disposition of our common stock.
This summary applies only to non-U.S. holders who acquire our common stock pursuant to this offering and who hold our common stock as a capital asset (generally property held for investment). This summary generally does not address tax considerations that may be relevant to particular investors because of their specific circumstances, or because they are subject to special rules. Certain former U.S. citizens or long-term residents, controlled foreign corporations, passive foreign investment companies, corporations that accumulate earnings to avoid federal income tax, life insurance companies, tax-exempt organizations, dealers in securities or currencies, brokers, banks or other financial institutions, certain trusts, hybrid entities, pension funds and investors that hold our common stock as part of a hedge, straddle or conversion transaction are among those categories of potential investors that are subject to special rules not covered in this discussion. This summary does not address any U.S. federal gift tax consequences, or state or local or non-U.S. tax consequences. This summary does not provide a complete analysis of all potential tax considerations. The information provided below is based on existing authorities. These authorities may change, or the Internal Revenue Service, or IRS, might interpret the existing authorities differently. In either case, the tax considerations of owning or disposing of common stock could differ from those described below.
142
INVESTORS CONSIDERING THE PURCHASE OF COMMON STOCK SHOULD CONSULT THEIR OWN TAX ADVISORS REGARDING THE APPLICATION OF THE U.S. FEDERAL INCOME AND ESTATE TAX LAWS TO THEIR PARTICULAR SITUATIONS AND THE CONSEQUENCES OF OTHER U.S. FEDERAL, FOREIGN, STATE OR LOCAL LAWS AND ANY APPLICABLE TAX TREATIES.
Dividends
Payments of cash and other property that we make to our shareholders with respect to our common stock will constitute dividends to the extent paid from our current or accumulated earnings and profits, as determined under U.S. federal income tax principles. To the extent those dividends exceed our current and accumulated earnings and profits, the dividends will constitute a return of capital and will first reduce a holder's basis, but not below zero, and then will be treated as gain from the sale of stock.
The gross amount of any dividend (out of earnings and profits) paid to a non-U.S. holder of common stock generally will be subject to U.S. withholding tax at a rate of 30% unless the holder is entitled to an exemption from or reduced rate of withholding under an applicable income tax treaty. In order to receive an exemption or a reduced treaty rate, prior to the payment of a dividend, a non-U.S. holder must provide us with an IRS Form W-8BEN or W-8BEN-E (or successor form) certifying qualification for the exemption or reduced rate.
Dividends received by a non-U.S. holder that are effectively connected with a U.S. trade or business conducted by the non-U.S. holder (and dividends attributable to a non-U.S. holder's permanent establishment in the United States if an income tax treaty applies) are exempt from this withholding tax. To obtain this exemption, prior to the payment of a dividend, a non-U.S. holder must provide us with an IRS Form W-8ECI (or successor form) properly certifying this exemption. Effectively connected dividends (or dividends attributable to a permanent establishment), although not subject to withholding tax, are taxed at the same graduated rates applicable to U.S. persons, net of certain deductions and credits. In addition, dividends received by a corporate non-U.S. holder that are effectively connected with a U.S. trade or business of the corporate non-U.S. holder (or dividends attributable to a corporate non-U.S. holder's permanent establishment in the United States if an income tax treaty applies) may also be subject to a branch profits tax at a rate of 30% (or such lower rate as may be specified in an income tax treaty).
A non-U.S. holder who provides us with an IRS Form W-8BEN or an IRS Form W-8ECI will be required to periodically update such form. A non-U.S. holder of common stock that is eligible for a reduced rate of withholding tax pursuant to an income tax treaty may obtain a refund of any excess amounts currently withheld if an appropriate claim for refund is timely filed with the IRS.
Gain on Disposition of Common Stock
A non-U.S. holder will generally not be subject to U.S. federal income tax on any gains realized on the sale, exchange, or other disposition of common stock unless:
- •
- the gain is effectively connected with a U.S. trade or business of the non-U.S. holder (or attributable to a permanent establishment
in the United States if an income tax treaty applies), in which case the non-U.S. holder generally will be required to pay tax on the net gain derived from the sale under regular graduated U.S.
federal income tax rates and, if the non-U.S. holder is a corporation, the branch profits tax may apply, at a 30% rate or such lower rate as may be specified by an applicable income tax treaty;
- •
- the non-U.S. holder is an individual who is present in the United States for a period or periods aggregating 183 days or more during the calendar year in which the sale or disposition occurs
143
- •
- our common stock constitutes a U.S. real property interest by reason of our status as a "U.S. real property holding corporation" for U.S. federal income tax purposes at any time within the shorter of the five-year period preceding the disposition or the holder's holding period for our common stock. We believe that we are not currently, and we are not likely to become, a "U.S. real property holding corporation" for U.S. federal income tax purposes.
and certain other conditions are met, in which case the non-U.S. holder will be required to pay a flat 30% tax (or such lower rate as may be specified by an applicable income tax treaty between the United States and such non-U.S. holder's country of residence) on the net gain derived from the disposition, which tax may be offset by U.S. source capital losses, if any, provided that the non-U.S. holder has timely filed U.S. federal income tax returns with respect to such losses; or
If we become a U.S. real property holding corporation after this offering, so long as our common stock is regularly traded on an established securities market and continues to be so traded, a non-U.S. holder will not be subject to U.S. federal income tax on gain recognized from the sale, exchange or other disposition of shares of our common stock as a result of such status unless (i) such holder actually or constructively owned more than 5% of our common stock at any time during the shorter of (A) the five-year period preceding the disposition, or (B) the holder's holding period for our common stock, and (ii) we were a U.S. real property holding corporation at any time during such period when the more than 5% ownership test was met. If any gain on your disposition is taxable because we are a U.S. real property holding corporation and your ownership of our common stock exceeds 5%, you will be taxed on such disposition generally in the manner applicable to U.S. persons. Any such non-U.S. holder that owns or has owned, actually or constructively, more than 5% of our common stock is urged to consult that holder's own tax advisor with respect to the particular tax consequences to such holder for the gain from the sale, exchange or other disposition of shares of our common stock if we were to be or to become a U.S. real property holding corporation.
Backup Withholding and Information Reporting
Generally, we must report annually to the IRS the amount of dividends paid, the name and address of the recipient, and the amount, if any, of tax withheld. A similar report is sent to the holder. Pursuant to tax treaties or other agreements, the IRS may make its reports available to tax authorities in the non-U.S. holder's country of residence.
Payments of dividends or of proceeds on the disposition of stock made to a non-U.S. holder may be subject to additional information reporting and backup withholding. Backup withholding will not apply if the non-U.S. holder establishes an exemption, for example, by properly certifying its non-U.S. person status on an IRS Form W-8BEN or W-8BEN-E (or successor form). Notwithstanding the foregoing, backup withholding may apply if either we or our paying agent has actual knowledge, or reason to know, that the holder is a U.S. person.
Backup withholding is not an additional tax. Rather, the U.S. federal income tax liability of persons subject to backup withholding will be reduced by the amount of tax withheld. If withholding results in an overpayment of taxes, a credit or refund may be obtained from the IRS, provided that the required information is furnished to the IRS in a timely manner.
Recent Legislation Relating to Foreign Accounts
Sections 1471 through 1474 of the Internal Revenue Code of 1986, as amended, generally may impose a U.S. federal withholding tax of 30% on dividends and the gross proceeds of a disposition of our common stock paid to non-U.S. financial institutions and certain non-U.S. non-financial entities (including, in some instances, where such an institution or entity is acting as an intermediary) unless they satisfy certain reporting requirements. Under certain circumstances, a non-U.S. holder might be
144
eligible for refunds or credits of such taxes. Prospective investors are encouraged to consult with their own tax advisors regarding the possible implications of the legislation on their investment in our common stock.
These withholding requirements are currently effective with respect to payments of dividends and are expected to be phased-in for payments of gross proceeds from a U.S. sale or other disposition of our common stock on or after January 1, 2017.
U.S. Federal Estate Tax
The estates of nonresident alien individuals are generally subject to U.S. federal estate tax on property with a U.S. situs. Because we are a U.S. corporation, our common stock will be U.S. situs property and therefore will be included in the taxable estate of a nonresident alien decedent. The U.S. federal estate tax liability of the estate of a nonresident alien may be affected by a tax treaty between the United States and the decedent's country of residence.
THE PRECEDING DISCUSSION OF MATERIAL U.S. FEDERAL TAX CONSEQUENCES IS FOR GENERAL INFORMATION ONLY. IT IS NOT TAX ADVICE. EACH PROSPECTIVE INVESTOR SHOULD CONSULT ITS OWN TAX ADVISOR REGARDING THE PARTICULAR U.S. FEDERAL, STATE, LOCAL, AND FOREIGN TAX CONSEQUENCES OF PURCHASING, HOLDING, AND DISPOSING OF OUR COMMON STOCK, INCLUDING THE CONSEQUENCES OF ANY PROPOSED CHANGE IN APPLICABLE LAWS.
145
We are offering the shares of common stock described in this prospectus through a number of underwriters. BMO Capital Markets Corp. and Raymond James & Associates, Inc. are acting as joint bookrunning managers of the offering and as representatives of the underwriters named below. Subject to the terms and conditions stated in the underwriting agreement dated the date of this prospectus, each underwriter named below has severally agreed to purchase, and we have agreed to sell to that underwriter, the number of shares set forth opposite the underwriter's name:
| |
Number of Shares |
|||
|---|---|---|---|---|
BMO Capital Markets Corp. |
||||
Raymond James & Associates, Inc. |
||||
Sandler O'Neill & Partners, L.P. |
||||
William Blair & Company, L.L.C. |
||||
| | | | | |
Total |
4,600,000 | |||
| | | | | |
| | | | | |
| | | | | |
The underwriting agreement provides that the obligations of the several underwriters are subject to various conditions, including approval of legal matters by counsel. The underwriters are committed to take and pay for all of the shares being offered, if any are taken, other than the shares covered by the option described below unless and until that option is exercised. If an underwriter fails or refuses to purchase any of its committed shares, the purchase commitments of the non-defaulting underwriters may be increased or the offering may be terminated.
The underwriting agreement provides that we will indemnify the underwriters against liabilities specified in the underwriting agreement under the Securities Act, or will contribute to payments that the underwriters may be required to make relating to these liabilities.
The underwriters expect to deliver the shares of common stock to purchasers on or about , 2015.
Over-Allotment Option
We have granted a 30-day over-allotment option to the underwriters to purchase up to a total of 690,000 additional shares of our common stock from us, at the public offering price, less the underwriting discounts and commissions payable by us, as set forth on the cover page of this prospectus. If the underwriters exercise this option in whole or in part, then each of the underwriters will be separately committed, subject to the conditions described in the underwriting agreement, to purchase the additional shares of our common stock in proportion to their respective commitments set forth in the table above. We will pay the expenses associated with the exercise of the over-allotment option.
Lock-Up Agreements
We and all of our directors and executive officers, holders of a significant majority of the shares of our common stock outstanding prior to this offering have agreed that, for a period of 180 days after the date of this prospectus, without the prior written consent of each of BMO Capital Markets Corp. and Raymond James & Associates, Inc., we and they will not directly or indirectly:
- •
- offer, sell, pledge, contract to sell, purchase any option to sell, grant any option for the purchase of, lend, or otherwise dispose of, or require us to file with the SEC a registration statement under the Securities Act to register, any shares of common stock or any securities convertible into, exercisable for or exchangeable for common stock of which the undersigned is now, or may
146
- •
- enter into any swap or other derivative transaction that transfers to another, in whole or in part, any of the economic benefits or
risks of ownership of common stock, whether any such transaction described in clause (1) or (2) above is to be settled by delivery of common stock or other securities, in cash or otherwise; or
- •
- publicly disclose the intention to enter into any transaction described in clause (1) or (2) above.
in the future become, the beneficial owner (within the meaning of Rule 13d-3 under the Exchange Act);
BMO Capital Markets Corp. and Raymond James & Associates, Inc. on behalf of the underwriters, have agreed to notify us at least three business days before the effective date of any release or waiver granted to one of our officers or directors, and we have agreed to announce the impending release or waiver by issuing a press release through a major news service at least two business days before the effective date of the release or waiver.
However, in the case of our officers, directors and shareholders, these lock-up restrictions will not apply to:
- •
- transfers of securities as a bona fide gift;
- •
- transfers or dispositions of the securities to any trust for the direct or indirect benefit of the holder or any member of the
immediate family of the holder;
- •
- transfers of shares of common stock or any security convertible into or exercisable for common stock upon death by will, other
testamentary document or intestate succession to the legal representative, heir, beneficiary or a member of the immediate family of the holder;
- •
- transfers or dispositions of securities of the holder to one or more of its affiliates, limited partners, general partners, limited
liability company members or shareholders;
- •
- transfers or dispositions of securities acquired by the holder in open market purchases after the completion of this offering;
- •
- the entry into a trading plan established pursuant to Rule 10b5-1 under the Securities Exchange Act, provided that such plan
does not provide for any sales or other dispositions of shares of common stock during the 180-day restricted period and no public announcement or filing under the Exchange Act is made by us or on our
behalf regarding the establishment of such plan; or
- •
- the conversion of any convertible security into shares of common stock and the stock split described in this prospectus.
Except for transfers related to securities acquired on the open market or in this offering, any transferee under the excepted transfers above must agree in writing, prior to the transfer, to be bound by the lock-up agreements.
Additionally, in our case, the lock-up restrictions will not apply to shares sold in this offering unless the holder is an officer or director of the company, or an affiliate thereof.
Determination of Offering Price
Prior to this offering, there has been no public market for our common stock. The initial public offering price will be determined through negotiations between us and the representatives. In addition to prevailing market conditions, the factors to be considered in determining the initial public offering price will include our results of operations, our current financial condition, our future prospects, our markets, the economic conditions in and future prospects for the industry in which we compete, our management, and currently prevailing general conditions in the equity securities markets, including current market valuations of publicly traded companies considered comparable to our company
We cannot assure you that an active or orderly trading market will develop for our common stock or that our common stock will trade in the public markets subsequent to this offering at or above the initial offering price.
147
Underwriting Discount and Offering Expenses
The following table summarizes the compensation to be paid to the underwriters by us and the proceeds, before expenses, payable to us:
| |
|
Total | ||||||||
|---|---|---|---|---|---|---|---|---|---|---|
| |
Per Share | Without Over-Allotment |
With Over-Allotment |
|||||||
Public offering price |
$ | |||||||||
Underwriting discounts and commissions |
$ | |||||||||
Proceeds, before expenses, to us |
$ | |||||||||
We estimate that the total expenses of this offering payable by us will be approximately $1.48 million. We have also agreed to reimburse the underwriters for certain of their expenses, including in connection with clearance of this offering with FINRA up to a maximum amount of $25,000, as set forth in the underwriting agreement.
Indemnification of Underwriters
We will indemnify the underwriters against some civil liabilities, including liabilities under the Securities Act. If we are unable to provide this indemnification, we will contribute to payments the underwriters may be required to make in respect of those liabilities.
Market Listing
We have applied to list our common stock on NASDAQ under the symbol "CNFR."
Passive Market Marketing
In connection with this offering, the underwriters, selling group members and selected dealers may engage in passive market making transactions in shares of our common stock on NASDAQ in accordance with Rule 103 of Regulation M under the Exchange Act during a period before the commencement of offers or sales of our shares of common stock and extending through the completion of the distribution of this offering. A passive market maker must display its bid at a price not in excess of the highest independent bid of that security. However, if all independent bids are lowered below the passive market maker's bid that bid must then be lowered when specified purchase limits are exceeded. Passive market making may cause the price of shares of our common stock to be higher than the price that otherwise would exist in the open market in the absence of those transactions. The underwriters, selling group members and selected dealers are not required to engage in a passive market making and may end passive market making activities at any time.
Short Sales, Stabilizing Transactions and Penalty Bids
In connection with the offering, the underwriters may purchase and sell shares of our common stock in the open market. These transactions may include short sales, stabilizing transactions and purchases to cover positions created by short sales. Short sales involve the sale by the underwriters of a greater number of shares than they are required to purchase in the offering, and a short position represents the amount of such sales that have not been covered by subsequent purchases. A "covered short position" is a short position that is not greater than the amount of additional shares for which the underwriters' over-allotment option described above may be exercised. The underwriters may cover any covered short position by either exercising their option to purchase additional shares or purchasing shares in the open market. In determining the source of shares to cover the covered short position, the underwriters will consider, among other things, the price of shares available for purchase in the open market as compared to the price at which they may purchase additional shares pursuant to the
148
over-allotment option described above. "Naked" short sales are any short sales that create a short position greater than the amount of additional shares for which the over-allotment option described above may be exercised. The underwriters must cover any such naked short position by purchasing shares in the open market. A naked short position is more likely to be created if the underwriters are concerned that there may be downward pressure on the price of the common stock in the open market after pricing that could adversely affect investors who purchase in the offering. Stabilizing transactions consist of various bids for or purchases of common stock made by the underwriters in the open market prior to the completion of the offering.
The underwriters may also impose a penalty bid. This occurs when a particular underwriter repays to the underwriters a portion of the underwriting discount received by it because the representatives have repurchased shares sold by or for the account of such underwriter in stabilizing or short covering transactions.
Purchases to cover a short position and stabilizing transactions, as well as other purchases by the underwriters for their own accounts, may have the effect of preventing or retarding a decline in the market price of our common stock, and together with the imposition of the penalty bid, may stabilize, maintain or otherwise affect the market price of our common stock. As a result, the price of our common stock may be higher than the price that otherwise might exist in the open market. The underwriters are not required to engage in these activities and may end any of these activities at any time. These transactions may be effected on NASDAQ, in the over-the-counter market or otherwise.
Electronic Distribution
A prospectus in electronic format may be made available on the internet sites or through other online services maintained by one or more of the underwriters participating in this offering, or by their affiliates. Other than the prospectus in electronic format, the information on any underwriter's web site and any information contained in any other web site maintained by an underwriter is not part of the prospectus or the registration statement of which this prospectus forms a part, has not been approved and/or endorsed by us or any underwriter in its capacity as underwriter and should not be relied upon by investors.
Conflicts of Interest
The underwriters and their respective affiliates are full service financial institutions engaged in various activities, which may include securities trading, commercial and investment banking, financial advisory, investment management, principal investment, hedging, financing and brokerage activities. Certain of the underwriters and their affiliates have in the past provided, and may in the future from time to time provide, investment banking and other financing and banking services to us, for which they have in the past received, and may in the future receive, customary fees and reimbursement for their expenses. In the ordinary course of their various business activities, the underwriters and their respective affiliates may make or hold a broad array of investments and actively trade debt and equity securities (or related derivative securities) and financial instruments including bank loans) for their own account and for the accounts of their customers and may at any time hold long and short positions in such securities and instruments. Such investment and securities activities may involve our securities and instruments. The underwriters and their affiliates may also make investment recommendations and/or publish or express independent research views in respect of such securities or financial instruments and may hold, or recommend to clients that they acquire, long and/or short positions in such securities and instruments.
149
European Economic Area
In relation to each Member State of the European Economic Area that has implemented the Prospectus Directive (each, a Relevant Member State), an offer to the public of any shares of our common stock described in this prospectus may not be made in that Relevant Member State, except that an offer to the public in that Relevant Member State of any shares of our common stock may be made at any time under the following exemptions under the Prospectus Directive, if they have been implemented in that Relevant Member State:
- •
- to any legal entity that is a qualified investor as defined in the Prospectus Directive;
- •
- to fewer than 100 or, if the Relevant Member State has implemented the relevant provision of the 2010 PD Amending Directive, 150,
natural or legal persons (other than qualified investors as defined in the Prospectus Directive), as permitted under the Prospectus Directive, subject to obtaining the prior consent of the
representatives for any such offer; or
- •
- in any other circumstances falling within Article 3(2) of the Prospectus Directive, provided that no such offer of shares of our common stock shall result in a requirement for the publication by us or any underwriter of a prospectus pursuant to Article 3 of the Prospectus Directive.
For the purposes of this provision, the expression an "offer to the public" in relation to any shares of our common stock in any Relevant Member State means the communication in any form and by any means of sufficient information on the terms of the offer and any shares of our common stock to be offered so as to enable an investor to decide to purchase any shares of our common stock, as the same may be varied in that Member State by any measure implementing the Prospectus Directive in that Member State, the expression "Prospectus Directive" means Directive 2003/71/EC (and amendments thereto, including the 2010 PD Amending Directive, to the extent implemented in the Relevant Member State), and includes any relevant implementing measure in the Relevant Member State, and the expression "2010 PD Amending Directive" means Directive 2010/73/EU.
United Kingdom
This prospectus is only being distributed to, and is only directed at, persons in the United Kingdom that are qualified investors within the meaning of Article 2(1)(e) of the Prospectus Directive (Qualified Investors) that are also (i) investment professionals falling within Article 19(5) of the Financial Services and Markets Act 2000 (Financial Promotion) Order 2005 (the "Order") or (ii) high net worth entities, and other persons to whom it may lawfully be communicated, falling within Articles 49(2)(a) to (d) of the Order (all such persons together being referred to as a relevant persons). This prospectus and its contents are confidential and should not be distributed, published or reproduced (in whole or in part) or disclosed by recipients to any other persons in the United Kingdom. Any person in the United Kingdom that is not a relevant person should not act or rely on this document or any of its contents.
150
Honigman Miller Schwartz and Cohn LLP will provide us with an opinion as to the validity of the common stock offered under this prospectus. Willkie Farr & Gallagher LLP will pass upon certain legal matters related to this offering for the underwriters.
The consolidated financial statements as of December 31, 2014 and 2013, and for each of the three years in the period ended December 31, 2014, of Conifer Holdings, Inc. and subsidiaries, and the related financial statement schedules, included in this Prospectus, have been audited by Deloitte & Touche LLP, an independent registered public accounting firm, as stated in their report appearing herein. Such consolidated financial statements and financial statement schedules are included in reliance upon the report of such firm given upon their authority as experts in accounting and auditing.
The consolidated financial statements of EGI Insurance Services, Inc. and subsidiaries as of and for the eleven months ended November 30, 2013, included in this Prospectus, have been audited by Deloitte & Touche LLP, independent auditors, as stated in their report appearing herein, and are included in reliance upon the report of such firm given upon their authority as experts in accounting and auditing.
151
GLOSSARY OF INDUSTRY AND OTHER TERMS
Accident year |
Means, with respect to losses, the calendar year during which the loss events related to such losses occurred and, with respect to premiums, the calendar year during which such premiums were earned. | |
Admitted insurer |
Means an insurer that has received a license or certificate of authority from a state regulatory authority to transact an insurance business in that state. |
|
Broker |
Means an intermediary who negotiates contracts of insurance or reinsurance, receiving a commission for placement and other services rendered, between (1) a policyholder and a primary insurer, on behalf of the insured party; (2) a primary insurer and reinsurer, on behalf of the primary insurer; or (3) a reinsurer and a retrocessionaire, on behalf of the reinsurer. |
|
Capacity |
Means the percentage of surplus, or the dollar amount of exposure, that an insurer or reinsurer is willing or able to place at risk. Capacity may apply to a single risk, a program, a line of business or an entire book of business. Capacity may be constrained by legal restrictions, corporate restrictions, or indirect financial restrictions such as capital adequacy requirements. |
|
Case reserves |
Means loss reserves, established with respect to specific, individual reported claims. |
|
Casualty reinsurance |
Means reinsurance that is primarily concerned with the losses caused by injuries to third parties and their property (in other words, parties other than the policyholder) and the legal liability imposed on the policyholder resulting therefrom. Also referred to as liability reinsurance. |
|
Catastrophe |
Means a severe loss, typically involving multiple claimants. Common catastrophe perils include earthquakes, hurricanes, tsunamis, hailstorms, severe winter weather, floods, fires, tornados, explosions, and other natural or man-made disasters. Catastrophe losses may also arise from acts of war, acts of terrorism and political instability. |
|
Cede; cedent; ceding company; Ceded |
Means when a party reinsures some or all of its liability with another, it "cedes" business and is referred to as the "ceding company" or "cedent." |
|
Claim |
Means a request by an insured or reinsured for indemnification by an insurance or reinsurance company for loss incurred from an insured peril or event. |
|
Claims-made policy |
Means an insurance policy that provides coverage to the insured only for claims first asserted during the term of the policy and reported to the insurer during a reporting period specified in the policy. |
152
Code |
Means the United States Internal Revenue Code of 1986, as amended |
|
Combined ratio |
Means the sum of the loss ratio and the expense ratio. A combined ratio under 100% generally indicates an underwriting profit. A combined ratio over 100% generally indicates an underwriting loss. |
|
Commercial lines |
Means the various kinds of insurance that are written for businesses such as property, workers' compensation and crop. |
|
Commission |
Means the fee paid to an agent, broker, intermediary or program administrator for placing insurance or reinsurance, which is generally a percentage of the premium. |
|
Direct insurance company |
Means insurance sold by an insurer that contracts with the insured, as distinguished from reinsurance. |
|
Earned premiums |
Means the portion of premiums earned during or prior to a given period that was actually recognized as income during such period. |
|
Excess and surplus lines (E&S) |
Means lines of insurance which are generally unavailable from admitted insurers due to perceived risk related to the insured's business and which, consequently, are placed by surplus lines agents or brokers with insurers that are not admitted in the subject jurisdiction. |
|
Excess of loss reinsurance |
Means reinsurance that indemnifies the reinsured against that portion of losses and loss adjustment expenses incurred on the underlying policies in excess of a specified dollar or percentage loss ratio amount. Also known as non-proportional reinsurance. |
|
Exclusions |
Means a listing of specific types of coverage or loss that are not covered by a given treaty or contract. |
|
Expense ratio |
Means financial ratio calculated by dividing policy acquisition costs and operating expenses by net premiums earned and other income. |
|
Facultative reinsurance |
Means reinsurance obtained on a case-by-case basis for all or part of the liability associated with a single risk, exposure, or policy. |
|
FASB |
Means the Financial Accounting Standards Board. |
|
Financial strength rating |
Means the opinions of rating agencies regarding the financial ability of an insurance or reinsurance company to meet its financial obligations under its policies. |
|
Frequency |
Means the number of claims occurring during a given coverage period. |
|
Fronting |
Means the issuance of insurance policies for another insurance company that may not have the licensure or rating to serve its desired market. |
|
FSOC |
Means the U.S. Financial Stability Oversight Council, which was established by the Dodd-Frank Act. |
|
GAAP |
Means accounting principles generally accepted in the United States. |
153
Gross written premiums |
Means total premiums for insurance written, or assumed reinsurance, during a given period. |
|
Hard market |
Means the portion of the market cycle of the property and casualty insurance industry characterized by constricted industry capital and underwriting capacity, increasing premium rates and, typically, enhanced underwriting performance. |
|
Incurred but not reported (IBNR) |
Means reserves for estimated loss and loss adjustment expenses that have been incurred by insureds and reinsureds but not yet reported to the insurer or reinsurer, including unknown future developments on loss and loss adjustment expenses which are known to the insurer or reinsurer. |
|
Line of business |
Means insurance line of business such as fire, auto, liability, and workers' compensation. |
|
Long tail |
Means a term used to describe certain types of third-party liability exposures (e.g., malpractice, products, workers' compensation, errors and omissions) where the incidence of loss and the determination of damages are frequently subject to delays that extend beyond the term the insurance or reinsurance was in force. An example would be asbestos liability, where the manifestation of the disease and determination of liability does not occur until years later. |
|
Loss adjustment expenses (LAE) |
Means the expenses of settling claims, including legal and other fees and the portion of general expenses allocated to claim settlement costs. Also known as claim adjustment expenses. |
|
Loss development |
Means increases or decreases in losses and LAE, whether paid or reserved, over a given period of time. |
|
Loss reserves |
Means reserves established by insurers and reinsurers to reflect the estimated cost of claims payments and the related expenses, including allocated LAE, that the insurer will ultimately be required to pay with respect to insurance it has written. |
|
Losses occurring |
Means contracts that cover claims arising from loss events that occur during the term of the contract, although not necessarily reported during the term of the contract. |
|
Loss ratio |
Means the financial ratio calculated by dividing net losses and loss expenses by net premiums earned and other income. |
|
NAIC |
Means the National Association of Insurance Commissioners, a voluntary organization of state insurance officials that promulgates model laws regulating the insurance industry, values securities owned by insurers, develops and modifies insurer financial reporting and insurer performance criteria and performs other services with respect to the insurance industry. |
|
Net earned premiums |
Means the portion of net premiums written during or prior to a given period that was actually recognized as income during such period. |
154
Net written premiums |
Means gross premiums written for a given period less premiums ceded to reinsurers and retrocessionaires during such period. |
|
Occurrence-based policy |
Means an insurance policy that provides coverage to the insured for liabilities arising from events occurring during the term of policy, irrespective of when a claim is actually made. |
|
P&C |
Means property and casualty. |
|
Personal lines |
Means types of insurance or reinsurance written for individuals or families, rather than for businesses. |
|
Premiums; written, earned and unearned |
Means the cost of insurance that is paid by the cedent or insurer to the insurer or the reinsurer. Written premiums represent the complete amount of premiums received, and earned premiums represent the amount recognized as income. Unearned premiums is the difference between written and earned premiums. |
|
Primary insurer |
Means an insurance company that generally issues insurance policies to the public. |
|
Property lines |
Means types of insurance or reinsurance that provide coverage to a person with an insurable interest in tangible property for that person's property loss, damage or loss of use caused by an insured peril. |
|
Quota share reinsurance |
Means a reinsurance arrangement in which the insurer, or cedent, automatically transfers, and the reinsurer accepts, a stated proportion of every risk within a defined type of business written by the insurer in exchange for an equal proportion of the premiums. The ceding insurer receives a commission, based on the amount of the premiums ceded, which is intended to reimburse the insurer for the costs of writing and administering the business. The reinsurer is dependent on the ceding company's ability in underwriting, pricing and claims administration. |
|
Reinsurance |
Means an arrangement in which an insurance company, the reinsurer, agrees to indemnify another insurance or reinsurance company, commonly referred to as the ceding company or cedent, for all or a portion of the insurance or reinsurance risks underwritten by the ceding company under one or more policies. Reinsurance does not legally discharge the primary insurer from its liability with respect to its obligations to the insured. |
|
Retention |
Means the specific amount of loss that the ceding company retains above which the reinsurance limit applies. |
|
Short tail |
Means an insurance product where the ultimate losses are typically known and settled quickly, usually within a few years. |
|
Soft market |
Means the portion of the market cycle of the property and casualty insurance industry characterized by heightened premium rate competition among insurers, increased underwriting capacity and, typically, depressed underwriting performance. |
155
Specialty lines |
Means lines of insurance and reinsurance that provide coverage for risks that are often unusual or difficult to place and do not fit the underwriting criteria of standard commercial products carriers. |
|
Statutory accounting principles (SAP) |
Means those accounting principles and practices which provide the framework for the preparation of insurance company financial statements, and the recording of transactions, in accordance with the rules and procedures adopted by regulatory authorities, generally emphasizing solvency considerations rather than a going-concern concept of accounting. The principal differences between SAP and GAAP as they relate to the financial statements of the Company's insurance subsidiaries are (1) policy acquisition costs are expensed as incurred under SAP, whereas they are deferred and amortized under GAAP, (2) certain assets are not admitted for purposes of determining surplus under SAP, (3) the classification and carrying amounts of investments in certain securities are different under SAP and GAAP and (4) the criteria for providing asset valuation allowances and the methodologies used to determine the amount thereof are different under SAP and GAAP. |
|
Treaty reinsurance |
Means the reinsurance of a specified type or category of risks defined in a reinsurance agreement (the "treaty") between the primary insurer or other reinsured and a reinsurer. Typically, in treaty reinsurance, the primary insurer or reinsured is obligated to offer and the reinsurer is obligated to accept a specified portion of all of that type or category of risk originally written by the primary insurer or reinsured. A treaty is generally valid for a period of one year and contains common contract terms along with a specific risk definition, data on limit and retention, and provisions for premium and duration. |
|
Underwriter |
Means an employee of an insurance or reinsurance company who examines, accepts or rejects risks and classifies accepted risks in order to charge an appropriate premium for each accepted risk. |
|
Underwriting |
Means the insurer's or reinsurer's process of reviewing applications submitted for insurance or reinsurance coverage, deciding whether to accept all or part of the coverage requested and determining the applicable premiums. |
|
Underwriting profit (loss) |
Means the sum of net premiums earned, minus net losses and loss and loss adjustment expense, acquisition costs, general and administrative expenses, plus other underwriting fee income. |
|
Unearned premium |
Means the portion of premiums written that is allocable to the unexpired portion of the policy term. |
156
WHERE YOU CAN FIND MORE INFORMATION
We have filed with the SEC a registration statement on Form S-1 under the Securities Act with respect to the shares of common stock offered under this prospectus. As permitted under the rules and regulations of the SEC, this prospectus does not contain all of the information in and exhibits and schedules to the registration statement. For further information with respect to us and our common stock, we refer you to the registration statement and its exhibits and schedules. Statements contained in this prospectus as to the contents of any contract or any other document referred to are not necessarily complete, and in each instance, we refer you to the copy of the contract or other document filed as an exhibit to the registration statement. Each of these statements is qualified in all respects by this reference. You may inspect a copy of the registration statement without charge at the SEC's Public Reference Room at 100 F Street, NE, Washington, D.C. 20549, and copies of all or any part of the registration statement may be obtained from the Public Reference Room of the SEC, 100 F Street, NE, Washington, DC 20549, upon payment of fees prescribed by the SEC. The SEC maintains an internet site that contains reports, proxy and information statements and other information regarding registrants that file electronically with the SEC. The address of the website is http://www.sec.gov. The public may obtain information on the operation of the Public Reference Room by calling the SEC at (800) SEC-0330.
Upon completion of the offering, we will be subject to the information reporting requirements of the Exchange Act, and we will file reports, proxy statements and other information with the SEC.
We intend to furnish our shareholders with annual reports containing financial statements audited by our independent registered public accounting firm and quarterly reports for the first three fiscal quarters of each fiscal year containing unaudited interim financial information. Our telephone number is (248) 559-0840.
157
CONIFER HOLDINGS, INC. AND SUBSIDIARIES
INDEX TO CONSOLIDATED FINANCIAL STATEMENTS
F-1
CONIFER HOLDINGS, INC. AND SUBSIDIARIES
Condensed Consolidated Balance Sheets (Unaudited)
| |
March 31, 2015 |
December 31, 2014 |
Proforma March 31, 2015 (Note 2) |
|||||||
|---|---|---|---|---|---|---|---|---|---|---|
| |
(dollars in thousands) |
|||||||||
Assets |
||||||||||
Investment securities: |
||||||||||
Fixed maturity securities, at fair value (amortized cost $94,147 and $83,768 at March 31, 2015 and December 31, 2014, respectively) |
$ | 95,274 | $ | 84,405 | $ | 95,274 | ||||
Equity securities, at fair value (cost $3,126 and $2,965 at March 31, 2015 and December 31, 2014, respectively) |
4,240 | 4,084 | 4,240 | |||||||
Short-term investments, at cost or amortized cost (approximates fair value) |
5,326 | 16,749 | 5,326 | |||||||
| | | | | | | | | | | |
Total investment securities |
104,840 | 105,238 | 104,840 | |||||||
Cash |
19,181 |
18,488 |
13,001 |
|||||||
Premiums and agents' balances receivable, net |
12,926 | 14,478 | 12,926 | |||||||
Reinsurance recoverables on unpaid losses |
4,590 | 3,224 | 4,590 | |||||||
Reinsurance recoverables on paid losses |
2,224 | 1,915 | 2,224 | |||||||
Ceded unearned premium |
10,567 | 9,510 | 10,567 | |||||||
Deferred policy acquisition costs |
6,120 | 5,679 | 6,120 | |||||||
Intangible assets, net |
1,153 | 1,171 | 1,153 | |||||||
Goodwill |
1,104 | 1,104 | 1,104 | |||||||
Other assets |
3,048 | 2,931 | 3,048 | |||||||
| | | | | | | | | | | |
Total assets |
$ | 165,753 | $ | 163,738 | $ | 159,573 | ||||
| | | | | | | | | | | |
| | | | | | | | | | | |
| | | | | | | | | | | |
Liabilities and Equity |
||||||||||
Liabilities: |
||||||||||
Unpaid losses and loss adjustment expenses |
$ | 32,987 | $ | 31,531 | $ | 32,987 | ||||
Unearned premiums |
43,612 | 43,381 | 43,612 | |||||||
Reinsurance premiums payable |
4,403 | 7,069 | 4,403 | |||||||
Senior debt |
28,212 | 27,562 | 28,212 | |||||||
Accounts payable and accrued expenses |
3,517 | 2,521 | 3,517 | |||||||
Other liabilities |
1,148 | 1,396 | 1,148 | |||||||
| | | | | | | | | | | |
Total liabilities |
113,879 | 113,460 | 113,879 | |||||||
Redeemable preferred stock, 1,000,000 shares authorized; 60,600 shares issued and outstanding at December 31, 2014 |
— |
6,119 |
— |
|||||||
Shareholders' equity: |
||||||||||
Preferred stock, 1,000,0000 shares authorized; 60,600 shares issued and outstanding at March 31, 2015 |
6,180 | — | — | |||||||
Common stock, no par value, 12,240,000 shares authorized, issued and outstanding 4,050,042 shares and 3,995,013 shares at March 31, 2015 and December 31, 2014, respectively |
46,656 | 46,119 | 46,656 | |||||||
Accumulated deficit |
(2,632 | ) | (3,095 | ) | (2,632 | ) | ||||
Accumulated other comprehensive income |
1,644 | 1,158 | 1,644 | |||||||
| | | | | | | | | | | |
Total shareholders' equity attributable to Conifer |
51,848 | 44,182 | 45,668 | |||||||
Noncontrolling interest |
26 | (23 | ) | 26 | ||||||
| | | | | | | | | | | |
Total equity |
51,874 | 44,159 | 45,694 | |||||||
| | | | | | | | | | | |
Total liabilities and equity |
$ | 165,753 | $ | 163,738 | $ | 159,573 | ||||
| | | | | | | | | | | |
| | | | | | | | | | | |
| | | | | | | | | | | |
See accompanying notes to condensed consolidated financial statements.
F-2
CONIFER HOLDINGS, INC. AND SUBSIDIARIES
Condensed Consolidated Statements of Operations (Unaudited)
| |
Three Months Ended March 31, |
||||||
|---|---|---|---|---|---|---|---|
| |
2015 | 2014 | |||||
| |
(dollars in thousands, except per share amounts) |
||||||
Revenue |
|||||||
Gross written premiums |
$ | 21,204 | $ | 17,667 | |||
Ceded written premiums |
(7,538 | ) | (958 | ) | |||
Change in net unearned premiums |
827 | (4,034 | ) | ||||
| | | | | | | | |
Net earned premiums |
14,493 | 12,675 | |||||
Net investment income |
486 | 220 | |||||
Net realized investment gains |
145 | 91 | |||||
Other income |
489 | 532 | |||||
| | | | | | | | |
Total revenue |
15,613 | 13,518 | |||||
Expenses |
|||||||
Losses and loss adjustment expenses, net |
8,570 | 10,576 | |||||
Policy acquisition costs |
2,595 | 3,231 | |||||
Operating expenses |
3,692 | 2,894 | |||||
Interest expense |
244 | 129 | |||||
| | | | | | | | |
Total expenses |
15,101 | 16,830 | |||||
| | | | | | | | |
Income (loss) before income taxes |
512 | (3,312 | ) | ||||
Income tax benefit |
— | (118 | ) | ||||
| | | | | | | | |
Net income (loss) |
512 | (3,194 | ) | ||||
Less net income attributable to noncontrolling interest |
49 | 35 | |||||
| | | | | | | | |
Net income (loss) attributable to Conifer |
$ | 463 | $ | (3,229 | ) | ||
| | | | | | | | |
| | | | | | | | |
| | | | | | | | |
Net income (loss) allocable to common shareholders |
$ | 250 | $ | (3,240 | ) | ||
| | | | | | | | |
| | | | | | | | |
| | | | | | | | |
Income (loss) per share allocable to common shareholders, |
$ | 0.06 | $ | (1.51 | ) | ||
| | | | | | | | |
| | | | | | | | |
| | | | | | | | |
Weighted average common shares outstanding, basic and diluted |
4,040,872 | 2,138,776 | |||||
| | | | | | | | |
| | | | | | | | |
| | | | | | | | |
See accompanying notes to condensed consolidated financial statements.
F-3
CONIFER HOLDINGS, INC. AND SUBSIDIARIES
Condensed Consolidated Statements of Comprehensive Income (Loss) (Unaudited)
| |
Three Months Ended March 31, |
||||||
|---|---|---|---|---|---|---|---|
| |
2015 | 2014 | |||||
| |
(dollars in thousands) |
||||||
Net income (loss) |
$ | 512 | $ | (3,194 | ) | ||
Other comprehensive income (loss): |
|||||||
Unrealized gains on investments arising during the period, net of tax of $— and $182 in 2015 and 2014, respectively |
703 | 353 | |||||
Less: reclassification adjustment for gains included in net income, net of tax of $— and $64 in 2015 and 2014, respectively |
217 | 124 | |||||
| | | | | | | | |
Change in fair value of available for sale investments |
486 | 229 | |||||
Comprehensive income |
998 | (2,965 | ) | ||||
Less comprehensive income attributable to noncontrolling interest |
49 | 35 | |||||
| | | | | | | | |
Comprehensive income (loss) attributable to Conifer |
$ | 949 | $ | (3,000 | ) | ||
| | | | | | | | |
| | | | | | | | |
| | | | | | | | |
See accompanying notes to condensed consolidated financial statements.
F-4
CONIFER HOLDINGS, INC. AND SUBSIDIARIES
Condensed Consolidated Statement of Changes in Redeemable Preferred Stock and Equity (Unaudited)
(dollars in thousands)
| |
Redeemable Preferred Stock |
|
|
|
No Par, Common Stock |
|
|
Total Conifer Holdings Shareholders' Equity |
|
|
||||||||||||||||||||||||||
|---|---|---|---|---|---|---|---|---|---|---|---|---|---|---|---|---|---|---|---|---|---|---|---|---|---|---|---|---|---|---|---|---|---|---|---|---|
| |
|
Preferred Stock | Retained Earnings (Accumulated Deficit) |
Accumulated Other Comprehensive Income (Loss) |
|
|
||||||||||||||||||||||||||||||
| |
|
Noncontrolling Interest |
|
|||||||||||||||||||||||||||||||||
| |
Shares | Amount |
|
Shares | Amount | Shares | Amount | Total Equity | ||||||||||||||||||||||||||||
Balances at December 31, 2014 |
60,600 | $ | 6,119 | — | $ | — | 3,995,013 | $ | 46,119 | $ | (3,095 | ) | $ | 1,158 | 44,182 | $ | (23 | ) | $ | 44,159 | ||||||||||||||||
Net income (loss) |
— | — | — | — | — | — | 463 | — | 463 | 49 | 512 | |||||||||||||||||||||||||
Proceeds from issuance of shares of common stock |
— | — | — | — | 55,029 | 750 | — | — | 750 | — | 750 | |||||||||||||||||||||||||
Paid-in-kind dividends |
— | 61 | — | — | — | (61 | ) | — | — | (61 | ) | — | (61 | ) | ||||||||||||||||||||||
Cash dividends paid on preferred stock |
— | — | — | — | — | (152 | ) | — | — | (152 | ) | — | (152 | ) | ||||||||||||||||||||||
Reclassification of redeemable Preferred Stock to permanent equity (Note 10) |
(60,600 | ) | (6,180 | ) | 60,600 | 6,180 | — | — | — | 6,180 | — | 6,180 | ||||||||||||||||||||||||
Other comprehensive income |
— | — | — | — | — | — | — | 486 | 486 | — | 486 | |||||||||||||||||||||||||
| | | | | | | | | | | | | | | | | | | | | | | | | | | | | | | | | | | | | |
Balance at March 31, 2015 |
— | $ | — | 60,600 | $ | 6,180 | 4,050,042 | $ | 46,656 | $ | (2,632 | ) | $ | 1,644 | $ | 51,848 | $ | 26 | $ | 51,874 | ||||||||||||||||
| | | | | | | | | | | | | | | | | | | | | | | | | | | | | | | | | | | | | |
| | | | | | | | | | | | | | | | | | | | | | | | | | | | | | | | | | | | | |
| | | | | | | | | | | | | | | | | | | | | | | | | | | | | | | | | | | | | |
Balances at December 31, 2013 |
— | $ | — | — | $ | — | 1,749,626 | $ | 16,883 | $ | 3,851 | $ | 536 | $ | 21,270 | $ | (19 | ) | $ | 21,251 | ||||||||||||||||
Net income (loss) |
— | — | — | — | — | — | (3,229 | ) | — | (3,229 | ) | 35 | (3,194 | ) | ||||||||||||||||||||||
Issuance of common stock in capital raising activities (Note 9) |
— | — | — | — | 538,173 | 6,543 | — | — | 6,543 | — | 6,543 | |||||||||||||||||||||||||
Conversion of note payable into shares of common stock (Note 14) |
— | — | — | — | 41,126 | 500 | — | — | 500 | — | 500 | |||||||||||||||||||||||||
Issuance of preferred stock |
— | — | 64,000 | 640 | — | — | — | — | 640 | — | 640 | |||||||||||||||||||||||||
Cash dividends paid on preferred stock |
— | — | — | — | — | — | (11 | ) | — | (11 | ) | — | (11 | ) | ||||||||||||||||||||||
Other comprehensive income |
— | — | — | — | — | — | — | 229 | 229 | — | 229 | |||||||||||||||||||||||||
| | | | | | | | | | | | | | | | | | | | | | | | | | | | | | | | | | | | | |
Balance at March 31, 2014 |
— | $ | — | 64,000 | $ | 640 | 2,328,925 | $ | 23,926 | $ | 611 | $ | 765 | $ | 25,942 | $ | 16 | $ | 25,958 | |||||||||||||||||
| | | | | | | | | | | | | | | | | | | | | | | | | | | | | | | | | | | | | |
| | | | | | | | | | | | | | | | | | | | | | | | | | | | | | | | | | | | | |
| | | | | | | | | | | | | | | | | | | | | | | | | | | | | | | | | | | | | |
See accompanying notes to condensed consolidated financial statements.
F-5
CONIFER HOLDINGS, INC. AND SUBSIDIARIES
Condensed Consolidated Statements of Cash Flows (Unaudited)
(dollars in thousands)
| |
Three Months Ended March 31, |
||||||
|---|---|---|---|---|---|---|---|
| |
2015 | 2014 | |||||
Cash Flows from Operating Activities |
|||||||
Net income (loss) |
$ | 512 | $ | (3,194 | ) | ||
Adjustments to reconcile net income (loss) to net cash (used in) provided by operating activities: |
|||||||
Depreciation and amortization of property and equipment, and intangibles |
101 | 94 | |||||
Amortization of bond premium and discount, net |
125 | 143 | |||||
Gains on investments |
(145 | ) | (91 | ) | |||
Deferred income taxes |
— | (118 | ) | ||||
Other |
2 | — | |||||
Changes in operating assets and liabilities: |
|||||||
Premiums and agents' balances receivable |
1,552 | 837 | |||||
Reinsurance recoverables |
(1,675 | ) | (2,459 | ) | |||
Ceded unearned premiums |
(1,057 | ) | 73 | ||||
Deferred policy acquisition costs |
(441 | ) | (575 | ) | |||
Other assets |
(20 | ) | (205 | ) | |||
Unpaid Losses and loss adjustment expenses |
1,456 | 3,875 | |||||
Unearned premium |
231 | 3,223 | |||||
Reinsurance premium payable |
(2,666 | ) | (989 | ) | |||
Accounts payable and accrued expenses |
996 | 1,251 | |||||
Other liabilities |
(402 | ) | (1,390 | ) | |||
| | | | | | | | |
Net cash (used in) provided by operating activities |
(1,431 | ) | 475 | ||||
| | | | | | | | |
Cash Flows From Investing Activities |
|||||||
Purchase of investments: |
|||||||
Fixed maturity securities |
(13,469 | ) | (11,502 | ) | |||
Equity securities |
(439 | ) | (271 | ) | |||
Short-term investments |
(19,393 | ) | (14,548 | ) | |||
Proceeds from maturities and redemptions of investments: |
|||||||
Fixed maturity securities |
1,103 | 65 | |||||
Proceeds from sales of investments: |
|||||||
Fixed maturity securities |
1,926 | 734 | |||||
Equity securitiesEquity securities |
359 | 317 | |||||
Short-term investments |
30,816 | 20,541 | |||||
Purchases of property and equipment |
(39 | ) | (86 | ) | |||
| | | | | | | | |
Net cash provided by (used in) investing activities |
864 | (4,750 | ) | ||||
| | | | | | | | |
Cash Flows From Financing Activities |
|||||||
Proceeds from issuance of shares of common stock |
750 | 6,345 | |||||
Proceeds from issuance of shares of preferred stock |
— | 640 | |||||
Borrowings under Revolver |
900 | — | |||||
Repayment of borrowings under Revolver |
(250 | ) | — | ||||
Principal payments under term notes |
— | (250 | ) | ||||
Payment of deferred offering costs |
(140 | ) | — | ||||
| | | | | | | | |
Net cash provided by financing activities |
1,260 | 6,735 | |||||
| | | | | | | | |
Net increase in cash |
693 | 2,460 | |||||
Cash at beginning of period |
18,488 | 11,296 | |||||
| | | | | | | | |
Cash at end of period |
$ | 19,181 | $ | 13,756 | |||
| | | | | | | | |
| | | | | | | | |
| | | | | | | | |
See accompanying notes to condensed consolidated financial statements.
F-6
CONIFER HOLDINGS, INC. AND SUBSIDIARIES
Notes to Unaudited Condensed Consolidated Financial Statements
(dollars in thousands, except per share
amounts)
1. Organization
Conifer Holdings, Inc. and its subsidiaries (collectively, the "Company") are engaged in the sale of property and casualty insurance products. The Company underwrites a variety of specialty insurance products, including property, general liability, commercial multi-peril, liquor liability, automobile, and homeowners and dwelling policies. The Company discontinued offering and writing new non-standard personal automobile policies on January 27, 2015 and renewal automobile policies on June 1, 2015, but it will continue to service existing policies, pay claims and perform other administrative services as needed until the run-off of claims on such policies are complete. The Company markets and sells its insurance products through a network of independent agents, including managing general agents, writing policies in 44 states in the United States ("U.S.").
2. Summary of Significant Accounting Policies
Basis of Presentation
The accompanying unaudited condensed consolidated financial statements have been prepared in accordance with accounting principles generally accepted in the United States of America ("U.S. GAAP") and the applicable rules and regulations of the Securities and Exchange Commission ("SEC") regarding interim financial information. Accordingly, these condensed consolidated financial statements do not include all of the information and notes required by U.S. GAAP for complete financial statements. In the opinion of management, all adjustments, consisting of items of a normal and recurring nature, necessary for a fair presentation of the condensed consolidated financial statements have been included. The results of operations for the three months ended March 31, 2015 are not necessarily indicative of the results that may be expected for any other interim period or for the full year. These unaudited condensed consolidated financial statements should be read in conjunction with the audited consolidated financial statements and related notes for the year ended December 31, 2014 included elsewhere in this prospectus. The condensed consolidated balance sheet at December 31, 2014 was derived from the audited financial statements.
Stock Split
On July 22, 2015, the board of directors approved a stock split in the form of a stock dividend of 10.2 shares for each share of common stock to be effectuated immediately prior to the effectiveness of the initial public offering contemplated in this prospectus. All common stock share and per share amounts for all periods presented in these unaudited condensed consolidated financial statements have been adjusted retroactively to reflect the stock split.
Unaudited Pro forma Presentation
Upon the consummation of the initial public offering contemplated in this prospectus, all of the outstanding shares of preferred stock will be repurchased for cash. The unaudited pro forma balance sheet data at March 31, 2015 has been prepared for this material reduction of permanent equity assuming the repurchase of 60,600 shares of the preferred stock for cash. The unaudited pro forma balance sheet does not give effect to the cash received from certain holders of preferred stock that have agreed to use the cash to be received from the sale of their preferred stock to purchase 257,255 shares of common stock at the per share price of this offering since it will not occur until the closing of the offering. Refer to note 18.
F-7
CONIFER HOLDINGS, INC. AND SUBSIDIARIES
Notes to Unaudited Condensed Consolidated Financial Statements (Continued)
(dollars in thousands, except per share amounts)
2. Summary of Significant Accounting Policies (Continued)
The unaudited pro forma income (loss) per share allocable to common shareholders, basic and diluted, is not presented herein as the repurchase of the preferred shares does not materially reduce income (loss) per share allocable to common shareholders, basic and diluted, because of the effect of the elimination of the preferred stock dividends from net income (loss) allocable to common shareholders.
Principles of Consolidation
The condensed consolidated financial statements include the accounts of Conifer Holdings, Inc. and its wholly owned subsidiaries, and a 50%-owned entity that the Company controls due to its majority representation on the entity's Board. All intercompany transactions and accounts have been eliminated.
Noncontrolling interest in a consolidated subsidiary in the consolidated balance sheets represents the noncontrolling shareholder's proportionate share of the 50%-owned entity's equity. Consolidated net income (loss) is allocated to the Company and noncontrolling interest in proportion to their percentage ownership interest.
Use of Estimates
The preparation of financial statements in conformity with U.S. GAAP requires management to make estimates and assumptions that affect the amounts reported therein. Due to the inherent uncertainty involved in making estimates, actual results reported in future periods may be based upon amounts that differ from these estimates.
Recently Issued Accounting Guidance
In May 2015, the FASB issued ASU No. 2015-09, Disclosures about Short-Duration Contracts, which requires enhanced disclosures about an insurance entity's initial claim estimates and subsequent adjustments to those estimates, methodologies and judgments in estimating claims, and the timing, frequency and severity of claims. The enhanced disclosures will be effective for annual reporting periods beginning after December 15, 2015 and interim periods thereafter. Early adoption is permitted. The enhanced disclosures under the new guidance will be provided in the Company's consolidated financial statements for the year ended December 31, 2016, as required.
In August 2014, the FASB issued ASU No. 2014-15, Presentation of Financial Statements—Going Concern (Subtopic 205-40), which requires management to evaluate, at each annual and interim reporting period, whether there is substantial doubt about the Company's ability to continue as a going concern within one year after the date the financial statements are issued and provide related footnote disclosures. The standard is effective for the annual period ending after December 15, 2016 and for the annual and interim periods thereafter. Early adoption is permitted. This standard is not expected to have a material impact on the Company's financial statements.
F-8
CONIFER HOLDINGS, INC. AND SUBSIDIARIES
Notes to Unaudited Condensed Consolidated Financial Statements (Continued)
(dollars in thousands, except per share amounts)
3. Investments
The cost or amortized cost, gross unrealized gain or loss, and fair value of the fixed maturity and equity securities, by major security type, that are classified as available for sale, were as follows:
| |
March 31, 2015 | ||||||||||||
|---|---|---|---|---|---|---|---|---|---|---|---|---|---|
| |
|
Gross Unrealized | |
||||||||||
| |
Cost or Amortized Cost |
Fair Value |
|||||||||||
| |
Gain | Loss | |||||||||||
Fixed maturity securities: |
|||||||||||||
U.S. Government obligations |
$ | 5,001 | $ | 78 | $ | (4 | ) | $ | 5,075 | ||||
State and local government |
13,696 | 254 | (40 | ) | 13,910 | ||||||||
Corporate debt |
32,642 | 381 | (23 | ) | 33,000 | ||||||||
Commercial mortgage and asset-backed |
42,808 | 521 | (40 | ) | 43,289 | ||||||||
| | | | | | | | | | | | | | |
Total fixed maturity securities |
94,147 | 1,234 | (107 | ) | 95,274 | ||||||||
Equity securities, common stock |
3,126 | 1,157 | (43 | ) | 4,240 | ||||||||
| | | | | | | | | | | | | | |
Total |
$ | 97,273 | $ | 2,391 | $ | (150 | ) | $ | 99,514 | ||||
| | | | | | | | | | | | | | |
| | | | | | | | | | | | | | |
| | | | | | | | | | | | | | |
| |
December 31, 2014 | ||||||||||||
|---|---|---|---|---|---|---|---|---|---|---|---|---|---|
| |
|
Gross Unrealized | |
||||||||||
| |
Cost or Amortized Cost |
Fair Value |
|||||||||||
| |
Gain | Loss | |||||||||||
Fixed maturity securities: |
|||||||||||||
U.S. Government obligations |
$ | 5,872 | $ | 85 | $ | (16 | ) | $ | 5,941 | ||||
State and local government |
10,755 | 210 | (4 | ) | 10,961 | ||||||||
Corporate debt |
30,818 | 237 | (106 | ) | 30,949 | ||||||||
Commercial mortgage and asset-backed |
36,323 | 348 | (117 | ) | 36,554 | ||||||||
| | | | | | | | | | | | | | |
Total fixed maturity securities |
83,768 | 880 | (243 | ) | 84,405 | ||||||||
Equity securities, common stock |
2,965 | 1,158 | (39 | ) | 4,084 | ||||||||
| | | | | | | | | | | | | | |
Total |
$ | 86,733 | $ | 2,038 | $ | (282 | ) | $ | 88,489 | ||||
| | | | | | | | | | | | | | |
| | | | | | | | | | | | | | |
| | | | | | | | | | | | | | |
F-9
CONIFER HOLDINGS, INC. AND SUBSIDIARIES
Notes to Unaudited Condensed Consolidated Financial Statements (Continued)
(dollars in thousands, except per share amounts)
3. Investments (Continued)
The following table summarizes fair value and gross unrealized losses for all available-for-sale securities, aggregated by investment category, and the length of time that individual securities have been in a continuous unrealized loss position, as follows:
| |
March 31, 2015 | ||||||||||||||||||
|---|---|---|---|---|---|---|---|---|---|---|---|---|---|---|---|---|---|---|---|
| |
Less than 12 Months |
Greater than 12 Months |
Total | ||||||||||||||||
| |
Fair Value |
Unrealized Losses |
Fair Value |
Unrealized Losses |
Fair Value |
Unrealized Losses |
|||||||||||||
Fixed maturity securities: |
|||||||||||||||||||
U.S. Government obligations |
$ | — | $ | — | $ | 1,330 | $ | (4 | ) | $ | 1,330 | $ | (4 | ) | |||||
State and local government |
3,624 | (40 | ) | — | — | 3,624 | (40 | ) | |||||||||||
Corporate debt |
5,718 | (17 | ) | 571 | (6 | ) | 6,289 | (23 | ) | ||||||||||
Commercial mortgage and asset-backed |
8,934 | (24 | ) | 1,120 | (16 | ) | 10,054 | (40 | ) | ||||||||||
| | | | | | | | | | | | | | | | | | | | |
Total fixed maturity securities |
18,276 | (81 | ) | 3,021 | (26 | ) | 21,297 | (107 | ) | ||||||||||
Equity securities, common stock |
534 | (43 | ) | — | — | 534 | (43 | ) | |||||||||||
| | | | | | | | | | | | | | | | | | | | |
Total |
$ | 18,810 | $ | (124 | ) | $ | 3,021 | $ | (26 | ) | $ | 21,831 | $ | (150 | ) | ||||
| | | | | | | | | | | | | | | | | | | | |
| | | | | | | | | | | | | | | | | | | | |
| | | | | | | | | | | | | | | | | | | | |
| |
December 31, 2014 | ||||||||||||||||||
|---|---|---|---|---|---|---|---|---|---|---|---|---|---|---|---|---|---|---|---|
| |
Less than 12 Months |
Greater than 12 Months |
Total | ||||||||||||||||
| |
Fair Value |
Unrealized Losses |
Fair Value |
Unrealized Losses |
Fair Value |
Unrealized Losses |
|||||||||||||
Fixed maturity securities: |
|||||||||||||||||||
U.S. Government obligations |
$ | — | $ | — | $ | 1,319 | $ | (16 | ) | $ | 1,319 | $ | (16 | ) | |||||
State and local government |
552 | (1 | ) | 825 | (3 | ) | 1,377 | (4 | ) | ||||||||||
Corporate debt |
18,835 | (98 | ) | 489 | (8 | ) | 19,324 | (106 | ) | ||||||||||
Commercial mortgage and asset-backed |
12,060 | (34 | ) | 4,999 | (83 | ) | 17,059 | (117 | ) | ||||||||||
| | | | | | | | | | | | | | | | | | | | |
Total fixed maturity securities |
31,447 | (133 | ) | 7,632 | (110 | ) | 39,079 | (243 | ) | ||||||||||
Equity securities, common stock |
347 | (39 | ) | — | — | 347 | (39 | ) | |||||||||||
| | | | | | | | | | | | | | | | | | | | |
Total |
$ | 31,794 | $ | (172 | ) | $ | 7,632 | $ | (110 | ) | $ | 39,426 | $ | (282 | ) | ||||
| | | | | | | | | | | | | | | | | | | | |
| | | | | | | | | | | | | | | | | | | | |
| | | | | | | | | | | | | | | | | | | | |
Substantially all of the Company's fixed maturity securities are of investment grade with the average credit quality of AA. The duration of the fixed maturity securities are short in duration; approximately 3.5 years. The unrealized loss position is attributable to minor fluctuations in the interest rate environment. The Company does not consider the $150 of gross unrealized losses in the portfolio at March 31, 2015 to be other-than-temporary impairments because (i) as of that date, all contractual interest and principal payments on the fixed maturity securities has been received, (ii) there is no intent to sell the securities, (iii) it is more likely than not that the Company will not be required to sell the securities before recovery of their amortized cost or cost bases and (iv) the unrealized loss relates to
F-10
CONIFER HOLDINGS, INC. AND SUBSIDIARIES
Notes to Unaudited Condensed Consolidated Financial Statements (Continued)
(dollars in thousands, except per share amounts)
3. Investments (Continued)
non-credit factors, such as interest rate changes and fluctuations due to market conditions. The Company did not recognize any other-than-temporary impairment losses during the periods presented.
The sources of net investment income is as follows:
| |
Three Months Ended March 31, |
||||||
|---|---|---|---|---|---|---|---|
| |
2015 | 2014 | |||||
Fixed maturity securities |
$ | 531 | $ | 244 | |||
Equity securities |
23 | 15 | |||||
Cash, cash equivalents, and short-term investments |
2 | 3 | |||||
| | | | | | | | |
Total investment income |
556 | 262 | |||||
Investment expenses |
(70 | ) | (42 | ) | |||
| | | | | | | | |
Net investment income |
$ | 486 | $ | 220 | |||
| | | | | | | | |
| | | | | | | | |
| | | | | | | | |
The following table summarizes the gross realized gains and losses from sales or maturities of available for sale fixed maturity and equity securities, as follows:
| |
Three Months Ended March 31, |
||||||
|---|---|---|---|---|---|---|---|
| |
2015 | 2014 | |||||
Fixed maturity securities: |
|||||||
Gross realized gains |
$ | 68 | $ | 1 | |||
Gross realized losses |
(3 | ) | (24 | ) | |||
| | | | | | | | |
|
65 | (23 | ) | ||||
| | | | | | | | |
Equity securities: |
|||||||
Gross realized gains |
99 | 115 | |||||
Gross realized losses |
(19 | ) | (1 | ) | |||
| | | | | | | | |
|
80 | 114 | |||||
| | | | | | | | |
Net realized investment gains |
$ | 145 | $ | 91 | |||
| | | | | | | | |
| | | | | | | | |
| | | | | | | | |
F-11
CONIFER HOLDINGS, INC. AND SUBSIDIARIES
Notes to Unaudited Condensed Consolidated Financial Statements (Continued)
(dollars in thousands, except per share amounts)
3. Investments (Continued)
The following table summarizes the fair value and amortized cost of available-for-sale fixed maturity securities by contractual maturity at March 31, 2015, as follows:
| |
Amortized Cost |
Fair Value |
|||||
|---|---|---|---|---|---|---|---|
Due in one year or less |
$ | 3,017 | $ | 3,028 | |||
Due after one year through five years |
32,405 | 32,762 | |||||
Due after five years through ten years |
7,291 | 7,490 | |||||
Due after ten years |
8,626 | 8,705 | |||||
| | | | | | | | |
Securities with contractual maturities |
51,339 | 51,985 | |||||
Commercial mortgage and asset-backed |
42,808 | 43,289 | |||||
| | | | | | | | |
Total fixed maturity securities |
$ | 94,147 | $ | 95,274 | |||
| | | | | | | | |
| | | | | | | | |
| | | | | | | | |
Actual maturities may differ from contractual maturities because certain borrowers have the right to call or prepay obligations with or without call or prepayment penalties.
At March 31, 2015 and December 31, 2014, the insurance companies had deposited fixed maturity securities, common stock, and short-term investments of approximately $6.4 million and $7.0 million, respectively, to meet the deposit requirements of various state insurance departments. There are withdrawals and other restrictions on these deposits, but the Company can direct how the deposits are invested and earn interest on the funds.
4. Fair Value Measurements
The Company's financial instruments include assets and liabilities carried at fair value, as well as assets and liabilities carried at cost or amortized cost but disclosed at fair value in these condensed consolidated financial statements. Fair value is defined as the price that would be received for an asset or paid to transfer a liability in the principal most advantageous market for the asset or liability in an orderly transaction between market participants. In determining fair value, the Company applies the market approach, which uses prices and other relevant data based on market transactions involving identical or comparable assets and liabilities. The inputs to valuation techniques used to measure fair value are prioritized into a three-level hierarchy. The hierarchy gives the highest priority to quoted prices in active markets for identical assets and liabilities and the lowest priority to unobservable inputs. The fair value hierarchy is as follows:
Level 1—Inputs are based on quoted prices (unadjusted) in active markets for identical assets or liabilities.
Level 2—Inputs are other than quoted prices that are observable for the asset or liabilities, either directly or indirectly, for substantially the full term of the asset or liability.
Level 3—Unobservable inputs that are supported by little or no market activity. The unobservable inputs represent the Company's best assumption of how market participants would price the assets or liabilities.
F-12
CONIFER HOLDINGS, INC. AND SUBSIDIARIES
Notes to Unaudited Condensed Consolidated Financial Statements (Continued)
(dollars in thousands, except per share amounts)
4. Fair Value Measurements (Continued)
The following tables present the fair value of the Company's financial instruments that were carried or disclosed at fair value. Unless indicated, these items were carried at fair value on the consolidated balance sheets.
| |
March 31, 2015 | ||||||||||||
|---|---|---|---|---|---|---|---|---|---|---|---|---|---|
| |
Level 1 | Level 2 | Level 3 | Total | |||||||||
Fixed maturity securities: |
|||||||||||||
U.S. Government obligations |
$ | — | $ | 5,075 | $ | — | $ | 5,075 | |||||
State and local government |
— | 13,910 | — | 13,910 | |||||||||
Corporate debt |
— | 33,000 | — | 33,000 | |||||||||
Commercial mortgage and asset-backed |
— | 43,289 | — | 43,289 | |||||||||
| | | | | | | | | | | | | | |
Total fixed maturity securities |
— | 95,274 | — | 95,274 | |||||||||
Equity securities, common stock |
4,240 |
— |
— |
4,240 |
|||||||||
Short-term investments* |
5,326 | — | — | 5,326 | |||||||||
| | | | | | | | | | | | | | |
Total assets measured at fair value |
$ | 9,566 | $ | 95,274 | $ | — | $ | 104,840 | |||||
| | | | | | | | | | | | | | |
| | | | | | | | | | | | | | |
| | | | | | | | | | | | | | |
Senior debt* |
$ | — | $ | 28,212 | $ | — | $ | 28,212 | |||||
Contingent consideration |
170 | 170 | |||||||||||
Interest rate swap |
— | 17 | — | 17 | |||||||||
| | | | | | | | | | | | | | |
Total liabilities measured at fair value |
$ | — | $ | 28,229 | $ | 170 | $ | 28,399 | |||||
| | | | | | | | | | | | | | |
| | | | | | | | | | | | | | |
| | | | | | | | | | | | | | |
- *
- Carried at cost or amortized cost on consolidated balance sheet.
| |
December 31, 2014 | ||||||||||||
|---|---|---|---|---|---|---|---|---|---|---|---|---|---|
| |
Level 1 | Level 2 | Level 3 | Total | |||||||||
Fixed maturity securities: |
|||||||||||||
U.S. Government obligations |
$ | — | $ | 5,941 | $ | — | $ | 5,941 | |||||
State and local government |
— | 10,961 | — | 10,961 | |||||||||
Corporate debt |
— | 30,949 | — | 30,949 | |||||||||
Commercial mortgage and asset-backed |
— | 36,554 | — | 36,554 | |||||||||
| | | | | | | | | | | | | | |
Total fixed maturity securities |
— | 84,405 | — | 84,405 | |||||||||
Equity securities, common stock |
4,084 |
— |
— |
4,084 |
|||||||||
Short-term investments* |
16,749 | — | — | 16,749 | |||||||||
| | | | | | | | | | | | | | |
Total assets measured at fair value |
$ | 20,833 | $ | 84,405 | $ | — | $ | 105,238 | |||||
| | | | | | | | | | | | | | |
| | | | | | | | | | | | | | |
| | | | | | | | | | | | | | |
Senior debt* |
$ | — | $ | 27,562 | $ | — | $ | 27,562 | |||||
Contingent consideration |
— | — | 168 | 168 | |||||||||
Interest rate swap |
— | 9 | — | 9 | |||||||||
| | | | | | | | | | | | | | |
Total liabilities measured at fair value |
$ | — | $ | 27,571 | $ | 168 | $ | 27,739 | |||||
| | | | | | | | | | | | | | |
| | | | | | | | | | | | | | |
| | | | | | | | | | | | | | |
- *
- Carried at cost or amortized cost on consolidated balance sheet.
F-13
CONIFER HOLDINGS, INC. AND SUBSIDIARIES
Notes to Unaudited Condensed Consolidated Financial Statements (Continued)
(dollars in thousands, except per share amounts)
4. Fair Value Measurements (Continued)
Level 1 investments consist of equity securities traded in an active exchange market. The Company uses unadjusted quoted prices for identical instruments to measure fair value. Level 1 also includes money market funds and other interest-bearing deposits at banks, which are reported as short-term investments.
Level 2 investments include fixed maturity securities, which consist of U.S. government agency securities, state and local municipal bonds (including those held as restricted securities), corporate debt securities, mortgage-backed and asset-backed securities. Fair value is measured for the majority of Level 2 investments using matrix pricing and observable market data, including benchmark securities or yields, reported trades, broker/dealer quotes, issuer spreads, two-sided markets, bids, offers, default rates, loss severity and other economic measures.
The Company obtains pricing for each security from independent pricing services, investment managers or consultants to assist in determining fair value for its Level 2 investments. To validate that these quoted prices are reasonable estimates of fair value, the Company performs various quantitative and qualitative procedures, including: i) evaluation of the underlying methodologies, ii) analysis of recent sales activity, iii) analytical review of our fair values against current market prices and iv) comparison of the pricing services' fair value to other pricing services' fair value for the same investment. No markets for the investments were determined to be inactive at year-end. Based on these procedures, the Company did not adjust the prices or quotes provided from independent pricing services, investment managers or consultants.
The Level 2 financial instruments also includes our senior debt and an interest rate swap. The fair value of borrowings under senior debt, consisting of the revolving credit facility and term loans, approximates its carrying amount because interest is based on 30-day LIBOR plus 2.75% to 3.25%. At March 31, 2015 and December 31, 2014, the fair value of the interest rate swap was $17 and $9 (notional amounts of $3,500 and $3,750), respectively.
The Level 3 financial instruments include the fair value of the Company's contingent consideration arrangements that were entered into at the date of the respective acquisitions, which are classified within other liabilities in the consolidated balance sheets. The fair value of these liabilities were determined based on internally developed models that use assumptions or other data that are not readily observable from objective sources.
The following table sets forth a roll forward of the Level 3 measurements:
| |
Contingent Consideration Liabilities |
|||
|---|---|---|---|---|
Balance at December 31, 2013 |
$ | 339 | ||
Change in fair value |
11 | |||
Payout of contingent consideration |
(182 | ) | ||
| | | | | |
Balance at December 31, 2014 |
168 | |||
Change in fair value |
2 | |||
| | | | | |
Balance at March 31, 2015 |
$ | 170 | ||
| | | | | |
| | | | | |
| | | | | |
F-14
CONIFER HOLDINGS, INC. AND SUBSIDIARIES
Notes to Unaudited Condensed Consolidated Financial Statements (Continued)
(dollars in thousands, except per share amounts)
5. Goodwill and Intangible Assets
Goodwill
There has been no change in the carrying amount of goodwill from December 31, 2014.
Intangibles assets
The following table reflects intangible assets and related accumulated amortization:
| |
As of March 31, 2015 | |||||||||||
|---|---|---|---|---|---|---|---|---|---|---|---|---|
| |
Weighted Average Amortization Period |
Gross Carrying Amount |
Accumulated Amortization |
Net Carrying Amount |
||||||||
Nonamortizing indefinite-lived, intangible assets—state insurance licenses |
$ | 900 | $ | — | $ | 900 | ||||||
Amortizing definite-lived, intangible assets, customer lists |
5 years | 368 | 115 | 253 | ||||||||
| | | | | | | | | | | | | |
Total intangible assets |
$ | 1,268 | $ | 115 | $ | 1,153 | ||||||
| | | | | | | | | | | | | |
| | | | | | | | | | | | | |
| | | | | | | | | | | | | |
| |
As of December 31, 2014 | |||||||||||
|---|---|---|---|---|---|---|---|---|---|---|---|---|
| |
Weighted Average Amortization Period |
Gross Carrying Amount |
Accumulated Amortization |
Net Carrying Amount |
||||||||
Nonamortizing indefinite-lived intangible assets—state insurance licenses |
$ | 900 | $ | — | $ | 900 | ||||||
Amortizing definite-lived, intangible assets, customer lists |
5 years | 368 | 97 | 271 | ||||||||
| | | | | | | | | | | | | |
Total |
$ | 1,268 | $ | 97 | $ | 1,171 | ||||||
| | | | | | | | | | | | | |
| | | | | | | | | | | | | |
| | | | | | | | | | | | | |
Amortization of intangible assets was $18 for the three months ended March 31, 2015 and 2014. Future amortization of identifiable intangibles is as follows: remainder of 2015: $56, 2016: $74, 2017: $74 and 2018: $49.
6. Unpaid Losses and Loss Adjustment Expenses
The Company establishes a liability for losses and loss adjustment expenses which represents the estimated ultimate cost of all reported losses and unreported losses (i.e. incurred but not yet reported losses) and loss adjustment expenses incurred and unpaid at the balance sheet date.
F-15
CONIFER HOLDINGS, INC. AND SUBSIDIARIES
Notes to Unaudited Condensed Consolidated Financial Statements (Continued)
(dollars in thousands, except per share amounts)
6. Unpaid Losses and Loss Adjustment Expenses (Continued)
The table below provides the changes in the liability for unpaid losses and loss adjustment expenses, net of reinsurance (referred to as reserves), for the periods indicated as follows:
| |
March 31, | ||||||
|---|---|---|---|---|---|---|---|
| |
2015 | 2014 | |||||
Gross reserves—beginning of period |
$ | 31,531 | $ | 28,908 | |||
Less reinsurance recoverables on unpaid losses |
3,224 | 3,953 | |||||
| | | | | | | | |
Net reserves—beginning of period |
28,307 | 24,955 | |||||
| | | | | | | | |
Add: incurred losses and loss adjustment expenses, net of reinsurance: |
|||||||
Current period |
8,535 | 11,018 | |||||
Prior periods |
35 | (442 | ) | ||||
| | | | | | | | |
Total net incurred losses and loss adjustment expenses |
8,570 | 10,576 | |||||
| | | | | | | | |
Deduct: loss and loss adjustment expense payments, net of reinsurance: |
|||||||
Current period |
1,765 | 3,528 | |||||
Prior periods |
6,715 | 5,475 | |||||
| | | | | | | | |
Total net loss and loss adjustment expense payments |
8,480 | 9,003 | |||||
| | | | | | | | |
Net reserves—end of period |
28,397 | 26,528 | |||||
Plus: reinsurance recoverables on unpaid losses |
4,590 | 6,255 | |||||
| | | | | | | | |
Gross reserves—end of period |
$ | 32,987 | $ | 32,783 | |||
| | | | | | | | |
| | | | | | | | |
| | | | | | | | |
The Company recorded $35 of prior year adverse reserve development in the first three months of March 31, 2015 and favorable reserve development of $442 in the first three months of March 31, 2014. In 2015, there was $207 of favorable development in the workers compensation product that is in other commercial lines and there was $195 of adverse development in the commercial automobile line. In 2014, there was $247 and $149 of favorable reserve development in the personal automobile and other liability lines, respectively.
7. Reinsurance
In the normal course of business, the insurance companies seek to minimize the loss that may arise from catastrophes or other events that cause unfavorable underwriting results by reinsuring certain levels of risk in various areas of exposure with reinsurers. Although reinsurance does not discharge the direct insurer from liability to its policyholder, the insurance companies participate in such treaty and facultative reinsurance agreements in order to limit their loss exposure, protect them against catastrophic losses and diversify their business. The Company primarily ceded all specific risks in excess of $500 in 2015 and $300 in 2014. Failure of reinsurers to honor their obligations could result in losses to the Company. The Company evaluates the financial condition of its reinsurers and monitors the concentration of credit risk arising from similar geographic regions, activities, or economic characteristics of the reinsurers to minimize its exposure to significant losses from reinsurer insolvencies.
F-16
CONIFER HOLDINGS, INC. AND SUBSIDIARIES
Notes to Unaudited Condensed Consolidated Financial Statements (Continued)
(dollars in thousands, except per share amounts)
7. Reinsurance (Continued)
Effective December 31, 2014, the Company entered into a quota-share reinsurance agreement in which it cedes 25% of the subject premium, net of other reinsurance, and cedes 25% of the losses within the Company's retention which is between $0 and $500. The subject premium represents substantially all product lines other than the Florida homeowners and personal automobile policies. The Company recorded $4,834 of ceded written premiums during the three months ended March 31, 2015 under the quota-share reinsurance agreement.
Beginning in December 2014, the Company assumed written premium of $5,483 under a policy assumption agreement with Citizens Property and Casualty Corporation ("Citizens"). For the three months ended March 31, 2015, the Company assumed additional written premium of $1,419.
Citizens is a Florida government sponsored insurer that provides homeowners insurance to Florida residences that cannot find coverage in the voluntary market. Upon assuming this premium, the Company becomes the primary insurer to the policyholders. The Company is responsible for claims occurring on or after the effective date of the assumption.
The following table presents the effect of such reinsurance transactions on premiums, losses and loss adjustment expenses and policy acquisition costs:
| |
Three Months Ended March 31, |
||||||
|---|---|---|---|---|---|---|---|
| |
2015 | 2014 | |||||
Written premiums: |
|||||||
Direct |
$ | 21,119 | $ | 17,667 | |||
Assumed |
85 | — | |||||
Ceded |
(7,538 | ) | (958 | ) | |||
| | | | | | | | |
Net written premiums |
$ | 13,666 | $ | 16,709 | |||
| | | | | | | | |
| | | | | | | | |
| | | | | | | | |
Earned premiums: |
|||||||
Direct |
$ | 19,301 | $ | 14,481 | |||
Assumed |
1,673 | — | |||||
Ceded |
(6,481 | ) | (1,806 | ) | |||
| | | | | | | | |
Net earned premiums |
$ | 14,493 | $ | 12,675 | |||
| | | | | | | | |
| | | | | | | | |
| | | | | | | | |
Loss and loss adjustment expenses: |
|||||||
Direct |
$ | 9,652 | $ | 12,871 | |||
Assumed |
794 | 311 | |||||
Ceded |
(1,876 | ) | (2,606 | ) | |||
| | | | | | | | |
Net loss and loss adjustment expenses |
$ | 8,570 | $ | 10,576 | |||
| | | | | | | | |
| | | | | | | | |
| | | | | | | | |
Policy acquisition costs |
$ | 9,570 | $ | 6,322 | |||
Ceding commissions |
(3,450 | ) | — | ||||
| | | | | | | | |
Net policy acquisition costs |
$ | 6,120 | $ | 6,322 | |||
| | | | | | | | |
| | | | | | | | |
| | | | | | | | |
F-17
CONIFER HOLDINGS, INC. AND SUBSIDIARIES
Notes to Unaudited Condensed Consolidated Financial Statements (Continued)
(dollars in thousands, except per share amounts)
8. Senior Debt
A summary of the outstanding senior debt is as follows:
| |
March 31, 2015 |
December 31, 2014 |
|||||
|---|---|---|---|---|---|---|---|
Revolver |
$ | 17,462 | $ | 16,562 | |||
Term Note |
3,500 | 3,500 | |||||
2014 Term Note |
7,250 | 7,500 | |||||
| | | | | | | | |
Total |
$ | 28,212 | $ | 27,562 | |||
| | | | | | | | |
| | | | | | | | |
| | | | | | | | |
There have been no changes to the terms and conditions of the Amended Credit Agreement since December 31, 2014 except the Company entered into a first amendment to its Amended Credit Agreement ("First Amendment"), dated May 4, 2015. The First Amendment, among other things, eliminated certain other metrics and revised the provision that the Company's Chairman ownership be not less than 50% to not less than 33%. These revisions were retroactive to December 31, 2014. With these revisions to its Amended Credit Agreement, the Company was in compliance with its debt covenants at March 31, 2015.
The weighted-average interest rate on borrowings under the Revolver for the three months ended March 31, 2015 was 3.5%. The amount available under the Revolver was $38 at March 31, 2015.
9. Shareholders' Equity
Common Stock
In January 2015, the Company issued 55,029 shares of common stock to an Executive of the Company for cash of $750 ($13.63 per share).
During the three months ended March 31, 2014, the Company initiated certain capital-raising activities whereby shares of common stock were issued to third-party investors, members of the board of directors, executive management and employees, along with their relatives. The Company raised proceeds of $6,543 from the issuance of 538,173 shares of common stock at $12.16 per share. The common shares were issued entirely to executive management and their relatives.
Preferred Stock
During the three months ended March 31, 2014, the Company issued 64,000 shares of preferred stock at $10.00 per share to certain investors. On October 1, 2014, the then outstanding shares of preferred stock were exchanged for shares of redeemable preferred stock.
10. Redeemable Preferred Stock
At December 31, 2014, the Company has 60,600 shares of redeemable preferred stock outstanding. The shares of redeemable preferred stock was initially recorded at fair value and has been increased by the paid-in-kind interest. The Company has classified the shares of redeemable preferred within temporary equity on its consolidated balance sheet at December 31, 2014 due to its liquidation rights. The redeemable preferred stock is redeemable in cash upon a deemed liquation event (i.e., the sale of 50% or more of the outstanding shares of voting capital stock) that is not solely within the control of the Company.
F-18
CONIFER HOLDINGS, INC. AND SUBSIDIARIES
Notes to Unaudited Condensed Consolidated Financial Statements (Continued)
(dollars in thousands, except per share amounts)
10. Redeemable Preferred Stock (Continued)
On March 25, 2015, the Company further amended its articles of incorporation with the consent of more than 80% of the holders of the preferred stock and a majority of the holders of the common stock to restrict the definition of a Liquidation Event to the liquidation, dissolution or winding up of the Company and to eliminate from that definition a change of control or a public offering of the Company. All or part of the preferred stock may be redeemed after one year from the date of issuance, at the option of the Company by a cash payment of the original purchase price plus any accumulated and as yet unpaid preferred dividends and PIK interest. On the effective date of the modification, the Company reclassified the carrying amount of its redeemable preferred stock from temporary equity to permanent equity as the redemption of the redeemable preferred stock is within the Company's control.
11. Other Comprehensive Income (Loss)
The following table presents changes in accumulated other comprehensive income (loss) for unrealized gains and losses on available for sale securities (the amounts in the three months ended March 31, 2014 are shown after applying a tax rate of 34%):
Three months ended March 31, 2015 |
||||
Balance at December 31, 2014 |
$ | 1,158 | ||
Other comprehensive income before reclassifications |
703 | |||
Amounts reclassified from accumulated other comprehensive income (loss) |
(217 | ) | ||
| | | | | |
Net current period other comprehensive income |
486 | |||
| | | | | |
Balance at March 31, 2015 |
$ | 1,644 | ||
| | | | | |
| | | | | |
| | | | | |
Three months ended March 31, 2014 |
||||
Balance at December 31, 2013 |
$ | 536 | ||
Other comprehensive income before reclassifications |
353 | |||
Amounts reclassified from accumulated other comprehensive income (loss) |
(124 | ) | ||
| | | | | |
Net current period other comprehensive income |
229 | |||
| | | | | |
Balance at March 31, 2014 |
$ | 765 | ||
| | | | | |
| | | | | |
| | | | | |
The following indicates the line items in the statements of operations and amounts of the reclassification adjustments made for the periods presented:
| |
Three Months Ended March 31, |
||||||
|---|---|---|---|---|---|---|---|
| |
2015 | 2014 | |||||
Net realized gains |
$ | 217 | $ | 188 | |||
Income tax expense |
— | 64 | |||||
F-19
CONIFER HOLDINGS, INC. AND SUBSIDIARIES
Notes to Unaudited Condensed Consolidated Financial Statements (Continued)
(dollars in thousands, except per share amounts)
12. Income (loss) Per Share
Basic and diluted income (loss) per share are computed by dividing net income allocable to common shareholders by the weighted average number of common shares outstanding during the period. The dividends on preferred stock are deducted from the net income to arrive at net income allocable to common shareholders. In the period of a net loss, the dividends on preferred stock are added to the net loss to arrive at net loss allocable to common shareholders.
The following table presents the calculation of basic and diluted income (loss) per common share, as follows:
| |
Three Months Ended March 31, |
||||||
|---|---|---|---|---|---|---|---|
| |
2015 | 2014 | |||||
Numerator: |
|||||||
Net income (loss) attributable to Conifer |
$ | 463 | $ | (3,229 | ) | ||
Preferred stock dividends |
152 | 11 | |||||
Paid-in-kind dividends |
61 | — | |||||
| | | | | | | | |
Net income (loss) allocable to common shareholders |
250 | (3,240 | ) | ||||
| | | | | | | | |
Denominator: |
|||||||
Weighted average common shares, basic and diluted |
4,040,872 | 2,138,776 | |||||
| | | | | | | | |
Income (loss) per share allocable to common shareholders, basic and diluted |
$ | 0.06 | $ | (1.51 | ) | ||
| | | | | | | | |
| | | | | | | | |
| | | | | | | | |
13. Stock-based Compensation
In March 2015, the Company established a 2015 Omnibus Incentive Plan ("2015 Plan"), which permits the granting of stock options, stock appreciation rights, restricted stock units and other stock-based awards. The 2015 Plan authorizes up to 1,377,000 shares of common stock for awards to be issued to employees, directors or consultants of the Company. The stock-based awards will be issued at no less than the market price on the date the awards are granted. Refer to Note 18, Subsequent Events.
14. Related Party Transactions
In December 2012, the Company entered into a short-term, unsecured note payable with an executive of the Company for $1 million. The note required only quarterly interest payments at 12% per annum. The note was converted for equity of the Company in two separate transactions. On January 31, 2014, the Company issued 41,126 shares of common stock in satisfaction of $500 of the note balance. The remaining note balance was satisfied through the issuance of 41,126 shares of common stock on June 30, 2014. Interest expense recorded on the note was $20 for the three months ended March 31, 2014.
F-20
CONIFER HOLDINGS, INC. AND SUBSIDIARIES
Notes to Unaudited Condensed Consolidated Financial Statements (Continued)
(dollars in thousands, except per share amounts)
15. Commitments and Contingencies
Legal proceedings
The Company is subject to claims and lawsuits that arise primarily in the ordinary course of business. In the opinion of management, the disposition or ultimate resolution of such claims and lawsuits will not have a material adverse effect on the Company's consolidated financial position, results of operations, or liquidity.
Commitment
During 2010, the Company entered into an agreement with an unaffiliated party to design, develop, and implement a new policy administration, billing, and claims system for the Company. The Company is required to pay a minimum monthly fee of $40 with a fee schedule that is scalable with its premium volume. The contract expires on July 1, 2018 but it may be extended by mutual agreement in writing by the respective parties.
16. Supplemental Information
Supplemental cash flow information is as follows:
| |
Three Months Ended March 31, |
||||||
|---|---|---|---|---|---|---|---|
| |
2015 | 2014 | |||||
Interest paid |
$ | 233 | $ | 135 | |||
Dividends declared but not paid at end of period |
152 | 11 | |||||
Paid-in-kind interest |
61 | — | |||||
Purchases of common stock not paid at end of period |
— | 198 | |||||
During the three months ended March 31, 2014, the Company converted $500 of the outstanding note payable issued to an Executive to equity. Refer to Note 14, Related Party Transactions.
17. Segment Information
The Company is engaged in the sale of property and casualty insurance products and has organized its principal operations into two types of insurance businesses: commercial lines and personal lines. Within these two insurance businesses, the Company operates through various lines of businesses that offer various insurance products that are engaged in underwriting and marketing insurance coverages, and administering claims processing for such policies.
The Company defines its operating segments as components of the business where separate financial information is available and used by the chief operating decision-making group in deciding how to allocate resources to its segments and in assessing its performance. In assessing performance of its operating segments, the Company's chief operating decision-making group, comprised of key senior executives, review a number of financial measures including gross written premiums, net earned premiums, and loss and loss adjustment expenses, net of reinsurance recoveries. The primary measure used for making decisions about resources to be allocated to an operating segment and assessing its performance is segment underwriting gain or loss which is defined as segment revenues, consisting of
F-21
CONIFER HOLDINGS, INC. AND SUBSIDIARIES
Notes to Unaudited Condensed Consolidated Financial Statements (Continued)
(dollars in thousands, except per share amounts)
17. Segment Information (Continued)
net earned premiums and other income, less segment expenses, consisting of loss and loss adjustment expenses, policy acquisition costs and other underwriting and operating expenses, of the operating segments. Other underwriting and operating expenses include primarily compensation and related benefits for underwriting personnel, licensing of policy issuance and claims systems, rent and utilities. The Company markets, distributes and sells its insurance products through owned-insurance agencies and a network of independent agents. All of the Company's insurance activities are conducted in the United States with a concentration of activity in Florida, Michigan and Pennsylvania. For the three months ended March 31, 2015 and 2014, gross written premiums attributable to these three states were 57% and 59%, respectively, of the Company's total gross written premiums.
The commercial lines and personal lines accounted for approximately 65% and 35%, respectively, of net earned premiums for the three months ended March 31, 2015 and approximately 50% and 50%, respectively, of net earned premiums for the three months ended March 31, 2014. Other income includes installment and policy fees charged to policyholders and commissions income from third party insurers on policies written through our agencies relating to our product lines.
The following provides a description of the Company's two insurance businesses and product offerings within these businesses:
- •
- Commercial lines—offers coverage for property, liability, automobile and other miscellaneous coverage primarily to
owner-operated small and mid-sized businesses, professional organizations and hospitality businesses such as restaurant, bars and taverns. Included within commercial insurance business are the
following key products:
- •
- Commercial multi-peril ("CMP")—provides property and liability coverages in a package to the policyholder.
- •
- Other liability—provides coverage for general liability and liquor liability on an individual policy.
- •
- Automobile—provides coverage for commercial automobiles for businesses that supply to their employees
company-owned vehicles.
- •
- Other—includes primarily policies for coverage in the areas of for workers' compensation.
- •
- Personal lines—offers coverage for Midwest homeowners, specialty homeowners and automobile. Included within personal
insurance business are the following key products:
- •
- Midwest homeowners—provides coverage for nonstandard homeowners insurance and dwelling fire insurance
products (property coverage and basic perils coverage only) located primarily in Indiana and Illinois.
- •
- Specialty homeowners—provides coverage in niche homeowners markets that have special risk characteristics,
including heightened exposure to wind and storms, located primarily in Florida, Hawaii and Texas.
- •
- Automobile—provides coverage for nonstandard private passenger automobile insurance policies primarily for individuals located in Florida and Illinois.
F-22
CONIFER HOLDINGS, INC. AND SUBSIDIARIES
Notes to Unaudited Condensed Consolidated Financial Statements (Continued)
(dollars in thousands, except per share amounts)
17. Segment Information (Continued)
In addition to the reportable segments, the Company maintains a Corporate and Other category to reconcile segment results to the consolidated totals. The Corporate and Other category includes: (i) corporate operating expenses such as salaries and related benefits of the Company's executive management team and finance and information technology personnel, and other corporate headquarter expenses, (ii) interest expense on the Company's senior debt obligations; (iii) depreciation and amortization on property and equipment, and (iv) all investment income activity. All investment income activity is reported within net investment income and net realized investment gains on the consolidated statements of operations.
The following tables present information by reportable segment:
| |
Commercial Lines | Personal Lines | |
|
||||||||||||||||||||||||||||||
|---|---|---|---|---|---|---|---|---|---|---|---|---|---|---|---|---|---|---|---|---|---|---|---|---|---|---|---|---|---|---|---|---|---|---|
| |
|
|
|
|
|
Homeowners | |
|
|
|
||||||||||||||||||||||||
| |
|
Other Liability |
|
|
|
|
|
Corporate & Other |
|
|||||||||||||||||||||||||
Three Months Ended March 31, 2015 |
CMP | Auto | Other | Total | Midwest | Specialty | Auto | Total | Total | |||||||||||||||||||||||||
Gross written premiums |
$ | 9,662 | $ | 2,298 | $ | 2,676 | $ | 1,106 | $ | 15,742 | $ | 1,588 | $ | 3,067 | $ | 807 | $ | 5,462 | — | $ | 21,204 | |||||||||||||
| | | | | | | | | | | | | | | | | | | | | | | | | | | | | | | | | | | |
| | | | | | | | | | | | | | | | | | | | | | | | | | | | | | | | | | | |
| | | | | | | | | | | | | | | | | | | | | | | | | | | | | | | | | | | |
Net written premiums |
$ | 5,818 | $ | 1,426 | $ | 1,815 | $ | 795 | $ | 9,854 | $ | 1,011 | $ | 1,994 | $ | 807 | $ | 3,812 | — | $ | 13,666 | |||||||||||||
| | | | | | | | | | | | | | | | | | | | | | | | | | | | | | | | | | | |
| | | | | | | | | | | | | | | | | | | | | | | | | | | | | | | | | | | |
| | | | | | | | | | | | | | | | | | | | | | | | | | | | | | | | | | | |
Net earned premiums |
$ | 6,126 | $ | 1,222 | $ | 1,610 | $ | 530 | $ | 9,488 | $ | 1,488 | $ | 2,095 | $ | 1,422 | $ | 5,005 | — | $ | 14,493 | |||||||||||||
Other income |
306 | 38 | 5 | — | 349 | 63 | 9 | 56 | 128 | 12 | 489 | |||||||||||||||||||||||
| | | | | | | | | | | | | | | | | | | | | | | | | | | | | | | | | | | |
Segment revenue |
6,432 | 1,260 | 1,615 | 530 | 9,837 | 1,551 | 2,104 | 1,478 | 5,133 | 12 | 14,982 | |||||||||||||||||||||||
Loss and loss adjustment expenses, net |
3,780 | 454 | 1,065 | 18 | 5,317 | 872 | 882 | 1,499 | 3,253 | — | 8,570 | |||||||||||||||||||||||
Policy acquisition costs |
1,119 | 208 | 330 | 81 | 1,738 | 394 | 225 | 238 | 857 | — | 2,595 | |||||||||||||||||||||||
Operating expenses |
1,032 | 254 | 114 | 72 | 1,472 | 101 | 115 | 197 | 413 | 1,807 | 3,692 | |||||||||||||||||||||||
| | | | | | | | | | | | | | | | | | | | | | | | | | | | | | | | | | | |
Segment expense |
5,931 | 916 | 1,509 | 171 | 8,527 | 1,367 | 1,222 | 1,934 | 4,523 | 1,807 | 14,857 | |||||||||||||||||||||||
| | | | | | | | | | | | | | | | | | | | | | | | | | | | | | | | | | | |
Segment underwriting gain (loss) |
$ | 501 | $ | 344 | $ | 106 | $ | 359 | $ | 1,310 | $ | 184 | $ | 882 | $ | (456 | ) | $ | 610 | (1,795 | ) | 125 | ||||||||||||
| | | | | | | | | | | | | | | | | | | | | | | | | | | | | | | | | | | |
| | | | | | | | | | | | | | | | | | | | | | | | | | | | | | | | | | | |
| | | | | | | | | | | | | | | | | | | | | | | | | | | | | | | | | | | |
Investment income |
486 | 486 | ||||||||||||||||||||||||||||||||
Net realized investment gains |
145 | 145 | ||||||||||||||||||||||||||||||||
Interest expense |
(244 | ) | (244 | ) | ||||||||||||||||||||||||||||||
| | | | | | | | | | | | | | | | | | | | | | | | | | | | | | | | | | | |
Income (loss) before income taxes |
$ | (1,408 | ) | $ | 512 | |||||||||||||||||||||||||||||
| | | | | | | | | | | | | | | | | | | | | | | | | | | | | | | | | | | |
| | | | | | | | | | | | | | | | | | | | | | | | | | | | | | | | | | | |
| | | | | | | | | | | | | | | | | | | | | | | | | | | | | | | | | | | |
F-23
CONIFER HOLDINGS, INC. AND SUBSIDIARIES
Notes to Unaudited Condensed Consolidated Financial Statements (Continued)
(dollars in thousands, except per share amounts)
17. Segment Information (Continued)
| |
Commercial Lines | Personal Lines | |
|
||||||||||||||||||||||||||||||
|---|---|---|---|---|---|---|---|---|---|---|---|---|---|---|---|---|---|---|---|---|---|---|---|---|---|---|---|---|---|---|---|---|---|---|
| |
|
|
|
|
|
Homeowners | |
|
|
|
||||||||||||||||||||||||
| |
|
Other Liability |
|
|
|
|
|
Corporate & Other |
|
|||||||||||||||||||||||||
Three Months Ended March 31, 2014 |
CMP | Auto | Other | Total | Midwest | Specialty | Auto | Total | Total | |||||||||||||||||||||||||
Gross written premiums |
$ | 6,266 | $ | 1,867 | $ | 1,410 | $ | 434 | $ | 9,977 | $ | 1,976 | $ | 2,422 | $ | 3,292 | $ | 7,690 | — | $ | 17,667 | |||||||||||||
| | | | | | | | | | | | | | | | | | | | | | | | | | | | | | | | | | | |
| | | | | | | | | | | | | | | | | | | | | | | | | | | | | | | | | | | |
| | | | | | | | | | | | | | | | | | | | | | | | | | | | | | | | | | | |
Net written premiums |
$ | 5,625 | $ | 1,742 | $ | 1,358 | $ | 394 | $ | 9,119 | $ | 1,935 | $ | 2,363 | $ | 3,292 | $ | 7,590 | — | $ | 16,709 | |||||||||||||
| | | | | | | | | | | | | | | | | | | | | | | | | | | | | | | | | | | |
| | | | | | | | | | | | | | | | | | | | | | | | | | | | | | | | | | | |
| | | | | | | | | | | | | | | | | | | | | | | | | | | | | | | | | | | |
Net earned premiums |
$ | 4,510 | $ | 1,125 | $ | 473 | $ | 254 | $ | 6,362 | $ | 1,383 | $ | 668 | $ | 4,262 | $ | 6,313 | — | 12,675 | ||||||||||||||
Other income (loss) |
229 | 40 | 4 | — | 273 | 103 | — | 159 | 262 | (3 | ) | 532 | ||||||||||||||||||||||
| | | | | | | | | | | | | | | | | | | | | | | | | | | | | | | | | | | |
Segment revenue |
4,739 | 1,165 | 477 | 254 | 6,635 | 1,486 | 668 | 4,421 | 6,575 | (3 | ) | 13,207 | ||||||||||||||||||||||
Loss and loss adjustment expenses, net |
4,891 | 435 | 136 | 161 | 5,623 | 1,333 | 260 | 3,360 | 4,953 | — | 10,576 | |||||||||||||||||||||||
Policy acquisition costs |
1,227 | 298 | 133 | 35 | 1,693 | 394 | 227 | 917 | 1,538 | — | 3,231 | |||||||||||||||||||||||
Operating expenses |
754 | 205 | 74 | 45 | 1,078 | 98 | 74 | 430 | 602 | 1,214 | 2,894 | |||||||||||||||||||||||
| | | | | | | | | | | | | | | | | | | | | | | | | | | | | | | | | | | |
Segment expense |
6,872 | 938 | 343 | 241 | 8,394 | 1,825 | 561 | 4,707 | 7,093 | 1,214 | 16,701 | |||||||||||||||||||||||
| | | | | | | | | | | | | | | | | | | | | | | | | | | | | | | | | | | |
Segment underwriting gain (loss) |
$ | (2,133 | ) | $ | 227 | $ | 134 | $ | 13 | $ | (1,759 | ) | $ | (339 | ) | $ | 107 | $ | (286 | ) | $ | (518 | ) | (1,217 | ) | (3,494 | ) | |||||||
| | | | | | | | | | | | | | | | | | | | | | | | | | | | | | | | | | | |
| | | | | | | | | | | | | | | | | | | | | | | | | | | | | | | | | | | |
| | | | | | | | | | | | | | | | | | | | | | | | | | | | | | | | | | | |
Investment income |
220 | 220 | ||||||||||||||||||||||||||||||||
Net realized investment gains |
91 | 91 | ||||||||||||||||||||||||||||||||
Interest expense |
(129 | ) | (129 | ) | ||||||||||||||||||||||||||||||
| | | | | | | | | | | | | | | | | | | | | | | | | | | | | | | | | | | |
Income (loss) before income taxes |
$ | (1,035 | ) | $ | (3,312 | ) | ||||||||||||||||||||||||||||
| | | | | | | | | | | | | | | | | | | | | | | | | | | | | | | | | | | |
| | | | | | | | | | | | | | | | | | | | | | | | | | | | | | | | | | | |
| | | | | | | | | | | | | | | | | | | | | | | | | | | | | | | | | | | |
The Company's assets on the consolidated balance sheet are not allocated to the reportable segments.
In January 2015, the Company notified its insurance regulator in the State of Florida of its intent to stop writing non-standard personal automobile policies. As of March 31, 2015, the Company had 2,591 automobile policies in force. The Company discontinued offering and writing new policies on January 27, 2015 but will continue to service existing policies, pay claims and perform other administrative services as needed until the run-off of the claims on such policies are complete. In early 2014, the Company discontinued writing non-standard personal automobile business in Illinois. The Company has no plans to provide or write this insurance coverage in the future. By the end of May 2015, this exited product line was solely in run-off. The Company received approval to discontinue its offering of personal automobile insurance policies from the insurance regulators in April 2015. The personal automobile product line contributed $1,422 and $4,262 to net earned premiums and $(456) and $(286) to income (loss) before income taxes for the three months ended March 31, 2015 and 2014, respectively.
The decision to stop writing personal automobile policies is the result of the Company's change in strategic positioning and its desire to increase its personal homeowners product line and pursue existing commercial line opportunities in this market.
F-24
CONIFER HOLDINGS, INC. AND SUBSIDIARIES
Notes to Unaudited Condensed Consolidated Financial Statements (Continued)
(dollars in thousands, except per share amounts)
18. Subsequent Events
The Company has evaluated subsequent events from the balance sheet dated through July 2, 2015, the date at which the condensed consolidated financial statements were originally issued and July 30, 2015, the date on which the retrospectively adjusted condensed consolidated financial statements were issued to reflect the common stock split, as described in Note 2, and for disclosure purposes.
Proposed Initial Public Offering
The Company is in the process of preparing for an initial public offering ("IPO"). The Company's expectation is that the IPO will occur during the latter half of 2015, although no assurance of the IPO event can be made. Upon completion of the IPO, all outstanding shares of preferred stock will be repurchased in cash. Certain holders of preferred stock have agreed to use such cash proceeds to purchase shares of common stock at the same per share price as the common stock is being offered to the public. Refer to the transaction with preferred shareholders discussed below.
Preferred Stock
Pursuant to agreements effective on or before July 1, 2015, the holders of preferred stock agreed for the Company to repurchase their outstanding preferred shares at the original purchase price (i.e. $100 per share) plus all accrued and unpaid preferred dividends. In addition, the holders of 29,550 shares (or 48.8%) of preferred stock agreed to use such cash received from the Company's repurchase of their preferred stock to purchase shares of common stock at the same per share price as the common stock is being offered in the Company's IPO. The closing of these transactions are conditioned on the completion of the Company's initial public offering.
As a result of these transactions, following the closing of the IPO, the Company will pay $6,340 to holders of shares of preferred stock to repurchase such shares and for the payment of accrued dividends. Thereafter will be no shares of preferred stock outstanding. The Company will issue on the closing date, 257,567 shares of common stock to former holders of the preferred stock that have agreed to use such cash to purchase shares of common stock at the offering price per share.
2015 Omnibus Incentive Plan
In connection with the Company's contemplated initial public offering, the Company will grant an aggregate of 333,333 restricted stock units under the 2015 Omnibus Incentive Plan to executive officers and other employees at an assumed initial offering price of $12.00 per share, the midpoint of the range set forth in this prospectus. The value of the restricted stock unit is determined by the market value of the Company's common stock at the date of grant. The total values of such awards, approximately $4.0 million, will vest in five equal annual installments, commencing on the first anniversary from the date of grant. Upon vesting, each restricted stock unit will convert into one share of common stock.
Senior Debt
On June 29, 2015, the Company entered into a second amendment to its Amended Credit Agreement ("Second Amendment"). The Second Amendment, among other things, further revised the provision that the Company's Chairman ownership be not less than 20% after consummation of an initial public offering.
F-25
REPORT OF INDEPENDENT REGISTERED PUBLIC ACCOUNTING FIRM
The accompanying consolidated financial statements give effect to a 10.2 to 1 split of the common stock of Conifer Holdings, Inc. and subsidiaries, which will be effectuated immediately prior to the effectiveness of the initial public offering. The following report is in the form which will be furnished by Deloitte & Touche LLP, an independent registered public accounting firm, upon completion of the 10.2 to 1 split of the common stock of Conifer Holdings, Inc. described in Note 2 to the financial statements and assuming that from May 6, 2015 to the date of such completion no other material events have occurred that would affect the accompanying financial statements or disclosures therein except as described in Note 2.
/s/ Deloitte & Touche LLP
Detroit, Michigan
July 30, 2015
REPORT OF INDEPENDENT REGISTERED PUBLIC ACCOUNTING FIRM
To the Board of Directors of
Conifer Holdings, Inc.
Birmingham, Michigan
We have audited the accompanying consolidated balance sheets of Conifer Holdings, Inc. and subsidiaries (the "Company") as of December 31, 2014 and 2013, and the related consolidated statements of operations, comprehensive income (loss), changes in redeemable preferred stock and equity, and cash flows for each of the three years in the period ended December 31, 2014. Our audits also included the financial statement schedules listed in the Index. These financial statements and financial statement schedules are the responsibility of the Company's management. Our responsibility is to express an opinion on these financial statements and financial statement schedules based on our audits.
We conducted our audits in accordance with the standards of the Public Company Accounting Oversight Board (United States). Those standards require that we plan and perform the audit to obtain reasonable assurance about whether the financial statements are free of material misstatement. The Company is not required to have, nor were we engaged to perform, an audit of its internal control over financial reporting. Our audits included consideration of internal control over financial reporting as a basis for designing audit procedures that are appropriate in the circumstances, but not for the purpose of expressing an opinion on the effectiveness of the Company's internal control over financial reporting. Accordingly, we express no such opinion. An audit also includes examining, on a test basis, evidence supporting the amounts and disclosures in the financial statements, assessing the accounting principles used and significant estimates made by management, as well as evaluating the overall financial statement presentation. We believe that our audits provide a reasonable basis for our opinion.
In our opinion, such consolidated financial statements present fairly, in all material respects, the financial position of Conifer Holdings, Inc. and subsidiaries as of December 31, 2014 and 2013, and the results of their operations and their cash flows for each of the three years in the period ended December 31, 2014, in conformity with accounting principles generally accepted in the United States of America. Also, in our opinion, such financial statement schedules, when considered in relation to the basic consolidated financial statements taken as a whole, present fairly in all material respects the information set forth therein.
Detroit, Michigan
May 6, 2015 (July , 2015 as to the effects of the common stock split discussed in Note 2)
F-26
CONIFER HOLDINGS, INC. AND SUBSIDIARIES
Consolidated Balance Sheets
| |
December 31, | ||||||
|---|---|---|---|---|---|---|---|
| |
2014 | 2013 | |||||
| |
(dollars in thousands) |
||||||
Assets |
|||||||
Investment securities: |
|||||||
Fixed maturity securities, at fair value (amortized cost $83,768 in 2014 and $44,536 in 2013) |
$ | 84,405 | $ | 44,155 | |||
Equity securities, at fair value (cost $2,965 in 2014 and $2,520 in 2013) |
4,084 | 3,712 | |||||
Short-term investments, at cost or amortized cost (approximates fair value) |
16,749 | 9,282 | |||||
| | | | | | | | |
Total investment securities |
105,238 | 57,149 | |||||
Cash |
18,488 |
11,296 |
|||||
Premiums and agents' balances receivable, net |
14,478 | 12,304 | |||||
Reinsurance recoverables on unpaid losses |
3,224 | 3,953 | |||||
Reinsurance recoverables on paid losses |
1,915 | 441 | |||||
Ceded unearned premium |
9,510 | 1,404 | |||||
Deferred policy acquisition costs |
5,679 | 5,747 | |||||
Intangible assets, net |
1,171 | 1,245 | |||||
Goodwill |
1,104 | 1,104 | |||||
Other assets |
2,931 | 2,213 | |||||
| | | | | | | | |
Total assets |
$ | 163,738 | $ | 96,856 | |||
| | | | | | | | |
| | | | | | | | |
| | | | | | | | |
Liabilities and Equity |
|||||||
Liabilities: |
|||||||
Unpaid losses and loss adjustment expenses |
$ | 31,531 | $ | 28,908 | |||
Unearned premiums |
43,381 | 26,505 | |||||
Reinsurance premiums payable |
7,069 | 989 | |||||
Senior debt |
27,562 | 13,087 | |||||
Accounts payable and accrued expenses |
2,521 | 2,349 | |||||
Other liabilities |
1,396 | 3,767 | |||||
| | | | | | | | |
Total liabilities |
113,460 | 75,605 | |||||
Commitments and contingencies (note 20) |
|||||||
Redeemable preferred stock, 1,000,000 shares authorized; 60,600 shares and none issued and outstanding at December 31, 2014 and 2013, respectively |
6,119 |
— |
|||||
Shareholders' equity: |
|||||||
Common stock, no par value, 12,240,000 shares authorized, 3,995,013 shares and 1,749,626 shares issued and outstanding at December 31, 2014 and 2013, respectively |
46,119 | 16,883 | |||||
Retained earnings (accumulated deficit) |
(3,095 | ) | 3,851 | ||||
Accumulated other comprehensive income |
1,158 | 536 | |||||
| | | | | | | | |
Total shareholders' equity attributable to Conifer |
44,182 | 21,270 | |||||
Noncontrolling interest |
(23 | ) | (19 | ) | |||
| | | | | | | | |
Total equity |
44,159 | 21,251 | |||||
| | | | | | | | |
Total liabilities and equity |
$ | 163,738 | $ | 96,856 | |||
| | | | | | | | |
| | | | | | | | |
| | | | | | | | |
See accompanying notes to consolidated financial statements.
F-27
CONIFER HOLDINGS, INC. AND SUBSIDIARIES
Consolidated Statements of Operations
| |
Year Ended December 31, | |||||||||
|---|---|---|---|---|---|---|---|---|---|---|
| |
2014 | 2013 | 2012 | |||||||
| |
(dollars in thousands, except per share amounts) |
|||||||||
Revenue |
||||||||||
Gross written premiums |
$ | 83,847 | $ | 44,087 | $ | 22,838 | ||||
Ceded written premiums |
(17,548 | ) | (6,439 | ) | (543 | ) | ||||
Change in net unearned premiums |
(8,771 | ) | (10,019 | ) | (5,361 | ) | ||||
| | | | | | | | | | | |
Net earned premiums |
57,528 | 27,629 | 16,934 | |||||||
Net investment income |
1,175 | 1,000 | 1,072 | |||||||
Net realized investment gains |
417 | 299 | 1,273 | |||||||
Gains from acquisitions |
— | 3,714 | — | |||||||
Other income |
1,809 | 834 | 309 | |||||||
| | | | | | | | | | | |
Total revenue |
60,929 | 33,476 | 19,588 | |||||||
Expenses |
||||||||||
Losses and loss adjustment expenses, net |
40,730 | 15,824 | 7,591 | |||||||
Policy acquisition costs |
14,696 | 7,667 | 4,652 | |||||||
Operating expenses |
12,139 | 9,161 | 6,520 | |||||||
Interest expense |
584 | 541 | 428 | |||||||
| | | | | | | | | | | |
Total expenses |
68,149 | 33,193 | 19,191 | |||||||
| | | | | | | | | | | |
Income (loss) before income taxes |
(7,220 | ) | 283 | 397 | ||||||
Income tax expense (benefit) |
(281 | ) | 3 | (16 | ) | |||||
| | | | | | | | | | | |
Net income (loss) |
(6,939 | ) | 280 | 413 | ||||||
Less net loss attributable to noncontrolling interest |
(4 | ) | (69 | ) | — | |||||
| | | | | | | | | | | |
Net income (loss) attributable to Conifer |
$ | (6,935 | ) | $ | 349 | $ | 413 | |||
| | | | | | | | | | | |
| | | | | | | | | | | |
| | | | | | | | | | | |
Net income (loss) allocable to common shareholders |
$ | (7,200 | ) | $ | 349 | $ | 413 | |||
| | | | | | | | | | | |
| | | | | | | | | | | |
| | | | | | | | | | | |
Income (loss) per share allocable to common shareholders, basic and diluted |
$ | (2.69 | ) | $ | 0.20 | $ | 0.24 | |||
| | | | | | | | | | | |
| | | | | | | | | | | |
| | | | | | | | | | | |
Weighted average common shares outstanding, basic and diluted |
2,672,440 | 1,749,626 | 1,741,517 | |||||||
| | | | | | | | | | | |
| | | | | | | | | | | |
| | | | | | | | | | | |
See accompanying notes to consolidated financial statements.
F-28
CONIFER HOLDINGS, INC. AND SUBSIDIARIES
Consolidated Statements of Comprehensive Income (Loss)
| |
Year Ended December 31, | |||||||||
|---|---|---|---|---|---|---|---|---|---|---|
| |
2014 | 2013 | 2012 | |||||||
| |
(dollars in thousands) |
|||||||||
Net income (loss) |
$ | (6,939 | ) | $ | 280 | $ | 413 | |||
Other comprehensive income (loss): |
||||||||||
Unrealized gains (losses) on investments arising during the year, net of tax of $571, ($120), and $391, in 2014, 2013 and 2012, respectively |
1,107 | (233 | ) | 760 | ||||||
Less: reclassification adjustment for gains included in net income (loss), net of tax of $250, $237, and $360, in 2014, 2013 and 2012, respectively |
485 | 461 | 700 | |||||||
| | | | | | | | | | | |
Change in fair value of available for sale investments |
622 | (694 | ) | 60 | ||||||
Comprehensive income (loss) |
(6,317 |
) |
(414 |
) |
473 |
|||||
Less comprehensive income (loss) attributable to noncontrolling interest |
(4 | ) | (69 | ) | — | |||||
| | | | | | | | | | | |
Comprehensive income (loss) attributable to Conifer |
$ | (6,313 | ) | $ | (345 | ) | $ | 473 | ||
| | | | | | | | | | | |
| | | | | | | | | | | |
| | | | | | | | | | | |
See accompanying notes to consolidated financial statements.
F-29
CONIFER HOLDINGS, INC. AND SUBSIDIARIES
Consolidated Statement of Changes in Redeemable Preferred Stock and Equity
(dollars in thousands, except share amounts)
| |
Redeemable Preferred Stock |
|
|
|
No Par, Common Stock |
|
|
Total Conifer Holdings Shareholders' Equity |
|
|
||||||||||||||||||||||||||
|---|---|---|---|---|---|---|---|---|---|---|---|---|---|---|---|---|---|---|---|---|---|---|---|---|---|---|---|---|---|---|---|---|---|---|---|---|
| |
|
Preferred Stock | Retained Earnings (Accumulated Deficit) |
Accumulated Other Comprehensive Income (Loss) |
|
|
||||||||||||||||||||||||||||||
| |
|
Non- controlling Interest |
Total Equity |
|||||||||||||||||||||||||||||||||
| |
Shares | Amount |
|
Shares | Amount | Shares | Amount | |||||||||||||||||||||||||||||
Balance at January 1, 2012 |
— | — | — | — | 1,758,867 | 16,901 | $ | 3,169 | $ | 1,170 | $ | 21,240 | $ | — | $ | 21,240 | ||||||||||||||||||||
Net income |
— | — | — | — | — | — | 413 | — | 413 | — | 413 | |||||||||||||||||||||||||
Proceeds from issuance of common stock |
— | — | — | — | 30,569 | 382 | — | — | 382 | — | 382 | |||||||||||||||||||||||||
Retirement of shares of common stock (Note 12) |
— | — | — | — | (39,810 | ) | (400 | ) | (80 | ) | — | (480 | ) | — | (480 | ) | ||||||||||||||||||||
Other comprehensive income |
— | — | — | — | — | — | — | 60 | 60 | — | 60 | |||||||||||||||||||||||||
| | | | | | | | | | | | | | | | | | | | | | | | | | | | | | | | | | | | | |
Balance at December 31, 2012 |
— | — | — | — | 1,749,626 | 16,883 | 3,502 | 1,230 | 21,615 | — | 21,615 | |||||||||||||||||||||||||
Net income (loss) |
— | — | — | — | — | — | 349 | — | 349 | (69 | ) | 280 | ||||||||||||||||||||||||
Issuance of subsidiary common stock (Note 12) |
— | — | — | — | — | — | — | — | — | 50 | 50 | |||||||||||||||||||||||||
Other comprehensive loss |
— | — | — | — | — | — | — | (694 | ) | (694 | ) | — | (694 | ) | ||||||||||||||||||||||
| | | | | | | | | | | | | | | | | | | | | | | | | | | | | | | | | | | | | |
Balances at December 31, 2013 |
— | — | — | — | 1,749,626 | 16,883 | 3,851 | 536 | 21,270 | (19 | ) | 21,251 | ||||||||||||||||||||||||
Net loss |
— | — | — | — | — | — | (6,935 | ) | — | (6,935 | ) | (4 | ) | (6,939 | ) | |||||||||||||||||||||
Issuance of common stock in capital raising activities (Note 12) |
— | — | — | — | 2,163,135 | 28,475 | — | — | 28,475 | — | 28,475 | |||||||||||||||||||||||||
Conversion of note payable into shares of common stock (note 18) |
— | — | — | — | 82,252 | 1,000 | — | — | 1,000 | — | 1,000 | |||||||||||||||||||||||||
Issuance of preferred stock |
— | — | 66,000 | 660 | — | — | — | — | 660 | — | 660 | |||||||||||||||||||||||||
Issuance of redeemable preferred stock |
54,000 | 5,400 | — | — | — | — | — | — | — | — | — | |||||||||||||||||||||||||
Exchange of preferred stock for redeemable preferred stock (Note 13) |
6,600 | 660 | (66,000 | ) | (660 | ) | — | — | — | — | (660 | ) | — | (660 | ) | |||||||||||||||||||||
Paid-in-kind dividends |
— | 59 | — | — | — | (59 | ) | — | — | (59 | ) | — | (59 | ) | ||||||||||||||||||||||
Cash dividends paid on preferred stock |
— | — | — | — | — | (180 | ) | (11 | ) | — | (191 | ) | — | (191 | ) | |||||||||||||||||||||
Other comprehensive income |
— | — | — | — | — | — | — | 622 | 622 | — | 622 | |||||||||||||||||||||||||
| | | | | | | | | | | | | | | | | | | | | | | | | | | | | | | | | | | | | |
Balances at December 31, 2014 |
60,600 | $ | 6,119 | — | $ | — | 3,995,013 | $ | 46,119 | $ | (3,095 | ) | $ | 1,158 | $ | 44,182 | $ | (23 | ) | $ | 44,159 | |||||||||||||||
| | | | | | | | | | | | | | | | | | | | | | | | | | | | | | | | | | | | | |
| | | | | | | | | | | | | | | | | | | | | | | | | | | | | | | | | | | | | |
| | | | | | | | | | | | | | | | | | | | | | | | | | | | | | | | | | | | | |
See accompanying notes to consolidated financial statements.
F-30
CONIFER HOLDINGS, INC. AND SUBSIDIARIES
Consolidated Statements of Cash Flows
(dollars in thousands)
| |
Year Ended December 31, | |||||||||
|---|---|---|---|---|---|---|---|---|---|---|
| |
2014 | 2013 | 2012 | |||||||
Cash Flows from Operating Activities |
||||||||||
Net income (loss) |
$ | (6,939 | ) | $ | 280 | $ | 413 | |||
Adjustments to reconcile net income (loss) to net cash provided by operating activities: |
||||||||||
Gains on acquisitions |
— | (3,714 | ) | — | ||||||
Depreciation and amortization of property and equipment, and intangibles |
371 | 268 | 248 | |||||||
Amortization of bond premium and discount, net |
527 | 480 | 490 | |||||||
Gains on investments |
(417 | ) | (299 | ) | (1,273 | ) | ||||
Deferred income taxes |
(302 | ) | 4 | (31 | ) | |||||
Other |
14 | — | — | |||||||
Changes in operating assets and liabilities, net of acquisitions: |
||||||||||
Premiums and agents' balances receivable |
(2,174 | ) | (5,147 | ) | (1,239 | ) | ||||
Reinsurance recoverables |
(745 | ) | 3,584 | 4,674 | ||||||
Ceded unearned premiums |
(8,106 | ) | (1,175 | ) | 534 | |||||
Deferred policy acquisition costs |
68 | (2,981 | ) | (1,047 | ) | |||||
Other assets |
(526 | ) | 146 | (556 | ) | |||||
Unpaid losses and loss adjustment expenses |
2,623 | (1,955 | ) | (4,731 | ) | |||||
Unearned premium |
16,876 | 11,231 | 4,827 | |||||||
Reinsurance premium payable |
6,080 | 786 | (663 | ) | ||||||
Accounts payable and accrued expenses |
172 | 663 | (395 | ) | ||||||
Other liabilities |
(1,217 | ) | 371 | 11 | ||||||
| | | | | | | | | | | |
Net cash provided by operating activities |
6,305 | 2,542 | 1,262 | |||||||
| | | | | | | | | | | |
Cash Flows From Investing Activities |
||||||||||
Purchase of investments: |
||||||||||
Fixed maturity securities |
(44,632 | ) | (22,747 | ) | (13,877 | ) | ||||
Equity securities |
(1,392 | ) | (658 | ) | (938 | ) | ||||
Short-term investments |
(84,369 | ) | (44,030 | ) | (22,191 | ) | ||||
Proceeds from maturities and redemptions of investments: |
||||||||||
Fixed maturity securities |
4,892 | 175 | 1,175 | |||||||
Proceeds from sales of investments: |
||||||||||
Fixed maturity securities |
1,345 | 17,037 | 20,166 | |||||||
Equity securities |
— | 677 | 891 | |||||||
Short-term investments |
76,900 | 44,662 | 14,037 | |||||||
Cash received from acquisitions, net of cash paid |
— | 8,832 | — | |||||||
Purchases of property and equipment |
(444 | ) | (283 | ) | (54 | ) | ||||
| | | | | | | | | | | |
Net cash (used in) provided by investing activities |
(47,700 | ) | 3,665 | (791 | ) | |||||
| | | | | | | | | | | |
Cash Flows From Financing Activities |
||||||||||
Proceeds received from issuance of shares of common stock |
28,475 | — | 382 | |||||||
Issuance of shares of common stock to noncontrolling interest |
— | 50 | — | |||||||
Proceeds from issuance of shares of redeemable preferred stock |
6,060 | — | — | |||||||
Repurchase of shares of common stock |
— | — | (480 | ) | ||||||
Proceeds from issuance of note payable |
— | — | 1,000 | |||||||
Borrowings under Revolver |
11,000 | 1,350 | 500 | |||||||
Repayment of borrowings under Revolver |
(2,775 | ) | — | — | ||||||
Proceeds from term notes |
7,500 | — | — | |||||||
Principal payments under term notes |
(1,250 | ) | (250 | ) | — | |||||
Payment of debt issuance costs |
(50 | ) | — | — | ||||||
Dividends paid to preferred shareholders |
(191 | ) | — | — | ||||||
Payout of contingent consideration |
(182 | ) | — | — | ||||||
| | | | | | | | | | | |
Net cash provided by financing activities |
48,587 | 1,150 | 1,402 | |||||||
| | | | | | | | | | | |
Net increase in cash |
7,192 | 7,357 | 1,873 | |||||||
Cash at beginning of year |
11,296 | 3,939 | 2,066 | |||||||
| | | | | | | | | | | |
Cash at end of year |
$ | 18,488 | $ | 11,296 | $ | 3,939 | ||||
| | | | | | | | | | | |
| | | | | | | | | | | |
| | | | | | | | | | | |
See accompanying notes to consolidated financial statements.
F-31
CONIFER HOLDINGS, INC. AND SUBSIDIARIES
Notes to Consolidated Financial Statements
(dollars in thousands, except per share amounts)
1. Organization and Description of Business
Conifer Holdings, Inc. and its subsidiaries (collectively, the "Company") are engaged in the sale of property and casualty insurance products. The Company underwrites a variety of specialty insurance products, including property, general liability, commercial multi-peril, liquor liability, automobile, and homeowners and dwelling policies. The Company markets and sells its insurance products through a network of independent agents, including managing general agents, writing in 44 states in the United States ("U.S."). The Company's principal operations are organized into two insurance businesses: commercial lines and personal lines.
Conifer Holdings, Inc. (the "Parent"), a Michigan-based insurance holding company formed in October 2009, operates through its three insurance companies consisting of Conifer Insurance Company, White Pine Insurance Company and American Colonial Insurance Company. In 2012, the Parent created Sycamore Insurance Agency, Inc. ("Sycamore"), an insurance agency, to facilitate our insurance companies access to brokers that write on a surplus line basis. Additionally, Sycamore has a 50% ownership interest, through Venture Agency Holdings, Inc. ("Venture Holdings"), in a small wholesale agency that was acquired in May 2013, which writes commercial liability policies for customers in the alarm and security industry. All of the insurance companies write business on admitted and excess and surplus lines basis.
In October 2011, the Parent formed a captive insurance entity, Red Cedar Insurance Company ("Red Cedar"), under the captive insurance laws of the District of Columbia, to engage in reinsurance transactions exclusively for its insurance companies. The Company's ability to maintain this mezzanine layer of reinsurance through Red Cedar helps us maintain capital in our operating entities by shifting some of our retained per policy risk to the captive insurance entity in exchange for a portion of the applicable premium. The mezzanine layer represents a middle reinsurance layer above the underlying operating subsidiary retention and below the reinsurers' participation. The operations of Red Cedar have been eliminated in the consolidated financial statements.
2. Summary of Significant Accounting Policies
Basis of Presentation
The consolidated financial statements have been prepared in accordance with U.S. generally accepted accounting principles ("U.S. GAAP"), which vary in some respects from statutory accounting practices ("SAP") which are prescribed or permitted by the various state insurance regulatory authorities in the U.S.
Stock Split
On July 22, 2015, the board of directors approved a stock split in the form of a stock dividend of 10.2 shares for each share of common stock to be effectuated immediately prior to the effectiveness of the initial public offering contemplated in this prospectus. All common stock share and per share amounts for all periods presented in these consolidated financial statements have been adjusted retroactively to reflect the stock split.
Principles of Consolidation
The consolidated financial statements include the accounts of Conifer Holdings, Inc. and its wholly-owned subsidiaries, and a 50%-owned entity, that was formed in May 2013, that the Company
F-32
CONIFER HOLDINGS, INC. AND SUBSIDIARIES
Notes to Consolidated Financial Statements (Continued)
(dollars in thousands, except per share amounts)
2. Summary of Significant Accounting Policies (Continued)
controls due to its majority representation on the entity's Board. Refer to Note 12. All intercompany transactions and accounts have been eliminated.
Noncontrolling interest in a consolidated subsidiary in the consolidated balance sheets represents the noncontrolling shareholder's proportionate share of the 50%-owned entity's equity, Venture Holdings. Consolidated net income or loss is allocated to the Company and noncontrolling interest in proportion to their percentage ownership interest.
Use of Estimates
The preparation of financial statements in conformity with U.S. GAAP requires management to make estimates and assumptions that affect the reported amounts of assets and liabilities and disclosure of contingent assets and liabilities at the date of the financial statements and the reported amounts of revenues and expenses during the reporting period. Due to the inherent uncertainty involved in making estimates, actual results reported in future periods may be based upon amounts that differ from these estimates.
Cash and Short-term Investments
Cash consists of cash deposits in banks, generally in operating accounts. Short-term investments, consisting of money-market funds, are classified as investments in the consolidated balance sheets as they relate principally to the Company's investment activities. The Company maintains its cash deposits in major banks and invests short-term funds in institutional money-market funds and short-term financial instruments. These securities typically mature within three months or less.
At December 31, 2014 and 2013, the Company held restricted short-term investments of $169 that represented funds of unaffiliated parties for the payment of claims. These funds are included in the Company's investment portfolio. The Company retains the interest earned on these funds.
Investment Securities
Investment securities, consisting of fixed maturity securities and equity securities, are classified as available for sale and reported at fair value. The Company determines the fair value using the market approach, which uses quoted prices or other relevant data based on market transactions involving identical or comparable assets. The Company purchases the available for sale fixed maturity securities with the expectation that they will be held to maturity, but the Company may sell them if market conditions or credit-related risk warrant earlier sales. The Company does not have any securities classified as held to maturity or trading.
The change in unrealized gain and loss on the investment securities is recorded as a component of accumulated other comprehensive income (loss), net of the related deferred tax effect, within consolidated shareholders' equity, until realized.
The fixed maturity securities portfolio includes mortgage-backed and asset-backed securities. The Company recognizes income from these securities using a constant effective yield based on anticipated prepayments and the estimated economic life of the securities. When actual prepayments differ significantly from anticipated prepayments, the estimated economic life is recalculated and the remaining unamortized premium or discount is amortized prospectively over the remaining economic
F-33
CONIFER HOLDINGS, INC. AND SUBSIDIARIES
Notes to Consolidated Financial Statements (Continued)
(dollars in thousands, except per share amounts)
2. Summary of Significant Accounting Policies (Continued)
life. Premiums and discounts on mortgage-backed and asset-backed securities are amortized or accreted over the life of the related available-for-sale security as an adjustment to yield using the effective interest method. Such amortization and accretion is included in interest income in the consolidated statements of operations. Dividend and interest income are recognized when earned.
Realized gains and losses from the sale of available-for-sale securities are determined on a specific-identification basis and included in earnings on the trade date.
Other-than-temporary Impairments
The Company reviews its impaired securities for possible other-than-temporary impairment at each quarter-end. A security has an impairment loss when its fair value is less than its cost or amortized cost at the balance sheet date. The Company considers the following factors in performing its review: (i) the amount by which the security's fair value is less than its cost, (ii) length of time the security has been impaired, (iii) whether management has the intent to sell the security, (iv) if it is more likely than not that management will be required to sell the security before recovery of its amortized cost basis, (v) whether the impairment is due to an issuer-specific event, credit issues or change in market interest rates, (vi) the security's credit rating and any recent downgrades and (vii) stress testing of expected cash flows under different scenarios. If the Company determines that a security has experienced an other-than-temporary loss, the impairment is recognized as a realized investment loss in the consolidated statements of operations.
For each impaired security, the Company determines if: (i) it does not intend to sell the security and (ii) it will more likely than not be required to sell the security before recovery of its amortized cost basis. If the Company cannot assert these conditions, an other-than-temporary impairment loss is recorded through the consolidated statements of operations in the current period. For all other impaired securities, except equity securities, the Company will assess whether the net present value of the cash flows expected to be collected from the security is less than its amortized cost basis. Such a shortfall in cash flows is referred to as a "credit loss." For any such security, the Company separates the impairment loss into: 1) the credit loss and 2) the non-credit loss, which is the amount related to all other factors such as interest rate changes, fluctuations in exchange rates and market conditions. The credit loss charge is recorded to the current period statements of operations and the non-credit loss is recorded to accumulated other comprehensive income (loss), within shareholders' equity, on an after-tax basis. A security's cost basis is permanently reduced by the amount of a credit loss. Income is accreted over the remaining life of a fixed maturity security based on the interest rate necessary to discount the expected future cash flows to the new basis. If the security is non-income producing, any cash proceeds is applied as a reduction of principal when received.
For equity securities, if the impairment is deemed an other-than-temporary impairment, the loss is recognized in the statements of operations.
Recognition of Premium Revenues
Substantially all of the property and casualty policies written by the insurance companies are considered short-term duration contracts. These policies are earned on a daily pro-rata basis, net of reinsurance, over the term of the policy, which are six or twelve months in duration. The portion of premiums written that relate to the unexpired terms of policies in force are deferred and reported as
F-34
CONIFER HOLDINGS, INC. AND SUBSIDIARIES
Notes to Consolidated Financial Statements (Continued)
(dollars in thousands, except per share amounts)
2. Summary of Significant Accounting Policies (Continued)
unearned premium at the balance sheet date. Premiums on reinsured business are accounted for on a basis consistent with that used in accounting for the original policies issued and terms of the reinsurance contracts.
Premiums and Agents' Balances Receivable, net
Premiums and agents' balances receivable represent amounts due from policyholders directly or indirectly through agents for premiums written and uncollected, net of allowance for doubtful accounts. The allowance for doubtful accounts represents an estimate of amounts considered uncollectible based on the Company's assessment of the collectability of receivables that are past due. The Company generally cancels insurance coverage if the premium is unpaid. Management provides an allowance for those accounts older than 90 days and specific individual accounts. All other accounts are reviewed on a pooled basis. Account balances are charged-off against the allowance after all means of collection have been exhausted and the potential for recovery is considered remote.
Reinsurance
Certain premiums and losses are ceded to other insurance companies under various excess of loss and quota-share reinsurance contracts. The Company enters into these reinsurance contracts to protect it against the impact of large losses, to limit exposure on new lines of insurance written by the Company and to provide additional capacity for growth. Such reinsurance reduces the magnitude of such losses on net income of the Company. Reinsurance makes the assuming reinsurer liable to the ceding company to the extent of the reinsurance. It does not, however, discharge the ceding company from its primary liability to its policyholders in the event the reinsurer is unable to meet its obligations under such reinsurance agreement. The Company monitors the financial condition of its reinsurers and does not believe that it is currently exposed to any material credit risk through its ceded reinsurance arrangements.
Reinsurance premiums, commissions, losses and loss adjustment expenses on reinsured business are accounted for on a basis consistent with that used in accounting for the original policies issued and the terms of the reinsurance contracts. The amounts reported as reinsurance recoverables include amounts billed to reinsurers on losses and loss adjustment expenses paid as well as estimates of amounts expected to be recovered from reinsurers on insurance liabilities that have not yet been paid. Reinsurance recoverables on unpaid losses and loss adjustment expenses are estimated based upon assumptions consistent with those used in establishing those gross liabilities as they applied to the underlying reinsured contracts. The Company records an allowance for uncollectible reinsurance recoverables based on an assessment of the reinsurer's creditworthiness and collectability of the recorded amounts. Management believes an allowance for uncollectible recoverable from its reinsurers was not considered necessary for the periods presented.
The Company receives ceding commissions in connection with certain ceded reinsurance. The ceding commissions are recorded as a reduction of other underwriting and operating expenses.
Deferred Policy Acquisition Costs
Costs incurred which are incremental and directly related to the successful acquisition of new or renewal insurance business is deferred. These deferred costs consist of commissions paid to agents,
F-35
CONIFER HOLDINGS, INC. AND SUBSIDIARIES
Notes to Consolidated Financial Statements (Continued)
(dollars in thousands, except per share amounts)
2. Summary of Significant Accounting Policies (Continued)
premium taxes, and underwriting costs, including compensation and payroll related benefits. Proceeds from reinsurance transactions that represent recovery of acquisition costs reduce applicable unamortized acquisition costs in such a manner that net acquisition costs are capitalized and charged to expense. Amortization of such policy acquisition costs is charged to expense in proportion to premium earned over the estimated policy term.
To the extent that unearned premiums on existing policies are not adequate to cover the sum of expected losses and loss adjustment expenses, unamortized acquisition costs and policy maintenance costs, unamortized deferred policy acquisition costs are charged to expense to the extent required to eliminate the premium deficiency. If the premium deficiency were greater than the unamortized policy acquisition costs, a liability is recorded for any such deficiency. The Company considers anticipated investment income in determining whether a premium deficiency exists. Management performs this evaluation at the insurance product line level.
Long-Lived Assets
Long-lived assets, such as property and equipment, and definite-lived intangible assets, are reviewed for impairment whenever events or changes in circumstances indicate that the carrying amount of an asset may not be recoverable. If circumstances require long-lived assets or asset groups to be tested for possible impairment, the Company compares the undiscounted cash flows expected to be generated by that asset or asset group to its carrying amount. If the carrying amount of the long-lived asset or asset group is not recoverable on an undiscounted cash flow basis, an impairment charge is recognized to the extent that the carrying amount exceeds its fair value. Fair value is determined through various valuation techniques, such as discounted cash flow models, and with the assistance of third-party independent appraisals.
Definite-lived intangible assets, consisting of customer lists, are amortized on a straight-line basis over their estimated useful lives.
Goodwill and Indefinite-lived Intangibles
Goodwill represents the excess acquisition cost of an acquired entity over the estimated fair values of the net tangible assets and the identifiable intangible assets acquired. When a business acquisition is completed, the Company records the business combination using the acquisition method of accounting. All identifiable assets and liabilities are valued at fair value and any remaining consideration is allocated to goodwill in performing the purchase price allocation. Goodwill is assigned to applicable reporting units, based on the reporting unit's share of the estimated future cash flows of all acquired insurance products.
Goodwill and indefinite-lived intangibles, consisting of state insurance licenses, are not amortized, but rather are reviewed for impairment annually or more frequently if facts or circumstances indicate that the carrying value may not be recoverable.
The Company assigns goodwill to its reporting units for the purpose of performing the goodwill impairment test. The quantitative goodwill impairment test requires the comparison of the fair value of the Company's reporting unit to its related carrying value. If the fair value of the reporting unit is less than its carrying amount, an indication of goodwill impairment exists and the Company must perform step two of the impairment test. Under step two, an impairment loss is recognized for any excess of the
F-36
CONIFER HOLDINGS, INC. AND SUBSIDIARIES
Notes to Consolidated Financial Statements (Continued)
(dollars in thousands, except per share amounts)
2. Summary of Significant Accounting Policies (Continued)
carrying amount of the reporting unit's goodwill over the implied fair value of that goodwill. The implied fair value of goodwill is determined by allocating the fair value of the reporting unit in a manner similar to a purchase price allocation and the residual fair value after this allocation is the implied fair value of the reporting unit goodwill. Fair value of the reporting unit is determined using a discounted cash flow analysis. If the fair value of the reporting unit exceeds its carrying amount, step two does not need to be performed.
The Company performs its annual impairment review of goodwill and indefinite-lived intangibles as of October 1 and when a triggering event occurs between annual impairment tests.
Property and Equipment
Property and equipment, which is included in other assets in the consolidated balance sheets, are stated at cost less accumulated depreciation. Depreciation on property and equipment is computed using the straight-line method over the estimated useful lives of the assets; generally three to ten years. The cost of leasehold improvements is amortized over the life of the improvement or the lease term, whichever is shorter. Upon disposition of property and equipment, the cost of the asset and related accumulated depreciation are removed from the accounts, and the resulting gain or loss is included in the statements of operations. Expenditures for repairs and maintenance are charged to expense as incurred. Depreciation and amortization expense was $297, $245 and $248 for the years ended December 31, 2014, 2013 and 2012, respectively.
Unpaid Losses and Loss Adjustment Expenses
The liability for unpaid losses and loss adjustment expenses in the consolidated balance sheets represents the Company's estimate of the amount it expects to pay for the ultimate cost of reported and unreported claims at the end of the reporting period. The liability is recorded on an undiscounted basis, except for the liability for unpaid losses and loss adjustment expenses assumed related to acquired companies which are initially recorded at fair value. The process of estimating the liability for unpaid losses and loss adjustment expenses is a complex process that requires a high degree of judgment.
The liability for unpaid losses and loss adjustment expenses represent the accumulation of individual case estimates for reported losses and loss adjustment expenses, and actuarial determined estimates for incurred but not reported losses and loss adjustment expenses. The liability for unpaid losses and loss adjustment expenses are intended to include the ultimate net cost of all losses and loss adjustment expenses incurred but unpaid as of the balance sheet date. The liability is stated net of anticipated deductibles, salvage and subrogation, and gross of reinsurance ceded. Reinsurance recoverables of paid and unpaid losses and loss adjustment expenses are reflected as assets. The estimate of the unpaid losses and loss adjustment expenses liability are continually reviewed and updated. Although management believes the liability for losses and loss adjustment expenses is reasonable, the ultimate liability may be more or less than the current estimate.
The estimation of ultimate liability for unpaid losses and loss adjustment expenses is a complex, imprecise and inherently uncertain process, and therefore involves a considerable degree of judgment and expertise. The Company utilizes various actuarially-accepted reserving methodologies in deriving the continuum of expected outcomes and ultimately determining its estimated liability amount. These
F-37
CONIFER HOLDINGS, INC. AND SUBSIDIARIES
Notes to Consolidated Financial Statements (Continued)
(dollars in thousands, except per share amounts)
2. Summary of Significant Accounting Policies (Continued)
methodologies utilize various inputs, including but not limited to written and earned premiums, paid and reported losses and loss adjustment expenses, expected initial loss and loss adjustment expenses ratio, which is the ratio of incurred losses and loss adjustment expenses to earned premiums, and expected claim reporting and payout patterns (company specific and industry data) . The liability for unpaid loss and loss adjustment expenses does not represent an exact measurement of liability, but are estimates that are not directly or precisely quantifiable, particularly on a prospective basis, and are subject to a significant degree of variability over time. In addition, the establishment of the liability for unpaid losses and loss adjustment expenses makes no provision for the broadening of coverage by legislative action or judicial interpretation or for the extraordinary future emergence of new types of losses not sufficiently represented in the Company's historical experience or which cannot yet be quantified. As a result, an integral component of estimating the liability for unpaid losses and loss adjustment expenses is the use of informed subjective estimates and judgments about the ultimate exposure to unpaid losses and loss adjustment expenses. The effects of changes in the estimated liability are included in the results of operations in the period in which the estimates are revised.
The Company allocates the applicable portion of the unpaid losses and loss adjustment expenses to amounts recoverable from reinsurers under ceded reinsurance contracts and reports those amounts separately as an asset on the consolidated balance sheets.
Income Taxes
Income taxes are accounted for under the asset and liability method. Deferred tax assets and liabilities are recognized for the future tax consequences attributable to differences between the financial statement carrying amounts of existing assets and liabilities and their respective tax bases and operating loss and tax credit carryforwards. Deferred tax assets and liabilities are measured using enacted tax rates expected to apply to taxable income in the years in which those temporary differences are expected to be recovered or settled. The effect on deferred tax assets and liabilities of a change in tax rates is recognized in income in the period that includes the enactment date.
Deferred tax assets are recognized to the extent that there is sufficient positive evidence, as allowed under ASC 740 Income Taxes, to support the recoverability of those deferred tax assets. The Company establishes a valuation allowance to the extent that there is insufficient evidence to support the recoverability of the deferred tax asset under ASC 740. In making such a determination, management considers all available positive and negative evidence, including future reversals of existing taxable temporary differences, projected future taxable income, tax-planning strategies, and results of recent operations. If it is determined that the deferred tax assets would be realizable in the future in excess of their net recorded amount, an adjustment would be made to the deferred tax asset valuation allowance, which would reduce the provision for income taxes.
The Company records interest and penalties related to tax uncertainties as income tax expense. Accrued interest and penalties are included on the related tax liability line in the consolidated balance sheet. Based on management's evaluation, the Company concluded there were no significant uncertain tax positions requiring recognition in its consolidated financial statements.
F-38
CONIFER HOLDINGS, INC. AND SUBSIDIARIES
Notes to Consolidated Financial Statements (Continued)
(dollars in thousands, except per share amounts)
2. Summary of Significant Accounting Policies (Continued)
Other Income
Other income consists primarily of fees charged by the insurance companies for installment payments made by the policyholders. Commission income is received by the Company's insurance agency for writing policies for third party insurance companies. The Company recognizes commission income on the later of the effective date of the policy, the date when the premium can be reasonably established, or the date when substantially all services related to the insurance placement have been rendered.
Operating Expenses
Operating expenses consist primarily of other underwriting, compensation and benefits, information technology, facility and other expenses.
Recently Issued Accounting Guidance
In August 2014, the FASB issued ASU No. 2014-15, "Presentation of Financial Statements—Going Concern (Subtopic 205-40)," which requires management to evaluate, at each annual and interim reporting period, whether there is substantial doubt about the Company's ability to continue as a going concern within one year after the date the financial statements are issued and provide related footnote disclosures. The standard is effective for the annual period ending after December 15, 2016 and for the annual and interim periods thereafter. Early adoption is permitted. This standard is not expected to have a material impact on the Company's financial statements.
In April 2014, the FASB issued ASU No. 2014-08, Reporting Discontinued Operations and Disclosures of Disposals of Components of an Entity, to reduce diversity in practice for reporting discontinued operations. Previous guidance allowed any component of an entity that was a reportable segment, an operating segment, a reporting unit, a subsidiary, or an asset group to be eligible for discontinued operations presentation. The revised guidance only allows disposals of components of an entity that represent a strategic shift (e.g., disposal of a major geographical area, a major line of business, a major equity method investment, or other major parts of an entity) and that have a major effect on a reporting entity's operations and financial results to be reported as discontinued operations. The revised guidance also requires expanded disclosures in the financial statements. The new guidance is effective for transactions that occur within annual periods beginning on or after December 15, 2014. Early adoption is permitted, but only for disposals that have not been reported in financial statements previously issued or available for issuance. The guidance will be applied to future dispositions or disposals, as applicable.
3. Acquisitions
EGI Insurance Services, Inc.
In November 2013, the Company acquired all the outstanding common shares of EGI Insurance Services, Inc. ("EGI Services") for $4 million in cash. EGI Services was the parent of two wholly-owned corporations, American Colonial Insurance Company (formerly known as Echelon Insurance Company of America) and EGI Insurance Services (Florida) Inc. American Colonial Insurance Company is a property and casualty insurance company licensed in the State of Florida primarily focused on nonstandard automobile insurance in the Southeastern U.S. EGI Florida provides agency services primarily focused on administrating the issuance of nonstandard automobile insurance and
F-39
CONIFER HOLDINGS, INC. AND SUBSIDIARIES
Notes to Consolidated Financial Statements (Continued)
(dollars in thousands, except per share amounts)
3. Acquisitions (Continued)
claims handling. The purpose of this acquisition was to expand the Company's insurance offerings in the State of Florida.
The Company measured the identifiable tangible and intangible assets acquired and the liabilities assumed at their acquisition-date fair values. The acquisition-date fair values of identifiable net assets exceeded the fair value of the consideration transferred and therefore, the transaction was considered a bargain purchase. A gain of $2.7 million was recognized at the acquisition date and is included in the statement of operations for the year ended December 31, 2013. The transaction resulted in a bargain purchase primarily because the acquired business was experiencing significant losses and the seller's intent was to exit writing private passenger automobile policies. The Company purchased the business with the intent to obtain its insurance licenses and expand its insurance coverage portfolio in this market. The following table summarizes the consideration transferred and the recognized amounts of identifiable assets acquired and liabilities assumed at the acquisition date:
Fair value of consideration transferred:
Cash |
$ | 4,000 |
Recognized amount of identifiable assets acquired and liabilities assumed, at fair value:
Cash and cash equivalents |
$ | 3,428 | ||
Investment securities |
8,710 | |||
Premium receivables |
2,311 | |||
Prepaid expenses and other current assets |
196 | |||
Intangible assets |
400 | |||
Losses and loss adjustment expenses |
(4,829 | ) | ||
Unearned premiums |
(3,150 | ) | ||
Deferred tax liabilities |
(136 | ) | ||
Current liabilities |
(198 | ) | ||
| | | | | |
Total identifiable net assets |
6,732 | |||
| | | | | |
Gain on bargain purchase |
$ | 2,732 | ||
| | | | | |
| | | | | |
| | | | | |
The Company recorded intangible assets, consisting of the fair value of four state insurance licenses, for the states of Alabama, Louisiana, Georgia and Florida, which were acquired in the transaction.
For the year ended December 31, 2013, the Company incurred acquisition related costs, consisting of legal, accounting and valuation fees of $193. These expenses are included in operating expenses.
MLBA Mutual Insurance Company
In January 2013, the Company acquired all the outstanding common shares of MLBA Mutual Insurance Company ("MLBA") for $7.5 million in cash. MLBA was a Michigan domiciled property and casualty insurance company. The purpose of this acquisition was to expand the Company's insurance offerings to customers in the liquor liability market.
The Company measured the identifiable tangible and intangible assets acquired and the liabilities assumed at their acquisition-date fair values. The acquisition-date fair values of identifiable net assets exceeded the fair value of the consideration transferred and therefore, the transaction was considered a
F-40
CONIFER HOLDINGS, INC. AND SUBSIDIARIES
Notes to Consolidated Financial Statements (Continued)
(dollars in thousands, except per share amounts)
3. Acquisitions (Continued)
bargain purchase. A gain of $982 was recognized at the acquisition date and is included in the statement of operations for the year ended December 31, 2013. The transaction resulted in a bargain purchase primarily because the MLBA was a mutual insurer with limited prospects for the members to realize a liquidity event. The following table summarizes the consideration transferred and the recognized amounts of identifiable assets acquired and liabilities assumed at the acquisition date:
Fair value of consideration transferred:
Cash |
$ | 7,500 |
Recognized amount of identifiable assets acquired and liabilities assumed, at fair value:
Cash and cash equivalents |
$ | 9,373 | ||
Investment securities |
524 | |||
Premium receivables |
92 | |||
Prepaid expenses and other current assets |
160 | |||
Intangible assets, customer list |
100 | |||
Reserve for losses and loss adjustment expenses |
(1,192 | ) | ||
Unearned premiums |
(218 | ) | ||
Deferred tax liabilities |
(342 | ) | ||
Current liabilities |
(15 | ) | ||
| | | | | |
Total identifiable net assets |
8,482 | |||
| | | | | |
Gain on bargain purchase |
$ | 982 | ||
| | | | | |
| | | | | |
| | | | | |
The Company's acquisition related costs were not significant.
Main Street Systems, Inc.
On May 30, 2013, Venture Holdings, an entity owned 50% by the Company, acquired all of the outstanding common stock of Main Street Systems, Inc. ("Main Street") for $450, with the provision for up to $225 additional consideration contingent upon achieving certain client-retention metrics to be paid over a two year period. The Company used the acquisition method to record the transaction, which resulted in goodwill of $619. The acquisition date fair value of the contingent consideration of $212 was estimated using the income approach. This measure is based on Level 3 inputs not observable in the market. During 2014, the Company was required to pay the sellers additional consideration of $112. Main Street is an agency that has the ability to write excess and surplus lines in the commercial liability market. Main Street's net tangible assets were not significant.
Asset Purchase from Independent Insurance Agency
In November 2013, Main Street entered into an asset purchase agreement with an agency to purchase its client list, including solicitation rights, for $145 with the provision for up to $130 additional consideration contingent upon achieving certain client-retention metrics over a two year period. The fair value of the contingent consideration of $123 was estimated using the income approach. This measure is based on Level 3 inputs not observable in the market. During 2014, the Company was required to pay the sellers additional consideration of $70. The agency offered insurance products and services to customers in the alarm and security industry. The transaction was recorded as an asset
F-41
CONIFER HOLDINGS, INC. AND SUBSIDIARIES
Notes to Consolidated Financial Statements (Continued)
(dollars in thousands, except per share amounts)
3. Acquisitions (Continued)
purchase. Such intangible asset, consisting of a customer list, is amortized over its estimated useful life of five years.
Proforma Operating Results
The following pro forma summary presents consolidated information as if the acquisitions had occurred on January 1, 2012. The unaudited pro forma results reflect certain adjustments related to the acquisitions, such as amortization of intangible assets acquired and adjustments to reflect the elimination of investment income on cash used to fund the purchase price and the tax impact of such adjustments. Also, the 2012 period includes nonrecurring pro forma adjustments for the gains on a bargain purchase of $3.7 million and related costs incurred for acquisition costs of $193 as if the acquisitions occurred as of January 1, 2012. Accordingly, such pro forma operating results were prepared for comparative purposes only and do not purport to be indicative of what would have occurred had the acquisitions been made as of January 1, 2012 or of results that may occur in the future.
| |
2013 | 2012 | |||||
|---|---|---|---|---|---|---|---|
Net earned premiums |
$ | 34,424 | $ | 21,887 | |||
| | | | | | | | |
| | | | | | | | |
| | | | | | | | |
Net income (loss) |
$ | (5,097 | ) | $ | 1,370 | ||
| | | | | | | | |
| | | | | | | | |
| | | | | | | | |
Income (loss) per common share—basic and diluted |
$ | (2.91 | ) | $ | 0.79 | ||
| | | | | | | | |
| | | | | | | | |
| | | | | | | | |
4. Investments
The cost or amortized cost, gross unrealized gain or loss, and fair value of the fixed maturity and equity securities, by major security type, that are classified as available for sale, were as follows:
| |
December 31, 2014 | ||||||||||||
|---|---|---|---|---|---|---|---|---|---|---|---|---|---|
| |
|
Gross Unrealized | |
||||||||||
| |
Cost or Amortized Cost |
Fair Value |
|||||||||||
| |
Gain | Loss | |||||||||||
Fixed maturity securities: |
|||||||||||||
U.S. Government obligations |
$ | 5,872 | $ | 85 | $ | (16 | ) | $ | 5,941 | ||||
State and local government |
10,755 | 210 | (4 | ) | 10,961 | ||||||||
Corporate debt |
30,818 | 237 | (106 | ) | 30,949 | ||||||||
Commercial mortgage and asset-backed |
36,323 | 348 | (117 | ) | 36,554 | ||||||||
| | | | | | | | | | | | | | |
Total fixed maturity securities |
83,768 | 880 | (243 | ) | 84,405 | ||||||||
Equity securities, common stock |
2,965 | 1,158 | (39 | ) | 4,084 | ||||||||
| | | | | | | | | | | | | | |
Total |
$ | 86,733 | $ | 2,038 | $ | (282 | ) | $ | 88,489 | ||||
| | | | | | | | | | | | | | |
| | | | | | | | | | | | | | |
| | | | | | | | | | | | | | |
F-42
CONIFER HOLDINGS, INC. AND SUBSIDIARIES
Notes to Consolidated Financial Statements (Continued)
(dollars in thousands, except per share amounts)
4. Investments (Continued)
| |
December 31, 2013 | ||||||||||||
|---|---|---|---|---|---|---|---|---|---|---|---|---|---|
| |
|
Gross Unrealized | |
||||||||||
| |
Cost or Amortized Cost |
Fair Value |
|||||||||||
| |
Gain | Loss | |||||||||||
Fixed maturity securities: |
|||||||||||||
U.S. Government obligations |
$ | 3,345 | $ | 92 | $ | (30 | ) | $ | 3,407 | ||||
State and local government |
9,585 | 7 | (357 | ) | 9,235 | ||||||||
Corporate debt |
10,611 | 204 | (79 | ) | 10,736 | ||||||||
Commercial mortgage and asset-backed |
20,995 | 230 | (448 | ) | 20,777 | ||||||||
| | | | | | | | | | | | | | |
Total fixed maturity securities |
44,536 | 533 | (914 | ) | 44,155 | ||||||||
Equity securities, common stock |
2,520 | 1,198 | (6 | ) | 3,712 | ||||||||
| | | | | | | | | | | | | | |
Total |
$ | 47,056 | $ | 1,731 | $ | (920 | ) | $ | 47,867 | ||||
| | | | | | | | | | | | | | |
| | | | | | | | | | | | | | |
| | | | | | | | | | | | | | |
The following table summarizes fair value and gross unrealized losses for all available-for-sale securities, aggregated by investment category, and the length of time that individual securities have been in a continuous unrealized loss position, as follows:
| |
December 31, 2014 | ||||||||||||||||||
|---|---|---|---|---|---|---|---|---|---|---|---|---|---|---|---|---|---|---|---|
| |
Less than 12 Months | Greater than 12 Months | Total | ||||||||||||||||
| |
Fair Value |
Unrealized Losses |
Fair Value |
Unrealized Losses |
Fair Value |
Unrealized Losses |
|||||||||||||
Fixed maturity securities: |
|||||||||||||||||||
U.S. Government obligations |
$ | — | $ | — | $ | 1,319 | $ | (16 | ) | $ | 1,319 | $ | (16 | ) | |||||
State and local government |
552 | (1 | ) | 825 | (3 | ) | 1,377 | (4 | ) | ||||||||||
Corporate debt |
18,835 | (98 | ) | 489 | (8 | ) | 19,324 | (106 | ) | ||||||||||
Commercial mortgage and asset-backed |
12,060 | (34 | ) | 4,999 | (83 | ) | 17,059 | (117 | ) | ||||||||||
| | | | | | | | | | | | | | | | | | | | |
Total fixed maturity securities |
31,447 | (133 | ) | 7,632 | (110 | ) | 39,079 | (243 | ) | ||||||||||
Equity securities, common stocks |
347 | (39 | ) | — | — | 347 | (39 | ) | |||||||||||
| | | | | | | | | | | | | | | | | | | | |
Total |
$ | 31,794 | $ | (172 | ) | $ | 7,632 | $ | (110 | ) | $ | 39,426 | $ | (282 | ) | ||||
| | | | | | | | | | | | | | | | | | | | |
| | | | | | | | | | | | | | | | | | | | |
| | | | | | | | | | | | | | | | | | | | |
F-43
CONIFER HOLDINGS, INC. AND SUBSIDIARIES
Notes to Consolidated Financial Statements (Continued)
(dollars in thousands, except per share amounts)
4. Investments (Continued)
| |
December 31, 2013 | ||||||||||||||||||
|---|---|---|---|---|---|---|---|---|---|---|---|---|---|---|---|---|---|---|---|
| |
Less than 12 Months | Greater than 12 Months | Total | ||||||||||||||||
| |
Fair Value |
Unrealized Losses |
Fair Value |
Unrealized Losses |
Fair Value |
Unrealized Losses |
|||||||||||||
Fixed maturity securities: |
|||||||||||||||||||
U.S. Government obligations |
$ | 1,304 | $ | (30 | ) | $ | — | $ | — | $ | 1,304 | $ | (30 | ) | |||||
State and local government |
7,473 | (325 | ) | 67 | (32 | ) | 7,540 | (357 | ) | ||||||||||
Corporate debt |
4,377 | (75 | ) | 42 | (4 | ) | 4,419 | (79 | ) | ||||||||||
Commercial mortgage and asset-backed |
11,188 | (436 | ) | 216 | (12 | ) | 11,404 | (448 | ) | ||||||||||
| | | | | | | | | | | | | | | | | | | | |
Total fixed maturity securities |
24,342 | (866 | ) | 325 | (48 | ) | 24,667 | (914 | ) | ||||||||||
Equity securities, common stocks |
112 | (6 | ) | — | — | 112 | (6 | ) | |||||||||||
| | | | | | | | | | | | | | | | | | | | |
Total |
$ | 24,454 | $ | (872 | ) | $ | 325 | $ | (48 | ) | $ | 24,779 | $ | (920 | ) | ||||
| | | | | | | | | | | | | | | | | | | | |
| | | | | | | | | | | | | | | | | | | | |
| | | | | | | | | | | | | | | | | | | | |
Substantially all of the Company's fixed maturity securities are of investment grade with the average credit quality of AA. The duration of the fixed maturity securities are short in duration; approximately 3.1 years. The unrealized loss position is attributable to minor fluctuations in the interest rate environment. The Company does not consider the $282 of gross unrealized losses in the portfolio at December 31, 2014 to be other-than-temporary impairments because (i) as of that date, all contractual interest and principal payments on the fixed maturity securities has been received, (ii) no intent to sell the securities, (iii) it is more likely than not that the Company will not be required to sell the securities before recovery of their amortized cost or cost bases and (iv) the unrealized loss relates to non-credit factors, such as interest rate changes and fluctuations due to market conditions. The Company did not recognize any other-than-temporary impairment losses during the periods presented.
The sources of net investment income is as follows:
| |
Year Ended December 31, | |||||||||
|---|---|---|---|---|---|---|---|---|---|---|
| |
2014 | 2013 | 2012 | |||||||
Fixed maturity securities |
$ | 1,289 | $ | 1,098 | $ | 1,210 | ||||
Equity securities |
78 | 68 | 69 | |||||||
Cash, cash equivalents, and short-term investments |
9 | 9 | 5 | |||||||
| | | | | | | | | | | |
Total investment income |
1,376 | 1,175 | 1,284 | |||||||
Investment expenses |
(201 | ) | (175 | ) | (212 | ) | ||||
| | | | | | | | | | | |
Net investment income |
$ | 1,175 | $ | 1,000 | $ | 1,072 | ||||
| | | | | | | | | | | |
| | | | | | | | | | | |
| | | | | | | | | | | |
F-44
CONIFER HOLDINGS, INC. AND SUBSIDIARIES
Notes to Consolidated Financial Statements (Continued)
(dollars in thousands, except per share amounts)
4. Investments (Continued)
The table summarizes the gross realized gains and losses from sales or maturities of available-for-sale fixed maturity and equity securities, as follows:
| |
Year Ended December 31, | |||||||||
|---|---|---|---|---|---|---|---|---|---|---|
| |
2014 | 2013 | 2012 | |||||||
Fixed maturity securities: |
||||||||||
Gross realized gains |
$ | 47 | $ | 278 | $ | 1,185 | ||||
Gross realized losses |
(29 | ) | (146 | ) | (17 | ) | ||||
| | | | | | | | | | | |
|
18 | 132 | 1,168 | |||||||
| | | | | | | | | | | |
Equity securities: |
||||||||||
Gross realized gains |
449 | 177 | 150 | |||||||
Gross realized losses |
(50 | ) | (10 | ) | (45 | ) | ||||
| | | | | | | | | | | |
|
399 | 167 | 105 | |||||||
| | | | | | | | | | | |
Net realized investment gain |
$ | 417 | $ | 299 | $ | 1,273 | ||||
| | | | | | | | | | | |
| | | | | | | | | | | |
| | | | | | | | | | | |
The table summarizes the fair value and amortized cost of available-for-sale fixed maturity securities by contractual maturity at December 31, 2014, as follows:
| |
Amortized Cost |
Fair Value |
|||||
|---|---|---|---|---|---|---|---|
Due in one year or less |
$ | 1,509 | $ | 1,509 | |||
Due after one year through five years |
31,432 | 31,568 | |||||
Due after five years through ten years |
7,242 | 7,374 | |||||
Due after ten years |
7,262 | 7,400 | |||||
| | | | | | | | |
Securities with contractual maturities |
47,445 | 47,851 | |||||
Commercial mortgage and asset-backed |
36,323 | 36,554 | |||||
| | | | | | | | |
Total fixed maturity securities |
$ | 83,768 | $ | 84,405 | |||
| | | | | | | | |
| | | | | | | | |
| | | | | | | | |
Actual maturities may differ from contractual maturities because certain borrowers have the right to call or prepay obligations with or without call or prepayment penalties.
At December 31, 2014 and 2013, the insurance companies had deposited fixed maturity securities, common stock, and short-term investments of approximately $7.0 million and $6.6 million, respectively, to meet the deposit requirements of various state insurance departments. There are withdrawals and other restrictions on these deposits, but the Company can direct how the deposits are invested and earn interest on the funds.
F-45
CONIFER HOLDINGS, INC. AND SUBSIDIARIES
Notes to Consolidated Financial Statements (Continued)
(dollars in thousands, except per share amounts)
5. Fair Value Measurements
The Company's financial instruments include assets and liabilities carried at fair value, as well as assets and liabilities carried at cost or amortized cost but disclosed at fair value in these consolidated financial statements. Fair value is defined as the price that would be received for an asset or paid to transfer a liability in the principal most advantageous market for the asset or liability in an orderly transaction between market participants. In determining fair value, the Company applies the market approach, which uses prices and other relevant data based on market transactions involving identical or comparable assets and liabilities. The inputs to valuation techniques used to measure fair value are prioritized into a three-level hierarchy. The hierarchy gives the highest priority to quoted prices in active markets for identical assets and liabilities and the lowest priority to unobservable inputs. The fair value hierarchy is as follows:
Level 1—Inputs are based on quoted prices (unadjusted) in active markets for identical assets or liabilities.
Level 2—Inputs are other than quoted prices that are observable for the asset or liabilities, either directly or indirectly, for substantially the full term of the asset or liability.
Level 3—Unobservable inputs that are supported by little or no market activity. The unobservable inputs represent the Company's best assumption of how market participants would price the assets or liabilities.
The following tables present the fair value of the Company's financial instruments that were carried or disclosed at fair value. Unless indicated, these items were carried at fair value on the consolidated balance sheets.
| |
December 31, 2014 | ||||||||||||
|---|---|---|---|---|---|---|---|---|---|---|---|---|---|
| |
Level 1 | Level 2 | Level 3 | Total | |||||||||
Fixed maturity securities: |
|||||||||||||
U.S. Government obligations |
$ | — | $ | 5,941 | $ | — | $ | 5,941 | |||||
State and local government |
— | 10,961 | — | 10,961 | |||||||||
Corporate debt |
— | 30,949 | — | 30,949 | |||||||||
Commercial mortgage and asset-backed |
— | 36,554 | — | 36,554 | |||||||||
| | | | | | | | | | | | | | |
Total fixed maturity securities |
— | 84,405 | — | 84,405 | |||||||||
Equity securities, common stock |
4,084 |
— |
— |
4,084 |
|||||||||
Short-term investments* |
16,749 | — | — | 16,749 | |||||||||
| | | | | | | | | | | | | | |
Total assets measured at fair value |
$ | 20,833 | $ | 84,405 | $ | — | $ | 105,238 | |||||
| | | | | | | | | | | | | | |
| | | | | | | | | | | | | | |
| | | | | | | | | | | | | | |
Senior debt* |
$ | — | $ | 27,562 | $ | — | $ | 27,562 | |||||
Contingent consideration |
— | — | 168 | 168 | |||||||||
Interest rate swap |
— | 9 | — | 9 | |||||||||
| | | | | | | | | | | | | | |
Total liabilities measured at fair value |
$ | — | $ | 27,571 | $ | 168 | $ | 27,739 | |||||
| | | | | | | | | | | | | | |
| | | | | | | | | | | | | | |
| | | | | | | | | | | | | | |
- *
- Carried at cost or amortized cost on consolidated balance sheet.
F-46
CONIFER HOLDINGS, INC. AND SUBSIDIARIES
Notes to Consolidated Financial Statements (Continued)
(dollars in thousands, except per share amounts)
5. Fair Value Measurements (Continued)
| |
December 31, 2013 | ||||||||||||
|---|---|---|---|---|---|---|---|---|---|---|---|---|---|
| |
Level 1 | Level 2 | Level 3 | Total | |||||||||
Fixed maturity securities: |
|||||||||||||
U.S. Government obligations |
$ | — | $ | 3,407 | $ | — | $ | 3,407 | |||||
State and local government |
— | 9,235 | — | 9,235 | |||||||||
Corporate debt |
— | 10,736 | — | 10,736 | |||||||||
Commercial mortgage and asset-backed |
— | 20,777 | — | 20,777 | |||||||||
| | | | | | | | | | | | | | |
Total fixed maturity securities |
— | 44,155 | — | 44,155 | |||||||||
Equity securities, common stock |
3,712 |
— |
— |
3,712 |
|||||||||
Short-term investments* |
9,282 | — | — | 9,282 | |||||||||
| | | | | | | | | | | | | | |
Total assets measured at fair value |
$ | 12,994 | $ | 44,155 | $ | — | $ | 57,149 | |||||
| | | | | | | | | | | | | | |
| | | | | | | | | | | | | | |
| | | | | | | | | | | | | | |
Senior debt* |
$ | — | $ | 13,087 | $ | — | $ | 13,087 | |||||
Contingent consideration |
339 | 339 | |||||||||||
Note payable, related party* |
— | 1,000 | — | 1,000 | |||||||||
Interest rate swap |
— | 19 | — | 19 | |||||||||
| | | | | | | | | | | | | | |
Total liabilities measured at fair value |
$ | — | $ | 14,106 | $ | 339 | $ | 14,445 | |||||
| | | | | | | | | | | | | | |
| | | | | | | | | | | | | | |
| | | | | | | | | | | | | | |
- *
- Carried at cost or amortized cost on consolidated balance sheet.
Level 1 investments consist of equity securities traded in an active exchange market. The Company uses unadjusted quoted prices for identical instruments to measure fair value. Level 1 also includes money market funds and other interest-bearing deposits at banks, which are reported as short-term investments.
Level 2 investments include the fixed maturity securities, which consist of U.S. government agency securities, state and local municipal bonds (including those held as restricted securities), corporate debt securities, mortgage-backed and asset-backed securities. Fair value is measured for the majority of Level 2 investments using matrix pricing and observable market data, including benchmark securities or yields, reported trades, broker/dealer quotes, issuer spreads, two-sided markets, bids, offers, default rates, loss severity and other economic measures.
The Company obtains pricing for each security from independent pricing services, investment managers or consultants to assist in determining fair value for its Level 2 investments. To validate that these quoted prices are reasonable estimates of fair value, the Company performs various quantitative and qualitative procedures, including: i) evaluation of the underlying methodologies, ii) analysis of recent sales activity, iii) analytical review of fair values against current market prices and iv) comparison of the pricing services' fair value to other pricing services' fair value for the same investment. No markets for the investments were determined to be inactive at year-end. Based on these procedures, the Company did not adjust the prices or quotes provided from independent pricing services, investment managers or consultants.
The Level 2 financial instruments also include senior debt and note payable, related party. The fair value of borrowings under senior debt, consisting of the revolving credit facility and term loans, approximates its carrying amount because interest is based on 30-day LIBOR plus 2.75% to 3.25%. The fair value of the note payable, related party, approximated its carrying amount because of its short-term nature and market interest rate.
F-47
CONIFER HOLDINGS, INC. AND SUBSIDIARIES
Notes to Consolidated Financial Statements (Continued)
(dollars in thousands, except per share amounts)
5. Fair Value Measurements (Continued)
The Level 3 financial instruments include the fair value of the Company's contingent consideration arrangements that were entered into at the dates of the respective acquisitions.
The following table sets forth a roll forward of the Level 3 measurements:
| |
Contingent Consideration Liabilities |
|||
|---|---|---|---|---|
Balance at January 1, 2013 |
$ | — | ||
Main Street Acquisition (Note 3) |
212 | |||
Asset purchase (Note 3) |
123 | |||
Change in fair value |
4 | |||
| | | | | |
Balance at December 31, 2013 |
339 | |||
Change in fair value |
11 | |||
Payout of contingent consideration |
(182 | ) | ||
| | | | | |
Balance at December 31, 2014 |
$ | 168 | ||
| | | | | |
| | | | | |
| | | | | |
6. Premiums and Agents' Balances Receivable, net
Premiums and agents' balances receivable are shown net of an allowance for doubtful accounts. Activity in the allowance for doubtful accounts was as follows:
| |
Year ended December 31, | |||||||||
|---|---|---|---|---|---|---|---|---|---|---|
| |
2014 | 2013 | 2012 | |||||||
Beginning Balance |
$ | (181 | ) | $ | (205 | ) | $ | — | ||
Charged to expense |
(105 | ) | (242 | ) | (424 | ) | ||||
Write-offs, net of recoveries |
126 | 266 | 219 | |||||||
| | | | | | | | | | | |
Ending Balance |
$ | (160 | ) | $ | (181 | ) | $ | (205 | ) | |
| | | | | | | | | | | |
| | | | | | | | | | | |
| | | | | | | | | | | |
7. Deferred Policy Acquisition Costs
The activity in deferred policy acquisition costs is as follows:
| |
Year Ended December 31, | |||||||||
|---|---|---|---|---|---|---|---|---|---|---|
| |
2014 | 2013 | 2012 | |||||||
Balance at beginning of period |
$ | 5,747 | $ | 2,766 | $ | 1,719 | ||||
Deferred policy acquisition costs |
14,628 | 10,648 | 5,699 | |||||||
Write-off of deferred policy acquisition costs |
(139 | ) | — | — | ||||||
Amortization of policy acquisition costs |
(14,557 | ) | (7,667 | ) | (4,652 | ) | ||||
| | | | | | | | | | | |
Net change |
(68 | ) | 2,981 | 1,047 | ||||||
| | | | | | | | | | | |
Balance at end of period |
$ | 5,679 | $ | 5,747 | $ | 2,766 | ||||
| | | | | | | | | | | |
| | | | | | | | | | | |
| | | | | | | | | | | |
F-48
CONIFER HOLDINGS, INC. AND SUBSIDIARIES
Notes to Consolidated Financial Statements (Continued)
(dollars in thousands, except per share amounts)
7. Deferred Policy Acquisition Costs (Continued)
Based on its analysis, the Company recorded a premium deficiency charge of $139 comprised of a reduction to unamortized deferred acquisition costs within the personal automobile product line for the year ended December 31, 2014. The premium deficiency resulted when the Company began paying agents' commissions based on written premium instead of its historical method of paying based on earned premium. This resulted in higher deferred acquisition costs on the personal automobile line than management deemed recoverable. As the charge was a reduction of unamortized deferred acquisition costs, no premium deficiency reserve exists at December 31, 2014.
8. Goodwill and Intangible Assets
Goodwill
The changes in the carrying amount of goodwill, assigned to Commercial line—other liability segment, are as follows:
| |
December 31, | |||||||||
|---|---|---|---|---|---|---|---|---|---|---|
| |
2014 | 2013 | 2012 | |||||||
Beginning of year |
$ | 1,104 | $ | 485 | $ | — | ||||
Goodwill acquired during the year |
— | 619 | 485 | |||||||
| | | | | | | | | | | |
End of year |
$ | 1,104 | $ | 1,104 | $ | 485 | ||||
| | | | | | | | | | | |
| | | | | | | | | | | |
| | | | | | | | | | | |
Annual Assessment. The Company performed its annual assessment of goodwill for its Commercial line—other liability, as of October 1 of each year. For all years presented, the Company performed a quantitative impairment analysis of goodwill, which indicated that the estimated fair value of the reporting unit exceeded its corresponding carrying amount, and as such, the reporting unit was not at risk for impairment.
Intangibles assets
The following table reflects intangible assets and related accumulated amortization:
| |
December 31, 2014 | |||||||||||
|---|---|---|---|---|---|---|---|---|---|---|---|---|
| |
Weighted Average Amortization Period |
Gross Carrying Amount |
Accumulated Amortization |
Net Carrying Amount |
||||||||
Nonamortizing indefinite-lived intangible assets—state insurance licenses |
$ | 900 | $ | — | $ | 900 | ||||||
Amortizing definite-lived, intangible assets, customer lists |
5 years | 368 | $ | 97 | 271 | |||||||
| | | | | | | | | | | | | |
Total |
$ | 1,268 | $ | 97 | $ | 1,171 | ||||||
| | | | | | | | | | | | | |
| | | | | | | | | | | | | |
| | | | | | | | | | | | | |
F-49
CONIFER HOLDINGS, INC. AND SUBSIDIARIES
Notes to Consolidated Financial Statements (Continued)
(dollars in thousands, except per share amounts)
8. Goodwill and Intangible Assets (Continued)
| |
December 31, 2013 | |||||||||||
|---|---|---|---|---|---|---|---|---|---|---|---|---|
| |
Weighted Average Amortization Period |
Gross Carrying Amount |
Accumulated Amortization |
Net Carrying Amount |
||||||||
Nonamortizing indefinite-lived, intangible assets—state insurance licenses |
$ | 900 | $ | — | $ | 900 | ||||||
Amortizing definite-lived, intangible assets, customer lists |
5 years | 368 | 23 | 345 | ||||||||
| | | | | | | | | | | | | |
Total intangible assets |
$ | 1,268 | $ | 23 | $ | 1,245 | ||||||
| | | | | | | | | | | | | |
| | | | | | | | | | | | | |
| | | | | | | | | | | | | |
The Company performed its annual impairment analysis for its indefinite-lived licenses as of October 1 of each year using a quantitative assessment and concluded that no impairment existed.
Amortization of intangible assets was $74 and $23 for the years ended December 31, 2014 and 2013, respectively. Future amortization of identifiable intangibles is as follows: 2015: $74, 2016: $74, 2017: $74 and 2018: $49.
9. Unpaid Losses and Loss Adjustment Expenses
As discussed in Note 1, the Company establishes a liability for both reported and unreported covered losses, which includes estimates of both future payments of losses and related loss adjustment expenses.
F-50
CONIFER HOLDINGS, INC. AND SUBSIDIARIES
Notes to Consolidated Financial Statements (Continued)
(dollars in thousands, except per share amounts)
9. Unpaid Losses and Loss Adjustment Expenses (Continued)
The changes in those aggregate reserves on unpaid losses and loss adjustment expenses are presented as follows:
| |
December 31, | |||||||||
|---|---|---|---|---|---|---|---|---|---|---|
| |
2014 | 2013 | 2012 | |||||||
Gross reserves—beginning of year |
$ | 28,908 | $ | 24,843 | $ | 29,574 | ||||
Less reinsurance recoverables on unpaid losses |
3,953 | 7,296 | 12,410 | |||||||
| | | | | | | | | | | |
Net reserves—beginning of year |
24,955 | 17,547 | 17,164 | |||||||
| | | | | | | | | | | |
Net reserve additions from acquisitions |
— |
6,021 |
— |
|||||||
Add: incurred losses and loss adjustment expenses, net of reinsurance: |
||||||||||
Current year |
41,923 | 20,844 | 11,947 | |||||||
Prior years |
(1,193 | ) | (5,020 | ) | (4,356 | ) | ||||
| | | | | | | | | | | |
Total net incurred losses and loss adjustment expenses |
40,730 | 15,824 | 7,591 | |||||||
| | | | | | | | | | | |
Deduct: loss and loss adjustment expense payments, net of reinsurance: |
||||||||||
Current year |
24,134 | 9,093 | 3,772 | |||||||
Prior years |
13,244 | 5,344 | 3,436 | |||||||
| | | | | | | | | | | |
Total net loss and loss adjustment expense payments |
37,378 | 14,437 | 7,208 | |||||||
| | | | | | | | | | | |
Net reserves—end of year |
28,307 | 24,955 | 17,547 | |||||||
Plus: reinsurance recoverables on unpaid losses |
3,224 | 3,953 | 7,296 | |||||||
| | | | | | | | | | | |
Gross reserves—end of year |
$ | 31,531 | $ | 28,908 | $ | 24,843 | ||||
| | | | | | | | | | | |
| | | | | | | | | | | |
| | | | | | | | | | | |
The Company has experienced favorable development in incurred losses and loss adjustment expenses related to prior years in all periods presented.
During 2014, there was $1.2 million of prior year favorable reserve development, generated mostly from the commercial liability lines, in the 2011, 2012 and 2013 accident years. The Company experienced $0.6 million of adverse development in Midwest homeowners due to greater than expected weather-related losses occurring in late 2013. There was $0.5 million of favorable development in personal auto due to $0.7 million of favorable development in our Florida personal automobile business from the 2012 and 2013 accident years offset by $0.2 million of adverse development in our Illinois personal auto business in the 2012 accident year.
During 2013, there was $5.0 million of prior-year favorable reserve development, which was generated from $5.4 million of favorable reserve development in the commercial liability lines offset primarily by $0.6 million of adverse development in the personal automobile line. The $5.4 million of favorable development in the commercial liability lines included $2.8 million attributable to commercial multi-peril and $2.6 million from other liability. The $0.6 million adverse development in personal automobile was primarily due to larger settlements than expected on reported claims in the 2011 and 2012 accident years.
F-51
CONIFER HOLDINGS, INC. AND SUBSIDIARIES
Notes to Consolidated Financial Statements (Continued)
(dollars in thousands, except per share amounts)
9. Unpaid Losses and Loss Adjustment Expenses (Continued)
During 2012, there was $4.4 million of prior-year favorable reserve development, of which $4.2 million was generated in the commercial liability lines. This favorable development was primarily attributable to a reduction in incurred but not yet reported due to faster than expected claim settlements.
The Company does not adjust premium based on loss experience.
The table below details the net (favorable) / unfavorable loss reserve development by line of business, as follows:
| |
Year Ended December 31, | |||||||||
|---|---|---|---|---|---|---|---|---|---|---|
| |
2014 | 2013 | 2012 | |||||||
Net (favorable) / unfavorable loss reserve development |
||||||||||
Commercial multi-peril |
$ | (703 | ) | $ | (2,870 | ) | $ | (3,781 | ) | |
Other liability |
(509 | ) | (2,642 | ) | (577 | ) | ||||
Automobile |
(1 | ) | (4 | ) | 6 | |||||
Other |
31 | — | — | |||||||
| | | | | | | | | | | |
Total commercial lines |
(1,182 | ) | (5,516 | ) | (4,352 | ) | ||||
Midwest homeowners |
548 |
(77 |
) |
(55 |
) |
|||||
Specialty homeowners |
(9 | ) | — | — | ||||||
Automobile |
(550 | ) | 573 | 51 | ||||||
| | | | | | | | | | | |
Total personal lines |
(11 | ) | 496 | (4 | ) | |||||
| | | | | | | | | | | |
Total net (favorable) / unfavorable loss reserve development |
$ | (1,193 | ) | $ | (5,020 | ) | $ | (4,356 | ) | |
| | | | | | | | | | | |
| | | | | | | | | | | |
| | | | | | | | | | | |
10. Reinsurance
In the normal course of business, the insurance companies seek to minimize the loss that may arise from catastrophes or other events that cause unfavorable underwriting results by reinsuring certain levels of risk in various areas of exposure with reinsurers. Although reinsurance does not discharge the direct insurer from liability to its policyholder, the insurance companies participate in such treaty and facultative reinsurance agreements in order to limit their loss exposure, protect them against catastrophic losses and diversify their business. The Company primarily ceded all specific risks in excess of $300 in 2014 and 2013, and $250 in 2012. Failure of reinsurers to honor their obligations could result in losses to the Company. The Company evaluates the financial condition of its reinsurers and monitors the concentration of credit risk arising from similar geographic regions, activities, or economic characteristics of the reinsurers to minimize its exposure to significant losses from reinsurer insolvencies.
F-52
CONIFER HOLDINGS, INC. AND SUBSIDIARIES
Notes to Consolidated Financial Statements (Continued)
(dollars in thousands, except per share amounts)
10. Reinsurance (Continued)
Effective December 31, 2014, the Company entered into a quota-share reinsurance agreement in which it cedes 25% of the subject premium, net of other reinsurance, and cedes 25% of the losses within the Company's retention which is between $0 and $500. The subject premium represents substantially all lines other than the Florida homeowners and personal automobile policies. The Company recorded $8,412 of ceded written premium on December 31, 2014, relating to unearned premiums subject to this agreement.
In December 2014, the Company assumed written premiums of $5,483 under a policy assumption agreement with Citizens Property and Casualty Corporation ("Citizens"). Citizens is a Florida government-sponsored insurer that provides homeowners insurance to Florida residences that cannot find coverage in the voluntary market. Upon assuming this premium, the Company becomes the primary insurer to the policyholders. The Company is responsible for claims occurring on or after the effective date of the assumption.
The following table presents the effect of such reinsurance transactions on premium, losses and loss adjustment expenses and policy acquisition costs:
| |
Year Ended December 31, | |||||||||
|---|---|---|---|---|---|---|---|---|---|---|
| |
2014 | 2013 | 2012 | |||||||
Written premiums: |
||||||||||
Direct |
$ | 78,296 | $ | 44,087 | $ | 22,701 | ||||
Assumed |
5,551 | — | 137 | |||||||
Ceded |
(17,548 | ) | (6,439 | ) | (543 | ) | ||||
| | | | | | | | | | | |
Net written premiums |
$ | 66,299 | $ | 37,648 | $ | 22,295 | ||||
| | | | | | | | | | | |
| | | | | | | | | | | |
| | | | | | | | | | | |
Earned premiums: |
||||||||||
Direct |
$ | 66,608 | $ | 32,893 | $ | 17,861 | ||||
Assumed |
361 | — | 151 | |||||||
Ceded |
(9,441 | ) | (5,264 | ) | (1,078 | ) | ||||
| | | | | | | | | | | |
Net earned premiums |
$ | 57,528 | $ | 27,629 | $ | 16,934 | ||||
| | | | | | | | | | | |
| | | | | | | | | | | |
| | | | | | | | | | | |
Loss and loss adjustment expenses: |
||||||||||
Direct |
$ | 43,894 | $ | 15,284 | $ | 4,410 | ||||
Assumed |
107 | (171 | ) | 92 | ||||||
Ceded |
(3,271 | ) | 711 | 3,089 | ||||||
| | | | | | | | | | | |
Net loss and loss adjustment expenses |
$ | 40,730 | $ | 15,824 | $ | 7,591 | ||||
| | | | | | | | | | | |
| | | | | | | | | | | |
| | | | | | | | | | | |
Policy acquisition costs |
$ |
8,791 |
$ |
5,747 |
$ |
2,766 |
||||
Ceding commissions |
(3,112 | ) | — | — | ||||||
| | | | | | | | | | | |
Net policy acquisition costs |
$ | 5,679 | $ | 5,747 | $ | 2,766 | ||||
| | | | | | | | | | | |
| | | | | | | | | | | |
| | | | | | | | | | | |
Assumed earned premiums as a percent of net earned premiums |
0.6 | % | — | 0.9 | % | |||||
The Company manages its credit risk on reinsurance recoverables by reviewing the financial stability, A.M. Best rating, capitalization, and creditworthiness of prospective and existing risk-sharing
F-53
CONIFER HOLDINGS, INC. AND SUBSIDIARIES
Notes to Consolidated Financial Statements (Continued)
(dollars in thousands, except per share amounts)
10. Reinsurance (Continued)
partners. All major unaffiliated reinsurance participants of the Company are required to be rated "A–" or better by A.M. Best. The Company does not hold collateral against the reinsurance recoverable assets. Reinsurance recoverables on paid and unpaid losses are summarized in the table, as follows:
| |
|
December 31, | |||||||
|---|---|---|---|---|---|---|---|---|---|
Reinsurer
|
Rating | 2014 | 2013 | ||||||
General Reinsurance Corporation |
A++ | $ | 2,405 | $ | 411 | ||||
Swiss Re |
A+ | 712 | 1,111 | ||||||
Munich Re |
A+ | 698 | 952 | ||||||
Arch Reinsurance |
A+ | 490 | 548 | ||||||
Platinum Underwriters |
A | 288 | 520 | ||||||
TOA Reinsurance |
A+ | 236 | 355 | ||||||
QBE Reinsurance |
A | 182 | 288 | ||||||
Other |
A to A++ | 128 | 209 | ||||||
| | | | | | | | | | |
Total reinsurance recoverables |
$ | 5,139 | $ | 4,394 | |||||
| | | | | | | | | | |
| | | | | | | | | | |
| | | | | | | | | | |
11. Senior Debt
A summary of the outstanding senior debt is as follows:
| |
December 31, | ||||||
|---|---|---|---|---|---|---|---|
| |
2014 | 2013 | |||||
Revolver |
$ | 16,562 | $ | 8,337 | |||
Term Note |
3,500 | 4,750 | |||||
2014 Term Note |
7,500 | — | |||||
| | | | | | | | |
Total |
$ | 27,562 | $ | 13,087 | |||
| | | | | | | | |
| | | | | | | | |
| | | | | | | | |
In April, 2010, the Company entered into a credit agreement ("Credit Agreement") with a bank that provided for a $12 million revolving credit facility ("Revolver") with an original maturity date of May 1, 2013. In March 2013, $5 million of the then outstanding balance under the Revolver was converted into a five-year term note ("Term Note") which requires quarterly principal payments of $250 plus accrued interest, beginning October 1, 2013. At the same time, the total amount available to borrow under the Revolver was reduced to $10 million with a maturity date of October 1, 2014.
In September 2014, the Company entered into an amended and restated credit agreement ("Amended Credit Agreement") which amended its existing Credit Agreement in its entirety. The Amended Credit Agreement provides for (i) a $17.5 million Revolver, due in August 2016, (ii) a new five-year term note for $7.5 million ("2014 Term Note") and (iii) the original Term Note for $5 million. Additionally, letter-of-credit obligations are available for up to $2 million. Any outstanding letters of credit would reduce the amount available under the Credit Facility. The 2014 Term Note requires quarterly principal payments ranging from $250 to $500 plus accrued interest, beginning January 1, 2015.
F-54
CONIFER HOLDINGS, INC. AND SUBSIDIARIES
Notes to Consolidated Financial Statements (Continued)
(dollars in thousands, except per share amounts)
11. Senior Debt (Continued)
The obligations (except for the unused letters of credit) under the Amended Credit Agreement bears interest at LIBOR rate plus an applicable margin (2.75%, as defined) or the lender's prime rate plus an applicable margin (1.0%, as defined) except for the 2014 Term Note. Interest is required on the 2014 Term Note at LIBOR plus 3.25% or the lender's prime rate plus an applicable margin (1.50% at December 31, 2014). The weighted average interest rate was 3.3% for each of the years ended December 31, 2014 and 2013. The Company is required to pay quarterly commitment fees on the unused portion of the Credit Facility equal to 0.2% of 1.0% per annum.
The Company's previous Credit Agreement required interest at rates of LIBOR, plus 2.75% or the lender's prime rate, plus 1%, but not less than a rate of 2.5%.
The aggregate maturities under the Amended Credit Agreement for each of the five years subsequent to December 31, 2014 are as follows: $1,750 in 2015, $18,562 in 2016, $2,500 in 2017, $2,750 in 2018 and $2,000 in 2019.
The Credit Facility contains various restrictive covenants that relate to the Company's shareholders' equity, premiums-to-capital and surplus ratios, fixed-charge coverage ratio, certain other metrics as defined by the NAIC such as IRIS ratios and risk-based capital ratios, and A.M. Best ratings of its insurance subsidiaries. At December 31, 2014, the Company was in compliance with all of its Credit Facility covenants except as follows: the Company's chairman's ownership fell below the required 50% to 45.6%, the debt service coverage ratio fell below 1.20-to-1.0 to 1.09-to-1.0, the Company's tangible net worth was below the covenant minimum by $800 and two insurance companies had five unusual IRIS ratio results which exceeded the limitation of four per company. The Company received waivers for these covenant breaches as of December 31, 2014. The Company is expected to meet the debt covenant requirements going forward based upon a combination of amendments to the Credit Facility, dated May 4, 2015, a modification to the redeemable preferred stock, effective March 2015 (which requires the redeemable preferred stock to be classified as equity for the tangible net worth covenant, see Note 23) and improved cash flows from operations.
Interest Rate Swap Agreement
The Company sometimes borrows at variable interest rates and uses interest rate swaps, not designated as hedges, which have the economic effect of converting its borrowings from floating rates to fixed rates. The interest rate swaps allow the Company to enter into long-term borrowings at floating interest rates and swap them into fixed rates that are lower than available if it borrowed at fixed rates directly. Under the interest rate swaps, the Company agrees with other parties to exchange, at specific intervals (mainly quarterly), the difference between fixed contract rates and floating rate interest amounts calculated by reference to the agreed notional principal amounts.
As discussed above, the Company has a $5 million variable-rate Term Note outstanding with interest payments due on a quarterly basis. In order to minimize its interest rate risk, the Company entered into an interest rate swap for a notional amount of $5 million at a fixed rate of 1.04%. Under this swap agreement, the Company pays the fixed rate of 1.04% on the $5 million notional amount on a quarterly basis, and receives the LIBOR rate on a quarterly basis. Payments are settled on a net basis, and the Company has effectively converted its variable-rate debt into fixed-rate debt with an effective interest rate of 3.79%. Payments made or received on the swap are recorded as interest
F-55
CONIFER HOLDINGS, INC. AND SUBSIDIARIES
Notes to Consolidated Financial Statements (Continued)
(dollars in thousands, except per share amounts)
11. Senior Debt (Continued)
expense. The changes in fair value of the interest rate swap at period-end are recorded as interest expense. At December 31, 2014 and 2013, the fair value of the interest rate swap of $9 and $19, respectively (notional amounts of $3,750 and $4,750, respectively), was recorded in accounts payable and accrued expenses in the consolidated balance sheets.
12. Shareholders' Equity and Noncontrolling Interest
Capital stock
In November 2013, the Company amended its original Articles of Incorporation to change its authorized capital stock to consist of (i) 12,240,000 million shares of common stock, no par value, of which 3,995,013 and 1,749,626 shares of common stock were issued and outstanding at December 31, 2014 and 2013, respectively, and (ii) 1 million shares of preferred stock. Prior to November 2013, the Company's authorized capital stock consisted of 2,040,000 shares of common stock.
Effective September 2014, the Company amended its Articles of Incorporation to restate the powers, preferences, rights, limitations and restrictions of its common and redeemable preferred shares as discussed below and in Note 13.
Common Stock
Holders of common stock are entitled to one vote per share and to receive dividends only when and if declared by the board of directors. The holders have no preemptive, conversion or subscription rights, and there are no redemption or sinking fund provisions with respect to such shares. Common stock is subordinate to the redeemable preferred stock with respect to dividend rights or rights upon liquidation, winding up, and dissolution of the Company.
In 2014, the Company initiated two capital-raising activities whereby shares of common stock were issued to third-party investors, members of the board of directors, executive management and employees, along with their relatives. In the first half of 2014, the Company raised proceeds of $8,295 from the issuance of 682,349 shares of common stock at $12.16 per share. The common shares were issued to the respective parties as follows: 311,059 to third party investors, 49,348 to members of the board of directors, 203,969 to executive management and their relatives, and 117,973 to employees. In the second half of 2014, the Company raised proceeds of $20,179 from the issuance of 1,480,786 shares of common stock at $13.63 per share. The common shares were issued to the respective parties as follows: 82,895 to third party investors, 807,177 to members of the board of directors, and 590,714 to executive management and their relatives.
In 2012, the Company issued 30,569 shares of common stock primarily to executives and employees of the Company for $382 in cash. Additionally in 2012, the Company repurchased and retired 39,810 shares of common stock in exchange for $480 in cash.
Preferred Stock
Beginning in November 2013, the Company's authorized capital includes preferred shares with an annual dividend rate of 10%, payable quarterly commencing June 1, 2014, and is noncumulative.
F-56
CONIFER HOLDINGS, INC. AND SUBSIDIARIES
Notes to Consolidated Financial Statements (Continued)
(dollars in thousands, except per share amounts)
12. Shareholders' Equity and Noncontrolling Interest (Continued)
In early 2014, the Company issued 66,000 shares of preferred stock at $10.00 per share to certain third-party investors. On October 1, 2014, the Company repurchased all of the 66,000 outstanding shares and cancelled the related certificates. In return, the holders received consideration in the form of newly issued redeemable preferred shares. Refer to Note 13.
Noncontrolling Interest
In May 2013, the Company and a third party formed a joint venture entity, Venture Holdings, to expand operations in the specialty line of the commercial liability business. Each partner contributed $50 upon formation in exchange for its 50% ownership interest. In addition, the Company loaned $350 to Venture Holdings with interest payable quarterly at a fixed interest rate of 7.5%. The principal and unpaid accrued interest is due on May 31, 2018. The proceeds from the loan were used by Venture Holdings to fund the acquisition of Main Street Systems, Inc. Refer to Note 3.
During the period of time that the aforementioned loan is outstanding, the Company has control of Venture Holdings through its board representation of two of the three seats. Therefore, the Company has consolidated the operations of Venture Holdings and its subsidiaries in the consolidated financial statements and reflected the other partners' ownership interest as a noncontrolling interest.
13. Redeemable Preferred Stock
On October 1, 2014, the Company issued 6,600 shares of redeemable preferred stock to the holders of the then outstanding shares of preferred stock in exchange for 66,000 shares of redeemable preferred stock. On the date of the transaction, the Company determined the fair value of the preferred stock and compared it to the fair value of the redeemable preferred stock. The difference in fair value of $15 was recorded as a deemed dividend on the preferred stock which increased preferred stock and decreased no par, common stock. Additionally, on October 1, 2014, the Company issued 54,000 shares of redeemable preferred stock to additional investors for $100 per share resulting in total cash proceeds of $5.4 million. The proceeds received were contributed to the insurance subsidiaries to support future premium volume growth.
The redeemable preferred stock was initially recorded at fair value and has been increased by the paid-in kind interest ("PIK Interest") of $59, which will be paid upon redemption of the redeemable preferred stock. The issuance costs were nominal. The Company has classified the shares of redeemable preferred stock within temporary equity on its consolidated balance sheet at December 31, 2014 due to its liquidation rights. The redeemable preferred stock is redeemable in cash upon a deemed liquation event that is not solely within the control of the Company.
A general summary of the rights with respect to the redeemable preferred stock are provided below:
Dividends
The holders of the redeemable preferred stock are entitled to interest earned at an annual rate of 10% based on the original purchase price payable quarterly and PIK interest that will accrue and be capitalized on the original purchase price at an annual rate of 4% on a cumulative basis. The PIK
F-57
CONIFER HOLDINGS, INC. AND SUBSIDIARIES
Notes to Consolidated Financial Statements (Continued)
(dollars in thousands, except per share amounts)
13. Redeemable Preferred Stock (Continued)
Interest is payable in cash at the time of any redemption of the redeemable preferred shares. The redeemable preferred stock does not have any conversion feature into common stock.
Liquidation
A liquidation or winding up of the Company, a change in control or an initial public offering would be a "Deemed Liquidation Event" that would trigger redemption of preferred shares, in cash.
Redemption
All or any part of the redeemable preferred shares may be redeemed after one year from the date of issuance, at the option of the Company.
Voting
The redeemable preferred shareholders are not entitled to vote on any action other than (i) change to any provision of the Company's articles of incorporation or bylaws that alters or changes the power, preferences, or other special rights or privileges or restrictions of the redeemable preferred shares or (ii) any authorization of any new class or series of shares or any other securities convertible into equity securities ranking senior to the redeemable preferred shares in right of redemption, liquidation preference or dividends. Each common share has one vote on all matters to be voted on.
14. Employee Benefits
In 2014, the Company has established a retirement savings plan under section 401(k) of the Internal Revenue Code (the "Plan") for certain eligible employees. Eligible employees electing to participate in the 401(k) plan may defer and contribute from one to 100% of their compensation on a pre-tax basis, subject to statutory limits. The Company will match the employees' contributions up to the first 4% of their compensation. The Company's Plan expense amounted to $210 in 2014.
F-58
CONIFER HOLDINGS, INC. AND SUBSIDIARIES
Notes to Consolidated Financial Statements (Continued)
(dollars in thousands, except per share amounts)
15. Accumulated Other Comprehensive Income (Loss)
The following table presents changes in accumulated other comprehensive income (loss) for unrealized gains and losses on available for sale securities (all amounts are shown after applying a tax rate of 34%):
For the year ended December 31, 2014 |
||||
Balance at January 1, 2014 |
$ | 536 | ||
Other comprehensive income (loss) before reclassifications |
1,107 | |||
Amounts reclassified from accumulated other comprehensive income (loss) |
(485 | ) | ||
| | | | | |
Net current period other comprehensive income |
622 | |||
| | | | | |
Balance at December 31, 2014 |
$ | 1,158 | ||
| | | | | |
| | | | | |
| | | | | |
For the year ended December 31, 2013 |
||||
Balance at January 1, 2013 |
$ | 1,230 | ||
Other comprehensive income (loss) before reclassifications |
(233 | ) | ||
Amounts reclassified from accumulated other comprehensive income (loss) |
(461 | ) | ||
| | | | | |
Net current period other comprehensive loss |
(694 | ) | ||
| | | | | |
Balance at December 31, 2013 |
$ | 536 | ||
| | | | | |
For the year ended December 31, 2012 |
||||
Balance at January 1, 2012 |
$ | 1,170 | ||
Other comprehensive income (loss) before reclassifications |
760 | |||
Amounts reclassified from accumulated other comprehensive income (loss) |
(700 | ) | ||
| | | | | |
Net current period other comprehensive income |
60 | |||
| | | | | |
Balance at December 31, 2012 |
$ | 1,230 | ||
| | | | | |
| | | | | |
| | | | | |
The following indicates the line items in the statements of operations and amounts of the reclassification adjustments made for the periods presented:
| |
Years Ended December 31, | |||||||||
|---|---|---|---|---|---|---|---|---|---|---|
| |
2014 | 2013 | 2012 | |||||||
Net realized gains |
$ | 735 | $ | 698 | $ | 1,060 | ||||
Income tax expense |
250 | 237 | 360 | |||||||
16. Income Taxes
At December 31, 2014 and 2013, the Company had current income taxes receivable of $70 and $77, respectively, included in other assets in the consolidated balance sheets.
F-59
CONIFER HOLDINGS, INC. AND SUBSIDIARIES
Notes to Consolidated Financial Statements (Continued)
(dollars in thousands, except per share amounts)
16. Income Taxes (Continued)
The income tax expense (benefit) is comprised of the following:
| |
Year Ended December 31, | |||||||||
|---|---|---|---|---|---|---|---|---|---|---|
| |
2014 | 2013 | 2012 | |||||||
Current taxes |
$ | 3 | $ | (1 | ) | $ | 15 | |||
Deferred taxes |
(284 | ) | 4 | (31 | ) | |||||
| | | | | | | | | | | |
Total income tax expense (benefit) |
$ | (281 | ) | $ | 3 | $ | (16 | ) | ||
| | | | | | | | | | | |
| | | | | | | | | | | |
| | | | | | | | | | | |
The income tax expense (benefit) differed from the amounts computed by applying the statutory U.S. federal income tax rate of 34% to pretax income as a result of the following:
| |
Year Ended December 31, | |||||||||
|---|---|---|---|---|---|---|---|---|---|---|
| |
2014 | 2013 | 2012 | |||||||
Income (loss) before income taxes |
$ | (7,220 | ) | $ | 283 | $ | 397 | |||
| | | | | | | | | | | |
Statutory U.S. federal income tax rate |
(2,455 | ) | 96 | 135 | ||||||
State income taxes, net of federal benefit |
(246 | ) | — | — | ||||||
Gains on acquisitions |
— | (1,278 | ) | — | ||||||
Tax-exempt investment income and dividend received deduction |
(66 | ) | 80 | (75 | ) | |||||
Nondeductible acquisition costs and purchase adjustments |
143 | 70 | 10 | |||||||
Nondeductible meals and entertainment |
30 | 22 | 5 | |||||||
Valuation allowance on deferred tax assets |
2,283 | 1,089 | (43 | ) | ||||||
Other |
30 | 84 | (48 | ) | ||||||
| | | | | | | | | | | |
Income tax expense (benefit) |
$ | (281 | ) | $ | 3 | $ | (16 | ) | ||
| | | | | | | | | | | |
| | | | | | | | | | | |
| | | | | | | | | | | |
Effective tax rate |
3.9 | % | 1.2 | % | (4.1 | )% | ||||
| | | | | | | | | | | |
| | | | | | | | | | | |
| | | | | | | | | | | |
F-60
CONIFER HOLDINGS, INC. AND SUBSIDIARIES
Notes to Consolidated Financial Statements (Continued)
(dollars in thousands, except per share amounts)
16. Income Taxes (Continued)
The tax effects of temporary differences that give rise to significant portions of the deferred tax assets and deferred tax liabilities are presented below:
| |
December 31, | ||||||
|---|---|---|---|---|---|---|---|
| |
2014 | 2013 | |||||
Deferred tax assets: |
|||||||
Discounted unpaid losses and loss adjustment expenses |
$ | 481 | $ | 417 | |||
Unearned premiums |
2,423 | 1,735 | |||||
Net operating loss carryforwards |
6,889 | 5,154 | |||||
State net operating loss carryforwards |
213 | — | |||||
Other |
(159 | ) | 109 | ||||
| | | | | | | | |
Gross deferred tax assets |
9,847 | 7,415 | |||||
Less valuation allowance |
(6,917 | ) | (4,634 | ) | |||
| | | | | | | | |
Total deferred tax assets, net of allowance |
2,930 | 2,781 | |||||
| | | | | | | | |
Deferred tax liabilities: |
|||||||
Investment basis difference |
38 | 229 | |||||
Unrealized gains on investments |
562 | 276 | |||||
Deferred policy acquisition costs |
1,971 | 1,931 | |||||
Intangible assets |
306 | 285 | |||||
Property and equipment |
378 | 365 | |||||
| | | | | | | | |
Total deferred tax liabilities |
3,255 | 3,087 | |||||
| | | | | | | | |
Net deferred tax liability |
$ | (325 | ) | $ | (306 | ) | |
| | | | | | | | |
| | | | | | | | |
| | | | | | | | |
The net deferred tax liability is recorded in other liabilities in the consolidated balance sheets.
As of December 31, 2014, the Company has net operating loss carryforwards for federal income tax purposes of $20.3 million, which expire in tax years 2019 through 2034. Of this amount, $8.9 million are subject to limitations under Section 382 of the Internal Revenue Code. Certain of the net operating loss carryforwards are limited in the amount that can be utilized in any one year and may expire before they are realized. The Company expects that $6.3 million of these net operating loss carryforwards will expire before utilized. The Company has stated net operating loss carryforwards of $8.1 million, which expire in tax years 2029 through 2034.
Management assesses the available positive and negative evidence to estimate whether sufficient future taxable income will be generated to permit the use of the existing deferred tax assets under the guidance of ASC 740 Income Taxes. A significant piece of objective negative evidence evaluated was the cumulative loss incurred over the three-year period ended December 31, 2014. Such objective evidence limits the ability to consider other subjective evidence, such as our projections for future growth.
Based on its evaluation, the Company has recorded a valuation allowance of $6.9 million, $4.6 million and $213 at December 31, 2014, 2013 and 2012, respectively, to reduce the deferred tax assets to an amount that more-likely-than-not will be realized. The amount of the deferred tax assets considered realizable, however, could be adjusted if estimates of future taxable income during the
F-61
CONIFER HOLDINGS, INC. AND SUBSIDIARIES
Notes to Consolidated Financial Statements (Continued)
(dollars in thousands, except per share amounts)
16. Income Taxes (Continued)
carryforward period are reduced or if objective negative evidence in the form of cumulative losses is no longer present, and additional weight may be given to subjective evidence, such as the Company's projections for growth.
The Company files consolidated federal income tax returns. For the years before 2011, the Company is no longer subject to U.S. federal examinations; however, the Internal Revenue Service has the ability to review years prior to 2011 to the extent the Company utilized tax attributes carried forward from those prior years. The statute of limitations on state filings is generally three to four years.
17. Income (loss) Per Share
Basic and diluted income (loss) per share are computed by dividing net income allocable to common shareholders by the weighted average number of common shares outstanding during the period. The dividends on the redeemable preferred stock are added to the net income (loss) to arrive at net income (loss) allocable to common shareholders.
The following table presents the calculation of basic and diluted income (loss) per common share, as follows:
| |
Year Ended December 31, | |||||||||
|---|---|---|---|---|---|---|---|---|---|---|
| |
2014 | 2013 | 2012 | |||||||
Numerator: |
||||||||||
Net income (loss) attributable to Conifer |
$ | (6,935 | ) | $ | 349 | $ | 413 | |||
Plus: preferred stock dividends |
191 | — | — | |||||||
Plus: paid-in-kind dividends |
59 | — | — | |||||||
Plus: deemed dividend on preferred stock (Note 13) |
15 | — | — | |||||||
| | | | | | | | | | | |
Net income (loss) allocable to common shareholders |
(7,200 | ) | 349 | 413 | ||||||
| | | | | | | | | | | |
Denominator: |
||||||||||
Weighted average common shares, basic and diluted |
2,672,440 | 1,749,626 | 1,741,517 | |||||||
| | | | | | | | | | | |
Income (loss) per share allocable to common shareholders, basic and diluted |
$ | (2.69 | ) | $ | 0.20 | $ | 0.24 | |||
| | | | | | | | | | | |
| | | | | | | | | | | |
| | | | | | | | | | | |
18. Related Party Transactions
In December 2012, the Company entered into a short-term, unsecured note payable with an executive of the Company for $1 million. The note required quarterly interest payments only at 12% per annum. The note was converted for equity of the Company in two separate transactions. On January 31, 2014, the Company issued 41,126 shares of common stock in satisfaction of $500,000 of the note balance. The remaining note balance was satisfied through issuance of 41,126 shares of common
F-62
CONIFER HOLDINGS, INC. AND SUBSIDIARIES
Notes to Consolidated Financial Statements (Continued)
(dollars in thousands, except per share amounts)
18. Related Party Transactions (Continued)
stock on June 30, 2014. Interest expense recorded on the note was $35, $120 and $2 for the years ended December 31, 2014, 2013 and 2012, respectively.
19. Supplemental Disclosure of Noncash Investing and Financing Activities
The supplemental disclosures of cash flow information related to noncash investing and financing activities are as follows:
In 2014, the Company recorded the PIK Interest on its redeemable preferred stock of $59 resulting in an increase to redeemable preferred stock and decrease to no par, common stock.
During 2014, the Company converted the note payable issued to an Executive to equity. Refer to Note 18.
At December 31, 2012, accounts payable and accrued expenses included $360 related to the purchase of furniture and fixtures.
Cash paid for interest was $510, $364 and $417 for the years ended December 31, 2014, 2013 and 2012, respectively.
20. Commitments and Contingencies
Legal proceedings
The Company is subject to claims and lawsuits that arise primarily in the ordinary course of business. In the opinion of management, the disposition or ultimate resolution of such claims and lawsuits will not have a material adverse effect on the Company's consolidated financial position, results of operations, or liquidity.
Commitments
During 2010, the Company entered into an agreement with an unaffiliated party to design, develop, and implement a new policy administration, billing, and claims system for the Company. In March 2011, the Company increased the scope of work to be performed, which required monthly payments to $30 through December 31, 2013. The total commitment associated with the new system approximated $1,244, of which $720 and $0 remains in accounts payable and accrued expenses as of December 31, 2014 and 2013, respectively. On July 1, 2013, this contract was further amended to require a minimum monthly payment of $40 with a fee schedule that was scalable with the premium volume. The expiration date was extended to July 1, 2018.
Operating leases
The Company leases administrative office facilities, including its corporate headquarters, and office equipment under operating leases that expire at various dates through 2024. The Company has the option to extend its corporate headquarters lease for two additional five-year periods. The Company recognizes rent expense on a straight-line basis over the term of the lease. Rent expense under the operating leases totaled $871 in 2014, $342 in 2013 and $164 in 2012.
F-63
CONIFER HOLDINGS, INC. AND SUBSIDIARIES
Notes to Consolidated Financial Statements (Continued)
(dollars in thousands, except per share amounts)
20. Commitments and Contingencies (Continued)
In 2014, the Company terminated its lease for its previous corporate headquarters before the end of the lease term. The Company paid a termination fee of $280 to the property owner, which has been included in rent expense in 2014.
The future minimum rental payments under noncancelable operating leases as of December 31, 2014, are as follows:
| |
Amount | |||
|---|---|---|---|---|
Years Ending December 31, |
||||
2015 |
$ | 791 | ||
2016 |
806 | |||
2017 |
746 | |||
2018 |
649 | |||
2019 |
529 | |||
2020 and thereafter |
2,625 | |||
| | | | | |
Total future minimum rental payments |
$ | 6,146 | ||
| | | | | |
| | | | | |
| | | | | |
21. Statutory Financial Information
U.S. state insurance laws and regulations prescribe accounting practices for determining statutory net income and capital and surplus for insurance companies. In addition, state regulators may permit statutory accounting practices that differ from prescribed practices. Statutory accounting practices prescribed or permitted by regulatory authorities for the Company's insurance subsidiaries differ from U.S. GAAP. The principal differences between Statutory Accounting Principles ("SAP") and U.S. GAAP as they relate to the financial statements of the Company's insurance subsidiaries are (i) policy acquisition costs are expensed as incurred under SAP, whereas they are deferred and amortized under U.S. GAAP, (ii) deferred tax assets are subject to more limitations regarding what amounts can be recorded under SAP and (iii) bonds are recorded at amortized cost under SAP and fair value under U.S. GAAP. The combined statutory net income, statutory capital and surplus and minimum required statutory capital and surplus, as determined in accordance with statutory accounting practices, for the insurance subsidiaries are summarized as follows:
| |
December 31, | |||||||||
|---|---|---|---|---|---|---|---|---|---|---|
| |
2014 | 2013 | 2012 | |||||||
Statutory net income (loss) |
$ | (4,373 | ) | $ | (3,845 | ) | $ | 262 | ||
| | | | | | | | | | | |
| | | | | | | | | | | |
| | | | | | | | | | | |
Statutory capital and surplus |
$ | 66,585 | $ | 29,994 | $ | 26,868 | ||||
| | | | | | | | | | | |
| | | | | | | | | | | |
| | | | | | | | | | | |
Minimum required statutory capital and surplus |
$ | 18,250 | $ | 18,250 | $ | 18,250 | ||||
| | | | | | | | | | | |
| | | | | | | | | | | |
| | | | | | | | | | | |
Risk-Based Capital requirements as promulgated by the National Association of Insurance Commissioners ("NAIC") require property and casualty insurers to maintain minimum capitalization levels determined based on formulas incorporating various business risks (i.e., investment risk, underwriting profitability, etc.) of the insurance subsidiaries. As of December 31, 2014, the insurance
F-64
CONIFER HOLDINGS, INC. AND SUBSIDIARIES
Notes to Consolidated Financial Statements (Continued)
(dollars in thousands, except per share amounts)
21. Statutory Financial Information (Continued)
subsidiaries' adjusted capital and surplus exceeded their authorized control level as determined by the NAIC's risk-based capital models.
Dividend Restrictions
The state insurance statutes in which the insurance subsidiaries are domiciled limit the amount of dividends that they may pay annually without first obtaining regulatory approval. Generally, the limitations are based on the greater of statutory net income for the preceding year or 10% of statutory surplus at the end of the preceding year. The maximum amount of dividends available to the Parent from its insurance subsidiaries during 2014 without regulatory approval was $2.8 million. However, state insurance regulators have broad powers to prevent the reduction of statutory surplus to inadequate levels and could refuse to permit the payment of dividends.
22. Segment Information
The company is engaged in the sale of property and casualty insurance products and has organized its principal operations into two types of insurance businesses: commercial lines and personal lines. Within these two insurance businesses, the Company operates through various lines of businesses that offer various insurance products that are engaged in underwriting and marketing insurance coverages, and administering claims processing for such policies.
The Company defines its operating segments as components of the business where separate financial information is available and used by the chief operating decision-making group in deciding how to allocate resources to its segments and in assessing its performance. In assessing performance of its operating segments, the Company's chief operating decision-making group, comprised of key senior executives, review a number of financial measures including gross written premiums, net earned premiums, and loss and loss adjustment expenses, net of reinsurance recoveries. The primary measure used for making decisions about resources to be allocated to an operating segment and assessing its performance is segment underwriting gain or loss which is defined as segment revenues, consisting of net earned premiums and other income, less segment expenses, consisting of loss and loss adjustment expenses, policy acquisition costs and other underwriting and operating expenses, of the operating segments. Other underwriting and operating expenses include primarily compensation and related benefits for underwriting personnel, licensing of policy issuance and claims systems, rent and utilities. The Company markets, distributes and sells its insurance products through owned-insurance agencies and a network of independent agents. All of the Company's insurance activities are conducted in the United States with a concentration of activity in Florida, Michigan and Pennsylvania. For the year ended December 31, 2014, 2013 and 2012, gross written premiums attributable to these three states were 61%, 52% and 53%, respectively, of the Company's total gross written premiums.
The commercial lines and personal lines accounted for approximately 62% and 38%, respectively, of net earned premiums for the year ended December 31, 2014, approximately 57% and 43%, respectively, of net earned premiums for the year ended December 31, 2013, and approximately 69% and 31%, respectively, of net earned premiums for the year ended December 31, 2012.
F-65
CONIFER HOLDINGS, INC. AND SUBSIDIARIES
Notes to Consolidated Financial Statements (Continued)
(dollars in thousands, except per share amounts)
22. Segment Information (Continued)
The following provides a description of the Company's two insurance businesses and product offerings within these businesses:
- •
- Commercial lines—offers coverage for property, liability, automobile and other miscellaneous coverage primarily to
owner-operated small and mid-sized businesses, professional organizations and hospitality businesses such as restaurants, bars and taverns. Included within commercial insurance business are the
following key products:
- •
- Commercial multi-peril ("CMP")—provides property and liability coverages in a package to the policyholder.
- •
- Other liability—provides coverage for general liability and liquor liability on an individual policy.
- •
- Automobile—provides coverage for commercial automobiles for businesses that supply to their employees
company-owned vehicles.
- •
- Other—includes primarily policies for coverage in the areas of for workers' compensation.
- •
- Personal lines—offers coverage for Midwest homeowners, specialty homeowners and automobile. Included within personal
insurance business are the following key products:
- •
- Midwest homeowners—provides coverage for nonstandard homeowners insurance and dwelling fire insurance
products (property coverage and basic perils coverage only) located primarily in Indiana and Illinois.
- •
- Specialty homeowners—provides coverage in niche homeowners markets that have special risk characteristics,
including heightened exposure to wind and storms, located primarily in Florida, Hawaii and Texas.
- •
- Automobile—provides coverage for nonstandard private passenger automobile insurance policies primarily for individuals located in Florida and Illinois.
In addition to the reportable segments, the Company maintains a Corporate and Other category to reconcile segment results to the consolidated totals. The Corporate and Other category includes: (i) corporate operating expenses such as salaries and related benefits of the Company's executive management team, and finance and information technology personnel, and other corporate headquarter expenses, (ii) interest expense on the Company's senior debt obligations; (iii) depreciation and amortization on property and equipment, and (iv) all investment income activity. All investment income activity is reported within net investment income and net realized investment gains on the consolidated statements of operations.
F-66
CONIFER HOLDINGS, INC. AND SUBSIDIARIES
Notes to Consolidated Financial Statements (Continued)
(dollars in thousands, except per share amounts)
22. Segment Information (Continued)
The following tables present information by reportable segment:
| |
Commercial Lines | Personal Lines | |
|
||||||||||||||||||||||||||||||
|---|---|---|---|---|---|---|---|---|---|---|---|---|---|---|---|---|---|---|---|---|---|---|---|---|---|---|---|---|---|---|---|---|---|---|
| |
|
|
|
|
|
Homeowners | |
|
|
|
||||||||||||||||||||||||
| |
|
Other Liability |
|
|
|
|
|
Corporate & Other |
|
|||||||||||||||||||||||||
Year ended December 31, 2014
|
CMP | Auto | Other | Total | Midwest | Specialty | Auto | Total | Total | |||||||||||||||||||||||||
Gross written premiums |
$ | 35,613 | $ | 7,745 | $ | 9,228 | $ | 2,470 | $ | 55,056 | $ | 8,080 | $ | 12,305 | $ | 8,406 | $ | 28,791 | — | $ | 83,847 | |||||||||||||
Net earned premiums |
24,246 | 5,373 | 4,564 | 1,566 | 35,749 | 6,495 | 3,651 | 11,633 | 21,779 | — | 57,528 | |||||||||||||||||||||||
Other income (loss) |
766 | 129 | 23 | — | 918 | 340 | 2 | 562 | 904 | $ | (13 | ) | 1,809 | |||||||||||||||||||||
| | | | | | | | | | | | | | | | | | | | | | | | | | | | | | | | | | | |
Segment revenue |
25,012 | 5,502 | 4,587 | 1,566 | 36,667 | 6,835 | 3,653 | 12,195 | 22,683 | (13 | ) | 59,337 | ||||||||||||||||||||||
Loss and loss adjustment expenses, net |
14,668 | 1,638 | 3,257 | 1,058 | 20,621 | 8,390 | 1,254 | 10,465 | 20,109 | — | 40,730 | |||||||||||||||||||||||
Policy acquisition costs |
6,265 | 1,453 | 1,187 | 304 | 9,209 | 1,977 | 1,149 | 2,361 | 5,487 | — | 14,696 | |||||||||||||||||||||||
Operating expenses |
3,330 | 671 | 366 | 199 | 4,566 | 380 | 328 | 1,745 | 2,453 | 5,120 | 12,139 | |||||||||||||||||||||||
| | | | | | | | | | | | | | | | | | | | | | | | | | | | | | | | | | | |
Segment expense |
24,263 | 3,762 | 4,810 | 1,561 | 34,396 | 10,747 | 2,731 | 14,571 | 28,049 | 5,120 | 67,565 | |||||||||||||||||||||||
| | | | | | | | | | | | | | | | | | | | | | | | | | | | | | | | | | | |
Segment underwriting gain (loss) |
$ | 749 | $ | 1,740 | $ | (223 | ) | $ | 5 | $ | 2,271 | $ | (3,912 | ) | $ | 922 | $ | (2,376 | ) | $ | (5,366 | ) | (5,133 | ) | (8,228 | ) | ||||||||
| | | | | | | | | | | | | | | | | | | | | | | | | | | | | | | | | | | |
| | | | | | | | | | | | | | | | | | | | | | | | | | | | | | | | | | | |
| | | | | | | | | | | | | | | | | | | | | | | | | | | | | | | | | | | |
Investment income |
1,175 | 1,175 | ||||||||||||||||||||||||||||||||
Net realized investment gains |
417 | 417 | ||||||||||||||||||||||||||||||||
Interest expense |
(584 | ) | (584 | ) | ||||||||||||||||||||||||||||||
| | | | | | | | | | | | | | | | | | | | | | | | | | | | | | | | | | | |
Loss before income taxes |
$ | (4,125 | ) | $ | (7,220 | ) | ||||||||||||||||||||||||||||
| | | | | | | | | | | | | | | | | | | | | | | | | | | | | | | | | | | |
| | | | | | | | | | | | | | | | | | | | | | | | | | | | | | | | | | | |
| | | | | | | | | | | | | | | | | | | | | | | | | | | | | | | | | | | |
| |
Commercial Lines | Personal Lines | |
|
||||||||||||||||||||||||||||||
|---|---|---|---|---|---|---|---|---|---|---|---|---|---|---|---|---|---|---|---|---|---|---|---|---|---|---|---|---|---|---|---|---|---|---|
| |
|
|
|
|
|
Homeowners | |
|
|
|
||||||||||||||||||||||||
| |
|
Other Liability |
|
|
|
|
|
Corporate & Other |
|
|||||||||||||||||||||||||
Year ended December 31, 2013
|
CMP | Auto | Other | Total | Midwest | Specialty | Auto | Total | Total | |||||||||||||||||||||||||
Gross written premiums |
$ | 21,133 | $ | 4,485 | $ | 769 | $ | 935 | $ | 27,321 | $ | 6,250 | $ | 3,759 | $ | 6,757 | $ | 16,766 | — | $ | 44,087 | |||||||||||||
Net earned premiums |
11,699 | 3,358 | 678 | (15 | ) | 15,720 | 3,895 | 1,153 | 6,861 | 11,909 | — | 27,629 | ||||||||||||||||||||||
Other income |
305 | 43 | 9 | — | 357 | 338 | — | 59 | 397 | $ | 80 | 834 | ||||||||||||||||||||||
| | | | | | | | | | | | | | | | | | | | | | | | | | | | | | | | | | | |
Segment revenue |
12,004 | 3,401 | 687 | (15 | ) | 16,077 | 4,233 | 1,153 | 6,920 | 12,306 | 80 | 28,463 | ||||||||||||||||||||||
Loss and loss adjustment expenses, net |
6,122 | (1,008 | ) | 342 | 172 | 5,628 | 2,924 | 889 | 6,383 | 10,196 | — | 15,824 | ||||||||||||||||||||||
Policy acquisition costs |
2,966 | 770 | 189 | 48 | 3,973 | 1,148 | 493 | 2,053 | 3,694 | — | 7,667 | |||||||||||||||||||||||
Operating expenses |
3,714 | 776 | 170 | 205 | 4,865 | 370 | 161 | 167 | 698 | 3,598 | 9,161 | |||||||||||||||||||||||
| | | | | | | | | | | | | | | | | | | | | | | | | | | | | | | | | | | |
Segment expense |
12,802 | 538 | 701 | 425 | 14,466 | 4,442 | 1,543 | 8,603 | 14,588 | 3,598 | 32,652 | |||||||||||||||||||||||
| | | | | | | | | | | | | | | | | | | | | | | | | | | | | | | | | | | |
Segment underwriting gain (loss) |
$ | (798 | ) | $ | 2,863 | $ | (14 | ) | $ | (440 | ) | $ | 1,611 | $ | (209 | ) | $ | (390 | ) | $ | (1,683 | ) | $ | (2,282 | ) | (3,518 | ) | (4,189 | ) | |||||
| | | | | | | | | | | | | | | | | | | | | | | | | | | | | | | | | | | |
| | | | | | | | | | | | | | | | | | | | | | | | | | | | | | | | | | | |
| | | | | | | | | | | | | | | | | | | | | | | | | | | | | | | | | | | |
Investment income |
1,000 | 1,000 | ||||||||||||||||||||||||||||||||
Net realized investment gains |
299 | 299 | ||||||||||||||||||||||||||||||||
Gain on acquisition |
3,714 | 3,714 | ||||||||||||||||||||||||||||||||
Interest expense |
(541 | ) | (541 | ) | ||||||||||||||||||||||||||||||
| | | | | | | | | | | | | | | | | | | | | | | | | | | | | | | | | | | |
Income before income taxes |
$ | 954 | $ | 283 | ||||||||||||||||||||||||||||||
| | | | | | | | | | | | | | | | | | | | | | | | | | | | | | | | | | | |
| | | | | | | | | | | | | | | | | | | | | | | | | | | | | | | | | | | |
| | | | | | | | | | | | | | | | | | | | | | | | | | | | | | | | | | | |
F-67
CONIFER HOLDINGS, INC. AND SUBSIDIARIES
Notes to Consolidated Financial Statements (Continued)
(dollars in thousands, except per share amounts)
22. Segment Information (Continued)
| |
Commercial Lines | Personal Lines | |
|
||||||||||||||||||||||||||||||
|---|---|---|---|---|---|---|---|---|---|---|---|---|---|---|---|---|---|---|---|---|---|---|---|---|---|---|---|---|---|---|---|---|---|---|
| |
|
|
|
|
|
Homeowners | |
|
|
|
||||||||||||||||||||||||
| |
|
Other Liability |
|
|
|
|
|
Corporate & Other |
|
|||||||||||||||||||||||||
Year ended December 31, 2012
|
CMP | Auto | Other | Total | Midwest | Specialty | Auto | Total | Total | |||||||||||||||||||||||||
Gross written premiums |
$ | 10,513 | $ | 2,636 | $ | 802 | $ | 3 | $ | 13,954 | $ | 2,900 | $ | 1,287 | $ | 4,697 | $ | 8,884 | — | $ | 22,838 | |||||||||||||
Net earned premiums |
8,094 | 2,882 | 641 | 4 | 11,621 | 1,273 | 235 | 3,805 | 5,313 | — | 16,934 | |||||||||||||||||||||||
Other income |
106 | 20 | 10 | — | 136 | 172 | — | 1 | 173 | — | 309 | |||||||||||||||||||||||
| | | | | | | | | | | | | | | | | | | | | | | | | | | | | | | | | | | |
Segment revenue |
8,200 | 2,902 | 651 | 4 | 11,757 | 1,445 | 235 | 3,806 | 5,486 | — | 17,243 | |||||||||||||||||||||||
Loss and loss adjustment expenses, net |
2,196 | 1,213 | 305 | — | 3,714 | 870 | 94 | 2,913 | 3,877 | — | 7,591 | |||||||||||||||||||||||
Policy acquisition costs |
2,157 | 547 | 164 | 15 | 2,883 | 375 | 68 | 1,326 | 1,769 | — | 4,652 | |||||||||||||||||||||||
Other underwriting and operating expenses |
2,022 | 327 | 114 | — | 2,463 | 205 | 71 | 22 | 298 | $ | 3,759 | 6,520 | ||||||||||||||||||||||
| | | | | | | | | | | | | | | | | | | | | | | | | | | | | | | | | | | |
Segment expense |
6,375 | 2,087 | 583 | 15 | 9,060 | 1,450 | 233 | 4,261 | 5,944 | 3,759 | 18,763 | |||||||||||||||||||||||
| | | | | | | | | | | | | | | | | | | | | | | | | | | | | | | | | | | |
Segment underwriting gain (loss) |
$ | 1,825 | $ | 815 | $ | 68 | $ | (11 | ) | $ | 2,697 | $ | (5 | ) | $ | 2 | $ | (455 | ) | $ | (458 | ) | (3,759 | ) | (1,520 | ) | ||||||||
| | | | | | | | | | | | | | | | | | | | | | | | | | | | | | | | | | | |
| | | | | | | | | | | | | | | | | | | | | | | | | | | | | | | | | | | |
| | | | | | | | | | | | | | | | | | | | | | | | | | | | | | | | | | | |
Investment income |
1,072 | 1,072 | ||||||||||||||||||||||||||||||||
Net realized investment gains |
1,273 | 1,273 | ||||||||||||||||||||||||||||||||
Interest expense |
(428 | ) | (428 | ) | ||||||||||||||||||||||||||||||
| | | | | | | | | | | | | | | | | | | | | | | | | | | | | | | | | | | |
Income (loss) before income taxes |
$ | (1,842 | ) | $ | 397 | |||||||||||||||||||||||||||||
| | | | | | | | | | | | | | | | | | | | | | | | | | | | | | | | | | | |
| | | | | | | | | | | | | | | | | | | | | | | | | | | | | | | | | | | |
| | | | | | | | | | | | | | | | | | | | | | | | | | | | | | | | | | | |
The Company's assets on the consolidated balance sheets are not allocated to the reportable segments. The accounting policies of the segments are the same as those described in Note 2, Summary of Significant Accounting Policies.
23. Subsequent Events
The Company has evaluated subsequent events from the balance sheet date through May 6, 2015, the date at which the consolidated financial statements were originally issued and July 30, 2015, the date on which the retrospectively adjusted consolidated financial statements were issued to reflect the common stock split, as described in Note 2.
Exit of the Personal Automobile Product Line
In January 2015, the Company notified its insurance regulator in the State of Florida of its intent to stop writing non-standard personal automobile policies. As of December 31, 2014, the Company had 3,370 automobile policies in force. The Company discontinued offering and writing new policies on January 27, 2015, but will continue to service existing policies, pay claims and perform other administrative services. In early 2014, the Company discontinued writing non-standard personal automobile business in Illinois. Combined, Florida and Illinois represented all non-standard personal automobile business written by the Company. The Company has no plans to provide or write this insurance coverage in the future. Hereafter, this product line will solely be in run-off. The Company received approval to discontinue its offering of personal automobile insurance policies from the insurance regulators in April 2015. The personal automobile product line contributed $11,633, $6,861 and $3,805 to net earned premiums and $2,376, $1,683 and $455 to loss before income taxes of the Company for the years ended December 31, 2014, 2013 and 2012, respectively.
The decision to stop writing personal automobile policies is the result of the Company's change in strategic positioning and its desire to increase its personal homeowners product line and pursue existing commercial line opportunities in this market.
F-68
CONIFER HOLDINGS, INC. AND SUBSIDIARIES
Notes to Consolidated Financial Statements (Continued)
(dollars in thousands, except per share amounts)
23. Subsequent Events (Continued)
Stock Incentive Plan
In March 2015, the Company established a 2015 Omnibus Incentive Plan ("2015 Plan"), which permits the granting of stock options, stock appreciation rights, restricted stock units and other stock-based awards. The 2015 Plan authorizes up to 1,377,000 shares of common stock for awards to be issued to employees, directors or consultants of the Company. The stock-based awards will be issued at no less than the market price on the date the awards are granted.
Modification of Terms and Preferences of Preferred Stock
In March 2015, the Company further amended its articles of incorporation with the consent of more than 80% of the holders of redeemable preferred stock and a majority of the holders of common stock to restrict the definition of a Liquidation Event to the liquidation, dissolution or winding up of the Company and to eliminate from that definition a change of control or a public offering of the Company. All or part of the redeemable preferred shares may be redeemed after one year from the date of issuance, at the option of the Company by a cash payment of the original purchase price plus any accumulated and as yet unpaid Preferred Dividends and PIK Interest. The Company will reclassify the carrying amount of its redeemable preferred stock from temporary equity to permanent equity on the effective date of the modification as the redemption of the redeemable preferred stock is within the Company's control.
F-69
INDEPENDENT AUDITORS' REPORT
To
the Board of Directors of
EGI Insurance Services, Inc.
Birmingham, MI
We have audited the accompanying consolidated financial statements of EGI Insurance Services, Inc. and subsidiaries (the "Company"), which comprise the consolidated balance sheet as of November 30, 2013, and the related consolidated statements of comprehensive income (loss), changes in shareholder's equity, and cash flows for the eleven-month period ended November 30, 2013, and the related notes to the consolidated financial statements.
Management's Responsibility for the Financial Statements
Management is responsible for the preparation and fair presentation of these consolidated financial statements in accordance with accounting principles generally accepted in the United States of America; this includes the design, implementation, and maintenance of internal control relevant to the preparation and fair presentation of consolidated financial statements that are free from material misstatement, whether due to fraud or error.
Auditors' Responsibility
Our responsibility is to express an opinion on these consolidated financial statements based on our audit. We conducted our audit in accordance with auditing standards generally accepted in the United States of America. Those standards require that we plan and perform the audit to obtain reasonable assurance about whether the consolidated financial statements are free from material misstatement.
An audit involves performing procedures to obtain audit evidence about the amounts and disclosures in the consolidated financial statements. The procedures selected depend on the auditor's judgment, including the assessment of the risks of material misstatement of the consolidated financial statements, whether due to fraud or error. In making those risk assessments, the auditor considers internal control relevant to the Company's preparation and fair presentation of the consolidated financial statements in order to design audit procedures that are appropriate in the circumstances, but not for the purpose of expressing an opinion on the effectiveness of the Company's internal control. Accordingly, we express no such opinion. An audit also includes evaluating the appropriateness of accounting policies used and the reasonableness of significant accounting estimates made by management, as well as evaluating the overall presentation of the consolidated financial statements.
We believe that the audit evidence we have obtained is sufficient and appropriate to provide a basis for our audit opinion.
Opinion
In our opinion, the consolidated financial statements referred to above present fairly, in all material respects, the financial position of EGI Insurance Services, Inc. and subsidiaries as of November 30, 2013, and the results of its operations and its cash flows for the eleven-month period ended November 30, 2013 in accordance with accounting principles generally accepted in the United States of America.
/s/ Deloitte & Touche LLP
Detroit,
MI
May 6, 2015
F-70
EGI Insurance Services, Inc. and Subsidiaries
Consolidated Balance Sheet
November 30, 2013
Assets |
||||
Investment securities: |
||||
Fixed maturity securities, at fair value (amortized cost $892,406) |
$ | 879,618 | ||
Short-term investments, at cost (approximates fair value) |
7,830,074 | |||
| | | | | |
Total investment securities |
8,709,692 | |||
Cash and cash equivalents |
3,428,462 |
|||
Premiums receivable |
2,329,351 | |||
Deferred policy acquisition costs |
79,550 | |||
Intangible assets, net |
194,579 | |||
Other assets |
167,169 | |||
| | | | | |
Total assets |
$ | 14,908,803 | ||
| | | | | |
| | | | | |
| | | | | |
Liabilities and Shareholder's Equity |
||||
Liabilities |
||||
Unpaid loss and loss adjustment expenses |
$ | 4,828,972 | ||
Unearned premiums |
3,229,665 | |||
Deferred tax liabilities |
68,000 | |||
Accounts payable and accrued liabilities |
142,971 | |||
Other liabilities |
8,330 | |||
| | | | | |
Total liabilities |
8,277,938 | |||
| | | | | |
Shareholder's equity |
||||
Common stock, $100 par value; authorized 106,500 shares; issued and outstanding shares |
10,650,000 | |||
Additional paid-in capital |
5,742,807 | |||
Accumulated deficit |
(9,753,630 | ) | ||
Accumulated other comprehensive loss |
(8,312 | ) | ||
| | | | | |
Total shareholder's equity |
6,630,865 | |||
| | | | | |
Total liabilities and shareholder's equity |
$ | 14,908,803 | ||
| | | | | |
| | | | | |
| | | | | |
The accompanying notes are an integral part of these financial statements.
F-71
EGI Insurance Services, Inc. and Subsidiaries
Consolidated Statement of Comprehensive Income (Loss)
For the Eleven Months Ended November 30,
2013
Revenue |
||||
Gross written premiums |
$ |
11,923,576 |
||
Ceded written premiums |
(3,292,794 | ) | ||
Change in net earned premiums |
(1,835,885 | ) | ||
| | | | | |
Net earned premiums |
6,794,897 | |||
Net investment income |
176,531 | |||
Net realized investment gains |
592,708 | |||
Other income |
976,068 | |||
| | | | | |
Total revenue |
8,540,204 | |||
| | | | | |
Expenses |
||||
Unpaid losses and loss adjustment expenses |
6,099,102 |
|||
Policy acquisition costs |
822,325 | |||
Operating expenses |
3,148,518 | |||
| | | | | |
Total expenses |
10,069,945 | |||
| | | | | |
Loss before income taxes |
(1,529,741 | ) | ||
Income tax expense |
237,577 |
|||
| | | | | |
Net loss |
(1,767,318 | ) | ||
Other comprehensive loss, net of tax: |
||||
Net changes related to available for sale securities: |
||||
Unrealized loss during the period, net of tax of $10,445 |
(19,398 | ) | ||
Less: Reclassifications of gains to net loss, net of tax of $242,358 |
450,093 | |||
| | | | | |
Other comprehensive loss |
(469,491 | ) | ||
| | | | | |
Comprehensive loss |
$ | (2,236,809 | ) | |
| | | | | |
| | | | | |
| | | | | |
The accompanying notes are an integral part of these consolidated financial statements.
F-72
EGI Insurance Services, Inc. and Subsidiaries
Consolidated Statement of Changes in Shareholder's Equity
For the Eleven Months Ended November 30,
2013
| |
Common stock | |
|
Accumulated Other Comprehensive Income (Loss) |
|
||||||||||||||
|---|---|---|---|---|---|---|---|---|---|---|---|---|---|---|---|---|---|---|---|
| |
Additional Paid-in Capital |
Accumulated Deficit |
Total Shareholder's Equity |
||||||||||||||||
| |
Shares | Amount | |||||||||||||||||
Balances at January 1, 2013 |
106,500 | $ | 10,650,000 | $ | 2,000,000 | $ | (7,986,312 | ) | $ | 461,179 | $ | 5,124,867 | |||||||
Net loss |
— | — | — | (1,767,318 | ) | — | (1,767,318 | ) | |||||||||||
Contributions from Parent |
— | — | 839,738 | — | — | 839,738 | |||||||||||||
Forgiveness of loan from Parent (Note 13) |
— | — | 2,350,000 | — | — | 2,350,000 | |||||||||||||
Forgiveness of management fees charged by Parent (Note 13) |
— | — | 553,069 | — | — | 553,069 | |||||||||||||
Other comprehensive loss |
— | — | — | — | (469,491 | ) | (469,491 | ) | |||||||||||
| | | | | | | | | | | | | | | | | | | | |
Balances at November 30, 2013 |
106,500 | $ | 10,650,000 | $ | 5,742,807 | $ | (9,753,630 | ) | $ | (8,312 | ) | $ | 6,630,865 | ||||||
| | | | | | | | | | | | | | | | | | | | |
| | | | | | | | | | | | | | | | | | | | |
| | | | | | | | | | | | | | | | | | | | |
The accompanying notes are an integral part of these consolidated financial statements.
F-73
EGI Insurance Services, Inc.
Consolidated Statement of Cash Flows
For the Eleven Months Ended November 30, 2013
Cash Flows from Operating Activities |
||||
Net loss |
$ | (1,767,318 | ) | |
Adjustments to reconcile net loss to net cash provided by operating activities: |
||||
Depreciation and amortization of property and equipment, and intangibles |
36,936 | |||
Amortization of bond premium and discount, net |
26,053 | |||
Gains on investments |
(592,708 | ) | ||
Deferred income taxes |
248,499 | |||
Changes in operating assets and liabilities: |
||||
Due from Parent |
79,274 | |||
Premiums receivable |
325,061 | |||
Reinsurance recoverables from reinsurers, net |
364,364 | |||
Deferred policy acquisition costs |
120,633 | |||
Other assets |
123,305 | |||
Unpaid losses and loss adjustment expenses |
3,451,833 | |||
Unearned premium |
1,835,884 | |||
Reinsurance premium payable |
(1,390,889 | ) | ||
Accounts payable and accrued expenses |
(1,579,240 | ) | ||
Other liabilities |
(113,823 | ) | ||
| | | | | |
Net cash provided by operating activities |
1,167,864 | |||
| | | | | |
Cash Flows From Investing Activities |
||||
Purchase of short-term investments |
(7,789,243 | ) | ||
Proceeds from sales of investments: |
||||
Fixed maturity securities |
6,232,129 | |||
Equity securities |
1,318,950 | |||
Short-term investments |
900,000 | |||
Purchases of property and equipment |
(27,972 | ) | ||
| | | | | |
Net cash provided by investing activities |
633,864 | |||
| | | | | |
Cash Flows From Financing Activities |
||||
Contributions from Parent |
839,738 | |||
| | | | | |
Net increase in cash |
2,641,466 | |||
Cash at beginning of period |
786,996 | |||
| | | | | |
Cash at end of period |
$ | 3,428,462 | ||
| | | | | |
| | | | | |
| | | | | |
Noncash Investing and Financing Activities: |
||||
A loan payable in the amount of $2,350,000 was forgiven by the Parent and recorded as an equity contribution. Refer to Note 13. |
||||
An amount payable of $553,069 due to Parent was forgiven and recorded as an equity contribution. Refer to Note 13. |
The accompanying notes are an integral part of these consolidated financial statements.
F-74
EGI Insurance Services, Inc.
Notes to Consolidated Financial Statements
November 30, 2013
1. Organization and Description of Business
EGI Insurance Services, Inc. ("EGI Services") is a Delaware incorporated holding company that was wholly owned by EGI Financial Holdings, Inc. (the "Parent"), a property and casualty insurance company, based in Toronto, Canada.
EGI Services has two wholly owned subsidiaries, American Colonial Insurance Company (formerly known as Echelon Insurance Company of America) ("ACIC") and EGI Insurance Services (Florida) Inc. ("EGI Florida"). The consolidated financial statements include the accounts of the aforementioned entities (collectively, the "Company").
ACIC is a property and casualty insurance company licensed in the State of Florida, primarily focusing on nonstandard automobile insurance in the southeastern United States ("U.S."). Founded in 1957, the Company's focus is on underwriting opportunities not served by many of the larger, standard insurers.
EGI Florida is a State of Florida based managing general agent ("MGA") focused primarily on administering the issuance of nonstandard automobile insurance and claims handling in the State of Texas through Home State County Mutual Insurance Company and in Florida, Georgia, Alabama, and Louisiana through ACIC.
2. Summary of Significant Accounting Policies
Basis of Presentation
The accompanying consolidated financial statements have been prepared in accordance with U.S. generally accepted accounting principles ("U.S. GAAP") which differ in some respects from statutory accounting practices ("SAP") which are prescribed or permitted by the various state insurance regulatory authorities in the U.S.
Principles of Consolidation
The consolidated financial statements include the accounts of the Company and its wholly owned subsidiaries. Intercompany accounts and transactions have been eliminated.
Use of Estimates
The preparation of financial statements in conformity with U.S. GAAP requires management to make estimates and assumptions that affect the reported amounts of assets and liabilities and disclosure of contingent assets and liabilities at the date of the financial statements and the reported amounts of revenues and expenses during the reporting period. Due to the inherent uncertainty involved in making estimates, actual results reported in the future periods may be based upon amounts that differ from these estimates.
Cash and Cash Equivalents, and Short-term Investments
Cash and cash equivalents consists of cash deposits in banks, generally operating accounts, and certificates of deposits with original maturities of ninety days or less. Short-term investments, consisting of money market funds, are classified as investments in the consolidated balance sheets as they relate principally to the Company's investment activities. The Company maintains its cash deposits in major banks and invests short-term funds in institutional money-market funds.
F-75
EGI Insurance Services, Inc.
Notes to Consolidated Financial Statements (Continued)
November 30, 2013
2. Summary of Significant Accounting Policies (Continued)
Investments Securities
Investment securities, consisting of fixed maturity securities, are classified as available for sale and reported at fair value. Any changes during the year in the fair values of investments are recognized in other comprehensive income. The cumulative change in the fair values of investments previously recognized in accumulated other comprehensive income are reclassified to net income when they are realized or the decline in value is considered to be other than temporary.
The Company evaluates its investment portfolio on a regular basis to identify securities that may be other-than-temporarily impaired. When such impairments occur, the decrease in fair value are reported in the results of operations as a realized investment loss and a new cost basis is established. The analysis takes into account relevant factors, both quantitative and qualitative in nature. Among the factors considered are the following:
- •
- The length of time and the extent to which fair value has been less than cost;
- •
- Issuer-specific considerations, including an issuer's short-term prospects and financial condition, recent news that may have an
adverse impact on its results, and an event of missed or late payment or default;
- •
- The occurrence of a significant economic event that may affect the industry in which an issuer participates; and
- •
- For loan-backed and structured securities, the undiscounted estimated future cash flows as compared to the current book value.
With respect to a security where the decline in fair value is determined to be temporary and the security's value is not written down, a subsequent decision may be made to sell that security and realize a loss. If it is not expected that a security's decline in fair value will be fully recovered prior to the expected time of sale, an other-than-temporary impairment would be recorded in the period in which the decision to sell is made.
Transaction costs related to available for sale investments are capitalized on initial recognition and, where applicable, are amortized to interest income using the effective yield method.
Investment income is recorded as it accrues. Dividend income on shares is accrued on the ex-dividend date. Gains and losses on disposal of investments are determined and recorded based on the trade date and are calculated using the average cost of the investments held.
Reinsurance
The Company enters into reinsurance contracts to protect it against the impact of large losses, to limit exposure and to provide additional capacity for growth. Such reinsurance reduces the magnitude of such losses on net income of the Company. Reinsurance makes the assuming reinsurer liable to the ceding company to the extent of the reinsurance. It does not, however, discharge the ceding company from its primary liability to its policyholders in the event the reinsurer is unable to meet its obligations under such reinsurance agreements. The Company monitors the financial condition of its reinsurers and does not believe that is currently exposed to any material credit risk through its ceded reinsurance arrangements.
F-76
EGI Insurance Services, Inc.
Notes to Consolidated Financial Statements (Continued)
November 30, 2013
2. Summary of Significant Accounting Policies (Continued)
Reinsurance premiums and liabilities related to reinsured business are accounted for on a basis consistent with those used in accounting for the original policies issued and the terms of the reinsurance contracts. Ceding commissions are reported as a reduction of underwriting expenses.
Premiums Receivable
Premiums receivable represent unpaid premium balances due from policyholders. Management provides an allowance for those accounts older than ninety days and specific individual accounts. All other accounts are reviewed on a pooled basis. Account balances are charged-off against the allowance after all means of collection have been exhausted and the potential for recovery is considered remote.
Property, Equipment and Computer Software
Property, equipment and computer software are recorded at cost less accumulated depreciation. Depreciation and amortization are provided over the estimated useful lives of the assets using the straight-line method over the following terms:
Furniture and equipment |
3 years | |
Computer hardware |
3 years | |
Computer software |
2 years |
Intangible Assets
Intangible assets consists of four state insurance licenses, valued at $50,000 each, for the states of Alabama, Louisiana, Georgia, and Florida. The Company begins amortizing the cost of these licenses when it commences activity in a particular state. The licenses are amortized using the straight-line method over a period of 30 years. Amortization expense for the eleven months ended November 30, 2013 was $1,529.
Liability for Unpaid Losses and Loss Adjustment Expenses
The liability for unpaid losses and loss adjustment expenses is an actuarially determined estimate of reported case losses and loss adjustment expenses, and an estimate of incurred but not reported losses and loss adjustment expenses based on Company and industry experience. The liability for unpaid losses and loss adjustment expenses represent the accumulation of individual case estimates for reported losses and loss adjustment expenses, and actuarial determined estimates for incurred but not reported losses and loss adjustment expenses. The liability for unpaid losses and loss adjustment expenses are intended to include the ultimate net cost of all losses and loss adjustment expenses incurred but unpaid as of the balance sheet date. The liability is stated net of anticipated deductibles, salvage and subrogation, and gross of reinsurance ceded. Reinsurance recoverables of paid and unpaid losses and loss adjustment expenses are reflected as assets. The estimate of the unpaid losses and loss adjustment expenses liability are continually reviewed and updated. Although management believes the liability for unpaid losses and loss adjustment expenses is reasonable, the ultimate liability may be more or less than the current estimate.
The estimation of ultimate liability for unpaid losses and loss adjustment expenses is a complex, imprecise and inherently uncertain process, and therefore involves a considerable degree of judgment and expertise. The Company utilizes various actuarially-accepted reserving methodologies in deriving the continuum of expected outcomes and ultimately determining its estimated liability amount. These
F-77
EGI Insurance Services, Inc.
Notes to Consolidated Financial Statements (Continued)
November 30, 2013
2. Summary of Significant Accounting Policies (Continued)
methodologies utilize various inputs, including but not limited to written and earned premiums, paid and reported losses and loss adjustment expenses, expected initial loss and loss adjustment expenses ratio, which is the ratio of incurred losses and loss adjustment expenses to earned premiums, and expected claim reporting and payout patterns (company specific and industry data). The liability for unpaid losses and loss adjustment expenses does not represent an exact measurement of liability, but are estimates that are not directly or precisely quantifiable, particularly on a prospective basis, and are subject to a significant degree of variability over time. In addition, the establishment of the liability for unpaid losses and loss adjustment expenses makes no provision for the broadening of coverage by legislative action or judicial interpretation or for the extraordinary future emergence of new types of losses not sufficiently represented in the Company's historical experience or which cannot yet be quantified. As a result, an integral component of estimating the liability for unpaid losses and loss adjustment expenses is the use of informed subjective estimates and judgments about the ultimate exposure to unpaid losses and loss adjustment expenses. The impact of changes in the estimate is reflected in current operations.
Recognition of Premium Revenue
The Company issues nonstandard auto insurance with a six month policy life. These policies are earned on a daily pro-rata basis over the six months life of the policy. Insurance premiums written are deferred as unearned premiums and taken into income pro rata over the terms of the underlying policies. The portion of the premium related to the unexpired term of the policy at the end of the reporting period is reflected in unearned premiums.
Other Income
Other income consists primarily of fees charged by ACIC for installment payments made by the policyholders. Commission income is received by the Company's insurance agency for writing policies for third party insurance companies. The Company recognizes commission income on the later of the effective date of the policy, the date when the premium can be reasonably established, or the date when substantially all services related to the insurance placement have been rendered.
Income Taxes
Income taxes are accounted for under the asset and liability method. Deferred tax assets and liabilities are recognized for the future tax consequences attributable to differences between the financial statement carrying amounts of existing assets and liabilities and their respective tax bases and operating loss and tax credit carryforwards. Deferred tax assets and liabilities are measured using enacted tax rates expected to apply to taxable income in the years in which those temporary differences are expected to be recovered or settled. The effect on deferred tax assets and liabilities of a change in tax rates is recognized in income in the period that includes the enactment date.
Deferred tax assets are recognized to the extent that there is sufficient positive evidence, as allowed under ASC 740 Income Taxes, to support the recoverability of those deferred tax assets. The Company establishes a valuation allowance to the extent that there is insufficient evidence to support the recoverability of the deferred tax asset under ASC 740. In making such a determination, management considers all available positive and negative evidence, including future reversals of existing taxable temporary differences, projected future taxable income, tax-planning strategies, and results of recent operations. If it is determined that the deferred tax assets would be realizable in the future in
F-78
EGI Insurance Services, Inc.
Notes to Consolidated Financial Statements (Continued)
November 30, 2013
2. Summary of Significant Accounting Policies (Continued)
excess of their net recorded amount, an adjustment would be made to the deferred tax asset valuation allowance, which would reduce the provision for income taxes.
The Company records interest and penalties related to tax uncertainties as income tax expense. Accrued interest and penalties are included on the related tax liability line in the consolidated balance sheet. Based on management's evaluation, the Company concluded there were no significant uncertain tax positions requiring recognition in its consolidated financial statements.
The Company files a consolidated tax return with its wholly owned subsidiaries, EGI FL and ACIC. The provision for federal income taxes is based on income which is currently taxable under the tax-sharing agreement. Under the terms of the tax-sharing agreement, income tax provisions are allocated to the respective companies based on their contribution to consolidated taxable income.
Guaranty Fund Assessments
Under Florida law, the Company is subject to state guaranty fund assessments, the purpose of which is to collect money from solvent insurance companies to cover certain losses resulting from the insolvency or rehabilitation of other insurance companies. The Company's policy is to recognize its obligation for guaranty fund assessments when it becomes aware that an insolvency has occurred for which the Company will be assessed.
Deferred Policy Acquisition Costs
Costs incurred which are incremental or directly related to the successful acquisition of new or renewal insurance business is deferred. These deferred costs consist principally of commissions paid to agents and premium taxes. Proceeds from reinsurance transactions that represent recovery of acquisition costs reduce applicable unamortized acquisition costs in such a manner that net acquisition costs are capitalized and charged to expense. Amortization of such policy acquisition costs is charged to expense in proportion to premium earned over the estimated policy term.
To the extent that unearned premium on existing policies are not adequate to cover the sum of expected losses and loss adjustment expenses, unamortized acquisition costs and policy maintenance costs, unamortized deferred policy acquisition costs are charged to expense to the extent required to eliminate the premium deficiency. If the premium deficiency were greater than the unamortized policy acquisition costs, a liability is recorded for any such deficiency. The Company does not include anticipated investment income in determining whether a premium deficiency exists. The Company did not experience a premium deficiency during the period presented.
Recently Issued Accounting Pronouncements
Reporting of Amounts Reclassified Out of Accumulated Other Comprehensive Income
In February 2013, the FASB issued guidance to improve the reporting of reclassifications out of accumulated other comprehensive income. The guidance requires an entity to report the effect of significant reclassifications out of accumulated other comprehensive income on the respective line items in net income if the amount being reclassified is required under GAAP to be reclassified in its entirety to net income. For other amounts that are not required under GAAP to be reclassified in their entirety to net income in the same reporting period, an entity is required to cross-reference other disclosures required under GAAP that provide addition detail about those amounts. The guidance is to be applied prospectively for reporting periods beginning after December 15, 2012. The Company adopted this new
F-79
EGI Insurance Services, Inc.
Notes to Consolidated Financial Statements (Continued)
November 30, 2013
2. Summary of Significant Accounting Policies (Continued)
guidance on January 1, 2013 and included the required disclosures in Note 15—Accumulated Other Comprehensive Income.
Presentation of an Unrecognized Tax Benefit When a Net Operating Loss Carryforward, a Similar Loss, or a Tax Credit Carryforward Exists
In July 2013, the FASB issued a new standard that requires entities to present an unrecognized tax benefit as a reduction of a deferred tax asset for a net operating loss carryforward, or similar tax loss or tax credit carryforward, rather than as a liability when the uncertain tax position would reduce the net operating loss or other carryforward under the tax law of the applicable jurisdiction and when the entity intends to use the deferred tax asset for that purpose. The new standard will be effective for fiscal years and interim periods within those years that begin after December 15, 2013. The adoption of the new standard did not have a material impact on the Company's consolidated financial statements.
Presentation of Financial Statements—Going Concern
In August 2014, the FASB issued ASU No. 2014-15, "Presentation of Financial Statements—Going Concern (Subtopic 205-40)," which requires management to evaluate, at each annual and interim reporting period, whether there is substantial doubt about the Company's ability to continue as a going concern within one year after the date the financial statements are issued and provide related footnote disclosures. The standard is effective for the annual period ending after December 15, 2016 and for the annual and interim periods thereafter. Early adoption is permitted. This standard is not expected to have a material impact on the Company's financial statements.
3. Investments
The amortized cost, gross unrealized gains and losses, and fair value of fixed maturity securities, by major security type, that are classified as available for sale at November 30, 2013 are as follows:
| |
Amortized Cost |
Gross Unrealized Gains |
Gross Unrealized Losses |
Fair Value |
|||||||||
|---|---|---|---|---|---|---|---|---|---|---|---|---|---|
Bonds |
|||||||||||||
U.S. Government obligations |
$ | 892,406 | $ | 17,720 | $ | (30,508 | ) | $ | 879,618 | ||||
| | | | | | | | | | | | | | |
|
$ | 892,406 | $ | 17,720 | $ | (30,508 | ) | $ | 879,618 | ||||
| | | | | | | | | | | | | | |
| | | | | | | | | | | | | | |
| | | | | | | | | | | | | | |
Fixed income securities with fair market value of $879,618 were on deposit with the Florida Department of Financial Services, Office of Insurance Regulation as of November 30, 2013, as required by Florida Statutes.
At November 30, 2013, the Company held an investment with a gross unrealized loss of $(30,508) and related fair value of $565,860 for a period of less than 12 months. The loss is considered temporary due to the short duration, low magnitude of the losses and management intent to hold until maturity.
F-80
EGI Insurance Services, Inc.
Notes to Consolidated Financial Statements (Continued)
November 30, 2013
3. Investments (Continued)
The amortized cost and fair value of fixed maturity securities at November 30, 2013 by contractual maturity are shown below. Expected maturities differ from contractual maturities because borrowers may have the right to call or prepay obligations with or without call or prepayment penalties.
| |
Amortized Cost |
Fair Value |
|||||
|---|---|---|---|---|---|---|---|
Due in one year or less |
$ | — | $ | — | |||
Due after one year through five years |
296,039 | 313,758 | |||||
Due after five years through ten years |
— | — | |||||
Due after ten years |
596,367 | 565,860 | |||||
| | | | | | | | |
Total fixed maturity securities |
$ | 892,406 | $ | 879,618 | |||
| | | | | | | | |
| | | | | | | | |
| | | | | | | | |
The following table presents the components of net realized gains (losses) for the eleven months ended November 30, 2013 is as follows:
| |
Gross Realized Gains |
Gross Realized (Losses) |
Net Gain (Loss) |
|||||||
|---|---|---|---|---|---|---|---|---|---|---|
Fixed maturity securities: |
||||||||||
U.S. Government obligations |
$ | — | $ | (54,456 | ) | $ | (54,456 | ) | ||
Corporate debt |
341,293 | (883 | ) | 340,410 | ||||||
| | | | | | | | | | | |
|
341,293 | (55,339 | ) | 285,954 | ||||||
Equity securities, common stock |
306,754 | — | 306,754 | |||||||
| | | | | | | | | | | |
Total |
$ | 648,047 | $ | (55,339 | ) | $ | 592,708 | |||
| | | | | | | | | | | |
| | | | | | | | | | | |
| | | | | | | | | | | |
The sources of net investment income is as follows for the eleven months ended November 30, 2013:
Fixed maturity securities |
$ | 152,896 | ||
Equity securities |
28,381 | |||
Cash and short-term investments |
984 | |||
| | | | | |
Total investment income |
182,261 | |||
Investment expenses |
(5,730 | ) | ||
| | | | | |
Net investment income |
$ | 176,531 | ||
| | | | | |
| | | | | |
| | | | | |
4. Fair Value Measurements
The Company's financial instruments include assets and liabilities carried at fair value, as well as assets and liabilities carried at cost or amortized cost but disclosed at fair value in these consolidated financial statements. Fair value is defined as the price that would be received to sell an asset or paid to transfer a liability in an orderly transaction between market participants at the measurement date. Market data and assumptions that are believed to be used by market participants in pricing the asset or liability including assumptions about risk and the risks inherent in the inputs to the valuations technique are utilized. These inputs may be readily observable, market corroborated or generally unobservable.
F-81
EGI Insurance Services, Inc.
Notes to Consolidated Financial Statements (Continued)
November 30, 2013
4. Fair Value Measurements (Continued)
In determining fair value, the Company applies the market approach, which uses prices and other relevant data based on market transactions involving identical or comparable assets and liabilities. The inputs to valuation techniques used to measure fair value are prioritized into a three-level hierarchy. The hierarchy gives the highest priority to quoted prices in active markets for identical assets and liabilities and the lowest priority to unobservable inputs. The fair value hierarchy is as follows:
| Level 1 | Quoted prices (unadjusted) for identical assets or liabilities in active markets that the entity has the ability to access as of the measurement date. | |
Level 2 |
Significant other observable inputs other than Level 1 prices such as quoted prices for similar assets or liabilities; quoted prices in markets that are not active; or other inputs that are observable or can be corroborated by observable market data. |
|
Level 3 |
Significant unobservable inputs that reflect a reporting entity's own assumptions about the assumptions that market participants would use in pricing an asset or liability. |
Fair values are based on quoted market prices when available. When market prices are not available, fair value is generally estimated using discounted cash flow analyses, incorporating current market inputs for similar financial instruments with comparable terms and credit quality (matrix pricing). In instances where there is little or no market activity for the same or similar instruments, the Company estimates fair value using methods, models and assumptions that management believes market participants would use to determine a current transaction price. These valuation techniques involve some level of management estimation and judgment which becomes significant with increasingly complex instruments or pricing models. Where appropriate, adjustments are included to reflect the risk inherent in a particular methodology, model or input used.
The fair values of investments at amortized cost are determined by obtaining quoted prices on nationally recognized securities exchanges (Level 1 inputs) or matrix pricing, which is a mathematical technique widely used in the industry to value debt securities without relying exclusively on quoted prices for the specific securities but rather by relying on the securities relationship to other benchmark quoted securities (Level 2 inputs).
The following table presents disclosures about fair value measurements at November 30, 2013 for assets measured at fair value on a recurring basis:
| |
Active Markets for Identical Assets (Level 1) |
Significant Other Observable Input (Level 2) |
Significant Unobservable Input (Level 3) |
Total | |||||||||
|---|---|---|---|---|---|---|---|---|---|---|---|---|---|
Assets at fair value |
|||||||||||||
U.S. government and agency obligations |
$ | — | $ | 879,618 | $ | — | $ | 879,618 | |||||
| | | | | | | | | | | | | | |
Investments at available for sale |
— | 879,618 | — | 879,618 | |||||||||
| | | | | | | | | | | | | | |
Short-term investments |
7,830,074 | — | — | 7,830,074 | |||||||||
Cash equivalents |
— | 100,080 | — | 100,080 | |||||||||
| | | | | | | | | | | | | | |
Total assets at fair value |
$ | 7,830,074 | $ | 979,698 | $ | — | $ | 8,809,772 | |||||
| | | | | | | | | | | | | | |
| | | | | | | | | | | | | | |
| | | | | | | | | | | | | | |
F-82
EGI Insurance Services, Inc.
Notes to Consolidated Financial Statements (Continued)
November 30, 2013
5. Deferred Policy Acquisition Costs
The activity in deferred policy acquisition costs for the eleven months ended November 30, 2013 is as follows:
Balance at January 1, 2013 |
$ | 200,183 | ||
| | | | | |
Policy acquisition costs deferred |
701,692 | |||
Amortization of policy acquisition costs |
(822,325 | ) | ||
| | | | | |
Net change |
(120,633 | ) | ||
| | | | | |
Balance at November 30, 2013 |
$ | 79,550 | ||
| | | | | |
| | | | | |
| | | | | |
6. Property, Equipment and Computer Software
Property, equipment and computer software, included in other assets, consist of the following at November 30, 2013:
| |
Cost | Accumulated Depreciation |
Net | |||||||
|---|---|---|---|---|---|---|---|---|---|---|
Furniture and equipment |
$ | 15,662 | $ | 15,045 | $ | 617 | ||||
Computer hardware |
57,818 | 51,336 | 6,482 | |||||||
Computer software |
380,661 | 375,248 | 5,413 | |||||||
| | | | | | | | | | | |
|
$ | 454,141 | $ | 441,629 | $ | 12,512 | ||||
| | | | | | | | | | | |
| | | | | | | | | | | |
| | | | | | | | | | | |
Depreciation and amortization expense for the eleven months ended November 30, 2013 was $35,407.
7. Reinsurance
In the normal course of business, the Company seeks to reduce the loss that may arise from catastrophes or other events that cause unfavorable underwriting results by purchasing reinsurance to share all or part of the insurance risks originally accepted by the Company in writing premiums. This reinsurance does not relieve the Company of its primary obligation to policyholders.
The Company had a 50% quota share reinsurance agreement with an affiliated Company, Echelon General Insurance Company, and received a ceding commission of 21% of written premium ceded and recouped 50% of the claims expense allowance paid to EGI Florida. Effective October 1, 2013, the reinsurance agreement was terminated releasing any rights, obligations and liabilities, known and unknown, under the agreement. In the eleven months ended November 30, 2013, the ceding commission received was $94,071 and the recoupment for claims expense paid for the eleven months ended November 30, 2013 was $467,514.
F-83
EGI Insurance Services, Inc.
Notes to Consolidated Financial Statements (Continued)
November 30, 2013
7. Reinsurance (Continued)
The effect of reinsurance ceded on premiums written and earned for the eleven months ended November 30, 2013 are as follows:
Premiums written |
||||
Direct |
$ | 11,923,576 | ||
Ceded |
(3,292,794 | ) | ||
| | | | | |
Premiums written, net of reinsurance |
$ | 8,630,782 | ||
| | | | | |
| | | | | |
| | | | | |
Premiums earned |
||||
Direct |
$ | 11,481,474 | ||
Ceded |
(4,686,576 | ) | ||
| | | | | |
Premiums earned, net of reinsurance |
$ | 6,794,898 | ||
| | | | | |
| | | | | |
| | | | | |
Losses and loss adjustment expenses incurred |
||||
Direct |
$ | 10,665,506 | ||
Ceded |
(4,566,404 | ) | ||
| | | | | |
Losses and loss adjustment expenses incurred |
$ | 6,099,102 | ||
| | | | | |
| | | | | |
| | | | | |
8. Unpaid Losses and Loss Adjustment Expense
Activity in the liability for unpaid losses and loss adjustment expenses is summarized as follows:
Balance at January 1, 2013 |
$ | 1,377,139 | ||
| | | | | |
Incurred related to |
||||
Current year |
5,843,381 | |||
Prior years |
255,721 | |||
| | | | | |
Total incurred |
6,099,102 | |||
| | | | | |
Paid related to |
||||
Current year |
2,376,119 | |||
Prior years |
271,150 | |||
| | | | | |
Total paid |
2,647,269 | |||
| | | | | |
Balance at November 30, 2013 |
$ | 4,828,972 | ||
| | | | | |
| | | | | |
| | | | | |
Incurred losses and loss adjustment expenses for claims related to prior years represent the changes in estimates charged to the statement of comprehensive income (loss) in the current year with respect to the liabilities that originated and were established in prior years. Information regarding incurred losses and loss adjustment expenses is accumulated over time and the estimates of the liability are revised accordingly, resulting in gains or losses in the period revisions are made. The increase to prior year reserves during 2013 is due to adverse development due to the settlement of claims for more than the original estimates.
F-84
EGI Insurance Services, Inc.
Notes to Consolidated Financial Statements (Continued)
November 30, 2013
9. Income Taxes
The income tax expense attributable to income from operations for the eleven months ended November 30, 2013 consists of the following:
Current income tax expense |
$ | — | ||
Deferred income tax expense |
||||
Federal |
(528,557 | ) | ||
State |
(48,585 | ) | ||
| | | | | |
Total deferred income tax expense |
(577,142 | ) | ||
| | | | | |
Valuation allowance |
814,719 | |||
| | | | | |
Total income tax expense |
$ | 237,577 | ||
| | | | | |
| | | | | |
| | | | | |
Deferred income taxes reflect the estimated future tax effects of temporary differences between the bases of assets and liabilities for financial reporting purposes and such amounts as measured by tax laws and regulations. The components of the deferred tax asset as of November 30, 2013 are as follows:
Gross deferred tax assets |
||||
Discounted unpaid losses and loss adjustment expenses |
$ | 65,674 | ||
Unearned premium reserve |
219,617 | |||
Net operating loss carryforwards |
3,038,567 | |||
State net operating loss carryforwards |
307,332 | |||
Unrealized capital losses |
4,348 | |||
Other |
19,440 | |||
| | | | | |
Gross deferred tax assets |
3,654,978 | |||
Less valuation allowance |
(3,615,065 | ) | ||
| | | | | |
Total deferred tax assets |
39,914 | |||
| | | | | |
Gross deferred tax liabilities |
||||
Deferred policy acquisition expense |
(39,914 | ) | ||
Intangible assets |
(68,000 | ) | ||
| | | | | |
Total deferred tax liabilities |
(107,914 | ) | ||
| | | | | |
Net deferred tax liability |
$ | (68,000 | ) | |
| | | | | |
| | | | | |
| | | | | |
Management assesses the available positive and negative evidence to estimate whether sufficient future taxable income will be generated to permit the use of the existing deferred tax assets under the guidance of ASC 740 Income Taxes. A significant piece of objective negative evidence evaluated was the cumulative loss incurred over the three-year period ended November 30, 2013. Such objective evidence limits the ability to consider other subjective evidence, such as our projections for future growth.
Based on its evaluation, the Company has recorded a valuation allowance of $3.6 million as of November 30, 2013, to reduce the deferred tax assets to an amount that more-likely-than-not will be realized. The amount of the deferred tax assets considered realizable, however, could be adjusted if estimates of future taxable income during the carryforward period are reduced or if objective negative
F-85
EGI Insurance Services, Inc.
Notes to Consolidated Financial Statements (Continued)
November 30, 2013
9. Income Taxes (Continued)
evidence in the form of cumulative losses is no longer present, and additional weight may be given to subjective evidence, such as the Company's projections for growth.
The Company has net operating loss carryforwards of $8.9 million expiring through calendar years 2019 to 2033.
The income tax expense differed from the amounts computed by applying the statutory U.S. federal income tax rate of 34% to pretax income for the eleven months ended November 30, 2013, as a result of the following:
Income (loss) before income taxes |
$ | (1,529,741 | ) | |
| | | | | |
Statutory U.S. federal income tax rate |
(520,112 | ) | ||
State income taxes, net of federal benefit |
(48,585 | ) | ||
Dividend received deduction |
(5,247 | ) | ||
Valuation allowance on deferred tax assets |
814,718 | |||
Other |
(3,197 | ) | ||
| | | | | |
Income tax expense |
$ | 237,577 | ||
| | | | | |
| | | | | |
| | | | | |
10. Lease Commitments
The Company is committed under lease agreements for office premises with minimum lease payments as follows:
2013 |
$ | 6,712 | ||
2014 |
54,335 | |||
2015 |
58,240 | |||
2016 |
59,972 | |||
2017 |
— | |||
2018 and thereafter |
— | |||
| | | | | |
|
$ | 179,259 | ||
| | | | | |
| | | | | |
| | | | | |
Rent expense was $65,667 for the eleven months ended November 30, 2013.
11. Contingencies
From time to time, in connection with its insurance operations, the Company is subject to claims and lawsuits that arise primary in the ordinary course of business. In the opinion of management, the disposition or ultimate resolution of such claims and lawsuits will not have a material adverse effect on the Company's consolidated financial position, results of operations, or liquidity.
12. Statutory Financial Information
The Company's insurance subsidiary, ACIC, domiciled in Florida, is subject to U.S. state regulatory requirements. U.S. state insurance laws and regulations prescribe accounting practices for determining statutory net income and statutory capital and surplus for insurance companies. In addition, state
F-86
EGI Insurance Services, Inc.
Notes to Consolidated Financial Statements (Continued)
November 30, 2013
12. Statutory Financial Information (Continued)
regulators may permit statutory accounting practices that differ from prescribed practices. Statutory accounting practices prescribed or permitted by regulatory authorities for the Company's insurance subsidiary differ from U.S. GAAP. The principal differences between SAP and U.S. GAAP as they relate to the financial statements of the Company's insurance subsidiary are (i) policy acquisition costs are expensed as incurred under SAP, whereas they are deferred and amortized under U.S. GAAP, (ii) deferred tax assets are subject to more limitations regarding what amounts that can be recorded under SAP and (iii) debt securities are recorded at amortized cost under SAP and fair value under U.S. GAAP. The combined statutory net income, statutory capital and surplus and minimum required statutory capital and surplus, as determined in accordance with statutory accounting practices, for the ACIC is summarized as follows as of November 30, 2013:
Statutory net loss |
$ | (1,721,490 | ) | |
| | | | | |
| | | | | |
| | | | | |
Statutory capital and surplus |
$ | 6,083,035 | ||
| | | | | |
| | | | | |
| | | | | |
Minimum required statutory capital and surplus |
$ | 4,000,000 | ||
| | | | | |
| | | | | |
| | | | | |
Risk-Based Capital requirements as promulgated by the National Association of Insurance Commissioners ("NAIC") require property and casualty insurers to maintain minimum capitalization levels determined based on formulas incorporating various business risks (i.e., investment risk, underwriting profitability, etc.) of insurance subsidiaries. As of November 30, 2013, ACIC's adjusted capital and surplus exceeded their authorized control level as determined by the NAIC's risk-based capital models.
ACIC is required to be in compliance with various financial criteria as outlined under applicable Florida Statues. At November 30, 2013, ACIC was in compliance with all such requirements.
Dividend Restrictions
The state insurance statutes in which the insurance subsidiaries are domiciled limit the amount of dividends that they may pay annually without first obtaining regulatory approval. The maximum amount of dividends which can be paid by state of Florida insurance companies without prior approval of the Florida Commissioner of Insurance is subject to restrictions relating to statutory surplus. Generally, the limitations are based on the lesser of 10% of surplus or net income, not including realized gains, and must be from positive unassigned surplus. No dividends can be paid by ACIC to the Parent without prior approval from the Florida Commissioner of Insurance. For the eleven months ended November 30, 2013, no dividend payments were made to the Parent.
13. Related Party Transactions
The Company had a loan payable to the Parent of $2,350,000. The financing loan was used for start-up costs incurred prior to 2011. The loan was forgiven by the Parent on November 30, 2013 and recorded as an equity contribution on the statement of changes in shareholder's equity.
The Company paid management fees to its Parent pursuant to a management services agreement. At November 30, 2013, the amount due of $553,069 under the agreement was forgiven by the Parent. The Company incurred $70,000 in management fees for the eleven months ended November 30, 2013.
F-87
EGI Insurance Services, Inc.
Notes to Consolidated Financial Statements (Continued)
November 30, 2013
13. Related Party Transactions (Continued)
As discussed in Note 7, the Company's reinsurance contract is with an affiliated company, Echelon General Insurance Company.
14. Employee Benefit Plan
The Company's employees are eligible to participate in a defined contribution plan sponsored by the Company ("the Plan"). For the eleven months ended November 30, 2013, the Plan allows employees to contribute up to $16,500 of their pre-tax compensation and an additional $5,000 if over the age of 55. Eligible employees must be 18 years old with at least one year of service in which the employee worked at least 1,000 hours. The Plan requires the Company to match 100% of the first 5% of employee contributions. The Company, at its option, may make discretionary contributions on behalf of eligible employees. Expenses incurred for administration of the Plan are paid on a pro rata basis by the Company. Assets held by the Plan are maintained in a separate account and are not included with the Company's assets. For the eleven months ended November 30, 2013, the Company recorded expense for the matching contributions of approximately $30,335.
15. Accumulated Other Comprehensive Income
The table presents the changes in accumulated other comprehensive income (loss) for eleven months ended November 30, 2013 (all amounts are net of tax):
| |
Unrealized Gains and Losses on Available for Sale Securities |
|||
|---|---|---|---|---|
Beginning Balance |
$ | 461,179 | ||
| | | | | |
Unrealized losses on investments arising during the year, net of tax benefit of $10,445 |
(19,398 | ) | ||
Less: reclassification adjustment for gains included in net loss, net of tax of $242,358 |
(450,093 | ) | ||
| | | | | |
Change in fair value of available for sale investments |
(469,491 | ) | ||
| | | | | |
Ending Balance |
$ | (8,312 | ) | |
| | | | | |
| | | | | |
| | | | | |
The reclassification adjustments of $692,451 and $242,358 were included in net realized investment gains and income tax expense, respectively.
16. Subsequent Events
The Parent entered into a stock purchase arrangement, dated August 8, 2013, with a subsidiary of Conifer Holdings, Inc., a Michigan-based specialty insurance company, to sell its U.S. non-standard automobile insurance operations for a purchase price of approximately $4 million. The transaction closed on November 30, 2013.
The Company has evaluated subsequent events from the balance sheet date through May 6, 2015, the date at which the consolidated financial statements were issued, noting no events that required adjustment to or disclosure in the consolidated financial statements.
F-88
SCHEDULE I
Conifer Holdings, Inc. and Subsidiaries
Summary of Investments—Other than Investments in Related Parties
(in thousands)
| |
December 31, 2014 | |||||||||
|---|---|---|---|---|---|---|---|---|---|---|
Type of Investment
|
Cost | Fair Value | Amount at which shown in the Balance Sheet |
|||||||
Fixed maturities: |
||||||||||
United States Government and government agencies and authorities |
$ | 5,872 | $ | 5,941 | $ | 5,941 | ||||
States, municipalities and political subdivisions |
10,755 | 10,961 | 10,961 | |||||||
Corporate bonds |
30,818 | 30,949 | 30,949 | |||||||
Mortgage backed and asset backed |
36,323 | 36,554 | 36,554 | |||||||
| | | | | | | | | | | |
Total fixed maturities |
83,768 | 84,405 | 84,405 | |||||||
| | | | | | | | | | | |
Equity securities: |
||||||||||
Common stocks—Public Utilities |
129 | 160 | 160 | |||||||
Common stocks—Banks, Trusts and Insurance Companies |
637 | 844 | 844 | |||||||
Common stocks—Industrial, miscellaneous, and all other |
2,199 | 3,080 | 3,080 | |||||||
| | | | | | | | | | | |
Total equity securities |
2,965 | 4,084 | 4,084 | |||||||
| | | | | | | | | | | |
Short-term investments |
16,749 | 16,749 | 16,749 | |||||||
| | | | | | | | | | | |
Total investments |
$ | 103,482 | $ | 105,238 | $ | 105,238 | ||||
| | | | | | | | | | | |
| | | | | | | | | | | |
| | | | | | | | | | | |
F-89
Conifer Holdings, Inc.
Condensed Financial Information of Registrant
Parent Company Only
Balance Sheets
| |
December 31, | ||||||
|---|---|---|---|---|---|---|---|
| |
2014 | 2013 | |||||
| |
(dollars in thousands) |
||||||
Assets |
|||||||
Investment in subsidiaries |
$ | 75,692 | $ | 34,154 | |||
Cash |
1,150 |
415 |
|||||
Due from subsidiaries |
175 | 165 | |||||
Other assets |
1,759 | 1,474 | |||||
| | | | | | | | |
Total assets |
$ | 78,776 | $ | 36,208 | |||
| | | | | | | | |
| | | | | | | | |
| | | | | | | | |
Liabilities and Equity |
|||||||
Liabilities: |
|||||||
Senior debt |
$ | 27,562 | $ | 13,087 | |||
Accounts payable and accrued expenses |
330 | 244 | |||||
Other liabilities |
606 | 1,626 | |||||
| | | | | | | | |
Total liabilities |
28,498 | 14,957 | |||||
Redeemable preferred stock, 1,000,000 authorized; 60,600 shares and none issued and outstanding at December 31, 2014 and 2013, respectively |
6,119 |
— |
|||||
Shareholders' equity: |
|||||||
Common stock, no par, 1,200,000 shares authorized; 391,668 shares and 171,532 shares issued and outstanding at December 31, 2014 and 2013, respectively |
46,119 | 16,883 | |||||
Retained earnings (accumulated deficit) |
(3,095 | ) | 3,851 | ||||
Accumulated other comprehensive income |
1,158 | 536 | |||||
| | | | | | | | |
Total shareholders' equity attributable to Conifer |
44,182 | 21,270 | |||||
Noncontrolling interest |
(23 | ) | (19 | ) | |||
| | | | | | | | |
Total equity |
44,159 | 21,251 | |||||
| | | | | | | | |
Total liabilities and equity |
$ | 78,776 | $ | 36,208 | |||
| | | | | | | | |
| | | | | | | | |
| | | | | | | | |
See accompanying notes.
F-90
Conifer Holdings, Inc.
Condensed Financial Information of Registrant
Parent Company Only
Statements of Comprehensive Income
(Loss)
| |
Year Ended December 31, | |||||||||
|---|---|---|---|---|---|---|---|---|---|---|
| |
2014 | 2013 | 2012 | |||||||
| |
(dollars in thousands) |
|||||||||
Revenue |
||||||||||
Management fees from subsidiaries |
$ | 8,100 | $ | 5,757 | $ | 2,938 | ||||
Other income |
20 | 55 | 30 | |||||||
| | | | | | | | | | | |
Total revenue |
8,120 | 5,812 | 2,968 | |||||||
Expenses |
||||||||||
Operating expenses |
9,962 | 6,816 | 3,257 | |||||||
Interest expense |
584 | 541 | 428 | |||||||
| | | | | | | | | | | |
Total expenses |
10,546 | 7,357 | 3,685 | |||||||
| | | | | | | | | | | |
Loss before equity in income (loss) of subsidiaries and income tax benefit |
(2,426 |
) |
(1,545 |
) |
(717 |
) |
||||
Income tax benefit |
(77 | ) | (88 | ) | (708 | ) | ||||
| | | | | | | | | | | |
Loss before equity in income (loss) of subsidiaries |
(2,349 | ) | (1,457 | ) | (9 | ) | ||||
Equity in income (loss) of subsidiaries |
(4,590 | ) | 1,737 | 422 | ||||||
| | | | | | | | | | | |
Net income (loss) |
(6,939 | ) | 280 | 413 | ||||||
Less net loss attributable to noncontrolling interest |
(4 | ) | (69 | ) | — | |||||
| | | | | | | | | | | |
Net income (loss) attributable to Conifer |
$ | (6,935 | ) | $ | 349 | $ | 413 | |||
Other comprehensive income |
||||||||||
Equity in other comprehensive income (loss) of subsidiaries |
622 | (694 | ) | 60 | ||||||
| | | | | | | | | | | |
Total comprehensive income (loss) |
$ | (6,313 | ) | $ | (345 | ) | $ | 473 | ||
| | | | | | | | | | | |
| | | | | | | | | | | |
| | | | | | | | | | | |
See accompanying notes.
F-91
Conifer Holdings, Inc.
Condensed Financial Information of Registrant
Parent Company Only
Statements of Cash Flows
| |
Year Ended December 31, | |||||||||
|---|---|---|---|---|---|---|---|---|---|---|
| |
2014 | 2013 | 2012 | |||||||
| |
(dollars in thousands) |
|||||||||
Cash Flows from Operating Activities |
||||||||||
Net income (loss) |
$ | (6,939 | ) | $ | 280 | $ | 413 | |||
Adjustments to reconcile net income (loss) to net cash used in operating activities: |
||||||||||
Depreciation and amortization |
287 | 243 | 210 | |||||||
Deferred income taxes |
3 | 27 | 84 | |||||||
Equity in undistributed income (loss) of subsidiaries |
4,590 | (1,737 | ) | (422 | ) | |||||
Changes in operating assets and liabilities: |
||||||||||
Change in due from/payable to subsidiaries |
(10 | ) | 706 | (1,457 | ) | |||||
Other assets |
(92 | ) | (164 | ) | 108 | |||||
Accounts payable and accrued expenses |
86 | (270 | ) | (427 | ) | |||||
Other liabilities |
(19 | ) | 487 | (13 | ) | |||||
| | | | | | | | | | | |
Net cash used in operating activities |
(2,094 | ) | (428 | ) | (1,504 | ) | ||||
| | | | | | | | | | | |
Cash Flows From Investing Activities |
||||||||||
Contributions to subsidiaries |
(46,006 | ) | (1,317 | ) | (1,001 | ) | ||||
Dividends received from subsidiaries |
500 | 1,000 | 1,100 | |||||||
Purchases of property and equipment |
(434 | ) | (230 | ) | (54 | ) | ||||
| | | | | | | | | | | |
Net cash provided by (used in) investing activities |
(45,940 | ) | (547 | ) | 45 | |||||
| | | | | | | | | | | |
Cash Flows From Financing Activities |
||||||||||
Proceeds received from issuance of shares of common stock |
28,475 | — | 382 | |||||||
Issuance of shares of common stock to noncontrolling interest |
— | 50 | — | |||||||
Proceeds from issuance of shares of preferred stock |
6,060 | — | — | |||||||
Repurchase of shares of common stock |
— | — | (480 | ) | ||||||
Proceeds from issuance of note payable |
— | — | 1,000 | |||||||
Borrowings under Revolver |
11,000 | 1,350 | 500 | |||||||
Repayment of borrowings under Revolver |
(2,775 | ) | — | — | ||||||
Proceeds from term notes |
7,500 | — | — | |||||||
Principal payments made on term notes |
(1,250 | ) | (250 | ) | — | |||||
Payment of debt issuance costs |
(50 | ) | — | — | ||||||
Dividends paid to preferred shareholders |
(191 | ) | — | — | ||||||
| | | | | | | | | | | |
Net cash provided by financing activities |
48,769 | 1,150 | 1,402 | |||||||
| | | | | | | | | | | |
Net increase (decrease) in cash |
735 | 175 | (57 | ) | ||||||
Cash at beginning of period |
415 | 240 | 297 | |||||||
| | | | | | | | | | | |
Cash at end of period |
$ | 1,150 | $ | 415 | $ | 240 | ||||
| | | | | | | | | | | |
| | | | | | | | | | | |
| | | | | | | | | | | |
Supplemental information |
||||||||||
Interest paid |
$ | 510 | $ | 364 | $ | 417 | ||||
| | | | | | | | | | | |
| | | | | | | | | | | |
| | | | | | | | | | | |
Supplemental disclosure of non-cash investing and financing activities
In 2014, the Company recorded paid-in-kind interest on its redeemable preferred stock of $59 resulting in an increase to redeemable preferred stock and decrease to no par, common stock.
In 2014, the Company exchanged a note payable of $1,000 for equity.
In 2012, accounts payable and accrued expenses included $360 related to the purchase of furniture and fixtures.
See accompanying notes.
F-92
Conifer Holdings, Inc.
Condensed Financial Information of Registrant
Parent Company Only
Notes to Condensed Financial Statements
1. Accounting Policies
Organization
Conifer Holdings, Inc. (the "Parent") is a Michigan-based holding company organized for the purpose of managing its insurance entities. The Parent conducts its principal operations through these entities.
Basis of Presentation
The accompanying condensed financial information should be read in conjunction with the Consolidated Financial Statements and related Notes of Conifer Holdings, Inc. and Subsidiaries. Investments in subsidiaries are accounted for using the equity method. Under the equity method, the investment in subsidiaries is stated at cost plus contributions and equity in undistributed income (loss) of consolidated subsidiaries less dividends received since the date of acquisition.
The Parent's operations consist of income earned from management and administrative services performed for the insurance entities pursuant to intercompany services agreements. These management and administrative services include providing management, marketing, offices and equipment, and premium collection, for which the insurance companies pay fees based on a percentage of gross premiums written. Also, the Parent receives commission income for performing agency services. The primary operating costs of the Parent include salaries and related costs of corporate personnel, including information technology, administrative expenses, and professional fees. The income received from the management and administrative services is used to meet debt service requirements and pay federal income taxes.
Estimates and Assumptions
Preparation of the condensed financial statements in conformity with U.S. GAAP requires management to make estimates and assumptions that affect the amounts reported in the condensed financial statements and accompanying disclosures. Those estimates are inherently subject to change, and actual results may ultimately differ from those estimates.
Dividends
The Parent received cash dividends from its subsidiaries of $500,000, $1,000,000 and $1,100,000 for the years ended December 31, 2014, 2013, and 2012, respectively.
F-93
SCHEDULE III
Conifer Holdings, Inc. & Subsidiaries
Supplementary Insurance Information
| |
December 31, | Year Ended December 31, | |||||||||||||||||||||||||||||
|---|---|---|---|---|---|---|---|---|---|---|---|---|---|---|---|---|---|---|---|---|---|---|---|---|---|---|---|---|---|---|---|
Segment
|
Deferred policy acquisition cost |
Future policy benefits, losses, claims and loss expenses |
Unearned premiums |
Other policy claims and benefits payable |
Net Earned Premiums |
Net investment income |
Losses and Loss Adjustment Expenses |
Amortization of deferred policy acquisition costs |
Other operating expenses |
Net Written Premiums |
|||||||||||||||||||||
2014 |
|||||||||||||||||||||||||||||||
CMP |
2,958 | 15,673 | 19,515 | — | 24,246 | 14,668 | 6,265 | 3,330 | 25,702 | ||||||||||||||||||||||
Other Liability |
549 | 4,541 | 3,756 | — | 5,373 | 1,638 | 1,453 | 671 | 5,892 | ||||||||||||||||||||||
Auto |
631 | 1,301 | 4,515 | — | 4,564 | 3,257 | 1,187 | 366 | 7,460 | ||||||||||||||||||||||
Other |
109 | 936 | 1,276 | — | 1,566 | 1,058 | 304 | 199 | 1,904 | ||||||||||||||||||||||
| | | | | | | | | | | | | | | | | | | | | | | | | | | | | | | | |
Total commercial lines |
4,247 | 22,451 | 29,062 | — | 35,749 | — | 20,621 | 9,209 | 4,566 | 40,958 | |||||||||||||||||||||
Midwest Homeowners |
789 | 2,211 | 4,081 | — | 6,495 | 8,390 | 1,977 | 380 | 6,834 | ||||||||||||||||||||||
Specialty Homeowners |
440 | 367 | 8,657 | — | 3,651 | 1,254 | 1,149 | 328 | 10,104 | ||||||||||||||||||||||
Auto |
203 | 6,502 | 1,581 | — | 11,633 | 10,465 | 2,361 | 1,745 | 8,403 | ||||||||||||||||||||||
| | | | | | | | | | | | | | | | | | | | | | | | | | | | | | | | |
Total personal lines |
1,432 | 9,080 | 14,319 | — | 21,779 | — | 20,109 | 5,487 | 2,453 | 25,341 | |||||||||||||||||||||
Corporate & Other |
— | — | — | — | — | 1,175 | — | — | 5,120 | — | |||||||||||||||||||||
| | | | | | | | | | | | | | | | | | | | | | | | | | | | | | | | |
Total |
$ | 5,679 | $ | 31,531 | $ | 43,381 | $ | — | $ | 57,528 | $ | 1,175 | $ | 40,730 | $ | 14,696 | $ | 12,139 | $ | 66,299 | |||||||||||
| | | | | | | | | | | | | | | | | | | | | | | | | | | | | | | | |
| | | | | | | | | | | | | | | | | | | | | | | | | | | | | | | | |
| | | | | | | | | | | | | | | | | | | | | | | | | | | | | | | | |
2013 |
|||||||||||||||||||||||||||||||
CMP |
2,954 | 10,798 | 12,705 | 11,699 | 6,122 | 2,966 | 3,714 | 17,429 | |||||||||||||||||||||||
Other Liability |
514 | 5,995 | 2,229 | 3,358 | (1,008 | ) | 770 | 776 | 4,028 | ||||||||||||||||||||||
Auto |
108 | 78 | 425 | 678 | 342 | 189 | 170 | 573 | |||||||||||||||||||||||
Other |
92 | 198 | 618 | (15 | ) | 172 | 48 | 205 | 603 | ||||||||||||||||||||||
| | | | | | | | | | | | | | | | | | | | | | | | | | | | | | | | |
Total commercial lines |
3,668 | 17,069 | 15,977 | — | 15,720 | — | 5,628 | 3,973 | 4,865 | 22,633 | |||||||||||||||||||||
Midwest Homeowners |
874 | 1,165 | 3,380 | 3,895 | 2,924 | 1,148 | 370 | 5,224 | |||||||||||||||||||||||
Specialty Homeowners |
475 | 640 | 2,339 | 1,153 | 889 | 493 | 161 | 3,034 | |||||||||||||||||||||||
Auto |
730 | 10,034 | 4,809 | 6,861 | 6,383 | 2,053 | 167 | 6,757 | |||||||||||||||||||||||
| | | | | | | | | | | | | | | | | | | | | | | | | | | | | | | | |
Total personal lines |
2,079 | 11,839 | 10,528 | — | 11,909 | — | 10,196 | 3,694 | 698 | 15,015 | |||||||||||||||||||||
Corporate & Other |
— | — | — | — | — | 1,000 | — | — | 3,598 | — | |||||||||||||||||||||
| | | | | | | | | | | | | | | | | | | | | | | | | | | | | | | | |
Total |
$ | 5,747 | $ | 28,908 | $ | 26,505 | $ | — | $ | 27,629 | $ | 1,000 | $ | 15,824 | $ | 7,667 | $ | 9,161 | $ | 37,648 | |||||||||||
| | | | | | | | | | | | | | | | | | | | | | | | | | | | | | | | |
| | | | | | | | | | | | | | | | | | | | | | | | | | | | | | | | |
| | | | | | | | | | | | | | | | | | | | | | | | | | | | | | | | |
2012 |
|||||||||||||||||||||||||||||||
CMP |
1,225 | 12,748 | 5,691 | 8,094 | 2,196 | 2,157 | 2,022 | 10,106 | |||||||||||||||||||||||
Other Liability |
251 | 9,170 | 1,304 | 2,882 | 1,213 | 547 | 327 | 2,660 | |||||||||||||||||||||||
Auto |
101 | 44 | 443 | 641 | 305 | 164 | 114 | 805 | |||||||||||||||||||||||
Other |
— | — | 1 | 4 | — | 15 | — | 3 | |||||||||||||||||||||||
| | | | | | | | | | | | | | | | | | | | | | | | | | | | | | | | |
Total commercial lines |
1,577 | 21,962 | 7,439 | — | 11,621 | — | 3,714 | 2,883 | 2,463 | 13,574 | |||||||||||||||||||||
Midwest Homeowners |
409 | 436 | 1,722 | 1,273 | 870 | 375 | 205 | 2,793 | |||||||||||||||||||||||
Specialty Homeowners |
204 | 47 | 1,022 | 235 | 94 | 68 | 71 | 1,231 | |||||||||||||||||||||||
Auto |
576 | 2,398 | 1,722 | 3,805 | 2,913 | 1,326 | 22 | 4,697 | |||||||||||||||||||||||
| | | | | | | | | | | | | | | | | | | | | | | | | | | | | | | | |
Total personal lines |
1,189 | 2,881 | 4,466 | — | 5,313 | — | 3,877 | 1,769 | 298 | 8,721 | |||||||||||||||||||||
Corporate & Other |
— | — | — | — | — | 1,072 | — | — | 3,759 | — | |||||||||||||||||||||
| | | | | | | | | | | | | | | | | | | | | | | | | | | | | | | | |
Total |
$ | 2,766 | $ | 24,843 | $ | 11,905 | $ | — | $ | 16,934 | $ | 1,072 | $ | 7,591 | $ | 4,652 | $ | 6,520 | $ | 22,295 | |||||||||||
| | | | | | | | | | | | | | | | | | | | | | | | | | | | | | | | |
| | | | | | | | | | | | | | | | | | | | | | | | | | | | | | | | |
| | | | | | | | | | | | | | | | | | | | | | | | | | | | | | | | |
F-94
SCHEDULE V
Conifer Holdings, Inc. and Subsidiaries
Valuation and Qualifying Accounts
(dollars in thousands)
| |
Balance at beginning of period |
Charged to costs and expenses |
Charged to other accounts— describe |
Deductions— describe(A) |
Balance at the end of the period |
|||||||||||
|---|---|---|---|---|---|---|---|---|---|---|---|---|---|---|---|---|
Year ended December 31, 2014 |
||||||||||||||||
Allowance for doubtful accounts for premiums and Agents' balances receivables |
$ | 181 | $ | 105 | $ | — | $ | (126 | ) | $ | 160 | |||||
Valuation allowance on deferred tax assets |
4,634 | 2,283 | — | — | 6,917 | |||||||||||
Year ended December 31, 2013 |
||||||||||||||||
Allowance for doubtful accounts for premiums and Agents' balances receivables |
$ | 205 | $ | 242 | $ | — | $ | (266 | ) | $ | 181 | |||||
Valuation allowance on deferred tax assets |
213 | 4,421 | — | — | 4,634 | |||||||||||
Year ended December 31, 2012 |
||||||||||||||||
Allowance for doubtful accounts for premiums and Agents' balances receivables |
$ | — | $ | 424 | $ | — | $ | (219 | ) | $ | 205 | |||||
Valuation allowance on deferred tax assets |
274 | (61 | ) | — | — | 213 | ||||||||||
- (A)
- Represents write-off of accounts to the allowance for doubtful accounts
F-95
4,600,000 Shares
Common Stock
PRELIMINARY PROSPECTUS
| BMO Capital Markets | Raymond James | |
Sandler O'Neill+Partners, L.P. |
William Blair |
Neither we nor any of the underwriters have authorized anyone to provide information different from that contained in this prospectus. When you make a decision about whether to invest in our common stock, you should not rely upon any information other than the information in this prospectus. Neither the delivery of this prospectus nor the sale of our common stock means that information contained in this prospectus is correct after the date of this prospectus. This prospectus is not an offer to sell or solicitation of an offer to buy these shares of common stock in any circumstances under which the offer or solicitation is unlawful.
Until , 2015 (25 days after the commencement of this offering), all dealers that effect transactions in these securities, whether or not participating in this offering, may be required to deliver a prospectus. This is in addition to the dealer's obligation to deliver a prospectus when acting as an underwriter and with respect to unsold allotments or subscriptions.
PART II
INFORMATION NOT REQUIRED IN PROSPECTUS
Item 13. Other Expenses of Issuance and Distribution
The following table sets forth the costs and expenses, other than the underwriting discounts and commissions payable by us, in connection with the sale of common stock being registered. All amounts are estimates except the SEC registration fee, the Financial Industry Regulatory Authority "FINRA", filing fee and listing fee.
| |
Amount To Be Paid |
|||
|---|---|---|---|---|
SEC registration fee |
$ | 7,992 | ||
FINRA filing fee |
8,100 | |||
Exchange listing fee |
25,000 | |||
Transfer agent's fees |
4,000 | |||
Printing and engraving expenses |
150,000 | |||
Legal fees and expenses |
500,000 | |||
Accounting fees and expenses |
785,000 | |||
| | | | | |
Total |
$ | 1,480,092 | ||
| | | | | |
| | | | | |
| | | | | |
Item 14. Indemnification of Directors and Officers
We are incorporated under the laws of the State of Michigan. Under Sections 561-571 of the Michigan Business Corporation Act (as it may be amended from time to time, the "MBCA"), directors and officers of a Michigan corporation may be entitled to indemnification by the corporation against judgments, expenses, fines and amounts paid by the director or officer in settlement of claims brought against them by third persons or by or in the right of the corporation if the statutory standard (defined below) is met. In particular, Section 561 of the MBCA provides that a Michigan corporation has the power to indemnify a person who was or is a party or is threatened to be made a party to a threatened, pending, or completed action, suit, or proceeding, whether civil, criminal, administrative, or investigative and whether formal or informal, other than an action by or in the right of the corporation, by reason of the fact that he or she is or was a director, officer, employee, or agent of the corporation, or is or was serving at the request of the corporation as a director, officer, partner, trustee, employee, or agent of another foreign or domestic corporation, partnership, joint venture, trust, or other enterprise, whether for profit or not, against expenses, including attorneys' fees, judgments, penalties, fines, and amounts paid in settlement actually and reasonably incurred by him or her in connection with the action, suit, or proceeding (provided that generally the director did not (i) receive a financial benefit to which he was not entitled, (ii) intentionally inflict harm on the corporation or its shareholders, (iii) violate Section 551 of the MBCA relating to loans, dividends and distributions, or (iv) intentionally commit a criminal act, collectively, the "statutory standard"), and with respect to a criminal action or proceeding, if the person had no reasonable cause to believe his or her conduct was unlawful. In addition, Section 562 of the MBCA provides that a Michigan corporation has the power to indemnify a person who was or is a party or is threatened to be made a party to a threatened, pending, or completed action or suit by or in the right of the corporation to procure a judgment in its favor by reason of the fact that he or she is or was a director, officer, employee, or agent of the corporation, or is or was serving at the request of the corporation as a director, officer, partner, trustee, employee, or agent of another foreign or domestic corporation, partnership, joint venture, trust, or other enterprise, whether for profit or not, against expenses, including attorneys' fees, and amounts paid in settlement actually and reasonably incurred by the person in connection with the action or suit if the statutory standard is met. The MBCA does not permit indemnification for a claim, issue or matter in which the
II-1
person has been found liable to the corporation unless application for indemnification is made to, and ordered by, the court conducting the proceeding or another court of competent jurisdiction.
Section 563 of the MBCA provides that a director or officer who has been successful on the merits or otherwise in defense of an action, suit or proceeding referred to in Sections 561 and 562 of the MBCA, or in defense of a claim, issue, or matter in any such action, suit, or proceeding, shall be indemnified by the corporation against actual and reasonable expenses, including attorneys' fees, incurred by him or her in connection with the action, suit or proceeding, and any action, suit, or proceeding brought to enforce this mandatory indemnification.
Our amended and restated articles will eliminate the liability of our directors for monetary damages to the fullest extent permitted under the MBCA and other applicable law. Our amended and restated bylaws will generally require us to indemnify our officers and directors to the fullest extent permitted by law, and to advance expenses incurred by our directors and officers prior to the final disposition of any action or proceeding arising by reason of the fact that any such person is or was our agent. In addition, our amended and restated bylaws will permit us to provide such other indemnification and advancement of expenses to our other employees and agents as permitted by law and authorized by the Board from time to time.
As permitted by the MBCA, prior to or following the completion of this offering, we expect to enter into separate indemnification agreements with our directors and executive officers. Such agreements will generally provide for indemnification by reason of being a director or executive officer of the company, as the case may be. These agreements will be in addition to the indemnification provided by our amended and restated bylaws discussed elsewhere in the prospectus.
At present, there is no pending litigation or proceeding involving any of our directors or executive officers as to which indemnification is required or permitted, and we are not aware of any threatened litigation or proceeding that may result in a claim for indemnification.
As of the offering, we will have an insurance policy covering our officers and directors with respect to certain liabilities, including liabilities arising under the Securities Act or otherwise.
The underwriting agreement filed as Exhibit 1.1 to this registration statement will provide for indemnification by the underwriters of us and our officers and directors for certain liabilities arising under the Securities Act or otherwise.
The foregoing statements are subject to the detailed provisions of the MBCA, as well as the following documents filed (or to be filed) as exhibits to this registration statement with respect to relevant indemnification provisions described above and elsewhere in this registration statement:
| Exhibit Number |
Description | ||
|---|---|---|---|
| 1.1 | Form of Underwriting Agreement | ||
| 3.2 | Form of Amended and Restated Articles of Incorporation, to be effective upon the closing of the offering | ||
3.4 |
Form of Amended and Restated Bylaws, to be in effect upon completion of this offering |
||
Item 15. Recent Sales of Unregistered Securities
In the three years preceding the filing of this registration statement, we have sold and issued the following unregistered securities:
In a related series of transactions ranging from January 1, 2014 through June 30, 2014, we sold an aggregate of 764,602 shares of our common stock at a per share price of $12.16, resulting in aggregate gross proceeds of $9.3 million (approximately $1.0 million of which resulted from the conversion of a
II-2
loan from one of our executive officers at the same per share price). These shares were sold to certain of our officers and directors and other accredited investors known to our management.
In a related series of transactions ranging from January 8, 2014 through February 27, 2014, and again on July 24, 2014, we sold an aggregate of 66,000 shares of newly designated preferred stock at $10 per share for aggregate gross proceeds of $660,000.
On September 30, 2014, we amended the designations of our preferred stock. In a related series of transactions ranging from September 30, 2014 through November 20, 2014, we sold an additional 54,000 redeemable preferred shares at $100 per share to certain of our directors and officers and other accredited investors known to management. These transactions resulted in aggregate gross proceeds of $5.4 million. Also, in connection with the change in designations of our preferred stock, on September 30, 2014, we exchanged shares of our new redeemable preferred shares for shares of our previously existing preferred shares on a 1-for-10 basis, reflecting the $100 original issue price of the new redeemable preferred shares. We did not receive any proceeds from this exchange.
In the fourth quarter of 2014, in a series of transactions ranging from September 30, 2014 through January 16, 2015, we sold an aggregate of 1,535,814 shares of our common stock at a per share price of $13.63, resulting in aggregate gross proceeds of $20.9 million. These shares were sold to certain of our officers and directors and other third party accredited investors.
No underwriters were involved in the foregoing sales of securities. The issuances of the securities described above were deemed to be exempt from registration under the Securities Act in reliance on Section 4(2) of the Securities Act as transactions by an issuer not involving a public offering.
Item 16. Exhibits and Financial Statement Schedules
- (a)
- Exhibits
| Exhibit Number |
Description | ||
|---|---|---|---|
| 1.1 | Form of Underwriting Agreement | ||
3.1 |
* |
Articles of incorporation, including all amendments as currently in effect (most recent amendment filed March 25, 2015) |
|
3.2 |
Amended and Restated Articles of incorporation of the Registrant, to be effective upon the closing of the offering |
||
3.3 |
* |
Bylaws of Registrant as currently in effect |
|
3.4 |
Form of Amended and Restated Bylaws of the Registrant, to be effective upon closing of the offering |
||
4.1 |
Form of Common Stock Certificate |
||
5.1 |
Opinion of Honigman Miller Schwartz and Cohn LLP |
||
10.1.1 |
* |
Amended and Restated Credit Agreement dated September 29, 2014, between the Registrant and Comerica Bank |
|
10.1.2 |
* |
First Amendment to Amended and Restated Credit Agreement and Waiver dated May 4, 2015, between the Registrant and Comerica Bank |
|
10.1.3 |
Second Amendment to Amended and Restated Credit Agreement dated June 29, 2015, between the Registrant and Comerica Bank |
||
10.2 |
*† |
2015 Omnibus Incentive Plan |
|
II-3
| Exhibit Number |
Description | ||
|---|---|---|---|
| 10.3 | * | Lease Agreement, dated September 18, 2013, as amended | |
21.1 |
* |
List of subsidiaries of Registrant |
|
23.1 |
Consent of Deloitte & Touche LLP, Independent Registered Public Accounting Firm |
||
23.2 |
Consent of Deloitte & Touche LLP, Independent Auditors |
||
23.3 |
Consent of Honigman Miller Schwartz and Cohn LLP (included in Exhibit 5.1) |
||
24.1 |
* |
Power of Attorney |
|
- *
- Previously
filed.
- †
- Indicates a management contract or compensatory plan or arrangement
- (b)
- Financial Statement Schedules:
The financial statement schedules I-III and V are set forth after the Exhibit Index below and incorporated herein by reference. The other financial statement schedules IV and VI have been omitted since the information to be set forth herein is included in the consolidated financial statements or notes thereto.
The registrant hereby undertakes to provide to the underwriters, at the closing specified in the underwriting agreement, certificates in such denominations and registered in such names as required by the underwriters to permit prompt delivery to each purchaser.
Insofar as indemnification by the registrant for liabilities arising under the Securities Act may be permitted to directors, officers and controlling persons of the registrant pursuant to the provisions referenced in Item 14 of this registration statement or otherwise, the registrant has been advised that in the opinion of the Securities and Exchange Commission such indemnification is against public policy as expressed in the Securities Act, and is, therefore, unenforceable. In the event that a claim for indemnification against such liabilities (other than the payment by the registrant of expenses incurred or paid by a director, officer, or controlling person of the registrant in the successful defense of any action, suit or proceeding) is asserted by such director, officer or controlling person in connection with the securities being registered hereunder, the registrant will, unless in the opinion of its counsel the matter has been settled by controlling precedent, submit to a court of appropriate jurisdiction the question whether such indemnification by it is against public policy as expressed in the Securities Act and will be governed by the final adjudication of such issue.
The registrant hereby undertakes that:
(1) For purposes of determining any liability under the Securities Act, the information omitted from the form of prospectus filed as part of this registration statement in reliance upon Rule 430A and contained in a form of prospectus filed by the registrant pursuant to Rule 424(b)(1) or (4) or 497(h) under the Securities Act shall be deemed to be part of this registration statement as of the time it was declared effective.
(2) For the purpose of determining any liability under the Securities Act of 1933, each post-effective amendment that contains a form of prospectus shall be deemed to be a new registration statement relating to the securities offered therein, and the offering of such securities at that time shall be deemed to be the initial bona fide offering thereof.
II-4
Pursuant to the requirements of the Securities Act of 1933, as amended, the registrant has duly caused this registration statement to be signed on its behalf by the undersigned, thereunto duly authorized in Birmingham, Michigan on July 30, 2015.
| Conifer Holdings, Inc. | ||||
/s/ JAMES G. PETCOFF |
||||
| By: | James G. Petcoff | |||
| Title: | Chairman and Chief Executive Officer | |||
Pursuant to the requirements of the Securities Act of 1933, this registration statement has been signed by the following persons in the capacities and on the dates indicated:
Signature
|
Title
|
Date
|
||||
|---|---|---|---|---|---|---|
| /s/ JAMES G. PETCOFF James G. Petcoff |
Chief Executive Officer and Director (principal executive officer) | July 30, 2015 | ||||
/s/ HAROLD MELOCHE Harold Meloche |
Chief Financial Officer and Treasurer (principal financial officer and principal accounting officer) |
July 30, 2015 |
||||
* Mark McCammon |
Director |
July 30, 2015 |
||||
* Nicholas J. Petcoff |
Director |
July 30, 2015 |
||||
* Jorge Morales |
Director |
July 30, 2015 |
||||
* Joseph Sarafa |
Director |
July 30, 2015 |
||||
* Richard J. Williams, Jr. |
Director |
July 30, 2015 |
||||
*By: |
/s/ HAROLD MELOCHE Harold Meloche Attorney-in-fact |
|||||
II-5
| Exhibit Number |
Description | ||
|---|---|---|---|
| 1.1 | Form of Underwriting Agreement | ||
3.1 |
* |
Articles of incorporation, including all amendments as currently in effect (most recent amendment filed March 25, 2015) |
|
3.2 |
Amended and Restated Articles of incorporation of the Registrant, to be effective upon the closing of the offering |
||
3.3 |
* |
Bylaws of Registrant as currently in effect |
|
3.4 |
Form of Amended and Restated Bylaws of the Registrant, to be effective upon closing of the offering |
||
4.1 |
Form of Common Stock Certificate |
||
5.1 |
Opinion of Honigman Miller Schwartz and Cohn LLP |
||
10.1.1 |
* |
Amended and Restated Credit Agreement dated September 29, 2014, between the Registrant and Comerica Bank, N.A |
|
10.1.2 |
* |
First Amendment to Amended and Restated Credit Agreement and Waiver dated May 4, 2015, between the Registrant and Comerica Bank, N.A. |
|
10.1.3 |
Second Amendment to Amended and Restated Credit Agreement dated June 29, 2015, between the Registrant and Comerica Bank |
||
10.2 |
*† |
2015 Omnibus Incentive Plan |
|
10.3 |
* |
Lease Agreement, dated September 18, 2013, as amended |
|
21.1 |
* |
List of subsidiaries of Registrant |
|
23.1 |
Consent of Deloitte & Touche LLP, Independent Registered Public Accounting Firm |
||
23.2 |
Consent of Deloitte & Touche LLP, Independent Auditors |
||
23.3 |
Consent of Honigman Miller Schwartz and Cohn LLP (included in Exhibit 5.1) |
||
24.1 |
* |
Power of Attorney |
|
- *
- Previously
filed.
- †
- Indicates a management contract or compensatory plan or arrangement
II-6