Attached files
| file | filename |
|---|---|
| 8-K - FORM 8-K - Univar Solutions Inc. | d37525d8k.htm |
| EX-99.1 - EX-99.1 - Univar Solutions Inc. | d37525dex991.htm |
 Second
Quarter Fiscal 2015 Earnings Conference Call
July 29, 2015 Exhibit 99.2 |
| Forward-Looking
Statements This presentation includes “forward-looking
statements,” including with respect to the initial public offering,
within the meaning of Section 27A of the Securities Act and Section 21E of the Securities Exchange Act of 1934, as amended. Forward-looking statements are subject to known and unknown
risks and uncertainties, many of which may be beyond our control. We caution you that
the forward- looking information presented in this presentation is not
a guarantee of future events, and that actual events may differ
materially from those made in or suggested by the forward-looking information contained in this presentation. You should review Univar’s filings with the Securities and Exchange
Commission for more information regarding the factors that could cause actual results
to differ materially from these projections or expectations. In addition,
forward-looking statements generally can be identified by the use of
forward-looking terminology such as “may,” “plan,” “seek,” “comfortable with,” “will,” “expect,” “intend,” “estimate,” “anticipate,” “believe” or
“continue” or the negative thereof or variations thereon or
similar terminology. Any forward-looking information presented herein is made only as of the date of this presentation, and we do not undertake any obligation to update or revise any
forward-looking information to reflect changes in assumptions, the occurrence of
unanticipated events, or otherwise.
Regulation G: Non GAAP Measures
The information presented herein regarding certain unaudited non GAAP measures does not
conform to generally accepted accounting principles in the United States
(U.S. GAAP) and should not be construed as an alternative to the reported
results determined in accordance with U.S. GAAP. Univar has included this
non-GAAP information to assist in understanding the operating performance of the company and its operating segments. The non-GAAP information provided may not be consistent with
the methodologies used by other companies. All non-GAAP information related to
previous Univar filings with the SEC has been reconciled with reported
U.S. GAAP results. 2 |
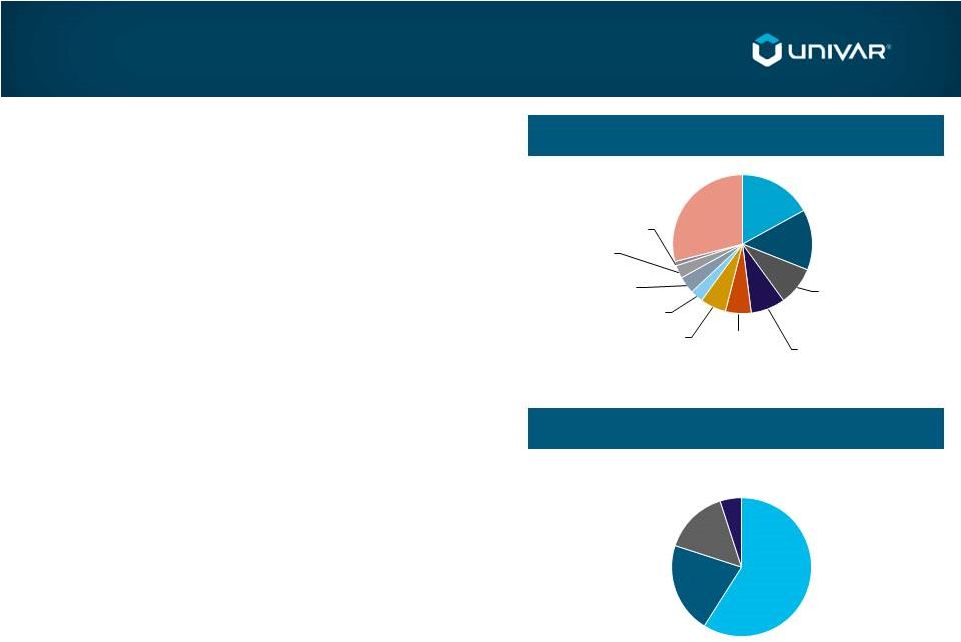 3 World Leader in Chemical Distribution 2014 Revenue By End Market 2014 Revenue By Operating Segment Global provider of basic and specialty chemicals; innovative value-added services • Net Sales $9.8 billion – Last 12 months (LTM) 6/30/15 • Adjusted EBITDA $634.0 million - LTM 6/30/15 #1 in North America and #2 in Europe (a) Strategically positioned for growth and margin expansion (a) Univar and Brenntag are the largest North American chemical distributors per “Specialty Chemical Distribution Market Update” (Boston Consulting Group; April
2014); market share measured based upon revenue per Univar
S-1 (USA + Canada) and Brenntag
2014 annual report. Water treatment comprises 5% of total revenue Oil, Gas & Mining 17% Coatings & Adhesives 14% Agricultural Sciences 9% Chemical Food Ingredients 6% Cleaning & Sanitization 6% 3% Pharmaceuticals Rubber & Plastics 1% Other 29% Manufacturing 8% Personal Care 4% Utilities 3% USA 59% EMEA 21% Canada 15% RoW 5% |
 4 Second Quarter 2015 Highlights Strong Execution Despite Significant FX and Oil & Gas Headwinds Adjusted EBITDA 1 (4.4%) • Adjusted EBITDA Excl. FX +1.5% Margin Expansion 1 • Gross margin +110 basis points • Adjusted EBITDA margin + 55 basis points Attractive Bolt-on Acquisition • Key Chemical (April) Initial Public Offering • 40,250,000 shares of common stock (primary and secondary) and $350.0 million private placement 1 Variances to Q2 2014 |
 5 Univar - Consolidated Highlights Successfully Offsetting Headwinds • Large FX translation impact • Oil & Gas volume decline • Mix enrichment from industrial
chemicals and services
• Gross Margin up • Conversion ratio up 1 • Adjusted EBITDA margin up Key Metrics: $ in millions 2Q15 2Q14 Y/Y % Net Sales $2,510.1 $2,861.4 (12.3%) Currency Neutral -- -- (5.4%) Gross Profit $467.2 $500.5 (6.7%) Currency Neutral -- -- 0.4% Gross Margin 18.6% 17.5% +110 bps Adjusted EBITDA $168.6 $176.4 (4.4%) Currency Neutral -- -- 1.4% Adjusted EBITDA Margin 6.7% 6.2% +55 bps 1 Defined as Adjusted EBITDA divided by Gross Profit |
 6 USA - Highlights Higher Profitability Outside Oil & Gas • Strong performance in Industrial Chemicals • Attractive growth in value-added services (ChemPoint, ChemCare, MiniBulk, and Environmental Sciences) • Significant declines in upstream Oil & Gas Key Metrics: $ in millions 2Q15 2Q14 Y/Y % Net Sales $1,389.4 $1,546.2 (10.1%) Gross Profit $284.2 $298.6 (4.8%) Gross Margin 20.5% 19.3% +115 bps Adjusted EBITDA $110.1 $120.5 (8.6%) Adjusted EBITDA Margin 7.9% 7.8% +15 bps |
 7 Canada - Highlights Solid Results Ex-FX Translation • Good growth in eastern Canada industrial markets • Strong early agriculture season tapers off with dry weather and lower demand for crop protection products • Volume declines in western Canada oil drilling markets Key Metrics: $ in millions 2Q15 2Q14 Y/Y % Net Sales $534.6 $587.7 (9.0%) Currency Neutral -- -- 2.5% Gross Profit $63.0 $67.9 (7.2%) Currency Neutral -- -- 4.6% Gross Margin 11.8% 11.6% +25 bps Adjusted EBITDA $30.4 $31.9 (4.7%) Currency Neutral -- -- 7.5% Adjusted EBITDA Margin 5.7% 5.4% +25 bps |
 8 EMEA - Highlights Improved Profitability • 18% FX translation impact on sales • Lower volumes driven by business resizing • Gross Margin and Adjusted EBITDA up significantly • Restructuring program on track $ in millions 2Q15 2Q14 Y/Y % Net Sales $467.4 $596.9 (21.7%) Currency Neutral -- -- (4.1%) Gross Profit $98.6 $115.0 (14.3%) Currency Neutral -- -- 4.9% Gross Margin 21.1% 19.3% +185 bps Adjusted EBITDA $27.1 $22.7 19.4% Currency Neutral -- -- 39.7% Adjusted EBITDA Margin 5.8% 3.8% +200 bps Key Metrics: |
 9 Acquisition Drives Growth • Nov. 2014 D’Altomare acquisition (Brazil) driving margins up significantly with product shift to specialty chemicals • Positive double-digit impact on a currency neutral basis • Tight operating expense controls • Lower prices in commodity products reducing overall revenues $ in millions 2Q15 2Q14 Y/Y % Net Sales $118.7 $130.6 (9.1%) Currency Neutral -- -- 10.4% Gross Profit $21.4 $19.0 12.6% Currency Neutral -- -- 40.5% Gross Margin 18.0% 14.5% +350 bps Adjusted EBITDA $6.2 $4.7 31.9% Currency Neutral -- -- 70.2% Adjusted EBITDA Margin 5.2% 3.6% +160 bps Key Metrics: Rest of World - Highlights |
 10 Consolidated Balance Sheet & Cash Flow Highlights (1) Cash flow from operating activities less net cash investment in PP&E and cost method investments.
(2) Net Debt defined as Total Debt (Long term debt plus short term financing) less cash and cash equivalents.
(3) LTM Earnings before Interest, Taxes and Amortization (EBITA) divided by trailing 13 month average of net PP&E plus trade working capital (accounts receivable plus inventory less accounts payable). $ in millions YTD 6/30/15 YTD 6/30/14 Y/Y % Free Cash Flow (1) $51.2 $(123.6) 141.4% Total Debt (2) $3,114.2 $3,949.0 (21.1)% Net Debt (2) $2,917.2 $3,785.8 (22.9)% Return on Assets Deployed (3) 22.2% 21.7% +50 bps Cash Taxes $16.9 $10.8 56.5% |
 11 Strengthened Financial Condition Three transactions strengthen financial condition IPO + Private Placement + Refinancing • ~$760 million of equity proceeds raised in June 2015 • Paid off all $650 million of 10.5% interest rate Mezzanine Debt • Refinanced entire capital structure • Extended debt maturities 5 years to 2022-23 • future annual cash interest reduced ~$100 million • Net debt/EBITDA reduced from 5.6 times to 4.5 times • Credit rating raised in June 2015 |
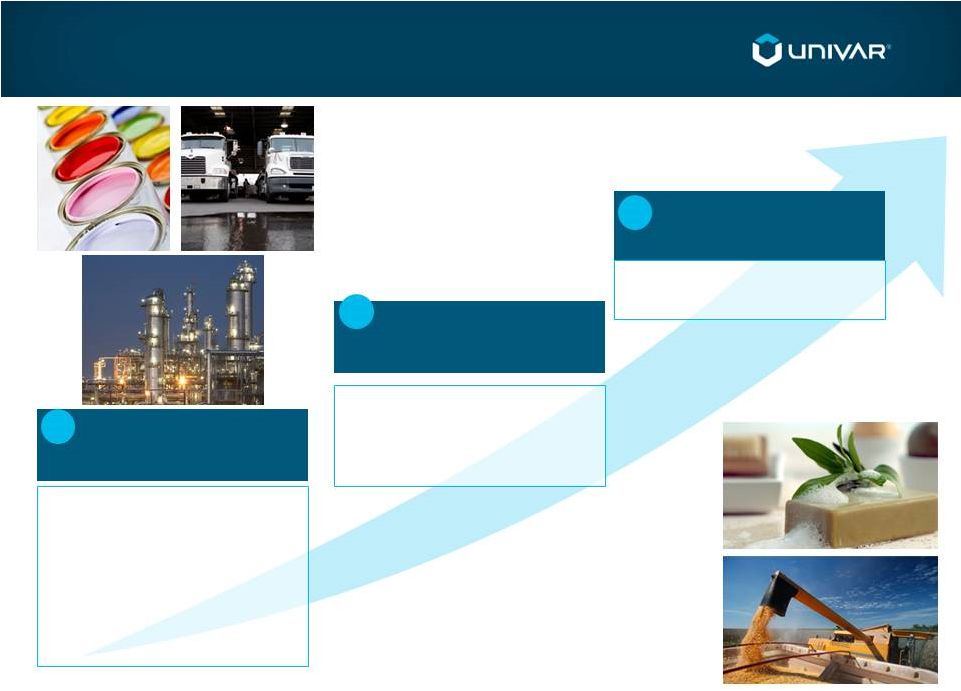 12 Strategic Priorities Capitalize on Organic Growth Opportunities in Attractive Markets 1 › Innovative Valued-Added Services › Highly Focused Sales Force › Full Solution Customer Value Proposition › Producer-Supported Solutions Model Continue to Execute on Operational Excellence Initiatives 2 › Commercial Excellence Initiatives › Ongoing Productivity Improvements “Tuck-in”
Acquisitions to Complement Organic
Growth 3 › Steady Flow of Opportunities › New Markets / New Products |
 13 Outlook Key Assumptions • Margin improvement • Unfavorable FX translation impact • Lower demand from Oil & Gas end markets Outlook • Expect third quarter 2015 Adjusted EBITDA to be modestly below the third quarter 2014 on a currency neutral basis |
 14 Appendix – Adj. EBITDA Reconciliation 3 months ended 6/30 6 months ended 6/30 LTM $ in Millions 2015 2014 2015 2014 6/30/2015 Adjusted EBITDA $168.6 $176.4 $314.3 $322.0 $634.0 Other Operating Expenses, net 39.0 25.6 47.1 47.3 196.9 Depreciation 37.7 30.6 69.7 61.2 142.0 Amortization 22.4 24.1 44.3 47.8 92.5 Impairment Charges -- -- -- -- 0.3 Interest Expense, net 63.1 64.8 126.3 128.7 248.2 Loss on Extinguishment of Debt 7.3 -- 7.3 1.2 7.3 Other Expense, net 12.1 2.0 5.3 3.9 0.3 Income tax expense (benefit) (0.6) 9.8 7.0 15.2 (24.0) Net Income (Loss) $(12.4) $19.5 $7.3 $16.7 $(29.5) |
 15 |