Attached files
| file | filename |
|---|---|
| 8-K - 8-K - O-I Glass, Inc. /DE/ | a15-16527_18k.htm |
| EX-99.1 - EX-99.1 - O-I Glass, Inc. /DE/ | a15-16527_1ex99d1.htm |
Exhibit 99.2
|
|
O-I Second Quarter 2015 Earnings Presentation July 30, 2015 |
|
|
Safe Harbor Comments Regulation G The information presented here regarding adjusted net earnings relates to net earnings from continuing operations attributable to the Company exclusive of items management considers not representative of ongoing operations and does not conform to U.S. generally accepted accounting principles (GAAP). In addition, the information presented here regarding EBITDA is not a defined term under GAAP. Non-GAAP measures should not be construed as an alternative to the reported results determined in accordance with GAAP. Management has included this non-GAAP information to assist in understanding the comparability of results of ongoing operations. Further, the information presented here regarding free cash flow does not conform to GAAP. Management defines free cash flow as cash provided by continuing operating activities less capital spending (both as determined in accordance with GAAP) and has included this non-GAAP information to assist in understanding the comparability of cash flows. Management uses non-GAAP information principally for internal reporting, forecasting, budgeting and calculating compensation payments. Management believes that the non-GAAP presentation allows the board of directors, management, investors and analysts to better understand the Company’s financial performance in relationship to core operating results and the business outlook. Forward Looking Statements This document contains "forward-looking" statements within the meaning of Section 21E of the Securities Exchange Act of 1934 and Section 27A of the Securities Act of 1933. Forward-looking statements reflect the Company's current expectations and projections about future events at the time, and thus involve uncertainty and risk. The words “believe,” “expect,” “anticipate,” “will,” “could,” “would,” “should,” “may,” “plan,” “estimate,” “intend,” “predict,” “potential,” “continue,” and the negatives of these words and other similar expressions generally identify forward looking statements. It is possible the Company's future financial performance may differ from expectations due to a variety of factors including, but not limited to the following: (1) the Company’s ability to consummate the Vitro Acquisition on a timely basis or at all, (2) risks associated with governmental approvals of the Vitro Acquisition, (3) the Company’s ability to integrate the Vitro Business in a timely and cost effective manner, to maintain on existing terms the permits, licenses and other approvals required for the Vitro Business to operate as currently operated, and to realize the expected synergies from the Vitro Acquisition, (4) risks associated with the significant transaction costs and additional indebtedness that the Company expects to incur in financing the Vitro Acquisition, (5) the Company’s ability to realize expected growth opportunities and cost savings from the Vitro Acquisition, (6) foreign currency fluctuations relative to the U.S. dollar, specifically the Euro, Brazilian real, Mexican peso, Colombian peso and Australian dollar, (7) changes in capital availability or cost, including interest rate fluctuations and the ability of the Company to refinance debt at favorable terms, (8) the general political, economic and competitive conditions in markets and countries where the Company has operations, including uncertainties related to economic and social conditions, disruptions in capital markets, disruptions in the supply chain, competitive pricing pressures, inflation or deflation, and changes in tax rates and laws, (9) consumer preferences for alternative forms of packaging, (10) cost and availability of raw materials, labor, energy and transportation, (11) the Company’s ability to manage its cost structure, including its success in implementing restructuring plans and achieving cost savings, (12) consolidation among competitors and customers, (13) the ability of the Company to acquire businesses and expand plants, integrate operations of acquired businesses and achieve expected synergies, (14) unanticipated expenditures with respect to environmental, safety and health laws, (15) the Company’s ability to further develop its sales, marketing and product development capabilities, and (16) the timing and occurrence of events which are beyond the control of the Company, including any expropriation of the Company’s operations, floods and other natural disasters, events related to asbestos-related claims, and the other risk factors discussed in the Company’s Annual Report on Form 10-K for the year ended December 31, 2014 and any subsequently filed Quarterly Report on Form 10-Q. It is not possible to foresee or identify all such factors. Any forward-looking statements in this document are based on certain assumptions and analyses made by the Company in light of its experience and perception of historical trends, current conditions, expected future developments, and other factors it believes are appropriate in the circumstances. Forward-looking statements are not a guarantee of future performance and actual results or developments may differ materially from expectations. While the Company continually reviews trends and uncertainties affecting the Company's results of operations and financial condition, the Company does not assume any obligation to update or supplement any particular forward-looking statements contained in this document. 1 |
|
|
Safe Harbor Comments Presentation Note Unless otherwise noted, the information presented in this presentation reflects continuing operations only. Vitro’s Food and Beverage Business Financial Information The financial information the Company provides in this presentation for Vitro’s food and beverage business is unaudited and incorporates significant assumptions and estimates. This presentation contains historical financial information for Vitro’s food and beverage business based on data provided by Vitro management which are unaudited and have not been reviewed by the Company’s independent accountants. The Company plans to file separate Vitro food and beverage financial statements and pro forma O-I financial information giving effect to the Vitro food and beverage business acquisition in a Current Report on Form 8-K within the prescribed time period following consummation of the Vitro food and beverage acquisition, as required by SEC rules. However, the Company cannot ensure that there will not be material differences between the historical financial information for Vitro’s food and beverage business provides in this presentation and the audited financial statements that the Company intends to file in a Current Report on Form 8-K. 2 |
|
|
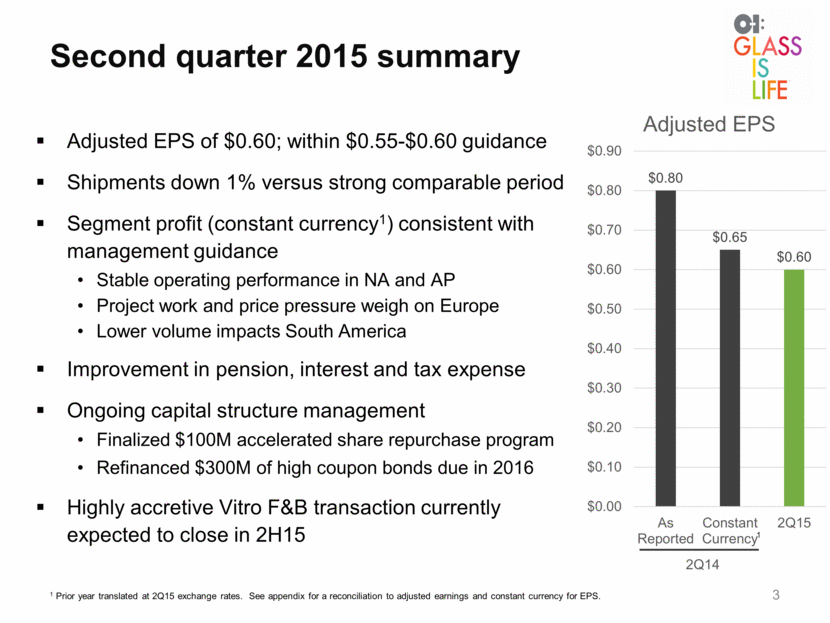
Adjusted EPS of $0.60; within $0.55-$0.60 guidance Shipments down 1% versus strong comparable period Segment profit (constant currency1) consistent with management guidance Stable operating performance in NA and AP Project work and price pressure weigh on Europe Lower volume impacts South America Improvement in pension, interest and tax expense Ongoing capital structure management Finalized $100M accelerated share repurchase program Refinanced $300M of high coupon bonds due in 2016 Highly accretive Vitro F&B transaction currently expected to close in 2H15 Second quarter 2015 summary 2Q14 1 Prior year translated at 2Q15 exchange rates. See appendix for a reconciliation to adjusted earnings and constant currency for EPS. 1 $0.80 $0.65 $0.60 $0.00 $0.10 $0.20 $0.30 $0.40 $0.50 $0.60 $0.70 $0.80 $0.90 As Reported Constant Currency 2Q15 Adjusted EPS |
|
|
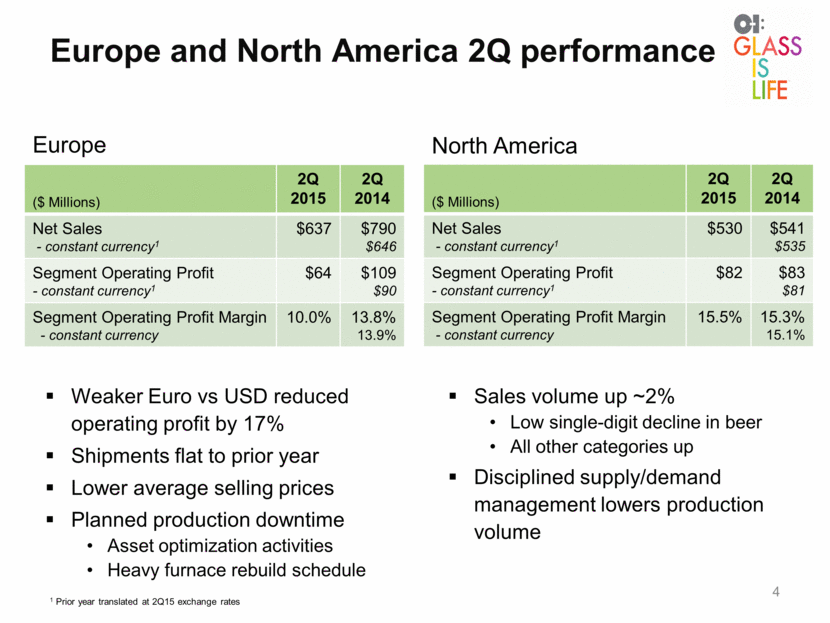
4 Weaker Euro vs USD reduced operating profit by 17% Shipments flat to prior year Lower average selling prices Planned production downtime Asset optimization activities Heavy furnace rebuild schedule North America Europe Sales volume up ~2% Low single-digit decline in beer All other categories up Disciplined supply/demand management lowers production volume 1 Prior year translated at 2Q15 exchange rates ($ Millions) 2Q 2015 2Q 2014 Net Sales - constant currency1 $637 $790 $646 Segment Operating Profit - constant currency1 $64 $109 $90 Segment Operating Profit Margin - constant currency 10.0% 13.8% 13.9% ($ Millions) 2Q 2015 2Q 2014 Net Sales - constant currency1 $530 $541 $535 Segment Operating Profit - constant currency1 $82 $83 $81 Segment Operating Profit Margin - constant currency 15.5% 15.3% 15.1% Europe and North America 2Q performance |
|
|
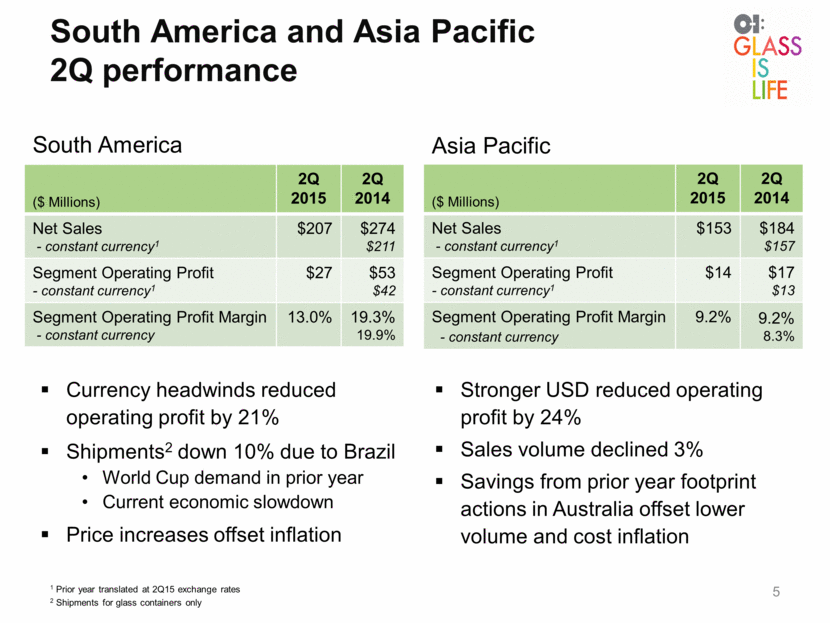
South America and Asia Pacific 2Q performance 5 Currency headwinds reduced operating profit by 21% Shipments2 down 10% due to Brazil World Cup demand in prior year Current economic slowdown Price increases offset inflation Asia Pacific South America Stronger USD reduced operating profit by 24% Sales volume declined 3% Savings from prior year footprint actions in Australia offset lower volume and cost inflation 1 Prior year translated at 2Q15 exchange rates 2 Shipments for glass containers only ($ Millions) 2Q 2015 2Q 2014 Net Sales - constant currency1 $207 $274 $211 Segment Operating Profit - constant currency1 $27 $53 $42 Segment Operating Profit Margin - constant currency 13.0% 19.3% 19.9% ($ Millions) 2Q 2015 2Q 2014 Net Sales - constant currency1 $153 $184 $157 Segment Operating Profit - constant currency1 $14 $17 $13 Segment Operating Profit Margin - constant currency 9.2% 9.2% 8.3% |
|
|
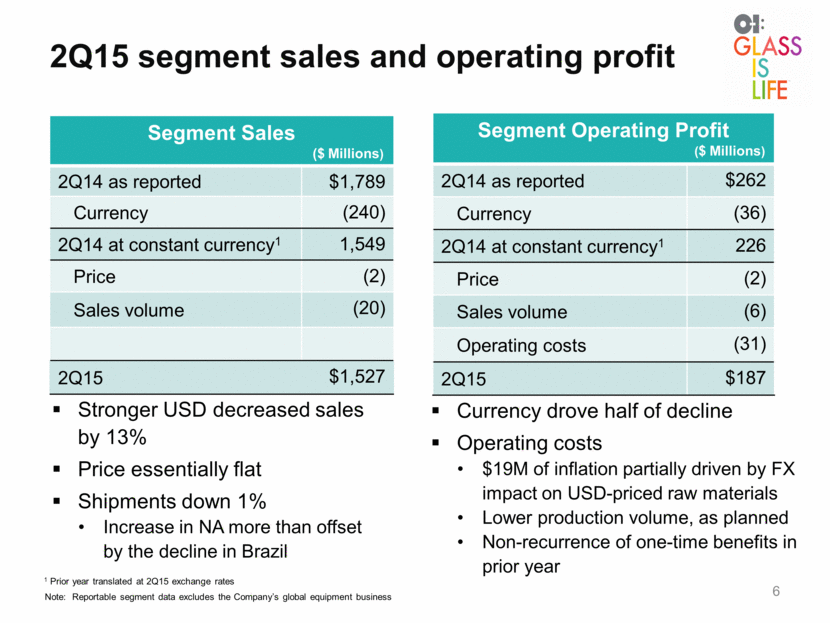
2Q15 segment sales and operating profit 6 Note: Reportable segment data excludes the Company’s global equipment business Stronger USD decreased sales by 13% Price essentially flat Shipments down 1% Increase in NA more than offset by the decline in Brazil Segment Sales ($ Millions) 2Q14 as reported $1,789 Currency (240) 2Q14 at constant currency1 1,549 Price (2) Sales volume (20) 2Q15 $1,527 Segment Operating Profit ($ Millions) 2Q14 as reported $262 Currency (36) 2Q14 at constant currency1 226 Price (2) Sales volume (6) Operating costs (31) 2Q15 $187 Currency drove half of decline Operating costs $19M of inflation partially driven by FX impact on USD-priced raw materials Lower production volume, as planned Non-recurrence of one-time benefits in prior year 1 Prior year translated at 2Q15 exchange rates |
|
|
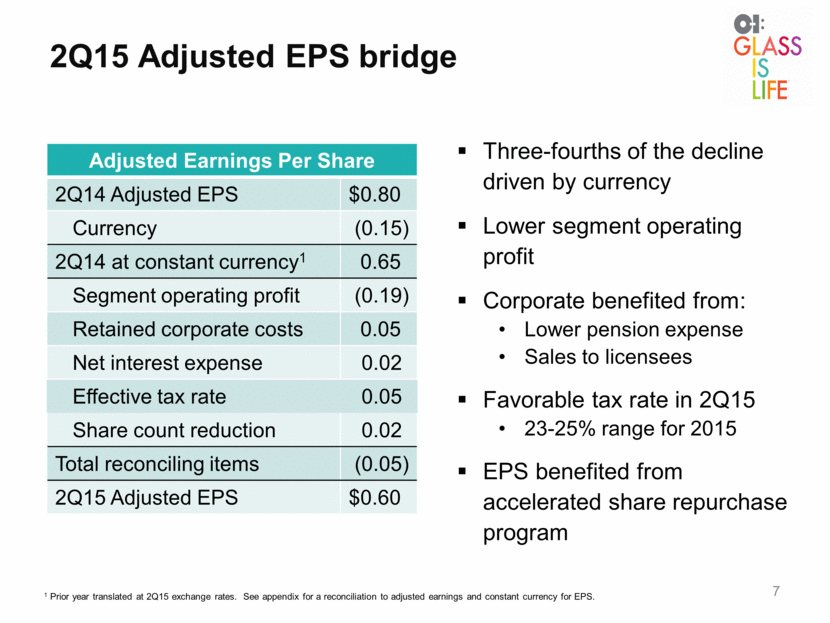
2Q15 Adjusted EPS bridge 7 Adjusted Earnings Per Share 2Q14 Adjusted EPS $0.80 Currency (0.15) 2Q14 at constant currency1 0.65 Segment operating profit (0.19) Retained corporate costs 0.05 Net interest expense 0.02 Effective tax rate 0.05 Share count reduction 0.02 Total reconciling items (0.05) 2Q15 Adjusted EPS $0.60 1 Prior year translated at 2Q15 exchange rates. See appendix for a reconciliation to adjusted earnings and constant currency for EPS. Three-fourths of the decline driven by currency Lower segment operating profit Corporate benefited from: Lower pension expense Sales to licensees Favorable tax rate in 2Q15 23-25% range for 2015 EPS benefited from accelerated share repurchase program |
|
|
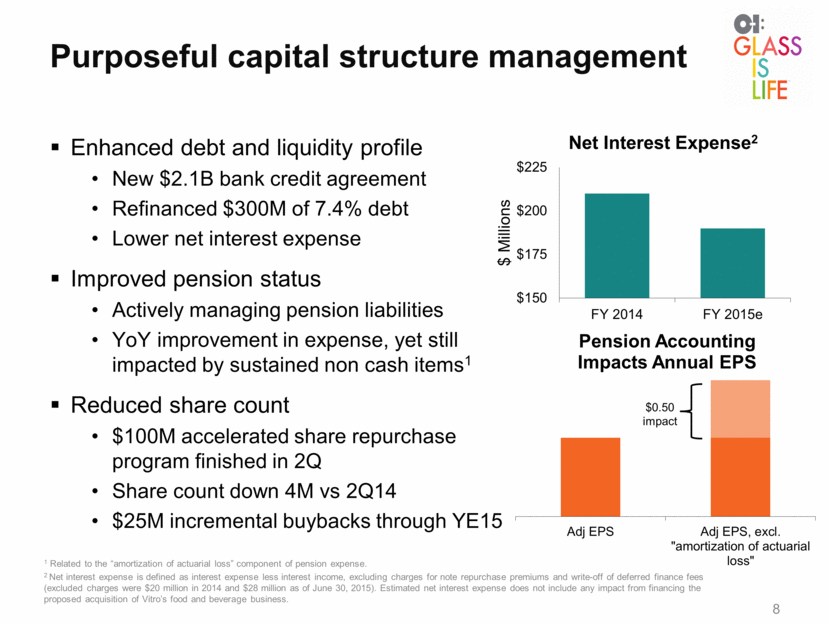
1 Related to the “amortization of actuarial loss” component of pension expense. 2 Net interest expense is defined as interest expense less interest income, excluding charges for note repurchase premiums and write-off of deferred finance fees (excluded charges were $20 million in 2014 and $28 million as of June 30, 2015). Estimated net interest expense does not include any impact from financing the proposed acquisition of Vitro’s food and beverage business. Purposeful capital structure management Enhanced debt and liquidity profile New $2.1B bank credit agreement Refinanced $300M of 7.4% debt Lower net interest expense Improved pension status Actively managing pension liabilities YoY improvement in expense, yet still impacted by sustained non cash items1 Reduced share count $100M accelerated share repurchase program finished in 2Q Share count down 4M vs 2Q14 $25M incremental buybacks through YE15 $0.50 impact 8 $150 $175 $200 $225 FY 2014 FY 2015e $ Millions Net Interest Expense 2 Adj EPS Adj EPS, excl. "amortization of actuarial loss" Pension Accounting Impacts Annual EPS |
|
|
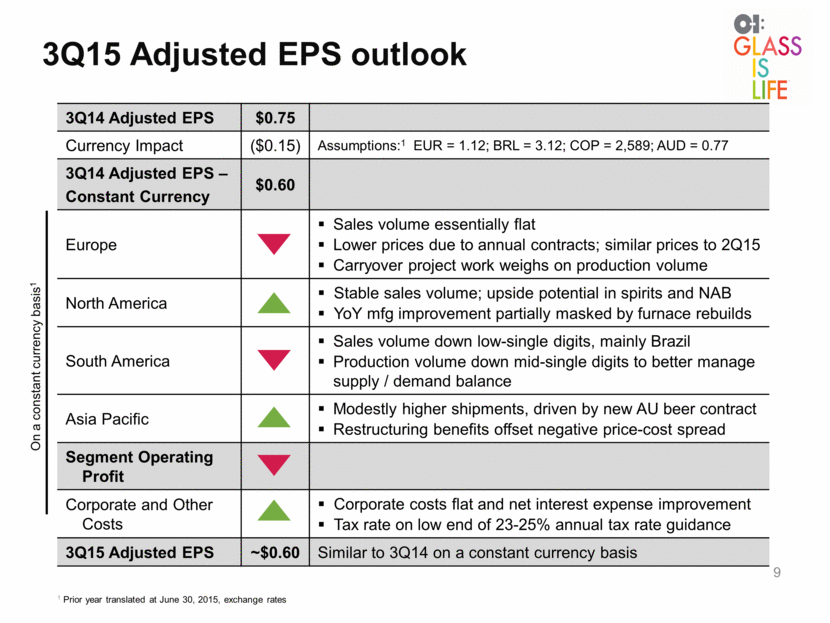
3Q15 Adjusted EPS outlook 9 3Q14 Adjusted EPS $0.75 Currency Impact ($0.15) Assumptions:1 EUR = 1.12; BRL = 3.12; COP = 2,589; AUD = 0.77 3Q14 Adjusted EPS – Constant Currency $0.60 Europe Sales volume essentially flat Lower prices due to annual contracts; similar prices to 2Q15 Carryover project work weighs on production volume North America Stable sales volume; upside potential in spirits and NAB YoY mfg improvement partially masked by furnace rebuilds South America Sales volume down low-single digits, mainly Brazil Production volume down mid-single digits to better manage supply / demand balance Asia Pacific Modestly higher shipments, driven by new AU beer contract Restructuring benefits offset negative price-cost spread Segment Operating Profit Corporate and Other Costs Corporate costs flat and net interest expense improvement Tax rate on low end of 23-25% annual tax rate guidance 3Q15 Adjusted EPS ~$0.60 Similar to 3Q14 on a constant currency basis 1 Prior year translated at June 30, 2015, exchange rates On a constant currency basis1 |
|
|
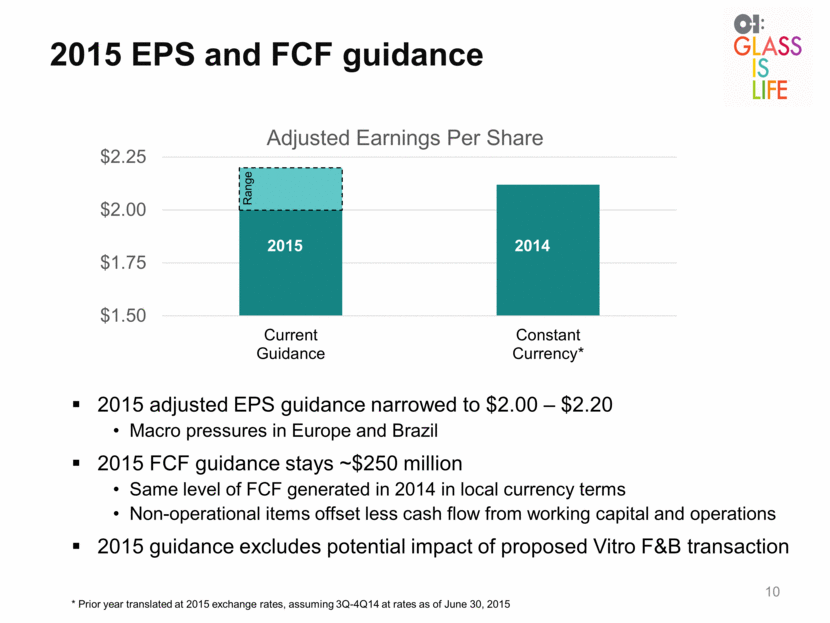
2015 adjusted EPS guidance narrowed to $2.00 – $2.20 Macro pressures in Europe and Brazil 2015 FCF guidance stays ~$250 million Same level of FCF generated in 2014 in local currency terms Non-operational items offset less cash flow from working capital and operations 2015 guidance excludes potential impact of proposed Vitro F&B transaction 2015 EPS and FCF guidance 10 2014 * Prior year translated at 2015 exchange rates, assuming 3Q-4Q14 at rates as of June 30, 2015 2015 Range $1.50 $1.75 $2.00 $2.25 Current Guidance Constant Currency* Adjusted Earnings Per Share |
|
|
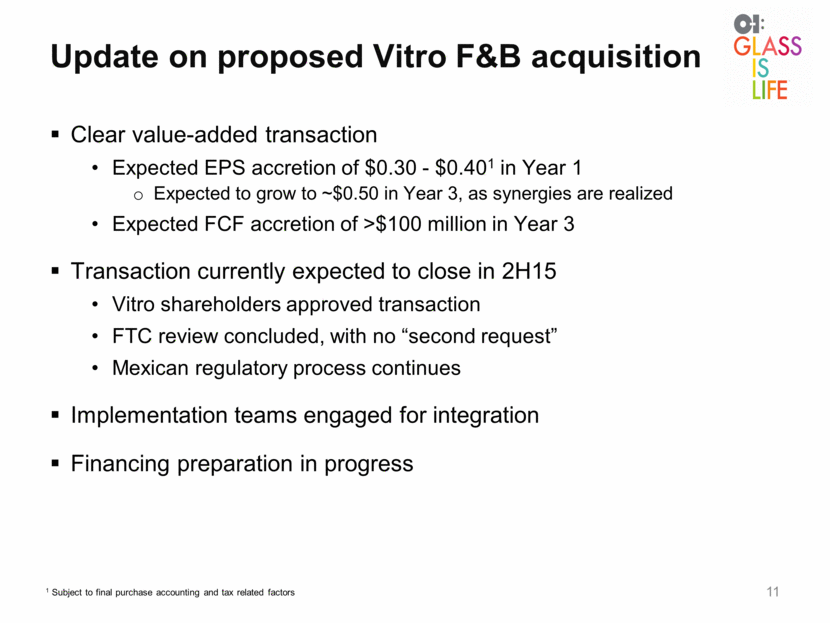
Update on proposed Vitro F&B acquisition 11 Clear value-added transaction Expected EPS accretion of $0.30 - $0.401 in Year 1 Expected to grow to ~$0.50 in Year 3, as synergies are realized Expected FCF accretion of >$100 million in Year 3 Transaction currently expected to close in 2H15 Vitro shareholders approved transaction FTC review concluded, with no “second request” Mexican regulatory process continues Implementation teams engaged for integration Financing preparation in progress 1 Subject to final purchase accounting and tax related factors |
|
|
2015 management priorities Advance leadership succession at multiple levels Execute key projects: Vitro F&B closing and integration, JV with CBI in Mexico, EU asset optimization Progression in innovation: melting and forming technology Strategic Generate strong cash flows in local currencies ~$250M free cash flow at current exchange rates1 Target $125M of share repurchases Balance financial flexibility and leverage Financial Enhance manufacturing capabilities and stability Continue to reduce structural costs Exercise disciplined price / volume management Operational 12 1 Assumes June 30, 2015, exchange rates continue for remainder of the year. 12 |

|
|
Appendix 13 |
|
|
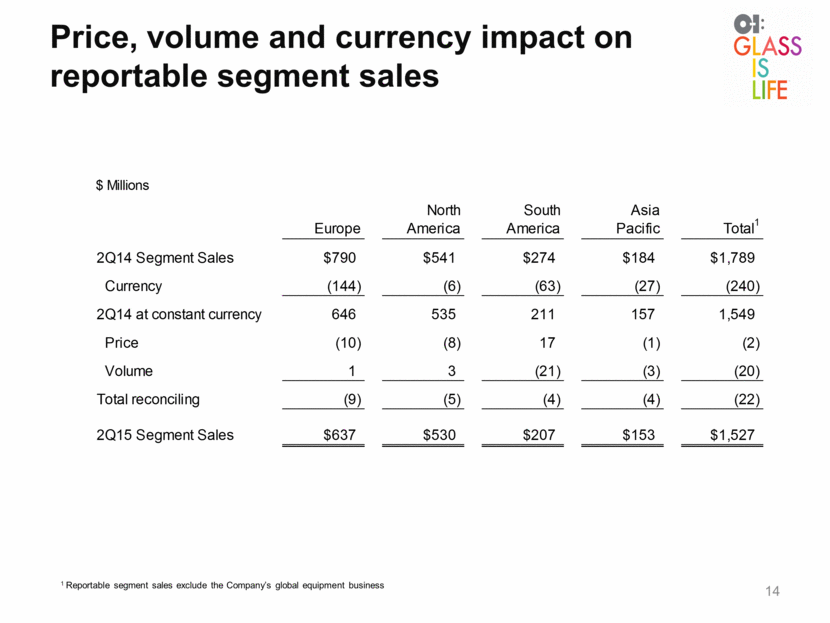
Price, volume and currency impact on reportable segment sales 14 1 Reportable segment sales exclude the Company’s global equipment business $ Millions Europe North America South America Asia Pacific Total1 2Q14 Segment Sales $790 $541 $274 $184 $1,789 Currency (144) (6) (63) (27) (240) 2Q14 at constant currency 646 535 211 157 1,549 Price (10) (8) 17 (1) (2) Volume 1 3 (21) (3) (20) Total reconciling (9) (5) (4) (4) (22) 2Q15 Segment Sales $637 $530 $207 $153 $1,527 |
|
|
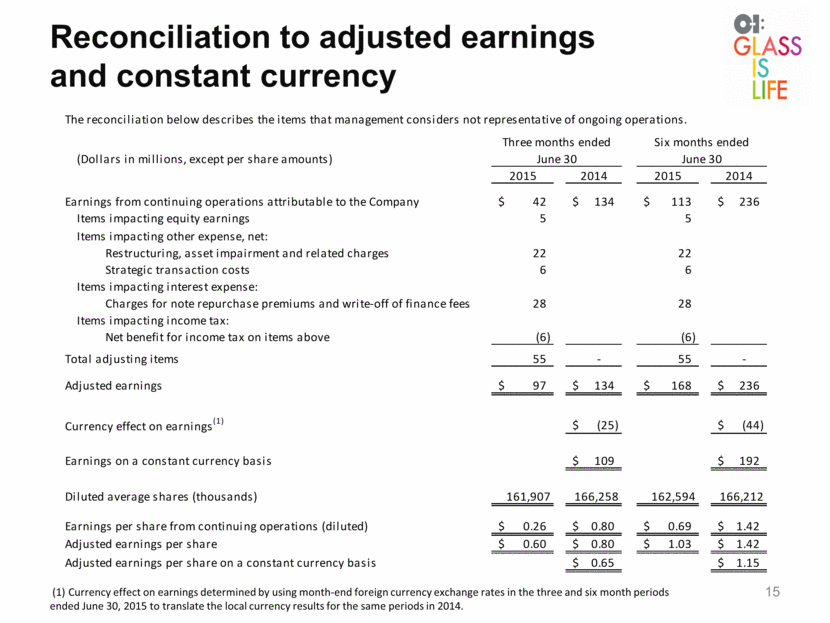
Reconciliation to adjusted earnings and constant currency 15 (1) Currency effect on earnings determined by using month-end foreign currency exchange rates in the three and six month periods ended June 30, 2015 to translate the local currency results for the same periods in 2014. The reconciliation below describes the items that management considers not representative of ongoing operations. (Dollars in millions, except per share amounts) 2015 2014 2015 2014 42 $ 134 $ 113 $ 236 $ Items impacting equity earnings 5 5 Restructuring, asset impairment and related charges 22 22 Strategic transaction costs 6 6 Charges for note repurchase premiums and write-off of finance fees 28 28 Items impacting income tax: Net benefit for income tax on items above (6) (6) Total adjusting items 55 - 55 - Adjusted earnings 97 $ 134 $ 168 $ 236 $ Currency effect on earnings (1) (25) $ (44) $ Earnings on a constant currency basis 109 $ 192 $ 161,907 166,258 162,594 166,212 Earnings per share from continuing operations (diluted) 0.26 $ 0.80 $ 0.69 $ 1.42 $ Adjusted earnings per share 0.60 $ 0.80 $ 1.03 $ 1.42 $ Adjusted earnings per share on a constant currency basis 0.65 $ 1.15 $ Six months ended June 30 Items impacting other expense, net: Items impacting interest expense: Diluted average shares (thousands) Three months ended June 30 Earnings from continuing operations attributable to the Company |
|
|
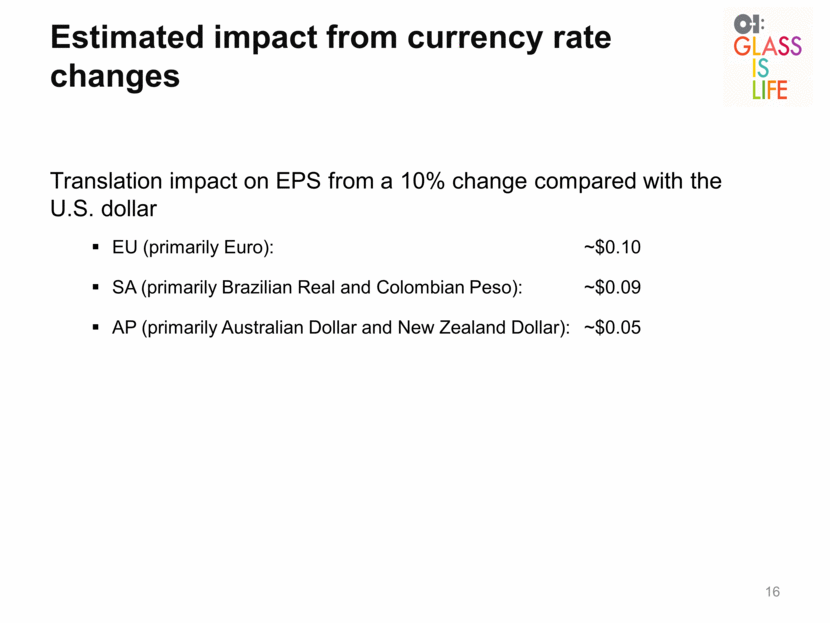
Estimated impact from currency rate changes 16 Translation impact on EPS from a 10% change compared with the U.S. dollar EU (primarily Euro): ~$0.10 SA (primarily Brazilian Real and Colombian Peso): ~$0.09 AP (primarily Australian Dollar and New Zealand Dollar): ~$0.05 |