Attached files
| file | filename |
|---|---|
| 8-K - CURRENT REPORT - CMS ENERGY CORP | d40252d8k.htm |
Exhibit 99.1
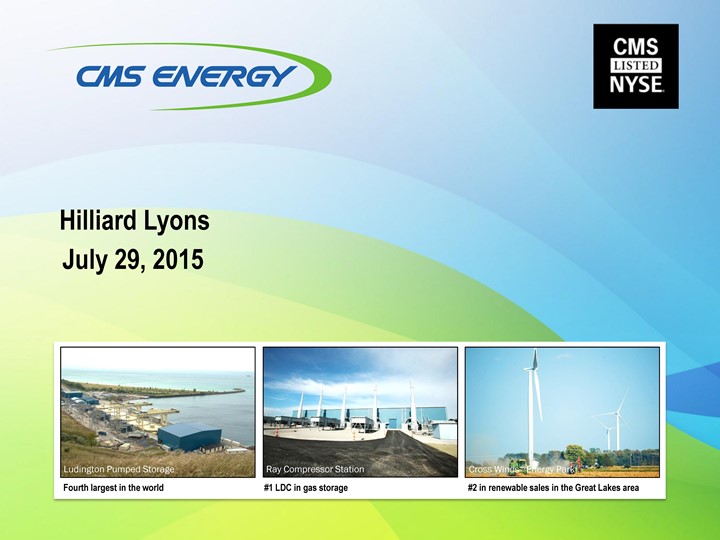
Hilliard Lyons July 29, 2015
Ludington Pumped Storage
Fourth largest in the world
Ray Compressor Station
#1 LDC in gas storage
Cross Winds âEnergy Park
#2 in renewable sales in the Great Lakes area
This presentation is made as of the date hereof and contains “forward-looking statements” as defined in Rule 3b-6 of the
Securities Exchange Act of 1934, Rule 175 of the Securities Act of 1933, and relevant legal decisions. The forward-looking statements are subject to risks and uncertainties. All forward-looking statements should be considered in the context of the risk and other factors detailed from time to time in CMS Energy’s and Consumers Energy’s Securities and Exchange Commission filings. Forward-looking statements should be read in conjunction with “FORWARD-LOOKING STATEMENTS AND
INFORMATION” and “RISK FACTORS” sections of CMS Energy’s and Consumers Energy’s Form 10-K for the year ended
December 31, 2014 and as updated in subsequent 10-Qs. CMS Energy’s and Consumers Energy’s “FORWARD-LOOKING
STATEMENTS AND INFORMATION” and “RISK FACTORS” sections are incorporated herein by reference and discuss important factors that could cause CMS Energy’s and Consumers Energy’s results to differ materially from those anticipated in such statements. CMS Energy and Consumers Energy undertake no obligation to update any of the information presented herein to reflect facts, events or circumstances after the date hereof.
The presentation also includes non-GAAP measures when describing CMS Energy’s results of operations and financial performance. A reconciliation of each of these measures to the most directly comparable GAAP measure is included in the appendix and posted on our website at www.cmsenergy.com.
CMS Energy provides historical financial results on both a reported (Generally Accepted Accounting Principles) and adjusted (non-GAAP) basis and provides forward-looking guidance on an adjusted basis. Management views adjusted earnings as a key measure of the company’s present operating financial performance, unaffected by discontinued operations, asset sales, impairments, regulatory items from prior years, or other items. These items have the potential to impact, favorably or unfavorably, the company’s reported earnings in future periods.
Investors and others should note that CMS Energy routinely posts important information on its website and considers the Investor Relations section, www.cmsenergy.com/investor-relations, a channel of distribution.
1
CMS Energy . . . .
Electric service territory Natural gas service territory Combined service territory
Generating facility
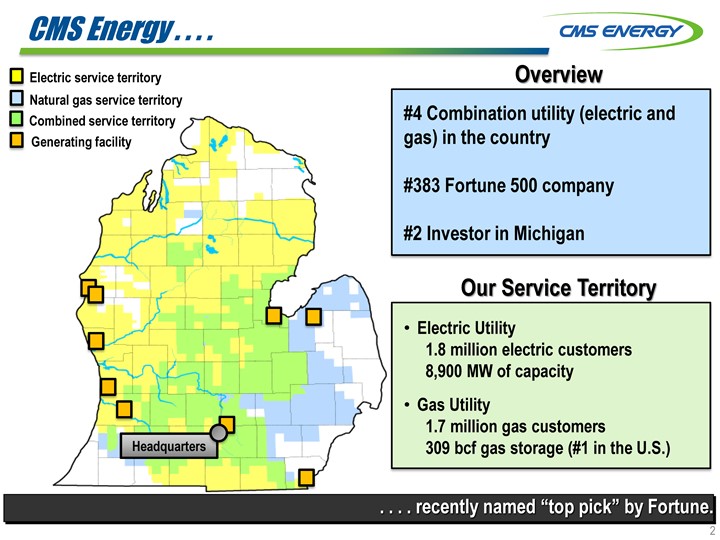
Overview
#4 Combination utility (electric and gas) in the country
#383 Fortune 500 company
#2 Investor in Michigan
Our Service Territory
Electric Utility
1.8 million electric customers 8,900 MW of capacity Gas Utility 1.7 million gas customers 309 bcf gas storage (#1 in the U.S.)
Headquarters
. . . . recently named “top pick” by Fortune.
2
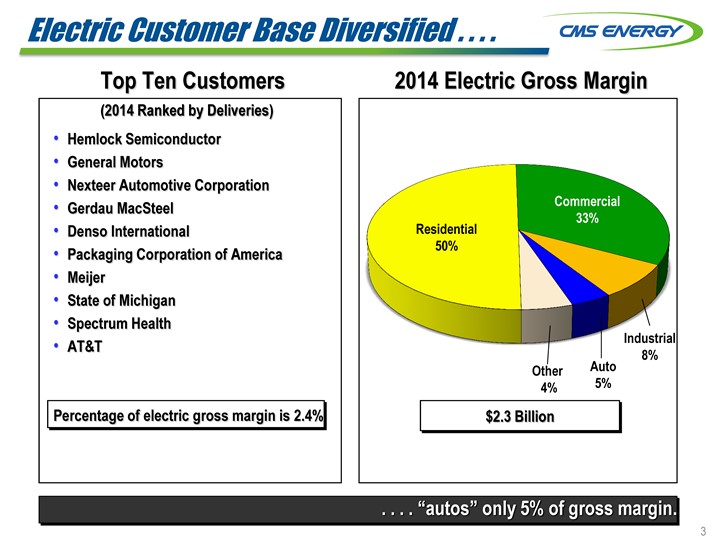
Electric Customer Base Diversified . . . .
2014 Electric Gross Margin
Top Ten Customers
(2014 Ranked by Deliveries)
Hemlock Semiconductor General Motors
Nexteer Automotive Corporation Gerdau MacSteel Denso International Packaging Corporation of America Meijer State of Michigan Spectrum Health AT&T
Percentage of electric gross margin is 2.4%
Commercial
33%
Residential 50%
Other
4%
Auto 5%
Industrial
8%
$2.3 Billion
. . . . “autos” only 5% of gross margin.
3
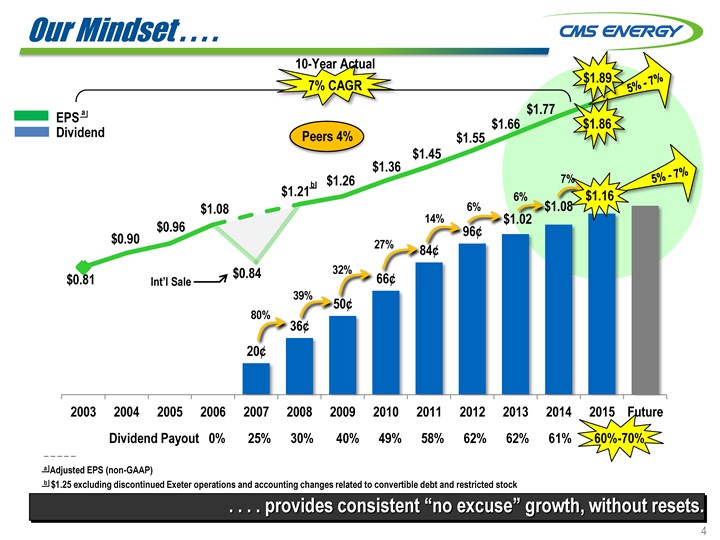
Our Mindset . . . .
EPS a Dividend
10-Year Actual
7% CAGR
$1.89
$ 1.86
5%—7%
Peers 4%
$1.77 $1.66 $1.55 $1.36 $1.45
b $1.26
$1.21
$1.08
$0.96
$0.90
$0.81
$0.84
Int’l Sale
$1.16
5%—7%
7%
6%
$1.02 $1.08
6%
96¢ 84¢
14%
66¢ 50¢
32% 27%
36¢
20¢
80% 39%
2003 2004 2005 2006 2007 2008 2009 2010 2011 2012 2013 2014 2015 Future
Dividend Payout 0% 25% 30% 40% 49% 58% 62% 62% 61% 60%-70%
. . . . provides consistent “no excuse” growth, without resets.
4
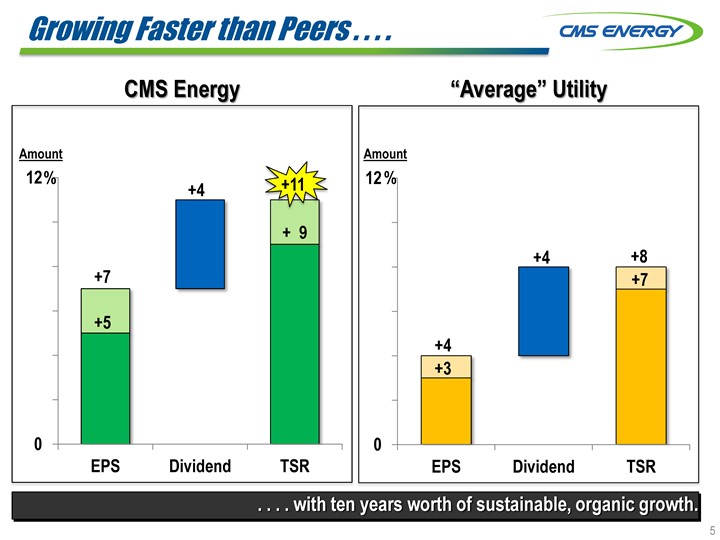
Growing Faster than Peers . . . .
CMS Energy
“Average” Utility
Amount
12 % +4 +11
+ 9
+7
+5
0
EPS Dividend TSR
Amount
12 % +4 +8
+ 7
+4
+3
0
EPS Dividend TSR
. . . . with ten years worth of sustainable, organic growth.
5
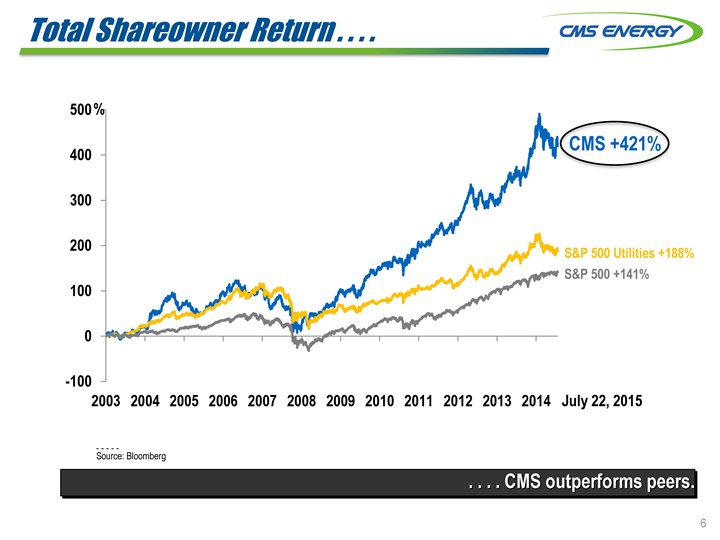
Total Shareowner Return . . . .
S&P 500 Utilities +188% S&P 500 +141%
500 %
400
300
200
100
0
-100
2003 2004 2005 2006 2007 2008 2009 2010 2011 2012 2013 2014 July 22, 2015
Source: Bloomberg
. . . . CMS outperforms peers.
6
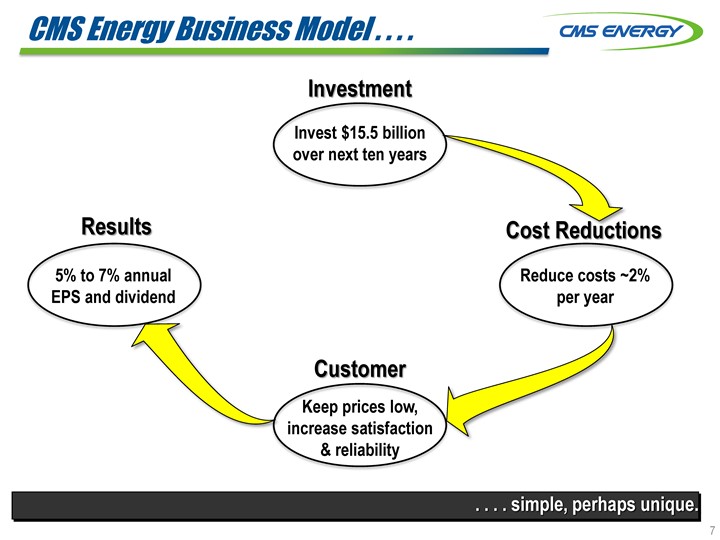
CMS Energy Business Model . . . .
Investment
Invest $15.5 billion over next ten years
Results
5% to 7% annual EPS and dividend
Cost Reductions
Reduce costs ~2% per year
Customer
Keep prices low, increase satisfaction & reliability
. . . . simple, perhaps unique.
7
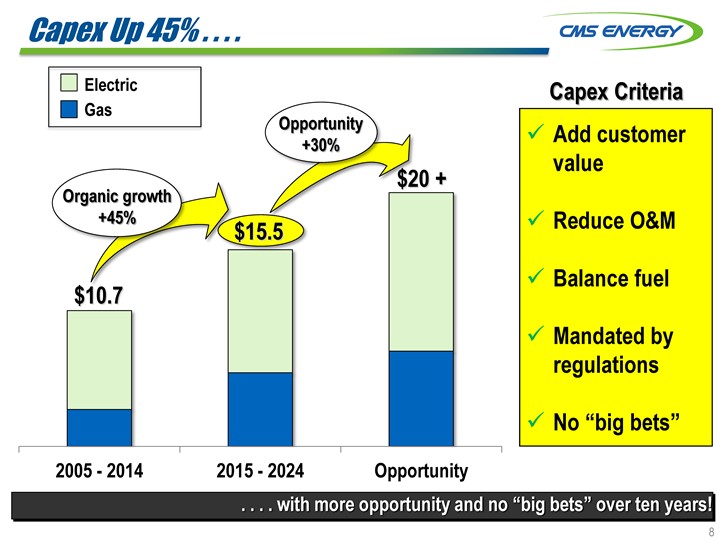
Capex Up 45% . . . .
Electric Gas
Capex Criteria
Add customer value
Reduce O&M
Balance fuel
Mandated by regulations
No “big bets”
Opportunity +30%
Organic growth +45%
$10.7
$15.5
$ 20 +
2005 — 2014 2015 — 2024 Opportunity
. . . . with more opportunity and no “big bets” over ten years!
8
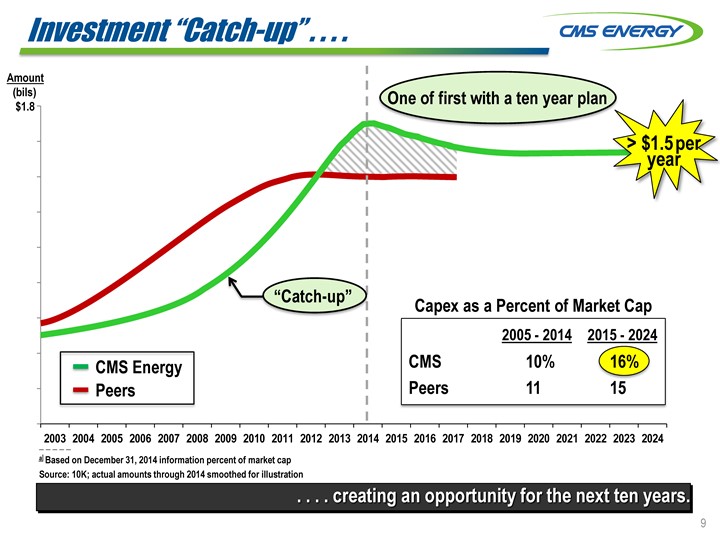
Investment “Catch-up” . . . .
Amount (bils) $1.8
One of first with a ten year plan
> $1.5 per
year
“Catch-up”
CMS Energy Peers
Capex as a Percent of Market Cap
2005—2014 2015—2024
CMS 10% 16%
Peers 11 15
2003 2004 2005 2006 2007 2008 2009 2010 2011 2012 2013 2014 2015 2016 2017 2018 2019 2020 2021 2022 2023 2024
a Based on December 31, 2014 information percent of market cap Source: 10K; actual amounts through 2014 smoothed for illustration
. . . . creating an opportunity for the next ten years.
9
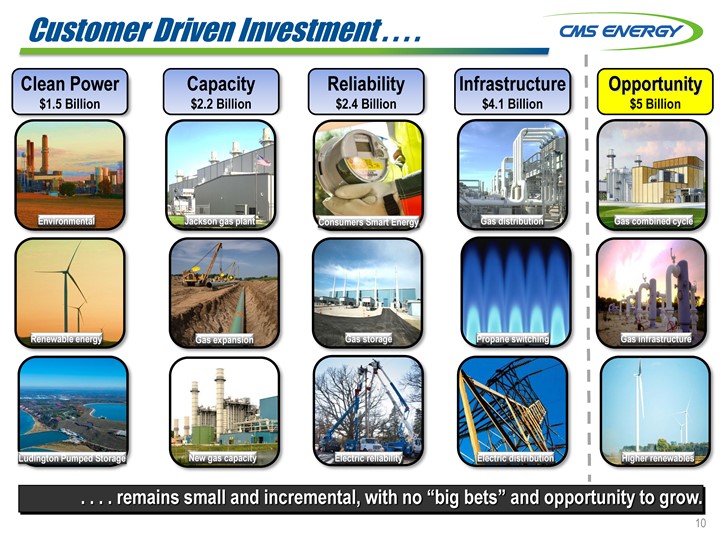
Customer Driven Investment . . . .
Clean Power Capacity Reliability Infrastructure Opportunity
$1.5 Billion $2.2 Billion $2.4 Billion $4.1 Billion $5 Billion
Environmental Jackson gas plant Consumers Smart Energy Gas distribution Gas combined cycle
Renewable energy Gas expansion Gas storage Propane switching Gas infrastructure
Ludington Pumped Storage New gas capacity Electric reliability Electric distribution Higher renewables
. . . . remains small and incremental, with no “big bets” and opportunity to grow.
10
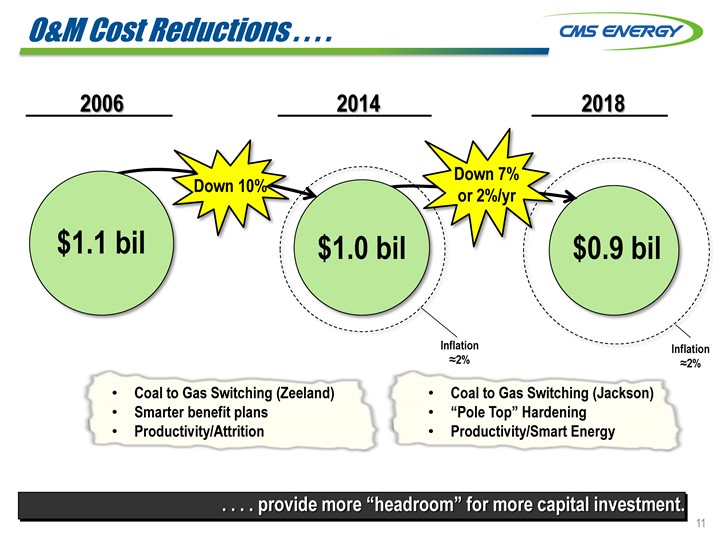
O&M Cost Reductions . . . .
2006 2014 2018
Down 7%
Down 10% or 2%/yr
$1.1 bil $1.0 bil $0.9 bil
Inflation Inflation
?2% ?2%
Coal to Gas Switching (Zeeland)
Coal to Gas Switching (Jackson)
Smarter benefit plans
“Pole Top” Hardening
Productivity/Attrition
Productivity/Smart Energy
. . . . provide more “headroom” for more capital investment.
11
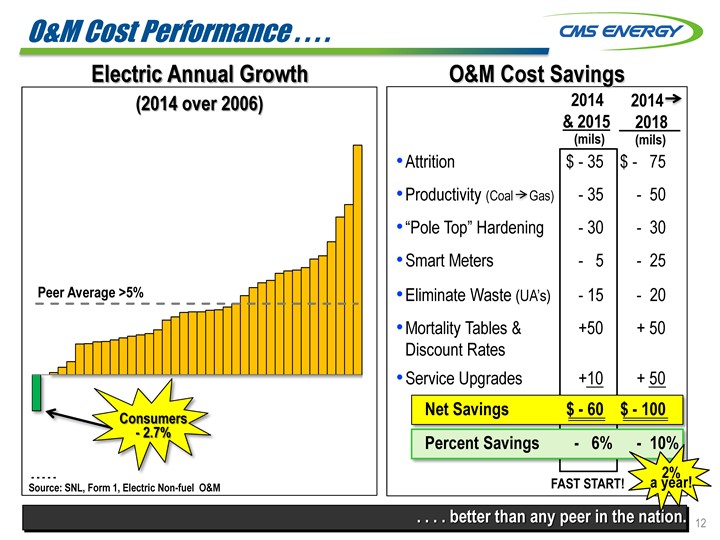
O&M Cost Performance . . . .
Electric Annual Growth
(2014 over 2006)
O&M Cost Savings
Source: SNL, Form 1, Electric Non-fuel O&M
Peer Average >5%
Consumers—2.7%
Attrition
Productivity (Coal Gas)
“Pole Top” Hardening
Smart Meters
Eliminate Waste (UA’s) Mortality Tables & Discount Rates Service Upgrades
2014 2014
& 2015 2018
(mils) (mils)
$— 35 $ — 75
— 35 — 50
— 30 — 30
— 5 — 25
— 15 — 20
+50 + 50
+10 + 50
$— 60 $ —100
Net Savings
Percent Savings
-6% -10%
2%
FAST START! a year!
. . . . better than any peer in the nation.
12
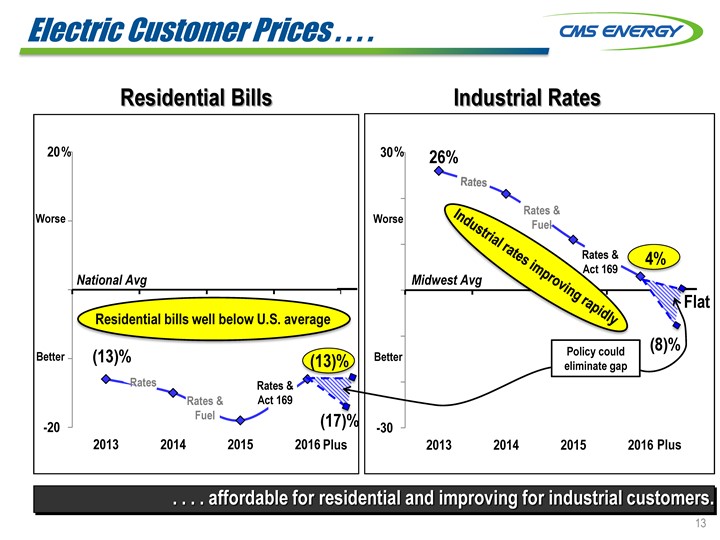
Electric Customer Prices . . . .
Residential Bills
Industrial Rates
20 % 30 % 26%
Worse Worse
4%
National Avg Midwest Avg
Flat
Residential bills well below U.S. average
could (8)%
Better (13)% (13)% Better Policy
eliminate gap
Rates Rates &
Rates & Act 169
Fuel (17)%
-20 -30
2013 2014 2015 2016 Plus 2013 2014 2015 2016 Plus
Rates Rates & Fuel Rates & Act 169
Industrial rates improving rapidly
. . . . affordable for residential and improving for industrial customers.
13
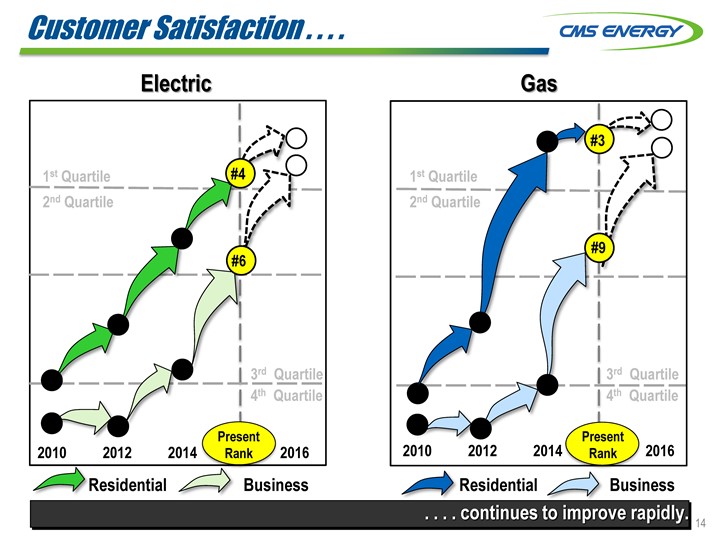
Customer Satisfaction . . . .
Electric
Gas
#3
1st Quartile #4 1st Quartile
2nd Quartile 2nd Quartile
#9
#6
3rd Quartile 3rd Quartile
4th Quartile 4th Quartile
Present Present
2010 2012 2014 Rank 2016 2010 2012 2014 Rank 2016
Residential Business Residential Business
. . . . continues to improve rapidly.
14
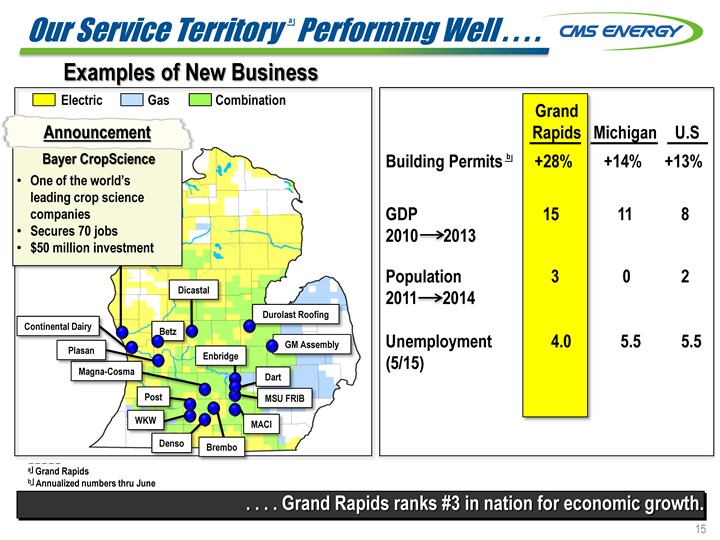
Our Service Territory a Performing Well . . . .
Examples of New Business
Electric Gas Combination
Announcement
Bayer CropScience
One of the world’s leading crop science companies Secures 70 jobs $50 million investment
Dicastal
Durolast Roofing
Continental Dairy Betz
GM Assembly
Plasan Enbridge
Magna-Cosma Dart
Post MSU FRIB
WKW MACI
Denso Brembo
Grand Rapids
Annualized numbers thru June
. . . . Grand Rapids ranks #3 in nation for economic growth.
15
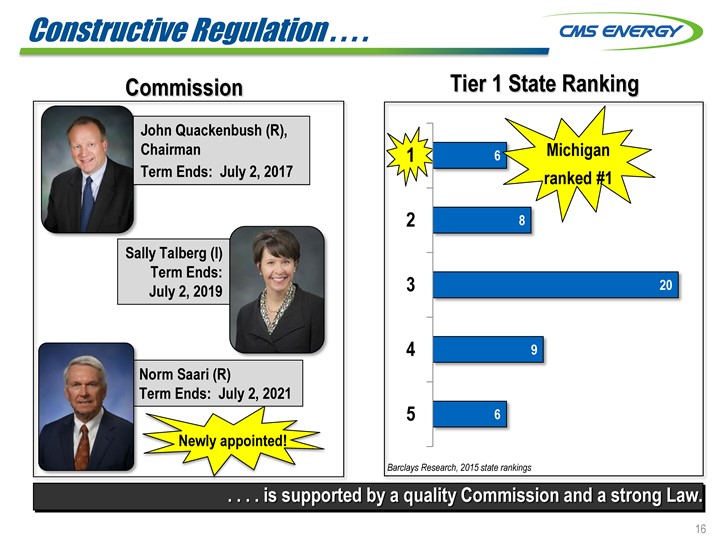
Constructive Regulation . . . .
Commission Tier 1 State Ranking
John Quackenbush (R), Chairman Term Ends: July 2, 2017
Sally Talberg (I) Term Ends: July 2, 2019
Norm Saari (R)
Term Ends: July 2, 2021
Newly appointed!
1 2 3 4 5 6 8 20 9 6 Michigal ranked #1
Barclays Research, 2015 state rankings
. . . . is supported by a quality Commission and a strong Law.
16
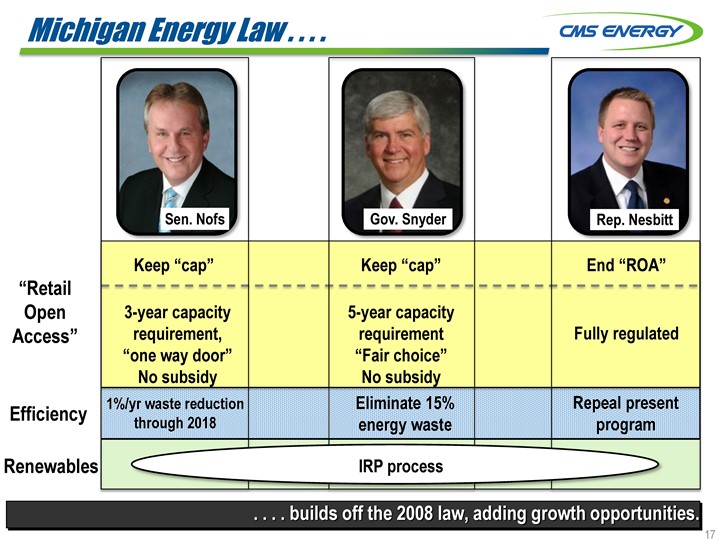
Michigan Energy Law . . . .
Sen. Nofs
Gov. Snyder
Rep. Nesbitt
“Retail
Open
Access”
Efficiency
Renewables
Keep “cap”
3-year capacity requirement “one way door” No subsidy
1%/yr waste reduction through 2018
Keep “cap”
5-year capacity requirement “Fair choice” No subsidy Eliminate 15% energy waste
End “ROA” Fully regu;ated
Repeal present program
IRP process
. . . . builds off the 2008 law, adding growth opportunities.
17
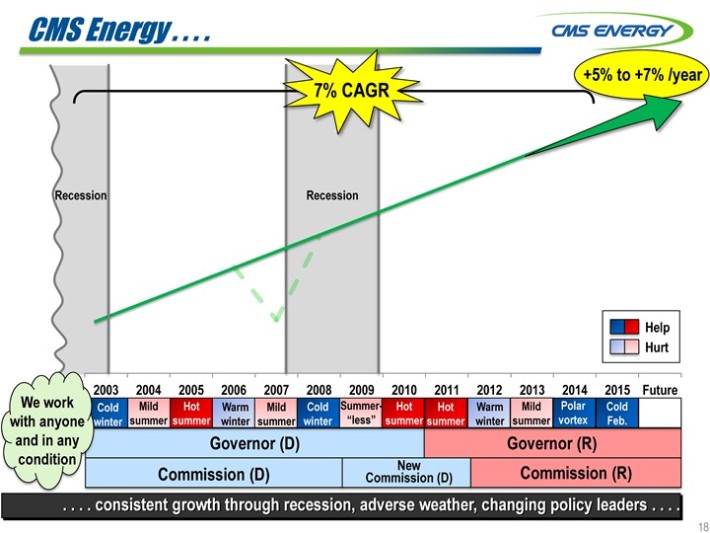
CMS Energy . . . .
7% CAGR
+5% to +7% /year
Recession
Recession
Help Hurt
We work with anyone and in any condition
2003 2004 2005 2006 2007 2008 2009 2010 2011 2012 2013 2014 2015 Future
Cold Mild Hot Warm Mild Cold Summer- Hot Hot Warm Mild Polar Cold
winter summer summer winter summer winter “less” summer summer winter summer vortex Feb.
Governor (D) Governor (R)
Commission (D) Commission New (D) Commission (R)
. . . . consistent growth through recession, adverse weather, changing policy leaders . . . .
18
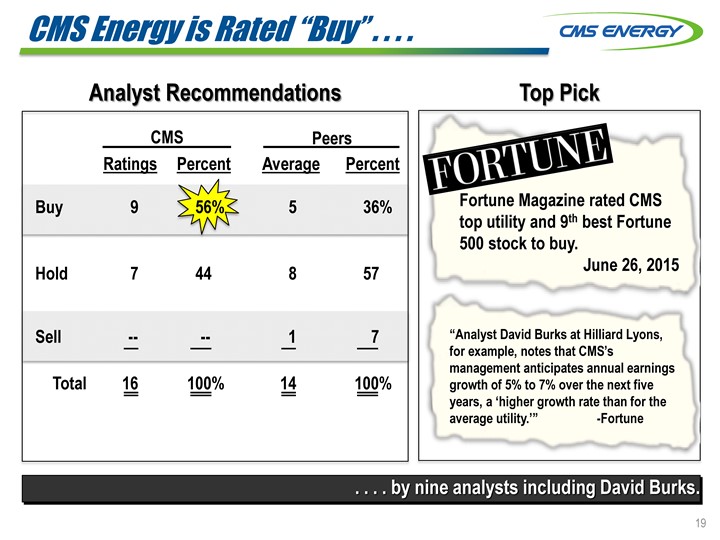
CMS Energy is Rated “Buy” . . . .
Analyst Recommendations
Top Pick
CMS Peers
Ratings Percent Average Percent
Buy 9 56% 5 36%
Hold 7 44 8 57
Sell — — 1 7
Total 16 100% 14 100%
Fortune Magazine rated CMS
top utility and 9th best Fortune
500 stock to buy.
June 26, 2015
“Analyst David Burks at Hilliard Lyons,
for example, notes that CMS’s
management anticipates annual earnings
growth of 5% to 7% over the next five
years, a ‘higher growth rate than for the
average utility.’”
-Fortune
. . . . by nine analysts including David Burks.
19
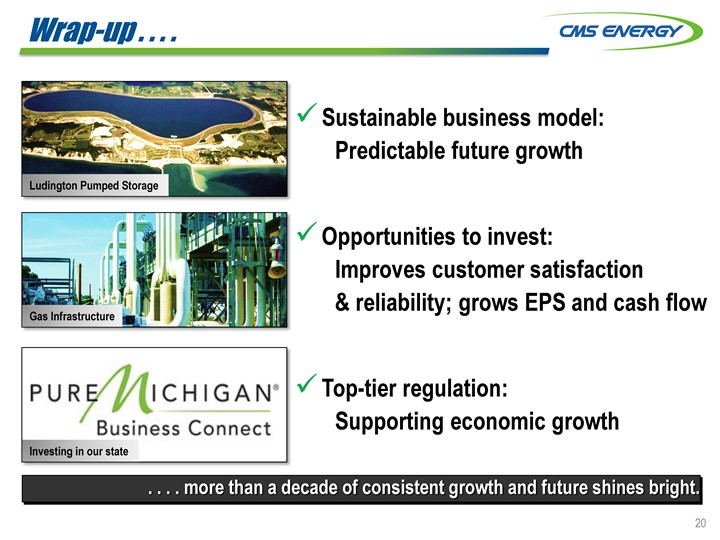
Wrap-up . . . .
Sustainable business model: Predictable future growth
Opportunities to invest:
Improves customer satisfaction & reliability; grows EPS and cash flow
Top-tier regulation:
Supporting economic growth
Ludington Pumped Storage Gas Infrastructure Investing in our state
. . . . more than a decade of consistent growth and future shines bright.
20
Appendix
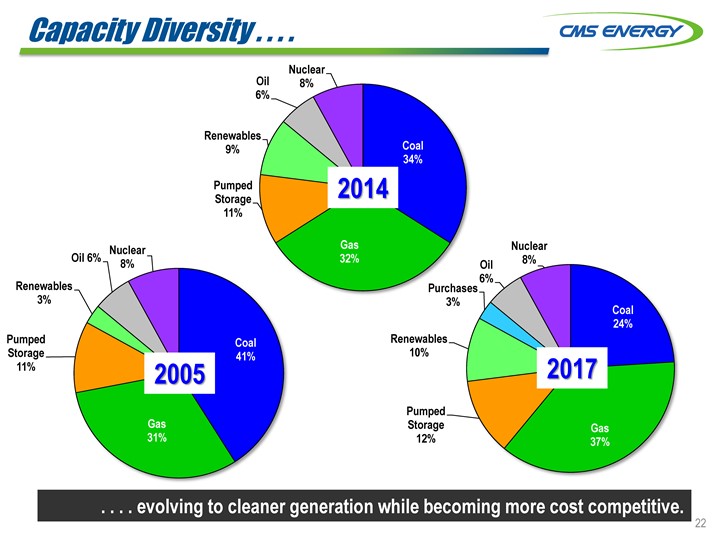
Capacity Diversity . . . .
Nuclear
Oil 8%
6%
Renewables
9% Coal
34%
Pumped Storage 2014
11%
Nuclear Gas Nuclear
Oil 6% 8% 32% Oil 8%
Renewables Purchases 6%
3% 3% Coal
24%
Pumped Coal Renewables
Storage 11% 41% 10% 2017
2005
Pumped
Gas Storage Gas
31% 12% 37%
. . . . evolving to cleaner generation while becoming more cost competitive.
22
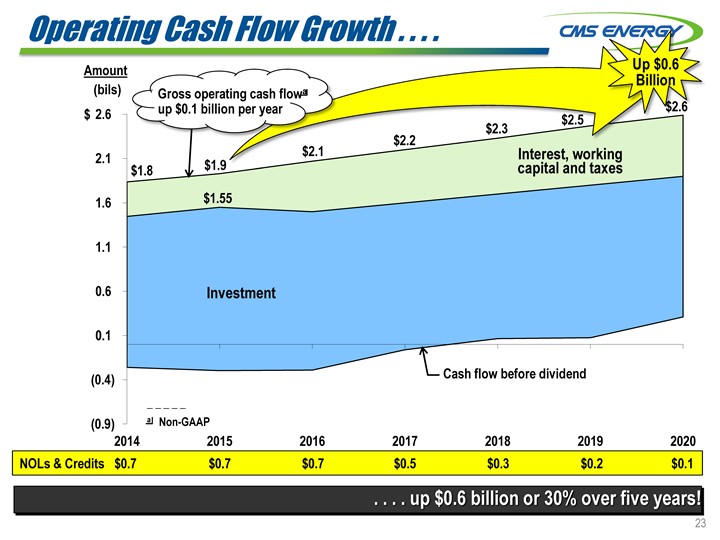
Operating Cash Flow Growth . . . .
Amount Up $0.6
Billion
(bils) Gross operating cash flowa
up $0.1 billion per year
$ 2.6 $2.5
2.1
$1.8 $1.9
1.6 $1.55
1.1
0.6 Investment
0.1
Cash flow before dividend
(0.4)
(0.9) a Non-GAAP
2014 2015 2016 2017 2018 2019 2020
$2.1
$2.1
$2.3
$2.6
Interest, working capital and taxes
NOLs & Credits $0.7 $0.7 $0.7 $0.5 $0.3 $0.2 $0.1
. . . . up $0.6 billion or 30% over five years!
23

GAAP Reconciliation
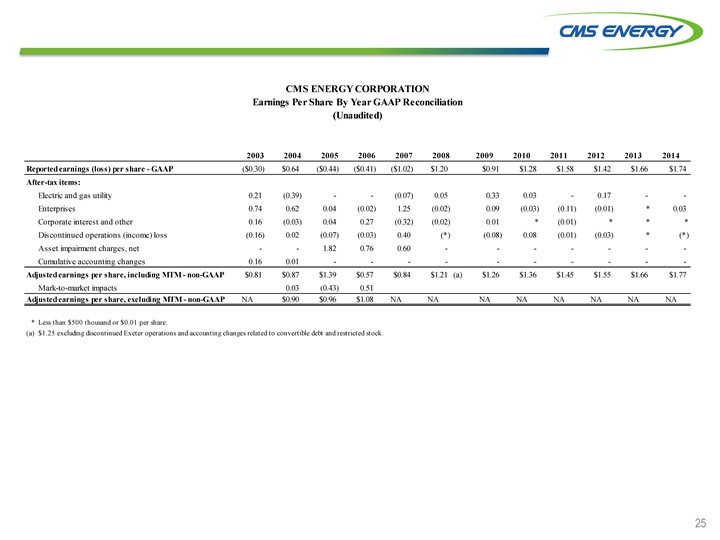
CMS ENERGY CORPORATION
Earnings Per Share By Year GAAP Reconciliation (Unaudited)
2003 2004 2005 2006 2007 2008 2009 2010 2011 2012 2013 2014
Reported earnings (loss) per share—GAAP ($0.30) $0.64 ($0.44) ($0.41) ($1.02) $1.20 $0.91 $1.28 $1.58 $1.42 $1.66 $1.74
After-tax items:
Electric and gas utility 0.21 (0.39) —— (0.07) 0.05 0.33 0.03 — 0.17 — -
Enterprises 0.74 0.62 0.04 (0.02) 1.25 (0.02) 0.09 (0.03) (0.11) (0.01) * 0.03
Corporate interest and other 0.16 (0.03) 0.04 0.27 (0.32) (0.02) 0.01 * (0.01) * * *
Discontinued operations (income) loss (0.16) 0.02 (0.07) (0.03) 0.40 (*) (0.08) 0.08 (0.01) (0.03) * (*)
Asset impairment charges, net —— 1.82 0.76 0.60 —————— -
Cumulative accounting changes 0.16 0.01 ————————— -
Adjusted earnings per share, including MTM—non-GAAP $0.81 $0.87 $1.39 $0.57 $0.84 $1.21 (a) $1.26 $1.36 $1.45 $1.55 $1.66 $1.77
Mark-to-market impacts 0.03 (0.43) 0.51
Adjusted earnings per share, excluding MTM—non-GAAP NA $0.90 $0.96 $1.08 NA NA NA NA NA NA NA NA
* Less than $500 thousand or $0.01 per share.
(a) $1.25 excluding discontinued Exeter operations and accounting changes related to convertible debt and restricted stock.
25
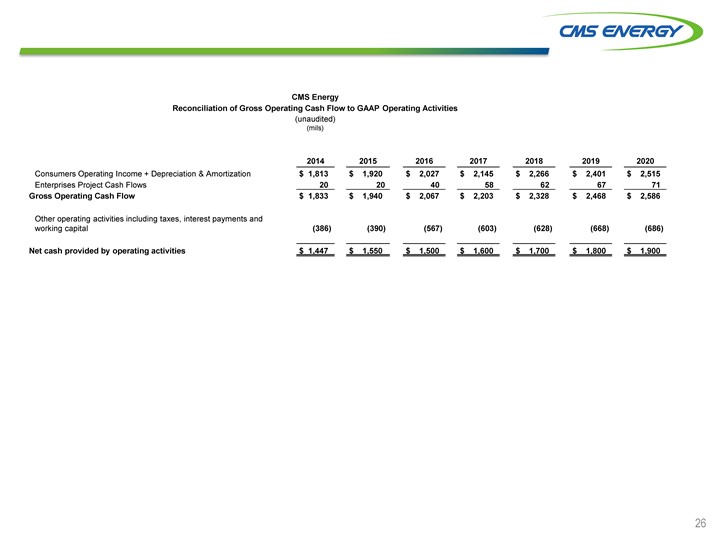
CMS Energy
Reconciliation of Gross Operating Cash Flow to GAAP Operating Activities
(unaudited)
(mils)
2014 2015 2016 2017 2018 2019 2020
Consumers Operating Income + Depreciation & Amortization $ 1,813 $ 1,920 $ 2,027 $ 2,145 $ 2,266 $ 2,401 $ 2,515
Enterprises Project Cash Flows 20 20 40 58 62 67 71
Gross Operating Cash Flow $ 1,833 $ 1,940 $ 2,067 $ 2,203 $ 2,328 $ 2,468 $ 2,586
Other operating activities including taxes, interest payments and
working capital (386) (390) (567) (603) (628) (668) (686)
Net cash provided by operating activities $ 1,447 $ 1,550 $ 1,500 $ 1,600 $ 1,700 $ 1,800 $ 1,900
26