Attached files
| file | filename |
|---|---|
| EX-99.1 - EXHIBIT 99.1 - Ally Financial Inc. | v416264_ex99-1.htm |
| EX-99.3 - EXHIBIT 99.3 - Ally Financial Inc. | v416264_ex99-3.htm |
| 8-K - FORM 8-K - Ally Financial Inc. | v416264_8k.htm |
Exhibit 99.2

Ally Financial Inc. 2 Q 2015 Earnings Review Contact Ally Investor Relations at (866) 710 - 4623 or investor.relations@ally.com July 28, 2015

2 2Q 2015 Preliminary Results Forward - Looking Statements and Additional Information The following should be read in conjunction with the financial statements, notes and other information contained in the Compa ny’ s Annual Reports on Form 10 - K, Quarterly Reports on Form 10 - Q, and Current Reports on Form 8 - K . This information is preliminary and based on company data available at the time of the presentation In the presentation that follows and related comments by Ally Financial Inc. (“Ally”) management, the use of the words “expec t,” “anticipate,” “estimate,” “forecast,” “initiative,” “objective,” “plan,” “goal,” “project,” “outlook,” “priorities,” “target,” “explore,” “ pos itions,” “intend,” “evaluate,” “pursue,” “seek,” “may,” “would, ” “could, ” “should, ” “believe, ” “potential, ” “continue,” or the negative of these words, or similar expressions is intended to identify forward - looking statements. All statements herein and in related management comments, other than statements of historical fact, including without limitation, statements about future events and financial performance, are forward - looking statements tha t involve certain risks and uncertainties. While these statements represent our current judgment on what the future may hold, and we believe th ese judgments are reasonable, these statements are not guarantees of any events or financial results, and Ally’s actual results may differ mate ria lly due to numerous important factors that are described in the most recent reports on SEC Forms 10 - K and 10 - Q for Ally, each of which may be revise d or supplemented in subsequent reports filed with the SEC. Such factors include, among others, the following: maintaining the mut ual ly beneficial relationship between Ally and General Motors, and Ally and Chrysler and our ability to further diversify our business; our ability to maintain relationships with automotive dealers; the significant regulation and restrictions that we are subject to as a bank holding company and financial holding company; the potential for deterioration in the residual value of off - lease vehicles; disruptions in the market in which we fund our operations, with resulting negative impact on our liquidity; changes in our accounting assumptions that may require or that r esu lt from changes in the accounting rules or their application, which could result in an impact on earnings; changes in our credit ratings; changes in economic conditions, currency exchange rates or political stability in the markets in which we operate; and changes in the existing or th e adoption of new laws, regulations, policies or other activities of governments, agencies and similar organizations (including as a result of the Dodd - Frank Act and Basel III). Investors are cautioned not to place undue reliance on forward - looking statements. Ally undertakes no obligation to update publi cly or otherwise revise any forward - looking statements, whether as a result of new information, future events or other such factors that affect t he subject of these statements, except where expressly required by law. Reconciliation of non - GAAP financial measures included within this presentat ion are provided in this presentation. Use of the term “loans” describes products associated with direct and indirect lending activities of Ally’s operations. The s pec ific products include retail installment sales contracts, lines of credit, leases or other financing products. The term “originate” refers to Ally’ s p urchase, acquisition or direct origination of various “loan” products.

3 2Q 2015 Preliminary Results Key Messages Building a better financial services company Diversifying our leading auto finance business Expanding franchise to drive long - term growth Improving shareholder returns

4 2Q 2015 Preliminary Results Delivering on Financial Targets • Well on pace to achieve high $30s billion of auto originations in 2015 – $ 20.6 billion in 1H15, up 3% vs. 1H14 – More diversified origination mix • Core ROTCE (1) target of 9 - 11% – Full financial impact of capital actions yet to be realized – Priority to address remaining Series G • Adjusted efficiency ratio (1) target of mid - 40% – Expense base normalizing even while reinvesting in the franchise • Maintain prudent credit discipline – Credit performance well in line with expectations – Provision build related to loan growth (1) Represents a non - GAAP financial measure. See slide 24 for details On track to achieve year - end targets

5 2Q 2015 Preliminary Results Second Quarter Highlights • Net income of $182 million including pre - tax charge of $155 million related to debt repurchases • Core pre - tax income ex. repositioning items (1) of $435 million and Adjusted EPS (2) of $0.46 – Core ROTCE (3) of 8.2% and Adjusted Efficiency Ratio (3) of 46% – Net Interest Margin (4) of 2.58%, up 11 bps QoQ • Auto originations of $10.8 billion • Retail deposit growth of $1.1 billion in 2Q, with balances up 13% YoY – Added almost 35,000 deposit customers in 2Q (1) Represents a non - GAAP financial measure. As presented excludes the impact of repositioning items, OID amortization expense, income tax expense and discontinued operations. See slides 23 and 24 for details (2) See slide 6 for details (3) Represents a non - GAAP financial measure. Core ROTCE adjusts for certain items such as net DTA and OID. See slide 24 for details (4) Excludes OID Driving improved shareholder returns and long - term growth 2Q 15 2Q 14 YoY Change Growth 3.4$ 2.2$ 58% Chrysler 2.5 1.9 37% GM Non Subvented 4.1 3.3 22% GM Subvented (Loan and Lease) 0.8 3.6 -78% Total 10.8$ 10.9$ -1% Consumer Auto Originations by Channel ($B) +36% YoY

6 2Q 2015 Preliminary Results ($ millions except per share data) 2Q 15 1Q 15 2Q 14 1Q 15 2Q 14 Net financing revenue (1) 927$ 860$ 912$ 67$ 15$ Total other revenue (1)(2) 368 440 372 (72) (5) Provision for loan losses 140 116 63 24 77 Controllable expenses (2) 448 469 458 (21) (10) Other noninterest expenses (2) 272 226 347 46 (75) Core pre-tax income, ex. repositioning (3) 435$ 490$ 417$ (55)$ 18$ Net income 182$ 576$ 323$ (394)$ (141)$ GAAP EPS (diluted) (2.22)$ 1.06$ 0.54$ (3.28)$ (2.76)$ Discontinued operations, net of tax (0.03) (0.82) (0.08) 0.80 0.06 OID expense, net of tax 0.02 0.02 0.07 0.00 (0.05) Capital actions (Series A and G) 2.47 - - 2.47 2.47 Repositioning / other (4) 0.21 0.26 (0.11) (0.05) 0.32 Adjusted EPS 0.46$ 0.52$ 0.42$ (0.05)$ 0.04$ Core ROTCE (5) 8.2% 9.1% 8.4% Adjusted Efficiency Ratio (5) 46% 48% 49% Effective Tax Rate 36.0% 36.3% 18.4% Increase/(Decrease) vs. Second Quarter Financial Results (1) Excludes OID. Total other revenue excludes accelerated OID expense of $7 million in 2Q15, 1Q15 and 2Q14 associated with debt redemptions (2) Excludes repositioning items. See slides 23 and 24 for details (3) As presented excludes the impact of repositioning items, OID amortization expense, income tax expense and discontinued operation s. See slides 23 and 24 for details (4) Repositioning items are primarily related to the extinguishment of high - cost legacy debt in 2Q15 and 1Q15. See slide 24 for additional details (5) Represents a non - GAAP financial measure. See slide 24 for details

7 2Q 2015 Preliminary Results Pre-Tax Income ($ millions) 2Q 15 1Q 15 2Q 14 Automotive Finance 401$ 70$ (60)$ Insurance 15 (63) 38 Dealer Financial Services 416$ 7$ (22)$ Mortgage (1) 9 (60) (18) Corporate and Other (1) 9 (2) 57 Core pre-tax income, ex. repositioning (2) 435$ (55)$ 18$ Increase/(Decrease) vs. Results by Segment (1) Results exclude the impact of repositioning items. Corporate and other also excludes OID amortization expense. See slide 23 fo r details (2) Core pre - tax income is a non - GAAP financial measure and as presented excludes the impact of repositioning items, OID amortizatio n expense, income tax expense and discontinued operations. See slides 23 and 24 for details • Auto Finance results driven by continued strong originations – Credit performance in line with expectations with provision increase due to strong loan growth – Retail loan growth and lower funding costs offset by lower net lease revenue and higher provision YoY – Higher asset balances, favorable net lease revenue and seasonally lower expenses driving QoQ improvement • Insurance results largely driven by seasonality in weather - related losses, with favorability YoY • Mortgage comparative results impacted by significant items that did not repeat (TDR asset sale in 1Q15 and reserve release in 2Q14) • Corporate and Other favorability YoY driven by improved funding costs

8 2Q 2015 Preliminary Results Net Interest Margin • Net Interest Margin (1) up 11 bps QoQ driven by lower cost of funds – Higher consumer asset yields partially offset by lease balance decline and continued competition in commercial auto – Cost of funds (1) down 32 bps YoY and 8 bps QoQ driven by continued reduction of legacy high - cost debt and deposit growth Note: Continuing operations only (1) Excludes OID Ally Financial - Net Interest Margin $138 $141 $143 4.61% 4.21% 4.25% 2.63% 2.47% 2.58% 2.09% 1.85% 1.77% 2Q 14 3Q 14 4Q 14 1Q 15 2Q 15 Average Earning Assets ($B) Earning Asset Yield NIM (ex. OID) Cost of Funds (ex. OID)

9 2Q 2015 Preliminary Results Interest Rate Sensitivity • Ally’s balance sheet primarily consists of short duration assets (~2 year weighted average life) funded primarily with deposits and securitizations • Ally’s interest rate sensitivity is dependent on the re - pricing assumptions of the deposit book in a rising rate environment – For modeling interest rate sensitivity, Ally uses assumptions on deposit pricing that result in ~80 % pass - through rate over time – Assuming a long - term deposit pricing pass - through rate of 50% would result in a neutral to asset sensitive position • Another material portion of interest rate exposure has historically been driven by rate floors on certain commercial auto loans – Ally has migrated a substantial portion of dealer floorplan loans from Prime to LIBOR indices – As of June 30th, approximately 80% of floorplan loans will re - price directly with short - term interest rates (1) Net financing revenue impacts reflect a rolling 12 - month view (2) Results in ~80% pass - through rate over time. See slide 24 for additional details $ million Ally Modeled Scenario (2) 50% Deposit Pass-Through Stable rate environment 39$ 5$ +100 bp Instantaneous (110)$ 1$ +100 bp Gradual (over 12 months) (32)$ 8$ Net Financing Revenue Impact (1) vs. Forward Curve

10 2Q 2015 Preliminary Results Ally Bank Deposit Levels ($ billions) $45.9 $46.7 $48.0 $50.6 $51.8 $9.7 $9.7 $9.9 $9.9 $9.9 $55.6 $56.4 $57.8 $60.5 $61.6 2Q 14 3Q 14 4Q 14 1Q 15 2Q 15 Ally Bank Retail Ally Bank Brokered Deposits • $1.1 billion of retail deposit growth in 2Q, with balances up 13% YoY • Grew customer base 16% YoY with over 989,000 primary customers • Continue to build strong franchise and brand – Enhanced iPhone® mobile app with Ally Assist SM voice interaction technology and predictive analysis to help customers manage their accounts – Received the 2015 TNS Choice Award for Direct Banking, recognizing superior performance in the competitive marketplace Stable, consistent growth of retail deposits Deposit Mix Retail deposit customer growth Ally Bank Quarterly Retail Customer Net Growth (thousands) 28.5 30.9 24.2 45.3 34.9 2Q 14 3Q 14 4Q 14 1Q 15 2Q 15 Ally Bank Deposit Composition and Average Retail Portfolio Interest Rate 17% 17% 17% 16% 16% 42% 41% 40% 38% 36% 40% 41% 43% 46% 48% 1.17% 1.16% 1.16% 1.17% 1.15% 2Q 14 3Q 14 4Q 14 1Q 15 2Q 15 Brokered Retail CD MMA/OSA/Checking Average Retail Portfolio Interest Rate

11 2Q 2015 Preliminary Results Capital • Capital ratios are normalizing towards targeted levels driven primarily by Series G / Series A actions and Risk Weighted Asset growth • Preliminary fully phased - in Basel III Common Equity Tier 1 (CET1) ratio of 9.3% – Preliminary Basel III CET1 ratio, reflective of transition provisions, is 9.8%, primarily driven by phase - in of DTA treatment • Adjusted Tangible Book Value up over $2 per share YoY – Flat QoQ as strong core financial results were impacted by liability management actions and OCI adjustments Tier 1 Common (2014 figures calculated under Basel I) and CET1 (2015 as shown fully phased - in Basel III) are non - GAAP financial measures. See page 16 of the Financial Supplement for details Capital Ratios and Risk - Weighted Assets Adjusted Tangible Book Value per Share Adjusted Tangible Book Value is a non - GAAP financial measure, which adjusts for certain items such as Series G discount and tax - effected OID . See page 21 of the Financial Supplement for details $21.5 $22.2 $22.7 $23.7 $23.7 2Q 14 3Q 14 4Q 14 1Q 15 2Q 15 $129 $128 $131 $131 $135 13.2% 13.5% 13.2% 14.0% 12.6% 12.3% 12.7% 12.5% 13.0% 11.7% 9.4% 9.7% 9.6% 10.4% 9.3% 2Q 14 3Q 14 4Q 14 1Q 15 2Q 15 Risk-Weighted Assets ($B) Total Capital Ratio Tier 1 Ratio Tier 1 Common/CET1

12 2Q 2015 Preliminary Results $121 $83 $137 $160 $132 $96 0.85% 0.58% 0.93% 1.10% 0.93% 0.65% 1Q 14 2Q 14 3Q 14 4Q 14 1Q 15 2Q 15 Net Charge-Offs ($M) Annualized NCO Rate 224% 344% 187% 144% 155% 244% 0.53% 0.34% 0.60% 0.68% 0.61% 0.39% 1Q 14 2Q 14 3Q 14 4Q 14 1Q 15 2Q 15 ALLL as % of Annualized NCOs Annualized NCO Rate $933 $977 $1,113 $1,171 $1,192 $ 974 ALLL Balance ($M) (30+ DPD) $904 $1,174 $1,338 $1,543 $1,076 $1,389 1.59% 2.02% 2.28% 2.73% 1.87% 2.29% 1Q 14 2Q 14 3Q 14 4Q 14 1Q 15 2Q 15 Delinquent Contracts ($M) Delinquency Rate Consolidated Net Charge - Offs Provision Expense Asset Quality U.S. Retail Auto Net Charge - Offs U.S. Retail Auto Delinquencies Note: Above loans are classified as held - for - investment and recorded at historical cost. See slide 24 for details Note: Includes accruing contracts only ($ millions) Provision Expense 2Q 14 3Q 14 4Q 14 1Q 15 2Q 15 Retail Auto 97$ 112$ 168$ 158$ 152$ Commercial Auto 2 (3) 7 (31) (20) Mortgage (25) (7) (14) (5) 3 CF/Other (11) - (6) (6) 5 Total 63$ 102$ 155$ 116$ 140$ Retail Auto Coverage Ratio 1.25% 1.18% 1.21% 1.24% 1.26% Retail Auto Loan Balance (EOP) 58,084$ 58,659$ 56,535$ 57,379$ 60,717$
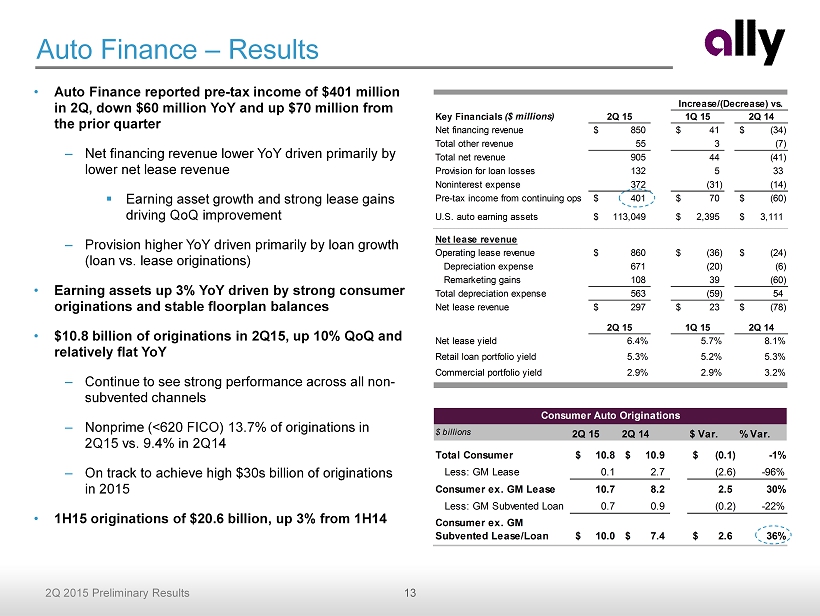
13 2Q 2015 Preliminary Results $ billions 2Q 15 2Q 14 $ Var. % Var. Total Consumer 10.8$ 10.9$ (0.1)$ -1% Less: GM Lease 0.1 2.7 (2.6) -96% Consumer ex. GM Lease 10.7 8.2 2.5 30% Less: GM Subvented Loan 0.7 0.9 (0.2) -22% Consumer ex. GM Subvented Lease/Loan 10.0$ 7.4$ 2.6$ 36% Consumer Auto Originations Key Financials ($ millions) 2Q 15 1Q 15 2Q 14 Net financing revenue 850$ 41$ (34)$ Total other revenue 55 3 (7) Total net revenue 905 44 (41) Provision for loan losses 132 5 33 Noninterest expense 372 (31) (14) Pre-tax income from continuing ops 401$ 70$ (60)$ U.S. auto earning assets 113,049$ 2,395$ 3,111$ Net lease revenue Operating lease revenue 860$ (36)$ (24)$ Depreciation expense 671 (20) (6) Remarketing gains 108 39 (60) Total depreciation expense 563 (59) 54 Net lease revenue 297$ 23$ (78)$ 2Q 15 1Q 15 2Q 14 Net lease yield 6.4% 5.7% 8.1% Retail loan portfolio yield 5.3% 5.2% 5.3% Commercial portfolio yield 2.9% 2.9% 3.2% Increase/(Decrease) vs. • Auto Finance reported pre - tax income of $401 million in 2Q, down $60 million YoY and up $70 million from the prior quarter – Net financing revenue lower YoY driven primarily by lower net lease revenue ▪ Earning asset growth and strong lease gains driving QoQ improvement – Provision higher YoY driven primarily by loan growth (loan vs. lease originations) • Earning assets up 3 % YoY driven by strong consumer originations and stable floorplan balances • $10.8 billion of originations in 2Q15, up 10% QoQ and relatively flat YoY – Continue to see strong performance across all non - subvented channels – Nonprime (<620 FICO) 13.7% of originations in 2Q15 vs. 9.4% in 2Q14 – On track to achieve high $ 30s billion of originations in 2015 • 1H15 originations of $20.6 billion, up 3% from 1H14 Auto Finance – Results

14 2Q 2015 Preliminary Results ($ billions) $32.6 $32.9 $31.4 $33.2 $32.4 $32.5 1Q 14 2Q 14 3Q 14 4Q 14 1Q 15 2Q 15 (EOP $ billions) $77.8 $79.2 $81.3 $81.3 $82.1 $83.7 1Q 14 2Q 14 3Q 14 4Q 14 1Q 15 2Q 15 On Balance Sheet Sold ($ billions; % of $ originations) 66% 63% 63% 60% 52% 45% 15% 17% 16% 18% 20% 24% 19% 20% 20% 22% 28% 32% $9.2 $10.9 $11.8 $9.0 $9.8 $10.8 1Q 14 2Q 14 3Q 14 4Q 14 1Q 15 2Q 15 GM Chrysler Growth Auto Finance – Key Metrics See slide 24 for definitions Consumer Serviced Assets Commercial Assets Consumer Originations Origination Mix Note: Asset balances reflect the average daily balance for the quarter (% of $ originations) 8% 5% 6% 27% 31% 36% 8% 10% 12% 29% 17% 9% 28% 36% 37% 1Q 14 2Q 14 3Q 14 4Q 14 1Q 15 2Q 15 New Subvented New Standard New Growth Lease Used

15 2Q 2015 Preliminary Results Dealer Products & Services Written Premiums ($ millions) $276 $267 $225 $244 $267 $265 $248 $239 $263 2Q 13 3Q 13 4Q 13 1Q 14 2Q 14 3Q 14 4Q 14 1Q 15 2Q 15 Key Financials ($ millions) 2Q 15 1Q 15 2Q 14 Premiums, service revenue earned and other 241$ 4$ (11)$ Losses and loss adjustment expenses 122 66 (66) Acquisition and underwriting expenses 145 (1) 4 Total underwriting income (26) (61) 51 Investment income and other 41 (2) (13) Pre-tax income from continuing ops 15$ (63)$ 38$ Total assets 7,260$ 18$ 28$ Key Statistics 2Q 15 1Q 15 2Q 14 Insurance ratios Loss ratio 51% 24% 75% Underwriting expense ratio 61% 62% 56% Combined ratio 112% 86% 131% Increase/(Decrease) vs. Insurance • Pre - tax income of $15 million, up $38 million YoY and down $63 million from the prior quarter – Comparative results primarily driven by weather - related losses ▪ YoY losses down and more typical of historical results, but up seasonally QoQ • Written premiums of $263 million in 2Q – Relatively flat YoY and up $24 million QoQ driven primarily by higher retail volume Note: Excludes Canadian Personal Lines business, which is in runoff Note: Excludes the benefit of weather - related loss reinsurance and Canadian Personal Lines losses Insurance Losses ($ millions) $49 $51 $47 $42 $40 $42 $7 $124 $36 $5 $4 $67 $69 $190 $97 $60 $56 $123 1Q 14 2Q 14 3Q 14 4Q 14 1Q 15 2Q 15 VSC Losses Weather Losses Other Losses

16 2Q 2015 Preliminary Results Key Financials ($ millions) 2Q 15 1Q 15 2Q 14 Net financing revenue 15$ -$ 3$ Total other revenue 7 (61) (2) Total net revenue 22 (61) 1 Provision for loan losses 3 8 28 Noninterest expense 10 (9) (9) Pre-tax income from continuing ops (1) 9$ (60)$ (18)$ Total assets 9,249$ 1,555$ 1,609$ Ally Bank HFI Portfolio 2Q 15 1Q 15 2Q 14 Net Carry Value ($ billions) 9.1$ 7.5$ 7.5$ Ongoing (post 1/1/2009) 61% 51% 39% Legacy (pre 1/1/2009) 39% 49% 61% % Interest Only 9.1% 11.1% 13.5% % 30+ Delinquent 2.2% 2.8% 2.7% Net Charge-off Rate 0.2% 1.0% 0.3% Wtd. Avg. LTV/CLTV (2) 67.7% 68.6% 76.6% Refreshed FICO 751 748 726 Increase/(Decrease) vs. Key Financials ($ millions) 2Q 15 1Q 15 2Q 14 Net financing revenue (ex. OID) 48$ 24$ 48$ Total other revenue (ex. OID) 37 (15) 26 Provision for loan losses 5 11 16 Noninterest expense 71 0 1 Core pre-tax income (1) 9$ (2)$ 57$ OID amortization expense (2) 18 1 (36) Pre-tax loss from continuing ops (1) (9)$ (3)$ 93$ Total assets 26,356$ (1,083)$ 2,625$ Increase/(Decrease) vs. Mortgage and Corporate and Other (1) Excludes repositioning items in 2Q15. See slide 23 for details (2) Updated home values derived using a combination of appraisals, BPOs, AVMs and MSA level house price indices Mortgage Results (1) Excludes repositioning items in prior periods. See slide 23 for details (2) Primarily bond exchange OID amortization expense used for calculating core pre - tax income Corporate and Other Results

17 2Q 2015 Preliminary Results Conclusion • Successfully diversifying auto business with attractive loan growth • Credit continues to perform in line with expectations • Deposit growth outpacing expectations • Expect to achieve year - end financial targets • Focused on continued franchise expansion – “ One Ally” – Exploring additional product offerings to position for long - term growth – Category leading auto finance franchise will continue to be primary focus Driving improved shareholder returns and long - term growth
Supplemental Charts
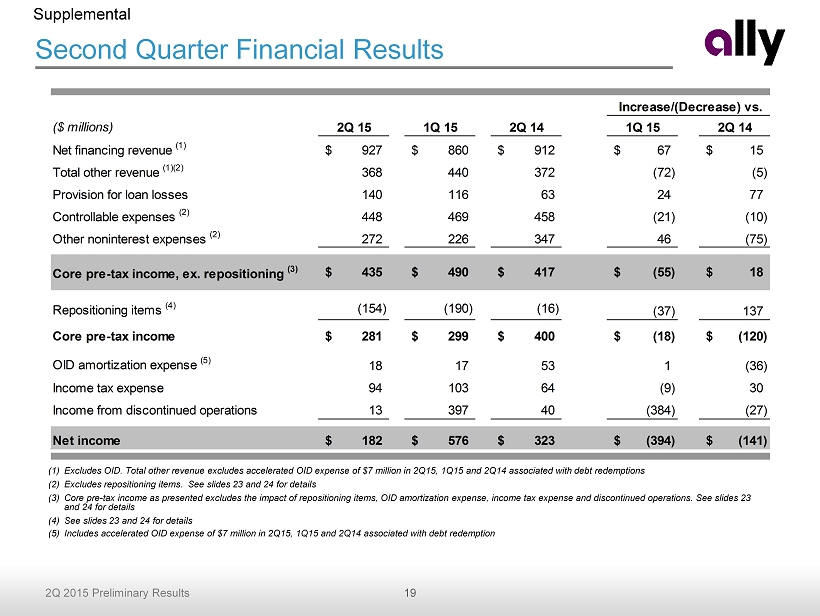
19 2Q 2015 Preliminary Results Second Quarter Financial Results (1) Excludes OID. Total other revenue excludes accelerated OID expense of $7 million in 2Q15, 1Q15 and 2Q14 associated with debt redemptions (2) Excludes repositioning items. See slides 23 and 24 for details (3) Core pre - tax income as presented excludes the impact of repositioning items, OID amortization expense, income tax expense and di scontinued operations. See slides 23 and 24 for details (4) See slides 23 and 24 for details (5) Includes accelerated OID expense of $7 million in 2Q15, 1Q15 and 2Q14 associated with debt redemption Supplemental ($ millions) 2Q 15 1Q 15 2Q 14 1Q 15 2Q 14 Net financing revenue (1) 927$ 860$ 912$ 67$ 15$ Total other revenue (1)(2) 368 440 372 (72) (5) Provision for loan losses 140 116 63 24 77 Controllable expenses (2) 448 469 458 (21) (10) Other noninterest expenses (2) 272 226 347 46 (75) Core pre-tax income, ex. repositioning (3) 435$ 490$ 417$ (55)$ 18$ Repositioning items (4) (154) (190) (16) (37) 137 Core pre-tax income 281$ 299$ 400$ (18)$ (120)$ OID amortization expense (5) 18 17 53 1 (36) Income tax expense 94 103 64 (9) 30 Income from discontinued operations 13 397 40 (384) (27) Net income 182$ 576$ 323$ (394)$ (141)$ Increase/(Decrease) vs.

20 2Q 2015 Preliminary Results 2Q 2015 ($ millions) Average Outstanding Balance (1) Quarterly Interest Expense Annualized Cost of Funds LT Unsecured Debt 22,701$ 282$ 4.98% Secured Debt 42,230 121 1.15% Other Borrowings (2) 9,011 16 0.71% Deposits 61,323 177 1.16% Total / Weighted Average 135,265$ 596$ 1.77% ($ billions) $2.0 $2.7 $0.0 $0.0 $1.9 $4.4 $2.9 $1.6 1Q 15 2Q 15 3Q 15 4Q 15 2016 2017 2018 2019 Matured Remaining • Diversified funding strategy with opportunities to lower cost of funds – 68% of total assets reside at Ally Bank – Deposits represent 45% of Ally’s funding • Efficient capital markets funding in 2Q – $2.0 billion of term securitizations – $1.4 billion of unsecured issuance Funding As of 6/30/15. Total maturities for 2020 and beyond equal $9.7 billion and do not exceed $3.0 billion in any given year. Current period does not include early debt redemptions. Total Asset Breakdown Unsecured Long - Term Debt Maturities Supplemental Liability and Cost of Funds Detail (1) Excludes OID (2) Includes Demand Notes, FHLB, and Repurchase Agreements ($ billions) 68% 68% 69% 68% 68% $149.9 $149.2 $151.8 $153.5 $156.5 2Q 14 3Q 14 4Q 14 1Q 15 2Q 15 Ally Bank Assets Non-Bank Assets

21 2Q 2015 Preliminary Results Capital and Liability Management • Significant progress in bringing down high - cost unsecured debt and preferred securities (1) Includes unsecured debt with coupons of 5.5% or greater (2) Approved capital plan includes the redemption of $500 million of TruPS in the first quarter of 2016 (3) Reflects carry values (face value less OID and fair market adjustments) Supplemental Remaining High-Cost Debt (1) Maturity Date Coupon 9/30/14 Face Value Matured Repurchased 6/30/15 Face Value Associated OID Dec-14 6.75% 765$ (765)$ -$ -$ -$ Dec-14 6.75% 556 (556) - - - Feb-15 8.30% 2,000 (2,000) - - - Apr-15 7.50% 1,263 (1,263) - - - Feb-17 5.50% 1,500 - - 1,500 (1) Dec-17 6.25% 1,000 - - 1,000 (6) Dec-18 8.00% 483 - - 483 (171) Mar-20 8.00% 1,900 - (917) 983 (8) Sep-20 7.50% 1,750 - (1,274) 476 (3) Nov-31 8.00% 1,995 - - 1,995 (1,029) Nov-31 8.00% 933 - (420) 512 (5) TruPS (callable in Feb. 2016) (2) 8.13% 2,747 - - 2,747 (121) Total High-Cost Debt 16,891$ (4,584)$ (2,611)$ 9,696$ (1,342)$ Total Long-Term Unsecured Debt (3) 24,051$ 19,567$ Remaining Preferred Stock Security Dividend 9/30/14 Liquidation Amount Redeemed Repurchased 6/30/15 Liquidation Amount Series G 7.00% 2,577$ 1,288$ -$ 1,288$ Series A 8.50% 1,022 - 325 697 Total 3,599$ 1,288$ 325$ 1,985$

22 2Q 2015 Preliminary Results Deferred Tax Asset 1Q 15 (1) ($ millions) Gross DTA/(DTL) Balance Valuation Allowance Net DTA/(DTL) Balance Net DTA/(DTL) Balance Net Operating Loss (Federal) 873$ -$ 873$ 913$ Capital Loss (Federal) - - - 6 Tax Credit Carryforwards 1,922 (478) 1,444 1,442 State/Local Tax Carryforwards 211 (110) 101 98 Other Deferred Tax Assets/(Liabilities) (2) (786) (1) (787) (825) Net Deferred Tax Assets 2,220$ (589)$ 1,631$ 1,634$ 2Q 15 (1) Deferred Tax Asset Supplemental (1) U.S. GAAP does not prescribe a method for calculating individual elements of deferred taxes for interim periods; therefore , these balances are estimated (2) Primarily book / tax timing differences

23 2Q 2015 Preliminary Results Notes on non - GAAP and other financial measures Supplemental (1) Represents core pre - tax income excluding repositioning items. See slide 24 for definitions $ millions GAAP OID & Repositioning Items Non-GAAP (1) GAAP OID & Repositioning Items Non-GAAP (1) GAAP OID & Repositioning Items Non-GAAP (1) Consolidated Ally Net financing revenue 916$ 11$ 927$ 850$ 10$ 860$ 866$ 46$ 912$ Total other revenue 211 157 368 243 197 440 365 7 372 Provision for loan losses 140 - 140 116 - 116 63 - 63 Controllable expenses 452 (4) 448 469 - 469 455 3 458 Other noninterest expenses 272 - 272 226 - 226 366 (19) 347 Pre-tax income from continuing ops 263$ 172$ 435$ 282$ 208$ 490$ 347$ 70$ 417$ Mortgage Operations Net financing revenue 15$ -$ 15$ 15$ -$ 15$ 12$ -$ 12$ Gain on sale of mortgage loans, net 4 - 4 66 - 66 6 - 6 Other revenue (excluding gain on sale) 2 1 3 2 - 2 3 - 3 Total net revenue 21 1 22 83 - 83 21 - 21 Provision for loan losses 3 - 3 (5) - (5) (25) - (25) Noninterest expense 10 - 10 19 - 19 19 - 19 Pre-tax income from continuing ops 8$ 1$ 9$ 69$ -$ 69$ 27$ -$ 27$ Corporate / Other (incl. CF) Net financing (loss) 37$ 11$ 48$ 14$ 10$ 24$ (46)$ 46$ 0$ Total other revenue (loss) (118) 155 37 (145) 197 52 4 7 11 Provision for loan losses 5 - 5 (6) - (6) (11) - (11) Noninterest expense 75 (4) 71 71 - 71 87 (16) 71 Pre-tax income (loss) from continuing ops (161)$ 170$ 9$ (196)$ 208$ 12$ (118)$ 70$ (48)$ 2Q 15 1Q 15 2Q 14

24 2Q 2015 Preliminary Results Notes on non - GAAP and other financial measures Supplemental 1) Core pre - tax income (loss) is a non - GAAP financial measure. It is defined as income (loss) from continuing operations before income tax expense and primarily bond exchange original issue discount ("OID") amortization expense . 2) Repositioning items for 2Q15 and 1Q15 are primarily related to the extinguishment of high - cost legacy debt. Repositioning items for 2Q14 are primarily related to Ally’s Initial Public Offering and a one - time tax benefit item 3) Core ROTCE is equal to Operating Net Income Available to Common divided by Normalized Common Equity. See page 22 in the Financial Supplement for full calculation . A. Operating Net Income Available to Common is calculated as (a) Pre - Tax Income from Continuing Operations minus (b) Income Tax Expense using a normalized 34% rate plus (c) expense associated with original issue bond discount amortization minus (d) preferred dividends associated with our Series A and Series G preferred stock plus (e) impact of any disclosed repositioning items . B. Normalized Common Equity is calculated as the two period average of (a) shareholder equity minus (b) the book value of preferred stock outstanding minus (c) goodwill and other intangibles minus (d) remaining original issue bond discount minus (e) remaining net deferred tax asset. 4) Adjusted Efficiency ratio is equal to (A) total noninterest expense less ( i ) Insurance operating segment related expenses, (ii) mortgage repurchase expense and (iii) expense related to repositioning items divided by ( B) total net revenue less ( i ) Insurance operating segment related revenue, (ii) OID amortization expense and (iii) any revenue related to repositioning items . See page 22 in the Financial Supplement for full calculation. 5) Corporate and Other primarily consists of Ally’s centralized treasury activities, the residual impacts of the company’s corporate funds transfer pri cing and asset liability management activities, and the amortization of the discount associated with debt issuances and bond exchanges . C orporate and Other also includes the Ally Corporate Finance business, certain equity investments and reclassifications, eliminations between the repo rta ble operating segments, and overhead previously allocated to operations that have since been sold or discontinued. 6) Controllable expenses include employee related costs, consulting and legal fees, marketing, information technology, facility, portfolio servicing a nd restructuring expenses. 7) U.S. consumer auto originations ▪ New Subvented – subvented rate new vehicle loans from GM and Chrysler dealers ▪ New Standard – standard rate new vehicle loans from GM and Chrysler dealers ▪ Lease – new vehicle lease originations from all dealers ▪ Used – used vehicle loans from all dealers ▪ Growth – total originations from non - GM/Chrysler dealers (New Growth refers to new vehicle loan originations only) 8) Net charge - off ratios are calculated as annualized net charge - offs divided by average outstanding finance receivables and loans excluding loans measur ed at fair value and loans held - for - sale . 9) Interest rate risk modeling – Ally’s interest rate risk models use dynamic assumptions driven by a number of factors, including the overall level of interest rates and the spread between short - term and long - term interest rates to project changes in Ally’s retail deposit offered rates. Ally’s interest rate risk metrics currently assume a long - term retail deposit beta of greater than 80%. We believe our deposits may ultimately be less sensitive to interest rate changes which will reduce our overall exposure to rising rates. Assuming a long - term retail deposit beta of 50% ( vs. current assumption of greater than 80%) would result in a consolidated interest rate risk position that is neutral to asset sensitive