Attached files
| file | filename |
|---|---|
| EX-99.1 - EXHIBIT 99.1 PDF - UDR, Inc. | a2q15pressrelease.pdf |
| EX-99.2 - EXHIBIT 99.2 PDF - UDR, Inc. | a2q15supplement.pdf |
| EX-99.1 - EXHIBIT 99.1 - UDR, Inc. | exhibit991-06302015.htm |
| 8-K - 8-K PRESS RELEASE - UDR, Inc. | form8-kx06302015.htm |
Exhibit 99.2
Financial Highlights | |||||||||||||
UDR, Inc. | |||||||||||||
As of End of Second Quarter 2015 (1) | |||||||||||||
(Unaudited) | |||||||||||||
Actual Results | Actual Results | Guidance as of June 30, 2015 | |||||||||||
Dollars in thousands, except per share | 2Q 2015 | YTD 2015 | 3Q 2015 | Full-Year 2015 | |||||||||
Per Share Metrics | |||||||||||||
FFO per common share and unit, diluted | $0.41 | $0.84 | $0.39 to $0.41 | $1.64 to $1.68 | |||||||||
FFO as Adjusted per common share and unit, diluted | $0.42 | $0.82 | $0.39 to $0.41 | $1.63 to $1.67 | |||||||||
Adjusted Funds from Operations ("AFFO") per common share and unit, diluted | $0.38 | $0.76 | $0.34 to $0.36 | $1.46 to $1.50 | |||||||||
Dividend declared per share and unit | $0.2775 | $0.5550 | $0.2775 | $1.11 (2) | |||||||||
Same-Store Operating Metrics | |||||||||||||
Revenue growth | 5.4% | 5.2% | -- | 5.00% to 5.50% | |||||||||
Expense growth | 1.8% | 2.1% | -- | 2.50% to 3.00% | |||||||||
NOI growth | 6.8% | 6.6% | -- | 5.75% to 6.75% | |||||||||
Physical Occupancy | 96.9% | 96.8% | -- | 96.5% | |||||||||
Property Metrics | Homes | Communities | % of Total NOI | ||||||||||
Same-Store | 35,250 | 125 | 74.8% | ||||||||||
Stabilized, Non-Mature | 2,952 | 7 | 10.1% | ||||||||||
Redevelopment | 328 | 1 | 1.5% | ||||||||||
Development, completed | 874 | 3 | 0.7% | ||||||||||
Non-Residential / Other | N/A | N/A | 2.3% | ||||||||||
Joint Venture (includes completed JV developments) (3) | 6,696 | 28 | 10.6% | ||||||||||
Sub-total, completed homes | 46,100 | 164 | 100% | ||||||||||
Under Development | 516 | 1 | - | ||||||||||
Joint Venture Development | 1,173 | 4 | - | ||||||||||
Preferred Equity Investments | 1,533 | 5 | - | ||||||||||
Total expected homes (3)(4) | 49,322 | 174 | 100% | ||||||||||
Balance Sheet Metrics (adjusted for non-recurring items) | Market Capitalization | ||||||||||||
2Q 2015 | 2Q 2014 | 2Q 2015 | % of Total | ||||||||||
Interest Coverage Ratio | 4.32x | 3.65x | Total debt | $ | 3,564,403 | 29.0% | |||||||
Fixed Charge Coverage Ratio | 4.21x | 3.56x | Common stock equivalents (5) | 8,708,705 | 71.0% | ||||||||
Leverage Ratio | 37.5% | 40.5% | Total market capitalization | $ | 12,273,108 | 100.0% | |||||||
Net Debt-to-EBITDA | 6.2x | 6.9x | |||||||||||
(1) See Attachment 16 for definitions and other terms. | ||||||||||||
(2) Annualized for 2015. | ||||||||||||
(3) Joint venture NOI is based on UDR's pro rata share. Homes and communities at 100%. | ||||||||||||
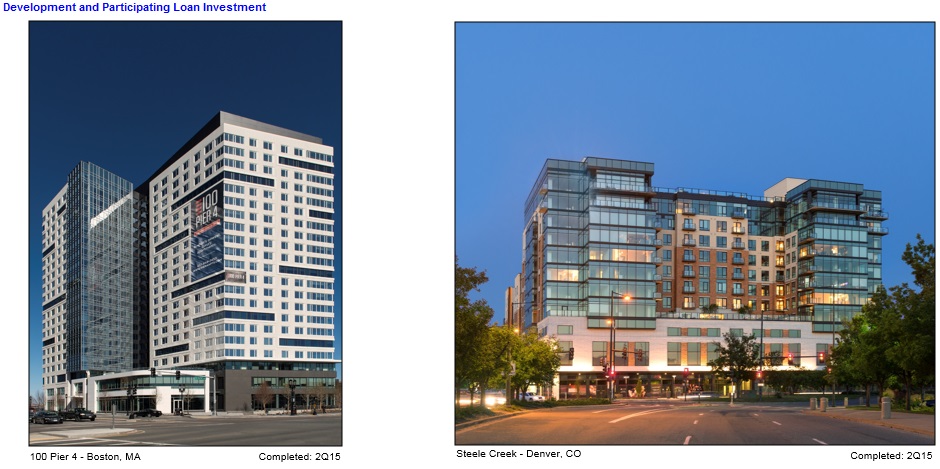
(4) Excludes 218 homes at Steele Creek where we have a participating loan investment as described in Attachment 9(B). | ||||||||||||
(5) Based on a common share price of $32.03 at June 30, 2015. | ||||||||||||
1
 | |||||||||||||||||
Attachment 1 | |||||||||||||||||
UDR, Inc. | |||||||||||||||||
Consolidated Statements of Operations (1) | |||||||||||||||||
(Unaudited) | |||||||||||||||||
Three Months Ended | Six Months Ended | ||||||||||||||||
June 30, | June 30, | ||||||||||||||||
In thousands, except per share amounts | 2015 | 2014 | 2015 | 2014 | |||||||||||||
REVENUES: | |||||||||||||||||
Rental income | $ | 212,764 | $ | 200,959 | $ | 419,811 | $ | 395,311 | |||||||||
Joint venture management and other fees (2) | 3,098 | 2,747 | 15,804 | 6,434 | |||||||||||||
Total revenues | 215,862 | 203,706 | 435,615 | 401,745 | |||||||||||||
OPERATING EXPENSES: | |||||||||||||||||
Property operating and maintenance | 37,194 | 36,840 | 74,444 | 73,560 | |||||||||||||
Real estate taxes and insurance | 25,138 | 23,716 | 51,360 | 49,147 | |||||||||||||
Property management | 5,851 | 5,527 | 11,545 | 10,872 | |||||||||||||
Other operating expenses | 1,769 | 2,162 | 3,535 | 4,088 | |||||||||||||
Real estate depreciation and amortization | 90,344 | 88,876 | 179,121 | 177,409 | |||||||||||||
Acquisition costs | 84 | — | 283 | 102 | |||||||||||||
General and administrative | 13,637 | 12,530 | 25,590 | 24,422 | |||||||||||||
Casualty-related (recoveries)/charges, net | 843 | — | 1,839 | 500 | |||||||||||||
Other depreciation and amortization | 1,700 | 1,193 | 3,323 | 2,273 | |||||||||||||
Total operating expenses | 176,560 | 170,844 | 351,040 | 342,373 | |||||||||||||
Operating income | 39,302 | 32,862 | 84,575 | 59,372 | |||||||||||||
Income/(loss) from unconsolidated entities (2) (3) | (573 | ) | (428 | ) | 58,586 | (3,993 | ) | ||||||||||
Interest expense | (29,673 | ) | (31,499 | ) | (58,473 | ) | (64,383 | ) | |||||||||
Other debt (charges)/benefits, net | — | (192 | ) | — | (192 | ) | |||||||||||
Total interest expense | (29,673 | ) | (31,691 | ) | (58,473 | ) | (64,575 | ) | |||||||||
Interest income and other income/(expense), net | 382 | 1,426 | 742 | 2,841 | |||||||||||||
Income/(loss) before income taxes, discontinued operations and gain/(loss) on sale of real estate | 9,438 | 2,169 | 85,430 | (6,355 | ) | ||||||||||||
Tax benefit/(provision), net | 1,404 | 2,190 | 1,829 | 5,519 | |||||||||||||
Income/(loss) from continuing operations | 10,842 | 4,359 | 87,259 | (836 | ) | ||||||||||||
Income/(loss) from discontinued operations, net of tax | — | 18 | — | (69 | ) | ||||||||||||
Income/(loss) before gain/(loss) on sale of real estate owned | 10,842 | 4,377 | 87,259 | (905 | ) | ||||||||||||
Gain/(loss) on sale of real estate owned, net of tax | 79,042 | 26,709 | 79,042 | 51,003 | |||||||||||||
Net income/(loss) | 89,884 | 31,086 | 166,301 | 50,098 | |||||||||||||
Net (income)/loss attributable to redeemable noncontrolling interests in the OP | (3,029 | ) | (1,077 | ) | (5,617 | ) | (1,724 | ) | |||||||||
Net (income)/loss attributable to noncontrolling interests | — | (2 | ) | (7 | ) | (6 | ) | ||||||||||
Net income/(loss) attributable to UDR, Inc. | 86,855 | 30,007 | 160,677 | 48,368 | |||||||||||||
Distributions to preferred stockholders - Series E (Convertible) | (931 | ) | (931 | ) | (1,862 | ) | (1,862 | ) | |||||||||
Net income/(loss) attributable to common stockholders | $ | 85,924 | $ | 29,076 | $ | 158,815 | $ | 46,506 | |||||||||
Income/(loss) per weighted average common share - basic: | |||||||||||||||||
Income/(loss) from continuing operations attributable to common stockholders | $ | 0.33 | $ | 0.12 | $ | 0.62 | $ | 0.19 | |||||||||
Income/(loss) from discontinued operations attributable to common stockholders | $ | 0.00 | $ | 0.00 | $ | 0.00 | $ | 0.00 | |||||||||
Net income/(loss) attributable to common stockholders | $ | 0.33 | $ | 0.12 | $ | 0.62 | $ | 0.19 | |||||||||
Income/(loss) per weighted average common share - diluted: | |||||||||||||||||
Income/(loss) from continuing operations attributable to common stockholders | $ | 0.33 | $ | 0.12 | $ | 0.61 | $ | 0.18 | |||||||||
Income/(loss) from discontinued operations attributable to common stockholders | $ | 0.00 | $ | 0.00 | $ | 0.00 | $ | 0.00 | |||||||||
Net income/(loss) attributable to common stockholders | $ | 0.33 | $ | 0.12 | $ | 0.61 | $ | 0.18 | |||||||||
Common distributions declared per share | $ | 0.2775 | $ | 0.2600 | $ | 0.5550 | $ | 0.5200 | |||||||||
Weighted average number of common shares outstanding - basic | 257,849 | 250,255 | 257,344 | 250,216 | |||||||||||||
Weighted average number of common shares outstanding - diluted | 262,806 | 252,191 | 259,267 | 252,091 | |||||||||||||
(1) See Attachment 16 for definitions and other terms. | |||||||||||||||||
(2) In January 2015, the eight communities held by the Texas joint venture were sold, generating proceeds to UDR of $43.5 million. The Company recorded promote and disposition fee income of approximately $9.6 million and a gain of approximately $59.1 million in connection with the sale. | |||||||||||||||||
(3) Includes $1.5 million of acquisition-related costs related to UDR's share of the West Coast Development joint venture's transaction expenses. | |||||||||||||||||
2
| |||||||||||||||||
Attachment 2 | |||||||||||||||||
UDR, Inc. | |||||||||||||||||
Funds From Operations (1) | |||||||||||||||||
(Unaudited) | |||||||||||||||||
Three Months Ended | Six Months Ended | ||||||||||||||||
June 30, | June 30, | ||||||||||||||||
In thousands, except per share amounts | 2015 | 2014 | 2015 | 2014 | |||||||||||||
Net income/(loss) attributable to common stockholders | $ | 85,924 | $ | 29,076 | $ | 158,815 | $ | 46,506 | |||||||||
Real estate depreciation and amortization, including discontinued operations | 90,344 | 88,876 | 179,121 | 177,409 | |||||||||||||
Noncontrolling interests | 3,029 | 1,079 | 5,624 | 1,730 | |||||||||||||
Real estate depreciation and amortization on unconsolidated joint ventures | 10,017 | 8,861 | 19,867 | 19,528 | |||||||||||||
Net (gain)/loss on the sale of unconsolidated depreciable property (3) | — | — | (59,073 | ) | — | ||||||||||||
Net (gain)/loss on the sale of depreciable property, excluding TRS | (79,042 | ) | (26,709 | ) | (79,042 | ) | (49,883 | ) | |||||||||
Funds from operations ("FFO") attributable to common stockholders and unitholders, basic | $ | 110,272 | $ | 101,183 | $ | 225,312 | $ | 195,290 | |||||||||
Distributions to preferred stockholders - Series E (Convertible) | 931 | 931 | 1,862 | 1,862 | |||||||||||||
FFO attributable to common stockholders and unitholders, diluted | $ | 111,203 | $ | 102,114 | $ | 227,174 | $ | 197,152 | |||||||||
FFO per common share and unit, basic | $ | 0.41 | $ | 0.39 | $ | 0.85 | $ | 0.75 | |||||||||
FFO per common share and unit, diluted | $ | 0.41 | $ | 0.39 | $ | 0.84 | $ | 0.75 | |||||||||
Weighted average number of common shares and OP Units outstanding - basic | 266,974 | 259,571 | 266,489 | 259,533 | |||||||||||||
Weighted average number of common shares, OP Units, and common stock | |||||||||||||||||
equivalents outstanding - diluted | 271,931 | 264,543 | 271,448 | 264,444 | |||||||||||||
Impact of adjustments to FFO: | |||||||||||||||||
Acquisition-related costs/(fees), including joint ventures (2) | $ | 1,544 | $ | — | $ | 1,743 | $ | 102 | |||||||||
Cost/(benefit) associated with debt extinguishment and other | — | 192 | — | 192 | |||||||||||||
Texas Joint Venture promote and disposition fee income (3) | — | — | (9,633 | ) | — | ||||||||||||
Long-term incentive plan transition costs | 1,008 | — | 1,862 | — | |||||||||||||
(Gain)/loss on sale of land | — | — | — | (1,120 | ) | ||||||||||||
Casualty-related (recoveries)/charges, net | 843 | — | 1,839 | 500 | |||||||||||||
$ | 3,395 | $ | 192 | $ | (4,189 | ) | $ | (326 | ) | ||||||||
FFO as Adjusted attributable to common stockholders and unitholders, diluted | $ | 114,598 | $ | 102,306 | $ | 222,985 | $ | 196,826 | |||||||||
FFO as Adjusted per common share and unit, diluted | $ | 0.42 | $ | 0.39 | $ | 0.82 | $ | 0.74 | |||||||||
Recurring capital expenditures | (10,111 | ) | (11,096 | ) | (17,354 | ) | (17,697 | ) | |||||||||
AFFO attributable to common stockholders and unitholders | $ | 104,487 | $ | 91,210 | $ | 205,631 | $ | 179,129 | |||||||||
AFFO per common share and unit, diluted | $ | 0.38 | $ | 0.34 | $ | 0.76 | $ | 0.68 | |||||||||
(1) See Attachment 16 for definitions and other terms. | |||||||||||||||||
(2) 2Q15 acquisition-related costs include $1.5 million related to UDR's share of the West Coast Development joint venture's transaction expenses, which are recorded as income/(loss) from unconsolidated entities in Attachment 1. | |||||||||||||||||
(3) The Company recorded promote and disposition fee income of approximately $9.6 million and a gain of approximately $59.1 million in connection with the sale of eight communities held by the Texas Joint Venture in 1Q15. | |||||||||||||||||
3
| |||||||||
Attachment 3 | |||||||||
UDR, Inc. | |||||||||
Consolidated Balance Sheets | |||||||||
June 30, | December 31, | ||||||||
In thousands, except share and per share amounts | 2015 | 2014 | |||||||
ASSETS | (unaudited) | (audited) | |||||||
Real estate owned: | |||||||||
Real estate held for investment | $ | 8,332,634 | $ | 8,205,627 | |||||
Less: accumulated depreciation | (2,557,949 | ) | (2,434,772 | ) | |||||
Real estate held for investment, net | 5,774,685 | 5,770,855 | |||||||
Real estate under development | |||||||||
(net of accumulated depreciation of $0 and $0) | 92,645 | 177,632 | |||||||
Total real estate owned, net of accumulated depreciation | 5,867,330 | 5,948,487 | |||||||
Cash and cash equivalents | 2,990 | 15,224 | |||||||
Restricted cash | 22,912 | 22,340 | |||||||
Deferred financing costs, net | 19,930 | 22,686 | |||||||
Notes receivable, net | 15,494 | 14,369 | |||||||
Investment in and advances to unconsolidated joint ventures, net | 914,815 | 718,226 | |||||||
Other assets | 96,259 | 105,202 | |||||||
Total assets | $ | 6,939,730 | $ | 6,846,534 | |||||
LIABILITIES AND EQUITY | |||||||||
Liabilities: | |||||||||
Secured debt | $ | 1,350,439 | $ | 1,361,529 | |||||
Unsecured debt | 2,213,964 | 2,221,576 | |||||||
Real estate taxes payable | 18,263 | 15,978 | |||||||
Accrued interest payable | 27,735 | 34,215 | |||||||
Security deposits and prepaid rent | 33,366 | 34,064 | |||||||
Distributions payable | 75,129 | 69,460 | |||||||
Accounts payable, accrued expenses, and other liabilities | 72,054 | 91,282 | |||||||
Total liabilities | 3,790,950 | 3,828,104 | |||||||
Redeemable noncontrolling interests in the OP | 290,278 | 282,480 | |||||||
Equity: | |||||||||
Preferred stock, no par value; 50,000,000 shares authorized | |||||||||
2,803,812 shares of 8.00% Series E Cumulative Convertible issued | |||||||||
and outstanding (2,803,812 shares at December 31, 2014) | 46,571 | 46,571 | |||||||
Common stock, $0.01 par value; 350,000,000 shares authorized | |||||||||
259,091,257 shares issued and outstanding (255,114,603 shares at December 31, 2014) | 2,591 | 2,551 | |||||||
Additional paid-in capital | 4,342,829 | 4,223,747 | |||||||
Distributions in excess of net income | (1,525,159 | ) | (1,528,917 | ) | |||||
Accumulated other comprehensive income/(loss), net | (9,190 | ) | (8,855 | ) | |||||
Total stockholders' equity | 2,857,642 | 2,735,097 | |||||||
Noncontrolling interests | 860 | 853 | |||||||
Total equity | 2,858,502 | 2,735,950 | |||||||
Total liabilities and equity | $ | 6,939,730 | $ | 6,846,534 | |||||
4
| |||||||||||||||||||
Attachment 4(A) | |||||||||||||||||||
UDR, Inc. | |||||||||||||||||||
Selected Financial Information (1) | |||||||||||||||||||
(Unaudited) | |||||||||||||||||||
June 30, | December 31, | ||||||||||||||||||
Common Stock and Equivalents | 2015 | 2014 | |||||||||||||||||
Common shares (2) | 257,908,470 | 254,114,631 | |||||||||||||||||
Restricted shares | 1,182,787 | 999,972 | |||||||||||||||||
Total common stock | 259,091,257 | 255,114,603 | |||||||||||||||||
Stock options and restricted stock equivalents | 702,628 | 1,052,147 | |||||||||||||||||
Operating partnership units | 7,311,018 | 7,413,802 | |||||||||||||||||
Preferred OP units | 1,751,671 | 1,751,671 | |||||||||||||||||
Convertible preferred Series E stock (3) | 3,035,548 | 3,035,548 | |||||||||||||||||
Total common stock and equivalents | 271,892,122 | 268,367,771 | |||||||||||||||||
2Q 2015 Weighted | 2Q 2014 Weighted | ||||||||||||||||||
Weighted Average Number of Shares Outstanding | Average | Average | |||||||||||||||||
Weighted average number of common shares and OP Units outstanding - basic | 266,973,865 | 259,570,652 | |||||||||||||||||
Weighted average number of OP Units outstanding | (9,124,983 | ) | (9,315,709 | ) | |||||||||||||||
Weighted average number of common shares outstanding - basic per the Consolidated Statements of Operations | 257,848,882 | 250,254,943 | |||||||||||||||||
Weighted average number of common shares, OP units, and common stock equivalents outstanding - diluted | 271,931,010 | 264,542,859 | |||||||||||||||||
Weighted average number of OP Units outstanding | (9,124,983 | ) | (9,315,709 | ) | |||||||||||||||
Weight average number of Series E preferred shares outstanding (4) | — | (3,035,548 | ) | ||||||||||||||||
Weighted average number of common shares outstanding - diluted per the Consolidated Statements of Operations | 262,806,027 | 252,191,602 | |||||||||||||||||
Year-to-Date | Year-to-Date | ||||||||||||||||||
Weighted Average | Weighted Average | ||||||||||||||||||
Weighted average number of common shares and OP Units outstanding - basic | 266,488,982 | 259,533,384 | |||||||||||||||||
Weighted average number of OP Units outstanding | (9,144,945 | ) | (9,317,307 | ) | |||||||||||||||
Weighted average number of common shares outstanding - basic per the Consolidated Statements of Operations | 257,344,037 | 250,216,077 | |||||||||||||||||
Weighted average number of common shares, OP units, and common stock equivalents outstanding - diluted | 271,447,391 | 264,443,776 | |||||||||||||||||
Weighted average number of OP Units outstanding | (9,144,945 | ) | (9,317,307 | ) | |||||||||||||||
Weight average number of Series E preferred shares outstanding (4) | (3,035,548 | ) | (3,035,548 | ) | |||||||||||||||
Weighted average number of common shares outstanding - diluted per the Consolidated Statements of Operations | 259,266,898 | 252,090,921 | |||||||||||||||||
June 30, | December 31, | ||||||||||||||||||
Market Capitalization, In thousands | 2015 | % of Total | 2014 | % of Total | |||||||||||||||
Total debt | $ | 3,564,403 | 29.0 | % | $ | 3,583,105 | 30.2 | % | |||||||||||
Common stock and equivalents ($32.03 at 6/30/15 and $30.82 at 12/31/14) | 8,708,705 | 71.0 | % | 8,271,095 | 69.8 | % | |||||||||||||
Total market capitalization | $ | 12,273,108 | 100.0 | % | $ | 11,854,200 | 100.0 | % | |||||||||||
Gross | % of | ||||||||||||||||||
Number of | 2Q 2015 NOI (1) | Carrying Value | Total Gross | ||||||||||||||||
Asset Summary | Homes | ($000s) | % of NOI | ($000s) | Carrying Value | ||||||||||||||
Unencumbered assets | 26,811 | $ | 105,314 | 70.0 | % | $ | 6,184,616 | 73.4 | % | ||||||||||
Encumbered assets | 12,593 | 45,118 | 30.0 | % | 2,240,663 | 26.6 | % | ||||||||||||
39,404 | $ | 150,432 | 100.0 | % | $ | 8,425,279 | 100.0 | % | |||||||||||
(1) See Attachment 16 for definitions and other terms. | |||||||||||||||||||
(2) Includes the effect of the ATM issuance of 3.4 million and 3.4 million shares at an average price of $32.29 and $29.95 and a net price of $31.64 and $29.36 during the six and twelve months ended June 30, 2015 and December 31, 2014. | |||||||||||||||||||
(3) At June 30, 2015 and December 31, 2014, a total of 2,803,812 shares of the Series E were outstanding, which is equivalent to 3,035,548 shares of common stock if converted (after adjusting for the special dividend paid in 2008). | |||||||||||||||||||
(4) Series E preferred shares are dilutive for purposes of calculating earnings per share for the three months ended June 30, 2015. For the three and six months ended June 30, 2014 and the six months ended June 30, 2015, the Series E preferred shares are anti-dilutive. | |||||||||||||||||||
5
| ||||||||||||||||||||||
Attachment 4(B) | ||||||||||||||||||||||
UDR, Inc. | ||||||||||||||||||||||
Selected Financial Information | ||||||||||||||||||||||
(Unaudited) | ||||||||||||||||||||||
| Weighted | Weighted | ||||||||||||||||||||
Average | Average Years | |||||||||||||||||||||
Debt Structure, In thousands | Balance | % of Total | Interest Rate | to Maturity | ||||||||||||||||||
Secured | Fixed | $ | 975,024 | (1) | 27.4 | % | 5.3 | % | 2.5 | |||||||||||||
Floating | 375,415 | (2) | 10.5 | % | 1.5 | % | 5.3 | |||||||||||||||
Combined | 1,350,439 | 37.9 | % | 4.2 | % | 3.3 | ||||||||||||||||
Unsecured | Fixed | 1,721,964 | (3) | 48.3 | % | 3.8 | % | 5.2 | ||||||||||||||
Floating | 492,000 | 13.8 | % | 1.1 | % | 2.5 | ||||||||||||||||
Combined | 2,213,964 | 62.1 | % | 3.2 | % | 4.6 | ||||||||||||||||
Total Debt | Fixed | 2,696,988 | 75.7 | % | 4.3 | % | 4.2 | |||||||||||||||
Floating | 867,415 | 24.3 | % | 1.3 | % | 3.7 | ||||||||||||||||
Combined | $ | 3,564,403 | 100.0 | % | 3.6 | % | 4.1 | |||||||||||||||
Debt Maturities, In thousands | ||||||||||||||||||||||
Unsecured | Revolving | Weighted Average | ||||||||||||||||||||
Secured Debt | Debt | Credit Facility | Balance | % of Total | Interest Rate | |||||||||||||||||
2015 | $ | 187,448 | $ | — | $ | — | $ | 187,448 | 5.3 | % | 5.9 | % | ||||||||||
2016 | 143,110 | (4) | 95,868 | — | 238,978 | 6.7 | % | 5.1 | % | |||||||||||||
2017 | 279,283 | — | 457,000 | (5) | 736,283 | 20.6 | % | 2.2 | % | |||||||||||||
2018 | 207,969 | 648,749 | — | 856,718 | 24.0 | % | 3.0 | % | ||||||||||||||
2019 | 319,220 | — | — | 319,220 | 9.0 | % | 4.4 | % | ||||||||||||||
2020 | 90,000 | 299,958 | — | 389,958 | 10.9 | % | 3.8 | % | ||||||||||||||
2021 | — | — | — | — | — | — | ||||||||||||||||
2022 | — | 397,657 | — | 397,657 | 11.2 | % | 4.7 | % | ||||||||||||||
2023 | 96,409 | — | — | 96,409 | 2.7 | % | 2.1 | % | ||||||||||||||
2024 | — | 314,706 | — | 314,706 | 8.8 | % | 4.0 | % | ||||||||||||||
Thereafter | 27,000 | 26 | — | 27,026 | 0.8 | % | 0.9 | % | ||||||||||||||
$ | 1,350,439 | $ | 1,756,964 | $ | 457,000 | $ | 3,564,403 | 100.0 | % | 3.6 | % | |||||||||||
Debt Maturities With Extensions, In thousands | ||||||||||||||||||||||
Unsecured | Revolving | Weighted Average | ||||||||||||||||||||
Secured Debt | Debt | Credit Facility | Balance | % of Total | Interest Rate | |||||||||||||||||
2015 | $ | 187,448 | $ | — | $ | — | $ | 187,448 | 5.3 | % | 5.9 | % | ||||||||||
2016 | 72,365 | 95,868 | — | 168,233 | 4.7 | % | 4.8 | % | ||||||||||||||
2017 | 350,028 | — | — | 350,028 | 9.7 | % | 4.4 | % | ||||||||||||||
2018 | 207,969 | 648,749 | 457,000 | (5) | 1,313,718 | 36.9 | % | 2.4 | % | |||||||||||||
2019 | 319,220 | — | — | 319,220 | 9.0 | % | 4.4 | % | ||||||||||||||
2020 | 90,000 | 299,958 | — | 389,958 | 10.9 | % | 3.8 | % | ||||||||||||||
2021 | — | — | — | — | — | — | ||||||||||||||||
2022 | — | 397,657 | — | 397,657 | 11.2 | % | 4.7 | % | ||||||||||||||
2023 | 96,409 | — | — | 96,409 | 2.7 | % | 2.1 | % | ||||||||||||||
2024 | — | 314,706 | — | 314,706 | 8.8 | % | 4.0 | % | ||||||||||||||
Thereafter | 27,000 | 26 | — | 27,026 | 0.8 | % | 0.9 | % | ||||||||||||||
$ | 1,350,439 | $ | 1,756,964 | $ | 457,000 | $ | 3,564,403 | 100.0 | % | 3.6 | % | |||||||||||
(1) Includes $50 million of floating rate debt that has been fixed using interest rate swaps at a weighted average rate of 4.0%. | ||||||||||||||||||||||
(2) Includes $286.3 million of debt with a weighted average interest cap of 8.1% on the underlying index. | ||||||||||||||||||||||
(3) Includes $315.0 million of floating rate debt that has been fixed using interest rate swaps at a weighted average rate of 1.6%. | ||||||||||||||||||||||
(4) Includes $70.7 million of financing with a one year extension at UDR's option. | ||||||||||||||||||||||
(5) UDR's $900 million line of credit has a maturity date of December 2017, plus a six-month extension option and contains an accordion feature that allows UDR to increase the facility up to $1.45 billion assuming lender participation. The credit facility carries an interest rate equal to LIBOR plus a spread of 100 basis points and a facility fee of 15 basis points. | ||||||||||||||||||||||
6
| ||||||||||||
Attachment 4(C) | ||||||||||||
UDR, Inc. | ||||||||||||
Selected Financial Information (1) | ||||||||||||
(Unaudited) | ||||||||||||
Quarter Ended | ||||||||||||
Coverage Ratios | June 30, 2015 | |||||||||||
Net income/(loss) attributable to UDR, Inc. | $ | 86,855 | ||||||||||
Adjustments (includes continuing and discontinued operations): | ||||||||||||
Interest expense | 29,673 | |||||||||||
Real estate depreciation and amortization | 90,344 | |||||||||||
Real estate depreciation and amortization on unconsolidated joint ventures | 10,017 | |||||||||||
Other depreciation and amortization | 1,700 | |||||||||||
Noncontrolling interests | 3,029 | |||||||||||
Income tax expense/(benefit) | (1,404 | ) | ||||||||||
EBITDA | $ | 220,214 | ||||||||||
(Gain)/loss on sale of real estate owned, net of tax | (79,042 | ) | ||||||||||
Long-term incentive plan transition costs | 1,008 | |||||||||||
Acquisition-related costs/(fees), including joint ventures | 1,544 | |||||||||||
Casualty-related (recoveries)/charges, net | 843 | |||||||||||
EBITDA - adjusted for non-recurring items | $ | 144,567 | ||||||||||
Annualized EBITDA - adjusted for non-recurring items | $ | 578,268 | ||||||||||
Interest expense | $ | 29,673 | ||||||||||
Capitalized interest expense | 3,775 | |||||||||||
Total interest | $ | 33,448 | ||||||||||
Preferred dividends | $ | 931 | ||||||||||
Total debt | $ | 3,564,403 | ||||||||||
Cash | 2,990 | |||||||||||
Net debt | $ | 3,561,413 | ||||||||||
Interest Coverage Ratio | 6.58 | x | ||||||||||
Fixed Charge Coverage Ratio | 6.41 | x | ||||||||||
Interest Coverage Ratio - adjusted for non-recurring items | 4.32 | x | ||||||||||
Fixed Charge Coverage Ratio - adjusted for non-recurring items | 4.21 | x | ||||||||||
Net Debt-to-EBITDA, adjusted for non-recurring items | 6.2 | x | ||||||||||
Debt Covenant Overview | ||||||||||||
Unsecured Line of Credit Covenants (2) | Required | Actual | Compliance | |||||||||
Maximum Leverage Ratio | ≤60.0% | 37.4% | Yes | |||||||||
Minimum Fixed Charge Coverage Ratio | ≥1.5 | 3.4 | Yes | |||||||||
Maximum Secured Debt Ratio | ≤40.0% | 18.2% | Yes | |||||||||
Minimum Unencumbered Pool Leverage Ratio | ≥150.0% | 325.3% | Yes | |||||||||
Senior Unsecured Note Covenants (3) | Required | Actual | Compliance | |||||||||
Debt as a percentage of Total Assets | ≤60.0% | 37.6% | Yes | |||||||||
Consolidated Income Available for Debt Service to Annual Service Charge | ≥1.5 | 4.3 | Yes | |||||||||
Secured Debt as a percentage of Total Assets | ≤40.0% | 14.2% | Yes | |||||||||
Total Unencumbered Assets to Unsecured Debt | ≥150.0% | 283.8% | Yes | |||||||||
Securities Ratings | Debt | Preferred | Outlook | |||||||||
Moody's Investors Service | Baa1 | Baa2 | Stable | |||||||||
Standard & Poor's | BBB+ (4) | BB+ | Stable | |||||||||
(1) See Attachment 16 for definitions and other terms. | ||||||||||||
(2) As defined in our credit agreement dated October 25, 2011 as amended June 6, 2013. | ||||||||||||
(3) As defined in our indenture dated November 1, 1995 as amended, supplemented or modified from time to time. | ||||||||||||
(4) Received a senior unsecured credit upgrade from Standard & Poor's to BBB+ in June 2015. | ||||||||||||
7
| |||||||||||||||||||||||
Attachment 5 | |||||||||||||||||||||||
UDR, Inc. | |||||||||||||||||||||||
Operating Information (1) | |||||||||||||||||||||||
(Unaudited) | |||||||||||||||||||||||
Total | Quarter Ended | Quarter Ended | Quarter Ended | Quarter Ended | Quarter Ended | ||||||||||||||||||
Dollars in thousands | Homes | June 30, 2015 | March 31, 2015 | December 31, 2014 | September 30, 2014 | June 30, 2014 | |||||||||||||||||
Revenues | |||||||||||||||||||||||
Same-Store Communities | 35,250 | $ | 174,521 | $ | 170,708 | $ | 168,180 | $ | 167,992 | $ | 165,628 | ||||||||||||
Stabilized, Non-Mature Communities | 2,952 | 24,504 | 24,043 | 23,553 | 21,115 | 17,576 | |||||||||||||||||
Acquired Communities | — | — | — | — | — | — | |||||||||||||||||
Redevelopment Communities | 328 | 3,125 | 3,073 | 3,106 | 3,025 | 2,916 | |||||||||||||||||
Development Communities | 874 | 2,971 | 1,795 | 685 | 23 | 1 | |||||||||||||||||
Non-Residential / Other (2) | — | 5,632 | 4,656 | 4,634 | 4,776 | 4,332 | |||||||||||||||||
Total | 39,404 | $ | 210,753 | $ | 204,275 | $ | 200,158 | $ | 196,931 | $ | 190,453 | ||||||||||||
Expenses | |||||||||||||||||||||||
Same-Store Communities | $ | 49,676 | $ | 50,388 | $ | 48,609 | $ | 51,158 | $ | 48,778 | |||||||||||||
Stabilized, Non-Mature Communities | 7,739 | 7,824 | 7,687 | 7,337 | 6,848 | ||||||||||||||||||
Acquired Communities | — | — | — | — | — | ||||||||||||||||||
Redevelopment Communities | 575 | 578 | 570 | 564 | 534 | ||||||||||||||||||
Development Communities | 1,853 | 1,340 | 1,043 | 590 | 131 | ||||||||||||||||||
Non-Residential / Other (2) | 1,813 | 2,415 | 2,147 | 1,662 | 568 | ||||||||||||||||||
Total | $ | 61,656 | $ | 62,545 | $ | 60,056 | $ | 61,311 | $ | 56,859 | |||||||||||||
Net Operating Income | |||||||||||||||||||||||
Same-Store Communities | $ | 124,845 | $ | 120,320 | $ | 119,571 | $ | 116,834 | $ | 116,850 | |||||||||||||
Stabilized, Non-Mature Communities | 16,765 | 16,219 | 15,866 | 13,778 | 10,728 | ||||||||||||||||||
Acquired Communities | — | — | — | — | — | ||||||||||||||||||
Redevelopment Communities | 2,550 | 2,495 | 2,536 | 2,461 | 2,382 | ||||||||||||||||||
Development Communities | 1,118 | 455 | (358 | ) | (567 | ) | (130 | ) | |||||||||||||||
Non-Residential / Other (2) | 3,819 | 2,241 | 2,487 | 3,114 | 3,764 | ||||||||||||||||||
Total | $ | 149,097 | $ | 141,730 | $ | 140,102 | $ | 135,620 | $ | 133,594 | |||||||||||||
Operating Margin | |||||||||||||||||||||||
Same-Store Communities | 71.5 | % | 70.5 | % | 71.1 | % | 69.5 | % | 70.5 | % | |||||||||||||
Average Physical Occupancy | |||||||||||||||||||||||
Same-Store Communities | 96.9 | % | 96.7 | % | 96.7 | % | 96.8 | % | 96.8 | % | |||||||||||||
Stabilized, Non-Mature Communities | 95.7 | % | 95.2 | % | 95.2 | % | 92.9 | % | 78.4 | % | |||||||||||||
Acquired Communities | — | — | — | — | — | ||||||||||||||||||
Redevelopment Communities | 95.0 | % | 97.1 | % | 98.0 | % | 98.3 | % | 97.4 | % | |||||||||||||
Development Communities | 67.6 | % | 57.7 | % | 39.8 | % | 20.7 | % | — | ||||||||||||||
Other (3) | — | 97.3 | % | 97.1 | % | 93.3 | % | 89.9 | % | ||||||||||||||
Total | 96.2 | % | 96.2 | % | 95.6 | % | 96.3 | % | 95.2 | % | |||||||||||||
Return on Invested Capital | |||||||||||||||||||||||
Same-Store Communities | 7.7 | % | 7.5 | % | 7.3 | % | 7.3 | % | 7.3 | % | |||||||||||||
Sold and Held for Disposition Communities | |||||||||||||||||||||||
Revenues | $ | 2,011 | $ | 2,772 | $ | 5,946 | $ | 6,656 | $ | 10,506 | |||||||||||||
Expenses | 676 | 927 | 2,057 | 2,472 | 3,697 | ||||||||||||||||||
Net Operating Income/(loss) | $ | 1,335 | $ | 1,845 | $ | 3,889 | $ | 4,184 | $ | 6,809 | |||||||||||||
Total | 39,404 | $ | 150,432 | $ | 143,575 | $ | 143,991 | $ | 139,804 | $ | 140,403 | ||||||||||||
Discontinued Operations (4) | |||||||||||||||||||||||
Revenues | $ | — | $ | — | $ | — | $ | 21 | $ | 78 | |||||||||||||
Expenses | — | — | — | 11 | 89 | ||||||||||||||||||
Net Operating Income/(loss) | $ | — | $ | — | $ | — | $ | 10 | $ | (11 | ) | ||||||||||||
(1) See Attachment 16 for definition and other terms. | |||||||||||||||||||||||
(2) Primarily non-residential revenue and expense and straight-line adjustment for concessions. | |||||||||||||||||||||||
(3) Includes occupancy of Sold and Held for Disposition Communities and Discontinued Operations. | |||||||||||||||||||||||
(4) Effective January 1, 2014, UDR prospectively adopted Accounting Standards Update (“ASU”) No. 2014-08, Reporting Discontinued Operations and Disclosures of Disposals of Components of an Entity, for all communities not previously sold or classified as held for sale. ASU 2014-08 incorporates into the definition of a discontinued operation a requirement that a disposition represent a strategic shift in an entity’s operations, which resulted in UDR no longer classifying the sale of communities as a discontinued operation. 2014 activity included in discontinued operations is related to Grandview, a commercial property classified as held for sale prior to the adoption of the new accounting standard, which was sold in July 2014. | |||||||||||||||||||||||
8
| |||||||||||||||
Attachment 6 | |||||||||||||||
UDR, Inc. | |||||||||||||||
Same-Store Operating Expense Information (1) | |||||||||||||||
(Dollars in Thousands) | |||||||||||||||
(Unaudited) | |||||||||||||||
% of 2Q 2015 | |||||||||||||||
SS Operating | |||||||||||||||
Year-Over-Year Comparison | Expenses | 2Q 2015 | 2Q 2014 | % Change | |||||||||||
Real estate taxes | 34.4 | % | $ | 17,071 | $ | 16,673 | 2.4 | % | |||||||
Personnel | 25.2 | % | 12,521 | 12,161 | 3.0 | % | |||||||||
Utilities | 15.5 | % | 7,721 | 7,461 | 3.5 | % | |||||||||
Repair and maintenance | 14.0 | % | 6,940 | 7,052 | -1.6 | % | |||||||||
Administrative and marketing | 6.3 | % | 3,132 | 3,192 | -1.9 | % | |||||||||
Insurance | 4.6 | % | 2,291 | 2,239 | 2.3 | % | |||||||||
Same-Store operating expenses | 100.0 | % | $ | 49,676 | $ | 48,778 | 1.8 | % | |||||||
Same-Store Homes | 35,250 | ||||||||||||||
% of 2Q 2015 | |||||||||||||||
SS Operating | |||||||||||||||
Sequential Comparison | Expenses | 2Q 2015 | 1Q 2015 | % Change | |||||||||||
Real estate taxes | 34.4 | % | $ | 17,071 | $ | 17,527 | -2.6 | % | |||||||
Personnel | 25.2 | % | 12,521 | 12,029 | 4.1 | % | |||||||||
Utilities | 15.5 | % | 7,721 | 8,828 | -12.5 | % | |||||||||
Repair and maintenance | 14.0 | % | 6,940 | 6,667 | 4.1 | % | |||||||||
Administrative and marketing | 6.3 | % | 3,132 | 3,194 | -2.0 | % | |||||||||
Insurance | 4.6 | % | 2,291 | 2,143 | 7.0 | % | |||||||||
Same-Store operating expenses | 100.0 | % | $ | 49,676 | $ | 50,388 | -1.4 | % | |||||||
Same-Store Homes | 35,250 | ||||||||||||||
% of YTD 2015 | |||||||||||||||
SS Operating | |||||||||||||||
Year-to-Date Comparison | Expenses | YTD 2015 | YTD 2014 | % Change | |||||||||||
Real estate taxes | 34.6 | % | $ | 34,598 | $ | 33,670 | 2.8 | % | |||||||
Personnel | 24.5 | % | 24,550 | 23,722 | 3.5 | % | |||||||||
Utilities | 16.6 | % | 16,549 | 16,058 | 3.1 | % | |||||||||
Repair and maintenance | 13.6 | % | 13,607 | 13,692 | -0.6 | % | |||||||||
Administrative and marketing | 6.3 | % | 6,326 | 6,271 | 0.9 | % | |||||||||
Insurance | 4.4 | % | 4,434 | 4,570 | -3.0 | % | |||||||||
Same-Store operating expenses | 100.0 | % | $ | 100,064 | $ | 97,983 | 2.1 | % | |||||||
Same-Store Homes | 35,250 | ||||||||||||||
(1) See Attachment 16 for definitions and other terms. | |||||||||||||||
9
| ||||||||||||||||||
Attachment 7(A) | ||||||||||||||||||
UDR, Inc. | ||||||||||||||||||
Apartment Home Breakout (1) | ||||||||||||||||||
Portfolio Overview as of Quarter Ended | ||||||||||||||||||
June 30, 2015 | ||||||||||||||||||
(Unaudited) | ||||||||||||||||||
Non-Mature Homes | Unconsolidated | |||||||||||||||||
Total | Total | Joint Venture | Total | |||||||||||||||
Same-Store | Non- | Consolidated | Operating | Homes | ||||||||||||||
Homes | Stabilized (2) | Stabil. / Other (3) | Homes | Homes (4) | (incl. JV) (4) | |||||||||||||
West Region | ||||||||||||||||||
Orange County, CA | 3,757 | 1,284 | 173 | 5,214 | — | 5,214 | ||||||||||||
San Francisco, CA | 2,108 | 315 | 328 | 2,751 | — | 2,751 | ||||||||||||
Seattle, WA | 1,727 | 358 | — | 2,085 | 555 | 2,640 | ||||||||||||
Los Angeles, CA | 1,225 | — | — | 1,225 | 151 | 1,376 | ||||||||||||
Monterey Peninsula, CA | 1,565 | — | — | 1,565 | — | 1,565 | ||||||||||||
Other Southern CA | 875 | — | — | 875 | 571 | 1,446 | ||||||||||||
Portland, OR | 476 | — | — | 476 | — | 476 | ||||||||||||
11,733 | 1,957 | 501 | 14,191 | 1,277 | 15,468 | |||||||||||||
Mid-Atlantic Region | ||||||||||||||||||
Metropolitan DC | 4,568 | 256 | 332 | 5,156 | 874 | 6,030 | ||||||||||||
Baltimore, MD | 2,300 | — | — | 2,300 | 379 | 2,679 | ||||||||||||
Richmond, VA | 1,358 | — | — | 1,358 | — | 1,358 | ||||||||||||
Norfolk, VA | 846 | — | — | 846 | — | 846 | ||||||||||||
Other Mid-Atlantic | 168 | — | — | 168 | — | 168 | ||||||||||||
9,240 | 256 | 332 | 9,828 | 1,253 | 11,081 | |||||||||||||
Southeast Region | ||||||||||||||||||
Tampa, FL | 2,499 | — | — | 2,499 | — | 2,499 | ||||||||||||
Orlando, FL | 2,500 | — | — | 2,500 | — | 2,500 | ||||||||||||
Nashville, TN | 2,260 | — | — | 2,260 | — | 2,260 | ||||||||||||
Other Florida | 636 | — | — | 636 | — | 636 | ||||||||||||
7,895 | — | — | 7,895 | — | 7,895 | |||||||||||||
Northeast Region | ||||||||||||||||||
New York, NY | 1,205 | 739 | — | 1,944 | 710 | 2,654 | ||||||||||||
Boston, MA | 1,179 | — | 369 | 1,548 | 1,302 | 2,850 | ||||||||||||
Philadelphia, PA | — | — | — | — | 290 | 290 | ||||||||||||
2,384 | 739 | 369 | 3,492 | 2,302 | 5,794 | |||||||||||||
Southwest Region | ||||||||||||||||||
Dallas, TX | 2,725 | — | — | 2,725 | 1,382 | 4,107 | ||||||||||||
Austin, TX | 1,273 | — | — | 1,273 | 259 | 1,532 | ||||||||||||
Other Southwest | — | — | — | — | 223 | 223 | ||||||||||||
3,998 | — | — | 3,998 | 1,864 | 5,862 | |||||||||||||
Totals | 35,250 | 2,952 | 1,202 | 39,404 | 6,696 | 46,100 | ||||||||||||
Communities | 125 | 7 | 4 | 136 | 28 | 164 | ||||||||||||
Total Homes (incl. joint ventures) (4) | 46,100 | |||||||||||||||||
Homes in Development, Excluding Completed Homes (5) | ||||||||||||||||||
Current Pipeline Wholly-Owned | 516 | |||||||||||||||||
Current Pipeline Joint Venture (6) | 1,173 | |||||||||||||||||
Current Pipeline Preferred Equity Investments (6) | 1,533 | |||||||||||||||||
Total expected homes (including development) | 49,322 | |||||||||||||||||
(1) See Attachment 16 for definitions and other terms. | ||||||||||||||||||
(2) Represents homes included in Stabilized, Non-Mature category on Attachment 5. | ||||||||||||||||||
(3) Represents homes included in Acquired, Development, Redevelopment, Non-Residential/Other, Sold, and Held for Disposition categories on Attachment 5. Excludes development homes not yet completed. | ||||||||||||||||||
(4) Represents joint venture homes at 100 percent. See Attachment 12 for UDR's joint venture and partnership ownership interests. | ||||||||||||||||||
(5) See Attachments 9(A) and 9(B) for detail of our development communities. | ||||||||||||||||||
(6) Represents joint venture and preferred equity investment homes at 100 percent. Excludes 218 homes at Steele Creek where we have a participating loan investment. See Attachments 9(A) and 9(B) for UDR's developments and ownership interests. | ||||||||||||||||||
10
| |||||||||||||||||||||
Attachment 7(B) | |||||||||||||||||||||
UDR, Inc. | |||||||||||||||||||||
Non-Mature Home Summary (1) | |||||||||||||||||||||
Portfolio Overview as of Quarter Ended | |||||||||||||||||||||
June 30, 2015 | |||||||||||||||||||||
(Unaudited) | |||||||||||||||||||||
Non-Mature Home Breakout - By Region (includes development homes that have been completed) | |||||||||||||||||||||
# of | Same-Store | # of | Same-Store | ||||||||||||||||||
Community | Category | Homes | Date (2) | Community | Category | Homes | Date (2) | ||||||||||||||
West Region | Mid-Atlantic Region | ||||||||||||||||||||
Orange County, CA | Metropolitan D.C. | ||||||||||||||||||||
27 Seventy Five Mesa Verde | Stabilized, Non-Mature | 964 | 3Q15 | Domain College Park | Stabilized, Non-Mature | 256 | 4Q15 | ||||||||||||||
Los Alisos | Stabilized, Non-Mature | 320 | 1Q16 | DelRay Tower | Development | 332 | 4Q16 | ||||||||||||||
Beach & Ocean | Development | 173 | 3Q16 | ||||||||||||||||||
Northeast Region | |||||||||||||||||||||
San Francisco, CA | New York, NY | ||||||||||||||||||||
Channel @ Mission Bay | Stabilized, Non-Mature | 315 | 3Q15 | View 34 | Stabilized, Non-Mature | 739 | 1Q16 | ||||||||||||||
2000 Post | Redevelopment | 328 | 1Q17 | ||||||||||||||||||
Boston, MA | |||||||||||||||||||||
Seattle, WA | 100 Pier 4 | Development | 369 | 2Q17 | |||||||||||||||||
Lightbox | Stabilized, Non-Mature | 162 | 2Q16 | ||||||||||||||||||
Waterscape | Stabilized, Non-Mature | 196 | 1Q16 | ||||||||||||||||||
Total | 4,154 | ||||||||||||||||||||
Non-Mature Home Breakout - By Date (quarter indicates date of Same-Store inclusion) | |||||||||||||||||||||
# of | # of | ||||||||||||||||||||
Date & Community | Category | Homes | Date & Community | Category | Homes | ||||||||||||||||
3Q15 | 3Q16 | ||||||||||||||||||||
27 Seventy Five Mesa Verde | Stabilized, Non-Mature | 964 | Beach & Ocean | Development | 173 | ||||||||||||||||
Channel @ Mission Bay | Stabilized, Non-Mature | 315 | |||||||||||||||||||
4Q16 | |||||||||||||||||||||
4Q15 | DelRay Tower | Development | 332 | ||||||||||||||||||
Domain College Park | Stabilized, Non-Mature | 256 | |||||||||||||||||||
1Q17 | |||||||||||||||||||||
1Q16 | 2000 Post | Redevelopment | 328 | ||||||||||||||||||
Los Alisos | Stabilized, Non-Mature | 320 | |||||||||||||||||||
Waterscape | Stabilized, Non-Mature | 196 | 2Q17 | ||||||||||||||||||
View 34 | Stabilized, Non-Mature | 739 | 100 Pier 4 | Development | 369 | ||||||||||||||||
2Q16 | |||||||||||||||||||||
Lightbox | Stabilized, Non-Mature | 162 | Total | 4,154 | |||||||||||||||||
Summary of Non-Mature Home Activity | |||||||||||||||||||||
Stabilized, Non-Mature | Acquired | Redevelopment | Development | Total | |||||||||||||||||
Non-Mature Homes at March 31, 2015 | 2,213 | — | 1,067 | 613 | 3,893 | ||||||||||||||||
View 34 | 739 | — | (739 | ) | — | — | |||||||||||||||
100 Pier 4 | — | — | — | 261 | 261 | (3) | |||||||||||||||
Non-Mature Homes at June 30, 2015 | 2,952 | — | 328 | 874 | 4,154 | ||||||||||||||||
(1) See Attachment 16 for definitions and other terms. | |||||||||||||||||||||
(2) Estimated Same-Store quarter represents the quarter UDR anticipates contributing the community to the QTD Same-Store pool. | |||||||||||||||||||||
(3) 261 homes were completed at 100 Pier 4 in 2Q15. | |||||||||||||||||||||
11
| ||||||||||||||||||||||||
Attachment 7(C) | ||||||||||||||||||||||||
UDR, Inc. | ||||||||||||||||||||||||
Total Revenue Per Occupied Home Summary (1) | ||||||||||||||||||||||||
Portfolio Overview as of Quarter Ended | ||||||||||||||||||||||||
June 30, 2015 | ||||||||||||||||||||||||
(Unaudited) | ||||||||||||||||||||||||
Non-Mature Homes | Unconsolidated | |||||||||||||||||||||||
Total | Total | Joint Venture | Total | |||||||||||||||||||||
Same-Store | Non- | Consolidated | Operating | Homes | ||||||||||||||||||||
Homes | Stabilized (2) | Stabilized (3) (4) | Homes | Homes (5) | (incl. pro rata JV) (5) | |||||||||||||||||||
West Region | ||||||||||||||||||||||||
Orange County, CA | $ | 1,899 | $ | 2,070 | $ | 2,103 | $ | 1,947 | $ | — | $ | 1,947 | ||||||||||||
San Francisco, CA | 2,988 | 4,448 | 3,345 | 3,197 | — | 3,197 | ||||||||||||||||||
Seattle, WA | 1,836 | 1,899 | — | 1,846 | 3,417 | 2,030 | ||||||||||||||||||
Los Angeles, CA | 2,453 | — | — | 2,453 | 3,924 | 2,535 | ||||||||||||||||||
Monterey Peninsula, CA | 1,311 | — | — | 1,311 | — | 1,311 | ||||||||||||||||||
Other Southern CA | 1,630 | — | — | 1,630 | 2,904 | 1,940 | ||||||||||||||||||
Portland, OR | 1,268 | — | — | 1,268 | — | 1,268 | ||||||||||||||||||
Mid-Atlantic Region | ||||||||||||||||||||||||
Metropolitan DC | 1,924 | 1,949 | 1,954 | 1,926 | 2,714 | 1,970 | ||||||||||||||||||
Baltimore, MD | 1,494 | — | — | 1,494 | 1,774 | 1,515 | ||||||||||||||||||
Richmond, VA | 1,236 | — | — | 1,236 | — | 1,236 | ||||||||||||||||||
Norfolk, VA | 1,077 | — | — | 1,077 | — | 1,077 | ||||||||||||||||||
Other Mid-Atlantic | 1,034 | — | — | 1,034 | — | 1,034 | ||||||||||||||||||
Southeast Region | ||||||||||||||||||||||||
Tampa, FL | 1,187 | — | — | 1,187 | — | 1,187 | ||||||||||||||||||
Orlando, FL | 1,098 | — | — | 1,098 | — | 1,098 | ||||||||||||||||||
Nashville, TN | 1,103 | — | — | 1,103 | — | 1,103 | ||||||||||||||||||
Other Florida | 1,427 | — | — | 1,427 | — | 1,427 | ||||||||||||||||||
Northeast Region | ||||||||||||||||||||||||
New York, NY | 3,805 | 4,420 | — | 4,037 | 4,670 | 4,133 | ||||||||||||||||||
Boston, MA | 2,316 | — | 1,810 | 2,273 | 2,342 | 2,296 | ||||||||||||||||||
Philadelphia, PA | — | — | — | — | 3,241 | 3,241 | ||||||||||||||||||
Southwest Region | ||||||||||||||||||||||||
Dallas, TX | 1,181 | — | — | 1,181 | 1,825 | 1,309 | ||||||||||||||||||
Austin, TX | 1,345 | — | — | 1,345 | 4,319 | 1,615 | ||||||||||||||||||
Other Southwest | — | — | — | — | 3,086 | 3,086 | ||||||||||||||||||
Weighted Average | $ | 1,703 | $ | 2,891 | $ | 2,496 | $ | 1,809 | $ | 2,817 | $ | 1,885 | ||||||||||||
(1) See Attachment 16 for definitions and other terms. | ||||||||||||||||||||||||
(2) Represents homes included in Stabilized, Non-Mature category on Attachment 5. | ||||||||||||||||||||||||
(3) Represents homes included in Acquired, Development, Redevelopment, Non-Residential/Other and Sold and Held for Disposition communities categories on Attachment 5. | ||||||||||||||||||||||||
(4) Development revenue per occupied home can be affected by the timing of home deliveries during a quarter and the effects of upfront rental rate concessions on cash-based calculations. | ||||||||||||||||||||||||
(5) Represents joint ventures at UDR's pro-rata ownership interests. See Attachment 12 for UDR's joint venture and partnership ownership interests. | ||||||||||||||||||||||||
12
| ||||||||||||||
Attachment 7(D) | ||||||||||||||
UDR, Inc. | ||||||||||||||
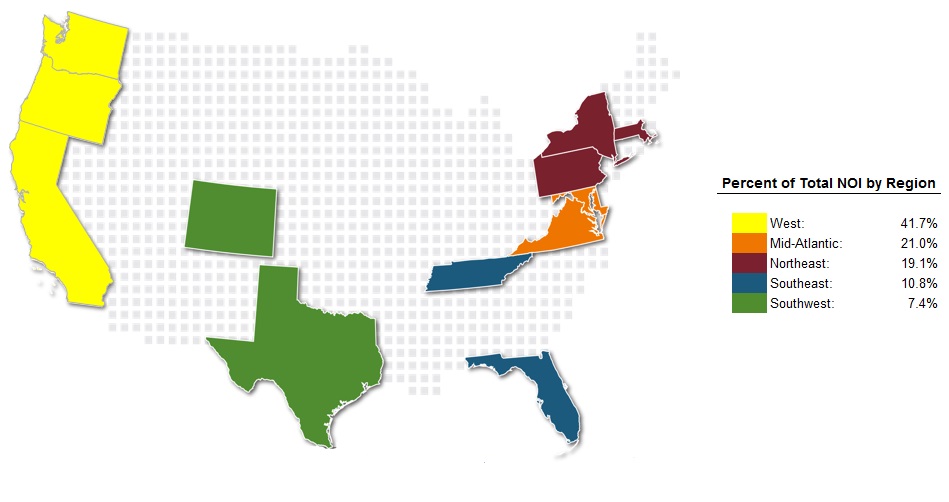
Net Operating Income Breakout By Market (1) | ||||||||||||||
June 30, 2015 | ||||||||||||||
(Dollars in Thousands) | ||||||||||||||
(Unaudited) | ||||||||||||||
Three Months Ended June 30, 2015 | ||||||||||||||||||||
Pro-Rata | ||||||||||||||||||||
Same-Store | Non Same-Store (2) | Share of JVs (3) | Total | |||||||||||||||||
Net Operating Income | $ | 124,845 | $ | 24,252 | $ | 17,717 | $ | 166,814 | ||||||||||||
Three Months Ended June 30, 2015 | Three Months Ended June 30, 2015 | |||||||||||||||||||
As a % of NOI | As a % of NOI | |||||||||||||||||||
Region | Same-Store | Total | Region | Same-Store | Total | |||||||||||||||
West Region | Southeast Region | |||||||||||||||||||
Orange County, CA | 12.5 | % | 12.9 | % | Tampa, FL | 4.5 | % | 3.4 | % | |||||||||||
San Francisco, CA | 11.4 | % | 11.9 | % | Orlando, FL | 4.4 | % | 3.3 | % | |||||||||||
Seattle, WA | 5.3 | % | 6.7 | % | Nashville, TN | 4.1 | % | 3.1 | % | |||||||||||
Los Angeles, CA | 5.1 | % | 4.1 | % | Other Florida | 1.3 | % | 1.0 | % | |||||||||||
Monterey Peninsula, CA | 3.5 | % | 2.6 | % | 14.3 | % | 10.8 | % | ||||||||||||
Other Southern CA | 2.4 | % | 2.7 | % | Northeast Region | |||||||||||||||
Portland, OR | 1.0 | % | 0.8 | % | New York, NY | 8.4 | % | 13.0 | % | |||||||||||
41.2 | % | 41.7 | % | Boston, MA | 4.7 | % | 5.3 | % | ||||||||||||
Philadelphia, PA | 0.0 | % | 0.8 | % | ||||||||||||||||
Mid-Atlantic Region | 13.1 | % | 19.1 | % | ||||||||||||||||
Metropolitan DC | 14.0 | % | 12.9 | % | Southwest Region | |||||||||||||||
Baltimore, MD | 5.7 | % | 4.7 | % | Dallas, TX | 4.9 | % | 4.7 | % | |||||||||||
Richmond, VA | 2.9 | % | 2.2 | % | Austin, TX | 2.3 | % | 2.3 | % | |||||||||||
Norfolk, VA | 1.4 | % | 1.0 | % | Other Southwest | 0.0 | % | 0.4 | % | |||||||||||
Other Mid-Atlantic | 0.2 | % | 0.2 | % | 7.2 | % | 7.4 | % | ||||||||||||
24.2 | % | 21.0 | % | |||||||||||||||||
Total | 100.0 | % | 100.0 | % | ||||||||||||||||
(1) See Attachment 16 for definitions and other terms. | ||||||||||||||||||||
(2) Excludes results from Sold, Held for Disposition Communities and Discontinued Operations. | ||||||||||||||||||||
(3) Includes UDR's pro rata share of joint venture and partnership NOI. | ||||||||||||||||||||
13
| |||||||||||||||||||||
Attachment 8(A) | |||||||||||||||||||||
UDR, Inc. | |||||||||||||||||||||
Same-Store Operating Information By Major Market (1) | |||||||||||||||||||||
Current Quarter vs. Prior Year Quarter | |||||||||||||||||||||
June 30, 2015 | |||||||||||||||||||||
(Unaudited) | |||||||||||||||||||||
% of Same- | |||||||||||||||||||||
Total | Store Portfolio | Same-Store | |||||||||||||||||||
Same-Store | Based on | Physical Occupancy | Total Revenue per Occupied Home | ||||||||||||||||||
Homes | 2Q 2015 NOI | 2Q 15 | 2Q 14 | Change | 2Q 15 | 2Q 14 | Change | ||||||||||||||
West Region | |||||||||||||||||||||
Orange County, CA | 3,757 | 12.5 | % | 95.9 | % | 95.1 | % | 0.8 | % | $ | 1,899 | $ | 1,807 | 5.1 | % | ||||||
San Francisco, CA | 2,108 | 11.4 | % | 97.1 | % | 97.4 | % | -0.3 | % | 2,988 | 2,727 | 9.6 | % | ||||||||
Seattle, WA | 1,727 | 5.3 | % | 97.3 | % | 97.5 | % | -0.2 | % | 1,836 | 1,727 | 6.3 | % | ||||||||
Los Angeles, CA | 1,225 | 5.1 | % | 95.6 | % | 95.4 | % | 0.2 | % | 2,453 | 2,319 | 5.8 | % | ||||||||
Monterey Peninsula, CA | 1,565 | 3.5 | % | 97.5 | % | 97.4 | % | 0.1 | % | 1,311 | 1,195 | 9.7 | % | ||||||||
Other Southern CA | 875 | 2.4 | % | 96.5 | % | 96.6 | % | -0.1 | % | 1,630 | 1,544 | 5.6 | % | ||||||||
Portland, OR | 476 | 1.0 | % | 97.5 | % | 97.9 | % | -0.4 | % | 1,268 | 1,147 | 10.5 | % | ||||||||
11,733 | 41.2 | % | 96.6 | % | 96.4 | % | 0.2 | % | 2,019 | 1,886 | 7.0 | % | |||||||||
Mid-Atlantic Region | |||||||||||||||||||||
Metropolitan DC | 4,568 | 14.0 | % | 96.8 | % | 97.1 | % | -0.3 | % | 1,924 | 1,879 | 2.4 | % | ||||||||
Baltimore, MD | 2,300 | 5.7 | % | 97.3 | % | 97.3 | % | 0.0 | % | 1,494 | 1,461 | 2.3 | % | ||||||||
Richmond, VA | 1,358 | 2.9 | % | 96.9 | % | 96.5 | % | 0.4 | % | 1,236 | 1,221 | 1.2 | % | ||||||||
Norfolk, VA | 846 | 1.4 | % | 95.3 | % | 95.3 | % | 0.0 | % | 1,077 | 1,051 | 2.5 | % | ||||||||
Other Mid-Atlantic | 168 | 0.2 | % | 95.9 | % | 97.0 | % | -1.1 | % | 1,034 | 1,017 | 1.7 | % | ||||||||
9,240 | 24.2 | % | 96.8 | % | 96.9 | % | -0.1 | % | 1,623 | 1,588 | 2.1 | % | |||||||||
Southeast Region | |||||||||||||||||||||
Tampa, FL | 2,499 | 4.5 | % | 97.1 | % | 96.5 | % | 0.6 | % | 1,187 | 1,128 | 5.2 | % | ||||||||
Orlando, FL | 2,500 | 4.4 | % | 97.0 | % | 97.0 | % | 0.0 | % | 1,098 | 1,025 | 7.1 | % | ||||||||
Nashville, TN | 2,260 | 4.1 | % | 97.3 | % | 97.6 | % | -0.3 | % | 1,103 | 1,052 | 4.8 | % | ||||||||
Other Florida | 636 | 1.3 | % | 96.6 | % | 96.2 | % | 0.4 | % | 1,427 | 1,352 | 5.5 | % | ||||||||
7,895 | 14.3 | % | 97.1 | % | 96.9 | % | 0.2 | % | 1,154 | 1,091 | 5.8 | % | |||||||||
Northeast Region | |||||||||||||||||||||
New York, NY | 1,205 | 8.4 | % | 98.0 | % | 97.3 | % | 0.7 | % | 3,805 | 3,626 | 4.9 | % | ||||||||
Boston, MA | 1,179 | 4.7 | % | 97.1 | % | 96.8 | % | 0.3 | % | 2,316 | 2,203 | 5.1 | % | ||||||||
2,384 | 13.1 | % | 97.6 | % | 97.1 | % | 0.5 | % | 3,072 | 2,924 | 5.1 | % | |||||||||
Southwest Region | |||||||||||||||||||||
Dallas, TX | 2,725 | 4.9 | % | 97.0 | % | 97.6 | % | -0.6 | % | 1,181 | 1,122 | 5.3 | % | ||||||||
Austin, TX | 1,273 | 2.3 | % | 97.3 | % | 96.7 | % | 0.6 | % | 1,345 | 1,264 | 6.4 | % | ||||||||
3,998 | 7.2 | % | 97.1 | % | 97.3 | % | -0.2 | % | 1,233 | 1,167 | 5.7 | % | |||||||||
Total/Weighted Avg. | 35,250 | 100.0 | % | 96.9 | % | 96.8 | % | 0.1 | % | $ | 1,703 | $ | 1,618 | 5.3 | % | ||||||
(1) See Attachment 16 for definitions and other terms. | |||||||||||||||||||||
14
| |||||||||||||||||||||||||||||
Attachment 8(B) | |||||||||||||||||||||||||||||
UDR, Inc. | |||||||||||||||||||||||||||||
Same-Store Operating Information By Major Market (1) | |||||||||||||||||||||||||||||
Current Quarter vs. Prior Year Quarter | |||||||||||||||||||||||||||||
June 30, 2015 | |||||||||||||||||||||||||||||
(Unaudited) | |||||||||||||||||||||||||||||
Total | Same-Store ($000s) | ||||||||||||||||||||||||||||
Same-Store | Revenues | Expenses | Net Operating Income | ||||||||||||||||||||||||||
Homes | 2Q 15 | 2Q 14 | Change | 2Q 15 | 2Q 14 | Change | 2Q 15 | 2Q 14 | Change | ||||||||||||||||||||
West Region | |||||||||||||||||||||||||||||
Orange County, CA | 3,757 | $ | 20,531 | $ | 19,369 | 6.0 | % | $ | 4,958 | $ | 5,067 | -2.2 | % | $ | 15,573 | $ | 14,302 | 8.9 | % | ||||||||||
San Francisco, CA | 2,108 | 18,351 | 16,797 | 9.3 | % | 4,154 | 4,106 | 1.2 | % | 14,197 | 12,691 | 11.9 | % | ||||||||||||||||
Seattle, WA | 1,727 | 9,253 | 8,724 | 6.1 | % | 2,613 | 2,540 | 2.9 | % | 6,640 | 6,184 | 7.4 | % | ||||||||||||||||
Los Angeles, CA | 1,225 | 8,617 | 8,131 | 6.0 | % | 2,267 | 2,524 | -10.2 | % | 6,350 | 5,607 | 13.2 | % | ||||||||||||||||
Monterey Peninsula, CA | 1,565 | 5,999 | 5,464 | 9.8 | % | 1,603 | 1,605 | -0.2 | % | 4,396 | 3,859 | 13.9 | % | ||||||||||||||||
Other Southern CA | 875 | 4,129 | 3,915 | 5.5 | % | 1,140 | 1,170 | -2.6 | % | 2,989 | 2,745 | 8.9 | % | ||||||||||||||||
Portland, OR | 476 | 1,766 | 1,604 | 10.1 | % | 511 | 496 | 3.1 | % | 1,255 | 1,108 | 13.2 | % | ||||||||||||||||
11,733 | 68,646 | 64,004 | 7.3 | % | 17,246 | 17,508 | -1.5 | % | 51,400 | 46,496 | 10.5 | % | |||||||||||||||||
Mid-Atlantic Region | |||||||||||||||||||||||||||||
Metropolitan DC | 4,568 | 25,523 | 24,997 | 2.1 | % | 8,091 | 7,788 | 3.9 | % | 17,432 | 17,209 | 1.3 | % | ||||||||||||||||
Baltimore, MD | 2,300 | 10,028 | 9,807 | 2.3 | % | 2,888 | 2,811 | 2.7 | % | 7,140 | 6,996 | 2.1 | % | ||||||||||||||||
Richmond, VA | 1,358 | 4,879 | 4,800 | 1.6 | % | 1,196 | 1,162 | 2.9 | % | 3,683 | 3,638 | 1.3 | % | ||||||||||||||||
Norfolk, VA | 846 | 2,606 | 2,543 | 2.5 | % | 863 | 837 | 3.1 | % | 1,743 | 1,706 | 2.2 | % | ||||||||||||||||
Other Mid-Atlantic | 168 | 501 | 497 | 0.9 | % | 196 | 183 | 7.0 | % | 305 | 314 | -2.7 | % | ||||||||||||||||
9,240 | 43,537 | 42,644 | 2.1 | % | 13,234 | 12,781 | 3.5 | % | 30,303 | 29,863 | 1.5 | % | |||||||||||||||||
Southeast Region | |||||||||||||||||||||||||||||
Tampa, FL | 2,499 | 8,641 | 8,159 | 5.9 | % | 3,051 | 2,894 | 5.4 | % | 5,590 | 5,265 | 6.2 | % | ||||||||||||||||
Orlando, FL | 2,500 | 7,991 | 7,458 | 7.2 | % | 2,484 | 2,379 | 4.5 | % | 5,507 | 5,079 | 8.4 | % | ||||||||||||||||
Nashville, TN | 2,260 | 7,277 | 6,964 | 4.5 | % | 2,175 | 2,144 | 1.4 | % | 5,102 | 4,820 | 5.8 | % | ||||||||||||||||
Other Florida | 636 | 2,631 | 2,482 | 6.0 | % | 954 | 877 | 8.8 | % | 1,677 | 1,605 | 4.5 | % | ||||||||||||||||
7,895 | 26,540 | 25,063 | 5.9 | % | 8,664 | 8,294 | 4.5 | % | 17,876 | 16,769 | 6.6 | % | |||||||||||||||||
Northeast Region | |||||||||||||||||||||||||||||
New York, NY | 1,205 | 13,481 | 12,753 | 5.7 | % | 3,020 | 2,851 | 5.9 | % | 10,461 | 9,902 | 5.6 | % | ||||||||||||||||
Boston, MA | 1,179 | 7,955 | 7,541 | 5.5 | % | 2,147 | 1,984 | 8.2 | % | 5,808 | 5,557 | 4.5 | % | ||||||||||||||||
2,384 | 21,436 | 20,294 | 5.6 | % | 5,167 | 4,835 | 6.9 | % | 16,269 | 15,459 | 5.2 | % | |||||||||||||||||
Southwest Region | |||||||||||||||||||||||||||||
Dallas, TX | 2,725 | 9,365 | 8,954 | 4.6 | % | 3,260 | 3,393 | -3.9 | % | 6,105 | 5,561 | 9.8 | % | ||||||||||||||||
Austin, TX | 1,273 | 4,997 | 4,669 | 7.0 | % | 2,105 | 1,967 | 7.1 | % | 2,892 | 2,702 | 7.0 | % | ||||||||||||||||
3,998 | 14,362 | 13,623 | 5.4 | % | 5,365 | 5,360 | 0.1 | % | 8,997 | 8,263 | 8.9 | % | |||||||||||||||||
Totals | 35,250 | $ | 174,521 | $ | 165,628 | 5.4 | % | $ | 49,676 | $ | 48,778 | 1.8 | % | $ | 124,845 | $ | 116,850 | 6.8 | % | ||||||||||
(1) See Attachment 16 for definitions and other terms. | |||||||||||||||||||||||||||||
15
| |||||||||||||||||||
Attachment 8(C) | |||||||||||||||||||
UDR, Inc. | |||||||||||||||||||
Same-Store Operating Information By Major Market (1) | |||||||||||||||||||
Current Quarter vs. Last Quarter | |||||||||||||||||||
June 30, 2015 | |||||||||||||||||||
(Unaudited) | |||||||||||||||||||
Total | Same-Store | ||||||||||||||||||
Same-Store | Physical Occupancy | Total Revenue per Occupied Home | |||||||||||||||||
Homes | 2Q 15 | 1Q 15 | Change | 2Q 15 | 1Q 15 | Change | |||||||||||||
West Region | |||||||||||||||||||
Orange County, CA | 3,757 | 95.9 | % | 96.1 | % | -0.2 | % | $ | 1,899 | $ | 1,867 | 1.7 | % | ||||||
San Francisco, CA | 2,108 | 97.1 | % | 97.3 | % | -0.2 | % | 2,988 | 2,890 | 3.4 | % | ||||||||
Seattle, WA | 1,727 | 97.3 | % | 97.3 | % | 0.0 | % | 1,836 | 1,791 | 2.5 | % | ||||||||
Los Angeles, CA | 1,225 | 95.6 | % | 95.0 | % | 0.6 | % | 2,453 | 2,393 | 2.5 | % | ||||||||
Monterey Peninsula, CA | 1,565 | 97.5 | % | 97.1 | % | 0.4 | % | 1,311 | 1,266 | 3.6 | % | ||||||||
Other Southern CA | 875 | 96.5 | % | 96.5 | % | 0.0 | % | 1,630 | 1,608 | 1.4 | % | ||||||||
Portland, OR | 476 | 97.5 | % | 98.4 | % | -0.9 | % | 1,268 | 1,226 | 3.4 | % | ||||||||
11,733 | 96.6 | % | 96.6 | % | 0.0 | % | 2,019 | 1,968 | 2.5 | % | |||||||||
Mid-Atlantic Region | |||||||||||||||||||
Metropolitan DC | 4,568 | 96.8 | % | 96.7 | % | 0.1 | % | 1,924 | 1,893 | 1.6 | % | ||||||||
Baltimore, MD | 2,300 | 97.3 | % | 97.0 | % | 0.3 | % | 1,494 | 1,478 | 1.1 | % | ||||||||
Richmond, VA | 1,358 | 96.9 | % | 95.9 | % | 1.0 | % | 1,236 | 1,224 | 1.0 | % | ||||||||
Norfolk, VA | 846 | 95.3 | % | 94.6 | % | 0.7 | % | 1,077 | 1,063 | 1.3 | % | ||||||||
Other Mid-Atlantic | 168 | 95.9 | % | 94.7 | % | 1.2 | % | 1,034 | 1,010 | 2.4 | % | ||||||||
9,240 | 96.8 | % | 96.4 | % | 0.4 | % | 1,623 | 1,601 | 1.4 | % | |||||||||
Southeast Region | |||||||||||||||||||
Tampa, FL | 2,499 | 97.1 | % | 97.0 | % | 0.1 | % | 1,187 | 1,166 | 1.8 | % | ||||||||
Orlando, FL | 2,500 | 97.0 | % | 96.6 | % | 0.4 | % | 1,098 | 1,070 | 2.6 | % | ||||||||
Nashville, TN | 2,260 | 97.3 | % | 97.1 | % | 0.2 | % | 1,103 | 1,085 | 1.7 | % | ||||||||
Other Florida | 636 | 96.6 | % | 96.8 | % | -0.2 | % | 1,427 | 1,401 | 1.9 | % | ||||||||
7,895 | 97.1 | % | 96.9 | % | 0.2 | % | 1,154 | 1,131 | 2.0 | % | |||||||||
Northeast Region | |||||||||||||||||||
New York, NY | 1,205 | 98.0 | % | 97.9 | % | 0.1 | % | 3,805 | 3,712 | 2.5 | % | ||||||||
Boston, MA | 1,179 | 97.1 | % | 95.9 | % | 1.2 | % | 2,316 | 2,286 | 1.3 | % | ||||||||
2,384 | 97.6 | % | 96.9 | % | 0.7 | % | 3,072 | 3,014 | 1.9 | % | |||||||||
Southwest Region | |||||||||||||||||||
Dallas, TX | 2,725 | 97.0 | % | 97.1 | % | -0.1 | % | 1,181 | 1,162 | 1.6 | % | ||||||||
Austin, TX | 1,273 | 97.3 | % | 97.0 | % | 0.3 | % | 1,345 | 1,318 | 2.0 | % | ||||||||
3,998 | 97.1 | % | 97.1 | % | 0.0 | % | 1,233 | 1,212 | 1.7 | % | |||||||||
Total/Weighted Avg. | 35,250 | 96.9 | % | 96.7 | % | 0.2 | % | $ | 1,703 | $ | 1,669 | 2.0 | % | ||||||
(1) See Attachment 16 for definitions and other terms. | |||||||||||||||||||
16
| |||||||||||||||||||||||||||||
Attachment 8(D) | |||||||||||||||||||||||||||||
UDR, Inc. | |||||||||||||||||||||||||||||
Same-Store Operating Information By Major Market (1) | |||||||||||||||||||||||||||||
Current Quarter vs. Last Quarter | |||||||||||||||||||||||||||||
June 30, 2015 | |||||||||||||||||||||||||||||
(Unaudited) | |||||||||||||||||||||||||||||
Total | Same-Store ($000s) | ||||||||||||||||||||||||||||
Same-Store | Revenues | Expenses | Net Operating Income | ||||||||||||||||||||||||||
Homes | 2Q 15 | 1Q 15 | Change | 2Q 15 | 1Q 15 | Change | 2Q 15 | 1Q 15 | Change | ||||||||||||||||||||
West Region | |||||||||||||||||||||||||||||
Orange County, CA | 3,757 | $ | 20,531 | $ | 20,220 | 1.5 | % | $ | 4,958 | $ | 5,017 | -1.2 | % | $ | 15,573 | $ | 15,203 | 2.4 | % | ||||||||||
San Francisco, CA | 2,108 | 18,351 | 17,780 | 3.2 | % | 4,154 | 4,218 | -1.5 | % | 14,197 | 13,562 | 4.7 | % | ||||||||||||||||
Seattle, WA | 1,727 | 9,253 | 9,028 | 2.5 | % | 2,613 | 2,554 | 2.3 | % | 6,640 | 6,474 | 2.6 | % | ||||||||||||||||
Los Angeles, CA | 1,225 | 8,617 | 8,354 | 3.1 | % | 2,267 | 2,396 | -5.4 | % | 6,350 | 5,958 | 6.6 | % | ||||||||||||||||
Monterey Peninsula, CA | 1,565 | 5,999 | 5,772 | 3.9 | % | 1,603 | 1,650 | -2.9 | % | 4,396 | 4,122 | 6.7 | % | ||||||||||||||||
Other Southern CA | 875 | 4,129 | 4,072 | 1.4 | % | 1,140 | 1,076 | 6.0 | % | 2,989 | 2,996 | -0.2 | % | ||||||||||||||||
Portland, OR | 476 | 1,766 | 1,723 | 2.5 | % | 511 | 439 | 16.4 | % | 1,255 | 1,284 | -2.3 | % | ||||||||||||||||
11,733 | 68,646 | 66,949 | 2.5 | % | 17,246 | 17,350 | -0.6 | % | 51,400 | 49,599 | 3.6 | % | |||||||||||||||||
Mid-Atlantic Region | |||||||||||||||||||||||||||||
Metropolitan DC | 4,568 | 25,523 | 25,085 | 1.7 | % | 8,091 | 8,156 | -0.8 | % | 17,432 | 16,929 | 3.0 | % | ||||||||||||||||
Baltimore, MD | 2,300 | 10,028 | 9,893 | 1.4 | % | 2,888 | 2,961 | -2.5 | % | 7,140 | 6,932 | 3.0 | % | ||||||||||||||||
Richmond, VA | 1,358 | 4,879 | 4,783 | 2.0 | % | 1,196 | 1,291 | -7.3 | % | 3,683 | 3,492 | 5.5 | % | ||||||||||||||||
Norfolk, VA | 846 | 2,606 | 2,552 | 2.1 | % | 863 | 909 | -5.0 | % | 1,743 | 1,643 | 6.1 | % | ||||||||||||||||
Other Mid-Atlantic | 168 | 501 | 482 | 3.8 | % | 196 | 190 | 3.1 | % | 305 | 292 | 4.2 | % | ||||||||||||||||
9,240 | 43,537 | 42,795 | 1.7 | % | 13,234 | 13,507 | -2.0 | % | 30,303 | 29,288 | 3.5 | % | |||||||||||||||||
Southeast Region | |||||||||||||||||||||||||||||
Tampa, FL | 2,499 | 8,641 | 8,482 | 1.9 | % | 3,051 | 2,997 | 1.8 | % | 5,590 | 5,485 | 1.9 | % | ||||||||||||||||
Orlando, FL | 2,500 | 7,991 | 7,751 | 3.1 | % | 2,484 | 2,435 | 2.0 | % | 5,507 | 5,316 | 3.6 | % | ||||||||||||||||
Nashville, TN | 2,260 | 7,277 | 7,145 | 1.8 | % | 2,175 | 2,316 | -6.1 | % | 5,102 | 4,829 | 5.7 | % | ||||||||||||||||
Other Florida | 636 | 2,631 | 2,587 | 1.7 | % | 954 | 886 | 7.7 | % | 1,677 | 1,701 | -1.4 | % | ||||||||||||||||
7,895 | 26,540 | 25,965 | 2.2 | % | 8,664 | 8,634 | 0.3 | % | 17,876 | 17,331 | 3.1 | % | |||||||||||||||||
Northeast Region | |||||||||||||||||||||||||||||
New York, NY | 1,205 | 13,481 | 13,138 | 2.6 | % | 3,020 | 2,924 | 3.3 | % | 10,461 | 10,214 | 2.4 | % | ||||||||||||||||
Boston, MA | 1,179 | 7,955 | 7,754 | 2.6 | % | 2,147 | 2,402 | -10.6 | % | 5,808 | 5,352 | 8.5 | % | ||||||||||||||||
2,384 | 21,436 | 20,892 | 2.6 | % | 5,167 | 5,326 | -3.0 | % | 16,269 | 15,566 | 4.5 | % | |||||||||||||||||
Southwest Region | |||||||||||||||||||||||||||||
Dallas, TX | 2,725 | 9,365 | 9,223 | 1.5 | % | 3,260 | 3,467 | -6.0 | % | 6,105 | 5,756 | 6.1 | % | ||||||||||||||||
Austin, TX | 1,273 | 4,997 | 4,884 | 2.3 | % | 2,105 | 2,104 | 0.1 | % | 2,892 | 2,780 | 3.9 | % | ||||||||||||||||
3,998 | 14,362 | 14,107 | 1.8 | % | 5,365 | 5,571 | -3.7 | % | 8,997 | 8,536 | 5.4 | % | |||||||||||||||||
Total | 35,250 | $ | 174,521 | $ | 170,708 | 2.2 | % | $ | 49,676 | $ | 50,388 | -1.4 | % | $ | 124,845 | $ | 120,320 | 3.8 | % | ||||||||||
(1) See Attachment 16 for definitions and other terms. | |||||||||||||||||||||||||||||
17
| ||||||||||||||||||||||
Attachment 8(E) | ||||||||||||||||||||||
UDR, Inc. | ||||||||||||||||||||||
Same-Store Operating Information By Major Market (1) | ||||||||||||||||||||||
Current Year-to-Date vs. Prior Year-to-Date | ||||||||||||||||||||||
June 30, 2015 | ||||||||||||||||||||||
(Unaudited) | ||||||||||||||||||||||
% of Same- | ||||||||||||||||||||||
Total | Store Portfolio | Same-Store | ||||||||||||||||||||
Same-Store | Based on | Physical Occupancy | Total Revenue per Occupied Home | |||||||||||||||||||
Homes | YTD 2015 NOI | YTD 15 | YTD 14 | Change | YTD 15 | YTD 14 | Change | |||||||||||||||
West Region | ||||||||||||||||||||||
Orange County, CA | 3,757 | 12.6 | % | 96.0 | % | 94.9 | % | 1.1 | % | $ | 1,883 | $ | 1,799 | 4.7 | % | |||||||
San Francisco, CA | 2,108 | 11.3 | % | 97.2 | % | 97.0 | % | 0.2 | % | 2,939 | 2,699 | 8.9 | % | |||||||||
Seattle, WA | 1,727 | 5.3 | % | 97.3 | % | 97.3 | % | 0.0 | % | 1,813 | 1,707 | 6.2 | % | |||||||||
Los Angeles, CA | 1,225 | 5.0 | % | 95.3 | % | 95.3 | % | 0.0 | % | 2,423 | 2,310 | 4.9 | % | |||||||||
Monterey Peninsula, CA | 1,565 | 3.5 | % | 97.3 | % | 94.5 | % | 2.8 | % | 1,288 | 1,188 | 8.4 | % | |||||||||
Other Southern CA | 875 | 2.4 | % | 96.5 | % | 95.8 | % | 0.7 | % | 1,619 | 1,531 | 5.7 | % | |||||||||
Portland, OR | 476 | 1.0 | % | 98.0 | % | 97.7 | % | 0.3 | % | 1,247 | 1,139 | 9.5 | % | |||||||||
11,733 | 41.1 | % | 96.6 | % | 95.8 | % | 0.8 | % | 1,993 | 1,874 | 6.3 | % | ||||||||||
Mid-Atlantic Region | ||||||||||||||||||||||
Metropolitan DC | 4,568 | 14.0 | % | 96.8 | % | 96.8 | % | 0.0 | % | 1,908 | 1,870 | 2.0 | % | |||||||||
Baltimore, MD | 2,300 | 5.7 | % | 97.2 | % | 96.8 | % | 0.4 | % | 1,485 | 1,461 | 1.6 | % | |||||||||
Richmond, VA | 1,358 | 2.9 | % | 96.4 | % | 96.6 | % | -0.2 | % | 1,230 | 1,213 | 1.4 | % | |||||||||
Norfolk, VA | 846 | 1.4 | % | 95.0 | % | 94.8 | % | 0.2 | % | 1,070 | 1,043 | 2.6 | % | |||||||||
Other Mid-Atlantic | 168 | 0.2 | % | 95.3 | % | 97.0 | % | -1.7 | % | 1,022 | 1,003 | 1.9 | % | |||||||||
9,240 | 24.2 | % | 96.6 | % | 96.6 | % | 0.0 | % | 1,611 | 1,580 | 2.1 | % | ||||||||||
Southeast Region | ||||||||||||||||||||||
Tampa, FL | 2,499 | 4.5 | % | 97.0 | % | 96.5 | % | 0.5 | % | 1,177 | 1,121 | 5.0 | % | |||||||||
Orlando, FL | 2,500 | 4.6 | % | 96.8 | % | 96.8 | % | 0.0 | % | 1,084 | 1,020 | 6.3 | % | |||||||||
Nashville, TN | 2,260 | 4.1 | % | 97.2 | % | 97.3 | % | -0.1 | % | 1,094 | 1,045 | 4.7 | % | |||||||||
Other Florida | 636 | 1.4 | % | 96.7 | % | 96.4 | % | 0.3 | % | 1,414 | 1,347 | 5.0 | % | |||||||||
7,895 | 14.6 | % | 97.0 | % | 96.8 | % | 0.2 | % | 1,143 | 1,085 | 5.3 | % | ||||||||||
Northeast Region | ||||||||||||||||||||||
New York, NY | 1,205 | 8.4 | % | 98.0 | % | 97.4 | % | 0.6 | % | 3,757 | 3,580 | 4.9 | % | |||||||||
Boston, MA | 1,179 | 4.6 | % | 96.5 | % | 96.4 | % | 0.1 | % | 2,301 | 2,183 | 5.4 | % | |||||||||
2,384 | 13.0 | % | 97.3 | % | 96.9 | % | 0.4 | % | 3,043 | 2,893 | 5.2 | % | ||||||||||
Southwest Region | ||||||||||||||||||||||
Dallas, TX | 2,725 | 4.8 | % | 97.1 | % | 97.1 | % | 0.0 | % | 1,171 | 1,121 | 4.5 | % | |||||||||
Austin, TX | 1,273 | 2.3 | % | 97.1 | % | 96.7 | % | 0.4 | % | 1,332 | 1,259 | 5.8 | % | |||||||||
3,998 | 7.1 | % | 97.1 | % | 97.0 | % | 0.1 | % | 1,222 | 1,165 | 4.9 | % | ||||||||||
Total/Weighted Avg. | 35,250 | 100.0 | % | 96.8 | % | 96.5 | % | 0.3 | % | $ | 1,686 | $ | 1,607 | 4.9 | % | |||||||
(1) See Attachment 16 for definitions and other terms. | ||||||||||||||||||||||
18
| |||||||||||||||||||||||||||||
Attachment 8(F) | |||||||||||||||||||||||||||||
UDR, Inc. | |||||||||||||||||||||||||||||
Same-Store Operating Information By Major Market (1) | |||||||||||||||||||||||||||||
Current Year-to-Date vs. Prior Year-to-Date | |||||||||||||||||||||||||||||
June 30, 2015 | |||||||||||||||||||||||||||||
(Unaudited) | |||||||||||||||||||||||||||||
Total | Same-Store ($000s) | ||||||||||||||||||||||||||||
Same-Store | Revenues | Expenses | Net Operating Income | ||||||||||||||||||||||||||
Homes | YTD 15 | YTD 14 | Change | YTD 15 | YTD 14 | Change | YTD 15 | YTD 14 | Change | ||||||||||||||||||||
West Region | |||||||||||||||||||||||||||||
Orange County, CA | 3,757 | $ | 40,751 | $ | 38,478 | 5.9 | % | $ | 9,975 | $ | 10,305 | -3.2 | % | $ | 30,776 | $ | 28,173 | 9.2 | % | ||||||||||
San Francisco, CA | 2,108 | 36,131 | 33,115 | 9.1 | % | 8,372 | 8,359 | 0.2 | % | 27,759 | 24,756 | 12.1 | % | ||||||||||||||||
Seattle, WA | 1,727 | 18,281 | 17,208 | 6.2 | % | 5,167 | 5,002 | 3.3 | % | 13,114 | 12,206 | 7.4 | % | ||||||||||||||||
Los Angeles, CA | 1,225 | 16,971 | 16,179 | 4.9 | % | 4,663 | 5,055 | -7.8 | % | 12,308 | 11,124 | 10.6 | % | ||||||||||||||||
Monterey Peninsula, CA | 1,565 | 11,771 | 10,545 | 11.6 | % | 3,253 | 3,147 | 3.3 | % | 8,518 | 7,398 | 15.2 | % | ||||||||||||||||
Other Southern CA | 875 | 8,201 | 7,701 | 6.5 | % | 2,216 | 2,320 | -4.5 | % | 5,985 | 5,381 | 11.2 | % | ||||||||||||||||
Portland, OR | 476 | 3,489 | 3,179 | 9.8 | % | 950 | 930 | 2.2 | % | 2,539 | 2,249 | 12.9 | % | ||||||||||||||||
11,733 | 135,595 | 126,405 | 7.3 | % | 34,596 | 35,118 | -1.5 | % | 100,999 | 91,287 | 10.6 | % | |||||||||||||||||
Mid-Atlantic Region | |||||||||||||||||||||||||||||
Metropolitan DC | 4,568 | 50,608 | 49,624 | 2.0 | % | 16,247 | 15,929 | 2.0 | % | 34,361 | 33,695 | 2.0 | % | ||||||||||||||||
Baltimore, MD | 2,300 | 19,921 | 19,520 | 2.1 | % | 5,849 | 5,579 | 4.8 | % | 14,072 | 13,941 | 0.9 | % | ||||||||||||||||
Richmond, VA | 1,358 | 9,662 | 9,549 | 1.2 | % | 2,487 | 2,383 | 4.3 | % | 7,175 | 7,166 | 0.1 | % | ||||||||||||||||
Norfolk, VA | 846 | 5,158 | 5,020 | 2.7 | % | 1,772 | 1,744 | 1.6 | % | 3,386 | 3,276 | 3.3 | % | ||||||||||||||||
Other Mid-Atlantic | 168 | 983 | 981 | 0.3 | % | 386 | 360 | 7.4 | % | 597 | 621 | -3.9 | % | ||||||||||||||||
9,240 | 86,332 | 84,694 | 1.9 | % | 26,741 | 25,995 | 2.9 | % | 59,591 | 58,699 | 1.5 | % | |||||||||||||||||
Southeast Region | |||||||||||||||||||||||||||||
Tampa, FL | 2,499 | 17,123 | 16,218 | 5.6 | % | 6,048 | 5,729 | 5.6 | % | 11,075 | 10,489 | 5.6 | % | ||||||||||||||||
Orlando, FL | 2,500 | 15,742 | 14,809 | 6.3 | % | 4,919 | 4,679 | 5.1 | % | 10,823 | 10,130 | 6.8 | % | ||||||||||||||||
Nashville, TN | 2,260 | 14,422 | 13,792 | 4.6 | % | 4,491 | 4,200 | 6.9 | % | 9,931 | 9,592 | 3.5 | % | ||||||||||||||||
Other Florida | 636 | 5,218 | 4,955 | 5.3 | % | 1,840 | 1,701 | 8.2 | % | 3,378 | 3,254 | 3.8 | % | ||||||||||||||||
7,895 | 52,505 | 49,774 | 5.5 | % | 17,298 | 16,309 | 6.1 | % | 35,207 | 33,465 | 5.2 | % | |||||||||||||||||
Northeast Region | |||||||||||||||||||||||||||||
New York, NY | 1,205 | 26,619 | 25,212 | 5.6 | % | 5,944 | 5,835 | 1.9 | % | 20,675 | 19,377 | 6.7 | % | ||||||||||||||||
Boston, MA | 1,179 | 15,709 | 14,884 | 5.6 | % | 4,549 | 4,257 | 6.9 | % | 11,160 | 10,627 | 5.0 | % | ||||||||||||||||
2,384 | 42,328 | 40,096 | 5.6 | % | 10,493 | 10,092 | 4.0 | % | 31,835 | 30,004 | 6.1 | % | |||||||||||||||||
Southwest Region | |||||||||||||||||||||||||||||
Dallas, TX | 2,725 | 18,588 | 17,789 | 4.5 | % | 6,727 | 6,634 | 1.4 | % | 11,861 | 11,155 | 6.3 | % | ||||||||||||||||
Austin, TX | 1,273 | 9,881 | 9,301 | 6.3 | % | 4,209 | 3,835 | 9.8 | % | 5,672 | 5,466 | 3.8 | % | ||||||||||||||||
3,998 | 28,469 | 27,090 | 5.1 | % | 10,936 | 10,469 | 4.5 | % | 17,533 | 16,621 | 5.5 | % | |||||||||||||||||
Totals | 35,250 | $ | 345,229 | $ | 328,059 | 5.2 | % | $ | 100,064 | $ | 97,983 | 2.1 | % | $ | 245,165 | $ | 230,076 | 6.6 | % | ||||||||||
(1) See Attachment 16 for definitions and other terms. | |||||||||||||||||||||||||||||
19
| ||||||||||||||||
Attachment 8(G) | ||||||||||||||||
UDR, Inc. | ||||||||||||||||
Same-Store Operating Information By Major Market (1) | ||||||||||||||||
June 30, 2015 | ||||||||||||||||
(Unaudited) | ||||||||||||||||
Effective New Lease Rate Growth | Effective Renewal Lease Rate Growth | Annualized Turnover | ||||||||||||||
2Q 2015 | 2Q 2015 | 2Q 2015 | 2Q 2014 | YTD 2015 | YTD 2014 | |||||||||||
West Region | ||||||||||||||||
Orange County, CA | 6.3 | % | 7.1 | % | 65.8 | % | 63.5 | % | 56.0 | % | 57.5 | % | ||||
San Francisco, CA | 14.0 | % | 10.2 | % | 59.4 | % | 58.4 | % | 50.4 | % | 52.9 | % | ||||
Seattle, WA | 11.9 | % | 8.3 | % | 55.5 | % | 57.4 | % | 49.6 | % | 48.1 | % | ||||
Los Angeles, CA | 8.6 | % | 10.1 | % | 51.4 | % | 56.6 | % | 47.1 | % | 49.1 | % | ||||
Monterey Peninsula, CA | 22.2 | % | 10.2 | % | 60.5 | % | 43.3 | % | 48.3 | % | 42.3 | % | ||||
Other Southern CA | 7.7 | % | 5.7 | % | 61.0 | % | 61.0 | % | 54.6 | % | 55.3 | % | ||||
Portland, OR | 16.7 | % | 12.0 | % | 55.6 | % | 67.4 | % | 51.7 | % | 50.0 | % | ||||
60.1 | % | 58.3 | % | 51.8 | % | 51.9 | % | |||||||||
Mid-Atlantic Region | ||||||||||||||||
Metropolitan DC | 2.3 | % | 4.5 | % | 46.6 | % | 43.7 | % | 41.7 | % | 40.3 | % | ||||
Baltimore, MD | 2.5 | % | 4.6 | % | 48.7 | % | 52.8 | % | 42.6 | % | 46.9 | % | ||||
Richmond, VA | 3.3 | % | 5.4 | % | 58.8 | % | 69.7 | % | 52.9 | % | 55.8 | % | ||||
Norfolk, VA | 2.9 | % | 4.9 | % | 51.2 | % | 47.9 | % | 51.0 | % | 53.2 | % | ||||
Other Mid-Atlantic | -3.3 | % | 5.2 | % | 83.6 | % | 59.7 | % | 56.4 | % | 50.4 | % | ||||
50.0 | % | 50.5 | % | 44.7 | % | 45.6 | % | |||||||||
Southeast Region | ||||||||||||||||
Tampa, FL | 6.7 | % | 7.0 | % | 58.9 | % | 58.7 | % | 53.2 | % | 51.7 | % | ||||
Orlando, FL | 7.1 | % | 6.6 | % | 57.3 | % | 50.7 | % | 50.0 | % | 48.3 | % | ||||
Nashville, TN | 5.6 | % | 5.9 | % | 59.6 | % | 55.6 | % | 53.4 | % | 53.4 | % | ||||
Other Florida | 4.6 | % | 5.7 | % | 60.5 | % | 58.0 | % | 45.7 | % | 49.1 | % | ||||
58.7 | % | 55.2 | % | 51.6 | % | 50.9 | % | |||||||||
Northeast Region | ||||||||||||||||
New York, NY | 8.4 | % | 7.0 | % | 46.6 | % | 52.6 | % | 39.0 | % | 43.7 | % | ||||
Boston, MA | 7.1 | % | 6.5 | % | 52.7 | % | 47.6 | % | 44.3 | % | 40.5 | % | ||||
49.6 | % | 50.1 | % | 41.6 | % | 42.1 | % | |||||||||
Southwest Region | ||||||||||||||||
Dallas, TX | 9.0 | % | 6.2 | % | 56.5 | % | 57.6 | % | 52.2 | % | 53.1 | % | ||||
Austin, TX | 3.5 | % | 4.7 | % | 51.7 | % | 54.8 | % | 45.9 | % | 49.3 | % | ||||
55.0 | % | 56.7 | % | 50.2 | % | 51.9 | % | |||||||||
Total/Weighted Avg. | 7.7 | % | 7.0 | % | 55.9 | % | 54.8 | % | 49.0 | % | 49.4 | % | ||||
Percentage of Total Repriced Homes | 52.6 | % | 47.4 | % | ||||||||||||
2Q 2015 | 2Q 2014 | |||||||||||||||
Total Combined New and Renewal Lease Rate Growth | 7.4 | % | 4.5 | % | ||||||||||||
(1) See Attachment 16 for definitions and other terms. | ||||||||||||||||
20
| |||||||||||||||||||||||||||||||||||
Attachment 9(A) | |||||||||||||||||||||||||||||||||||
UDR, Inc. | |||||||||||||||||||||||||||||||||||
Development Summary (1) (2) | |||||||||||||||||||||||||||||||||||
June 30, 2015 | |||||||||||||||||||||||||||||||||||
(Dollars in Thousands) | |||||||||||||||||||||||||||||||||||
(Unaudited) | |||||||||||||||||||||||||||||||||||
Wholly-Owned | |||||||||||||||||||||||||||||||||||
Schedule | Percentage | ||||||||||||||||||||||||||||||||||
# of | Compl. | Cost to | Budgeted | Est. Cost | Project | Initial | |||||||||||||||||||||||||||||
Community | Location | Homes | Homes | Date | Cost | per Home | Debt | Start | Occ. | Compl. | Leased | Occupied | |||||||||||||||||||||||
Projects Under Construction | |||||||||||||||||||||||||||||||||||
Pacific City | Huntington Beach, CA | 516 | — | $ | 92,645 | $ | 342,000 | $ | 663 | $ | — | 2Q15 | 2Q17 | 1Q18 | — | — | |||||||||||||||||||
Total | 516 | — | $ | 92,645 | $ | 342,000 | $ | 663 | $ | — | |||||||||||||||||||||||||
Completed Projects, Non-Stabilized | |||||||||||||||||||||||||||||||||||
100 Pier 4 (3) | Boston, MA | 369 | 369 | $ | 209,946 | $ | 217,700 | $ | 590 | $ | — | 4Q12 | 1Q15 | 2Q15 | 68.8 | % | 56.6 | % | |||||||||||||||||
DelRay Tower (5) | Alexandria, VA | 332 | 332 | 125,522 | 127,000 | 383 | — | 3Q11 | 3Q14 | 4Q14 | 87.1 | % | 82.5 | % | |||||||||||||||||||||
Beach & Ocean | Huntington Beach, CA | 173 | 173 | 51,723 | 51,900 | 300 | — | 3Q12 | 4Q14 | 4Q14 | 98.3 | % | 97.7 | % | |||||||||||||||||||||
Total - Wholly Owned | 1,390 | 874 | $ | 479,836 | $ | 738,600 | $ | 531 | $ | — | |||||||||||||||||||||||||
Net Operating Income From Wholly-Owned Projects | Capitalized Interest for Current Development Projects | ||||||||||||||||||||||||||||||||||
2Q 2015 | 2Q 15 | 2Q 14 | YTD 15 | YTD 14 | |||||||||||||||||||||||||||||||
Projects Under Construction | $ | (9 | ) | $ | 1,347 | $ | 3,157 | $ | 3,763 | $ | 5,792 | ||||||||||||||||||||||||
Completed, Non-Stabilized | 1,127 | ||||||||||||||||||||||||||||||||||
Total | $ | 1,118 | |||||||||||||||||||||||||||||||||
Unconsolidated Joint Ventures and Partnerships | |||||||||||||||||||||||||||||||||||
Schedule | Percentage | ||||||||||||||||||||||||||||||||||
Own. | # of | Compl. | Cost to | Budgeted | Project | Initial | |||||||||||||||||||||||||||||
Community | Location | Interest | Homes | Homes | Date (6) | Cost | Debt | Start | Occ. | Compl. | Leased | Occupied | |||||||||||||||||||||||
Projects Under Construction | |||||||||||||||||||||||||||||||||||
399 Fremont | San Francisco, CA | 51 | % | 447 | — | $ | 204,128 | $ | 317,700 | (7) | $ | 32,734 | 1Q14 | 1Q16 | 3Q16 | — | — | ||||||||||||||||||
Residences at 2801 Kelvin | Irvine, CA | 50 | % | 381 | — | 56,946 | 125,000 | — | 3Q14 | 3Q16 | 1Q17 | — | — | ||||||||||||||||||||||
3033 Wilshire | Los Angeles, CA | 50 | % | 190 | — | 33,931 | 107,000 | (8) | — | 4Q14 | 4Q16 | 1Q17 | — | — | |||||||||||||||||||||
Domain Mountain View | Mountain View, CA | 50 | % | 155 | — | 28,384 | 99,000 | (9) | — | 1Q15 | 1Q17 | 2Q17 | — | — | |||||||||||||||||||||
Total | 1,173 | — | $ | 323,389 | $ | 648,700 | $ | 32,734 | |||||||||||||||||||||||||||
Completed Projects, Non-Stabilized | |||||||||||||||||||||||||||||||||||
N/A | N/A | — | — | — | $ | — | $ | — | $ | — | N/A | N/A | N/A | — | — | ||||||||||||||||||||
Total - Unconsolidated Joint Ventures and Partnerships | 1,173 | — | $ | 323,389 | $ | 648,700 | $ | 32,734 | |||||||||||||||||||||||||||
Projected Weighted Average Stabilized Yield on Development Projects Over Respective Market Cap Rates: | 150-200 bps | ||||||||||||||||||||||||||||||||||
(1) See Attachment 16 for definitions and other terms. | |||||||||||||||||||||||||||||||||||
(2) The development summary above includes all communities under development that UDR wholly owns or owns an interest in through an unconsolidated joint venture. | |||||||||||||||||||||||||||||||||||
(3) The developer will have the opportunity to earn an additional contingent developer fee, which will be determined by meeting a specific revenue hurdle during the 24 months after final completion. | |||||||||||||||||||||||||||||||||||
(4) Includes 11,000 square feet of retail space. | |||||||||||||||||||||||||||||||||||
(5) Project encompasses the complete redevelopment of the former 187 homes combined with the development of an additional 145 homes, 10,000 square feet of retail space and underground parking. | |||||||||||||||||||||||||||||||||||
(6) Cost to Date includes land using the fair value established at joint venture formation versus historical cost and excludes UDR outside basis differences. | |||||||||||||||||||||||||||||||||||
(7) Includes 3,800 square feet of retail space. | |||||||||||||||||||||||||||||||||||
(8) Includes 5,500 square feet of retail space. | |||||||||||||||||||||||||||||||||||
(9) Includes 4,500 square feet of retail space. | |||||||||||||||||||||||||||||||||||
21
| ||||||||||||||||||||||||||||||
Attachment 9(B) | ||||||||||||||||||||||||||||||
UDR, Inc. | ||||||||||||||||||||||||||||||
Preferred Equity and Participating Loan Investments (1) | ||||||||||||||||||||||||||||||
June 30, 2015 | ||||||||||||||||||||||||||||||
(Dollars in Thousands) | ||||||||||||||||||||||||||||||
(Unaudited) | ||||||||||||||||||||||||||||||
Preferred Equity Investments | ||||||||||||||||||||||||||||||
UDR | UDR | |||||||||||||||||||||||||||||
Own. | # of | Compl. | Going-in | Investment | Share of | Schedule | Percentage | |||||||||||||||||||||||
Community | Location | Interest | Homes | Homes | Valuation | Cost | Debt | Start | Compl. | Stabilization | Leased | Occupied | ||||||||||||||||||
Projects Under Construction | ||||||||||||||||||||||||||||||
West Coast Development JV (2) | ||||||||||||||||||||||||||||||
8th & Republican (3)(4) | Seattle, WA | 48 | % | 211 | — | $ | 97,020 | $ | 23,971 | $ | 5,939 | 3Q14 | 1Q16 | 1Q17 | — | — | ||||||||||||||
Katella Grand I | Anaheim, CA | 49 | % | 399 | — | 137,935 | 34,268 | 14,085 | 4Q13 | 1Q16 | 1Q17 | — | — | |||||||||||||||||
CityLine (5) | Seattle, WA | 49 | % | 244 | — | 80,360 | 20,214 | 3,611 | 3Q14 | 2Q16 | 3Q16 | — | — | |||||||||||||||||
12th & Olive (3)(6) | Los Angeles, CA | 47 | % | 293 | — | 129,360 | 33,698 | 6,604 | 2Q14 | 3Q16 | 4Q17 | — | — | |||||||||||||||||
Katella Grand II | Anaheim, CA | 49 | % | 386 | — | 114,660 | 17,441 | (7) | 4,409 | 4Q14 | 2Q17 | 2Q18 | — | — | ||||||||||||||||
Total | 1,533 | — | $ | 559,335 | $ | 129,592 | $ | 34,647 | ||||||||||||||||||||||
Completed Projects, Non-Stabilized | ||||||||||||||||||||||||||||||
N/A | N/A | — | — | — | $ | — | $ | — | $ | — | N/A | N/A | N/A | — | — | |||||||||||||||
Total - Preferred Equity Investments | 1,533 | — | $ | 559,335 | $ | 129,592 | $ | 34,647 | ||||||||||||||||||||||
Participating Loan Investment | ||||||||||||||||||||||||||||||
# of | Compl. | Cost to | Budgeted | Loan | Loan | |||||||||||||||||||||||||
Community | Location | Homes | Homes | Date (10) | Cost | Commitment | Balance (10) | Leased | Occupied | |||||||||||||||||||||
Steele Creek (8)(9) | Denver, CO | 218 | 218 | $ | 102,969 | $ | 108,245 | $ | 92,009 | $ | 85,208 | 50.0 | % | 33.9 | % | |||||||||||||||
Total | 218 | 218 | $ | 102,969 | $ | 108,245 | $ | 92,009 | $ | 85,208 | ||||||||||||||||||||
(1) See Attachment 16 for definitions and other terms. | ||||||||||||||||||||||||||||||
(2) In May 2015, UDR agreed to pay $136 million, net of debt, to acquire a 48% weighted average ownership interest in a $559 million, West Coast Development joint venture consisting of five communities in various stages of construction. UDR receives a 6.5% preferred return on our equity investment cost until stabilization. Our partner assumes all economics until stabilization. Upon stabilization, economics will be shared between UDR and our partner. UDR has the option to purchase each property at a fixed price one year after completion at an all-in option price of $597 million. A community is considered stabilized when it reaches 80% occupancy for ninety consecutive days. | ||||||||||||||||||||||||||||||
(3) A small ownership interest in 8th & Republican and 12th & Olive is held by an additional co-investor. | ||||||||||||||||||||||||||||||
(4) Includes 13,600 square feet of retail space. | ||||||||||||||||||||||||||||||
(5) UDR will have an option to acquire an interest in the second phase that is adjacent to the first phase. | ||||||||||||||||||||||||||||||
(6) Includes 15,500 square feet of retail space. | ||||||||||||||||||||||||||||||
(7) Excludes $6.7 million expected to be funded over the remainder of 2015. | ||||||||||||||||||||||||||||||
(8) Includes 17,000 square feet of retail space. Refer to Attachment 12 for terms of our participating loan investment. | ||||||||||||||||||||||||||||||
(9) UDR's participating loan is reflected as investment in and advances to unconsolidated joint ventures on the Consolidated Balance Sheets and net income/(loss) from unconsolidated entities on the Consolidated Statements of Operations in accordance with GAAP. UDR has the option to purchase the property 25 months after completion of construction and we receive 50% of the value created from the project upon acquisition of the community or sale to a third party. | ||||||||||||||||||||||||||||||
(10) Cost to date includes accruals for costs incurred, but not yet paid as of the end of the period. Loan balance includes only amounts funded plus interest accrued at 6.5% prior to the period end. | ||||||||||||||||||||||||||||||
22
| ||||||||||||||||||||||||||||||||||
Attachment 10 | ||||||||||||||||||||||||||||||||||
UDR, Inc. | ||||||||||||||||||||||||||||||||||
Redevelopment Summary (1) | ||||||||||||||||||||||||||||||||||
June 30, 2015 | ||||||||||||||||||||||||||||||||||
(Dollars in Thousands) | ||||||||||||||||||||||||||||||||||
(Unaudited) | ||||||||||||||||||||||||||||||||||
Wholly-Owned | ||||||||||||||||||||||||||||||||||
Sched. | ||||||||||||||||||||||||||||||||||
# of | Redev. | Compl. | Cost to | Budgeted | Est. Cost | Schedule | Percentage | |||||||||||||||||||||||||||
Community | Location | Homes | Homes | Homes | Date | Cost (2) | per Home | Acq. | Start | Compl. | Same-Store (3) | Leased | Occupied | |||||||||||||||||||||
Projects in Redevelopment | ||||||||||||||||||||||||||||||||||
2000 Post | San Francisco, CA | 328 | (4) | (4) | $ | 4,854 | $ | 15,000 | (4) | 4Q98 | 1Q15 | 1Q16 | 1Q17 | 93.9 | % | 92.4 | % | |||||||||||||||||
Total | 328 | — | — | $ | 4,854 | $ | 15,000 | $ | — | |||||||||||||||||||||||||
Completed Redevelopments, Non-Stabilized | ||||||||||||||||||||||||||||||||||
N/A | N/A | — | — | — | $ | — | $ | — | $ | — | N/A | N/A | N/A | N/A | — | — | ||||||||||||||||||
Total - Wholly Owned | 328 | — | — | $ | 4,854 | $ | 15,000 | $ | — | |||||||||||||||||||||||||
Capitalized Interest for Current Redevelopment Projects | ||||||||||||||||||||||||||||||||||
2Q 15 | 2Q 14 | YTD 15 | YTD 14 | |||||||||||||||||||||||||||||||
Projected Weighted Average Return on Incremental Capital Invested: | 7.0% to 9.0% | $ | 24 | $ | — | $ | 39 | $ | — | |||||||||||||||||||||||||
(1) See Attachment 16 for definitions and other terms. | ||||||||||||||||||||||||||||||||||
(2) Represents UDR's incremental capital invested in the projects. | ||||||||||||||||||||||||||||||||||
(3) Estimated Same-Store quarter represents the quarter UDR anticipates contributing the community to the QTD same-store pool. | ||||||||||||||||||||||||||||||||||
(4) 2000 Post redevelopment project will not impact the individual homes. The project includes renovation of building exteriors, corridors, and common area amenities. | ||||||||||||||||||||||||||||||||||
23
| |||||||||||
Attachment 11 | |||||||||||
UDR, Inc. | |||||||||||
Land Summary (1) | |||||||||||
June 30, 2015 | |||||||||||
(Dollars in Thousands) | |||||||||||
(Unaudited) | |||||||||||
UDR Ownership | Real Estate | UDR Pro-Rata | |||||||||
Parcel | Location | Interest | Cost Basis | Cost Basis | Status Update (2) | ||||||
Pursuing | Design | Hold for Future | |||||||||
Entitlements | Development | Development | |||||||||
Wholly-Owned | |||||||||||
7 Harcourt (3) | Boston, MA | 100% | $ | 6,020 | $ | 6,020 | Complete | In Process | |||
Vitruvian Park® | Addison, TX | 100% | 13,784 | 13,784 | Complete | In Process | |||||
Graybar | Boston, MA | 100% | 35,939 | 35,939 | Complete | In Process | |||||
Total | $ | 55,743 | $ | 55,743 | |||||||
Real Estate | UDR Pro-Rata | ||||||||||
Cost Basis | Cost Basis | ||||||||||
Consolidated Joint Ventures | |||||||||||
3032 Wilshire | Santa Monica, CA | 95% | $ | 12,570 | $ | 11,942 | In Process | ||||
2919 Wilshire | Santa Monica, CA | 95% | 8,306 | 7,891 | In Process | ||||||
Total | $ | 20,876 | $ | 19,833 | |||||||
Real Estate | UDR Pro-Rata | ||||||||||
Cost Basis (4) | Cost Basis (4) | ||||||||||
Unconsolidated Joint Ventures and Partnerships | |||||||||||
UDR/MetLife I - 3 parcels (5) | Various | 5% | $ | 70,441 | $ | 3,463 | In Process | In Process | |||
UDR/MetLife Land - 8 parcels (6) | Various | 50% | 86,514 | 43,274 | Complete | In Process | In Process | ||||
Total | $ | 156,955 | $ | 46,737 | |||||||
Total | $ | 233,574 | $ | 122,313 | |||||||
(1) See Attachment 16 for definitions and other terms. | |||||||||||
(2) Pursuing Entitlements: During this phase the Company is actively pursuing the necessary approvals for the rights to develop multifamily and/or mixed use communities. | |||||||||||
Design Development: During this phase the Company is actively working to complete architectural and engineering documents in preparation for the commencement of construction of multifamily and/or mixed uses communities. | |||||||||||
Hold for Future Development: Entitled and/or unentitled land sites that the Company holds for future development. | |||||||||||
(3) Land is adjacent to UDR's Garrison Square community. | |||||||||||
(4) Cost basis includes land using the fair value established at joint venture formation versus historical cost and excludes UDR outside basis differences. | |||||||||||
(5) Parcels are located in Bellevue, WA; Los Angeles, CA; and Dublin, CA. | |||||||||||
(6) Includes 6 parcels in Addison, TX and 2 parcels in Los Angeles, CA. | |||||||||||
24
| |||||||||||||||||||||||||
Attachment 12 | |||||||||||||||||||||||||
UDR, Inc. | |||||||||||||||||||||||||
Unconsolidated Joint Venture Summary (1) | |||||||||||||||||||||||||
June 30, 2015 | |||||||||||||||||||||||||
(Dollars in Thousands) | |||||||||||||||||||||||||
(Unaudited) | |||||||||||||||||||||||||
Portfolio Characteristics | |||||||||||||||||||||||||
# of | Physical | Total Rev. per | Net Operating Income | ||||||||||||||||||||||
Property | Comm. / | # of | Own. | Occupancy | Occ. Home | UDR's Share | Total | ||||||||||||||||||
Joint Venture and Partnerships | Type | Parcels | Homes (9) | Interest | 2Q 15 | 2Q 15 (1) | 2Q 2015 | YTD 2015 | YTD 2015 (2) | ||||||||||||||||
UDR / MetLife | |||||||||||||||||||||||||
Operating communities | Various | 23 | 5,381 | 50 | % | 96.2 | % | $ | 2,915 | $ | 15,646 | $ | 31,445 | $ | 62,890 | ||||||||||
Stabilized, Non-Mature | Various | 2 | 655 | (3) | 91.9 | % | 2,148 | 1,081 | 2,229 | 4,408 | |||||||||||||||
Development communities | Various | 4 | — | (4) | — | — | (5 | ) | (13 | ) | (27 | ) | |||||||||||||
Land parcels | 11 | — | (5) | — | — | (28 | ) | (51 | ) | (192 | ) | ||||||||||||||
UDR / KFH | High-rise | 3 | 660 | 30 | % | 95.9 | % | 2,536 | 1,023 | 2,061 | 6,869 | ||||||||||||||
Total/Weighted Average | 43 | 6,696 | 96.2 | % | $ | 2,817 | $ | 17,717 | $ | 35,671 | $ | 73,948 | |||||||||||||
Balance Sheet Characteristics and Returns | |||||||||||||||||||||||||
Gross Book Value | Weighted | ||||||||||||||||||||||||
of JV Real | Total | UDR's Equity | Avg. Debt | Debt | Returns (8) | ||||||||||||||||||||
Joint Venture and Partnerships | Estate Assets (6) | Project Debt (6) | Investment (7) | Interest Rate | Maturity | ROIC | ROE | ||||||||||||||||||
UDR / MetLife | |||||||||||||||||||||||||
Operating communities | $ | 2,349,770 | $ | 1,212,651 | $ | 444,814 | 4.4 | % | 2018-2023 | ||||||||||||||||
Stabilized, Non-Mature | 182,318 | 119,510 | 25,844 | 2.9 | % | 2017-2025 | |||||||||||||||||||
Development communities | 335,583 | 32,734 | 141,749 | 2.1 | % | 2018 | |||||||||||||||||||
Land parcels | 176,558 | — | 63,798 | N/A | N/A | ||||||||||||||||||||
UDR / KFH | 283,917 | 164,829 | 19,775 | 3.0 | % | 2016-2025 | |||||||||||||||||||
Total/Weighted Average | $ | 3,328,146 | $ | 1,529,724 | $ | 695,980 | 4.1 | % | 5.9 | % | 7.7 | % | |||||||||||||
Same-Store Unconsolidated Joint Venture Growth | |||||||||||||||||||||||||
Same-Store | |||||||||||||||||||||||||
Joint Venture | 2Q 2015 vs. 2Q 2014 Growth | 2Q 2015 vs. 1Q 2015 Growth | |||||||||||||||||||||||
Joint Venture | Communities (6) | Revenue | Expense | NOI | Revenue | Expense | NOI | ||||||||||||||||||
UDR / MetLife | 23 | 4.7 | % | 11.3 | % | 1.7 | % | 1.9 | % | 8.1 | % | -1.0 | % | ||||||||||||
UDR / KFH | 3 | -2.6 | % | 7.7 | % | -6.3 | % | -0.7 | % | 1.2 | % | -1.4 | % | ||||||||||||
Total/Average | 26 | 4.0 | % | 10.9 | % | 0.9 | % | 1.6 | % | 7.5 | % | -1.0 | % | ||||||||||||
NOI | NOI | ||||||||||||||||||||||||
Same-Store JV Results at UDR's Pro-rata Ownership Interest | 1.2 | % | -1.0 | % | |||||||||||||||||||||
Same-Store | |||||||||||||||||||||||||
Joint Venture | YTD 2015 vs. YTD 2014 Growth | ||||||||||||||||||||||||
Joint Venture | Communities (6) | Revenue | Expense | NOI | |||||||||||||||||||||
UDR / MetLife | 23 | 4.6 | % | 5.4 | % | 4.1 | % | ||||||||||||||||||
UDR / KFH | 3 | -1.6 | % | 5.0 | % | -4.1 | % | ||||||||||||||||||
Total/Average | 26 | 3.9 | % | 5.4 | % | 3.2 | % | ||||||||||||||||||
NOI | |||||||||||||||||||||||||
Same-Store JV Results at UDR's Pro-rata Ownership Interest | 3.6 | % | |||||||||||||||||||||||
Participating Loan Investment | Income from Participating | ||||||||||||||||||||||||
Interest | Years to | Loan Investment | Upside | ||||||||||||||||||||||
UDR's Investment | Rate | Maturity | 2Q 2015 | YTD 2015 | Participation | ||||||||||||||||||||
Steele Creek (10) | $ | 85,208 | 6.5 | % | 2.1 | $ | 1,352 | $ | 2,506 | 50 | % | ||||||||||||||
Preferred Equity Investment | Income from Preferred | ||||||||||||||||||||||||
UDR's Equity | Preferred | Equity Investment (12) | |||||||||||||||||||||||
Investment (11) | Return | 2Q 2015 | YTD 2015 | ||||||||||||||||||||||
West Coast Development JV (10) | $ | 133,627 | 6.5 | % | $ | 952 | $ | 952 | |||||||||||||||||
(1) See Attachment 16 for definitions and other terms. | |||||||||||||||||||||||||
(2) Represents NOI at 100 percent for the period ended June 30, 2015. | |||||||||||||||||||||||||
(3) Includes Fiori on Vitruvian Park® of which UDR owns 50.0% and 13th & Market of which UDR owns 51.0%. | |||||||||||||||||||||||||
(4) Includes 399 Fremont of which UDR owns 51.0%, Residences at 2801 Kelvin of which UDR owns 50.1%, 3033 Wilshire of which UDR owns 50.0% and Domain Mountain View of which UDR owns 50.1%. | |||||||||||||||||||||||||
(5) See summary of unconsolidated land parcels on Attachment 11. | |||||||||||||||||||||||||
(6) Joint ventures and partnerships represented at 100 percent. | |||||||||||||||||||||||||
(7) Includes deferred fees, which are netted in "Investments in and advances to unconsolidated joint ventures, net" on Attachment 3. | |||||||||||||||||||||||||
(8) Excludes non-stabilized developments. | |||||||||||||||||||||||||
(9) Includes homes completed for the period ended June 30, 2015. | |||||||||||||||||||||||||
(10) See Attachment 9(B) for additional details of our participating loan and preferred equity investments. | |||||||||||||||||||||||||
(11) UDR's equity investment of $133.6 million is inclusive of outside basis and our preferred return, which differs from our upfront investment cost of $129.6 million in Attachment 9(B). | |||||||||||||||||||||||||
(12) Excludes $1.5 million of acquisition-related costs related to UDR's share of the West Coast Development joint venture's transaction expenses. | |||||||||||||||||||||||||
25
| |||||||||||||||||||||
Attachment 13 | |||||||||||||||||||||
UDR, Inc. | |||||||||||||||||||||
Acquisitions and Dispositions Summary | |||||||||||||||||||||
June 30, 2015 | |||||||||||||||||||||
(Dollars in Thousands) | |||||||||||||||||||||
(Unaudited) | |||||||||||||||||||||
Post | |||||||||||||||||||||
Prior | Transaction | ||||||||||||||||||||
Ownership | Ownership | # of | Price per | ||||||||||||||||||
Date of Purchase | Community | Location | Interest | Interest | Price (1) | Debt (1) | Homes | Home | |||||||||||||
Acquisitions - Wholly-Owned | |||||||||||||||||||||
Feb-15 | 1745 Shea Center I (2) | Highlands Ranch, CO | 0% | 100% | $ | 24,059 | $ | 24,059 | — | $ | — | ||||||||||
$ | 24,059 | $ | 24,059 | — | $ | — | |||||||||||||||
Acquisitions - Wholly-Owned Land | |||||||||||||||||||||
None | |||||||||||||||||||||
Acquisitions - Joint Ventures | |||||||||||||||||||||
May-15 | West Coast Development JV | Various | 0% | 48% | $ | 559,335 | $ | 277,476 | (3 | ) | 1,533 | $ | 365 | ||||||||
$ | 559,335 | $ | 277,476 | 1,533 | $ | 365 | |||||||||||||||
Acquisitions - Joint Ventures - Land | |||||||||||||||||||||
None | |||||||||||||||||||||
Post | |||||||||||||||||||||
Prior | Transaction | ||||||||||||||||||||
Ownership | Ownership | # of | Price per | ||||||||||||||||||
Date of Sale | Community | Location | Interest | Interest | Price (1) | Debt (1) | Homes | Home | |||||||||||||
Dispositions - Wholly-Owned | |||||||||||||||||||||
May-15 | Bay Meadows | Clearwater, FL | 100% | 0% | $ | 34,150 | $ | — | 276 | $ | 124 | ||||||||||
Jun-15 | The Canopy Apartment Villas | Orlando, FL | 100% | 0% | 30,540 | — | 296 | 103 | |||||||||||||
Jun-15 | Andover Park | Beaverton, OR | 100% | 0% | 45,250 | 16,818 | 240 | 189 | |||||||||||||
$ | 109,940 | $ | 16,818 | 812 | $ | 135 | |||||||||||||||
Dispositions - Joint Ventures | |||||||||||||||||||||
Jan-15 | Texas JV - 8 operating communities | Various | 20% | 0% | $ | 400,300 | $ | 219,588 | 3,359 | $ | 119 | ||||||||||
$ | 400,300 | $ | 219,588 | 3,359 | $ | 119 | |||||||||||||||
Dispositions - Wholly-Owned Land | |||||||||||||||||||||
None | |||||||||||||||||||||
Dispositions - Joint Ventures Land | |||||||||||||||||||||
None | |||||||||||||||||||||
(1) Price represents 100% of the value of assets. Debt represents 100% of the asset's indebtedness. | |||||||||||||||||||||
(2) Includes approximately 120,000 square feet of office space, which is 37% occupied by UDR's corporate headquarters. | |||||||||||||||||||||
(3) Debt represents maximum debt of the joint venture at 100% upon completion of construction. See Attachment 9(B) for additional details. | |||||||||||||||||||||
26
| ||||||||||||||||||||
Attachment 14 | ||||||||||||||||||||
UDR, Inc. | ||||||||||||||||||||
Capital Expenditure and Repair and Maintenance Summary (1) | ||||||||||||||||||||
June 30, 2015 | ||||||||||||||||||||
(Dollars in Thousands) | ||||||||||||||||||||
(Unaudited) | ||||||||||||||||||||
Three Months | Six Months | |||||||||||||||||||
Weighted Avg. | Ended | Cost | Ended | Cost | ||||||||||||||||
Category (Capitalized) | Useful Life (yrs) (2) | June 30, 2015 | per Home | June 30, 2015 | per Home | |||||||||||||||
Capital Expenditures for Consolidated Homes (3) | ||||||||||||||||||||
Average number of homes (4) | 38,980 | 39,163 | ||||||||||||||||||
Recurring Cap Ex | ||||||||||||||||||||
Asset preservation | ||||||||||||||||||||
Building interiors | 5 - 20 | $ | 3,683 | $ | 94 | $ | 6,407 | $ | 164 | |||||||||||
Building exteriors | 5 - 20 | 2,543 | 65 | 4,319 | 110 | |||||||||||||||
Landscaping and grounds | 10 | 1,031 | 26 | 1,546 | 39 | |||||||||||||||
Total asset preservation | 7,257 | 185 | 12,272 | 313 | ||||||||||||||||
Turnover related | 5 | 2,854 | 73 | 5,082 | 130 | |||||||||||||||
Total Recurring Cap Ex | 10,111 | 258 | 17,354 | 443 | ||||||||||||||||
Revenue Enhancing Cap Ex (5) | ||||||||||||||||||||
Kitchen & Bath | 3,018 | 77 | 4,745 | 121 | ||||||||||||||||
Revenue Enhancing | 7,983 | 205 | 12,562 | 321 | ||||||||||||||||
Total Revenue Enhancing Cap Ex | 5 - 20 | 11,001 | 282 | 17,307 | 442 | |||||||||||||||
Total Recurring and Revenue Enhancing Cap Ex | $ | 21,112 | $ | 540 | $ | 34,661 | $ | 885 | ||||||||||||
One-Time Infrastructure Cap Ex | 5 - 35 | $ | 1,236 | $ | — | $ | 1,791 | $ | — | |||||||||||
Three Months | Six Months | |||||||||||||||||||
Ended | Cost | Ended | Cost | |||||||||||||||||
Category (Expensed) | June 30, 2015 | per Home | June 30, 2015 | per Home | ||||||||||||||||
Repair and Maintenance for Consolidated Homes | ||||||||||||||||||||
Average number of homes (4) | 38,980 | 39,163 | ||||||||||||||||||
Contract services | $ | 4,470 | $ | 115 | $ | 8,649 | $ | 221 | ||||||||||||
Turnover related expenses | 942 | 24 | 1,845 | 47 | ||||||||||||||||
Other Repair and Maintenance | ||||||||||||||||||||
Building interiors | 1,668 | 43 | 3,067 | 78 | ||||||||||||||||
Building exteriors | 339 | 9 | 698 | 18 | ||||||||||||||||
Landscaping and grounds | 188 | 5 | 659 | 17 | ||||||||||||||||
Total | $ | 7,607 | $ | 196 | $ | 14,918 | $ | 381 | ||||||||||||
(1) See Attachment 16 for definitions and other terms. | ||||||||||||||||||||
(2) Weighted average useful life of capitalized expenses for the six months ended June 30, 2015. | ||||||||||||||||||||
(3) Excludes redevelopment capital. | ||||||||||||||||||||
(4) Average number of homes is calculated based on the number of homes outstanding at the end of each month. | ||||||||||||||||||||
(5) Revenue enhancing capital expenditures were incurred at specific apartment communities in conjunction with UDR's overall capital expenditure plan. | ||||||||||||||||||||
27
| |||||
Attachment 15 | |||||
UDR, Inc. | |||||
Full-Year 2015 Guidance (1) | |||||
June 30, 2015 | |||||
(Unaudited) | |||||
FFO and AFFO per Share Guidance | |||||
3Q 2015 | Full Year 2015 | ||||
FFO per common share and unit, diluted | $0.39 to $0.41 | $1.64 to $1.68 | |||
FFO As Adjusted per common share and unit, diluted | $0.39 to $0.41 | $1.63 to $1.67 | |||
Adjusted Funds from Operations ("AFFO") per common share and unit, diluted | $0.34 to $0.36 | $1.46 to $1.50 | |||
Annualized dividend per share | $1.11 | ||||
Same-Store Guidance | Full Year 2015 | ||||
Revenue growth | 5.00% to 5.50% | ||||
Expense growth | 2.50% to 3.00% | ||||
NOI growth | 5.75% to 6.75% | ||||
Physical occupancy | 96.5% | ||||
Same-Store homes | 35,250 | ||||
Sources of Funds ($ in millions) | Full Year 2015 | ||||
Sales Proceeds and Debt and Equity Issuances | $750 to $900 | ||||
Construction Loan Proceeds | $120 to $140 | ||||
Uses of Funds ($ in millions) | Full Year 2015 | ||||
Debt maturities (weighted average interest rate of 5.5%) | $516 | ||||
Development and redevelopment spending | $325 to $375 | ||||
Acquisitions | $160 to $250 | ||||
Other Additions/(Deductions) ($ in millions except per home amounts) | Full Year 2015 | ||||
Interest | ($120) to ($125) | ||||
General and administrative, gross (2) | ($54) to ($56) | ||||
Tax benefit for TRS | $3 to $5 | ||||
Total joint venture FFO, Including fee income | $57 to $61 | ||||
Non-recurring items: | |||||
Disposition-related FFO | $10 | ||||
Acquisition-related costs | $1.5 to $2 | ||||
Long-term incentive plan transition costs | $3 to $4 | ||||
Average stabilized homes | 40,000 | ||||
Recurring capital expenditures per home | $1,150 | ||||
Revenue enhancing capital expenditures | $15 to $20 | ||||
Kitchen & Bath capital expenditures | $5 to $10 | ||||
One-time infrastructure capital expenditures | $5 to $7 | ||||
(1) See Attachment 16 for definitions and other terms. | |||||
(2) Includes an estimated $15 million to $16 million of long-term incentive plan compensation expense, including $3.5 million related to program transition expense. | |||||
28
| |||||||||||||||||
Attachment 16(A) | |||||||||||||||||
UDR, Inc. | |||||||||||||||||
Definitions and Reconciliations | |||||||||||||||||
June 30, 2015 | |||||||||||||||||
(Unaudited) | |||||||||||||||||
Acquired Communities: The Company defines Acquired Communities as those communities acquired by the Company, other than development and redevelopment activity, that did not achieve stabilization as of the most recent quarter. | |||||||||||||||||
Adjusted Funds From Operations ("AFFO") attributable to common stockholders and unitholders: The Company defines AFFO as FFO as Adjusted attributable to common stockholders and unitholders less recurring capital expenditures that are necessary to help preserve the value of and maintain functionality at our communities. | |||||||||||||||||
Management considers AFFO a useful supplemental performance metric for investors as it is more indicative of the Company's operational performance than FFO or FFO as Adjusted. AFFO is not intended to represent cash flow or liquidity for the period, and is only intended to provide an additional measure of our operating performance. The Company believes that net income attributable to UDR, Inc. is the most directly comparable GAAP financial measure to AFFO. Management believes that AFFO is a widely recognized measure of the operations of REITs, and presenting AFFO will enable investors to assess our performance in comparison to other REITs. However, other REITs may use different methodologies for calculating AFFO and, accordingly, our AFFO may not always be comparable to AFFO calculated by other REITs. AFFO should not be considered as an alternative to net income (determined in accordance with GAAP) as an indication of financial performance, or as an alternative to cash flows from operating activities (determined in accordance with GAAP) as a measure of our liquidity, nor is it indicative of funds available to fund our cash needs, including our ability to make distributions. A reconciliation from net income attributable to UDR, Inc. to AFFO is provided on Attachment 2. | |||||||||||||||||
Development Communities: The Company defines Development Communities as those communities recently developed or under development by the Company, that are currently majority owned by the Company and have not achieved stabilization as of the most recent quarter. | |||||||||||||||||
Discontinued Operations: Effective January 1, 2014, UDR prospectively adopted Accounting Standards Update (“ASU”) No. 2014-08, Reporting Discontinued Operations and Disclosures of Disposals of Components of an Entity, for all communities not previously sold or classified as held for sale. ASU 2014-08 incorporates into the definition of a discontinued operation a requirement that a disposition represent a strategic shift in an entity’s operations, which resulted in UDR no longer classifying the sale of communities as a discontinued operation. Communities that meet the criteria to be classified as held for disposition subsequent to the adoption of ASU 2014-08 are presented as held for disposition in the Consolidated Balance Sheet for the current period, but do not meet the criteria to be classified as discontinued operations in accordance with ASU 2014-08. Prior to the prospective adoption of ASU 2014-08, FASB ASC Subtopic 205.20, required, among other things, that the primary assets and liabilities and the results of operations of UDR’s real properties that have been sold or are held for disposition, be classified as discontinued operations and segregated in UDR’s Consolidated Statements of Operations and Consolidated Balance Sheets. Consequently, the primary assets and liabilities and the net operating results of those properties sold or classified as held for disposition prior to January 1, 2014 are accounted for as discontinued operations for all periods presented. This presentation does not have an impact on net income available to common stockholders, it only results in the reclassification of the operating results within the Consolidated Statements of Operations for the period ended June 30, 2014, and the reclassification of the assets and liabilities within the Consolidated Balance Sheet as of December 31, 2014. During the twelve months ended December 31, 2014, UDR sold one commercial property that was classified as real estate held for disposition prior to the adoption of ASU 2014-08 and is therefore presented as a discontinued operation. The results of operations for these properties are classified on the Consolidated Statements of Operations on Attachment 1 of the Company's quarterly supplemental disclosure in the line item entitled “Income from discontinued operations, net of tax”. | |||||||||||||||||
In thousands | 2Q 2015 | 2Q 2014 | YTD 2015 | YTD 2014 | |||||||||||||
Rental income | $ | — | $ | 78 | $ | — | $ | 126 | |||||||||
Rental expenses | — | 89 | — | 214 | |||||||||||||
Property management | — | 2 | — | 3 | |||||||||||||
Real estate depreciation | — | — | — | — | |||||||||||||
Other operating expenses | — | 9 | — | 18 | |||||||||||||
Non-property (income)/expense | — | — | — | — | |||||||||||||
Total expenses | — | 100 | — | 235 | |||||||||||||
Income before net impairment of real estate held for disposition and net gain on the sale of depreciable property | — | (22 | ) | — | (109 | ) | |||||||||||
Net gain on the sale of depreciable property, net of tax | — | — | — | — | |||||||||||||
Income tax benefit/(expense) | — | 40 | — | 40 | |||||||||||||
Income/(loss) from discontinued operations, net of tax | $ | — | $ | 18 | $ | — | $ | (69 | ) | ||||||||
Effective New Lease Rate Growth: The Company defines effective new lease rate growth as the increase in gross potential rent realized less all concessions for the new lease term (current effective rent) versus prior resident effective rent for the prior lease term on all new leases commenced during the current quarter. | |||||||||||||||||
Management considers effective new lease rate growth a useful metric for investors as it assesses market-level new demand trends. | |||||||||||||||||
Effective Renewal Lease Rate Growth: The Company defines effective renewal lease rate growth as the increase in gross potential rent realized less all concessions for the new lease term (current effective rent) versus prior effective rent for the prior lease term on all renewed leases commenced during the current quarter. | |||||||||||||||||
Management considers effective renewal lease rate growth a useful metric for investors as it assesses market-level, in-place demand trends. | |||||||||||||||||
Estimated Quarter of Completion: The Company defines estimated quarter of completion of a development or redevelopment project as the date on which construction is expected to be completed, but does not represent the date of stabilization. | |||||||||||||||||
Fixed Charge Coverage Ratio: The Company defines Fixed Charge Coverage Ratio as net income, excluding the impact of interest expense, real estate depreciation and amortization of wholly owned and other joint venture communities, other depreciation and amortization, noncontrolling interests, net gain on the sale of depreciable property, TRS income tax, divided by total interest plus preferred dividends. | |||||||||||||||||
Management considers fixed charge coverage a useful metric for investors as it provides ratings agencies, investors and lending partners with a widely-used measure of the Company’s ability to service its debt obligations as well as compare leverage against that of its peer REITs. A reconciliation of the components that comprise fixed charge coverage is provided on Attachment 4(C) of the Company's quarterly supplemental disclosure. | |||||||||||||||||
Funds From Operations as Adjusted attributable to common stockholders and unitholders: The Company defines FFO attributable to common stockholders and unitholders as Adjusted as FFO excluding the impact of acquisition-related costs and other non-comparable items including, but not limited to, prepayment costs/benefits associated with early debt retirement, gains on sales of marketable securities and TRS property, deferred tax valuation allowance increases and decreases, casualty-related expenses and recoveries, severance costs and legal costs. | |||||||||||||||||
Management believes that FFO as Adjusted is useful supplemental information regarding our operating performance as it provides a consistent comparison of our operating performance across time periods and allows investors to more easily compare our operating results with other REITs. FFO as Adjusted is not intended to represent cash flow or liquidity for the period, and is only intended to provide an additional measure of our operating performance. The Company believes that net income attributable to UDR, Inc. is the most directly comparable GAAP financial measure to FFO as Adjusted. However, other REITs may use different methodologies for calculating FFO as Adjusted or similar FFO measures and, accordingly, our FFO as Adjusted may not always be comparable to FFO as Adjusted or similar FFO measures calculated by other REITs. FFO as Adjusted should not be considered as an alternative to net income (determined in accordance with GAAP) as an indication of financial performance, or as an alternative to cash flows from operating activities (determined in accordance with GAAP) as a measure of our liquidity. A reconciliation from net income attributable to UDR, Inc. to FFO as Adjusted is provided on Attachment 2. | |||||||||||||||||
29
| |||||||||||||||||||
Attachment 16(B) | |||||||||||||||||||
UDR, Inc. | |||||||||||||||||||
Definitions and Reconciliations | |||||||||||||||||||
June 30, 2015 | |||||||||||||||||||
(Unaudited) | |||||||||||||||||||
Funds From Operations ("FFO") attributable to common stockholders and unitholders: The Company defines FFO as net income attributable to common stockholders and unitholders, excluding impairment write-downs of depreciable real estate or of investments in non-consolidated investees that are driven by measurable decreases in the fair value of depreciable real estate held by the investee, gains (or losses) from sales of depreciable property, plus real estate depreciation and amortization, and after adjustments for noncontrolling interests, unconsolidated partnerships and joint ventures. This definition conforms with the National Association of Real Estate Investment Trust's definition issued in April 2002. In the computation of diluted FFO, unvested restricted stock, stock options, and the shares of Series E Cumulative Convertible Preferred Stock are dilutive; therefore, they are included in the diluted share count. | |||||||||||||||||||
Activities of our taxable REIT subsidiary (TRS), include development and land entitlement. From time to time, we develop and subsequently sell a TRS property which results in a short-term use of funds that produces a profit that differs from the traditional long-term investment in real estate for REITs. We believe that the inclusion of these TRS gains in FFO is consistent with the standards established by NAREIT as the short-term investment is incidental to our main business. TRS gains on sales, net of taxes, are defined as net sales proceeds less a tax provision and the gross investment basis of the asset before accumulated depreciation. | |||||||||||||||||||
Management considers FFO a useful metric for investors as the Company uses FFO in evaluating property acquisitions and its operating performance and believes that FFO should be considered along with, but not as an alternative to, net income and cash flow as a measure of the Company's activities in accordance with GAAP. FFO does not represent cash generated from operating activities in accordance with GAAP and is not necessarily indicative of funds available to fund our cash needs. A reconciliation from net income attributable to UDR, Inc. to FFO is provided on Attachment 2. | |||||||||||||||||||
Held For Disposition Communities: The Company defines Held for Disposition Communities as those communities that were held for sale as of the end of the most recent quarter. | |||||||||||||||||||
Interest Coverage Ratio: The Company defines Interest Coverage Ratio as net income, excluding the impact of interest expense, real estate depreciation and amortization of wholly owned and joint venture communities, other depreciation and amortization, noncontrolling interests, net gain on the sale of depreciable property, TRS income tax, divided by total interest. | |||||||||||||||||||
Management considers interest coverage ratio a useful metric for investors as it provides ratings agencies, investors and lending partners with a widely-used measure of the Company’s ability to service its debt obligations as well as compare leverage against that of its peer REITs. A reconciliation of the components that comprise interest coverage ratio is provided on Attachment 4(C) of the Company's quarterly supplemental disclosure. | |||||||||||||||||||
Joint Venture Reconciliation at UDR's Weighted Average Pro-Rata Ownership Interest | |||||||||||||||||||
In thousands | 2Q 2015 | YTD 2015 | |||||||||||||||||
Income/(loss) from unconsolidated entities | $ | (573 | ) | $ | 58,586 | ||||||||||||||
Management fee | 1,003 | 1,984 | |||||||||||||||||
Interest expense | 7,841 | 15,625 | |||||||||||||||||
Depreciation | 10,017 | 19,867 | |||||||||||||||||
General and administrative | 351 | 533 | |||||||||||||||||
Other income/expense | (922 | ) | (1,851 | ) | |||||||||||||||
Gain on sale | — | (59,073 | ) | ||||||||||||||||
Total Joint Venture NOI at UDR's Pro-Rata Ownership Interest | $ | 17,717 | $ | 35,671 | |||||||||||||||
JV Return on Equity ("ROE"): The Company defines JV ROE as the pro rata share of property NOI plus property and asset management fee revenue less interest expense, divided by the average of beginning and ending equity capital for the quarter. | |||||||||||||||||||
Management considers ROE a useful metric for investors as it provides a widely used measure of how well the Company is investing its capital on a leveraged basis. | |||||||||||||||||||
JV Return on Invested Capital ("ROIC"): The Company defines JV ROIC as the pro rata share of property NOI plus property and asset management fee revenue divided by the average of beginning and ending invested capital for the quarter. | |||||||||||||||||||
Management considers ROIC a useful metric for investors as it provides a widely used measure of how well the Company is investing its capital on an unleveraged basis. | |||||||||||||||||||
Net Debt to EBITDA: The Company defines net debt to EBITDA as total debt net of cash and cash equivalents divided by EBITDA. EBITDA is defined as net income, excluding the impact of interest expense, real estate depreciation and amortization of wholly owned and other joint venture communities, other depreciation and amortization, noncontrolling interests, net gain on the sale of depreciable property, and TRS income tax. | |||||||||||||||||||
Management considers net debt to EBITDA a useful metric for investors as it provides ratings agencies, investors and lending partners with a widely-used measure of the Company’s ability to service its debt obligations as well as compare leverage against that of its peer REITs. A reconciliation between net income and EBITDA is provided on Attachment 4(C) of the Company's quarterly supplemental disclosure. | |||||||||||||||||||
Net Operating Income (“NOI”): The Company defines NOI as rental income less direct property rental expenses. Rental income represents gross market rent less adjustments for concessions, vacancy loss and bad debt. Rental expenses include real estate taxes, insurance, personnel, utilities, repairs and maintenance, administrative and marketing. Excluded from NOI is property management expense which is calculated as 2.75% of property revenue to cover the regional supervision and accounting costs related to consolidated property operations, and land rent. | |||||||||||||||||||
Management considers NOI a useful metric for investors as it is a more meaningful representation of a community’s continuing operating performance than net income as it is prior to corporate-level expense allocations, general and administrative costs, capital structure and depreciation and amortization and is a widely used input, along with capitalization rates, in the determination of real estate valuations. A reconciliation from net income attributable to UDR, Inc. to NOI is provided below. | |||||||||||||||||||
In thousands | 2Q 2015 | 1Q 2015 | 4Q 2014 | 3Q 2014 | 2Q 2014 | ||||||||||||||
Net income/(loss) attributable to UDR, Inc. | $ | 86,855 | $ | 73,822 | $ | 65,417 | $ | 40,549 | $ | 30,007 | |||||||||
Property management | 5,851 | 5,694 | 5,668 | 5,598 | 5,527 | ||||||||||||||
Other operating expenses | 1,769 | 1,766 | 2,174 | 2,009 | 2,162 | ||||||||||||||
Real estate depreciation and amortization | 90,344 | 88,777 | 91,406 | 89,339 | 88,876 | ||||||||||||||
Interest expense | 29,673 | 28,800 | 32,792 | 33,087 | 31,691 | ||||||||||||||
Casualty-related (recoveries)/charges, net | 843 | 996 | 41 | — | — | ||||||||||||||
General and administrative | 13,721 | 12,152 | 11,722 | 11,554 | 12,530 | ||||||||||||||
Tax provision/(benefit), net (includes valuation adjustment) | (1,404 | ) | (425 | ) | (7,087 | ) | (2,492 | ) | (2,190 | ) | |||||||||
Income/(loss) from unconsolidated entities | 573 | (59,159 | ) | 2,074 | 939 | 428 | |||||||||||||
Interest and other income, net | (382 | ) | (360 | ) | 44 | (9,061 | ) | (1,426 | ) | ||||||||||
Joint venture management and other fees | (3,098 | ) | (12,706 | ) | (3,445 | ) | (3,165 | ) | (2,747 | ) | |||||||||
Other depreciation and amortization | 1,700 | 1,623 | 2,117 | 1,385 | 1,193 | ||||||||||||||
(Income)/loss from discontinued operations, net of tax | — | — | — | (79 | ) | (18 | ) | ||||||||||||
(Gain)/loss on sale of real estate owned, net of tax | (79,042 | ) | — | (61,267 | ) | (31,302 | ) | (26,709 | ) | ||||||||||
Net income/(loss) attributable to noncontrolling interests | 3,029 | 2,595 | 2,335 | 1,443 | 1,079 | ||||||||||||||
Total consolidated NOI | $ | 150,432 | $ | 143,575 | $ | 143,991 | $ | 139,804 | $ | 140,403 | |||||||||
30
| ||||||||
Attachment 16(C) | ||||||||
UDR, Inc. | ||||||||
Definitions and Reconciliations | ||||||||
June 30, 2015 | ||||||||
(Unaudited) | ||||||||
Non-Mature: The Company defines Non-Mature Communities as those communities that have not met the criteria to be included in Same-Store Communities. | ||||||||
Non-Residential / Other: The Company defines Non-Residential / Other as non-apartment components of mixed-use properties, land held, properties being prepared for redevelopment and properties where a material change in home count has occurred. | ||||||||
Physical Occupancy: The Company defines physical occupancy as the number of occupied homes divided by the total homes available at a community. | ||||||||
QTD Same-Store ("SS") Communities: The Company defines QTD SS Communities as those communities stabilized for five full consecutive quarters. These communities were owned and had stabilized occupancy and operating expenses as of the beginning of the quarter in the prior year, there is no plan to conduct substantial redevelopment activities, and the community is not held for disposition within the current year. | ||||||||
Recurring Capital Expenditures: The Company defines recurring capital expenditures as expenditures that are necessary to help preserve the value of and maintain functionality at its communities. | ||||||||
Redevelopment Communities: The Company generally defines Redevelopment Communities as those communities where substantial redevelopment is in progress that is expected to have a material impact on the community's operations, including occupancy levels and future rental rates. | ||||||||
Redevelopment Projected Weighted Average Return on Incremental Capital Invested: The projected weighted average return on incremental capital invested for redevelopment projects is NOI as set forth in the Stabilization Period for Redevelopment Yield definition, less Recurring Capital Expenditures, minus the project’s annualized operating NOI prior to commencing the redevelopment, less Recurring Capital Expenditures, divided by total cost of the project. | ||||||||
Return on Equity ("ROE"): The Company defines ROE as a referenced quarter's NOI less interest expense, annualized, divided by the average of beginning and ending equity capital for the quarter. | ||||||||
Management considers ROE a useful metric for investors as it provides a widely used measure of how well the Company is investing its capital on a leveraged basis. | ||||||||
Return on Invested Capital ("ROIC"): The Company defines ROIC as a referenced quarter's NOI, annualized, divided by the average of beginning and ending invested capital for the quarter. | ||||||||
Management considers ROIC a useful metric for investors as it provides a widely used measure of how well the Company is investing its capital on an unleveraged basis. | ||||||||
Revenue Enhancing Capital Expenditures: The Company defines revenue-enhancing capital expenditures as expenditures that result in increased income generation over time. | ||||||||
Management considers revenue enhancing capital expenditures a useful metric for investors as it quantifies the amount of capital expenditures that are expected to grow, not just maintain, revenues. | ||||||||
Sold Communities: The Company defines Sold Communities as those communities that previously met the criteria for discontinued operations and were disposed of prior to the end of the most recent quarter. | ||||||||
Stabilization for Same Store Classification: The Company generally defines stabilization as when a community’s occupancy reaches 90% or above for at least three consecutive months. | ||||||||
Stabilized, Non-Mature Communities: The Company defines Stabilized, Non-Mature Communities as those communities that are stabilized but not yet in the Company's Same-Store portfolio. | ||||||||
Stabilization Period for Development Yield: The Company defines the stabilization period for development property yield as the forward twelve month NOI, excluding any remaining lease-up concessions outstanding, commencing one year following the delivery of the final home of the project. | ||||||||
Stabilization Period for Redevelopment Yield: The Company defines the stabilization period for a redevelopment property yield for purposes of computing the Projected Weighted Average Return on Incremental Capital Invested, as the forward twelve month NOI, excluding any remaining lease-up concessions outstanding, commencing one year following the delivery of the final home of a project. | ||||||||
Stabilized Yield on Developments: Expected stabilized yields on development are calculated as follows, projected stabilized NOI less management fees divided by budgeted construction cost on a project-specific basis. Projected stabilized NOI for development projects, calculated in accordance with the NOI reconciliation provided on Attachment 16(B), is set forth in the definition of Stabilization Period for Development Yield. Given the differing completion dates and years for which NOI is being projected for these communities as well as the complexities associated with estimating other expenses upon completion such as corporate overhead allocation, general and administrative costs and capital structure, a reconciliation to GAAP measures is not meaningful. Projected NOI for these projects is neither provided, nor is representative of Management’s expectations for the Company’s overall financial performance or cash flow growth and there can be no assurances that forecast NOI growth implied in the estimated construction yield of any project will be achieved. | ||||||||
Management considers estimated stabilized yield on development as a useful metric for investors as it helps provide context to the expected effects that development projects will have on the Company’s future performance once stabilized. | ||||||||
Total Revenue per Occupied Home: The Company defines total revenue per occupied home as rental and other revenues, calculated in accordance with GAAP, divided by the product of occupancy and the number of apartment homes. | ||||||||
Management considers total revenue per occupied home a useful metric for investors as it serves as a proxy for portfolio quality, both geographic and physical. | ||||||||
TRS: The Company's taxable REIT subsidiary ("TRS") focuses on development, land entitlement and short-term hold investments. TRS gains on sales, net of taxes, is defined as net sales proceeds less a tax provision and the gross investment basis of the asset before accumulated depreciation. | ||||||||
YTD Same-Store ("SS") Communities: The Company defines YTD SS Communities as those communities stabilized for two full consecutive calendar years. These communities were owned and had stabilized occupancy and operating expenses as of the beginning of the prior year, there is no plan to conduct substantial redevelopment activities, and the community is not held for disposition within the current year. | ||||||||
31
| ||||||||||||||
Attachment 16(D) | ||||||||||||||
UDR, Inc. | ||||||||||||||
Definitions and Reconciliations | ||||||||||||||
June 30, 2015 | ||||||||||||||
(Unaudited) | ||||||||||||||
All guidance is based on current expectations of future economic conditions and the judgment of the Company's management team. The following reconciles from GAAP net income/(loss) per share for full year 2015 and third quarter of 2015 to forecasted FFO, FFO as Adjusted and AFFO per share and unit: | ||||||||||||||
Full Year 2015 | ||||||||||||||
Low | High | |||||||||||||
Forecasted earnings per diluted share | $ | 0.79 | $ | 0.83 | ||||||||||
Conversion from GAAP share count | (0.10 | ) | (0.10 | ) | ||||||||||
Net (gain)/loss on the sale of depreciable property, excluding TRS | (0.50 | ) | (0.50 | ) | ||||||||||
Depreciation | 1.46 | 1.46 | ||||||||||||
Noncontrolling Interests | (0.02 | ) | (0.02 | ) | ||||||||||
Preferred Dividends | 0.01 | 0.01 | ||||||||||||
Forecasted FFO per diluted share and unit | $ | 1.64 | $ | 1.68 | ||||||||||
Disposition-related FFO | (0.03 | ) | (0.03 | ) | ||||||||||
Long-term incentive plan transition costs | 0.01 | 0.01 | ||||||||||||
Acquisition-related and other costs | 0.01 | 0.01 | ||||||||||||
Forecasted FFO as Adjusted per diluted share and unit | $ | 1.63 | $ | 1.67 | ||||||||||
Recurring capital expenditures | (0.17 | ) | (0.17 | ) | ||||||||||
Forecasted AFFO per diluted share and unit | $ | 1.46 | $ | 1.50 | ||||||||||
3Q 2015 | ||||||||||||||
Low | High | |||||||||||||
Forecasted earnings per diluted share | $ | 0.05 | $ | 0.07 | ||||||||||
Conversion from GAAP share count | (0.03 | ) | (0.03 | ) | ||||||||||
Depreciation | 0.37 | 0.37 | ||||||||||||
Noncontrolling Interests | — | — | ||||||||||||
Preferred Dividends | — | — | ||||||||||||
Forecasted FFO per diluted share and unit | $ | 0.39 | $ | 0.41 | ||||||||||
Disposition-related FFO | — | — | ||||||||||||
Long-term incentive plan transition costs | — | — | ||||||||||||
Acquisition-related and other costs | — | — | ||||||||||||
Forecasted FFO as Adjusted per diluted share and unit | $ | 0.39 | $ | 0.41 | ||||||||||
Recurring capital expenditures | (0.05 | ) | (0.05 | ) | ||||||||||
Forecasted AFFO per diluted share and unit | $ | 0.34 | $ | 0.36 | ||||||||||
32
Page intentionally left blank