Attached files
| file | filename |
|---|---|
| 8-K - FORM 8-K - S&T BANCORP INC | d37120d8k.htm |
| EX-99.1 - EX-99.1 - S&T BANCORP INC | d37120dex991.htm |
 Exhibit
99.2 Second Quarter
2015 |
 Forward
Looking Statement and Risk Factor
• This presentation contains certain forward-looking statements within the meaning of Section 27A of
the Securities Act of 1933 and Section 21E of the Securities Exchange Act of
1934. Forward-looking statements include, among others,
statements regarding trends, strategies, plans, beliefs, intentions,
expectations, goals and opportunities. Forward looking statements are typically
identified by words or phrases such as believe, expect, anticipate,
intend, estimate, assume, strategy, plan, outlook, outcome, continue,
remain, trend and variations of such words and similar expressions, or future or conditional verbs such as will, would, should, could, may or similar expressions. Actual results and
performance could differ materially from those anticipated by these forward-looking
statements. Factors that could cause such a difference include, but
are not limited to, general economic conditions, changes in interest
rates, deposit flows, loan demand, asset quality, including real estate
and other collateral values, and competition.
• S&T cautions that these forward-looking statements are subject to numerous assumptions, risks and
uncertainties, which change over time. These forward-looking statements speak
only as of the date hereof, and S&T assumes no duty to update
forward-looking statements. Subsequent written or oral
statements attributable to S&T or persons acting on its behalf are expressly
qualified in their entirety by the cautionary statements contained herein
and those in S&T’s reports previously and subsequently filed
with the Securities and Exchange Commission. 2
|
 Non-GAAP Financial Measures
• In addition to the results of operations presented in accordance with Generally Accepted Accounting
Principles (GAAP), S&T management uses and this presentation contains or references
certain non- GAAP financial measures, such as net interest income on a
fully taxable equivalent basis. S&T believes these financial measures
provide information useful to investors in understanding our operational
performance and business and performance trends which facilitate comparisons with the performance of others in the financial services industry. Although S&T believes that these non-GAAP
financial measures enhance investors’ understanding of S&T’s business and
performance, these non- GAAP financial measures should not be
considered an alternative to GAAP. The non-GAAP financial measures
contained therein should be read in conjunction with the audited financial statements and analysis as presented in the Annual Report on Form 10-K as well as the unaudited financial
statements and analyses as presented in the respective Quarterly Reports on Forms
10-Q for S&T Bancorp, Inc. and subsidiaries.
3 |
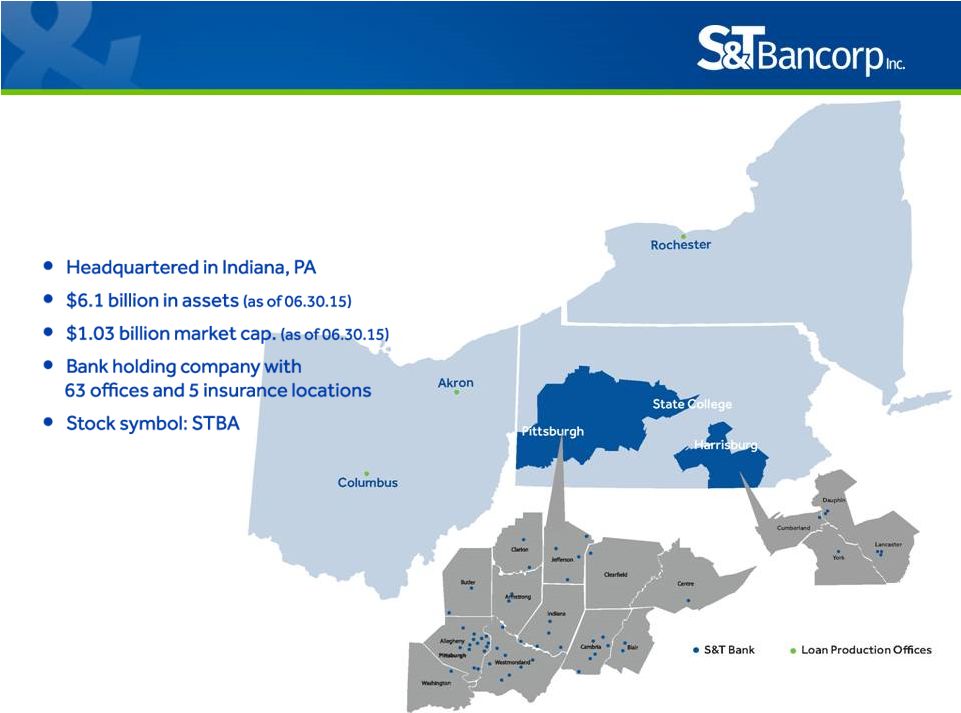 Corporate Profile 4 |
 Performance Summary *Refer to appendix for reconciliation of Non-GAAP financial measures 5 |
 STBA
Investment Thesis •
Above peer performance
• Strategic and effective mergers and expansion • Demonstrated expense discipline and efficiency • Organic growth • Excellent asset quality • Stable regional economies with long-term oil and gas benefit 6 |
 7 Performance 0.79% 1.12% 1.22% 0.99% 1.21% Peer* 0.0% 0.2% 0.4% 0.6% 0.8% 1.0% 1.2% 1.4% 2012 2013 2014 1Q 15** 2Q 15** **Annualized Return on Average Assets * Bank Holding Companies $3-10 Billion of
Assets |
 8 Performance 9.21% 9.71% 7.85% 9.52% Peer* 0.0% 2.5% 5.0% 7.5% 10.0% 12.5% 2012 2013 2014 1Q 15** 2Q 15** Return on Average Equity *Bank Holding Companies $3-10 Billion of Assets **Annualized 6.62% |
 9 Performance 10.35% 13.94% 14.02% 11.80% 15.79% Peer* 0.0% 2.0% 4.0% 6.0% 8.0% 10.0% 12.0% 14.0% 16.0% 2012 2013 2014 1Q 15** 2Q 15** Return on Average Tangible Equity 1 1 Refer to appendix for reconciliation of Non-GAAP financial measures * SNL Financial Custom Peer Group Holding Companies $3-10 Billion of Assets ** Annualized |
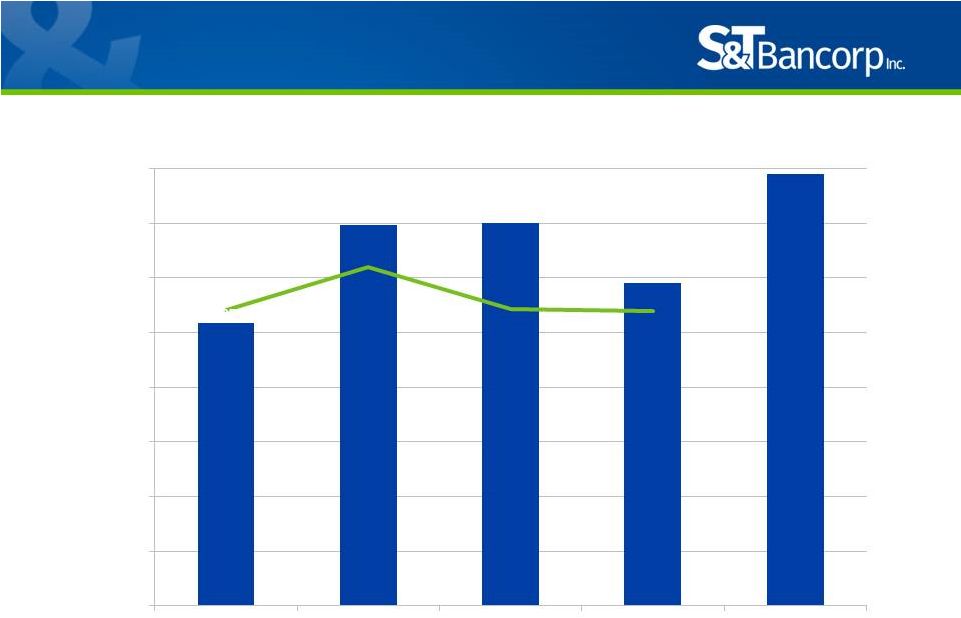
 10 4,120 4,159 4,533 4,965 5,105 6,134 242 866 126 3,000 3,500 4,000 4,500 5,000 5,500 6,000 6,500 2011 2012 2013 2014 1Q 15 2Q 15 Gateway Bank Mainline Bank Integrity Bank 4,527 5,971 Mainline National Bank acquired - March 9, 2012 Northeast Ohio Loan Production Office opened – August 27, 2012 Gateway Bank acquired August 13, 2012 Central Ohio Loan Production Office opened – January 21, 2014 Western New York Loan Production Office opened – March 23, 2015 Integrity Bank acquired March 4, 2015 S&T Bank branch opens in State College, PA June 18, 2014 Mergers and expansion |
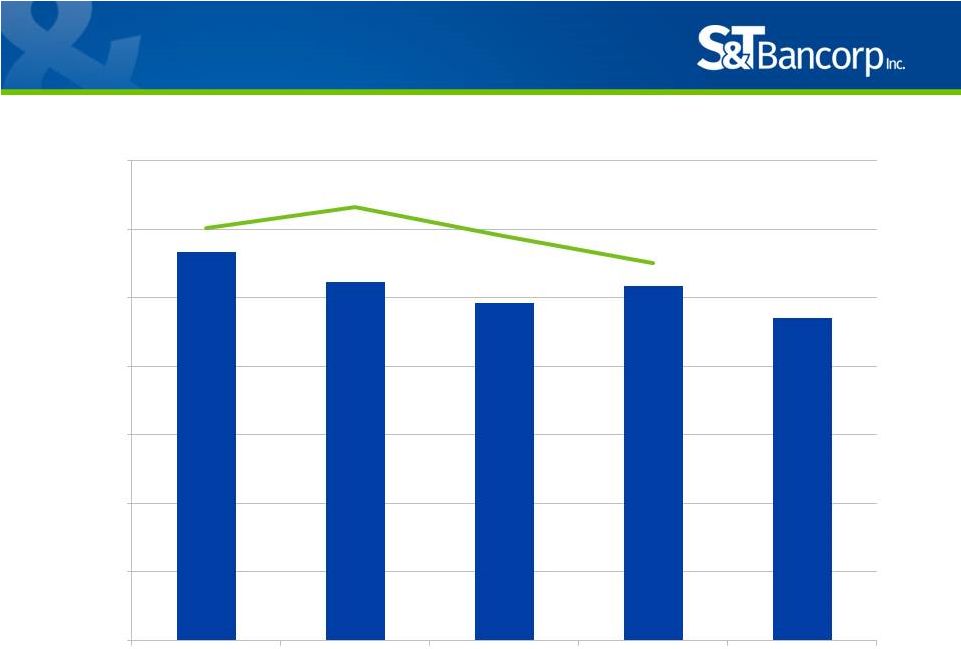 11 Expenses 2.83% 2.61% 2.46% 2.59% 2.35% Peer* 0.0% 0.5% 1.0% 1.5% 2.0% 2.5% 3.0% 3.5% 2012 2013 2014 1Q 15** 2Q 15** Non Interest Expense / Average Assets **Annualized *Bank Holding Companies $3-10 Billion of Assets |
 12 Expenses 65.15% 60.03% 58.67% 62.57% 55.63% Peer* 40% 45% 50% 55% 60% 65% 70% 2012 2013 2014 1Q 15 2Q 15 Efficiency Ratio *Bank Holding Companies $3-10 Billion of Assets |
 Market Opportunity MSA 2015 Population (in thousands) 2015-2020 % Change Median HH Income (in thousands) Locations Deposits (in millions) Deposit Market Share % Loans (in millions) Pittsburgh, PA 2,361 0.41% 53 26 $1,735 1.8% $1,860 Indiana, PA 87 (1.27)% 46 11 $1,212 49.5% $405 Jefferson-Clarion, PA 84 (1.05)% 44 8 $572 34.8% $234 Harrisburg-Carlisle, PA 562 2.04% 58 4 $532 4.4% $371 Lancaster, PA 534 2.39% 56 3 $171 1.7% $307 DuBois, PA 81 (0.57)% 45 2 $163 12.2% $116 Johnstown, PA 139 (2.34)% 43 6 $140 5.0% $73 Altoona, PA 126 (0.85)% 45 1 $60 2.6% $154 York-Hanover, PA 441 1.34% 59 1 $42 0.7% $73 State College, PA 156 1.27% 52 1 New NA $27 Akron, OH 706 0.54% 52 1 - - $69 Cleveland-Elyra, OH 2,061 (0.25)% 48 - - - $81 Columbus, OH 1,998 3.86% 56 1 - - $147 Rochester, NY 1,084 0.98% 53 1 - - $37 Buffalo-Cheektowaga- Niagara Falls, NY 1,134 0.55% 52 - - - $78 13 1 Micropolitan statistical area 2 Counties not part of an MSA or Micropolitan statistical area Source: SNL, Nielson, and internal data Growth 1 2 1 |
 14 Asset quality 0.63% 0.32% 0.39% 0.40% Peer* 0.0% 0.5% 1.0% 1.5% 2.0% 2012 2013 2014 1Q 15 2Q 15 *Bank Holding Companies $3-10 Billion of Assets Non Performing Loans / Total Loans 1.63% |
 15 Asset quality 0.78% 0.25% 0.00% 0.10% 0.11% Peer* 0.0% 0.2% 0.4% 0.6% 0.8% 2012 2013 2014 1Q 15** 2Q 15** Net Charge Offs / Average Loans *Bank Holding Companies $3-10 Billion of Assets **Annualized |
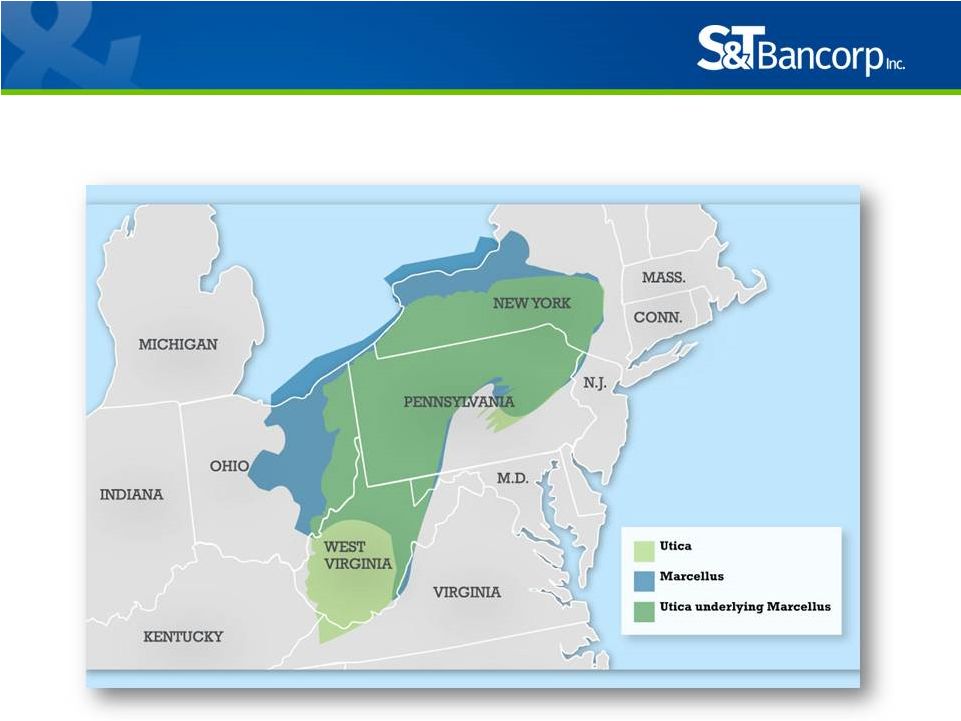 Stable
regional economies with long-term oil & gas benefit
16 Regional economy |
 Loan
Mix As of 6.30.15
17 Commercial 3,639 76% Consumer 1,159 24% CRE 2,055 56% C&I 1,239 34% Construction 345 10% Home Equity 458 40% Mortgage/Construction 607 52% Other 94 8% |
 Rate
Sensitivity As of 6.30.15
Loans & Securities Floating Rate 2,087 37% ARM/Future Reset 1,464 26% Fixed Rate 2,035 36% Total 5,586 100% 18 Deposits & Borrowings Floating Rate/Short Wholesale Liabilities 798 15% Non-Maturity Variable Deposits 1,464 26% Non-Interest Bearing DDA 1,182 22% Fixed Rate 1,146 22% Total 5,300 100% |
 Senior Management 19 Name Title Years in Banking Years with S&T Todd D. Brice President & CEO 30 30 Mark Kochvar Chief Financial Officer 29 23 David G. Antolik Chief Lending Officer 27 25 Ernest J. Draganza Chief Risk Officer 28 23 Patrick J. Haberfield Chief Credit Officer 28 5 David P. Ruddock Chief Operating Officer 30 30 Thomas J. Sposito, II Market Executive 30 3 Rebecca A. Stapleton Chief Banking Officer 27 27 |
 Continuous Improvement
20 Multi-Faceted Growth Profit Improvement Operational Effectiveness Culture Customer Experience Risk Management 3 mergers since 2012 3 new LPOs in 3 years State College branch opened Closed 4 branches Converted 2 branches to drive-ups Insurance restructure Wealth Management restructure Sold merchant processing business Centralized collections New floor plan system New mortgage origination system Replaced computer network Wealth Management system conversion New deposit origination platform Voted Best Place to Work in PA.
AARP recognition Organization wide focus Marketing rebranding Branch innovation center New training center Mobile expansion Balanced risk vs. reward |
 Stock
Performance 1 YR
3YR 5YR 10YR STBA 22.28% 20.40% 11.65% 1.27% NASDAQ Bank 12.91% 19.83% 13.78% 1.85% KRX-Dow Jones KBW Regional Bank 15.70% 19.34% 15.81% NA S&P 500 7.42% 17.27% 17.31% 7.88% Institutional Ownership 41.66% Insider Ownership 3.88% Employee 401K 1.63% Source: Bloomberg Source: NASDAQ and internal data Source: SNL 21 S&T Bank (+19.07%) KBW Regional Bank (+13.02) NASDAQ Bank (+10.64) S&P 500 (+5.25) Stock Price Change (%) Total Annualized Shareholder Return Includes reinvested dividends (Data as of 06.30.15) |
 Lines
of Business Commercial Banking
• 48 commercial bankers • 19 business bankers • Privately held companies with sales up to $150 million • Regional team based approach to credit delivery • Dedicated small business (B2B) delivery channel Retail Banking • Competitive, relationship driven • Robust suite of deposit and loan products • Over 120,000 households • 63 branches; average size of $71.2 million • Technology driven with over 87,000 online banking and over 36,000 mobile banking customers S&T-Evergreen Insurance • Full service agency – Commercial P&C (75%) – Group life and health (13%) – Personal lines (12%) • Annual revenue of $5.2 million • Focus on increasing penetration of S&T customer base Wealth Management • $2.0 billion AUM • 3 divisions – S&T Trust – S&T Financial Services – RIA/Stewart Capital • Annual revenue of $11.3 million • Stewart Capital Mid-Cap Fund (SCMFX) with $103 million in assets • 4-Star Morningstar rating, 5 year & since inception |
 The
Right Size •
Big enough to: – Provide full complement of products and services – Access technology – Access capital markets – Attract talent – Expand – mergers and acquisitions/de novo • Small enough to: – Stay close to our customers – Understand our markets – Be responsive 23 |
 Income Statement Dollars in thousands, except per share data 24 |
 Balance Sheet Dollars in thousands 25 |
 Loan
Portfolio Dollars in thousands
26 |
 Asset
Quality 27
Dollars in thousands |
 Capital ** Refer to appendix for reconciliation of Non-GAAP financial measures 28 |
 APPENDIX – Non-GAAP Measures 29 |
 APPENDIX – Non-GAAP Measures 30 |
 Second Quarter 2015 |