Attached files
| file | filename |
|---|---|
| 8-K - 8-K - SOUTHWEST BANCORP INC | oksb-20150727x8k.htm |
 NVESTOR PRESENTATION 17771 SWBancorp PPT backgrounds-3States-LL.jpg JULY/AUGUST 2015 NASDAQ: OKSB
 Forward Looking Statements We make forward-looking statements in this presentation that are subject to risks and uncertainties. We intend these statements to be covered by the safe harbor provision for forward-looking statements contained in the Private Securities Litigation Reform Act of 1995. These forward-looking statements include: •Statements of Southwest's goals, intentions, and expectations; •Estimates of risks and of future costs and benefits; •Expectations regarding our future financial performance and the financial performance of our operating segments; •Expectations regarding regulatory actions; •Expectations regarding our ability to utilize tax loss benefits; •Expectations regarding our stock repurchase program; •Expectations regarding dividends; •Expectations regarding acquisitions and divestitures; •Assessments of loan quality, probable loan losses, and the amount and timing of loan payoffs; •Estimates of the value of assets held for sale or available for sale; and •Statements of our ability to achieve financial and other goals. These forward-looking statements are subject to significant uncertainties because they are based upon: the amount and timing of future changes in interest rates, market behavior, and other economic conditions; future laws, regulations, and accounting principles; changes in regulatory standards and examination policies, and a variety of other matters. These other matters include, among other things, the direct and indirect effects of economic conditions on interest rates, credit quality, loan demand, liquidity, and monetary and supervisory policies of banking regulators. Because of these uncertainties, the actual future results may be materially different from the results indicated by these forward- looking statements. In addition, Southwest's past growth and performance do not necessarily indicate our future results. For other factors, risks, and uncertainties that could cause actual results to differ materially from estimates and projections contained in forward-looking statements, please read the “Risk Factors” contained in Southwest’s reports to the Securities and Exchange Commission. We do not intend, or undertake no obligation, to update or revise any forward-looking statements contained in this presentation, whether as a result of differences in actual results, changes in assumptions, or changes in other factors affecting said statements, except as required by law.
 Investor Information In connection with the proposed merger of First Commercial Bancshares, Inc. (“First Commercial”) into Southwest Bancorp, Inc. (“OKSB”), on July 7, 2015 OKSB filed with the Securities and Exchange Commission a Registration Statement on Form S-4 (File no. 333-205521) to register the shares of OKSB’s common stock to be issued to the shareholders of First Commercial. The registration statement includes a Prospectus of OKSB, a Proxy Statement of First Commercial, as well as other relevant documents concerning the proposed transaction, which will be sent to the shareholders of First Commercial seeking their approval of the proposed transaction. We urge investors and shareholders to read the Registration Statement on Form S-4, the Proxy Statement and Prospectus included with the Registration Statement on Form S-4, and any other relevant documents filed with the SEC, as well as any amendments or supplements to those documents, because they will contain important information relating to the proposed transaction. A free copy of these materials may be obtained on the SEC’s website at http://www.sec.gov. Alternatively, when available, these documents can be obtained free of charge from OKSB’s website at www.oksb.com under the tab “Investors” and then under the tab “SEC Filings.” OKSB, certain of its directors and executive officers and other persons may be deemed to be participants in the solicitation of proxies from the shareholders of First Commercial in connection with the proposed transaction under the rules of the SEC. Information about these participants is set forth in the proxy statement for OKSB’s 2015 annual meeting of shareholders, as filed with the SEC on a Schedule 14A on April 22, 2015. Additional information regarding the participants in the proxy solicitation and a description of their direct and indirect interests, by security holdings or otherwise, may be obtained by reading the definitive proxy statement and other relevant materials, when available, to be filed by OKSB with the SEC in conjunction with the proposed transaction. Free copies of this document may be obtained as described in the preceding paragraph.
 COMPANY OVERVIEW
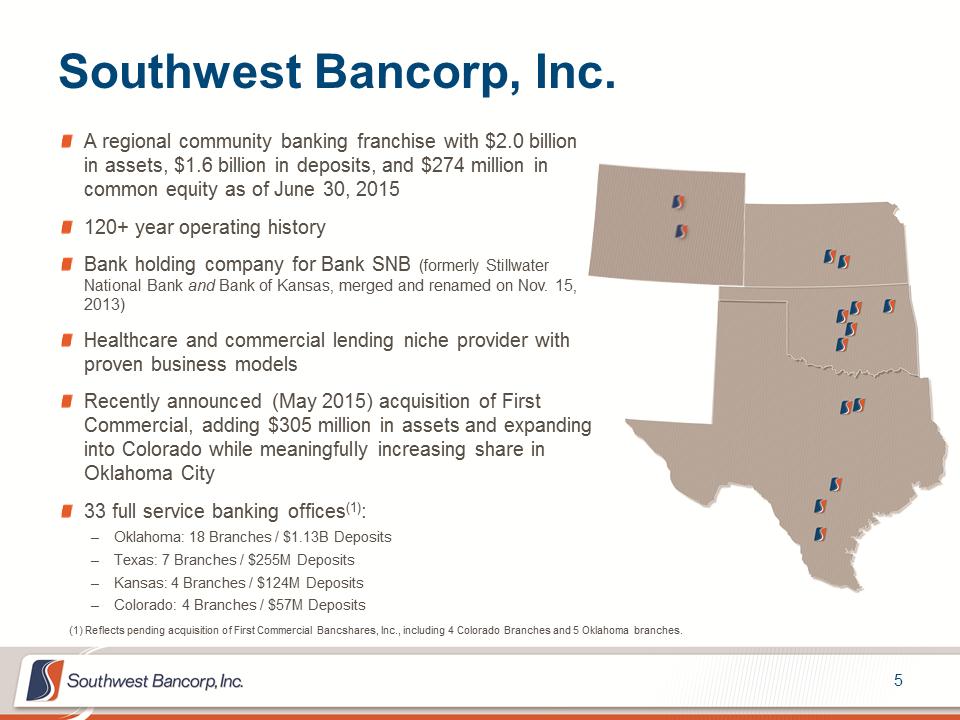 Southwest Bancorp, Inc. A regional community banking franchise with $2.0 billion in assets, $1.6 billion in deposits, and $274 million in common equity as of June 30, 2015 120+ year operating history Bank holding company for Bank SNB (formerly Stillwater National Bank and Bank of Kansas, merged and renamed on Nov. 15, 2013) Healthcare and commercial lending niche provider with proven business models Recently announced (May 2015) acquisition of First Commercial, adding $305 million in assets and expanding into Colorado while meaningfully increasing share in Oklahoma City 33 full service banking offices(1): –Oklahoma: 18 Branches / $1.13B Deposits –Texas: 7 Branches / $255M Deposits –Kansas: 4 Branches / $124M Deposits –Colorado: 4 Branches / $57M Deposits (1) Reflects pending acquisition of First Commercial Bancshares, Inc., including 4 Colorado Branches and 5 Oklahoma branches.
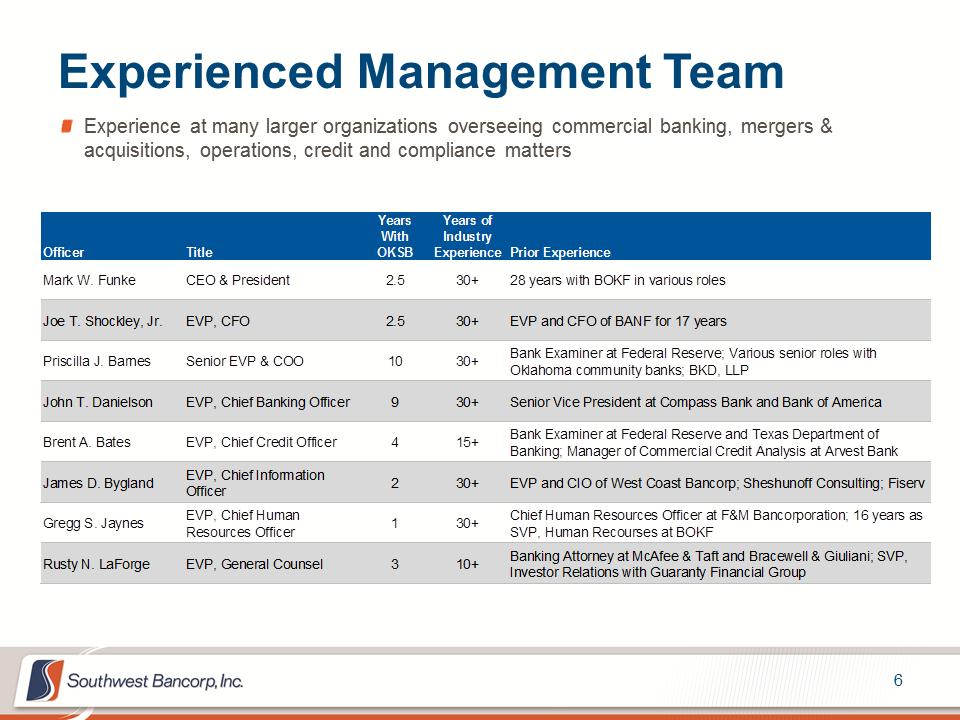 Experienced Management Team Experience at many larger organizations overseeing commercial banking, mergers & acquisitions, operations, credit and compliance matters YearsYears ofWithIndustryOfficerTitleOKSBExperiencePrior ExperienceMark W. FunkeCEO & President2.530+28 years with BOKF in various rolesJoe T. Shockley, Jr.EVP, CFO2.530+EVP and CFO of BANF for 17 yearsPriscilla J. BarnesSenior EVP & COO1030+Bank Examiner at Federal Reserve; Various senior roles with Oklahoma community banks; BKD, LLPJohn T. DanielsonEVP, Chief Banking Officer930+Senior Vice President at Compass Bank and Bank of AmericaBrent A. BatesEVP, Chief Credit Officer415+Bank Examiner at Federal Reserve and Texas Department of Banking; Manager of Commercial Credit Analysis at Arvest BankJames D. ByglandEVP, Chief Information Officer230+EVP and CIO of West Coast Bancorp; Sheshunoff Consulting; FiservGregg S. JaynesEVP, Chief Human Resources Officer130+Chief Human Resources Officer at F&M Bancorporation; 16 years as SVP, Human Recourses at BOKFRusty N. LaForgeEVP, General Counsel310+Banking Attorney at McAfee & Taft and Bracewell & Giuliani; SVP, Investor Relations with Guaranty Financial Group
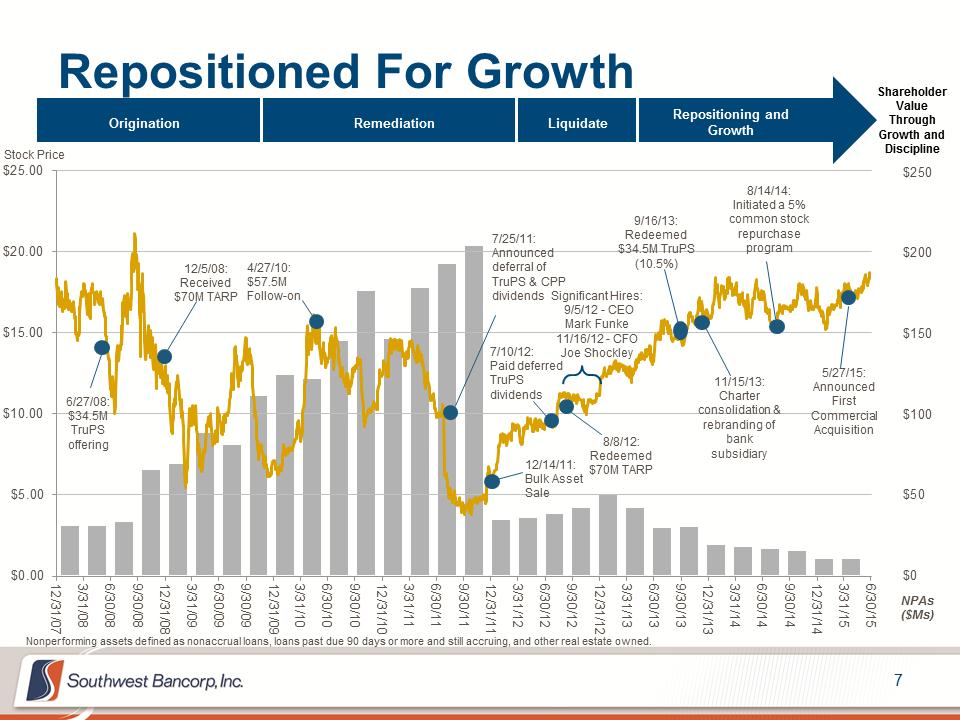 Repositioned For Growth $0 $50 $100 $150 $200 $250 $0.00 $5.00 $10.00 $15.00 $20.00 $25.00 12/ 31/ 07 3/ 31/ 08 6/ 30/ 08 9/ 30/ 08 12/ 31/ 08 3/ 31/ 09 6/ 30/ 09 9/ 30/ 09 12/ 31/ 09 3/ 31/ 10 6/ 30/ 10 9/ 30/ 10 12/ 31/ 10 3/ 31/ 11 6/ 30/ 11 9/ 30/ 11 12/ 31/ 11 3/ 31/ 12 6/ 30/ 12 9/ 30/ 12 12/ 31/ 12 3/ 31/ 13 6/ 30/ 13 9/ 30/ 13 12/ 31/ 13 3/ 31/ 14 6/ 30/ 14 9/ 30/ 14 12/ 31/ 14 3/ 31/ 15 6/ 30/ 15 Nonperforming assets defined as nonaccrual loans, loans past due 90 days or more and still accruing, and other real estate owned. 6/27/08: $34.5M TruPS offering 12/5/08: Received $70M TARP 4/27/10: $57.5M Follow-on 12/14/11: Bulk Asset Sale 7/10/12: Paid deferred TruPS dividends 8/8/12: Redeemed $70M TARP Significant Hires: 9/5/12 - CEO Mark Funke 11/16/12 - CFO Joe Shockley 9/16/13: Redeemed $34.5M TruPS (10.5%) 11/15/13: Charter consolidation & rebranding of bank subsidiary 8/14/14: Initiated a 5% common stock repurchase program 5/27/15: Announced First Commercial Acquisition Origination Remediation Liquidate Repositioning and Growth Shareholder Value Through Growth and Discipline 7/25/11: Announced deferral of TruPS & CPP dividends Stock Price NPAs ($Ms)
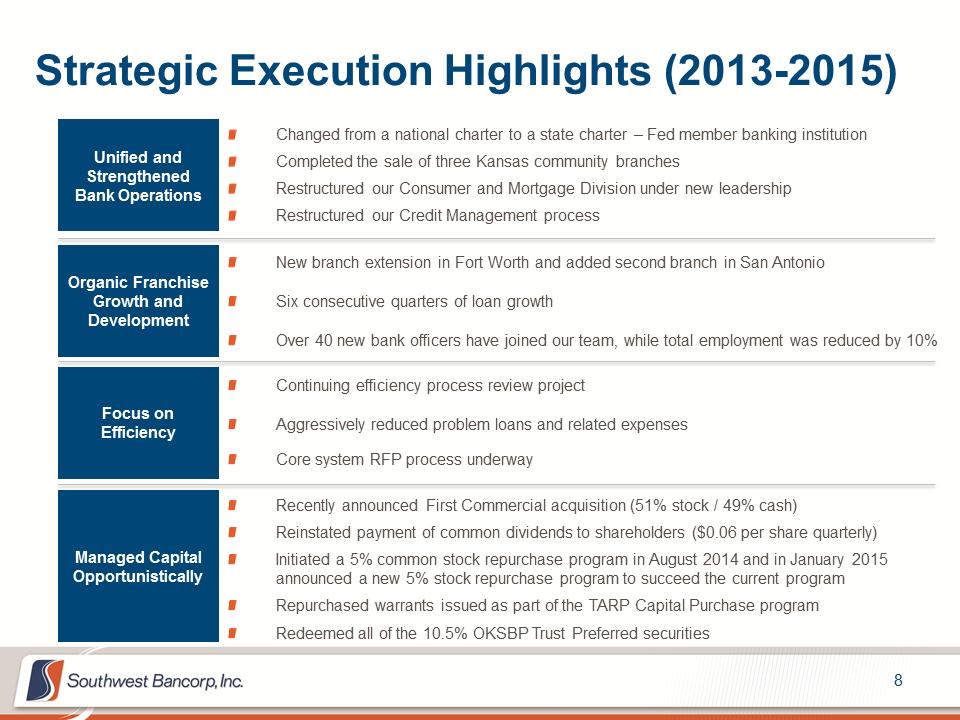 Strategic Execution Highlights (2013-2015) Continuing efficiency process review project Aggressively reduced problem loans and related expenses Core system RFP process underway Organic Franchise Growth and Development Focus on Efficiency Unified and Strengthened Bank Operations Managed Capital Opportunistically Changed from a national charter to a state charter – Fed member banking institution Completed the sale of three Kansas community branches Restructured our Consumer and Mortgage Division under new leadership Restructured our Credit Management process Recently announced First Commercial acquisition (51% stock / 49% cash) Reinstated payment of common dividends to shareholders ($0.06 per share quarterly) Initiated a 5% common stock repurchase program in August 2014 and in January 2015 announced a new 5% stock repurchase program to succeed the current program Repurchased warrants issued as part of the TARP Capital Purchase program Redeemed all of the 10.5% OKSBP Trust Preferred securities New branch extension in Fort Worth and added second branch in San Antonio Six consecutive quarters of loan growth Over 40 new bank officers have joined our team, while total employment was reduced by 10%
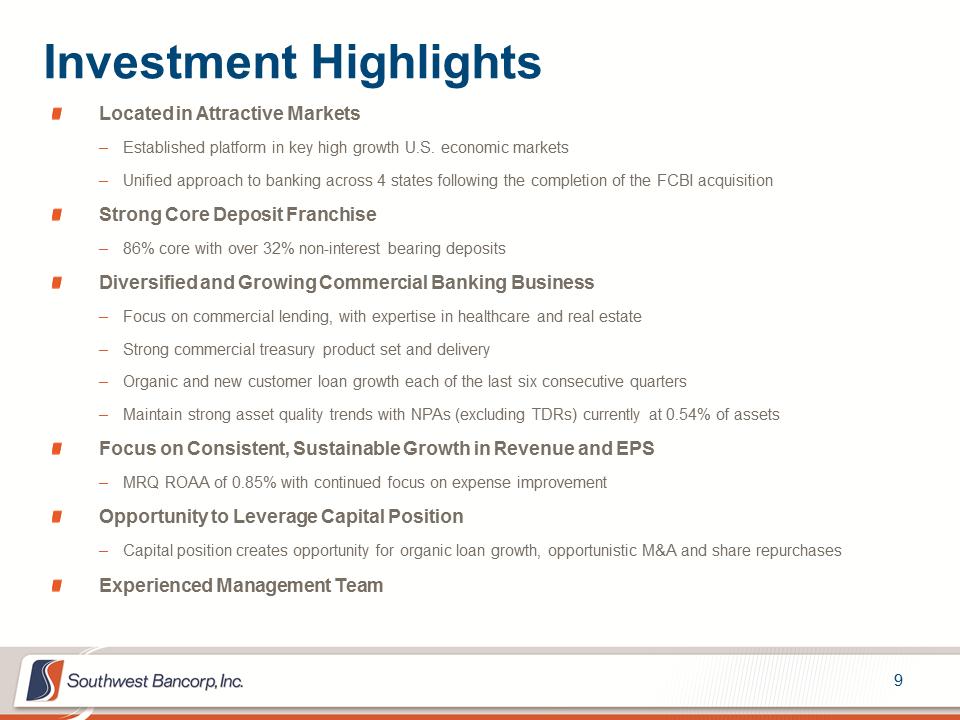 Investment Highlights Located in Attractive Markets –Established platform in key high growth U.S. economic markets –Unified approach to banking across 4 states following the completion of the FCBI acquisition Strong Core Deposit Franchise –86% core with over 32% non-interest bearing deposits Diversified and Growing Commercial Banking Business –Focus on commercial lending, with expertise in healthcare and real estate –Strong commercial treasury product set and delivery –Organic and new customer loan growth each of the last six consecutive quarters –Maintain strong asset quality trends with NPAs (excluding TDRs) currently at 0.54% of assets Focus on Consistent, Sustainable Growth in Revenue and EPS –MRQ ROAA of 0.85% with continued focus on expense improvement Opportunity to Leverage Capital Position –Capital position creates opportunity for organic loan growth, opportunistic M&A and share repurchases Experienced Management Team
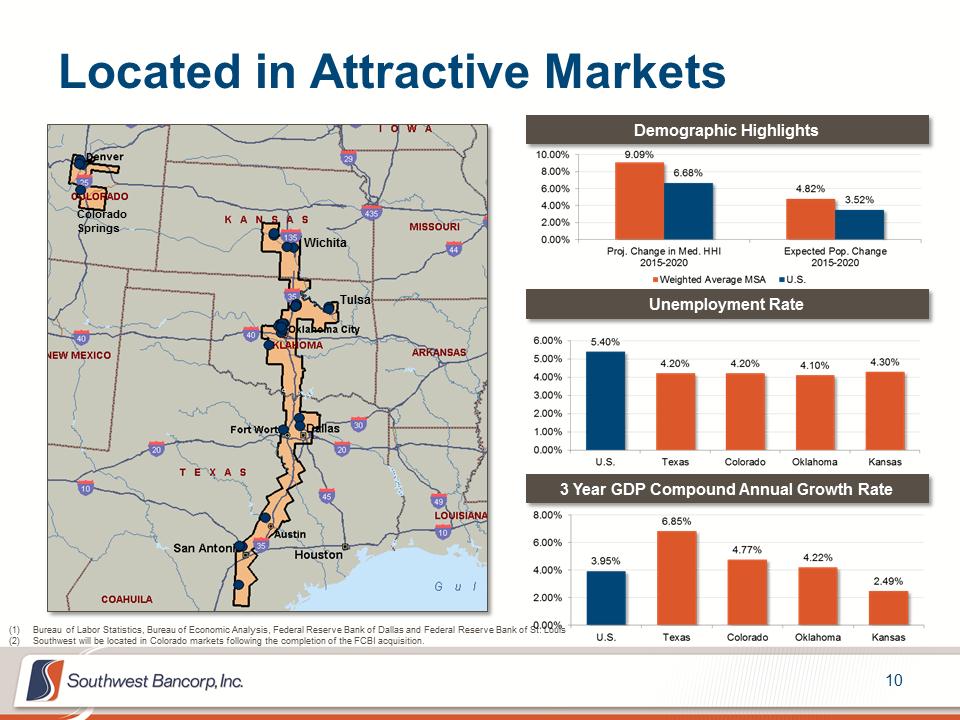 Located in Attractive Markets (1)Bureau of Labor Statistics, Bureau of Economic Analysis, Federal Reserve Bank of Dallas and Federal Reserve Bank of St. Louis (2)Southwest will be located in Colorado markets following the completion of the FCBI acquisition. Demographic Highlights Unemployment Rate Colorado Springs Wichita Tulsa 3 Year GDP Compound Annual Growth Rate
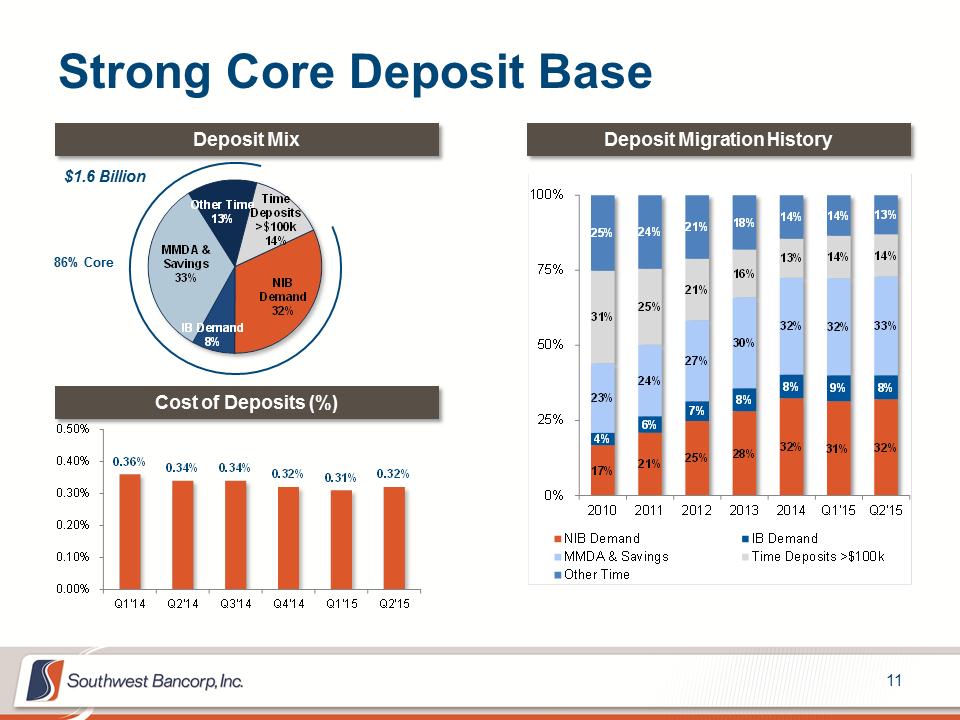 Strong Core Deposit Base Deposit Migration History Cost of Deposits (%) Deposit Mix 86% Core $1.6 Billion 0.36%0.34%0.34%0.32%0.31%0.32% 0.00% 0.10% 0.20% 0.30% 0.40% 0.50% Q1'14Q2'14Q3'14Q4'14Q1'15Q2'15 NIB Demand32% IB Demand8% MMDA & Savings33% Other Time13% Time Deposits >$100k14% 17% 21% 25% 28% 32% 31% 32% 4% 6% 7% 8% 8% 9% 8% 23% 24% 27% 30% 32% 32% 33% 31% 25% 21% 16% 13% 14% 14% 25% 24% 21% 18% 14% 14% 13% 0% 25% 50% 75% 100% 20102011201220132014Q1'15Q2'15NIB DemandIB DemandMMDA & SavingsTime Deposits >$100kOther Time
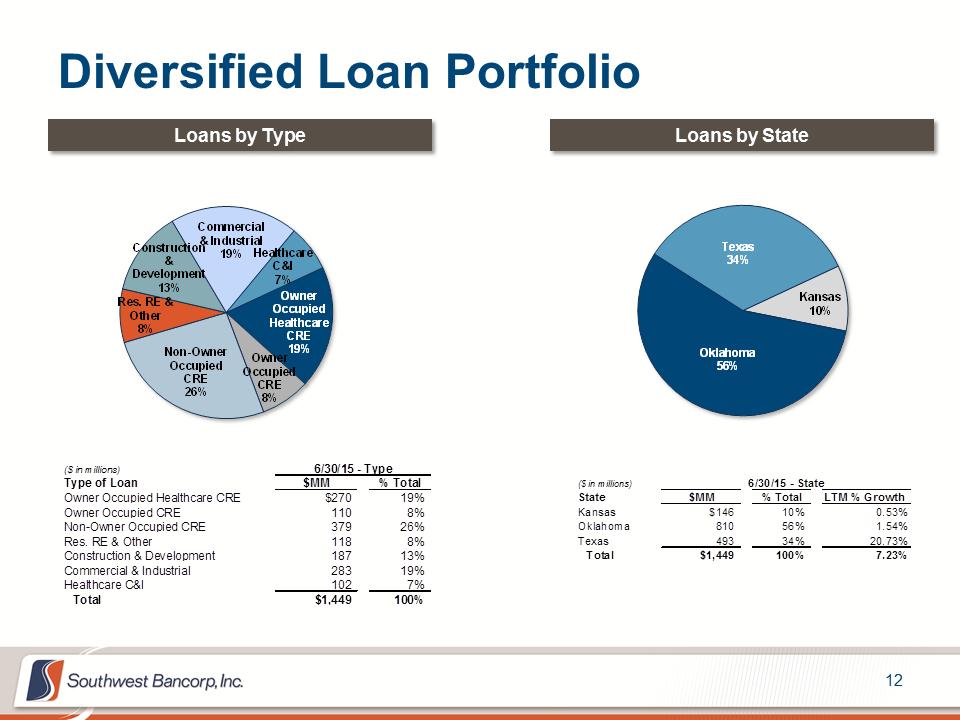 Diversified Loan Portfolio Owner Occupied Healthcare CRE19% Owner Occupied CRE8% Non-Owner Occupied CRE26% Res. RE & Other8% Construction & Development13% Commercial & Industrial19%Healthcare C&I7% Loans by Type Loans by State ($ in millions)6/30/15 - TypeType of Loan$MM% TotalOwner Occupied Healthcare CRE$27019% Owner Occupied CRE1108% Non-Owner Occupied CRE37926% Res. RE & Other1188% Construction & Development18713% Commercial & Industrial28319% Healthcare C&I1027% Total$1,449100% Kansas10% Oklahoma56% Texas34% ($ in millions) State$MM% TotalLTM % GrowthKansas$14610%0.53% Oklahoma81056%1.54% Texas49334%20.73% Total$1,449100%7.23% 6/30/15 - State
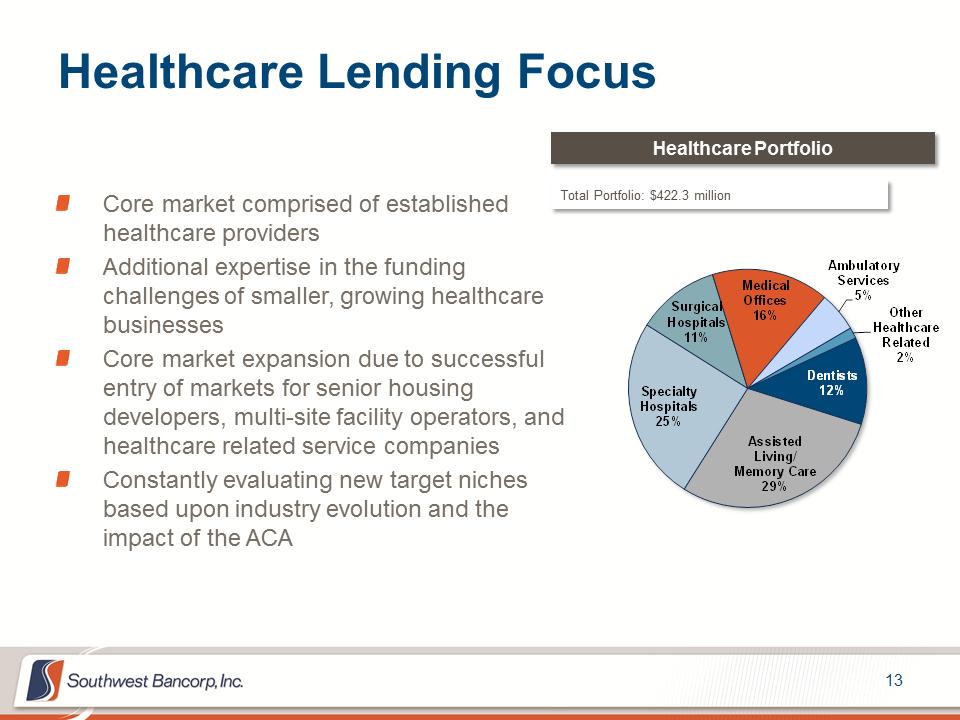 Healthcare Lending Focus Core market comprised of established healthcare providers Additional expertise in the funding challenges of smaller, growing healthcare businesses Core market expansion due to successful entry of markets for senior housing developers, multi-site facility operators, and healthcare related service companies Constantly evaluating new target niches based upon industry evolution and the impact of the ACA Healthcare Portfolio Total Portfolio: $422.3 million Dentists12% Assisted Living/ Memory Care29% Specialty Hospitals25% Surgical Hospitals11% Medical Offices16% Ambulatory Services5% Other Healthcare Related2%
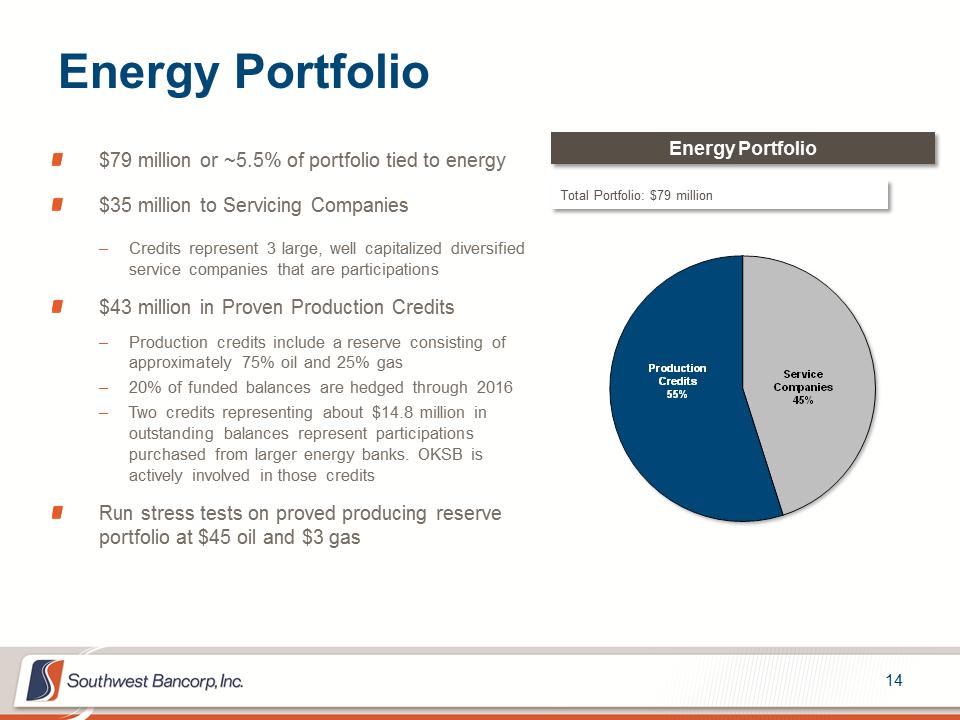 Energy Portfolio $79 million or ~5.5% of portfolio tied to energy $35 million to Servicing Companies –Credits represent 3 large, well capitalized diversified service companies that are participations $43 million in Proven Production Credits –Production credits include a reserve consisting of approximately 75% oil and 25% gas –20% of funded balances are hedged through 2016 –Two credits representing about $14.8 million in outstanding balances represent participations purchased from larger energy banks. OKSB is actively involved in those credits Run stress tests on proved producing reserve portfolio at $45 oil and $3 gas Energy Portfolio Total Portfolio: $79 million Service Companies45% Production Credits55%
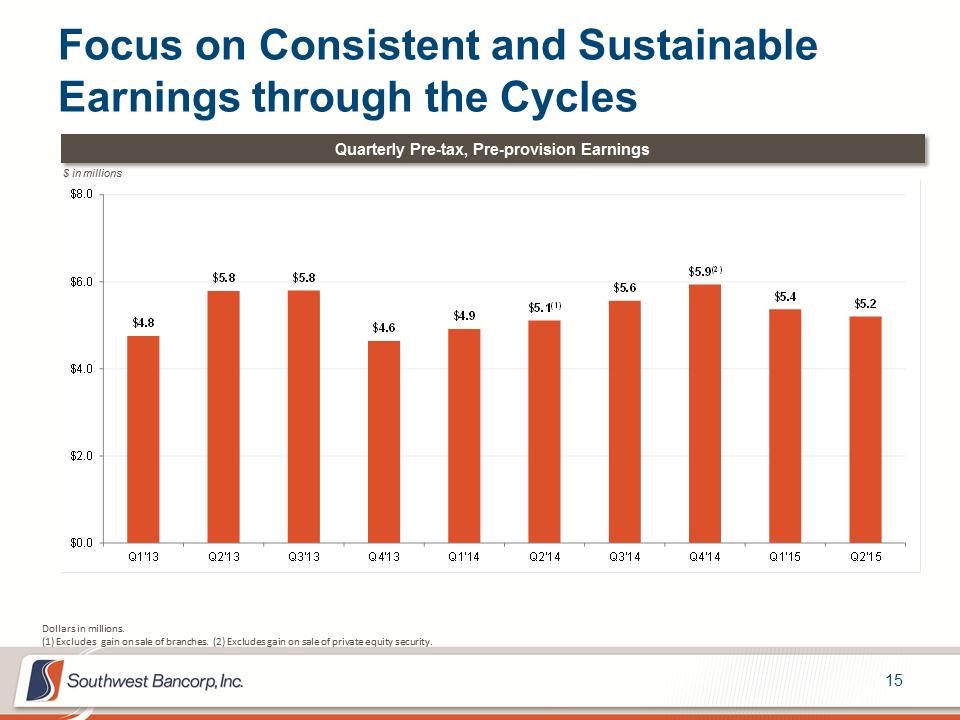 Focus on Consistent and Sustainable Earnings through the Cycles Quarterly Pre-tax, Pre-provision Earnings $ in millions Dollars in millions. (1) Excludes gain on sale of branches. (2) Excludes gain on sale of private equity security. $4.8$5.8$5.8$4.6$4.9$5.1(1) $5.6$5.9(2) $5.4$5.2$0.0$2.0$4.0$6.0$8.0Q1'13Q2'13Q3'13Q4'13Q1'14Q2'14Q3'14Q4'14Q1'15Q2'15
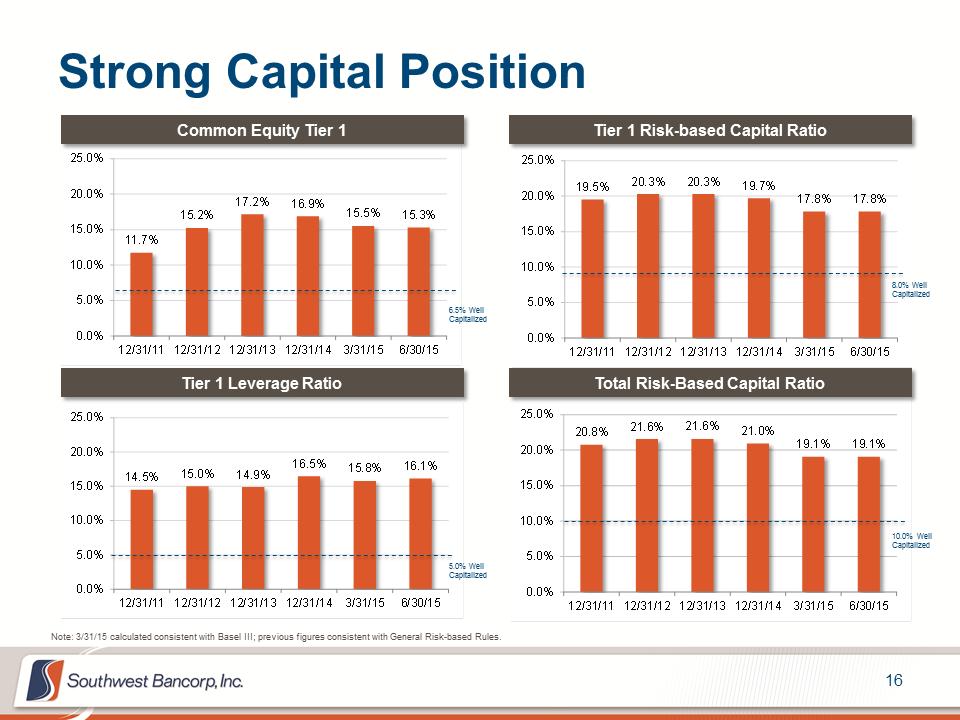 Strong Capital Position 11.7% 15.2% 17.2%16.9% 15.5%15.3% 0.0% 5.0% 10.0% 15.0% 20.0% 25.0% 12/31/1112/31/1212/31/1312/31/143/31/156/30/15 19.5%20.3%20.3%19.7% 17.8%17.8% 0.0% 5.0% 10.0% 15.0% 20.0% 25.0% 12/31/1112/31/1212/31/1312/31/143/31/156/30/15 20.8%21.6%21.6%21.0% 19.1%19.1% 0.0% 5.0% 10.0% 15.0% 20.0% 25.0% 12/31/1112/31/1212/31/1312/31/143/31/156/30/15 14.5%15.0%14.9% 16.5%15.8%16.1% 0.0% 5.0% 10.0% 15.0% 20.0% 25.0% 12/31/1112/31/1212/31/1312/31/143/31/156/30/15 Tier 1 Leverage Ratio Common Equity Tier 1 Note: 3/31/15 calculated consistent with Basel III; previous figures consistent with General Risk-based Rules. Tier 1 Risk-based Capital Ratio Total Risk-Based Capital Ratio 6.5% Well Capitalized 8.0% Well Capitalized 10.0% Well Capitalized 5.0% Well Capitalized
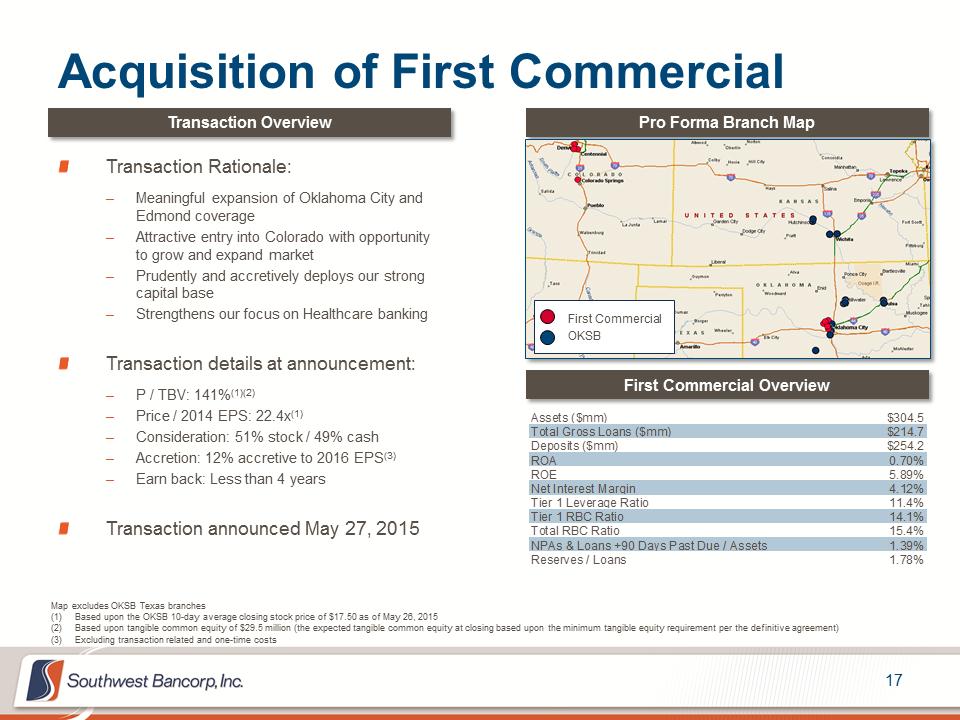 Acquisition of First Commercial Map excludes OKSB Texas branches (1)Based upon the OKSB 10-day average closing stock price of $17.50 as of May 26, 2015 (2)Based upon tangible common equity of $29.5 million (the expected tangible common equity at closing based upon the minimum tangible equity requirement per the definitive agreement) (3)Excluding transaction related and one-time costs Transaction Rationale: –Meaningful expansion of Oklahoma City and Edmond coverage –Attractive entry into Colorado with opportunity to grow and expand market –Prudently and accretively deploys our strong capital base –Strengthens our focus on Healthcare banking Transaction details at announcement: –P / TBV: 141%(1)(2) –Price / 2014 EPS: 22.4x(1) –Consideration: 51% stock / 49% cash –Accretion: 12% accretive to 2016 EPS(3) –Earn back: Less than 4 years Transaction announced May 27, 2015 Transaction Overview Pro Forma Branch Map First Commercial Overview First Commercial OKSB Assets ($mm)$304.5Total Gross Loans ($mm)$214.7Deposits ($mm)$254.2ROA0.70% ROE5.89% Net Interest Margin4.12% Tier 1 Leverage Ratio11.4% Tier 1 RBC Ratio14.1% Total RBC Ratio15.4% NPAs & Loans +90 Days Past Due / Assets1.39% Reserves / Loans1.78%
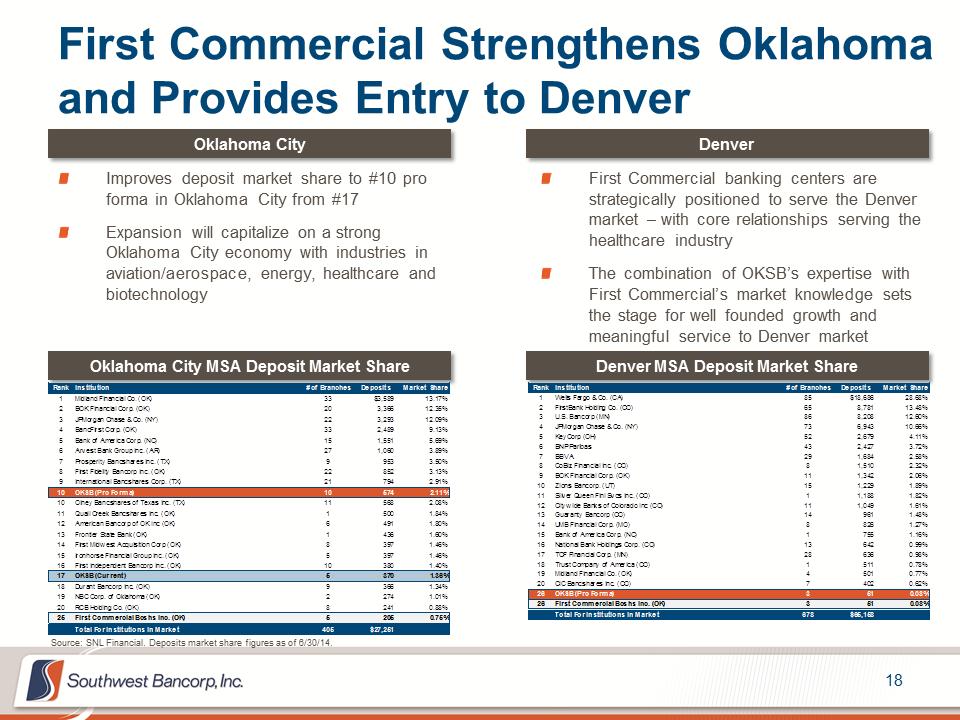 First Commercial Strengthens Oklahoma and Provides Entry to Denver Source: SNL Financial. Deposits market share figures as of 6/30/14. Oklahoma City Denver Denver MSA Deposit Market Share Improves deposit market share to #10 pro forma in Oklahoma City from #17 Expansion will capitalize on a strong Oklahoma City economy with industries in aviation/aerospace, energy, healthcare and biotechnology Oklahoma City MSA Deposit Market Share First Commercial banking centers are strategically positioned to serve the Denver market – with core relationships serving the healthcare industry The combination of OKSB’s expertise with First Commercial’s market knowledge sets the stage for well founded growth and meaningful service to Denver market RankInstitution# of BranchesDeposits Market Share1Midland Financial Co. (OK)33$3,58913.17% 2BOK Financial Corp. (OK)203,36612.35% 3JPMorgan Chase & Co. (NY)223,29312.09% 4BancFirst Corp. (OK)332,4899.13% 5Bank of America Corp. (NC)151,5515.69% 6Arvest Bank Group Inc. (AR)271,0603.89% 7Prosperity Bancshares Inc. (TX)99533.50% 8First Fidelity Bancorp Inc. (OK)228523.13% 9International Bancshares Corp. (TX)217942.91% 10OKSB (Pro Forma)105742.11% 10Olney Bancshares of Texas Inc. (TX)115682.08% 11Quail Creek Bancshares Inc. (OK)15001.84% 12American Bancorp of OK Inc (OK)64911.80% 13Frontier State Bank (OK)14361.60% 14First Midwest Acquisition Corp (OK)83971.46% 15Ironhorse Financial Group Inc. (OK)53971.46% 16First Independent Bancorp Inc. (OK)103801.40% 17OKSB (Current)53701.36% 18Durant Bancorp Inc. (OK)93661.34% 19NBC Corp. of Oklahoma (OK)22741.01% 20RCB Holding Co. (OK)82410.88% 25First Commercial Bcshs Inc. (OK)52050.75% Total For Institutions In Market405$27,251 RankInstitution# of BranchesDeposits Market Share1Wells Fargo & Co. (CA)85$18,68628.68% 2FirstBank Holding Co. (CO)658,78113.48% 3U.S. Bancorp (MN)868,20812.60% 4JPMorgan Chase & Co. (NY)736,94310.66% 5KeyCorp (OH)522,6794.11% 6BNP Paribas432,4273.72% 7BBVA291,6842.58% 8CoBiz Financial Inc. (CO)81,5102.32% 9BOK Financial Corp. (OK)111,3422.06% 10Zions Bancorp. (UT)151,2291.89% 11Silver Queen Finl Svcs Inc. (CO)11,1881.82% 12Citywide Banks of Colorado Inc (CO)111,0491.61% 13Guaranty Bancorp (CO)149611.48% 14UMB Financial Corp. (MO)88261.27% 15Bank of America Corp. (NC)17551.16% 16National Bank Holdings Corp. (CO)136420.99% 17TCF Financial Corp. (MN)286360.98% 18Trust Company of America (CO)15110.78% 19Midland Financial Co. (OK)45010.77% 20CIC Bancshares Inc. (CO)74020.62% 26OKSB (Pro Forma)3510.08% 26First Commercial Bcshs Inc. (OK)3510.08% Total For Institutions In Market678$65,158
 FINANCIAL PERFORMANCE
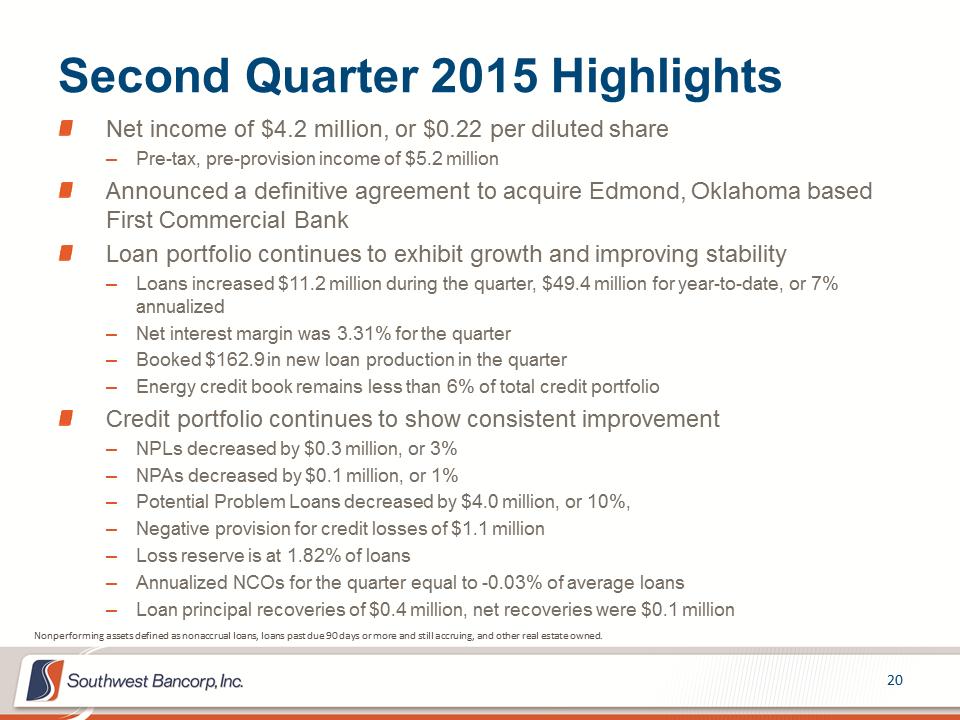 Second Quarter 2015 Highlights Net income of $4.2 million, or $0.22 per diluted share –Pre-tax, pre-provision income of $5.2 million Announced a definitive agreement to acquire Edmond, Oklahoma based First Commercial Bank Loan portfolio continues to exhibit growth and improving stability –Loans increased $11.2 million during the quarter, $49.4 million for year-to-date, or 7% annualized –Net interest margin was 3.31% for the quarter –Booked $162.9 in new loan production in the quarter –Energy credit book remains less than 6% of total credit portfolio Credit portfolio continues to show consistent improvement –NPLs decreased by $0.3 million, or 3% –NPAs decreased by $0.1 million, or 1% –Potential Problem Loans decreased by $4.0 million, or 10%, –Negative provision for credit losses of $1.1 million –Loss reserve is at 1.82% of loans –Annualized NCOs for the quarter equal to -0.03% of average loans –Loan principal recoveries of $0.4 million, net recoveries were $0.1 million Nonperforming assets defined as nonaccrual loans, loans past due 90 days or more and still accruing, and other real estate owned.
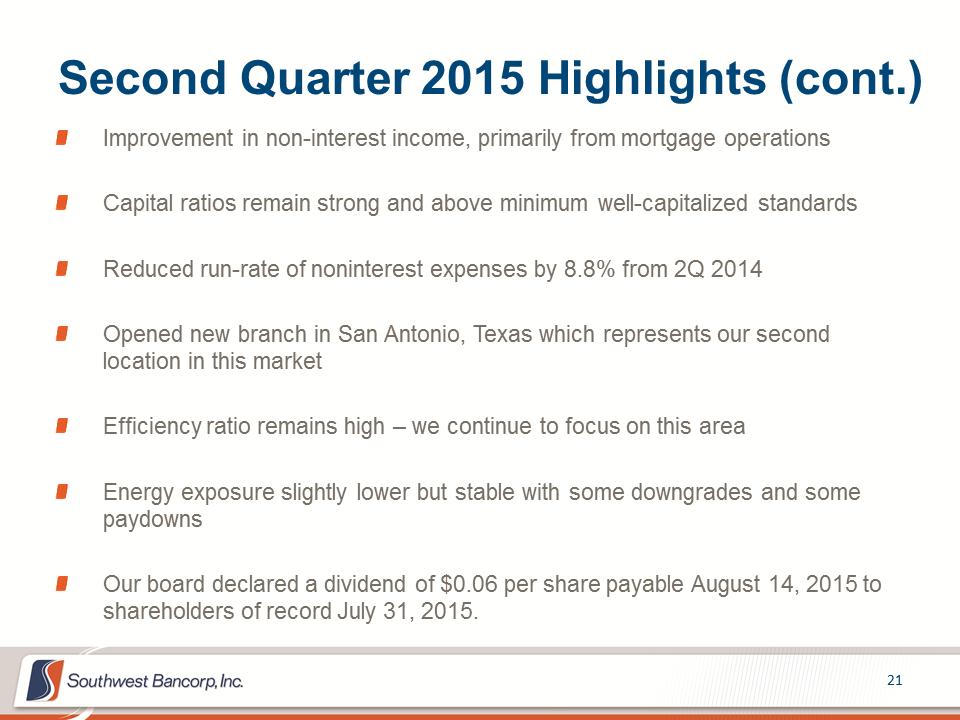 Second Quarter 2015 Highlights (cont.) Improvement in non-interest income, primarily from mortgage operations Capital ratios remain strong and above minimum well-capitalized standards Reduced run-rate of noninterest expenses by 8.8% from 2Q 2014 Opened new branch in San Antonio, Texas which represents our second location in this market Efficiency ratio remains high – we continue to focus on this area Energy exposure slightly lower but stable with some downgrades and some paydowns Our board declared a dividend of $0.06 per share payable August 14, 2015 to shareholders of record July 31, 2015.
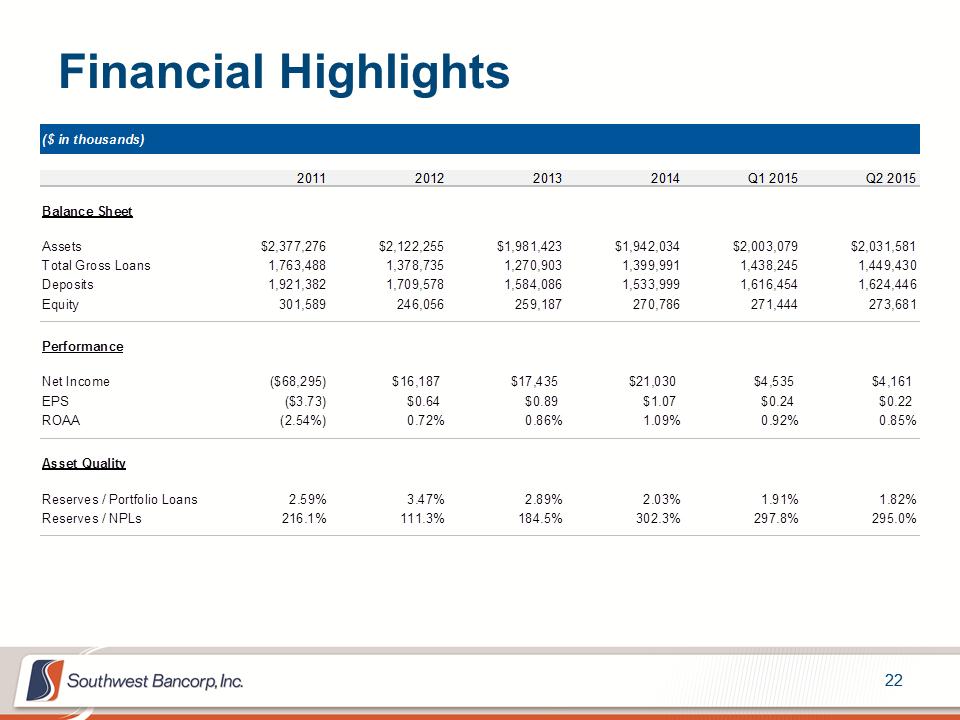 Financial Highlights ($ in thousands) 2011201220132014Q1 2015Q2 2015Balance SheetAssets$2,377,276$2,122,255$1,981,423$1,942,034$2,003,079$2,031,581Total Gross Loans1,763,4881,378,7351,270,9031,399,9911,438,2451,449,430Deposits1,921,3821,709,5781,584,0861,533,9991,616,4541,624,446Equity301,589246,056259,187270,786271,444273,681PerformanceNet Income($68,295)$16,187$17,435$21,030$4,535$4,161EPS($3.73)$0.64$0.89$1.07$0.24$0.22ROAA(2.54%)0.72%0.86%1.09%0.92%0.85% Asset QualityReserves / Portfolio Loans2.59%3.47%2.89%2.03%1.91%1.82% Reserves / NPLs216.1%111.3%184.5%302.3%297.8%295.0%
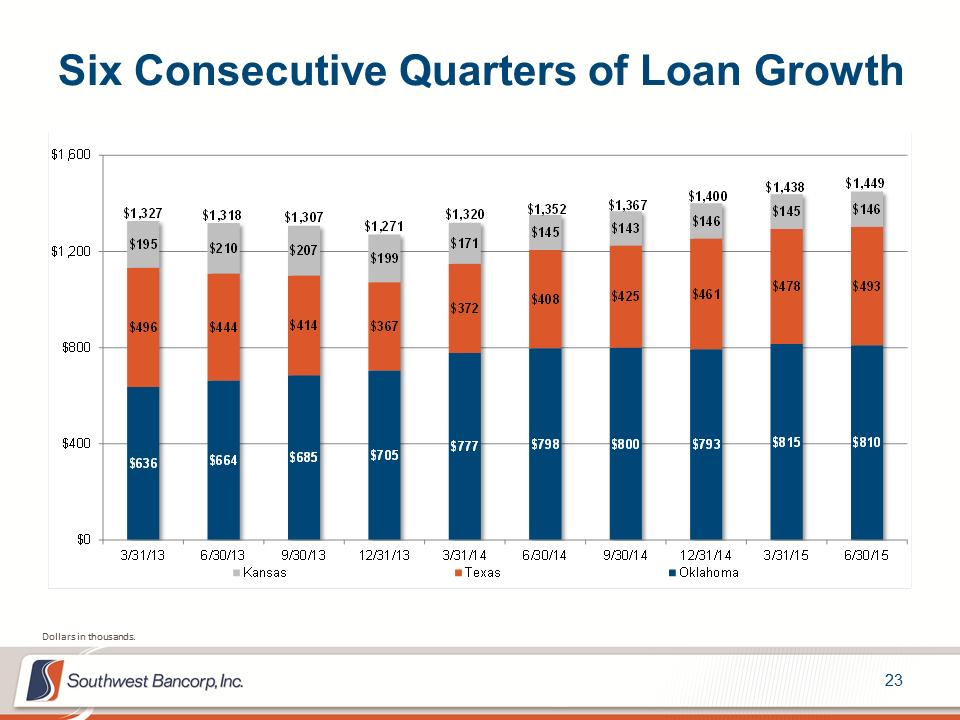 Six Consecutive Quarters of Loan Growth $636$664$685$705$777$798$800$793$815$810$496$444$414$367$372$408$425$461$478$493$195$210$207$199$171$145$143$146$145$146$0$400$800$1,200$1,6003/31/136/30/139/30/1312/31/133/31/146/30/149/30/1412/31/143/31/156/30/15KansasTexasOklahoma$1,327$1,318$1,307$1,271$1,438$1,320$1,352$1,367$1,400$1,449 Dollars in thousands.
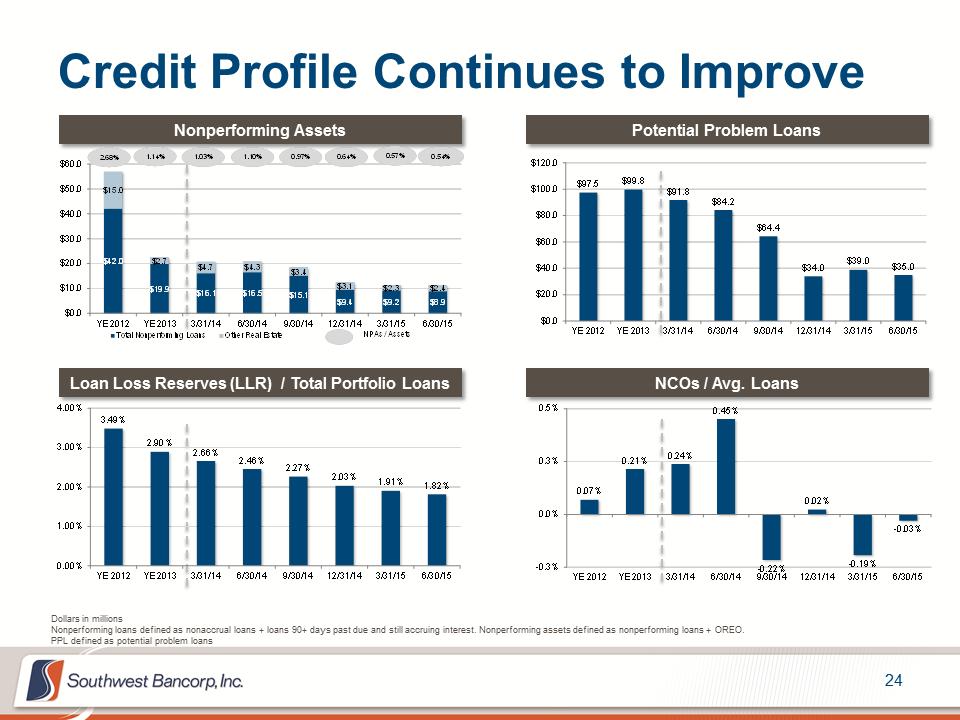 Credit Profile Continues to Improve $97.5$99.8$91.8$84.2$64.4$34.0$39.0$35.0$0.0$20.0$40.0$60.0$80.0$100.0$120.0YE 2012YE 20133/31/146/30/149/30/1412/31/143/31/156/30/15 Nonperforming Assets Loan Loss Reserves (LLR) / Total Portfolio Loans Dollars in millions Nonperforming loans defined as nonaccrual loans + loans 90+ days past due and still accruing interest. Nonperforming assets defined as nonperforming loans + OREO. PPL defined as potential problem loans Potential Problem Loans NCOs / Avg. Loans 3.49% 2.90% 2.66% 2.46% 2.27% 2.03%1.91%1.82% 0.00% 1.00% 2.00% 3.00% 4.00% YE 2012YE 20133/31/146/30/149/30/1412/31/143/31/156/30/15 0.07% 0.21%0.24% 0.45% -0.22% 0.02% -0.19% -0.03% -0.3% 0.0% 0.3% 0.5% YE 2012YE 20133/31/146/30/149/30/1412/31/143/31/156/30/15 $42.0$19.9$16.1$16.5$15.1$9.4$9.2$8.9$15.0$2.7$4.7$4.3$3.4$3.1$2.3$2.4$0.0$10.0$20.0$30.0$40.0$50.0$60.0YE 2012YE 20133/31/146/30/149/30/1412/31/143/31/156/30/15Total Nonperforming LoansOther Real Estate2.68%1.14%1.03%1.10%0.97%0.64%0.57%0.54% NPAs / Assets
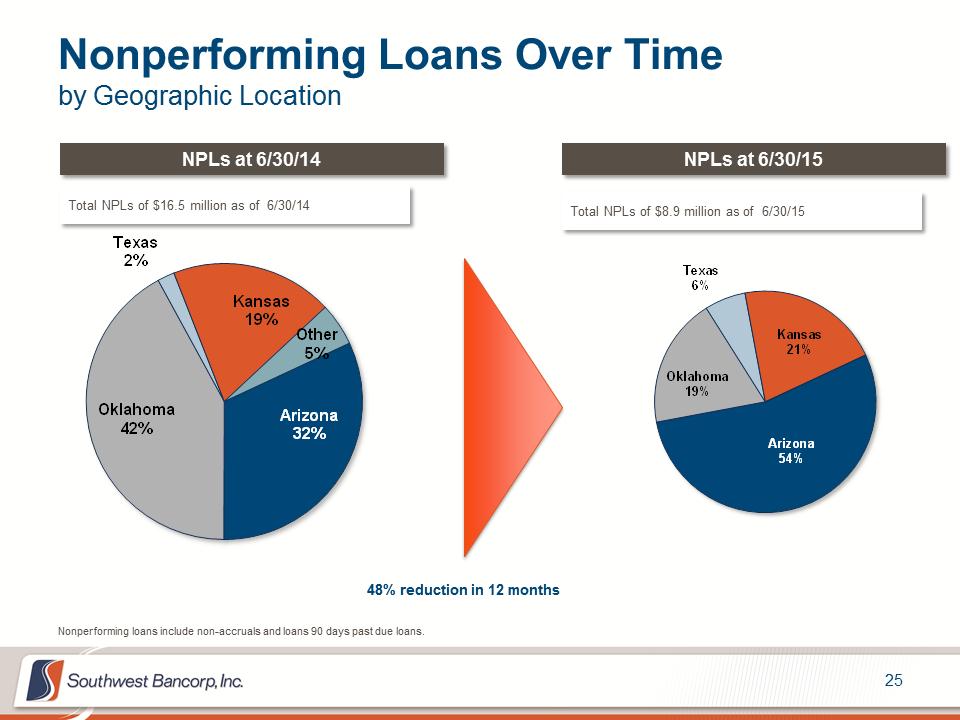 Nonperforming Loans Over Time by Geographic Location NPLs at 6/30/14 NPLs at 6/30/15 Total NPLs of $16.5 million as of 6/30/14 Total NPLs of $8.9 million as of 6/30/15 Nonperforming loans include non-accruals and loans 90 days past due loans. 48% reduction in 12 months Arizona54% Oklahoma19% Texas6% Kansas21% Arizona32% Oklahoma42% Texas2% Kansas19% Other5%
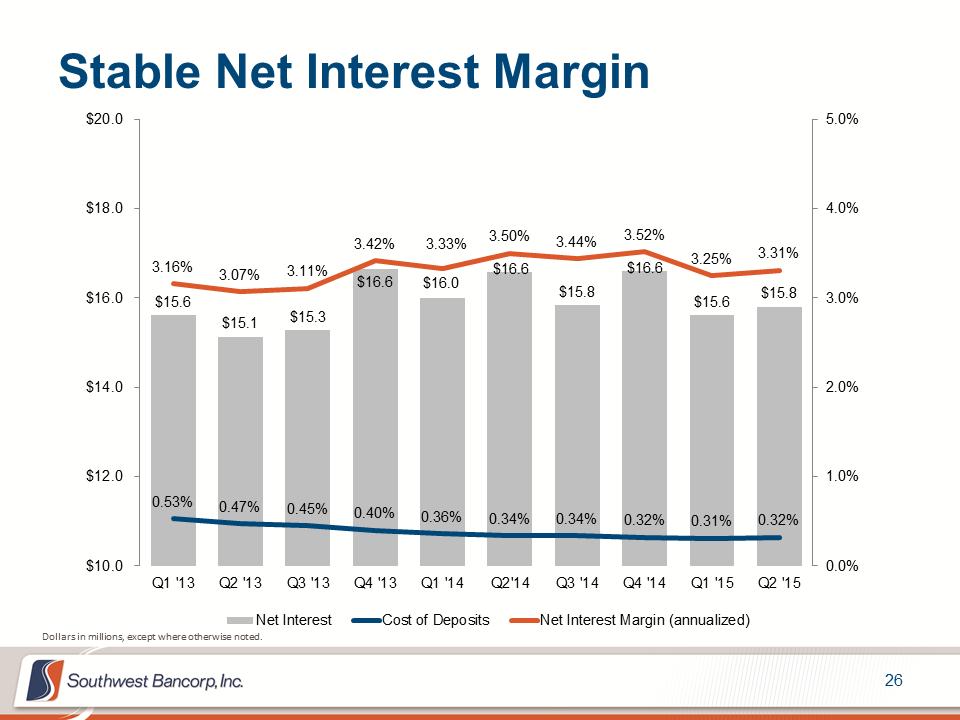 Stable Net Interest Margin $15.6 $15.1 $15.3 $16.6 $16.0 $16.6 $15.8 $16.6 $15.6 $15.8 0.53% 0.47% 0.45% 0.40% 0.36% 0.34% 0.34% 0.32% 0.31% 0.32% 3.16% 3.07% 3.11% 3.42% 3.33% 3.50% 3.44% 3.52% 3.25% 3.31% 0.0% 1.0% 2.0% 3.0% 4.0% 5.0% $10.0 $12.0 $14.0 $16.0 $18.0 $20.0 Q1 '13 Q2 '13 Q3 '13 Q4 '13 Q1 '14 Q2'14 Q3 '14 Q4 '14 Q1 '15 Q2 '15 Net Interest Cost of Deposits Net Interest Margin (annualized) Dollars in millions, except where otherwise noted.
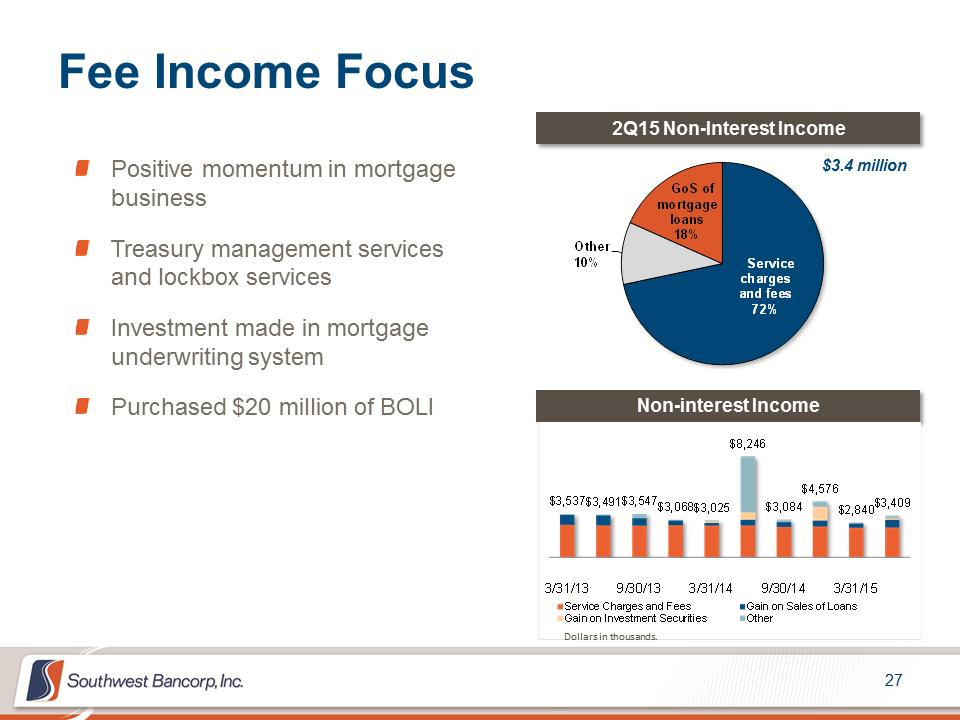 Fee Income Focus Positive momentum in mortgage business Treasury management services and lockbox services Investment made in mortgage underwriting system Purchased $20 million of BOLI 2Q15 Non-Interest Income Non-interest Income $3.4 million Service charges and fees72% Other10% GoS of mortgage loans18% $3,537$3,491$3,547$3,068$3,025$8,246$3,084$4,576$2,840$3,4093/31/139/30/133/31/149/30/143/31/15Service Charges and FeesGain on Sales of LoansGain on Investment SecuritiesOther Dollars in thousands.
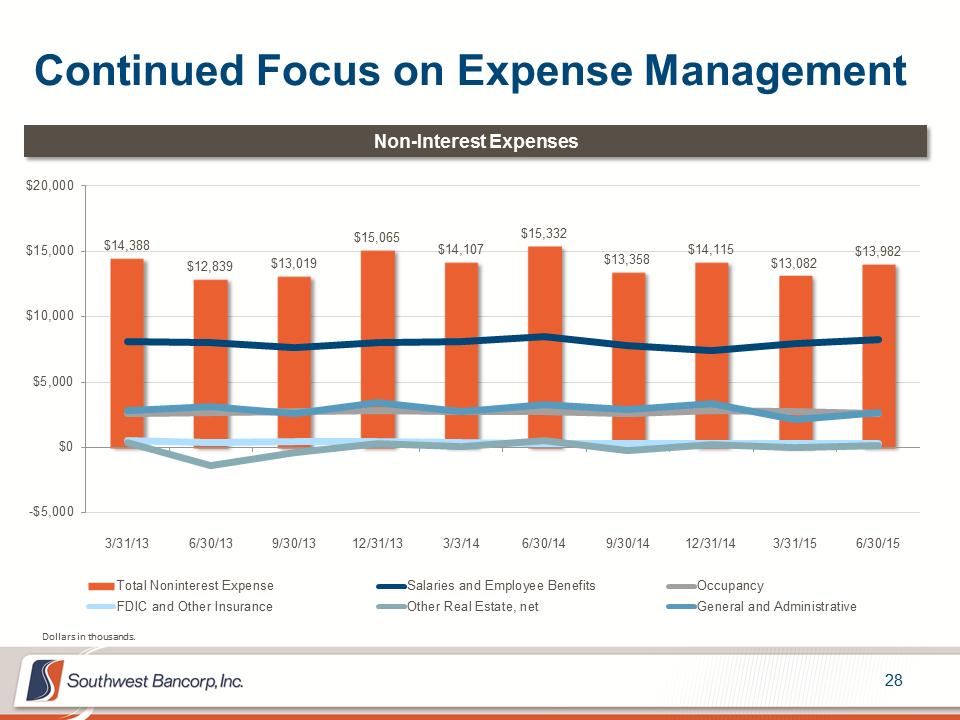 Continued Focus on Expense Management $14,388 $12,839 $13,019 $15,065 $14,107 $15,332 $13,358 $14,115 $13,082 $13,982 -$5,000 $0 $5,000 $10,000 $15,000 $20,000 3/31/13 6/30/13 9/30/13 12/31/13 3/3/14 6/30/14 9/30/14 12/31/14 3/31/15 6/30/15 Total Noninterest Expense Salaries and Employee Benefits Occupancy FDIC and Other Insurance Other Real Estate, net General and Administrative Non-Interest Expenses Dollars in thousands.
 LOOKING AHEAD
 Near Term Priorities Aggressively seek ways to efficiently and profitably deploy our excess capital, including strategic acquisitions, selective de-novo branching and product investments. Identify and acquire talented individuals and teams that will enhance our presence and profitability in select business segments and markets. Successful and efficient integration of First Commercial acquisition. Continue to improve credit quality and balance sheet strength. Maintain high credit standards while accelerating loan growth focused in areas of expertise, i.e. real estate, healthcare, commercial and energy. Improve internal operating efficiency while providing superior customer service. This includes investment in core operating systems and people. Strengthen and invest in business lines that produce non-interest income and effectively scale them across our geographic footprint. Drive a culture that produces consistent, conservative, and sustainable revenue and earnings growth.
 Investment Highlights Located in Attractive Markets –Established platform in key high growth U.S. economic markets –Unified approach to banking across 4 states following the completion of the FCBI acquisition Strong Core Deposit Franchise –86% core with over 32% non-interest bearing deposits Diversified and Growing Commercial Banking Business –Focus on commercial lending, with expertise in healthcare and real estate –Strong commercial treasury product set and delivery –Organic and new customer loan growth each of the last six consecutive quarters –Maintain strong asset quality trends with NPAs (excluding TDRs) currently at 0.54% of assets Focus on Consistent, Sustainable Growth in Revenue and EPS –MRQ ROAA of 0.85% with continued focus on expense improvement Opportunity to Leverage Capital Position –Capital position creates opportunity for organic loan growth, opportunistic M&A and share repurchases Experienced Management Team
 INVESTOR PRESENTATION 17771 SWBancorp PPT backgrounds-3States-LL.jpg JULY/AUGUST 2015 NASDAQ: OKSB