Attached files
| file | filename |
|---|---|
| 8-K - 8-K - SIMON PROPERTY GROUP INC /DE/ | a2225413z8-k.htm |
Use these links to rapidly review the document
TABLE OF CONTENTS
Exhibit 99.1
SIMON PROPERTY GROUP
EARNINGS RELEASE & SUPPLEMENTAL INFORMATION
UNAUDITED SECOND QUARTER 2015
- (1)
- Includes reconciliation of consolidated net income to funds from operations.
| 2Q 2015 SUPPLEMENTAL |
|
1 |

| Contacts: | FOR IMMEDIATE RELEASE | |||
| Tom Ward | 317-685-7330 Investors | |||
| Les Morris | 317-263-7711 Media | |||
SIMON PROPERTY GROUP REPORTS SECOND QUARTER 2015 RESULTS AND RAISES QUARTERLY DIVIDEND AND
FULL YEAR 2015 GUIDANCE
INDIANAPOLIS, July 24, 2015 - Simon, a leading global retail real estate company, today reported results for the quarter ended June 30, 2015.
- •
- Funds from Operations ("FFO") was $955.4 million, or $2.63 per diluted share, as compared to $783.8 million, or $2.16
per diluted share, in the prior year period, a 21.8% increase. Included in the second quarter 2015 results is $80.2 million, or $0.22 per diluted share, related to a gain upon sale of
marketable securities. The second quarter 2014 results include a net contribution of $0.05 per diluted share from the Washington Prime Group Inc. ("WPG") properties that were spun-off effective
May 28, 2014.
- •
- Net income attributable to common stockholders was $472.9 million, or $1.52 per diluted share, as compared to
$406.6 million, or $1.31 per diluted share, in the prior year period.
- •
- Growth in comparable FFO per diluted share for the three months ended June 30, 2015 was 14.2%.
- •
- Funds from Operations ("FFO") was $1.786 billion, or $4.92 per diluted share, as compared to $1.649 billion, or $4.54
per diluted share, in the prior year period.
- •
- Net income attributable to common stockholders was $835.1 million, or $2.69 per diluted share, as compared to
$748.2 million, or $2.41 per diluted share, in the prior year period.
- •
- Growth in comparable FFO per diluted share for the six months ended June 30, 2015 was 10.8%.
- 1
- For a reconciliation of FFO and net income per diluted share on a comparable basis, please see Footnote H of the Footnotes to Unaudited Reconciliation of Non-GAAP Financial Measures.
| 2Q 2015 SUPPLEMENTAL |
|
2 |
EARNINGS RELEASE
"This was an excellent quarter for Simon, with strong financial and operational performance," said David Simon, Chairman and CEO. "Our growing development and redevelopment opportunities position us to continue to deliver strong results for our stockholders. Based upon our results to date and expectations for the remainder of 2015, we are once again raising our quarterly dividend and increasing our full-year 2015 guidance."
U.S. MALLS AND PREMIUM OUTLETS OPERATING STATISTICS
| |
AS OF JUNE 30, |
|
||||||
|---|---|---|---|---|---|---|---|---|
| |
YEAR-OVER-YEAR CHANGE |
|||||||
| |
2015 | 2014 | ||||||
Occupancy (1) |
96.1% | 96.5% | –40 bps | |||||
Base Minimum Rent per sq. ft. (1) |
$ | 48.07 | $ | 45.83 | +4.9% | |||
Releasing Spread per sq. ft. (1)(2) |
$ | 10.87 | $ | 11.06 | –$0.19 | |||
Releasing Spread (percentage change) (1)(2) |
18.4% | 20.0% | –160 bps | |||||
Total Sales per sq. ft. (3) |
$ | 620 | $ | 608 | +2.0% | |||
- (1)
- Represents mall stores in Malls and all owned square footage in Premium Outlets.
- (2)
- Same space measure that compares opening and closing rates on individual spaces leased during trailing 12-month period.
- (3)
- Trailing 12-month sales per square foot for mall stores less than 10,000 square feet in Malls and all owned square footage in Premium Outlets.
COMPARABLE PROPERTY NET OPERATING INCOME
Comparable property NOI growth for the three months ended June 30, 2015 was 3.6%. The growth for the six months ended June 30, 2015 was 3.5%. Comparable properties include U.S. Malls, Premium Outlets and The Mills.
Today Simon's Board of Directors declared a quarterly common stock dividend of $1.55 per share. This is a 19.2% increase year-over-year and an increase of $0.05 or 3.3% from the previous quarter. The dividend will be payable on August 31, 2015 to stockholders of record on August 17, 2015.
Simon's Board of Directors also declared the quarterly dividend on its 83/8% Series J Cumulative Redeemable Preferred Stock (NYSE: SPGPrJ) of $1.046875 per share, payable on September 30, 2015 to stockholders of record on September 16, 2015.
During the quarter, we completed a 140,000 square foot expansion of Las Vegas North Premium Outlets, one of the most productive and well-known outlet centers in North America; and a 130,000 square foot expansion of Shisui Premium Outlets, a highly productive center in Shisui (Chiba), Japan.
| 2Q 2015 SUPPLEMENTAL |
|
3 |
EARNINGS RELEASE
Construction continues on three new Premium Outlets opening in 2015:
- •
- Gloucester Premium Outlets in Gloucester, New Jersey, serving the greater Philadelphia metropolitan area, is a 375,000 square foot
center scheduled to open in August. Simon owns a 50% interest in this project.
- •
- Tucson Premium Outlets is a 366,000 square foot center scheduled to open in October. Simon owns 100% of this project.
- •
- Tampa Premium Outlets is a 441,000 square foot center scheduled to open in October. Simon owns 100% of this project.
Construction continues on other significant expansion projects including Roosevelt Field, Del Amo Fashion Center, King of Prussia, The Galleria in Houston, Woodbury Common Premium Outlets, San Francisco Premium Outlets and Chicago Premium Outlets.
At quarter-end, redevelopment and expansion projects, including the addition of new anchors, were underway at 28 properties in the U.S. Simon's share of the costs of all development and redevelopment projects under construction at quarter-end was approximately $2.3 billion.
During the second quarter, construction started on two significant new development projects:
- •
- The Shops at Clearfork in Fort Worth, Texas - 590,000 square foot center projected to open in February 2017. Simon owns a 45%
interest in this project.
- •
- A 355,000 square foot upscale outlet center located in Columbus, Ohio projected to open in June 2016. Simon owns a 50% interest in this project.
We entered into a partnership to jointly develop the 500,000 square foot retail component to Brickell City Centre in Miami, Florida, projected to open in September 2016. Simon owns a 25% interest in this project.
In addition, Vancouver Designer Outlet in Vancouver, British Columbia, Canada opened on July 9th. The center serves the greater Vancouver metropolitan market with 242,000 square feet of high-quality, name brand stores. Simon owns a 45% interest in this center.
During the second quarter, we created a joint venture with Sears Holdings Corporation that includes 10 Sears stores located at our malls. Sears Holdings subsequently sold its interest in the joint venture to Seritage Growth Properties. Sears Holdings is leasing and continues to operate the existing stores at the properties and the joint venture will have the ability to create additional value through re-developing the contributed properties and re-leasing space at each property to third-party tenants. In July, we purchased 1,125,760 Seritage Growth Properties common shares at $29.58 per share.
In addition to the joint venture, we separately acquired a Sears store at the La Plaza Mall in McAllen, Texas.
The Company was active in the secured debt markets in the first half of the year continuing to lower our effective borrowing costs. We closed on seven new loans totaling approximately $2.4 billion, or the non-U.S. dollar equivalent thereof, of which SPG's share is $1.2 billion. The weighted average interest rate on these loans is 2.9% and term is 8.0 years.
| 2Q 2015 SUPPLEMENTAL |
|
4 |
EARNINGS RELEASE
As of June 30, 2015, Simon had over $5.5 billion of liquidity consisting of cash on hand, including its share of joint venture cash, and its available revolving credit facility capacity.
COMMON STOCK REPURCHASE PROGRAM
On April 2nd, the Company announced that its Board of Directors authorized a common stock repurchase program. Under the program, the Company may purchase up to $2 billion of its common stock over the next 24 months as market conditions warrant. The shares may be purchased in the open market or in privately negotiated transactions.
During the quarter ended June 30, 2015, the Company invested $505.7 million for the purchase of 1,903,340 shares of its common stock and 944,359 limited partnership units.
Today, the Company is raising both the low and high ends of its previously provided full year 2015 FFO range and currently estimates a range of $10.02 to $10.07 per diluted share for the year ending December 31, 2015, with net income to be within a range of $5.47 to $5.52 per diluted share.
The following table provides the reconciliation for the expected range of estimated net income available to common stockholders per diluted share to estimated FFO per diluted share:
For the year ending December 31, 2015
| |
LOW END | HIGH END | |||||
|---|---|---|---|---|---|---|---|
Estimated net income available to common stockholders per diluted share * |
$ | 5.47 | $ | 5.52 | |||
Depreciation and amortization including Simon's share of unconsolidated entities |
4.60 | 4.60 | |||||
Gain upon acquisition of controlling interests, sale or disposal of assets and interests in unconsolidated entities, net |
(0.05) | (0.05) | |||||
| | | | | | | | |
Estimated FFO per diluted share * |
$ | 10.02 | $ | 10.07 | |||
| | | | | | | | |
| | | | | | | | |
| | | | | | | | |
- *
- Includes $0.22 of a gain upon the sale of marketable securities.
Simon will hold a conference call to discuss the quarterly financial results today at 11:00 a.m. Eastern Time, Friday, July 24, 2015. A live webcast of the conference call will be accessible in listen-only mode at investors.simon.com. An audio replay of the conference call will be available until July 31, 2015. To access the audio replay, dial 1-888-286-8010 (international 617-801-6888) passcode 52068250.
SUPPLEMENTAL MATERIALS AND WEBSITE
Supplemental information on our second quarter 2015 performance is available at investors.simon.com. This information has also been furnished to the SEC in a current report on Form 8-K.
| 2Q 2015 SUPPLEMENTAL |
|
5 |
EARNINGS RELEASE
We routinely post important information online at our investor relations website, investors.simon.com. We use this website, press releases, SEC filings, quarterly conference calls, presentations and webcasts to disclose material, non-public information in accordance with Regulation FD. We encourage members of the investment community to monitor these distribution channels for material disclosures. Any information accessed through our website is not incorporated by reference into, and is not a part of, this document.
This press release includes FFO, FFO per share, comparable FFO per share, comparable earnings per share and comparable property net operating income growth, which are financial performance measures not defined by generally accepted accounting principles in the United States ("GAAP"). Reconciliations of these non-GAAP financial measures to the most directly comparable GAAP measures are included in this press release and in Simon's supplemental information for the quarter. FFO and comparable property net operating income growth are financial performance measures widely used in the REIT industry. Our definitions of these non-GAAP measures may not be the same as similar measures reported by other REITs.
Certain statements made in this press release may be deemed "forward-looking statements" within the meaning of the Private Securities Litigation Reform Act of 1995. Although the Company believes the expectations reflected in any forward-looking statements are based on reasonable assumptions, the Company can give no assurance that its expectations will be attained, and it is possible that actual results may differ materially from those indicated by these forward-looking statements due to a variety of risks, uncertainties and other factors. Such factors include, but are not limited to: the Company's ability to meet debt service requirements, the availability and terms of financing, changes in the Company's credit rating, changes in market rates of interest and foreign exchange rates for foreign currencies, changes in value of investments in foreign entities, the ability to hedge interest rate and currency risk, risks associated with the acquisition, development, expansion, leasing and management of properties, general risks related to retail real estate, the liquidity of real estate investments, environmental liabilities, international, national, regional and local economic conditions, changes in market rental rates, security breaches that could compromise our information technology or infrastructure or personally identifiable data of customers of our retail properties, trends in the retail industry, relationships with anchor tenants, the inability to collect rent due to the bankruptcy or insolvency of tenants or otherwise, risks relating to joint venture properties, the intensely competitive market environment in the retail industry, costs of common area maintenance, risks related to international activities, insurance costs and coverage, the loss of key management personnel, terrorist activities, changes in economic and market conditions and maintenance of our status as a real estate investment trust. The Company discusses these and other risks and uncertainties under the heading "Risk Factors" in our annual and quarterly reports filed with the SEC. The Company undertakes no duty or obligation to update or revise these forward-looking statements, whether as a result of new information, future developments, or otherwise unless required by law.
Simon is a global leader in retail real estate ownership, management and development and a S&P100 company (Simon Property Group, NYSE:SPG). Our industry-leading retail properties and investments across North America, Europe and Asia provide shopping experiences for millions of consumers every day and generate billions in annual retail sales. For more information, visit simon.com.
| 2Q 2015 SUPPLEMENTAL |
|
6 |
Simon Property Group, Inc. and Subsidiaries
Unaudited Consolidated Statements of Operations
(Dollars in thousands, except per share amounts)
| |
FOR THE THREE MONTHS ENDED JUNE 30, |
FOR THE SIX MONTHS ENDED JUNE 30, |
|||||||||||
|---|---|---|---|---|---|---|---|---|---|---|---|---|---|
| |
2015 |
2014 |
2015 |
2014 |
|||||||||
REVENUE: |
|||||||||||||
Minimum rent |
$ | 768,138 | $ | 728,486 | $ | 1,521,583 | $ | 1,450,768 | |||||
Overage rent |
37,029 | 39,160 | 75,986 | 70,834 | |||||||||
Tenant reimbursements |
364,309 | 342,250 | 704,479 | 667,721 | |||||||||
Management fees and other revenues |
40,027 | 34,142 | 75,106 | 64,749 | |||||||||
Other income |
139,607 | 37,944 | 188,191 | 84,932 | |||||||||
| | | | | | | | | | | | | | |
Total revenue |
1,349,110 | 1,181,982 | 2,565,345 | 2,339,004 | |||||||||
| | | | | | | | | | | | | | |
EXPENSES: |
|||||||||||||
Property operating |
99,841 | 92,630 | 199,598 | 187,577 | |||||||||
Depreciation and amortization |
295,778 | 287,214 | 583,883 | 567,708 | |||||||||
Real estate taxes |
106,487 | 99,396 | 213,374 | 193,699 | |||||||||
Repairs and maintenance |
22,676 | 21,656 | 52,410 | 51,421 | |||||||||
Advertising and promotion |
41,215 | 38,149 | 59,971 | 60,768 | |||||||||
Provision for credit losses |
2,685 | 2,442 | 6,533 | 6,866 | |||||||||
Home and regional office costs |
39,346 | 44,958 | 75,250 | 80,246 | |||||||||
General and administrative |
15,345 | 15,599 | 30,344 | 30,454 | |||||||||
Other |
23,352 | 18,407 | 42,426 | 37,769 | |||||||||
| | | | | | | | | | | | | | |
Total operating expenses |
646,725 | 620,451 | 1,263,789 | 1,216,508 | |||||||||
| | | | | | | | | | | | | | |
OPERATING INCOME |
702,385 | 561,531 | 1,301,556 | 1,122,496 | |||||||||
Interest expense |
(230,974) | (254,930) | (463,147) | (509,164) | |||||||||
Income and other taxes |
(3,420) | (6,626) | (9,781) | (13,489) | |||||||||
Income from unconsolidated entities |
70,196 | 55,764 | 135,068 | 112,842 | |||||||||
Gain upon acquisition of controlling interests and sale or disposal of assets and interests in unconsolidated entities, net |
16,339 | 133,870 | 16,339 | 136,525 | |||||||||
| | | | | | | | | | | | | | |
Consolidated income from continuing operations |
554,526 | 489,609 | 980,035 | 849,210 | |||||||||
Discontinued operations and gain on disposal |
– | 26,022 | – | 67,524 | |||||||||
Discontinued operations transaction expenses |
– | (38,163) | – | (38,163) | |||||||||
| | | | | | | | | | | | | | |
CONSOLIDATED NET INCOME |
554,526 | 477,468 | 980,035 | 878,571 | |||||||||
Net income attributable to noncontrolling interests |
80,748 | 70,047 | 143,248 | 128,667 | |||||||||
Preferred dividends |
834 | 834 | 1,669 | 1,669 | |||||||||
| | | | | | | | | | | | | | |
NET INCOME ATTRIBUTABLE TO COMMON STOCKHOLDERS |
$ | 472,944 | $ | 406,587 | $ | 835,118 | $ | 748,235 | |||||
| | | | | | | | | | | | | | |
| | | | | | | | | | | | | | |
| | | | | | | | | | | | | | |
BASIC AND DILUTED EARNINGS PER COMMON SHARE: |
|||||||||||||
Income from continuing operations |
$ | 1.52 | $ | 1.34 | $ | 2.69 | $ | 2.33 | |||||
Discontinued operations |
– | (0.03) | – | 0.08 | |||||||||
| | | | | | | | | | | | | | |
Net income attributable to common stockholders |
$ | 1.52 | $ | 1.31 | $ | 2.69 | $ | 2.41 | |||||
| | | | | | | | | | | | | | |
| | | | | | | | | | | | | | |
| | | | | | | | | | | | | | |
| 2Q 2015 SUPPLEMENTAL |
|
7 |
Simon Property Group, Inc. and Subsidiaries
Unaudited Consolidated Balance Sheets
(Dollars in thousands, except share amounts)
| |
JUNE 30, 2015 |
DECEMBER 31, 2014 |
|||||
|---|---|---|---|---|---|---|---|
ASSETS: |
|||||||
Investment properties at cost |
$ | 32,898,773 | $ | 31,318,532 | |||
Less - accumulated depreciation |
9,409,100 | 8,950,747 | |||||
| | | | | | | | |
|
23,489,673 | 22,367,785 | |||||
Cash and cash equivalents |
565,657 | 612,282 | |||||
Tenant receivables and accrued revenue, net |
537,172 | 580,197 | |||||
Investment in unconsolidated entities, at equity |
2,353,339 | 2,378,800 | |||||
Investment in Klepierre, at equity |
1,803,746 | 1,786,477 | |||||
Deferred costs and other assets |
1,333,944 | 1,806,789 | |||||
| | | | | | | | |
Total assets |
$ | 30,083,531 | $ | 29,532,330 | |||
| | | | | | | | |
| | | | | | | | |
| | | | | | | | |
LIABILITIES: |
|||||||
Mortgages and unsecured indebtedness |
$ | 22,070,777 | $ | 20,852,993 | |||
Accounts payable, accrued expenses, intangibles, and deferred revenues |
1,215,444 | 1,259,681 | |||||
Cash distributions and losses in partnerships and joint ventures, at equity |
1,344,028 | 1,167,163 | |||||
Other liabilities |
248,596 | 275,451 | |||||
| | | | | | | | |
Total liabilities |
24,878,845 | 23,555,288 | |||||
| | | | | | | | |
Commitments and contingencies |
|||||||
Limited partners' preferred interest in the Operating Partnership |
25,537 | 25,537 | |||||
EQUITY: |
|||||||
Stockholders' Equity |
|||||||
Capital stock (850,000,000 total shares authorized, $0.0001 par value, 238,000,000 shares of excess common stock, 100,000,000 authorized shares of preferred stock): |
|||||||
Series J 83/8% cumulative redeemable preferred stock, 1,000,000 shares authorized, 796,948 issued and outstanding with a liquidation value of $39,847 |
43,898 | 44,062 | |||||
Common stock, $0.0001 par value, 511,990,000 shares authorized, 314,807,366 and 314,320,664 issued and outstanding, respectively |
31 | 31 | |||||
Class B common stock, $0.0001 par value, 10,000 shares authorized, 8,000 issued and outstanding |
– | – | |||||
Capital in excess of par value |
9,357,567 | 9,422,237 | |||||
Accumulated deficit |
(4,274,289) | (4,208,183) | |||||
Accumulated other comprehensive loss |
(246,575) | (61,041) | |||||
Common stock held in treasury at cost, 5,397,729 and 3,540,754 shares, respectively |
(437,751) | (103,929) | |||||
| | | | | | | | |
Total stockholders' equity |
4,442,881 | 5,093,177 | |||||
Noncontrolling interests |
736,268 | 858,328 | |||||
| | | | | | | | |
Total equity |
5,179,149 | 5,951,505 | |||||
| | | | | | | | |
Total liabilities and equity |
$ | 30,083,531 | $ | 29,532,330 | |||
| | | | | | | | |
| | | | | | | | |
| | | | | | | | |
| 2Q 2015 SUPPLEMENTAL |
|
8 |
Simon Property Group, Inc. and Subsidiaries
Unaudited Joint Venture Statements of Operations
(Dollars in thousands)
| |
FOR THE THREE MONTHS ENDED JUNE 30, |
FOR THE SIX MONTHS ENDED JUNE 30, |
|||||||||||
|---|---|---|---|---|---|---|---|---|---|---|---|---|---|
| |
2015 |
2014 |
2015 |
2014 |
|||||||||
REVENUE: |
|||||||||||||
Minimum rent |
$ | 443,485 | $ | 427,899 | $ | 877,266 | $ | 852,684 | |||||
Overage rent |
41,342 | 41,589 | 92,522 | 90,386 | |||||||||
Tenant reimbursements |
199,142 | 193,006 | 393,629 | 385,799 | |||||||||
Other income |
61,545 | 61,929 | 115,539 | 174,635 | |||||||||
| | | | | | | | | | | | | | |
Total revenue |
745,514 | 724,423 | 1,478,956 | 1,503,504 | |||||||||
OPERATING EXPENSES: |
|||||||||||||
Property operating |
132,257 | 131,643 | 263,061 | 293,064 | |||||||||
Depreciation and amortization |
148,607 | 142,047 | 290,265 | 294,195 | |||||||||
Real estate taxes |
56,477 | 52,797 | 115,051 | 107,588 | |||||||||
Repairs and maintenance |
17,086 | 15,944 | 37,447 | 35,585 | |||||||||
Advertising and promotion |
17,388 | 17,113 | 34,090 | 35,923 | |||||||||
Provision for credit losses |
1,296 | 970 | 3,149 | 4,078 | |||||||||
Other |
38,924 | 44,554 | 83,351 | 97,483 | |||||||||
| | | | | | | | | | | | | | |
Total operating expenses |
412,035 | 405,068 | 826,414 | 867,916 | |||||||||
| | | | | | | | | | | | | | |
OPERATING INCOME |
333,479 | 319,355 | 652,542 | 635,588 | |||||||||
Interest expense |
(149,041) | (150,059) | (296,062) | (301,696) | |||||||||
| | | | | | | | | | | | | | |
INCOME FROM CONTINUING OPERATIONS |
184,438 | 169,296 | 356,480 | 333,892 | |||||||||
Income from operations of discontinued joint venture interests |
– |
2,094 |
– |
5,079 |
|||||||||
Gain on sale or disposal of assets and interests in unconsolidated entities |
35,779 | – | 35,779 | – | |||||||||
| | | | | | | | | | | | | | |
NET INCOME |
$ | 220,217 | $ | 171,390 | $ | 392,259 | $ | 338,971 | |||||
| | | | | | | | | | | | | | |
| | | | | | | | | | | | | | |
| | | | | | | | | | | | | | |
THIRD-PARTY INVESTORS' SHARE OF NET INCOME |
$ | 112,763 | $ | 88,217 | $ | 201,877 | $ | 177,530 | |||||
| | | | | | | | | | | | | | |
| | | | | | | | | | | | | | |
| | | | | | | | | | | | | | |
OUR SHARE OF NET INCOME |
107,454 | 83,173 | 190,382 | 161,441 | |||||||||
AMORTIZATION OF EXCESS INVESTMENT (A) |
(24,387) | (24,383) | (48,541) | (49,981) | |||||||||
OUR SHARE OF LOSS FROM UNCONSOLIDATED DISCONTINUED OPERATIONS |
– | (307) | – | (652) | |||||||||
OUR SHARE OF GAIN ON SALE OR DISPOSAL OF ASSETS AND INTERESTS IN UNCONSOLIDATED ENTITIES, NET |
(16,339) | – | (16,339) | – | |||||||||
| | | | | | | | | | | | | | |
INCOME FROM UNCONSOLIDATED ENTITIES (B) |
$ | 66,728 | $ | 58,483 | $ | 125,502 | $ | 110,808 | |||||
| | | | | | | | | | | | | | |
| | | | | | | | | | | | | | |
| | | | | | | | | | | | | | |
- Note:
- The
above financial presentation does not include any information related to our investment in Klépierre S.A.
("Klépierre").
For additional information, see footnote B.
| 2Q 2015 SUPPLEMENTAL |
|
9 |
Simon Property Group, Inc. and Subsidiaries
Unaudited Joint Venture Balance Sheets
(Dollars in thousands)
| |
JUNE 30, 2015 |
DECEMBER 31, 2014 |
|||||
|---|---|---|---|---|---|---|---|
Assets: |
|||||||
Investment properties, at cost |
$ | 16,790,264 | $ | 16,087,282 | |||
Less - accumulated depreciation |
5,611,016 | 5,457,899 | |||||
| | | | | | | | |
|
11,179,248 | 10,629,383 | |||||
Cash and cash equivalents |
885,430 | 993,178 | |||||
Tenant receivables and accrued revenue, net |
333,033 | 362,201 | |||||
Investment in unconsolidated entities, at equity |
– | 11,386 | |||||
Deferred costs and other assets |
533,447 | 536,600 | |||||
| | | | | | | | |
Total assets |
$ | 12,931,158 | $ | 12,532,748 | |||
| | | | | | | | |
| | | | | | | | |
| | | | | | | | |
LIABILITIES AND PARTNERS' DEFICIT: |
|||||||
Mortgages |
$ | 13,801,561 | $ | 13,272,557 | |||
Accounts payable, accrued expenses, intangibles, and deferred revenue |
940,309 | 1,015,334 | |||||
Other liabilities |
386,277 | 493,718 | |||||
| | | | | | | | |
Total liabilities |
15,128,147 | 14,781,609 | |||||
Preferred units |
67,450 | 67,450 | |||||
Partners' deficit |
(2,264,439) | (2,316,311) | |||||
| | | | | | | | |
Total liabilities and partners' deficit |
$ | 12,931,158 | $ | 12,532,748 | |||
| | | | | | | | |
| | | | | | | | |
| | | | | | | | |
OUR SHARE OF: |
|||||||
Partners' deficit |
$ | (820,782) | $ | (663,700) | |||
Add: Excess Investment (A) |
1,830,093 | 1,875,337 | |||||
| | | | | | | | |
Our net Investment in unconsolidated entities, at equity |
$ | 1,009,311 | $ | 1,211,637 | |||
| | | | | | | | |
| | | | | | | | |
| | | | | | | | |
- Note:
- The
above financial presentation does not include any information related to our investment in Klépierre.
For additional information, see footnote B attached hereto.
| 2Q 2015 SUPPLEMENTAL |
|
10 |
Simon Property Group, Inc. and Subsidiaries
Unaudited Reconciliation of Non-GAAP Financial Measures (C)
(Amounts in thousands, except per share
amounts)
| |
Reconciliation of Consolidated Net Income to FFO |
|
|
|
|
|
||||||||||
|---|---|---|---|---|---|---|---|---|---|---|---|---|---|---|---|---|
| |
|
FOR THE THREE MONTHS ENDED JUNE 30, |
FOR THE SIX MONTHS ENDED JUNE 30, |
|
||||||||||||
| |
|
2015 |
2014 |
2015 |
2014 |
|
||||||||||
|
Consolidated Net Income (D) |
$ | 554,526 | $ | 477,468 | $ | 980,035 | $ | 878,571 | |||||||
|
Adjustments to Arrive at FFO: |
|||||||||||||||
|
Depreciation and amortization from consolidated properties |
291,853 | 314,500 | 576,080 | 637,104 | |||||||||||
|
Our share of depreciation and amortization from unconsolidated entities, including Klépierre |
128,184 | 128,461 | 252,068 | 275,718 | |||||||||||
|
Gain upon acquisition of controlling interests and sale or disposal of assets and interests in unconsolidated entities, net |
(16,339) | (133,870) | (16,339) | (136,767) | |||||||||||
|
Net income attributable to noncontrolling interest holders in properties |
(609) | (447) | (1,298) | (970) | |||||||||||
|
Noncontrolling interests portion of depreciation and amortization |
(946) | (966) | (1,833) | (1,864) | |||||||||||
|
Preferred distributions and dividends |
(1,313) | (1,313) | (2,626) | (2,626) | |||||||||||
| | | | | | | | | | | | | | | | | |
|
FFO of the Operating Partnership (E) |
$ | 955,356 | $ | 783,833 | $ | 1,786,087 | $ | 1,649,166 | |||||||
| | | | | | | | | | | | | | | | | |
| | | | | | | | | | | | | | | | | |
| | | | | | | | | | | | | | | | | |
|
Diluted net income per share to diluted FFO per share reconciliation: |
|||||||||||||||
|
Diluted net income per share |
$ | 1.52 | $ | 1.31 | $ | 2.69 | $ | 2.41 | |||||||
|
Depreciation and amortization from consolidated properties and our share of depreciation and amortization from unconsolidated entities, including Klépierre, net of noncontrolling interests portion of depreciation and amortization |
1.16 | 1.22 | 2.28 | 2.51 | |||||||||||
|
Gain upon acquisition of controlling interests and sale or disposal of assets and interests in unconsolidated entities, net |
(0.05) | (0.37) | (0.05) | (0.38) | |||||||||||
| | | | | | | | | | | | | | | | | |
|
Diluted FFO per share (F) |
$ | 2.63 | $ | 2.16 | $ | 4.92 | $ | 4.54 | |||||||
| | | | | | | | | | | | | | | | | |
| | | | | | | | | | | | | | | | | |
| | | | | | | | | | | | | | | | | |
|
|
|||||||||||||||
|
Details for per share calculations: |
|||||||||||||||
|
FFO of the Operating Partnership (E) |
$ | 955,356 | $ | 783,833 | $ | 1,786,087 | $ | 1,649,166 | |||||||
|
Diluted FFO allocable to unitholders |
(137,682) | (114,003) | (257,987) | (238,881) | |||||||||||
| | | | | | | | | | | | | | | | | |
|
Diluted FFO allocable to common stockholders (G) |
$ | 817,674 | $ | 669,830 | $ | 1,528,100 | $ | 1,410,285 | |||||||
| | | | | | | | | | | | | | | | | |
| | | | | | | | | | | | | | | | | |
| | | | | | | | | | | | | | | | | |
|
Basic and Diluted weighted average shares outstanding |
310,499 | 310,743 | 310,799 | 310,683 | |||||||||||
|
Weighted average limited partnership units outstanding |
52,263 | 52,861 | 52,472 | 52,625 | |||||||||||
| | | | | | | | | | | | | | | | | |
|
Basic and Diluted weighted average shares and units outstanding |
362,762 | 363,604 | 363,271 | 363,308 | |||||||||||
| | | | | | | | | | | | | | | | | |
| | | | | | | | | | | | | | | | | |
| | | | | | | | | | | | | | | | | |
|
Basic and Diluted FFO per Share (F) |
$ | 2.63 | $ | 2.16 | $ | 4.92 | $ | 4.54 | |||||||
|
Percent Change |
21.8% | 8.4% | |||||||||||||
| 2Q 2015 SUPPLEMENTAL |
|
11 |
Simon Property Group, Inc. and Subsidiaries
Footnotes to Unaudited Reconciliation of Non-GAAP Financial Measures
- (A)
- Excess
investment represents the unamortized difference of our investment over equity in the underlying net assets of the related partnerships and joint
ventures shown therein. The Company generally amortizes excess investment over the life of the related properties.
- (B)
- The
Unaudited Joint Venture Statements of Operations do not include any operations or our share of net income or excess investment amortization related to
our investment in Klépierre. Amounts included in Footnotes D below exclude our share of related activity for our investment in Klépierre. For further information,
reference should be made to financial information in Klépierre's public filings and additional discussion and analysis in our Form 10-Q.
- (C)
- This
report contains measures of financial or operating performance that are not specifically defined by GAAP, including FFO, FFO per share, comparable FFO
per share and comparable EPS. FFO is a performance measure that is standard in the REIT business. We believe FFO provides investors with additional information concerning our operating performance and
a basis to compare our performance with those of other REITs. We also use these measures internally to monitor the operating performance of our portfolio. Our computation of these non-GAAP measures
may not be the same as similar measures reported by other REITs.
We determine FFO based upon the definition set forth by the National Association of Real Estate Investment Trusts ("NAREIT"). We determine FFO to be our share of consolidated net income computed in accordance with GAAP, excluding real estate related depreciation and amortization, excluding gains and losses from extraordinary items, excluding gains and losses from the sales or disposals of, or any impairment charges related to, previously depreciated retail operating properties, plus the allocable portion of FFO of unconsolidated joint ventures based upon economic ownership interest, and all determined on a consistent basis in accordance with GAAP.
We have adopted NAREIT's clarification of the definition of FFO that requires it to include the effects of nonrecurring items not classified as extraordinary, cumulative effect of accounting changes, or a gain or loss resulting from the sale or disposal of, or any impairment charges relating to, previously depreciated retail operating properties. We include in FFO gains and losses realized from the sale of land, outlot buildings, marketable and non-marketable securities, and investment holdings of non-retail real estate. However, you should understand that FFO does not represent cash flow from operations as defined by GAAP, should not be considered as an alternative to net income determined in accordance with GAAP as a measure of operating performance, and is not an alternative to cash flows as a measure of liquidity.
- (D)
- Includes
our share of:
- -
- Gains
on land sales of $3.6 million and $5.6 million for the three months ended June 30, 2015 and 2014, respectively, and
$3.7 million and $12.4 million for the six months ended June 30, 2015 and 2014, respectively.
- -
- Straight-line adjustments to minimum rent of $16.8 million and $13.3 million for the three months ended June 30, 2015 and 2014, respectively (including $0.2 million related to WPG in 2014), and $33.2 million and $27.3 million for the six months ended June 30, 2015 and 2014, respectively (including $0.3 million related to WPG in 2014).
| 2Q 2015 SUPPLEMENTAL |
|
12 |
- -
- Amortization
of fair market value of leases from acquisitions of $3.2 million and $3.1 million for the three months ended June 30, 2015
and 2014, respectively (including $0.1 million related to WPG in 2014), and $6.6 million and $8.5 million for the six months ended June 30, 2015 and 2014, respectively
(including $0.3 million related to WPG in 2014).
- -
- Debt
premium amortization of $5.4 million and $5.3 million for the three months ended June 30, 2015 and 2014, respectively (including
$0.1 million related to WPG in 2014), and $12.6 million and $21.4 million for the six months ended June 30, 2015 and 2014, respectively (including $0.2 million
related to WPG in 2014).
- (E)
- Includes
FFO of the operating partnership related to the sale of marketable securities of $80.2 million for the three and six months ended
June 30, 2015. Includes FFO of the operating partnership related to WPG of $19.7 million ($57.9 million from operations net of $38.2 million of transaction expenses) for
the three months ended June 30, 2014 and $108.0 million ($146.2 million from operations net of $38.2 million of transaction expenses) for the six months ended
June 30, 2014.
- (F)
- Includes
Basic and Diluted FFO per share related to the sale of marketable securities of $0.22 for the three and six months ended June 30, 2015.
Includes Basic and Diluted FFO per share related to WPG operations of $0.05 ($0.15 from operations net of $0.10 of transaction expenses) for the three months ended June 30, 2014 and $0.30
($0.40 from operations net of $0.10 of transaction expenses) for the six months ended June 30, 2014.
- (G)
- Includes
Diluted FFO allocable to common stockholders related to WPG of $16.8 million for the three months ended June 30, 2014 and
$92.4 million for the six months ended June 30, 2014.
- (H)
- Reconciliation of reported earnings per share to comparable earnings per share and FFO per share to comparable FFO per share:
| |
THREE MONTHS ENDED JUNE 30, |
SIX MONTHS ENDED JUNE 30, |
||||||||||
|---|---|---|---|---|---|---|---|---|---|---|---|---|
| |
2015 |
2014 |
2015 |
2014 |
||||||||
Reported FFO per share |
$ | 2.63 | $ | 2.16 | $ | 4.92 | $ | 4.54 | ||||
Less: Gain upon sale of marketable securities |
(0.22) | – | (0.22) | – | ||||||||
Add: WPG spin-off transaction expenses |
– | 0.10 | – | 0.10 | ||||||||
Less: FFO from WPG properties |
– | (0.15) | – | (0.40) | ||||||||
| | | | | | | | | | | | | |
Comparable FFO per share |
$ | 2.41 | $ | 2.11 | $ | 4.70 | $ | 4.24 | ||||
| | | | | | | | | | | | | |
| | | | | | | | | | | | | |
| | | | | | | | | | | | | |
Comparable FFO per share growth |
14.2% | 10.8% | ||||||||||
| 2Q 2015 SUPPLEMENTAL |
|
13 |
| |
THREE MONTHS ENDED JUNE 30, |
SIX MONTHS ENDED JUNE 30, |
||||||||||
|---|---|---|---|---|---|---|---|---|---|---|---|---|
| |
2015 |
2014 |
2015 |
2014 |
||||||||
Reported earnings per share1 |
$ | 1.52 | $ | 1.31 | $ | 2.69 | $ | 2.41 | ||||
Less: Gain upon sale of marketable securities |
(0.22) | – | (0.22) | – | ||||||||
Add: WPG spin-off transaction expenses |
– | 0.10 | – | 0.10 | ||||||||
Less: Earnings per share from WPG properties |
– | (0.07) | – | (0.18) | ||||||||
| | | | | | | | | | | | | |
Comparable earnings per share |
$ | 1.30 | $ | 1.34 | $ | 2.47 | $ | 2.33 | ||||
| | | | | | | | | | | | | |
| | | | | | | | | | | | | |
| | | | | | | | | | | | | |
Comparable earnings per share growth |
–3.0% | 6.0% | ||||||||||
- (1)
- Three and six month periods ended June 30, 2014 include a gain on disposition of $0.37 per diluted share related to Klépierre's sale of a portfolio of 126 retail galleries.
| 2Q 2015 SUPPLEMENTAL |
|
14 |
Simon Property Group, Inc. (NYSE:SPG) is a self-administered and self-managed real estate investment trust ("REIT"). Simon Property Group, L.P., or the Operating Partnership, is our majority-owned partnership subsidiary that owns all of our real estate properties and other assets. In this package, the terms Simon, we, our, or the Company refer to Simon Property Group, Inc., the Operating Partnership, and its subsidiaries. We are engaged primarily in the ownership, development and management of retail real estate properties including Malls, Premium Outlets®, The Mills®, and International Properties. At June 30, 2015, we owned or had an interest in 228 properties comprising 189 million square feet in North America, Asia and Europe. Additionally, at June 30, 2015, we had an 20.3% ownership interest in Klépierre, a publicly traded, Paris-based real estate company, which owns shopping centers in 16 European countries.
This package was prepared to provide operational and balance sheet information as of June 30, 2015, for the Company and the Operating Partnership.
On May 28, 2014, we completed the spin-off of 98 smaller malls and community centers to Washington Prime Group Inc. (WPG), now doing business as WP GLIMCHER. Results from the properties transferred to WPG (WPG properties) are included in our financial information as discontinued operations through May 28, 2014.
Certain statements made in this Supplemental Package may be deemed "forward-looking statements" within the meaning of the Private Securities Litigation Reform Act of 1995. Although we believe the expectations reflected in any forward-looking statements are based on reasonable assumptions, we can give no assurance that our expectations will be attained, and it is possible that actual results may differ materially from those indicated by these forward-looking statements due to a variety of risks, uncertainties and other factors. Such factors include, but are not limited to: our ability to meet debt service requirements, the availability and terms of financing, changes in our credit rating, changes in market rates of interest and foreign exchange rates for foreign currencies, changes in value of investments in foreign entities, the ability to hedge interest rate and currency risk, risks associated with the acquisition, development, expansion, leasing and management of properties, general risks related to retail real estate, the liquidity of real estate investments, environmental liabilities, international, national, regional and local economic climates, changes in market rental rates, security breaches that could compromise our information technology or infrastructure or personally identifiable data of customers of our retail properties, trends in the retail industry, relationships with anchor tenants, the inability to collect rent due to the bankruptcy or insolvency of tenants or otherwise, risks relating to joint venture properties, costs of common area maintenance, intensely competitive market environment in the retail industry, risks related to international activities, insurance costs and coverage, terrorist activities, changes in economic and market conditions, the loss of key management personnel and maintenance of our status as a real estate investment trust. We discuss these and other risks and uncertainties under the heading "Risk Factors" in our annual and quarterly periodic reports filed with the SEC. We may update that discussion in our periodic reports, but except as required by law, otherwise we undertake no duty or obligation to update or revise these forward-looking statements, whether as a result of new information, future developments, or otherwise.
Any questions, comments or suggestions regarding this Supplemental Information should be directed to Tom Ward, Vice President of Investor Relations (tom.ward@simon.com or 317.685.7330).
Below is a list of estimated dates for future announcements of results. Dates are subject to change.
Third Quarter 2015 |
October 23, 2015 | |
Fourth Quarter 2015 |
January 29, 2016 | |
First Quarter 2016 |
April 22, 2016 |
| 2Q 2015 SUPPLEMENTAL |
|
15 |
The Company's common stock and one issue of preferred stock are traded on the New York Stock Exchange under the following symbols:
|
Common Stock |
SPG | ||||||
|
8.375% Series J Cumulative Redeemable Preferred |
SPGPrJ | ||||||
|
||||||||
|
Standard & Poor's |
|
|
|||||
|
Corporate |
A | (Stable Outlook) | |||||
|
Senior Unsecured |
A | (Stable Outlook) | |||||
|
Preferred Stock |
BBB+ | (Stable Outlook) | |||||
|
Commercial Paper |
A1 | (Stable Outlook) | |||||
|
Moody's |
|
|
|||||
|
Senior Unsecured |
A2 | (Stable Outlook) | |||||
|
Preferred Stock |
A3 | (Stable Outlook) | |||||
|
Commercial Paper |
P1 | (Stable Outlook) | |||||
SENIOR UNSECURED DEBT COVENANTS (1)
|
Required | Actual | Compliance |
|||
| | | | | | | |
Total Debt to Total Assets (1) |
£65% | 41% | Yes | |||
Total Secured Debt to Total Assets (1) |
£50% | 19% | Yes | |||
Fixed Charge Coverage Ratio |
>1.5X | 4.0X | Yes | |||
Total Unencumbered Assets to Unsecured Debt |
³125% | 255% | Yes |
- (1)
- Covenants for indentures dated June 7, 2005 and later. Total Assets are calculated in accordance with the indenture and essentially represent net operating income (NOI) divided by a 7.0% capitalization rate plus the value of other assets at cost.
| 2Q 2015 SUPPLEMENTAL |
|
16 |
SELECTED FINANCIAL AND EQUITY INFORMATION
(In thousands, except as noted)
|
|
THREE MONTHS ENDED JUNE 30, |
|
SIX MONTHS ENDED JUNE 30, |
|||||||||
| | | | | | | | | | | | | | |
|
|
2015 |
|
2014 |
|
2015 | | 2014 | |||||
Financial Highlights |
|||||||||||||
Total Revenue - Consolidated Properties |
$ | 1,349,110 | $ | 1,181,982 | $ | 2,565,345 | $ | 2,339,004 | |||||
Consolidated Net Income |
$ |
554,526 |
$ |
477,468 |
$ |
980,035 |
$ |
878,571 |
|||||
Net Income Attributable to Common Stockholders |
$ | 472,944 | $ | 406,587 | $ | 835,118 | $ | 748,235 | |||||
Basic and Diluted Earnings per Common Share (EPS) |
$ | 1.52 | $ | 1.31 | $ | 2.69 | $ | 2.41 | |||||
Funds from Operations (FFO) of the Operating Partnership (1) |
$ |
955,356 |
$ |
783,833 |
$ |
1,786,087 |
$ |
1,649,166 |
|||||
Basic and Diluted FFO per Share (FFOPS) (2) |
$ | 2.63 | $ | 2.16 | $ | 4.92 | $ | 4.54 | |||||
Dividends/Distributions per Share/Unit |
$ |
1.50 |
$ |
1.30 |
$ |
2.90 |
$ |
2.55 |
|||||
Stockholders' Equity Information |
|
AS OF JUNE 30, 2015 |
|
AS OF DECEMBER 31, 2014 |
|||
Limited Partners' Units Outstanding at end of period |
51,817 | 52,847 | |||||
Common Shares Outstanding at end of period |
309,417 | 310,788 | |||||
| | | | | | | | |
Total Common Shares and Limited Partnership Units Outstanding at end of period |
361,234 | 363,635 | |||||
| | | | | | | | |
| | | | | | | | |
| | | | | | | | |
Weighted Average Limited Partnership Units Outstanding |
52,472 | 52,745 | |||||
Weighted Average Common Shares Outstanding: |
|||||||
Basic and Diluted - for purposes of EPS and FFOPS |
310,799 | 310,731 | |||||
|
|||||||
Debt Information |
|||||||
Share of Consolidated Debt |
$ | 21,991,798 | $ | 20,773,850 | |||
Share of Joint Venture Debt |
6,640,668 | 6,359,882 | |||||
| | | | | | | | |
Share of Total Debt |
$ | 28,632,466 | $ | 27,133,732 | |||
| | | | | | | | |
| | | | | | | | |
| | | | | | | | |
|
|||||||
Market Capitalization |
|||||||
Common Stock Price at end of period |
$ | 173.02 | $ | 182.11 | |||
Common Equity Capitalization, including Limited Partnership Units |
$ | 62,500,787 | $ | 66,221,496 | |||
Preferred Equity Capitalization, including Limited Partnership Preferred Units |
81,403 | 81,236 | |||||
| | | | | | | | |
Total Equity Market Capitalization |
$ | 62,582,190 | $ | 66,302,732 | |||
| | | | | | | | |
| | | | | | | | |
| | | | | | | | |
Total Market Capitalization - Including Share of Total Debt |
$ | 91,214,656 | $ | 93,436,464 | |||
|
|||||||
Debt to Total Market Capitalization |
31.4% | 29.0% |
- (1)
- Includes FFO of the Operating Partnership related to the sale of marketable securities of $80.2 million for the three and six months ended June 30, 2015. Includes FFO of the Operating Partnership related to WPG properties of $19.7 million ($57.9 million from operations net of $38.2 million of transaction expenses) for the three months ended June 30, 2014 and $108.0 million ($146.2 million from operations net of $38.2 million of transaction expenses) for the six months ended June 30, 2014.
- (2)
- Includes Basic and Diluted FFO per share related to the sale of marketable securities of $0.22 for the three and six months ended June 30, 2015. Includes Basic and Diluted FFO per share related to WPG properties of $0.05 ($0.15 from operations net of $0.10 of transaction expenses) for the three months ended June 30, 2014 and $0.30 ($0.40 from operations net of $0.10 of transaction expenses) for the six months ended June 30, 2014.
| 2Q 2015 SUPPLEMENTAL |
|
17 |
PRO-RATA STATEMENT OF OPERATIONS
(In thousands)
|
|
FOR THE THREE MONTHS ENDED JUNE 30, 2015 |
| FOR THE | |||||||||||||||
| | | | | | | | | | | | | | | | | | | | |
|
|
CONSOLIDATED |
|
NONCONTROLLING INTERESTS (1) |
|
OUR CONSOLIDATED SHARE |
|
OUR SHARE OF JOINT VENTURES |
| OUR TOTAL SHARE |
|
THREE MONTHS ENDED JUNE 30, 2014 OUR TOTAL SHARE |
|||||||
REVENUE: |
|||||||||||||||||||
Minimum rent |
$ | 768,138 | $ | (3,323) | $ | 764,815 | $ | 213,644 | $ | 978,459 | $ | 933,424 | |||||||
Overage rent |
37,029 | (27) | 37,002 | 17,878 | | 54,880 | 56,955 | ||||||||||||
Tenant reimbursements |
364,309 | (1,919) | 362,390 | 93,491 | | 455,881 | 431,597 | ||||||||||||
Management fees and other revenues |
40,027 | – | 40,027 | – | | 40,027 | 34,142 | ||||||||||||
Other income |
139,607 | (144) | 139,463 | 29,325 | | 168,788 | 67,837 | ||||||||||||
| | | | | | | | | | | | | | | | | | | | |
Total revenue |
1,349,110 | (5,413) | 1,343,697 | 354,338 | | 1,698,035 | 1,523,955 | ||||||||||||
| | | | | | | | | | | | | | | | | | | | |
EXPENSES: |
| | |||||||||||||||||
Property operating |
99,841 | (874) | 98,967 | 58,915 | | 157,882 | 150,658 | ||||||||||||
Depreciation and amortization |
295,778 | (946) | 294,832 | 99,099 | | 393,931 | 384,323 | ||||||||||||
Real estate taxes |
106,487 | (561) | 105,926 | 26,634 | | 132,560 | 124,271 | ||||||||||||
Repairs and maintenance |
22,676 | (168) | 22,508 | 7,983 | | 30,491 | 29,020 | ||||||||||||
Advertising and promotion |
41,215 | (111) | 41,104 | 8,178 | | 49,282 | 46,069 | ||||||||||||
Provision for credit losses |
2,685 | 15 | 2,700 | 601 | | 3,301 | 2,937 | ||||||||||||
Home and regional office costs |
39,346 | – | 39,346 | – | | 39,346 | 44,958 | ||||||||||||
General and administrative |
15,345 | – | 15,345 | – | | 15,345 | 15,599 | ||||||||||||
Other |
23,352 | (987) | 22,365 | 17,159 | | 39,524 | 37,739 | ||||||||||||
| | | | | | | | | | | | | | | | | | | | |
Total operating expenses |
646,725 | (3,632) | 643,093 | 218,569 | | 861,662 | 835,574 | ||||||||||||
| | | | | | | | | | | | | | | | | | | | |
OPERATING INCOME |
702,385 | (1,781) | 700,604 | 135,769 | | 836,373 | 688,381 | ||||||||||||
Interest expense |
(230,974) | 1,172 | (229,802) | (69,041) | | (298,843) | (323,744) | ||||||||||||
Income and other taxes |
(3,420) | – | (3,420) | – | | (3,420) | (6,626) | ||||||||||||
Income from unconsolidated entities |
70,196 | – | 70,196 | (66,728) | | 3,468 | (2) | (2,719) | (2) | ||||||||||
Gain upon acquisition of controlling interests and sale or disposal of assets and interests in unconsolidated entities, net |
16,339 | – | 16,339 | – | | 16,339 | 133,870 | ||||||||||||
| | | | | | | | | | | | | | | | | | | | |
Consolidated income from continuing operations |
554,526 | (609) | 553,917 | – | | 553,917 | 489,162 | ||||||||||||
| | | | | | | | | | | | | | | | | | | | |
Discontinued operations |
– | – | – | – | | – | 26,022 | ||||||||||||
Discontinued operations transaction expenses |
– | – | – | – | | – | (38,163) | ||||||||||||
| | | | | | | | | | | | | | | | | | | | |
CONSOLIDATED NET INCOME |
554,526 | (609) | 553,917 | – | | 553,917 | 477,021 | ||||||||||||
Net income attributable to noncontrolling interests |
80,748 | (609) | 80,139 | – | | 80,139 | (3) | 69,600 | (3) | ||||||||||
Preferred dividends |
834 | – | 834 | – | | 834 | 834 | ||||||||||||
| | | | | | | | | | | | | | | | | | | | |
NET INCOME ATTRIBUTABLE TO COMMON STOCKHOLDERS |
$ | 472,944 | $ | – | $ | 472,944 | $ | – | $ | 472,944 | $ | 406,587 | |||||||
| | | | | | | | | | | | | | | | | | | | |
| | | | | | | | | | | | | | | | | | | | |
| | | | | | | | | | | | | | | | | | | | |
RECONCILIATION OF CONSOLIDATED NET INCOME TO FFO: |
| | |||||||||||||||||
Consolidated Net Income |
$ | 554,526 | $ | – | $ | 554,526 | $ | 477,468 | |||||||||||
Adjustments to Consolidated Net Income to Arrive at FFO: |
| ||||||||||||||||||
Depreciation and amortization from consolidated properties |
291,853 | – | | 291,853 | 314,500 | ||||||||||||||
Our share of depreciation and amortization from unconsolidated entities, including Klépierre |
– | 128,184 | | 128,184 | 128,461 | ||||||||||||||
Income from unconsolidated entities |
(70,196) | 70,196 | | – | – | ||||||||||||||
Gain upon acquisition of controlling interests and sale or disposal of assets and interests in unconsolidated entities, net |
(16,339) | – | | (16,339) | (133,870) | ||||||||||||||
Net income attributable to noncontrolling interest holders in properties |
(609) | – | | (609) | (447) | ||||||||||||||
Noncontrolling interests portion of depreciation and amortization |
(946) | – | | (946) | (966) | ||||||||||||||
Preferred distributions and dividends |
(1,313) | – | | (1,313) | (1,313) | ||||||||||||||
| | | | | | | | | | | | | | | | | | | | |
FFO of the Operating Partnership |
$ | 756,976 | $ | 198,380 | $ | 955,356 | $ | 783,833 | |||||||||||
| | | | | | | | | | | | | | | | | | | | |
| | | | | | | | | | | | | | | | | | | | |
| | | | | | | | | | | | | | | | | | | | |
Percentage of FFO of the Operating Partnership |
79.23% | 20.77% | | 100.00% | 100.00% | ||||||||||||||
- (1)
- Represents our venture partners' share of operations from consolidated properties.
- (2)
- Our Total Share of income from unconsolidated entities represents our share of net results related to our investment in Klépierre.
- (3)
- Represents limited partners' interest in the Operating Partnership.
| 2Q 2015 SUPPLEMENTAL |
|
18 |
PRO-RATA STATEMENT OF OPERATIONS
(In thousands)
|
|
FOR THE SIX MONTHS ENDED JUNE 30, 2015 |
| FOR THE | |||||||||||||||
| | | | | | | | | | | | | | | | | | | | |
|
|
CONSOLIDATED |
|
NONCONTROLLING INTERESTS (1) |
|
OUR CONSOLIDATED SHARE |
|
OUR SHARE OF JOINT VENTURES |
| OUR TOTAL SHARE |
|
SIX MONTHS ENDED JUNE 30, 2014 OUR TOTAL SHARE |
|||||||
REVENUE: |
|||||||||||||||||||
Minimum rent |
$ | 1,521,583 | $ | (6,608) | $ | 1,514,975 | $ | 421,876 | $ | 1,936,851 | $ | 1,857,370 | |||||||
Overage rent |
75,986 | (80) | 75,906 | 39,566 | | 115,472 | 109,175 | ||||||||||||
Tenant reimbursements |
704,479 | (3,994) | 700,485 | 184,854 | | 885,339 | 846,087 | ||||||||||||
Management fees and other revenues |
75,106 | – | 75,106 | – | | 75,106 | 64,749 | ||||||||||||
Other income |
188,191 | (291) | 187,900 | 55,359 | | 243,259 | 170,386 | ||||||||||||
| | | | | | | | | | | | | | | | | | | | |
Total revenue |
2,565,345 | (10,973) | 2,554,372 | 701,655 | | 3,256,027 | 3,047,767 | ||||||||||||
| | | | | | | | | | | | | | | | | | | | |
EXPENSES: |
| ||||||||||||||||||
Property operating |
199,598 | (1,915) | 197,683 | 117,482 | | 315,165 | 318,082 | ||||||||||||
Depreciation and amortization |
583,883 | (1,833) | 582,050 | 194,830 | | 776,880 | 772,123 | ||||||||||||
Real estate taxes |
213,374 | (1,145) | 212,229 | 53,850 | | 266,079 | 243,489 | ||||||||||||
Repairs and maintenance |
52,410 | (400) | 52,010 | 17,816 | | 69,826 | 67,996 | ||||||||||||
Advertising and promotion |
59,971 | (184) | 59,787 | 15,843 | | 75,630 | 77,008 | ||||||||||||
Provision for credit losses |
6,533 | (6) | 6,527 | 1,493 | | 8,020 | 8,819 | ||||||||||||
Home and regional office costs |
75,250 | – | 75,250 | – | | 75,250 | 80,246 | ||||||||||||
General and administrative |
30,344 | (1) | 30,343 | – | | 30,343 | 30,454 | ||||||||||||
Other |
42,426 | (1,855) | 40,571 | 38,165 | | 78,736 | 79,352 | ||||||||||||
| | | | | | | | | | | | | | | | | | | | |
Total operating expenses |
1,263,789 | (7,339) | 1,256,450 | 439,479 | | 1,695,929 | 1,677,569 | ||||||||||||
| | | | | | | | | | | | | | | | | | | | |
OPERATING INCOME |
1,301,556 | (3,634) | 1,297,922 | 262,176 | | 1,560,098 | 1,370,198 | ||||||||||||
Interest expense |
(463,147) | 2,336 | (460,811) | (136,674) | | (597,485) | (647,028) | ||||||||||||
Income and other taxes |
(9,781) | – | (9,781) | – | | (9,781) | (13,489) | ||||||||||||
Income from unconsolidated entities |
135,068 | – | 135,068 | (125,502) | | 9,566 | (2) | 2,034 | (2) | ||||||||||
Gain upon acquisition of controlling interests and sale or disposal of assets and interests in unconsolidated entities, net |
16,339 | – | 16,339 | – | | 16,339 | 136,525 | ||||||||||||
| | | | | | | | | | | | | | | | | | | | |
Consolidated income from continuing operations |
980,035 | (1,298) | 978,737 | – | | 978,737 | 848,240 | ||||||||||||
| | | | | | | | | | | | | | | | | | | | |
Discontinued operations |
– | – | – | – | | – | 67,524 | ||||||||||||
Discontinued operations transaction expenses |
– | – | – | – | | – | (38,163) | ||||||||||||
| | | | | | | | | | | | | | | | | | | | |
CONSOLIDATED NET INCOME |
980,035 | (1,298) | 978,737 | – | | 978,737 | 877,601 | ||||||||||||
Net income attributable to noncontrolling interests |
143,248 | (1,298) | 141,950 | – | | 141,950 | (3) | 127,697 | (3) | ||||||||||
Preferred dividends |
1,669 | – | 1,669 | – | | 1,669 | 1,669 | ||||||||||||
| | | | | | | | | | | | | | | | | | | | |
NET INCOME ATTRIBUTABLE TO COMMON STOCKHOLDERS |
$ | 835,118 | $ | – | $ | 835,118 | $ | – | $ | 835,118 | $ | 748,235 | |||||||
| | | | | | | | | | | | | | | | | | | | |
| | | | | | | | | | | | | | | | | | | | |
| | | | | | | | | | | | | | | | | | | | |
RECONCILIATION OF CONSOLIDATED NET INCOME TO FFO: |
| ||||||||||||||||||
Consolidated Net Income |
$ | 980,035 | $ | – | $ | 980,035 | $ | 878,571 | |||||||||||
Adjustments to Consolidated Net Income to Arrive at FFO: |
| ||||||||||||||||||
Depreciation and amortization from consolidated properties |
576,080 | – | | 576,080 | 637,104 | ||||||||||||||
Our share of depreciation and amortization from unconsolidated entities, including Klépierre |
– | 252,068 | | 252,068 | 275,718 | ||||||||||||||
Income from unconsolidated entities |
(135,068) | 135,068 | | – | – | ||||||||||||||
Gain upon acquisition of controlling interests and sale or disposal of assets and interests in unconsolidated entities, net |
(16,339) | – | | (16,339) | (136,767) | ||||||||||||||
Net income attributable to noncontrolling interest holders in properties |
(1,298) | – | | (1,298) | (970) | ||||||||||||||
Noncontrolling interests portion of depreciation and amortization |
(1,833) | – | | (1,833) | (1,864) | ||||||||||||||
Preferred distributions and dividends |
(2,626) | – | | (2,626) | (2,626) | ||||||||||||||
| | | | | | | | | | | | | | | | | | | | |
FFO of the Operating Partnership |
$ | 1,398,951 | $ | 387,136 | $ | 1,786,087 | $ | 1,649,166 | |||||||||||
| | | | | | | | | | | | | | | | | | | | |
| | | | | | | | | | | | | | | | | | | | |
| | | | | | | | | | | | | | | | | | | | |
Percentage of FFO of the Operating Partnership |
78.32% | 21.68% | | 100.00% | 100.00% | ||||||||||||||
- (1)
- Represents our venture partners' share of operations from consolidated properties.
- (2)
- Our Total Share of income from unconsolidated entities represents our share of net results related to our investment in Klépierre.
- (3)
- Represents limited partners' interest in the Operating Partnership.
| 2Q 2015 SUPPLEMENTAL |
|
19 |
PRO-RATA BALANCE SHEET
(In thousands)
|
|
AS OF JUNE 30, 2015 |
| ||||||||||||||||
| | | | | | | | | | | | | | | | | | | | |
|
|
CONSOLIDATED |
|
NONCONTROLLING INTERESTS |
|
OUR CONSOLIDATED SHARE |
|
OUR SHARE OF JOINT VENTURES |
|
OUR TOTAL SHARE |
|
AS OF DECEMBER 31, 2014 OUR TOTAL SHARE |
|||||||
ASSETS: |
|||||||||||||||||||
Investment properties, at cost |
$ | 32,898,773 | $ | (125,921) | $ | 32,772,852 | $ | 10,147,177 | $ | 42,920,029 | $ | 41,213,880 | |||||||
Less - accumulated depreciation |
9,409,100 | (55,261) | 9,353,839 | 2,676,639 | | 12,030,478 | 11,510,665 | ||||||||||||
| | | | | | | | | | | | | | | | | | | | |
|
23,489,673 | (70,660) | 23,419,013 | 7,470,538 | | 30,889,551 | 29,703,215 | ||||||||||||
Cash and cash equivalents |
565,657 | (3,076) | 562,581 | 442,835 | | 1,005,416 | 1,132,675 | ||||||||||||
Tenant receivables and accrued revenue, net |
537,172 | (1,896) | 535,276 | 159,447 | | 694,723 | 752,565 | ||||||||||||
Investment in unconsolidated entities, at equity |
2,353,339 | – | 2,353,339 | (2,353,339) | | – | – | ||||||||||||
Investment in Klépierre, at equity |
1,803,746 | – | 1,803,746 | – | | 1,803,746 | 1,786,477 | ||||||||||||
Deferred costs and other assets |
1,333,944 | (7,116) | 1,326,828 | 295,075 | | 1,621,903 | 2,095,776 | ||||||||||||
| | | | | | | | | | | | | | | | | | | | |
Total assets |
$ | 30,083,531 | $ | (82,748) | $ | 30,000,783 | $ | 6,014,556 | $ | 36,015,339 | $ | 35,470,708 | |||||||
| | | | | | | | | | | | | | | | | | | | |
| | | | | | | | | | | | | | | | | | | | |
| | | | | | | | | | | | | | | | | | | | |
LIABILITIES: |
| | |||||||||||||||||
Mortgages and unsecured indebtedness |
$ | 22,070,777 | $ | (78,979) | $ | 21,991,798 | $ | 6,640,668 | $ | 28,632,466 | $ | 27,133,732 | |||||||
Accounts payable, accrued expenses, intangibles, and deferred revenues |
1,215,444 | (3,917) | 1,211,527 | 537,692 | | 1,749,219 | 1,837,316 | ||||||||||||
Cash distributions and losses in partnerships and joint ventures, at equity |
1,344,028 | – | 1,344,028 | (1,344,028) | | – | – | ||||||||||||
Other liabilities |
248,596 | (263) | 248,333 | 180,224 | | 428,557 | 522,389 | ||||||||||||
| | | | | | | | | | | | | | | | | | | | |
Total liabilities |
24,878,845 | (83,159) | 24,795,686 | 6,014,556 | | 30,810,242 | 29,493,437 | ||||||||||||
| | | | | | | | | | | | | | | | | | | | |
Commitments and contingencies |
| | |||||||||||||||||
Limited partners' preferred interest in the Operating Partnership |
25,537 | – | 25,537 | – | | 25,537 | 25,537 | ||||||||||||
EQUITY: |
| | |||||||||||||||||
Stockholders' equity |
| | |||||||||||||||||
Capital stock |
| | |||||||||||||||||
Series J 83/8% cumulative redeemable preferred stock |
43,898 | – | 43,898 | – | | 43,898 | 44,062 | ||||||||||||
Common stock, $.0001 par value |
31 | – | 31 | – | | 31 | 31 | ||||||||||||
Class B common stock, $.0001 par value |
– | – | – | – | | – | – | ||||||||||||
Capital in excess of par value |
9,357,567 | – | 9,357,567 | – | | 9,357,567 | 9,422,237 | ||||||||||||
Accumulated deficit |
(4,274,289) | – | (4,274,289) | – | | (4,274,289) | (4,208,183) | ||||||||||||
Accumulated other comprehensive loss |
(246,575) | – | (246,575) | – | | (246,575) | (61,041) | ||||||||||||
Common stock held in treasury at cost |
(437,751) | – | (437,751) | – | | (437,751) | (103,929) | ||||||||||||
| | | | | | | | | | | | | | | | | | | | |
Total stockholders' equity |
4,442,881 | – | 4,442,881 | – | | 4,442,881 | 5,093,177 | ||||||||||||
Noncontrolling interests |
736,268 | 411 | 736,679 | – | | 736,679 | 858,557 | ||||||||||||
| | | | | | | | | | | | | | | | | | | | |
Total equity |
5,179,149 | 411 | 5,179,560 | – | | 5,179,560 | 5,951,734 | ||||||||||||
| | | | | | | | | | | | | | | | | | | | |
Total liabilities and equity |
$ | 30,083,531 | $ | (82,748) | $ | 30,000,783 | $ | 6,014,556 | $ | 36,015,339 | $ | 35,470,708 | |||||||
| | | | | | | | | | | | | | | | | | | | |
| | | | | | | | | | | | | | | | | | | | |
| | | | | | | | | | | | | | | | | | | | |
We present balance sheet and income statement data on a pro-rata basis reflecting our proportionate economic ownership of each asset in our portfolio. The consolidated amounts shown are prepared on a consistent basis with our consolidated financial statements. Our Share of Joint Ventures column was derived on a property-by-property basis by applying the same joint venture ownership percentage interests used to arrive at our share of net income during the period and applying them to all financial statement line items of each property. A similar calculation was performed for noncontrolling interests.
| 2Q 2015 SUPPLEMENTAL |
|
20 |
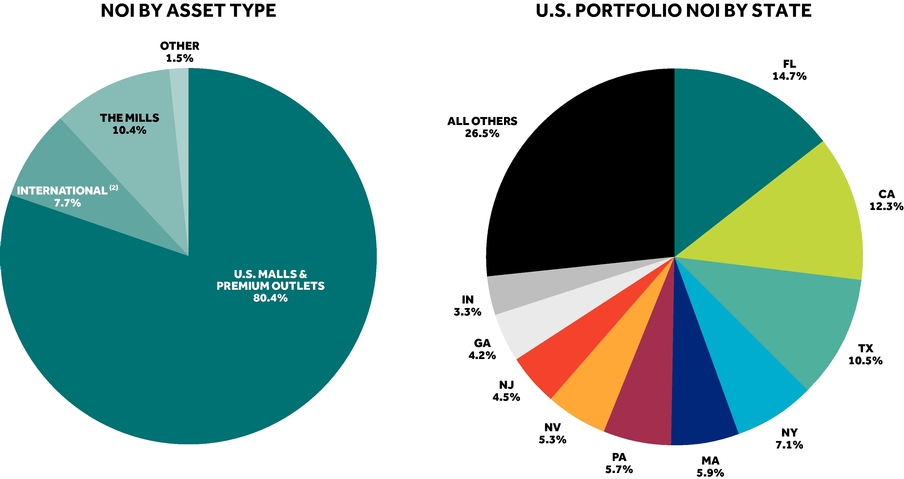
NET OPERATING INCOME (NOI) COMPOSITION (1)
For the Six Months Ended June 30, 2015
|
- (1)
- Based on our share of total NOI and does not reflect any property, entity or corporate-level debt.
- (2)
- Includes Klépierre, international Premium Outlets and international Designer Outlets.
| 2Q 2015 SUPPLEMENTAL |
|
21 |
RECONCILIATIONS OF NON-GAAP FINANCIAL MEASURES
(In thousands, except as noted)
The following schedule reconciles net income to NOI and provides our calculation of comparable property NOI. |
|||||||||||||
|
|||||||||||||
|
|
THREE MONTHS ENDED JUNE 30, |
|
SIX MONTHS ENDED JUNE 30, |
|||||||||
| | | | | | | | | | | | | | |
|
|
2015 | | 2014 |
|
2015 | | 2014 | |||||
Reconciliation of NOI of consolidated properties: |
| | |||||||||||
Consolidated Net Income |
$ | 554,526 | $ | 477,468 | $ | 980,035 | $ | 878,571 | |||||
Discontinued operations |
| – | (26,022) | | – | (67,524) | |||||||
Discontinued operations transaction expenses |
| – | 38,163 | | – | 38,163 | |||||||
Income and other taxes |
| 3,420 | 6,626 | | 9,781 | 13,489 | |||||||
Interest expense |
| 230,974 | 254,930 | | 463,147 | 509,164 | |||||||
Income from unconsolidated entities |
| (70,196) | (55,764) | | (135,068) | (112,842) | |||||||
Gain upon acquisition of controlling interests and sale or disposal of assets and interests in unconsolidated entities, net |
| (16,339) | (133,870) | | (16,339) | (136,525) | |||||||
| | | | | | | | | | | | | | |
Operating Income |
| 702,385 | 561,531 | | 1,301,556 | 1,122,496 | |||||||
Depreciation and amortization |
| 295,778 | 287,214 | | 583,883 | 567,708 | |||||||
| | | | | | | | | | | | | | |
NOI of consolidated properties |
$ | 998,163 | $ | 848,745 | $ | 1,885,439 | $ | 1,690,204 | |||||
| | | | | | | | | | | | | | |
| | | | | | | | | | | | | | |
| | | | | | | | | | | | | | |
Reconciliation of NOI of unconsolidated entities: |
| | |||||||||||
Net Income |
$ | 220,217 | $ | 171,390 | $ | 392,259 | $ | 338,971 | |||||
Interest expense |
| 149,041 | 150,059 | | 296,062 | 301,696 | |||||||
Gain on sale or disposal of assets and interests in unconsolidated entities |
| (35,779) | – | | (35,779) | – | |||||||
Income from operations of discontinued joint venture interests |
| – | (2,094) | | – | (5,079) | |||||||
| | | | | | | | | | | | | | |
Operating Income |
| 333,479 | 319,355 | | 652,542 | 635,588 | |||||||
Depreciation and amortization |
| 148,607 | 142,047 | | 290,265 | 294,195 | |||||||
| | | | | | | | | | | | | | |
NOI of unconsolidated entities |
$ | 482,086 | $ | 461,402 | $ | 942,807 | $ | 929,783 | |||||
| | | | | | | | | | | | | | |
| | | | | | | | | | | | | | |
| | | | | | | | | | | | | | |
Total consolidated and unconsolidated NOI from continuing operations |
$ | 1,480,249 | $ | 1,310,147 | $ | 2,828,246 | $ | 2,619,987 | |||||
| | | | | | | | | | | | | | |
| | | | | | | | | | | | | | |
| | | | | | | | | | | | | | |
Change in total NOI from continuing operations from prior period |
| 13.0% | | 7.9% | |||||||||
Adjustments to NOI: |
| | |||||||||||
NOI of discontinued consolidated properties |
| – | 68,953 | | – | 169,828 | |||||||
NOI of discontinued unconsolidated properties |
| – | 6,969 | | – | 17,445 | |||||||
| | | | | | | | | | | | | | |
Total NOI of our portfolio |
$ | 1,480,249 | $ | 1,386,069 | $ | 2,828,246 | $ | 2,807,260 | |||||
| | | | | | | | | | | | | | |
| | | | | | | | | | | | | | |
| | | | | | | | | | | | | | |
Add: Our share of NOI from Klépierre |
| 43,364 | 53,189 | | 86,661 | 120,065 | |||||||
Less: Joint venture partners' share of NOI from continuing operations |
| 249,945 | 237,443 | | 491,268 | 477,666 | |||||||
Less: Joint venture partners' share of NOI from discontinued operations |
| – | 5,139 | | – | 12,998 | |||||||
| | | | | | | | | | | | | | |
Our share of NOI |
$ | 1,273,668 | $ | 1,196,676 | $ | 2,423,639 | $ | 2,436,661 | |||||
| | | | | | | | | | | | | | |
| | | | | | | | | | | | | | |
| | | | | | | | | | | | | | |
Total NOI of our portfolio |
$ | 1,480,249 | $ | 1,386,069 | $ | 2,828,246 | $ | 2,807,260 | |||||
NOI from non comparable properties (1) |
| 300,933 | 247,346 | | 502,186 | 560,486 | |||||||
| | | | | | | | | | | | | | |
Total NOI of comparable properties (2) |
$ | 1,179,316 | $ | 1,138,723 | $ | 2,326,060 | $ | 2,246,774 | |||||
| | | | | | | | | | | | | | |
| | | | | | | | | | | | | | |
| | | | | | | | | | | | | | |
Increase in NOI of U.S. Malls, Premium Outlets and The Mills that are comparable properties |
| 3.6% | | 3.5% | |||||||||
| | | | | | | | | | | | | | |
| | | | | | | | | | | | | | |
| | | | | | | | | | | | | | |
- (1)
- NOI excluded from comparable property NOI relates to WPG properties, international properties, other retail properties, TMLP properties, any of our non-retail holdings and results of our corporate and management company operations, NOI of U.S. Malls, Premium Outlets and The Mills not owned and operated in both periods under comparison and excluded income noted in footnote 2 below.
- (2)
- Excludes lease termination income, interest income, land sale gains, straight line rent, above/below market rent adjustments, and the impact of significant redevelopment activities.
| 2Q 2015 SUPPLEMENTAL |
|
22 |
RECONCILIATIONS OF NON-GAAP FINANCIAL MEASURES
(In thousands, except as noted)
- (1)
- Non-cash impacts to FFO of the Operating Partnership include:
|
|
THREE MONTHS ENDED JUNE 30, 2015 |
|
SIX MONTHS ENDED JUNE 30, 2015 |
||||||||||
Deductions: |
||||||||||||||
Straight-line rent |
(16,889) | (33,239) | ||||||||||||
Fair value of debt amortization |
(5,407) | (12,625) | ||||||||||||
Fair market value of lease amortization |
(3,222) | (6,581) | ||||||||||||
Additions: |
||||||||||||||
Stock based compensation expense |
12,533 | 25,053 | ||||||||||||
Mortgage, financing fee and terminated swap amortization expense |
9,922 | 19,904 | ||||||||||||
| | | | | | | | | | | | | | | |
|
(3,063) | (7,488) | ||||||||||||
| | | | | | | | | | | | | | | |
| | | | | | | | | | | | | | | |
| | | | | | | | | | | | | | |
This report contains measures of financial or operating performance that are not specifically defined by generally accepted accounting principles (GAAP) in the United States, including FFO, diluted FFO per share, funds available for distribution, net operating income (NOI), and comparable property NOI. FFO and NOI are performance measures that are standard in the REIT business. We believe FFO and NOI provide investors with additional information concerning our operating performance and a basis to compare our performance with the performance of other REITs. We also use these measures internally to monitor the operating performance of our portfolio. Our computation of these non-GAAP measures may not be the same as similar measures reported by other REITs.
The non-GAAP financial measures used in this report should not be considered as alternatives to net income as a measure of our operating performance or to cash flows computed in accordance with GAAP as a measure of liquidity nor are they indicative of cash flows from operating and financial activities. Reconciliations of other non-GAAP measures used in this report to the most-directly comparable GAAP measure are included in the tables on pages 18-19, 22 and 23 and in the Earnings Release for the latest period.
| 2Q 2015 SUPPLEMENTAL |
|
23 |
OTHER INCOME, OTHER EXPENSE AND CAPITALIZED INTEREST
(In thousands)
|
|
THREE MONTHS ENDED JUNE 30, |
|
SIX MONTHS ENDED JUNE 30, |
||||||||
| | | | | | | | | | | | | |
|
|
2015 |
|
2014 |
|
2015 | | 2014 | ||||
Consolidated Properties |
||||||||||||
Other Income (1) |
||||||||||||
Interest and dividend income |
$ | 6,832 | $ | 2,678 | $ | 13,497 | $ | 5,178 | ||||
Lease settlement income |
13,280 | 1,138 | 17,065 | 12,022 | ||||||||
Gains on land sales |
3,635 | 4,945 | 4,361 | 12,155 | ||||||||
Realized gains on sale of marketable securities |
80,187 | – | 80,187 | – | ||||||||
Other (2) |
35,673 | 29,183 | 73,081 | 55,577 | ||||||||
| | | | | | | | | | | | | |
Totals |
$ | 139,607 | $ | 37,944 | $ | 188,191 | $ | 84,932 | ||||
| | | | | | | | | | | | | |
| | | | | | | | | | | | | |
| | | | | | | | | | | | | |
|
||||||||||||
Other Expense (1) |
||||||||||||
Ground leases |
$ | 9,601 | $ | 10,992 | $ | 18,718 | $ | 19,949 | ||||
Professional fees and other |
13,751 | 7,415 | 23,708 | 17,820 | ||||||||
| | | | | | | | | | | | | |
Totals |
$ | 23,352 | $ | 18,407 | $ | 42,426 | $ | 37,769 | ||||
| | | | | | | | | | | | | |
| | | | | | | | | | | | | |
| | | | | | | | | | | | | |
|
||||||||||||
| | | | | | | | | | | | | |
Capitalized Interest (1) |
|
THREE MONTHS ENDED JUNE 30, |
|
SIX MONTHS ENDED JUNE 30, |
||||||||
| | | | | | | | | | | | | |
|
|
2015 |
|
2014 |
|
2015 | | 2014 | ||||
Interest Capitalized during the Period: |
||||||||||||
Our Share of Consolidated Properties |
$ | 8,231 | $ | 3,092 | $ | 15,306 | $ | 6,414 | ||||
Our Share of Joint Venture Properties |
$ | 719 | $ | 124 | $ | 1,278 | $ | 196 | ||||
- (1)
- Excludes WPG properties in all periods presented as those items are reported as discontinued operations.
- (2)
- Includes ancillary property revenues, gift cards, marketing, media, parking and sponsorship revenues and other miscellaneous income items.
| 2Q 2015 SUPPLEMENTAL |
|
24 |
U.S. MALLS AND PREMIUM OUTLETS OPERATING INFORMATION (1)
|
|
AS OF JUNE 30, |
||||
| | | | | | | |
|
|
2015 | | 2014 (1) | ||
Total Number of Properties |
| 178 | 181 | |||
Total Square Footage of Properties (in millions) |
|
151.6 |
154.2 |
|||
Ending Occupancy (2): |
|
|||||
Consolidated Assets |
| 96.4% | 96.9% | |||
Unconsolidated Assets |
| 95.3% | 95.5% | |||
Total Portfolio |
| 96.1% | 96.5% | |||
Total Sales per Square Foot (PSF) (3): |
|
|||||
Consolidated Assets |
$ | 608 | $ | 596 | ||
Unconsolidated Assets |
$ | 662 | $ | 650 | ||
Total Portfolio |
$ | 620 | $ | 608 | ||
Base Minimum Rent PSF (4): |
|
|||||
Consolidated Assets |
$ | 46.40 | $ | 44.46 | ||
Unconsolidated Assets |
$ | 53.08 | $ | 49.66 | ||
Total Portfolio |
$ | 48.07 | $ | 45.83 | ||
Releasing Activity for the Trailing Twelve Month Period Ended:
|
| | TOTAL RENT PSF | | | ||||||||||
| | | | | | | | | | | | | | | | |
|
|
SQUARE FOOTAGE OF OPENINGS |
|
OPENING RATE PSF (5) |
|
CLOSING RATE PSF (5) |
|
RELEASING SPREAD (5) |
|||||||
6/30/15 |
| 7,323,872 | $ | 69.90 | $ | 59.03 | $ | 10.87 | | 18.4% | |||||
3/31/15 |
7,378,694 | $ | 70.54 | $ | 59.35 | $ | 11.19 | 18.9% | |||||||
12/31/14 |
| 7,560,601 | $ | 67.51 | $ | 57.92 | $ | 9.59 | | 16.6% | |||||
9/30/14 |
7,263,578 | $ | 65.46 | $ | 55.79 | $ | 9.67 | 17.3% | |||||||
6/30/14 |
| 7,174,353 | $ | 66.28 | $ | 55.22 | $ | 11.06 | | 20.0% | |||||
Occupancy Cost as a Percentage of Sales (6): |
|||||||||||||||
6/30/15 |
11.9% | ||||||||||||||
3/31/15 |
| 11.7% | |||||||||||||
12/31/14 |
11.7% | ||||||||||||||
9/30/14 |
| 11.7% | |||||||||||||
6/30/14 |
11.6% | ||||||||||||||
- (1)
- Excludes WPG properties and all prior periods have been restated.
- (2)
- Ending Occupancy is the percentage of total owned square footage (GLA) which is leased as of the last day of the reporting period. We include all company owned space except for mall anchors, mall majors, mall freestanding and mall outlots in the calculation.
- (3)
- Total Sales PSF is defined as total sales of the tenants open and operating in the center during the reporting period divided by the associated company owned and occupied GLA on a trailing 12-month basis. Includes tenant sales activity for all months a tenant is open within the trailing 12-month period. In accordance with the standard definition of sales for regional malls adopted by the International Council of Shopping Centers, only stores with less than 10,000 square feet are included for malls. All company owned space is included for Premium Outlets.
- (4)
- Base Minimum Rent PSF is the average base minimum rent charge in effect for the reporting period for all tenants that would qualify to be included in Ending Occupancy as defined above.
- (5)
- Releasing Spread is a "same space" measure that compares opening and closing rates on individual spaces, including spaces greater than 10,000 square feet. The Opening Rate is the average of the initial cash Total Rent PSF for spaces leased during the trailing 12-month period, and includes new leases and existing tenant renewals, amendments and relocations (including expansions and downsizings). The Closing Rate is the average of the final cash Total Rent PSF as of the month the tenant terminates or closes. Total Rent PSF includes Base Minimum Rent, common area maintenance (CAM) and base percentage rent. It includes leasing activity on all spaces occupied by tenants that would qualify to be included in Ending Occupancy as defined above as long as the opening and closing dates are within 24 months of one another.
- (6)
- Occupancy Cost as a Percentage of Sales is the trailing 12-month Base Minimum Rent, plus all applicable ancillary charges, plus overage rent, if applicable (based on last 12 months of sales), divided by the trailing 12-month Total Sales PSF for the same tenants.
| 2Q 2015 SUPPLEMENTAL |
|
25 |
THE MILLS AND INTERNATIONAL OPERATING INFORMATION
|
|
AS OF JUNE 30, | ||||
| | | | | | | |
|
|
2015 | | 2014 | ||
The Mills |
| |||||
Total Number of Properties |
|
14 |
13 |
|||
Total Square Footage of Properties (in millions) |
|
20.9 |
19.7 |
|||
Ending Occupancy (1) |
|
98.2% |
98.0% |
|||
Total Sales PSF (2) |
$ |
571 |
$ |
529 |
||
Base Minimum Rent PSF (3) |
$ |
26.53 |
$ |
24.78 |
||
Releasing Spread PSF (4) |
$ |
13.19 |
$ |
12.74 |
||
Releasing Spread (Percentage Change) (4) |
|
33.0% |
46.9% |
|||
|
| |||||
International Properties |
| |||||
Premium Outlets |
|
|||||
Total Number of Properties |
|
16 |
15 |
|||
Total Square Footage of Properties (in millions) |
|
5.9 |
5.0 |
|||
Designer Outlets |
|
|||||
Total Number of Properties |
|
5 |
5 |
|||
Total Square Footage of Properties (in millions) |
|
1.0 |
1.0 |
|||
Statistics for Premium Outlets in Japan (5) |
|
|||||
Ending Occupancy |
|
99.8% |
99.5% |
|||
Total Sales PSF |
|
¥ 99,582 |
¥ 91,869 |
|||
Base Minimum Rent PSF |
|
¥ 4,967 |
¥ 4,913 |
|||
- (1)
- See footnote 2 on page 25 for definition, except Ending Occupancy is calculated on all company owned space.
- (2)
- See footnote 3 on page 25 for definition; calculation methodology is the same as for malls.
- (3)
- See footnote 4 on page 25 for definition.
- (4)
- See footnote 5 on page 25 for definition.
- (5)
- Information supplied by the managing venture partner; includes 9 properties.
| 2Q 2015 SUPPLEMENTAL |
|
26 |
U.S. MALLS AND PREMIUM OUTLETS LEASE EXPIRATIONS (1)
YEAR |
|
NUMBER OF LEASES EXPIRING |
|
SQUARE FEET |
|
AVG. BASE MINIMUM RENT PSF AT 6/30/15 |
|
PERCENTAGE OF GROSS ANNUAL RENTAL REVENUES (2) |
||||
Inline Stores and Freestanding |
||||||||||||
Month to Month Leases |
700 |
2,375,051 |
$ |
44.22 |
2.4% |
|||||||
2015 (7/1/15 - 12/31/15) |
577 | 1,479,931 | $ | 49.65 | 1.6% | |||||||
2016 |
2,481 | 8,326,584 | $ | 42.68 | 7.8% | |||||||
2017 |
2,475 | 8,350,766 | $ | 45.46 | 8.5% | |||||||
2018 |
2,272 | 8,378,948 | $ | 47.84 | 8.9% | |||||||
2019 |
1,860 | 7,112,948 | $ | 46.99 | 7.5% | |||||||
2020 |
1,484 | 5,792,186 | $ | 47.01 | 6.0% | |||||||
2021 |
1,214 | 5,016,308 | $ | 48.69 | 5.6% | |||||||
2022 |
1,463 | 5,617,958 | $ | 49.86 | 6.3% | |||||||
2023 |
1,710 | 6,515,541 | $ | 51.81 | 7.6% | |||||||
2024 |
1,556 | 5,920,625 | $ | 54.45 | 7.1% | |||||||
2025 |
877 | 3,371,360 | $ | 60.80 | 4.6% | |||||||
2026 and Thereafter |
410 | 2,134,262 | $ | 42.45 | 2.1% | |||||||
Specialty Leasing Agreements w/ terms in excess of 12 months |
875 | 2,255,605 | $ | 19.87 | 1.0% | |||||||
|
||||||||||||
Anchors |
||||||||||||
2016 |
7 |
861,306 |
$ |
2.28 |
0.0% |
|||||||
2017 |
21 | 2,780,232 | $ | 3.20 | 0.2% | |||||||
2018 |
16 | 2,085,629 | $ | 4.71 | 0.2% | |||||||
2019 |
20 | 2,203,190 | $ | 5.14 | 0.3% | |||||||
2020 |
25 | 2,890,841 | $ | 4.92 | 0.3% | |||||||
2021 |
11 | 1,064,318 | $ | 6.95 | 0.1% | |||||||
2022 |
8 | 957,917 | $ | 9.67 | 0.2% | |||||||
2023 |
10 | 1,268,016 | $ | 10.65 | 0.3% | |||||||
2024 |
12 | 703,770 | $ | 11.67 | 0.2% | |||||||
2025 |
18 | 2,142,396 | $ | 9.36 | 0.5% | |||||||
2026 and Thereafter |
19 | 2,404,785 | $ | 5.02 | 0.3% |
- (1)
- Does not consider the impact of renewal options that may be contained in leases.
- (2)
- Annual rental revenues represent domestic 2014 consolidated and joint venture combined base rental revenue excluding WPG properties.
| 2Q 2015 SUPPLEMENTAL |
|
27 |
U.S. MALLS AND PREMIUM OUTLETS TOP TENANTS
TOP INLINE STORE TENANTS (sorted by percentage of total base minimum rent for U.S. properties)
TENANT |
|
NUMBER OF STORES |
|
SQUARE FEET (000's) |
|
PERCENT OF TOTAL SQ. FT. IN U.S. PROPERTIES |
|
PERCENT OF TOTAL BASE MINIMUM RENT FOR U.S. PROPERTIES |
||||
|
||||||||||||
The Gap, Inc. |
367 | 3,716 | 2.0% | 3.4% | ||||||||
L Brands, Inc. |
297 | 1,765 | 1.0% | 2.1% | ||||||||
Signet Jewelers, Ltd. |
405 | 594 | 0.3% | 1.6% | ||||||||
PVH Corporation |
269 | 1,504 | 0.8% | 1.5% | ||||||||
Abercrombie & Fitch Co. |
181 | 1,295 | 0.7% | 1.5% | ||||||||
Forever 21, Inc. |
79 | 1,307 | 0.7% | 1.4% | ||||||||
VF Corporation |
244 | 1,227 | 0.7% | 1.2% | ||||||||
Foot Locker, Inc. |
251 | 1,033 | 0.6% | 1.2% | ||||||||
American Eagle Outfitters, Inc. |
174 | 1,133 | 0.6% | 1.2% | ||||||||
Luxottica Group SPA |
386 | 700 | 0.4% | 1.2% |
TOP ANCHORS (sorted by percentage of total square footage in U.S. properties) (1)
ANCHOR |
|
NUMBER OF STORES |
|
SQUARE FEET (000's) |
|
PERCENT OF TOTAL SQ. FT. IN U.S. PROPERTIES |
|
PERCENT OF TOTAL BASE MINIMUM RENT FOR U.S. PROPERTIES |
||||
|
||||||||||||
Macy's Inc. |
123 | 23,393 | 12.8% | 0.4% | ||||||||
Sears Holdings Corporation (2) |
73 | 12,176 | 6.6% | 0.5% | ||||||||
J.C. Penney Co., Inc. |
71 | 11,370 | 6.2% | 0.4% | ||||||||
Dillard's, Inc. |
38 | 6,839 | 3.7% | * | ||||||||
Nordstrom, Inc. |
27 | 4,541 | 2.5% | 0.1% | ||||||||
Hudson's Bay Company |
15 | 2,004 | 1.1% | 0.1% | ||||||||
Belk, Inc. |
10 | 1,674 | 0.9% | 0.1% | ||||||||
Dick's Sporting Goods, Inc. |
24 | 1,640 | 0.9% | 0.5% | ||||||||
The Neiman Marcus Group, Inc. |
10 | 1,265 | 0.7% | * | ||||||||
Target Corporation |
7 | 1,091 | 0.6% | 0.1% | ||||||||
The Bon-Ton Stores, Inc. |
8 | 1,081 | 0.6% | * |
- (1)
- Includes space leased and owned by anchors in U.S. Malls; does not include Bloomingdale's The Outlet Store, Neiman Marcus Last Call, Nordstrom Rack, and Saks Fifth Avenue Off 5th.
- (2)
- Includes 10 stores contributed to a joint venture and 17 stores owned by Seritage Growth Properties, Inc. and leased back to Sears Holdings Corporation.
- *
- Less than one-tenth of one percent.
| 2Q 2015 SUPPLEMENTAL |
|
28 |
CAPITAL EXPENDITURES
(In thousands)
|
|
|
UNCONSOLIDATED PROPERTIES |
||||||
| | | | | | | | | | |
|
|
CONSOLIDATED PROPERTIES |
|
TOTAL |
|
OUR SHARE |
|||
New development projects |
$ | 70,826 | $ | 416,134 | $ | 135,713 | |||
Redevelopment projects with incremental square footage and/or anchor replacement |
285,771 |
221,259 |
108,817 |
||||||
Redevelopment projects with no incremental square footage |
27,393 |
33,656 |
16,294 |
||||||
| | | | | | | | | | |
|
|||||||||
Subtotal new development and redevelopment projects |
| 383,990 | | 671,049 | | 260,824 | |||
Tenant allowances |
54,133 |
32,923 |
16,268 |
||||||
Operational capital expenditures at properties: |
|||||||||
CAM expenditures (1) |
19,452 | 29,459 | 12,860 | ||||||
Non-CAM expenditures |
4,431 | 3,026 | 1,252 | ||||||
| | | | | | | | | | |
|
|||||||||
Totals |
$ | 462,006 | $ | 736,457 | $ | 291,204 | |||
| | | | | | | | | | |
| | | | | | | | | | |
| | | | | | | | | | |
Conversion from accrual to cash basis |
26,944 |
20,430 |
8,078 |
||||||
| | | | | | | | | | |
|
|||||||||
Capital Expenditures for the Six Months Ended 6/30/15 (2) |
$ | 488,950 | $ | 756,887 | $ | 299,282 | |||
| | | | | | | | | | |
| | | | | | | | | | |
| | | | | | | | | | |
|
|||||||||
Capital Expenditures for the Six Months Ended 6/30/14 (2) |
$ | 366,034 | $ | 306,933 | $ | 145,754 | |||
| | | | | | | | | | |
| | | | | | | | | | |
| | | | | | | | | | |
- (1)
- Expenditures included in the pool of expenses allocated to tenants as CAM.
- (2)
- Agrees with the line item "Capital expenditures" on the Combined Statements of Cash Flows for the consolidated properties. No statement of cash flows is prepared for the joint venture properties; however, the above reconciliation was completed in the same manner as the reconciliation for the consolidated properties.
| 2Q 2015 SUPPLEMENTAL |
|
29 |
DEVELOPMENT ACTIVITY SUMMARY (1)
As of June 30, 2015
(in millions, except percent)
|
PLATFORM |
|
|
PROJECTED GROSS COST (2) |
|
|
PROJECTED NET COST (3) |
|
|
OUR SHARE OF NET COST |
|
|
EXPECTED STABILIZED RATE OF RETURN |
|
|
TOTAL CONSTRUCTION IN PROGRESS |
|
|
OUR SHARE OF TOTAL CONSTRUCTION IN PROGRESS |
| ||||||||||||||
|
Malls |
| | | | | | | | | | | | | | | | | | | ||||||||||||||
|
New Developments |
$ | 700 | $ | 671 | $ | 219 | 7% | $ | 362 | $ | 101 | ||||||||||||||||||||||
|
Redevelopments |
$ | 1,666 | $ | 1,614 | $ | 1,226 | 7% | $ | 874 | $ | 663 | ||||||||||||||||||||||
|
|
|||||||||||||||||||||||||||||||||
|
Premium Outlets |
| | | | | | | | | | | | | | | | | | | ||||||||||||||
|
New Developments |
$ | 586 | $ | 568 | $ | 390 | 11% | $ | 305 | $ | 210 | ||||||||||||||||||||||
|
Redevelopments |
$ | 434 | $ | 403 | $ | 403 | 11% | $ | 221 | $ | 221 | ||||||||||||||||||||||
|
|
|||||||||||||||||||||||||||||||||
|
The Mills |
| | | | | | | | | | | | | | | | | | | ||||||||||||||
|
Redevelopments |
$ | 140 | $ | 62 | $ | 59 | 14% | $ | 41 | $ | 36 | ||||||||||||||||||||||
|
Totals |
| $ | 3,526 | | $ | 3,318 | | $ | 2,297 | | | 9% | | $ | 1,803 | | $ | 1,231 | | ||||||||||||||
- (1)
- Represents projects under construction; new development and redevelopment projects with budgeted gross costs in excess of $5 million; and anchor/big box/restaurant additions with budgeted gross costs in excess of $2 million. Includes both domestic and international properties.
- (2)
- Projected Gross Cost includes soft costs such as architecture and engineering fees, tenant costs (allowances/leasing commissions), development, legal and other fees, marketing costs, cost of capital, and other related costs.
- (3)
- Projected Net Cost includes cost recoveries such as land sales, tenant reimbursements, Tax Increment Financing (TIF), CAM, and other such recoveries.
- (4)
- Costs and returns are based upon current budget assumptions; actual costs may vary.
| 2Q 2015 SUPPLEMENTAL |
|
30 |
DEVELOPMENT ACTIVITY REPORT (1)
As of June 30, 2015
|
PROPERTY/ LOCATION |
PROJECT DESCRIPTION |
ACTUAL/ PROJECTED OPENING |
COMPANY'S OWNERSHIP PERCENTAGE |
|||
| Malls - New Developments | ||||||
Brickell City Centre - Miami, FL |
500,000 SF retail development |
9/16 |
25% |
|||
The Shops at Clearfork - Fort Worth, TX |
590,000 SF retail/office development |
2/17 |
45% |
|||
| Malls - Redevelopments | ||||||
Copley Place Office - Boston, MA |
AIR Worldwide expansion |
7/15 |
94% |
|||
Copley Place Office - Boston, MA |
Wayfair expansion |
7/15 |
94% |
|||
Southdale Center - Edina (Minneapolis), MN |
Dave & Buster's |
7/15 |
100% |
|||
Southdale Center - Edina (Minneapolis), MN |
Gordmans |
7/15 |
100% |
|||
Barton Creek Square - Austin, TX |
The Cheesecake Factory |
8/15 |
100% |
|||
Phipps Plaza - Atlanta, GA |
Redevelopment |
8/15 |
100% |
|||
Copley Place Office - Boston, MA |
Redevelopment |
9/15 |
94% |
|||
Menlo Park Mall - Edison (New York), NJ |
Havana Central |
9/15 |
100% |
|||
Del Amo Fashion Center - Torrance (Los Angeles), CA |
Phase II includes 260,000 SF small shop expansion and addition of Nordstrom |
10/15 |
50% |
|||
Woodfield Mall - Schaumburg (Chicago), IL |
Redevelopment |
10/15 |
50% |
|||
Del Amo Fashion Center - Torrance (Los Angeles), CA |
Phase III includes the redevelopment of the two-level and single level south mall |
11/15 |
50% |
|||
Menlo Park Mall - Edison (New York), NJ |
Redevelopment |
11/15 |
100% |
|||
Phipps Plaza - Atlanta, GA |
Peachtree Road façade redevelopment |
11/15 |
100% |
|||
Town Center at Boca Raton - Boca Raton (Miami), FL |
Entrance redevelopment and valet upgrades |
11/15 |
100% |
|||
Roosevelt Field - Garden City (New York), NY |
AMC Theatre renovation |
12/15 |
100% |
|||
Wolfchase Galleria - Memphis, TN |
The Cheesecake Factory |
12/15 |
95% |
|||
Independence Center - Independence (Kansas City), MO |
Dick's Sporting Goods |
2/16 |
100% |
|||
Roosevelt Field - Garden City (New York), NY |
Redevelopment (11/15) and 50,000 SF small shop expansion and addition of Neiman Marcus (2/16) |
2/16 |
100% |
|||
Woodland Hills Mall - Tulsa, OK |
Texas de Brazil |
2/16 |
95% |
|||
Galleria, The - Houston, TX |
14,000 SF luxury building addition |
3/16 |
50% |
|||
Stanford Shopping Center - Palo Alto (San Jose), CA |
Relocation of Bloomingdale's (opened 10/14), redevelopment and 120,000 SF small shop expansion (3/16) |
3/16 |
100% |
|||
Tyrone Square - St. Petersburg, FL |
Cobb 10 Luxury Theatre |
3/16 |
100% |
| 2Q 2015 SUPPLEMENTAL |
|
31 |
DEVELOPMENT ACTIVITY REPORT (1)
As of June 30, 2015
|
PROPERTY/ LOCATION |
PROJECT DESCRIPTION |
ACTUAL/ PROJECTED OPENING |
COMPANY'S OWNERSHIP PERCENTAGE |
|||
Dadeland Mall - Miami, FL |
Dining pavilion redevelopment |
4/16 |
50% |
|||
Fashion Centre at Pentagon City, The - Arlington, VA |
Redevelopment (12/15) and 50,000 SF expansion (4/16) |
4/16 |
43% |
|||
Montgomery Mall - North Wales (Philadelphia), PA |
Redevelopment of the Wegmans wing |
4/16 |
79% |
|||
Phipps Plaza Hotel - Atlanta, GA |
166 room AC Hotel by Marriott |
5/16 |
50% |
|||
Haywood Mall - Greenville, SC |
The Cheesecake Factory |
6/16 |
100% |
|||
Phipps Plaza - Atlanta, GA |
319 residential units |
7/16 |
50% |
|||
King of Prussia - King of Prussia (Philadelphia), PA |
150,000 SF small shop expansion including restaurants to connect The Plaza and The Court |
8/16 |
100% |
|||
Galleria, The - Houston, TX |
Redevelopment |
11/16 |
50% |
|||
Galleria, The - Houston, TX |
Relocation of Saks Fifth Avenue (4/16), redevelopment (4/16) and 105,000 SF small shop expansion (6/17) |
6/17 |
50% |
|||
Florida Mall, The - Orlando, FL |
Redevelopment of the Saks building to an indoor/outdoor dining pavilion (opened 6/15) and small shops (11/17) |
11/17 |
50% |
|||
| Premium Outlets - New Developments | ||||||
Gloucester Premium Outlets - Gloucester (Philadelphia, PA), NJ |
375,000 SF upscale Premium Outlet Center |
8/15 |
50% |
|||
Tucson Premium Outlets - Marana (Tucson), AZ |
366,000 SF upscale Premium Outlet Center |
10/15 |
100% |
|||
Tampa Premium Outlets - Tampa, FL |
441,000 SF upscale Premium Outlet Center |
10/15 |
100% |
|||
Tanger Outlets - Columbus - Columbus, OH |
355,000 SF upscale Outlet Center |
6/16 |
50% |
|||
| Designer Outlets - New Developments | ||||||
Vancouver Designer Outlet - Vancouver, British Columbia, Canada |
242,000 SF Designer Outlet Center |
7/15 |
45% |
|||
| Premium Outlets - Redevelopments | ||||||
Chicago Premium Outlets - Aurora (Chicago), IL |
264,000 SF expansion |
8/15 |
100% |
|||
San Francisco Premium Outlets - Livermore (San Francisco), CA |
185,000 SF expansion |
8/15 |
100% |
|||
Chicago Premium Outlets - Aurora (Chicago), IL |
Phase I redevelopment |
5/16 |
100% |
|||
Woodbury Common Premium Outlets - Central Valley (New York), NY |
Redevelopment and 63,000 SF expansion |
8/16 |
100% |
| 2Q 2015 SUPPLEMENTAL |
|
32 |
DEVELOPMENT ACTIVITY REPORT (1)
As of June 30, 2015
|
PROPERTY/ LOCATION |
PROJECT DESCRIPTION |
ACTUAL/ PROJECTED OPENING |
COMPANY'S OWNERSHIP PERCENTAGE |
|||
| The Mills - Redevelopments | ||||||
Potomac Mills - Woodbridge (Washington, D.C.), VA |
Matchbox Restaurant |
12/15 |
100% |
|||
The Colonnade at Sawgrass - Sunrise (Miami), FL |
56,000 SF expansion |
12/15 |
100% |
|||
Grapevine Mills - Grapevine (Dallas), TX |
Redevelopment |
12/15 |
59% |
|||
Arizona Mills - Tempe (Phoenix), AZ |
Sports Authority relocation (opened 5/15) and addition of Legoland (5/16) |
5/16 |
100% |
|||
Sawgrass Mills - Sunrise (Miami), FL |
Addition of two parking decks |
7/17 |
100% |
- (1)
- Projects listed represent projects that are under construction; new development and redevelopment projects with budgeted gross costs in excess of $5 million; and anchor/big box/restaurant additions with budgeted gross costs in excess of $2 million.
| 2Q 2015 SUPPLEMENTAL |
|
33 |
PROPERTY NAME/LOCATION |
PROPERTY TYPE | NEW TENANT | FORMER TENANT | |||
Openings during the First Six Months of 2015 |
||||||
Arizona Mills - Tempe (Phoenix), AZ |
Mills |
Sports Authority (1) |
Saks Fifth Avenue Off 5th |
|||
Columbia Center - Kennewick, WA |
Mall |
DSW |
N/A |
|||
Florida Mall, The - Orlando, FL |
Mall |
Dick's Sporting Goods |
Nordstrom |
|||
|
Crayola Experience |
Nordstrom |
||||
King of Prussia - King of Prussia (Philadelphia), PA |
Mall |
Grand Lux Café |
N/A |
|||
Prien Lake Mall - Lake Charles, LA |
Mall |
Ulta |
Piccadilly Cafeteria |
|||
Walt Whitman Shops - Huntington Station (New York), NY |
Mall |
Zara |
N/A |
|||
|
|
|
|
|||
Openings Projected for the Remainder of 2015 |
||||||
Barton Creek Square - Austin, TX |
Mall |
The Cheesecake Factory |
N/A |
|||
Del Amo Fashion Center - Los Angeles, CA |
Mall |
Nordstrom |
N/A |
|||
Galleria, The - Houston, TX |
Mall |
The Webster |
N/A |
|||
King of Prussia - King of Prussia (Philadelphia), PA |
Mall |
Primark |
Sears |
|||
Mall at Rockingham Park, The - Salem (Boston), NH |
Mall |
Dick's Sporting Goods |
Sears (2) |
|||
McCain Mall - N. Little Rock, AR |
Mall |
B.J.'s Brewhouse |
N/A |
|||
Menlo Park Mall - Edison (New York), NJ |
Mall |
Havana Central |
Champps |
|||
Potomac Mills - Woodbridge (Washington, DC), VA |
Mills |
Matchbox Restaurant |
N/A |
|||
Rockaway Townsquare - Rockaway (New York), NY |
Mall |
Raymour & Flanigan |
Sears (2) |
|||
Southdale Center - Edina (Minneapolis), MN |
Mall |
Dave & Buster's |
N/A |
|||
|
Gordmans |
Marshalls |
||||
Summit Mall - Akron, OH |
Mall |
B.J.'s Brewhouse |
N/A |
|||
Wolfchase Galleria - Memphis, TN |
Mall |
The Cheesecake Factory |
N/A |
| 2Q 2015 SUPPLEMENTAL |
|
34 |
PROPERTY NAME/LOCATION |
PROPERTY TYPE | NEW TENANT | FORMER TENANT | |||
Openings Projected for 2016 |
||||||
Arizona Mills - Tempe (Phoenix), AZ |
Mills |
Legoland |
Sports Authority (1) |
|||
Burlington Mall - Burlington (Boston), MA |
Mall |
Primark |
Sears (2) |
|||
Galleria, The - Houston, TX |
Mall |
Yauatcha Restaurant |
N/A |
|||
Haywood Mall - Greenville, SC |
Mall |
The Cheesecake Factory |
Panera Bread (1) |
|||
Independence Center - Independence (Kansas City), MO |
Mall |
Dick's Sporting Goods |
N/A |
|||
Mall of Georgia - Buford (Atlanta), GA |
Mall |
Von Maur |
Nordstrom |
|||
Roosevelt Field - Garden City (New York), NY |
Mall |
Neiman Marcus |
N/A |
|||
Sawgrass Mills - Sunrise (Miami), FL |
Mills |
Century 21 Department Store |
VF Outlet |
|||
South Shore Plaza - Braintree (Boston), MA |
Mall |
Primark |
Sears (2) |
|||
Tyrone Square - St. Petersburg (Tampa), FL |
Mall |
Cobb 10 Luxury Theatre |
N/A |
|||
Woodland Hills Mall - Tulsa, OK |
Mall |
Texas de Brazil |
N/A |
|||
|
|
|
|
|||
Openings Projected for 2017 and Beyond |
||||||
College Mall - Bloomington, IN |
Mall |
Ulta |
Sears |
- (1)
- Tenant has an existing store at this center but will move to a new location.
- (2)
- Tenant to remain in a portion of its existing space.
| 2Q 2015 SUPPLEMENTAL |
|
35 |
COMMON AND PREFERRED STOCK INFORMATION
CHANGES IN COMMON SHARE AND LIMITED PARTNERSHIP UNIT OWNERSHIP
For the Period December 31, 2014 through June 30, 2015
|
|
COMMON SHARES (1) |
|
LIMITED PARTNERSHIP UNITS (2) |
||
Number Outstanding at December 31, 2014 |
310,787,910 | 52,846,682 | ||||
First Quarter Activity: |
||||||
Exchange of Limited Partnership Units for Common Stock |
483,154 |
(483,154) |
||||
Treasury Shares Acquired Related to Stock Grant Recipients' Tax Obligations |
(2,289) |
– |
||||
Long-Term Incentive Performance (LTIP) Units Earned (3) |
– |
401,203 |
||||
| | | | | | | |
Number Outstanding at March 31, 2015 |
311,268,775 | 52,764,731 | ||||
| | | | | | | |
| | | | | | | |
| | | | | | | |
Second Quarter Activity: |
||||||
Exchange of Limited Partnership Units for Common Stock |
3,548 |
(3,548) |
||||
Treasury Shares Acquired Related to Stock Grant Recipients' Tax Obligations |
(14,741) |
– |
||||
Restricted Stock Awards |
63,395 |
– |
||||
Redemption of Limited Partnership Units |
– |
(944,359) |
||||
Repurchase of Simon Property Group Common Stock in open market |
(1,903,340) |
– |
||||
| | | | | | | |
Number Outstanding at June 30, 2015 |
309,417,637 | 51,816,824 | ||||
| | | | | | | |
| | | | | | | |
| | | | | | | |
Number of Limited Partnership Units and Common Shares at June 30, 2015 |
361,234,461 | |||||
| | | | | | | |
| | | | | | | |
| | | | | | | |
PREFERRED STOCK/UNITS OUTSTANDING AS OF JUNE 30, 2015
($ in 000's, except per share amounts)
ISSUER |
DESCRIPTION |
|
NUMBER OF SHARES/UNITS |
|
PER SHARE LIQUIDATION PREFERENCE |
|
AGGREGATE LIQUIDATION PREFERENCE |
|
TICKER SYMBOL |
|||||
Preferred Stock: |
||||||||||||||
Simon Property Group, Inc. |
Series J 8.375% Cumulative Redeemable (4) |
796,948 |
$ |
50.00 |
$ |
39,847 |
SPGPrJ |
|||||||
Preferred Units: |
|
|||||||||||||
Simon Property Group, L.P. |
7.50% Cumulative Redeemable (5) |
255,373 |
$ |
100.00 |
$ |
25,537 |
N/A |
- (1)
- Excludes Limited Partnership preferred units relating to preferred stock outstanding.
- (2)
- Excludes units owned by the Company (shown here as Common Shares) and Limited Partnership Units not exchangeable for common shares.
- (3)
- Represents earned LTIP units issued pursuant to the Operating Partnership's 1998 Stock Incentive Plan.
- (4)
- Each share is redeemable on or after October 15, 2027. The shares are traded on the New York Stock Exchange. The closing price on June 30, 2015 was $70.10 per share.
- (5)
- Each preferred unit is redeemable upon the occurrence of certain tax triggering events.
| 2Q 2015 SUPPLEMENTAL |
|
36 |
CREDIT PROFILE
(As of June 30, unless otherwise indicated)
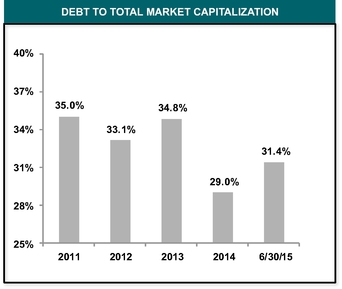
|
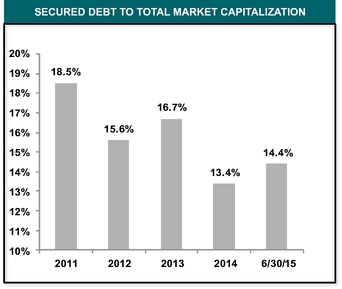
|
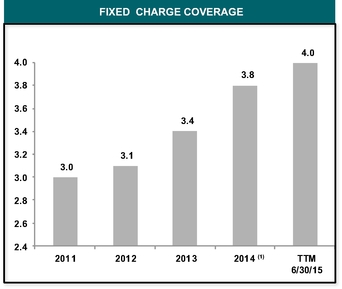
|
||
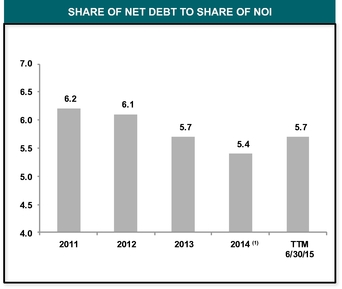
|
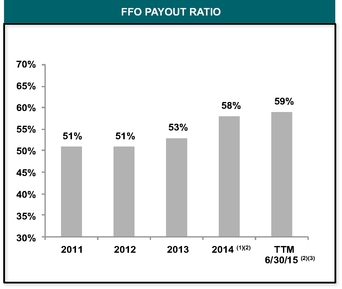
|
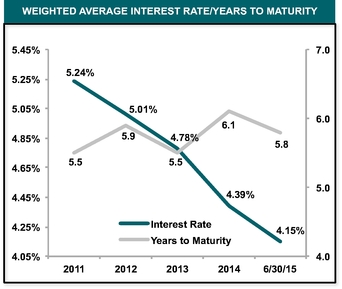
|
- (1)
- Includes WPG properties NOI and FFO through the effective date of the WPG spin-off, net of transaction expenses related to the spin-off of WPG.
- (2)
- Includes a $0.35 per share charge for loss on extinguishment of debt.
- (3)
- Includes $0.22 per share for gain upon sale of marketable securities.
| 2Q 2015 SUPPLEMENTAL |
|
37 |
SUMMARY OF INDEBTEDNESS
As of June 30, 2015
(In thousands)
| |
|
|
|
|
|
|
|
|
|
|
|
|||||||||||||||
|---|---|---|---|---|---|---|---|---|---|---|---|---|---|---|---|---|---|---|---|---|---|---|---|---|---|---|
|
|
TOTAL INDEBTEDNESS |
|
OUR SHARE OF INDEBTEDNESS |
|
WEIGHTED AVERAGE END OF PERIOD INTEREST RATE |
|
WEIGHTED AVERAGE YEARS TO MATURITY |
||||||||||||||||||
Consolidated Indebtedness |
||||||||||||||||||||||||||
Mortgage Debt |
||||||||||||||||||||||||||
Fixed Rate |
$ | 5,928,673 | $ | 5,849,694 | 5.36% | 3.6 | ||||||||||||||||||||
Variable Rate Debt |
630,000 | 630,000 | 2.05% | 1.8 | ||||||||||||||||||||||
| | | | | | | | | | | | | | | | | | | | | | | | | | | |
Total Mortgage Debt |
6,558,673 | 6,479,694 | 5.04% | 3.5 | ||||||||||||||||||||||
Unsecured Debt |
|
|
|
|
|
|
|
|||||||||||||||||||
Fixed Rate |
13,043,376 | 13,043,376 | 4.40% | 7.3 | ||||||||||||||||||||||
Revolving Credit Facility - USD Currency |
200,000 | 200,000 | 0.99% | 4.0 | ||||||||||||||||||||||
Revolving Credit Facility - Euro Currency |
1,025,768 | 1,025,768 | 0.80% | 4.0 | ||||||||||||||||||||||
Revolving Credit Facility - Yen Currency |
181,503 | 181,503 | 0.86% | 4.0 | ||||||||||||||||||||||
| | | | | | | | | | | | | | | | | | | | | | | | | | | |
Total Revolving Credit Facilities |
1,407,271 | 1,407,271 | 0.83% | 4.0 | ||||||||||||||||||||||
Unsecured Term Loan |
240,000 | 240,000 | 1.29% | 2.7 | ||||||||||||||||||||||
Global Commercial Paper - USD |
610,000 | 610,000 | 0.22% | 0.2 | ||||||||||||||||||||||
Global Commercial Paper - Euro |
193,033 | 193,033 | 0.05% | 0.2 | ||||||||||||||||||||||
| | | | | | | | | | | | | | | | | | | | | | | | | | | |
Total Unsecured Debt |
15,493,680 | 15,493,680 | 3.81% | 6.5 | ||||||||||||||||||||||
Premium |
56,387 | 56,387 | ||||||||||||||||||||||||
Discount |
(37,963) | (37,963) | ||||||||||||||||||||||||
| | | | | | | | | | | | | | | | | | | | | | | | | | | |
|
||||||||||||||||||||||||||
| | | | | | | | | | | | | | | | | | | | | | | | | | | |
Consolidated Mortgages and Unsecured Indebtedness (1) |
$ | 22,070,777 | | | $ | 21,991,798 | | | | 4.17% | | | | 5.6 | | |||||||||||
| | | | | | | | | | | | | | | | | | | | | | | | | | | |
| | | | | | | | | | | | | | | | | | | | | | | | | | | |
| | | | | | | | | | | | | | | | | | | | | | | | | | | |
Joint Venture Indebtedness |
|
|
|
|
|
|
|
|||||||||||||||||||
Mortgage Debt |
||||||||||||||||||||||||||
Fixed Rate |
$ | 11,676,793 | $ | 5,697,278 | 4.33% | 6.7 | ||||||||||||||||||||
Variable Rate Debt |
1,396,289 | 635,797 | 1.79% | 4.8 | ||||||||||||||||||||||
TMLP Debt(2) |
723,985 | 305,215 | – | – | ||||||||||||||||||||||
| | | | | | | | | | | | | | | | | | | | | | | | | | | |
Total Mortgage Debt |
13,797,067 | 6,638,290 | 4.08% | 6.5 | ||||||||||||||||||||||
Premium |
4,494 | 2,378 | ||||||||||||||||||||||||
| | | | | | | | | | | | | | | | | | | | | | | | | | | |
|
||||||||||||||||||||||||||
| | | | | | | | | | | | | | | | | | | | | | | | | | | |
Joint Venture Mortgages and Other Indebtedness (1) |
$ | 13,801,561 | | | $ | 6,640,668 | | | | 4.08% | | | | 6.5 | | |||||||||||
| | | | | | | | | | | | | | | | | | | | | | | | | | | |
| | | | | | | | | | | | | | | | | | | | | | | | | | | |
| | | | | | | | | | | | | | | | | | | | | | | | | | | |
|
| | | | ||||||||||||||||||||||
| | | | | | | | | | | | | | | | | | | | | | | | | | | |
Our Share of Total Indebtedness |
| | | | $ | 28,632,466 | | | | 4.15% | | | | 5.8 | | |||||||||||
| | | | | | | | | | | | | | | | | | | | | | | | | | | |
| |
|
|
|
|
|
|
|
|
|
|
|
|||||||||||||||
|---|---|---|---|---|---|---|---|---|---|---|---|---|---|---|---|---|---|---|---|---|---|---|---|---|---|---|
|
|
TOTAL INDEBTEDNESS |
|
OUR SHARE OF INDEBTEDNESS |
|
WEIGHTED AVERAGE END OF PERIOD INTEREST RATE |
|
WEIGHTED AVERAGE YEARS TO MATURITY |
||||||||||||||||||
Summary of Our Share of Fixed and Variable Rate Debt |
||||||||||||||||||||||||||
Consolidated |
||||||||||||||||||||||||||
Fixed |
86.0% | $ | 18,911,494 | 4.70% | 6.2 | |||||||||||||||||||||
Variable |
14.0% | 3,080,304 | 0.95% | 2.5 | ||||||||||||||||||||||
| | | | | | | | | | | | | | | | | | | | | | | | | | | |
|
100.0% | 21,991,798 | 4.17% | 5.6 | ||||||||||||||||||||||
Joint Venture |
|
|
|
|
|
|
|
|||||||||||||||||||
Fixed |
88.3% | $ | 5,864,369 | 4.33% | 6.7 | |||||||||||||||||||||
Variable |
11.7% | 776,299 | 1.79% | 4.5 | ||||||||||||||||||||||
| | | | | | | | | | | | | | | | | | | | | | | | | | | |
|
100.0% | 6,640,668 | 4.08% | 6.5 | ||||||||||||||||||||||
Total Debt |
$ |
28,632,466 |
||||||||||||||||||||||||
| | | | | | | | | | | | | | | | | | | | | | | | | | | |
| | | | | | | | | | | | | | | | | | | | | | | | | | | |
| | | | | | | | | | | | | | | | | | | | | | | | | | | |
|
||||||||||||||||||||||||||
| | | | | | | | | | | | | | | | | | | | | | | | | | | |
Total Fixed Debt |
| 86.5% | | | $ | 24,775,863 | | | | 4.61% | | | | 6.3 | | |||||||||||
| | | | | | | | | | | | | | | | | | | | | | | | | | | |
| | | | | | | | | | | | | | | | | | | | | | | | | | | |
| | | | | | | | | | | | | | | | | | | | | | | | | | | |
|
| | | | ||||||||||||||||||||||
| | | | | | | | | | | | | | | | | | | | | | | | | | | |
Total Variable Debt |
| 13.5% | | | $ | 3,856,603 | | | | 1.09% | | | | 2.8 | | |||||||||||
| | | | | | | | | | | | | | | | | | | | | | | | | | | |
| | | | | | | | | | | | | | | | | | | | | | | | | | | |
| | | | | | | | | | | | | | | | | | | | | | | | | | | |
- (1)
- Amounts give effect to outstanding derivative instruments as footnoted in the Property and Debt Information.
- (2)
- See footnote 23 on the Property and Debt information.
| 2Q 2015 SUPPLEMENTAL |
|
38 |
TOTAL DEBT AMORTIZATION AND MATURITIES BY YEAR (OUR SHARE)
As of June 30, 2015
(In thousands)
Year |
|
OUR SHARE OF UNSECURED CONSOLIDATED DEBT |
|
WEIGHTED AVERAGE RATE OF MATURING UNSECURED CONSOLIDATED DEBT |
|
OUR SHARE OF SECURED CONSOLIDATED DEBT |
|
WEIGHTED AVERAGE RATE OF MATURING SECURED CONSOLIDATED DEBT |
|
OUR SHARE OF UNCONSOLIDATED JOINT VENTURE DEBT |
|
WEIGHTED AVERAGE RATE OF MATURING UNCONSOLIDATED JOINT VENTURE DEBT |
|
OUR SHARE OF TOTAL DEBT |
|
TOTAL WEIGHTED AVERAGE RATE OF MATURING DEBT |
||||||||
|
||||||||||||||||||||||||
2015 |
1,169,668 | 1.93% | 39,355 | – | 200,080 | 4.77% | 1,409,103 | 2.00% | ||||||||||||||||
2016 |
527,574 |
5.51% |
2,340,806 |
5.78% |
531,267 |
6.37% |
3,399,647 |
5.81% |
||||||||||||||||
2017 |
1,307,453 |
2.99% |
1,713,030 |
4.93% |
319,148 |
4.99% |
3,339,631 |
4.16% |
||||||||||||||||
2018 |
1,990,000 |
3.92% |
33,971 |
– |
168,984 |
1.46% |
2,192,955 |
3.79% |
||||||||||||||||
2019 |
2,657,271 |
3.47% |
114,892 |
7.79% |
279,451 |
2.50% |
3,051,614 |
3.56% |
||||||||||||||||
2020 |
2,091,714 |
4.33% |
580,974 |
4.48% |
1,138,680 |
4.00% |
3,811,368 |
4.25% |
||||||||||||||||
2021 |
1,600,000 |
4.27% |
323,319 |
5.41% |
980,361 |
4.27% |
2,903,680 |
4.40% |
||||||||||||||||
2022 |
600,000 |
3.38% |
507,082 |
4.13% |
839,354 |
3.92% |
1,946,436 |
3.82% |
||||||||||||||||
2023 |
500,000 |
2.75% |
695,659 |
3.85% |
393,848 |
3.37% |
1,589,507 |
3.41% |
||||||||||||||||
2024 |
1,500,000 |
3.53% |
80,492 |
4.57% |
1,077,218 |
4.18% |
2,657,710 |
3.83% |
||||||||||||||||
2025 |
– |
– |
1,186 |
– |
695,984 |
3.62% |
697,170 |
3.62% |
||||||||||||||||
Thereafter |
1,550,000 |
5.40% |
48,928 |
3.85% |
13,915 |
1.57% |
1,612,843 |
5.16% |
||||||||||||||||
| | | | | | | | | | | | | | | | | | | | | | | | | |
Face Amounts of Indebtedness |
$ |
15,493,680 |
3.81% |
$ |
6,479,694 |
5.04% |
$ |
6,638,290 |
4.08% |
$ |
28,611,664 |
4.15% |
||||||||||||
Premiums (Discounts) on Indebtedness, Net |
(37,686) |
56,110 |
2,378 |
20,802 |
||||||||||||||||||||
| | | | | | | | | | | | | | | | | | | | | | | | | |
Our Share of Total Indebtedness |
$ |
15,455,994 |
|
|
$ |
6,535,804 |
|
|
$ |
6,640,668 |
|
|
$ |
28,632,466 |
||||||||||
| | | | | | | | | | | | | | | | | | | | | | | | | |
| | | | | | | | | | | | | | | | | | | | | | | | | |
| | | | | | | | | | | | | | | | | | | | | | | | | |
| 2Q 2015 SUPPLEMENTAL |
|
39 |
PROPERTY AND DEBT INFORMATION
As of June 30, 2015
|
|
|
DEBT INFORMATION | ||||||||||||||||||||||
| | | | | | | | | | | | | | | | | | | | | | | | | | |
|
|
|
LEGAL | TOTAL | MATURITY | INTEREST | | INDEBTEDNESS ($ IN 000's) | |||||||||||||||||
|
PROPERTY NAME |
STATE | CITY (CBSA) |
OWNERSHIP | SQUARE FEET | DATE | | RATE (1) | TYPE |
|
TOTAL | | OUR SHARE | ||||||||||||
|
Malls |
|
| | |||||||||||||||||||||
1. |
Apple Blossom Mall |
VA | Winchester |
49.1% | 473,003 | (2) | |||||||||||||||||||
2. |
Auburn Mall |
MA | Auburn |
56.4% | 586,242 | 09/01/20 | 6.02% | Fixed | 39,447 | 22,236 | |||||||||||||||
3. |
Aventura Mall (3) |
FL | Miami Beach (Miami) |
33.3% | 2,105,125 | 12/01/20 | 3.75% | Fixed | 1,200,000 | 400,000 | |||||||||||||||
4. |
Avenues, The |
FL | Jacksonville |
25.0% | (4) | 1,114,379 | 02/06/23 | 3.60% | Fixed | 110,000 | 27,500 | ||||||||||||||
5. |
Bangor Mall |
ME | Bangor |
87.6% | 652,822 | 10/01/17 | 6.15% | Fixed | 80,000 | 70,087 | |||||||||||||||
6. |
Barton Creek Square |
TX | Austin |
100.0% | 1,430,669 | (2) | |||||||||||||||||||
7. |
Battlefield Mall |
MO | Springfield |
100.0% | 1,201,626 | 09/01/22 | 3.95% | Fixed | 125,000 | 125,000 | |||||||||||||||
8. |
Bay Park Square |
WI | Green Bay |
100.0% | 711,689 | (2) | |||||||||||||||||||
9. |
Brea Mall |
CA | Brea (Los Angeles) |
100.0% | 1,319,317 | (2) | |||||||||||||||||||
10. |
Briarwood Mall |
MI | Ann Arbor |
50.0% | 979,852 | 11/30/16 | (6) | 7.50% | Fixed | 108,661 | 54,331 | ||||||||||||||
11. |
Broadway Square |
TX | Tyler |
100.0% | 627,811 | (2) | |||||||||||||||||||
12. |
Burlington Mall |
MA | Burlington (Boston) |
100.0% | 1,317,293 | (2) | |||||||||||||||||||
13. |
Cape Cod Mall |
MA | Hyannis |
56.4% | 722,481 | 03/06/21 | 5.75% | Fixed | 94,394 | 53,210 | |||||||||||||||
14. |
Castleton Square |
IN | Indianapolis |
100.0% | 1,382,737 | (2) | |||||||||||||||||||
15. |
Cielo Vista Mall |
TX | El Paso |
100.0% | 1,245,751 | (2) | |||||||||||||||||||
16. |
Coconut Point |
FL | Estero |
50.0% | 1,204,899 | 12/10/16 | 5.83% | Fixed | 230,000 | 115,000 | |||||||||||||||
17. |
Coddingtown Mall |
CA | Santa Rosa |
50.0% | 823,753 | 03/01/17 | (8) | 1.94% | Variable | 11,550 | 11,550 | ||||||||||||||
18. |
College Mall |
IN | Bloomington |
100.0% | 636,255 | (2) | |||||||||||||||||||
19. |
Columbia Center |
WA | Kennewick |
100.0% | 772,469 | (2) | |||||||||||||||||||
20. |
Copley Place |
MA | Boston |
94.4% | (7) | 1,254,417 | (2) | ||||||||||||||||||
21. |
Coral Square |
FL | Coral Springs (Miami) |
97.2% | 943,791 | (2) | |||||||||||||||||||
22. |
Cordova Mall |
FL | Pensacola |
100.0% | 917,638 | (2) | |||||||||||||||||||
23. |
Crystal Mall |
CT | Waterford |
78.2% | 783,312 | 06/06/22 | 4.46% | Fixed | 93,516 | 73,116 | |||||||||||||||
24. |
Dadeland Mall |
FL | Miami |
50.0% | 1,498,492 | 12/05/21 | 4.50% | Fixed | 438,987 | 219,493 | |||||||||||||||
25. |
Del Amo Fashion Center |
CA | Torrance (Los Angeles) |
50.0% | 2,092,400 | 01/20/20 | (8) | 1.69% | Variable | 400,000 | 200,000 | ||||||||||||||
26. |
Domain, The |
TX | Austin |
100.0% | 1,229,736 | 08/01/21 | 5.44% | Fixed | 197,097 | 197,097 | |||||||||||||||
27. |
Dover Mall |
DE | Dover |
68.1% | 928,168 | 08/06/21 | 5.57% | Fixed | 89,125 | 60,685 | |||||||||||||||
28. |
Emerald Square |
MA | North Attleboro (Providence, RI) |
56.4% | 1,022,679 | 08/11/22 | 4.71% | Fixed | 109,931 | 61,968 | |||||||||||||||
29. |
Empire Mall |
SD | Sioux Falls |
100.0% | 1,125,434 | 06/01/16 | 5.79% | Fixed | 176,300 | 176,300 | |||||||||||||||
30. |
Falls, The |
FL | Miami |
50.0% | 837,620 | 11/30/16 | (6) | 7.50% | Fixed | 105,039 | 52,520 | ||||||||||||||
31. |
Fashion Centre at Pentagon City, The |
VA | Arlington (Washington, DC) |
42.5% | 987,613 | 07/01/21 | 5.11% | Fixed | 40,000 | 17,000 | |||||||||||||||
|
07/01/21 | 4.87% | Fixed | 410,000 | 174,250 | ||||||||||||||||||||
32. |
Fashion Mall at Keystone, The |
IN | Indianapolis |
100.0% | 711,666 | (2) | |||||||||||||||||||
33. |
Fashion Valley |
CA | San Diego |
50.0% | 1,721,261 | 01/04/21 | 4.30% | Fixed | 462,964 | 231,478 | |||||||||||||||
34. |
Firewheel Town Center |
TX | Garland (Dallas) |
100.0% | 999,474 | (2) | |||||||||||||||||||
35. |
Florida Mall, The |
FL | Orlando |
50.0% | 1,712,444 | 09/05/20 | 5.25% | Fixed | 347,223 | 173,611 | |||||||||||||||
36. |
Forum Shops at Caesars, The |
NV | Las Vegas |
100.0% | 662,609 | (2) | |||||||||||||||||||
37. |
Galleria, The |
TX | Houston |
50.4% | 1,900,009 | 03/01/25 | 3.55% | Fixed | 1,200,000 | 604,440 | |||||||||||||||
| 2Q 2015 SUPPLEMENTAL |
|
40 |
PROPERTY AND DEBT INFORMATION
As of June 30, 2015
|
|
|
DEBT INFORMATION | ||||||||||||||||||||||
| | | | | | | | | | | | | | | | | | | | | | | | | | |
|
|
|
LEGAL | TOTAL | MATURITY | INTEREST | | INDEBTEDNESS ($ IN 000's) | |||||||||||||||||
|
PROPERTY NAME |
STATE | CITY (CBSA) |
OWNERSHIP | SQUARE FEET | DATE | | RATE (1) | TYPE |
|
TOTAL | | OUR SHARE | ||||||||||||
38. |
Greendale Mall |
MA | Worcester (Boston) |
56.4% | 428,864 | 10/01/16 | 6.00% | Fixed | 45,000 | 25,367 | |||||||||||||||
39. |
Greenwood Park Mall |
IN | Greenwood (Indianapolis) |
100.0% | 1,288,053 | 08/01/16 | (9) | 8.00% | Fixed | 75,232 | 75,232 | ||||||||||||||
40. |
Haywood Mall |
SC | Greenville |
100.0% | 1,228,390 | (2) | |||||||||||||||||||
41. |
Independence Center |
MO | Independence (Kansas City) |
100.0% | 830,959 | 07/10/17 | 5.94% | Fixed | 200,000 | 200,000 | |||||||||||||||
42. |
Ingram Park Mall |
TX | San Antonio |
100.0% | 1,119,845 | 06/01/21 | 5.38% | Fixed | 136,821 | 136,821 | |||||||||||||||
43. |
King of Prussia Mall |
PA | King of Prussia (Philadelphia) |
100.0% | 2,450,179 | 01/01/17 | 7.49% | Fixed | 34,369 | 34,369 | |||||||||||||||
|
01/01/17 | 8.53% | Fixed | 2,485 | 2,485 | ||||||||||||||||||||
|
01/01/17 | 4.50% | Fixed | 50,000 | 50,000 | ||||||||||||||||||||
44. |
La Plaza Mall |
TX | McAllen |
100.0% | 1,220,863 | (2) | |||||||||||||||||||
45. |
Lakeline Mall |
TX | Cedar Park (Austin) |
100.0% | 1,097,849 | (2) | |||||||||||||||||||
46. |
Lehigh Valley Mall |
PA | Whitehall |
50.0% | 1,180,561 | 07/05/20 | 5.88% | Fixed | 130,272 | 65,136 | |||||||||||||||
47. |
Lenox Square |
GA | Atlanta |
100.0% | 1,559,291 | (2) | |||||||||||||||||||
48. |
Liberty Tree Mall |
MA | Danvers (Boston) |
49.1% | 856,039 | 05/06/23 | 3.41% | Fixed | 33,591 | 16,506 | |||||||||||||||
49. |
Livingston Mall |
NJ | Livingston (New York) |
100.0% | 969,192 | (2) | |||||||||||||||||||
50. |
Mall at Chestnut Hill, The |
MA | Chestnut Hill (Boston) |
94.4% | 468,492 | 11/01/23 | 4.69% | Fixed | 120,000 | 113,328 | |||||||||||||||
51. |
Mall at Rockingham Park, The |
NH | Salem (Boston) |
28.2% | 1,025,329 | 03/10/17 | 5.61% | Fixed | 260,000 | 73,282 | |||||||||||||||
52. |
Mall at Tuttle Crossing, The |
OH | Dublin (Columbus) |
50.0% | 1,125,128 | 05/01/23 | 3.56% | Fixed | 125,000 | 62,500 | |||||||||||||||
53. |
Mall of Georgia |
GA | Buford (Atlanta) |
100.0% | 1,818,410 | (2) | |||||||||||||||||||
54. |
Mall of New Hampshire, The |
NH | Manchester |
56.4% | 812,279 | 07/01/25 | 4.11% | Fixed | 150,000 | 84,555 | |||||||||||||||
55. |
McCain Mall |
AR | N. Little Rock |
100.0% | 788,155 | (2) | |||||||||||||||||||
56. |
Meadowood Mall |
NV | Reno |
50.0% | 844,598 | 11/06/21 | 5.82% | Fixed | 119,253 | 59,627 | |||||||||||||||
57. |
Menlo Park Mall |
NJ | Edison (New York) |
100.0% | 1,334,283 | (2) | |||||||||||||||||||
58. |
Miami International Mall |
FL | Miami |
47.8% | 1,083,419 | 02/06/24 | 4.42% | Fixed | 160,000 | 76,442 | |||||||||||||||
59. |
Midland Park Mall |
TX | Midland |
100.0% | 622,483 | 09/06/22 | 4.35% | Fixed | 81,114 | 81,114 | |||||||||||||||
60. |
Miller Hill Mall |
MN | Duluth |
100.0% | 832,506 | (2) | |||||||||||||||||||
61. |
Montgomery Mall |
PA | North Wales (Philadelphia) |
79.4% | 1,103,052 | 05/01/24 | 4.57% | Fixed | 100,000 | 79,351 | |||||||||||||||
62. |
North East Mall |
TX | Hurst (Dallas) |
100.0% | 1,669,001 | (2) | |||||||||||||||||||
63. |
Northgate Mall |
WA | Seattle |
100.0% | 1,048,110 | (2) | |||||||||||||||||||
64. |
Northshore Mall |
MA | Peabody (Boston) |
56.4% | 1,591,881 | 07/05/23 | 3.30% | Fixed | 264,375 | 149,029 | |||||||||||||||
65. |
Ocean County Mall |
NJ | Toms River (New York) |
100.0% | 898,375 | (2) | |||||||||||||||||||
66. |
Orland Square |
IL | Orland Park (Chicago) |
100.0% | 1,231,807 | (2) | |||||||||||||||||||
67. |
Oxford Valley Mall |
PA | Langhorne (Philadelphia) |
85.5% | 1,335,010 | 12/07/20 | 4.77% | Fixed | 65,885 | 56,359 | |||||||||||||||
68. |
Penn Square Mall |
OK | Oklahoma City |
94.5% | 1,063,666 | 04/01/16 | 7.75% | Fixed | 93,331 | 88,194 | |||||||||||||||
69. |
Pheasant Lane Mall |
NH | Nashua |
(10) | 979,338 | (2) | |||||||||||||||||||
70. |
Phipps Plaza |
GA | Atlanta |
100.0% | 830,360 | (2) | |||||||||||||||||||
71. |
Plaza Carolina |
PR | Carolina (San Juan) |
100.0% | 1,157,740 | 09/30/17 | (8) | 1.54% | Variable | 225,000 | 225,000 | ||||||||||||||
72. |
Prien Lake Mall |
LA | Lake Charles |
100.0% | 849,261 | (2) | |||||||||||||||||||
73. |
Quaker Bridge Mall |
NJ | Lawrenceville |
50.0% | 1,083,305 | 04/01/16 | 7.03% | Fixed | 11,490 | 5,745 | |||||||||||||||
|
04/01/16 | 2.95% | Fixed | 62,000 | 31,000 | ||||||||||||||||||||
74. |
Rockaway Townsquare |
NJ | Rockaway (New York) |
100.0% | 1,245,673 | (2) | |||||||||||||||||||
75. |
Roosevelt Field |
NY | Garden City (New York) |
100.0% | 2,209,160 | (2) | |||||||||||||||||||
| 2Q 2015 SUPPLEMENTAL |
|
41 |
PROPERTY AND DEBT INFORMATION
As of June 30, 2015
|
|
|
DEBT INFORMATION | ||||||||||||||||||||||
| | | | | | | | | | | | | | | | | | | | | | | | | | |
|
|
|
LEGAL | TOTAL | MATURITY | INTEREST | | INDEBTEDNESS ($ IN 000's) | |||||||||||||||||
|
PROPERTY NAME |
STATE | CITY (CBSA) |
OWNERSHIP | SQUARE FEET | DATE | | RATE (1) | TYPE |
|
TOTAL | | OUR SHARE | ||||||||||||
76. |
Ross Park Mall |
PA | Pittsburgh |
100.0% | 1,245,681 | (2) | |||||||||||||||||||
77. |
Santa Rosa Plaza |
CA | Santa Rosa |
100.0% | 692,405 | (2) | |||||||||||||||||||
78. |
Shops at Mission Viejo, The |
CA | Mission Viejo (Los Angeles) |
51.0% | 1,152,110 | 02/01/23 | 3.61% | Fixed | 295,000 | 150,450 | |||||||||||||||
79. |
Shops at Nanuet, The |
NY | Nanuet |
100.0% | 752,871 | (2) | |||||||||||||||||||
80. |
Shops at Riverside, The |
NJ | Hackensack (New York) |
100.0% | 659,552 | 02/01/23 | 3.37% | Fixed | 130,000 | 130,000 | |||||||||||||||
81. |
Smith Haven Mall |
NY | Lake Grove (New York) |
25.0% | (4) | 1,300,095 | 05/29/20 | (8) | 1.39% | Variable | 180,000 | 45,000 | |||||||||||||
82. |
Solomon Pond Mall |
MA | Marlborough (Boston) |
56.4% | 886,479 | 11/01/22 | 4.01% | Fixed | 104,993 | 59,185 | |||||||||||||||
83. |
South Hills Village |
PA | Pittsburgh |
100.0% | 1,120,169 | (2) | |||||||||||||||||||
84. |
South Shore Plaza |
MA | Braintree (Boston) |
100.0% | 1,588,916 | (2) | |||||||||||||||||||
85. |
Southdale Center |
MN | Edina (Minneapolis) |
100.0% | 1,258,260 | 04/01/23 | 3.84% | Fixed | 154,557 | 154,557 | |||||||||||||||
86. |
SouthPark |
NC | Charlotte |
100.0% | 1,680,494 | 08/01/16 | (9) | 8.00% | Fixed | 186,199 | 186,199 | ||||||||||||||
87. |
Southridge Mall |
WI | Greendale (Milwaukee) |
100.0% | 1,177,099 | 06/06/23 | 3.85% | Fixed | 125,000 | 125,000 | |||||||||||||||
88. |
Springfield Mall (3) |
PA | Springfield (Philadelphia) |
50.0% | 611,200 | 11/30/15 | (11) | 4.77% | Fixed | 62,104 | 31,052 | ||||||||||||||
89. |
Square One Mall |
MA | Saugus (Boston) |
56.4% | 929,998 | 01/06/22 | 5.47% | Fixed | 95,331 | 53,738 | |||||||||||||||
90. |
St. Charles Towne Center |
MD | Waldorf (Washington, D.C.) |
100.0% | 980,762 | (2) | |||||||||||||||||||
91. |
St. Johns Town Center |
FL | Jacksonville |
50.0% | 1,390,911 | 09/11/24 | 3.82% | Fixed | 350,000 | 175,000 | |||||||||||||||
92. |
Stanford Shopping Center |
CA | Palo Alto (San Jose) |
94.4% | (7) | 1,231,705 | (2) | ||||||||||||||||||
93. |
Stoneridge Shopping Center |
CA | Pleasanton (San Francisco) |
49.9% | 1,299,440 | 11/30/16 | (6) | 7.50% | Fixed | 214,912 | 107,241 | ||||||||||||||
94. |
Summit Mall |
OH | Akron |
100.0% | 769,431 | 06/10/17 | 5.42% | Fixed | 65,000 | 65,000 | |||||||||||||||
95. |
Tacoma Mall |
WA | Tacoma (Seattle) |
100.0% | 1,334,694 | (2) | |||||||||||||||||||
96. |
Tippecanoe Mall |
IN | Lafayette |
100.0% | 862,740 | (2) | |||||||||||||||||||
97. |
Town Center at Boca Raton |
FL | Boca Raton (Miami) |
100.0% | 1,779,735 | (2) | |||||||||||||||||||
98. |
Town Center at Cobb |
GA | Kennesaw (Atlanta) |
100.0% | 1,280,911 | 05/01/22 | 4.76% | Fixed | 196,816 | 196,816 | |||||||||||||||
99. |
Towne East Square |
KS | Wichita |
100.0% | 1,134,384 | (2) | |||||||||||||||||||
100. |
Treasure Coast Square |
FL | Jensen Beach |
100.0% | 876,257 | (2) | |||||||||||||||||||
101. |
Tyrone Square |
FL | St. Petersburg (Tampa) |
100.0% | 1,094,153 | (2) | |||||||||||||||||||
102. |
University Park Mall |
IN | Mishawaka |
100.0% | 921,235 | (2) | |||||||||||||||||||
103. |
University Park Village |
TX | Fort Worth |
100.0% | 160,872 | 05/01/28 | 3.85% | Fixed | 55,000 | 55,000 | |||||||||||||||
104. |
Walt Whitman Shops |
NY | Huntington Station (New York) |
100.0% | 1,087,739 | 08/01/16 | (9) | 8.00% | Fixed | 114,728 | 114,728 | ||||||||||||||
105. |
West Town Mall |
TN | Knoxville |
50.0% | 1,341,351 | 12/01/17 | 6.34% | Fixed | 210,000 | 105,000 | |||||||||||||||
106. |
Westchester, The |
NY | White Plains (New York) |
40.0% | 826,249 | 05/05/20 | 6.00% | Fixed | 348,450 | 139,380 | |||||||||||||||
107. |
White Oaks Mall |
IL | Springfield |
80.7% | 924,616 | 11/01/16 | 5.54% | Fixed | 50,000 | 40,339 | |||||||||||||||
108. |
Wolfchase Galleria |
TN | Memphis |
94.5% | 1,150,907 | 04/01/17 | 5.64% | Fixed | 225,000 | 212,616 | |||||||||||||||
109. |
Woodfield Mall |
IL | Schaumburg (Chicago) |
50.0% | 2,171,670 | 03/05/24 | 4.50% | Fixed | 425,000 | 212,500 | |||||||||||||||
110. |
Woodland Hills Mall |
OK | Tulsa |
94.5% | 1,091,314 | 04/05/19 | 7.79% | Fixed | 91,042 | 86,005 | |||||||||||||||
| | | | | | | | | | | | | | | | | | | | | | | | | | |
|
Total Mall Square Footage |
| |
| 122,684,247 | | | | | | | | |||||||||||||
| | | | | | | | | | | | | | | | | | | | | | | | | | |
| | | | | | | | | | | | | | | | | | | | | | | | | | |
| | | | | | | | | | | | | | | | | | | | | | | | | | |
| 2Q 2015 SUPPLEMENTAL |
|
42 |
PROPERTY AND DEBT INFORMATION
As of June 30, 2015
|
|
|
DEBT INFORMATION | ||||||||||||||||||||||
| | | | | | | | | | | | | | | | | | | | | | | | | | |
|
|
|
LEGAL | TOTAL | MATURITY | INTEREST | | INDEBTEDNESS ($ IN 000's) | |||||||||||||||||
|
PROPERTY NAME |
STATE | CITY (CBSA) |
OWNERSHIP | SQUARE FEET | DATE | | RATE (1) | TYPE |
|
TOTAL | | OUR SHARE | ||||||||||||
|
|
| | | | | | | | | |||||||||||||||
1. |
Albertville Premium Outlets |
MN | Albertville (Minneapolis) |
100.0% | 429,555 | (2) | |||||||||||||||||||
2. |
Allen Premium Outlets |
TX | Allen (Dallas) |
100.0% | 441,766 | (2) | |||||||||||||||||||
3. |
Aurora Farms Premium Outlets |
OH | Aurora (Cleveland) |
100.0% | 285,238 | (2) | |||||||||||||||||||
4. |
Birch Run Premium Outlets |
MI | Birch Run (Detroit) |
100.0% | 679,430 | 04/11/16 | (14) | 5.95% | Fixed | 101,395 | 101,395 | ||||||||||||||
5. |
Calhoun Premium Outlets |
GA | Calhoun |
100.0% | 254,048 | 09/01/16 | (15) | 5.79% | Fixed | 19,526 | 19,526 | ||||||||||||||
6. |
Camarillo Premium Outlets |
CA | Camarillo (Los Angeles) |
100.0% | 675,344 | (2) | |||||||||||||||||||
7. |
Carlsbad Premium Outlets |
CA | Carlsbad (San Diego) |
100.0% | 289,411 | (2) | |||||||||||||||||||
8. |
Carolina Premium Outlets |
NC | Smithfield (Raleigh) |
100.0% | 438,838 | 12/01/22 | 3.36% | Fixed | 48,014 | 48,014 | |||||||||||||||
9. |
Charlotte Premium Outlets |
NC | Charlotte |
50.0% | 398,689 | 11/24/19 | (8) | 1.64% | Variable | 90,000 | 45,000 | ||||||||||||||
10. |
Chicago Premium Outlets |
IL | Aurora (Chicago) |
100.0% | 437,458 | (2) | |||||||||||||||||||
11. |
Cincinnati Premium Outlets |
OH | Monroe (Cincinnati) |
100.0% | 398,834 | (2) | |||||||||||||||||||
12. |
Clinton Crossing Premium Outlets |
CT | Clinton |
100.0% | 276,188 | (2) | |||||||||||||||||||
13. |
Columbia Gorge Premium Outlets |
OR | Troutdale (Portland) |
100.0% | 163,743 | (2) | |||||||||||||||||||
14. |
Desert Hills Premium Outlets |
CA | Cabazon (Palm Springs) |
100.0% | 649,368 | (2) | |||||||||||||||||||
15. |
Edinburgh Premium Outlets |
IN | Edinburgh (Indianapolis) |
100.0% | 377,734 | (2) | |||||||||||||||||||
16. |
Ellenton Premium Outlets |
FL | Ellenton (Tampa) |
100.0% | 476,496 | 01/11/16 | (16) | 5.51% | Fixed | 99,429 | 99,429 | ||||||||||||||
17. |
Folsom Premium Outlets |
CA | Folsom (Sacramento) |
100.0% | 297,701 | (2) | |||||||||||||||||||
18. |
Gaffney Premium Outlets |
SC | Gaffney (Greenville/Charlotte) |
100.0% | 359,839 | 09/01/16 | (15) | 5.79% | Fixed | 35,436 | 35,436 | ||||||||||||||
19. |
Gilroy Premium Outlets |
CA | Gilroy (San Jose) |
100.0% | 577,872 | (2) | |||||||||||||||||||
20. |
Grand Prairie Premium Outlets |
TX | Grand Prairie (Dallas) |
100.0% | 417,194 | 04/01/23 | 3.66% | Fixed | 120,000 | 120,000 | |||||||||||||||
21. |
Grove City Premium Outlets |
PA | Grove City (Pittsburgh) |
100.0% | 531,262 | 01/11/16 | (16) | 5.51% | Fixed | 107,331 | 107,331 | ||||||||||||||
22. |
Gulfport Premium Outlets |
MS | Gulfport |
100.0% | 300,233 | 01/11/16 | (16) | 5.51% | Fixed | 23,948 | 23,948 | ||||||||||||||
23. |
Hagerstown Premium Outlets |
MD | Hagerstown (Baltimore/Washington DC) |
100.0% | 485,152 | 04/11/16 | (14) | 5.95% | Fixed | 85,232 | 85,232 | ||||||||||||||
24. |
Houston Premium Outlets |
TX | Cypress (Houston) |
100.0% | 541,806 | (2) | |||||||||||||||||||
25. |
Jackson Premium Outlets |
NJ | Jackson (New York) |
100.0% | 285,460 | (2) | |||||||||||||||||||
26. |
Jersey Shore Premium Outlets |
NJ | Tinton Falls (New York) |
100.0% | 434,363 | 01/11/16 | (16) | 5.51% | Fixed | 66,611 | 66,611 | ||||||||||||||
27. |
Johnson Creek Premium Outlets |
WI | Johnson Creek |
100.0% | 276,373 | (2) | |||||||||||||||||||
28. |
Kittery Premium Outlets |
ME | Kittery |
100.0% | 259,484 | (2) | |||||||||||||||||||
29. |
Las Americas Premium Outlets |
CA | San Diego |
100.0% | 555,800 | 06/11/16 | 5.84% | Fixed | 175,440 | 175,440 | |||||||||||||||
30. |
Las Vegas North Premium Outlets |
NV | Las Vegas |
100.0% | 675,636 | (2) | |||||||||||||||||||
31. |
Las Vegas South Premium Outlets |
NV | Las Vegas |
100.0% | 535,225 | (2) | |||||||||||||||||||
32. |
Lebanon Premium Outlets |
TN | Lebanon (Nashville) |
100.0% | 227,271 | 01/11/16 | (16) | 5.51% | Fixed | 14,724 | 14,724 | ||||||||||||||
33. |
Lee Premium Outlets |
MA | Lee |
100.0% | 224,850 | 09/01/16 | (15) | 5.79% | Fixed | 48,743 | 48,743 | ||||||||||||||
34. |
Leesburg Corner Premium Outlets |
VA | Leesburg (Washington D.C.) |
100.0% | 478,210 | (2) | |||||||||||||||||||
35. |
Liberty Village Premium Outlets |
NJ | Flemington (New York) |
100.0% | 162,239 | (2) | |||||||||||||||||||
36. |
Lighthouse Place Premium Outlets |
IN | Michigan City (Chicago, IL) |
100.0% | 454,730 | (2) | |||||||||||||||||||
37. |
Merrimack Premium Outlets |
NH | Merrimack |
100.0% | 408,996 | 07/01/23 | 3.78% | Fixed | 130,000 | 130,000 | |||||||||||||||
38. |
Napa Premium Outlets |
CA | Napa |
100.0% | 179,140 | (2) | |||||||||||||||||||
39. |
North Bend Premium Outlets |
WA | North Bend (Seattle) |
100.0% | 223,561 | (2) | |||||||||||||||||||
| 2Q 2015 SUPPLEMENTAL |
|
43 |
PROPERTY AND DEBT INFORMATION
As of June 30, 2015
|
|
|
DEBT INFORMATION | ||||||||||||||||||||||
| | | | | | | | | | | | | | | | | | | | | | | | | | |
|
|
|
LEGAL | TOTAL | MATURITY | INTEREST | | INDEBTEDNESS ($ IN 000's) | |||||||||||||||||
|
PROPERTY NAME |
STATE | CITY (CBSA) |
OWNERSHIP | SQUARE FEET | DATE | | RATE (1) | TYPE |
|
TOTAL | | OUR SHARE | ||||||||||||
40. |
North Georgia Premium Outlets |
GA | Dawsonville (Atlanta) |
100.0% | 540,312 | (2) | |||||||||||||||||||
41. |
Orlando International Premium Outlets |
FL | Orlando |
100.0% | 773,482 | (2) | |||||||||||||||||||
42. |
Orlando Vineland Premium Outlets |
FL | Orlando |
100.0% | 655,004 | (2) | |||||||||||||||||||
43. |
Osage Beach Premium Outlets |
MO | Osage Beach |
100.0% | 392,462 | (2) | |||||||||||||||||||
44. |
Petaluma Village Premium Outlets |
CA | Petaluma (San Francisco) |
100.0% | 201,666 | (2) | |||||||||||||||||||
45. |
Philadelphia Premium Outlets |
PA | Limerick (Philadelphia) |
100.0% | 549,137 | (2) | |||||||||||||||||||
46. |
Phoenix Premium Outlets |
AZ | Chandler (Phoenix) |
100.0% | 356,494 | (2) | |||||||||||||||||||
47. |
Pismo Beach Premium Outlets |
CA | Pismo Beach |
100.0% | 147,416 | 11/06/16 | (17) | 5.84% | Fixed | 33,850 | 33,850 | ||||||||||||||
48. |
Pleasant Prairie Premium Outlets |
WI | Pleasant Prairie (Chicago, IL/ |
100.0% | 402,540 | 01/11/16 | (16) | 5.51% | Fixed | 57,209 | 57,209 | ||||||||||||||
|
Milwaukee) |
12/01/16 | 6.01% | Fixed | 34,927 | 34,927 | |||||||||||||||||||
49. |
Puerto Rico Premium Outlets |
PR | Barceloneta |
100.0% | 342,023 | 09/30/17 | (8) | 1.54% | Variable | 125,000 | 125,000 | ||||||||||||||
50. |
Queenstown Premium Outlets |
MD | Queenstown (Baltimore) |
100.0% | 289,527 | 11/06/16 | (17) | 5.84% | Fixed | 66,150 | 66,150 | ||||||||||||||
51. |
Rio Grande Valley Premium Outlets |
TX | Mercedes (McAllen) |
100.0% | 604,105 | (2) | |||||||||||||||||||
52. |
Round Rock Premium Outlets |
TX | Round Rock (Austin) |
100.0% | 488,677 | (2) | |||||||||||||||||||
53. |
San Francisco Premium Outlets |
CA | Livermore (San Francisco) |
100.0% | 511,925 | (2) | |||||||||||||||||||
54. |
San Marcos Premium Outlets |
TX | San Marcos (Austin/San Antonio) |
100.0% | 732,283 | 01/11/16 | (16) | 5.51% | Fixed | 136,149 | 136,149 | ||||||||||||||
55. |
Seattle Premium Outlets |
WA | Tulalip (Seattle) |
100.0% | 554,783 | (2) | |||||||||||||||||||
56. |
Silver Sands Premium Outlets |
FL | Destin |
50.0% | 451,235 | 06/01/22 | 3.93% | Fixed | 100,000 | 50,000 | |||||||||||||||
57. |
St. Augustine Premium Outlets |
FL | St. Augustine (Jacksonsville) |
100.0% | 328,977 | (2) | |||||||||||||||||||
58. |
St. Louis Premium Outlets |
MO | St. Louis (Chesterfield) |
60.0% | 351,513 | 10/06/24 | 4.06% | Fixed | 95,000 | 57,000 | |||||||||||||||
59. |
Tanger Outlets - Galveston/Houston (3) |
TX | Texas City |
50.0% | 352,705 | 07/01/18 | (8) | 1.69% | Variable | 65,000 | 32,500 | ||||||||||||||
60. |
The Crossings Premium Outlets |
PA | Tannersville |
100.0% | 411,562 | 12/01/22 | 3.41% | Fixed | 115,000 | 115,000 | |||||||||||||||
61. |
Twin Cities Premium Outlets |
MN | Eagan |
35.0% | 408,944 | 11/06/24 | 4.32% | Fixed | 115,000 | 40,250 | |||||||||||||||
62. |
Vacaville Premium Outlets |
CA | Vacaville |
100.0% | 440,089 | (2) | |||||||||||||||||||
63. |
Waikele Premium Outlets |
HI | Waipahu (Honolulu) |
100.0% | 219,328 | (2) | |||||||||||||||||||
64. |
Waterloo Premium Outlets |
NY | Waterloo |
100.0% | 417,755 | (2) | |||||||||||||||||||
65. |
Williamsburg Premium Outlets |
VA | Williamsburg |
100.0% | 521,957 | 04/11/16 | (14) | 5.95% | Fixed | 98,468 | 98,468 | ||||||||||||||
66. |
Woodburn Premium Outlets |
OR | Woodburn (Portland) |
100.0% | 389,731 | (2) | |||||||||||||||||||
67. |
Woodbury Common Premium Outlets |
NY | Central Valley (New York) |
100.0% | 880,376 | (2) | |||||||||||||||||||
68. |
Wrentham Village Premium Outlets |
MA | Wrentham (Boston) |
100.0% | 660,101 | (2) | |||||||||||||||||||
|
|||||||||||||||||||||||||
| | | | | | | | | | | | | | | | | | | | | | | | | | |
|
|
28,940,646 | |||||||||||||||||||||||
| | | | | | | | | | | | | | | | | | | | | | | | | | |
| | | | | | | | | | | | | | | | | | | | | | | | | | |
| | | | | | | | | | | | | | | | | | | | | | | | | | |
|
|
|
|||||||||||||||||||||||
|
|
151,624,893 | |||||||||||||||||||||||
| | | | | | | | | | | | | | | | | | | | | | | | | | |
| | | | | | | | | | | | | | | | | | | | | | | | | | |
| | | | | | | | | | | | | | | | | | | | | | | | | | |
| 2Q 2015 SUPPLEMENTAL |
|
44 |
PROPERTY AND DEBT INFORMATION
As of June 30, 2015
|
|
|
DEBT INFORMATION | ||||||||||||||||||||||
| | | | | | | | | | | | | | | | | | | | | | | | | | |
|
|
|
LEGAL | TOTAL | MATURITY | INTEREST | | INDEBTEDNESS ($ IN 000's) | |||||||||||||||||
|
PROPERTY NAME |
STATE | CITY (CBSA) |
OWNERSHIP | SQUARE FEET | DATE | | RATE (1) | TYPE |
|
TOTAL | | OUR SHARE | ||||||||||||
|
|
| | | | | | | | | |||||||||||||||
1. |
Arizona Mills |
AZ | Tempe (Phoenix) |
100.0% | 1,239,488 | 07/01/20 | 5.76% | Fixed | 163,419 | 163,419 | |||||||||||||||
2. |
Arundel Mills |
MD | Hanover (Baltimore) |
59.3% | 1,662,801 | 02/06/24 | 4.29% | Fixed | 385,000 | 228,113 | |||||||||||||||
3. |
Colorado Mills |
CO | Lakewood (Denver) |
37.5% | 1,410,825 | 11/01/24 | 4.28% | Fixed | 136,000 | 51,000 | |||||||||||||||
|
07/01/21 | 5.04% | Fixed | 27,645 | 10,367 | ||||||||||||||||||||
4. |
Concord Mills |
NC | Concord (Charlotte) |
59.3% | 1,344,384 | 11/01/22 | 3.84% | Fixed | 235,000 | 139,261 | |||||||||||||||
5. |
Grapevine Mills |
TX | Grapevine (Dallas) |
59.3% | 1,778,623 | 10/01/24 | 3.83% | Fixed | 268,000 | 158,817 | |||||||||||||||
6. |
Great Mall |
CA | Milpitas (San Jose) |
100.0% | 1,365,129 | (2) | |||||||||||||||||||
7. |
Gurnee Mills |
IL | Gurnee (Chicago) |
100.0% | 1,919,462 | 07/01/17 | 5.77% | Fixed | 321,000 | 321,000 | |||||||||||||||
8. |
Katy Mills |
TX | Katy (Houston) |
62.5% | (4) | 1,789,953 | 12/06/22 | 3.49% | Fixed | 140,000 | 35,000 | ||||||||||||||
9. |
Mills at Jersey Gardens, The |
NJ | Elizabeth |
100.0% | 1,304,142 | 11/01/20 | 3.83% | Fixed | 350,000 | 350,000 | |||||||||||||||
10. |
Ontario Mills |
CA | Ontario (Riverside) |
50.0% | 1,366,484 | 03/05/22 | 4.25% | Fixed | 329,871 | 164,936 | |||||||||||||||
11. |
Opry Mills |
TN | Nashville |
100.0% | 1,153,532 | 10/10/16 | 2.69% | Variable | 280,000 | 280,000 | |||||||||||||||
|
10/10/16 | 5.00% | Fixed | 81,910 | 81,910 | ||||||||||||||||||||
12. |
Outlets at Orange, The |
CA | Orange (Los Angeles) |
50.0% | 805,155 | 04/01/24 | 4.22% | Fixed | 215,000 | 107,500 | |||||||||||||||
13. |
Potomac Mills |
VA | Woodbridge (Washington, D.C.) |
100.0% | 1,526,721 | 07/11/17 | 5.83% | Fixed | 410,000 | 410,000 | |||||||||||||||
14. |
Sawgrass Mills |
FL | Sunrise (Miami) |
100.0% | 2,195,979 | (2) | |||||||||||||||||||
| | | | | | | | | | | | | | | | | | | | | | | | | | |
|
|
20,862,678 | |||||||||||||||||||||||
| | | | | | | | | | | | | | | | | | | | | | | | | | |
| | | | | | | | | | | | | | | | | | | | | | | | | | |
| | | | | | | | | | | | | | | | | | | | | | | | | | |
|
|
|
|||||||||||||||||||||||
|
|
| | ||||||||||||||||||||||
1. |
ABQ Uptown |
NM | Albuquerque |
100.0% | 230,026 | (2) | |||||||||||||||||||
2. |
Hamilton Town Center |
IN | Noblesville (Indianapolis) |
50.0% | 672,896 | 04/01/22 | 4.81% | Fixed | 83,802 | 41,901 | |||||||||||||||
3. |
Pier Park |
FL | Panama City Beach |
65.6% | 882,654 | (2) | |||||||||||||||||||
| | | | | | | | | | | | | | | | | | | | | | | | | | |
|
|
1,785,576 | |||||||||||||||||||||||
| | | | | | | | | | | | | | | | | | | | | | | | | | |
| | | | | | | | | | | | | | | | | | | | | | | | | | |
| | | | | | | | | | | | | | | | | | | | | | | | | | |
|
|
|
|||||||||||||||||||||||
|
|
| | ||||||||||||||||||||||
|
The Esplanade, The Galleria at White Plains, Northpark Mall, Philadelphia Mills, and Sugarloaf Mills |
(23) | 723,985 | 305,215 | |||||||||||||||||||||
| | | | | | | | | | | | | | | | | | | | | | | | | | |
|
|
5,750,064 | |||||||||||||||||||||||
| | | | | | | | | | | | | | | | | | | | | | | | | | |
| | | | | | | | | | | | | | | | | | | | | | | | | | |
| | | | | | | | | | | | | | | | | | | | | | | | | | |
|
|
| | ||||||||||||||||||||||
|
Circle Centre, Florida Keys Outlet Center, Huntley Outlet Center, Lincoln Plaza, Naples Outlet Center, Outlet Marketplace, The Shops at Sunset Place |
(16)(21) | 191,742 | 90,331 | |||||||||||||||||||||
| | | | | | | | | | | | | | | | | | | | | | | | | | |
|
|
2,364,465 | |||||||||||||||||||||||
| | | | | | | | | | | | | | | | | | | | | | | | | | |
| | | | | | | | | | | | | | | | | | | | | | | | | | |
| | | | | | | | | | | | | | | | | | | | | | | | | | |
|
|
|
|||||||||||||||||||||||
|
|
182,387,676 | |||||||||||||||||||||||
| | | | | | | | | | | | | | | | | | | | | | | | | | |
| | | | | | | | | | | | | | | | | | | | | | | | | | |
| | | | | | | | | | | | | | | | | | | | | | | | | | |
| 2Q 2015 SUPPLEMENTAL |
|
45 |
PROPERTY AND DEBT INFORMATION
As of June 30, 2015
|
|
|
DEBT INFORMATION | ||||||||||||||||||||||
| | | | | | | | | | | | | | | | | | | | | | | | | | |
|
|
|
LEGAL | TOTAL | MATURITY | INTEREST | | INDEBTEDNESS ($ IN 000's) | |||||||||||||||||
|
PROPERTY NAME |
STATE | CITY (CBSA) |
OWNERSHIP | SQUARE FEET | DATE | | RATE (1) | TYPE |
|
TOTAL | | OUR SHARE | ||||||||||||
|
|
| | ||||||||||||||||||||||
|
AUSTRIA |
||||||||||||||||||||||||
1. |
Parndorf Designer Outlet Phases 3 & 4 |
Vienna | 90.0% | 118,000 | 06/30/16 | (20) | 1.95% | Fixed | 103,250 | 92,925 | |||||||||||||||
| | | | | | | | | | | | | | | | | | | | | | | | | | |
|
Subtotal Austria Square Footage |
118,000 | |||||||||||||||||||||||
|
CANADA |
|
|
||||||||||||||||||||||
2. |
Premium Outlets Montréal |
Montréal (Quebec) | 50.0% | 365,500 | 09/10/17 | (8)(29) | 2.29% | Variable | 87,577 | 43,788 | |||||||||||||||
3. |
Toronto Premium Outlets |
Toronto (Ontario) | 50.0% | 358,400 | 06/01/22 | (29) | 3.13% | Fixed | 136,964 | 68,483 | |||||||||||||||
| | | | | | | | | | | | | | | | | | | | | | | | | | |
|
Subtotal Canada Square Footage |
723,900 | |||||||||||||||||||||||
|
ITALY |
|
|
||||||||||||||||||||||
4. |
La Reggia Designer Outlet Phases 1 & 2 |
Marcianise (Naples) | 60.0% | 288,000 | 03/31/27 | (20) | 1.40% | Variable | 67,317 | 40,390 | |||||||||||||||
5. |
Noventa Di Piave Designer Outlet |
Venice | 60.0% | 280,000 | 08/29/26 | (13)(20) | 1.00% | Variable | 35,638 | 21,383 | |||||||||||||||
|
Phases 1, 2 & 3 |
06/30/27 | (13)(20) | 2.49% | Variable | 34,535 | 20,721 | ||||||||||||||||||
| | | | | | | | | | | | | | | | | | | | | | | | | | |
|
Subtotal Italy Square Footage |
568,000 | |||||||||||||||||||||||
|
JAPAN |
|
|
||||||||||||||||||||||
6. |
Ami Premium Outlets |
Ami (Tokyo) | 40.0% | 315,000 | 09/25/23 | (25) | 1.83% | Fixed | 70,512 | 28,207 | |||||||||||||||
7. |
Gotemba Premium Outlets |
Gotemba City (Tokyo) | 40.0% | 481,500 | 02/28/18 | (25) | 0.39% | Variable | 12,839 | 5,136 | |||||||||||||||
8. |
Kobe-Sanda Premium Outlets |
Kobe (Osaka) | 40.0% | 441,000 | 01/31/20 | (25) | 0.46% | Variable | 31,500 | 12,600 | |||||||||||||||
9. |
Rinku Premium Outlets |
Izumisano (Osaka) | 40.0% | 416,500 | 07/31/17 | (25) | 0.41% | Variable | 12,228 | 4,891 | |||||||||||||||
10. |
Sano Premium Outlets |
Sano (Tokyo) | 40.0% | 390,800 | 05/31/18 | (25) | 0.46% | Variable | 5,462 | 2,185 | |||||||||||||||
11. |
Sendai-Izumi Premium Outlets |
Izumi Park Town (Sendai) | 40.0% | 164,200 | 10/31/18 | (25) | 0.43% | Variable | 10,842 | 4,337 | |||||||||||||||
12. |
Shisui Premium Outlets |
Shisui (Chiba) | 40.0% | 365,900 | 05/31/18 | (25) | 0.39% | Variable | 36,521 | 14,608 | |||||||||||||||
|
05/29/22 | (25) | 0.38% | Fixed | 40,760 | 16,304 | |||||||||||||||||||
13. |
Toki Premium Outlets |
Toki (Nagoya) | 40.0% | 367,700 | 05/31/20 | (25) | 0.93% | Variable | 5,072 | 2,029 | |||||||||||||||
|
11/30/19 | (25) | 0.38% | Fixed | 24,456 | 9,782 | |||||||||||||||||||
14. |
Tosu Premium Outlets |
Fukuoka (Kyushu) | 40.0% | 290,400 | 12/31/18 | (25) | 0.43% | Variable | 16,101 | 6,440 | |||||||||||||||
| | | | | | | | | | | | | | | | | | | | | | | | | | |
|
Subtotal Japan Square Footage |
3,233,000 | |||||||||||||||||||||||
|
KOREA |
|
|
||||||||||||||||||||||
15. |
Busan Premium Outlets |
Busan | 50.0% | 360,200 | 06/20/22 | (26) | 5.44% | Fixed | 72,168 | 36,084 | |||||||||||||||
|
02/13/17 | (26) | 3.94% | Variable | 50,527 | 25,264 | |||||||||||||||||||
16. |
Paju Premium Outlets |
Paju (Seoul) | 50.0% | 442,900 | 11/28/19 | (26) | 4.08% | Fixed | 96,940 | 48,470 | |||||||||||||||
17. |
Yeoju Premium Outlets |
Yeoju (Seoul) | 50.0% | 551,600 | 09/06/20 | (26) | 4.68% | Fixed | 50,351 | 25,176 | |||||||||||||||
| | | | | | | | | | | | | | | | | | | | | | | | | | |
|
Subtotal South Korea Square Footage |
1,354,700 | |||||||||||||||||||||||
|
MALAYSIA |
|
|
||||||||||||||||||||||
18. |
Johor Premium Outlets |
Johor (Singapore) | 50.0% | 264,400 | 10/14/20 | (27) | 5.12% | Variable | 22,688 | 11,344 | |||||||||||||||
| | | | | | | | | | | | | | | | | | | | | | | | | | |
|
Subtotal Malaysia Square Footage |
264,400 | |||||||||||||||||||||||
| 2Q 2015 SUPPLEMENTAL |
|
46 |
PROPERTY AND DEBT INFORMATION
As of June 30, 2015
|
|
|
DEBT INFORMATION | ||||||||||||||||||||||
| | | | | | | | | | | | | | | | | | | | | | | | | | |
|
|
|
LEGAL | TOTAL | MATURITY | INTEREST | | INDEBTEDNESS ($ IN 000's) | |||||||||||||||||
|
PROPERTY NAME |
STATE | CITY (CBSA) |
OWNERSHIP | SQUARE FEET | DATE | | RATE (1) | TYPE |
|
TOTAL | | OUR SHARE | ||||||||||||
|
MEXICO |
|
|
||||||||||||||||||||||
19. |
Premium Outlets Punta Norte |
Mexico City | 50.0% | 333,000 | (2) | ||||||||||||||||||||
| | | | | | | | | | | | | | | | | | | | | | | | | | |
|
Subtotal Mexico Square Footage |
333,000 | |||||||||||||||||||||||
|
NETHERLANDS |
|
|
||||||||||||||||||||||
20. |
Roermond Designer Outlet Phases 2 & 3 |
Roermond | 90.0% | 173,000 | 12/01/21 | (20) | 1.86% | Fixed | 202,011 | 181,810 | |||||||||||||||
| | | | | | | | | | | | | | | | | | | | | | | | | | |
|
Subtotal Netherlands Square Footage |
173,000 | |||||||||||||||||||||||
|
UNITED KINGDOM |
|
|
||||||||||||||||||||||
21. |
Ashford Designer Outlet |
Kent | 45.0% | 183,000 | 07/31/16 | (5) | 2.44% | Variable | 6,293 | 2,830 | |||||||||||||||
|
07/31/16 | (11)(5) | 4.27% | Fixed | 56,634 | 25,485 | |||||||||||||||||||
| | | | | | | | | | | | | | | | | | | | | | | | | | |
|
Subtotal United Kingdom Square Footage |
183,000 | |||||||||||||||||||||||
| | | | | | | | | | | | | | | | | | | | | | | | | | |
|
|
|
|||||||||||||||||||||||
|
|
6,951,000 | |||||||||||||||||||||||
| | | | | | | | | | | | | | | | | | | | | | | | | | |
| | | | | | | | | | | | | | | | | | | | | | | | | | |
| | | | | | | | | | | | | | | | | | | | | | | | | | |
|
|
|
|||||||||||||||||||||||
|
|
189,338,676 | |||||||||||||||||||||||
| | | | | | | | | | | | | | | | | | | | | | | | | | |
| | | | | | | | | | | | | | | | | | | | | | | | | | |
| | | | | | | | | | | | | | | | | | | | | | | | | | |
|
Other Secured Indebtedness: |
(30) |
223,014 |
104,090 |
|||||||||||||||||||||
| | | | | | | | | | | | | | | | | | | | | | | | | | |
|
|
|
|||||||||||||||||||||||
|
|
$ | 13,117,984 | (31) | |||||||||||||||||||||
| | | | | | | | | | | | | | | | | | | | | | | | | | |
| | | | | | | | | | | | | | | | | | | | | | | | | | |
| | | | | | | | | | | | | | | | | | | | | | | | | | |
|
|
|
|||||||||||||||||||||||
|
Our Share of Consolidated Mortgage Debt |
$ | 6,479,694 | ||||||||||||||||||||||
|
|
|
|||||||||||||||||||||||
|
Our Share of Joint Venture Mortgage Debt |
$ | 6,638,290 | ||||||||||||||||||||||
| 2Q 2015 SUPPLEMENTAL |
|
47 |
PROPERTY AND DEBT INFORMATION
As of June 30, 2015
|
|
DEBT INFORMATION | ||||||||||
| | | | | | | | | | | | | |
UNSECURED INDEBTEDNESS: |
|
MATURITY DATE |
|
INTEREST RATE (1) |
TYPE |
|
INDEBTEDNESS ($ IN 000's) TOTAL |
|||||
Global Commercial Paper - USD |
09/25/15 | 0.22% | Variable | 610,000 | ||||||||
Global Commercial Paper - Euro |
09/21/15 | (12) | 0.05% | Variable | 193,033 | |||||||
Simon Property Group, LP (Sr. Notes) |
12/01/15 | 5.75% | Fixed | 366,635 | ||||||||
Simon Property Group, LP (Sr. Notes) |
05/01/16 | 6.10% | Fixed | 163,298 | ||||||||
Simon Property Group, LP (Sr. Notes) |
12/01/16 | 5.25% | Fixed | 364,276 | ||||||||
Simon Property Group, LP (Sr. Notes) |
01/30/17 | 2.80% | Fixed | 500,000 | ||||||||
Simon Property Group, LP (Sr. Notes) |
03/01/17 | 5.88% | Fixed | 207,453 | ||||||||
Simon Property Group, LP (Sr. Notes) |
09/15/17 | 2.15% | Fixed | 600,000 | ||||||||
Simon Property Group, LP (Sr. Notes) |
02/01/18 | 1.50% | Fixed | 750,000 | ||||||||
Unsecured Term Loan |
02/28/18 | (8) | 1.29% | Variable | 240,000 | |||||||
Simon Property Group, LP (Sr. Notes) |
05/30/18 | 6.13% | Fixed | 800,000 | ||||||||
Simon Property Group, LP (Sr. Notes) |
06/15/18 | 7.38% | Fixed | 200,000 | ||||||||
Simon Property Group, LP (Sr. Notes) |
02/01/19 | 2.20% | Fixed | 600,000 | ||||||||
Simon Property Group, LP (Sr. Notes) |
04/01/19 | 10.35% | Fixed | 650,000 | ||||||||
Revolving Credit Facility - Euro Currency |
06/30/19 | (8)(32) | 0.80% | Variable | 1,025,768 | |||||||
Revolving Credit Facility - USD Currency |
06/30/19 | (8) | 0.99% | Variable | 200,000 | |||||||
Revolving Credit Facility - Yen Currency |
06/30/19 | (8)(19) | 0.86% | Variable | 181,503 | |||||||
Simon Property Group, LP (Sr. Notes) |
02/01/20 | 5.65% | Fixed | 1,250,000 | ||||||||
Simon Property Group, LP (Euro Sr. Notes) |
10/02/20 | (22) | 2.38% | Fixed | 841,714 | |||||||
Simon Property Group, LP (Sr. Notes) |
03/01/21 | 4.38% | Fixed | 900,000 | ||||||||
Simon Property Group, LP (Sr. Notes) |
12/01/21 | 4.13% | Fixed | 700,000 | ||||||||
Simon Property Group, LP (Sr. Notes) |
03/15/22 | 3.38% | Fixed | 600,000 | ||||||||
Simon Property Group, LP (Sr. Notes) |
02/01/23 | 2.75% | Fixed | 500,000 | ||||||||
Simon Property Group, LP (Sr. Notes) |
02/01/24 | 3.75% | Fixed | 600,000 | ||||||||
Simon Property Group, LP (Sr. Notes) |
10/01/24 | 3.38% | Fixed | 900,000 | ||||||||
Simon Property Group, LP (Sr. Notes) |
02/01/40 | 6.75% | Fixed | 600,000 | ||||||||
Simon Property Group, LP (Sr. Notes) |
03/15/42 | 4.75% | Fixed | 550,000 | ||||||||
Simon Property Group, LP (Sr. Notes) |
10/01/44 | 4.25% | Fixed | 400,000 | ||||||||
| | | | | | | | | | | | | |
Total Unsecured Indebtedness |
$ | 15,493,680 | (18) | |||||||||
| | | | | | | | | | | | | |
| | | | | | | | | | | | | |
| | | | | | | | | | | | | |
| 2Q 2015 SUPPLEMENTAL |
|
48 |
PROPERTY AND DEBT INFORMATION
As of June 30, 2015
- FOOTNOTES:
- (1)
- Variable rate debt interest rates are based on the following base rates as of June 30, 2015: 1M LIBOR at .19%; 1M EUR LIBOR at -.06%; 1M EURIBOR at -.06%; 3M EURIBOR at -.01%; 6M EURIBOR at .05%; 1M YEN LIBOR at .06%; 6M YEN LIBOR at .14%; 1M CDOR at .99%; KLIBOR at 3.39% and 91 Day Korean CD rate at 1.65%.
- (2)
- Unencumbered asset.
- (3)
- This property is managed by a third party.
- (4)
- The Operating Partnership's direct and indirect interests in some joint venture properties are subject to preferences on distributions and/or capital allocation in favor of other partners or the Operating Partnership.
- (5)
- Amounts shown in USD equivalent; GBP equivalent is 40.0 million.
- (6)
- These three properties are secured by cross-collateralized and cross-defaulted mortgages.
- (7)
- The Operating Partnership receives substantially all the economic benefit of the property due to a preference or advance.
- (8)
- Includes applicable extensions available at our option.
- (9)
- These three properties are secured by cross-collateralized and cross-defaulted mortgages.
- (10)
- The Operating Partnership owns a mortgage note that encumbers Pheasant Lane Mall that entitles it to 100% of the economics of this property.
- (11)
- Through an interest rate swap agreement, interest is essentially fixed at the all-in-rate presented.
- (12)
- Amount shown in USD equivalent; Euro equivalent is 172.0 million.
- (13)
- Loan refinanced after June 30, 2015.
- (14)
- These three properties are secured by cross-collateralized and cross-defaulted mortgages.
- (15)
- These three properties are secured by cross-collateralized and cross-defaulted mortgages.
- (16)
- These ten properties (which includes Florida Keys Outlet Center, Huntley Outlet Center and Naples Outlet Center) are secured by cross-collateralized and cross-defaulted mortgages.
- (17)
- These two properties are secured by cross-collateralized and cross-defaulted mortgages.
- (18)
- Also represents our share of Total Unsecured Indebtedness.
- (19)
- Amounts shown in USD equivalent; balance includes borrowings on multi-currency tranche of Yen 22.3 billion.
- (20)
- Amounts shown in USD equivalent; Euro equivalent is 394.5 million.
- (21)
- Consists of five encumbered properties with interest rates ranging from 3.09% to 5.62% and maturities between 2016 and 2020.
- (22)
- Amount shown in USD equivalent; Euro equivalent is 750.0 million.
- (23)
- Includes five properties with interest rates ranging from 4.50% to 7.32% and maturities between 2015 and 2023.
- (24)
- Includes office space of 1,889,925 square feet including the following centers with more than 20,000 square feet of office space:
| Circle Centre - 129,944 sq. ft. | Greendale Mall - 119,860 sq. ft. | |
| Copley Place - 880,149 sq. ft. | Menlo Park Mall - 49,481 sq. ft. | |
| Domain, The - 156,240 sq. ft. | Oxford Valley Mall - 112,254 sq. ft. | |
| Fashion Centre at Pentagon City - 169,089 sq. ft. | Plaza Carolina - 27,398 sq. ft. | |
| Firewheel Town Center - 75,303 sq. ft. | Southdale Center - 20,393 sq. ft. |
- (25)
- Amounts shown in USD equivalent; Yen equivalent is 32.7 billion.
- (26)
- Amounts shown in USD equivalent; Won equivalent is 301.9 billion.
- (27)
- Amounts shown in USD equivalent; Ringgit equivalent is 85.5 million.
- (28)
- Does not include Klépierre.
- (29)
- Amount shown in USD equivalent; CAD equivalent is 278.7 million.
- (30)
- Consists of eight loans with interest rates ranging from 1.69% to 6.53% and maturities between 2016 and 2021.
- (31)
- Our share of total indebtedness includes a pro rata share of the mortgage debt on joint venture properties, including TMLP. To the extent total indebtedness is secured by a property, it is non-recourse to us, with the exception of approximately $319.9 million of payment guarantees provided by the Operating Partnership (of which $96.7 million is recoverable from our venture partner under the partnership agreement).
- (32)
- Amounts shown in USD equivalent; Balance includes borrowings on multi-currency tranche of Euro 914.0 million.
| 2Q 2015 SUPPLEMENTAL |
|
49 |