Attached files
| file | filename |
|---|---|
| 8-K - 8-K - POPULAR, INC. | d92525d8k.htm |
 Investor Presentation
Second Quarter 2015
Exhibit 99.1 |
 Forward Looking Statements
The information contained in this presentation contains forward-looking statements within the meaning of the Private Securities Litigation Reform Act of 1995. These forward-looking statements are based on management’s current expectations and are subject to risks and uncertainties that may cause the Corporation's actual results to differ materially from any future results expressed or implied by such forward-looking statements. Please refer to our Annual Report on Form 10-K for the year ended December 31, 2014, the Quarterly Report on Form 10-Q for the quarter ended March 31, 2015 and our other filings with the SEC for a discussion of those factors that could impact our future results. Other than to the extent required by applicable law, the Corporation undertakes no obligation to publicly update or revise any forward- looking statement to reflect events or circumstances after the date of such statements. 1 |
 1 See appendix for reconciliation to GAAP. ² Excludes net write-downs related to held-for-sale reclassifications and classified asset sales.
Q2 2015 Highlights
• NPLs decreased by $89 million QoQ; ratio at 2.6% • NPL inflows, excluding consumer loans, down by $31 million QoQ • NCOs ratio of 0.89%² compared to 0.72%² last quarter Credit (excluding covered loans) • Reported adjusted net income of $90 million¹
• Strong margins: Popular, Inc. 4.54%, BPPR 4.92% Earnings • Robust capital; Common Equity Tier 1 Capital ratio of 15.6% • Strong DFAST results • DTA Reversal - increase in tangible book value by $5.27 (no material impact to regulatory capital) Capital Quarter Events • Completed acquisition of Doral’s $5B GSE mortgage servicing rights (“MSRs”)
• Purchased Doral insurance agency portfolio • Puerto Rico economic and fiscal update 2 |
 PR
Public Sector Exposure Our current direct exposure to the PR
government, instrumentalities, and municipalities is $729 million, down by $266 million from Q1 2015. The outstanding balance is approximately $673 million decreasing by $140 million from Q1 2015.
• Loans to the Government of Puerto Rico and Public Corporations are obligations that have a pledge of a specific source of income or revenues identified for their repayment. • Central Government securities exposure consists of GDB notes guaranteed by the Commonwealth and private insurance, COFINA and Public Buildings Authority guaranteed by the Commonwealth. • Reduction in PREPA driven by decision to sell and the related transfer to held for sale resulting in a $30 million write-down of which $29 million was previously reserved. • During the quarter, we recorded an other than temporary impairment (“OTTI”) of $14 million on our PR bond portfolio. Central Government & Public Corporations Municipalities Loans to various municipalities are backed by unlimited taxing power or real and personal property taxes collected within such municipalities. 3 Indirect exposure includes loans or instruments that are payable by non-governmental entities and have a government guarantee to cover any shortfall in collateral in the event of borrower default. Majority are single-family mortgage related. Indirect Exposure 1 Numbers may not add to total due to rounding. Outstanding government exposure¹
($ in millions)
Loans Securities Total Central Government $0 $49 $49 Public Corporations PRASA 90 0 90 PREPA 45 0 45 Total Central Govt & Public Corp. 135 50 185 as % of Tier 1 Risk-Based Capital 4.6% Municipalities 430 59 488 Direct Government Exposure $565 $108 $673 Indirect Exposure $330 $50 $380 |
 Financial Summary (non-GAAP)¹
¹ Unaudited. See Appendix for reconciliation to GAAP.
4 ($ in thousands) Q2 2015 Variance Net interest income 362,553 $ 343,195 $ 19,358 $ FDIC loss share income 12,396 4,139 8,257 Other non-interest income 135,168 109,975 25,193 Gross revenues 510,117 457,309 52,808 Provision for loan losses – non-covered loans 60,468 29,711 30,757 Provision for loan losses – covered loans 15,766 10,324 5,442 Total provision for loan losses 76,234 40,035 36,199 Net revenues 433,883 417,274 16,609 Personnel costs 117,112 114,026 3,086 Professional fees 73,564 68,531 5,033 OREO expenses 22,859 23,069 (210) Other operating expenses 108,744 85,891 22,853 Total operating expenses 322,279 291,517 30,762 Income from continuing operations before income tax 111,604 125,757 (14,153) Income tax expense 21,513 35,464 (13,951) Net income from continuing operations 90,091 $ 90,293 $ (202) $ Q1 2015 |
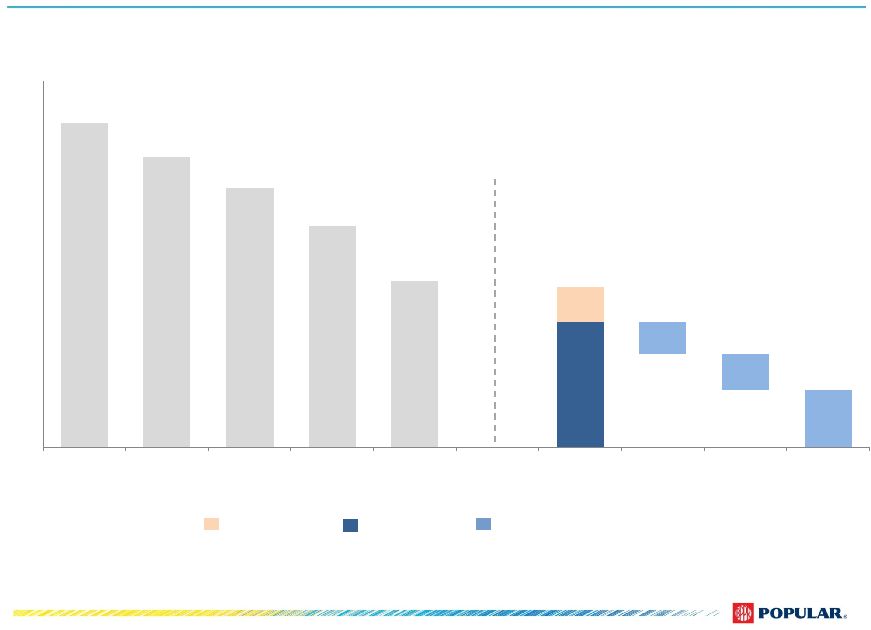 $798 $713 $636 $542 $410 $308 $85 $79 $88 $141 $- $100 $200 $300 $400 $500 $600 $700 $800 $900 FDIC LSA Q1 14 FDIC LSA Q2 14 FDIC LSA Q3 14 FDIC LSA Q4 14 FDIC LSA Q1 15 FDIC LSA Q2 15 Q1 15 Claims Paid by FDIC (July 2015) Q2 15 Estimated Claims - Not in Dispute Claims in Dispute Composition of FDIC Loss Share Asset ($ in millions) FDIC Loss Share Asset 5 $393 Single family FDIC LSA Commercial FDIC LSA Commercial FDIC LSA Components |
 Capital Ratios (%) • 2015 DFAST results show strong capital ratios in a severely adverse economic scenario
• Popular’s capital metrics continued to be robust with Common Equity Tier 1 of 15.6%
6 Note: Capital ratios for the current quarter are preliminary 15.7 16.1 18.7 11.8 15.6 15.6 18.1 11.6 Common Equity Tier 1 Capital Tier 1 Risk-Based Capital Total Risk-Based Capital Tier 1 Leverage Q1 2015 Q2 2015 Popular, Inc. Capital Ratios (%) |
  De-risked Loan Portfolios
• The Corporation has de-risked its loan portfolios by reducing its exposure to asset classes with historically high loss content • The BPPR commercial portfolio, excluding loans reclassified to non-covered during Q2 2015, includes: Commercial portfolio, including construction, has decreased from 55% of total loans held-in- portfolio to 38% Construction portfolio is down by 94% since Q4 2007 SME 1 lending is down by 55% from Q4 2007 • Collateralized exposure now represents a larger portion of consumer loan portfolio • Unsecured loan credit quality has improved as overall FICO scores have increased Note: Numbers may not add to total due to rounding. 7 $ in millions Q4 2007 Q2 2015 Q4 2007 Q2 2015 Q4 2007 Q2 2015 Variance Commercial $7,774 $7,569 $4,515 $2,436 $12,288 $10,005 ($2,284) Consumer 3,552 3,395 1,698 448 5,249 3,843 (1,406) Mortgage 2,933 6,244 3,139 981 6,071 7,226 1,154 Construction 1,231 113 237 583 1,468 696 (772) Leases 814 593 - - 814 593 (221) Legacy - - 2,130 73 2,130 73 (2,057) Total $16,304 $17,915 $11,718 $4,520 $28,021 $22,435 ($5,586) PR US Total Loan Composition (Held-in Portfolio) NCOs ($mm) (%) ($mm) (%) ($mm) (%) Distribution 3 CRE SME 1 $2,938 33% $1,528 24% ($1,410) -48% 24% C&I SME 1 2,287 25% 810 13% (1,477) -65% 29% C&I Corp 1,592 18% 1,797 29% 205 13% 5% Construction 1,231 14% 77 1% (1,154) -94% 36% CRE Corp 892 10% 1,960 31% 1,068 120% 4% Multifamily 64 1% 84 1% 20 32% 1% Total $9,004 $6,256 ($2,748) -31% 100% BPPR Commercial & Construction Distribution 2 Q4 2007 Q2 2015 Variance 2 3 NCOs distribution represents the percentage allocation of net charge-offs from Q1 2008 through Q2 2015 per each
loan category.
Excludes commercial and construction loans transferred to non-covered
category amounting to $1.4 billion and $36 million,
respectively. Small and Medium Enterprise
1 De-risked Loan Portfolios (excluding covered loans) ($ in millions) |
 Non-Performing Assets
Non-Performing
Loans (excluding covered loans)
($ in millions) • NPLs, excluding covered loans, decreased by $89 million QoQ; NPLs to loans at 2.6% of loans compared to 3.2% in Q1 2015 • Includes $8 million transferred from covered to non-covered NPLs upon expiration of loss share coverage under the LSA agreement Non-Performing Assets (including covered assets) ($ in millions) • NPAs, including covered loans, decreased by $129 million OREOs down by $66 million, primarily from the sale of covered commercial properties Differences due to rounding. BPPR NPLs at $542 million, or 3.0% of loans, decreased by $96 million - Commercial NPLs down $85 million in connection with the abovementioned $75 million public sector borrower - Construction NPLs down $8 million, mostly related to loan resolutions - Mortgage NPLs, down $1 million US operations NPLs at $34 million, or 0.8% of loans, up by $7 million 8 770 858 1,008 771 781 923 1,028 1,203 1,404 1,978 2,116 2,276 2,313 2,330 2,344 1,572 1,614 1,625 1,732 1,738 1,682 1,563 1,550 1,425 1,051 614 618 598 635 640 622 630 665 576 2.4% 2.7% 3.1% 2.8% 2.9% 3.5% 3.9% 4.7% 5.6% 8.0% 8.7% 9.6% 10.0% 10.4% 10.6% 7.6% 7.9% 7.9% 8.4% 8.4% 8.2% 7.6% 7.5% 6.8% 4.9% 2.9% 2.9% 2.8% 2.9% 3.3% 3.2% 3.3% 3.2% 2.6% 0.0% 2.0% 4.0% 6.0% 8.0% 10.0% 12.0% 14.0% Q1 07 Q2 07 Q3 07 Q4 07 Q1 08 Q2 08 Q3 08 Q4 08 Q1 09 Q2 09 Q3 09 Q4 09 Q1 10 Q2 10 Q3 10 Q4 10 Q1 11 Q2 11 Q3 11 Q4 11 Q1 12 Q2 12 Q3 12 Q4 12 Q1 13 Q2 13 Q3 13 Q4 13 Q1 14 Q2 14 Q3 14 Q4 14 Q1 15 Q2 15 Mortgage Commercial & Construction Other NPL/Loans (HIP) NPLs, including NPL HFS, down by $62 million, primarily related to a $75 million public sector credit, written down by approximately $30
million and transferred to HFS
$859 971 1,142 852 866 1,026 1,101 1,293 1,500 2,084 2,245 2,402 2,448 2,539 2,623 2,489 2,314 2,277 2,254 2,365 2,311 2,178 2,120 2,002 1,420 993 944 932 956 956 943 933 935 806 1.8% 2.1% 2.4% 1.9% 2.1% 2.5% 2.7% 3.3% 4.0% 5.7% 6.3% 6.9% 7.2% 6.0% 6.4% 6.4% 6.0% 5.8% 5.9% 6.3% 6.2% 5.9% 5.8% 5.5% 3.8% 2.7% 2.6% 2.6% 2.6% 2.6% 2.8% 2.8% 2.6% 2.2% Q1 07 Q2 07 Q3 07 Q4 07 Q1 08 Q2 08 Q3 08 Q4 08 Q1 09 Q2 09 Q3 09 Q4 09 Q1 10 Q2 10 Q3 10 Q4 10 Q1 11 Q2 11 Q3 11 Q4 11 Q1 12 Q2 12 Q3 12 Q4 12 Q1 13 Q2 13 Q3 13 Q4 13 Q1 14 Q2 14 Q3 14 Q4 14 Q1 15 Q2 15 NPLs OREO NPL HFS NPAs/Total Assets |
 NPL Inflows Total NPL Inflows ($ in millions) Highlights • Total NPL inflows decreased by $31 million QoQ, mainly driven by lower PR mortgage inflows PR mortgage NPL inflows down by $22 million - Q1 2015 inflows included the addition of $17 million of loans previously serviced by Doral - Excluding the impact of Doral from the prior quarter, mortgage inflows decreased by $5 million PR commercial inflows, including construction, down $11 million US NPL inflows increased by $2 million, mostly mortgage additions Excludes consumer loans Metrics exclude covered loans. Differences due to rounding. 9 Mortgage NPL Inflows ($ in millions) Commercial, Construction, and Legacy NPL Inflows ($ in millions) 45 42 26 22 22 22 10 19 11 7 2 9 5 65 100 43 48 59 42 32 94 31 23 113 28 17 Q2 12 Q3 12 Q4 12 Q1 13 Q2 13 Q3 13 Q4 13 Q1 14 Q2 14 Q3 14 Q4 14 Q1 15 Q2 15 US Inflows PR Inflows 51 52 34 26 29 27 16 23 16 9 10 15 17 231 257 210 158 158 136 126 183 136 119 205 135 103 Q2 12 Q3 12 Q4 12 Q1 13 Q2 13 Q3 13 Q4 13 Q1 14 Q2 14 Q3 14 Q4 14 Q1 15 Q2 15 US Inflows PR Inflows 6 10 8 5 7 5 6 4 5 3 8 6 12 166 157 167 110 99 94 94 89 105 95 92 90 86 17 Q2 12 Q3 12 Q4 12 Q1 13 Q2 13 Q3 13 Q4 13 Q1 14 Q2 14 Q3 14 Q4 14 Q1 15 Q2 15 US Inflows PR Inflows Doral Inflows |
 NCO ($ in
millions) and
NCO-to-Loan Ratio Provision
($ in millions) and Provision-to-NCO Ratio Additional Credit Metrics Highlights • NCOs up $11 million QoQ (excluding write-downs) mainly driven by: Higher commercial NCOs by $12 million as the Q1 2015 reflected a lower than normal loss trend, offset by $5 million recovery related to the sale of previously charged-off credit cards and auto loans • NCO ratio of 0.89% vs. 0.72% in Q1 2015 • Write-downs of $31 million related to loans transferred to HFS, of which $29 million was previously reserved • Provision of $60 million, increased by $31 million Provision to NCO of 128% compared to 83% in Q1 2015 • ALLL at $513 million, decreasing by $3 million QoQ; ALLL to loans at 2.29% vs. 2.46% in Q1 2015 Includes $13 million allowance transferred from covered loans • ALLL to NPL coverage ratio at 89% in Q2 2015 vs. 78% in Q1 2015 Metrics exclude covered loans. Differences due to rounding. 10 ALLL ($ in millions), ALLL-to-NCO and ALLL-to-NPL
Ratios 649
636 622 584 529 526 538 543 526 522 520 516 513 165% 276% 41% 89% Q2 12 Q3 12 Q4 12 Q1 13 Q2 13 Q3 13 Q4 13 Q1 14 Q2 14 Q3 14 Q4 14 Q1 15 Q2 15 ALLL ALLL/NCO ALLL/NPL 98 96 101 81 79 58 35 43 46 40 50 36 46 163 200 32 3 31 1.93% 0.89% 1.47% Q2 12 Q3 12 Q4 12 Q1 13 Q2 13 Q3 13 Q4 13 Q1 14 Q2 14 Q3 14 Q4 14 Q1 15 Q2 15 NCO Loan Sales Write-downs NCO% Loan Sales NCO% 82 84 86 58 55 55 48 47 50 56 50 30 59 149 169 12 2 1 83% 128% 79% Q2 12 Q3 12 Q4 12 Q1 13 Q2 13 Q3 13 Q4 13 Q1 14 Q2 14 Q3 14 Q4 14 Q1 15 Q2 15 PLLL Loan Sales PLLL PLLL/NCO Loan Sales PLLL/NCO |
 Driving Shareholder Value
Capital • Robust capital with Common Equity Tier 1 Capital of 15.6% • Working toward more active capital management Earnings • Unique franchise in PR provides strong, stable revenue-generating capacity • Continued stability in Popular’s credit metrics Additional Value • EVTC ownership and Banco BHD León stake 11 Recent Accomplishments • US restructuring completed; continued strong loan growth • Doral transactions completed |
 Investor Presentation
Second Quarter 2015
APPENDIX |
 Banco Popular
de Puerto Rico
Popular Auto,
LLC Popular Securities LLC Popular’s Insurance Subsidaries Popular North America, Inc. Banco Popular North America Holding Companies (Including Equity Investments) Who We Are – Popular, Inc. Franchise Information as of June 30, 2015 ¹ Doing business as Popular Community Bank Summary Corporate Structure Assets = $37 billion Assets = $30 billion Assets = $7 billion Puerto Rico Operations United States Operations Selected equity investments EVERTEC and Banco BHD León under Corporate segment and joint ventures under BPPR segment
• Transaction processing, business processes outsourcing • 15.04% stake • Adjusted EBITDA of $183.3 million for the year ended March 31, 2015 • Dominican Republic bank • 15.84% stake • 2014 approximate net income of $123 million PRLP 2011 Holdings, LLC • Construction and commercial loans vehicle • 24.9% stake PR Asset Portfolio 2013-1 International, LLC • Construction, commercial loans and OREOs vehicle • 24.9% stake Corporate Structure – Popular, Inc. Industry Financial services Headquarters San Juan, Puerto Rico Assets $37 billion (among top 50 BHCs in the U.S.) Loans $23 billion Deposits $28 billion Banking branches 233 in Puerto Rico, New York, New Jersey, Florida and U.S. and British Virgin Islands NASDAQ ticker symbol BPOP Market Cap $3.0 billion 13 1 |
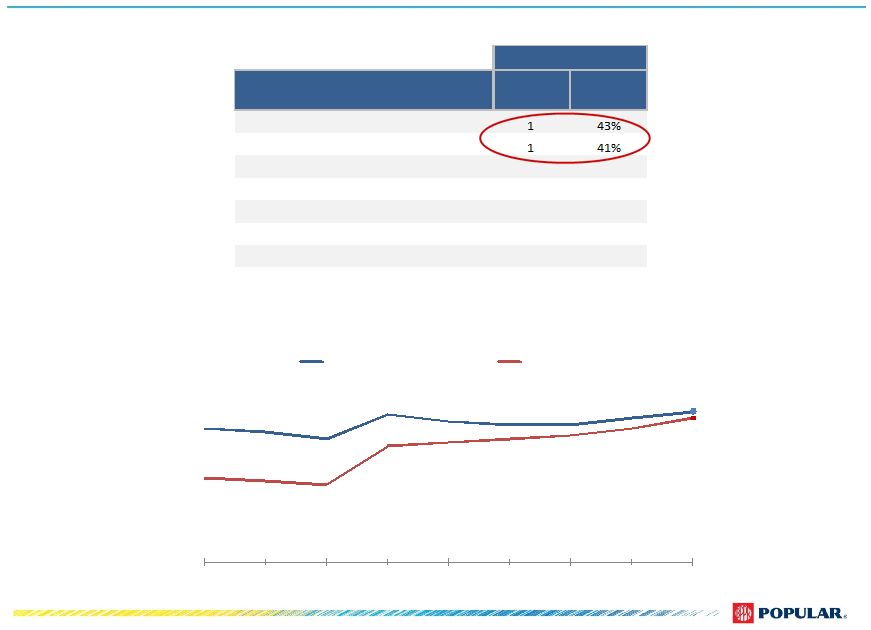 Category Market position Market share Total Deposits (Net of brokered) *
1 43% Total Loans * 1 41% Commercial & Construction Loans *
1 44% Credit Cards ¹ 1 53% Mortgage Loan Production ¹ 1 29% Personal Loans * 1 30% Auto Loans/Leases 2 18% Assets Under Management 3 15% Q1 2015 Market Leadership in Puerto Rico Source: Puerto Rico Office of the Commissioner of Financial Institutions, COSSEC, and 10K Reports.*Information included pertains to
PR Commercial Banks and Credit Unions. ¹ Mortgage loan
production and credit card data for certain competitors is not publicly available; figures presented for competitors were estimated. Popular’s Puerto Rico Market Share by Category Popular’s Puerto Rico Market Share Trend 14 38% 37% 35% 42% 40% 39% 39% 41% 43% 24% 23% 22% 33% 34% 35% 36% 38% 41% 2007 2008 2009 2010 2011 2012 2013 2014 Q1 2015 Total Deposits (net of brokered) Total Loans |
 GAAP Reconciliation Q2
2015 * Unaudited. ¹ Covered loans represent loans acquired in the Westernbank FDIC-assisted transaction that are covered under FDIC loss sharing
agreements. 15
($ in thousands)
Actual Results BPNA
(US GAAP) Reorganization Doral Acquisition OTTI Reversal DTA - BPNA Loss on Bulk Sale of Covered OREOs Adjustment to FDIC Indemnification Asset Adjusted Results (Non- GAAP) Net interest income $ 362,553 $
-
$
-
$
-
$
-
$
-
$
- $
362,553 Provision
for loan losses – non-covered loans 60,468 - - - - - - 60,468 Provision for loan losses – covered loans ¹ 15,766 - - - - - - 15,766 Net interest income after provision for loan losses 286,319 - - - - - - 286,319 Net (loss) and valuation adjustments on investment securities (14,440) - - (14,445) - - - 5 FDIC loss share income 19,075 - - - - 17,566 (10,887) 12,396 Other non-interest income 136,124 - 961 - - - - 135,163 Total non-interest income $ 140,759 $
-
$ 961
$ (14,445)
$
-
$ 17,566
$
(10,887) $ 147,564
Personnel costs
120,977 - 3,865 - - - - 117,112 Net occupancy expenses 23,286 - 2,309 - - - - 20,977 Equipment expenses 15,925 - 725 - - - - 15,200 Professional fees 78,449 - 4,885 - - - - 73,564 Communications 6,153 - 70 - - - - 6,083 Business promotion 13,776 - 401 - - - - 13,375 Other real estate owned (OREO) expenses 44,816 - - - - 21,957 - 22,859 Restructuring costs 6,174 6,174 - - - - - - Other operating expenses 53,618 - 509 - - - - 53,109 Total operating expenses $ 363,174 $ 6,174
$ 12,764
$
-
$
-
$ 21,957
$
- $
322,279 Income from continuing operations before income
tax 63,904
(6,174) (11,803) (14,445) - (4,391) (10,887) 111,604 Income tax (benefit) expense (533,533) - (3,744) (2,486) (544,927) (1,712) (2,177) 21,513 Income from continuing operations $ 597,437 $ (6,174)
$ (8,059)
$ (11,959)
$ 544,927
$ (2,679)
$
(8,710) $ 90,091
Income from discontinued operations, net of tax
$
15
$
15
$
-
$
-
$
-
$
-
$
-
$
- Net income
$ 597,452
$
(6,159) $
(8,059) $ (11,959)
$ 544,927
$ (2,679)
$
(8,710) $ 90,091
Basic EPS
5.80 $ Diluted EPS 5.79 $ Net interest margin 4.54% Tangible common book value per common share 41.75 $ Market value per common share 28.86 $ Q2 2015 * |
 GAAP Reconciliation Q1 2015
* Unaudited. ¹ Covered loans represent loans acquired in the Westernbank FDIC-assisted transaction that are covered under FDIC loss sharing
agreements. 16
($ in thousands)
Actual Results BPNA
(US GAAP) Reorganization Doral Acquisition Adjusted Results (Non-GAAP) Net interest income $ 343,195 $ - $ -
$ 343,195
Provision for loan losses –
non-covered loans
29,711 - - 29,711 Provision for loan losses – covered loans ¹ 10,324 - - 10,324 Net interest income after provision for loan losses 303,160 - - 303,160 FDIC loss share income 4,139 - - 4,139 Other non-interest income 111,096 - 1,121 109,975 Total non-interest income $ 115,235 $
-
$ 1,121
$ 114,114
Personnel costs
116,458 - 2,432 114,026 Net occupancy expenses 21,709 - 643 21,066 Equipment expenses 13,411 - - 13,411 Professional fees 75,528 - 6,997 68,531 Communications 6,176 - - 6,176 Business promotion 10,813 - - 10,813 Other real estate owned (OREO) expenses 23,069 - - 23,069 Restructuring costs 10,753 10,753 - - Other operating expenses 34,425 - - 34,425 Total operating expenses $ 312,342 $ 10,753
$ 10,072
$ 291,517
Income from continuing operations before income tax
106,053 (10,753) (8,951) 125,757 Income tax expense 32,568 - (2,896) 35,464 Income from continuing operations $ 73,485 $ (10,753)
$ (6,055)
$ 90,293
Income from discontinued operations, net of tax
$ 1,341
$
1,341
$
-
$
- Net income
$ 74,826
$
(9,412)
$ (6,055)
$ 90,293
Basic and Diluted EPS
0.72 $
Net interest margin
4.57% Tangible common book value per common share 36.33 $ Market value per common share 34.39 $ Q1 2015 * |
    Business Segments (GAAP)*
* Unaudited ¹ Non-fully taxable equivalent 17 ($ in millions) Financial Results Q2 2015 Q1 2015 Variance Q2 2015 Q1 2015 Variance Net interest income 316 $ 307 $ 9 $ 62 $ 52 $ 10 $ Non-interest income 126 103 23 6 6 - Gross revenues 442 410 32 68 58 10 Provision for loan losses – non-covered loans 60 32 28 - (2) 2 Provision for loan losses – covered loans 16 10 6 - - - Total provision for loan losses 76 42 34 - (2) 2 Operating expenses 293 240 53 51 56 (5) Income tax expense 17 37 (20) (544) 1 (545) Income (loss) from continuing operations 56 $ 91 $ (35) $ 561 $ 3 $ 558 $ Income from discontinued operations, net of tax - $ - $ - $ - $ 1 $ (1) $ Net income (loss) 56 $ 91 $ (35) $ 561 $ 4 $ 557 $ ($ in millions) Balance Sheet Highlights Q2 2015 Q1 2015 Variance Q2 2015 Q1 2015 Variance Total assets 29,669 $ 28,804 $ 865 $ 7,459 $ 6,718 $ 741 $ Total loans 18,804 19,211 (407) 4,521 4,417 104 Total deposits 23,079 22,504 575 4,793 4,854 (61) Asset Quality (including covered assets)
Q2 2015 Q1 2015 Variance Q2 2015 Q1 2015 Variance Non-performing loans held-in-portfolio / Total loans 2.90% 3.42% (0.52)% 0.76% 0.61% 0.15% Non-performing assets / Total assets 2.59% 3.11% (0.52)% 0.51% 0.59% (0.08)% Allowance for loan losses / Total loans 2.77% 2.90% (0.13)% 0.66% 0.72% (0.06)% Net interest margin¹ 4.92% 5.00% -0.08% 4.03% 3.82% 0.21% PR US |
 Consolidated Credit Summary (Excluding Covered Loans) 1 Excluding provision for loan losses and net write-downs related to the assets sales
Note: Numbers may not add to total due to rounding.
18 $ in millions Q2 15 Q1 15 Q4 14 Q3 14 Q2 14 Loans Held in Portfolio (HIP) $22,435 $21,013 $19,404 $19,359 $19,635 Performing HFS 151 152 87 158 93 NPL HFS 51 8 19 20 4 Total Non Covered Loans
22,637 $ 21,174 $ 19,511 $ 19,537 $ 19,732 $ Non-performing loans (NPLs) $576 $665 $631 $622 $640 Commercial $190 $274 $260 $252 $278 Construction $5 $13 $14 $19 $22 Legacy $5 $2 $2 $6 $8 Mortgage $331 $329 $305 $295 $286 Consumer $42 $44 $47 $47 $43 Leases $2 $3 $3 $3 $3 NPLs HIP to loans HIP 2.57% 3.16% 3.25% 3.21% 3.26% Net charge-offs (NCOs) $46 $36 $50 $40 $46 Commercial $16 $4 $13 $0 $10 Construction $2 ($3) ($0) ($1) ($1) Legacy $0 ($2) ($4) $0 ($1) Mortgage $11 $11 $12 $13 $10 Consumer $17 $25 $28 $27 $26 Leases $1 $1 $1 $1 $1 Write-downs $31 ($3) $3 $32 $20 NCOs to average loans HIP 0.89% 1 0.72% 1 1.04% 1 0.83% 1 0.94% Provision for loan losses (PLL) $59 1 $30 1 $50 1 $56 1 $50 PLL to average loans HIP 1.06% 1 0.57% 1 1.02% 1 1.16% 1 1.02% PLL to NCOs 1.28x 1 0.83x 1 0.99x 1 1.39x 1 1.08x Allowance for loan losses (ALL) $513 $516 $520 $522 $526 ALL to loans HIP 2.29% 2.46% 2.68% 2.69% 2.68% ALL to NPLs HIP 89.02% 77.63% 82.30% 83.88% 82.26% |
 Popular, Inc. Credit Ratings
April Moody’s placing most of the PR banks under review with the possibility of downgrades, due to the state of the Puerto Rico economy December Moody’s downgraded BPOP to B1; outlook stable January Fitch raised to BB- from B+; outlook stable October Moody’s revised outlook to negative February Moody's placed BPOP on review for downgrade May Moody’s downgraded BPOP to B2; outlook negative 2012 2013 2014 2015 19 March Moodys placed BPOP on review for possible upgrade due to a change in their bank rating methodology July On 7/10 S&P affirmed BPOP’s rating while maintaining a negative outlook February S&P placed BPOP on credit watch negative due to the general economic environment in Puerto Rico May Moodys, as part of a recalibration of their bank rating model, upgraded BPOP from B2 to B1 with a stable outlook Our senior unsecured ratings have remained stable Our senior unsecured ratings have remained stable Moody’s B1 Stable Outlook Fitch BB- Stable Outlook S&P B+ Negative |
 Investor Presentation
Second Quarter 2015 |