Attached files
| file | filename |
|---|---|
| 8-K - 8-K - Ameris Bancorp | v416124_8k.htm |
| EX-99.1 - EXHIBIT 99.1 - Ameris Bancorp | v416124_ex99-1.htm |
Exhibit 99.2

Ameris Bancorp 2 nd Quarter 2015 Earnings Presentation Edwin W. Hortman, Jr. – President & CEO Dennis J. Zember, Jr. – EVP & CFO

This presentation contains certain performance measures determined by methods other than in accordance with accounting principles generally accepted in the United States of America (“GAAP”) . Management of Ameris Bancorp (the “Company”) uses these non - GAAP measures in its analysis of the Company’s performance . These measures are useful when evaluating the underlying performance and efficiency of the Company’s operations and balance sheet . The Company’s management believes that these non - GAAP measures provide a greater understanding of ongoing operations, enhance comparability of results with prior periods and demonstrate the effects of significant gains and charges in the current period . The Company’s management believes that investors may use these non - GAAP financial measures to evaluate the Company’s financial performance without the impact of unusual items that may obscure trends in the Company’s underlying performance . These disclosures should not be viewed as a substitute for financial measures determined in accordance with GAAP, nor are they necessarily comparable to non - GAAP performance measures that may be presented by other companies . Tangible common equity and Tier 1 capital ratios are non - GAAP measures . The Company calculates the Tier 1 capital using current call report instructions . The Company’s management uses these measures to assess the quality of capital and believes that investors may find them useful in their evaluation of the Company . These capital measures may, or may not be necessarily comparable to similar capital measures that may be presented by other companies . This presentation may contain statements that constitute “forward - looking statements” within the meaning of Section 27 A of the Securities Act of 1933 , as amended, and Section 21 E of the Securities Exchange Act of 1934 , as amended . The words “believe”, “estimate”, “expect”, “intend”, “anticipate” and similar expressions and variations thereof identify certain of such forward - looking statements, which speak only as of the dates which they were made . The Company undertakes no obligation to publicly update or revise any forward - looking statements, whether as a result of new information, future events or otherwise . Readers are cautioned that any such forward - looking statements are not guarantees of future performance and involve risks and uncertainties and that actual results may differ materially from those indicated in the forward - looking statements as a result of various factors . Readers are cautioned not to place undue reliance on these forward - looking statements and are referred to the Company’s periodic filings with the Securities and Exchange Commission for a summary of certain factors that may impact the Company’s results of operations and financial condition . Cautionary Statements
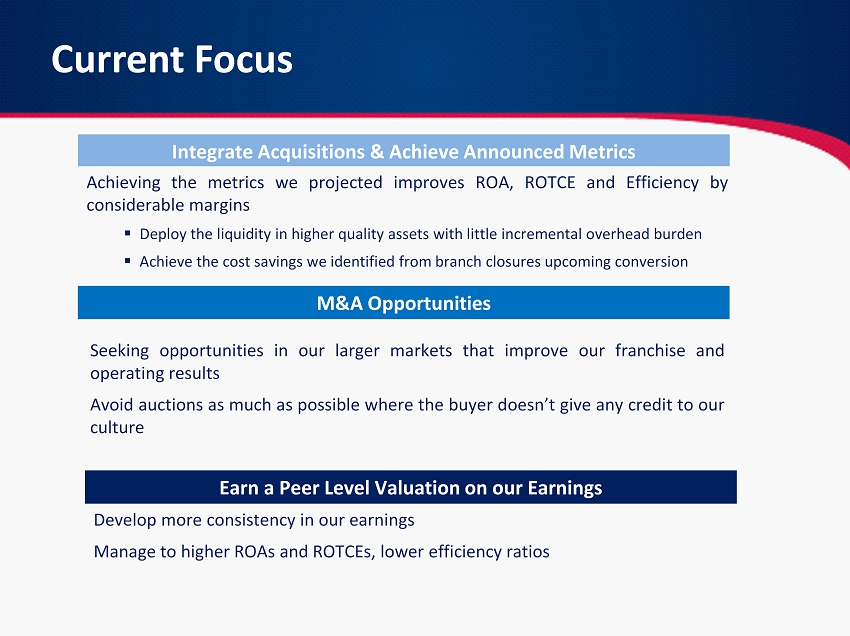
Achieving the metrics we projected improves ROA, ROTCE and Efficiency by considerable margins ▪ Deploy the liquidity in higher quality assets with little incremental overhead burden ▪ Achieve the cost savings we identified from branch closures upcoming conversion Current Focus Integrate Acquisitions & Achieve Announced Metrics M&A Opportunities Seeking opportunities in our larger markets that improve our franchise and operating results Avoid auctions as much as possible where the buyer doesn’t give any credit to our culture Earn a Peer Level Valuation on our Earnings Develop more consistency in our earnings Manage to higher ROAs and ROTCEs, lower efficiency ratios

2 nd Quarter Operating Results • Net Operating Income (excluding one time charges) of $ 12 . 3 million, up 23 . 3 % vs . 2 Q 14 • Operating EPS of $ 0 . 38 per share, down $ 0 . 01 per share from 2 Q 14 due to additional shares . • Total Revenue increased 19 . 2 % vs . year ago period • Spread income up 15 % vs . a year ago . • Non - interest income, driven by mortgage success, increased 30 . 4 % to $ 20 . 6 million • Core Operating Expenses up 26 . 3 % vs . 2 Q 14 due to Coastal Acquisition, IT and Support center spend and costs associated with LOB revenue improvement . • Organic loan growth rate of 15 . 4 % (annualized) vs . linked quarter • Total loan growth of $ 606 million . • Tangible Book Value per share of $ 11 . 81 per share compared to initial proforma of $ 11 . 74 for recent acquisitions 2Q15 2Q14 Chg 2Q15 2Q14 Chg Int Inc before Accretion 41,594$ 36,035$ 15% 80,865$ 71,181$ 14% Accretion income 2,635 2,573 2% 5,732 5,299 8% Interest Expense 3,541 3,343 6% 7,077 6,732 5% Net Interest Income 40,688 35,265 15% 79,520 69,748 14% Provision (1) 1,286 1,365 -6% 2,355 3,091 -24% Non-Interest Income 20,626 15,819 30% 38,201 28,573 34% Core Opex (1) 39,912 31,606 26% 77,563 62,205 25% Credit Costs, recurring 1,369 2,840 -52% 4,530 5,030 -10% Income before taxes 18,747 15,273 23% 33,273 27,995 19% Income tax expense 6,420 5,275 22% 11,172 9,356 19% Preferred Dividends - - 0% - 286 -100% Operating Net Income 12,327$ 9,998$ 23% 22,101$ 18,353$ 20% Earnings Per Share $0.38 $0.39 -3% $0.70 $0.72 -3% Avg Diluted Shares 32,520 25,633 27% 31,653 25,615 24% One-time charges 2Q15 2Q14 Chg 2Q15 2Q14 Chg Merger-related expenses 5,712$ 2,872 5,727 3,322$ Credit charge - Provision 1,370 - 1,370 - Credit charge - OREO 9,871 - 9,871 - Total 16,953 2,872 16,968 3,322 After tax effect 11,019$ 1,867 11,029 2,159$ Reported Net Income $ 1,308 8,131 -84% 11,072 16,194 -32% Reported EPS 0.04$ 0.32$ -87% 0.35$ 0.63$ -45% (1) - excludes amounts seen below related to one time charges Quarter to date results Year to date results
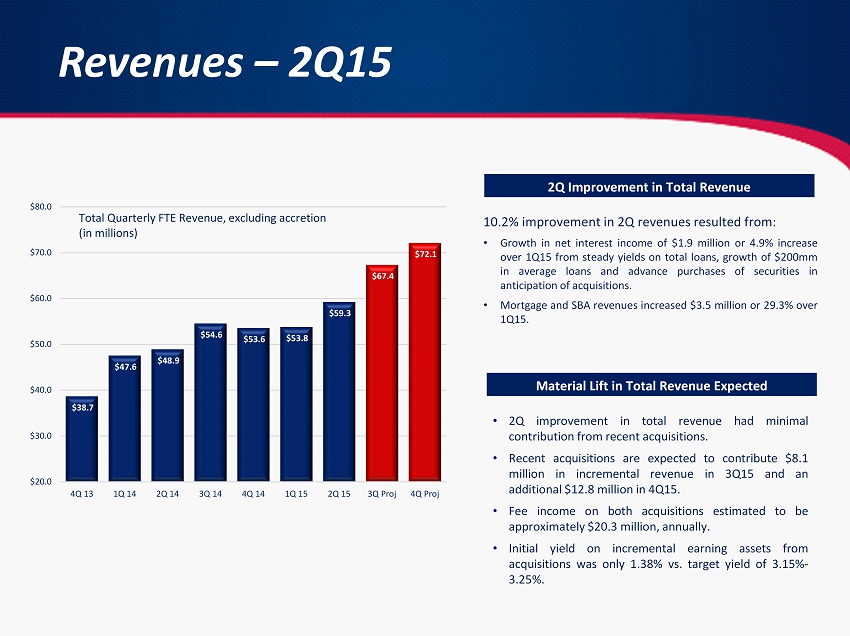
Revenues – 2Q15 10 . 2 % improvement in 2 Q revenues resulted from : • Growth in net i nterest i ncome of $ 1 . 9 million or 4 . 9 % increase over 1 Q 15 from steady yields on total loans, growth of $ 200 mm in average loans and advance purchases of securities in anticipation of acquisitions . • Mortgage and SBA revenues increased $ 3 . 5 million or 29 . 3 % over 1 Q 15 . $38.7 $47.6 $48.9 $54.6 $53.6 $53.8 $59.3 $67.4 $72.1 $20.0 $30.0 $40.0 $50.0 $60.0 $70.0 $80.0 4Q 13 1Q 14 2Q 14 3Q 14 4Q 14 1Q 15 2Q 15 3Q Proj 4Q Proj Total Quarterly FTE Revenue, excluding accretion (in millions) 2Q Improvement in T otal Revenue • 2 Q improvement in total revenue had minimal contribution from recent acquisitions . • Recent acquisitions are expected to contribute $ 8 . 1 million in incremental revenue in 3 Q 15 and an additional $ 12 . 8 million in 4 Q 15 . • Fee income on both acquisitions estimated to be approximately $ 20 . 3 million, annually . • Initial yield on incremental earning assets from acquisitions was only 1 . 38 % vs . target yield of 3 . 15 % - 3 . 25 % . Material Lift in Total Revenue Expected

Non - Interest Income – 2Q15 Earnings from Mortgage and SBA increased 73 % and totaled $ 4 . 0 million in 2 Q 15 vs . $ 2 . 3 million in 2 Q 14 . Earnings growing faster than revenue . 2Q15 1Q15 2Q14 Mortgage production (000's) 285,611 188,296 184,308 Mortgage GOS (1) - retail 3.67% 4.04% 3.56% Open Pipeline 115,890 110,856 86,218 SBA Production: 9,500 17,100 14,500 SBA sold loans 12,300 9,100 10,400 SBA GOS % 12% 12% 11% SBA Pipeline 41,000 67,000 14,400 • Service charges in 2 Q 15 up 22 % over 2 Q 14 • Mortgage non - interest income in 2 Q 15 up 35 % over 2 Q 14 • SBA non - interest income in 2 Q 15 up 38 % over 2 Q 14 • Recently closed acquisitions should have approximately 1 . 60 % non - interest income to average assets in only deposit related fees . 1 – GOS – “gain on sale” of loans 1.61% 1.75% 1.57% 1.45% 1.81% 1.80% 1.63% 1.72% 1.85% 1.0% 1.5% 2.0% 2Q 13 4Q 13 2Q 14 4Q 14 2Q 15 Non - Interest Income as a % of Average Assets $6.4 $5.9 $5.6 $6.9 $10.3 $12.0 $10.7 $11.8 $15.2 $0.0 $4.0 $8.0 $12.0 $16.0 2Q 13 4Q 13 2Q 14 4Q 14 2Q 15 Mortgage & SBA Revenues (in millions)

Expenses – 2Q15 • Expenses in LOBs up 33 % vs . last year . Revenue is up 48 % over same period . 55 % on incremental revenue . • Mortgage expenses up mostly in higher commissions . Additional hires have been made in Florida and around recent M&A transactions . • Warehouse LOB leverages existing relationships in mortgage . Still a lot of growth potential for this highly profitable and efficient LOB . • SBA aggressively recruiting experienced, high volume producers . Target is 12 - 15 bankers, currently have 9 bankers on staff . • Bank level opex up 25 % vs . 2 Q 14 but up only 1 . 3 % against 1 Q 15 . • 2 Q 15 opex includes approx . $ 800 k of opex related to M&S and BoA • Bank opex includes purchase of Coastal Bank as well as spend related to IT and Customer Support centers in recent quarters preparing for 2 nd Quarter M&A . • Expect $ 4 million in additional Opex related to 2 nd Quarter M&A in 3 Q and 4 Q . • Branch closings and integration savings at both banks total approx . $ 1 million per quarter . 1 – Core operating expenses exclude Problem loan and OREO costs as well as merger - related charges $20.0 $20.8 $22.5 $25.8 $24.9 $27.7 $29.4 $30.7 $31.1 $4.4 $4.5 $5.5 $4.8 $6.7 $7.1 $7.0 $7.0 $8.9 $0.0 $10.0 $20.0 $30.0 $40.0 2Q 13 3Q 13 4Q 13 1Q 14 2Q 14 3Q 14 4Q 14 1Q 15 2Q 15 Source of Operating Expenses (in millions, excluding credit & merger costs) Bank Level Opex LOB Opex Bank Level Opex LOB Opex

Expenses – 2Q15 Change compared to: Expense 2Q15 1Q15 2Q14 1Q15 2Q14 Salaries (ex mortgage & SBA) $12,409 $11,556 $10,263 $854 $2,147 Against 1Q15, BoA and M&S salaries were $595,000 while customer support and I/T costs were $167,000. Against 2Q14, Coastal Salaries were an additional $1.37 million Incentive & FICA 3,676 3,242 1,900 $434 $1,776 Payroll taxes were down but incentive accruals were higher by approx $800k Mortgage Expense 7,556 6,249 5,892 $1,307 $1,664 Revenue is up $2.4 million against 1Q15 and up $4.3 million against 2Q14. SBA Expenses 1,296 705 822 $591 $474 Revenue is up $1.1 million against 1Q15 and up $662,000 against 2Q14. Recruited two new producers in 2Q15. DP & IT 4,214 4,260 3,940 ($46) $274 Steady costs in 2Q15 and against earlier quarters reflect lower costs in new contract offset by higher volumes/ adoption rate of electronic banking and debit. FDIC Insurance 783 783 739 $0 $44 Growth relates to Coastal Acquisition in year ago period. Expect an increase of approximately $210,000 related to recent acquisitions. Occupancy 4,809 4,554 4,071 $255 $738 Higher costs associated with Coastal acquisitions as well as upgraded systems and software for customer support. Printing & Postage $1,096 $1,060 $896 $36 $200 Steady levels in 2Q15 vs. 1Q15. Higher against 2Q14 due to Coastal Acquisition in June 2014.

Expenses – Credit Related Costs • Every NPA over $ 200 , 000 evaluated on a 90 - 120 day disposition value . • Includes reserve for expiring LSA’s and larger Covered assets • “Normal” range is a $ 9 . 2 million annual improvement over 2014 levels or $ 0 . 18 per share 1 – Credit costs include provision for loan losses and OREO related costs. $5.9 $6.8 $3.9 $4.2 $4.9 $6.2 $4.2 $13.9 $2.5 $- $4.0 $8.0 $12.0 $16.0 3Q 13 4Q 13 1Q 14 2Q 14 3Q 14 4Q 14 1Q 15 2Q 15 Normal Credit Costs, Including Provision (in millions) • Removes the primary driver for inconsistent earnings • Payback period in 4 - 5 quarters using run - rate from previous 5 quarters . • ROA and ROTCE performance can track towards top quartile with normal credit costs . • 2016 forecasts are achievable with normal costs . Rationale for Credit Charge Formulation of One - time charge
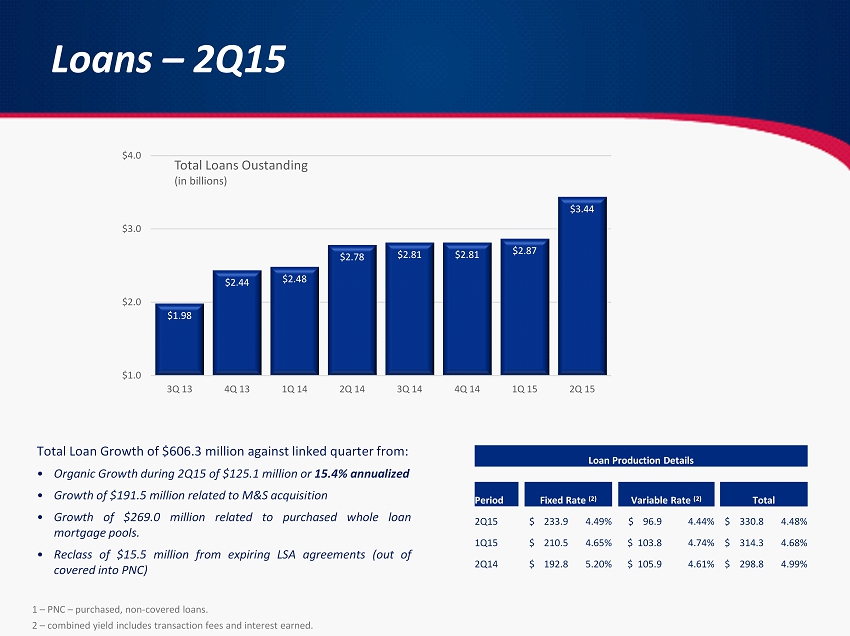
Loans – 2Q15 Total Loan Growth of $ 606 . 3 million against linked quarter from : • Organic Growth during 2 Q 15 of $ 125 . 1 million or 15 . 4 % annualized • Growth of $ 191 . 5 million related to M&S acquisition • Growth of $ 269 . 0 million related to purchased whole loan mortgage pools . • Reclass of $ 15 . 5 million from expiring LSA agreements (out of covered into PNC) 1 – PNC – purchased, non - covered loans. 2 – combined yield includes transaction fees and interest earned. Loan Production Details Period Fixed Rate (2) Variable Rate (2) Total 2Q15 $ 233.9 4.49% $ 96.9 4.44% $ 330.8 4.48% 1Q15 $ 210.5 4.65% $ 103.8 4.74% $ 314.3 4.68% 2 Q14 $ 192.8 5.20% $ 105.9 4.61% $ 298.8 4.99% $1.98 $2.44 $2.48 $2.78 $2.81 $2.81 $2.87 $3.44 $1.0 $2.0 $3.0 $4.0 3Q 13 4Q 13 1Q 14 2Q 14 3Q 14 4Q 14 1Q 15 2Q 15 Total Loans Oustanding (in billions)

Loans – Purchased Mortgage Pools 1 – PNC – purchased, non - covered loans. 2 – combined yield includes transaction fees and interest earned. Purchased mortgage pools have the following characteristics: • Seasoned pools of 5/1, 7/1 and 10/1 adjustable rate mortgages. • LTVs in the 60% range or below • Yields of 3.0% to 3.35% beat comparable mortgage backed yields by 75bps – 125bps. • No mark - to - market risk as rates rise versus a comparable mortgage backed portfolio Anticipate additional purchases of this product through the end of 2015. Modeling 3 – 4 year durations to reinvest the cash flows into higher yielding commercial assets. Balance Price Book Value Duration Yield LTV DTI FICO Pool 1 $41,308 103.0 $42,547 3.7 3.54% 59.5 38.8 759 Pool 2 $129,351 101.3 $131,129 3.5 3.61% 49.0 35.6 724 Pool 3 $93,100 102.4 $95,311 3.9 3.21% 71.4 36.7 747 Total $263,758 102.0 $268,987 3.7 3.46% 58.6 36.5 738

Deposits – 2Q15 Deposit mix has materially improved our interest rate risk profile . In the last 12 months, we have grown : • Approximately $ 489 million in NIB checking . • Approximately $ 740 million in total non - rate sensitive deposits Not all of the growth is in M&A . Organic growth accounts for $ 218 million or 44 % of the growth . • Non - rate sensitive deposits continue to climb, now at 53 . 7 % of total deposits • Percentage of fixed rate loans funded with non - rate sensitive deposits improved from 86 % at 2 Q 13 to 115 % at 2 Q 15 . $476 $669 $699 $791 $817 $839 $967 $1,280 $0 $400 $800 $1,200 $1,600 3Q 13 4Q 13 1Q 14 2Q 14 3Q 14 4Q 14 1Q 15 2Q 15 Non - Interest Bearing Demand Deposits (in millions) 84% 88% 87% 97% 91% 98% 100% 115% 60% 80% 100% 120% 3Q 13 4Q 13 1Q 14 2Q 14 3Q 14 4Q 14 1Q 15 2Q 15 F/R Loans Funded with Non - Rate Sensitive Deposits Improved Sensitivity to Interest Rates Non - Rate Sensitive Deposits include NIB, NOW and Savings Accounts.
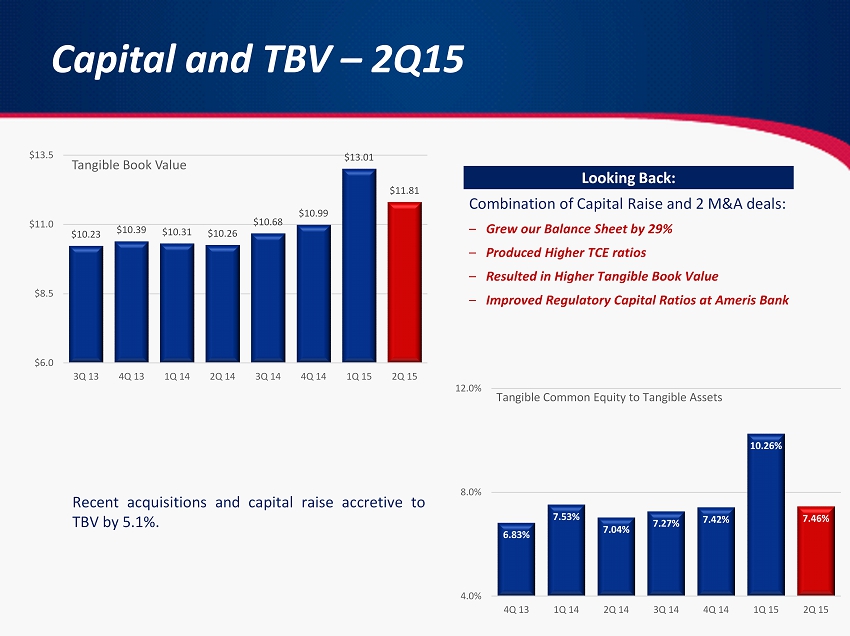
Capital and TBV – 2Q15 Combination of Capital Raise and 2 M&A deals: – Grew our Balance Sheet by 29% – Produced Higher TCE ratios – Resulted in Higher Tangible Book Value – Improved Regulatory Capital Ratios at Ameris Bank Recent acquisitions and capital raise accretive to TBV by 5 . 1 % . $10.23 $10.39 $10.31 $10.26 $10.68 $10.99 $13.01 $11.81 $6.0 $8.5 $11.0 $13.5 3Q 13 4Q 13 1Q 14 2Q 14 3Q 14 4Q 14 1Q 15 2Q 15 Tangible Book Value 6.83% 7.53% 7.04% 7.27% 7.42% 10.26% 7.46% 4.0% 8.0% 12.0% 4Q 13 1Q 14 2Q 14 3Q 14 4Q 14 1Q 15 2Q 15 Tangible Common Equity to Tangible Assets Looking Back:

• 25 % - 35 % discount to our peer group . • The overhangs causing discounted P/E are behind us . • Lift in operating performance ratios and lower volatility in earnings will drive higher multiples . Investment Rationale Discounted P/E valuation • Top Quartile ROA and ROTCE once we deploy the liquidity and achieve the cost savings projected . • Diversified revenue sources ( 66 % spread, 34 % non - interest income) . Operating Performance M&A Opportunities • Disciplined Acquirer • Announced/Executed low risk deals • Enough conversations underway so that we can avoid auctions • Strong Capital Ratios support additional M&A • Regulatory reputation presents no hurdle