Attached files
| file | filename |
|---|---|
| 8-K - 8-K - Colfax CORP | cfx8-kxq22015earnings.htm |
| EX-99.1 - EXHIBIT 99.1 - Colfax CORP | q22015earningspressrelease.htm |

SECOND QUARTER 2015 | EARNINGS CONFERENCE CALL

2 FORWARD-LOOKING STATEMENTS The following information contains forward-looking statements, including forward-looking statements within the meaning of the Private Securities Litigation Reform Act of 1995. Such forward-looking statements include, but are not limited to, statements concerning Colfax's plans, objectives, expectations and intentions and other statements that are not historical or current facts. Forward-looking statements are based on Colfax's current expectations and involve risks and uncertainties that could cause actual results to differ materially from those expressed or implied in such forward-looking statements. Factors that could cause Colfax's results to differ materially from current expectations include, but are not limited to, factors detailed in Colfax's reports filed with the U.S. Securities and Exchange Commission including its 2014 Annual Report on Form 10-K under the caption “Risk Factors”. In addition, these statements are based on a number of assumptions that are subject to change. This presentation speaks only as of this date. Colfax disclaims any duty to update the information herein.

Q2 2015 RESULTS

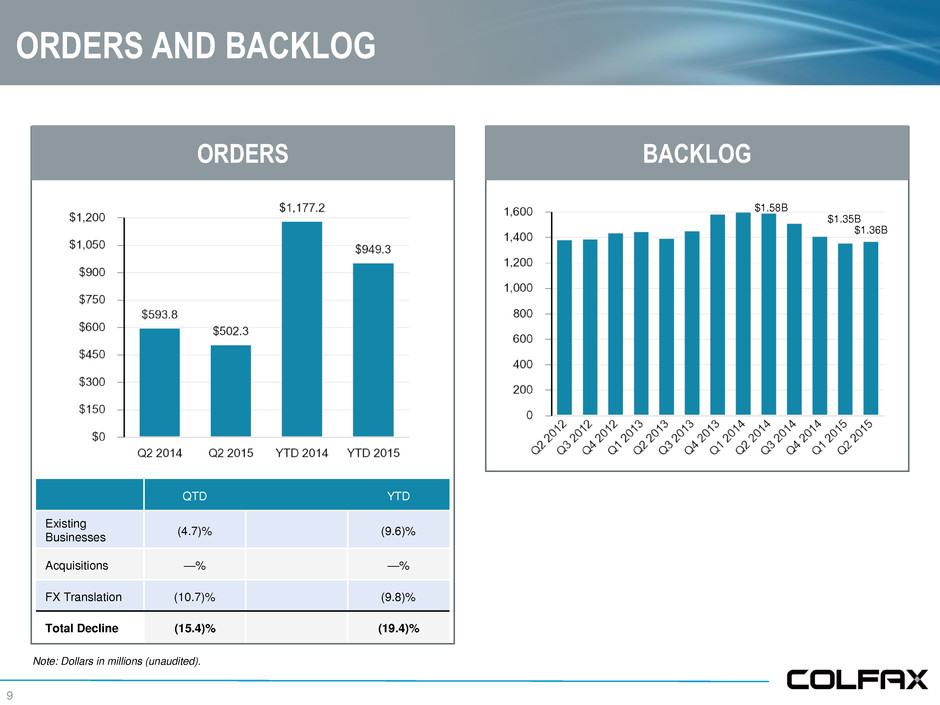
4 Q2 2015 HIGHLIGHTS • Adjusted net income of $63.0 million ($0.50 per share) compared to $59.6 million ($0.48 per share) in Q2 2014 • Q2 2015 excludes non-cash charges of $4.7 million associated with the refinancing of the Company's credit agreement • Net sales of $1.025 billion, a decrease of 14.5% from Q2 2014 net sales of $1.199 billion (an organic decline of 4.5%) • Adjusted operating income of $105.4 million and adjusted operating income margin of 10.3%, an increase of 120 basis points from Q2 2014 • Second quarter gas- and fluid-handling orders of $502.3 million compared to orders of $593.8 million in Q2 2014, a decrease of 15.4% (an organic decline of 4.7%) • Gas- and fluid-handling backlog of $1.364 billion at period end

5 YEAR TO DATE 2015 HIGHLIGHTS • Adjusted net income of $107.6 million ($0.86 per share) compared to $111.2 million ($0.91 per share) in the six months ended June 27, 2014 • Net sales of $1.936 billion, a decrease of 14.1% from the six months ended June 27, 2014 net sales of $2.254 billion (an organic decline of 8.1%) • Adjusted operating income of $186.6 million and adjusted operating income margin of 9.6%, a margin increase of 60 basis points from the six months ended June 27, 2014 • Gas- and fluid-handling orders of $949.3 million compared to orders of $1.177 billion in the six months ended June 27, 2014, a decrease of 19.4% (an organic decline of 9.6%)

GAS AND FLUID HANDLING

7 GAS AND FLUID HANDLING Q2 2015 HIGHLIGHTS • Net sales of $504.9 million compared to net sales of $568.9 million in Q2 2014, a decrease of 11.2% (an organic decline of 0.9%) • Adjusted segment operating income of $64.2 million and adjusted segment operating income margin of 12.7% as compared to 8.0% in Q2 2014 • Second quarter orders of $502.3 million compared to orders of $593.8 million in Q2 2014, a decrease of 15.4% (an organic decline of 4.7%) • Backlog of $1.364 billion at period end

8 GAS AND FLUID HANDLING YTD 2015 HIGHLIGHTS • Net sales of $927.1 million compared to net sales of $1.143 billion in the six months ended June 27, 2014, a decrease of 18.9% (an organic decline of 9.1%) • Adjusted segment operating income of $100.5 million and adjusted segment operating income margin of 10.8%, an improvement of 190 basis points over the six months ended June 27, 2014 • Orders of $949.3 million compared to orders of $1.177 billion in the six months ended June 27, 2014, a decrease of 19.4% (an organic decline of 9.6%)

9 ORDERS AND BACKLOG ORDERS BACKLOG Note: Dollars in millions (unaudited). $1.58B QTD YTD Existing Businesses (4.7)% (9.6)% Acquisitions —% —% FX Translation (10.7)% (9.8)% Total Decline (15.4)% (19.4)% $1.35B $1.36B

10 GEOGRAPHIC EXPOSURE YTD 2015 REVENUE REVENUE AFTERMARKET REVENUE YTD 2015 Note: Dollars in millions (unaudited). QTD YTD Existing Businesses (0.9)% (9.1)% Acquisitions —% —% FX Translation (10.3)% (9.8)% Total Decline (11.2)% (18.9)% ▪ Foremarket ▪ Aftermarket ▪ Developed Economies ▪ Emerging Markets 35% 65% 43% 57%

11 Q2 2015 SALES AND ORDERS BY END MARKET SALES: $504.9 million Total Decline Organic Growth (Decline) Power Generation (5.9)% 0.6% Oil, Gas & Petrochemical (9.9)% 2.8% Marine (6.0)% 8.9% Mining (2.6)% 11.7% General Industrial & Other (21.0)% (10.3)% Total (11.2)% (0.9)% ORDERS: $502.3 million Total Growth (Decline) Organic Growth (Decline) Power Generation 3.4% 11.1% Oil, Gas & Petrochemical 17.8% 30.9% Marine (60.9)% (51.1)% Mining (38.3)% (23.1)% General Industrial & Other (21.9)% (9.9)% Total (15.4)% (4.7)%

12 YTD 2015 SALES AND ORDERS BY END MARKET SALES: $927.1 million Total Decline Organic (Decline) Growth Power Generation (21.9)% (15.9)% Oil, Gas & Petrochemical (20.8)% (7.9)% Marine (11.6)% 2.9% Mining (4.1)% 8.7% General Industrial & Other (18.8)% (8.6)% Total (18.9)% (9.1)% ORDERS: $949.3 million Total (Decline) Growth Organic (Decline) Growth Power Generation (22.1)% (15.7)% Oil, Gas & Petrochemical 13.1% 25.6% Marine (43.8)% (31.9)% Mining (29.0)% (15.7)% General Industrial & Other (20.9)% (10.2)% Total (19.4)% (9.6)%

13 POWER GENERATION MARKET PERSPECTIVE SALES & ORDERS (DECLINE) GROWTH • Served by both Howden and Colfax Fluid Handling • New-build activity offset non-recurring SCR projects in China • Solid aftermarket order growth in North America • Continued focus on new-build market in Southeast and East Asia YTD 2015 SALES SPLIT YTD 2015 ORDERS SPLIT HIGHLIGHTS Q2 2015 vs. Q2 2014 YTD 2015 vs. YTD 2014 Total Organic Total Organic Sales (5.9)% 0.6% (21.9)% (15.9)% Orders 3.4% 11.1% (22.1)% (15.7)% 34% 34%

14 OIL, GAS & PETROCHEMICAL MARKET PERSPECTIVE SALES & ORDERS (DECLINE) GROWTH • Served by both Howden and Colfax Fluid Handling • Period over period comparisons are difficult due to the timing of large projects • Quarterly order growth led by $40 million supply contract at Howden Compressors Division YTD 2015 SALES SPLIT YTD 2015 ORDERS SPLIT HIGHLIGHTS Q2 2015 vs. Q2 2014 YTD 2015 vs. YTD 2014 Total Organic Total Organic Sales (9.9)% 2.8% (20.8)% (7.9)% Orders 17.8% 30.9% 13.1% 25.6% 20% 24%

15 MARINE MARKET PERSPECTIVE SALES & ORDERS (DECLINE) GROWTH • Primarily served by Colfax Fluid Handling • Year over year comparisons affected by $30 million Defense contract awarded in Q2 2014 • Commercial ship building down • Continued focus on aftermarket growth and expansion of product line YTD 2015 SALES SPLIT YTD 2015 ORDERS SPLIT HIGHLIGHTS Note: Marine market comprised of commercial marine and government, or defense, customers Q2 2015 vs. Q2 2014 YTD 2015 vs. YTD 2014 Total Organic Total Organic Sales (6.0)% 8.9% (11.6)% 2.9% Orders (60.9)% (51.1)% (43.8)% (31.9)% 11% 10%

16 MINING MARKET PERSPECTIVE SALES & ORDERS (DECLINE) GROWTH • Primarily served by Howden • Remains a depressed market; focused on winning targeted projects YTD 2015 SALES SPLIT YTD 2015 ORDERS SPLIT HIGHLIGHTS Q2 2015 vs. Q2 2014 YTD 2015 vs. YTD 2014 Total Organic Total Organic Sales (2.6)% 11.7% (4.1)% 8.7% Orders (38.3)% (23.1)% (29.0)% (15.7)% 6% 5%

17 GENERAL INDUSTRIAL & OTHER MARKET PERSPECTIVE SALES & ORDERS DECLINE • Includes both Howden and Colfax Fluid Handling • Steel industry spend significantly down compared to prior year • Modest growth in other industrial sectors YTD 2015 SALES SPLIT YTD 2015 ORDERS SPLIT HIGHLIGHTS Q2 2015 vs. Q2 2014 YTD 2015 vs. YTD 2014 Total Organic Total Organic Sales (21.0)% (10.3)% (18.8)% (8.6)% Orders (21.9)% (9.9)% (20.9)% (10.2)% 29% 27%

FABRICATION TECHNOLOGY

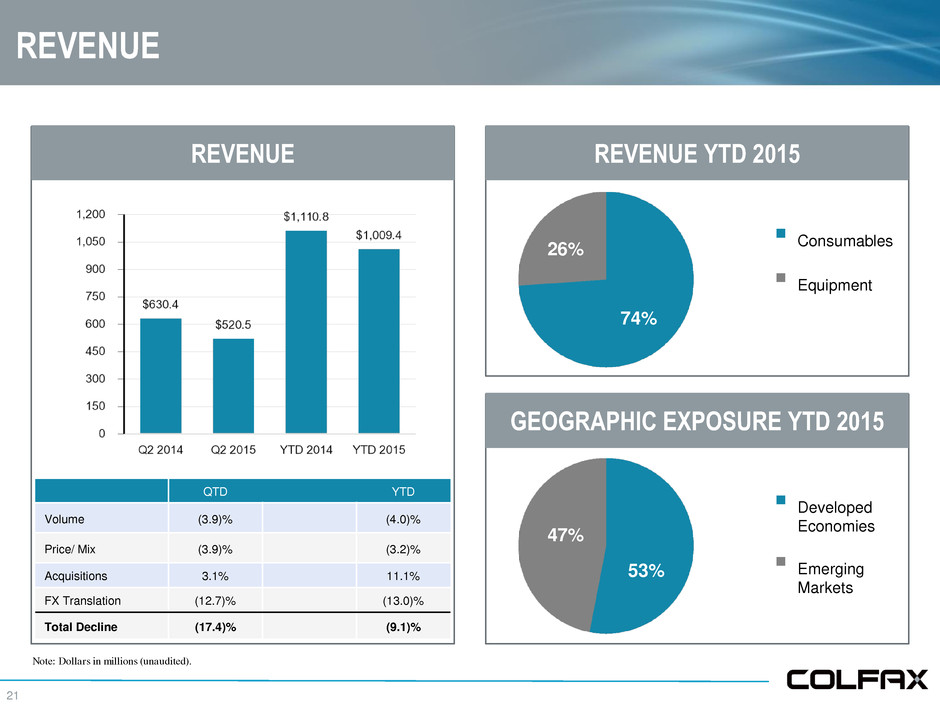
19 FABRICATION TECHNOLOGY Q2 2015 HIGHLIGHTS • Net sales of $520.5 million compared to net sales of $630.4 million in Q2 2014, a decrease of 17.4% (an organic decline of 7.8%) • Adjusted segment operating income of $53.9 million and adjusted segment operating income margin of 10.4%

20 FABRICATION TECHNOLOGY YTD 2015 HIGHLIGHTS • Net sales of $1.009 billion compared to net sales of $1.111 billion in the six months ended June 27, 2014, a decrease of 9.1% (an organic decline of 7.2%) • Adjusted segment operating income of $111.2 million and adjusted segment operating income margin of 11.0%

21 GEOGRAPHIC EXPOSURE YTD 2015 REVENUE REVENUE REVENUE YTD 2015 Note: Dollars in millions (unaudited). ▪ Consumables ▪ Equipment 74% 26% ▪ Developed Economies ▪ Emerging Markets 47% 53% QTD YTD Volume (3.9)% (4.0)% Price/ Mix (3.9)% (3.2)% Acquisitions 3.1% 11.1% FX Translation (12.7)% (13.0)% Total Decline (17.4)% (9.1)%

RESULTS OF OPERATIONS

23 INCOME STATEMENT SUMMARY (unaudited) Refer to Appendix for Non-GAAP reconciliation and footnotes. Note: Dollars in millions, except per share amounts. Three Months Ended Six Months Ended June 26, 2015 June 27, 2014 June 26, 2015 June 27, 2014 Net sales $ 1,025.4 $ 1,199.3 $ 1,936.4 $ 2,253.7 Gross profit $ 328.0 $ 388.2 $ 622.5 $ 713.8 % of sales 32.0 % 32.4 % 32.1 % 31.7 % SG&A expense $ 222.6 $ 279.0 $ 435.9 $ 510.6 % of sales 21.7 % 23.3 % 22.5 % 22.7 % Adjusted operating income $ 105.4 $ 109.1 $ 186.6 $ 203.2 % of sales 10.3 % 9.1 % 9.6 % 9.0 % Adjusted net income $ 63.0 $ 59.6 $ 107.6 $ 111.2 % of sales 6.1 % 5.0 % 5.6 % 4.9 % Adjusted net income per share $ 0.50 $ 0.48 $ 0.86 $ 0.91

APPENDIX

25 DISCLAIMER Colfax has provided financial information that has not been prepared in accordance with GAAP. These non-GAAP financial measures are projected adjusted net income, projected adjusted net income per share, projected adjusted operating income, adjusted net income, adjusted net income per share, adjusted operating income, adjusted operating income margin, organic sales growth (decline) and organic order growth (decline). Projected adjusted net income, projected adjusted net income per share, projected adjusted operating income, adjusted net income, adjusted net income per share, adjusted operating income and adjusted operating income margin exclude the impact of restructuring and other related charges. Projected adjusted net income, projected adjusted net income per share, adjusted net income and adjusted net income per share for the 2015 periods presented exclude the impact of the write-off of certain deferred financing fees and original issue discount associated with the refinancing of Colfax's credit agreement. Adjusted net income and adjusted net income per share for the six months ended June 27, 2014 exclude the impact of the preferred stock conversion inducement payment. The effective tax rates used to calculate adjusted net income and adjusted net income per share are 28.3% and 28.8% for the three and six months ended June 26, 2015, respectively, and 30.7% and 29.0% for the three and six months ended June 27, 2014, respectively. Organic sales growth (decline) and organic order growth (decline) exclude the impact of acquisitions and foreign exchange rate fluctuations. These non-GAAP financial measures assist Colfax in comparing its operating performance on a consistent basis because, among other things, they remove the impact of restructuring and other related charges, write-off of certain deferred financing fees and original issue discount and the preferred stock conversion inducement payment. Sales and order information by end market are estimates. We periodically update our customer groupings order to refine these estimates.

26 NON-GAAP RECONCILIATION (unaudited) _____________________ Note: Dollars in thousands. Six Months Ended June 26, 2015 Six Months Ended June 27, 2014 Gas and Fluid Handling Fabrication Technology Corporate and Other Total Colfax Corporation Gas and Fluid Handling Fabrication Technology Corporate and Other Total Colfax Corporation Net sales $ 927,084 $ 1,009,361 $ — $ 1,936,445 $ 1,142,889 $ 1,110,778 $ — $ 2,253,667 Operating income (loss) 95,159 10.3 % 103,937 10.3 % (25,069 ) 174,027 9.0 % 92,150 8.1 % 120,703 10.9 % (29,447 ) 183,406 8.1 % Restructuring and other related charges 5,304 7,283 — 12,587 9,538 10,248 — 19,786 Adjusted operating income (loss) $ 100,463 10.8 % $ 111,220 11.0 % $ (25,069 ) $ 186,614 9.6 % $ 101,688 8.9 % $ 130,951 11.8 % $ (29,447 ) $ 203,192 9.0 % Three Months Ended June 26, 2015 Three Months Ended June 27, 2014 Gas and Fluid Handling Fabrication Technology Corporate and Other Total Colfax Corporation Gas and Fluid Handling Fabrication Technology Corporate and Other Total Colfax Corporation Net sales $ 504,875 $ 520,500 $ — $ 1,025,375 $ 568,940 $ 630,396 $ — $ 1,199,336 Operating income (loss) 61,547 12.2 % 47,699 9.2 % (12,672 ) 96,574 9.4 % 39,052 6.9 % 70,252 11.1 % (13,636 ) 95,668 8.0 % Restructuring and other related charges 2,659 6,175 — 8,834 6,638 6,836 — 13,474 Adjusted operating income (loss) $ 64,206 12.7 % $ 53,874 10.4 % $ (12,672 ) $ 105,408 10.3 % $ 45,690 8.0 % $ 77,088 12.2 % $ (13,636 ) $ 109,142 9.1 %

27 NON-GAAP RECONCILIATION (unaudited) (1) The effective tax rates used to calculate adjusted net income and adjusted net income per share are 28.3% and 28.8% for the three and six months ended June 26, 2015, respectively, and 30.7% and 29.0% for the three and six months ended June 27, 2014, respectively. (2) Adjusted net income per share for the period prior to February 12, 2014 was calculated under the if-converted method in accordance with GAAP. On February 12, 2014, the Series A Perpetual Convertible Preferred Stock were converted to Common stock and the Company paid a $19.6 million conversion inducement to the holders of the Series A Perpetual Convertible Preferred Stock. _____________________ Note: Dollars in thousands, except per share amounts. Three Months Ended Six Months Ended June 26, 2015 June 27, 2014 June 26, 2015 June 27, 2014 Adjusted Net Income Net income attributable to Colfax Corporation $ 53,127 $ 191,785 $ 105,183 $ 238,575 Restructuring and other related charges 8,834 13,474 12,587 19,786 Debt extinguishment charges - Refinancing of credit agreement 4,731 — 4,731 — Tax adjustment(1) (3,643 ) (145,634 ) (14,905 ) (147,122 ) Adjusted net income $ 63,049 $ 59,625 $ 107,596 $ 111,239 Adjusted net income margin 6.1 % 5.0 % 5.6 % 4.9 % Adjusted Net Income Per Share Net income available to Colfax Corporation common shareholders $ 53,127 $ 191,785 $ 105,183 $ 216,662 Restructuring and other related charges 8,834 13,474 12,587 19,786 Debt extinguishment charges - Refinancing of credit agreement 4,731 — 4,731 — Preferred stock conversion inducement payment(2) — — — 19,565 Tax adjustment(1) (3,643 ) (145,634 ) (14,905 ) (147,122 ) Adjusted net income available to Colfax Corporation common shareholders 63,049 59,625 107,596 108,891 Dividends on preferred stock(2) — — — 2,348 $ 63,049 $ 59,625 $ 107,596 $ 111,239 Weighted-average shares outstanding - diluted 125,261,738 125,485,480 125,181,467 122,721,700 Adjusted net income per share $ 0.50 $ 0.48 $ 0.86 $ 0.91 Net income per share — diluted (in accordance with GAAP) $ 0.42 $ 1.53 $ 0.84 $ 1.81

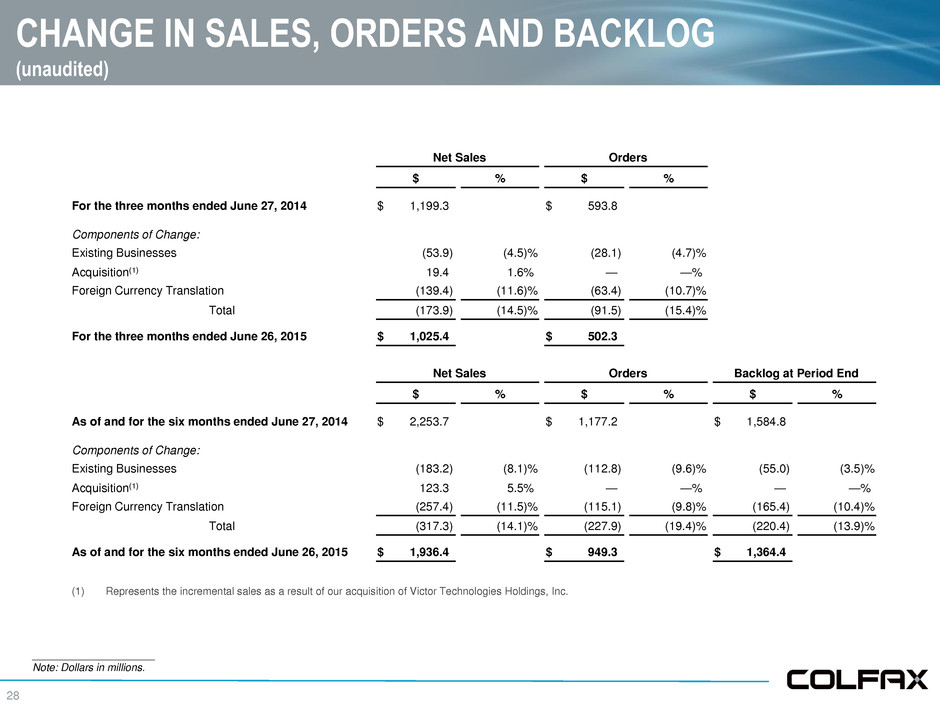
28 CHANGE IN SALES, ORDERS AND BACKLOG (unaudited) _____________________ Note: Dollars in millions. (1) Represents the incremental sales as a result of our acquisition of Victor Technologies Holdings, Inc. Net Sales Orders Backlog at Period End $ % $ % $ % As of and for the six months ended June 27, 2014 $ 2,253.7 $ 1,177.2 $ 1,584.8 Components of Change: Existing Businesses (183.2 ) (8.1 )% (112.8 ) (9.6 )% (55.0 ) (3.5 )% Acquisition(1) 123.3 5.5 % — — % — — % Foreign Currency Translation (257.4 ) (11.5 )% (115.1 ) (9.8 )% (165.4 ) (10.4 )% Total (317.3 ) (14.1 )% (227.9 ) (19.4 )% (220.4 ) (13.9 )% As of and for the six months ended June 26, 2015 $ 1,936.4 $ 949.3 $ 1,364.4 Net Sales Orders $ % $ % For the three months ended June 27, 2014 $ 1,199.3 $ 593.8 Components of Change: Existing Businesses (53.9 ) (4.5 )% (28.1 ) (4.7 )% Acquisition(1) 19.4 1.6 % — — % Foreign Currency Translation (139.4 ) (11.6 )% (63.4 ) (10.7 )% Total (173.9 ) (14.5 )% (91.5 ) (15.4 )% For the three months ended June 26, 2015 $ 1,025.4 $ 502.3

29 2015 OUTLOOK SUMMARY (July Update) _____________________ Note: Guidance as of July 23, 2015. (1) Excludes impact of restructuring charges, gain on reversal of tax accruals and non-cash charges on debt refinancing. (2) Portion of range relates to uncertainty on tax extenders. REVENUE RANGE 2015 Total $4.035 billion To $4.110 billion EPS AND ADJUSTED NET INCOME RANGE 2015 Net income per share $1.61 To $1.71 Adjusted operating income $405 million To $423 million Adjusted net income - Colfax (1) $231 million To $243 million 2015 Adjusted net income per share (1) $1.83 To $1.93 ASSUMPTIONS Restructuring costs $50 million Euro (average for year) $1.10 Tax rate - adjusted basis/GAAP (2) 28-30% Outstanding shares 126 million Depreciation $87 million Amortization (including $2 million inventory step-up) $63 million Interest expense (based on LIBOR and EURIBOR = 25 bps) $47 million

30 2015 OUTLOOK SUMMARY (July Update) _____________________ Note: Guidance as of July 23, 2015. In thousands, except per share data 2015 Low High Revenue $ 4,035,000 $ 4,110,000 Adjusted Operating Profit (1) 405,000 423,000 Interest (47,000 ) (47,000 ) Taxes (104,000 ) (109,000 ) Noncontrolling interest (23,000 ) (24,000 ) Adjusted Net Income - Colfax $ 231,000 $ 243,000 Adjust EPS $ 1.83 $ 1.93 (1) Includes transaction costs and year-one fair value adjustments from the Roots Acquisition of $6 million.

31 NON-GAAP RECONCILIATION (July Update) _____________________ Note: Guidance as of July 23, 2015. 2015 EPS Range Low High Projected net income per share - diluted $ 1.61 $ 1.71 Restructuring costs 0.39 0.39 Non-cash charge on debt refinancing (1) 0.04 0.04 Tax adjustment (2) (0.21 ) (0.21 ) Projected adjusted net income per share - diluted $ 1.83 $ 1.93 (1) Reflects the non-cash charge associated with the June 2015 refinancing of the principal credit facility. (2) Excludes gain on tax accrual reversals and tax implication of adjustments above.
