Attached files
| file | filename |
|---|---|
| 8-K - FORM 8-K - BENCHMARK ELECTRONICS INC | form8k.htm |
| EX-99 - EXHIBIT 99.1 - BENCHMARK ELECTRONICS INC | ex99-1.htm |

Second Quarter 2015 July 23, 2015 Earnings Release Conference Call

design develop deliver advanced technology 2 Forward - Looking Statements This document contains forward - looking statements within the scope of the Securities Act of 1933 and the Securities Exchange Act of 1934 . The words “expect,” “estimate,” “anticipate,” “predict ” and similar expressions, and the negatives thereof, often identify forward - looking statements, which are not limited to historical facts . Our forward - looking statements include, among other things : future revenue estimates based on new program bookings ; guidance for the third quarter of 2015 relating to sales, operating margin, tax rate, and earnings per share ; other statements, express or implied, concerning future operating results or margins, the ability to generate sales, income or cash flow, and Benchmark’s business and growth strategies, including expected internal growth and performance goals . Although Benchmark believes these statements are based upon reasonable assumptions, they involve risks and uncertainties relating to our operations, markets and business environment generally . If one or more of these risks or uncertainties materialize, or underlying assumptions prove incorrect, actual outcomes may vary materially from those indicated . All forward - looking statements included in this document are based upon information available to Benchmark as of the date of this document, and the Company assumes no obligation to update them . Readers are advised to consult further disclosures on related subjects, particularly in Item 1 A, “Risk Factors” of the Company’s Annual Report on Form 10 - K for the year ended December 31 , 2014 , in its other filings with the Securities and Exchange Commission and in its press releases . This document includes certain financial measures, such as earnings and earnings per share, that exclude certain items and therefore are not in accordance with generally accepted accounting principles (“GAAP”) . A detailed reconciliation between GAAP results and results excluding special items (“non - GAAP”) is included in our earnings release and in the Appendix of this document .

design develop deliver advanced technology 3 ▪ Revenue of $664 million at the high end of guidance range ▪ Non - GAAP operating margin at 4.2% - a 40 basis point quarter - over - quarter and 10 basis point year - over - year improvement ▪ Generated non - GAAP EPS of $0.42 ▪ Strong operating cash flow of $52 million ▪ Returned $19 million to shareholders through share repurchases Second Quarter 2015 Highlights

design develop deliver advanced technology 4 Portfolio Trends Traditional Market Revenue ▪ Q2 sales in traditional markets driven by seasonality and stronger customer demand ▪ H igher growth markets >50% of sales for the third straight quarter Higher Growth Market Revenue (Computing and Telecom) 3 - Year CAGR = 5% 3 - Year CAGR = 10% (Industrial, Medical and T&I)

design develop deliver advanced technology 5 Second Quarter 2015 New Business Wins Q2 2015 Number of New Business Wins by Segment ▪ Q2 2015: 42 new business bookings, including 13 engineering projects ▪ E stimated annual revenue run rate between $110 - 130 million Quarterly Estimated Annual Revenue Run Rate for New Business Wins

design develop deliver advanced technology 6 Second Quarter 2015 Financial Summary (In millions, except EPS) Jun 30, 2015 Mar 31, 2015 Jun 30, 2014 Net Sales $664.0 $620.9 $716.9 Net Income – GAAP $21.2 $14.2 $22.2 Net Income – non - GAAP $22.0 $17.8 $23.4 Diluted EPS – GAAP $0.40 $0.27 $0.41 Diluted EPS – non - GAAP $0.42 $0.34 $0.43 Operating Margin – GAAP 3.9% 3.0% 3.8% Operating Margin – non - GAAP 4.2% 3.8% 4.1% Effective Tax Rate – non - GAAP 22.0% 20.9% 20.3% For the Three Months Ended Guidance Provided for the June 30, 2015 Quarter: ▪ Revenue (in millions) $635 – $665 Results within Guidance ▪ Diluted EPS – non - GAAP $0.37 – $0.41 Results above Guidance

design develop deliver advanced technology 7 Trending Operating Income ▪ Continued improvement in operating income percentage ▪ Results from portfolio diversification and operational excellence initiatives

design develop deliver advanced technology 8 Second Quarter Industry Sector Update Revenue by Industry Sector Sector (in millions) Jun 30 , 2015 Mar 31, 2015 Jun 30 , 2014 Q2 YoY Industrial Controls 30% $201 32% $199 29% $211 (5)% Telecommunications 27% $177 27% $166 29% $205 (14%) Computing 20% $137 19% $120 21% $148 (7%) Medical 14% $90 13% $81 11% $81 11% Test & Instrumentation 9% $59 9% $55 10% $72* (17%) Total Revenue $664 $621 $717 Q2 - 2015 Q2 - 2014 *Includes $27 million of revenue from a customer that filed bankruptcy.
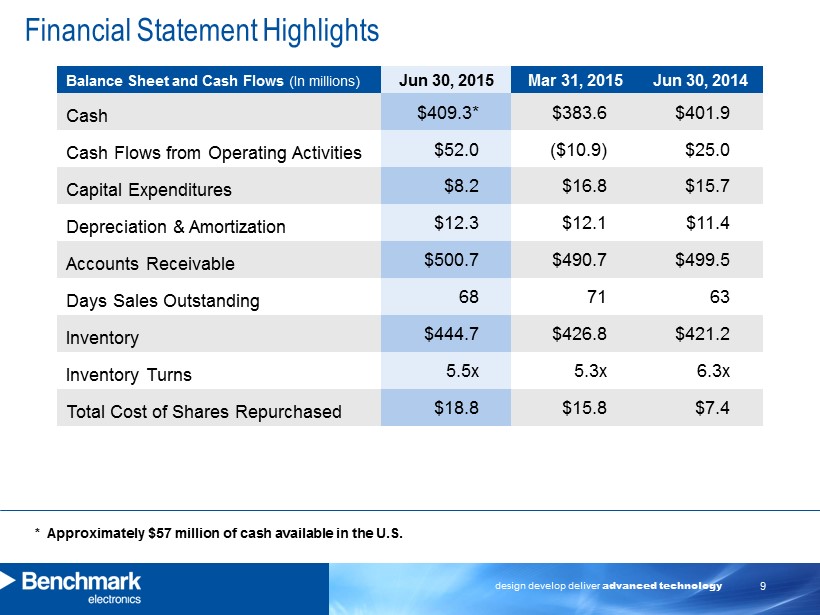
design develop deliver advanced technology 9 Financial Statement Highlights Balance Sheet and Cash Flows (In millions) Jun 30, 2015 Mar 31, 2015 Jun 30, 2014 Cash $409.3* $383.6 $401.9 Cash Flows from Operating Activities $52.0 ($10.9) $25.0 Capital Expenditures $8.2 $16.8 $15.7 Depreciation & Amortization $12.3 $12.1 $11.4 Accounts Receivable $500.7 $490.7 $499.5 Days Sales Outstanding 68 71 63 Inventory $444.7 $426.8 $421.2 Inventory Turns 5.5x 5.3x 6.3x Total Cost of Shares Repurchased $18.8 $15.8 $7.4 * Approximately $57 million of cash available in the U.S.

design develop deliver advanced technology 10 Working Capital Update Jun 30 , 2015 Mar 31 , 2015 Accounts Receivable Days 68 71 Accounts Payable Days 42 39 Inventory Days 66 68 Cash Conversion Cycle Days 91 99 ▪ Accounts Receivable and Accounts Payable each improved by three days; inventory improved by two days ▪ Cash Conversion Cycle improved by eight days ▪ Initiatives for working capital improvement: o Better alignment of customer and supplier payment terms o Demand and inventory optimization o Strategic sourcing initiatives

design develop deliver advanced technology 11 Third Quarter 2015 Guidance Guidance Net Sales (in millions) $635 – $665 Operating Margin – non - GAAP 3.8% – 4.2% Effective Tax Rate 21% - 22 % Diluted EPS – non - GAAP $0.38 – $0.42 ▪ Outlook is for the third quarter ending September 30, 2015.

design develop deliver advanced technology 12 Benchmark Market Overview Higher Growth Markets Jun 30 , 2015 Q3 - 15 Outlook (%) 2015 Outlook Industrial Controls 30% $201 Up Mid - Single Digits Growth Medical 14% $90 Up Mid - Single Digits Growth Test & Instrumentation 9% $59 Up Mid - Single Digits Stable Total Revenue $350 Traditional Markets Jun 30 , 2015 Q3 - 15 Outlook (%) 2015 Outlook Telecommunication s 27% $177 Down Low Double Digits Decline Computing 20% $137 Down Mid - Single Digits Decline Total Revenue $314

design develop deliver advanced technology 13 ▪ Near Term Cash Priorities: o Share repurchases ($69 million remaining in current program) o Capital expenditures $40 - 50 million in 2015 o Strategic growth investments ▪ Key Strategic Initiatives: o Portfolio Diversification o Lean and Operational Excellence o Working Capital Management ▪ Margin Expansion on track towards 4.5% longer term Summary Second Quarter 2015

design develop deliver advanced technology 14 Appendix

design develop deliver advanced technology 15 Reconciliation of GAAP to non - GAAP Financial Results (Amounts in Thousands, Except Per Share Data) – (UNAUDITED)