Attached files

|
Index
|
|||||||||||||||
|
2Q 2015 Supplemental
|
|||||||||||||||
|
Category
|
Page
|
||||||||||||||
|
Roseland Overview
|
3
|
||||||||||||||
|
Residential Portfolio Overview
|
4
|
||||||||||||||
|
Operating Communities (Stabilized)
|
5
|
||||||||||||||
|
Operating Communities (Lease-Up)
|
6
|
||||||||||||||
|
In-Construction Communities
|
7
|
||||||||||||||
|
Future Development Communities
|
8 - 9
|
||||||||||||||
|
Capitalization Highlights - Debt and Equity
|
10 - 11
|
||||||||||||||
|
Operating Communities - Repositioning Details
|
12
|
||||||||||||||
|
Appendix
|
13
|
||||||||||||||

|
This Supplemental Operating and Financial Data is not an offer to sell or solicitation to buy any securities of the Company. Any offers to sell or solicitations of the Company shall be made by means of a prospectus. The information in this Supplemental Package must be read in conjunction with, and is modified in its entirety by, the Quarterly on Form 10-Q (the “10-Q”) filed by the Company for the same period with the Securities and Exchange Commission (the “SEC”) and all of the Company’s other public filings with the SEC (the “Public Filings”). In particular, the financial information contained herein is subject to and qualified by reference to the financial statements contained in the 10-Q, the footnotes thereto and the limitations set forth therein. Investors may not rely on the Supplemental Package without reference to the 10-Q and the Public Filings. Any investors’ receipt of, or access to, the information contained herein is subject to this qualification.
|
|||||||||||||||
1
DISCLOSURE REGARDING FORWARD-LOOKING STATEMENTS
We consider portions of this information to be forward-looking statements within the meaning of Section 21E of the Securities Exchange Act of 1934, as amended. We intend such forward-looking statements to be covered by the safe harbor provisions for forward-looking statements contained in Section 21E of such act. Such forward-looking statements relate to, without limitation, our future economic performance, plans and objectives for future operations and projections of revenue and other financial items. Forward-looking statements can be identified by the use of words such as “may,” “will,” “plan,” “potential,” “projected,” “should,” “expect,” “anticipate,” “estimate,” “continue” or comparable terminology. Forward-looking statements are inherently subject to risks and uncertainties, many of which we cannot predict with accuracy and some of which we might not even anticipate. Although we believe that the expectations reflected in such forward-looking statements are based upon reasonable assumptions at the time made, we can give no assurance that such expectations will be achieved. Future events and actual results, financial and otherwise, may differ materially from the results discussed in the forward-looking statements. Readers are cautioned not to place undue reliance on these forward-looking statements.
Among the factors about which the Company has made assumptions are:
|
·
|
risks and uncertainties affecting the general economic climate and conditions, which in turn may have a negative effect on the fundamentals of our business and the financial condition of our tenants and residents;
|
|
·
|
the value of our real estate assets, which may limit our ability to dispose of assets at attractive prices or obtain or maintain debt financing secured by our properties or on an unsecured basis;
|
|
·
|
the extent of any tenant bankruptcies or of any early lease terminations;
|
|
·
|
our ability to lease or re-lease space at current or anticipated rents;
|
|
·
|
changes in the supply of and demand for our properties;
|
|
·
|
changes in interest rate levels and volatility in the securities markets;
|
|
·
|
our ability to complete construction and development activities on time and within budget, including without limitation obtaining regulatory permits and the availability and cost of materials, labor and equipment;
|
|
·
|
forward-looking financial and operational information, including information relating to future development projects, potential acquisitions or dispositions, and projected revenue and income;
|
|
·
|
changes in operating costs;
|
|
·
|
our ability to obtain adequate insurance, including coverage for terrorist acts;
|
|
·
|
our credit worthiness and the availability of financing on attractive terms or at all, which may adversely impact our ability to pursue acquisition and development opportunities and refinance existing debt and our future interest expense;
|
|
·
|
changes in governmental regulation, tax rates and similar matters; and
|
|
·
|
other risks associated with the development and acquisition of properties, including risks that the development may not be completed on schedule, that the tenants or residents will not take occupancy or pay rent, or that development or operating costs may be greater than anticipated.
|
For further information on factors which could impact us and the statements contained herein, see Item 1A: Risk Factors in our Annual Report on Form 10-K for the year ended December 31, 2014. We assume no obligation to update and supplement forward-looking statements that become untrue because of subsequent events, new information or otherwise.
2
|
Roseland Overview
|
|||||||||||||||||||||||||||
|
2Q 2015 Supplemental
|
|||||||||||||||||||||||||||
|
Roseland, the Residential Division of Mack-Cali Realty Corporation (“MCRC” or the “Company”), serves as the Company’s platform for the strategic transformation of its real estate holdings into the multi-family sector. As reflected through the various components of the Roseland portfolio highlighted in this new Supplemental, the Company forecasts short- and long-term value creation through its multi-family investment. This distinct Supplemental was conceived in mid-June upon installation of new Company leadership, and we anticipate further enhancements and transparency over the coming quarters to allow for full appreciation of the Company’s multi-family expansion.
|
|||||||||||||||||||||||||||
|
Roseland’s exceptional track record and proven commitment to excellence has established it as one of the premier residential and mixed-use developers in the Northeast. Roseland has an industry leading reputation for successful and profitable conception, execution and management of Class A residential developments. Roseland’s entrepreneurial owner/developer approach is hands on from project conception to operations incorporating all responsibilities of development, construction, financing, marketing, leasing and on-going property management.
|
|||||||||||||||||||||||||||
|
Roseland, a full-service real estate company, has a scalable and integrated business platform overseeing operating and in-construction assets, a geographically desirable land portfolio (much of which benefits from historical low, below market land bases) and sourcing of new sites from both strategic Repurposing of MCRC’s office holdings (as further described herein) and new development and acquisition opportunities. We envision continuous annual production from Roseland’s owned/controlled land inventory, thereby generating ongoing value creation and cash flow growth from the Company’s Residential Division.
|
|||||||||||||||||||||||||||
|
Roseland Management Services, the property management division of Roseland, is a best-in class manager with a portfolio of approximately 10,100 apartments under management including properties owned by Roseland as well as third party, institutionally owned assets on a fee-management basis (approximately 4,500). Roseland Management Services’ active presence in the Washington, DC to Boston corridor provides invaluable market-based contributions as Roseland evaluates and develops new opportunities.
|
|||||||||||||||||||||||||||
|
Roseland executive leadership, a cohesive unit since 2003, has an average experience of 17 years at Roseland and 26 years in the industry.
|
|||||||||||||||||||||||||||
|
· Marshall Tycher
|
President
|
||||||||||||||||||||||||||
|
· Andrew Marshall
|
Executive Vice President, Chief Operating Officer
|
||||||||||||||||||||||||||
|
· Ivan Baron
|
Executive Vice President, Chief Legal Counsel
|
||||||||||||||||||||||||||
|
· Bob Cappy
|
Executive Vice President, Chief Financial Officer
|
||||||||||||||||||||||||||
|
· Brenda Cioce
|
President, Roseland Management Services
|
||||||||||||||||||||||||||
|
· Gabriel Shiff
|
Executive Vice President, Finance
|
||||||||||||||||||||||||||
3
|
Residential Portfolio Overview
|
|||||||||||||||||||||||||||
|
2Q 2015 Supplemental
|
|||||||||||||||||||||||||||
|
Overview
|
|||||||||||||||||||||||||||
|
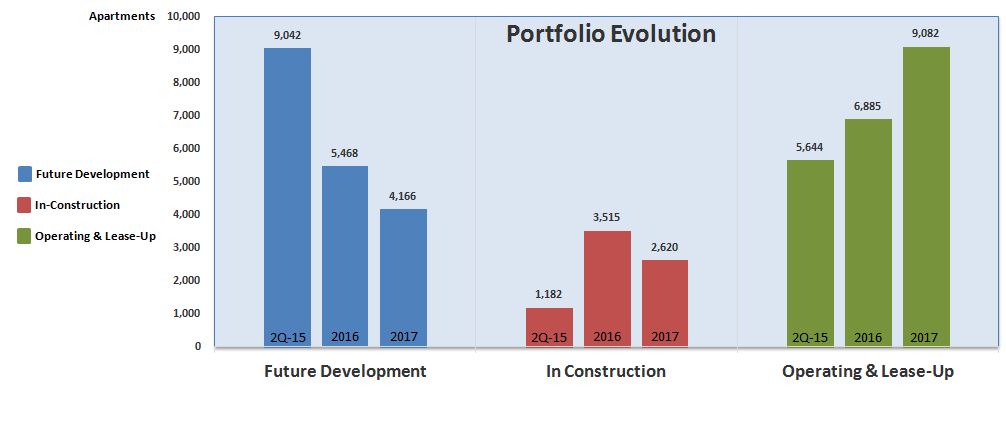
As of June 30, 2015, Roseland had a current Residential Portfolio, excluding communities under third party management contracts, comprised of:
|
|||||||||||||||||||||||||||
|
- Operating & Lease-Up Communities:
|
5,644 apartments
|
||||||||||||||||||||||||||
|
- In-Construction Communities:
|
1,182 apartments
|
||||||||||||||||||||||||||
|
- Future Development Communities:
|
9,042 apartments
|
||||||||||||||||||||||||||
|
Through continuous construction production from its Future Development portfolio, the Company envisions cash flow and value creation growth via expansion of its Operating and Lease-Up communities from 5,644 apartments to 9,082 apartments through year-end 2017 (61% increase). Further, at year-end 2017 we project 2,620 apartments will be in construction, with over 4,000 apartment development opportunities available for ongoing growth.
|
|||||||||||||||||||||||||||
|
Note A: The Company is evaluating alternatives to increase its ownership and cash flow participation throughout the portfolio.
|
|||||||||||||||||||||||||||
|
Note B: The Company is committed to expanding its current Residential Portfolio via strategic acquisitions and Repurposing activities from its office holdings.
|
|||||||||||||||||||||||||||
4
|
Operating Communities (Stabilized)
|
|||||||||||||||||
|
2Q 2015 Supplemental
|
|||||||||||||||||
|
As of June 30, 2015, the Company held interests in Operating Communities totaling 4,669 apartments, some of which are currently undergoing strategic Repositioning. The initial Roseland portfolio investment included multiple subordinated joint ventures in which Roseland was the developer and received a promoted interest in excess of a hurdle rate. Due to the increase of rental income, the embedded value of these interest has increased substantially. For example, in 2Q-2015 we sold our subordinated interest in Morristown Train Station for approximately $6.4 million on a $2.2 million book basis, producing a 2.9x multiple. We believe that over the next six to eight quarters we will favorably restructure our ownership or exit these interests.
|
|||||||||||||||||
|
Operating Highlights
|
|||||||||||||||||
|
Average
|
Average
|
||||||||||||||||
|
Percentage
|
Percentage
|
Revenue
|
Revenue
|
||||||||||||||
|
Apartment
|
Rentable
|
Avg.
|
Year
|
Leased
|
Leased
|
Per Home
|
Per Home
|
NOI
|
NOI
|
NOI
|
|||||||
|
Residential
|
Location
|
Ownership
|
Homes
|
SF
|
Size
|
Built
|
Q2 2015
|
Q1 2015
|
Q2 2015
|
Q1 2015
|
Q2 2015
|
Q1 2015
|
YTD
|
||||
|
Consolidated
|
|||||||||||||||||
|
Alterra I (1)
|
Revere, MA
|
100.00%
|
310
|
289,287
|
933
|
2004
|
96.8%
|
97.4%
|
$ 1,717
|
$ 1,668
|
$ 822
|
$ 797
|
$ 1,619
|
||||
|
Alterra IB (1)
|
Revere, MA
|
100.00%
|
412
|
373,852
|
907
|
2008
|
97.3%
|
96.4%
|
1,704
|
1,672
|
1,115
|
1,136
|
2,250
|
||||
|
Park Square
|
Rahway, NJ
|
100.00%
|
159
|
184,957
|
1,163
|
2009
|
98.1%
|
98.1%
|
2,130
|
2,077
|
510
|
484
|
994
|
||||
|
Richmond Court (1)
|
New Brunswick, NJ
|
100.00%
|
82
|
61,635
|
752
|
1995
|
100.0%
|
100.0%
|
1,606
|
1,628
|
209
|
186
|
395
|
||||
|
Riverwatch Commons (1)
|
New Brunswick, NJ
|
100.00%
|
118
|
86,217
|
731
|
1997
|
98.3%
|
99.2%
|
1,671
|
1,649
|
293
|
289
|
582
|
||||
|
Andover (1)
|
Andover, MA
|
100.00%
|
220
|
178,101
|
810
|
1989
|
98.6%
|
96.8%
|
1,373
|
1,418
|
387
|
378
|
765
|
||||
|
Consolidated
|
100.00%
|
1,301
|
1,174,049
|
902
|
97.8%
|
97.4%
|
$ 1,694
|
$ 1,673
|
$ 3,336
|
$ 3,270
|
$ 6,605
|
||||||
|
Participatory Joint Ventures
|
|||||||||||||||||
|
Crystal House (1)(2)
|
Arlington, VA
|
25.00%
|
798
|
740,941
|
928
|
1962
|
94.0%
|
97.2%
|
$ 1,781
|
$ 1,774
|
$ 2,578
|
$ 2,473
|
$ 5,051
|
||||
|
Participatory Joint Ventures
|
25.00%
|
798
|
740,941
|
928
|
94.0%
|
97.2%
|
$ 1,781
|
$ 1,774
|
$ 2,578
|
$ 2,473
|
$ 5,051
|
||||||
|
Subordinated Joint Ventures
|
|||||||||||||||||
|
Marbella
|
Jersey City, NJ
|
24.27%
|
(4)
|
412
|
369,515
|
897
|
2003
|
99.5%
|
99.3%
|
$2,965
|
$2,915
|
$2,382
|
$2,373
|
$4,755
|
|||
|
Monaco
|
Jersey City, NJ
|
15.00%
|
(4)
|
523
|
475,742
|
910
|
2011
|
98.3%
|
98.5%
|
3,305
|
3,249
|
3,453
|
3,381
|
6,834
|
|||
|
RiversEdge at Port Imperial
|
Weehawken, NJ
|
50.00%
|
(4)
|
236
|
214,963
|
911
|
2009
|
97.0%
|
97.0%
|
3,017
|
3,040
|
1,025
|
1,173
|
2,198
|
|||
|
RiverTrace
|
Weehawken, NJ
|
25.00%
|
(4)
|
316
|
295,767
|
936
|
2014
|
98.7%
|
98.7%
|
2,924
|
2,893
|
1,575
|
1,699
|
3,274
|
|||
|
The Estuary
|
Weehawken, NJ
|
7.50%
|
(4)
|
582
|
530,587
|
912
|
2014
|
98.6%
|
94.0%
|
2,907
|
3,004
|
2,989
|
2,251
|
5,240
|
|||
|
Metropolitan at 40 Park
|
Morristown, NJ
|
12.50%
|
(4)
|
130
|
124,237
|
956
|
2010
|
97.7%
|
94.6%
|
3,262
|
3,222
|
687
|
680
|
1,367
|
|||
|
The Chase at Overlook Ridge
|
Malden, MA
|
50.00%
|
(4)
|
371
|
337,060
|
909
|
2014
|
98.9%
|
96.8%
|
1,825
|
1,839
|
1,152
|
1,032
|
2,184
|
|||
|
Subordinated Joint Ventures
|
24.16%
|
2,570
|
2,347,871
|
914
|
98.5%
|
97.1%
|
$ 2,871
|
$ 2,872
|
$ 13,263
|
$ 12,589
|
$ 25,852
|
||||||
|
Total Operating Communities - Residential (3)
|
45.43%
|
4,669
|
4,262,861
|
913
|
2003
|
97.6%
|
97.2%
|
$ 2,357
|
$ 2,350
|
$ 19,177
|
$ 18,332
|
$ 37,508
|
|||||
|
Commercial
|
Parking
|
||||||||||||||||
|
Spaces
|
Retail SF
|
||||||||||||||||
|
Port Imperial Garage I
|
Weehawken, NJ
|
43.75%
|
800
|
2013
|
NA
|
NA
|
$506
|
$413
|
$919
|
||||||||
|
Port Imperial Retail I
|
Weehawken, NJ
|
43.75%
|
16,736
|
2013
|
52.0%
|
52.0%
|
(26)
|
(26)
|
(52)
|
||||||||
|
Shops at 40 Park
|
Morristown, NJ
|
12.50%
|
50,973
|
2010
|
60.4%
|
60.4%
|
205
|
187
|
392
|
||||||||
|
Riverwalk at Port Imperial
|
West New York, NJ
|
20.00%
|
30,745
|
2008
|
64.0%
|
64.0%
|
156
|
157
|
313
|
||||||||
|
Total Operating Communities - Commercial
|
20.15%
|
800
|
98,454
|
61.8%
|
61.8%
|
NA
|
NA
|
$ 841
|
$ 731
|
$ 1,572
|
|||||||
|
(1) Assets targeted for or undergoing repositioning. Additional information on Repositioning Communities can be found on Page 12.
|
|||||||||||||||||
|
(2) Unit count excludes 30 apartments permanently offline for renovation. Percentage Leased decreased as a result of an additional 69 offline apartments commencing Repositioning in 2Q.
|
|||||||||||||||||
|
(3) Excludes approximately 45,000 SF of ground floor retail.
|
|||||||||||||||||
|
(4) Ownership represents Company participation after satisfaction of Priority Capital, as detailed on Page 10.
|
|||||||||||||||||
|
See appendix for select financial definitions.
|
|||||||||||||||||
5
|
Operating Communities (Lease-Up)
|
||||||||||||||||||
|
2Q 2015 Supplemental
|
||||||||||||||||||
|
As of June 30, 2015, the Company held interests in four communities currently undergoing lease-up, totaling 975 apartments with initial stabilization dates from Q3 2015 to Q2 2016.
|
||||||||||||||||||
|
Operating Highlights
|
||||||||||||||||||
|
Percentage
|
Percentage
|
Projected
|
Projected
|
|||||||||||||||
|
Apartment
|
Rentable
|
Avg.
|
Total
|
Initial
|
Project
|
Project
|
Leased
|
Leased
|
Stabilized
|
Stabilized
|
||||||||
|
Community
|
Location
|
Ownership
|
Homes
|
SF
|
Size
|
Costs
|
Occupancy
|
Completion
|
Stabilization
|
Q2 2015
|
Q1 2015
|
(4)
|
NOI
|
Yield
|
||||
|
Participatory Joint Ventures
|
||||||||||||||||||
|
701 2nd Street, NE
|
Washington, DC
|
50.00%
|
378
|
290,348
|
768
|
$ 194,357
|
Q1 2015
|
Q4 2015
|
Q2 2016
|
40.5%
|
7.1%
|
$ 11,400
|
5.87%
|
|||||
|
RiverPark at Harrison
|
Harrison, NJ
|
36.00%
|
(2)
|
141
|
125,498
|
890
|
27,643
|
Q4 2014
|
Q2 2015
|
Q3 2015
|
99.3%
|
97.2%
|
1,900
|
6.87%
|
||||
|
Participatory Joint Ventures
|
46.20%
|
519
|
415,846
|
801
|
$ 222,000
|
56.5%
|
31.6%
|
$ 13,300
|
5.99%
|
|||||||||
|
Subordinated Joint Ventures
|
||||||||||||||||||
|
Portside at Pier One - 7
|
East Boston, MA
|
38.25%
|
(3)
|
176
|
156,693
|
890
|
$ 66,307
|
Q4 2014
|
Q2 2015
|
Q3 2015
|
93.9%
|
54.7%
|
$ 4,300
|
6.48%
|
||||
|
RiverParc at Port Imperial
|
Weehawken, NJ
|
20.00%
|
(3)
|
280
|
255,828
|
914
|
96,400
|
Q1 2015
|
Q3 2015
|
Q1 2016
|
53.9%
|
14.3%
|
6,700
|
6.95%
|
||||
|
Subordinated Joint Ventures
|
27.04%
|
456
|
412,521
|
905
|
$ 162,707
|
69.3%
|
29.9%
|
$ 11,000
|
6.76%
|
|||||||||
|
Total Lease-Up Communities (1)
|
37.24%
|
975
|
828,367
|
850
|
$ 384,707
|
62.5%
|
30.8%
|
$ 24,300
|
6.32%
|
|||||||||
|
Represents 309 units of initial lease-up success from recently completed inventory
|
||||||||||||||||||
|
Value Creation Summary
|
||||||||||||||||||
|
Projected Stabilized NOI
|
$ 24,300
|
|||||||||||||||||
|
Average - Projected Stabilized Yield
|
6.32%
|
|||||||||||||||||
|
Average - Stabilized Cap Rate
|
4.66%
|
|||||||||||||||||
|
Projected Asset Valuation
|
$ 521,172
|
|||||||||||||||||
|
Less: Total Costs
|
(384,707)
|
|||||||||||||||||
|
Projected Value Creation
|
$ 136,465
|
|||||||||||||||||
|
Projected Development Margin
|
35%
|
|||||||||||||||||
|
Company Share of Value Creation ($)
|
$ 40,961
|
|||||||||||||||||
|
Company Share of Value Creation (%)
|
30%
|
|||||||||||||||||
|
Company Capital Requirement - Total
|
$ 49,760
|
|||||||||||||||||
|
Company Capital Requirement - Remaining
|
$0
|
|||||||||||||||||
|
(1) Excludes approximately 28,800 SF of ground floor retail.
|
||||||||||||||||||
|
(2) Subsequent to quarter-end, RiverPark at Harrison was refinanced resulting in an ownership buy-up to 45% as well as a cash distribution of approximately $1.7 million.
|
||||||||||||||||||
|
(3) Ownership represents Company participation after satisfaction of Preferred Capital, as detailed on Page 10.
|
||||||||||||||||||
|
(4) Percentage Leased of Lease-Up communities represents quarter-end levels.
|
||||||||||||||||||
|
See appendix for select financial definitions.
|
||||||||||||||||||
6
|
In-Construction Communities
|
||||||||||||||||||||
|
2Q 2015 Supplemental
|
||||||||||||||||||||
|
As of June 30, 2015, the company had four In-Construction Communities representing 1,182 apartments with lease-up commencement dates from Q4 2015 to Q4 2016.
|
||||||||||||||||||||
|
Project Capitalization - Total
|
Capital as of 2Q 2015
|
Development Schedule
|
||||||||||||||||||
|
Third
|
Projected
|
Projected
|
||||||||||||||||||
|
Apartment
|
Total
|
MCRC
|
Party
|
Total
|
MCRC
|
Initial
|
Project
|
Stabilized
|
Stabilized
|
|||||||||||
|
Community
|
Location
|
Ownership
|
Homes
|
Costs
|
Debt
|
Capital
|
Capital
|
Costs
|
Capital
|
Start
|
Occupancy
|
Stabilization
|
NOI
|
Yield
|
||||||
|
Consolidated
|
||||||||||||||||||||
|
Eastchester (Tuckahoe)
|
Eastchester, NY
|
76.25%
|
108
|
$ 49,950
|
$ 28,750
|
$ 20,941
|
$ 259
|
$ 18,431
|
$ 12,706
|
Q1 2014
|
Q1 2016
|
Q1 2017
|
$ 3,300
|
6.61%
|
||||||
|
Consolidated
|
76.25%
|
108
|
$ 49,950
|
$ 28,750
|
$ 20,941
|
$ 259
|
$ 18,431
|
$ 12,706
|
$ 3,300
|
6.61%
|
||||||||||
|
Participatory Joint Ventures
|
||||||||||||||||||||
|
Marbella South (M2)
|
Jersey City, NJ
|
24.27%
|
311
|
$ 132,100
|
$ 77,400
|
$ 13,271
|
$ 41,429
|
$ 95,244
|
$ 9,745
|
Q3 2013
|
Q4 2015
|
Q4 2016
|
$ 8,470
|
6.41%
|
||||||
|
URL® Harborside - I
|
Jersey City, NJ
|
85.00%
|
763
|
320,305
|
192,000
|
108,889
|
19,416
|
128,375
|
91,522
|
Q4 2013
|
Q4 2016
|
Q3 2018
|
19,500
|
6.09%
|
||||||
|
Participatory Joint Ventures
|
67.41%
|
1,074
|
$ 452,405
|
$ 269,400
|
$ 122,160
|
$ 60,845
|
$ 223,619
|
$ 101,267
|
$ 27,970
|
6.18%
|
||||||||||
|
Commercial
|
||||||||||||||||||||
|
Port Imperial Garage II
|
Weehawken, NJ
|
100.00%
|
-
|
$ 31,200
|
$ -
|
$ 31,200
|
$ -
|
$ 18,848
|
$ 16,550
|
Q3 2014
|
Q3 2015
|
N/A
|
$ 1,975
|
6.33%
|
||||||
|
Commercial
|
100.00%
|
-
|
$ 31,200
|
$ -
|
$ 31,200
|
$ -
|
$ 18,848
|
$ 16,550
|
$ 1,975
|
6.33%
|
||||||||||
|
Total In-Construction Communities
|
1,182
|
$ 533,555
|
$ 298,150
|
$ 174,301
|
$ 61,104
|
$ 260,898
|
$ 130,523
|
$ 33,245
|
6.23%
|
|||||||||||
|
Value Creation Summary (Residential)
|
||||||||||||||||||||
|
Projected Stabilized NOI
|
$31,270
|
|||||||||||||||||||
|
Average - Projected Stabilized Yield
|
6.22%
|
|||||||||||||||||||
|
Average - Stabilized Cap Rate
|
4.75%
|
|||||||||||||||||||
|
Projected Asset Valuation
|
$658,316
|
|||||||||||||||||||
|
Less: Total Costs
|
(502,355)
|
|||||||||||||||||||
|
Projected Value Creation
|
$155,961
|
|||||||||||||||||||
|
Projected Development Margin
|
31%
|
|||||||||||||||||||
|
Company Share of Value Creation ($)
|
$106,399
|
An increase in participation as compared to Roseland's historic pattern.
|
||||||||||||||||||
|
Company Share of Value Creation (%)
|
68%
|
The Company envisions comparable or enhanced participation in future value creation activities.
|
||||||||||||||||||
|
Company Capital Requirement - Total
|
$174,301
|
|||||||||||||||||||
|
Company Capital Requirement - Remaining
|
$43,778
|
|||||||||||||||||||
|
See appendix for select financial definitions.
|
||||||||||||||||||||
7
|
Future Development Communities
|
|||||||||||||||
|
2Q 2015 Supplemental
|
|||||||||||||||
|
The Company anticipates additional value creation from construction production of its Land Inventory, all of which is owned or controlled by the Company.
|
|||||||||||||||
|
Predevelopment Communities
|
|||||||||||||||
|
As of June 30, 2015, the Company owned 10 Predevelopment Communities aggregating 2,979 apartments and hotel keys that have forecasted construction starts through year-end 2016.
|
|||||||||||||||
|
MCRC
|
Anticipated
|
||||||||||||||
|
Apartment
|
Current
|
Construction
|
Approved /
|
Projected
|
|||||||||||
|
Community
|
Location
|
Homes
|
Ownership
|
Start
|
Entitled
|
Costs
|
Notes
|
||||||||
|
Chase II
|
Malden, MA
|
290
|
100.00%
|
Q3 2015
|
fully
|
$ 73,000
|
(1)
|
||||||||
|
Worcester
|
Worcester, MA
|
365
|
100.00%
|
Q3 2015
|
fully
|
91,400
|
|||||||||
|
PI South - 4/5 Hotel
|
Weehawken, NJ
|
364
|
50.00%
|
Q3 2015
|
fully
|
128,900
|
(2)
|
||||||||
|
Conshohocken
|
Conshohocken, PA
|
294
|
100.00%
|
Q4 2015
|
fully
|
79,800
|
|||||||||
|
PI South - Building 11
|
Weehawken, NJ
|
296
|
50.00%
|
Q4 2015
|
fully
|
110,000
|
|||||||||
|
Lofts at 40 Park
|
Morristown, NJ
|
59
|
25.00%
|
Q4 2015
|
partial
|
18,000
|
|||||||||
|
Freehold
|
Freehold, NJ
|
400
|
100.00%
|
Q1 2016
|
partial
|
95,000
|
(3)
|
||||||||
|
Portside 5/6
|
East Boston, MA
|
296
|
85.00%
|
Q1 2016
|
fully
|
110,000
|
(4)
|
||||||||
|
PI North - Building C
|
West New York, NJ
|
363
|
20.00%
|
Q3 2016
|
partial
|
157,000
|
|||||||||
|
Crystal House - III
|
Arlington, VA
|
252
|
50.00%
|
Q3 2016
|
fully
|
87,000
|
|||||||||
|
Predevelopment Communities
|
2,979
|
$ 950,100
|
|||||||||||||
|
Value Creation Summary
|
|||||||||||||||
|
Projected Average Yield
|
6.40%
|
||||||||||||||
|
Projected NOI
|
$ 60,806
|
||||||||||||||
|
Approximate Gross Value @ 5.00% Cap
|
$ 1,216,128
|
||||||||||||||
|
Less: Projected Costs
|
(950,100)
|
||||||||||||||
|
Net Value Creation
|
$ 266,028
|
||||||||||||||
|
Repurposing Communities
|
|||||||||||||||
|
The Company defines Repurposing Communities as commercial holdings of the Company which have been targeted for re-zoning from their existing office to new multi-family use and have a likelihood of achieving desired re-zoning and project approvals. As of June 30, 2015, the Company had three active Repurposing Communities aggregating 595 potential apartments. Further, the Company has ongoing municipal negotiations for additional residential approvals and is evaluating numerous MCRC office holdings for Repurposing potential.
|
|||||||||||||||
|
MCRC
|
Anticipated
|
||||||||||||||
|
Apartment
|
Current
|
Construction
|
Approved /
|
Projected
|
|||||||||||
|
Community
|
Location
|
Homes
|
Ownership
|
Start
|
Entitled
|
Costs
|
|||||||||
|
250 Johnson Road
|
Morris Plains, NJ
|
188
|
100.00%
|
Q3 2015
|
fully
|
$ 54,800
|
|||||||||
|
150 Monument Road
|
Bala Cynwyd, PA
|
207
|
100.00%
|
Q1 2016
|
partial
|
54,700
|
|||||||||
|
233 Canoe Brook Road
|
Short Hills, NJ
|
200
|
100.00%
|
Q2 2016
|
partial
|
63,000
|
(5)
|
||||||||
|
Repurposing Communities
|
595
|
$ 172,500
|
|||||||||||||
|
Value Creation Summary
|
|||||||||||||||
|
Projected Average Yield
|
6.75%
|
||||||||||||||
|
Projected NOI
|
$ 11,644
|
||||||||||||||
|
Approximate Gross Value @ 5.00% Cap
|
$ 232,875
|
||||||||||||||
|
Less: Projected Costs
|
(172,500)
|
||||||||||||||
|
Net Value Creation
|
$ 60,375
|
||||||||||||||
8
|
Future Development Communities (cont.)
|
||||||||||||||||
|
2Q 2015 Supplemental
|
||||||||||||||||
|
Future Developments
|
Anticipated
|
|||||||||||||||
|
Apartment
|
Current
|
Construction
|
Approved /
|
|||||||||||||
|
Community
|
Location
|
Homes
|
Ownership
|
Start
|
Entitled
|
Notes
|
||||||||||
|
Liberty Landing Phase I
|
Jersey City, NJ
|
265
|
50.00%
|
2017
|
partial
|
|||||||||||
|
PI North - Building J
|
West New York, NJ
|
141
|
20.00%
|
2017
|
partial
|
|||||||||||
|
PI North - Building I
|
West New York, NJ
|
224
|
20.00%
|
2017
|
partial
|
|||||||||||
|
San Remo
|
Jersey City, NJ
|
250
|
41.67%
|
2017
|
partial
|
|||||||||||
|
Portside 1-4
|
East Boston, MA
|
160
|
85.00%
|
2017
|
none
|
|||||||||||
|
Overlook IIIC
|
Malden, MA
|
252
|
100.00%
|
2017
|
partial
|
|||||||||||
|
PI South - Building 8/9
|
Weehawken, NJ
|
275
|
50.00%
|
2017
|
partial
|
|||||||||||
|
PI North - Riverbend 6
|
West New York, NJ
|
471
|
20.00%
|
Beyond
|
partial
|
|||||||||||
|
PI South - Building 16
|
Weehawken, NJ
|
131
|
50.00%
|
Beyond
|
partial
|
|||||||||||
|
PI South - Building 2
|
Weehawken, NJ
|
200
|
50.00%
|
Beyond
|
partial
|
|||||||||||
|
PI South - Park Parcel
|
Weehawken, NJ
|
224
|
50.00%
|
Beyond
|
partial
|
|||||||||||
|
PI South - Office 1/3
|
Weehawken, NJ
|
N/A
|
50.00%
|
Beyond
|
partial
|
|||||||||||
|
Overlook IIIA
|
Malden, MA
|
445
|
100.00%
|
Beyond
|
partial
|
|||||||||||
|
Overlook IV
|
Malden, MA
|
45
|
100.00%
|
Beyond
|
partial
|
|||||||||||
|
URL® Harborside - Future
|
Jersey City, NJ
|
1,500
|
100.00%
|
Beyond
|
partial
|
|||||||||||
|
Crystal House - Future
|
Arlington, VA
|
300
|
50.00%
|
Beyond
|
partial
|
|||||||||||
|
Liberty Landing
|
Jersey City, NJ
|
585
|
50.00%
|
Beyond
|
partial
|
|||||||||||
|
Future Developments
|
5,468
|
|||||||||||||||
|
Total Development Communities - Future
|
9,042
|
|||||||||||||||
|
Notes:
|
||||||||||||||||
|
(1) The Chase II project represents two development parcels: IIB and IIID.
|
||||||||||||||||
|
(2) Number of units reflects programmed hotel keys.
|
||||||||||||||||
| (3) The Company has a signed agreement to acquire this land, subject to certain conditions. | ||||||||||||||||
|
(4) Prudential has an option to participate in East Boston Parcels 5 and 6, under similar terms as Parcel 7.
|
||||||||||||||||
|
(5) Target approvals will likely also include approximately 225 hotel keys.
|
||||||||||||||||
|
|
||||||||||||||||
9
|
Capitalization Highlights
|
|||||||||||||
|
2Q 2015 Supplemental
|
|||||||||||||
|
Project Debt
|
Priority Capital Balances (1)
|
||||||||||||
|
Third
|
|||||||||||||
|
Outstanding
|
Maximum
|
Maturity
|
Interest
|
MCRC
|
Party
|
Return
|
|||||||
|
Ownership
|
Balance
|
Balance
|
Date
|
Rate
|
Capital
|
Capital
|
Rate
|
Note
|
|||||
|
Operating Communities
|
|||||||||||||
|
Consolidated Communities
|
|||||||||||||
|
Park Square
|
100.00%
|
$ 27,500
|
$ 27,500
|
4/10/2019
|
L + 1.75%
|
||||||||
|
Consolidated Communities
|
$ 27,500
|
$ 27,500
|
$ -
|
$ -
|
|||||||||
|
Participatory Joint Ventures
|
|||||||||||||
|
Crystal House
|
25.00%
|
$ 165,000
|
$ 165,000
|
4/1/2020
|
3.17%
|
$ 25,870
|
$ 77,611
|
(2)
|
|||||
|
Participatory Joint Ventures
|
$ 165,000
|
$ 165,000
|
$ 25,870
|
$ 77,611
|
|||||||||
|
Subordinated Joint Ventures
|
|||||||||||||
|
Marbella
|
24.27%
|
$ 95,000
|
$ 95,000
|
5/1/2018
|
4.99%
|
$ 125
|
$ 7,567
|
9.50%
|
(3) *
|
||||
|
Monaco
|
15.00%
|
165,000
|
165,000
|
2/1/2021
|
4.19%
|
-
|
81,082
|
9.00%
|
*
|
||||
|
RiversEdge at Port Imperial
|
50.00%
|
57,500
|
57,500
|
9/1/2020
|
4.32%
|
-
|
42,188
|
9.00%
|
*
|
||||
|
RiverTrace
|
25.00%
|
79,380
|
79,380
|
7/15/2021
|
6.00%
|
-
|
45,575
|
7.75%
|
*
|
||||
|
The Estuary
|
7.50%
|
210,000
|
210,000
|
3/1/2030
|
4.00%
|
-
|
23,361
|
8.50%
|
*
|
||||
|
Metropolitan at 40 Park
|
12.50%
|
38,600
|
38,600
|
9/1/2020
|
3.25%
|
695
|
21,010
|
9.00%
|
(4) *
|
||||
|
The Chase at Overlook Ridge
|
50.00%
|
52,662
|
55,500
|
12/26/2015
|
L + 2.50%
|
-
|
26,356
|
6.50%
|
(5) (6) *
|
||||
|
Subordinated Joint Ventures
|
$ 698,142
|
$ 700,980
|
$ 820
|
$ 247,139
|
|||||||||
|
Commercial Operating Communities
|
|||||||||||||
|
Port Imperial Garage I
|
43.75%
|
-
|
-
|
N/A
|
N/A
|
$ 17,238
|
-
|
8.00%
|
|||||
|
Shops at 40 Park
|
12.50%
|
$ 6,500
|
$ 6,500
|
8/13/2018
|
3.63%
|
-
|
-
|
||||||
|
Riverwalk at Port Imperial
|
20.00%
|
-
|
-
|
N/A
|
N/A
|
-
|
$ 6,216
|
9.00%
|
|||||
|
Commercial Operating Communities
|
$ 6,500
|
$ 6,500
|
$ 17,238
|
$ 6,216
|
|||||||||
|
Total Operating Communities
|
$ 897,142
|
$ 899,980
|
$ 43,928
|
$ 330,966
|
|||||||||
|
Lease-Up Communities
|
|||||||||||||
|
Participatory Joint Ventures
|
|||||||||||||
|
701 2nd Street, NE
|
50.00%
|
$ 91,434
|
$ 100,700
|
7/1/2033
|
4.82%
|
-
|
-
|
||||||
|
RiverPark at Harrison
|
36.00%
|
23,400
|
23,400
|
6/27/2016
|
L + 2.35%
|
$ 3,261
|
$ 4,867
|
7.25%
|
(7)
|
||||
|
Participatory Joint Ventures
|
|
$ 114,834
|
$ 124,100
|
$ 3,261
|
$ 4,867
|
||||||||
|
Subordinated Joint Ventures
|
|||||||||||||
|
Portside at Pier One - Building 7
|
38.25%
|
$ 42,108
|
$ 42,500
|
12/4/2015
|
L + 2.50%
|
-
|
$ 28,509
|
9.00%
|
|||||
|
RiverParc at Port Imperial
|
20.00%
|
64,927
|
73,350
|
6/27/2016
|
L + 2.15%
|
$ 2,296
|
52,601
|
9.00%
|
(8)
|
||||
|
Subordinated Joint Ventures
|
|
$ 107,035
|
$ 115,850
|
$ 2,296
|
$ 81,110
|
||||||||
|
Total Lease-Up Communities
|
|
$ 221,869
|
$ 239,950
|
$ 5,557
|
$ 85,977
|
||||||||
10
|
Capitalization Highlights (cont.)
|
|||||||||||||
|
2Q 2015 Supplemental
|
|||||||||||||
|
Project Debt
|
Priority Capital Balances (1)
|
||||||||||||
|
Third
|
|||||||||||||
|
Outstanding
|
Maximum
|
Maturity
|
Interest
|
MCRC
|
Party
|
Return
|
|||||||
|
Ownership
|
Balance
|
Balance
|
Date
|
Rate
|
Capital
|
Capital
|
Rate
|
Note
|
|||||
|
In-Construction Communities
|
|||||||||||||
|
Consolidated
|
|||||||||||||
|
Eastchester
|
76.25%
|
$ 3,493
|
$ 28,750
|
3/30/2017
|
L + 2.35%
|
$ 14,289
|
$ 756
|
8.00%
|
(9) | ||||
|
Consolidated Communities
|
$ 3,493
|
$ 28,750
|
$ 14,289
|
$ 756
|
|||||||||
|
Participatory Joint Ventures
|
|||||||||||||
|
Marbella South (M2)
|
24.27%
|
$ 51,206
|
$ 77,400
|
3/30/2017
|
L + 2.25%
|
$ 10,736
|
$ 33,758
|
9.00%
|
|||||
|
URL Harborside - I
|
85.00%
|
0
|
192,000
|
8/1/2029
|
5.20%
|
-
|
-
|
||||||
|
Participatory Joint Ventures
|
$ 51,206
|
$ 269,400
|
$ 10,736
|
$ 33,758
|
|||||||||
|
Total In-Construction Communities
|
|
$ 54,699
|
$ 298,150
|
$ 25,025
|
$ 34,514
|
||||||||
|
Future Developments
|
|||||||||||||
|
Lofts at 40 Park
|
25.00%
|
$ 1,116
|
$ 1,116
|
9/30/2015
|
L + 2.50%
|
-
|
$ 1,085
|
8.00%
|
|||||
|
PI North - Building C
|
20.00%
|
-
|
-
|
-
|
26,132
|
10.00%
|
|||||||
|
Port Imperial North
|
20.00%
|
-
|
-
|
$ 4,985
|
59,733
|
||||||||
|
Port Imperial South
|
50.00%
|
44,550
|
45,100
|
9/19/2015
|
L + 1.75%
|
13,663
|
-
|
Prime + 8.00%
|
(10)
|
||||
|
Total Future Developments
|
|
$ 45,666
|
$ 46,216
|
$ 18,648
|
$ 86,950
|
||||||||
|
Total Residential Portfolio
|
$ 1,219,376
|
$ 1,484,296
|
$ 93,158
|
$ 538,407
|
|||||||||
|
Notes:
|
|||||||||||||
|
* Ownership represents Company participation after satisfaction of Priority Capital.
|
|||||||||||||
|
(1) Includes outstanding preferred returns, where applicable.
|
|||||||||||||
|
(2) Upon a capital event, the Company receives a promoted additional 25 percent interest over a 9.00 percent IRR to heads-up capital accounts.
|
|||||||||||||
|
(3) The MCRC Balance represents capital account held by Marbella Rosegarden, L.L.C., of which the Company owns a 48.53 percent interest.
|
|||||||||||||
|
(4) Equity Capital balances apply to Metropolitan at 40 Park and Shoppes at 40 Park. The MCRC balance represents capital account held by Rosewood Epsteins, L.L.C., of which the Company owns a 50 percent interest.
|
|||||||||||||
|
(5) On January 18, 2013, Overlook Apartments Investors entered into an interest rate swap agreement with a commercial bank. The swap agreement fixes the all-in rate to 3.0875 percent per annum for the period from September 3, 2013 to November 2, 2015.
|
|||||||||||||
|
(6) The operating agreement allows for MCRC to participate in operating cash flows after equity partner receives a 6.5 percent preferred return on their capital balance. Upon a capital event, the partner receives 100 percent of cash flows until receiving a 9 percent IRR. Then, 70 percent is distributed to the partner and 30 percent is distributed to MCRC until an 11 percent IRR, with excess proceeds distributed in accordance with the members’ ownership percentages.
|
|||||||||||||
|
(7) Subsequent to quarter end, the RiverPark at Harrison venture secured $30M, ten-year permanent financing. The financing fully amortized the PNC construction loan, and provided to the MCRC member ownership increase to 45% and excess financing proceeds of approximately $1.7 million.
|
|||||||||||||
|
(8) On December 28, 2012, PruRose 13 entered into an interest rate swap agreement with a commercial bank. The swap agreement fixes the all-in rate to 2.79 percent per annum for the period from July 1, 2013 to January 1, 2016.
|
|||||||||||||
|
(9) Third Party Capital includes land capital of $391,000.
|
|||||||||||||
| (10) Represents Member Loan Balance and accrued unpaid interest as of 2Q 2015. After repayment of outstanding member loans, venture distributions are subject to tiered priority land payments between MCRC and the joint venture partner as described in the operating agreement. | |||||||||||||
11
|
Operating Communities - Repositioning Details
|
|||||||||||||||||||
|
2Q 2015 Supplemental
|
|||||||||||||||||||
|
The Company defines Repositioning Communities as communities targeted for additional investment by the Company for unit and common area renovations. During repositioning it is often necessary to take apartments offline for a period of time to allow for renovations which can have a short-term impact on occupancy and operations. As of June 30, 2015, the company owned interests in six Repositioning Communities totaling 1,940 apartments.
|
|||||||||||||||||||
|
MCRC
|
Company's
|
||||||||||||||||||
|
Share of
|
Share of Cost
|
Homes
|
Acquisition
|
Post Repos.
|
Projected Schedule
|
||||||||||||||
|
Acq.
|
Purchase
|
Purchase
|
Reposition
|
MCRC
|
Incurred
|
Completed
|
Avg. Rent
|
Avg. Rent
|
Estimated
|
Estimated
|
|||||||||
|
Repositioning Communities
|
Homes
|
Date
|
Price
|
Price (1)
|
Budget
|
Participation
|
@6/30/15
|
@ 6/30/15
|
Per Home
|
Per Home
|
Start
|
Completion
|
Stabilization
|
||||||
|
Consolidated
|
|||||||||||||||||||
|
Alterra I
|
310
|
Jan 2013
|
$ 61,250
|
$ 61,250
|
$ 5,800
|
$ 5,800
|
$ 2,457
|
170
|
$ 1,414
|
$ 1,600
|
Q4 2013
|
Q4 2015
|
Q1 2016
|
||||||
|
Alterra IB
|
412
|
Apr 2013
|
87,950
|
87,950
|
3,800
|
3,800
|
1,867
|
234
|
1,499
|
1,650
|
Q4 2013
|
Q4 2015
|
Q1 2016
|
||||||
|
Richmond Court
|
82
|
Dec 2013
|
20,492
|
20,492
|
3,075
|
3,075
|
382
|
3
|
1,541
|
1,892
|
Q3 2014
|
Q3 2017
|
Q4 2017
|
||||||
|
Riverwatch Commons
|
118
|
Dec 2013
|
20,493
|
20,493
|
4,425
|
4,425
|
325
|
-
|
1,507
|
1,856
|
Q3 2014
|
Q3 2017
|
Q4 2017
|
||||||
|
Andover
|
220
|
Apr 2014
|
37,700
|
37,700
|
5,930
|
5,930
|
691
|
-
|
1,345
|
1,637
|
Q3 2014
|
Q3 2017
|
Q4 2017
|
||||||
|
Consolidated
|
1,142
|
$227,885
|
$227,885
|
$23,030
|
$23,030
|
$5,722
|
407
|
$1,450
|
$1,673
|
||||||||||
|
Participatory Joint Ventures
|
|||||||||||||||||||
|
Crystal House (2)
|
798
|
Mar 2013
|
$ 262,500
|
$ 30,210
|
$ 29,900
|
$ 7,475
|
$ 1,591
|
$ 27
|
$ 1,888
|
$ 2,282
|
Q1 2014
|
Q1 2017
|
Q2 2017
|
||||||
|
Participatory Joint Ventures
|
798
|
$262,500
|
$30,210
|
$29,900
|
$7,475
|
$1,591
|
27
|
$1,888
|
$2,282
|
||||||||||
|
Total Repositioning
|
1,940
|
$ 490,385
|
$ 258,095
|
$ 52,930
|
$ 30,505
|
$ 7,313
|
$ 434
|
$ 1,630
|
$ 1,923
|
||||||||||
|
Note: The Company projects an approximate 10% return on its incremental repositioning capital investment.
|
|||||||||||||||||||
|
(1) The balance of purchase price repositioning capital to be provided by Joint Venture partner.
|
|||||||||||||||||||
|
(2) Unit count excludes 30 apartments permanently offline for renovation.
|
|||||||||||||||||||
|
See appendix for select financial definitions.
|
|||||||||||||||||||
12
|
Appendix
|
||||||||||||||
|
2Q 2015 Supplemental
|
||||||||||||||
|
Average Revenue Per Home: Calculated as total apartment revenue for the quarter ended June 30, 2015, divided by the average percent occupied for the quarter ended June 30, 2015, divided by the number of units and divided by 3.
|
Post Repositioning Average Rent Per Home: The projected average monthly rental rate the Company expects to achieve post implementation of a repositioning plan (see Page 14).
|
|||||||||||||
|
Consolidated Operating Communities: Wholly owned communities and communities whereby the Company has a controlling interest.
|
Predevelopment Communities: Communities where the Company has commenced predevelopment activities that have a near-term projected project start.
|
|||||||||||||
|
Development Communities - Future: Represents land inventory currently owned or controlled by the Company.
|
Project Completion: As evidenced by a certificate of completion by a certified architect or issuance of a final or temporary certificate of occupancy.
|
|||||||||||||
|
In-Construction Communities: Communities that are under construction and have not yet commenced initial leasing activities.
|
Projected Stabilized NOI: Pro forma NOI for Lease-Up, In-Construction or Future Development communities upon achieving Project Stabilization.
|
|||||||||||||
|
Lease-Up Communities: Communities that have commenced initial operations but have not yet achieved Project Stabilization.
|
Project Stabilization: Lease-Up communities that have achieved over 95 Percent Leased for six consecutive weeks.
|
|||||||||||||
|
MCRC Capital: Represents cash equity that the Company has contributed or has a future obligation to contribute to a project.
|
Projected Stabilized Yield: Represents Projected Stabilized NOI divided by Total Costs.
|
|||||||||||||
|
Net Operating Income (NOI): Total property revenues less real estate taxes, utilities and operating expenses.
|
Repurposing Communities: Commercial holdings of the Company which have been targeted for re-zoning from their existing office to new multi-family use and have a likelihood of achieving desired rezoning and project approvals.
|
|||||||||||||
|
Operating Communities: Communities that have achieved Project Stabilization.
|
Subordinated Joint Ventures: Joint Venture communities where the Company's ownership distributions are subordinate to payment of priority capital preferred returns.
|
|||||||||||||
|
Participatory Joint Ventures: Joint ventures in which the Company invests capital alongside Joint Venture partners with contributions made in proportion to each member's ownership percentage.
|
Third Party Capital: Capital invested other than MCRC Capital.
|
|||||||||||||
|
Percentage Leased: The percentage of units that are either currently occupied or vacant units leased for future occupancy.
|
Total Costs: Represents full project budget, including land and developer fees, and interest expense through Project Completion.
|
|||||||||||||
13