Attached files
| file | filename |
|---|---|
| 8-K - CIRRUS LOGIC, INC. 8-K - CIRRUS LOGIC, INC. | a51146795.htm |
| EX-99.1 - EXHIBIT 99.1 - CIRRUS LOGIC, INC. | a51146795ex99_1.htm |
Exhibit 99.2
1 July 22, 2015 Letter to Shareholders Q1 FY16 FY13 CIRRUS LOGIC, INC. 800 WEST SIXTH STREET, AUSTIN, TEXAS 78701
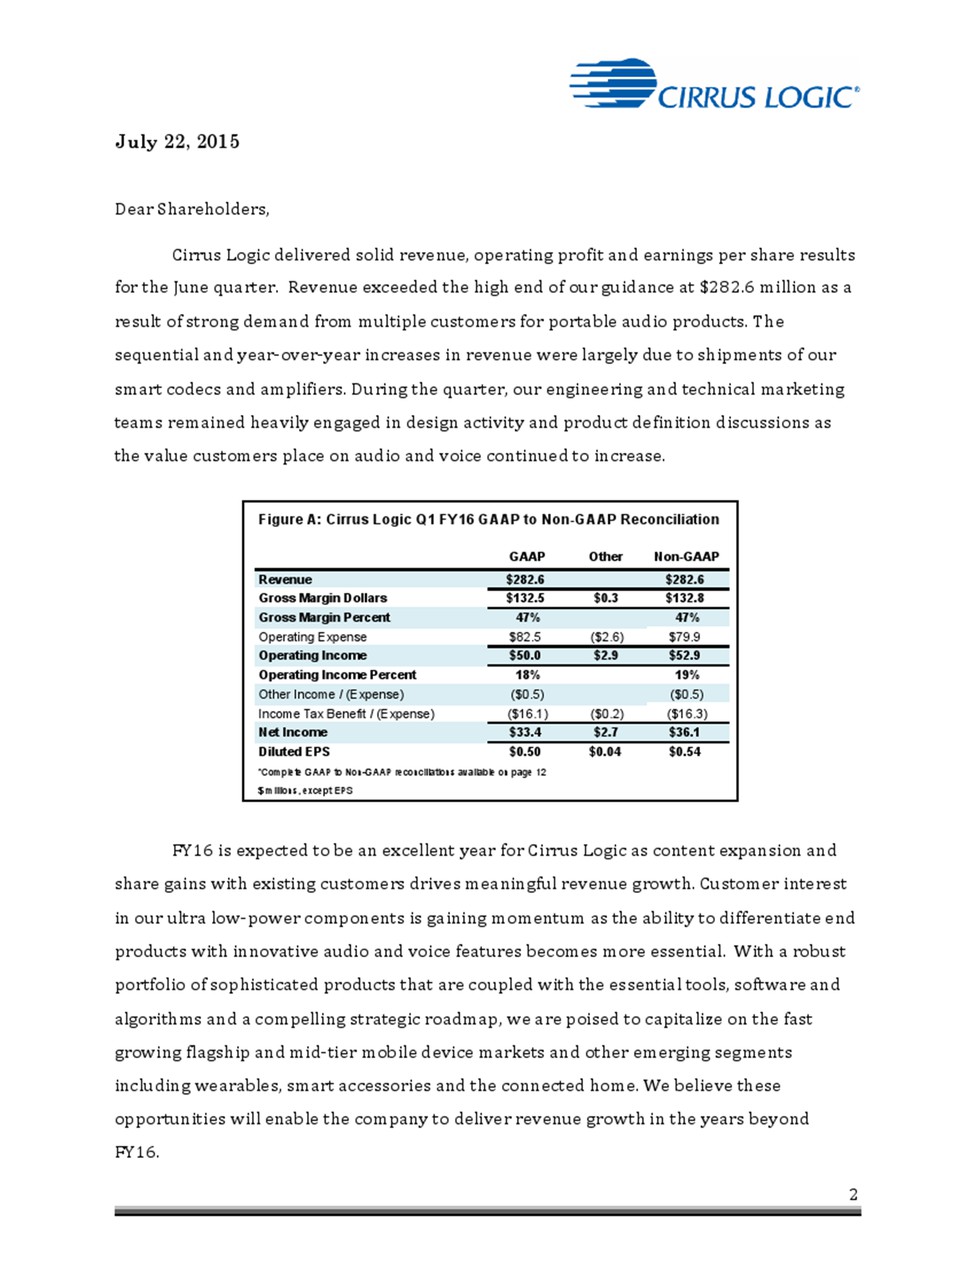
Page 2 July 22, 2015 Dear Shareholders, Cirrus Logic delivered solid revenue, operating profit and earnings per share results for the June quarter. Revenue exceeded the high end of our guidance at $282.6 million as a result of strong demand from multiple customers for portable audio products. The sequential and year-‐over-‐year increases in revenue were largely due to shipments of our smart codecs and amplifiers. During the quarter, our engineering and technical marketing teams remained heavily engaged in design activity and product definition discussions as the value customers place on audio and voice continued to increase. FY16 is expected to be an excellent year for Cirrus Logic as content expansion and share gains with existing customers drives meaningful revenue growth. Customer interest in our ultra low-‐power components is gaining momentum as the ability to differentiate end products with innovative audio and voice features becomes more essential. With a robust portfolio of sophisticated products that are coupled with the essential tools, software and algorithms and a compelling strategic roadmap, we are poised to capitalize on the fast growing flagship and mid-‐tier mobile device markets and other emerging segments including wearables, smart accessories and the connected home. We believe these opportunities will enable the company to deliver revenue growth in the years beyond FY16. 2
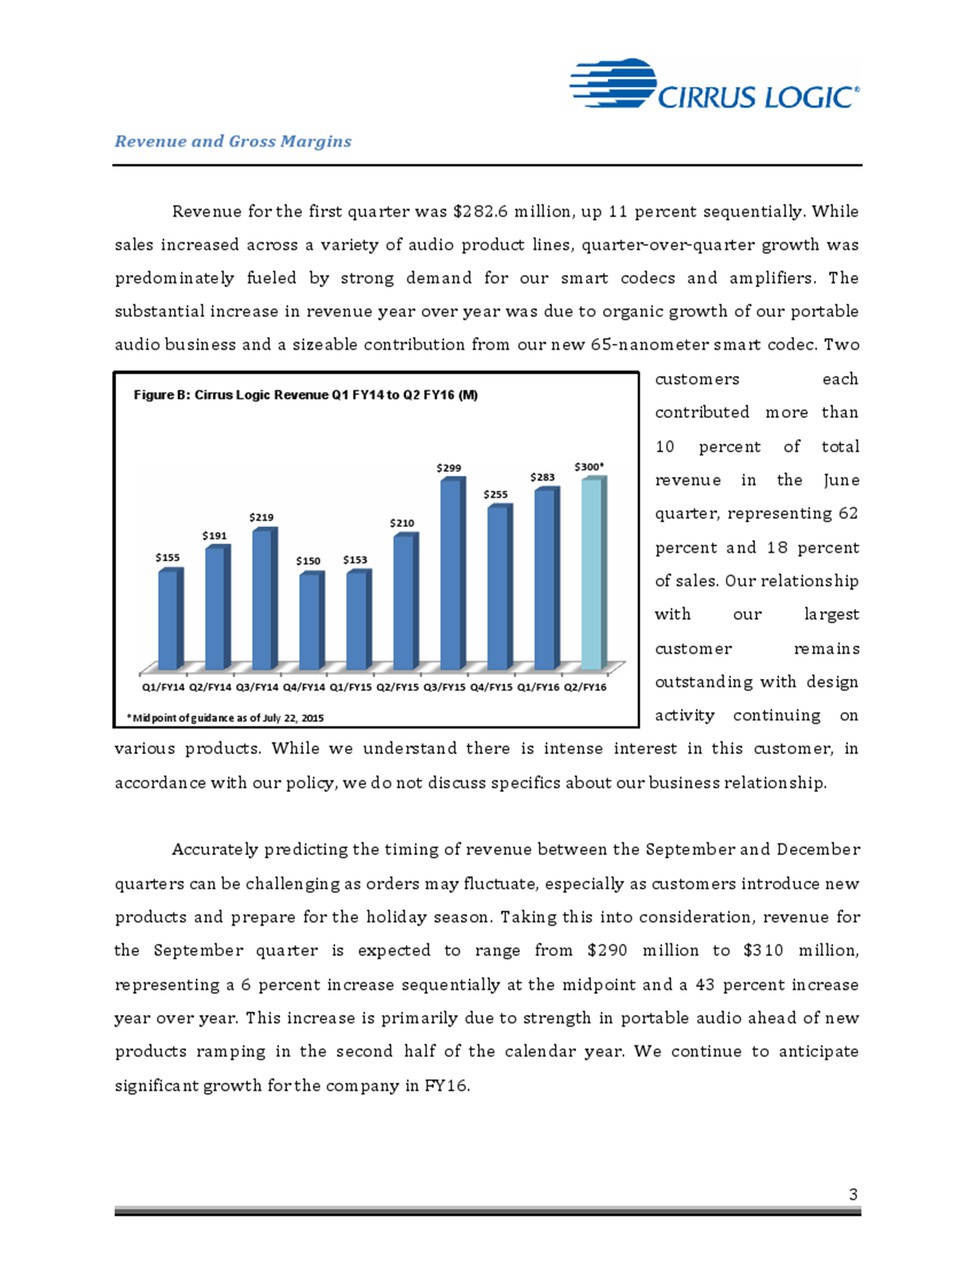
3 Revenue and Gross Margins Revenue for the first quarter was $282.6 million, up 11 percent sequentially. While sales increased across a variety of audio product lines, quarter--‐over--‐quarter growth was predominately fueled by strong demand for our smart codecs and amplifiers. The substantial increase in revenue year over year was due to organic growth of our portable audio business and a sizeable contribution from our new 65--‐nanometer smart codec. Two customers each contributed more than 10 percent of total revenue in the June quarter, representing 62 percent and 18 percent of sales. Our relationship with our largest customer remains outstanding with design activity continuing on various products. While we understand there is intense interest in this customer, in accordance with our policy, we do not discuss specifics about our business relationship. Accurately predicting the timing of revenue between the September and December quarters can be challenging as orders may fluctuate, especially as customers introduce new products and prepare for the holiday season. Taking this into consideration, revenue for the September quarter is expected to range from $290 million to $310 million, representing a 6 percent increase sequentially at the midpoint and a 43 percent increase year over year. This increase is primarily due to strength in portable audio ahead of new products ramping in the second half of the calendar year. We continue to anticipate significant growth for the company in FY16. Q1/FY14'Q2/FY14'Q3/FY14'Q4/FY14'Q1/FY15'Q2/FY15'Q3/FY15'Q4/FY15'Q1/FY16'Q2/FY16' $155'' $191'' $219'' $150'' $153'' $210'' $299'' $255' $283'' $300*' *Midpoint of guidance as of July 22, 2015 Figure B: Cirrus Logic Revenue Q1 FY14 to Q2 FY16 (M)
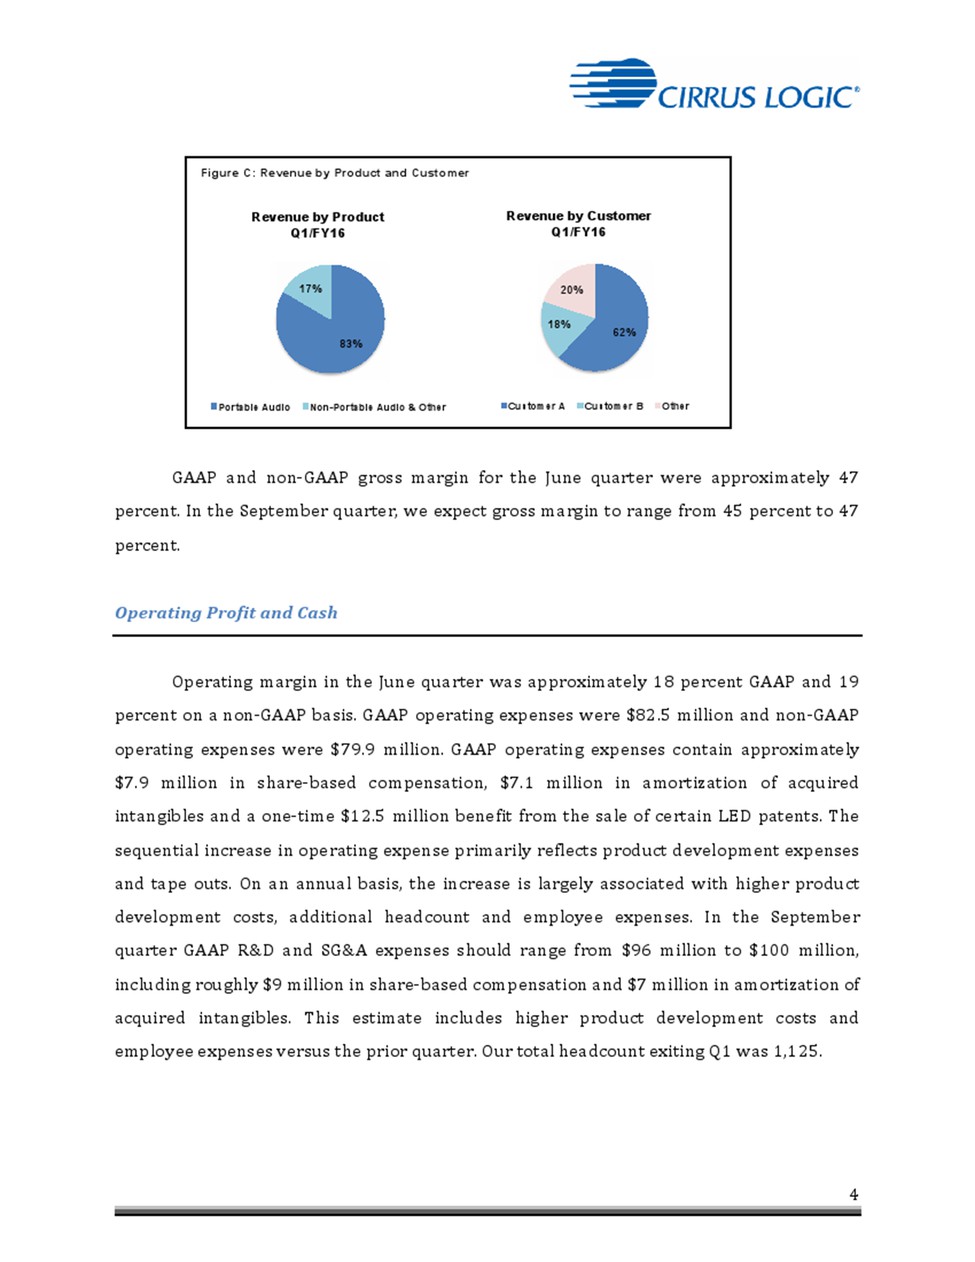
4 GAAP and non--‐GAAP gross margin for the June quarter were approximately 47 percent. In the September quarter, we expect gross margin to range from 45 percent to 47 percent. Operating Profit and Cash Operating margin in the June quarter was approximately 18 percent GAAP and 19 percent on a non--‐GAAP basis. GAAP operating expenses were $82.5 million and non--‐GAAP operating expenses were $79.9 million. GAAP operating expenses contain approximately $7.9 million in share--‐based compensation, $7.1 million in amortization of acquired intangibles and a one--‐time $12.5 million benefit from the sale of certain LED patents. The sequential increase in operating expense primarily reflects product development expenses and tape outs. On an annual basis, the increase is largely associated with higher product development costs, additional headcount and employee expenses. In the September quarter GAAP R&D and SG&A expenses should range from $96 million to $100 million, including roughly $9 million in share--‐based compensation and $7 million in amortization of acquired intangibles. This estimate includes higher product development costs and employee expenses versus the prior quarter. Our total headcount exiting Q1 was 1,125. Figure C: Revenue by Product and Customer 62% 18% 20% Revenue by Customer Q1/FY16 Customer A Customer B Other 83% 17% Revenue by Product Q1/FY16 Portable Audio Non-Portable Audio & Other
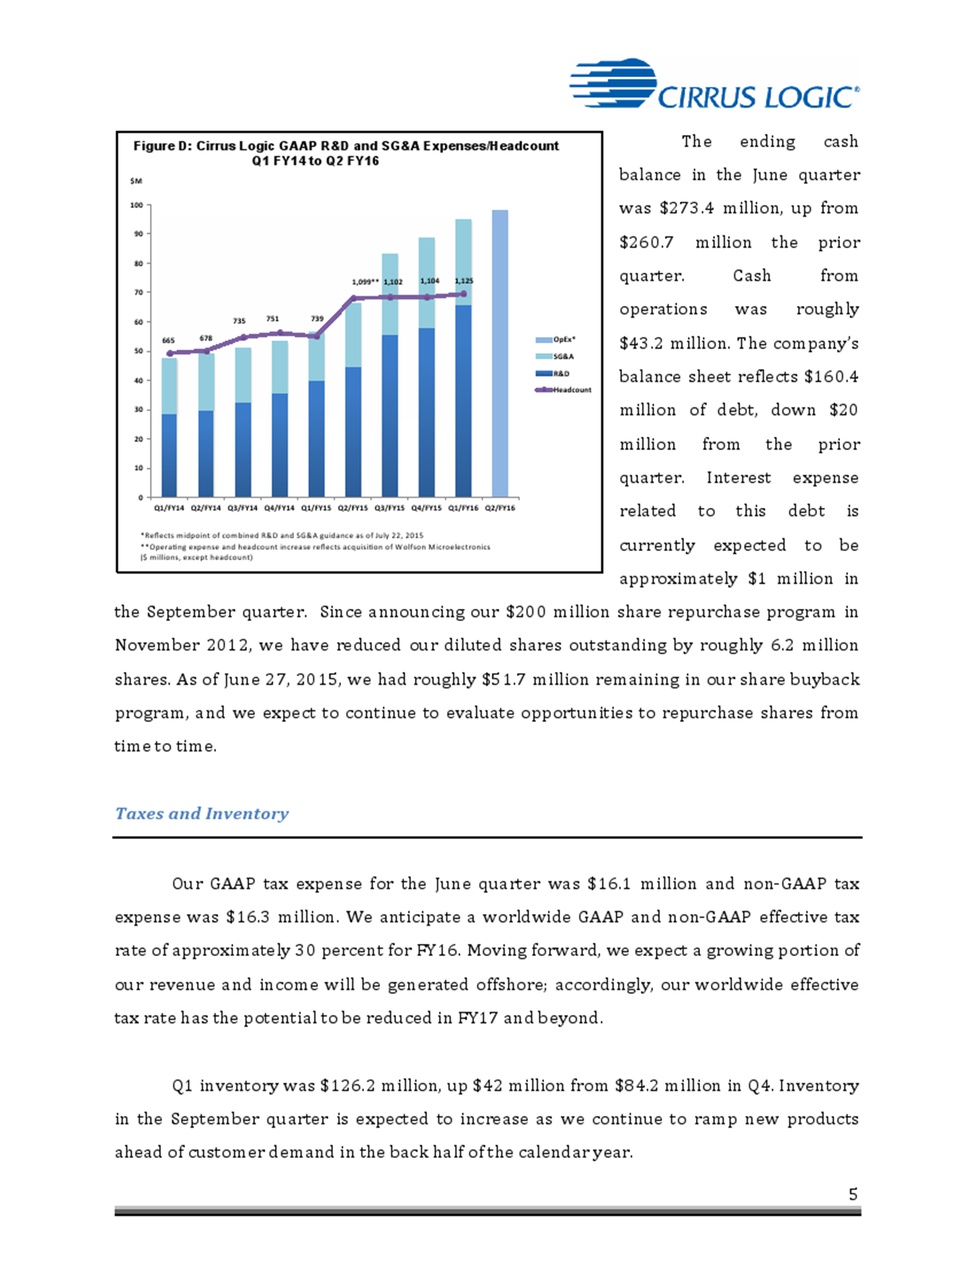
5 The ending cash balance in the June quarter was $273.4 million, up from $260.7 million the prior quarter. Cash from operations was roughly $43.2 million. The company’s balance sheet reflects $160.4 million of debt, down $20 million from the prior quarter. Interest expense related to this debt is currently expected to be approximately $1 million in the September quarter. Since announcing our $200 million share repurchase program in November 2012, we have reduced our diluted shares outstanding by roughly 6.2 million shares. As of June 27, 2015, we had roughly $51.7 million remaining in our share buyback program, and we expect to continue to evaluate opportunities to repurchase shares from time to time. Taxes and Inventory Our GAAP tax expense for the June quarter was $16.1 million and non-‐GAAP tax expense was $16.3 million. We anticipate a worldwide GAAP and non-‐GAAP effective tax rate of approximately 30 percent for FY16. Moving forward, we expect a growing portion of our revenue and income will be generated offshore; accordingly, our worldwide effective tax rate has the potential to be reduced in FY17 and beyond. Q1 inventory was $126.2 million, up $42 million from $84.2 million in Q4. Inventory in the September quarter is expected to increase as we continue to ramp new products ahead of customer demand in the back half of the calendar year. Figure D: Cirrus Logic GAAP R&D and SG&A Expenses/Headcount Q1 FY14 to Q2 FY16 $M# 665# 678# 735# 751# 739# 1,099**# 1,102# 1,104# 1,125# 0# 10# 20# 30# 40# 50# 60# 70# 80# 90# 100# Q1/FY14# Q2/FY14# Q3/FY14# Q4/FY14# Q1/FY15# Q2/FY15# Q3/FY15# Q4/FY15# Q1/FY16# Q2/FY16# OpEx*# SG&A# R&D# Headcount# ! *Reflects!midpoint!of!combined!R&D!and!SG&A!guidance!as!of!July!22,!2015! **OperaCng!expense!and!headcount!increase!reflects!acquisiCon!of!Wolfson!Microelectronics! ($!millions,!except!headcount)!
6 Company Strategy As a leading supplier of a complete end-‐to-‐end audio solution that includes smart codecs, boosted amplifiers with speaker protection and microphones, Cirrus Logic is capitalizing on the rapidly expanding audio and voice market. We are delighted with the progress we have made in the past six months. While this market is still in the early stages of development, content increases with our new smart codecs as well as substantial share gains with existing customers are expected to fuel significant revenue growth in FY16. Earlier this year we successfully began shipping a new 65-‐nanometer smart codec in volume and we are on track to ramp our new 55-‐nanometer smart codec in the second half of the calendar year. More importantly, as a key enabler of audio and voice technology, our strategy and robust product roadmap have positioned the company for sustained growth in FY17. Our first priority is to further strengthen our relationships with our existing customers and increase content, including cross-‐selling boosted amplifiers, smart codecs and ultimately microphones. Secondly, building on this momentum, we are working to expand our market share in smartphone OEMs three through ten, while driving a subset of the audio and voice features in flagship devices into the mid-‐tier. Longer term, our strategy is to leverage the technology we have developed for mobile devices into adjacent markets including wearables, smart accessories, the connected home and automotive. Cirrus Logic introduced its first boosted amplifier in 2012 and has shipped over 750 million units in the past three years, making it one of our most successful product lines. Although this market remains highly competitive, we plan to continue to heavily invest in product development as we view amplifiers as a crucial component in the audio signal chain – and one that has a natural synergy with our smart codecs. OEM’s increasingly view amplifiers as a key differentiator for mobile devices. The ability to provide louder sound with less distortion can vastly improve the user experience when consuming multimedia content or making calls on speakerphones. We believe our ability to offer best-‐in-‐class amplifiers, which include speaker protection/enhancement software, with our smart codecs and MEMS microphones is a meaningful competitive advantage. Our solutions optimize performance at very low power levels and simplify our customers’ design process.
7 With a strong portfolio of components on the market today and an innovative product roadmap, we expect our amplifier business to continue to grow as we cross-‐sell into existing customers and gain traction with smartphone OEMs three through ten. Over the next few years there are several opportunities that we anticipate will contribute to the diversification of our customer base and revenue growth beyond FY16. We are working to further increase content with our top smartphone customers, while our team is pushing to expand our foothold in OEMs three through ten and to drive a subset of flagship features into mid-‐tier devices. We are very encouraged by the progress we have made with these initiatives. We are particularly excited to be ramping a smart codec over the next two quarters in another top Android smartphone OEM. This win validates our vision of the audio and voice market and our business model of focusing on strategic customers where we can leverage our relationships to grow content. In the case of mid-‐tier handsets, we are actively engaged in discussions with customers regarding the features, functionality and price points that meet the technical specifications and challenges of this market. We are sampling our first smart codec targeting mid-‐tier devices and the initial feedback from customers has been positive. In the near-‐to-‐mid term, the opportunities with many of the other top OEMs will be more opportunistic and largely associated with augmenting existing platforms through the sale of amplifiers and converters. In the coming years, we believe that the leaders in the Android handset market will continue to push the envelope with audio and voice acting as a catalyst for broad-‐market adoption of the functions we enable, such as Always-‐on Voice. As consumers begin to view these features as “must have,” flagship and mid-‐tier smartphones without these functions will be at a considerable disadvantage in the marketplace. As a key supplier of this disruptive technology we help smartphone manufacturers meaningfully differentiate the audio and voice experience on mobile devices. Cirrus Logic is well placed to benefit from this expanding market as OEMs adopt these features across a wider range of devices. The introduction of voice as an alternative user interface is transforming mobile devices and driving these solutions into emerging products such as wearables, smart accessories and the connected home. While these markets will take time to mature, we
8 believe voice control will be a critical component. We have already seen many leading OEMs begin to target these areas with products that range from networking the home to new devices capable of managing your home environment and tracking health statistics. As these markets evolve Cirrus Logic is in a unique position to leverage the hardware and software technology we have developed for mobile applications as well our deep-‐rooted relationships with many of the industry leaders. With an outstanding portfolio of products on the market today and an innovative roadmap that targets the rapidly growing audio and voice market, we are very confident in our future success. Summary and Guidance For the September quarter we expect the following results: • Revenue to range between $290 million and $310 million; • GAAP gross margin to be between 45 percent and 47 percent; and • Combined GAAP R&D and SG&A expenses to range between $96 million and $100 million, including approximately $9 million in share-‐based compensation expense and $7 million in amortization of acquired intangibles. In summary, Q1 was another great quarter for Cirrus Logic. We are extremely pleased with our financial results as strong demand for our smart codecs and amplifiers drove revenue above the high end of our guidance. With a comprehensive portfolio of products, a compelling strategic roadmap and outstanding customers, we are excited about our outlook for growth in FY16 and FY17. Sincerely,
9 Jason Rhode Thurman Case President and Chief Executive Officer Chief Financial Officer Conference Call Q&A Session Cirrus Logic will host a live Q&A session at 5 p.m. EDT today to answer questions related to its financial results and business outlook. Participants may listen to the conference call on the Cirrus Logic website. Participants who would like to submit a question to be addressed during the call are requested to email investor.relations@cirrus.com. A replay of the webcast can be accessed on the Cirrus Logic website approximately two hours following its completion, or by calling (404) 537-‐3406, or toll-‐free at (855) 859-‐ 2056 (Access Code: 75505782). Use of Non-‐GAAP Financial Information To supplement Cirrus Logic's financial statements presented on a GAAP basis, Cirrus has provided non-‐ GAAP financial information, including gross margins, operating expenses, net income, operating profit and income, effective tax rate and diluted earnings per share. A reconciliation of the adjustments to GAAP results is included in the tables below. Non-‐GAAP financial information is not meant as a substitute for GAAP results, but is included because management believes such information is useful to our investors for informational and comparative purposes. In addition, certain non-‐GAAP financial information is used internally by management to evaluate and manage the company. The non-‐GAAP financial information used by Cirrus Logic may differ from that used by other companies. These non-‐ GAAP measures should be considered in addition to, and not as a substitute for, the results prepared in accordance with GAAP. Safe Harbor Statement Except for historical information contained herein, the matters set forth in this news release contain forward-‐looking statements, including expectations for growth and product ramps in the second quarter and fiscal year 2016 and beyond, and our estimates of second quarter fiscal year 2016 revenue, gross margin, combined research and development and selling, general and administrative
10 expense levels, share-‐based compensation expense and amortization of acquired intangibles. In some cases, forward-‐looking statements are identified by words such as “expect,” “anticipate,” “target,” “project,” “believe,” “goals,” “opportunity,” “estimates,” “intend,” and variations of these types of words and similar expressions. In addition, any statements that refer to our plans, expectations, strategies or other characterizations of future events or circumstances are forward-‐looking statements. These forward-‐looking statements are based on our current expectations, estimates and assumptions and are subject to certain risks and uncertainties that could cause actual results to differ materially. These risks and uncertainties include, but are not limited to, the following: the level of orders and shipments during the second quarter of fiscal year 2016, as well as customer cancellations of orders, or the failure to place orders consistent with forecasts; and the risk factors listed in our Form 10-‐K for the year ended March 28, 2015, and in our other filings with the Securities and Exchange Commission, which are available at www.sec.gov. The foregoing information concerning our business outlook represents our outlook as of the date of this news release, and we undertake no obligation to update or revise any forward-‐looking statements, whether as a result of new developments or otherwise. Summary financial data follows:
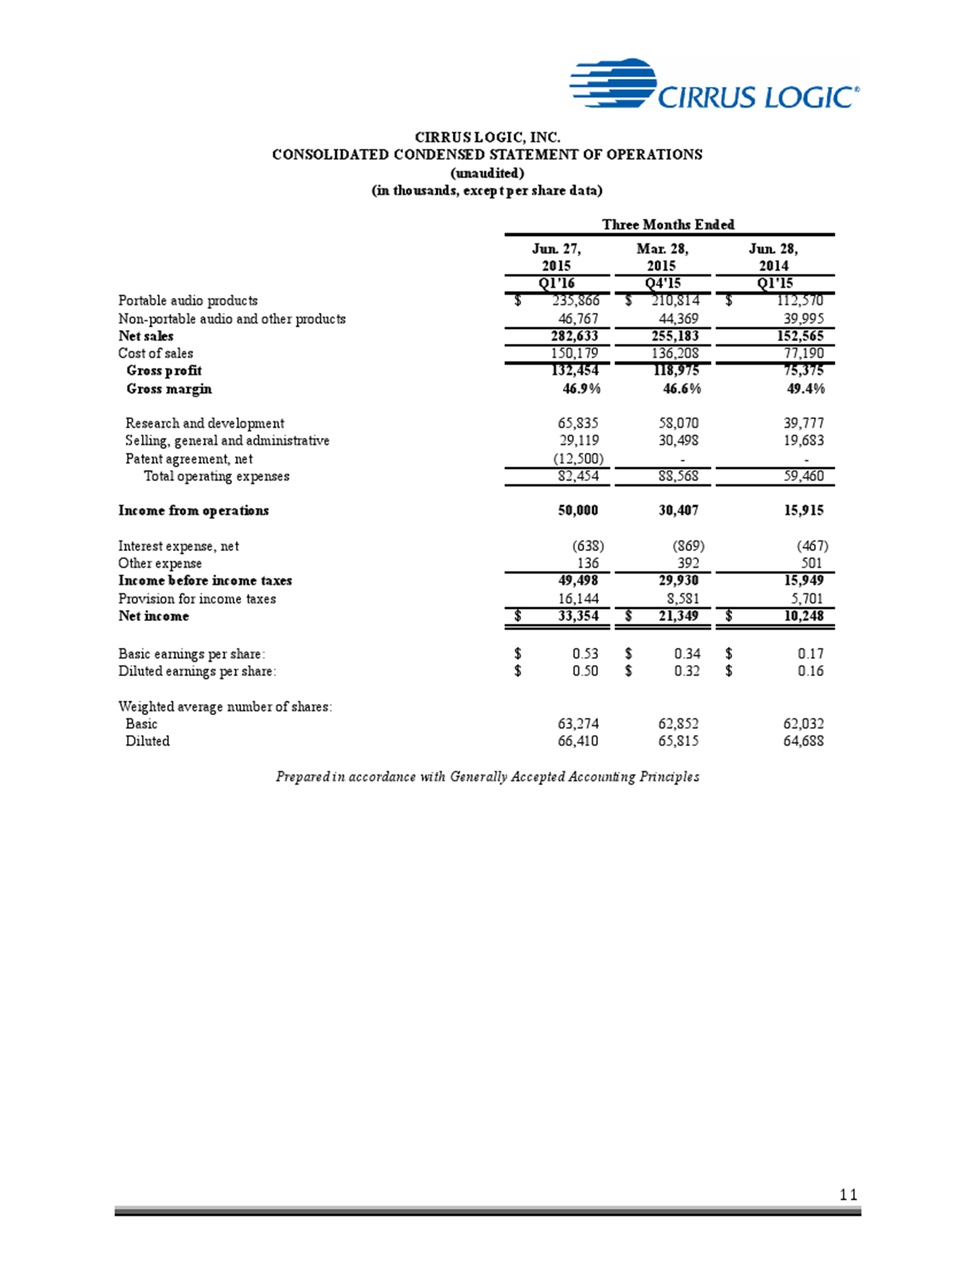
11 Jun. 27, Mar. 28, Jun. 28, 2015 2015 2014 Q1'16 Q4'15 Q1'15 Portable audio products $ 235,866 $ 210,814 $ 112,570 Non-portable audio and other products 46,767 44,369 39,995 CIRRUS LOGIC, INC. CONSOLIDATED CONDENSED STATEMENT OF OPERATIONS (unaudited) (in thousands, except per share data) Three Months Ended Net sales 282,633 255,183 152,565 Cost of sales 150,179 136,208 77,190 Gross profit 132,454 118,975 75,375 Gross margin 46.9% 46.6% 49.4% Research and development 65,835 58,070 39,777 Selling, general and administrative 29,119 30,498 19,683 Patent agreement, net (12,500) - - Total operating expenses 82,454 88,568 59,460 Income from operations 50,000 30,407 15,915 Interest expense, net (638) (869) (467) Other expense 136 392 501 Income before income taxes 49,498 29,930 15,949 Provision for income taxes 16,144 8,581 5,701 Net income $ 33,354 $ 21,349 $ 10,248 Basic earnings per share: $ 0.53 $ 0.34 $ 0.17 Diluted earnings per share: $ 0.50 $ 0.32 $ 0.16 Weighted average number of shares: Basic 63,274 62,852 62,032 Diluted 66,410 65,815 64,688 Prepared in accordance with Generally Accepted Accounting Principles
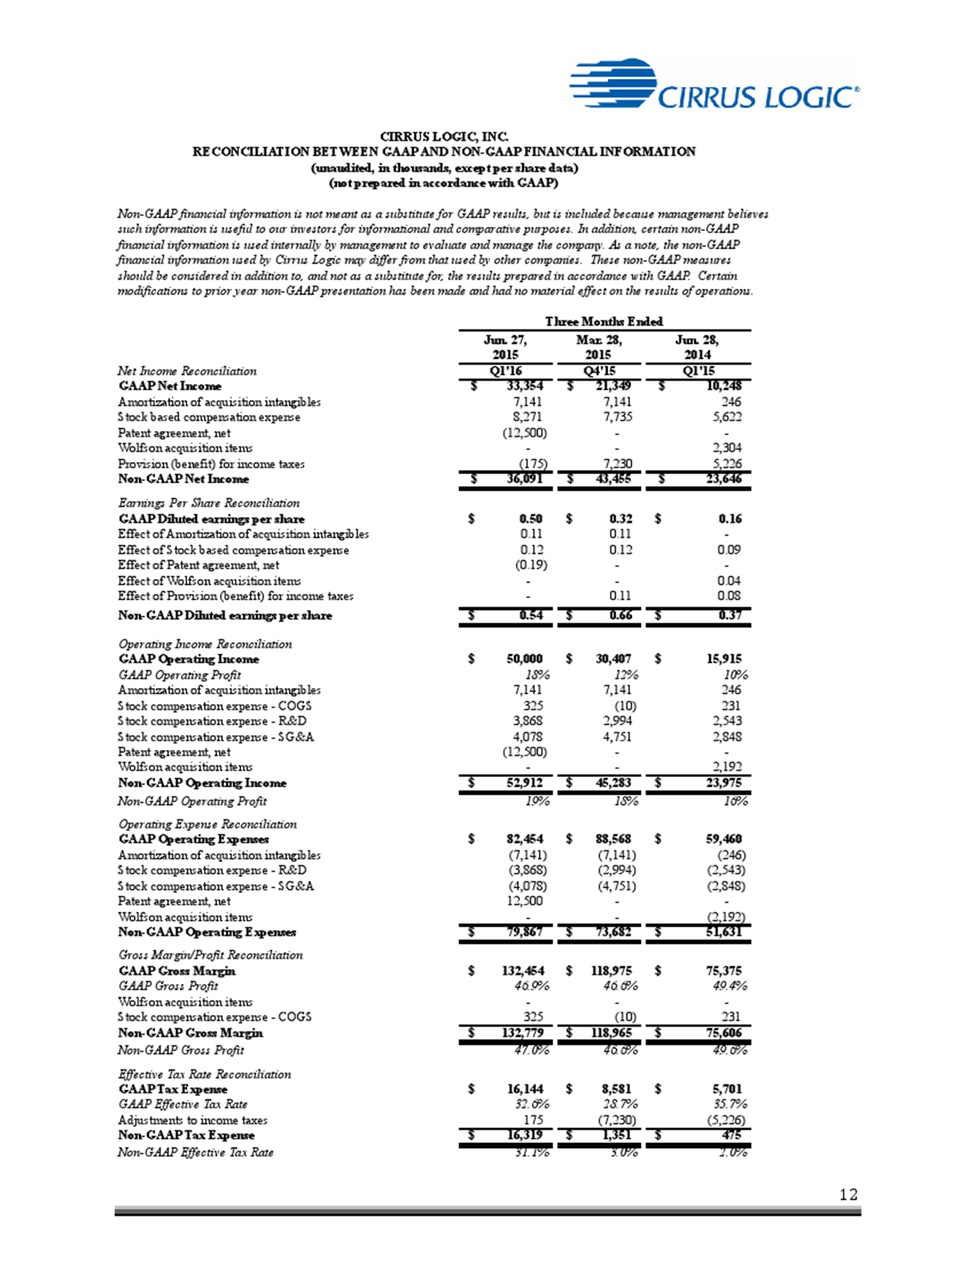
12 Jun. 27, Mar. 28, Jun. 28, 2015 2015 2014 Net Income Reconciliation Q1'16 Q4'15 Q1'15 GAAP Net Income $ 33,354 $ 21,349 $ 10,248 Amortization of acquisition intangibles 7,141 7,141 246 Stock based compensation expense 8,271 7,735 5,622 Non-GAAP financial information is not meant as a substitute for GAAP results, but is included because management believes such information is useful to our investors for informational and comparative purposes. In addition, certain non-GAAP financial information is used internally by management to evaluate and manage the company. As a note, the non-GAAP financial information used by Cirrus Logic may differ from that used by other companies. These non-GAAP measures should be considered in addition to, and not as a substitute for, the results prepared in accordance with GAAP. Certain modifications to prior year non-GAAP presentation has been made and had no material effect on the results of operations. Three Months Ended (not prepared in accordance with GAAP) CIRRUS LOGIC, INC. RECONCILIATION BETWEEN GAAP AND NON-GAAP FINANCIAL INFORMATION (unaudited, in thousands, except per share data) Patent agreement, net (12,500) - - Wolfson acquisition items - - 2,304 Provision (benefit) for income taxes (175) 7,230 5,226 Non-GAAP Net Income $ 36,091 $ 43,455 $ 23,646 Earnings Per Share Reconciliation GAAP Diluted earnings per share $ 0.50 $ 0.32 $ 0.16 Effect of Amortization of acquisition intangibles 0.11 0.11 - Effect of Stock based compensation expense 0.12 0.12 0.09 Effect of Patent agreement, net (0.19) - - Effect of Wolfson acquisition items - - 0.04 Effect of Provision (benefit) for income taxes - 0.11 0.08 Non-GAAP Diluted earnings per share $ 0.54 $ 0.66 $ 0.37 Operating Income Reconciliation GAAP Operating Income $ 50,000 $ 30,407 $ 15,915 GAAP Operating Profit 18% 12% 10% Amortization of acquisition intangibles 7,141 7,141 246 Stock compensation expense - COGS 325 (10) 231 Stock compensation expense - R&D 3,868 2,994 2,543 Stock compensation expense - SG&A 4,078 4,751 2,848 Patent agreement, net (12,500) - - Wolfson acquisition items - - 2,192 Non-GAAP Operating Income $ 52,912 $ 45,283 $ 23,975 Non-GAAP Operating Profit 19% 18% 16% Operating Expense Reconciliation GAAP Operating Expenses $ 82,454 $ 88,568 $ 59,460 Amortization of acquisition intangibles (7,141) (7,141) (246) Stock compensation expense - R&D (3,868) (2,994) (2,543) Stock compensation expense - SG&A (4,078) (4,751) (2,848) Patent agreement, net 12,500 - - Wolfson acquisition items - - (2,192) Non-GAAP Operating Expenses $ 79,867 $ 73,682 $ 51,631 Gross Margin/Profit Reconciliation GAAP Gross Margin $ 132,454 $ 118,975 $ 75,375 GAAP Gross Profit 46.9% 46.6% 49.4% Wolfson acquisition items - - - Stock compensation expense - COGS 325 (10) 231 Non-GAAP Gross Margin $ 132,779 $ 118,965 $ 75,606 Non-GAAP Gross Profit 47.0% 46.6% 49.6% Effective Tax Rate Reconciliation GAAP Tax Expense $ 16,144 $ 8,581 $ 5,701 GAAP Effective Tax Rate 32.6% 28.7% 35.7% Adjustments to income taxes 175 (7,230) (5,226) Non-GAAP Tax Expense $ 16,319 $ 1,351 $ 475 Non-GAAP Effective Tax Rate 31.1% 3.0% 2.0%
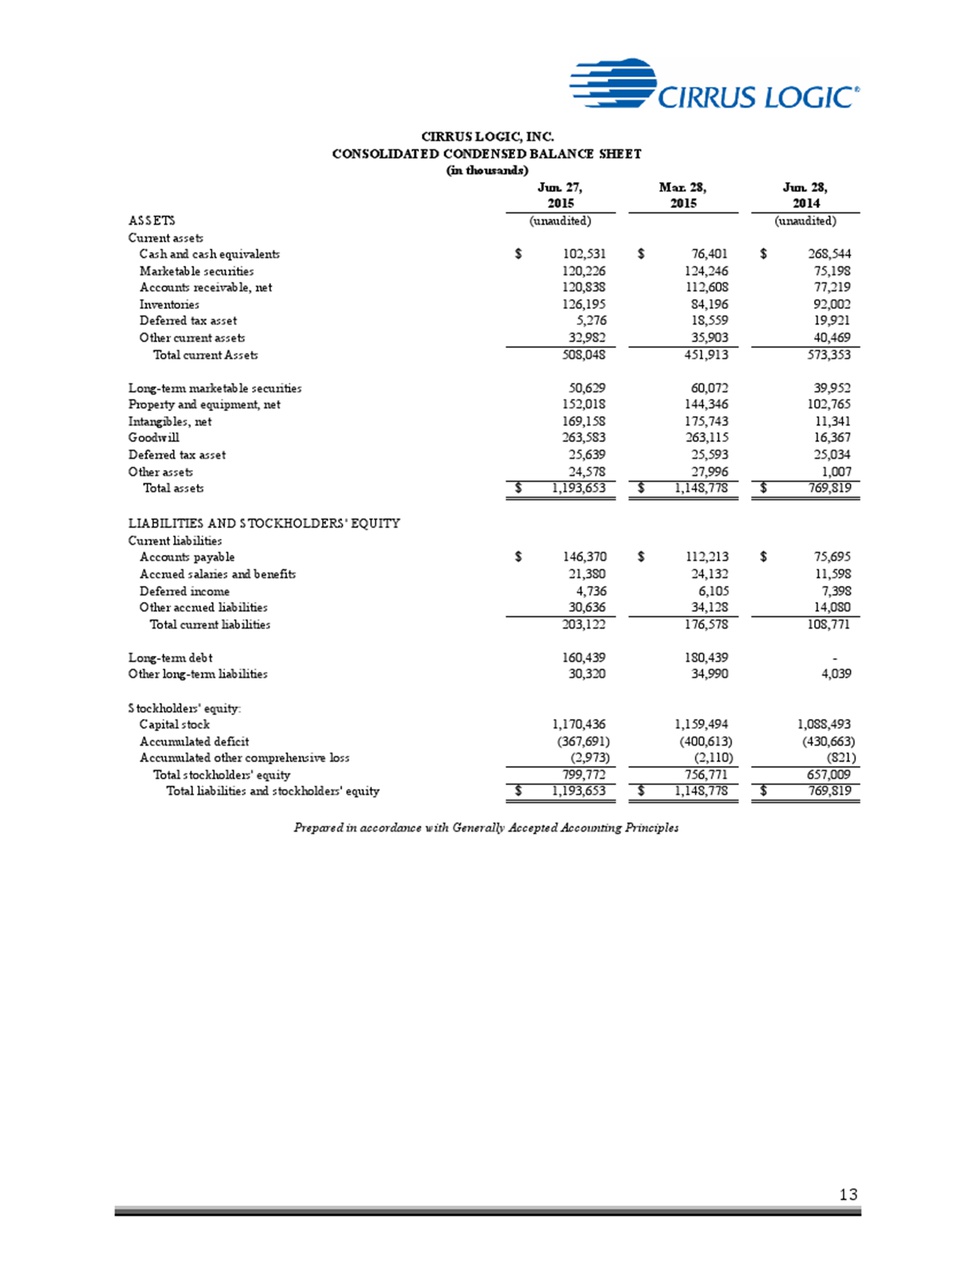
13 CIRRUS LOGIC, INC. CONSOLIDATED CONDENSED BALANCE SHEET Jun. 27, Mar. 28, Jun. 28, 2015 2015 2014 (in thousands) ASSETS (unaudited) (unaudited) Current assets Cash and cash equivalents $ 102,531 $ 76,401 $ 268,544 Marketable securities 120,226 124,246 75,198 Accounts receivable, net 120,838 112,608 77,219 Inventories 126,195 84,196 92,002 Deferred tax asset 5,276 18,559 19,921 Other current assets 32,982 35,903 40,469 Total current Assets 508,048 451,913 573,353 Long-term marketable securities 50,629 60,072 39,952 Property and equipment, net 152,018 144,346 102,765 Intangibles, net 169,158 175,743 11,341 Goodwill 263,583 263,115 16,367 Deferred tax asset 25,639 25,593 25,034 Other assets 24,578 27,996 1,007 Total assets $ 1,193,653 $ 1,148,778 $ 769,819 LIABILITIES AND STOCKHOLDERS' EQUITY Current liabilities Accounts payable $ 146,370 $ 112,213 $ 75,695 Accrued salaries and benefits 21,380 24,132 11,598 Deferred income 4,736 6,105 7,398 Other accrued liabilities 30,636 34,128 14,080 Total current liabilities 203,122 176,578 108,771 Long-term debt 160,439 180,439 - Other long-term liabilities 30,320 34,990 4,039 Stockholders' equity: Capital stock 1,170,436 1,159,494 1,088,493 Accumulated deficit (367,691) (400,613) (430,663) Accumulated other comprehensive loss (2,973) (2,110) (821) Total stockholders' equity 799,772 756,771 657,009 Total liabilities and stockholders' equity $ 1,193,653 $ 1,148,778 $ 769,819 Prepared in accordance with Generally Accepted Accounting Principles