Attached files
| file | filename |
|---|---|
| 8-K - CHINA FUND INC | fp0015176_8k.htm |

Data as of 6/30/15
Manager's Commentary
Market Review
Following the very strong performance from Chinese equities in the first half of 2015, the last few weeks have seen a higher level of volatility and significant market weakness. The Shanghai Composite Index fell 6.9%, in RMB terms, in June. However, this figure does not represent the overall intra-month volatility. The Index fell 13.2% and 6.3%, in the third and fourth weeks of June, respectively. We believe this recent weakness in the equity market was driven mainly by technical factors, such as the deterioration of investor sentiment over A-share liquidity evident from falling daily turnover. More specifically, investors began to unwind their margin trades, hurting growth names and leading to increased rates of margin calls.
Towards the end of the month, the People's Bank of China (PBoC) provided some downside support with further monetary easing. The PBoC cut the one year lending and one year deposit rate by 0.25% and the reserve requirement ratio (RRR) by 0.5%, for banks who lend to small and agricultural businesses. On the macro front, the June HSBC Purchasing Managers' Index (PMI) showed manufacturing contraction was greater than the market had previously believed, increasing by 0.2 to 49.4. This is the fourth consecutive month that the PMI has been in the contractionary zone.
Although activity in the onshore Chinese equity markets impacts Hong Kong, the Hong Kong market was less vulnerable to market volatility as it is less reliant on margin financing. For example, the Hang Seng Index fell by 6.1% at its peak; in comparison to the Shanghai Composite Index which fell by 21.5% (in local terms). The Taiwan stock market was on a downward trend at the beginning of the month, but then moved sideways, generally avoiding the volatility that has characterised the Chinese and Hong Kong stock markets over the past month.
Fund Review
The China Fund, Inc. (the "Fund”) underperformed the MSCI Golden Dragon Index (the "benchmark index”) for the month of June. The underperformance was primarily driven by stock selection in the information technology sector, which was partly offset by stock selection in the consumer discretionary sector.
Among our top contributors was Largan Precision Company, a lens manufacturer based in Taiwan. Largan's stock price was strong due to increased estimated revenue, as a result of better-than-expected demand for the iPhone and the beginnings of a recovery in the Chinese smartphone market. Largan's strong fundamentals, dominant market position and strong management also aided its stock price. Conversely, Digital China, our top contributor from May, was the top detractor for June. The stock price fell from the end of May through June, upon the news that a major shareholder was selling 60m shares for a price below the mid-point of a marketed range. The price continued to fall when the company announced that a subsidiary of Digital China had been falsely accused of defaulting in payments for procurement contracts. We believe the case for long term investment remains intact and continue to hold the stock.
Key Transactions
During June, we initiated a position in Hengan International Group amid expectations that sales in the second half of 2015 would increase, due to the emergence of a new growth driver for ultra-light diapers. Within the pharmaceutical sector, we initiated a position in 3S Bio Inc. and switched out of Jiangsu Hengrui. 3SBio was relisted in Hong Kong, after delisting from the Nasdaq in 2013. The Fund's position in Gree Electric increased due to improved industry pricing and demand, especially for air conditioning units over the summer.
Outlook
Our position is to look through the short term noise and focus on the long term fundamentals in China. The recent China A-share market weakness is driven mainly by technical factors, such as the unwinding of margin positions. At some point this technical weakness will end, and create a healthier entry point for investors. We are focused on Hong Kong listed Chinese stocks, which in our view, offer more attractive valuations and are less vulnerable to market sentiment. Within our China A-share exposure, we have been taking profits in May and June. At the end of June we have around 11% allocated to China A-shares.
There are three key reasons we remain positive on China over the long term. Firstly, we see an important reform process underway, which we believe, will lead to a higher quality of growth, driven by domestic consumption. The process is likely to be long and gradual, and may lead to a slower headline GDP growth rate. However, a slower growth rate is more sustainable and a necessary outcome. Secondly, amid the economic weakness, we expect to see further monetary policy easing from Beijing. China remains one of the few major economies with positive real interest rates and a high RRR, which allows more room for policy support. Finally, further financial reforms underpin the inclusion of China A-shares into the global equity benchmark. We believe China will soon become too big to ignore for global asset allocators, and H-shares will be the preferred market to gain Chinese exposure.
In Brief
Fund Data
|
Description
|
Seeks to achieve long-term capital appreciation through investments in China companies.
|
|
Listing Date (NYSE)
|
July 10, 1992
|
|
Total Fund Assets (millions)
|
$367.6
|
|
Median Market Cap (in billions)
|
$7.0
|
|
Distribution Frequency
|
Annual
|
|
Management Firm
|
Allianz Global Investors U.S. LLC
|
|
Portfolio Management
|
Christina Chung, CFA Lead Portfolio Manager
|
|
Performance (US$ Returns) (as of 6/30/15)
|
Fund | Benchmark1 |
|
One Month
|
-7.53%
|
-4.24% |
|
Three Month
|
6.50%
|
4.66% |
|
One Year
|
18.12%
|
15.61% |
|
Three Year
|
16.60%
|
14.74% |
|
Net Asset Value / Market Price
|
|
|
Net Asset Value (NAV) / Market Price at Inception
|
$13.15 / $14.26 |
|
NAV / Market Price (as of 6/30/15)
|
$23.44 / $19.87
|
|
High / Low Ranges (52-Week)
|
|
|
High / Low NAV
|
$26.04 / $19.82
|
|
High / Low Market Price
|
$22.46 / $17.64 |
|
Premium/Discount to NAV (as of 6/30/15)
|
-15.23% |
|
Fund Data (Common Shares)
|
|
|
Shares Outstanding
|
15,682,028
|
|
Average Daily Volume
|
45,502 |
|
Expense Ratio
|
1.30%
|
1. MSCI Golden Dragon Index.
Fund Manager

Christina Chung, CFA
Lead Portfolio Manager

The China Fund, Inc.
Investment Objective
The investment objective of the Fund is to achieve long-term capital appreciation. The Fund seeks to achieve its objective through investment in the equity securities of companies and other entities with significant assets, investments, production activities, trading or other business interests in China or which derive a significant part of their revenue from China.
The Fund has an operating policy that the Fund will invest at least 80% of its assets in China companies. For this purpose, 'China companies' are (i) companies for which the principal securities trading market is in China; (ii) companies for which the principal securities trading market is outside of China or in companies organized outside of China, that in both cases derive at least 50% of their revenues from goods or services sold or produced, or have a least 50% of their assets in China; or (iii) companies organized in China. Under the policy, China means the People's Republic of China, including Hong Kong, and Taiwan. The Fund will provide its stockholders with at least 60 days' prior notice of any change to this policy.
|
Average Annual Returns
|
||||||||
|
1 Month
|
3 Month
|
YTD
|
1 Year
|
3 Year
|
5 Year
|
10 Year
|
Inception | |
|
NAV
|
-7.53%
|
6.50%
|
13.40%
|
18.12%
|
16.60%
|
9.61%
|
15.49%
|
11.31%
|
|
Market Price
|
-8.18%
|
2.69%
|
9.00%
|
12.81%
|
13.39%
|
8.55%
|
12.38%
|
10.12%
|
|
MSCI Golden Dragon Index
|
-4.24%
|
4.66%
|
11.41%
|
15.61%
|
14.74%
|
9.71%
|
9.82%
|
—
|
|
Calendar Year Returns
|
||||||||
|
2007
|
2008
|
2009
|
2010
|
2011
|
2012
|
2013
|
2014
|
|
|
NAV
|
86.20%
|
-46.95%
|
72.83%
|
27.26%
|
-24.37%
|
12.12%
|
18.31%
|
7.82%
|
|
Market Price
|
50.24%
|
-40.65%
|
72.19%
|
23.60%
|
-27.51%
|
20.52%
|
12.70%
|
5.29%
|
|
MSCI Golden Dragon Index
|
37.97%
|
-49.37%
|
67.12%
|
13.60%
|
-18.35%
|
22.65%
|
7.25%
|
8.06%
|
Past performance is not a guide to future returns.
Returns are annualized, except for periods of less than one year.
Source: State Street Bank and Trust Company. Source for index data: MSCI as at June 30, 2015. Investment returns are historical and do not guarantee future results. Investment returns reflect changes in net asset value and market price per share during each period and assumes that dividends and capital gains distributions, if any, were reinvested. The net asset value (NAV) percentages are not an indication of the performance of a shareholder's investment in the Fund, which is based on market price. NAV performance includes the deduction of management fees and other expenses. Market price performance does not include the deduction of brokerage commissions and other expenses of trading shares and would be lower had such commissions and expenses been deducted. It is not possible to invest directly in an index.
Premium/Discount
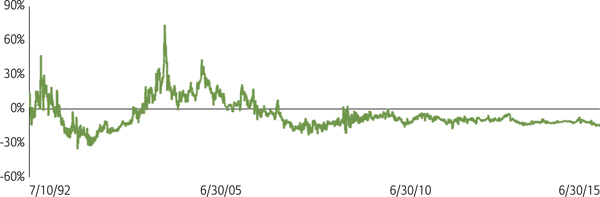
|
Sector Allocation
|
Fund
|
Benchmark
|
|
Financials
|
28.73%
|
41.56%
|
|
Information Technology
|
26.07%
|
22.21%
|
|
Consumer Discretionary
|
13.92%
|
5.39%
|
|
Industrials
|
13.39%
|
7.19%
|
|
Consumer Staples
|
7.05%
|
2.81%
|
|
Telecom Services
|
3.86%
|
6.64%
|
|
Health Care
|
2.65%
|
1.07%
|
|
Materials
|
0.81%
|
3.62%
|
|
Energy
|
0.47%
|
4.80%
|
|
Utilities
|
0.00%
|
4.69%
|
|
Other assets & liabilities
|
3.06%
|
0.00%
|
Source: IDS GmbH - Analysis and Reporting Services, a subsidiary of Allianz SE.
|
Country Allocation
|
Fund
|
Benchmark1
|
|
China
|
75.60%
|
73.72%
|
|
Hong Kong Red Chips
|
16.91%
|
12.73%
|
|
Hong Kong 'H' shares
|
18.54%
|
28.59%
|
|
Equity linked securities ('A' shares)
|
11.09%
|
0.00%
|
|
China 'A' & 'B' shares
|
0.00%
|
0.19%
|
|
Other Hong Kong securities
|
29.06%
|
32.30%
|
|
Taiwan
|
21.34%
|
26.28%
|
|
Other assets & liabilities
|
3.06%
|
0.00%
|
|
Top 10 Holdings
|
|
|
PING AN INSURANCE (China)
|
6.59%
|
|
ICBC LTD (China)
|
6.31%
|
| HONG KONG EXCHANGES AND CLEARING LTD (H.K.) | 4.76% |
|
TENCENT HOLDINGS LTD (China)
|
4.12%
|
|
TAIWAN SEMIC CO LTD (Taiwan)
|
3.93%
|
|
CHINA MOBILE LTD (China)
|
3.87% |
|
DIGITAL CHINA HOLDINGS LTD (China)
|
3.41% |
|
WANT WANT CHINA HOLDINGS LTD (China)
|
3.13% |
|
SUN HUNG KAI PROPERTIES LTD (H.K.)
|
3.04% |
|
HERMES MICROVISION INC (Taiwan)
|
3.01 |
|
Portfolio Characteristics
|
Fund
|
Benchmark1
|
|
P/E Ratio
|
14.11
|
12.43
|
|
P/B Ratio
|
2.08
|
1.52
|
|
Issues in Portfolio
|
46
|
280
|
|
Foreign Holdings (%)
|
96.94
|
100.00
|
|
Other assets & liabilities (%)
|
3.06
|
0.00
|
|
Yield (%)
|
2.49
|
2.91
|
1. MSCI Golden Dragon Index.
The China Fund, Inc.
Distribution History (10 Year)
|
Declaration Date
|
Ex-dividend Date
|
Record Date
|
Payable Date
|
Distribution/
Share
|
Income
|
Long-term
Capital Gain
|
Short-term
Capital Gain
|
|
12/9/05
|
12/19/05
|
12/21/05
|
12/29/05
|
$2.51190
|
$0.21720
|
$2.29470
|
—
|
|
12/8/06
|
12/19/06
|
12/21/06
|
12/29/06
|
$4.01170
|
$0.29960
|
$2.73090
|
$0.98120
|
|
12/7/07
|
12/19/07
|
12/21/07
|
1/25/08
|
$12.12000
|
$0.28000
|
$9.00000
|
$2.84000
|
|
12/8/08
|
12/22/08
|
12/24/08
|
1/23/09
|
$5.81740
|
$0.48130
|
$5.33610
|
—
|
|
12/9/09
|
12/22/09
|
12/24/09
|
12/29/09
|
$0.25570
|
$0.25570
|
—
|
—
|
|
12/8/10
|
12/21/10
|
12/24/10
|
12/29/10
|
$2.27420
|
$0.37460
|
$1.89960
|
—
|
|
12/8/11
|
12/21/11
|
12/23/11
|
12/29/11
|
$2.99640
|
$0.17420
|
$2.82220
|
—
|
|
12/10/12
|
12/20/12
|
12/24/12
|
12/28/12
|
$3.25170
|
$0.34730
|
$2.90440
|
—
|
|
12/13/13
|
12/19/13
|
12/23/13
|
12/27/13
|
$3.31400
|
$0.43870
|
$2.87530
|
—
|
|
12/8/14
|
12/18/14
|
12/22/14
|
1/5/15
|
$3.76510
|
$0.29820
|
$3.46690
|
—
|
Distribution/Share includes Income, Long-term Capital gains and Short-term Capital gains.
The China Fund NAV Performance of $10,000 since inception (with dividends reinvested at NAV price)
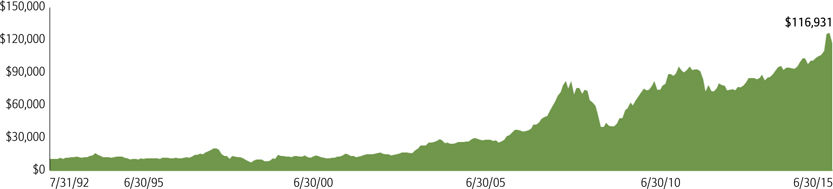
Past performance is not a guide to future returns.
Index Description
MSCI Golden Dragon Index
The MSCI Golden Dragon Index captures the equity market performance of large and mid cap China securities (H shares, B shares, Red-Chips and P-Chips) and non-domestic China securities listed in Hong Kong and Taiwan.
It is not possible to invest directly in an index.
The China Fund, Inc.
Portfolio in Full
| Sector |
Company
(exchange ticker) |
Market Price
|
Holding
|
Value
US$
|
% of
net assets |
|
Financials
|
28.70
|
||||
|
PING AN INSURANCE GROUP CO OF CHINA LTD
|
2318
|
104.40
|
1,797,000
|
24,201,552
|
6.59
|
|
INDUSTRIAL & COMMERCIAL BANK OF CHINA LTD
|
1398
|
6.15
|
29,244,000
|
23,200,991
|
6.31
|
|
HONG KONG EXCHANGES AND CLEARING LTD
|
388
|
273.60
|
495,300
|
17,481,515
|
4.76
|
|
SUN HUNG KAI PROPERTIES LTD
|
16
|
125.90
|
688,000
|
11,174,004
|
3.04
|
|
CATHAY FINANCIAL HOLDING CO LTD
|
2882
|
53.90
|
5,305,000
|
9,267,352
|
2.52
|
|
CHINA LIFE INSURANCE CO LTD
|
2628
|
33.60
|
1,612,000
|
6,987,132
|
1.90
|
|
CHAILEASE HOLDING CO LTD
|
5871
|
74.40
|
2,328,200
|
5,614,030
|
1.53
|
|
HONGKONG LAND HOLDINGS LTD
|
H78
|
8.20
|
497,000
|
4,075,400
|
1.11
|
|
CHINA OVERSEAS LAND & INVESTMENT LTD
|
688
|
27.45
|
976,000
|
3,456,104
|
0.94
|
|
Information Technology
|
26.02
|
||||
|
TENCENT HOLDINGS LTD
|
700
|
154.80
|
757,500
|
15,126,841
|
4.12
|
|
TAIWAN SEMICONDUCTOR MANUFACTURING CO LTD
|
2330
|
140.50
|
3,170,000
|
14,435,009
|
3.93
|
|
DIGITAL CHINA HOLDINGS LTD
|
861
|
10.34
|
9,391,000
|
12,526,421
|
3.41
|
|
HERMES MICROVISION INC
|
3658
|
2,010.00
|
170,000
|
11,074,560
|
3.01
|
|
LARGAN PRECISION CO LTD
|
3008
|
3,525.00
|
88,000
|
10,053,639
|
2.74
|
|
DELTA ELECTRONICS INC
|
2308
|
158.00
|
1,835,000
|
9,396,684
|
2.56
|
|
ADVANTECH CO LTD
|
2395
|
212.00
|
1,058,841
|
7,275,253
|
1.98
|
|
SEMICONDUCTOR MANUFACTURING INTERNATIONAL CORP
|
981
|
0.85
|
37,480,000
|
4,109,729
|
1.12
|
|
GOLDPAC GROUP LTD
|
3315
|
4.92
|
5,521,000
|
3,504,108
|
0.95
|
|
BAIDU INC
|
BIDU
|
199.08
|
15,821
|
3,149,645
|
0.86
|
|
ASM PACIFIC TECHNOLOGY LTD
|
522
|
76.60
|
295,700
|
2,921,963
|
0.80
|
|
TONG HSING ELECTRONIC INDUSTRIES LTD
|
6271
|
87.10
|
725,000
|
2,046,622
|
0.56
|
|
Consumer Discretionary
|
13.96
|
||||
|
QINGLING MOTORS CO LTD
|
1122
|
2.62
|
28,960,000
|
9,788,012
|
2.66
|
|
MERIDA INDUSTRY CO LTD
|
9914
|
200.00
|
1,435,000
|
9,301,723
|
2.53
|
|
LI & FUNG LTD
|
494
|
6.15
|
9,798,000
|
7,773,332
|
2.12
|
|
CLSA GLOBAL MARKETS (exch. for MIDEA GROUP CO LTD)
|
N/A
|
6.10
|
916,668
|
5,589,841
|
1.52
|
|
HSBC BANK PLC (exch. for MIDEA GROUP CO LTD)
|
N/A
|
6.01
|
670,000
|
4,028,040
|
1.10
|
|
CITIGROUP GLOBAL MARKETS HOLD
(exch. for CHINA CYTS TOURS HOLDIN)
|
N/A
|
3.41
|
863,208
|
2,943,539
|
0.80
|
|
CITIGROUP GLOBAL MARKETS WTS
(exch. for GREE ELECTRICAL APP INC)
|
N/A
|
10.30
|
267,298
|
2,753,169
|
0.75
|
|
CLSA GLOBAL MARKETS PTE LTD
(exch. for CHONG QING CHANGAN AUTO)
|
N/A
|
3.46
|
739,970
|
2,560,296
|
0.70
|
|
CITIGROUP GLOBAL MKTS HLDGS IN
(exch. for CHONG QING CHANGAN AUTO)
|
N/A |
3.41
|
558,897
|
1,905,839
|
0.52
|
|
CLSA GLOBAL MARKET PTE LTD
(exch. for GREE ELECTRICAL APP INC)
|
N/A
|
10.45
|
164,088
|
1,715,048
|
0.47
|
|
WAR HSBC BANK PLC (exch. for CHONG QING CHANGAN AUTO)
|
N/A
|
3.41
|
487,000
|
1,661,157
|
0.45
|
|
ZHONGSHENG GROUP HOLDINGS LTD
|
881
|
5.42
|
1,844,500
|
1,289,652
|
0.35
|
|
Industrials
|
13.42
|
||||
|
CHINA EVERBRIGHT INTERNATIONAL LTD
|
257
|
13.98
|
5,969,000
|
10,764,736
|
2.93
|
|
BEIJING ENTERPRISES HOLDINGS LTD
|
392
|
58.25
|
1,185,000
|
8,904,487
|
2.42
|
|
CLSA GLOBAL MARKET PTL LTD
(exch. for ZHENGZHOU YUTONG BUS CO)
|
N/A
|
3.36
|
1,945,690
|
6,539,464
|
1.78
|
|
CRRC CORP LTD
|
1766
|
11.90
|
3,697,000
|
5,675,329
|
1.54
|
|
ZHUZHOU CSR TIMES ELECTRIC CO LTD
|
3898
|
58.40
|
517,000
|
3,894,915
|
1.06
|
|
CN STATE CONSTRUCTION INTERNATIONAL HOLDINGS LTD
|
3311
|
13.88
|
2,110,000
|
3,778,040
|
1.03
|
|
QINGDAO PORT INTERNATIONAL CO LTD
|
6198
|
4.55
|
6,040,000
|
3,545,218
|
0.96
|
|
HSBC BANK PLC (exch. for XJ ELECTRIC CO)
|
N/A
|
4.06
|
864,000
|
3,505,248
|
0.95
|
|
CITIGROUP GLOBAL MARKETS HOLD
(exch. for XJ ELECTRIC CO)
|
N/A
|
4.06
|
419,748
|
1,704,177
|
0.46
|
|
HSBC BANK PLC (exch. for ZHENGZHOU YUTONG BUS CO)
|
N/A
|
3.31
|
304,500
|
1,009,113
|
0.27
|
|
Consumer Staples
|
7.06
|
||||
|
WANT WANT CHINA HOLDINGS LTD
|
151
|
8.20
|
10,877,000
|
11,505,821
|
3.13
|
|
HENGAN INTERNATIONAL GROUP CO LTD
|
1044
|
92.05
|
425,500
|
5,052,636
|
1.38
|
|
NATURAL BEAUTY BIO-TECHNOLOGY LTD
|
157
|
0.70
|
50,320,000
|
4,543,948
|
1.24
|
|
CITIGROUP GLOBAL MARKETS HOLD
(exch. for SHANGHAI JAHWA UNITED)
|
N/A
|
7.00
|
371,242
|
2,598,694
|
0.71
|
|
CLSA GLOBAL MARKETS PTE LTD
(exch. for SHANGHAI JAHWA UNITED)
|
N/A
|
7.10
|
315,651
|
2,240,806
|
0.61
|
The China Fund, Inc.
Portfolio in Full
|
Sector
|
Company
(exchange ticker) |
Market Price
|
Holding
|
Value US$
|
% of
net assets |
|
Telecom Services
|
3.87
|
||||
|
CHINA MOBILE LTD
|
941
|
99.40
|
1,108,000
|
14,207,602
|
3.87
|
|
Health Care
|
2.65
|
||||
|
CSPC PHARMACEUTICAL GROUP LTD
|
1093
|
7.68
|
5,804,000
|
5,750,204
|
1.56
|
|
3SBIO INC
|
1530
|
9.74
|
3,175,500
|
3,989,934
|
1.09
|
|
Materials
|
0.82
|
||||
|
TIANGONG INTERNATIONAL CO LTD
|
826
|
1.26
|
18,480,000
|
3,003,773
|
0.82
|
|
Energy
|
0.47
|
||||
|
CHINA SUNTIEN GREEN ENERGY CORP LTD
|
956
|
1.66
|
8,075,000
|
1,729,200
|
0.47
|
Source: State Street Bank and Trust Company, IDS GmbH - Analysis and Reporting Services, a subsidiary of Allianz SE.
Important Information:
Holdings are subject to change daily. The Fund seeks to achieve its objective through investment in the equity securities of companies and other entities with significant assets, investments, production activities, trading or other business interests in China or which derive a significant part of their revenue from China. Investing in non-U.S. securities entails additional risks, including political and economic risk and the risk of currency fluctuations, as well as lower liquidity. These risks, which can result in greater price volatility, will generally be enhanced in less diversified funds that concentrate investments in a particular geographic region.
The information contained herein has been obtained from sources believed to be reliable but Allianz Global Investors U.S. LLC and its affiliates do not warrant the information to be accurate, complete or reliable. The opinions expressed herein are subject to change at any time and without notice. Past performance is not indicative of future results. This material is not intended as an offer or solicitation for the purchase or sale of any financial instrument. Investors should consider the investment objectives, risks, charges and expenses of any mutual fund carefully before investing. This and other information is contained in the fund's annual and semiannual reports, proxy statement and other fund information, which may be obtained by contacting your financial advisor or visiting the fund's website at www.chinafundinc.com. This information is unaudited and is intended for informational purposes only. It is presented only to provide information on the Fund's holdings, performance and strategies. The Fund is a closed-end exchange traded management investment company. This material is presented only to provide information and is not intended for trading purposes. Closed-end funds, unlike open-end funds, are not continuously offered. After the initial public offering by a closed-end fund, its shares can be purchased and sold on the open market through a stock exchange, where shares may trade at a premium or a discount. The market price of holdings is subject to change daily.
P/E is a ratio of security price to earnings per share. Typically, an undervalued security is characterized by a low P/E ratio, while an overvalued security is characterized by a high P/E ratio. P/B is a ratio of the current stock price to the book value. This is used to identify undervalued stocks. Dividend yield is the annual percentage of return earned by an investor on a common or preferred stock. The average dividend yield is the dividend rate divided by current share price.
|
©2015 Allianz Global Investors Distributors LLC.
|
|
|
Investment Products: Not FDIC Insured | May Lose Value | Not Bank Guaranteed
|
FS-CHN-0615
|