Attached files
| file | filename |
|---|---|
| 8-K - FORM 8-K - FIFTH THIRD BANCORP | d75766d8k.htm |
| EX-99.1 - EX-99.1 - FIFTH THIRD BANCORP | d75766dex991.htm |
| EX-99.3 - EX-99.3 - FIFTH THIRD BANCORP | d75766dex993.htm |
 Fifth
Third Bank | All Rights Reserved 2Q15 Earnings Presentation
July 21, 2015 Refer to earnings release dated July 21, 2015 for further information. Exhibit 99.2 |
 2 Fifth Third Bank | All Rights Reserved Cautionary statement This release contains statements that we believe are “forward-looking statements” within the meaning of Section 27A of the
Securities Act of 1933, as amended, and Rule 175 promulgated thereunder,
and Section 21E of the Securities Exchange Act of 1934, as amended, and Rule 3b-6 promulgated thereunder. These statements relate to our financial condition, results of operations, plans, objectives, future performance or
business. They usually can be identified by the use of
forward-looking language such as “will likely result,” “may,” “are expected to,” “anticipates,” “potential,” “estimate,” “forecast,” “projected,” “intends to,” or may include other similar
words or phrases such as “believes,” “plans,” “trend,” “objective,” “continue,” “remain,” or similar expressions, or future or conditional verbs such as “will,”
“would,” “should,” “could,” “might,” “can,” or similar verbs. You should not place undue reliance on these statements, as they are subject to risks and uncertainties, including but not limited
to the risk factors set forth in our most recent Annual Report on Form
10-K as updated from time to time by our Quarterly Reports on Form 10-Q. When considering these forward-looking statements, you should keep in mind these risks and uncertainties, as well as any cautionary
statements
we may make. Moreover, you should treat these statements as speaking only as of the date they are made and based only on information then actually known to us. There is a risk that additional information may arise during the company’s close process or as a
result of subsequent events that would require the company to make
adjustments to the financial information contained herein. There are a
number of important factors that could cause future results to differ materially from historical performance and these forward-looking statements. Factors that might cause such a difference include, but are not limited to: (1) general economic conditions and weakening in the
economy, specifically the real estate market, either nationally or in the
states in which Fifth Third, one or more acquired entities and/or the
combined company do business, are less favorable than expected; (2) deteriorating
credit quality; (3) political developments, wars or other
hostilities may disrupt or increase volatility in securities markets or other economic
conditions; (4) changes in the interest rate environment reduce interest
margins; (5) prepayment speeds, loan origination and sale volumes, charge-offs and loan loss provisions; (6) Fifth Third’s ability to maintain required capital levels and adequate sources of funding and liquidity; (7) maintaining capital requirements and adequate sources of
funding and liquidity may limit Fifth Third’s operations and potential growth; (8) changes and trends in capital markets; (9) problems encountered by larger or similar financial institutions may adversely affect the banking industry and/or Fifth Third; (10) competitive pressures among
depository institutions increase significantly; (11) effects of critical
accounting policies and judgments; (12) changes in accounting policies or
procedures as may be required by the Financial Accounting Standards Board (FASB) or
other regulatory agencies; (13) legislative or regulatory changes or
actions, or significant litigation, adversely affect Fifth Third, one or more acquired entities and/or the combined company or the businesses in which Fifth Third, one or more acquired entities and/or the combined company are engaged, including the Dodd-Frank Wall Street Reform and Consumer Protection Act; (14) ability to maintain favorable ratings from rating agencies; (15) fluctuation of Fifth Third’s stock
price; (16) ability to attract and retain key personnel; (17) ability to
receive dividends from its subsidiaries; (18) potentially dilutive effect of future acquisitions on current shareholders’ ownership of Fifth Third; (19) effects of accounting or financial results of one or more acquired
entities; (20) difficulties from Fifth Third’s investment in,
relationship with, and nature of the operations of Vantiv, LLC; (21) loss of income from any sale or potential sale of businesses that could have an adverse effect on Fifth Third’s earnings and future growth; (22) difficulties in separating the operations of any branches or other assets divested; (23) inability to achieve expected benefits from branch consolidations and planned sales
within desired timeframes, if at all; (24) ability to secure confidential
information and deliver products and services through the use of computer
systems and telecommunications networks; and (25) the impact of reputational risk
created by these developments on such matters as business generation and
retention, funding and liquidity. You should refer to our periodic and
current reports filed with the Securities and Exchange Commission, or “SEC,” for further information on other factors, which could cause actual results to be significantly different from those expressed or implied by these forward-looking
statements. |
 3 Fifth Third Bank | All Rights Reserved 2Q15 in review Balancing current earnings results with prudent decisions to increase long-term shareholder value
($ in millions) 2Q15 Seq. YOY Average Balances Total loans & leases 1 $92,173 $1,665 $1,624 Core deposits $100,534 $2,340 $7,693 Income Statement Data Net interest income (taxable equivalent) $892 5% (1%) Provision for loan and lease losses 79 14% 4% Noninterest income 556 (12%) (24%) Noninterest expense 947 3% (1%) Net income attributable to Bancorp $315 (13%) (28%) Net income available to common shareholders $292 (16%) (30%) Financial Ratios Earnings per share, diluted 0.36 (14%) (27%) Net interest margin 2.90% 4bps (25bps) Efficiency ratio 65.4% 310bps 720bps Return on average assets 0.90% (16bps) (44bps) Return on average common equity 8.1% (160bps) (380bps) Return on average tangible common equity 2 9.7% (200bps) (470bps) Tangible book value per share 2 $ 14.62 (2%) 5% Note: The percentages in all of the tables in this presentation are calculated on actual dollar amounts and not the rounded dollar
amounts. 1
Excludes loans held-for-sale
2 Non-GAAP measure; see Reg. G reconciliation in appendix Significant pre-tax items in 2Q15 results (~$0.07 negative after-tax EPS impact): — $97MM non-cash impairment charge related to previously announced changes in the branch network (see form 8-K dated June 22, 2015) — $14MM positive valuation adjustment on the Vantiv warrant 2Q15 core business trends solid despite continued low interest rate environment Credit quality continues to improve — NCO ratio 37bps of loans as of 2Q15 — NPAs down $66MM compared with 1Q15; NPA ratio 67bps Strong capital ratios; tangible book value per share 2 up 5% from 2Q14 |
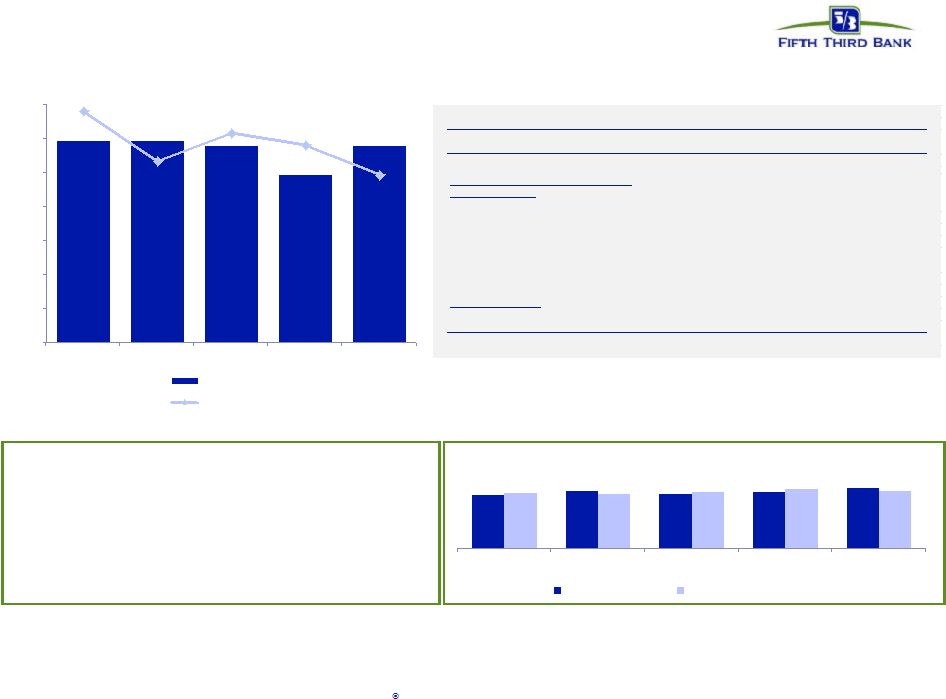
 4 Fifth Third Bank | All Rights Reserved $90.5 $92.7 $90.5 $90.8 $91.0 $90.5 $92.2 70 75 80 85 90 95 2Q14 3Q14 4Q14 1Q15 2Q15 EOP loans HFI Avg loans HFI Balance sheet Loan balances ($B) • Continuing to target prudent risk/reward profile in lending • Average commercial loans HFI up 3% sequentially and up 3% year-over-year – Year-over-year growth primarily driven by C&I and commercial construction, partially offset by lower commercial mortgage – End of period commercial line utilization 33% • Average consumer loans HFI increased 1% sequentially and declined 1% year- over-year • Average transaction deposits up $2.3B sequentially with increases in demand deposit and money market balances – Consumer average transaction deposits up 1% sequentially and up 5% year-over-year – Commercial average transaction deposits up 4% sequentially and up 12% year-over-year • Average core deposit to loan ratio of 109% Average core deposit balances ($B) Average securities and short-term investments ($B) • Average securities up $5.6B from 2Q14 driven by LCR requirements • Securities portfolio / total assets of 20.1% in 2Q15, up from 17.6% a year ago • Average other short-term investments increased $1.0B year-over-year reflecting higher cash balances at the Federal Reserve Note: Numbers may not sum due to rounding. |
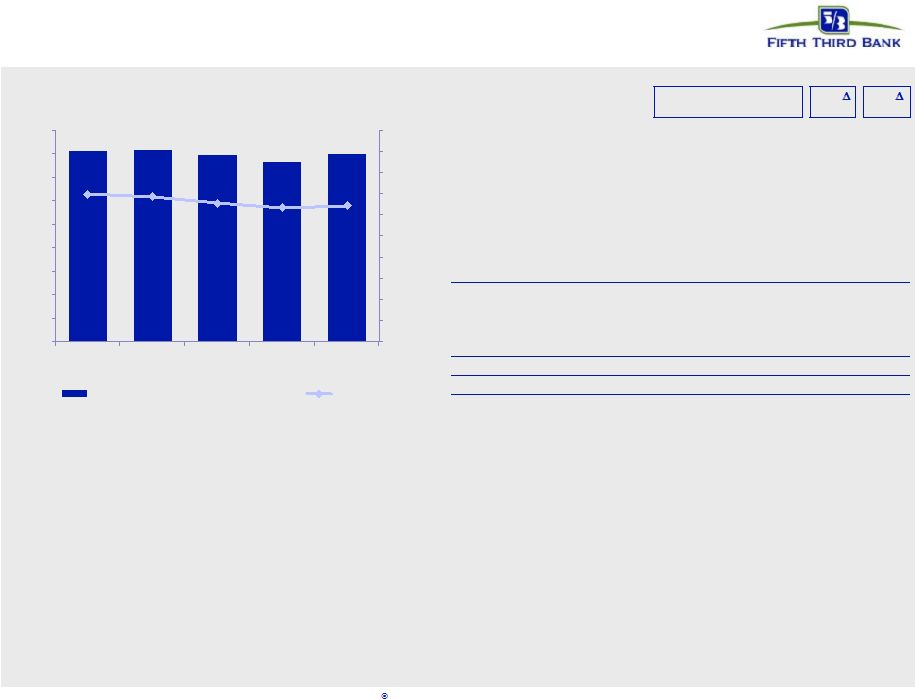 5 Fifth Third Bank | All Rights Reserved Net interest income NII and NIM (FTE) • Net interest income up $40MM from 1Q15 – Increase driven by earning asset growth, lower deposit costs, and the $7MM positive impact from higher day
count – NIM increased 4 bps sequentially driven by a 6 bp benefit due to deployment of cash balances into investment securities, 3 bps due to better funding rates including the continued rationalization of deposit
rates, partially offset by 4 bps of loan yield compression and a 1 basis point decrease
primarily due to day count
• Year-over-year NII decreased $13MM and NIM decreased 25 bps – NII decrease driven by changes to deposit advance product, higher interest expense due to increased
long-term debt balances, and continued loan repricing, partially offset by the impact
of higher investment securities balances
– NIM decrease primarily driven by the impact of the changes to the deposit advance product and loan
repricing Yield Analysis 2Q14 1Q15 2Q15 Seq. (bps) YoY (bps) Commercial and industrial loans 3.27% 3.16% 3.14% (2 ) (13) Commercial mortgage loans 3.39% 3.27% 3.22% (5) (17) Commercial construction loans 3.54% 3.23% 3.17% (6) (37) Commercial leases 3.04% 2.90% 2.83% (7) (21) Residential mortgage loans 3.93% 3.83% 3.69% (14 ) (24) Home equity 3.71% 3.66% 3.66% - (5) Automobile loans 2.77% 2.68% 2.65% (3) (12) Credit card 10.06% 10.22% 10.33% 11 27 Other consumer loans and leases 35.63% 10.79% 8.49% (230) (2,714) Total loans and leases 3.65% 3.46% 3.41% (5) (24) Taxable securities 3.34% 3.30% 3.20% (10) (14) Tax exempt securities 4.69% 5.24% 4.82% (42) 13 Other short-term investments 0.28% 0.25% 0.25% - (3) Total interest-earning assets 3.53% 3.28% 3.28% - (25) Total interest-bearing liabilities 0.54% 0.60% 0.56% (4) 2 Net interest spread 2.99% 2.68% 2.72% 4 (27) $905 $908 $888 $852 $892 3.15% 3.10% 2.96% 2.86% 2.90% $0 $100 $200 $300 $400 $500 $600 $700 $800 $900 $1,000 0.0% 0.5% 1.0% 1.5% 2.0% 2.5% 3.0% 3.5% 4.0% 4.5% 2Q14 3Q14 4Q14 1Q15 2Q15 Net Interest Income ($MM) NIM |
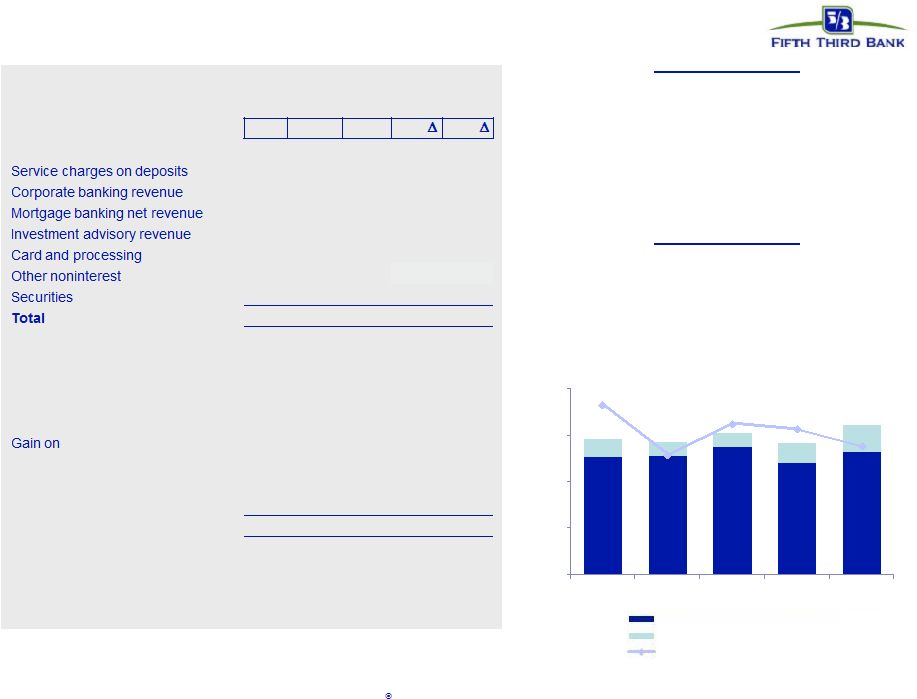 6 Fifth Third Bank | All Rights Reserved 2Q14 1Q15 2Q15 Seq. YOY ($ in millions) $139 $135 $139 3% - 107 63 113 79% 6% 78 86 117 36% 50% 102 108 105 (3%) 3% revenue 76 71 77 8% 1% income 226 163 1 (99%) (100%) gains, net 8 4 4 - (50%) noninterest income $736 $630 $556 (12%) (24%) Gain on sale of Vantiv shares (125) - - Vantiv warrant valuation (63) (70) (14) Other Vantiv-related items 12 - - Valuation of Visa total return swap 16 17 2 sale of TDRs - (37) - Impairment from aircraft leases - 30 - Branch / Land valuation adjustments 17 - 97 Securities (gains) / losses (8) (4) (4) Adjusted noninterest income $585 $566 $637 13% 9% Noninterest income Compared with 1Q15 • Corporate banking revenue results were primarily due to improvement in institutional sales revenue and higher syndication fees; sequential quarter comps impacted by the $30 million impairment associated with aircraft leases in 1Q15 • Mortgage banking revenue results reflect seasonally strong originations and a higher mortgage servicing revenues in 2Q15 Compared with 2Q14 • Increase in mortgage banking revenue reflected higher mortgage servicing revenue in 2Q15 • Corporate banking revenue results driven by higher institutional sales revenue and business lending fees, partially offset by lower syndication fees Components of noninterest income 5 quarter trend ($MM) $566 $585 $573 $612 $637 $- $200 $400 $600 $800 2Q14 3Q14 4Q14 1Q15 2Q15 Adjusted noninterest income Mortgage banking net revenue Reported noninterest income |
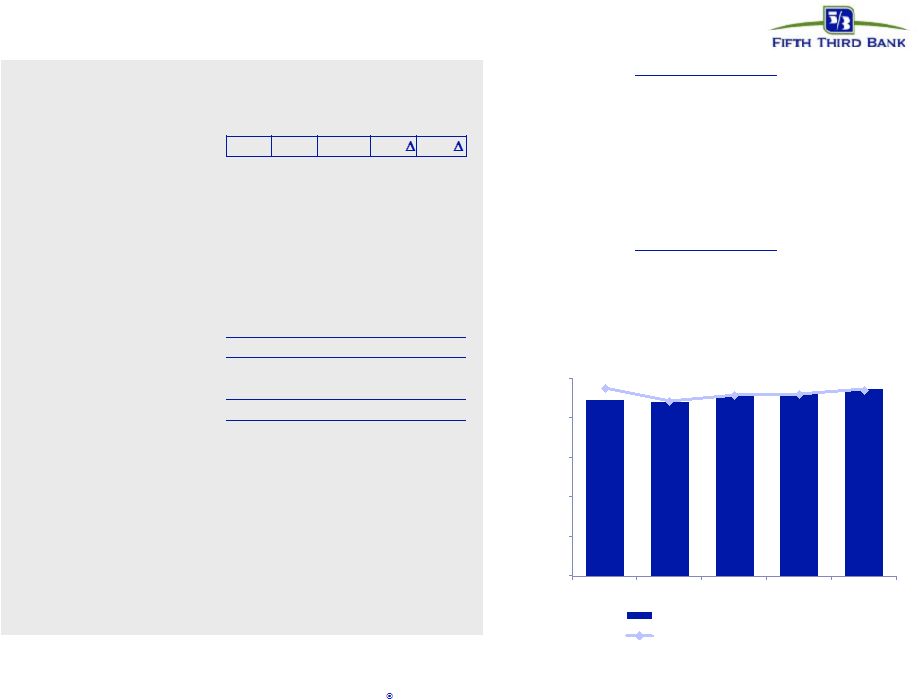 7 Fifth Third Bank | All Rights Reserved Noninterest expense Compared with 1Q15 • Expenses were up 3% sequentially, primarily due to higher incentive-based compensation expenses, which includes the seasonal pickup in long-term incentives, partially offset by a decrease in FICA and unemployment tax expense recorded in employee benefits • The sequential comparison also reflected the first quarter benefit from a settlement of a tax liability related to prior years recorded in other noninterest expense. Compared with 2Q14 • Expenses were down 1% year-over-year due to a decrease in litigation reserve charges, partially offset by an increase in compensation expenses 2Q14 1Q15 2Q15 Seq. YOY ($ in millions) Salaries, wages and incentives $368 $369 $383 4% 4% Employee benefits 79 99 78 (21%) (1%) Net occupancy expense 79 79 83 5% 5% Technology and communications 52 55 54 (2%) 4% Equipment expense 30 31 31 - 3% Card and processing expense 37 36 38 6% 3% Other noninterest expense 309 254 280 10% (9%) Noninterest expense $954 $923 $947 3% (1%) Litigation reserve charges (61) Adjusted noninterest expense $893 $923 $947 3% 6% Components of noninterest expense $- $200 $400 $600 $800 $1,000 2Q14 3Q14 4Q14 1Q15 2Q15 Adjusted noninterest expense Reported noninterest expense 5 quarter trend ($MM) Note: Provision for unfunded commitments was an expense of $2M in 2Q15, a benefit of $4M in 1Q15, an expense of $1M in 4Q14, a benefit of $8M in
3Q14, and a benefit of $11M in 2Q14.
$893 $888 $912 $923 $947 |
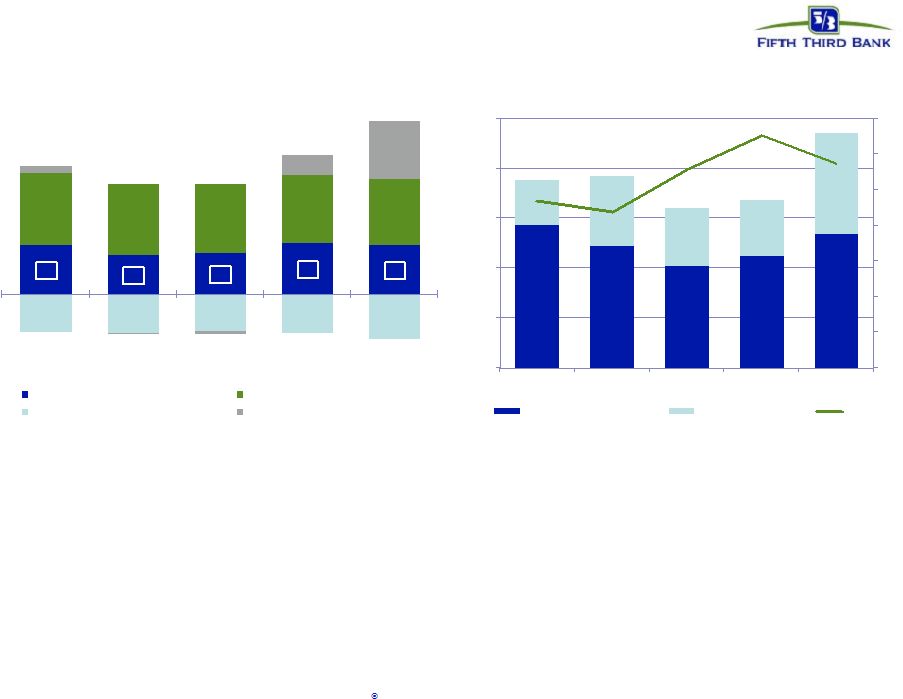
 8 Fifth Third Bank | All Rights Reserved 48 55 55 39 45 53 60 49 52 41 87 $0 $25 $50 $75 $100 $125 $150 $175 $200 2Q14 3Q14 4Q14 1Q15 2Q15 Commercial Consumer Related to TDR Transfer to HFS Credit quality overview Net charge-offs ($MM) $86 $115 NCO ratio 0.45% 0.50% 0.83% 0.41% 0.37% $101 HFI Nonperforming assets ($MM) 512 487 461 421 376 320 309 283 270 250 $0 $200 $400 $600 $800 $1,000 2Q14 3Q14 4Q14 1Q15 2Q15 Commercial Consumer $691 $626 $832 $744 $796 NPAs down 9% sequentially and 25% from 2Q14; lowest level since 2007 $1,458 $1,414 $1,322 $1,300 $1,293 1.61% 1.56% 1.47% 1.42% 1.39% $0 $500 $1,000 $1,500 0.00% 0.50% 1.00% 1.50% 2.00% 2.50% 2Q14 3Q14 4Q14 1Q15 2Q15 Allowance for Loan & Lease Losses (ALLL) ($MM) ALLL / Loans and Leases Reserve Coverage $94 $87 $87 $78 $70 $0 $10 $20 $30 $40 $50 $60 $70 $80 $90 $100 2Q14 3Q14 4Q14 1Q15 2Q15 Accruing 90+ Days Past Due ($MM) 2Q15 provision expense of $79MM, reserve coverage levels remain solid 90 + delinquencies declined 26% from 2Q14 NPA ratio 0.92%
0.88% 0.82% 0.76%
0.67% Net charge-offs down 5% sequentially and 15%
year-over-year $191
$91 |
 9 Fifth Third Bank | All Rights Reserved Strong capital position 1 Non-GAAP measure; See Reg. G reconciliation in appendix. 2 Represents Basel III common equity tier 1 ratio under the final capital rule, subject to phase-in periods. Fifth Third made a one-time
permanent election to not include AOCI in common equity tier 1 capital in
the March 31, 2015 regulatory filings. Tier
1 Common Ratio 1 Avg. Diluted Shares Outstanding (MM) EOP share impact (MM) Average share impact (MM) 1Q15 2Q15 1Q15 2Q15 3Q15 $225MM ASR - - 0.3 - - $180MM ASR 0.8 - 2.7 0.1 - $180MM ASR 8.5 1.1 6.0 3.4 0.3 $155MM ASR - 6.7 - 4.5 3.2 9.3 7.8 9.0 8.0 3.5 Capital Actions Impact of Share Repurchases Common Equity Tier 1 Ratio 2015 CCAR plan included potential repurchase of common shares in an amount up to $765MM — Also included the ability to repurchase shares in the amount of any after-tax gains from the sale of Vantiv Inc. stock Announced $155MM share repurchase transaction in 2Q15; expected to be completed on or before July 28, 2015 0% 2% 4% 6% 8% 2Q14 3Q14 4Q14 1Q15 2Q15 10% 9.6% 9.6% 9.7% 9.5% 9.4% 848 838 828 819 813 625 675 725 775 825 875 $10.00 $11.00 $12.00 $13.00 $14.00 $15.00 $16.00 2Q14 3Q14 4Q14 1Q15 2Q15 Common Shares O/S TBV per share $17.00 $13.86 $13.95 $14.40 $14.85 $14.62 2 (Basel III) (Basel I) and Tangible Book Value per share 1 |
 10 Fifth Third Bank | All Rights Reserved Appendix |
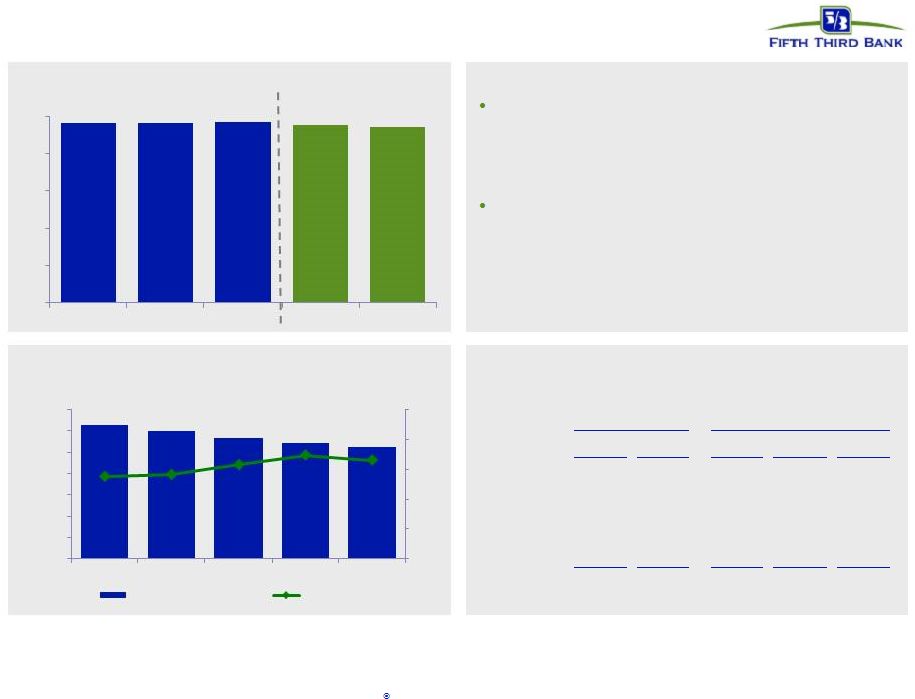
 11 Fifth Third Bank | All Rights Reserved 58.2% 62.1% 59.6% 62.3% 59.8% 59.5% 60.9% 64.9% 61.9% 2Q14 3Q14 4Q14 1Q15 2Q15 Efficiency Ratio Adjusted Efficiency Ratio $593 $594 $580 $493 $578 $0 $100 $200 $300 $400 $500 $600 $700 2Q14 3Q14 4Q14 1Q15 2Q15 Adjusted PPNR Reported PPNR Pre-tax pre-provision earnings 1 PPNR trend 1 Non-GAAP measure; see Reg. G reconciliation in appendix. 2 Prior quarters include similar adjustments. PPNR decreased 10% sequentially, reflecting impact of $82MM in net detriment in 2Q15 and a $61MM benefit in 1Q15 from significant items. Excluding those items, adjusted PPNR increased 17% sequentially, reflecting higher NII in 2Q15 PPNR reconciliation Efficiency ratio 65.4% ($ in millions) 2Q14 3Q14 4Q14 1Q15 2Q15 Income before income taxes (U.S. GAAP) (a) $606 $464 $519 $485 $417 Add: Provision expense (U.S. GAAP) (b) 76 71 99 69 79 PPNR (a) + (b) $682 $535 $618 $554 $496 Adjustments to remove (benefit) / detriment : In noninterest income: Gain from sales of Vantiv shares (125) - - - - Vantiv warrant valuation (63) 53 (56) (70) (14) Reduction in equity method income from interest in Vantiv 12 - - - - Branch and land valuation adjusments 17 - - - 97 Gain from sales of troubled debt restructurings - - - (37) - Impairment associated with aircraft leases - - - 30 - Valuation of 2009 Visa total return swap 16 3 19 17 2 Securities (gains) / losses (8) (3) (4) (4) (4) In noninterest expense: Severance expense 1 2 6 1 2 Litigation reserve charges 61 4 (3) 2 (1) Adjusted PPNR $593 $594 $580 $493 $578 2 |
 12 Fifth Third Bank | All Rights Reserved Mortgage banking results • $2.5B in originations; 53% purchase volume • 2Q15 mortgage drivers: – Origination fees and gain on sale revenue down $1MM – Gain on sale margin down 39 bps sequentially – Retaining conforming ARMs and shorter-term fixed-rate production on balance sheet
– MSR valuation adjustments of positive $57MM; servicing rights amortization of $39MM
– $56MM in gross servicing fees Mortgage originations ($B) and gain on sale margin 1 42 34 36 44 43 62 61 60 59 56 (32) (33) (32) (34) (39) 6 (1) (2) 17 57 2Q14 3Q14 4Q14 1Q15 2Q15 Orig fees and gains on loan sales Gross servicing fees Servicing rights amortization MSR valuation adjustments Mortgage Banking Net Revenue ($MM) Note: Numbers may not sum due to rounding. 1 Gain on sale margin represents gains on all loans originated for sale. $117 $61 $78 $61 0.0% 0.5% 1.0% 1.5% 2.0% 2.5% 3.0% 3.5% $0.0 $0.5 $1.0 $1.5 $2.0 $2.5 2Q14 3Q14 4Q14 1Q15 2Q15 Originations for sale Originations HFI Margin 1 $86 |
 13 Fifth Third Bank | All Rights Reserved $350 $2,450 $650 $600 $850 $850 2015 2016 2017 2018 2019 2020 2021 On Available and contingent borrowing capacity (2Q15): – FHLB ~$10.1B available, ~$14.7B total – Federal Reserve ~$26.5B Holding Company cash at 6/30/15: $2.4B Cash currently sufficient to satisfy all fixed obligations in a stressed environment for ~18 months (debt maturities, common and preferred dividends, interest and other expenses) without accessing capital markets; relying on dividends from subsidiaries or any other discretionary actions Holding company unsecured debt maturities ($MM) Bank unsecured debt maturities ($MM – excl. Brokered CDs) Heavily core funded Strong liquidity profile S-T wholesale 5% $1,250 $500 $500 $500 $2,312 2015 2016 2017 2018 2019 2020 2021 on Fifth Third Bancorp Fifth Third Capital Trust (Bancorp) |
 14 Fifth Third Bank | All Rights Reserved Interest Rate Risk Management 1. Actual results may vary from these simulated results due to differences between forecasted and actual balance sheet composition, timing, magnitude, and frequency of interest rate changes, as well as other changes in market conditions and management strategies.
2. Re-pricing percentage or “beta” is the estimated change in yield over 12 months as a result of a shock or ramp 100 bps parallel
shift in the yield curve Well-positioned for rising rates
• NII benefits from asset re-pricings in a rising rate environment – 64% of total loans are floating rate (81% of commercial and 36% of consumer) – Investment portfolio duration of approximately 4.9 years – Short-term wholesale funding represents approximately 3.5% - 4.0% of total funding – Approximately $12BN in non-core funding matures beyond one year • Interest rate sensitivities are based on conservative deposit assumptions – 70% beta on all interest-bearing deposit and sweep balances (~50% betas experienced in 2004 – 2006 Fed tightening cycle) – No modeled re-pricing lag – Modeled non-interest bearing commercial DDA runoff of approximately $2.5BN (about 10%) for each 100 bps increase in
rates – DDA runoff rolls into an interest bearing product with a 100% beta Change in Interest Rates +200 bps Shock Change in Interest Rates +100 bps Shock +200 bps Ramp 1.63% 6.65% (4.00%) +25 bps Shock +100 bps Ramp 0.89% 4.23% - -25 bps Shock Betas 25% Higher Betas 25% Lower Change in Interest Rates 12 Months 13 to 24 Months 12 Months Change in Interest Rates 12 Months 13 to 24 Months 12 Months 13 to 24 Months +200 bps Ramp 1.35% 6.09% 1.91% +200 bps Ramp (1.37%) 0.65% 4.63% 12.65% +100 bps Ramp 0.75% 3.95% 1.03% +100 bps Ramp (0.61%) 1.23% 2.39% 7.23% ESTIMATED NII SENSITIVITY PROFILE ESTIMATED EVE SENSITIVITY PROFILE Percent Change in NII (FTE) ALCO Policy Limits Change in EVE ALCO Policy Limit 12 Months 13 to 24 Months 12 Months 13 to 24 Months (12.00%) (1.84%) (6.00%) (0.33%) - 0.22% (4.63%) 13 to 24 Months 7.21% 4.52% ESTIMATED NII SENSITIVITY with DEMAND DEPOSIT BALANCE CHANGES ESTIMATED NII SENSITIVITY with DEPOSIT BETA CHANGES Percent Change in NII (FTE) Percent Change in NII (FTE) $1B Balance Decrease $1B Balance Increase |
 15 Fifth Third Bank | All Rights Reserved NPL rollforward NPL HFI Rollforward Commercial 2Q14 3Q14 4Q14 1Q15 2Q15 464 396 385 367 325 Transfers to nonperforming 141 116 99 80 66 Transfers to performing (67) - (1) (1) (3) Transfers from held for sale - - - - - Transfers to held for sale (1) (3) - - - Loans sold from portfolio (24) (12) (5) (5) (3) Loan paydowns/payoffs (54) (39) (45) (62) (44) Transfers to other real estate owned (18) (9) (7) (9) (10) Charge-offs (46) (66) (62) (45) (49) Draws/other extensions of credit 1 2 3 - 5 396 385 367 325 287 Consumer 2Q14 3Q14 4Q14 1Q15 2Q15 269 244 235 212 201 Transfers to nonperforming 85 90 86 54 55 Transfers to performing (44) (40) (33) (23) (26) Transfers from held for sale - - (24) - - Transfers to held for sale - - - 5 - Loans sold from portfolio - - - - - Loan paydowns/payoffs (11) (5) (5) (8) (14) Transfers to OREO/other repossessed property (24) (21) (20) (17) (10) Charge-offs (30) (33) (27) (22) (18) Draws/other extensions of credit (1) - - - - 244 235 212 201 188 Total NPL 640 620 579 526 475 Total new nonaccrual loans - HFI 226 206 185 134 121 Beginning NPL amount Ending Commercial NPL Beginning NPL amount Ending Consumer NPL |
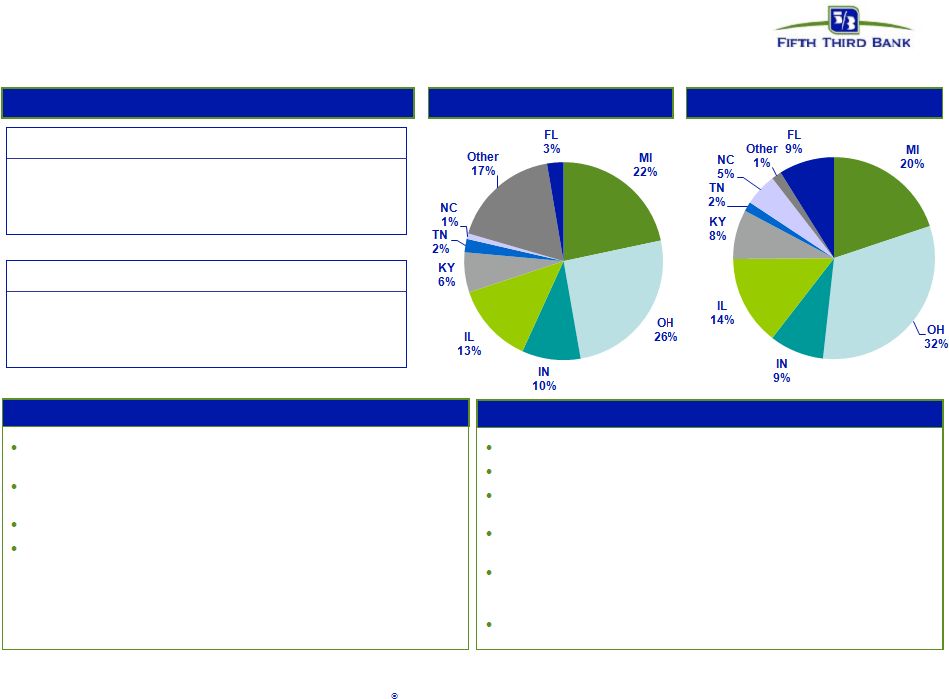
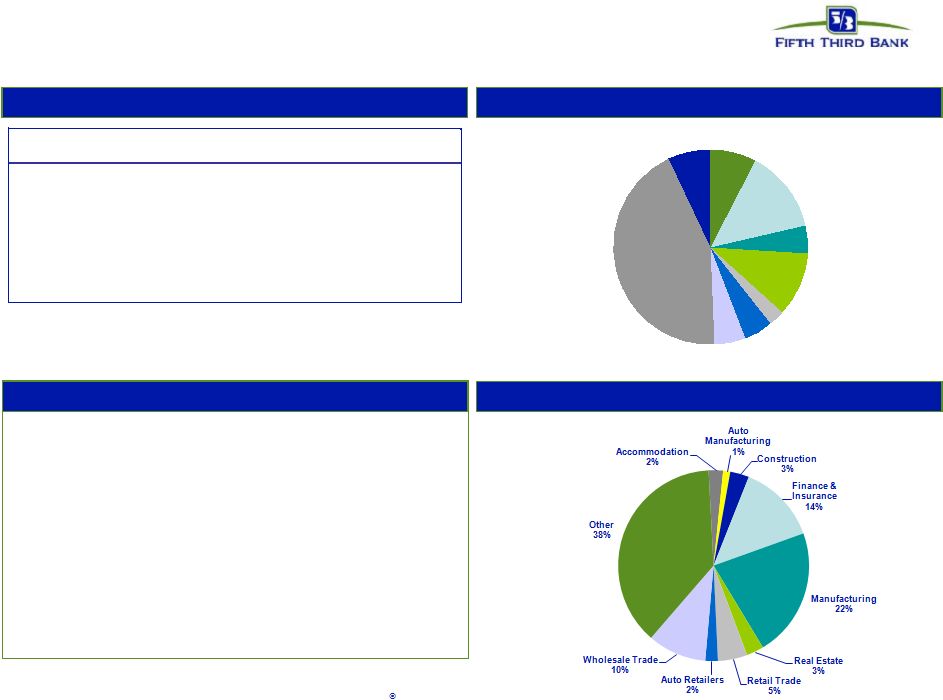 16 Fifth Third Bank | All Rights Reserved Commercial & industrial Loans by geography Credit trends Loans by industry Comments MI 7% OH 14% IN 4% IL 11% KY 2% TN 5% NC 5% Other / National 45% FL 7% * Excludes loans held-for-sale. • Commercial & industrial loans represented 46% of total loans • C&I loans were up 2% sequentially and up 4% since 2Q14 • SNC portfolio $25.1B; all material impacts from exam included in Q2 results • Non-power producer Energy portfolio $1.7B, down slightly from 1Q15 ($ in millions) 2Q14 3Q14 4Q14 1Q15 2Q15 EOP Balance* $41,299 $41,072 $40,765 $42,052 $42,800 Avg Loans* $41,374 $41,477 $41,277 $41,426 $42,550 90+ days delinquent - - - $2 $2 as % of loans NM NM NM NM NM NPAs* $265 $278 $246 $216 $193 as % of loans 0.64% 0.68% 0.60% 0.58% 0.45% Net charge-offs $31 $50 $44 $38 $34 as % of loans 0.30% 0.48% 0.43% 0.38% 0.32% C&I |
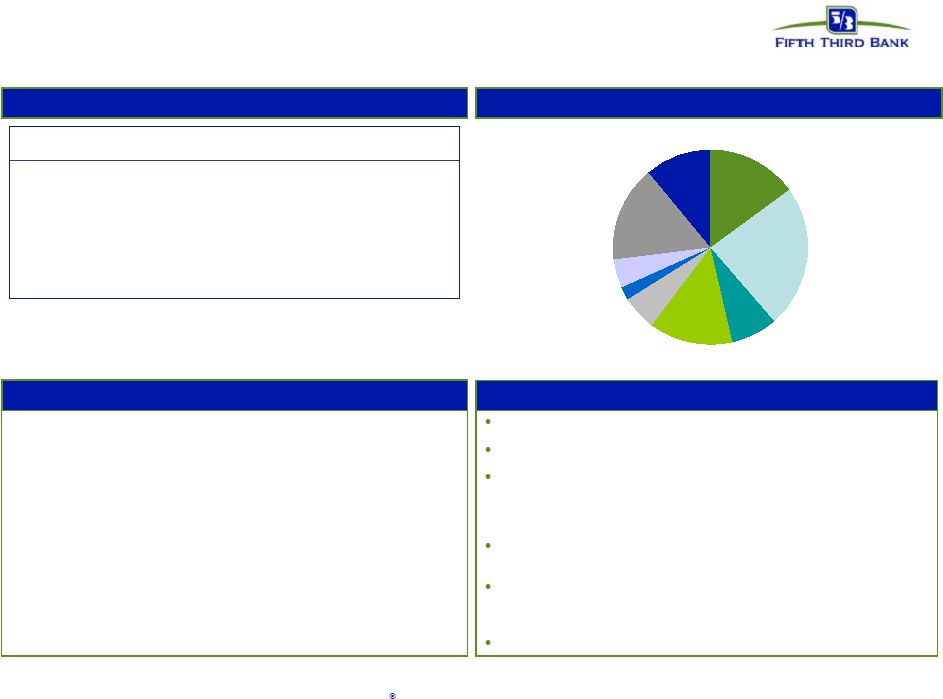
   17 Fifth Third Bank | All Rights Reserved Commercial real estate Loans by geography Credit trends Loans by industry Comments MI 15% OH 26% IN 5% IL 10% KY 2% TN 2% NC 6% Other / National 22% FL 12% • Commercial mortgage loans represented 8% of total loans — Non-owner occupied 2Q15 NCO ratio of 0.9% • Commercial construction loans represented 3% of total loans — Portfolio focused on large professional developers — Top 3 categories: Apartments, office and REIT * Excludes loans held-for-sale. ($ in millions) 2Q14 3Q14 4Q14 1Q15 2Q15 EOP Balance* $7,805 $7,564 $7,399 $7,209 $7,150 Avg Loans* $7,885 $7,633 $7,480 $7,241 $7,148 NPAs* $212 $186 $195 $186 $166 as % of loans 2.69% 2.43% 2.62% 2.56% 2.31% Net charge-offs $9 $5 $10 $1 $11 as % of loans 0.44% 0.24% 0.53% 0.05% 0.62% Commercial mortgage ($ in millions) 2Q14 3Q14 4Q14 1Q15 2Q15 EOP Balance* $1,424 $1,702 $2,069 $2,302 $2,709 Avg Loans* $1,362 $1,563 $1,909 $2,197 $2,549 NPAs* $31 $19 $16 $16 $14 as % of loans 2.17% 1.09% 0.75% 0.67% 0.51% Net charge-offs $8 - - - - as % of loans 2.26% (0.11%) (0.01%) (0.06%) 0.00% Commercial construction |
 18 Fifth Third Bank | All Rights Reserved Residential mortgage 1 st liens: 100%; weighted average LTV: 73.1% Weighted average origination FICO: 757 Origination FICO distribution: <660 5%; 660-689 5%; 690-719 9%;
720-749 14%; 750+ 62%; Other^ 5%
(note: loans <660 includes CRA loans and FHA/VA loans)
Origination LTV distribution: <=70 38%; 70.1-80 36%; 80.1-90 7%;
90.1-95 5%; >95 14%
Vintage distribution: 2015: 14%, 2014: 17%, 2013: 18%; 2012 17%;
2011 10%; 2010 6%; 2009 3%; 2008 2%; 2007 2%; 2006 2%; 2005
4%; 2004 and prior 5% 15% originated through 3 rd party; performance similar to direct Loans by geography Credit trends Portfolio details Comments ^ Includes acquired loans where FICO at origination is not available * Excludes loans held-for-sale • Residential mortgage loans represented 14% of total loans and 6% of net charge-offs • Net charge-offs decreased by $1MM sequentially — MI, IL, and OH account for 24%, 18%, and 16% of residential mortgage net charge-offs, respectively MI 15% OH 24% IN 8% IL 14% KY 6% TN 2% NC 5% Other / National 15% FL 11% ($ in millions) 2Q14 3Q14 4Q14 1Q15 2Q15 EOP Balance* $12,652 $12,941 $12,389 $12,569 $12,933 Avg Loans* $12,611 $12,785 $13,046 $12,433 $12,831 90+ days delinquent $60 $57 $56 $48 $43 as % of loans 0.47% 0.44% 0.44% 0.38% 0.33% NPAs* $172 $164 $126 $113 $101 as % of loans 1.36% 1.27% 1.01% 0.91% 0.78% Net charge-offs $8 $9 $94 $6 $5 as % of loans 0.24% 0.28% 2.87% 0.19% 0.16% Residential mortgage |
   19 Fifth Third Bank | All Rights Reserved Home equity loans represented 9% of total loans and 10% of net charge-offs Approximately 12% of portfolio in broker product generated 29% total loss 38% of Fifth Third 2 nd liens are behind Fifth Third 1 st liens 2005/2006 vintages represent approximately 23% of portfolio; account for 40% of losses Home equity 1 st liens: 35%; 2 nd liens: 65% Weighted average origination FICO: 753 Origination FICO distribution^: <660 3%; 660-689 7%; 690-719 12%; 720-749 16%; 750+ 55%; Other 7% Average CLTV: 72%; Origination CLTV distribution: <=70 42%; 70.1- 80 24%; 80.1-90 18%; 90.1-95 5%; >95 11% Vintage distribution: 2015: 3%; 2014: 8%, 2013: 6%; 2012 4%; 2011 2%; 2010 2%; 2009 3%; 2008 9%; 2007 9%; 2006 12%; 2005 11%; 2004 and prior 31% % through broker channels: 12% WA FICO: 734 brokered, 756 direct; WA CLTV: 88% brokered; 70% direct Portfolio details Comments Brokered loans by geography Direct loans by geography Credit trends Note: Brokered and direct home equity net charge-off ratios are calculated based on end of period loan balances
^ Includes acquired loans where FICO at origination is not available
* Excludes loans held-for-sale
($ in millions) 2Q14 3Q14 4Q14 1Q15 2Q15 EOP Balance* $1,131 $1,094 $1,062 $1,028 $987 90+ days delinquent - - - - - as % of loans NM NM NM NM NM Net charge-offs $7 $4 $3 $3 $3 as % of loans 2.35% 1.42% 1.05% 1.11% 1.06% Home equity - brokered ($ in millions) 2Q14 3Q14 4Q14 1Q15 2Q15 EOP Balance* $7,925 $7,893 $7,824 $7,686 $7,560 90+ days delinquent - - - - - as % of loans NM NM NM NM NM Net charge-offs $11 $10 $8 $11 $6 as % of loans 0.58% 0.51% 0.42% 0.59% 0.34% Home equity - direct |
 20 Fifth Third Bank | All Rights Reserved Regulation G Non-GAAP reconciliation Fifth Third Bancorp and Subsidiaries Regulation G Non-GAAP Reconcilation $ and shares in millions (unaudited) June March December September June 2015 2015 2014 2014 2014 Income before income taxes (U.S. GAAP) 417 485 519 464 606 Add: Provision expense (U.S. GAAP) 79 69 99 71 76 Pre-provision net revenue 496 554 618 535 682 Net income available to common shareholders (U.S. GAAP) 292 346 362 328 416 Add: Intangible amortization, net of tax - - 1 1 1 Tangible net income available to common shareholders 292 346 363 329 417 Tangible net income available to common shareholders (annualized) (a) 1,171 1,403 1,440 1,305 1,673 Average Bancorp shareholders' equity (U.S. GAAP) 15,841 15,820 15,644 15,486 15,157 Less: Average preferred stock (1,331) (1,331) (1,331) (1,331) (1,119) Average goodwill (2,416) (2,416) (2,416) (2,416) (2,416) Average intangible assets and other servicing rights (15) (15) (17) (16) (17) Average tangible common equity (b) 12,079 12,058 11,880 11,723 11,605 Total Bancorp shareholders' equity (U.S. GAAP) 15,605 15,864 15,626 15,404 15,469 Less: Preferred stock (1,331) (1,331) (1,331) (1,331) (1,331) Goodwill (2,416) (2,416) (2,416) (2,416) (2,416) Intangible assets and other servicing rights (14) (15) (16) (16) (17) Tangible common equity, including unrealized gains / losses (c) 11,844 12,102 11,863 11,641 11,705 Less: Accumulated other comprehensive income (291) (588) (429) (301) (382) Tangible common equity, excluding unrealized gains / losses (d) 11,553 11,514 11,434 11,340 11,323 Total assets (U.S. GAAP) 141,658 140,470 138,706 134,188 132,562 Less: Goodwill (2,416) (2,416) (2,416) (2,416) (2,416) Intangible assets and other servicing rights (14) (15) (16) (16) (17) Tangible assets, including unrealized gains / losses (e) 139,228 138,039 136,274 131,756 130,129 Less: Accumulated other comprehensive income / loss, before tax (448) (905) (660) (463) (588) Tangible assets, excluding unrealized gains / losses (f) 138,780 137,134 135,614 131,293 129,541 Common shares outstanding (g) 810 815 824 834 844 Ratios: Return on average tangible common equity (a) / (b) 9.7% 11.7% 12.1% 11.1% 14.4% Tangible common equity (excluding unrealized gains/losses) (d) / (f) 8.33% 8.40% 8.43% 8.64% 8.74% Tangible common equity (including unrealized gains/losses) (c) / (e) 8.51% 8.77% 8.71% 8.84% 9.00% Tangible book value per share (c) / (g) $14.62 $14.85 $14.40 $13.95 $13.86 For the Three Months Ended |
 21 Fifth Third Bank | All Rights Reserved Regulation G Non-GAAP reconciliation Fifth Third Bancorp and Subsidiaries Regulation G Non-GAAP Reconcilation $ and shares in millions (unaudited) June March December September June 2015 2015 2014 2014 2014 Total Bancorp shareholders' equity (U.S. GAAP) N/A N/A 15,626 15,404 15,469 Goodwill and certain other intangibles N/A N/A (2,476) (2,484) (2,484) Unrealized gains N/A N/A (429) (301) (382) Qualifying trust preferred securities N/A N/A 60 60 60 Other N/A N/A (17) (18) (19) Tier I capital N/A N/A 12,764 12,661 12,644 Less: Preferred stock N/A N/A (1,331) (1,331) (1,331) Qualifying trust preferred securities N/A N/A (60) (60) (60) Qualifying noncontrolling interest in consolidated subsidiaries N/A N/A (1) (1) (1) Tier I common equity (a) N/A (2) N/A (2) 11,372 11,269 11,252 Risk-weighted assets (actual) (b) (1) 123,134 121,310 117,878 116,917 117,117 Ratio: Tier I common equity (a) / (b) N/A (2) N/A (2) 9.65% 9.64% 9.61% Basel III Final Rule - Transitional to fully phased-in CET 1 capital (transitional) 11,582 11,543 Less: Adjustments to CET 1 capital from transitional to fully phased-in (3) (12) (13) CET 1 capital (fully phased-in) (c) 11,570 11,530 Risk-weighted assets (transitional) 123,134 121,310 Add: Adjustments to risk-weighted assets from transitional to fully phased-in
(4) 1,280 1,182 Risk-weighted assets (fully phased-in) (d) 124,414 122,492 Estimated CET 1 capital ratio under Basel III Final Rule (fully phased-in) (c) / (d)
9.30% 9.41% (1) (2) The Bancorp became subject to the Basel III Final Rule on January 1, 2015. This codified in the federal banking regulations the risk-based
capital ratios the Bancorp is now subject to, as such these ratios are no longer considered Non-GAAP measures. (3) Primarily relates to disallowed intangible assets (other than goodwill and MSRs, net of associated deferred tax liabilities).
(4) Primarily relates to higher risk-weighting for MSRs. For the Three Months Ended Basel I Basel III Transitional Under the banking agencies’ risk-based capital guidelines, assets and credit equivalent amounts of derivatives and off-balance sheet
exposures are assigned to broad risk categories. The aggregate dollar amount in each risk category is multiplied by the associated risk-weight of the category. The resulting weighted values are added together, along with the measure for market
risk, resulting in the Bancorp’s total risk-weighted assets. |