Attached files
| file | filename |
|---|---|
| EX-23.2 - EX-23.2 - NEP Group, Inc. | d743919dex232.htm |
| EX-5.1 - EX-5.1 - NEP Group, Inc. | d743919dex51.htm |
| EX-4.1 - EX-4.1 - NEP Group, Inc. | d743919dex41.htm |
Table of Contents
As filed with the Securities and Exchange Commission on July 20, 2015
Registration No. 333-205344
UNITED STATES
SECURITIES AND EXCHANGE COMMISSION
Washington, D.C. 20549
AMENDMENT NO. 2
to
FORM S-1
REGISTRATION STATEMENT
UNDER
THE SECURITIES ACT OF 1933
NEP Group, Inc.
(Exact Name of Registrant as Specified in its Charter)
| Delaware | 7380 | 80-0877943 | ||
| (State or other jurisdiction of incorporation or organization) |
(Primary Standard Industrial Classification Code Number) |
(I.R.S. Employer Identification Number) |
2 Beta Drive
Pittsburgh, PA 15238
(800) 444-0054
(Address, including zip code, and telephone number, including area code, of registrant’s principal executive offices)
Dean Naccarato
General Counsel
NEP Group, Inc.
2 Beta Drive
Pittsburgh, PA 15238
(800) 444-0054
(Name, address, including zip code, and telephone number, including area code, of agent for service)
Copies of all communications, including communications sent to agent for service, should be sent to:
| David P. Oelman Alan Beck Julian J. Seiguer Vinson & Elkins L.L.P. 1001 Fannin Street Suite 2500 Houston, Texas 77002 (713) 758-2222 |
Richard D. Truesdell, Jr. Davis Polk & Wardwell LLP 450 Lexington Avenue New York, NY 10017 (212) 450-4000 |
Approximate date of commencement of proposed sale to the public: As soon as practicable after this Registration Statement becomes effective.
If any of the securities being registered on this Form are to be offered on a delayed or continuous basis pursuant to Rule 415 under the Securities Act of 1933, check the following box: ¨
If this Form is filed to register additional securities for an offering pursuant to Rule 462(b) under the Securities Act, please check the following box and list the Securities Act registration statement number of the earlier effective registration statement for the same offering. ¨
If this Form is a post-effective amendment filed pursuant to Rule 462(c) under the Securities Act, check the following box and list the Securities Act registration statement number of the earlier effective registration statement for the same offering. ¨
If this Form is a post-effective amendment filed pursuant to Rule 462(d) under the Securities Act, check the following box and list the Securities Act registration statement number of the earlier effective registration statement for the same offering. ¨
Indicate by check mark whether the registrant is a large accelerated filer, an accelerated filer, a non-accelerated filer, or a smaller reporting company. See the definitions of “large accelerated filer,” “accelerated filer” and “smaller reporting company” in Rule 12b-2 of the Exchange Act. (Check one):
| Large accelerated filer | ¨ | Accelerated filer | ¨ | |||
| Non-accelerated filer | x (Do not check if a smaller reporting company) | Smaller reporting company | ¨ | |||
CALCULATION OF REGISTRATION FEE
|
| ||||||||
| Title of Each Class of Securities to be Registered |
Amount to be |
Proposed Maximum Offering Price Per Share(2) |
Proposed Offering Price(1)(2) |
Amount of Registration Fee(3) | ||||
| Common stock, par value $0.01 per share |
14,950,000 | $17.00 | $254,150,000 | $29,532.23 | ||||
|
| ||||||||
|
| ||||||||
| (1) | Estimated pursuant to Rule 457(a) under the Securities Act of 1933, as amended. Includes 1,950,000 additional shares of common stock that the underwriters have the option to purchase. |
| (2) | Estimated solely for the purpose of calculating the registration fee. |
| (3) | The Registrant previously paid $11,620.00 of the total registration fee in connection with the previous filing of this Registration Statement. |
The registrant hereby amends this registration statement on such date or dates as may be necessary to delay its effective date until the registrant shall file a further amendment which specifically states that this registration statement shall thereafter become effective in accordance with Section 8(a) of the Securities Act of 1933, as amended, or until this registration statement shall become effective on such date as the Securities and Exchange Commission, acting pursuant to said Section 8(a), may determine.
Table of Contents
The information in this preliminary prospectus is not complete and may be changed. We may not sell these securities until the registration statement filed with the Securities and Exchange Commission becomes effective. This preliminary prospectus is not an offer to sell these securities and we are not soliciting an offer to buy these securities in any jurisdiction where the offer or sale is not permitted.
Subject to Completion, dated July 20, 2015
PROSPECTUS
13,000,000 Shares

NEP Group, Inc.
COMMON STOCK
This is the initial public offering of the common stock of NEP Group, Inc., a Delaware corporation. We are offering 13,000,000 shares of our common stock. No public market currently exists for our common stock. We are an “emerging growth company” and are eligible for reduced reporting requirements. Please see “Summary—Emerging Growth Company Status.”
Our common stock has been approved for listing on the New York Stock Exchange (“NYSE”) under the symbol “NEPG.”
We anticipate that the initial public offering price will be between $15.00 and $17.00 per share.
Investing in our common stock involves risks. Please see “Risk Factors” beginning on page 23 of this prospectus.
| Per share |
Total | |||||||
| Price to the public |
$ | $ | ||||||
| Underwriting discounts and commissions (1) |
$ | $ | ||||||
| Proceeds to us (before expenses) |
$ | $ | ||||||
| (1) | Please see “Underwriting (Conflicts of Interest)” for a description of all underwriting compensation payable in connection with this offering. |
We have granted the underwriters the option to purchase up to 1,950,000 additional shares of common stock on the same terms and conditions set forth above if the underwriters sell more than 13,000,000 shares of common stock in this offering.
Neither the Securities and Exchange Commission nor any state securities commission has approved or disapproved of these securities or passed on the adequacy or accuracy of this prospectus. Any representation to the contrary is a criminal offense.
The underwriters expect to deliver the shares on or about , 2015.
| Joint Book-Running Managers | ||||||
| Barclays | Morgan Stanley | |||||
| Jefferies | Macquarie Capital | RBC Capital Markets | ||||
| Co-Managers | ||||||
| Nomura | Stifel | |||||
Prospectus dated , 2015
Table of Contents

Table of Contents
| 1 | ||||
| 23 | ||||
| 40 | ||||
| 42 | ||||
| 43 | ||||
| 44 | ||||
| 46 | ||||
| 47 | ||||
| Management’s Discussion and Analysis of Financial Condition and Results of Operations |
49 | |||
| 84 | ||||
| 105 | ||||
| 114 | ||||
| Security Ownership of Certain Beneficial Owners and Management |
125 | |||
| 127 | ||||
| 130 | ||||
| 134 | ||||
| Material United States Federal Income Tax Considerations for Non-United States Holders |
136 | |||
| 140 | ||||
| 149 | ||||
| 149 | ||||
| 149 | ||||
| F-1 |
Neither we nor the underwriters have authorized anyone to provide you with information other than that contained in this prospectus and any free writing prospectus prepared by us or on behalf of us or to which we have referred you. Neither we nor the underwriters take any responsibility for, or can provide any assurance as to the reliability of, any other information that others may give you. We and the underwriters are offering to sell shares of common stock and seeking offers to buy shares of common stock only in jurisdictions where offers and sales are permitted. The information in this prospectus is accurate only as of the date of this prospectus, regardless of the time of delivery of this prospectus or any sale of the common stock. Our business, financial condition, results of operations and prospects may have changed since that date.
This prospectus contains forward-looking statements that are subject to a number of risks and uncertainties, many of which are beyond our control. See “Risk Factors” and “Forward-Looking Statements.”
i
Table of Contents
BASIS OF PRESENTATION
Unless otherwise indicated, all of the financial data presented in this prospectus is presented on a consolidated basis for NEP Group, Inc. and its subsidiaries. The financial information and certain other information presented in this prospectus have been rounded to the nearest whole number or the nearest decimal. Therefore, the sum of the numbers in a column may not conform exactly to the total figure given for that column in certain tables in this prospectus. In addition, certain percentages presented in this prospectus reflect calculations based upon the underlying information prior to rounding and, accordingly, may not conform exactly to the percentages that would be derived if the relevant calculations were based upon the rounded numbers or may not sum due to rounding.
INDUSTRY AND MARKET DATA
The market data and certain other statistical information used throughout this prospectus are based on independent industry publications, government publications and other published independent sources. Some data is also based on our good faith estimates. Although we believe these third-party sources are reliable as of their respective dates, neither we nor the underwriters have independently verified the accuracy or completeness of this information. The industry in which we operate is subject to a high degree of uncertainty and risk due to a variety of factors, including those described in the section entitled “Risk Factors.” These and other factors could cause results to differ materially from those expressed in these publications.
References in this prospectus to:
| • | “Premium Events” refer to live or near-live events which are broadcast nationally by major broadcasters and event producers utilizing remote production services; representative Premium Events include Monday Night Football, the Masters, the Academy Awards and the Indy 500; |
| • | “Client group” refer to clients that are under the common control of a single ultimate parent; and |
| • | “NFL” refer to the National Football League; “MLB” refer to Major League Baseball; “NHL” refer to the National Hockey League; “NASCAR” refer to the National Association for Stock Car Auto Racing; “NBA” refer to the National Basketball Association; “NCAA” refer to the National Collegiate Athletic Association; “EPL” refer to the English Premier League; “PGA” refer to Professional Golfers’ Association of America. |
This prospectus includes copyrighted information of The Nielsen Company, licensed for use herein. The Nielsen material contained in this report represents Nielsen’s estimates and does not represent facts. Nielsen has neither reviewed nor approved this report and/or any of the statements made herein.
TRADEMARKS AND TRADE NAMES
We may own or have rights to various trademarks, service marks and trade names that we use in connection with the operation of our business. This prospectus may also contain trademarks, service marks and trade names of third parties, which are the property of their respective owners. Our use or display of third parties’ trademarks, service marks, trade names or products in this prospectus is not intended to, and does not imply a relationship with, or endorsement or sponsorship by us. Solely for convenience, the trademarks, service marks and trade names referred to in this prospectus may appear without the ®, TM or SM symbols, but such references are not intended to indicate, in any way, that we will not assert, to the fullest extent under applicable law, our rights or the rights of the applicable licensor to these trademarks, service marks and trade names.
ii
Table of Contents
This summary highlights some of the information contained in this prospectus. This summary may not contain all of the information that may be important to you. For a more complete understanding of our business and this offering, we encourage you to read this entire prospectus, including “Risk Factors,” “Management’s Discussion and Analysis of Financial Condition and Results of Operations,” and the more detailed information regarding our Company and the common stock being sold in this offering, as well as our consolidated historical financial statements and the related notes appearing elsewhere in this prospectus, before deciding to invest in our common stock. The information presented in this prospectus assumes, unless otherwise indicated, that the underwriters do not exercise their option to purchase additional shares of common stock and reflects a 7.7 for 1 split of our outstanding common stock that occurred on July 17, 2015. References in this prospectus to our operating statistics and market positions in 2014 are pro forma for the acquisitions of the Screen Scene Group, MPP Mediatec Group AB (“Mediatec”) and Outside Broadcast and RecordLab and Media GmbH (“Outside Broadcast”). Please see “—Recent Developments.” Some of the statements in this prospectus constitute forward-looking statements. See “Forward-Looking Statements.” In this prospectus, the terms the “Company,” “NEP,” “we,” “us” and “our” refer to NEP Group, Inc. and its subsidiaries. NEP Group, Inc. is a holding company with no independent operations and all of its business is conducted by its subsidiaries.
Overview
We are the largest global outsourced provider of comprehensive live and broadcast production solutions, with leading market positions in the United States, Europe and Australia. We serve the premium sports, entertainment and other live event production markets, where we offer mission-critical outsourced solutions, including remote production, studio production, video display and host broadcasting. Our service offering combines highly-trained technical experts with state-of-the-art production resources to offer a platform-agnostic solution across a wide variety of broadcasts and live events. With a team of more than 800 engineers, we work side-by-side with clients to design tailored solutions and provide real-time support for their productions. Our diverse capabilities offer clients the convenience of a comprehensive solution covering technical design, video and audio content capture through to the delivery of an integrated broadcast feed. We believe that we have the largest and most experienced outsourced engineering team in our industry, delivering unique value through our extensive network of mobile units, fixed-location studios and control rooms, and modular video displays.
Our objective is to leverage our engineering expertise and technical solutions to deliver superior service and develop long-standing client relationships. We believe our clients view us as a trusted partner who shares their commitment to continuous innovation and the seamless delivery of complex, high-quality productions. Our clients include many of the world’s premier television broadcasters, cable networks and event producers who offer the following live and broadcast productions:
| • | Sports production for well-known media rights holders and related events such as the NFL, PGA, MLB, NHL, NBA, WWE, NCAA, professional tennis, EPL, Olympic Games, World Cup and Commonwealth Games; |
| • | Entertainment production for scripted and unscripted television programming, late night television, awards shows, concert tours and music festivals; and |
| • | Other live event production for corporate events and trade shows. |
Founded in 1986, NEP was first to respond to an unmet need for higher service levels and advanced engineering expertise to support our clients’ live broadcasts. Over time, we have developed a wide range of services and expanded our geographic footprint, building our scale and engineering capabilities. Our strategy of increasing our scale has been accelerated by strategic acquisitions, where we have a proven track record of
1
Table of Contents
effectively sourcing, evaluating and integrating attractive businesses and assets. Today, we believe that the scale of our platform allows us to satisfy increasingly complex client requirements globally, while enabling us to achieve attractive returns on capital. Our offices in 13 countries and experience in more than 65 countries provide us with a global platform from which we serviced over 1,700 clients and more than 10,700 events in 2014. For the three months ended March 31, 2015 and the year ended December 31, 2014, we generated total revenues of $103.1 million and $442.8 million, respectively, net losses of $35.9 million and $41.2 million, respectively and Adjusted EBITDA of $32.1 million and $145.1 million, respectively. For a reconciliation of Adjusted EBITDA to net loss, please see “Summary—Non-GAAP Financial Measure.”
Outsourcing in our industry is driven by the need for greater engineering expertise and technical solutions, as well as the scale and geographic reach offered by a comprehensive service provider like NEP. We offer a wide array of live and broadcast production services to the sports, entertainment and other live event markets in the United States, Europe and Australia:
| • | Remote Production services provide our clients with a mobile control room to facilitate the creation and capture of live content, typically equipped with NEP-owned assets (e.g., cameras and related audio and video equipment) together with an NEP broadcast engineering team. These services are typically provided under long-term contracts with our clients for full season coverage of events and programs throughout the life of their related broadcast rights agreements. We have helped clients broadcast over 20 years of popular sports and live entertainment. For the three months ended March 31, 2015 and the year ended December 31, 2014, our remote production services generated 75% and 74%, respectively, of our total revenues. |
| • | Studio Production services include the supply and operation of studios and/or control rooms that support live and near-live television programming for entertainment clients as well as post-production services. These services are typically provided pursuant to annual contracts and are generally renewed throughout the life of the show. For the three months ended March 31, 2015 and the year ended December 31, 2014, our studio production services generated 9% and 9%, respectively, of our total revenues. |
| • | Video Display services provide our clients with the design and set-up of large-scale, modular, LED video screens and related capabilities. For the three months ended March 31, 2015 and the year ended December 31, 2014, our video display services generated 16% and 12%, respectively, of our total revenues. |
| • | Host Broadcasting includes the provision of technical design, build and operational services (e.g., equipment, satellite facilities and broadcast engineers) to assemble and operate centralized broadcast facilities that enable our clients to receive, produce and distribute content globally for multi-venue events. For the three months ended March 31, 2015 and the year ended December 31, 2014, our host broadcasting services generated 0% and 4%, respectively, of our total revenues. |
Our ability to deliver high-quality technical solutions for our clients is directly related to our ability to hire, train and retain the most experienced and innovative engineers in the industry. Our technical solutions are supported on-site and in real-time by a team of over 800 highly-trained engineers around the globe. Our high-quality equipment and facilities, which are typically designed and procured in connection with a specific long-term contract, are primarily comprised of 118 mobile production units, 46 studios and control rooms and approximately 14,400 square meters of modular LED displays.
Our objective is to stay ahead of our competitors by continually innovating and developing technical solutions that fully leverage the talents of our team and meet our clients’ evolving production, technology and budgetary goals. Our engineers are responsible for driving innovation for our clients and have established NEP’s track record of delivering numerous industry firsts. Our highly skilled integration team, which is dedicated to
2
Table of Contents
design and development, enables us to translate our extensive on-the-ground experience into high-quality solutions. Lastly, our relationships with suppliers and manufacturers provide us with insight into the latest technologies and trends across the live and broadcast event production industry.
In 2014, we were the:
| • | # 1 provider of remote production for Premium Events in the United States, with greater than 70% market share; |
| • | # 1 independent provider of technical control rooms in New York City and Los Angeles; |
| • | # 1 provider of remote production for Premium Events in Australia, with greater than 50% market share; |
| • | # 1 provider of remote production for Premium Events in the United Kingdom (the “U.K.”), with greater than 35% market share; and |
| • | # 1 provider of remote production for Premium Events in the Nordic countries (Norway, Finland, Denmark and Sweden), with greater than 40% market share. |
We have long-standing relationships with many of the world’s premier television broadcasters, cable networks and event producers who offer live and broadcast productions in sports, entertainment and other live events. Many of our clients have partnered with us for over 20 years, which we believe is driven by our track record of quality, reliability and excellence in service and technology. Our clients produce high-value, live content and, therefore, often rely on our ability to perform when given only one opportunity to execute a seamless live broadcast. In close consultation with our clients, our engineering team designs, develops and integrates production solutions that fit our clients’ technology, production and budgetary needs and provides on-site technical support for each event to facilitate high-quality productions. Our client relationships provide us with strong revenue visibility, as a large portion of our annual revenue is derived from multi-year contracts. Our contracts are typically coterminous with our clients’ broadcast or production rights agreements.
As of April 30, 2015 and 2014, our firm contracted revenue backlog for contracts with greater than one year remaining was approximately $673 million and $560 million, respectively, with a weighted average remaining contract length of approximately 4.4 years as of April 30, 2015. Approximately $496 million of our total firm contracted revenue backlog as of April 30, 2015 is not expected to be realized during 2015. In addition, we also generate additional revenues above contracted levels by providing incremental services at events to support expanded client needs, such as shoulder programming (e.g., pre-game, post-game and halftime shows) or additional on-site cameras.
Since 2004, we have completed 19 acquisitions for total consideration of over $700 million. Our acquisition activity has broadened our global footprint and expanded our service offering, enabling us to increase revenues from our clients, achieve cost synergies, cross-sell existing or acquired service offerings and improve our purchasing power with suppliers. Most recently, we acquired Mediatec in April 2015, a remote production company with leading market share in the Nordic countries, and Outside Broadcast, a remote production company in Belgium. The acquisitions are expected to provide us with a platform for organic growth and bolt-on acquisitions, as well as a new cloud-based media production solution known as Mediabank. In January 2014, we acquired Global Television (“GTV”), the market leader in remote production in Australia. This acquisition provided us with a leading position in the Australian market, a platform for potential expansion into the broader Asian markets and a host broadcasting capability that has been leveraged across the NEP platform.
3
Table of Contents
Market Opportunity
We believe that the size of the total addressable market of global live and broadcast production solutions is approximately $19.2 billion, out of which $1.5 billion and $8.1 billion represent existing U.S. and international core service offering opportunities, respectively, and $9.6 billion represents global opportunities in future planned service offerings, including content management, post production, uplink, audio, lighting, stage set design, freight forwarding, playout and technical consulting. As the largest global outsourced provider of comprehensive live and broadcast production solutions, we believe that our economies of scale and deep industry experience allow us to continue expanding our platform through both organic investment and acquisitions in these highly fragmented markets. We also believe that we are well positioned to win a disproportionate amount of the new business that is converted from in-house operations or currently outsourced to a smaller provider as clients seek services from partners with the scale and engineering expertise necessary to deliver high-quality productions.
Over the past decade, demand for high-quality productions with increasingly complex technical needs has driven consolidation within the live and broadcast production industry, especially in the United States. We believe that these same dynamics will support consolidation internationally, with additional support by the increasing demand for global delivery of comprehensive production services. We expect providers with greater scale and global reach will offer increasing competitive advantage, delivering higher-quality services and overall value to clients through long-term relationships. Against this backdrop, we believe there may be opportunities to consolidate markets, increase our scale, and continue to diversify the solutions that we provide to our clients. Our primary end markets include production and related solutions for sports, entertainment and corporate events, where we seek to be a top-tier service provider in all of the markets where we operate. Our scale and expertise position us to take advantage of several end-market trends including:
Increased demand for outsourced solutions
Outsourcing of live and broadcast solutions continues to be driven by the need for greater technical resources and expertise, particularly for live and broadcast productions. We believe that our clients have historically found it difficult to attract, develop and retain the necessary talent to design, construct and deliver high-quality production solutions, including engineers and other technical experts. Today, this outsourcing trend continues, driven by the increasing complexity of some of our clients’ live and broadcast productions, requiring specialized talent and technical capabilities, as well as the scale and geographic reach offered by a comprehensive service provider.
Increased value of live television due to time-shifting of programming
With the advent and continued evolution of digital video recorders (DVR) and Video-on-Demand (VoD) technology, consumers increasingly possess capabilities that speed or avoid delivery of advertisements, resulting in lower advertising value for marketers. Due to these trends, higher value programming has shifted towards content that is not only in high demand among viewers but also much more likely to be viewed live, translating into significantly more value for both marketers and broadcasters. As sporting events and unscripted television tend to be real-time and results-oriented in nature, broadcasters are more aggressively increasing programming in these areas.
Sports: According to The Nielsen Company, the total hours of sports programming aired on television grew over 240% from 2004 to 2014. In order to take advantage of the premium advertising spend, broadcasters have increased the segmentation of live sports broadcasting content, including pre-game and post-game analysis as well as halftime entertainment, highlights and replay shows. Each additional event potentially generates incremental demand for our services.
Unscripted Television Programming: After a decade of growth, broadcaster and consumer focus on unscripted television content has remained strong. According to Nielsen’s weekly ratings, unscripted
4
Table of Contents
television shows have accounted for as many as seven out of the top ten highest rated television broadcast programs in the United States in the last six months. Unscripted programming typically requires higher use of outsourced production solutions that we offer, including remote and studio production, video display, transmission and post-production services.
Increase in global consumer demand for live sports programming
According to The Nielsen Company, individual consumption of sports related content has grown over 21% from 2004 to 2014. One of the drivers of this increase is sports globalization; for instance, the EPL has recently granted broadcast rights to NBC for all of its regular season games through the 2016 season as a means to expand access to United States viewers. With the ability to broadcast globally, leagues are broadcasting games from all over the world, not just in their domestic markets. As domestic leagues expand into foreign markets, they will need reliable production partners to deliver and operate key production equipment all over the world. Given that each league has unique preferences in capturing, editing and broadcasting data, we believe they will require comprehensive service offerings to ensure seamless production as the number of international broadcasts increases. According to SNL Kagan, the value of the most recent NFL, MLB and NBA broadcast rights agreements have increased between 60% to 170% as compared to the prior contracts.
Growing global content consumption across all media genres
Technological advancements have enabled consumers of all age, race and ethnicity groups to consume media content with more presence than ever before. According to Nielsen’s Cross-Platform Report, during the fourth quarter of 2014, the average American adult spent approximately 5% more time per day, compared to the fourth quarter of 2012, consuming media through live television, time-shifted television and smartphones. This increased demand for content continues to fuel the proliferation of content delivery alternatives. For instance, the number of cable channels has increased approximately 400% since 1995, according to SNL Kagan. As a result, broadcasters focus on delivering premium programming through HD content or exclusive events in order to generate larger, captive and loyal audiences. These trends are particularly relevant to remote production services providers such as NEP, as our ability to generate revenue is typically unaffected by the content delivery method (e.g. internet, cable and satellite streaming video services), and therefore, we generally benefit from increased content creation.
Continued increase in outsourced studio production by broadcasters
As outsourced production and new media content proliferation trends continue, we believe specialized technical and engineering experts will be required to design and deliver the technical solutions to support this content. In some markets this trend is already apparent. For instance, New York has experienced 50% growth in production of television series since 2011. Similarly in the U.K., multichannel broadcaster expenditures on independent production grew at a 26% compound annual growth rate between 2004 and 2012 according to data from the Commercial Broadcasters Association. To further support production outside of a broadcaster’s location, several international and domestic markets are providing tax incentives to promote foreign television production where the broadcasters likely have no established studio or control room facilities including British Columbia, the U.K., New York and Connecticut. We believe independently operated studio providers are poised to benefit from the increase in demand for technical services, crewing support and studio facilities driven by the new content and incentives provided in key studio production markets.
5
Table of Contents
A resurgence in live music concerts, tours and festivals and other live event services generating demand for mobile broadcasting service and display technology
The transition of recorded music to digital media has resulted in electronic distribution and digital music streaming, which represents a growing portion of industry revenue and has left the music industry susceptible to piracy. These changes have led musicians to target touring and live events as a more stable source of revenue. According to a Billboard survey in May 2015, concert revenue accounted for more than 80% of revenue in the music industry in 2014.
Focus on the live music sector is growing, while the venues at which live concert and events are held are becoming larger; in the last five years, multiple arenas and stadiums have been replaced, in some cases increasing attendance by approximately 50%. Audiences are demanding a more immersive experience, which includes more advanced features such as the ability to stream events remotely. Additionally, music festivals, which require advanced technical capabilities, are becoming increasingly popular, with 32 million people attending at least one festival a year in the United States in 2014, as reported by Nielsen. We believe these trends will create further opportunities for live and broadcast production solutions providers, such as NEP, to expand service offerings for live events (e.g. display, projection, audio and lighting), as well as the opportunity to provide other value added services (e.g. content management, live event management and technical consulting).
Our Competitive Strengths
We believe the following are among our core competitive strengths and enable us to differentiate ourselves in the markets we serve:
Market leader in comprehensive live and broadcast production solutions, with global reach, expansive scale and breadth of service offerings
We are the largest global outsourced provider of comprehensive live and broadcast production solutions to the sports, entertainment and other live events markets. We offer a diverse array of services primarily in the United States, Europe and Australia and have serviced events in more than 65 countries. The depth and breadth of our platform is supported by over 800 experienced engineers and an extensive portfolio of mobile and studio assets including 118 mobile production units, 46 studios and control rooms and 14,400 square meters of modular LED displays.
Our global reach, expansive scale and breadth of service offerings provide us with a number of competitive advantages, including the ability to:
| • | Deliver “Gold Standard” Service—We are able to deliver best-in-class performance, allowing us to create and maintain long-term client relationships. Our “Gold Standard” service is made possible due to the performance of our experienced, technically-skilled engineers and in-house designed technical solutions. We believe our clients view us as a trusted partner who shares their commitment to high-quality productions; |
| • | Leverage Scale and Geographic Reach to Satisfy Complex Client Needs—We are able to leverage our scale to deliver a compelling value proposition to our clients, who are increasingly demanding global delivery of complex integrated services, while maintaining the expertise and footprint to remain nimble and responsive; |
| • | Achieve Attractive Economics by Differentiation through Innovation and Scale—Our combination of engineering expertise, technical solutions and unparalleled global platform represent significant competitive differentiation. Our increased negotiating power with key suppliers provides lower cost and ready access to new technology across our global footprint, which helps us achieve attractive returns on capital; |
6
Table of Contents
| • | Efficiently Repurpose Owned Technical Solutions—Our geographic reach and diversified service offerings allow us to optimize the useful life and revenue-generating potential of our assets by selectively repurposing existing assets and solutions into markets with lesser technical requirements; and |
| • | Consistently Maintain Financial Performance—The diversity of our clients, markets and service offerings has enabled us to maintain substantially consistent historical financial performance across economic cycles, characterized by long-term growth in long-term Adjusted EBITDA and free cash flow. |
Award-winning technology leader providing innovative, mission-critical production solutions
We offer our clients the latest in live and broadcast production technology, allowing us to deliver industry-leading comprehensive live and broadcast production solutions which enable high-quality productions. We were one of the first movers in successfully transitioning remote production from standard (SD) to high definition (HD) technology and we strive to be at the forefront of new technologies and broadcast innovations. Our clients rely on the depth of our engineering team’s technical expertise to match existing market technologies and capabilities with their specifications. Through the design, development and implementation of mission-critical production solutions, our engineering personnel become highly integrated within our clients’ organizations. These engineers, together with our in-house integration teams, also have a strong record of innovation for our clients. Examples of such innovation include low latency wireless camera solutions, innovative video display set designs and automation of the configuration process for production monitor walls. Our success and technology leadership has been recognized through numerous awards, including seven of the last ten Sports Emmy Technical Team Remote awards, Emmy Awards for technical excellence, five Sports Broadcasting Hall of Fame inductees, two technology leadership awards from Broadcasting & Cable Magazine four Pollstar Awards, four Parnelli Awards and a design award from the National Association of Broadcasters.
Strong culture of innovation and technical excellence driven by superior people development
Our culture of innovation and technical excellence is at the foundation of our business model. We believe our ability to deliver consistently high-quality, comprehensive outsourced production solutions for our clients is directly related to our ability to hire, train and retain the finest and most innovative engineers in the industry. Taking advantage of our global reach and depth of expertise, we provide numerous education and training opportunities to our engineering teams. Since 2006, we have offered a rigorous two-year training program for our new hires known as the NEP Mobile Unit Engineer Apprentice Program. Additionally, our Engineer Exchange Program provides engineers the opportunity to travel to one of our overseas locations to work alongside regional engineering teams and exchange know-how, facilitate integration of newly acquired assets and better equip themselves for global service delivery. Our engineers are also involved in the research and development process, enhancing their capability to troubleshoot and support our clients on site. As a result, we believe that we have earned a reputation as an employer of choice in the outsourced production industry. This is evidenced by the low levels of turnover among our engineers, who have an average tenure of 6.5 years, helping to develop continuity in customer relationships and depth of technical expertise, based on live and diverse experience.
Proven ability to successfully execute and integrate acquisitions, adding new companies to the NEP worldwide network
We believe there are strong benefits to achieving scale in live and broadcast production solutions, where many clients are looking for full-service solutions across multiple geographies. Therefore, we view acquisitions as an important component of our business strategy and intend to continue to pursue attractively-priced acquisitions. We target companies that enjoy leading market share positions, generate strong cash flow, are culturally aligned with NEP and offer a mix of new services, clients and geographic access.
7
Table of Contents
We have a strong in-house M&A team with significant experience that provides support with identification, evaluation, diligence and integration. The production solutions markets are large and highly fragmented with many attractive targets. Based on our acquisition track record and the favorable view of NEP from target management teams, NEP is typically viewed as a credible buyer to potential acquisition targets, which has allowed us to continue to grow our pipeline of opportunities. Our experienced in-house M&A team is regularly engaged in acquisition discussions and has a pipeline of several potential targets under consideration.
We have consummated and integrated 19 acquisitions since 2004. These acquisitions have expanded our geographic reach in remote production, studio production and video display and have added service offering capabilities in host broadcasting, post production and uplink. In the United States, we have consolidated several remote production players which serve sports broadcasts, including Corplex, MIRA Mobile, National Mobile Television, New Century Production and Trio Video. Within the video display market we have built scale through the acquisitions of Screenworks, American Hi-Def and Sweetwater. We entered the U.K. market with the acquisition of Visions in 2004 and have subsequently added capabilities across remote and studio production with the acquisitions of Bow Tie Video, Cymru, Roll To Record and the Screen Scene Group. We entered the Australian market in 2014 with the acquisition of GTV and further strengthened our platform there with the acquisition of Silk Studios. We further grew our European platform in December 2014 with the acquisition of Faber in the Netherlands and, most recently in April 2015, we acquired Mediatec and Outside Broadcast, extending our network to the Nordic and DACH countries (Switzerland, Germany and Austria).
Attractive operating model with high level of contracted revenue and strong free cash flows
Our annual revenue historically has been highly predictable, with strong revenue visibility and relatively limited sensitivity to significant macroeconomic changes. As of April 30, 2015 and 2014, our firm contracted revenue backlog for contracts with one or more years remaining was approximately $673 million and $560 million, respectively. Approximately $496 million of our total firm contracted revenue backlog as of April 30, 2015 is not expected to be realized during 2015. Our long-term contracts typically range from three to seven years with certain contracts lasting up to 12 years and had a weighted average remaining life of 4.4 years as of April 30, 2015. In addition to this contracted revenue stream, our long-term client relationships provide for a significant amount of recurring revenue. These factors have contributed to the consistency of our historical financial performance across economic cycles. We also have limited exposure to individual client risk, with no single client group accounting for more than 14% of revenue for the year ended December 31, 2014.
In addition to high levels of contracted revenue, there are several factors which have contributed to our strong historical generation of free cash flow. Much of our capital investment is success-based, with significant capital investments typically tied to new or renewed client contracts. Pricing for these contracts is market-based, but supported by internal rate of return criteria that we evaluate prior to entering into a new contract. In addition, given our size and scale, we are able to optimize the useful life of assets by repurposing assets and solutions into markets with lesser technical requirements. We also benefit from modest working capital requirements; well-maintained, long-lived equipment, which limits our near-term maintenance capital expenditure requirements; and, as of December 31, 2014, approximately $182.6 million in U.S. Federal net operating losses in addition to state and foreign net operating losses, which, subject to some limitations, are expected to support increased free cash flow.
8
Table of Contents
Long-term relationships with high-profile clients driven by the delivery of high-quality comprehensive live and broadcast production solutions
We have a long track record of delivering high-quality comprehensive live and broadcast production solutions to our clients. Our clients include premier broadcasters, event producers and cable networks, and our services are mission-critical to enable their productions across the globe. As our clients increasingly demand the integrated delivery of complex, comprehensive services on a global scale, we believe that our ability to be nimble and responsive in leveraging our growing global platform and capabilities, such as host broadcasting and flypacks, also becomes a key differentiating factor in maintaining and creating long-term client relationships.
We believe our reputation for superior service, demonstrated through our history of consistent, long-term coverage of high-profile sports, entertainment and other live events, together with our intimate knowledge of clients’ operations, preferences and technology needs, provide our existing clients with strong incentives to renew contracts with us. In 2014, over 83% of our contracted revenue came from repeat contracts.
Strong, diverse management team supported by deep bench of industry-leading talent
Our management team possesses a combination of long-time NEP experience, related industry backgrounds and functional area expertise. Members of our senior management team average 12 years with our Company, during which time they have cultivated strong client relationships and serviced thousands of events. Our management team has positioned us as a leader in our markets and has successfully marketed our services to retain and grow market share over time. Further, our management team has demonstrated its ability to successfully identify and execute acquisition and growth strategies on a global scale.
Our Strategy for Growth
Our multi-faceted growth strategy is to continue to pursue strategic acquisitions and expand our global scale while further developing our industry-leading technical solutions, engineering expertise and deep client relationships. Our strategy has historically allowed us to achieve strong margins, cash flow growth and attractive returns on capital. The key components of our strategy are:
Continue to pursue strategic acquisitions to improve our scale, reach and value to our clients
Acquisitions are an important component of our growth strategy. We believe that many of our clients increasingly favor scale providers to service their broadcasts and live events in order to meet their needs for the global delivery of high-quality and technically-complex productions. Since 2004, we have acquired and successfully integrated 19 businesses for total consideration of over $700 million. These acquisitions have added new leadership and engineering expertise to our platform, helped diversify our revenue mix and increased the scale and reach of our global service offerings, while enabling us to achieve cost synergies, cross-sell services and improve purchasing power. Most recently, in April 2015, we expanded our remote production and studio production capabilities by acquiring Mediatec and Outside Broadcast, extending our reach into the Nordic and DACH countries, as well as Belgium. In January 2015, we acquired the Screen Scene Group, extending our reach into Ireland and expanding our presence in the U.K., while also adding remote production and video display capabilities in these geographies. During 2014, we acquired GTV, Silk Studios and Faber; these acquisitions together provide entry into Asia and Continental Europe broadly, as well as new capabilities to deliver remote production, video display and host broadcasting services from local offices in Europe, Australia and the Middle East.
We utilize a targeted approach to identify and evaluate acquisition candidates based on quantitative and qualitative criteria, including market position and reputation, cash flow profile, return on capital, service mix and culture. Our leading market positions, global scale, ample track record integrating acquisitions and access to
9
Table of Contents
capital provide us with a competitive advantage in attracting potential sellers. We believe that there will continue to be an attractive pipeline of available acquisition candidates for us to consider and we intend to continue to aggressively pursue opportunities within broadcasting, live events and other value added services.
Expand global platform through continued consolidation and other growth initiatives
In addition to the acquisitions of Mediatec and Outside Broadcast, we are working to expand our operations within our existing international footprint, including the U.K., Continental Europe, Australia and the Middle East, both organically and through potential acquisitions. We believe that we have the opportunity to selectively consolidate smaller providers and win new outsourced production contracts in these geographic markets.
Once we have an established position in a geographic market with our core service offering, often through the acquisition of a successful regional or local player, we are able to further leverage the NEP platform with bolt-on acquisitions. This strategy has been successful over the past decade for NEP in the United States, and we intend to apply the same approach to international markets that are more highly-fragmented today. These acquisitions are typically similar in return and risk profile to organic growth through new signed contracts, while also offering the opportunity for increased utilization and cost synergies.
We are also able to leverage our existing operations to drive organic growth opportunities with both new and existing clients. For example, following our acquisition of Australia-based GTV which brought new host broadcasting capabilities to NEP, we were able to roll-out these services beyond the Australia market in 2014, most notably with the Commonwealth Games. In addition, we have been able to utilize high profile global events, such as the Olympic Games and Wimbledon, to raise our profile and establish new client relationships in our existing geographies.
Develop complementary products and services to increase our penetration with existing clients
We continually evaluate opportunities to serve our clients’ additional or adjacent production needs, organically or through acquisitions. These offerings may include lighting and audio solutions for live events, rigging infrastructure for stage productions, operations and logistics management and various other play-out and feed monitoring services. Many of these services are complementary to our existing technical solutions, allowing us to provide a more comprehensive set of services to our existing clients. We seek to leverage our existing expertise and service offerings to further penetrate our clients’ organizations and capture a greater share of their rapidly evolving production needs. We are in a strong position to evaluate the demand characteristics and overall adoption potential of adjacent service offerings given the depth to which we are integrated into our clients’ production workflow.
Continue to invest in human capital and client-driven service offerings to further sustain and enhance our leadership position
We believe that we have the most experienced live and broadcast event production engineering team in the industry. We seek to be the employer-of-choice for highly-skilled technical and engineering experts, who are integral to delivering superior services to our clients. We have made, and will continue to make, significant investments in the development of comprehensive technical solutions in the areas of broadcast, live events and other value-added services. As content delivery standards in our industry advance, we are focused on ensuring our portfolio of services delivers the greatest value for our clients, enabling us to grow with them as their production needs expand. We believe that our innovative capabilities are vital to maintaining our long-term relationships with our clients as well as developing new opportunities. Across all of our operations, we remain committed to hiring, training and retaining the industry’s most skilled engineers to strengthen and expand our offerings, delivering innovative solutions for our clients.
10
Table of Contents
Recent Developments
Consolidated Media Industries Acquisition
On July 8, 2015, we entered into a definitive agreement to acquire Consolidated Media Industries B.V. (“CMI”). Headquartered in the Netherlands, CMI operates both the DutchView and Infostrada Creative Technologies brands. DutchView is one of the leading providers of solutions for remote production and studio production in Northern Europe. Infostrada Creative Technologies is an innovative provider of solutions for the creation, management and distribution of video content. The acquisition is expected to expand our reach in Northern Europe and add extensive video and media management solutions to our offerings. The aggregate purchase price for CMI is expected to be approximately 92.0 million EUR, or $101.9 million (based on currency exchange rates as of July 8, 2015), in cash consideration and the assumption of CMI’s existing debt. The purchase price will be subject to certain adjustment between the date of signing and the closing of the transaction. The acquisition is expected to close in the third quarter of 2015, subject to certain closing conditions. We intend to use cash on hand and borrowings under our revolving credit facility to fund a portion of the CMI acquisition price. See “Use of Proceeds.”
Mediatec Acquisition
On April 29, 2015, we closed the acquisition of Mediatec, a leading outsourced production services provider in the Nordic and DACH countries, with headquarters in Sweden. This acquisition provides NEP with an established presence in the Nordic and DACH countries from which to grow its remote production and studio production service offerings, as well as complement the existing video display service offering under Faber. The aggregate purchase price for Mediatec was approximately 696.4 million SEK, or $81.0 million (based on currency exchange rates as of April 29, 2015), in cash consideration and included the assumption of Mediatec’s existing debt of approximately 408.8 million SEK, or $47.5 million.
Outside Broadcast Acquisition
On April 29, 2015, we closed the acquisition of Outside Broadcast, a leading outsourced production services provider in Belgium. This acquisition provides NEP with an established presence in Continental Europe from which to grow its remote production and studio production service offerings. The aggregate purchase price for Outside Broadcast was approximately 10.6 million EUR, or $11.5 million (based on currency exchange rates as of April 29, 2015). In connection with the Outside Broadcast acquisition, we assumed debt of approximately 10.3 million EUR, or $11.2 million. The debt balance is comprised of outstanding loans, including a line of credit and capital leases with third party financial institutions.
The aggregate purchase price for each of the Outside Broadcast and Mediatec acquisitions was funded in part by additional borrowings of $75.0 million under our second lien term loan and $25.0 million in proceeds from the issuance of 1,750,002 shares of our common stock to certain of our existing stockholders. On April 30, 2015, we also issued 237,306 shares of our common stock to certain members of management and other accredited investors of Mediatec and Outside Broadcast. See “Capitalization.”
Preliminary Estimates of Selected Second Quarter 2015 Financial Information
We are in the process of preparing our consolidated financial statements for the quarter ended June 30, 2015. The following are the preliminary estimates of the financial information listed below for the three months and six months ended June 30, 2015.
11
Table of Contents
Total revenue is expected to be in the range of $141.4 million to $147.4 million for the three months ended June 30, 2015, compared to $117.7 million of total revenue for the three months ended June 30, 2014. Total revenue is expected to be in the range of $244.5 million to $250.5 million for the six months ended June 30, 2015, compared to $212.9 million of total revenue for the six months ended June 30, 2014.
Net loss is expected to be in the range of $14.3 million to $11.3 million for the three months ended June 30, 2015, compared to $0.9 million of net income for the three months ended June 30, 2014. Net loss is expected to be in the range of $50.2 million to $47.2 million for the six months ended June 30, 2015, compared to $9.8 million of net loss for the six months ended June 30, 2014.
Adjusted EBITDA for the three months ended June 30, 2015 is expected to be between $43.0 million and $46.0 million compared to $42.4 million for the three months ended June 30, 2014. Adjusted EBITDA for the six months ended June 30, 2015 is expected to be between $75.1 million and $78.1 million compared to $69.4 million for the six months ended June 30, 2014 (see next page for a reconciliation of estimated Adjusted EBITDA to estimated net income, the most directly comparable measure calculated in accordance with generally accepted accounting principles (“GAAP”)). The estimated increase in our Adjusted EBITDA for the three and six months ended June 30, 2015 as compared to the prior year period is based on the accretive results of the acquisitions of MIRA, Faber, Screen Scene Group, Mediatec and Outside Broadcast, partially offset by a decrease due to the coverage of the 2014 Winter Olympic games, which positively impacted the prior year, and lower foreign currency exchange rates year over year.
Capital expenditures are expected to be in the range of $24.8 million to $28.8 million for the three months ended June 30, 2015, compared to $31.4 million of capital expenditures for the three months ended June 30, 2014. Capital expenditures are expected to be in the range of $61.0 million to $65.0 million for the six months ended June 30, 2015, compared to $46.3 million of capital expenditures for the six months ended June 30, 2014.
The preliminary financial information above has been prepared on a basis substantially consistent with our consolidated financial statements included elsewhere in this prospectus and in good faith based upon our internal reporting as of and for the three months ended June 30, 2015. These estimated ranges are preliminary and unaudited and are thus inherently uncertain and subject to change as we complete our financial closing procedures for the three months ended June 30, 2015. In particular, depreciation and amortization expense for the three months ended June 30, 2015 includes estimates related to the acquired fair market values of the Mediatec and Outside Broadcast acquisitions, which were recently completed. These estimates are preliminary pending the completion of fixed asset and intangible valuations which are in progress. Actual results may differ materially from the estimated preliminary financial information above. Our independent registered public accounting firm has not audited, reviewed, compiled, or performed any procedures with respect to the preliminary financial information presented above. Accordingly, our independent registered public accounting firm does not express an opinion or any other form of assurance with respect to this information.
Our consolidated financial statements and related notes as of and for the three months ended June 30, 2015 are not expected to be filed with the SEC until after this offering is completed.
12
Table of Contents
The following table shows the reconciliation of net income (loss) to Adjusted EBITDA for the three months and six months ended June 30, 2014 along with the estimated range for the three and six months ended June 30, 2015. The line items in the table for the three months and six months ended June 30, 2015 are estimates and are subject to the qualifications set forth above:
| ($ in millions) | Three Months Ended June 30, 2015 |
Six Months Ended June 30, 2015 |
Three Months Ended June 30, 2014 |
Six Months Ended June 30, 2014 |
||||||||||||||||||||
| Low | High | Low | High | |||||||||||||||||||||
| Net income (loss) |
$ | (14.3 | ) | $ | (11.3 | ) | $ | (50.2 | ) | $ | (47.2 | ) | $ | 0.9 | $ | (9.8 | ) | |||||||
| Adjustments: |
||||||||||||||||||||||||
| Interest Expense |
14.1 | 14.1 | 26.0 | 26.0 | 10.6 | 20.9 | ||||||||||||||||||
| Depreciation and amortization |
41.5 | 41.5 | 78.4 | 78.4 | 32.5 | 62.7 | ||||||||||||||||||
| Income tax expense (benefit) |
0.2 | 0.2 | 5.1 | 5.1 | (0.9 | ) | (4.1 | ) | ||||||||||||||||
| Stock-based compensation |
0.6 | 0.6 | 1.1 | 1.1 | 0.5 | 1.0 | ||||||||||||||||||
| Acquisition activity expenses |
3.2 | 3.2 | 6.0 | 6.0 | 0.7 | 1.7 | ||||||||||||||||||
| Write off of unamortized debt issuance costs |
0.7 | 0.7 | 0.7 | 0.7 | — | 0.5 | ||||||||||||||||||
| Other income |
(8.0 | ) | (8.0 | ) | (9.6 | ) | (9.6 | ) | (3.7 | ) | (6.5 | ) | ||||||||||||
| Other expense |
5.1 | 5.1 | 17.8 | 17.8 | 1.7 | 2.4 | ||||||||||||||||||
| Miscellaneous expenses (income) |
(0.1 | ) | (0.1 | ) | (0.2 | ) | (0.2 | ) | 0.2 | 0.7 | ||||||||||||||
|
|
|
|
|
|
|
|
|
|
|
|
|
|||||||||||||
| Adjusted EBITDA |
$ | 43.0 | $ | 46.0 | $ | 75.1 | $ | 78.1 | $ | 42.4 | $ | 69.4 | ||||||||||||
Our Equity Sponsor
Founded in 2004, Crestview Partners is a value-oriented private equity firm focused on the middle market. The firm is based in New York and manages funds with over $7 billion of aggregate capital commitments. The firm is led by a group of partners who have complementary experience and distinguished backgrounds in private equity, finance, operations and management. Crestview’s senior investment professionals primarily focus on sourcing and managing investments in each of the specialty areas of the firm: media, energy, financial services, healthcare and industrials. As used in this prospectus, “Crestview Partners” or “Crestview” refers to Crestview Advisors, L.L.C., a registered investment adviser to private equity funds, including funds affiliated with Crestview Partners II GP, L.P., which, following this offering, will continue to be our controlling stockholder as the owner of approximately 57.2% of our common stock (or approximately 54.4% if the underwriters exercise their option to purchase additional shares in full).
Risk Factors
Investing in our common stock involves risks. In particular, the following consideration may affect our competitive strengths or have a negative effect on our strategy, which could cause a decrease in the price of our common stock and a loss of all or part of your investment:
Risks Related to Our Business
| • | We face competition in our existing markets and may be subject to increased competitive pressures for our services. |
| • | We may lose business as a result of the vendor diversification efforts of our clients. |
13
Table of Contents
| • | An adverse realignment of broadcast rights could have a material adverse effect on our business, results of operations, financial condition and cash flow. |
| • | We have numerous individual contracts at any one time, but often several are with a single client or client group. If a substantial portion of our client contracts terminate and we are unable to successfully renew or replace these contracts on comparable terms, then our business, results of operations, financial condition and cash flow could be adversely affected. |
| • | If the estimates and assumptions we use to determine the size of our target market are inaccurate, our future growth rate may be impacted and our business would be harmed. |
| • | Labor strikes and lock-outs for major sports leagues constitute force majeure events under certain of our client contracts. |
| • | The sporting and other live events that our clients broadcast are highly sensitive to popular viewership preferences and our clients may be unable to anticipate changes in consumer preferences, which may result in any particular event or show underlying our contracts not being renewed. |
| • | We may not be able to respond to rapid changes in technology. |
| • | We lease our studios and may not be able to pass increases in rents to our studio production clients. |
| • | Our business depends on our senior management and other key personnel. |
| • | Our level of indebtedness could materially and adversely affect our financial condition. |
| • | Our indebtedness has floating interest rates and we do not currently hedge against the risk of interest rate increases. |
| • | Our credit facilities contain restrictions that limit our flexibility in operating our business. |
| • | Our results have been adversely affected by economic uncertainty or deteriorations in economic conditions, and may be similarly affected in the future. |
| • | Our sales and operations are subject to the economic, political, legal and business conditions in the countries in which we do business, and our failure to operate successfully or adapt to changes in these conditions could limit or disrupt our sales and operations. |
| • | We face risks relating to currency fluctuations and currency exchange. |
| • | We could be adversely affected by violations of the FCPA and similar worldwide anti-bribery laws. |
| • | We have significant intangible assets including goodwill and may experience impairment of goodwill or other intangible assets. |
| • | Limitations on our ability to utilize our net operating losses may negatively affect our financial results. |
| • | Significant increases in the costs of insurance, insurance claims or our deductibles may negatively affect our profitability. |
Risks Related to Acquisitions
| • | We may be unsuccessful in identifying and consummating suitable acquisitions, which may negatively impact our acquisition growth strategy. |
| • | The due diligence process that we undertake in connection with acquisitions may not reveal all facts that may be relevant in connection with an acquisition. |
| • | We may face difficulty integrating the operations of the businesses we have acquired and may acquire in the future. |
14
Table of Contents
| • | We typically retain the management of the businesses we acquire and rely on them to continue operating the acquired businesses, which leaves us vulnerable in the event they leave our Company. |
| • | Federal, state and foreign taxation of business combinations may discourage business combinations. |
| • | We may seek to raise funds, finance acquisitions or develop strategic relationships by issuing additional shares of common stock that would dilute your ownership. |
Risks Related to this Offering and Ownership of Our Common Stock
| • | Our sponsor controls us and their interests may conflict with or differ from your interests as a stockholder. |
| • | We are a “controlled company” within the meaning of the New York Stock Exchange (“NYSE”) rules and, as a result, qualify for and rely on exemptions from certain corporate governance requirements. |
| • | Internal control deficiencies have been identified that constituted a material weakness and significant deficiencies in our internal control over financial reporting. If one or more material weaknesses or significant deficiencies recur or if we fail to establish and maintain effective internal control over financial reporting, our ability to accurately report our financial results could be adversely affected. |
This list is not exhaustive. For a discussion of these risks and other considerations that could negatively affect us, including risks related to this offering and our common stock, see “Risk Factors” and “Forward-Looking Statements.”
Emerging Growth Company Status
We are an “emerging growth company” as defined in the Jumpstart Our Business Startups Act, or “JOBS Act.” For as long as we are an emerging growth company, unlike other public companies, we will not be required to:
| • | provide an auditor’s attestation report on management’s assessment of the effectiveness of our system of internal control over financial reporting pursuant to Section 404(b) of the Sarbanes-Oxley Act of 2002; |
| • | comply with any new requirements adopted by the Public Company Accounting Oversight Board, or the PCAOB, requiring mandatory audit firm rotation or a supplement to the auditor’s report in which the auditor would be required to provide additional information about the audit and the financial statements of the issuer; |
| • | comply with any new audit rules adopted by the PCAOB, unless the Securities and Exchange Commission determines otherwise; |
| • | provide certain disclosure regarding executive compensation required of larger public companies; or |
| • | obtain unitholder approval of any golden parachute payments not previously approved. |
We will cease to be an “emerging growth company” upon the earliest of:
| • | when we have $1.0 billion or more in annual revenues; |
| • | the date on which we become a “large-accelerated filer” (i.e., the end of the fiscal year on which the total market value of our common equity securities held by non-affiliates is $700.0 million or more as of the preceding June 30th); |
| • | when we issue more than $1.0 billion of non-convertible debt over a three-year period; or |
| • | the last day of the fiscal year following the fifth anniversary of our initial public offering. |
15
Table of Contents
In addition, Section 107 of the JOBS Act also provides that an emerging growth company can take advantage of the extended transition period provided in Section 7(a)(2)(B) of the Securities Act for complying with new or revised accounting standards. In other words, an emerging growth company can delay the adoption of certain accounting standards until those standards would otherwise apply to private companies. However, we are choosing to “opt out” of such extended transition period and, as a result, will comply with new or revised accounting standards on the relevant dates on which adoption of such standards is required for non-emerging growth companies. Section 107 of the JOBS Act provides that our decision to opt out of the extended transition period for complying with new or revised accounting standards is irrevocable.
Corporate History Information
We were incorporated as a Delaware corporation in December 2012. Our predecessors began operations over 27 years ago. Our corporate headquarters is located at 2 Beta Drive, Pittsburgh, PA 15238. Our telephone number is (800) 444-0054. Our website address is http://www.nepinc.com. The information on our website is not deemed to be part of this prospectus.
16
Table of Contents
The Offering
| Common stock offered by us |
13,000,000 shares. |
| Option to purchase additional shares |
We have granted the underwriters an option to purchase up to an additional 1,950,000 shares from us, at the initial public offering price, less the underwriting discounts and commissions, within 30 days from the date of this prospectus. |
| Total shares of common stock outstanding after this offering |
37,707,981 shares (or 39,657,981 shares, if the underwriters exercise in full their option to purchase additional shares). |
| Use of proceeds |
We expect to receive approximately $190,500,000 of net proceeds (or approximately $219,750,000 if the underwriters exercise in full their option to purchase additional shares) (based upon the assumed initial public offering price of $16.00 per share, the midpoint of the range set forth on the cover page of this prospectus) from the sale of the common stock offered by us, after deducting underwriting discounts and commissions and estimated offering expenses payable by us. Each $1.00 increase (decrease) in the public offering price would increase (decrease) our net proceeds by approximately $12.2 million. |
| We intend to use $69.0 million of net proceeds from this offering to repay borrowings and related fees and expenses outstanding under our revolving credit facility and $85.9 million of net proceeds from this offering to repay borrowings and related fees and expenses outstanding under our second lien term loan, with any remaining net proceeds to be used for general corporate purposes, including to fund acquisitions. We intend to use cash on hand and borrowings under our revolving credit facility to fund a portion of the CMI acquisition price. |
| Directed Share Program |
At our request, the underwriters have reserved for sale at the initial public offering price up to 650,000 shares offered hereby for officers, directors, employees and certain other persons associated with us. The number of shares available for sale to the general public will be reduced to the extent such persons purchase such reserved shares. Any reserved shares not so purchased will be offered by the underwriters to the general public on the same basis as the other shares offered hereby. Any participants in this program shall be prohibited from selling, pledging or assigning any shares sold to them pursuant to this program for a period of 180 days after the date of this prospectus. Please read “Underwriting (Conflicts of Interest).” |
| Dividend policy |
We do not anticipate paying any cash dividends on our common stock. |
| Conflicts of Interest |
In connection with the repayment of certain borrowings under our credit facilities, affiliates of each of Barclays Capital Inc. and Morgan Stanley & Co. LLC are expected to receive a portion of the net |
17
Table of Contents
| proceeds of this offering in their capacities as lenders. See “Use of Proceeds.” These proceeds will give the affiliates of Barclays Capital Inc. and Morgan Stanley & Co. LLC more than 5% of the proceeds of this offering, and consequently, each of Barclays Capital Inc. and Morgan Stanley & Co. LLC will be deemed to have a “conflict of interest” within the meaning of FINRA Rule 5121(f)(5)(C). Accordingly, this offering will be made in compliance with the applicable provisions of Rule 5121. As such, any underwriter that has a conflict of interest pursuant to Rule 5121 will not confirm sales to accounts in which it exercises discretionary authority without the prior written consent of the customer. Pursuant to Rule 5121, a “qualified independent underwriter” (as defined in Rule 5121) must participate in the preparation of the prospectus and perform its usual standard of due diligence with respect to the registration statement and this prospectus. RBC Capital Markets, LLC has agreed to act as qualified independent underwriter for the offering and to undertake the legal responsibilities and liabilities of an underwriter under the Securities Act of 1933, as amended, or the Securities Act, specifically including those inherent in Section 11 of the Securities Act. We have also agreed to indemnify RBC Capital Markets, LLC against certain liabilities incurred in connection with it acting as a qualified independent underwriter in this offering, including liabilities under the Securities Act. See “Underwriting (Conflicts of Interest).” |
| Listing and trading symbol |
Our common stock has been approved for listing on the NYSE under the symbol “NEPG.” |
| Risk factors |
You should carefully read and consider the information beginning on page 23 of this prospectus set forth under the heading “Risk Factors” and all other information set forth in this prospectus before deciding to invest in our common units. |
Unless the context requires otherwise, the number of shares outstanding after completion of this offering is based on 24,707,981 shares of common stock outstanding as of July 13, 2015.
The information above excludes:
| • | 4,758,958 shares of common stock available for issuance under our 2015 Long-Term Incentive Plan (the “LTIP”), that we intend to adopt in connection with the completion of this offering. |
| • | 2,141,562 shares of common stock issuable upon exercise of outstanding options as of March 31, 2015, at a weighted average exercise price of $9.96 per share. |
| • | 1,982,899 shares of common stock available for issuance under our Employee Stock Purchase Plan (the “ESPP”), that we intend to adopt in connection with the completion of this offering. |
18
Table of Contents
Summary Historical Condensed Consolidated Financial Data
The following table presents certain summary historical condensed consolidated financial data. On December 24, 2012, NEP Group, Inc. acquired ASP NEP/NCP Holdco, Inc., the accounting predecessor of NEP Group, Inc. (the “Predecessor”). Therefore, we present below certain summary historical condensed consolidated financial data of the Predecessor as of and for the 358-day period ended December 23, 2012.
The summary historical financial data as of March 31, 2015 and for the three months ended March 31, 2015 and 2014 is derived from the unaudited condensed consolidated financial statements and the notes thereto included elsewhere in this prospectus. The summary historical financial data as of and for the years ended December 31, 2014 and 2013, as of December 31, 2012, and for the period from NEP Group, Inc.’s inception on December 24, 2012 through December 31, 2012 is derived from the audited consolidated financial statements and the notes thereto included elsewhere in this prospectus. The summary historical financial data for the 358-day period ended December 23, 2012 is derived from the audited consolidated financial statements of the Predecessor included elsewhere in this prospectus.
19
Table of Contents
The financial data set forth below is only a summary and is not complete. It also does not necessarily indicate or represent anything about our future operations. You should read this summary financial data in conjunction with the disclosure under “Use of Proceeds,” “Capitalization,” “Selected Historical Condensed Consolidated Financial Data” and “Management’s Discussion and Analysis of Financial Condition and Results of Operations” and the financial statements and the related notes thereto included elsewhere in this prospectus.
| Predecessor | Successor | |||||||||||||||||||||||||
| 358-Day Period Ended December 23, 2012 |
December 24, 2012 (date of inception) through December 31, 2012 |
Year Ended December 31, |
Three Months Ended March 31, |
|||||||||||||||||||||||
| 2013 | 2014 | 2014 (as restated)(2) |
2015 | |||||||||||||||||||||||
| (in millions) | ||||||||||||||||||||||||||
| Statement of Operations Data |
||||||||||||||||||||||||||
| Revenue |
$ | 372.1 | $ | 4.4 | $ | 356.5 | $ | 442.8 | $ | 95.2 | $ | 103.1 | ||||||||||||||
| Cost of services, exclusive of depreciation and amortization |
139.2 | 1.0 | 103.8 | 148.9 | 32.8 | 31.5 | ||||||||||||||||||||
| Engineering |
67.6 | 1.5 | 72.7 | 82.5 | 19.5 | 21.2 | ||||||||||||||||||||
| Selling, general and administrative |
83.4 | 0.9 | 63.5 | 76.9 | 18.1 | 21.5 | ||||||||||||||||||||
| Depreciation and amortization (1) |
73.6 | 2.2 | 101.1 | 133.6 | |
30.2 |
|
36.9 | ||||||||||||||||||
|
|
|
|
|
|
|
|
|
|
|
|
|
|||||||||||||||
| Income (loss) from operations |
8.4 | (1.3 | ) | 15.4 | 0.9 | (5.3 | ) | (8.1 | ) | |||||||||||||||||
| Interest expense (1) |
16.0 | 1.1 | 38.3 | 43.4 | 10.3 | 11.9 | ||||||||||||||||||||
| Write-off of debt issuance costs |
— | — | 21.2 | 0.5 | 0.5 | — | ||||||||||||||||||||
| Other income |
(1.4 | ) | — | (3.6 | ) | (7.1 | ) | (2.8 | ) | (1.6 | ) | |||||||||||||||
| Other expenses |
3.3 | — | 3.3 | 18.1 | 0.7 | 12.7 | ||||||||||||||||||||
|
|
|
|
|
|
|
|
|
|
|
|
|
|||||||||||||||
| Loss before income taxes |
(9.5 | ) | (2.5 | ) | (43.8 | ) | (54.0 | ) | (13.9 | ) | (31.1 | ) | ||||||||||||||
| Income tax (expense) benefit |
(3.0 | ) | 0.9 | 16.5 | 12.8 | 3.2 | (4.9 | ) | ||||||||||||||||||
|
|
|
|
|
|
|
|
|
|
|
|
|
|||||||||||||||
| Net loss |
(12.4 | ) | (1.5 | ) | (27.3 | ) | (41.2 | ) | (10.7 | ) | (35.9 | ) | ||||||||||||||
| Foreign translation adjustment |
1.3 | — | 0.7 | (8.5 | ) | 3.7 | (7.7 | ) | ||||||||||||||||||
|
|
|
|
|
|
|
|
|
|
|
|
|
|||||||||||||||
| Comprehensive loss |
$ | (11.1 | ) | $ | (1.5 | ) | $ | (26.6 | ) | $ | (49.7 | ) | $ | (7.0 | ) | $ | (43.6 | ) | ||||||||
|
|
|
|
|
|
|
|
|
|
|
|
|
|||||||||||||||
| Earnings Per Common Share (3): |
||||||||||||||||||||||||||
| Net loss attributable to common shareholders, basic |
$ | (7.45 | ) | $ | (0.07 | ) | $ | (1.25 | ) | $ | (1.86 | ) | $ | (0.49 | ) | $ | (1.60 | ) | ||||||||
| Net loss attributable to common shareholders, diluted |
$ | (7.45 | ) | $ | (0.07 | ) | $ | (1.25 | ) | $ | (1.86 | ) | $ |
(0.49 |
) |
$ |
(1.60 |
) | ||||||||
| Number of common shares outstanding, basic |
1,668,793 | 21,703,089 | 21,811,728 | 22,128,922 | 22,066,421 | 22,474,929 | ||||||||||||||||||||
| Number of common shares outstanding, diluted |
1,668,793 | 21,703,089 | 21,811,728 | 22,128,922 | 22,066,421 | 22,474,929 | ||||||||||||||||||||
| Balance Sheet Data (at period end) |
||||||||||||||||||||||||||
| Cash and cash equivalents |
$ | 9.3 | $ | 8.0 | $ | 3.9 | $ | 6.8 | $ | 14.0 | $ | 9.6 | ||||||||||||||
| Working capital |
(23.6 | ) | 8.0 | 14.7 | 12.1 | 9.6 | — | |||||||||||||||||||
| Total assets |
651.1 | 911.4 | 879.8 | 1,117.1 | 1,060.6 | 1,110.7 | ||||||||||||||||||||
| Total debt, including current portion |
394.8 | 623.5 | 622.2 | 874.2 | 800.2 | 896.4 | ||||||||||||||||||||
| Total shareholders’ equity |
143.7 | 200.1 | 176.1 | 135.8 | 172.6 | 94.0 | ||||||||||||||||||||
| Cash Flow Data |
||||||||||||||||||||||||||
| Net cash flow provided by (used in): |
||||||||||||||||||||||||||
| Operating activities |
$ | 91.0 | $ | (1.4 | ) | $ | 70.7 | $ | 79.3 | $ | 15.5 | $ | 12.9 | |||||||||||||
| Investing activities |
(110.5 | ) | (400.6 | ) | (61.9 | ) | (337.8 | ) | (174.8 | ) | (35.9 | ) | ||||||||||||||
| Financing activities |
25.8 | 400.7 | (11.8 | ) | 253.5 | 173.0 | 17.6 | |||||||||||||||||||
| Other Financial Data |
||||||||||||||||||||||||||
| Adjusted EBITDA |
$ | 112.5 | $ | 0.9 | $ | 122.5 | $ | 145.1 | $ | 27.0 | $ | 32.1 | ||||||||||||||
|
|
|
|
|
|
|
|
|
|
|
|
|
|||||||||||||||
| (1) | As a result of our Corporate Reorganization, the comparability of our interest expense and depreciation and amortization was affected between the Predecessor’s and Successor’s financial data. Interest expense increased as a result of the increase in debt used to finance the Corporate Reorganization. Depreciation and amortization increased as a result of an increase in the basis of our assets to reflect their fair market value at the time of the Corporate Reorganization. |
| (2) | Subsequent to the date of the original issuance, we concluded that we were required to restate our unaudited interim condensed consolidated financial statements as of and for the quarter ended March 31, 2014. These amounts have been noted herein as restated. See Note 15 within the Condensed Consolidated Financial Statements for further discussion and detail of the restatement. |
20
Table of Contents
| (3) | On July 17, 2015, our board of directors approved: (i) an increase in the authorized common stock and (ii) a common stock split. All per share amounts and common shares outstanding have been restated to reflect a 7.7-for-1 stock split, which was declared by our board of directors on July 17, 2015, and effective as of the close of business on that date. Accordingly, all common share and per share amounts, other than those presented for the period from January 1, 2012 to December 23, 2012 (the “Predecessor Period”), have been adjusted to reflect the 7.7-for-1 stock split as though it had occurred at the beginning of the initial period presented. |
Non-GAAP Financial Measure
Adjusted EBITDA
Adjusted EBITDA is defined as EBITDA before stock-based compensation expense, acquisition activity expenses, professional fees associated with the May 2012 debt recapitalization, expenses associated with our Corporate Reorganization, one-time bonuses paid pursuant to the Corporate Reorganization, net loss from discontinued operations, write-off of deferred offering costs, write-off of unamortized debt issuance costs, other income, other expenses, and miscellaneous expenses as described in the footnotes to the table below. EBITDA is defined as earnings before interest expense, income tax expense, depreciation and amortization.
Our management uses Adjusted EBITDA as a means to measure our operating performance and to assist in comparing performance from period to period on a consistent basis. It is also used to readily view operating trends, as a measure for planning and forecasting overall expectations and for evaluating actual results against such expectations, as well as in communications with our board of directors, creditors, analysts and investors concerning our financial performance. We also believe Adjusted EBITDA may be used by some investors to assess our underlying financial performance.
Adjusted EBITDA is not a presentation made in accordance with GAAP and our computation of Adjusted EBITDA may vary from others in our industry. In addition, Adjusted EBITDA contains adjustments that are taken into account in the calculation of the components of various covenants in our credit agreement. Adjusted EBITDA should not be considered as an alternative to operating earnings or net (loss) earnings as measures of operating performance. Other companies, including companies in our industry, may calculate Adjusted EBITDA differently than we do, limiting its usefulness as a comparative measure. Adjusted EBITDA also has limitations as an analytical tool and should not be considered in isolation, or as a substitute for analysis of our results as reported under GAAP. For instance, Adjusted EBITDA:
| • | does not reflect our cash expenditures, or future requirements, for capital expenditures or contractual commitments; |
| • | does not reflect changes in, or cash requirements for, our working capital needs; |
| • | does not reflect our interest expense, or the cash requirements necessary to service interest or principal payments, on our debt; and |
| • | does not reflect certain other non-cash income and expenses. |
21
Table of Contents
The following tables reconcile net loss as reflected in the results of operations tables to Adjusted EBITDA for the periods presented:
| Predecessor | Successor | |||||||||||||||||||||||||
| 358-Day Period Ended December 23, 2012 |
December 24, 2012 (date of inception) through December 31, 2012 |
Year Ended December 31, |
Three Months Ended March 31, |
|||||||||||||||||||||||
| 2013 | 2014 | 2014 (as restated)(5) |
2015 | |||||||||||||||||||||||
| (in millions) |
||||||||||||||||||||||||||
| Net loss |
$ | (12.4 | ) | $ | (1.5 | ) | $ | (27.3 | ) | $ | (41.2 | ) | $ | (10.7 | ) | $ | (35.9 | ) | ||||||||
| Adjustments: |
||||||||||||||||||||||||||
| Interest expense |
16.0 | 1.1 | 38.3 | 43.4 | 10.3 | 11.9 | ||||||||||||||||||||
| Depreciation and amortization |
73.6 | 2.2 | 101.1 | 133.6 | 30.2 | 36.9 | ||||||||||||||||||||
| Income tax expense (benefit) |
3.0 | (0.9 | ) | (16.5 | ) | (12.8 | ) | (3.2 | ) | 4.9 | ||||||||||||||||
| Stock-based compensation expense |
3.0 | — | 1.9 | 2.1 | 0.5 | 0.5 | ||||||||||||||||||||
| Acquisition activity expenses |
1.2 | — | 2.5 | 4.2 | 1.0 | 2.8 | ||||||||||||||||||||
| Debt recapitalization professional fees |
1.1 | — | — | — | — | — | ||||||||||||||||||||
| Corporate Reorganization expenses (1) |
19.7 | — | 0.8 | — | — | — | ||||||||||||||||||||
| Corporate Reorganization bonuses |
4.5 | — | — | — | — | — | ||||||||||||||||||||
| Write-off of deferred offering costs (2) |
— | — | — | 2.2 | — | — | ||||||||||||||||||||
| Write-off of unamortized debt-issuance costs (3) |
— | — | 21.2 | 0.5 | 0.5 | — | ||||||||||||||||||||
| Other income |
(1.4 | ) | — | (3.6 | ) | (7.1 | ) | (2.8 | ) | (1.6 | ) | |||||||||||||||
| Other expenses |
3.3 | — | 3.3 | 18.1 | 0.7 | 12.7 | ||||||||||||||||||||
| Miscellaneous expenses (4) |
1.0 | — | 1.0 | 2.1 | 0.5 | (0.1) | ||||||||||||||||||||
|
|
|
|
|
|
|
|
|
|
|
|
|
|||||||||||||||
| Adjusted EBITDA |
$ | 112.5 | $ | 0.9 | $ | 122.5 | $ | 145.1 | $ | 27.0 | $ | 32.1 | ||||||||||||||
|
|
|
|
|
|
|
|
|
|
|
|
|
|||||||||||||||
| (1) | For each period, reflects transaction fees associated with the Corporate Reorganization and is recorded in selling, general and administrative expense. |
| (2) | During the year ended December 31, 2014, we delayed the timing of this public offering and, as a result, deferred offering costs of $2.2 million were charged against earnings. These amounts are included in our selling, general and administrative expenses. |
| (3) | For each period, reflects debt issuance cost write-off expense related to the refinancing of our Credit Agreements. |
| (4) | For the 358-day period ended December 23, 2012, includes $0.8 million of restructuring charges, including severance payments. For the year ended December 31, 2013, includes $0.7 million of consulting and evaluation fees for enterprise resource planning software. For the year ended December 31, 2014, includes $2.1 million of restructuring charges. For the three months ended March 31, 2014 includes $0.5 million of restructuring charges. |
| (5) | Subsequent to the date of the original issuance, we concluded that we were required to restate our unaudited interim condensed consolidated financial statements as of and for the quarter ended March 31, 2014. These amounts have been noted herein as restated. See Note 15 within the Condensed Consolidated Financial Statements for further discussion and detail of the restatement. |
22
Table of Contents
This offering and an investment in our common stock involve a high degree of risk. You should carefully consider the risks described below, together with the financial and other information contained in this prospectus, before you decide to purchase shares of our common stock. If any of the following risks actually occurs, our business, financial condition, results of operations, cash flows and prospects could be materially and adversely affected. As a result, the trading price of our common stock could decline and you could lose all or part of your investment in our common stock.
Risks Related to Our Business
We face competition in our existing markets and may be subject to increased competitive pressures for our services.
The market for the services we provide is competitive. Despite our current market share in our existing areas of focus, we may face pricing competition to the extent that our competitors price their services aggressively in an attempt to capture additional business.
Our existing and potential competitors may have, or may develop, greater brand name recognition and acceptance among our existing and potential clients. In addition, certain of these competitors may be better able to adapt quickly to clients’ changing demands and changes in technology, enhance existing services, develop and introduce new services and new production technologies and respond timely to changing market conditions and client demands. If we are not able to compete successfully, our ability to gain market share or market acceptance for the services that we provide could be limited, and our revenues and our profit margins could be materially adversely affected.
We may lose business as a result of the vendor diversification efforts of our clients.
Many of our clients look to us as a strongly-preferred provider of live and broadcast production solutions. However, our clients may periodically reevaluate the market for the provision of broadcasting solutions and may engage one of our competitors to provide some or all of the services for certain events that we have historically provided in an effort to diversify their network of service providers, and our revenues and our profit margins could be materially adversely affected as a result.
In addition, our clients may in the future consider hiring lower-priced competitors and/or developing in-house capabilities to supplement and/or replace the solutions that these clients currently outsource to us, particularly as certain types of broadcast solutions become more routine and less expensive. To the extent that this trend emerges, our results of operations and growth prospects may be adversely affected.
An adverse realignment of broadcast rights could have a material adverse effect on our business, results of operations, financial condition and cash flow.
Our clients compete with other national and regional networks, independent television stations, cable channel companies and other broadcasters to secure programming rights to broadcast sporting and other live events from third parties, such as the NFL, NCAA and PGA. Competition for popular programming that is licensed from third parties is intense, and our clients may be outbid by competitors for the rights to new events or in connection with the renewal of popular programming currently licensed by our clients. Such competitors may have alternative preferred broadcast service providers. Accordingly, our clients’ loss of broadcast rights to competitors that use other broadcast service providers could have a material adverse effect on our business, results of operations, financial condition and cash flow.
23
Table of Contents
We have numerous individual contracts at any one time, but often several are with a single client or client group. If a substantial portion of our client contracts terminate and we are unable to successfully renew or replace these contracts on comparable terms, then our business, results of operations, financial condition and cash flow could be adversely affected.
For the year ended December 31, 2014, our two largest client groups, News Corporation and Comcast, accounted for 14% and 12%, respectively, of our total revenues. We anticipate that sales of our services to these clients and client groups will continue to account for a significant portion of our revenues. Factors that are most likely to cause us to experience non-renewals and/or discontinuation or termination of our contracts include: the loss of the broadcast rights by our clients for coverage of sporting events; the cancellation of television shows that our clients broadcast; and the discontinuation of live entertainment events, e.g., television events and live concert tours. Other factors could also include competitive forces, including from low-cost competitors (most relevant for non-Premium Events), from industry consolidation that causes broadcasters to seek diversification of service providers, and from international competitors in markets where we do not have a strong footprint. Our clients’ continued outsourcing of broadcasting services, as opposed to developing similar service capabilities in-house, is also critical to maintaining demand for the services we provide. In certain limited circumstances, our long-term contracts may be terminated by our clients before their term expires. If any of our contracts with our clients is terminated, we may not be able to recover all fees due under the terminated contract, which may adversely affect our operating results. If a significant portion of our client contracts expire and we are unable to renew or replace these contracts on comparable terms, then our business, results of operations, financial condition and cash flow could be materially adversely affected.
If the estimates and assumptions we use to determine the size of our target market are inaccurate, our future growth rate may be impacted and our business would be harmed.
Market opportunity estimates are subject to significant uncertainty and are based on assumptions and estimates that may not prove to be accurate. The estimates and forecasts in this prospectus relating to the size of the market for our services may prove to be inaccurate. Even if the market in which we compete meets our size estimates and forecasted growth, our business could fail to grow at similar rates, if at all.
The principal assumptions relating to our market opportunity include our existing U.S. and international core service offerings, adjacent service offerings and geographies we plan to expand into in the future, the number of key players in these markets that we have identified based on our market research and experience in the live and broadcast production industry and the estimated annual revenue generated by these key players. Our market opportunity is also based on the assumption that we will be able to expand into these markets through both organic investments and acquisitions.
If these assumptions prove inaccurate, our business, financial condition and results of operations could be adversely affected. In addition, these inaccuracies or errors may cause us to misallocate capital and other business resources, which would harm our business.
Labor strikes and lock-outs for major sports leagues constitute force majeure events under certain of our client contracts.
Certain of our broadcast services contracts provide that in the event of a strike or other labor dispute, the client may declare a force majeure with respect to the affected event. This includes lock-outs and labor strikes resulting from breakdowns in negotiations between professional sports leagues and their respective players associations. Each of the NHL, NBA and MLB has experienced lock-outs in the past 25 years, resulting in truncated seasons, and each professional sports league may have labor issues in the future. A protracted lock-out event in any major professional sports league may have a material adverse effect on our business, results of operations, financial condition and cash flows.
24
Table of Contents
The sporting and other live events that our clients broadcast are highly sensitive to popular viewership preferences and our clients may be unable to anticipate changes in consumer preferences, which may result in any particular event or show underlying our contracts not being renewed.
Our clients’ decisions to broadcast sporting or other entertainment events depend primarily upon the viewing public’s shifting and unpredictable tastes. Many of our clients incur significant commitments to secure rights to broadcast such events or programs. A migration of consumer preference away from the style of such events or programs may prompt our clients to discontinue the broadcasts of such events or programs. For example, a singing competition television program for which we have provided remote production and video display solutions has recently experienced cancellation. In general, major shifts in the popularity of sporting and other entertainment events and programs may result in a decrease in the demand for our services, which would have a material adverse effect on our business, results of operations and financial condition.
We may not be able to respond to rapid changes in technology.
The markets for broadcast and production equipment are characterized by changing technology and evolving industry standards. If we are unable to adequately respond to changes in technology and standards, we may not be able to serve our clients effectively, and our equipment and services may become uncompetitive or obsolete. We are unable to accurately predict when these costs may arise, and the cost to modify or upgrade our equipment in order to adapt to these changes could be prohibitive and require substantial capital expenditures, and we may not have the financial resources to fund these expenses.
We lease our studios and may not be able to pass increases in rents to our studio production clients.
We lease each of the studios located in New York, Sydney and Melbourne that our clients use for studio production. As of March 31, 2015, the average remaining term of these leases was 10 years. In the event that the rents under our leases increase materially in the future, we may not be able to pass the increased costs onto our clients or we may not be able to operate our studios on a profitable basis, and the resulting increase in our cost structure or discontinuation of studio production operations may have a material adverse effect on our business, results of operations, financial condition and cash flows.
Our business depends on our senior management and other key personnel.
Our success depends to a significant extent upon the continued service of our executive officers and key management and technical personnel, particularly our experienced engineers, and upon our ability to continue to attract, retain and motivate qualified personnel. The competition for these employees is intense. Some of our client contracts name particular individuals who must perform the services thereunder, so if these employees are not available, we face the risk of being unable to perform under these contracts and/or non-renewal of these contracts in future periods. The loss of the services of key personnel could have a material adverse effect on our operating results. In addition, there could be a material adverse effect on us should the turnover rates for key personnel increase significantly or if we are unable to continue to attract qualified personnel. We do not maintain any key person life insurance policies on any of our officers or employees. Our success also depends on our ability to execute leadership succession plans. The inability to successfully transition key management roles could have a material adverse effect on our operating results.
Our level of indebtedness could materially and adversely affect our financial condition.
We now have, and expect to continue to have, significant indebtedness that could result in a material and adverse effect on our business. As of March 31, 2015, we had approximately $896.4 million of aggregate indebtedness outstanding, including $732.5 million under our first lien term loan, $80.0 million under our second lien term loan, $75.5 million under our revolving credit facility, $8.4 million of debt assumed from the acquisition of Faber as well as $39.5 million in capital lease obligations. In connection with the acquisitions of
25
Table of Contents
Mediatec and Outside Broadcast, we assumed $47.5 million and $11.2 million of indebtedness, respectively, in addition to incurring an additional $75.0 million of second lien indebtedness, and we expect to assume additional indebtedness in connection with our acquisition of CMI, which we estimate to be approximately $45.0 million as of the date of this prospectus. We intend to use the net proceeds of this offering to repay $69.0 million of debt outstanding under our revolving credit facility and $85.9 million of debt outstanding and related fees and expenses under our second lien term loan. We also intend to use cash on hand and borrowings under our revolving credit facility to fund a portion of the CMI acquisition price. As of March 31, 2015, after giving effect to the use of proceeds from this offering, we would have had approximately $747.4 million of debt outstanding. This substantial amount of debt could have important consequences, including:
| • | increasing our vulnerability to general adverse financial, business, economic and industry conditions, as well as other factors that are beyond our control; |
| • | requiring us to dedicate a substantial portion of our cash flow from operations to payments on our indebtedness, thereby reducing the availability of our cash flow to fund working capital, capital expenditures, acquisitions, research and development efforts and other general corporate purposes; |
| • | limiting our flexibility in planning for, or reacting to, changes in our business and industry; |
| • | restricting our ability to pay dividends on our capital stock or redeem, repurchase or retire our capital stock or indebtedness; |
| • | limiting our ability to borrow additional funds; |
| • | exposing us to the risk of increased interest rates as certain of our borrowings are, and may in the future be, at variable interest rates; |
| • | requiring us to sell assets or incur additional indebtedness if we are not able to generate sufficient cash flow from operations to fund our liquidity needs; |
| • | requiring us to refinance all or a portion of our indebtedness at or before maturity; and |
| • | making it more difficult for us to fund other liquidity needs. |
The occurrence of any one of these events or our failure to generate sufficient cash flow from operations could have a material adverse effect on our business, financial condition, results of operations and ability to satisfy our obligations under our outstanding credit agreements.
We may not have the funds necessary to pay principal and interest on the first lien or second lien term loans when they mature. Although we may seek to refinance this debt, we may not be able to do so on acceptable terms or at all. Any failure to pay these debts as they mature would adversely affect our business and the price of our common stock. In addition, the funds necessary to service this debt may divert cash from other important uses, including to fund the growth of our business and pursue acquisitions.
As we continue growing our business, including through acquisitions, it is possible that we will incur additional indebtedness, which could have the effect of increasing the risks described above.
Our indebtedness has floating interest rates and we do not currently hedge against the risk of interest rate increases.
Each of the first lien term loan, second lien term loan and revolving credit facility has floating interest rates. We do not currently plan to enter into swaps to hedge the risk of increases in interest rates. Consequently, to the extent interest rates increase, we will be liable for higher interest payments to our lenders. Assuming the same level of borrowings and a 25 basis point increase in interest rates, it is estimated that our interest expense for the three months ended March 31, 2015 would have increased by approximately $0.6 million.
26
Table of Contents
Our credit facilities contain restrictions that limit our flexibility in operating our business.
Our first lien term loan and the revolving credit facility, as well as our second lien term loan, are guaranteed on a senior basis by all of our subsidiaries and collateralized by substantially all of our assets. The agreement governing these debt instruments contain various covenants that may limit, among other things, our and our subsidiaries’ ability to:
| • | incur additional indebtedness or guarantee other indebtedness; |
| • | issue preferred equity interests; |
| • | grant liens; |
| • | merge with or consolidate with another entity; |
| • | make certain loans, investments or acquisitions; |
| • | dispose of assets, including the sale of equity interests in our subsidiaries, or issue equity interests in our subsidiaries to third parties; |
| • | enter into sale and leaseback transactions; |
| • | pay dividends or other distributions; |
| • | make payments in respect of, or amend the terms of, subordinated indebtedness; |
| • | enter into transactions with affiliates; or |
| • | change our fiscal year. |
The First Lien Credit Agreement also contains a financial covenant requiring us to maintain, as of the last day of each quarter if at such time 15% of the revolving credit facility commitment is utilized, a ratio of Consolidated First Lien Indebtedness to Consolidated EBITDA (as each is defined in the First Lien Credit Agreement) not exceeding a set ratio (the “debt to EBITDA ratio”), initially set at 6.25 to 1 on March 31, 2014, and which incrementally steps down every other quarter, beginning on December 31, 2014, until reaching 4.75 to 1 on June 30, 2017. Such ratio will remain at 4.75 to 1 thereafter until maturity (currently, July 2022 unless extended). On March 31, 2015, our debt to EBITDA ratio was 5.17 to 1.
If an event of default exists under the credit agreements, the applicable lenders are able to accelerate the maturity of the credit agreement and exercise other rights and remedies. The credit agreements contain customary events of default, including:
| • | failure to pay principal, interest or any other amount when due; |
| • | breach of the representations or warranties, or failure to comply with covenants in the credit agreements; |
| • | a failure to pay principal or interest, or otherwise default on, other material indebtedness; |
| • | bankruptcy or insolvency; |
| • | uninsured, enforceable judgments above a certain threshold amount; |
| • | the occurrence of certain material ERISA liabilities or failures to pay such liabilities; |
| • | liens on the collateral ceasing to be perfected; or |
| • | a change of control (as defined in the credit agreement). |
It is possible that, if the defaulted debt is accelerated, our assets and cash flow may not be sufficient to fully repay the indebtedness or borrowings under our outstanding debt instruments, and we cannot assure you that we would be able to refinance or restructure the payments on those debt securities.
27
Table of Contents
Such actions by the lenders to accelerate our credit agreement debt could also cause cross defaults under our other indebtedness. We pledged substantially all of our assets as collateral under our credit facility. If we were unable to repay those amounts, the lenders or holders under the credit facility and any future secured indebtedness could proceed against the collateral granted to them to secure that indebtedness.
Our results have been adversely affected by economic uncertainty or deteriorations in economic conditions, and may be similarly affected in the future.
Many of our clients derive substantially all of their revenues from the sale of advertising. Expenditures by advertisers tend to be cyclical, reflecting economic conditions and budgeting and buying patterns. A slow economy or recession, or periods of economic uncertainty, may be accompanied by a reduction in discretionary spending by consumers and a decrease in advertising, which could lead to the cancellation of events and programs, and could also potentially impact the pricing and other terms of our client contracts. If economic conditions do not continue to improve or deteriorate once again, or economic uncertainty increases, such conditions may disproportionately affect our business and result in an adverse impact on our revenue, profit margins, cash flow and liquidity, which may be material.
Our sales and operations are subject to the economic, political, legal and business conditions in the countries in which we do business, and our failure to operate successfully or adapt to changes in these conditions could limit or disrupt our sales and operations.
We derive a significant portion of our revenue and earnings from our international operations. Operating in multiple foreign countries involves substantial risk. Our principal business risks in expanding internationally include adapting to the local business environment, which in some parts of the world can be difficult to penetrate without local partnerships. Although we do not anticipate the need to enter into local partnerships in any of the countries where we currently operate, as we expand into other geographies, we may experience such obstacles, and we may be required to expend significant capital, and/or pursue acquisitions, in order to achieve our growth objectives in those markets.
In addition, our business activities subject us to a number of laws and regulations, such as anti-corruption laws, tax laws, foreign exchange controls, data privacy and security requirements, labor laws and anti-competition regulations. As we expand into additional countries, the complexity inherent in complying with these laws and regulations increases, making compliance more difficult and costly and driving up the costs of doing business in foreign jurisdictions. Any failure to comply with foreign laws and regulations could subject us to fines and penalties, make it more difficult or impossible to do business in that country and harm our reputation. In addition, our expansion strategy will require us to operate in countries with labor conditions, tax obligations, local customs and other conditions that we may be unfamiliar with, or conflict with those of other countries in which we operate. This could make it more complicated to operate our business successfully in such countries.
We face risks relating to currency fluctuations and currency exchange.
For the three months ended March 31, 2015, 37% of our revenues were denominated in foreign currencies, including primarily the British Pound and the Australian dollar. We estimate a 10% change in the value of the U.S. dollar relative to each of British pound sterling, the Australian dollar, and the Euro would have had a $1.5 million, $1.6 million, and $0.6 million impact on revenues, respectively, for the three months ended March 31, 2015. Due to our recent acquisitions of Mediatec and Outside Broadcast, we are also subject to foreign currency fluctuation risk in Denmark, Norway, Sweden, Finland and Switzerland. We have no current plans to hedge against currency fluctuations, and accordingly we may be materially and adversely affected by currency fluctuations in the United States dollar compared with foreign currencies. Weaker foreign currencies relative to the United States dollar may result in lower levels of reported revenues with respect to foreign currency-denominated client contracts on our United States dollar-denominated financial statements. Foreign exchange rates are influenced by many factors outside of our control, including but not limited to: changing supply and
28
Table of Contents
demand for a particular currency; monetary policies of governments (including exchange-control programs, restrictions on local exchanges or markets and limitations on foreign investment in a country or on investment by residents of a country in other countries); changes in balances of payments and trade; trade restrictions; and currency devaluations and revaluations. Also, governments may from time to time intervene in the currency markets, directly and by regulation, in order to influence prices directly. These events and actions are unpredictable. The resulting volatility in the exchange rates could have a material adverse effect on our financial condition and results of operations.
We could be adversely affected by violations of the FCPA and similar worldwide anti-bribery laws.
The FCPA and similar anti-bribery laws generally prohibit companies and their intermediaries from making improper payments to foreign government officials for the purpose of obtaining or retaining business. The U.K. Bribery Act of 2010 prohibits both domestic and international bribery, as well as bribery across both private and public sectors. In addition, an organization that “fails to prevent bribery” by anyone associated with the organization can be charged under the U.K. Bribery Act unless the organization can establish that it implemented “adequate procedures” to prevent bribery. Practices in the local business communities of many countries outside the United States have levels of government corruption greater than those found in developed countries. Our policies mandate compliance with these anti-bribery laws and we will establish formal policies and procedures designed to monitor compliance with these anti-bribery law requirements prior to the closing of this offering; however, we cannot ensure that our policies and procedures will protect us from reckless or criminal acts committed by individual employees or agents. If we are found to be liable for anti-bribery law violations, we could suffer from criminal or civil penalties or other sanctions that could have a material adverse effect on our business.
We have significant intangible assets including goodwill and may experience impairment of goodwill or other intangible assets.
We have significant intangible assets, including goodwill with an indefinite life, which are susceptible to valuation adjustments as a result of changes in various factors or conditions. Our identifiable intangible assets, except for goodwill, are amortized on a straight-line basis over their estimated useful lives. We assess the potential impairment of intangible assets on at least an annual basis, as well as whenever events or changes in circumstances indicate that their carrying value may not be recoverable. Factors that could trigger an impairment of such assets include the following:
| • | significant underperformance relative to historical or projected future operating results; |
| • | significant changes in the use of the acquired assets or the strategy for our overall business; |
| • | significant negative industry or economic trends; |
| • | significant decline in our stock price for a sustained period; |
| • | changes in our organization or management reporting structure that could result in additional reporting units, which may require alternative methods of estimating fair values or greater disaggregation or aggregation in our analysis by reporting unit; and |
| • | a decline in our market capitalization below net book value. |
Future adverse changes in these or other factors, including those affecting intangible assets from our acquisitions, could result in an impairment charge that would impact our results of operations and financial position in a given reporting period.
29
Table of Contents
Limitations on our ability to utilize our net operating losses may negatively affect our financial results.
As of March 31, 2015, we had U.S. Federal net operating loss (“NOL”) carryforwards of approximately $182.6 million. To the extent available, we anticipate using NOL carryforwards to reduce the future United States corporate income tax liability associated with our operations. However, if we do not achieve profitability prior to their expiration, we will not be able to fully utilize our NOL’s to offset income. Section 382 of the Internal Revenue Code of 1986, as amended (the “Code”) generally imposes an annual limitation on the amount of NOL carryforwards that may be used to offset taxable income when a loss corporation has undergone a change in control. As a result, our ability to utilize NOL carryforwards and built-in losses may be limited, under this section or otherwise, by future issuances of common stock or by other changes in stock ownership.
Significant increases in the costs of insurance, insurance claims or our deductibles may negatively affect our profitability.
We currently maintain the following major types of commercial insurance policies: workers’ compensation, commercial general liability, professional liability, automobile liability, excess and “umbrella” liability, commercial property coverage, fiduciary liability, and directors’ and officers’ liability. These policies are subject to various limitations, exclusions and deductibles. To date, we have been able to obtain insurance in amounts we believe to be appropriate. Such insurance may not continue to be readily available to us in the form or amounts we have been able to obtain in the past, or our insurance premiums could materially increase in the future as a consequence of conditions in the insurance business or in our industry.
Risks Related to Acquisitions
We may be unsuccessful in identifying and consummating suitable acquisitions, which may negatively impact our acquisition growth strategy.
Our strategy relies on our ability to consummate acquisitions to foster the growth of our business and establish ourselves in geographic regions and related businesses in which we do not currently operate. Our growth through acquisitions has consisted of 19 acquisitions over the last 11 years, and we are often in ongoing discussions to potentially acquire additional businesses. We may be unable to identify or consummate other suitable targets for future acquisition or acquire businesses at favorable prices, which would negatively impact our growth strategy. We have financed our acquisitions in the past through a combination of debt and equity financing. An increase in market interest rates could increase our interest costs on any new debt and our variable rate debt obligations. As a result, additional debt financing may not be available on terms favorable to us, or at all. We may also seek to raise funds to finance acquisitions through the issuance of our common stock. The extent to which we will be able or willing to use our common stock for acquisitions will depend on the market price of our common stock and the willingness of potential acquisition candidates to accept our common stock as full or partial consideration for the sale of their business. A decrease in the market price of our common stock, or an increase in market interest rates could negatively impact our ability to complete acquisitions on terms favorable to us.
In addition, we may incur expenses associated with sourcing, evaluating and negotiating acquisitions (including those that are not completed), and we also may pay fees and expenses associated with obtaining financing for acquisitions and with investment banks and others finding acquisitions for us. Any of these amounts may be substantial, and together with the size, timing and number of acquisitions we pursue, may negatively impact us and cause significant volatility in our financial results.
The due diligence process that we undertake in connection with acquisitions may not reveal all facts that may be relevant in connection with an acquisition.
Before making acquisitions, we conduct due diligence of the target company that we deem reasonable and appropriate based on the facts and circumstances applicable to each acquisition. The objective of the due
30
Table of Contents
diligence process is to assess the investment opportunities based on the facts and circumstances surrounding an investment or acquisition. When conducting due diligence, we may be required to evaluate important and complex business, financial, tax, accounting and legal issues. Accordingly, we cannot be certain that the due diligence investigation that we conduct with respect to any investment or acquisition opportunity will reveal or highlight all relevant facts that may be necessary or helpful in evaluating such investment opportunity. For example, instances of fraud, accounting irregularities and other deceptive practices can be difficult to detect. Executive officers, directors and employees may be named as defendants in litigation involving a company we are acquiring or have acquired. Even if we conduct extensive due diligence on a particular investment or acquisition, we may fail to uncover all material issues relating to such investment, including regarding the controls and procedures of a particular target or the full scope of its contractual arrangements. We rely on our due diligence to identify potential liabilities in the businesses we acquire, including such things as potential or actual lawsuits, contractual obligations or liabilities imposed by government regulation. However, our due diligence process may not uncover these liabilities, and where we identify a potential liability, we may incorrectly believe that we can consummate the acquisition without subjecting ourselves to that liability. If our due diligence fails to identify issues specific to an investment or acquisition, we may obtain a lower return from that transaction than the investment would return or otherwise subject ourselves to unexpected liabilities. We may also be forced to write-down or write-off assets, restructure our operations or incur impairment or other charges that could result in our reporting losses. Charges of this nature could contribute to negative market perceptions about us or shares of our common stock.
We may face difficulty integrating the operations of the businesses we have acquired and may acquire in the future.
Acquisitions have been and will continue to be an important component of our growth strategy; however, we will need to integrate these acquired businesses successfully in order for our growth strategy to succeed. We will implement, and the management teams of the acquired businesses will adopt, our policies, procedures and best practices, and cooperate with each other in other aspects of their operations. We may face difficulty with the integration of the businesses we acquire, such as coordinating geographically dispersed organizations, integrating personnel with disparate business backgrounds and combining different corporate cultures. Cross-border acquisitions, which form an important part of our growth strategy, are particularly susceptible to these risks. We may also fail in implementing our policies and procedures, or the policies and procedures may not be effective or provide the results we anticipate for a particular business. Further, we will be relying on these policies and procedures in preparing our financial and other reports as a public company, so any failure of acquired businesses to properly adopt these policies and procedures could impair our public reporting. Management of the businesses we acquire may not have the operational or business expertise to successfully implement our policies, procedures and best practices.
We typically retain the management of the businesses we acquire and rely on them to continue operating the acquired businesses, which leaves us vulnerable in the event they leave our Company.
We seek to acquire businesses that have strong management teams that will continue to run the business after the acquisition. We often rely on these individuals to conduct the day-to-day operations of and pursue the growth of these acquired businesses. Although we typically seek to sign employment agreements with the managers of acquired businesses, it remains possible that these individuals will leave our organization. This would harm the prospects of the businesses they manage, potentially causing us to lose money on our investment and harming our growth and financial results.
Federal, state and foreign taxation of business combinations may discourage business combinations.
Federal, state and foreign tax consequences are major considerations in any acquisition or business combination we may undertake. Currently, such transactions may be structured to result in tax-free treatment to both companies, pursuant to various federal, state and foreign tax provisions. We intend to structure any business combination to minimize the federal, state and foreign tax consequences to both us and the target entity;
31
Table of Contents
however, there can be no assurance that any particular business combination will meet the statutory requirements of a tax-free reorganization or that we will obtain the intended tax-free treatment upon a transfer of stock or assets. A non-qualifying reorganization could result in the imposition of federal, state and foreign taxes, which may have an adverse effect on us and any target company, reduce the future value of the shares and potentially discourage a business combination.
We may seek to raise funds, finance acquisitions or develop strategic relationships by issuing additional shares of common stock that would dilute your ownership.
We may finance future acquisitions in large part by issuing shares of our common stock, which would significantly reduce the percentage ownership of our then existing stockholders, including investors in this offering. Furthermore, any future issuances by us of equity securities may be at or below the prevailing market price of our common stock and in any event may have a dilutive impact on your ownership interest, which could cause the market price of our common stock to decline. In addition, we could issue securities in respect of future transactions that have rights, preferences and privileges senior to those of our common stock. The holders of any of our debt securities or term loans would also have rights superior to the rights of our common stockholders.
Risks Related to This Offering and Ownership of Our Common Stock
We do not intend to pay dividends on our common stock, and our credit agreements place certain restrictions on our ability to do so. Consequently, your only opportunity to achieve a return on your investment is if the price of our common stock appreciates.
We do not plan to declare dividends on shares of our common stock in the foreseeable future. In addition, because we are a holding company with no material direct operations, we are dependent on dividends from our subsidiaries to generate the funds necessary to pay any future dividends on our common stock. The ability of our subsidiaries to make such distributions will be subject to their operating results, cash requirements and financial condition, the applicable provisions of Delaware law and the laws of the jurisdictions in which our subsidiaries may be incorporated that may limit the amount of funds available for distribution and our ability to pay cash dividends, compliance with covenants and financial ratios related to existing or future indebtedness, including under our first lien term loan, and other agreements with third parties. Consequently, unless we revise our dividend policy and/or amend our credit agreements, your only opportunity to achieve a return on your investment in us will be if you sell your common stock at a price greater than you paid for it. There is no guarantee that the price of our common stock that will prevail in the market will ever exceed the price that you pay in this offering.
The requirements of being a public company, including compliance with the reporting requirements of the Securities Exchange Act of 1934, as amended (the “Exchange Act”), and the requirements of the Sarbanes-Oxley Act, may strain our resources, increase our costs and distract management, and we may be unable to comply with these requirements in a timely or cost-effective manner.
As a public company, we must comply with new laws, regulations and requirements, certain corporate governance provisions of the Sarbanes-Oxley Act of 2002, related regulations of the SEC and the requirements of the NYSE, with which we are not required to comply as a private company. Complying with these statutes, regulations and requirements will occupy a significant amount of time of our board of directors and management and will significantly increase our costs and expenses. We will need to:
| • | institute a more comprehensive compliance function; |
| • | comply with rules promulgated by the NYSE; |
| • | continue to prepare and distribute periodic public reports in compliance with our obligations under the federal securities laws; |
| • | establish new internal policies, such as those relating to insider trading; and |
| • | involve and retain outside counsel and accountants to a greater degree in the above activities. |
32
Table of Contents
Furthermore, while we generally must comply with Section 404 of the Sarbanes Oxley Act of 2002 for our fiscal year ended December 31, 2016, we are not required to have our independent registered public accounting firm attest to the effectiveness of our internal controls until our first annual report subsequent to our ceasing to be an “emerging growth company” within the meaning of Section 2(a)(19) of the Securities Act. Accordingly, we may not be required to have our independent registered public accounting firm attest to the effectiveness of our internal controls until as late as our annual report for the fiscal year ending December 31, 2020. Once it is required to do so, our independent registered public accounting firm may issue a report that is adverse in the event it is not satisfied with the level at which our controls are documented, designed, operated or reviewed. Compliance with these requirements may strain our resources, increase our costs and distract management, and we may be unable to comply with these requirements in a timely or cost-effective manner.
In addition, we expect that being a public company subject to these rules and regulations may make it more difficult and more expensive for us to obtain director and officer liability insurance and we may be required to accept reduced policy limits and coverage or incur substantially higher costs to obtain the same or similar coverage. As a result, it may be more difficult for us to attract and retain qualified individuals to serve on our board of directors or as executive officers. We are currently evaluating these rules, and we cannot predict or estimate the amount of additional costs we may incur or the timing of such costs.
Our sponsor controls us and their interests may conflict with or differ from your interests as a stockholder.
After the consummation of this offering, funds affiliated with Crestview Partners II GP, L.P. will collectively own approximately 57.2% of our common stock, assuming the underwriters do not exercise their option to purchase additional shares, or 54.4% if the underwriters exercise their option in full. Under a stockholders agreement to be entered into in connection with this offering, Crestview will be entitled to certain nomination rights, including the right to nominate 50% of our board of directors as long as it and its affiliates hold at least 50% of our outstanding common stock. The stockholders agreement will provide that for so long as Crestview and its affiliates hold at least 30% of our issued and outstanding common stock, Crestview will have the right to appoint any director as the Chairman of our board of directors. The stockholders agreement will also provide that, for so long as Crestview and its affiliates hold at least 50% of our issued and outstanding common stock, Crestview’s approval will be required for certain corporate actions, including change of control transactions, equity issuances, asset sales, certain debt incurrences, the amendment of our amended and restated certificate of incorporation or amended and restated bylaws and the hiring or termination of our Chief Executive Officer. See “Certain Relationships and Related Party Transactions—Other Transactions with Affiliates—Stockholders Agreement.” As a result, Crestview Partners II GP, L.P. will continue to control all matters affecting us, including decisions regarding extraordinary business transactions, fundamental corporate transactions, appointment of members to our management, election of directors and our corporate and management policies. This concentration of ownership makes it unlikely that any other holder or group of holders of our common stock will be able to affect the way we are managed or the direction of our business. The interests of Crestview with respect to matters potentially or actually involving or affecting us, such as future acquisitions, financings and other corporate opportunities and attempts to acquire us, could conflict with your interests as a holder of our common stock. For example, the concentration of ownership controlled by Crestview Partners II GP, L.P. could delay, defer or prevent a change of control of us or impede a merger, takeover or other business combination that you as a stockholder may otherwise view favorably. Further, a sale of a substantial number of shares of stock in the future by Crestview Partners II GP, L.P. could cause our stock price to decline.
Section 203 of the Delaware General Corporation Law (the “DGCL”) may affect the ability of an “interested stockholder” to engage in certain business combinations, including mergers, consolidations or acquisitions of additional shares, for a period of three years following the time that the stockholder becomes an “interested stockholder.” An “interested stockholder” is defined to include persons owning directly or indirectly 15% or more of the outstanding voting stock of a corporation. We have elected in our amended and restated certificate of incorporation not to be subject to Section 203 of the DGCL. Nevertheless, our amended and restated certificate of incorporation will contain provisions that have the same effect as Section 203 of the DGCL, except that they provide that affiliates of Crestview Partners II GP, L.P. and their transferees will not be deemed to be
33
Table of Contents
“interested stockholders,” regardless of the percentage of our voting stock owned by them, and accordingly will not be subject to such restrictions.
There is no existing market for our common stock, and we do not know if one will develop to provide you with adequate liquidity to sell our common stock at prices equal to or greater than the price you paid in this offering.
Prior to this offering, there has not been a public market for our common stock. We cannot predict the extent to which investor interest in our Company will lead to the development of an active trading market on the stock exchange on which we list our common stock or otherwise or how liquid that market might become.
The initial public offering price of our common stock may not be indicative of the market price of our common stock after this offering. In addition, an active, liquid and orderly trading market for our common stock may not develop or be maintained, and our stock price may be volatile.
Prior to this offering, our common stock was not traded on any market. An active, liquid and orderly trading market for our common stock may not develop or be maintained after this offering. Active, liquid and orderly trading markets usually result in less price volatility and more efficiency in carrying out investors’ purchase and sale orders. The market price of our common stock could vary significantly as a result of a number of factors, some of which are beyond our control. In the event of a drop in the market price of our common stock, you could lose a substantial part or all of your investment in our common stock. The initial public offering price was determined by negotiations between us and representatives of the underwriters, based on numerous factors which we discuss in “Underwriting (Conflicts of Interest),” and may not be indicative of the market price of our common stock after this offering. Consequently, you may not be able to sell shares of our common stock at prices equal to or greater than the price paid by you in this offering.
The following factors could affect our stock price:
| • | our operating and financial performance; |
| • | quarterly variations in the rate of growth of our financial indicators, such as net income per share, net income and revenues; |
| • | the public reaction to our press releases, our other public announcements and our filings with the SEC; |
| • | strategic actions by our competitors; |
| • | our failure to meet revenue or earnings estimates by research analysts or other investors; |
| • | changes in revenue or earnings estimates, or changes in recommendations or withdrawal of research coverage, by equity research analysts; |
| • | speculation in the press or investment community; |
| • | the failure of research analysts to cover our common stock; |
| • | sales of our common stock by us or other stockholders, or the perception that such sales may occur; |
| • | changes in accounting principles, policies, guidance, interpretations or standards; |
| • | additions or departures of key management personnel; |
| • | actions by our stockholders; |
| • | general market conditions; |
| • | domestic and international economic, legal and regulatory factors unrelated to our performance; and |
| • | the realization of any risks describes under this “Risk Factors” section, or other risks that may materialize in the future. |
The stock markets in general have experienced extreme volatility that has often been unrelated to the operating performance of particular companies. These broad market fluctuations may adversely affect the trading price of our common stock. Securities class action litigation has often been instituted against companies following periods of volatility in the overall market and in the market price of a company’s securities. Such litigation, if instituted against us, could result in very substantial costs, divert our management’s attention and resources and harm our business, operating results and financial condition.
34
Table of Contents
Our amended and restated certificate of incorporation contains a provision renouncing our interest and expectancy in certain corporate opportunities.
Our amended and restated certificate of incorporation provides for the allocation of certain corporate opportunities between us and Crestview Partners. Under these provisions, neither Crestview Partners, its portfolio companies, funds or other affiliates, nor any of their officers, directors, agents, stockholders, members or partners will have any duty to refrain from engaging, directly or indirectly, in the same business activities or similar business activities or lines of business in which we operate. For instance, a director of our Company who also serves as a director, officer or employee of Crestview Partners or any of its portfolio companies, funds or other affiliates may pursue certain acquisitions or other opportunities that may be complementary to our business and, as a result, such acquisition or other opportunities may not be available to us. These potential conflicts of interest could have a material adverse effect on our business, financial condition, results of operations or prospects if attractive corporate opportunities are allocated by Crestview Partners to itself or its portfolio companies, funds or other affiliates instead of to us. The terms of our amended and restated certificate of incorporation are more fully described in “Description of Capital Stock.”
Our amended and restated certificate of incorporation and amended and restated bylaws, as well as Delaware law, will contain provisions that could discourage acquisition bids or merger proposals, which may adversely affect the market price of our common stock.
Our amended and restated certificate of incorporation authorizes our board of directors to issue preferred stock without stockholder approval. If our board of directors elects to issue preferred stock, it could be more difficult for a third party to acquire us. In addition, some provisions of our amended and restated certificate of incorporation and amended and restated bylaws could make it more difficult for a third party to acquire control of us, even if the change of control would be beneficial to our stockholders, including:
| • | a classified board of directors; |
| • | limitations on the removal of directors; |
| • | limitations on the ability of our stockholders to call special meetings; |
| • | advance notice provisions for stockholder proposals and nominations for elections to the board of directors to be acted upon at meetings of stockholders; |
| • | providing the board of directors with express authority to adopt, or to alter or repeal our bylaws; and |
| • | advance notice and certain information requirements for nominations for election to our board of directors or for proposing matters that can be acted upon by stockholders at stockholder meetings. |
Section 203 of the DGCL may affect the ability of an “interested stockholder” to engage in certain business combinations, for a period of three years following the time that the stockholder becomes an “interested stockholder.” We have elected in our amended and restated certificate of incorporation not to be subject to Section 203 of the DGCL. Nevertheless, our amended and restated certificate of incorporation will contain provisions that have the same effect as Section 203 of the DGCL, except that they provide that affiliates of Crestview Partners II GP, L.P. and their transferees will not be deemed to be “interested stockholders,” regardless of the percentage of our voting stock owned by them, and accordingly will not be subject to such restrictions. These charter provisions may limit the ability of third parties to acquire control of our Company.
Investors in this offering will experience immediate and substantial dilution of $24.20 per share.
Based on an assumed initial public offering price of $16.00 per share (the midpoint of the range set forth on the cover of this prospectus), purchasers of our common stock in this offering will experience an immediate and substantial dilution of $24.20 per share in the as adjusted net tangible book value per share of common stock from the initial public offering price, and our as adjusted net tangible book value as of March 31, 2015 after giving effect to this offering would be $(8.20) per share. This dilution is due in large part to earlier investors having paid substantially less than the initial public offering price when they purchased their shares. Please see “Dilution.”
35
Table of Contents
Future sales of our common stock in the public market could reduce our stock price, and any additional capital raised by us through the sale of equity or convertible securities may dilute your ownership in us.
We may sell additional shares of common stock in subsequent public offerings. We may also issue additional shares of common stock or convertible securities. After the completion of this offering, we will have 37,707,981 outstanding shares of common stock. This number includes 13,000,000 shares that we are selling in this offering, which may be resold immediately in the public market. Following the completion of this offering, assuming no exercise of the underwriters’ option to purchase additional shares, funds affiliated with Crestview Partners II GP, L.P. will collectively own 21,564,673 shares of our common stock, or approximately 57.2% of our total outstanding shares, all of which are restricted from immediate resale under the federal securities laws and are subject to the lock-up agreements with the underwriters described in “Underwriting (Conflicts of Interest),” but may be sold into the market in the future. Affiliates of Crestview Partners II GP, L.P. will be party to a registration rights agreement with us which will require us to effect the registration of their shares (and shares of certain of their affiliates) in certain circumstances. Please see “Shares Eligible for Future Sale” and “Certain Relationships and Related Party Transactions—Other Transactions with Affiliates—Registration Rights Agreement.”
In connection with this offering, we intend to file a registration statement with the SEC on Form S-8 providing for the registration of 9,171,050 shares of our common stock issued or reserved for issuance under our LTIP, ESPP, and the NEP Group, Inc. Equity Incentive Plan (“EIP”). Subject to the satisfaction of vesting conditions and the expiration of lock-up agreements, all shares registered under the registration statement on Form S-8 will be available for resale immediately in the public market without restriction.
We cannot predict the size of future issuances of our common stock or securities convertible into common stock or the effect, if any, that future issuances and sales of shares of our common stock will have on the market price of our common stock. Sales of substantial amounts of our common stock (including shares issued in connection with an acquisition), or the perception that such sales could occur, may adversely affect prevailing market prices of our common stock.
The underwriters of this offering may waive or release parties to the lock-up agreements entered into in connection with this offering, which could adversely affect the price of our common stock.
We, affiliates of Crestview Partners II GP, L.P., all of our directors and executive officers and certain of our stockholders and option holders representing approximately 99% in the aggregate of our common stock have entered into lock-up agreements with respect to their common stock, pursuant to which they are subject to certain resale restrictions for a period of 180 days following the effectiveness date of the registration statement of which this prospectus forms a part. Barclays Capital Inc. and Morgan Stanley & Co. LLC, at any time and without notice, may release all or any portion of the common stock subject to the foregoing lock-up agreements. If the restrictions under the lock-up agreements are waived, then, subject to compliance with applicable securities laws, common stock will be available for sale into the public markets, which could cause the market price of our common stock to decline and impair our ability to raise capital. See “Shares Eligible for Future Sale.”
In addition, all of our executive officers and the persons identified as key employees under “Management”, have agreed with us not to sell, without our prior consent, more than 50% of the shares of common stock held by them after this offering for a period of twelve months from the date of this prospectus, subject to certain exceptions. We may in our sole discretion release the common stock subject to these restrictions in whole or in part at any time.
36
Table of Contents
We are a “controlled company” within the meaning of the NYSE rules and, as a result, qualify for and intend to rely on exemptions from certain corporate governance requirements.
Following this offering, Crestview Partners II GP, L.P. will continue to control a majority of the combined voting power of all classes of our outstanding voting stock, and as a result we will be a controlled company within the meaning of the NYSE corporate governance standards. Under the NYSE rules, a company of which more than 50% of the voting power is held by another person or group of persons acting together is a controlled company and may elect not to comply with certain NYSE corporate governance requirements, including the requirements that:
| • | a majority of the board of directors consist of independent directors; |
| • | the nominating and governance committee be composed entirely of independent directors with a written charter addressing the committee’s purpose and responsibilities; |
| • | the compensation committee be composed entirely of independent directors with a written charter addressing the committee’s purpose and responsibilities; and |
| • | there be an annual performance evaluation of the nominating and governance and compensation committees. |
These requirements will not apply to us as long as we remain a controlled company. Accordingly, you may not have the same protections afforded to stockholders of companies that are subject to all of the corporate governance requirements of the NYSE.
Internal control deficiencies have been identified that constituted a material weakness and significant deficiencies in our internal control over financial reporting. If one or more material weaknesses or significant deficiencies recur or if we fail to establish and maintain effective internal control over financial reporting, our ability to accurately report our financial results could be adversely affected.
Prior to the completion of this offering, we have been a private company with limited accounting personnel to adequately execute our accounting processes and limited other supervisory resources with which to address our internal control over financial reporting. We have identified control deficiencies that constituted a material weakness and significant deficiencies in our internal control over financial reporting. The material weakness related to deficiencies in the design and operation of controls related to the analysis undertaken to support complex and non-routine accounting transactions and disclose such transactions in our financial statements and deficiencies associated with the process of researching, evaluating, and assessing such non-routine transactions. A material weakness is a control deficiency, or a combination of control deficiencies, in internal control over financial reporting, such that there is a reasonable possibility that a material misstatement of our annual or interim financial statements will not be prevented or detected on a timely basis.
We are in the early phases of evaluating the design and operation of our internal control over financial reporting and will not complete our review until after this offering is completed. We cannot predict the outcome of our review at this time. During the course of the review, we may identify additional control deficiencies, which could give rise to significant deficiencies and other material weaknesses, in addition to those described above. The material weakness described above could result in a misstatement of our accounts or disclosures that would result in a material misstatement of our annual or interim financial statements that would not be prevented or detected. We cannot assure you that the measures we have taken to date, or any measures we may take in the future, will be sufficient to remediate the material weakness described above or avoid potential future material weaknesses.
We are not currently required to comply with the SEC’s rules implementing Section 404 of the Sarbanes Oxley Act of 2002, and are therefore not required to make a formal assessment of the effectiveness of our internal control over financial reporting for that purpose. Upon becoming a public company, we will be required
37
Table of Contents
to comply with the SEC’s rules implementing Sections 302 and 404 of the Sarbanes Oxley Act of 2002, which will require our management to certify financial and other information in our quarterly and annual reports and provide an annual management report on the effectiveness of our internal control over financial reporting. Though we will be required to disclose material changes made to our internal controls and procedures on a quarterly basis, we will not be required to make our first annual assessment of our internal control over financial reporting pursuant to Section 404 until the year following our first annual report required to be filed with the SEC. To comply with the requirements of being a public company, we will need to implement additional internal controls, reporting systems and procedures and hire additional accounting, finance and legal staff. Furthermore, while we generally must comply with Section 404 of the Sarbanes Oxley Act of 2002 for our fiscal year ending December 31, 2016, we are not required to have our independent registered public accounting firm attest to the effectiveness of our internal controls until our first annual report subsequent to our ceasing to be an “emerging growth company” within the meaning of Section 2(a)(19) of the Securities Act. Accordingly, we may not be required to have our independent registered public accounting firm attest to the effectiveness of our internal controls until our annual report for the fiscal year ending December 31, 2020. Once it is required to do so, our independent registered public accounting firm may issue a report that is adverse in the event it is not satisfied with the level at which our controls are documented, designed, operated or reviewed.
If we fail to develop or maintain an effective system of internal controls, we may not be able to accurately report our financial results or prevent fraud. As a result, current and potential stockholders could lose confidence in our financial reporting, which would harm our business and the trading price of our common stock.
Effective internal controls are necessary for us to provide reliable financial reports, prevent fraud and operate successfully as a public company. If we cannot provide reliable financial reports or prevent fraud, our reputation and operating results would be harmed. We cannot be certain that our efforts to develop and maintain our internal controls will be successful, that we will be able to maintain adequate controls over our financial processes and reporting in the future or that we will be able to comply with our obligations under Section 404 of the Sarbanes Oxley Act of 2002. Any failure to develop or maintain effective internal controls, remediate current deficiencies in internal controls over financial reporting or difficulties encountered in implementing or improving our internal controls, could harm our operating results or cause us to fail to meet our reporting obligations. Ineffective internal controls could also cause investors to lose confidence in our reported financial information, which would likely have a negative effect on the trading price of our common stock.
For as long as we are an emerging growth company, we will not be required to comply with certain reporting requirements, including those relating to accounting standards and disclosure about our executive compensation, that apply to other public companies.
We are classified as an “emerging growth company” under the JOBS Act. For as long as we are an emerging growth company, which may be up to five full fiscal years, unlike other public companies, we will not be required to, among other things, (1) provide an auditor’s attestation report on management’s assessment of the effectiveness of our system of internal control over financial reporting pursuant to Section 404(b) of the Sarbanes-Oxley Act, (2) comply with any new requirements adopted by the PCAOB requiring mandatory audit firm rotation or a supplement to the auditor’s report in which the auditor would be required to provide additional information about the audit and the financial statements of the issuer, (3) provide certain disclosure regarding executive compensation required of larger public companies or (4) hold nonbinding advisory votes on executive compensation. We will remain an emerging growth company until the last day of the fiscal year (i) following the fifth anniversary of this offering; (ii) in which we have more than $1.0 billion in revenues; (iii) in which we become a “large accelerated filer”; or (iv) in which we have issued more than $1.0 billion of non-convertible debt over the preceding three-year period.
38
Table of Contents
We may issue preferred stock whose terms could adversely affect the voting power or value of our common stock.
Our amended and restated certificate of incorporation authorizes us to issue, without the approval of our stockholders, one or more classes or series of preferred stock having such designations, preferences, limitations and relative rights, including preferences over our common stock respecting dividends and distributions, as our board of directors may determine. The terms of one or more classes or series of preferred stock could adversely impact the voting power or value of our common stock. For example, we might grant holders of preferred stock the right to elect some number of our directors in all events or on the happening of specified events or the right to veto specified transactions. Similarly, the repurchase or redemption rights or liquidation preferences we might assign to holders of preferred stock could affect the residual value of the common stock.
If securities or industry analysts do not publish research or reports about our business, if they adversely change their recommendations regarding our common stock or if our operating results do not meet their expectations, our stock price could decline.
The trading market for our common stock will be influenced by the research and reports that industry or securities analysts publish about us or our business. If one or more of these analysts cease coverage of our Company or fail to publish reports on us regularly, we could lose visibility in the financial markets, which in turn could cause our stock price or trading volume to decline. Moreover, if one or more of the analysts who cover our Company downgrades our common stock or if our operating results do not meet their expectations, our stock price could decline.
Our amended and restated certificate of incorporation will designate the Court of Chancery of the State of Delaware as the sole and exclusive forum for certain types of actions and proceedings that may be initiated by our stockholders, which could limit our stockholders’ ability to obtain a favorable judicial forum for disputes with us or our directors, officers, employees or agents.
Our amended and restated certificate of incorporation will provide that unless we consent in writing to the selection of an alternative forum, the Court of Chancery of the State of Delaware will, to the fullest extent permitted by applicable law, be the sole and exclusive forum for (i) any derivative action or proceeding brought on our behalf, (ii) any action asserting a claim of breach of a fiduciary duty owed by any of our directors, officers, employees or agents to us or our stockholders, (iii) any action asserting a claim arising pursuant to any provision of the DGCL, our amended and restated certificate of incorporation or our bylaws, or (iv) any action asserting a claim against us that is governed by the internal affairs doctrine, in each such case subject to such Court of Chancery having personal jurisdiction over the indispensable parties named as defendants therein. Any person or entity purchasing or otherwise acquiring any interest in shares of our capital stock will be deemed to have notice of, and consented to, the provisions of our amended and restated certificate of incorporation described in the preceding sentence. This choice of forum provision may limit a stockholder’s ability to bring a claim in a judicial forum that it finds favorable for disputes with us or our directors, officers, employees or agents, which may discourage such lawsuits against us and such persons.
Alternatively, if our exclusive forum provision is not enforceable, we may be subject to additional costs that we do not currently anticipate.
Alternatively, if a court were to find these provisions of our amended and restated certificate of incorporation inapplicable to, or unenforceable in respect of, one or more of the specified types of actions or proceedings, we may incur additional costs that we do not currently anticipate associated with resolving such matters in other jurisdictions, which could adversely affect our business, financial condition or results of operations.
39
Table of Contents
This prospectus contains forward-looking statements that are subject to risks and uncertainties. All statements other than statements of historical fact included in this prospectus are forward-looking statements. Forward-looking statements provide our current expectations and projections relating to our financial condition, results of operations, plans, objectives, future performance and business. You can identify forward-looking statements by the fact that they do not relate strictly to historical or current facts. These statements may include words such as “anticipate,” “estimate,” “expect,” “project,” “plan,” “designed,” “intend,” “believe,” “may,” “will,” “should,” “can have,” “likely” and other words and terms of similar meaning in connection with any discussion of the timing or nature of future operating or financial performance or other events. For example, all statements we make relating to our estimated and projected costs, expenditures, cash flows, growth rates and financial results, our plans and objectives for future operations, growth, initiative and strategies or the expected outcome or impact of pending or threatened litigation are forward-looking statements. All forward-looking statements are subject to risks and uncertainties that may cause actual results to differ materially from those that we expected, including:
| • | competition in our existing and potential markets; |
| • | loss of, or a material reduction in, business from our largest clients; |
| • | loss of business resulting from an adverse realignment of broadcast rights; |
| • | fluctuations in currency exchange rates; |
| • | labor strikes and lock-outs in major professional sports leagues; |
| • | shifts in consumer viewership preferences away from sports and other live entertainment events; |
| • | completion of our financial closing procedures for the quarter ended June 30, 2015 resulting in changes to our preliminary estimates for that period; |
| • | our ability to estimate the size of our target market; |
| • | substantial increases in the costs of our operations, including studio rents, equipment and insurance; |
| • | our ability to respond to rapid changes in technology; |
| • | our ability to attract and retain senior management and other key personnel; |
| • | our ability to maintain satisfactory labor relations; |
| • | our substantial indebtedness and the restrictions imposed on our operations by the agreements governing our indebtedness; |
| • | interruptions or failures in our information technology systems; |
| • | changes in interest rates and currency exchange rates; |
| • | our failure to comply with the FCPA; |
| • | our ability to complete the acquisition of, or successfully integrate, additional businesses; and |
| • | other factors disclosed in the section entitled “Risk Factors” and elsewhere in this prospectus. |
We derive many of our forward-looking statements from our operating budgets and forecasts, which are based on many detailed assumptions. While we believe that our assumptions are reasonable, we caution that it is very difficult to predict the impact of known factors, and it is impossible for us to anticipate all factors that could affect our actual results. Important factors that could cause actual results to differ materially from our expectations, and cautionary statements are disclosed under the sections entitled “Risk Factors” and “Management’s Discussion and Analysis of Financial Condition and Results of Operations” in this prospectus. All written and oral forward-looking statements attributable to us, or persons acting on our behalf, are expressly qualified in their entirety by these cautionary statements as well as other cautionary statements that are made from time to time in our other SEC filings and public communications. You should evaluate all forward-looking statements made in this prospectus in the context of these risks and uncertainties.
40
Table of Contents
We caution you that the important factors referenced above may not contain all of the factors that are important to you. In addition, we cannot assure you that we will realize the results or developments we expect or anticipate or, even if substantially realized, that they will result in the consequences or affect us or our operations in the way we expect. The forward-looking statements included in this prospectus are made only as of the date hereof. We undertake no obligation to update or revise any forward-looking statement as a result of new information, future events or otherwise, except as otherwise required by law.
41
Table of Contents
We expect to receive approximately $190,500,000 of net proceeds (based upon the assumed initial public offering price of $16.00 per share, the midpoint of the range set forth on the cover of this prospectus) from the sale of the common stock offered by us, after deducting underwriting discounts and commissions and estimated offering expenses payable by us.
We intend to use $69.0 million of net proceeds from this offering to repay borrowings and related fees and expenses outstanding under our revolving credit facility and $85.9 million of net proceeds from this offering to repay borrowings and related fees and expenses outstanding under our second lien term loan, with any remaining net proceeds to be used for general corporate purposes, including to fund acquisitions. We intend to use cash on hand and borrowings under our revolving credit facility to fund a portion of the CMI acquisition price.
If the underwriters exercise their option to purchase additional shares of common stock in full, we estimate that our additional net proceeds will be approximately $29.3 million. We will use the additional net proceeds we receive pursuant to any exercise of the underwriters’ option to repay additional borrowings outstanding under our second lien term loan.
As of March 31, 2015, we had $75.5 million of outstanding borrowings under our revolving credit facility. The revolving credit facility is scheduled to expire on January 22, 2018 and bears interest at a variable rate, which was 4.172%-6.25% per annum at March 31, 2015. While we do not currently have any plans to immediately borrow additional amounts under the revolving credit facility, other than to fund a portion of the CMI acquisition price, we may at any time reborrow amounts repaid under the revolving credit facility and expect to do so to fund future acquisitions and our ongoing operations. As of March 31, 2015, we had $80.0 million of outstanding borrowings under our second lien term loan. The second lien term loan matures in July 2020 and bears interest at a variable rate, which was 9.50% per annum at March 31, 2015. See “Capitalization” for amounts outstanding at April 29, 2015.
A $1.00 increase or decrease in the assumed initial public offering price of $16.00 per share would cause the net proceeds from this offering, after deducting the underwriting discounts and commissions and estimated offering expenses, received by us to increase or decrease, respectively, by approximately $12.2 million, assuming the number of shares offered by us as set forth on the cover page of this prospectus remains the same. If the proceeds decrease due to a lower initial public offering price, then we would first reduce by a corresponding amount the net proceeds directed to repay outstanding borrowings under our second lien term loan. If the proceeds increase due to a higher initial public offering price, we would use the additional net proceeds to repay additional borrowings outstanding under our second lien term loan.
42
Table of Contents
We do not anticipate declaring or paying any cash dividends to holders of our common stock in the foreseeable future. We currently intend to retain future earnings, if any, to finance the growth of our business and to repay outstanding debt. Our future dividend policy is within the discretion of our board of directors and will depend upon then-existing conditions, including our results of operations, financial condition, capital requirements, investment opportunities, statutory restrictions on our ability to pay dividends and other factors our board of directors may deem relevant.
Because we are a holding company with no material direct operations, we are dependent on dividends from our subsidiaries to generate the funds necessary to pay any future dividends on our common stock. Our subsidiaries are currently restricted from paying cash dividends on our common stock in certain circumstances by the covenants in our First Lien Credit Agreement and may be further restricted by the terms of future debt or preferred securities. For further discussion of the restrictions under our credit agreements, please see “Management’s Discussion and Analysis of Financial Condition and Results of Operations—Liquidity and Capital Resources—Description of Our Indebtedness—Credit Facilities.”
43
Table of Contents
The following table sets forth our cash and cash equivalents and capitalization as of March 31, 2015:
| • | on an actual basis; and |
| • | as adjusted to give effect to the sale of shares of our common stock by us in this offering at an assumed initial public offering price of $16.00 per share (the midpoint of the range set forth on the cover of this prospectus) and the application of the net proceeds as set forth under “Use of Proceeds.” |
You should read the following table in conjunction with “Management’s Discussion and Analysis of Financial Condition and Results of Operations” and our consolidated financial statements and related notes appearing elsewhere in this prospectus.
| As of March 31, 2015 | ||||||||
| Actual | As Adjusted(1) |
|||||||
| (in millions, except par value) |
||||||||
| Cash and cash equivalents |
$ | 9.6 | $ | 50.3 | ||||
|
|
|
|
|
|||||
| Long-term debt, including current maturities |
||||||||
| Revolving credit facility (2) |
75.5 | 6.5 | ||||||
| First lien term loan |
732.5 | 732.5 | ||||||
| Second lien term loan |
80.0 | — | ||||||
| Assumed debt—Faber Acquisition |
8.4 | 8.4 | ||||||
|
|
|
|
|
|||||
| Total indebtedness (3) |
$ | 896.4 | $ | 747.4 | ||||
| Stockholders’ equity: |
||||||||
| Preferred stock—$0.01 par value; no shares authorized, issued or outstanding, actual; 50,000,000 shares authorized, no shares issued or outstanding, as adjusted |
— | — | ||||||
| Common stock—$0.01 par value; 400,000,000 shares authorized, 22,498,930 shares issued or outstanding, actual; 400,000,000 shares authorized, 37,707,981 shares issued and outstanding, as adjusted |
0.2 | 0.4 | ||||||
| Additional paid-in capital |
215.3 | 405.6 | ||||||
| Accumulated other comprehensive income (loss) |
(15.5 | ) | (15.5) | |||||
| Stock subscription |
(0.1 | ) | (0.1) | |||||
| Retained deficit |
(105.9 | ) | (105.9) | |||||
|
|
|
|
|
|||||
| Total stockholders’ equity |
94.0 | 284.5 | ||||||
|
|
|
|
|
|||||
| Total capitalization |
$ | 990.4 | $ | 1,031.9 | ||||
|
|
|
|
|
|||||
| (1) | A $1.00 increase (decrease) in the assumed initial public offering price of $16.00 per share, which is the midpoint of the price range set forth on the cover page of this prospectus, would decrease total indebtedness (or, in the event of a $1.00 decrease, increase total indebtedness) by approximately $12.1 million and increase (decrease) each of additional paid-in capital, total equity and total capitalization by approximately $12.1 million assuming that the number of shares offered by us, as set forth on the cover page of this prospectus, remains the same, after deducting the estimated underwriting discounts and commissions and estimated offering expenses payable by us. We may also increase or decrease the number of shares we are offering. An increase (decrease) of one million shares offered by us at an assumed offering price of $16.00 per share, which is the midpoint of the range set forth on the cover page of this prospectus, would decrease total indebtedness (or, in the event of a decrease of one million shares, increase total indebtedness) by approximately $15.0 million and increase (decrease) each of additional paid-in capital, total shareholders’ equity and total capitalization by approximately $15.0 million, after deducting the estimated underwriting discounts and commissions and estimated offering expenses payable by us. |
| (2) | As of March 31, 2015, we had $27.6 million of available borrowing capacity under our revolving credit facility. After giving effect to the application of the net proceeds of this offering, we expect to have $96.6 million of available borrowing capacity under our $105.0 million revolving credit facility. As of March 31, 2015, we had letters of credit issued and outstanding of approximately $1.9 million. |
| (3) | Total indebtedness does not include capital leases of $39.5 million as of March 31, 2015. |
44
Table of Contents
| The principal changes to our capitalization since March 31, 2015 as a result of the Outside Broadcast and Mediatec acquisitions are described below: |
| An increase in our long-term indebtedness by $133.8 million dollars: |
| • | the assumption of 10.3 million EUR, or $11.2 million of indebtedness in connection with the acquisition of Outside Broadcast on April 29, 2015; |
| • | the assumption of 408.8 million SEK or $47.5 million of indebtedness in connection with the acquisition of Mediatec on April 29, 2015; and |
| • | the incurrence of an additional $75.0 million of second lien indebtedness on April 29, 2015 to fund the acquisitions; and |
| An increase at April 29, 2015 in our stockholders’ equity of $25.5 million to $119.5 million, comprised of $25.0 million from the issuance of 1,750,002 additional shares of common stock to 24,248,932 shares outstanding at April 29, 2015, used in part to fund the acquisitions, and $0.5 million of minority interest from the acquisition of Mediatec. |
| These transactions increased our total capitalization by $159.3 million to $1,189.2 million at April 29, 2015. Since April 29, 2015, we have also issued 441,002 shares of common stock for total consideration of approximately $6.3 million. |
| The cash balance for Mediatec and Outside Broadcast at April 29, 2015 was $6.7 million and $0.3 million, respectively. |
| We expect to assume additional indebtedness in connection with our acquisition of CMI, which we estimate to be approximately $45.0 million as of the date of this prospectus, and we intend to use cash on hand and borrowings under our revolving credit facility to fund a portion of the CMI acquisition price. |
45
Table of Contents
Purchasers of the common stock in this offering will experience immediate and substantial dilution in the net tangible book value per share of their common stock for accounting purposes. Assuming an initial public offering price of $16.00 per share (which is the midpoint of the range set forth on the cover page of this prospectus), after giving effect to the sale of the shares in this offering and further assuming the receipt of the estimated net proceeds (after deducting estimated underwriting discounts and commissions and estimated offering expenses), our adjusted pro forma net tangible book value as of March 31, 2015 would have been approximately $(531.2) million, or $(23.61) per share. This represents an immediate increase in the net tangible book value of $12.02 per share to our existing stockholders and an immediate dilution (i.e., the difference between the offering price and the adjusted pro forma net tangible book value after this offering) to new investors purchasing shares in this offering of $24.20 per share. The following table illustrates the per share dilution to new investors purchasing shares in this offering:
| Initial public offering price per share |
$ | 16.00 | ||||||
| Net tangible book value per share as of March 31, 2015 |
$ | (23.61) | ||||||
| Increase per share attributable to existing stockholders (1) |
3.39 | |||||||
| Increase per share attributable to new investors in this offering |
12.02 | |||||||
|
|
|
|||||||
| As adjusted pro forma net tangible book value per share after giving effect to this offering |
(8.20) | |||||||
|
|
|
|||||||
| Dilution in pro forma net tangible book value per share to new investors in this offering |
$ | 24.20 | ||||||
|
|
|
| (1) | Reflects 2,209,051 shares issued after March 31, 2015 for aggregate consideration of $31,532,575. |
A $1.00 increase (decrease) in the assumed initial public offering price of $16.00 per share, which is the midpoint of the range set forth on the cover page of this prospectus, would increase (decrease) our as adjusted pro forma net tangible book value per share after the offering by $0.32 and increase (decrease) the dilution to new investors in this offering by the same amount, assuming the number of shares offered by us, as set forth on the cover page of this prospectus, remains the same, after deducting the estimated underwriting discounts and commissions and estimated offering expenses payable by us. The following table summarizes, as of July 13, 2015, the total number of shares of common stock owned by existing stockholders and to be owned by new investors, the total consideration paid, and the average price per share paid by our existing stockholders and to be paid by new investors in this offering at the assumed initial public offering price of $16.00 per share, calculated before deduction of estimated underwriting discounts and commissions:
| Shares Purchased | Total Consideration | Average Price Per Share |
||||||||||||||||||
| Number | Percent | Amount (in thousands) |
Percent | |||||||||||||||||
| Existing stockholders |
24,707,981 | 65.5 | % | $ | 252,328 | 54.8 | % | $ | 10.21 | |||||||||||
| New investors in this offering |
13,000,000 | 34.5 | 208,000 | 45.2 | 16.00 | |||||||||||||||
| Total |
37,707,981 | 100 | % | $ | 460,328 | 100 | % | $ | 12.21 | |||||||||||
The above tables and discussion are based on the number of shares of our common stock to be outstanding as of the closing of this offering. The table does not reflect 4,758,958 shares of common stock reserved for issuance under our long-term incentive plan, which we plan to adopt in connection with this offering. If the underwriters’ option to purchase additional shares is exercised in full, the number of shares held by new investors will be increased to 14,950,000, or approximately 37.7% of the total number of shares of common stock.
46
Table of Contents
SELECTED HISTORICAL CONDENSED CONSOLIDATED FINANCIAL DATA
The following table presents selected historical condensed consolidated financial data. On December 24, 2012, NEP Group, Inc. acquired ASP NEP/NCP Holdco, Inc., the accounting predecessor of NEP Group, Inc. (the “Predecessor”). Therefore, we present below selected historical consolidated financial data of the Predecessor as of and for the 358-day period ended December 23, 2012.
The selected historical financial data as of March 31, 2015 and for the three months ended March 31, 2015 and 2014 is derived from the unaudited condensed consolidated financial statements and the notes thereto included elsewhere in this prospectus. The selected historical financial data as of and for the years ended December 31, 2014 and 2013, as of December 31, 2012, and for the period from NEP Group, Inc.’s inception on December 24, 2012 through December 31, 2012 is derived from the audited consolidated financial statements and the notes thereto included elsewhere in this prospectus. The selected historical financial data for the 358-day period ended December 23, 2012 is derived from the audited consolidated financial statements of the Predecessor included elsewhere in this prospectus.
The financial data set forth below is only a summary and is not complete. It also does not necessarily indicate or represent anything about our future operations. You should read these selected historical financial data in conjunction with the disclosure under “Use of Proceeds,” “Capitalization,” “Summary Historical Condensed Consolidated Financial Data” and “Management’s Discussion and Analysis of Financial Condition and Results of Operations” and the financial statements and the related notes thereto included elsewhere in this prospectus.
| Predecessor | Successor | |||||||||||||||||||||||||
| 358-Day Period Ended December 23, 2012 |
December 24, 2012 (date of inception) through December 31, 2012 |
Year Ended December 31, |
Three Months Ended March 31, |
|||||||||||||||||||||||
| 2013 | 2014 | 2014 (as restated)(3) |
2015 | |||||||||||||||||||||||
| (in millions) | ||||||||||||||||||||||||||
| Statement of Operations Data |
||||||||||||||||||||||||||
| Revenue |
$ | 372.1 | $ | 4.4 | $ | 356.5 | $ | 442.8 | $ | 95.2 | $ | 103.1 | ||||||||||||||
| Cost of services, exclusive of depreciation and amortization |
139.2 | 1.0 | 103.8 | 148.9 | 32.8 | 31.5 | ||||||||||||||||||||
| Engineering |
67.6 | 1.5 | 72.7 | 82.5 | 19.5 | 21.2 | ||||||||||||||||||||
| Selling, general and administrative |
83.4 | 0.9 | 63.5 | 76.9 | 18.1 | 21.5 | ||||||||||||||||||||
| Depreciation and amortization (1) |
73.6 | 2.2 | 101.1 | 133.6 | 30.2 | 36.9 | ||||||||||||||||||||
|
|
|
|
|
|
|
|
|
|
|
|
|
|||||||||||||||
| Income (loss) from operations |
8.4 | (1.3 | ) | 15.4 | 0.9 | (5.3 | ) | (8.1 | ) | |||||||||||||||||
| Interest expense (1) |
16.0 | 1.1 | 38.3 | 43.4 | 10.3 | 11.9 | ||||||||||||||||||||
| Write-off of debt issuance costs |
— | — | 21.2 | 0.5 | 0.5 | — | ||||||||||||||||||||
| Other income |
(1.4 | ) | — | (3.6 | ) | (7.1 | ) | (2.8 | ) | (1.6 | ) | |||||||||||||||
| Other expenses |
3.3 | — | 3.3 | 18.1 | 0.7 | 12.7 | ||||||||||||||||||||
|
|
|
|
|
|
|
|
|
|
|
|
|
|||||||||||||||
| Loss before income taxes |
(9.5 | ) | (2.5 | ) | (43.8 | ) | (54.0 | ) | (13.9 | ) | (31.1 | ) | ||||||||||||||
| Income tax (expense) benefit |
(3.0 | ) | 0.9 | 16.5 | 12.8 | 3.2 | (4.9 | ) | ||||||||||||||||||
|
|
|
|
|
|
|
|
|
|
|
|
|
|||||||||||||||
| Net loss |
(12.4 | ) | (1.5 | ) | (27.3 | ) | (41.2 | ) | (10.7 | ) | (35.9 | ) | ||||||||||||||
| Foreign translation adjustment |
1.3 | — | 0.7 | (8.5 | ) | 3.7 | (7.7 | ) | ||||||||||||||||||
|
|
|
|
|
|
|
|
|
|
|
|
|
|||||||||||||||
| Comprehensive loss |
$ | (11.1 | ) | $ | (1.5 | ) | $ | (26.6 | ) | $ | (49.7 | ) | $ | (7.0 | ) | $ | (43.6 | ) | ||||||||
|
|
|
|
|
|
|
|
|
|
|
|
|
|||||||||||||||
| Earnings Per Common Share (4): |
||||||||||||||||||||||||||
| Net loss attributable to common shareholders, basic |
$ | (7.45) | $ | (0.07) | $ | (1.25) | $ | (1.86) | $ | (0.49) | $ | (1.60) | ||||||||||||||
| Net loss attributable to common shareholders, diluted |
$ | (7.45) | $ | (0.07) | $ | (1.25) | $ | (1.86) | $ | (0.49) | $ |
(1.60) |
| |||||||||||||
47
Table of Contents
| Predecessor | Successor | |||||||||||||||||||||||||
| 358-Day Period Ended December 23, 2012 |
December 24, 2012 (date of inception) through December 31, 2012 |
Year Ended December 31, |
Three Months Ended March 31, |
|||||||||||||||||||||||
| 2013 | 2014 | 2014 (as restated)(3) |
2015 | |||||||||||||||||||||||
| (in millions) | ||||||||||||||||||||||||||
| Number of common shares outstanding, basic |
1,668,793 | 21,703,089 | 21,811,728 | 22,128,922 | 22,066,421 | 22,474,929 | ||||||||||||||||||||
| Number of common shares outstanding, diluted |
1,668,793 | 21,703,089 | 21,811,728 | 22,128,922 | 22,066,421 | 22,474,929 | ||||||||||||||||||||
| Balance Sheet Data (at period end) |
||||||||||||||||||||||||||
| Cash and cash equivalents |
$ | 9.3 | $ | 8.0 | $ | 3.9 | $ | 6.8 | $ | 14.0 | $ | 9.6 | ||||||||||||||
| Working capital |
(23.6 | ) | 8.0 | 14.7 | 12.1 | 9.6 | — | |||||||||||||||||||
| Total assets |
651.1 | 911.4 | 879.8 | 1,117.1 | 1,060.6 | 1,110.7 | ||||||||||||||||||||
| Total debt, including current portion |
394.8 | 623.5 | 622.2 | 874.2 | 800.2 | 896.4 | ||||||||||||||||||||
| Total shareholders’ equity |
143.7 | 200.1 | 176.1 | 135.8 | 172.6 | 94.0 | ||||||||||||||||||||
| Cash Flow Data |
||||||||||||||||||||||||||
| Net cash flow provided by (used in): |
||||||||||||||||||||||||||
| Operating activities |
$ | 91.0 | $ | (1.4 | ) | $ | 70.7 | $ | 79.3 | $ | 15.5 | $ | 12.9 | |||||||||||||
| Investing activities |
(110.5 | ) | (400.6 | ) | (61.9 | ) | (337.8 | ) | (174.8 | ) | (35.9 | ) | ||||||||||||||
| Financing activities |
25.8 | 400.7 | (11.8 | ) | 253.5 | 173.0 | 17.6 | |||||||||||||||||||
| Other Financial Data |
||||||||||||||||||||||||||
| Adjusted EBITDA (2) |
$ | 112.5 | $ | 0.9 | $ | 122.5 | $ | 145.1 | $ | 27.0 | $ | 32.1 | ||||||||||||||
|
|
|
|
|
|
|
|
|
|
|
|
|
|||||||||||||||
| (1) | As a result of our Corporate Reorganization, the comparability of our interest expense and depreciation and amortization was affected between the Predecessor’s and Successor’s financial data. Interest expense increased as a result of the increase in debt used to finance the Corporate Reorganization. Depreciation and amortization increased as a result of an increase in the basis of our assets to reflect their fair market value at the time of the Corporate Reorganization. |
| (2) | Please see “Summary—Non-GAAP Financial Measure—Adjusted EBITDA” for a reconciliation of Adjusted EBITDA to net loss. |
| (3) | Subsequent to the date of the original issuance, we concluded that we were required to restate our unaudited interim condensed consolidated financial statements as of and for the quarter ended March 31, 2014. These amounts have been noted herein as restated. See Note 15 within the Condensed Consolidated Financial Statements for further discussion and detail of the restatement. |
| (4) | On July 17, 2015, our board of directors approved: (i) an increase in the authorized common stock and (ii) a common stock split. All per share amounts and common shares outstanding have been restated to reflect a 7.7-for-1 stock split which was declared by our board of directors on July 17, 2015, and effective as of the close of business on that date. Accordingly, all common share and per share amounts, other than those presented for the Predecessor Period, have been adjusted to reflect the 7.7-for-1 stock split as though it had occurred at the beginning of the initial period presented. |
48
Table of Contents
MANAGEMENT’S DISCUSSION AND ANALYSIS OF FINANCIAL CONDITION AND RESULTS OF OPERATIONS
The following discussion and analysis summarizes the significant factors affecting the consolidated operating results, financial condition, liquidity and cash flows of our Company as of and for the periods presented below. The following discussion and analysis should be read in conjunction with our consolidated financial statements and the related notes included elsewhere in this prospectus. This discussion contains forward-looking statements that are based on the beliefs of our management, as well as assumptions made by, and information currently available to, our management. Actual results could differ materially from those discussed in or implied by forward-looking statements as a result of various factors, including those discussed below and elsewhere in this prospectus, particularly in the section entitled “Risk Factors.”
Overview
We are the largest global outsourced provider of comprehensive live and broadcast production solutions, with leading market positions in the United States, Europe and Australia. We serve the premium sports, entertainment and other live event production markets, where we offer mission-critical outsourced solutions, including remote production, studio production, video display and host broadcasting. Our service offering combines highly-trained technical experts with state-of-the-art production resources to offer a comprehensive and platform-agnostic solution across a wide variety of broadcasts and live events. Our clients include many of the world’s premier television broadcasters, cable networks and concert producers. Founded in 1986, NEP was a first-mover in responding to client demands for a higher level of engineering expertise and service to support the requirements of increasingly complex live event broadcasts. Over time, we have developed a wide range of services, built our scale and deepened our client relationships and engineering capabilities. Today, we have offices in 13 countries and experience in more than 65 countries.
For the three months ended March 31, 2015, we had total revenues of $103.1 million, an operating loss of $8.1 million, a net loss of $35.9 million and Adjusted EBITDA of $32.1 million. For the year ended December 31, 2014, we had total revenues of $442.8 million, operating income of $0.9 million, a net loss of $41.2 million and Adjusted EBITDA of $145.1 million. For a definition of Adjusted EBITDA and a reconciliation of Adjusted EBITDA to net loss see “Summary—Summary Historical Condensed Consolidated Financial Data.”
We manage our business through the following segments, identified by geography:
United States. We offer each of our primary services to the live sports and entertainment markets in the United States and North America. For the three months ended March 31, 2015 and the year ended December 31, 2014, our United States business segment accounted for 63% and 61% of our revenues, respectively, and 69% and 68% of our Adjusted EBITDA, respectively.
International. Our International segment includes our operations in the U.K., Continental Europe, Australia, and Dubai for which we offer each of our primary services to the live sports and entertainment markets. For the three months ended March 31, 2015 and the year ended December 31, 2014, our international business segment accounted for 37% and 39% of our revenues, respectively, and 31% and 32% of our Adjusted EBITDA, respectively.
Key Financial Measures
Revenue. We generate revenue by providing remote production, studio production, video display and host broadcasting services to our clients for use in the production of live sports and entertainment events. Our contracts with clients generally cover periods ranging from a single day up to a period of seven years. Revenue is considered earned as the services are provided in conjunction with the production of each event.
49
Table of Contents
Expenses. Our major categories of expenses are as follows:
Cost of Services, Exclusive of Depreciation and Amortization. These expenses represent variable costs directly associated with the generation of revenues from our clients. Significant expense classifications include freelance labor used to supplement our full-time field staff of broadcast engineers and drivers, excess equipment rentals, equipment shipping and travel costs for our field staff. Cost of services are expensed as incurred once services are provided in conjunction with each respective event.
Engineering. These expenses represent costs associated with the provision of our services to clients by our field staff. Engineering expenses include employee compensation costs for our broadcast engineers, drivers, operations and client support personnel in addition to repairs and maintenance costs for our production facilities and equipment.
Selling, General and Administrative. Our selling, general and administrative (“SG&A”) expenses include selling costs, real estate rental costs, employee compensation for non-field staff and other costs for back office support. Following this offering, we expect increased SG&A expenses for additional public company expenses that did not apply to us historically as a private company.
Depreciation and Amortization. Depreciation expense relates primarily to our production equipment which is depreciated over a period ranging from five to ten years depending upon the nature of the equipment. Depreciation also relates to furniture and fixtures, buildings and leasehold improvements. Amortization under capital leases is included in depreciation expense.
Amortization expense primarily relates to our client relationships, which are amortized on a straight-line basis over the estimated useful life of each relationship. The weighted average useful life was 210 months at March 31, 2015.
Factors Affecting Comparability of Historical Results
Corporate Reorganization and Related Transactions
On December 24, 2012, we acquired the Predecessor. Since our acquisition of the Predecessor (the “Corporate Reorganization”), we have operated as a standalone company, and our results of operations may not be comparable to the historical results of operations for the periods presented, primarily for the reasons described below:
| • | In connection with the Corporate Reorganization, certain additional transactions were consummated, and we entered into certain agreements with respect to our operations, including the following: |
| • | Credit Agreements. To finance the Corporate Reorganization, we entered into a series of credit agreements, initially consisting of a $60.0 million revolving credit facility, a $455.0 million first lien term loan and a $165.0 million second lien term loan, which replaced the Predecessor’s existing credit agreements. |
In January 2013, we refinanced $15.0 million of the second lien term loan by increasing the first lien term loan by a corresponding amount and also prepaid $10.0 million of the second lien term loan. In February 2013, we completed a second refinancing which resulted in $60.0 million of the second lien term loan being refinanced to the first lien term loan. In January 2014, we financed the purchase of GTV by increasing the first lien term loan by $155.0 million.
In August 2014, we amended the first lien term loan in conjunction with the acquisition of MIRA. As a result of this amendment, the existing first lien term loan increased by $60.0 million.
In January 2015, we increased the maximum borrowing capacity under our revolving credit facility by $45.0 million, for a total maximum of $105.0 million. There were no changes in the terms and conditions of the revolving credit facility as a result of this amendment.
50
Table of Contents
As a result of these transactions, as of March 31, 2015, our credit facilities consisted of (i) a $745.0 million first lien term loan, (ii) an $80.0 million second lien term loan and (iii) a $105.0 million revolving credit facility. See “—Liquidity and Capital Resources—Description of Our Indebtedness—Credit Facilities.”
| • | NEP Consulting Agreement. Following the Corporate Reorganization, we entered into a consulting agreement with Crestview Partners, pursuant to which they provide us with ongoing management, advisory and consulting services for an annual fee of $1.5 million plus expense reimbursements of $0.5 million. The consulting agreement will terminate upon the closing of this offering. See “Certain Relationships and Related Person Transactions—Historical Agreements with Affiliates—Consulting Agreement.” |
| • | Our predecessor was party to a consulting agreement with its majority shareholder, American Securities Capital Partners. As part of this consulting agreement, our predecessor was required to pay an annual management fee of $2.3 million. The agreement terminated upon completion of the Corporate Reorganization. |
| • | We incurred $19.7 million and $0.8 million of transaction fees associated with the Corporate Reorganization for the 358-day period ended December 23, 2012 and the year ended December 31, 2013, respectively, each of which is recorded in selling, general and administrative expense. |
| • | The Corporate Reorganization has been accounted for under the acquisition method of accounting for business combinations which requires that the assets acquired and liabilities assumed be adjusted to their estimated fair market value at the date of the acquisition. This treatment changed the book basis for the assets acquired and liabilities assumed from Predecessor as of December 24, 2012. In addition, depreciation and amortization expense increased following the Corporate Reorganization as a result of the basis of our assets being increased to reflect their fair market value at the time of the Corporate Reorganization. |
GTV Acquisition
On January 24, 2014, we acquired GTV, the largest provider of outsourced broadcast solutions in Australia. The aggregate purchase price was approximately $153.5 million, which was allocated to the net assets acquired and liabilities assumed. To finance this transaction, we increased and drew our first lien term loan by $155.0 million. Transaction costs of approximately $1.3 million were incurred related to the acquisition and are included in SG&A expenses for the year ended December 31, 2014.
MIRA Acquisition
On August 29, 2014, we acquired all of the assets of MIRA, based in Portland, Oregon, which specializes in providing remote production services for live events in the United States. The aggregate purchase price was approximately $63.6 million, which was allocated to the net assets acquired. To finance this transaction, we increased our first lien term loan by $60.0 million and financed the remaining purchase price with cash on hand and borrowings on the credit facility. Transaction costs of approximately $0.6 million were incurred related to the acquisition and are included in SG&A expenses for the year ended December 31, 2014.
Faber Acquisition
On December 19, 2014, we acquired Faber Audiovisuals, a leading supplier of display and audiovisual solutions in the European and international markets, headquartered in the Netherlands with outlets in Dubai and the United States. The aggregate purchase price was approximately $31.7 million, which was allocated to the net assets acquired and liabilities assumed. This transaction was primarily funded by cash on hand and borrowings under the credit facility. Transaction costs of approximately $0.8 million were incurred related to the acquisition and are included in SG&A expenses for the year ended December 31, 2014.
51
Table of Contents
Screen Scene Group Acquisition
On January 30, 2015, we acquired the Screen Scene Group, headquartered in Dublin, Ireland, which specializes in outsourced broadcast services, post-production and visual effects services, and specialized uplink and communication services. The aggregate purchase price was approximately $13.5 million, which was allocated to the net assets acquired and liabilities assumed. This transaction was primarily funded by cash on hand, borrowings on the credit facility and stock. Transaction costs of approximately $0.5 million were incurred related to the acquisition and are included in SG&A expenses for the three months ended March 31, 2015.
IPO Transactions
Our results of operations for periods subsequent to the closing of this offering may not be comparable to our results of operations for periods prior to the closing of this offering as a result of certain aspects of this offering, including the following:
| • | We expect that our general and administrative expenses will increase as a result of becoming a publicly traded company, including Exchange Act reporting expenses; expenses associated with Sarbanes-Oxley Act compliance; expenses associated with the listing of our common stock on the NYSE; independent auditors fees; legal fees, investor relations expenses; transfer agent fees; director and officer liability insurance costs; and director compensation. |
| • | We intend to use the net proceeds from this offering to repay $69.0 million of borrowings and related fees and expenses outstanding under our revolving credit facility as well as $85.9 million of borrowings and related fees and expenses outstanding under our second lien term loan, which will reduce our interest expense for periods subsequent to the closing of this offering. We also intend to use cash on hand and borrowings under our revolving credit facility to fund a portion of the CMI acquisition price. For the year ended December 31, 2014 and the three months ended March 31, 2015, $1.3 million and $0.6 million, respectively, of our total interest expense related to our revolving credit facility and $7.7 million and $1.9 million, respectively, of our total interest expense related to our second lien term loan debt. |
Results of Operations
In this “Results of Operations” section, we first review our business on a consolidated basis, and then separately review the results of operations of each segment. Detailed explanations of the period over period changes in our results of operations are contained in the discussion of the individual segments.
The historical financial data presented below are not necessarily indicative of the results to be expected for any future period. The historical financial data for the 358-day period ended December 23, 2012, do not reflect our capital structure following the Corporate Reorganization.
52
Table of Contents
Consolidated Financial Data
| Predecessor | Successor | |||||||||||||||||||||||||
| 358-Day Period Ended December 23, 2012 |
December 24, 2012 (inception date) to December 31, 2012 |
Year Ended December 31, |
Three Months Ended March 31, |
|||||||||||||||||||||||
| 2013 | 2014 | 2014 (as restated)(3) |
2015 | |||||||||||||||||||||||
| (in millions) | ||||||||||||||||||||||||||
| Revenue |
$ | 372.1 | $ | 4.4 | $ | 356.5 | $ | 442.8 | $ | 95.2 | $ | 103.1 | ||||||||||||||
| Cost of services, exclusive of depreciation and amortization |
139.2 | 1.0 | 103.8 | 148.9 | 32.8 | 31.5 | ||||||||||||||||||||
| Engineering |
67.6 | 1.5 | 72.7 | 82.5 | 19.5 | 21.2 | ||||||||||||||||||||
| Selling, general, and administrative |
83.4 | 0.9 | 63.5 | 76.9 | 18.1 | 21.5 | ||||||||||||||||||||
| Depreciation and amortization (1) |
73.6 | 2.2 | 101.1 | 133.6 | 30.2 | 36.9 | ||||||||||||||||||||
|
|
|
|
|
|
|
|
|
|
|
|
|
|||||||||||||||
| Income (loss) from operations |
8.4 | (1.3 | ) | 15.4 | 0.9 | (5.3 | ) | (8.1 | ) | |||||||||||||||||
| Interest expense (1) |
16.0 | 1.1 | 38.3 | 43.4 | 10.3 | 11.9 | ||||||||||||||||||||
| Write off of debt issuance costs |
— | — | 21.2 | 0.5 | 0.5 | — | ||||||||||||||||||||
| Other income |
(1.4 | ) | — | (3.6 | ) | (7.1 | ) | (2.8 | ) | (1.6 | ) | |||||||||||||||
| Other expense |
3.3 | — | 3.3 | 18.1 | 0.7 | 12.7 | ||||||||||||||||||||
|
|
|
|
|
|
|
|
|
|
|
|
|
|||||||||||||||
| Loss before income taxes |
(9.5 | ) | (2.5 | ) | (43.8 | ) | (54.0 | ) | (13.9 | ) | (31.1 | ) | ||||||||||||||
| Income tax (expense) benefit |
(3.0 | ) | 0.9 | 16.5 | 12.8 | 3.2 | (4.9 | ) | ||||||||||||||||||
|
|
|
|
|
|
|
|
|
|
|
|
|
|||||||||||||||
| Net loss |
(12.4 | ) | (1.5 | ) | (27.3 | ) | (41.2 | ) | (10.7 | ) | (35.9 | ) | ||||||||||||||
| Foreign translation adjustment |
1.3 | — | 0.7 | (8.5 | ) | 3.7 | (7.7 | ) | ||||||||||||||||||
|
|
|
|
|
|
|
|
|
|
|
|
|
|||||||||||||||
| Comprehensive loss |
$ | (11.1 | ) | $ | (1.5 | ) | $ | (26.6 | ) | $ | (49.7 | ) | $ | (7.0 | ) | (43.6 | ) | |||||||||
|
|
|
|
|
|
|
|
|
|
|
|
|
|||||||||||||||
| Adjusted EBITDA (2) |
$ | 112.5 | $ | 0.9 | $ | 122.5 | $ | 145.1 | $ | 27.0 | $ | 32.1 | ||||||||||||||
|
|
|
|
|
|
|
|
|
|
|
|
|
|||||||||||||||
| (1) | As a result of our Corporate Reorganization, the comparability of our interest expense and depreciation and amortization was affected between the Predecessor’s and Successor’s financial data. Interest expense increased as a result of the increase in debt used to finance the Corporate Reorganization. Depreciation and amortization increased as a result of an increase in the basis of our assets to reflect their fair market value at the time of the Corporate Reorganization. |
| (2) | See reconciliation to net loss under “—Adjusted EBITDA” below. |
| (3) | Subsequent to the date of the original issuance, we concluded that it was required to restate our unaudited interim condensed consolidated financial statements as of and for the quarter ended March 31, 2014. These amounts have been noted herein as restated. See Note 15 within the Condensed Consolidated Financial Statements for further discussion and detail of the restatement. |
Three Months Ended March 31, 2015 (Successor) Compared to the Three Months Ended March 31, 2014 (Successor)
Net loss. Net loss increased by $25.2 million to $35.9 million for the three months ended March 31, 2015 from $10.7 million for the three months ended March 31, 2014. The change is primarily due to increased depreciation and amortization expense due to the acquisitions of Faber, Screen Scene Group, MIRA, a full quarter of GTV operations and increased capital expenditures, increased interest expense due to incremental borrowings used to fund acquisitions, increased foreign currency losses related to mark-to-market adjustments, and a recorded income tax expense versus an income tax benefit in 2014. These increases in net losses were partially offset by the accretive results of acquired businesses and a decrease in the write-off of debt issuance costs.
Adjusted EBITDA. Adjusted EBITDA was $32.1 million for the three months ended March 31, 2015 and $27.0 million for the three months ended March 31, 2014.
53
Table of Contents
The difference between net loss and Adjusted EBITDA of $68.0 million for the three months ended March 31, 2015 is attributable to the add-back of interest expense of $11.9 million, depreciation and amortization of $36.9 million, stock-based compensation of $0.5 million, income tax expense of $4.9 million, acquisition activity expenses of $2.8 million, and other expenses, primarily foreign currency losses, of $12.7 million. These add-backs were partially offset by other income of $1.6 million and miscellaneous income of $0.1 million.
The difference between net loss and Adjusted EBITDA of $37.7 million for the three months ended March 31, 2014 is attributable to the add-back of interest expense of $10.3 million, depreciation and amortization of $30.2 million, stock-based compensation of $0.5 million, acquisition activity expenses of $1.0 million, write off of unamortized debt-issuance costs of $0.5 million, other expenses of $0.7 million, and miscellaneous expenses of $0.5 million. These add-backs were offset by an income tax benefit of $3.2 million and other income of $2.8 million.
Revenue. Total revenue increased by $7.9 million, or 8.3%, to $103.1 million for the three months ended March 31, 2015 from $95.2 million for the three months ended March 31, 2014. This increase was primarily attributable to the addition of the Silk Studios, Faber, MIRA, and Screen Scene acquisitions contributing $0.4 million, $4.3 million, $6.3 million, and $3.2 million, respectively. Also contributing was a full quarter of GTV operations, resulting in increased revenues of $1.1 million year over year. These increases were partially offset by decreases due to the coverage of the 2014 Winter Olympic Games, which contributed $2.9 million in revenue in 2014, as well as lower U.K. event volume in the three months ended March 31, 2015, primarily due to timing and phasing of events and lower foreign currency exchange rates for the three months ended March 31, 2015 compared to the three months ended March 31, 2014.
Cost of Services, Exclusive of Depreciation and Amortization. Cost of services, exclusive of depreciation and amortization decreased $1.3 million, or 4.0%, to $31.5 million for the three months ended March 31, 2015 from $32.8 million for the three months ended March 31, 2014. This variance was largely attributable to a decrease of $4.1 million in the U.K. related to lower event volume due to timing and phasing of events between periods as well as our coverage of the 2014 Winter Olympic Games, which contributed $1.3 million in costs for the first quarter of 2014. Also contributing was a decrease of $0.7 million of cost of services, exclusive of depreciation and amortization, for GTV year over year due primarily to the Commonwealth Games in 2014, which had a higher cost of services component, combined with lower foreign currency exchange rates for the three months ended March 31, 2015 compared to the three months ended March 31, 2014. Partially offsetting the decrease was an increase in cost of services, exclusive of depreciation and amortization of $2.4 million, $1.6 million, and $1.2 million due to the acquisitions of MIRA, Faber, and Screen Scene Group, respectively.
Engineering. Engineering expenses increased $1.7 million, or 8.7%, to $21.2 million for the three months ended March 31, 2015 from $19.5 million for the three months ended March 31, 2014. This increase was primarily attributable to the acquisitions of MIRA, Faber, and Screen Scene Group, which resulted in increases of engineering costs of $1.1 million, $0.7 million and $0.8 million, respectively, combined with a full quarter of GTV expenses, resulting in an increase of $0.4 million. These increases were partially offset by decreased U.S. engineering costs due to overhead reductions as a result of lower event volumes and lower foreign currency exchange rates for the three months ended March 31, 2015 compared to the same period of the prior year.
Selling, General and Administrative. SG&A expenses increased by $3.4 million, or 18.8%, to $21.5 million for the three months ended March 31, 2015 from $18.1 million for the three months ended March 31, 2014. This increase was primarily attributable to an increase in professional fees of $1.8 million incurred as a result of the acquisitions consummated in 2015 as well as increases from the acquisitions of MIRA, Silk Studios, Faber, and Screen Scene Group of $0.4 million, $0.1 million, $0.9 million, and $0.6 million, respectively, as well as a full quarter of GTV expenses in 2015.
Depreciation and Amortization. Depreciation and amortization increased by $6.7 million, or 22.2%, to $36.9 million for the three months ended March 31, 2015 from $30.2 million for the three months ended
54
Table of Contents
March 31, 2014. This increase was primarily attributable to the acquisitions of MIRA, Faber, Screen Scene Group, and a full quarter of GTV expenses, with the addition of Silk Studios, which resulted in an increase of $3.1 million, $1.0 million, $0.4 million, and $1.9 million of depreciation and amortization, respectively, for the three months ended March 31, 2015. The remainder of the increase was primarily due to incremental depreciation expense associated with capital expenditures incurred during the last three quarters of 2014.
Interest Expense. Interest expense increased $1.6 million, or 15.5%, to $11.9 million for the three months ended March 31, 2015 from $10.3 million for the three months ended March 31, 2014. The increase is due to increased debt levels as a result of increasing debt to fund our recent acquisitions.
Write Off of Debt Issuance Costs. During the three months ended March 31, 2014, we recognized $0.5 million of expenses related to the write-off of debt issuance costs associated with the refinancing of our debt agreements in conjunction with the acquisition of GTV in January 2014.
Other Income and Other Expense. Other income decreased $1.2 million, or 42.9%, to $1.6 million for the three months ended March 31, 2015 from $2.8 million for the three months ended March 31, 2014. Other expense increased $12.0 million to $12.7 million for the three months ended March 31, 2015 from $0.7 million for the three months ended March 31, 2014. This net increase of $13.2 million of expense was primarily the result of foreign currency translation losses on intercompany note mark-to-market adjustments as well as a $1.9 million of mark-to-market adjustment on the foreign exchange forward entered into during the three months ended March 31, 2015 for the then-pending acquisition of Mediatec, which closed subsequent to the first quarter of 2015.
Income Tax (Expense) Benefit. The expense or benefit for income taxes represents federal, state, local and foreign income taxes on income before taxes. The income tax expense was $4.9 million for the three months ended March 31, 2015 and a benefit of $3.2 million for the three months ended March 31, 2014, reflecting an effective income tax rate of (15.6)% and 23.0%, respectively. The change from an income tax benefit to income tax expense year over year is primarily due to the effect of a valuation allowance recorded within certain jurisdictions through the 2015 projected annual rate. There are certain current year losses, for which no tax benefit is expected to be realized.
Year Ended December 31, 2014 (Successor) Compared to the Year Ended December 31, 2013
(Successor)
Net loss. Net loss increased by $13.9 million to $41.2 million for the year ended December 31, 2014 from $27.3 million for the year ended December 31, 2013. The change is primarily due to increased depreciation and amortization expense due to the GTV acquisition and increased capital expenditures, increased interest expense due to incremental borrowings used to fund acquisitions, increased other expense resulting from foreign currency losses related to intercompany note payable mark-to-market adjustments, and a decrease in the recorded income tax benefit versus 2013. These increases in net losses were partially offset by the accretive results of acquired businesses and a decrease in the write-off of debt issuance costs.
Adjusted EBITDA. Adjusted EBITDA was $145.1 million for the year ended December 31, 2014 and $122.5 million for the year ended December 31, 2013.
The difference between net loss and Adjusted EBITDA of $186.3 million for the year ended December 31, 2014 is attributable to the add-back of interest expense of $43.4 million, depreciation and amortization of $133.6 million, stock-based compensation of $2.1 million, acquisition activity expenses of $4.2 million, write off of unamortized debt-issuance costs of $0.5 million, write off of deferred offering costs of $2.2 million, other expenses of $18.1 million, and miscellaneous expenses of $2.1 million. These add-backs were offset by decreases for income tax benefit of $12.8 million and other income of $7.1 million.
55
Table of Contents
The difference between net loss and Adjusted EBITDA of $149.8 million for the year ended December 31, 2013 is attributable to the add-back of interest expense of $38.3 million, depreciation and amortization of $101.1 million, stock-based compensation of $1.9 million, acquisition activity expenses of $2.5 million, Corporate Reorganization expenses of $0.8 million, write off of unamortized debt-issuance costs of $21.2 million, other expenses of $3.3 million, and miscellaneous expenses of $1.0 million. These add-backs were offset by a decrease for income tax benefit of $16.5 million and other income of $3.6 million.
Revenue. Total revenue increased by $86.3 million, or 24.2%, to $442.8 million for the year ended December 31, 2014 from $356.5 million for the year ended December 31, 2013. This increase was primarily attributable to the acquisition of GTV in January 2014 which resulted in an increase of $84.4 million of revenues for the year ended December 31, 2014. Also contributing to the increase was an increase in U.K. revenues of $17.2 million due to the addition of several new events in 2014, including the Commonwealth Games and the Sochi Winter Olympics. These increases were partially offset by the loss of several production services contracts in 2014 as a result of competitive bidding processes in addition to the cancellation of the X-Factor television show in the U.S. during 2014, which was a significant source of revenue in 2013.
Cost of Services, Exclusive of Depreciation and Amortization. Cost of services, exclusive of depreciation and amortization increased $45.1 million, or 43.4%, to $148.9 million for the year ended December 31, 2014 from $103.8 million for the year ended December 31, 2013. This increase was primarily attributable to the acquisition of GTV in January 2014 which resulted in an increase of $35.6 million of costs of services, exclusive of depreciation and amortization, for the year ended December 31, 2014. Also contributing to the change was an increase in U.K. event volume, including the Commonwealth Games and the Sochi Winter Olympics, which resulted in an incremental $12.1 million in cost of services. These increases were partially offset by lower U.S. remote production services costs related to the lower production services revenues, as noted above.
Engineering. Engineering expenses increased $9.8 million, or 13.5%, to $82.5 million for the year ended December 31, 2014 from $72.7 million for the year ended December 31, 2013. This increase was primarily attributable to the acquisition of GTV in January 2014 which resulted in an increase of $10.5 million of engineering costs for the year ended December 31, 2014. This increase was partially offset by decreased U.S. engineering costs due to overhead reductions as a result of aforementioned lower event volumes.
Selling, General and Administrative. SG&A expenses increased by $13.4 million, or 21.1%, to $76.9 million for the year ended December 31, 2014 from $63.5 million for the year ended December 31, 2013. This increase was primarily attributable to the acquisition of GTV in January 2014 which resulted in an increase of $11.1 million of SG&A expenses for the year ended December 31, 2014. Also contributing to the increase was acquisition-related professional fees of $2.7 million.
Depreciation and Amortization. Depreciation and amortization increased by $32.5 million, or 32.1%, to $133.6 million for the year ended December 31, 2014 from $101.1 million for the year ended December 31, 2013. This increase was primarily attributable to the acquisition of GTV in January 2014 which resulted in an increase of $18.6 million of depreciation and amortization for the year ended December 31, 2014. The remainder of the increase was primarily due to incremental depreciation expense associated with capital expenditures incurred during the second half of 2013 and 2014.
Interest Expense. Interest expense increased $5.1 million, or 13.3%, to $43.4 million for the year ended December 31, 2014 from $38.3 million for the year ended December 31, 2013. The acquisition of GTV in January 2014 resulted in an increase of $7.1 million of interest expense for the year ended December 31, 2014 due to increasing the amount of debt to finance the acquisition; this increase was partially offset by the effect of a reduction in our borrowing costs resulting from the refinancing of our debt agreements.
Write Off of Debt Issuance Costs. During the year ended December 31, 2014, we recognized $0.5 million of debt issuance cost write-off expense related to the refinancing of our debt agreements in conjunction with the
56
Table of Contents
acquisition of GTV in January 2014. During the year ended December 31, 2013, we recognized $21.2 million of debt issuance cost write-off expense related to our debt refinancing in 2013.
Other Income and Other Expense. Other income increased $3.5 million, or 97.2%, to $7.1 million for the year ended December 31, 2014 from $3.6 million for the year ended December 31, 2013. Other expense increased $14.8 million, or 448.5%, to $18.1 million for the year ended December 31, 2014 from $3.3 million for the year ended December 31, 2013. This net increase of $11.3 million of expense was primarily the result of foreign currency translation losses on intercompany note payable mark-to-market adjustments.
Income Tax (Expense) Benefit. The expense or benefit for income taxes represents federal, state, local and foreign income taxes on income before taxes. The income tax benefit was $12.8 million for the year ended December 31, 2014 and $16.5 million for the year ended December 31, 2013, reflecting an effective income tax rate of 23.7% and 37.7%, respectively.
Year Ended December 31, 2013 (Successor) Compared to the 358-Day Period Ended December 23, 2012
(Predecessor)
The following discussion includes a comparison of the year ended December 31, 2013 (Successor) to the 358-day period ended December 23, 2012 (Predecessor), which is the most comparable accounting year end period. The 2012 financial statements also include an accounting period from December 24, 2012 (Successor inception date) to December 31, 2012 for the Successor, and these amounts appear in the table above. We have not included a discussion of this accounting period because it is only for eight days, is not an accounting period we will use going forward and would not be otherwise meaningful for investors.
Net loss. Net loss increased by $14.9 million to $27.3 million for the year ended December 31, 2013 from $12.4 million for the 358-day period ended December 23, 2012. The change is due primarily to an increase of $27.5 million in depreciation and amortization as a result of the increase in the basis of our assets to reflect their fair market value at the time of the Corporate Reorganization, an increase in interest expense of $22.3 million due to increased debt as a result of the Corporate Reorganization and an increase in write off of debt issuance costs of $21.2 million due to debt refinancing. These increases were partially offset by an increase in operating results due primarily to an increase in volume for our international segment due to the addition of a new contract in the International X-Games, the acquisitions of Bow Tie Video and Corplex and commencement of our Brazilian operations, an increase of $2.2 million in other income due to foreign currency translation gains and a $19.5 million change from an income tax expense to an income tax benefit.
Adjusted EBITDA. Adjusted EBITDA was $122.5 million for year ended December 31, 2013 and $112.5 million for the 358-day period ended December 23, 2012.
The difference between net loss and Adjusted EBITDA of $149.8 million for the year ended December 31, 2013 is attributable to the add-back of interest expense of $38.3 million, depreciation and amortization of $101.1 million, stock-based compensation of $1.9 million, acquisition activity expenses of $2.5 million, Corporate Reorganization expenses of $0.8 million, write off of unamortized debt-issuance costs of $21.2 million, other expenses of $3.3 million and miscellaneous expenses of $1.0 million. These add-backs were offset by decreases for income tax benefit of $16.5 million and other income of $3.6 million.
The difference between net loss and Adjusted EBITDA of $124.9 million for 358-day period ended December 23, 2012 is attributable to the add-back of interest expense of $16.0 million, depreciation and amortization of $73.6 million, income tax expense of $3.0 million, stock-based compensation of $3.0 million, acquisition activity expenses of $1.2 million, debt recapitalization professional fees of $1.1 million, Corporate Reorganization expenses of $19.7 million, Corporate Reorganization bonuses of $4.5 million, other expenses of $3.3 million and miscellaneous expenses of $1.0 million. These add-backs were offset by a decrease for other income of $1.4 million.
57
Table of Contents
Revenue. Total revenue decreased by $15.6 million, or 4.2%, to $356.5 million for the year ended December 31, 2013 from $372.1 million for the 358-day period ended December 23, 2012. The majority of this decrease resulted from a change in the billing of certain costs of services for a significant client. For the year ended December 23, 2012, we incurred approximately $31.8 million of event-related costs of services that were passed through to this client with no mark-up or margin earned by us. Beginning in 2013, this client internalized these services and related costs, resulting in a decline in revenues for the year ended December 31, 2013 as compared to the year ended December 31, 2012. Since these revenues related to pass-through costs, the period-to-period decline in revenues had no impact on our income (loss) from operations or Adjusted EBITDA. Partially offsetting this decrease was an increase in revenue for our international segment for the year ended December 31, 2013 of $11.1 million, comprised of $3.8 million resulting from a new contract entered into with a significant customer, $2.6 million from the International X-Games, $2.2 million from our Brazil operations and $1.6 million resulting from the acquisition of Bow Tie Video. In the year ended December 31, 2013, our United States segment experienced an increase in certain revenue streams which also partially offset the overall revenue decrease, including $12.0 million of incremental revenues related to the acquisition of Corplex and $8.0 million in increased revenues related to our studio services.
Cost of Services, Exclusive of Depreciation and Amortization. Cost of services, exclusive of depreciation and amortization decreased by $35.4 million, or 25.4%, to $103.8 million for the year ended December 31, 2013 from $139.2 million for the 358-day period ended December 23, 2012. This decrease was primarily attributable to the change in billing of event-related direct costs of $31.8 million for a significant client, as described above in addition to lower third-party equipment rentals related to our display services of $2.6 million as a result of an increase in our portfolio of LED displays.
Engineering. Engineering expenses increased by $5.1 million, or 7.5%, to $72.7 million for the year ended December 31, 2013 from $67.6 million for the 358-day period ended December 23, 2012. This increase was attributable to growth in our United States operating segment which required an increase to our engineering infrastructure primarily in personnel and related costs, specifically increased engineering expenses of $2.5 million related to the acquisition of Corplex and $0.3 million in incremental engineering expenses from increased business in our studio services. The remainder of this increase was largely attributable to cost of living compensation increases for our engineering and operations personnel.
Selling, General and Administrative. SG&A expenses decreased by $19.9 million, or 23.9%, to $63.5 million for the year ended December 31, 2013 from $83.4 million for the 358-day period ended December 23, 2012. This decrease was attributable to transaction costs of $19.7 million and $4.5 million of bonus payments incurred in connection with the Corporate Reorganization, a decrease in stock-based compensation expense of $1.0 million and a decrease of $1.1 million in debt refinancing-related professional fees. These decreases were partially offset by increases of SG&A expenses of $0.1 million related to the acquisition of Corplex and $1.7 million in incremental SG&A expenses from increased business in our studio services.
Depreciation and Amortization. Depreciation and amortization expense increased by $27.5 million, or 37.4%, to $101.1 million for the year ended December 31, 2013 from $73.6 million for the 358-day period ended December 23, 2012. This increase generally resulted from an increase in the basis of our assets to reflect their fair market value at the time of the Corporate Reorganization.
Interest Expense. Interest expense increased by $22.3 million to $38.3 million for the year ended December 31, 2013 from $16.0 million for the 358-day period ended December 23, 2012. This increase generally was a result of the increase in our outstanding debt as a result of the Corporate Reorganization.
Write Off of Debt Issuance Costs. During the year ended December 31, 2013, we recognized $21.2 million of debt issuance cost write-off expense related to the refinancing of our debt agreements.
58
Table of Contents
Other Income and Other Expense. Other income increased $2.2 million to $3.6 million for the year ended December 31, 2013 from $1.4 million for the 358-day period ended December 23, 2012. This increase was attributable to a gain on the sale of fixed assets of $1.0 million in addition to the impact from gains resulting from foreign currency conversion. Other expense was $3.3 million for the year ended December 31, 2013 and for the 358-day period ended December 23, 2012. Other expense in the year ended December 31, 2013 and the 358-day period ended December 23, 2012 consisted primarily of management fees of $2.0 million and $2.3 million, respectively.
Income Tax (Expense) Benefit. There was an income tax benefit of $16.5 million for the year ended December 31, 2013 and a $3.0 million income tax expense for the 358-day period ended December 23, 2012, reflecting an effective income tax rate of 37.7% and (35.0%), respectively.
Adjusted EBITDA
Adjusted EBITDA is defined as EBITDA before stock-based compensation expense, acquisition activity expenses, professional fees associated with debt recapitalization, expenses associated with our Corporate Reorganization, one-time bonuses paid pursuant to the Corporate Reorganization, net loss from discontinued operations, write-off of deferred offering costs, write-off of unamortized debt issuance costs, other income, other expenses, and miscellaneous expenses as described in the footnotes to the table below. EBITDA is defined as earnings before interest expense, income tax expense, depreciation and amortization.
Our management uses Adjusted EBITDA as a means to measure our operating performance and to assist in comparing performance from period to period on a consistent basis. It is also used to readily view operating trends, as a measure for planning and forecasting overall expectations and for evaluating actual results against such expectations, as well as in communications with our board of directors, creditors, analysts and investors concerning our financial performance. We also believe Adjusted EBITDA may be used by some investors to assess our underlying financial performance.
Adjusted EBITDA is not a presentation made in accordance with GAAP and our computation of Adjusted EBITDA may vary from others in our industry. In addition, Adjusted EBITDA contains adjustments that are taken into account in the calculation of the components of various covenants in our credit agreement. Adjusted EBITDA should not be considered as an alternative to operating earnings or net (loss) earnings as measures of operating performance. Other companies, including companies in our industry, may calculate Adjusted EBITDA differently than we do, limiting its usefulness as a comparative measure. Adjusted EBITDA also has limitations as an analytical tool and should not be considered in isolation, or as a substitute for analysis of our results as reported under GAAP. For instance, Adjusted EBITDA:
| • | does not reflect our cash expenditures, or future requirements, for capital expenditures or contractual commitments; |
| • | does not reflect changes in, or cash requirements for, our working capital needs; |
| • | does not reflect our interest expense, or the cash requirements necessary to service interest or principal payments, on our debt; and |
| • | does not reflect certain other non-cash income and expenses. |
59
Table of Contents
The following tables reconcile net loss as reflected in the results of operations tables and segment footnote disclosures to Adjusted EBITDA for the periods presented:
| Predecessor | Successor | |||||||||||||||||||||||||
| 358-Day Period Ended December 23, 2012 |
December 24, 2012 (date of inception) through December 31, 2012 |
Year Ended December 31, |
Three Months Ended March 31, |
|||||||||||||||||||||||
| 2013 | 2014 | 2014 (as restated)(5) |
2015 | |||||||||||||||||||||||
| (in millions) | ||||||||||||||||||||||||||
| Net loss |
$ | (12.4 | ) | $ | (1.5 | ) | $ | (27.3 | ) | $ | (41.2 | ) | $ | (10.7 | ) | (35.9 | ) | |||||||||
| Adjustments: |
||||||||||||||||||||||||||
| Interest expense |
16.0 | 1.1 | 38.3 | 43.4 | 10.3 | 11.9 | ||||||||||||||||||||
| Depreciation and amortization |
73.6 | 2.2 | 101.1 | 133.6 | 30.2 | 36.9 | ||||||||||||||||||||
| Income tax expense (benefit) |
3.0 | (0.9 | ) | (16.5 | ) | (12.8 | ) | (3.2 | ) | 4.9 | ||||||||||||||||
| Stock-based compensation expense |
3.0 | — | 1.9 | 2.1 | 0.5 | 0.5 | ||||||||||||||||||||
| Acquisition activity expenses |
1.2 | — | 2.5 | 4.2 | 1.0 | 2.8 | ||||||||||||||||||||
| Debt recapitalization professional fees |
1.1 | — | — | — | — | — | ||||||||||||||||||||
| Corporate Reorganization expenses (1) |
19.7 | — | 0.8 | — | — | — | ||||||||||||||||||||
| Corporate Reorganization bonuses |
4.5 | — | — | — | — | — | ||||||||||||||||||||
| Write-off of deferred offering costs (2) |
— | — | — | 2.2 | — | — | ||||||||||||||||||||
| Write-off of unamortized debt-issuance costs (3) |
— | — | 21.2 | 0.5 | 0.5 | — | ||||||||||||||||||||
| Other income |
(1.4 | ) | — | (3.6 | ) | (7.1 | ) | (2.8 | ) | (1.6 | ) | |||||||||||||||
| Other expenses |
3.3 | — | 3.3 | 18.1 | 0.7 | 12.7 | ||||||||||||||||||||
| Miscellaneous expenses (income) (4) |
1.0 | — | 1.0 | 2.1 | 0.5 | (0.1 | ) | |||||||||||||||||||
|
|
|
|
|
|
|
|
|
|
|
|
|
|||||||||||||||
| Adjusted EBITDA |
$ | 112.5 | $ | 0.9 | $ | 122.5 | $ | 145.1 | $ | 27.0 | $ | 32.1 | ||||||||||||||
|
|
|
|
|
|
|
|
|
|
|
|
|
|||||||||||||||
| (1) | For each period, reflects transaction fees associated with the Corporate Reorganization and is recorded in selling, general and administrative expense. |
| (2) | During the year ended December 31, 2014, we delayed the timing of this public offering and, as a result, deferred offering costs of $2.2 million were charged against earnings. These amounts are included in our selling, general and administrative expenses. |
| (3) | For each period, reflects debt issuance cost write-off expense related to the refinancing of our Credit Agreements. |
| (4) | For the 358-day period ended December 23, 2012, includes $0.8 million of restructuring charges, including severance payments. For the year ended December 31, 2013, includes $0.7 million of consulting and evaluation fees for enterprise resource planning software. For the year ended December 31, 2014, includes $2.1 million of restructuring charges. For the three months ended March 31, 2014, includes $0.5 million of restructuring charges. |
| (5) | Subsequent to the date of the original issuance, we concluded that we were required to restate our unaudited interim condensed consolidated financial statements as of and for the quarter ended March 31, 2014. These amounts have been noted herein as restated. See Note 15 within the Condensed Consolidated Financial Statements for further discussion and detail of the restatement. |
60
Table of Contents
Segment Financial Data
United States Segment
The following tables present the results of operations of our United States segment for the periods presented:
| Predecessor | Successor | |||||||||||||||||||||||||
| 358-Day Period Ended December 23, 2012 |
December 24, 2012 (inception date) to December 31, 2012 |
Year Ended December 31, |
Three Months Ended March 31, |
|||||||||||||||||||||||
| 2013 | 2014 | 2014 | 2015 | |||||||||||||||||||||||
| (in millions) | ||||||||||||||||||||||||||
| Revenue |
$ | 310.5 | $ | 3.3 | $ | 283.9 | $ | 269.3 | $ | 59.0 | $ | 65.4 | ||||||||||||||
| Cost of services, exclusive of depreciation and amortization |
104.9 | 0.5 | 63.3 | 62.3 | 14.5 | 16.0 | ||||||||||||||||||||
| Engineering |
58.6 | 1.3 | 62.4 | 60.0 | 14.5 | 14.9 | ||||||||||||||||||||
| Selling, general, and administrative |
76.3 | 0.8 | 54.5 | 57.6 | 14.1 | 15.7 | ||||||||||||||||||||
| Depreciation and amortization |
64.2 | 2.0 | 92.5 | 106.3 | 24.4 | 29.2 | ||||||||||||||||||||
|
|
|
|
|
|
|
|
|
|
|
|
|
|||||||||||||||
| Income (loss) from operations |
$ | 6.4 | $ | (1.3 | ) | $ | 11.2 | $ | (16.9 | ) | $ | (8.5 | ) | $ | (10.5 | ) | ||||||||||
|
|
|
|
|
|
|
|
|
|
|
|
|
|||||||||||||||
| Adjusted EBITDA |
$ | 100.2 | $ | 0.7 | $ | 109.3 | $ | 99.3 | $ | 17.8 | $ | 22.1 | ||||||||||||||
|
|
|
|
|
|
|
|
|
|
|
|
|
|||||||||||||||
Three Months Ended March 31, 2015 (Successor) Compared to the Three Months Ended March 31, 2014
(Successor)
Income (loss) from Operations. Loss from operations increased $2.0 million to a loss from operations of $10.5 million for the three months ended March 31, 2015 from a loss from operations of $8.5 million for the three months ended March 31, 2014. The change was primarily the result of higher professional fees related to acquisition activities as well as increased depreciation and amortization due to acquisitions and increased capital expenditures, partially offset by higher operating results due to accretive acquisitions.
Adjusted EBITDA. Adjusted EBITDA was $22.1 million for the three months ended March 31, 2015 and $17.8 million for the three months ended March 31, 2014.
Revenue. Total revenue increased by $6.4 million, or 10.8%, to $65.4 million for the three months ended March 31, 2015 from $59.0 million for the three months ended March 31, 2014. This increase was primarily due to $6.3 million and $1.1 million in revenues from the acquisitions of MIRA and Faber, respectively. These increases were partially offset by lower revenues in our U.S. business primarily due to the loss of several mobile production services contracts as a result of competitive bidding processes.
Cost of Services, Exclusive of Depreciation and Amortization. Cost of services, exclusive of depreciation and amortization increased $1.5 million, or 10.3%, to $16.0 million for the three months ended March 31, 2015 from $14.5 million for the three months ended March 31, 2014. This increase was due to $2.4 million from the acquisition of MIRA, partially offset by a decrease in our legacy U.S. business due primarily to lower remote production services revenues for the three months ended March 31, 2015.
Engineering. Engineering expenses increased $0.4 million, or 2.8%, to $14.9 million for the three months ended March 31, 2015 from $14.5 million for the three months ended March 31, 2014. The increase included $1.1 million from the acquisition of MIRA, offset by overhead reductions taken as a result of the event volume decrease cited above.
Selling, General and Administrative. SG&A expenses increased by $1.6 million, or 11.3%, to $15.7 million for the three months ended March 31, 2015 from $14.1 million for the three months ended March 31, 2014. This
61
Table of Contents
increase was primarily attributable to $0.4 million from the acquisition of MIRA as well as additional professional fees incurred as a result of the acquisitions consummated in 2015 as well as other ongoing merger and acquisition activities.
Depreciation and Amortization. Depreciation and amortization increased by $4.8 million, or 19.7%, to $29.2 million for the three months ended March 31, 2015 from $24.4 million for the three months ended March 31, 2014. This increase was primarily attributable to the acquisition of MIRA, which contributed an additional $3.1 million of expense as well as incremental depreciation expense associated with capital expenditures incurred during the last three quarters of 2014 and the first quarter of 2015.
Year Ended December 31, 2014 (Successor) Compared to the Year Ended December 31, 2013
(Successor)
Income (loss) from Operations. Income (loss) from operations decreased $28.1 million to a loss from operations of $16.9 million for the year ended December 31, 2014 from income from operations of $11.2 million for the year ended December 31, 2013. The change was primarily the result of lower revenues due to the loss of several mobile production services contracts as well as the cancellation of a show with significant services; also contributing to the change was increased depreciation and amortization due to increased capital expenditures.
Adjusted EBITDA. Adjusted EBITDA was $99.3 million for the year ended December 31, 2014 and $109.3 million for the year ended December 31, 2013.
Revenue. Total revenue decreased by $14.6 million, or 5.1%, to $269.3 million for the year ended December 31, 2014 from $283.9 million for the year ended December 31, 2013. This decrease was primarily attributable to the loss of several mobile production services contracts in 2014 as a result of competitive bidding processes in addition to the cancellation of the X-Factor television series which was a significant source of revenue in 2013.
Cost of Services, Exclusive of Depreciation and Amortization. Cost of services, exclusive of depreciation and amortization decreased $1.0 million, or 1.6%, to $62.3 million for the year ended December 31, 2014 from $63.3 million for the year ended December 31, 2013. This decrease was primarily attributable to lower remote production services revenues for the year ended December 31, 2014 due to the reasons cited above.
Engineering. Engineering expenses decreased $2.4 million, or 3.8%, to $60.0 million for the year ended December 31, 2014 from $62.4 million for the year ended December 31, 2013 due to overhead reduction taken as a result of the event volume decrease cited above.
Selling, General and Administrative. SG&A expenses increased by $3.1 million, or 5.7%, to $57.6 million for the year ended December 31, 2014 from $54.5 million for the year ended December 31, 2013. This increase was primarily attributable professional fees incurred as a result of the acquisitions consummated in 2014 in addition to expenses incurred in relation to this offering in the year ended December 31, 2014.
Depreciation and Amortization. Depreciation and amortization increased by $13.8 million, or 14.9%, to $106.3 million for the year ended December 31, 2014 from $92.5 million for the year ended December 31, 2013. This increase was primarily attributable to incremental depreciation expense associated with capital expenditures incurred during the second half of 2013 and the first half of 2014.
Year Ended December 31, 2013 (Successor) Compared to the 358-Day Period Ended December 23, 2012
(Predecessor)
The following discussion includes a comparison of the year ended December 31, 2013 (Successor) to the 358-day period ended December 23, 2012 (Predecessor), which is the most comparable accounting period to the
62
Table of Contents
2013 year end period. The 2012 financial statements also include an accounting period from December 24, 2012 (Successor inception date) to December 31, 2012 for the Successor, and these amounts appear in the table above. We have not included a discussion of this accounting period because it is only for eight days, is not an accounting period we will use going forward and would not otherwise be meaningful to investors.
Income from Operations. Income from operations increased $4.8 million to $11.2 million for the year ended December 31, 2013 from $6.4 million for the 358-day period ended December 23, 2012. The change was the result of incremental revenues related to the acquisition of Corplex, increased revenues related to our studio services, decreased cost of services due to primarily to lower third-party equipment rentals, decreased SG&A expenses due to the Corporate Reorganization, which occurred in 2012. These increases were partially offset by increased engineering expenses due to the acquisition of Corplex and increased studio business as well as increased depreciation and amortization expense due to the increase in book basis of assets to the fair market value adjustments made in conjunction with the Corporate Reorganization.
Adjusted EBITDA. Adjusted EBITDA was $109.3 million for the year ended December 31, 2013 and $100.2 million for the 358-day period ended December 23, 2012.
Revenue. Total revenue decreased by $26.6 million, or 8.6%, to $283.9 million for the year ended December 31, 2013 from $310.5 million for the 358-day period ended December 23, 2012. This decrease resulted from a change in the billing of certain costs of services for a significant client. For the 358-day period ended December 23, 2012, we incurred approximately $31.8 million of event-related costs of services that were passed through to this client with no mark-up or margin earned by us. Beginning in 2013, this client internalized these services and related costs, resulting in a decline in revenues for the year ended December 31, 2013 as compared to the year ended December 31, 2012. Since these revenues related to pass-through costs, the period-to-period decline in revenues had no impact on our income (loss) from operations or Adjusted EBITDA. Partially offsetting this decrease was $12.0 million of incremental revenues related to the acquisition of Corplex, which was acquired in December 2012, and $8.0 million in increased revenue related to our studio services.
Cost of Services, Exclusive of Depreciation and Amortization. Cost of services, exclusive of depreciation and amortization decreased by $41.6 million, or 39.6%, to $63.3 million for the year ended December 31, 2013 from $104.9 million for the 358-day period ended December 23, 2012. This decrease was primarily attributable to the change in billing of event-related direct costs for a significant client, as described above in addition to lower third-party equipment rental related to our display services of $2.6 million as a result of an increase in our portfolio of LED displays.
Engineering. Engineering expenses increased by $3.8 million, or 6.5%, to $62.4 million for the year ended December 31, 2013 from $58.6 million for the 358-day period ended December 23, 2012. This increase was attributable to expenses of $2.5 million related to the acquisition of Corplex and $0.3 million in incremental engineering expenses from increased business in our studio services. The remainder of this increase was attributable to cost of living compensation increases for our engineering and operations personnel.
Selling, General and Administrative. SG&A expenses decreased by $21.8 million, or 28.6%, to $54.5 million for the year ended December 31, 2013 from $76.3 million for the 358-day period ended December 23, 2012. This decrease was attributable to transaction costs of $19.7 million and $4.5 million of bonus payments incurred in connection with the Corporate Reorganization, partially offset by increases of SG&A expenses of $1.4 million related to the acquisition of Corplex and $1.7 million in incremental SG&A expenses from increased business related to studio services.
Depreciation and Amortization. Depreciation and amortization expense increased by $28.3 million, or 44.1%, to $92.5 million for the year ended December 31, 2013 from $64.2 million for the 358-day period ended December 23, 2012. This increase generally resulted from an increase in the book basis of our assets to reflect their fair market value at the time of the Corporate Reorganization.
63
Table of Contents
International Segment
The following tables present the results of operations of our International segment for the periods presented:
| Predecessor | Successor | |||||||||||||||||||||||||
| 358-Day Period Ended December 23, 2012 |
December 24, 2012 (inception date) to December 31, 2012 |
Year Ended December 31, |
Three Months Ended March 31, |
|||||||||||||||||||||||
| 2013 | 2014 | 2014 | 2015 | |||||||||||||||||||||||
| (in millions) | ||||||||||||||||||||||||||
| Revenue |
$ | 61.6 | $ | 1.0 | $ | 72.7 | $ | 173.4 | $ | 36.2 | $ | 37.8 | ||||||||||||||
| Cost of services, exclusive of depreciation and amortization |
34.3 | 0.5 | 40.5 | 86.6 | 18.3 | 15.6 | ||||||||||||||||||||
| Engineering |
8.9 | 0.2 | 10.3 | 22.5 | 5.0 | 6.3 | ||||||||||||||||||||
| Selling, general, and administrative |
7.1 | 0.1 | 9.0 | 19.3 | 4.0 | 5.8 | ||||||||||||||||||||
| Depreciation and amortization |
9.4 | 0.2 | 8.6 | 27.3 | 5.8 | 7.7 | ||||||||||||||||||||
|
|
|
|
|
|
|
|
|
|
|
|
|
|||||||||||||||
| Income from operations |
$ | 1.9 | $ | — | $ | 4.2 | $ | 17.8 | $ | 3.2 | $ | 2.4 | ||||||||||||||
|
|
|
|
|
|
|
|
|
|
|
|
|
|||||||||||||||
| Adjusted EBITDA |
$ | 12.4 | $ | 0.2 | $ | 13.3 | $ | 45.8 | $ | 9.0 | $ | 10.0 | ||||||||||||||
|
|
|
|
|
|
|
|
|
|
|
|
|
|||||||||||||||
Three Months Ended March 31, 2015 (Successor) Compared to the Three Months Ended March 31, 2014
(Successor)
Income from Operations. Income from operations decreased $0.8 million to $2.4 million for the three months ended March 31, 2015 from $3.2 million for the three months ended March 31, 2014. The decrease is primarily related to lower event volumes in the U.K., largely due to timing and phasing of events between years as well as our coverage of the Winter Olympics in 2014, and lower foreign currency rates for the three months ended March 31, 2015 compared to the three months ended March 31, 2014. These decreases were partially offset by increases in income from operations due to the acquisitions of Screen Scene Group of $0.2 million as well as a full quarter of GTV operations in 2015.
Adjusted EBITDA. Adjusted EBITDA was $10.0 million for the three months ended March 31, 2015 and $9.0 million for the three months ended March 31, 2014.
Revenue. Total revenue increased by $1.6 million, or 4.4%, to $37.8 million for the three months ended March 31, 2015 from $36.2 million for the three months ended March 31, 2014. This increase was primarily attributable to the acquisitions of Silk Studios, Faber, and Screen Scene Group which contributed revenues of $0.4 million, $3.2 million, and $3.2 million, respectively, as well as a full quarter of GTV revenues in 2015, resulting in an increase of $1.1 million, year over year. These increases were partially offset by decreases due to the coverage of the 2014 Winter Olympic Games, which contributed $2.9 million in revenue, lower overall U.K. event volume, primarily due to timing and phasing of events, and lower foreign currency exchange rates for the three months ended March 31, 2015 compared to the three months ended March 31, 2014.
Cost of Services, Exclusive of Depreciation and Amortization. Cost of services, exclusive of depreciation and amortization decreased $2.7 million, or 14.8%, to $15.6 million for three months ended March 31, 2015 from $18.3 million for the three months ended March 31, 2014. This variance was largely attributable to a decrease of $4.1 million in the U.K. related to lower event volume due to timing and phasing of events between periods as well as our coverage of the 2014 Winter Olympic Games, which contributed $1.3 million in costs for the first quarter of 2014. Also contributing was a decrease of $0.7 million of cost of services, exclusive of depreciation and amortization, for GTV year over year due primarily to the Commonwealth Games in 2014, which had a higher cost of services component, combined with lower foreign currency exchange rates for the three months ended March 31, 2015 compared to the three months ended March 31, 2014. Partially offsetting the decrease was
64
Table of Contents
an increase in cost of services, exclusive of depreciation and amortization of $1.0 million and $1.2 million due to the acquisitions of Faber and Screen Scene Group, respectively.
Engineering. Engineering expenses increased $1.3 million, or 26.0%, to $6.3 million for the three months ended March 31, 2015 from $5.0 million for the three months ended March 31, 2014. This increase was primarily attributable to the acquisitions of Faber and Screen Scene Group, which resulted in increases in engineering costs of $0.7 million and $0.8 million, respectively, and an additional $0.4 million from a full quarter of GTV results in 2015. These increases were partially offset by lower foreign currency exchange rates for the three months ended March 31, 2015 compared to the three months ended March 31, 2014.
Selling, General and Administrative. SG&A expenses increased by $1.8 million, or 45.0%, to $5.8 million for the three months ended March 31, 2015 from $4.0 million for the three months ended March 31, 2014. This increase was primarily attributable to the acquisitions of Silk Studios, Faber, and Screen Scene Group of $0.1 million, $0.7 million, and $0.6 million, respectively, as well as a full quarter of GTV expenses in 2015.
Depreciation and Amortization. Depreciation and amortization increased by $1.9 million, or 32.8%, to $7.7 million for the year three months ended March 31, 2015 from $5.8 million for the three months ended March 31, 2014. This increase was primarily attributable to the acquisitions of Silk Studios, Faber, and Screen Scene Group, which resulted in an increase of depreciation and amortization of $0.2 million, $0.9 million and $0.4 million, respectively, as well as a full quarter of GTV depreciation and amortization in 2015.
Year Ended December 31, 2014 (Successor) Compared to the Year Ended December 31, 2013
(Successor)
Income from Operations. Income from operations increased $13.6 million to $17.8 million for the year ended December 31, 2014 from $4.2 million for the year ended December 31, 2013. The change was primarily the result of increased income from operations of $8.1 million due to the acquisition of GTV in January 2014 as well as increased income from operations of $4.2 million for the U.K. as a result of several new events, including the Commonwealth Games and the Sochi Winter Olympics.
Adjusted EBITDA. Adjusted EBITDA was $45.8 million for the year ended December 31, 2014 and $13.3 million for the year ended December 31, 2013.
Revenue. Total revenue increased by $100.7 million, or 138.5%, to $173.4 million for the year ended December 31, 2014 from $72.7 million for the year ended December 31, 2013. This increase was primarily attributable to the acquisition of GTV in January 2014, which contributed $84.4 million in revenues in the year ended December 31, 2014. Also contributing to this increase was an increase in U.K. revenues of $17.2 million due to the addition of several new events in 2014, including the Commonwealth Games and the Sochi Winter Olympics.
Cost of Services, Exclusive of Depreciation and Amortization. Cost of services, exclusive of depreciation and amortization increased $46.1 million, or 113.8%, to $86.6 million for the year ended December 31, 2014 from $40.5 million for the year ended December 31, 2013. This increase was primarily attributable to the acquisition of GTV in January 2014, which resulted in an increase of $35.6 million of cost of services, exclusive of depreciation and amortization. Also contributing to this increase was an increase in U.K. event volume, which resulted in an incremental $12.1 million in cost of services.
Engineering. Engineering expenses increased $12.2 million, or 118.4%, to $22.5 million for the year ended December 31, 2014 from $10.3 million for the year ended December 31, 2013. This increase was primarily attributable to the acquisition of GTV in January 2014, which resulted in an increase of engineering costs of $10.5 million.
65
Table of Contents
Selling, General and Administrative. SG&A expenses increased by $10.3 million, or 114.4%, to $19.3 million for the year ended December 31, 2014 from $9.0 million for the year ended December 31, 2013. This increase was primarily attributable to the acquisition of GTV in January 2014, which resulted in an increase of SG&A costs of $11.1 million.
Depreciation and Amortization. Depreciation and amortization increased by $18.7 million, or 217.4%, to $27.3 million for the year ended December 31, 2014 from $8.6 million for the year ended December 31, 2013. This increase was primarily attributable to the acquisition of GTV in January 2014, which resulted in an increase of depreciation and amortization of $18.6 million.
Year Ended December 31, 2013 (Successor) Compared to the 358-Day Period Ended December 23, 2012
(Predecessor)
The following discussion includes a comparison of year ended December 31, 2012 (Successor) to the 358-day period ended December 23, 2012 (Predecessor), which is the most comparable accounting period to the 2013 year end period. The 2012 financial statements also include an accounting period from December 24, 2012 (Successor inception date) to December 31, 2012 for the Successor, and these amounts appear in the table above. We have not included a discussion of this accounting period because it is only for eight days, is not an accounting period we will use going forward and would not otherwise be meaningful for investors.
Income from Operations. Income from operations increased $2.3 million to $4.2 million for the year ended December 31, 2013 from $1.9 million for the 358-day period ended December 23, 2012. The change was the result of higher income from operations for the U.K. due to the addition of several one-off, large sporting events, including the International X-Games. These increases in income from operations were partially offset by increased cost of services related to Bow Tie Video, Brazil, and the International X-Games, increased engineering due to Bow Tie Video and general business growth, and increased SG&A due to Bow Tie Video.
Adjusted EBITDA. Adjusted EBITDA was $13.3 million for the year ended December 31, 2013 and $12.4 million for the 358-day period ended December 23, 2012.
Revenue. Total revenue increased by $11.1 million, or 18.0%, to $72.7 million for the year ended December 31, 2013 from $61.6 million for the 358-day period ended December 23, 2012. This increase was primarily attributable to having a full year of revenues from the April 2012 acquisition of Bow Tie Video in 2013, which contributed $1.6 million in revenue, and the addition of several one-off large sporting events in 2013 including the International X-Games which did not occur in the previous year and contributed $2.6 million in incremental revenue in 2013. Also contributing to the increase was the commencement of our Brazil operations in 2013, which had $2.2 million in revenue.
Cost of Services, Exclusive of Depreciation and Amortization. Cost of services, exclusive of depreciation and amortization increased by $6.2 million, or 18.1%, to $40.5 million for the year ended December 31, 2013 from $34.3 million for the 358-day period ended December 23, 2012. This increase was primarily attributable to $0.4 million, $2.1 million, and $2.2 million as a result of an increase in direct costs from a full year of activity from Bow Tie Video, Brazil, and the International X-Games, respectively.
Engineering. Engineering expenses increased by $1.4 million, or 15.7%, to $10.3 million for the year ended December 31, 2013 from $8.9 million for the 358-day period ended December 23, 2012. This increase was primarily attributable to having a full year of engineering expenses from Bow Tie Video, which added incremental expenses of $0.6 million; also contributing to the increase was general growth in the business which required an increased investment in our field staff comprised primarily of broadcast engineers and drivers in addition to cost of living compensation increases for staff.
66
Table of Contents
Selling, General and Administrative. SG&A expenses increased by $1.9 million, or 26.8%, to $9.0 million for the year ended December 31, 2013 from $7.1 million for the 358-day period ended December 23, 2012. This increase was primarily attributable to having a full year of expenses from the April 2012 acquisition of Bow Tie Video in 2013, which added $0.4 million in incremental SG&A expenses in addition to cost of living compensation increases for staff.
Depreciation and Amortization. Depreciation and amortization expense decreased by $0.8 million, or 8.5%, to $8.6 million for the year ended December 31, 2013 from $9.4 million for the 358-day period ended December 23, 2012.
67
Table of Contents
Quarterly Results of Operations
The following tables set forth selected unaudited quarterly condensed consolidated statements of income data for each of the quarters in the thirteen quarter period ended March 31, 2015. The information for each of these quarters has been prepared on the same basis as the audited annual consolidated financial statements included elsewhere in this prospectus and, in the opinion of management, includes all adjustments, which includes only normal recurring adjustments, necessary for the fair presentation of the results of operations for these periods in accordance with GAAP. This data should be read in conjunction with our audited consolidated financial statements and related notes included elsewhere in this prospectus. These quarterly operating results are not necessarily indicative of our operating results for a full year or any future period.
| Predecessor | Successor | |||||||||||||||||||||||||||||||||||||||||||||||||||||||||
| Three Months Ended | October 1, 2012 to December 23, 2012 |
December 24, 2012 (inception) to December 31, 2012 |
Three Months Ended | |||||||||||||||||||||||||||||||||||||||||||||||||||||||
| March 31, 2012 |
June 30, 2012 |
September 30, 2012 |
March 31, 2013 |
June 30, 2013 |
September 30, 2013 |
December 31, 2013 |
March 31, 2014 (as restated)(1) |
June 30, 2014 (as restated)(1) |
September 30, 2014 |
December 31, 2014 |
March 31, 2015 |
|||||||||||||||||||||||||||||||||||||||||||||||
| (in millions) | ||||||||||||||||||||||||||||||||||||||||||||||||||||||||||
| Revenue |
$ | 85.6 | $ | 99.5 | $ | 98.8 | $ | 88.3 | $ | 4.4 | $ | 78.0 | $ | 98.6 | $ | 91.9 | $ | 88.1 | $ | 95.2 | $ | 117.7 | $ | 126.9 | $ | 103.0 | $ | 103.1 | ||||||||||||||||||||||||||||||
| Cost of services, exclusive of depreciation and amortization |
33.8 | 37.0 | 36.5 | 31.8 | 1.0 | 23.0 | 32.0 | 26.6 | 22.2 | 32.8 | 38.7 | 46.8 | 30.6 | 31.5 | ||||||||||||||||||||||||||||||||||||||||||||
| Engineering |
15.8 | 17.1 | 17.9 | 16.8 | 1.5 | 17.4 | 18.0 | 19.0 | 18.3 | 19.5 | 20.4 | 21.1 | 21.5 | 21.2 | ||||||||||||||||||||||||||||||||||||||||||||
| Selling, general and administrative |
13.7 | 16.1 | 14.0 | 39.5 | 0.9 | 15.8 | 14.0 | 13.3 | 20.4 | 18.1 | 17.6 | 19.9 | 21.3 | 21.5 | ||||||||||||||||||||||||||||||||||||||||||||
| Depreciation and amortization |
17.8 | 18.0 | 20.1 | 17.7 | 2.2 | 23.7 | 25.5 | 25.3 | 26.7 | 30.2 | 32.5 | 33.6 | 37.4 | 36.9 | ||||||||||||||||||||||||||||||||||||||||||||
|
|
|
|
|
|
|
|
|
|
|
|
|
|
|
|
|
|
|
|
|
|
|
|
|
|
|
|
|
|||||||||||||||||||||||||||||||
| Income (loss) from operations |
4.4 | 11.3 | 10.2 | (17.5 | ) | (1.3 | ) | (1.8 | ) | 9.2 | 7.6 | 0.4 | (5.3 | ) | 8.5 | 5.5 | (7.8 | ) | (8.1 | ) | ||||||||||||||||||||||||||||||||||||||
| Interest expense |
3.9 | 4.2 | 4.0 | 3.8 | 1.1 | 10.1 | 9.2 | 9.5 | 9.6 | 10.3 | 10.6 | 10.9 | 11.6 | 11.9 | ||||||||||||||||||||||||||||||||||||||||||||
| Write off of debt issuance costs |
— | — | — | — | — | 21.2 | — | — | — | 0.5 | — | — | — | — | ||||||||||||||||||||||||||||||||||||||||||||
| Other income |
— | (1.4 | ) | — | (0.1 | ) | — | — | — | (0.7 | ) | (2.9 | ) | (2.8 | ) | (3.7 | ) | (0.1 | ) | (0.5 | ) | (1.6 | ) | |||||||||||||||||||||||||||||||||||
| Other expense |
0.6 | 0.6 | 0.6 | 1.5 | — | 1.3 | 0.6 | 0.8 | 0.6 | 0.7 | 1.7 | 8.4 | 7.3 | 12.7 | ||||||||||||||||||||||||||||||||||||||||||||
|
|
|
|
|
|
|
|
|
|
|
|
|
|
|
|
|
|
|
|
|
|
|
|
|
|
|
|
|
|||||||||||||||||||||||||||||||
| Income (loss) before income taxes |
(0.2 | ) | 7.9 | 5.6 | (22.7 | ) | (2.5 | ) | (34.4 | ) | (0.6 | ) | (2.0 | ) | (6.9 | ) | (13.9 | ) | (0.1 | ) | (13.8 | ) | (26.3 | ) | (31.1 | ) | ||||||||||||||||||||||||||||||||
| Income tax (expense) benefit |
0.1 | (4.2 | ) | (2.9 | ) | 4.0 | 0.9 | 12.9 | 0.2 | 0.8 | 2.6 | 3.2 | 0.9 | 5.3 | 3.3 | (4.9 | ) | |||||||||||||||||||||||||||||||||||||||||
|
|
|
|
|
|
|
|
|
|
|
|
|
|
|
|
|
|
|
|
|
|
|
|
|
|
|
|
|
|||||||||||||||||||||||||||||||
| Net income (loss) |
$ | (0.1 | ) | $ | 3.7 | $ | 2.7 | $ | (18.7 | ) | $ | (1.5 | ) | $ | (21.5 | ) | $ | (0.4 | ) | $ | (1.2 | ) | $ | (4.3 | ) | $ | (10.7 | ) | $ | 0.9 | $ | (8.4 | ) | $ | (23.0 | ) | (35.9 | ) | ||||||||||||||||||||
|
|
|
|
|
|
|
|
|
|
|
|
|
|
|
|
|
|
|
|
|
|
|
|
|
|
|
|
|
|||||||||||||||||||||||||||||||
| Adjusted EBITDA |
$ | 22.7 | $ | 31.9 | $ | 31.0 | $ | 26.6 | $ | 0.9 | $ | 22.7 | $ | 35.2 | $ | 33.7 | $ | 31.5 | $ | 27.0 | $ | 42.4 | $ | 41.7 | $ | 34.0 | $ | 32.1 | ||||||||||||||||||||||||||||||
|
|
|
|
|
|
|
|
|
|
|
|
|
|
|
|
|
|
|
|
|
|
|
|
|
|
|
|
|
|||||||||||||||||||||||||||||||
| (1) | Subsequent to the date of the original issuance, we concluded that we were required to restate our unaudited interim condensed consolidated financial statements as of and for the quarter ended March 31, 2014. These amounts have been noted herein as restated. These restatement adjustments were previously included in the second quarter ended June 30, 2014; with the adjustments now recorded in the appropriate quarter, they were removed from the quarter ended June 30, 2014, which is now restated above. See Note 15 within the Condensed Consolidated Financial Statements for further discussion and detail of the restatement. |
68
Table of Contents
The following tables reconcile net income (loss) as reflected in the results of operations tables and segment footnote disclosures to Adjusted EBITDA for the periods presented:
| Predecessor | Successor | |||||||||||||||||||||||||||||||||||||||||||||||||||||||||
| Three Months Ended | October 1, 2012 to December 23, 2012 |
December 24, 2012 (inception) to December 31, 2012 |
Three Months Ended | |||||||||||||||||||||||||||||||||||||||||||||||||||||||
| March 31, 2012 |
June 30, 2012 |
September 30, 2012 |
March 31, 2013 |
June 30, 2013 |
September 30, 2013 |
December 31, 2013 |
March 31, 2014 (as restated)(1) |
June 30, 2014 (as restated)(1) |
September 30, 2014 |
December 31, 2014 |
March 31, 2015 |
|||||||||||||||||||||||||||||||||||||||||||||||
| (in millions) | ||||||||||||||||||||||||||||||||||||||||||||||||||||||||||
| Net income (loss) |
$ | (0.1 | ) | $ | 3.7 | $ | 2.7 | $ | (18.7 | ) | $ | (1.5 | ) | $ | (21.5 | ) | $ | (0.4 | ) | $ | (1.2 | ) | $ | (4.3 | ) | $ | (10.7 | ) | $ | 0.9 | $ | (8.4 | ) | $ | (23.0 | ) | $ | (35.9 | ) | |||||||||||||||||||
| Adjustments: |
||||||||||||||||||||||||||||||||||||||||||||||||||||||||||
| Interest expense |
3.9 | 4.2 | 4.0 | 3.8 | 1.1 | 10.1 | 9.2 | 9.5 | 9.6 | 10.3 | 10.6 | 10.9 | 11.6 | 11.9 | ||||||||||||||||||||||||||||||||||||||||||||
| Depreciation and amortization |
17.8 | 18.0 | 20.1 | 17.7 | 2.2 | 23.7 | 25.5 | 25.3 | 26.7 | 30.2 | 32.5 | 33.6 | 37.4 | 36.9 | ||||||||||||||||||||||||||||||||||||||||||||
| Income tax expense (benefit) |
(0.1 | ) | 4.2 | 2.9 | (4.0 | ) | (0.9 | ) | (12.9 | ) | (0.2 | ) | (0.8 | ) | (2.6 | ) | (3.2 | ) | (0.9 | ) | (5.3 | ) | (3.3 | ) | 4.9 | |||||||||||||||||||||||||||||||||
| Stock-based compensation expense |
0.7 | 0.7 | 0.7 | 0.7 | — | 0.4 | 0.5 | 0.5 | 0.5 | 0.5 | 0.5 | 0.5 | 0.5 | 0.5 | ||||||||||||||||||||||||||||||||||||||||||||
| Acquisition activity expenses |
— | 0.7 | — | 0.7 | — | — | — | — | 2.5 | 1.0 | |
0.7 |
|
|
1.0 |
|
2.0 | 2.8 | ||||||||||||||||||||||||||||||||||||||||
| Debt recapitalization professional fees |
— | 1.1 | — | — | — | — | — | — | — | — |
|
— |
|
|
— |
|
|
— |
|
|
— |
| ||||||||||||||||||||||||||||||||||||
| Corporate Reorganization expenses |
— | — | — | 19.7 | — | 0.4 | — | 0.4 | — | — | — | — | — | — | ||||||||||||||||||||||||||||||||||||||||||||
| Corporate Reorganization bonuses |
— | — | — | 4.5 | — | — | — | — | — | — | — | — | — | — | ||||||||||||||||||||||||||||||||||||||||||||
| Write off of unamortized debt issuance costs |
— | — | — | — | — | 21.2 | — | — | — | 0.5 |
|
— |
|
|
— |
|
|
— |
|
— | ||||||||||||||||||||||||||||||||||||||
| Write off of deferred offering costs |
— | — | — | — | — | — | — | — | — | — | — |
|
1.4 |
|
0.9 | — | ||||||||||||||||||||||||||||||||||||||||||
| Other income |
— | (1.4 | ) | — | (0.1 | ) | — | — | — | (0.7 | ) | (2.9 | ) | (2.8 | ) | (3.7 | ) | (0.1 | ) | (0.5 | ) | (1.6 | ) | |||||||||||||||||||||||||||||||||||
| Other expense |
0.6 | 0.6 | 0.6 | 1.5 | — | 1.3 | 0.6 | 0.8 | 0.6 | 0.7 | 1.7 | 8.4 | 7.3 | 12.7 | ||||||||||||||||||||||||||||||||||||||||||||
| Miscellaneous expenses (income) |
— | — | — | 0.7 | — | — | — | — | 1.0 | 0.5 | |
0.2 |
|
0.2 | 1.1 | (0.1) | ||||||||||||||||||||||||||||||||||||||||||
|
|
|
|
|
|
|
|
|
|
|
|
|
|
|
|
|
|
|
|
|
|
|
|
|
|
|
|
|
|||||||||||||||||||||||||||||||
| Adjusted EBITDA |
$ | 22.7 | $ | 31.9 | $ | 31.0 | $ | 26.6 | $ | 0.9 | $ | 22.7 | $ | 35.2 | $ | 33.7 | $ | 31.5 | $ | 27.0 | $ | 42.4 | $ | 41.7 | $ | 34.0 | $ | 32.1 | ||||||||||||||||||||||||||||||
|
|
|
|
|
|
|
|
|
|
|
|
|
|
|
|
|
|
|
|
|
|
|
|
|
|
|
|
|
|||||||||||||||||||||||||||||||
| (1) | Subsequent to the date of the original issuance, we concluded that we were required to restate our unaudited interim condensed consolidated financial statements as of and for the quarter ended March 31, 2014. These amounts have been noted herein as restated. These restatement adjustments were previously included in the second quarter ended June 30, 2014; with the adjustments now recorded in the appropriate quarter, they were removed from the quarter ended June 30, 2014, which is now restated above. See Note 15 within the Condensed Consolidated Financial Statements for further discussion and detail of the restatement. |
Quarterly Revenues Trends
Given the year-round broadcast of live sporting and other live entertainment, as well as unscripted television programming, seasonality does not have a material effect on our business as evidenced by substantially consistent revenues quarter over quarter with the exception of the quarter ended March 31 of each year, which is traditionally our slowest due to the generally lighter schedule of
69
Table of Contents
sports broadcasts for which we have contracts in the winter months in the United States and U.K. Our results in any particular quarter will, however, vary, depending on the acquisition or loss of contracts or other potentially unforeseen events.
Quarterly Expenses Trends
Quarterly expense trends are aligned with those aforementioned quarterly revenue trends. Expenses are fairly consistent quarter over quarter due to limited seasonality. Our capital expenditures are typically skewed to the first two quarters of the year, which impacts quarterly liquidity, but also maximizes revenue generating ability through the multi-purpose use of the assets throughout the year.
Liquidity and Capital Resources
Overview
Our principal liquidity requirements have historically been to meet our working capital and capital expenditure needs, to finance acquisitions and to service our debt. We have historically met our liquidity and capital investment needs with funds generated through operations, in addition to outside sources of liquidity including our debt agreements and capital lease transactions. We have historically funded our acquisitions through borrowings under our debt agreements, cash from operations, capital leases and through additional equity investments. Our working capital is the amount by which current assets exceed current liabilities and is a measure of our ability to pay our liabilities as they become due. As of March 31, 2015, our working capital was $0.0 million and we had $27.6 million of availability under our revolving credit facility. See “—Description of Our Indebtedness—Credit Facilities” for more information regarding our revolving credit facility.
Following completion of this offering, we believe that cash generated through operations and our financing arrangements will be sufficient to meet working capital requirements, anticipated capital expenditures and scheduled debt payments for at least the next 12 months.
Cash Flows
The following table sets forth our cash flows for the periods indicated:
| Predecessor | Successor | |||||||||||||||||||||||||
| 358-Day Period Ended December 23, 2012 |
December 24, 2012 (inception date) to December 31, 2012 |
Year Ended December 31, |
Three Months Ended March 31, |
|||||||||||||||||||||||
| 2013 | 2014 | 2014 (as restated)(1) |
2015 | |||||||||||||||||||||||
| (in millions) | ||||||||||||||||||||||||||
| Net cash provided by (used in) operating activities |
$ | 91.0 | $ | (1.4 | ) | $ | 70.7 | $ | 79.3 | $ | 15.5 | $ | 12.9 | |||||||||||||
| Net cash used in investing activities |
(110.5 | ) | (400.6 | ) | (61.9 | ) | (337.8 | ) | (174.8 | ) | (35.9 | ) | ||||||||||||||
| Net cash provided by (used in) financing activities |
25.8 | 400.7 | (11.8 | ) | 253.5 | 173.0 | 17.6 | |||||||||||||||||||
| Effect of exchange rate changes on cash and cash equivalents |
(0.3 | ) | (0 | ) | (1.1 | ) | 7.8 | (3.6 | ) | 8.3 | ||||||||||||||||
|
|
|
|
|
|
|
|
|
|
|
|
|
|||||||||||||||
| Net increase (decrease) in cash and cash equivalents |
5.9 | (1.3 | ) | (4.1 | ) | 2.9 | 10.1 | 2.8 | ||||||||||||||||||
| Cash and cash equivalents at beginning of period |
3.4 | 9.3 | 8.0 | 3.9 | 3.9 | 6.8 | ||||||||||||||||||||
|
|
|
|
|
|
|
|
|
|
|
|
|
|||||||||||||||
| Cash and cash equivalents at end of period |
$ | 9.3 | $ | 8.0 | $ | 3.9 | $ | 6.8 | $ | 14.0 | $ | 9.6 | ||||||||||||||
|
|
|
|
|
|
|
|
|
|
|
|
|
|
||||||||||||||
70
Table of Contents
| (1) | Subsequent to the date of the original issuance, we concluded that we were required to restate our unaudited interim condensed consolidated financial statements as of and for the quarter ended March 31, 2014. These amounts have been noted herein as restated. See Note 15 within the Condensed Consolidated Financial Statements for further discussion and detail of the restatement. |
Net Cash Provided by Operating Activities
For the three months ended March 31, 2015, cash provided by operating activities decreased by $2.6 million to $12.9 million from $15.5 million for the three months ended March 31, 2014. The decrease was primarily due to decreased operations in the U.K. due to event timing and phasing as well as the 2014 Winter Olympic Games and lower foreign currency rates, partially offset by the accretive operating activities associated with the acquisitions of MIRA, Faber, Screen Scene Group as well as a full quarter of GTV operations.
In 2014, cash provided by operating activities increased by $8.6 million to $79.3 million from $70.7 million during 2013. The increase was primarily driven by the operating activities associated with the GTV acquisition in January 2014.
In 2013, cash provided by operating activities decreased $20.3 million to $70.7 million from $91.0 million for the 358-day period ended December 23, 2012. This decrease was principally driven by an increase in our interest expense as a result of the increase in our outstanding debt as a result of the Corporate Reorganization.
Net Cash Used in Investing Activities
For the three months ended March 31, 2015, cash used in investing activities of $35.9 million consisted of capital expenditures of $23.4 million, which reflected increased spending on capital year over year, and acquisition of businesses of $12.5 million, comprised of the Screen Scene Group acquisition.
In 2014, cash used in investing activities of $337.8 million consisted of capital expenditures of $82.7 million, which reflected increased spending on capital year over year, and acquisition of businesses of $255.1 million, comprised of the GTV, MIRA, Silk Studios, and Faber acquisitions.
In 2013, cash used in investing activities of $61.9 million consisted of capital expenditures of $64.1 million, offset by proceeds from the sale of assets of $2.1 million. For the 358-day period ended December 23, 2012, cash used in investing activities of $110.5 million consisted of payments for acquisitions of $40.9 million and capital expenditures of $69.6 million.
Net Cash Provided By (Used In) Financing Activities
For the three months ended March 31, 2015, cash provided by financing activities of $17.6 million consisted of $25.3 million in borrowings (net) from our line of credit and proceeds from the issuance of stock of $0.2 million, offset by debt repayments of $2.2 million, debt issuance costs of $0.8 million, and capital lease repayments of $5.0 million.
In 2014, cash provided by financing activities of $253.5 million consisted of $31.0 million in borrowings (net) from our line of credit, $215.0 million of proceeds from additional debt issuance, $7.3 million in proceeds from the issuance of common stock (including $0.5 million from the collection of a promissory note in connection with a 2013 stock issuance), and $23.1 million in proceeds from sale-leaseback arrangements; these inflows were offset by debt repayments of $5.5 million, debt issuance costs of $7.8 million, and capital lease repayments of $9.7 million.
71
Table of Contents
In 2013, cash used in financing activities of $11.8 million consisted of $16.5 million in borrowings (net) from our line of credit, a $4.1 million refund of original issue discount on refinancing and $0.7 million in proceeds from the issuance of common stock offset by debt repayments of $17.8 million, debt issuance costs of $8.3 million and capital lease repayments of $7.0 million. For the 358-day period ended December 23, 2012, cash provided by financing activities of $25.8 million consisted of $34.5 million in borrowings (net) from our line of credit, $5.0 million in proceeds from debt issuance, $7.2 million in proceeds from a sale-leaseback arrangement and $0.6 million in proceeds from the issuance of common stock; these inflows were offset by debt repayments of $13.1 million, debt issuance costs of $0.3 million, and capital lease repayments of $8.1 million.
Working Capital
As of March 31, 2015, total current assets and total current liabilities were $82.0 million, which represents a $12.1 million decrease in working capital from December 31, 2014. Total current assets decreased $1.4 million, primarily due to a decrease in accounts receivable of $5.1 million related to the timing of sales, partially offset by an increase in cash of $2.8 million as a result of timing of payments and cash conservation for pending acquisitions. Total current liabilities increased $10.7 million primarily due to an increase in accounts payable of $13.1 million due to acquisitions, capital expenditures, and the timing of cash payments, with extended payment terms for some vendors.
As of December 31, 2014, total current assets were $83.4 million and total current liabilities were $71.3 million, resulting in working capital of $12.1 million, which represents a $2.6 million decrease in working capital from 2013 to 2014. Both current assets and liabilities increased as a result of the acquisitions made during 2014, and the current portion of long-term debt, in particular, increased $3.1 million from 2013 to 2014 as a result of increased debt to finance the GTV and MIRA acquisitions as well as the legacy debt assumed as a result of the Faber acquisition.
As of December 31, 2013, total current assets were $63.1 million and total current liabilities were $48.4 million, resulting in working capital of $14.7 million. As of December 31, 2012, total current assets were $65.9 million and total current liabilities were $57.8 million, resulting in working capital of $8.0 million. The $6.7 million increase in working capital from 2012 to 2013 was primarily comprised of decreases in liabilities of $1.8 million in current debt, $8.4 million in accounts payable, $4.4 million in other accruals and a decrease in assets of $4.1 million in cash; partially offsetting these decreases were increases in capital leases of $2.0 million, deferred revenue of $3.1 million, and prepaids and other current assets of $0.7 million.
Description of Our Indebtedness
Credit Facilities
On December 24, 2012, we entered into two credit agreements, the first providing for a $60.0 million revolving credit facility and a $455.0 million first lien term loan (the “First Lien Credit Agreement”), and the second providing for a $165.0 million second lien term loan (the “Second Lien Credit Agreement”). In January 2013, we refinanced $15.0 million of the second lien term loan by increasing the first lien term loan by an equal amount, and we also prepaid $10.0 million of the second lien term loan. In February 2013, we completed a second refinancing which resulted in $60.0 million of the second lien term loan refinanced to the first lien term loan. In January 2014, we financed the purchase of GTV by increasing the first lien term loan by $155.0 million. In August 2014, we financed the purchase of MIRA by increasing the first lien term loan by $60.0 million. In January 2015, we amended our credit agreements to increase the maximum borrowing capacity under our revolving credit facility by $45.0 million, for a total maximum of $105.0 million. As a result of these transactions, as of March 31, 2015, our credit facilities consist of (i) a $745.0 million first lien term loan, (ii) an $80.0 million second lien term loan and (iii) a $105.0 million revolving credit facility. We had $27.6 million of availability under the revolving credit facility and $1.9 million letters of credit outstanding at March 31, 2015. In April 2015, we financed our purchase of Mediatec and Outside Broadcast by increasing the second lien term loan by $75.0 million.
72
Table of Contents
First Lien Term Loan and Revolving Credit Facility
Principal on the first lien term loan is payable quarterly in amounts equaling 0.25% of the principal, with a final payment of approximately $697.4 million in January 2020. The final payment will be reduced by any prepayments, including those from the net proceeds of this offering. The revolving credit facility is scheduled to expire on January 22, 2018. Interest is charged on the revolving credit facility and the first lien term loan at either (i) the lender’s alternative base rate which is the greatest of (x) the prime rate, (y) the federal funds effective rate plus 0.50% and (z) an adjusted LIBO rate plus 1.00% and plus, in each case, an applicable rate of 2.25% per annum for term loans and 3.00% per annum for revolving credit facility borrowings, or (ii) an adjusted LIBO rate plus an applicable rate of between 3.25% per annum for term loans and 4.00% per annum for revolving credit facility borrowings, at our option. A 1.00% floor applies to the LIBO rate. In addition, we incur a commitment fee on the unused portion of the revolving credit facility at a rate of 0.5% per annum. Interest rates for the first lien term loan and the revolving credit facility were 4.25% and 4.172% - 6.25%, respectively, at March 31, 2015.
Second Lien Term Loan
Principal on the second lien term loan is payable in full at maturity in July 2020. Interest is charged on the second lien term loan at either (i) the greatest of (x) the prime rate, (y) the federal funds effective rate plus 0.50% and (z) an adjusted LIBO rate plus 1.00% and plus, in each case, an applicable rate of 7.25% per annum or (ii) an adjusted LIBO rate plus an applicable rate of 8.25% per annum, at our option. A 1.25% floor applies to the adjusted LIBO rate. The interest rate for the second lien term loan facility was 9.50% at March 31, 2015. If prepaid in connection with this offering, a 1.00% prepayment premium is applicable until December 24, 2015, and no prepayment premium after. If prepaid other than in connection with this offering, a 2.00% prepayment premium is applicable until April 29, 2015, a 1.00% prepayment premium is applicable from April 29, 2016 until April 29, 2017, and no prepayment premium is applicable thereafter.
Each of the First Lien Credit Agreement and Second Lien Credit Agreement is guaranteed on a senior basis by all of our subsidiaries and is collateralized by substantially all of our assets. The credit agreements contain various covenants that may limit, among other things, our and our subsidiaries’ ability to:
| • | incur additional indebtedness or guarantee other indebtedness; |
| • | issue preferred equity interests; |
| • | grant liens; |
| • | merge with or consolidate with another entity; |
| • | make certain loans, investments or acquisitions; |
| • | dispose of assets, including the sale of equity interests in our subsidiaries, or issue equity interests in our subsidiaries to third parties; |
| • | enter into sale and leaseback transactions; |
| • | pay dividends or other distributions; |
| • | make payments in respect of, or amend the terms of, subordinated indebtedness; |
| • | enter into transactions with affiliates; or |
| • | change our fiscal year. |
Each of the credit agreements contain provisions requiring mandatory prepayments in the case of certain asset sales and incurrences of indebtedness, as well as an annual mandatory prepayment of 75%, 50%, 25% or 0% of excess cash flow as of the end of the fiscal year, based upon a leverage test, reduced by any prepayment made earlier in the year.
The First Lien Credit Agreement also contains a financial covenant requiring us to maintain, as of the last day of each quarter if at such time 15% of the revolving credit facility commitment is utilized, a ratio of Consolidated First Lien Indebtedness to Consolidated EBITDA (as each is defined in the First Lien Credit
73
Table of Contents
Agreement) not exceeding a set ratio (the “debt to EBITDA ratio”), initially set at 6.25 to 1 on March 31, 2014 (currently set at 6.00 to 1 at March 31, 2015), and which incrementally steps down every other quarter, beginning on December 31, 2014, until reaching 4.75 to 1 on June 30, 2017. Such ratio will remain at 4.75 to 1 thereafter until maturity (currently, July 2022 unless extended). On March 31, 2015, our debt to EBITDA ratio was 5.17 to 1.
If an event of default exists under the credit agreements, the applicable lenders are able to accelerate the maturity of the credit agreement and exercise other rights and remedies. The credit agreements contain customary events of default, including:
| • | failure to pay principal, interest or any other amount when due; |
| • | breach of the representations or warranties, or failure to comply with covenants in the credit agreements; |
| • | a failure to pay principal or interest, or otherwise default on, other material indebtedness; |
| • | bankruptcy or insolvency; |
| • | uninsured, enforceable judgments above a certain threshold amount; |
| • | the occurrence of certain material ERISA liabilities or failures to pay such liabilities; |
| • | liens on the collateral ceasing to be perfected; or |
| • | a change of control (as defined in the credit agreement). |
As of March 31, 2015, we were in compliance with all covenants under the credit agreements and no events of default existed.
Faber Debt
In conjunction with the acquisition of Faber on December 19, 2014, the Company assumed Faber’s legacy debt. This debt is comprised of a 2.4 million EUR, or $3.0 million, loan; a 0.5 million EUR, or $0.6 million, loan; a credit facility with 1.3 million EUR, or $1.6 million, maximum line of credit; and an investment line of credit with 7.5 million EUR, or $9.2 million, maximum line of credit.
The 2.4 million EUR loan on Faber is payable in quarterly installments of 0.1 million EUR, starting on June 30, 2014, with the balance payable in full on March 31, 2020. Initially, the loan bears interest at Euro Interbank Offer Rate (“EURIBOR”) plus 3.0%, and after 2014, the margin is based on the ratio of senior net debt to earnings before interest, taxes, depreciation, and amortization (“EBITDA”) as follows: (1) ratio greater than or equal to 1.75, the margin is 3.0%; (2) ratio less than 1.75 and greater than or equal to 1.50, the margin is 2.75%; and (3) ratio less than 1.50, the margin is 2.5%. The loan balance outstanding at March 31, 2015 was 2.1 million EUR, or $2.3 million. The interest rate was 3.08% at March 31, 2015.
The 0.5 million EUR loan, on LED Investment International, is payable in equal monthly installments of 61,475 EUR, or approximately $75,000, through July 2015. At March 31, 2015, the balance was 0.3 million EUR, or $0.3 million. The interest rate was 4.78% at March 31, 2015.
The lines of credit (1.3 million EUR maximum line of credit and an additional 7.5 million EUR maximum investment line of credit) on Faber are available until March 31, 2020. The investment line of credit is reduced by quarterly curtailments of 0.3 million EUR, beginning with the quarter ended June 30, 2014. At March 31, 2015, the revolving credit line balance was 5.4 million EUR, or $5.9 million, with 2.1 million EUR, or $2.3 million available under the facilities. The interest rate was 2.29% at March 31, 2015.
Faber’s debt contains a certain covenant that requires a minimum leverage coverage ratio. The Company is currently in compliance with the covenant required under the credit agreement.
74
Table of Contents
Mediatec Debt
In connection with our acquisition of Mediatec on April 29, 2015, we assumed Mediatec’s debt of approximately 408.8 million SEK, or $47.5 million. This debt balance is comprised of outstanding loans including a line of credit and capital leases with third party financial institutions.
The outstanding aggregate loan balance for Mediatec as of April 29, 2015 was approximately 157.3 million SEK, or $18.3 million, and the line of credit balance was approximately 20.1 million SEK, or $2.3 million. The aggregate loan balance is comprised of multiple loans with terms ranging from 36 months to 96 months in duration. These loans will mature beginning January 2016 and will continue to mature until November 2020. The line of credit has a maximum of 60.1 million SEK, or approximately $7.0 million. Generally, the principal and interest payments are payable in quarterly installments. These loans typically bear interest at the Stockholm Interbank Offering Rate (“STIBOR”), Euro Interbank Offer Rate (“EURIBOR”), Copenhagen Interbank Offering Rate (“CIBOR”) or Norwegian Interbank Offering Rate (“NIBOR”) plus an applicable margin. As of April 29, 2015, the interest rates in effect ranged from 1.10% to 3.20%.
In addition to the loans, Mediatec is party to several capital leases having an aggregate balance of 231.4 million SEK, or $26.9 million as of April 29, 2015. The aggregate capital lease balance is comprised of multiple leases with terms which range from 24 months to 96 months in duration. These capital leases will mature beginning July 2015 and will continue to mature until March 2021. These loans typically bear interest at the STIBOR, EURIBOR, or NIBOR plus an applicable margin or at a fixed interest rate. As of April 29, 2015, the interest rates in effect ranged from 0.55% to 6.0%.
Several of Mediatec’s loans and capital leases contain customary covenants which require that it maintain a minimum equity to assets ratio. The Company is currently in compliance with the covenants contained in these agreements.
Outside Broadcast Debt
In connection with our acquisition of Outside Broadcast on April 29, 2015, we assumed Outside Broadcast’s debt of approximately 10.3 million EUR, or $11.2 million. This debt balance is comprised of outstanding loans including a line of credit and capital leases with third party financial institutions.
Outside Broadcast’s outstanding aggregate loan balance was approximately 8.1 million EUR, or $8.8 million USD and the line of credit balance was approximately 0.4 million EUR, or $0.4 million as of April 29, 2015. This aggregate balance is comprised of multiple loans with terms ranging from 12 months to 180 months in duration. These loans will mature beginning December 2015 and will continue to mature until November 2029. The line of credit has a maximum of 0.35 million EUR. Generally, the principal and interest payments are payable in monthly installments. These loans typically bear interest at the EURIBOR plus an applicable margin. As of April 29, 2015, the interest rates in effect ranged from 1.22% to 4.47%.
In addition to the loans, Outside Broadcast’s existing capital leases had a balance of 1.8 million EUR, or $2.0 million. The capital lease balance is comprised of multiple leases with terms which range from 12 months to 60 months in duration. These capital leases will mature beginning June 2015 and will continue to mature until February 2019. These loans typically bear interest at the EURIBOR plus an applicable margin. As of April 29, 2015, the interest rates in effect ranged from 2.20% to 4.50%.
Off-Balance Sheet Arrangements
We have no off-balance sheet arrangements that have or are likely to have a current or future material effect on our financial condition, changes in financial condition, sales, expenses, results of operations, liquidity, capital expenditures or capital resources.
75
Table of Contents
Contractual Obligations
A summary of our contractual obligations as of December 31, 2014 is provided in the following table:
| Payments Due by Period | ||||||||||||||||||||
| (amounts in thousands) | ||||||||||||||||||||
| Contractual Obligations |
Total | Less than 1 year |
1-3 years | 3-5 years | More than 5 years |
|||||||||||||||
| Long-term debt obligations (excluding interest)(1) |
874,180 | 8,395 | 18,786 | 67,286 | 779,713 | |||||||||||||||
| Capital lease obligations (including interest) |
50,336 | 15,048 | 20,060 | 14,154 | 1,074 | |||||||||||||||
| Operating lease obligations |
137,583 | 14,099 | 23,521 | 19,370 | 80,593 | |||||||||||||||
|
|
|
|
|
|
|
|
|
|
|
|||||||||||
| Total contractual cash obligations |
$ | 1,062,099 | $ | 37,542 | $ | 62,367 | $ | 100,810 | $ | 861,380 | ||||||||||
| (1) | In connection with our acquisitions of GTV on January 24, 2014 and MIRA on August 29, 2014, we increased our First Lien Term Loan by $155.0 million and $60.0 million, respectively. |
Critical Accounting Policies
Our discussion and analysis of our financial condition and results of operations are based upon our consolidated financial statements, which have been prepared in accordance with accounting principles generally acceptable in the United States of America. The preparation of these financial statements requires us to make estimates and assumptions that affect the reported amounts of assets and liabilities and the disclosure of contingent assets and liabilities at the dates of the financial statements and the reported revenues and expenses during the reporting periods. We evaluate these estimates and assumptions on an ongoing basis and base our estimates on historical experience, current conditions and various other assumptions that are believed to be reasonable under the circumstances. The results of these estimates form the basis for making judgments about the carrying values of assets and liabilities as well as identifying and assessing the accounting treatment with respect to commitments and contingencies. Our actual results may materially differ from these estimates.
Listed below are the accounting policies we believe are critical to our financial statements due to the degree of uncertainty regarding the estimates or assumptions involved, and that we believe are critical to the understanding of our operations.
Revenue Recognition
Revenue is recognized when the following criteria are met: 1) persuasive evidence of an arrangement exists; 2) delivery of our service has occurred; 3) an established sales price has been set with the client and 4) collection of the sale revenue from the client is reasonably assured. The Company’s revenue is derived from the following services:
| • | Remote Production services: These services provide the Company’s clients with a mobile control room to facilitate the capture and creation of live content, including a mobile unit equipped with the Company’s assets (e.g., cameras and related audio and video equipment) together with a NEP broadcast engineering team. |
| • | Studio Production services: These services include the supply and operation of studios and/or control rooms that support live and near-live format television programming for entertainment clients. |
| • | Video Display services: These services provide the Company’s clients with large-scale, modular, LED video screens and related capabilities. |
In general, we recognize revenue as the related services are provided. Revenue from contracts associated with group events are considered earned as the services are delivered; delivery, for those group events, is considered to have occurred when services are provided in conjunction with the broadcast of each event.
76
Table of Contents
Our clients represent some of the leading broadcasters, sports and entertainment producers and cable networks in the world, and therefore our historical exposure to bad debts has been minimal.
Unbilled receivables represent recorded revenue that has been earned and is billable by us at future dates based on contractual payment terms and is anticipated to be billed and collected within the 12 months following the balance sheet date.
We collect deposits in advance for certain events. These deposits are considered to be deferred revenue and are recognized as the services are provided.
Property, Plant, and Equipment
Property, plant, and equipment are recorded on the basis of cost. Expenditures for renewals and improvements that extend the useful life or utility of the asset are capitalized and depreciated over the remaining useful life of the asset, and expenditures for ordinary maintenance and repairs are expensed as incurred.
Depreciation is computed using the straight-line method based on the estimated useful lives of the respective assets as follows: furniture and fixtures, 4-10 years; computer equipment, 3-5 years; vehicles, 5-8 years; and broadcast and production equipment, 5-10 years, dependent on the nature of the equipment. Leasehold improvements in those operating leases are depreciated over the lesser of the useful life or the remaining lease term (including required lease periods and renewals deemed to be reasonably assured) at the date of acquisition of the leasehold improvement.
Accelerated depreciation methods are utilized for income tax purposes. Upon disposal or retirement of property, plant and equipment, the cost and related accumulated depreciation are removed from our accounts and the resulting gains and losses are reflected in other income (expense) in the accompanying consolidated statements of comprehensive loss. Amortization of assets under capital leases is included in depreciation expense.
Business Acquisitions, Intangible Assets and Goodwill
We account for acquired businesses using the acquisition method of accounting, which requires that the assets acquired and liabilities assumed be recorded at the date of acquisition at their respective estimated fair values. The cost to acquire businesses has been allocated to the underlying net assets of the acquired businesses based on estimates of their respective fair values. Definite-lived intangible assets are amortized over the expected life of the asset. Any excess of the purchase price over the estimated fair values of the net assets acquired is recorded as goodwill.
The judgments made in determining the estimated fair value assigned to each class of assets acquired and liabilities assumed, as well as asset lives, can materially impact our results of operations. Fair values and useful lives are determined based on, among other factors, the expected future period of benefit of the asset, the various characteristics of the asset and projected cash flows. Because this process involves management making estimates with respect to future sales, pricing, anticipated cost environment and overall market conditions, and because these estimates form the basis for the determination of whether or not an impairment charge should be recorded, these estimates are considered to be critical accounting estimates.
The Company uses a hybrid of two techniques or approaches to valuing a business:
| (1) | Income Approach |
The income approach indicates the fair value based on the value of the economic income that the Company is expected to generate in the future. A free cash flow analysis considers the present value equivalent of two components: projected free cash flow over a defined projection period and a residual value. Expected free cash
77
Table of Contents
flows (e.g., five years) will consider historical data and projections estimated by Company management. The residual value represents the future free cash flows of the Company beyond the projection period. The residual value is calculated using a perpetuity method or exit multiple, which capitalizes the free cash flow in the final year of the projection. The projected free cash flows and residual are then discounted to their present value equivalents based on a required return to total invested capital.
Discounted Cash Flow Method
The discounted cash flow (“DCF”) method under the income approach estimates the future cash flow that a business is expected to generate. Future cash flow is converted to a present value equivalent using an estimated discount rate such as the cost of equity or the weighted-average cost of capital (“WACC” or “discount rate”), based on the type of cash flows being discounted. The DCF assumptions are estimated considering forecasts provided by Company management, historical operating performance and the economic and industry outlook as of the date of the valuation. We used ranges of 9% to 9.5% for weighted average cost of capital and perpetual growth rates ranging from 2.5% to 3.0% during our most recent annual goodwill impairment test.
| (2) | Market Approach |
The market approach is a valuation technique predicated upon the principle of substitution. The essence of this approach is to consider companies in the same general industry as the subject company to provide valuation guidelines. Comparisons are then made between the subject company and the guideline companies whose stocks are actively traded. Valuation multiples for such companies are determined and analyzed. Additionally, valuation multiples indicated in comparable guideline merger and acquisition transactions may also be considered, as well as prior transactions involving the capital stock of the Company.
Guideline Merged and Acquired Company Method
The guideline merged and acquired company (“GMAC”) method under the market approach employs pricing indicators or ratios, based on various financial parameters of value, such as revenues and earnings, derived from actual mergers and acquisitions of enterprises operating in industries and markets reasonably comparable to that of the subject company. Transactions of acquired companies were selected based on their similarity of industry and a closing date of 2011 or later. Under the GMAC method, pricing multiples are determined for the acquired companies based on relevant measures of disclosed financial performance. The indicated business enterprise value (“BEV”) pricing multiples were then applied to the requisite measure of the Company performance to develop an indication of fair value, as of the valuation date, of the Company’s BEV. Adjusted trailing twelve months’ earnings before interest, taxes, depreciation and amortization (“TTM EBITDA”) was selected as the most reliable measure of the Company’s performance. To estimate the fair value of the Company’s operating equity, as of the valuation date, an applied weighting of 100% was given to TTM EBITDA (reflecting the importance of each multiple as an indicator of value); TTM EBITDA plus cash, minus total interest bearing debt, yielded the fair value of the Company’s operating equity.
Prior Stock Transaction Method
Previously, the Company was involved in an equity capital raise. Management provided a list of investors, number of shares purchased, and the value of the shares in the Company. These recent purchases provide a representative indication of value for the total equity of the Company on a controlling, fully marketable basis because the price paid in these transactions is the same as the indicated per share price paid by Crestview in its December 2012 acquisition of the Predecessor Company. By dividing the purchase consideration by the ownership interest acquired, the result is the indicated fair value of the total business enterprise value of the Company.
78
Table of Contents
Based on the aforementioned tests, the estimated fair value for the U.S. reporting unit exceeded its carrying value by 3.3%, the estimated fair value of the Australian reporting unit exceeded its carrying value by a 36.9%, and the estimated fair value of the U.K. reporting unit exceeded its carrying value by 16.5%.
We conduct impairment tests on our goodwill at least annually on October 1, or more frequently when events or other changes in circumstances indicate that the carrying amount of the assets may not be recoverable. We currently do not anticipate significant net sales declines in the fiscal year 2015, however, if we experience net sales declines, our results of operations would be adversely affected and we may determine that impairment indicators exist. Such a determination would require us to evaluate whether or not the carrying value of our long-lived assets and goodwill, is recoverable. Additionally, changes to the inputs within the valuation calculation could also cause the estimated fair value of a reporting unit to not exceed its carrying value (i.e., impairment); changes in valuation inputs, such as valuation multiples for those comparable, guideline companies, discount rates used, changes to projections, as estimated by the Company, and BEV pricing multiples could cause a decrease in the valuation of the Company’s reporting units, causing them to fall below their carrying values. As of March 31, 2015, 56.3% of our assets, or $625.2 million, were either goodwill or other intangible assets. Downward shifts in our net sales could impact our profitability and other changes to valuation inputs could ultimately result in the potential impairment of all or a portion of our goodwill and other intangible assets.
Income Taxes
We compute our income taxes based on the statutory tax rates based on the provisions of the enacted tax law; the effects of future changes in tax laws or rates are not anticipated. Significant judgment is required in determining our income taxes and in evaluating our tax positions. We establish reserves in accordance with NEP’s policy regarding accounting for uncertainty in income taxes. Our policy provides that the tax effects from an uncertain tax position be recognized in NEP’s financial statements, only if the position is more likely than not of being sustained upon audit, based on the technical merits of the position. We adjust these reserves in light of changing facts and circumstances, such as the settlement of a tax audit. Our provision for income taxes includes the impact of reserve provisions and changes to reserves. Favorable resolution would be recognized as a reduction to our provision for income taxes in the period of resolution.
Management assesses the available positive and negative evidence to estimate if sufficient future taxable income will be generated to utilize the existing deferred tax assets. Based on this evaluation, as of December 31, 2014, a valuation allowance of $12.1 million has been recorded in order to measure only the portion of the deferred tax asset that more likely than not will be realized. The amount of the deferred tax asset considered realizable, however, could be adjusted if estimates of future taxable income during the carryforward period are reduced or if objective negative evidence in the form of cumulative losses is no longer present and additional weight may be given to subjective evidence such as projections for growth.
The resolution of tax reserves and changes in valuation allowances could be material to NEP’s results of operations or financial position. A variance of 5% between estimated reserves and valuation allowances and actual resolution and realization of these tax items would have an effect on our reserve balance and valuation allowance of approximately $0 and $3.3 million, respectively.
Equity-Based Compensation
The Company accounts for equity-based compensation using the fair value method as set forth in the ASC 718, Compensation – Stock Compensation, which requires the measurement and recognition of compensation expense for all share-based payment awards based on estimated fair values. This method requires companies to estimate the fair value of stock-based compensation on the date of grant using an option pricing model. The Company estimates the fair value of each equity-based payment award on the date of grant using the Black-Scholes pricing model.
79
Table of Contents
The Black-Scholes model determines the fair value of equity-based payment awards based on the fair value of the underlying common stock on the date of grant and requires the use of estimates and assumptions, including the fair value of our common stock, exercise price of the stock option, expected volatility, expected life, risk-free interest rate and dividend rate. The Company estimates the expected volatility of its stock options by taking the average historical volatility of a group of comparable publicly traded companies over a period equal to the expected life of the options; it is not practical for the Company to estimate its own volatility due to the lack of a liquid market and historical prices. The expected term of the units was determined in accordance with existing equity agreements as the underlying units are assumed to be exercised upon the passage of time and attainment of certain operating targets. The risk-free interest rate is the estimated average interest rate based on U.S. Treasury zero-coupon notes with terms consistent with the expected life of the awards. The expected dividend yield is zero as we do not anticipate paying any recurring cash dividends in the foreseeable future. The Company estimates the forfeiture rate of its stock-based awards based on an analysis of our actual forfeitures, analysis of employee turnover and other factors. The impact from a forfeiture rate adjustment would be recognized in full in the period in which the forfeiture rate changes, and, if the actual number of future forfeitures differs from our prior estimates, we may be required to record adjustments to equity-based compensation expense in future periods.
Equity awards issued to non-employees are accounted for at fair value. The Company believes that the fair value of the awards is more reliably measured than the fair value of services received. The Company records compensation expense based on the then-current fair values of the stock awards at each financial reporting date. Compensation recorded during the service period is adjusted in subsequent periods for changes in the stock award’s fair value until the earlier of the date at which the non-employee’s performance is complete or a performance commitment is reached, which is generally when the stock option award vests. Compensation expense relating to non-employee stock awards is recorded on a straight-line basis.
The assumptions used in calculating the fair value of the stock-based awards represent management judgment. As a result, if factors change and different assumptions are used, the equity-based compensation expense could be materially different in the future. Compensation expense relating to employee stock awards is recorded on a straight-line basis. Determining the fair value of equity-based awards on the grant date requires the use of estimates and assumptions, including the fair value of our common stock, exercise price of the stock option, expected volatility, expected life, risk-free interest rate and dividend rate. Fair value determinations will be less reliant on estimates and assumptions post-IPO as there will be underlying shares trading when new equity-based awards are granted.
Recent Accounting Pronouncements
Emerging Growth Company
We qualify as an “emerging growth company” pursuant to the provisions of the JOBS Act, enacted on April 5, 2012. Section 102 of the JOBS Act provides that an “emerging growth company” can take advantage of the extended transition period provided in Section 7(a)(2)(B) of the Securities Act for complying with new or revised accounting standards. However, we are choosing to “opt out” of such extended transition period, and as a result, we will comply with new or revised accounting standards on the relevant dates on which adoption of such standards is required for non-emerging growth companies. Our election to “opt-out” of the extended transition period is irrevocable.
Revenue
In May 2014, the FASB issued ASU No. 2014-09, Revenue from Contracts with Customers. This guidance supersedes the revenue recognition requirements in ASC 605, Revenue Recognition. This guidance is based on the principle that revenue is recognized to depict the transfer of goods or services to customers in an amount that reflects the consideration to which the entity expects to be entitled in exchange for those goods or services. The guidance also requires additional disclosure about the nature, amount, timing and uncertainty of revenue and cash flows arising from customer contracts, including significant judgments and changes in judgments and assets
80
Table of Contents
recognized from costs incurred to obtain or fulfill a contract. The amendments in this ASU are effective retrospectively for annual reporting periods beginning after December 15, 2016, including interim periods within that reporting period. Entities have the option of using full retrospective, cumulative effect, or modified approach to adopt the guidance. We are evaluating the potential impact of this adoption on its consolidated financial statements.
Debt
In April 2015, the FASB issued ASU No. 2015-03, Interest — Imputation of Interest (Subtopic 835-30): Simplifying the Presentation of Debt Issuance Costs. This guidance is part of the Company’s initiative to reduce the complexity in accounting standards (the Simplification Initiative). To simplify the presentation of debt issuance costs, the amendments in this ASU require that debt issuance costs related to a recognized debt liability be presented in the balance sheet as a direct deduction from the carrying amount of the debt liability, consistent with debt discounts. The amendments in this ASU are effective retrospectively for annual reporting periods beginning after December 15, 2015, including interim periods within that reporting period. Early adoption of the amendments is permitted. We have historically presented debt issuance costs in a manner consistent with the ASU; as such, there is no impact of this adoption on the consolidated financial statements.
Internal Controls and Procedures
Prior to the completion of this offering, we have been a private company with limited accounting personnel to adequately execute our accounting processes and limited other supervisory resources with which to address our internal control over financial reporting. We have identified control deficiencies that constituted a material weakness and significant deficiencies in our internal control over financial reporting. The material weakness related to deficiencies in the design and operation of controls related to the analysis undertaken to support complex and non-routine accounting transactions and disclose such transactions in our financial statements and deficiencies associated with the process of researching, evaluating, and assessing such non-routine transactions. A material weakness is a control deficiency, or a combination of control deficiencies, in internal control over financial reporting, such that there is a reasonable possibility that a material misstatement of our annual or interim financial statements will not be prevented or detected on a timely basis.
Management has taken steps to address the causes of this material weakness by putting into place new accounting processes and control procedures, including the addition of experienced accounting personnel in response to our identification of gaps in our skills base and expertise of the staff required to meet the financial reporting requirements of a public company. However, our evaluation of internal control over financial reporting is not complete and we expect remediation to continue.
While we have begun the process of evaluating our internal control over financial reporting, we are in the early phases of our review and will not complete our review until well after this offering is completed. We cannot predict the outcome of our review at this time. During the course of the review, we may identify additional control deficiencies, which represent significant deficiencies and other material weaknesses, in addition to those previously identified, that require remediation by the Company. Our remediation efforts may not enable us to remedy or avoid material weaknesses or significant deficiencies in the future.
We are not currently required to comply with the SEC’s rules implementing Section 404 of the Sarbanes Oxley Act of 2002, and are therefore not required to make a formal assessment of the effectiveness of our internal control over financial reporting for that purpose. Upon becoming a public company, we will be required to comply with the SEC’s rules implementing Section 302 of the Sarbanes-Oxley Act of 2002, which will require our management to certify financial and other information in our quarterly and annual reports and provide an annual management report on the effectiveness of our internal control over financial reporting. We will not be required to make our first assessment of our internal control over financial reporting until the year following our first annual report required to be filed with the SEC. To comply with the requirements of being a public
81
Table of Contents
company, we will need to implement additional financial and management controls, reporting systems and procedures and hire additional accounting, finance and legal staff.
Further, our independent registered public accounting firm is not yet required to formally attest to the effectiveness of our internal controls over financial reporting, and will not be required to do so for as long as we are an “emerging growth company” pursuant to the provisions of the JOBS Act. Please read “Summary—Emerging Growth Company Status.”
Inflation
Inflation is a factor in the economies in which we do business and we continue to seek ways to mitigate its effect. Inflation has affected our performance in terms of higher costs for wages, salaries and equipment. Although the exact impact of inflation is indeterminable, we believe we have offset these higher costs by increasing the rates of the services we provide to our clients.
Seasonality
Given the year-round broadcast of live sporting and other live entertainment, as well as unscripted television programming, seasonality does not have a material effect on our business with the exception of the quarter ended March 31 of each year, which is traditionally our slowest due to the generally lighter schedule of sports broadcasts for which we have contracts in the winter months in the United States and United Kingdom. We manage the limited seasonality of the sports and entertainment industry through multi-purpose use of mobile units, studios and control rooms, thereby resulting in generally balanced quarterly seasonality in revenue and profitability. Seasonality of financial results is further reduced by the diversification of our service lines and our global presence in various markets with offsetting “peak” seasons. Our capital expenditures are typically skewed to the first two quarters of the year, which impacts quarterly liquidity, but also maximizes revenue generating ability through the multi-purpose use of the assets throughout the year. Certain large-scale, global sporting events, such as the Commonwealth Games and the Olympics, are serviced every two or four years and provide increased revenue and income during these periods.
Quantitative and Qualitative Disclosures About Market Risk
Market risk is the risk of loss arising from adverse changes in market rates and prices. The principal market risks to which we are exposed are interest rate risk and foreign exchange rate risk.
Interest Rate Risk
Our long-term debt bears interest at variable rates. We have no current plans to enter into interest rate swaps or interest rate cap agreements, however we will continue to evaluate the financial viability of potentially doing so in the future. Assuming the current level of borrowings and assuming a 25 basis point change in interest rates, it is estimated that our interest expense for the three months ended March 31, 2015 would have changed by approximately $0.6 million.
In the event of an adverse change in interest rates, management may take actions to mitigate our exposure. However, due to the uncertainty of the actions that would be taken and their possible effects, the preceding interest rate sensitivity analysis assumes no such actions. Further, the analysis does not consider the effects of the change in the level of overall economic activity that could exist in such an environment.
Foreign Exchange Rate Risk
At March 31, 2015, we conducted our operations principally in the United States, the U.K. and Australia, Ireland and the Netherlands. Income from foreign operations is earned in local currencies. As a result, our
82
Table of Contents
financial results could be affected by factors such as changes in foreign currency exchange rates or weak economic conditions in the foreign markets in which we have operations. We estimate a 10% change in the value of the U.S. dollar relative to each of British pound sterling, the Australian dollar, and the Euro would have had a $1.5 million, $1.6 million, and $0.6 million impact on revenues, respectively, for the three months ended March 31, 2015. Due to our recent acquisitions of Mediatec and Outside Broadcast, we are also subject to foreign currency fluctuation risk in Denmark, Norway, Sweden and Switzerland.
This analysis does not consider the implications that such currency fluctuations could have on the overall economic activity that could exist in such an environment in the U.S. or the foreign countries or on the results of operations of these foreign entities.
83
Table of Contents
Overview
We are the largest global outsourced provider of comprehensive live and broadcast production solutions, with leading market positions in the United States, Europe and Australia. We serve the premium sports, entertainment and other live event production markets, where we offer mission-critical outsourced solutions, including remote production, studio production, video display and host broadcasting. Our service offering combines highly-trained technical experts with state-of-the-art production resources to offer a platform-agnostic solution across a wide variety of broadcasts and live events. With a team of more than 800 engineers, we work side-by-side with clients to design tailored solutions and provide real-time support for their productions. Our diverse capabilities offer clients the convenience of a comprehensive solution covering technical design, video and audio content capture through to the delivery of an integrated broadcast feed. We believe that we have the largest and most experienced outsourced engineering team in our industry, delivering unique value through our extensive network of mobile units, fixed-location studios and control rooms, and modular video displays.
Our objective is to leverage our engineering expertise and technical solutions to deliver superior service and develop long-standing client relationships. We believe our clients view us as a trusted partner who shares their commitment to continuous innovation and the seamless delivery of complex, high-quality productions. Our clients include many of the world’s premier television broadcasters, cable networks and event producers who offer the following live and broadcast productions:
| • | Sports production for well-known media rights holders and related events such as the NFL, PGA, MLB, NHL, NBA, WWE, NCAA, professional tennis, EPL, Olympic Games, World Cup and Commonwealth Games; |
| • | Entertainment production for scripted and unscripted television programming, late night television, awards shows, concert tours and music festivals; and |
| • | Other live event production for corporate events and trade shows. |
Founded in 1986, NEP was first to respond to an unmet need for higher service levels and advanced engineering expertise to support our clients’ live broadcasts. Over time, we have developed a wide range of services and expanded our geographic footprint, building our scale and engineering capabilities. Our strategy of increasing our scale has been accelerated by strategic acquisitions, where we have a proven track record of effectively sourcing, evaluating and integrating attractive businesses and assets. Today, we believe that the scale of our platform allows us to satisfy increasingly complex client requirements globally, while enabling us to achieve attractive returns on capital. Our offices in 13 countries and experience in more than 65 countries provide us with a global platform from which we serviced over 1,700 clients and more than 10,700 events in 2014. For the three months ended March 31, 2015 and the year ended December 31, 2014, we generated total revenues of $103.1 million and $442.8 million, respectively, net losses of $35.9 million and $41.2 million, respectively and Adjusted EBITDA of $32.1 million and $145.1 million, respectively. For a reconciliation of Adjusted EBITDA to net loss, please see “Summary—Non-GAAP Financial Measure.”
Outsourcing in our industry is driven by the need for greater engineering expertise and technical solutions, as well as the scale and geographic reach offered by a comprehensive service provider like NEP. We offer a wide array of live and broadcast production services to the sports, entertainment and other live event markets in the United States, Europe and Australia:
| • | Remote Production services provide our clients with a mobile control room to facilitate the creation and capture of live content, typically equipped with NEP-owned assets (e.g., cameras and related audio and video equipment) together with an NEP broadcast engineering team. These services are typically provided under long-term contracts with our clients for full season coverage of events and programs throughout the life of their related broadcast rights agreements. We have helped clients broadcast over |
84
Table of Contents
| 20 years of popular sports and live entertainment. For the three months ended March 31, 2015 and the year ended December 31, 2014, our remote production services generated 75% and 74%, respectively, of our total revenues. |
| • | Studio Production services include the supply and operation of studios and/or control rooms that support live and near-live television programming for entertainment clients as well as post-production services. These services are typically provided pursuant to annual contracts and are generally renewed throughout the life of the show. For the three months ended March 31, 2015 and the year ended December 31, 2014, our studio production services generated 9% and 9%, respectively, of our total revenues. |
| • | Video Display services provide our clients with the design and set-up of large-scale, modular, LED video screens and related capabilities. For the three months ended March 31, 2015 and the year ended December 31, 2014, our video display services generated 16% and 12%, respectively, of our total revenues. |
| • | Host Broadcasting includes the provision of technical design, build and operational services (e.g., equipment, satellite facilities and broadcast engineers) to assemble and operate centralized broadcast facilities that enable our clients to receive, produce and distribute content globally for multi-venue events. For the three months ended March 31, 2015 and the year ended December 31, 2014, our host broadcasting services generated 0% and 4%, respectively, of our total revenues. |
Our ability to deliver high-quality technical solutions for our clients is directly related to our ability to hire, train and retain the most experienced and innovative engineers in the industry. Our technical solutions are supported on-site and in real-time by a team of over 800 highly-trained engineers around the globe. Our high-quality equipment and facilities, which are typically designed and procured in connection with a specific long-term contract, are primarily comprised of 118 mobile production units, 46 studios and control rooms and approximately 14,400 square meters of modular LED displays.
Our objective is to stay ahead of our competitors by continually innovating and developing technical solutions that fully leverage the talents of our team and meet our clients’ evolving production, technology and budgetary goals. Our engineers are responsible for driving innovation for our clients and have established NEP’s track record of delivering numerous industry firsts. Our highly skilled integration team, which is dedicated to design and development, enables us to translate our extensive on-the-ground experience into high-quality solutions. Lastly, our relationships with suppliers and manufacturers provide us with insight into the latest technologies and trends across the live and broadcast event production industry.
In 2014, we were the:
| • | # 1 provider of remote production for Premium Events in the United States, with greater than 70% market share; |
| • | # 1 independent provider of technical control rooms in New York City and Los Angeles; |
| • | # 1 provider of remote production for Premium Events in Australia, with greater than 50% market share; |
| • | # 1 provider of remote production for Premium Events in the U.K., with greater than 35% market share; and |
| • | # 1 provider of remote production for Premium Events in the Nordic countries (Norway, Finland, Denmark and Sweden), with greater than 40% market share. |
We have long-standing relationships with many of the world’s premier television broadcasters, cable networks and event producers who offer live and broadcast productions in sports, entertainment and other live events. Many of our clients have partnered with us for over 20 years, which we believe is driven by our track
85
Table of Contents
record of quality, reliability and excellence in service and technology. Our clients produce high-value, live content and, therefore, often rely on our ability to perform when given only one opportunity to execute a seamless live broadcast. In close consultation with our clients, our engineering team designs, develops and integrates production solutions that fit our clients’ technology, production and budgetary needs and provides on-site technical support for each event to facilitate high-quality productions. Our client relationships provide us with strong revenue visibility, as a large portion of our annual revenue is derived from multi-year contracts. Our contracts are typically coterminous with our clients’ broadcast or production rights agreements.
As of April 30, 2015 and 2014, our firm contracted revenue backlog for contracts with greater than one year remaining was approximately $673 million and $560 million, respectively, with a weighted average remaining contract length of approximately 4.4 years as of April 30, 2015. Approximately $496 million of our total firm contracted revenue backlog as of April 30, 2015 is not expected to be realized during 2015. In addition, we also generate additional revenues above contracted levels by providing incremental services at events to support expanded client needs, such as shoulder programming (e.g., pre-game, post-game and halftime shows) or additional on-site cameras.
Since 2004, we have completed 19 acquisitions for total consideration of over $700 million. Our acquisition activity has broadened our global footprint and expanded our service offering, enabling us to increase revenues from our clients, achieve cost synergies, cross-sell existing or acquired service offerings and improve our purchasing power with suppliers. Most recently, we acquired Mediatec in April 2015, a remote production company with leading market share in the Nordic countries, and Outside Broadcast, a remote production company in Belgium. The acquisitions are expected to provide us with a platform for organic growth and bolt-on acquisitions, as well as a new cloud-based media production solution known as Mediabank. In January 2014, we acquired GTV, the market leader in remote production in Australia. This acquisition provided us with a leading position in the Australian market, a platform for potential expansion into the broader Asian markets and a host broadcasting capability that has been leveraged across the NEP platform.
Market Opportunity
We believe that the size of the total addressable market of global live and broadcast production solutions is approximately $19.2 billion, out of which $1.5 billion and $8.1 billion represent existing U.S. and international core service offering opportunities, respectively, and $9.6 billion represents global opportunities in future planned service offerings, including content management, post production, uplink, audio, lighting, stage set design, freight forwarding, playout and technical consulting. As the largest global outsourced provider of comprehensive live and broadcast production solutions, we believe that our economies of scale and deep industry experience allow us to continue expanding our platform through both organic investment and acquisitions in these highly fragmented markets. We also believe that we are well positioned to win a disproportionate amount of the new business that is converted from in-house operations or currently outsourced to a smaller provider as clients seek services from partners with the scale and engineering expertise necessary to deliver high-quality productions.
Over the past decade, demand for high-quality productions with increasingly complex technical needs has driven consolidation within the live and broadcast production industry, especially in the United States. We believe that these same dynamics will support consolidation internationally, with additional support by the increasing demand for global delivery of comprehensive production services. We expect providers with greater scale and global reach will offer increasing competitive advantage, delivering higher-quality services and overall value to clients through long-term relationships. Against this backdrop, we believe there may be opportunities to consolidate markets, increase our scale, and continue to diversify the solutions that we provide to our clients. Our primary end markets include production and related solutions for sports, entertainment and corporate events, where we seek to be a top-tier service provider in all of the markets where we operate. Our scale and expertise position us to take advantage of several end-market trends including:
86
Table of Contents
Increased demand for outsourced solutions
Outsourcing of live and broadcast solutions continues to be driven by the need for greater technical resources and expertise, particularly for live and broadcast productions. We believe that our clients have historically found it difficult to attract, develop and retain the necessary talent to design, construct and deliver high-quality production solutions, including engineers and other technical experts. Today, this outsourcing trend continues, driven by the increasing complexity of some of our clients’ live and broadcast productions, requiring specialized talent and technical capabilities, as well as the scale and geographic reach offered by a comprehensive service provider.
Increased value of live television due to time-shifting of programming
With the advent and continued evolution of digital video recorders (DVR) and Video-on-Demand (VoD) technology, consumers increasingly possess capabilities that speed or avoid delivery of advertisements, resulting in lower advertising value for marketers. Due to these trends, higher value programming has shifted towards content that is not only in high demand among viewers but also much more likely to be viewed live, translating into significantly more value for both marketers and broadcasters. As sporting events and unscripted television tend to be real-time and results-oriented in nature, broadcasters are more aggressively increasing programming in these areas.
Sports: According to The Nielsen Company, the total hours of sports programming aired on television grew over 240% from 2004 to 2014. In order to take advantage of the premium advertising spend, broadcasters have increased the segmentation of live sports broadcasting content, including pre-game and post-game analysis as well as halftime entertainment, highlights and replay shows. Each additional event potentially generates incremental demand for our services.
Unscripted Television Programming: After a decade of growth, broadcaster and consumer focus on unscripted television content has remained strong. According to Nielsen’s weekly ratings, unscripted television shows have accounted for as many as seven out of the top ten highest rated television broadcast programs in the United States in the last six months. Unscripted programming typically requires higher use of outsourced production solutions that we offer, including remote and studio production, video display, transmission and post-production services.
Increase in global consumer demand for live sports programming
According to The Nielsen Company, individual consumption of sports related content has grown over 21% from 2004 to 2014. One of the drivers of this increase is sports globalization; for instance, the EPL has recently granted broadcast rights to NBC for all of its regular season games through the 2016 season as a means to expand access to United States viewers. With the ability to broadcast globally, leagues are broadcasting games from all over the world, not just in their domestic markets. As domestic leagues expand into foreign markets, they will need reliable production partners to deliver and operate key production equipment all over the world. Given that each league has unique preferences in capturing, editing and broadcasting data, we believe they will require comprehensive service offerings to ensure seamless production as the number of international broadcasts increases. According to SNL Kagan, the value of the most recent NFL, MLB and NBA broadcast rights agreements have increased between 60% to 170% as compared to the prior contracts.
Growing global content consumption across all media genres
Technological advancements have enabled consumers of all age, race and ethnicity groups to consume media content with more presence than ever before. According to Nielsen’s Cross-Platform Report, during the fourth quarter of 2014, the average American adult spent approximately 5% more time per day, compared to the fourth quarter of 2012, consuming media through live television, time-shifted television and smartphones. This increased demand for content continues to fuel the proliferation of content delivery alternatives. For instance, the
87
Table of Contents
number of cable channels has increased approximately 400% since 1995, according to SNL Kagan. As a result, broadcasters focus on delivering premium programming through HD content or exclusive events in order to generate larger, captive and loyal audiences. These trends are particularly relevant to remote production services providers such as NEP, as our ability to generate revenue is typically unaffected by the content delivery method (e.g., internet, cable and satellite streaming video services), and therefore, we generally benefit from increased content creation.
Continued increase in outsourced studio production by broadcasters
As outsourced production and new media content proliferation trends continue, we believe specialized technical and engineering experts will be required to design and deliver the technical solutions to support this content. In some markets this trend is already apparent. For instance, New York has experienced 50% growth in production of television series since 2011. Similarly in the U.K., multichannel broadcaster expenditures on independent production grew at a 26% compound annual growth rate between 2004 and 2012 according to data from the Commercial Broadcasters Association. To further support production outside of a broadcaster’s location, several international and domestic markets are providing tax incentives to promote foreign television production where the broadcasters likely have no established studio or control room facilities including British Columbia, the U.K., New York and Connecticut. We believe independently operated studio providers are poised to benefit from the increase in demand for technical services, crewing support and studio facilities driven by the new content and incentives provided in key studio production markets.
A resurgence in live music concerts, tours and festivals and other live event services generating demand for mobile broadcasting service and display technology
The transition of recorded music to digital media has resulted in electronic distribution and digital music streaming, which represents a growing portion of industry revenue and has left the music industry susceptible to piracy. These changes have led musicians to target touring and live events as a more stable source of revenue. According to a Billboard survey in May 2015, concert revenue accounted for more than 80% of revenue in the music industry in 2014.
Focus on the live music sector is growing, while the venues at which live concert and events are held are becoming larger; in the last five years, multiple arenas and stadiums have been replaced, in some cases increasing attendance by approximately 50%. Audiences are demanding a more immersive experience, which includes more advanced features such as the ability to stream events remotely. Additionally, music festivals, which require advanced technical capabilities, are becoming increasingly popular, with 32 million people attending at least one festival a year in the United States in 2014, as reported by Nielsen. We believe these trends will create further opportunities for live and broadcast production solutions providers, such as NEP, to expand service offerings for live events (e.g., display, projection, audio and lighting), as well as the opportunity to provide other value added services (e.g., content management, live event management and technical consulting).
Our Competitive Strengths
We believe the following are among our core competitive strengths and enable us to differentiate ourselves in the markets we serve:
Market leader in comprehensive live and broadcast production solutions, with global reach, expansive scale and breadth of service offerings
We are the largest global outsourced provider of comprehensive live and broadcast production solutions to the sports, entertainment and other live events markets. We offer a diverse array of services primarily in the United States, Europe and Australia and have serviced events in more than 65 countries. The depth and breadth
88
Table of Contents
of our platform is supported by over 800 experienced engineers and an extensive portfolio of mobile and studio assets including 118 mobile production units, 46 studios and control rooms and 14,400 square meters of modular LED displays.
Our global reach, expansive scale and breadth of service offerings provide us with a number of competitive advantages, including the ability to:
| • | Deliver “Gold Standard” Service—We are able to deliver best-in-class performance, allowing us to create and maintain long-term client relationships. Our “Gold Standard” service is made possible due to the performance of our experienced, technically-skilled engineers and in-house designed technical solutions. We believe our clients view us as a trusted partner who shares their commitment to high-quality productions; |
| • | Leverage Scale and Geographic Reach to Satisfy Complex Client Needs—We are able to leverage our scale to deliver a compelling value proposition to our clients, who are increasingly demanding global delivery of complex integrated services, while maintaining the expertise and footprint to remain nimble and responsive; |
| • | Achieve Attractive Economics by Differentiation through Innovation and Scale—Our combination of engineering expertise, technical solutions and unparalleled global platform represent significant competitive differentiation. Our increased negotiating power with key suppliers provides lower cost and ready access to new technology across our global footprint, which helps us achieve attractive returns on capital; |
| • | Efficiently Repurpose Owned Technical Solutions—Our geographic reach and diversified service offerings allow us to optimize the useful life and revenue-generating potential of our assets by selectively repurposing existing assets and solutions into markets with lesser technical requirements; and |
| • | Consistently Maintain Financial Performance—The diversity of our clients, markets and service offerings has enabled us to maintain substantially consistent historical financial performance across economic cycles, characterized by long-term growth in Adjusted EBITDA and free cash flow. |
Award-winning technology leader providing innovative, mission-critical production solutions
We offer our clients the latest in live and broadcast production technology, allowing us to deliver industry-leading comprehensive live and broadcast production solutions which enable high-quality productions. We were one of the first movers in successfully transitioning remote production from standard (SD) to high definition (HD) technology and we strive to be at the forefront of new technologies and broadcast innovations. Our clients rely on the depth of our engineering team’s technical expertise to match existing market technologies and capabilities with their specifications. Through the design, development and implementation of mission-critical production solutions, our engineering personnel become highly integrated within our clients’ organizations. These engineers, together with our in-house integration teams, also have a strong record of innovation for our clients. Examples of such innovation include low latency wireless camera solutions, innovative video display set designs and automation of the configuration process for production monitor walls. Our success and technology leadership has been recognized through numerous awards, including seven of the last ten Sports Emmy Technical Team Remote awards, Emmy Awards for technical excellence, five Sports Broadcasting Hall of Fame inductees, two technology leadership awards from Broadcasting & Cable Magazine, four Pollstar Awards, four Parnelli Awards and a design award from the National Association of Broadcasters.
Strong culture of innovation and technical excellence driven by superior people development
Our culture of innovation and technical excellence is at the foundation of our business model. We believe our ability to deliver consistently high-quality, comprehensive outsourced production solutions for our clients is directly related to our ability to hire, train and retain the finest and most innovative engineers in the industry. Taking advantage of our global reach and depth of expertise, we provide numerous education and training
89
Table of Contents
opportunities to our engineering teams. Since 2006, we have offered a rigorous two-year training program for our new hires known as the NEP Mobile Unit Engineer Apprentice Program. Additionally, our Engineer Exchange Program provides engineers the opportunity to travel to one of our overseas locations to work alongside regional engineering teams and exchange know-how, facilitate integration of newly acquired assets and better equip themselves for global service delivery. Our engineers are also involved in the research and development process, enhancing their capability to troubleshoot and support our clients on site. As a result, we believe that we have earned a reputation as an employer of choice in the outsourced production industry. This is evidenced by the low levels of turnover among our engineers, who have an average tenure of 6.5 years, helping to develop continuity in customer relationships and depth of technical expertise, based on live and diverse experience.
Proven ability to successfully execute and integrate acquisitions, adding new companies to the NEP worldwide network
We believe there are strong benefits to achieving scale in live and broadcast production solutions, where many clients are looking for full-service solutions across multiple geographies. Therefore, we view acquisitions as an important component of our business strategy and intend to continue to pursue attractively-priced acquisitions. We target companies that enjoy leading market share positions, generate strong cash flow, are culturally aligned with NEP and offer a mix of new services, clients and geographic access.
We have a strong in-house M&A team with significant experience that provides support with identification, evaluation, diligence and integration. The production solutions markets are large and highly fragmented with many attractive targets. Based on our acquisition track record and the favorable view of NEP from target management teams, NEP is typically viewed as a credible buyer to potential acquisition targets, which has allowed us to continue to grow our pipeline of opportunities. Our experienced in-house M&A team is regularly engaged in acquisition discussions and has a pipeline of several potential targets under consideration.
We have consummated and integrated 19 acquisitions since 2004. These acquisitions have expanded our geographic reach in remote production, studio production and video display and have added service offering capabilities in host broadcasting, post production and uplink. In the United States, we have consolidated several remote production players which serve sports broadcasts, including Corplex, MIRA Mobile, National Mobile Television, New Century Production and Trio Video. Within the video display market we have built scale through the acquisitions of Screenworks, American Hi-Def and Sweetwater. We entered the U.K. market with the acquisition of Visions in 2004 and have subsequently added capabilities across remote and studio production with the acquisitions of Bow Tie Video, Cymru, Roll To Record and the Screen Scene Group. We entered the Australian market in 2014 with the acquisition of GTV and further strengthened our platform there with the acquisition of Silk Studios. We further grew our European platform in December 2014 with the acquisition of Faber in the Netherlands, and most recently in April 2015, we acquired Mediatec and Outside Broadcast, extending our network to the Nordic and DACH countries.
Attractive operating model with high level of contracted revenue and strong free cash flows
Our annual revenue historically has been highly predictable, with strong revenue visibility and relatively limited sensitivity to significant macroeconomic changes. As of April 30, 2015 and 2014, our firm contracted revenue backlog for contracts with one or more years remaining was approximately $673 million and $560 million, respectively. Approximately $496 million of our total firm contracted revenue backlog as of April 30, 2015 is not expected to be realized during 2015. Our long-term contracts typically range from three to seven years with certain contracts lasting up to 12 years and had a weighted average remaining life of 4.4 years as of April 30, 2015. In addition to this contracted revenue stream, our long-term client relationships provide for a significant amount of recurring revenue. These factors have contributed to the consistency of our historical financial performance across economic cycles. We also have limited exposure to individual client risk, with no single client group accounting for more than 14% of revenue for the year ended December 31, 2014.
90
Table of Contents
In addition to high levels of contracted revenue, there are several factors which have contributed to our strong historical generation of free cash flow. Much of our capital investment is success-based, with significant capital investments typically tied to new or renewed client contracts. Pricing for these contracts is market-based, but supported by internal rate of return criteria that we evaluate prior to entering into a new contract. In addition, given our size and scale, we are able to optimize the useful life of assets by repurposing assets and solutions into markets with lesser technical requirements. We also benefit from modest working capital requirements; well-maintained, long-lived equipment, which limits our near-term maintenance capital expenditure requirements; and, as of December 31, 2014, approximately $182.6 million in U.S. Federal net operating losses in addition to state and foreign net operating losses, which, subject to some limitations, are expected to support increased free cash flow.
Long-term relationships with high-profile clients driven by the delivery of high-quality comprehensive live and broadcast production solutions
We have a long track record of delivering high-quality comprehensive live and broadcast production solutions to our clients. Our clients include premier broadcasters, event producers and cable networks and our services are mission-critical to enable their productions across the globe. As our clients increasingly demand the integrated delivery of complex, comprehensive services on a global scale, we believe that our ability to be nimble and responsive in leveraging our growing global platform and capabilities, such as host broadcasting and flypacks, also becomes a key differentiating factor in maintaining and creating long-term client relationships.
We believe our reputation for superior service, demonstrated through our history of consistent, long-term coverage of high-profile sports, entertainment and other live events, together with our intimate knowledge of clients’ operations, preferences and technology needs, provide our existing clients with strong incentives to renew contracts with us. In 2014, over 83% of our contracted revenue came from repeat contracts.
Strong, diverse management team supported by deep bench of industry-leading talent
Our management team possesses a combination of long-time NEP experience, related industry backgrounds and functional area expertise. Members of our senior management team average 12 years with our Company, during which time they have cultivated strong client relationships and serviced thousands of events. Our management team has positioned us as a leader in our markets and has successfully marketed our services to retain and grow market share over time. Further, our management team has demonstrated its ability to successfully identify and execute acquisition and growth strategies on a global scale.
Our Strategy for Growth
Our multi-faceted growth strategy is to continue to pursue strategic acquisitions and expand our global scale while further developing our industry-leading technical solutions, engineering expertise and deep client relationships. Our strategy has historically allowed us to achieve strong margins, cash flow growth and attractive returns on capital. The key components of our strategy are:
Continue to pursue strategic acquisitions to improve our scale, reach and value to our clients
Acquisitions are an important component of our growth strategy. We believe that many of our clients increasingly favor scale providers to service their broadcasts and live events in order to meet their needs for the global delivery of high-quality and technically-complex productions. Since 2004, we have acquired and successfully integrated 19 businesses for total consideration of over $700 million. These acquisitions have added new leadership and engineering expertise to our platform, helped diversify our revenue mix and increased the scale and reach of our global service offerings, while enabling us to achieve cost synergies, cross-sell services and improve purchasing power. Most recently, in April 2015, we expanded our remote production and studio production capabilities by acquiring Mediatec and Outside Broadcast, extending our reach into the Nordic and
91
Table of Contents
DACH countries, as well as Belgium. In January 2015, we acquired the Screen Scene Group, extending our reach into Ireland and expanding our presence in the U.K., while also adding remote production and video display capabilities in these geographies. During 2014, we acquired GTV, Silk Studios and Faber; these acquisitions together provide entry into Asia and Continental Europe broadly, as well as new capabilities to deliver remote production, video display and host broadcasting services from local offices in Europe, Australia and the Middle East.
We utilize a targeted approach to identify and evaluate acquisition candidates based on quantitative and qualitative criteria, including market position and reputation, cash flow profile, return on capital, service mix and culture. Our leading market positions, global scale, ample track record integrating acquisitions and access to capital provide us with a competitive advantage in attracting potential sellers. We believe that there will continue to be an attractive pipeline of available acquisition candidates for us to consider and we intend to continue to aggressively pursue opportunities within broadcasting, live events and other value added services.
Expand global platform through continued consolidation and other growth initiatives
In addition to the acquisitions of Mediatec and Outside Broadcast, we are working to expand our operations within our existing international footprint, including the U.K., Continental Europe, Australia and the Middle East, both organically and through potential acquisitions. We believe that we have the opportunity to selectively consolidate smaller providers and win new outsourced production contracts in these geographic markets.
Once we have an established position in a geographic market with our core service offering, often through the acquisition of a successful regional or local player, we are able to further leverage the NEP platform with bolt-on acquisitions. This strategy has been successful over the past decade for NEP in the United States, and we intend to apply the same approach to international markets that are more highly-fragmented today. These acquisitions are typically similar in return and risk profile to organic growth through new signed contracts, while also offering the opportunity for increased utilization and cost synergies.
We are also able to leverage our existing operations to drive organic growth opportunities with both new and existing clients. For example, following our acquisition of Australia-based GTV which brought new host broadcasting capabilities to NEP, we were able to roll-out these services beyond the Australia market in 2014, most notably with the Commonwealth Games. In addition, we have been able to utilize high profile global events, such as the Olympic Games and Wimbledon, to raise our profile and establish new client relationships in our existing geographies.
Develop complementary products and services to increase our penetration with existing clients
We continually evaluate opportunities to serve our clients’ additional or adjacent production needs, organically or through acquisitions. These offerings may include lighting and audio solutions for live events, rigging infrastructure for stage productions, operations and logistics management and various other play-out and feed monitoring services. Many of these services are complementary to our existing technical solutions, allowing us to provide a more comprehensive set of services to our existing clients. We seek to leverage our existing expertise and service offerings to further penetrate our clients’ organizations and capture a greater share of their rapidly evolving production needs. We are in a strong position to evaluate the demand characteristics and overall adoption potential of adjacent service offerings given the depth to which we are integrated into our clients’ production workflow.
For example, the complexity of the solutions we provide to our Super Bowl clients has substantially increased as both viewership and technical requirements have increased over time. In 2006, the Super Bowl was watched by 91 million viewers globally and we served four clients on-site, versus 114 million viewers and eight different clients in 2015. Our 2015 production of the Super Bowl included 11 distinct productions: Pregame, Primary Game, Halftime Show, World Feed, International Feed, Telemundo Feed, NFL Honors, ESPN International, Pro Football Talk and DirecTV/FOX Beach Bowl. In order to meet our clients’ evolving
92
Table of Contents
production needs and commitment to seamlessly deliver broadcasts to a growing audience, we increased resources dedicated to our Super Bowl productions. Our crew of on-site technical staff grew from 62 to 90 engineers and the number of mobile units operated also grew from 20 to 26. Our ability to satisfy increasingly complex technical requirements to a growing group of clients highlights the unique value proposition of our scale and technical capabilities.
Continue to invest in human capital and client-driven service offerings to further sustain and enhance our leadership position
We believe that we have the most experienced live and broadcast event production engineering team in the industry. We seek to be the employer-of-choice for highly-skilled technical and engineering experts, who are integral to delivering superior services to our clients. We have made, and will continue to make, significant investments in the development of comprehensive technical solutions in the areas of broadcast, live events and other value-added services. As content delivery standards in our industry advance, we are focused on ensuring our portfolio of services delivers the greatest value for our clients, enabling us to grow with them as their production needs expand. We believe that our innovative capabilities are vital to maintaining our long-term relationships with our clients as well as developing new opportunities. Across all of our operations, we remain committed to hiring, training and retaining the industry’s most skilled engineers to strengthen and expand our offerings, delivering innovative solutions for our clients.
93
Table of Contents
Our Technical Solutions
We offer four primary outsourced solutions to the sports, entertainment and other live events markets in the United States, Europe and Australia. Our mission-critical, comprehensive solutions are developed by in-house integration experts, supported on-site and in real-time by a team of over 800 experienced engineers around the globe. Our remote and studio production services enable the capture and creation of live and near-live programming content for our clients, leveraging technical solutions, including our fleet of mobile production units, stationary control rooms and production studios. Our video display services provide for the design and set-up of large-scale, modular, LED video screens and related capabilities for concerts, unscripted television broadcasts and corporate events. Our host broadcasting services provide broadcasting management solutions for large, multi-broadcast, multi-venue live events. Additionally, we provide post production and visual effects services, which include full service HD picture, sound, graphics and visual effects for feature films, television programs and commercials, and uplink and satellite communications services, which include uplink and satellite transmission services for live event coverage.
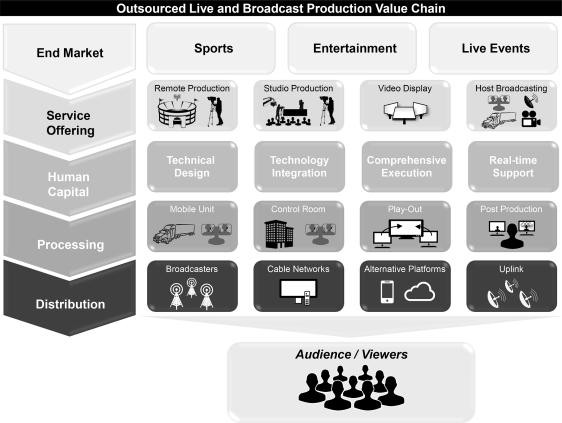
Remote Production
We offer remote production solutions to both broadcasters and rights holders for live sports events and to production companies for live or near-live entertainment shows, such as unscripted television shows, award shows or music festivals that are broadcast outside the traditional studio environment.
We typically have two to four broadcast engineers per mobile unit who provide real-time support and who work side-by-side with the client’s broadcast team to ensure smooth delivery of the event. They are responsible for operating cameras and microphone equipment, collecting raw video and audio footage to be fed to the mobile units for live editing and broadcasting, after which the assembled signal feed is delivered to the client or an uplink service provider. Our engineers are also responsible for any necessary trouble-shooting and ad hoc production-related needs that occur during an event.
94
Table of Contents
Our fleet of mobile production units, consisting of between one and four custom-designed and integrated tractor trailers, function as the control rooms for these events. Unlike many of our competitors, we design and construct most of our mobile units in-house, which allows us to offer top-quality integrated solutions and cultivate engineering expertise. Our mobile production units are equipped with HD cameras and lenses, production switchers, recording devices, routers, audio consoles, communication systems and other interconnected devices, all of which are purchased from third party providers and then integrated by NEP. The construction is generally completed in-house at NEP facilities by a team of experienced engineers, fabricators, electricians and equipment specialists to ensure full compatibility and functionality. New construction capital expenditures are typically tied to our entry into, or the renewal of, long-term client contracts.
In the case that a client is producing an event in a location where we cannot provide a mobile production unit, we offer a modular solution known as a “flypack,” that can be delivered to any location and provide the same core components of our mobile production units.

As of April 30, 2015, we operate 118 mobile units and six flypacks, including nine 4K capable mobile units in United States, four in the U.K. and two in Australia. We have plans to add two additional 4K capable mobile units in 2015. In addition to our mobile production units, we have specialty and support units that provide additional services to our clients during a broadcast. Our remote production services are primarily provided in conjunction with live sports and entertainment events under the arrangements as described below:
Sports
Sporting events require mobile production capabilities for the clients’ full set of broadcasts. For a live sports event, this would include coverage of the primary game, with potential incremental shoulder programming, including pre-game and post-game analysis and halftime entertainment, highlights and replay shows. Typically, remote sports production services are contracted on a long-term basis for a package of games and multiple seasons of coverage, coterminous with the broadcast rights agreements. Additional services above the contracted level may be added based upon the size and complexity of a given event, providing an incremental offering for clients who choose to expand the scope of the broadcast.
95
Table of Contents
Entertainment
Entertainment events, such as unscripted television shows, award shows and music festivals, are typically contracted for broadcasts season-by-season and are less likely to be under long-term arrangements.
Our Long-term Remote Production Contracts
Our long-term remote production services contracts generally take the form of either (i) a master services agreement pursuant to which we agree to provide specified remote production facilities, personnel and services to a single client for a variety of identified sports or entertainment events or (ii) an agreement for the provision of similar services for a single recurring event, and in either case, provide for compensation on an event-by-event basis. Pursuant to these agreements, we generally agree to provide a driver for each mobile unit, as well as the requisite maintenance and technical support staff specified in each contract, and we are solely responsible for keeping the facilities and other equipment maintained and in good working order. We are reimbursed for the travel, hotel, rental car and other costs incurred by our personnel while providing services, as well as a portion of our fuel costs.
Our long-term contracts have initial terms ranging from three years to 12 years. Our long-term contracts generally provide that our client may terminate its contract with us for a material deficiency in our performance under the agreement, that we may terminate the contract for our client’s failure to pay any undisputed amounts due within a specified time after invoicing, and that either party may terminate for a material uncured breach of the representation and warranties by the other party, the institution of bankruptcy proceedings with respect to the other party, and other customary events of default.
Our long-term contracts generally require us to maintain certain insurance coverages. We are generally required to indemnify our clients for out of pocket expenses incurred as a result of the breakdown of our equipment, including the costs of obtaining replacement equipment. In addition, each party is required to indemnify the other party for any third party claim relating arising from such other party’s gross negligence or willful misconduct.
Studio Production
We provide clients with studio production capabilities to enable the capture and creation of content through permanently installed, custom-designed studios and technical control rooms for live or near-live events. Depending on the geographic location and the client’s desire for physical space, we may provide either studio space or technical control room capabilities, or both. We also provide transportable control rooms that could be shipped to any location in North America, often in less than 12 hours.
The studio is where the content is physically recorded, typically in front of a studio audience and operated by NEP engineers, facilities managers and maintenance personnel. The technical control room, or rooms, is located nearby and houses the equipment necessary to edit a broadcast operated by our client’s programming directors and technical staff, supported by NEP engineers. Our studio capabilities enable television producers and broadcasters to create content for daytime and late night talk shows, sitcoms, game shows, judge shows and news commentary shows. Studio production services are typically provided on annual contracts, but are also provided for single-shoot or “ad hoc” shows. Currently, we provide these capabilities in New York, Los Angeles, Connecticut, the U.K., Australia, Belgium, Finland and Norway.
Studios
Our studios are staffed with our employees, including broadcast engineers, facilities managers and maintenance personnel and offer full post-production capabilities. As of April 30, 2015, we operated 24 fully-equipped technical studios, including nine technical studios in New York City, nine in Australia, two in Belgium, two in Finland and two in Norway. Our NYC studios range in size from 1,100 to 9,600 square feet and are free of
96
Table of Contents
line-of-sight obstructions, such as poles or columns, making them ideally suited to the production of audience based programming. Our studios in Australia range in size from 680 to 8,500 square feet. Our studios in Belgium range from 10,764 to 12,917 square feet. Our studios in Norway range from 1,000 to 2,000 square feet. We lease the studio space from the property owner under long-term contracts (e.g., 10 years with options to extend) which are then sub-let to our studio clients for single or multi-season runs. As of March 31, 2015, the average remaining term of these leases was 10 years.
Control Rooms
The technical control room, or rooms, is located nearby the related studio and houses the equipment necessary to edit a broadcast. We install and manage custom control rooms across the globe. Our engineers design, install the equipment for and manage the control rooms, working in conjunction with our clients’ production staff and facility management. As of April 30, 2015, we operate seven custom control rooms in California, two custom control rooms in Connecticut, four custom control rooms in the U.K., two custom control rooms in Finland, one custom control room in Sweden and six custom control rooms in Norway. All control rooms feature the equipment necessary to produce content, including cameras and lenses, production switchers, recording devices, routers, audio consoles, communication systems and other interconnected devices.

97
Table of Contents
Video Display
We provide our clients with innovative video display solutions for television, live events and corporate events using modular LED screens, mobile LED truck systems, digital projectors, HD flypacks, camera systems and high-resolution switches.
Our tailored display configurations include LED, projection and plasma display solutions and are generally fed by small modular HD and SD control rooms, or flypacks, which handle content video feeds and switching. The display feeds can be operated either by our engineers or our clients. Our project managers and engineers work with clients to design display technology solutions for the video feed components of their stage shows. Our project managers, engineers, audio and visual technicians and utility and support personnel then transport, setup, operate and breakdown these customized display solutions.

As of April 30, 2015, NEP has approximately 14,400 square meters of modular LED displays, with resolution of 1.6mm to 30mm; 19 display flypacks; broadcast, ENG and Robo cameras; 38 mobile LED display trucks consisting of HD LED screen modules ranging in size from 9 x 10 to 21 x 38 feet and screen resolution of 8mm to 25mm; and 398 digital projectors. We primarily deploy these assets in the United States and Europe, but frequently tour with our clients and deploy the display systems worldwide, addressing three key markets.
Television
Our television service offerings are focused on meeting the needs of live or near-live television event producers and television production companies. We specifically support these shows with bespoke modular LED video displays and video projection solutions (e.g., video walls, flooring, stairs, podiums and other creative elements). Our engineers coordinate and individually control the video and imaging on each display on the stage of popular televised competition shows, awards shows, game shows, talk shows and other unscripted programming. When required, our engineers also provide remote content capture via cameras and flypacks.
98
Table of Contents
Live Events
Our live event service offerings are focused on meeting the needs of live event producers, promoters and tour managers. We specifically support the video display needs of concert tours, music festivals and other live events. As revenue from concert tours has become an increasingly larger share of a performer’s overall earnings, the video display needs at concerts have expanded to offer a richer and more immersive audience experience, requiring more complex solutions and a higher level of technical expertise.
Our engineers typically travel alongside the client for the full tour and operate our technical solutions to distribute video content via on-stage displays systems, scoreboards and a variety of other outputs. These live events often utilize our mobile LED trucks to park on-site at the event and stream video. Contracts for live events are typically signed on a per-tour basis.
Corporate Events
Our corporate event service offerings are focused on meeting the needs of in-house and third-party event planners. Our technical solutions specifically support the video display and content capture for events such as shareholder meetings, conventions, product launches, dealer meetings and association meetings, among others.
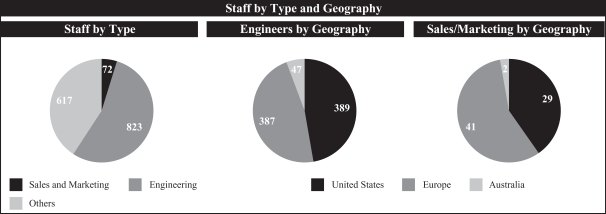
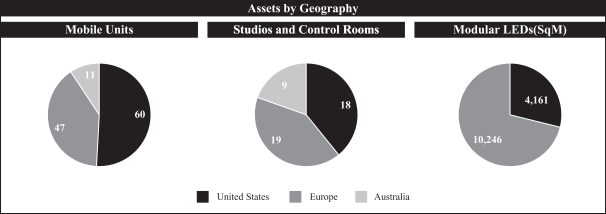
99
Table of Contents
Host Broadcasting
NEP is unique as a host broadcaster in that we offer access to our worldwide network of engineering expective and technical solutions, whereas other host broadcasters typically require sub-contractors for this activity. This allows us to achieve higher margins and returns on capital, while also ensuring the seamless combination of media management and on-site infrastructure. For large, single-purpose, multi-broadcaster, multi-venue sporting events such as the Commonwealth Games, we work with event organizers to plan, design and build content-capture and broadcast facilities. As a host broadcaster, our teams create a centralized media compound where broadcasters locate their mobile units and broadcast equipment, and provide systems integration, full production crews and support services, including the management of third party relationships.

Technology & Innovation
Our culture of innovation and technical excellence is at the foundation of our business model and value proposition. We believe our clients view us as a trusted partner because we have the necessary technical capabilities, insight and human capital, and we share their commitment to continuous innovation and the seamless delivery of complex, high-quality productions. We work closely with our clients to continuously improve, enhance and expand our portfolio of live and broadcast production solutions. Unlike many of our competitors, we design and construct most of our mobile units in-house, which allows us to offer top-quality integrated solutions and cultivate engineering expertise. Additionally, our relationships with suppliers and manufacturers provide insight into the latest technologies and trends.
Our highly talented, award-winning engineers are responsible for driving innovation across our portfolio. Our scale allows us to provide numerous education and training opportunities to our engineering teams, such as the two-year NEP Mobile Unit Engineer Apprentice Program, as well as the Engineer Exchange program. We believe these training opportunities facilitate knowledge transfer and continuity among our engineers and help us attract the most talented engineers in the industry. Our engineers are also actively involved in the research, development and integration process, allowing us to link their extensive on-the-ground experience with development of equipment and facilities that are tailored to our clients’ evolving needs.
100
Table of Contents
Our ability to attract and retain talents is also directly related to our track record of delivering numerous industry firsts. For example, we were one of the first in the industry to offer HD mobile units, enabling us to be the first provider delivering NFL, Super Bowl, NASCAR, U.S. Open (Golf) and Academy Awards telecasts in HD. We were the first to use aircraft grade composite materials to control weight in trailer design and distributed mirrored routing systems for large events, both of which have become the industry “gold standard” today. We also developed The Wall, an award-winning tablet-based application, which has significant advantages over the previously manual process of production monitor wall configuration. Most recently, we were the first production solutions provider to deliver a live 4K entertainment production and transmission from the National Theatre in the United Kingdom. Our technology leadership has been recognized with numerous industry awards, including dozens of recent Emmy Awards for technical excellence and two technology leadership awards from Broadcasting & Cable Magazine.
Sales & Marketing
Our sales and marketing efforts are organized by geography, client type and service offering and supported by account plans and business development leads to strategically pursue new business. The ongoing and execution-based nature of our work ensures that we are in constant dialogue with our clients, supported by deep relationships at all levels, with NEP executives, account managers, engineers and operations staff mapped to client counterparts. The strength of our client relationships and our incumbency position us well for contract renewals, working at an early stage with clients to develop the appropriate service offering and technology configuration in advance of a competitive new or renewal contract process. There is also a regular opportunity to provide incremental services for our long-term contracted clients, including shoulder programming (e.g., pre-game, post-game and halftime shows) or additional on-site cameras. For business lines that have a shorter contract cycle, our deep client and industry relationships provide us with insight and knowledge of upcoming events, television shows, concert tours, festivals and corporate events. In these situations, our scale and incumbency position us to win business with a strong value proposition and short development time.
Our Subsidiaries
NEP Group, Inc. is a holding company with no independent operations. All of our business is conducted by our wholly-owned subsidiaries, including:
| • | NEP Supershooters L.P., which conducts substantially all of our remote broadcast services operations in North America, and owns the entities that conduct our video display and studio production operations in North America, including Screenworks LLC. In addition, NEP Supershooters, L.P. indirectly owns the entities that provide managed media services for the British Parliament and other U.K. governmental authorities, as well as conduct remote production and studio production services throughout the U.K. |
| • | NEP/NCP Holdco, Inc., which, in turn owns: (i) NEP-GTV Holdco Pty Ltd. which owns the entities that conduct our remote production and studio operations in Australia, (ii) NEP LUXCO, S.a.r.l., which owns the entities that conduct our video display operations in Northern Europe, and (iii) NEP Media Investments Ireland, Ltd., which owns the entities that comprise the Company’s remote production, post-production and visual effects and uplink businesses based in Ireland. |
Our Employees
As of April 30, 2015, we had 1,512 permanent, full-time employees across our global operations, including 823 engineers and 72 sales and marketing personnel. We believe our engineering team represents the largest and deepest pool of engineering talent in the outsourced broadcast and live event production industry. These engineers design and deliver our technical solutions and drive our premium service quality. Our focus on quality begins with our unique apprenticeship program to nurture and develop talent in-house and is reinforced by our commitment to hire, train and retain the industry’s most skilled engineers.
101
Table of Contents
Our sales team is responsible for maintaining strong and continuous dialogue with our clients, with many relationships extending over a decade. Management maintains excellent relations with its workforce, and we have enjoyed the benefit of a relatively low employee turnover rate. None of our employees are represented by a labor union or covered by a collective bargaining agreement and we have not experienced any work stoppages.
Acquisitions
We have a strong history of successfully executing acquisitions to broaden our global footprint, expand our suite of services and gain market share. Historically, we have been able to acquire companies at attractive values and existing management of acquisitions targets often opt to roll a portion of their existing equity, which we believe reflects confidence in our track record of successful execution and integration of acquisitions.
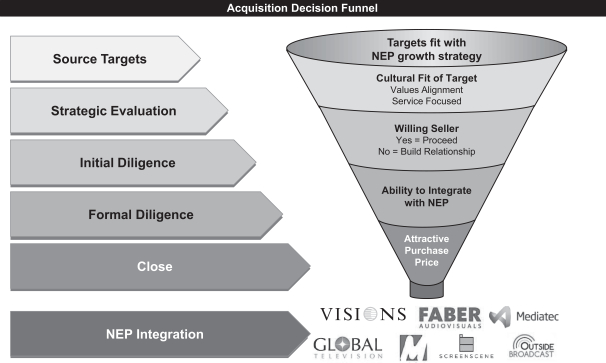
On July 8, 2015, we entered into a definitive agreement to acquire CMI. Headquartered in the Netherlands, CMI operates both the DutchView and Infostrada Creative Technologies brands. DutchView is one of the leading providers of solutions for remote production and studio production in Northern Europe. Infostrada Creative Technologies is an innovative provider of solutions for the creation, management and distribution of video content. The acquisition is expected to expand our reach in Northern Europe and add extensive video and media management solutions to our offerings. The acquisition is expected to close in the third quarter of 2015, subject to certain closing conditions.
On April 29, 2015, we acquired Mediatec, a leading remote production services company in the Nordic and DACH countries. The acquisition added 215 engineers to the NEP worldwide network, as well as a new cloud-based media production solution known as Mediabank. It is also expected to provide us with a platform for organic growth and bolt-on acquisitions across Europe.
On April 29, 2015, we acquired Outside Broadcast, a leading remote production services company in Belgium, adding 27 engineers to the NEP worldwide network and further strengthening our presence in Continental Europe.
102
Table of Contents
On January 30, 2015, we acquired the Screen Scene Group, adding four HD mobile units, post production and visual effects and uplink and satellite communications services, which we expect to leverage across the NEP worldwide network.
On December 19, 2014, we acquired Faber, strengthening our platform for video display in Europe and adding the Netherlands to our operations.
On December 1, 2014, we acquired Silk Studios, adding a production studio in Australia. The acquisition added studio capabilities in Australia, further strengthening our market leading position in Australia.
On August 29, 2014, we acquired MIRA Mobile, adding nine HD mobile units across the Western U.S. and Canada. This acquisition added scale to our West Coast operations, will provide a potential platform for our further expansion into Canada and will provide the opportunity to increase the utilization of legacy MIRA Mobile assets across the NEP worldwide network.
On January 24, 2014, we became the leader in Australian remote and studio production with the acquisition of GTV. The acquisition added a fleet of nine HD mobile units, two fly packs, five studios and one control room in Australia, providing a leading presence in that market and a platform for our further expansion into Asia. We also added host broadcasting capabilities to our suite of services, which we expect to leveraged across the NEP worldwide network.
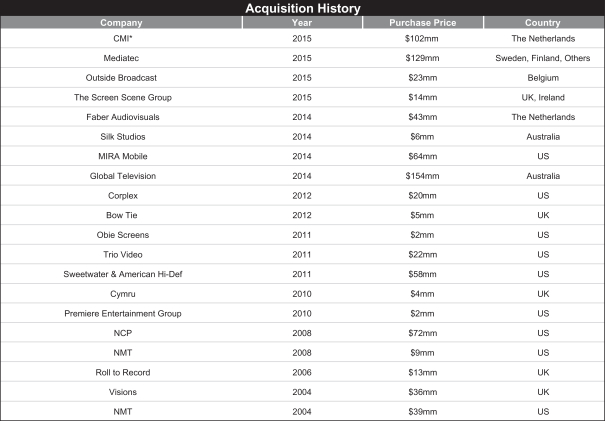
| * | Pending acquisition; expected to close in the third quarter of 2015, subject to certain closing conditions. The purchase price is approximate and subject to adjustment. |
103
Table of Contents
Competition
We compete in three primary geographies: the United States, Europe and Australia, servicing the sports, entertainment and other live events markets. These events for leading broadcasters, cable networks and producers can be highly technical and complex, necessitating the highest level of service, reputation and reliability. We compete primarily against F&F Productions, Game Creek Video, Lyon Video and Mobile Television Group in the United States; Gearhouse Broadcast in Australia; CTV Outside Broadcasts and Telegenic in the U.K.; AMP Visuals, Euro Media Group, Mediapro Group and Top Vision in Continental Europe. In those international markets where we do not currently have an established footprint, we can sometimes face significant barriers to entry from locally entrenched competitors, although as clients become increasingly global, local providers with limited expertise have less ability to serve production needs. Based on the high level of outsourcing in our primary geographies, we do not face significant competition from our clients, with the exception of studios and control rooms where many television networks retain in-house capabilities.
Suppliers
We are a large buyer globally of specialized technical equipment utilized in the broadcasting and production services industry, such as HD cameras, lenses, audio boards, recording devices and LCD screens. Unlike other mobile broadcast industry participants, we assemble the majority of our mobile units in-house, thus shortening signing to delivery and ensuring start-to-finish quality control. No single supplier’s annual spending represents greater than 10% of capital expenditures and we are typically protected from supply chain risk through the availability of dual sources.
Legal Proceedings
We have had no material legal proceedings in the last five years. However, we are subject to various legal proceedings and claims that arise in the ordinary course of business. The outcome of legal proceedings and claims brought against us is subject to significant uncertainty. If one or more legal matters were resolved against us in a reporting period for amounts in excess of management’s expectations, our consolidated financial statements for that reporting period could be materially adversely affected.
Environmental
Our business is not subject to any material impact from environmental laws or regulations.
Properties
As of April 30, 2015, we did not own any material real property. The table below provides a list of our principal leased properties. The office leases have an average remaining term of 12.8 years. We expect these offices will continue to be adequate for the administration of our business for the foreseeable future. In addition, we lease technical studios in New York City and Australia. Please see “—Our Solutions—Studio Production—Studios.”
Offices
| Country |
Address | |
| USA |
2 Beta Drive, Pittsburgh, Pennsylvania 15238 | |
| United Kingdom |
The Cube, Downmill Road, Bracknell, Berkshire, RG12 1QS | |
| Australia |
8 Central Avenue, Eveleigh NSW 2015 |
104
Table of Contents
Directors and Executive Officers
The following table sets forth the names, ages and titles of our directors and executive officers as of June 26, 2015:
| Name |
Age | Title | ||||
| Kevin Rabbitt |
43 | Chief Executive Officer and Director | ||||
| Gerald Delon |
44 | Chief Financial Officer | ||||
| Keith Andrews |
55 | President and Chief Operating Officer | ||||
| Carrie Galvin |
41 | Chief Strategy Officer and Head of Investor Relations | ||||
| Jeffrey Marcus |
68 | Chairman of the Board | ||||
| Debra Honkus |
61 | Founder, Chairman Emeritus and Executive Director | ||||
| Brian Cassidy |
41 | Director | ||||
| Katherine Chung |
38 | Director | ||||
| Howard Liszt |
68 | Director | ||||
| Mark Patricof |
50 | Director | ||||
| Hank Ratner |
56 | Director | ||||
| Kenneth Schanzer |
70 | Director | ||||
The following table sets forth information regarding other key employees as of June 26, 2015:
| Name |
Age | Title | ||||
| Alan Burns |
51 | Managing Director, Screen Scene Group | ||||
| Ronald Drews |
52 | Vice President, Sweetwater | ||||
| Cees Faber |
45 | President, Faber Audiovisuals | ||||
| Kevin Hayes |
65 | Vice President, Entertainment Mobile Units/Denali | ||||
| Paul Henriksen |
47 | Managing Director, Mediatec Broadcast | ||||
| George Hoover |
65 | Chief Technology Officer | ||||
| Stephen Jenkins |
44 | President, NEP UK & Ireland | ||||
| Barry Katz |
61 | Senior Vice President, NEP Studios & Control Rooms | ||||
| Timo Koch |
49 | Managing Director, Outside Broadcast | ||||
| Glen Levine |
53 | Co-President, Mobile Units USA | ||||
| Dean Naccarato |
44 | General Counsel and Secretary | ||||
| Daniel O’Bryen |
63 | President, Screenworks | ||||
| Kenneth Paterson |
56 | Managing Director, Mediatec Solutions | ||||
| Soames Treffry |
44 | President, NEP Australia | ||||
| Michael Werteen |
52 | Co-President, Mobile Units USA | ||||
| Lynda Wilkes |
55 | Senior Vice President, Human Resources | ||||
Set forth below is the description of the backgrounds of our directors, executive officers and other key employees.
Kevin Rabbitt. Kevin Rabbitt has served as our Chief Executive Officer since January 2012, and a member of our Board of Directors since our inception in December 2012. Prior to joining us, Mr. Rabbitt served as Chief Executive Officer of 3 Day Blinds, a manufacturer and multi-channel retailer of custom window coverings, from April 2010 until January 2012. From August 2002 until September 2009, Mr. Rabbitt worked for GES Exposition Services, a leading producer of face-to-face events and expositions. Mr. Rabbitt started as Vice President of National Operations progressively advancing in the organization to EVP of Products & Services, Chief Operating Officer, and then as President & Chief Executive Officer starting in January 2006. Prior to that, Mr. Rabbitt was a consultant with Bain & Company. Mr. Rabbitt holds a B.A. from Rice University and a M.B.A. from Harvard Business School. Mr. Rabbitt’s knowledge of our Company and the industry, in addition to his experience running multiple businesses make him well-suited to serve on our Board of Directors.
105
Table of Contents
Gerald Delon. Gerald Delon has served as our Chief Financial Officer since 2008. Mr. Delon joined NEP in 2004 as our Corporate Controller. In 2007, Mr. Delon was appointed Vice President of Planning & Logistics, a role in which he was responsible for managing the day-to-day operations and logistics of the Company, including oversight of scheduling, event coordination, travel and equipment, and field shop activity. Prior to his tenure at NEP, Mr. Delon served as the Corporate Controller for several private equity companies in the Pittsburgh region including Stargate Industries, LLC from 1999 to 2001, PrintCafe, Inc. from 2001 to 2003 and Chromalox, Inc. from 2003 to 2004. He served as an auditor for Ernst & Young, LLP where he worked from 1996 until 1999. He received his M.B.A. from the Joseph M. Katz Graduate School of Business at the University of Pittsburgh and a B.A. from Robert Morris College in Accounting.
Keith Andrews. Keith Andrews was promoted to the position of President and Chief Operating Officer of the Company in April 2015. Mr. Andrews previously served as Chief Executive Officer of Global Television (GTV), now NEP Australia, since April 2010 which we acquired in January 2014. Prior to joining GTV, Mr. Andrews provided management services to various companies, including Chief Executive Officer of Viewlocity Technologies from October 2009 to April 2010, a company that provides software that enhances supply chain visibility for major companies around the world. From June 2008 to October 2009. Mr. Andrews was also interim CEO to Advanced Vehicle Technologies, a company which developed and patented a method of converting the use of diesel in heavy haul trucks to liquefied petroleum gas. Mr. Andrews was also Chief Executive Officer of Integrated Research, a Software company listed on the Australian Stock Exchange, from November 2004 to October 2006. Mr. Andrews received a degree in Business from Queensland University of Technology.
Carrie Galvin. Carrie Galvin has been working with NEP since May 2012 and has served as our Chief Strategy Officer and Head of Investor Relations since June 2015. She previously served as SVP of Strategy and Business Development since January 2013. In her role, Ms. Galvin is responsible for the Company’s growth strategy and international expansion projects. She oversees marketing and public relations, and provides internal consulting and analytics assistance on strategic projects across all business units worldwide. Prior to joining us, Ms. Galvin was an independent consultant to and then the SVP of Business Development for 3 Day Blinds from June 2010 to April 2012. Prior, Ms. Galvin was a Strategy Consultant for Bain & Company from July 2005 to November 2009 where she focused on growth strategy, organizational redesign and merger integration for numerous Fortune 100 companies. Ms. Galvin earned a B.S. in Business Administration from the University of Southern California, as well as a M.B.A. with Distinction from Harvard Business School. She has 10 years of experience working in strategy and business development roles.
Jeffrey Marcus. Jeff Marcus serves as chairman of our board of directors and has served as a director of our board of directors since our inception in December 2012. Mr. Marcus joined Crestview Partners, a private equity firm, in 2004, and currently serves as head of Crestview’s media and communications strategy. Prior to joining Crestview Partners, Mr. Marcus served in various positions in the media and communications industry, including as President and Chief Executive Officer of AMFM Inc. (formerly Chancellor Media Corporation), one of the nation’s largest radio broadcasting companies, and as founder and chief executive officer of Marcus Cable Company, a privately-held cable company. Mr. Marcus is currently a director and chairman of the board of Cumulus Media and a director of CWGS Enterprises. In the last five years, Mr. Marcus also served as a director of Charter Communications, Insight Communications, OneLink Communications and DS Services of America. Mr. Marcus was selected to serve on our board of directors in recognition of his extensive experience serving as a director of numerous public and private companies as well as his operating experience as a CEO in the cable television, broadcast and outdoor industries. His long business career is an invaluable asset from a strategic and operational perspective. He has served as a director for seven of Crestview Partners’ portfolio companies. Further, his experience as a private equity investor provides us with valuable insight regarding acquisitions, debt financings, equity financings and public market sentiment.
Debra Honkus. Debra Honkus is a founder of NEP, currently serves as our Executive Director and has served on the board of directors since our inception in 2012. Ms. Honkus previously served as Chairman of our
106
Table of Contents
board of directors and, prior to that, held progressive roles with us as Chief Executive Officer, President, Vice President and General Manager since January 1988. She was the General Manager of Total Communications Systems (TCS) from 1978 until its merger to create NEP. Ms. Honkus has received numerous awards, accolades and recognition, including five Sports Emmys in 1992, 1993, 1995, 1996 and 2010. In 2011, Ms. Honkus was inducted into the Sports Broadcasting Hall of Fame, received the E&Y Entrepreneur of the Year Award and the Broadcasting & Cable Women in the Game Award. In 2012, Ms. Honkus was the recipient of the Goldman Sachs 100 Most Intriguing Entrepreneurs, the Pittsburgh Business Times Women in Business Award, and the Broadcasting & Cable Technology Leadership Award. We believe Ms. Honkus’ in-depth knowledge and well-known reputation in the industry make her uniquely qualified to serve on our board of directors.
Brian Cassidy. Brian Cassidy has served as a director since our inception in December 2012. Mr. Cassidy is a Partner at Crestview Partners, a private equity firm, having joined in 2004. He is a leader of Crestview’s media investment strategy. Mr. Cassidy is currently a director of CWGS Enterprises, Cumulus Media and Interoute Communications. Mr. Cassidy previously served as a director of OneLink Communications and ValueOptions, and was also involved with Crestview’s investments in Charter Communications and Insight Communications. Prior to joining Crestview, Mr. Cassidy worked in private equity at Boston Ventures, where he invested in companies in the media and communications, entertainment and business services industries. He also worked for one year as the acting CFO of one of their portfolio companies. Mr. Cassidy was also an investment banking analyst at Alex. Brown & Sons, where he completed a range of financing and M&A assignments for companies in the consumer and business services sectors. Mr. Cassidy received an M.B.A. from the Stanford Graduate School of Business, where he was an Arjay Miller Scholar, and an A.B. in Physics from Harvard College. Mr. Cassidy was selected to serve on our board of directors because of his investment and company oversight experience in the media industry. His background in private equity also provides our board of directors with integral knowledge with respect to acquisitions, debt financings and equity financings.
Katherine Chung. Katherine Chung has served as a director on our board of directors since March 2013. Ms. Chung is a Principal at Crestview Partners. Prior to joining Crestview in 2009, Ms. Chung was a Principal in private equity at The Blackstone Group. Prior to joining The Blackstone Group in 2005, Ms. Chung was an Associate at Capital Z Partners, a financial services focused fund, and an Analyst in the financial institutions group at Morgan Stanley. Ms. Chung is a board observer for Fidelis Insurance Holdings Limited, and previously served on the boards of directors of DS Services of America (a former Crestview portfolio company), Alliant Insurance Holdings and Gold Toe Moretz. Ms. Chung received her M.B.A. from the Wharton School where she was awarded a Joseph Wharton Fellowship and received an undergraduate degree in economics from the Johns Hopkins University. Ms. Chung was selected to serve on our board of directors because of her expertise overseeing Crestview Partners’ portfolio companies and her experience as a director of numerous companies. Her experience with private equity markets provides our board of directors integral knowledge with respect to acquisitions, debt financings and equity financings.
Howard Liszt. Howard Liszt joined our board of directors in July 2015. From 1994 until his retirement in 2001, Mr. Liszt was the Chief Executive Officer for Campbell Mithun, a national marketing communications agency he joined in 1976. Under his leadership, Campbell Mithun grew to become a top 15 international advertising firm with a diverse client roster of leading national and international brands. Mr. Liszt began his career in marketing management at Green Giant Company where he became the Director of Branded Foods and New Products. He was named the Silver Medal Award winner by the American Advertising Federation in 2000, and he spent eight years as Director of the American Association of Advertising Agencies. A graduate of the University of Minnesota, Minneapolis with a B.A. in Journalism and Marketing and a M.S. in Marketing, Mr. Liszt was a Senior Fellow at the University’s School of Journalism and Mass Communications from 2001 through 2012 and was awarded the University’s Alumni Award of Excellence in 2007. His charitable activities include work with the National Easter Seals Society, the Boys and Girls Club and the St. Paul Chamber Orchestra.
Mark Patricof. Mark Patricof has been a member of our board of directors since March 2013. Mr. Patricof was co-founder and managing partner of MESA Securities, a licensed broker-dealer investment bank focused on
107
Table of Contents
media and entertainment that was recently acquired by Houlihan Lokey. Mr. Patricof now serves as co-head of Houlihan Lokey’s Technology, Media & Telecommunications Group. Prior to joining MESA Securities, in 1996 Mark co-founded <kpe>, a renowned provider of digital solutions for media and entertainment companies, and served as its Chief Executive Officer. <kpe> guided clients including CBS, Sony and Viacom on the development of their earliest digital initiatives. In partnership with Grey Advertising, the Endeavor Agency (now WME) and Wasserstein Perella, <kpe> also invested in over 20 early stage digital media companies. From 1995 until 1996, Mr. Patricof served as Head of Business Affairs for The Voyager Company, a multimedia publishing company. Mr. Patricof is a member of the boards of directors of Rockwell Group Europe, New York Cruise Lines and serves as Chairman of the Board of New Heights. Mr. Patricof received a B.A. from Emory University. Mr. Patricof’s media background and venture capital experience provides our board of directors with valuable insight regarding acquisitions and the debt and equity capital markets.
Hank Ratner. Hank Ratner joined our board of directors in June 2015. Mr. Ratner has been employed with Cablevision Systems Corporation and its subsidiaries for thirty years. In his current role as Vice Chairman for Cablevision, he oversees major business partnerships and has guided the company through strategic transactions including the spin-offs of Rainbow Media (now AMC Networks) and The Madison Square Garden Company (MSG) where he served as president and chief executive officer from 2009 through 2014. Mr. Ratner spent 15 years at Rainbow Media where he held numerous leadership roles including chief operating officer. He is a board member and prior chairman of the Garden of Dreams Foundation, a nonprofit that works with MSG to positively impact the lives of children facing obstacles. Prior to working in the media, entertainment and telecommunications industries, Mr. Ratner was an associate with the law firm of Sullivan & Cromwell. He received a bachelor’s degree and doctorate of law with distinction from Emory University. Mr. Ratner was selected to serve on our board of directors because of his leadership experience developed while serving in several executive positions and extensive background in the industry.
Kenneth Schanzer. Kenneth Schanzer has been a member of our board of directors since March 2013. Mr. Schanzer served as president of NBC Sports from June 1998 until his retirement in September 2011. He also served as Chief Operating Officer and was responsible for supervising the day-to-day operation of the division. Mr. Schanzer began his career at NBC Sports in 1981 as Vice President, Talent and Program Negotiations and was appointed as Executive Vice President in 1983. In 1993, he served as the President and CEO of The Baseball Network, a joint venture among Major League Baseball, ABC and NBC. The Baseball Network oversaw the marketing, television sales and television production for the joint venture partners. Mr. Schanzer then returned to NBC Sports as Executive Vice President in 1995. Before joining NBC Sports, he served eight months as Senior Vice President, government relations for the National Association of Broadcasters. Mr. Schanzer received a B.A. from Colgate University and a J.D. from Columbia Law School. As a long-time sports executive at NBC, Mr. Schanzer brings extensive industry expertise and a unique, client-oriented perspective to our Board of Directors that is directly applicable to our business.
Alan Burns. Alan Burns serves as Managing Director of the Screen Scene Group of companies based in Republic of Ireland and United Kingdom, an NEP acquired business segment providing film and television post production, satellite uplinks and mobile production units to broadcasters and production companies. Prior to his current role, Mr. Burns was the technical director and founder of Screen Scene. In June 2002 he assumed responsibility for the establishment of the mobile production business supporting television productions such as Six Nations Rugby, The Voice, The Ryder Cup, and Queen Elizabeth’s Second Visit to Ireland. Mr. Burns has been with the Screen Scene Group since its founding 30 years ago.
Ronald Drews. Ronald Drews serves as Vice President of Sweetwater, an acquired business segment providing video display, camera flypack systems, custom control rooms and production trucks to entertainment and corporate clients worldwide. Since March 2005, Mr. Drews has built the television and corporate business for Sweetwater supporting television productions such as American Idol, The Voice, The Grammy Awards, the People’s CHOICE Awards, Rising Star, Who Wants to be a Millionaire, Jimmy Kimmel Show and more. From 1987 until 1992, Mr. Drews worked with projection systems, designing and installing the first training rooms at the new Apple Computer campus, as well as Visa, Oracle, Sun Micro Systems. He also designed and installed
108
Table of Contents
war rooms, simulators, monitoring and tracking systems at McClellan air force base, Navy, Coast Guard, as well as for the Top Gun training facility in Fallon Nevada. Mr. Drews attended business school at Colorado University and has spent his career in the display and projection business.
Cees Faber. Cees Faber is President of Faber Audiovisuals, a business acquired by NEP in December 2014. Faber Audiovisuals is a third generation family business which Mr. Faber took over in 2003. Mr. Faber started his career in the audiovisual industry at JVR (Jongenelen Video Roosendaal) in 1992 where he worked as an account manager, and later in 1995 became an independent agent for Jongenelen. From 2000, Mr. Faber served as a sales agent for Mitsubishi Diamond Vision England until he assumed leadership of the family audio business in 2003. He grew the company into Continental Europe and acquired the LED rental division of Mitsubushi Diamond Vision. Faber Audiovisuals has supported prestigious projects for television, sports, corporate and entertainment projects such as The Voice of Holland, Formula 1 and Red Bull Airraces.
Kevin Hayes. Kevin Hayes, who serves as the Vice President of our Entertainment Mobile Units group, joined us in May of 2000 with acquisition of two Unitel Mobile Video units and the formation of a division known as Denali. Previously, Mr. Hayes was the Vice President of Sales with Unitel from February 1995, the Vice President of Sales and Operations for Greene, Crowe & Co. from February 1981, and Sales and Operations Manager with Orange Coast Video from January 1979. Mr. Hayes earned his B.S. in Management from the Rensselaer Polytechnic Institute. He is a member of the Television Academy and has 35 years of experience in the entertainment production industry.
Paul Henriksen. Paul Henriksen serves as Managing Director, Mediatec Broadcast, a recently acquired addition to NEP. Having joined Mediatec Group nearly 30 years ago as a camera operator/technician, Mr. Henriksen advanced through the Norwegian part of the business until eventually assuming responsibility as President for the Broadcast operation in 2007. Having spent his entire career in the industry, Mr. Hendriksen also holds a degree in computer science.
George Hoover. George Hoover has served as our Chief Technology Officer since June 2007, having joined us as Director of Engineering in May 1993. Prior, Mr. Hoover was General Manager of the New Jersey Public Broadcasting Authority from 1981 to 1993. Mr. Hoover has earned three Emmy awards, two as Technical Supervisor (1996 Olympics, ESPN NASCAR) and as one a Producer of Phillip Morris Super Bands series for PBS. In recognition of his achievements, innovations and contributions to the industry, Broadcasting & Cable, recognized him as a visionary at their 2009 Technology Leadership Awards, and in 2011, he was inducted into the Sports Broadcasting Hall of Fame. In 2012, Mr. Hoover was named a Fellow in the Society of Motion Picture and Television Engineers (SMPTE). He attended Florida State University studying Communications and Technical Theatre. Mr. Hoover is a member of the Academy of Television Arts and Sciences, and an Allied Member of the American Institute of Architects. Along with Jim Boston, he is co-author of the first and second edition of TV On Wheels, the Story of Remote Television Production. Mr. Hoover has over 45 years of experience in television, motion picture, theatrical design and remote broadcasting.
Stephen Jenkins. Stephen Jenkins serves as President, NEP United Kingdom & Ireland, having managing our U.K. division since January 2009. In February 2015, Mr. Jenkins assumed oversight responsibility for the Ireland based operations of the newly acquired Screen Scene Group. In February 2015, Mr. Jenkins assumed oversight responsibility for the Ireland-based operations of the newly-acquired Screen Scene Group. Mr. Jenkins has spent the majority of his career in broadcasting, beginning at Outside Broadcasting as a junior technical engineer in 1993 and then as a freelance production manager for Sky Sports just before joining Visions Ltd. as a technical unit manager in 1997. He became Commercial Director & Senior Unit Manager of Visions Ltd. in 2003, and in that capacity, he negotiated and delivered a number of major events, including Test Match Cricket and host facilities for the 2006 FIFA World Cup. We acquired Roll to Record in 2006, and Mr. Jenkins was appointed Managing Director in the same year and served until Roll to Record was merged into NEP Visions in 2014.
Barry Katz. Barry Katz, Senior Vice President, joined us in January 2004 and leads the NEP Studios division where he is responsible for the overall management and operation of independent television studios in
109
Table of Contents
New York City and Los Angeles. Prior to joining us, Mr. Katz held senior sales positions at All Mobile Video from June 2002, the National Video Center from September 1999, and at Unitel New York from September 1997. Prior to that, Mr. Katz was General Manager of Bexel – New York from August 1992. Mr. Katz is a member of the Television Academy of Arts and Sciences and serves on the Queens College Business Advisory Board. He received his B.A. from Queens College and his M.A. from Brooklyn College, and was an adjunct faculty member at Long Island’s CW Post College for many years. Mr. Katz has nearly 40 years of experience in the broadcasting industry.
Timo Koch. Timo Koch has served as Managing Director of Outside Broadcast, a newly acquired entity of NEP, since 2006. Mr. Koch joined the company in 2002 as commercial manager responsible for the development of Outside Broadcast’s international growth in HDTV production, an area in which Outside Broadcast was a European pioneer at the time. Mr. Koch began his professional career in 1989 with the start-up of a Belgian television production company, VTP/Media Lounge. This production company went on to become an important media group with various activity domains in television production and studio operations. Mr. Koch has over 25 years’ experience in the industry.
Glen Levine. Glen Levine has served as Co-President of our Mobile Units USA division since February, 2014. Prior from September 2001, Mr. Levine was Vice President of Mobile Engineering and Operations, where he was responsible for nearly every aspect of mobile production. Previously, he served as Director of Engineering from July 2000, where he hired, trained and assigned our mobile unit engineers, engineering managers and other field staff. Mr. Levine previously served from December 1998 as General Manager for Unitel prior to our acquisition of this company in July 2000. Mr. Levine has over 33 years of experience in the mobile production industry.
Dean Naccarato. Dean Naccarato has served as our General Counsel and Secretary since March 2013. Prior to joining us, Dean worked for the law firm of Cohen & Grigsby in Pittsburgh, Pa. from January 2002, first as an associate and then as a partner. Prior to that, Dean was an associate with K&L Gates in Pittsburgh from August 1997. Mr. Naccarato is a cum laude graduate of Allegheny College, and received his J.D., cum laude from the Southern Methodist University School of Law. In addition, he has received a L.L.M. in taxation from the New York University School of Law.
Daniel O’Bryen. Daniel O’Bryen serves as President of Screenworks, a division supplying broadcast cameras systems and led video screens for sports, live entertainment events and touring artists. Mr. O’Bryen joined NEP in 2002 with the acquisition of BCC Video and its successor Live Media Group, a company he co-founded in 1989. He has spent his 43 year career in the entertainment and video business as a producer, director, lighting director and production manager. Prior to the creation of BCC Video, Mr. O’Bryen was the Head of Productions for Avalon Attractions between 1981 through 1994. He has significant experience producing and touring with an impressive list of acts including The Rolling Stones, Billy Joel, Barbra Streisand, Jimmy Buffet, Shakira, Eric Clapton, Madonna and Kenny Chesney among many others.
Kenneth Paterson. Kenneth Paterson serves as Managing Director of Mediatec Solutions, an acquired business supplying video display including mobile LED units, camera systems, lighting and turnkey live event solutions for the corporate, sports and entertainment industries. Mr. Paterson founded Mediatec Group in 2007. Having spent 34 years in the industry, he began his career as the founder and owner of a local Audio Retail Shop in Kungalv, Sweden. Mr. Paterson has served as the regional agent for Sony Professional, supporting both sales and installation in many of Sweden’s post production and video studios. Mr. Paterson has been a supplier to such major events as Formula One worldwide, eight Olympic Games, seven Eurovision Song Contests and all Global Car Shows for Volvo Worldwide for over 15 years. Mr. Paterson studied law at the University of Gothenburg.
Soames Treffry. Soames Treffry joined NEP with the acquisition of Global Television (now NEP Australia) in January 2014. Mr. Treffry was promoted to the role of President, NEP Australia in April 2015, having previously held the position of Director of Television and Commercial since joining Global Television in 2012. He began his
110
Table of Contents
career at FOX SPORTS Australia, spending 16 years in live and special event television. He chaired the launch of Australia’s first 24-hour sports news channel, FOX SPORTS News and ultimately held the position of Director of FOX SPORTS Channels. Mr. Treffry holds a Bachelor of Applied Science, Land Economics, from the University of Technology Sydney. Mr. Treffry has over 20 years of experience in the industry.
Mike Werteen. Mike Werteen has served as Co-President of our Mobile Units USA division since February 2014. From January 2008 to January 2014, Mr. Werteen was the Senior Vice President of Sales and Client Services, overseeing all sales initiatives for our domestic operations. From May 2005 to January 2008, Mr. Werteen was a General Manager at New Century Productions, which we acquired in 2008. Previously, Mr. Werteen oversaw sales for New Century Productions from February 1997 to May 2005. Mr. Werteen graduated from Kutztown University with a B.S. in Telecommunications. He has 30 years of experience in the remote broadcasting industry.
Lynda Wilkes. Lynda Wilkes has served as our Senior Vice President of Human Resources since April 2013. Prior to joining NEP, Ms. Wilkes was the Vice President of Human Resources Services at Education Management Corporation from May 2008. Previously, Ms. Wilkes was a Human Resources Business Partner at Philips Respironics from May 2005. Her career also includes HR leadership roles with SCA Packaging NA, ADVO/Vilassis, Allegheny General Hospital and Dollar Bank. Ms. Wilkes holds a B.A. in Consumer Services from Indiana University of Pennsylvania and a M.A. in Human Resources/ Industrial Relations from St. Francis College. She is a Past President of the Pittsburgh Human Resources Association and received a Senior Professional in Human Resources certification from the HR Certification Institute and certification as a SHRM-SCP from the Society for Human Resource Management. Ms. Wilkes has over 30 years of experience.
Board of Directors
Our board of directors currently consists of nine members, Mses. Honkus and Chung and Messrs. Rabbitt, Cassidy, Liszt, Marcus, Patricof, Ratner and Schanzer. The board of directors reviewed the independence of our directors using the independence standards of the NYSE and, based on this review, determined that Messrs. Liszt, Patricof, Ratner and Schanzer are independent within the meaning of the NYSE listing standards currently in effect, and Messrs. Liszt, Ratner and Schanzer are independent within the meaning of 10A-3 of the Exchange Act. In connection with this offering, we expect to enter into a stockholders agreement with funds managed by Crestview and other legacy stockholders. Under the stockholders agreement, Crestview will have the right, as long as it and its affiliates hold (i) at least 50% of our issued and outstanding common stock, to nominate 50% of our board of directors, (ii) less than 50% but greater than or equal to 35% of our issued and outstanding common stock, to nominate 40% of our board of directors, (iii) less than 35% but greater than or equal to 20% of our issued and outstanding common stock, to nominate 30% of our board of directors, (iv) less than 20% but greater than or equal to 10% of our issued and outstanding common stock, to nominate 20% of our board of directors or (v) less than 10% but greater than or equal to 5% of our issued and outstanding common stock, to nominate 10% of our board of directors. For so long as Crestview and its affiliates hold at least 30% of our issued and outstanding common stock, Crestview shall have the right to appoint any director as the Chairman of our board of directors. In addition, Crestview shall have the right to have a representative appointed to serve on each committee of our board of directors so long as Crestview has the right to nominate members to our board of directors, subject to applicable securities laws, rules of the NYSE and other governance rules. See “Certain Relationships and Related Party Transactions—Other Transactions with Affiliates—Stockholders Agreement.”
In evaluating director candidates, we will assess whether a candidate possesses the integrity, judgment, knowledge, experience, skills and expertise that are likely to enhance the board’s ability to manage and direct our affairs and business, including, when applicable, to enhance the ability of the committees of the board to fulfill their duties. We currently are in the process of identifying individuals who meet these standards and the relevant independence requirements. Our directors hold office until the earlier of their death, resignation, retirement, disqualification or removal or until their successors have been duly elected and qualified.
111
Table of Contents
In connection with the completion of this offering, our directors will be divided into three classes serving staggered three-year terms. Class I, Class II and Class III directors will serve until our annual meetings of stockholders in 2016, 2017 and 2018, respectively. We anticipate that Messrs. Cassidy, Patricof and Schanzer will be assigned to Class I, Messrs. Liszt, Ratner and Ms. Chung will be assigned to Class II and Messrs. Marcus, Rabbitt and Ms. Honkus will be assigned to Class III. At each annual meeting of stockholders held after the initial classification, directors will be elected to succeed the class of directors whose terms have expired. This classification of our board of directors could have the effect of increasing the length of time necessary to change the composition of a majority of the board of directors. In general, at least two annual meetings of stockholders will be necessary for stockholders to effect a change in a majority of the members of the board of directors.
Status as a Controlled Company
Because affiliates of Crestview Partners II GP, L.P. will own a majority of our outstanding common stock following the completion of this offering, we expect to be a controlled company under NYSE corporate governance standards. A controlled company need not comply with NYSE corporate governance rules that require its board of directors to have a majority of independent directors and independent compensation and nominating and governance committees.
Committees of the Board of Directors
Upon the completion of this offering, we intend to have an audit committee and a compensation committee of our board of directors, and may have such other committees as the board of directors shall determine from time to time. We anticipate that each of the standing committees of the board of directors will have the composition and responsibilities described below.
Audit Committee
We will establish an audit committee prior to the completion of this offering. Our audit committee will initially consist of Mr. Ratner (Chairman), Mr. Schanzer, Mr. Liszt and Ms. Chung. As required by the rules of the SEC and listing standards of the NYSE , the audit committee will consist solely of independent directors within one year of the date of the effectiveness of the registration statement of which this prospectus is a part and the listing of our common stock, respectively. SEC rules also require that a public company disclose whether or not its audit committee has an “audit committee financial expert” as a member. An “audit committee financial expert” is defined as a person who, based on his or her experience, possesses the attributes outlined in such rules. The Board has determined that Hank Ratner qualifies as an “audit committee financial expert.”
This committee will oversee, review, act on and report on various auditing and accounting matters to our board of directors, including: the selection of our independent accountants, the scope of our annual audits, fees to be paid to the independent accountants, the performance of our independent accountants and our accounting practices. In addition, the audit committee will oversee our compliance programs relating to legal and regulatory requirements. We expect to adopt an audit committee charter defining the committee’s primary duties in a manner consistent with the rules of the SEC and applicable stock exchange or market standards.
Compensation Committee
Because we will be a controlled company within the meaning of the NYSE corporate governance standards, we will not be required to have a compensation committee composed entirely of independent directors. However, we expect that we will have a compensation committee following the completion of this offering. This committee will establish salaries, incentives and other forms of compensation for officers and other employees. Our compensation committee will also administer our incentive compensation and benefit plans. We expect to adopt a compensation committee charter defining the committee’s primary duties in a manner consistent with the rules of the SEC and applicable stock exchange or market standards. Our compensation committee will initially consist of Mr. Cassidy (Chairman), Ms. Honkus and Mr. Patricof.
112
Table of Contents
Compensation Committee Interlocks and Insider Participation
None of our executive officers serve on the board of directors or compensation committee of a company that has an executive officer that serves on our board or compensation committee. No member of our board is an executive officer of a company in which one of our executive officers serves as a member of the board of directors or compensation committee of that company.
Code of Business Conduct and Ethics
Prior to the completion of this offering, our board of directors will adopt a code of business conduct and ethics applicable to our employees, directors and officers, in accordance with applicable U.S. federal securities laws and the corporate governance rules of the NYSE. Any waiver of this code may be made only by our board of directors and will be promptly disclosed as required by applicable United States federal securities laws and the corporate governance rules of the NYSE.
Corporate Governance Guidelines
Prior to the completion of this offering, our board of directors will adopt corporate governance guidelines in accordance with the corporate governance rules of the NYSE.
113
Table of Contents
2014 Summary Compensation Table
The following table summarizes the compensation awarded to, earned by or paid to our principal executive officer and our next two most highly-compensated executive officers (our “Named Executive Officers”) for the fiscal years ended December 31, 2014 and 2013.
| Name and Principal Position |
Year | Salary ($) |
Option Awards ($) (1) |
Non-Equity Incentive Plan Compensation ($) (2) |
All Other Compensation ($) (3) |
Total ($) |
||||||||||||||||||
| Kevin Rabbitt, |
2014 | $ | 412,000 | — | $ | 430,000 | $ | 5,200 | $ | 847,200 | ||||||||||||||
| 2013 | $ | 400,000 | $ | 2,457,680 | $ | 360,000 | $ | 7,650 | $ | 3,225,330 | ||||||||||||||
| Gerald Delon, |
2014 | $ | 309,000 | — | $ | 258,000 | $ | 5,200 | $ | 572,200 | ||||||||||||||
| 2013 | $ | 300,000 | $ | 1,340,823 | $ | 216,000 | $ | 7,650 | $ | 1,864,473 | ||||||||||||||
| Debra Honkus, |
2014 | $ | 306,000 | — | $ | 263,160 | $ | 5,200 | $ | 574,360 | ||||||||||||||
| 2013 | $ | 300,000 | $ | 446,941 | $ | 216,000 | $ | 7,650 | $ | 970,591 | ||||||||||||||
| (1) | Amounts reported in the “Option Awards” column for 2013 reflect the aggregate grant date fair value, computed in accordance with FASB ASC Topic 718, of stock option awards made to each Named Executive Officer during fiscal year 2013. Pursuant to SEC rules, the amounts shown exclude the effect of estimated forfeitures. See Note 13—Share-Based Compensation in Part I of the Notes to the audited Consolidated Financial Statements included elsewhere in this prospectus for additional detail regarding assumptions underlying the value of these stock option awards. We did not grant any stock options or other equity awards to our Named Executive Officers during 2014. |
| (2) | Amounts reported in the “Non-Equity Incentive Plan” column reflect the total earned pursuant to our annual cash incentive program for services provided in the fiscal year indicated. Annual cash incentive bonuses are paid in the first quarter following the year for which they are earned. |
| (3) | Amounts reported in the “All Other Compensation” column represent our matching contribution to each Named Executive Officer’s account under our 401(k) plan. |
Narrative Disclosure to Summary Compensation Table
Prior Employment Agreements
Ms. Honkus is not a party to an employment agreement with us. We have previously entered into an employment agreement with each of Messrs. Rabbitt and Delon (the “Employment Agreements”). Each Employment Agreement has an initial period of approximately one year that automatically renews for successive one year periods until terminated by either party in writing at least 60 days prior to the renewal date. The Employment Agreements provide that Messrs. Rabbitt and Delon will receive annual base salaries equal to $400,000 and $300,000, respectively, subject to annual review by our board of directors. The Employment Agreements also provide the executives with the right to participate in employee benefit plans and programs for which our senior executives and the executives of our subsidiaries are generally eligible. The maximum annual bonus enumerated in the Employment Agreements for Mr. Rabbitt is $500,000 and for Mr. Delon is $300,000. The Employment Agreements provide that Messrs. Rabbitt and Delon may not compete with us or our subsidiaries for a period of two years following the termination of their employment. The Employment Agreements also include restrictive covenants providing that the executives may not disclose or use work product or confidential information relating to us or any of our subsidiaries during the period of their employment or any time thereafter and that anything that relates to us or any of our subsidiaries that was conceived, developed, or created by the executives while employed or during the term of their non-competition obligation belongs in all
114
Table of Contents
instances to us. The Employment Agreements also provide that Messrs. Rabbitt and Delon will receive severance payments under certain circumstances. For more information about those potential payments please see the section below entitled “—Additional Narrative Disclosure—Potential Payments Upon Termination or Change in Control.”
New Employment Agreements
Effective as of June 2015, we entered into new employment agreements with each of Messrs. Rabbitt and Delon (the “New Employment Agreements”). Each New Empoyment Agreement has an initial period of three years from the effective date that automatically renews for successive one-year periods unless terminated by either party in writing at least 60 days prior to the renewal date. The New Employment Agreements provide that Messrs. Rabbitt and Delon will receive annual base salaries equal to $500,000 and $359,000, respectively, subject to annual review by our board of directors. The executives may also participate in employee benefit plans and programs for which our senior executives are generally eligible. The New Employment Agreements provide that Messrs. Rabbitt and Delon will be eligible to receive a target annual bonus of $500,000 and $300,000, respectively, contingent in each case upon the criteria established by our board of directors for each year. Further, the New Agreements note that in connection with the closing of this offering Messrs. Rabbitt and Delon will receive an award of restricted stock granted under our LTIP (as defined below), equal in value to approximately $1,000,000 and $400,000, respectively, which will vest in three equal installments on the first three anniversaries of the date of grant. Consistent with the Employment Agreements, the New Employment Agreements provide that Messrs. Rabbitt and Delon may not compete with us or our subsidiaries for a period of two years following the termination of their employment for any reason. The New Employment Agreements also include restrictive covenants providing that the executive may not disclose or use work product or confidential information relating to us or any of our subsidiaries during the period of their employment or anytime thereafter and anything that relates to us or any of our subsidiaries that was conceived, developed, or created by the executives while employed or during the term of their non-competition agreement belongs in all instances to us. The New Employment Agreements also provide that incentive compensation paid to the executives is subject to forfeiture and/or recovery by us to the extent required by applicable law or required under any policy implemented or maintained by us to comply with the applicable rules of the national securities exchange upon which our securities are listed. Finally, the New Employment Agreements give Messrs. Rabbitt and Delon the right to severance payments under the circumstances described in the section below entitled “—Additional Narrative Disclosure—Potential Payments Upon Termination or Change in Control.”
Base Salary
Each Named Executive Officer’s base salary is a fixed component of compensation for each year for performing specific job duties and functions. Historically, our board of directors has established the annual base salary rate for our Chief Executive Officer and while the base salary levels for each of our other Named Executive Officers has historically been determined by our Chief Executive Officer, in each case, at a level necessary to retain the individual’s services. Our board of directors and our Chief Executive Officer review base salary levels on an annual basis. The board of directors and the Chief Executive Officer, as applicable, have historically made adjustments to the base salary rates of the Named Executive Officers upon consideration of any factors that they deem relevant, including but not limited to: (a) any increase or decrease in the executive’s responsibilities, (b) the executive’s job performance, and (c) the level of compensation paid to executives of other companies with which we compete for executive talent, as estimated based on publicly available information and the experience of members of our board of directors and our Chief Executive Officer.
Annual Bonus
The bonus levels provided in the employment agreements for each of Messrs. Rabbitt and Delon represent both their target bonuses and their maximum bonuses and are as follows: $500,000 for Mr. Rabbitt, $300,000 for Mr. Delon. Ms. Honkus’ target and maximum bonus is established by our Chief Executive Officer, and for 2014 it was $300,000. Our annual bonus awards have historically been subject to the achievement of individual and
115
Table of Contents
company performance goals. For 2014, 30% of each Named Executive Officer’s annual bonus was determined based on individual performance and 70% was determined based on the level of achievement of a pre-established Adjusted EBITDA goal of $145.4 million for the fiscal year.
At the beginning of the year each Named Executive Officer creates a list of personal goals for the year. Our Chief Executive Officer’s goals are reviewed and approved by our board of directors while the individual performance goals for our other Named Executive Officers are reviewed and approved by our Chief Executive Officer. The board of directors also establishes the Adjusted EBITDA goal prior to or at the beginning of the new fiscal year. Following the end of the year, our board of directors determines the extent to which our Chief Executive Officer has achieved his individual performance goals and the Chief Executive Officer determines the extent to which the other Named Executive Offers have achieved their individual performance goals. Once our financial statements for the year have been finalized, the board of directors also determines the extent to which we achieved our Adjusted EBITDA goal for the prior year.
After reviewing the extent to which each Named Executive Officer achieved their individual performance goals, our board of directors and Chief Executive Officer, as applicable, determined that each Named Executive Officer had earned the full 30% of their annual bonus attributable to individual performance for the 2014 fiscal year. Further, after reviewing our final financial statements our board of directors determined that we had achieved 98% of our Adjusted EBITDA goal for 2014, resulting in a payout of 80% of the portion of each Named Executive Officer’s annual bonus attributable to Adjusted EBITDA performance. As such, our actual performance resulted in the payment of a bonus for fiscal year 2014 performance that was equal to 86% of each Named Executive Officer’s target bonus. The total dollar amount paid to each Named Executive Officer as an annual bonus for 2014 is included in the column of the Summary Compensation Table above entitled “Non-Equity Incentive Plan Compensation.”
Pre-IPO Long-Term Incentive Compensation
Each of our Named Executive Officers participates in the NEP Group, Inc. Equity Incentive Plan (“EIP”), under which we may grant stock options, restricted shares and other share-based awards. However, the only type of grant that our Named Executive Officers have received under the EIP is a grant of stock options. Awards under the plan may be granted with respect to 2,478,306 shares and no more than 2,478,306 shares may be delivered with respect to incentive stock options. Shares withheld in payment of the exercise price or taxes relating to an award will not be again available for awards under the EIP. The EIP is administered by our board of directors, or a sub-committee authorized by our board of directors. No awards will be granted under the EIP following this offering.
All stock option awards granted to our Named Executive Officers under the EIP were granted on January 14, 2013 with a term of ten years and an exercise price of $9.75. Each grant vests in five equal installments on the first five anniversaries of January 1, 2013, subject to continued employment through each vesting date. Each grant agreement requires the Named Executive Officer to become a party to the stockholder’s agreement for NEP Group, Inc. For information about the treatment of awards granted under the EIP in the event of a termination of employment or change in control, please see the section below entitled “—Additional Narrative Disclosure—Potential Payments Upon Termination or Change in Control.”
Post-IPO Long-Term Incentive Compensation
NEP Group, Inc. 2015 Long Term Incentive Compensation Plan
Prior to the completion of this offering, we anticipate that our board of directors will adopt a long term incentive plan pursuant to which our employees, consultants and directors (and those of our subsidiaries), including our Named Executive Officers, will be eligible to receive awards. The plan will become effective immediately prior to the consummation of this offering. We anticipate that the long term incentive plan, which we refer to herein as the “LTIP,” will provide for the grant of restricted stock, restricted stock units, stock
116
Table of Contents
options, stock appreciation rights, vested stock awards, dividend equivalents, performance awards, annual incentive awards, cash awards, substitute awards, performance awards, and other stock-based awards intended to align the interests of participants with those of our stockholders. The following description of the LTIP is based on the form we anticipate adopting, but the LTIP has not yet been adopted and the provisions discussed below remain subject to change. As a result, the following description is qualified in its entirety by reference to the final LTIP once adopted.
Administration. We anticipate that the LTIP will be administered by the compensation committee of our board of directors, or the “LTIP Administrator,” with certain decisions subject to approval of our board of directors. The LTIP Administrator will have the authority to, among other things, designate participants under the LTIP, determine the type or types of awards to be granted to a participant, determine the number of shares of our common stock to be covered by awards, determine the terms and conditions applicable to awards and interpret and administer the LTIP. The LTIP Administrator may terminate or amend the LTIP at any time with respect to any shares of our common stock for which a grant has not yet been made. The LTIP Administrator also has the right to alter or amend the LTIP or any part of the LTIP from time to time, including increasing the number of shares of our common stock that may be granted, subject to stockholder approval as required by any exchange upon which our common stock is listed at that time. However, no change in any outstanding grant may be made that would materially and adversely affect the rights of the participant under the award without the consent of the participant.
Number of Shares. Subject to adjustment in the event of any distribution, recapitalization, split, merger, consolidation or similar corporate event, the number of shares available for delivery pursuant to awards granted under the LTIP is 4,758,958 shares of common stock, and such total will be available for the issuance of incentive stock options. There is no limit on the number of awards that may be granted and paid in cash. Shares subject to an award under the LTIP that are canceled, forfeited, exchanged, settled in cash or otherwise terminated without the actual delivery of shares (awards of restricted stock that are forfeited are not considered “delivered shares” for this purpose), will again be available for awards under the LTIP unless prohibited by applicable law. Notwithstanding the foregoing, (i) the number of shares tendered or withheld in payment of any exercise or purchase price of an award or taxes related to an award, (ii) shares that were subject to a stock option or stock appreciation right but were not issued or delivered as a result of the net settlement or net exercise of such stock option or stock appreciation right, and (iii) shares repurchased on the open market with the proceeds of a stock option’s exercise price will not, in each case, be available again for awards under the LTIP. The shares of our common stock to be delivered under the LTIP will be made available from authorized but unissued shares, shares held in treasury, or previously issued shares reacquired by us, including by purchase on the open market.
Individual Limitations on Awards. In each calendar year during any part of which the LTIP is in effect and we can no longer rely on the transition relief set forth in Treasury Regulation Section 1.162-27(f) for awards granted under the LTIP, a “covered employee” (as defined in Treasury Regulation Section 1.162-27) may not be granted (a) awards (other than awards designated to be paid only in cash or the settlement of which is not based on a number of shares of stock) relating to more than 250,000 shares of stock, subject to adjustment as provided under the LTIP and (b) awards designated to be paid only in cash, or the settlement of which is not based on a number of shares of stock, having a value determined on the date of grant in excess of $4,000,000. In any calendar year during any part of which the LTIP is in effect, our non-employee directors may not be granted awards under the LTIP having a value determined on the date of grant in excess of $150,000.
Restricted Stock. A restricted stock grant is an award of common stock that vests over a period of time and that during such time is subject to forfeiture. The LTIP Administrator may make grants of restricted stock under the LTIP to participants containing such terms as the LTIP Administrator shall determine. The LTIP Administrator will determine the period over which restricted stock granted to participants will vest. The LTIP Administrator, in its discretion, may base its determination upon the achievement of specified financial or other performance objectives. Dividends made on restricted stock may or may not be subjected to the same vesting provisions as the restricted stock.
117
Table of Contents
Restricted Stock Units. A restricted stock unit is a notional share that entitles the grantee to receive shares of common stock following the vesting of the restricted stock unit or, in the discretion of the LTIP Administrator, cash equivalent to the value of the number of shares of common stock subject to the award. The LTIP Administrator may make grants of restricted stock units under the LTIP to participants containing such terms as the LTIP Administrator shall determine. The LTIP Administrator will determine the period over which the restricted stock units granted to participants will vest and the times in which restricted stock units will be paid.
Stock Options. An option is a right to purchase shares of common stock at a specified price during specified time periods. The LTIP will permit the grant of options covering our common stock. The LTIP Administrator may make option grants under the LTIP to participants containing such terms as the LTIP Administrator shall determine. Options will have an exercise price that may not be less than the fair market value of our common stock on the date of grant. Options granted under the LTIP can be either incentive options (within the meaning of section 422 of the Internal Revenue Code), which have certain tax advantages for recipients, or non-qualified options. Options granted will become exercisable over a period determined by the LTIP Administrator. No option will have a term that exceeds ten years.
Stock Appreciation Rights. The LTIP will permit the grant of stock appreciation rights. A stock appreciation right is an award that, upon exercise, entitles participants to receive the excess of the fair market value of our common stock on the exercise date over the grant price established for the stock appreciation right on the date of grant. Such excess will be paid in cash or common stock. The LTIP Administrator may make grants of stock appreciation rights under the LTIP to participants containing such terms as the LTIP Administrator shall determine. Stock appreciation rights will have a grant price that may not be less than the fair market value of our common stock on the date of grant. In general, stock appreciation rights granted will become exercisable over a period determined by the LTIP Administrator.
Stock Awards. The LTIP Administrator, in its discretion, may also grant to participants shares of common stock that are not subject to forfeiture. The LTIP Administrator can grant stock awards without requiring that the recipient pay any remuneration for the shares.
Dividend Equivalents. The LTIP Administrator, in its discretion, may grant free-standing dividend equivalents or tandem dividend equivalents with respect to any award other than an award of restricted stock or a stock award. Dividend equivalents entitle the holder to receive cash equal to any cash dividends made on our common stock while the award is outstanding.
Other Stock-Based Awards. The LTIP Administrator, in its discretion, may also grant to participants an award denominated or payable in, referenced to, or otherwise based on or related to the value of our common stock.
Cash Awards. Cash awards may also be granted by the LTIP Administrator under the LTIP, in its discretion. Cash awards may be subject to time or performance-based vesting conditions, or no conditions whatsoever.
Performance Awards. A performance award is a right to receive all or part of an award granted under the LTIP based upon performance criteria specified by the LTIP Administrator. The LTIP Administrator will determine the period over which certain specified company or individual goals or objectives must be met. The performance award may be paid in cash, shares of our common stock or other awards or property, in the discretion of the LTIP Administrator.
Further, one or more of the following business criteria as they apply to us on a consolidated basis and/or to our subsidiaries or business or geographical units (except with respect to the total stockholder return and earnings per share criteria), will be used by the LTIP Administrator in establishing performance goals for performance awards granted to covered employees and intended to satisfy the requirements for “performance-based
118
Table of Contents
compensation” within the meaning of section 162(m) of the Code: (1) earnings per share; (2) revenues; (3) cash flow; (4) cash flow from operations; (5) cash flow return; (6) return on net assets; (7) return on assets; (8) return on investment; (9) return on capital; (10) return on equity; (11) economic value added; (12) operating margin; (13) contribution margin; (14) net income; (15) net income per share; (16) pretax earnings; (17) pretax earnings before interest, depreciation and amortization; (18) pretax operating earnings after interest expense and before incentives, service fees, and extraordinary or special items; (19) total stockholder return; (20) debt reduction or management; (21) market share; (22) change in the fair market value of our stock; (23) operating income; (24) share price; (25) effective equipment utilization; (26) achievement of savings from business improvement projects; (27) capital projects deliverables; (28) performance against environmental targets; (29) safety performance and/or incident rate; (30) human resources management targets, including medical cost reductions and time to hire; (31) satisfactory internal or external audits; and (32) any of the above goals determined pre-tax or post-tax, on an absolute or relative basis, as a ratio with other business criteria, or as compared to the performance of a published or special index deemed applicable by the LTIP Administrator including, but not limited to, the Standard & Poor’s 500 Stock Index or a group of comparable companies.
Tax Withholding. The LTIP Administrator will determine, in its sole discretion, the form of payment acceptable to satisfy a participant’s minimum statutory tax withholding obligations with respect to an award, including, without limitation, the delivery of cash or cash equivalents, stock (including previously owned shares, net settlement, a broker-assisted sale, or other cashless withholding or reduction of the amount of shares otherwise issuable or delivered pursuant to the award), other property, or any other legal consideration the LTIP Administrator deems appropriate.
Change in Control. Upon a “change in control” (as defined in the LTIP), the LTIP Administrator may, in its discretion, (i) remove any forfeiture restrictions applicable to an award, (ii) accelerate the time of exercisability or vesting of an award, (iii) require awards to be surrendered in exchange for a cash payment, (iv) cancel unvested awards or stock options with an exercise price below fair market value without payment or (v) make adjustments to awards as the LTIP Administrator deems appropriate to reflect the change of control.
Other Adjustments. In the case of (i) a subdivision or consolidation of the common stock (by reclassification, split or reverse split or otherwise), (ii) a recapitalization, reclassification, or other change in our capital structure or (iii) any other reorganization, merger, combination, exchange or other relevant change in capitalization of our equity, then a corresponding and proportionate adjustment shall be made in accordance with the terms of the LTIP, as appropriate, with respect to the maximum number of shares available under the LTIP, the number of shares that may be acquired with respect to an award, and, if applicable, the exercise price of an award, in order to prevent dilution or enlargement of awards as a result of such events.
Termination of Employment or Service. The consequences of the termination of a participant’s employment, consulting arrangement, or membership on the board of directors will be determined by the LTIP Administrator in the terms of the relevant award agreement.
Employee Stock Purchase Plan
Prior to the completion of this offering, we anticipate that our board of directors will adopt an employee stock purchase plan, or “ESPP”, which will allow our employees and employees of certain U.S. subsidiaries to purchase shares of our stock at a discount from the market price through automatic deductions from their paychecks. Contributions will be accumulated during a six month period called the “option period.” The ESPP will be effective immediately prior to the consummation of this offering but the first option period will not begin until January 1, 2016. The maximum number of our shares reserved for issuance under the ESPP shall be 1,982,899 shares, subject to adjustment in accordance with the terms of the ESPP.
Administration. Subject to oversight by our board of directors or the compensation committee thereof, a committee of officers established by our board of directors to administer the ESPP, referred to as the “ESPP Administrator,” will have the authority to administer the ESPP and to make and adopt rules and regulations not
119
Table of Contents
inconsistent with the provisions of the ESPP or the Code. In addition, the ESPP Administrator will correct any defect or supply any omission or reconcile any inconsistency in the ESPP, or in any option to purchase our shares granted under the ESPP. The interpretations and decisions of the ESPP Administrator in respect to the ESPP will be final and conclusive. The ESPP Administrator will not be liable for any decision, determination or action made or taken in good faith in connection with the administration of the ESPP. The ESPP Administrator will have the authority to delegate authority with respect to the administration of the ESPP to an appointed employee to the extent the ESPP Administrator, in its sole discretion, deems advisable from time to time.
Purchase Price. The price paid by participants for the shares purchased will be equal to the lesser of (i) 85% of the fair market value of our common stock on the first day of the six month option period, or (ii) 85% of the fair market value of our common stock on the last day of the six month option period.
Qualification Under Section 423 of the Code. We intend for the ESPP to be qualified under Section 423 of the Code so that employees may receive favorable tax treatment if they hold the shares acquired under the ESPP for at least two years from the grant date and one year from the purchase date.
Limitations on Purchase. No participant will be given the opportunity to purchase shares under the ESPP if, immediately after the grant of such opportunity, the participant’s right to purchase our common shares under all employee stock purchase plans (as defined in Section 423 of the Code) of ours and any related company would accrue at a rate which exceeds $25,000 in market value of such shares (determined at the time such purchase right is granted) for each calendar year in which such purchase right would be outstanding at any time.
Limitations on Resale. All participants will be prohibited from selling any shares of our common stock purchased under the ESPP prior to the second anniversary of the last day of the option period during which such shares were purchased.
Termination of Eligibility. If a participant retires, the participant may elect to (i) withdraw the entire amount, if any, withdrawn from his paychecks but not yet used to purchase shares, or (ii) have the amount used to purchase whole shares of our common stock at the end of the then current option period and have any remaining balance refunded without interest. For purposes of the ESPP, a participant’s retirement age is 59 ½. If a participant ceases to be eligible to participate in the ESPP for any reason other than retirement, then, as of the date the participant ceases to be eligible, he or she will automatically be deemed to have withdrawn from the ESPP and the dollar amount and/or the number of unissued shares in the participant’s account will be refunded or distributed to the participant, or, in the case of death, the participant’s designated beneficiary or estate.
Adjustments for Changes in Common Stock. In the event that adjustments are made in the number of outstanding shares of our common stock or our shares are exchanged for a different class of our stock or for shares of stock of any other corporation by reason of merger, consolidation, stock dividend, stock split, recapitalization, or otherwise, the ESPP Administrator will make appropriate adjustments in (i) the number and class of shares or other securities that may be reserved for purchase, or purchased, under the ESPP and (ii) the price at which the shares are sold and the number of shares sold under the ESPP as a whole, as well as per participant limitations, during the then current option period and future option periods. All adjustments will be made in the sole discretion of the LTIP Administrator, and its decision shall be binding and conclusive.
Amendment to the ESPP. Our board of directors generally may at any time, or from time to time, amend the ESPP in any respect, except that, without approval of our shareholders, no amendment may increase the aggregate number of our shares reserved under the ESPP other than as provided in ESPP, materially increase the benefits accruing to participants or materially modify the requirements as to eligibility for participation in the ESPP.
Other Compensation Elements
We offer participation in broad-based retirement, health and welfare plans to all of our employees. We currently maintain a retirement plan intended to provide benefits under section 401(k) of the Internal Revenue
120
Table of Contents
Code where employees, including our Named Executive Officers, are allowed to contribute portions of their base compensation to a tax-qualified retirement account. See “—Additional Narrative Disclosure—Retirement Benefits” for more information.
Outstanding Equity Awards at 2014 Fiscal Year-End
The following table reflects information regarding outstanding equity-based awards held by our Named Executive Officers as of December 31, 2014.
| Name |
Option Awards (1) | |||||||||||||||
| Number of Securities Underlying Unexercised Options (#) Exercisable |
Number of Securities Underlying Unexercised Options (#) Unexercisable |
Option Exercise Price ($) |
Option Expiration Date |
|||||||||||||
| Kevin Rabbitt, |
||||||||||||||||
| Chief Executive Officer |
95,480 | 385,000 | $ | 9.75 | 01/14/2023 | |||||||||||
| Gerald Delon, |
||||||||||||||||
| Chief Financial Officer |
52,090 | 208,362 | $ | 9.75 | 01/14/2023 | |||||||||||
| Debra Honkus, |
||||||||||||||||
| Executive Director |
17,363 | 69,454 | $ | 9.75 | 01/14/2023 | |||||||||||
| (1) | The option awards reported in these columns are subject to time-based vesting conditions. Each award was granted in January of 2013 and vests in five equal installments on each of the first five anniversaries of January 1, 2013, subject to continued employment through the vesting date. |
Additional Narrative Disclosure
Retirement Benefits
We do not maintain a defined benefit pension plan or nonqualified deferred compensation plan. We currently maintain a retirement plan intended to provide benefits under section 401(k) of the Code where employees, including our Named Executive Officers, are allowed to contribute portions of their eligible compensation to a tax-qualified retirement account. We provide matching contributions equal to 2% of each employees’ eligible compensation contributed to the plan. We also match additional amounts for all of our employees on a uniform basis, at our discretion.
Potential Payments Upon Termination or Change in Control
Prior Employment Agreements
Ms. Honkus is not a party to an employment agreement with us. The Employment Agreements with Messrs. Rabbitt and Delon contain certain severance and change in control provisions. Specifically, upon a termination of employment by us without “Cause” (as defined in the Employment Agreements and described generally below) or a termination of employment by the executive for “Good Reason” (as defined in his Employment Agreement and described generally below) each of Messrs. Rabbitt and Delon is entitled to receive (i) continued payment of his then base salary for a period of one year, (ii) payment for any accrued, unused vacation days, (iii) full benefits, including without limitation, healthcare benefits for him and his spouse and dependents for a period of twelve months after the termination of employment and (iv) a prorated annual bonus for the fiscal year during which the date of termination occurs based on the number of days he was employed during such fiscal year and our actual performance through the date of termination. All of these severance payments are contingent upon the executive’s execution of a satisfactory separation and release agreement. If either Messrs. Rabbitt or Delon are terminated for any reason other than by us without cause, then he will not be entitled to any severance payments or amounts under the Employment Agreements.
121
Table of Contents
As used in the Employment Agreements, “Cause” generally means: (i) failure by the executive to observe our material policies applicable to our executives and which results in demonstrative economic or reputational harm to us, (ii) gross negligence or willful misconduct by the executive in the performance of his duties, (iii) the commission by the executive of any act of fraud, theft or financial dishonesty with respect to us or any of our subsidiaries, the determination of which is to be made upon objective criteria, (iv) the executive’s indictment, conviction of, or pleading no contest or nolo contendere to, any felony or a lesser crime involving dishonesty (other than an offense relating to the operation of a motor vehicle resulting only in a fine, license, suspension or other non-custodial penalty), (v) the breach by the executive of any material provision of the Employment Agreement, (vi) chronic absenteeism that is not the result of illness or (vii) alcohol or other substance abuse by the executive. Under certain circumstances, the executive has ten days following notice from our board of directors to cure the failure or breach.
As used in Messrs. Rabbitt’s and Delon’s Employment Agreement, “Good Reason” generally means: (i) a material diminution in the executive’s responsibilities or title, (ii) a material decrease in the executive’s base salary, eligible benefits or bonus target or (iii) a relocation of the executive from the Pittsburgh, Pennsylvania area without his prior consent. Prior to resigning for Good Reason, the executive must give written notice to us of the circumstances claimed to provide a basis for such resignation not more than 30 days following his knowledge of such circumstance, and we will have ten business days after receipt of the notice to cure before the executive may terminate for Good Reason.
New Employment Agreements
In the event of a termination of employment by us without “Cause” (as defined in the New Employment Agreements and described generally below) or a termination of employment by the executive for “Good Reason” (as defined in the New Employment Agreements and described generally below) the New Employment Agreements provide that Messrs. Rabbitt and Delon are entitled to receive (i) payment for any accrued, unused vacation days, (ii) continued payment of base salary for a period of 24 months, (iii) premium payments for continued group healthcare coverage for the executive and his family for a period of 18 months following termination of employment (or a lump-sum payment equal thereto), (iv) a prorated annual bonus for the fiscal year during which the date of termination occurs based on the number of days the executive was employed during the year and our actual performance during the year, paid at the same time bonuses are paid to all other continuing executives generally, and (v) all equity awards granted prior to the consummation of our initial public offering shall become fully vested and exercisable as of the date of termination. Any equity awards granted following the consummation of our initial public offering will be subject to the terms set forth in the applicable plan and award agreement. The executive will not be entitled to the severance benefits enumerated in (ii) through (v) above if he does not provide us with a fully enforceable and irrevocable release of claims within 30 days following their termination of employment. If Messrs. Rabbitt or Delon’s employment is terminated by reason of death or disability then he shall be entitled to receive the benefits described in clauses (i), (iii), and (v) above. If Messrs. Rabbitt or Delon’s employment is terminated for any reason other than by us without Cause, by the executive’s death or disability, or by the executive for Good Reason, then the executive will be entitled to receive the payment enumerated in clause (i) above. Finally, in the event that any payment under the New Employment Agreement would be subject to any excise tax imposed under Section 4999 of the Code then such payment shall be either (a) reduced to the extent necessary to avoid the incursion of such excise tax or (b) paid in full, whichever provides the executive with the greatest after-tax payment.
As used in the New Employment Agreements, “Cause” generally means: (i) failure by the executive to observe our material policies applicable to our executives and which results in demonstrative economic or reputational harm to us, (ii) gross negligence or willful misconduct by the executive in the performance of his duties, (iii) the commission by the executive of any act of fraud, theft or financial dishonesty with respect to us or any of our subsidiaries, the determination of which is to be made upon objective criteria, (iv) the executive’s indictment, conviction of, or pleading no contest or nolo contendere to, any felony, or (v) the breach by the executive of any material provision of the New Employment Agreement. Under certain circumstances, the executive has ten days following notice from our board of directors to cure the failure or breach.
122
Table of Contents
As used in the New Employment Agreements, “Good Reason” generally means: (i) a material diminution in the executive’s responsibilities or title, (ii) a decrease in the executive’s base salary or bonus target, (iii) the provision of a notice of non-renewal of the New Employment Agreement by us, (iv) a material breach by us under the New Employment Agreement, or (v) a relocation of the executive from the Pittsburgh, Pennsylvania area without his prior consent. Prior to resigning for Good Reason, the executive must give written notice to us of the circumstances claimed to provide a basis for such resignation not more than 30 days following his knowledge of such circumstance, and we will have ten business days after receipt of the notice to cure before the executive may terminate for Good Reason.
Stock Options
Pursuant to the terms of the EIP, a termination of employment for any reason other than a termination by us for “cause” (as defined in the EIP) will halt the vesting of the Named Executive Officer’s options and all unvested options will expire as of the date of termination. However, vested options remain exercisable until the earlier of ninety days after termination or the original date of the option’s expiration. If the termination is the result of the employee’s death or disability, the same provisions apply, except that the options may be exercised until the earlier of 12 months after termination or the original expiration date of the option. In the event that the Named Executive Officer is terminated for cause, all outstanding options will immediately expire and be forfeited, whether vested or unvested as of the date of termination.
Pursuant to the terms of the stockholder’s agreement for NEP Group, Inc., upon (i) a termination of employment by us for “cause” (as defined in each Named Executive Officer’s Employment Agreement, or, in the case of Ms. Honkus, who has no Employment Agreement, as defined under the EIP and described generally below) or (ii) a voluntary termination by the Named Executive Officer within two years of the date the Named Executive Officer acquired shares in us, we have the right to repurchase all shares held by the Named Executive Officer. The price for the repurchase under those circumstances will be the lesser of the exercise price or the fair market value of the shares. If the termination is for a reason other than cause, the repurchase price will be the fair market value on the date of the termination.
The definition of “cause” utilized in the Employment Agreements is included above. The term “cause” as used in the EIP generally means (i) commission of a deliberate and premeditated act against our interests including, without limitation, an act of fraud, embezzlement, misappropriation or breach of fiduciary duty against us, or the payment or receipt of bribes and kickbacks with respect to our business; (ii) conviction of or pleading guilty or nolo contendere to any felony or any crime involving moral turpitude; (iii) failure to perform or neglecting the material duties of the executive’s employment on a regular basis and such refusal or failure shall have continued for a period of twenty (20) days after written notice; (iv) chronic non-approved absence from work; (v) refusal, after written notice, to obey any lawful direction by our board of directors for a period of more than twenty (20) days; or (vi) engagement in the unlawful use or possession of illegal drugs on our premises or habitual drunkenness.
Pursuant to the terms of the EIP, competitive activities undertaken by an employee during employment, or within six months after termination of employment may result in forfeiture of options held by the employee, forfeiture of shares bought under the plan up to twelve months before the competitive activity, and forfeiture of profits realized by a sale under the plan up to twelve months before the competitive activity. The remedy applied is to be determined in the sole discretion of our board of directors or a sub-committee thereof.
The terms of the EIP further provide that in the event of a transaction or event that that enlarges or dilutes the rights of options holders, our board of directors or a sub-committee thereof shall make an equitable adjustment to (i) the number and kind of shares to be available for future grant under the EIP as well as those shares that will be delivered under outstanding awards, and, if applicable, (ii) the exercise price of the stock options. Additionally, under certain circumstances enumerated in the EIP, our board of directors, or a sub-committee thereof, may also alter the terms and conditions of outstanding options, including cancellation of
123
Table of Contents
vested or unvested options in exchange for their equivalent in cash or securities (less the applicable exercise price), cancellation of unvested, out-of-the-money, or at-the-money options for no consideration, acceleration of vesting, or adjustment of performance targets.
Upon a change in control in our Company (as defined below), awards outstanding under the EIP vest automatically. Under the terms of the EIP, an initial public offering of our Company is explicitly excluded from the definition of a change in control.
A “change in control” as defined under the EIP, generally means the sale of us (whether by merger, consolidation, recapitalization, reorganization, sale of securities, sale of assets, or otherwise) in one transaction or a series of related transactions to a person or entity that is not an affiliate of Crestview Partners, pursuant to which such person or entity acquires (i) securities representing at least a majority of the voting power of all of our securities, or (ii) all or substantially all of our assets on a consolidated basis.
Director Compensation
The following individuals served as members of the board of directors during fiscal year 2014: Messrs. Kevin Rabbitt, Jeffery Marcus, Brian Cassidy, Kenneth Schanzer, and Mark Patricof, and Mses. Debra Honkus and Katherine Chung.
Historically, directors who are employees or affiliates of us or Crestview Partners have not received any compensation from us for their service on our board of directors. Upon the consummation of the offering, only the directors who are our employees will not receive any compensation from us for their service on our board of directors.
Effective as of the closing of this offering, each non-employee director will receive a compensation package consisting of annual cash retainer of $80,000 plus an additional annual payment of $25,000 for the chairman of the board of directors, $20,000 for each member of the audit committee and an additional $15,000 for the audit committee chairman, $15,000 for each member of the compensation committee and an additional $10,000 for the compensation committee chairman. Each non-employee director will also be eligible to receive equity or equity-based compensation equal in value to approximately $80,000 annually, vesting at the first anniversary of the date of the grant. All of our directors will be reimbursed for out-of pocket expenses in connection with attending meetings of the board of directors or its committees.
In 2014, Mr. Rabbitt and Ms. Honkus were employed by us and Messrs. Marcus and Cassidy and Ms. Chung were each employed by or affiliated with Crestview Partners and, as such, received no compensation from us for their service on our board of directors. Messrs. Patricof and Schanzer each received an $80,000 cash retainer for their service on our board during the 2014 fiscal year, as outlined below. In addition, Mr. Patricof received $120,000 in May 2015 for certain advisory services he provided in connection with our acquisition of Mediatec.
| Name |
Fees Earned or Paid in Cash ($) |
Option Awards ($) (1) |
Total ($) |
|||||||||
| Mark Patricof |
$ | 80,000 | $ | — | $ | 80,000 | ||||||
| Kenneth Schanzer |
$ | 80,000 | $ | — | $ | 80,000 | ||||||
| (1) | No stock options were granted to our directors during 2014. As of December 31, 2014, Messrs. Patricof and Schanzer each held a total 9,240 unvested stock options and 2,310 vested stock options, representing the award of 11,550 stock options granted to each of them on January 1, 2013. This award vests in five equal installments on the first five anniversaries of January 1, 2013, subject to the continued provision of services to us through each vesting date. |
124
Table of Contents
SECURITY OWNERSHIP OF CERTAIN BENEFICIAL OWNERS AND MANAGEMENT
The following table sets forth the beneficial ownership of our common stock that, in connection with the completion of this offering, will be owned by:
| • | each person known to us to beneficially own more than 5% of any class of our outstanding voting securities; |
| • | each member of our board of directors; |
| • | each of our named executive officers; and |
| • | all of our directors and executive officers as a group. |
Except as otherwise noted, the person or entities listed below have sole voting and investment power with respect to all shares of our common stock beneficially owned by them, except to the extent this power may be shared with a spouse. All information with respect to beneficial ownership has been furnished by the directors or named executive officers, as the case may be. Unless otherwise noted, the mailing address of each listed beneficial owner is c/o NEP Group, Inc., 2 Beta Drive, Pittsburgh, PA 15238.
The table does not reflect any shares of common stock that directors and executive officers may purchase in this offering through the directed share program described under “Underwriting (Conflicts of Interest).”
| Shares Beneficially Owned | ||||||||
| Name of Beneficial Owner |
Number (1)(2) | Percentage (3) | ||||||
| Five percent Stockholders: |
||||||||
| Crestview Partners II GP, L.P. (4) |
21,564,673 | 57.2 | % | |||||
| Named Executive Officers and Directors: |
||||||||
| Kevin Rabbitt |
589,134 | 1.5 | % | |||||
| Debra Honkus |
153,037 | * | ||||||
| Gerald Delon |
310,733 | * | ||||||
| Brian Cassidy |
— | — | ||||||
| Jeffrey Marcus |
— | — | ||||||
| Katherine Chung |
— | — | ||||||
| Mark Patricof |
17,140 | * | ||||||
| Hank Ratner |
— | — | ||||||
| Kenneth Schanzer |
22,723 | * | ||||||
| Howard Liszt |
— | — | ||||||
| Directors and executive officers as a group (12 persons) |
1,519,191 | 3.0 | % | |||||
| * | Less than 1%. |
| (1) | The number of common shares reported as beneficially owned include 477,400, 86,817, 260,452, 11,550 and 11,550 stock options granted to Mr. Rabbitt, Ms. Honkus, Mr. Delon, Mr. Patricof and Mr. Schanzer, respectively. |
| (2) | Excludes 127,500 shares of restricted common stock (based on the midpoint of the price range set forth on the cover of this prospectus) that will be granted to our executive officers upon the closing of this offering in the following amounts: Mr. Rabbitt (62,500) and Mr. Delon (25,000). In addition, excludes 5,000 shares of restricted common stock, 35,000 shares in total, that will be granted to each of Messrs. Cassidy, Marcus, Patricof, Ratner, Schanzer and Liszt and to Ms. Chung. After giving effect to the issuance of these shares, we will have 37,835,481 shares of common stock outstanding. |
| (3) | Percentage of shares beneficially owned is calculated using a denominator 37,707,981 shares of common stock outstanding, and with respect to Messrs. Rabbit, Schanzer, Patricof and Ms. Honkus, adding to the baseline denominator the respective number of stock options held, all in accordance with Rule 13d-3(d)(1)(i) of the Exchange Act. |
125
Table of Contents
| (4) | Consists of shares owned directly by Crestview NEP, L.P. Each of Crestview Partners II, L.P., Crestview Partners II (TE), L.P., Crestview Partners II (FF), L.P., Crestview Offshore Holdings II (Cayman), L.P., Crestview Offshore Holdings II (FF Cayman), L.P. and Crestview Offshore Holdings II (892 Cayman), L.P. (collectively, the “Crestview Funds”) is a limited partner of Crestview NEP, L.P. and a member of Crestview NEP GP, LLC, the general partner of Crestview NEP, L.P. Each of the Crestview Funds and Crestview NEP GP, LLC may be deemed to be a beneficial owner of the shares owned directly by Crestview NEP, L.P. Crestview Partners II GP, L.P. is the general partner of the Crestview Funds and may also be deemed to be a beneficial owner of such shares. Each of the foregoing disclaims beneficial ownership of such shares except to the extent of its pecuniary interest. Crestview Partners II GP, L.P. has voting and investment control over such shares. Decisions by Crestview Partners II GP, L.P. to vote or dispose of such shares require the approval of a majority of the nine members of its investment committee, which is composed of the following individuals: Barry S. Volpert, Thomas S. Murphy, Jr., Jeffrey A. Marcus, Robert J. Hurst, Richard M. DeMartini, Robert V. Delaney, Jr., Brian P. Cassidy, Quentin Chu and Alexander M. Rose. None of the foregoing persons has the power individually to vote or dispose of any shares. Each of the foregoing individuals disclaims beneficial ownership of all such shares, except to the extent of his pecuniary interest. The address of each of the foregoing is c/o Crestview Partners, 667 Madison Avenue, 10th Floor, New York, New York 10065. |
126
Table of Contents
CERTAIN RELATIONSHIPS AND RELATED PARTY TRANSACTIONS
Procedures for Approval of Related Party Transactions
Prior to the closing of this offering, we have not maintained a policy for approval of Related Party Transactions. A “Related Party Transaction” is a transaction, arrangement or relationship in which we or any of our subsidiaries was, is or will be a participant, the amount of which involved exceeds $120,000, and in which any Related Person had, has or will have a direct or indirect material interest. A “Related Person” means:
| • | any person who is, or at any time during the applicable period was, one of our executive officers or one of our directors; |
| • | any person who is known by us to be the beneficial owner of more than 5% of our common stock; |
| • | any immediate family member of any of the foregoing persons, which means any child, stepchild, parent, stepparent, spouse, sibling, mother-in-law, father-in-law, son-in-law, daughter-in-law, brother-in-law or sister-in-law of a director, executive officer or a beneficial owner of more than 5% of our common stock, and any person (other than a tenant or employee) sharing the household of such director, executive officer or beneficial owner of more than 5% of our common stock; and |
| • | any firm, corporation or other entity in which any of the foregoing persons is a partner or principal or in a similar position or in which such person has a 10% or greater beneficial ownership interest. |
We anticipate that our board of directors will adopt a written related party transactions policy prior to the completion of this offering. Pursuant to this policy, we expect that our audit committee will review all material facts of all Related Party Transactions.
Historical Transactions with Affiliates
Consulting Agreement
On December 24, 2012, we entered into a consulting agreement with Crestview Partners, pursuant to which Crestview Partners provides us with ongoing management, advisory and consulting services for an annual fee of $1.5 million plus expense reimbursements of $500,000, payable on a quarterly basis. The consulting agreement will be terminated in connection with the closing of this offering in exchange for a one-time termination payment of $3.5 million in consideration for monitoring services to be performed following the closing of this offering as well as a $1.0 million payment for unpaid fees and expenses as of June 30, 2015.
Stockholders Agreement
We entered into a Stockholders Agreement with funds managed by Crestview and other legacy stockholders, dated as of December 24, 2012, (the “Stockholders Agreement”), in connection with our Corporate Reorganization. The Stockholders Agreement contains, among other things, the agreement among the stockholders to restrict their ability to transfer shares of our common stock as well as rights of first refusal, tagalong rights, drag-along rights and preemptive rights, and voting directives, all of which restrictions and rights will terminate upon the consummation of this offering. We intend to enter into a new stockholders agreement with Crestview in connection with this offering. See “—Other Transactions with Affiliates—Stockholders Agreement.”
Office and Facility Leases
Our corporate offices in Pittsburgh, Pennsylvania are leased through Development Partners, a real estate general partnership, the partners of which are Debra Honkus and Thomas P. Shelbourne, III. This lease is subject to a renewal option for one five-year period. For the year ended December 31, 2014 and 2013, we made payments on the lease of approximately $0.8 million and $0.8 million, respectively. Lease payments made during the period from December 24, 2012 to December 31, 2012 were immaterial. For the period from January 1, 2012 to December 23, 2012, we made payments on the lease totaling $0.8 million.
127
Table of Contents
Debra A. Honkus owns a minority interest in 1580 Magnolia, LLC, which leases facilities to one of our subsidiaries. For the years ended December 31, 2014 and 2013, we made payments on the lease totaling approximately $0.4 million and $0.4 million, respectively. Lease payments made during the period from December 24, 2012 to December 31, 2012 were immaterial. We made payments on the lease of $0.4 million for the period from January 1, 2012 to December 23, 2012.
Employment of Jason Honkus
Jason Honkus, the son of Ms. Debra Honkus who serves on our board of directors, is currently employed by us as the Director of Mobile Unit Engineering. Mr. Honkus received $134,927 in compensation during 2014. He is not an executive officer, and the compensation received by Mr. Honkus is determined under our standard compensation practices.
Other Transactions with Affiliates
Registration Rights Agreement
At or prior to the closing of this offering, we intend to enter into a Registration Rights Agreement, pursuant to which we will grant funds managed by Crestview Partners and the other legacy stockholders the right, under certain circumstances and subject to certain restrictions, to require us to register under the Securities Act the shares of our common stock that are held or acquired by them.
Demand Rights. Subject to several exceptions, affiliates of Crestview Partners II GP, L.P. may require that we register for public resale under the Securities Act all shares of common stock that they request be registered at any time following this offering so long as the securities being registered in each registration statement are reasonably expected to produce aggregate proceeds of at least $25 million. We will not be obligated to effectuate more than five demand registrations under the Registration Rights Agreement. If we become eligible to register the sale of our securities on Form S-3 under the Securities Act, affiliates of Crestview Partners II GP, L.P. will have unlimited rights under the Registration Rights Agreement to require us to register the sale of the common stock held by them on Form S-3 (including in a “shelf” registration statement), subject to offering size and other restrictions.
Blackout Periods. We have the ability to delay the filing of a registration statement in connection with a demand request for not more than one period of 45 days in any twelve-month period, subject to certain conditions.
Piggyback Registration Rights. The Registration Rights Agreement will also grant to Crestview Partners and the other legacy stockholders certain “piggyback” registration rights, which allow such holders the right to include certain securities in a registration statement filed by us, including in connection with the exercise of any “demand” registration rights by any other security holder possessing such rights, subject to certain customary exceptions.
Cut-Backs. If a registration on a shelf registration statement takedown requested by Crestview Partners (or another legacy stockholder) is in the form of a firm underwritten offering, and if the managing underwriter of the offering determines that the number of securities to be offered would have a material adverse effect on the distribution or sales price of the shares of common stock in the offering, the number of shares included in the offering will be determined as follows:
| • | first, shares offered by the legacy stockholders (including funds managed by Crestview Partners) who request to include their shares in the registration (pro rata, based on the number of registrable securities owned by such legacy stockholders); |
| • | second, shares offered by any other stockholders (pro rata, based on the number of registrable securities owned by such stockholder) except to the extent any such holders have agreed under existing agreements to grant priority with regard to participation in such offering to any other holders of our securities; and |
| • | third, shares offered by us for our own account. |
128
Table of Contents
If the managing underwriter in an underwritten offering commenced by the Company or requested by a stockholder (other than a legacy stockholder) determines that the number of securities offered in a piggyback registration would have a material adverse effect on the distribution or sales price of the shares of common stock in the offering, the number of shares included in the offering will be determined as follows:
| • | first, shares offered by us for own account if we have initiated such registration or by any stockholders exercising demand rights with respect to such registration (pro rata, based on the number of registrable securities owned by the requesting stockholders); |
| • | second, shares offered by any of our other stockholders (including the legacy stockholders) (pro rata, based on the number of registrable securities owned by such stockholder); and |
| • | third, shares offered by us for our own account if any stockholder initiated such registration by exercising demand rights. |
Underwriters. In connection with any firm underwritten offering pursuant to the Registration Rights Agreement, the underwriter will be selected: (i) in the case of a “demand” registration, by the holders of common stock issuing the demand notice (subject to our approval, which will not be unreasonably withheld); and (ii) in all other cases, by us.
Indemnification; Expenses. In connection with the registrations described above, we will indemnify any selling stockholders against certain liabilities and we will bear all fees, costs and expenses (except underwriting discounts and selling commissions). We have also agreed to pay the legal fees and expenses of one counsel to the selling stockholders, which shall be selected by the holder of a majority of the shares of common stock being registered for sale pursuant to such registration.
Amendment. The Registration Rights Agreement may be amended by the Company and the affirmative vote of the legacy stockholders holding at least a majority of the shares held by the legacy stockholders. Further, the Registration Rights Agreement may not be amended in a manner that would disproportionally and materially adversely affect the interests of any legacy stockholder (in relation to any other legacy stockholder after taking into account the rights of such legacy stockholder) without the written approval of such legacy stockholder.
Stockholders Agreement
In connection with this offering, we intend to enter into a stockholders agreement with Crestview. The stockholders agreement will contain provisions related to the composition of our board of directors, the committees of our board of directors and our corporate governance. See “Management—Board of Directors.” The stockholders agreement will also provide that, for as long as Crestview and its affiliates hold at least 50% of our issued and outstanding common stock, the approval of Crestview must be obtained before we are permitted to take any of the following actions:
| • | any change of control of the Company; |
| • | acquisitions or dispositions by the Company of assets valued at more than $30.0 million; |
| • | incurrence by the Company of any indebtedness in excess of $25.0 million, other than the incurrence of indebtedness under our revolving credit facility or a related refinancing of the existing revolving credit facility, or the making of any loan in excess of $25.0 million; provided that Crestview must approve all loans to any director, officer of the Company or other individual in excess of $1.0 million; |
| • | the issuance of any equity securities of the Company or any of our subsidiaries, other than pursuant to equity incentive plans that have received the prior approval of Crestview; |
| • | amending our amended and restated certificate of incorporation and our amended and restated bylaws; |
| • | the hiring and termination of our Chief Executive Officer; and |
| • | any increase or decrease in the size of our board of directors. |
Indemnification Agreements
Prior to the completion of this offering, we intend to enter into indemnification agreements with each of our directors and executive officers that provide, in general, that we will provide them with customary indemnification in connection with their service to us or on our behalf.
129
Table of Contents
Upon completion of this offering, the authorized capital stock of NEP Group, Inc. will consist of 400,000,000 shares of common stock, $0.01 par value per share, of which 37,707,981 shares will be issued and outstanding, and 50,000,000 shares of preferred stock, $0.01 par value per share, of which no shares will be issued and outstanding.
The following summary of the capital stock and amended and restated certificate of incorporation and amended and restated bylaws of NEP Group, Inc. does not purport to be complete and is qualified in its entirety by reference to the provisions of our amended and restated certificate of incorporation and amended and restated bylaws, which are filed as exhibits to the registration statement of which this prospectus is a part.
Common Stock
Except as provided by law or in a preferred stock designation, holders of common stock are entitled to one vote for each share held of record on all matters submitted to a vote of the stockholders, will have the exclusive right to vote for the election of directors and do not have cumulative voting rights. Except as otherwise required by law, holders of common stock, are not entitled to vote on any amendment to the amended and restated certificate of incorporation (including any certificate of designations relating to any series of preferred stock) that relates solely to the terms of any outstanding series of preferred stock if the holders of such affected series are entitled, either separately or together with the holders of one or more other such series, to vote thereon pursuant to the amended and restated certificate of incorporation (including any certificate of designations relating to any series of preferred stock) or pursuant to the Delaware General Corporation Law (the “DGCL”). Subject to prior rights and preferences that may be applicable to any outstanding shares or series of preferred stock, holders of common stock are entitled to receive ratably in proportion to the shares of common stock held by them such dividends (payable in cash, stock or otherwise), if any, as may be declared from time to time by our board of directors out of funds legally available for dividend payments. The holders of common stock have no preferences or rights of conversion, exchange, pre-emption or other subscription rights. There are no redemption or sinking fund provisions applicable to the common stock. In the event of any voluntary or involuntary liquidation, dissolution or winding-up of our affairs, holders of common stock will be entitled to share ratably in our assets in proportion to the shares of common stock held by them that are remaining after payment or provision for payment of all of our debts and obligations and after distribution in full of preferential amounts to be distributed to holders of outstanding shares of preferred stock, if any.
Preferred Stock
Our amended and restated certificate of incorporation authorizes our board of directors, subject to any limitations prescribed by law, without further stockholder approval, to establish and to issue from time to time one or more classes or series of preferred stock, par value $0.01 per share, covering up to an aggregate of 50,000,000 shares of preferred stock. Each class or series of preferred stock will cover the number of shares and will have the powers, preferences, rights, qualifications, limitations and restrictions determined by the board of directors, which may include, among others, dividend rights, liquidation preferences, voting rights, conversion rights, preemptive rights and redemption rights. Except as provided by law or in a preferred stock designation, the holders of preferred stock will not be entitled to vote at or receive notice of any meeting of stockholders.
Anti-Takeover Effects of Provisions of Our Amended and Restated Certificate of Incorporation, our Amended and Restated Bylaws and Delaware Law
Some provisions of Delaware law, our amended and restated certificate of incorporation and our amended and restated bylaws will contain provisions that could make the following transactions more difficult: acquisitions of us by means of a tender offer, a proxy contest or otherwise, or removal of our incumbent officers and directors. These provisions may also have the effect of preventing changes in our management. It is possible
130
Table of Contents
that these provisions could make it more difficult to accomplish or could deter transactions that stockholders may otherwise consider to be in their best interests or in our best interests, including transactions that might result in a premium over the market price for our shares.
These provisions are expected to discourage coercive takeover practices and inadequate takeover bids. These provisions are also designed to encourage persons seeking to acquire control of us to first negotiate with us. We believe that the benefits of increased protection and our potential ability to negotiate with the proponent of an unfriendly or unsolicited proposal to acquire or restructure us outweigh the disadvantages of discouraging these proposals because, among other things, negotiation of these proposals could result in an improvement of their terms.
Delaware Law
Section 203 of the DGCL prohibits a Delaware corporation, including those whose securities are listed for trading on the NYSE, from engaging in any business combination, such as a merger, with a person or group owning 15% or more of the corporation’s voting stock (an “interested stockholder”) for a period of three years following the time that the stockholder becomes an interested stockholder, unless (with certain exceptions) the business combination or the transaction in which the person became an interested stockholder is approved in a prescribed manner. We intend to elect in our amended and restated certificate of incorporation not to be subject to Section 203 of the DCGL. Accordingly, we will not be subject to any anti-takeover effects of Section 203. Nevertheless, our amended and restated certificate of incorporation will contain provisions that have the same effect as Section 203, except that they provide that affiliates of Crestview Partners II GP, L.P. and their transferees will not be deemed to be “interested stockholders,” regardless of the percentage of our voting stock owned by them, and accordingly will not be subject to such restrictions.
Amended and Restated Certificate of Incorporation and Amended and Restated Bylaws
Provisions of our amended and restated certificate of incorporation and amended and restated bylaws, which will become effective upon the closing of this offering, may delay or discourage transactions involving an actual or potential change in control or change in our management, including transactions in which stockholders might otherwise receive a premium for their shares, or transactions that our stockholders might otherwise deem to be in their best interests. Therefore, these provisions could adversely affect the price of our common stock.
Among other things, upon the completion of this offering, our amended and restated certificate of incorporation and amended and restated bylaws will:
| • | establish advance notice procedures with regard to stockholder proposals relating to the nomination of candidates for election as directors or to new business to be brought before meetings of our stockholders. These procedures provide that notice of stockholder proposals must be timely given in writing to our corporate secretary prior to the meeting at which the action is to be taken. Generally, to be timely, notice must be received at our principal executive offices not less than 90 days nor more than 120 days prior to the first anniversary date of the annual meeting for the preceding year. Our amended and restated bylaws specify the requirements as to form and content of all stockholders’ notices. These requirements may preclude stockholders from bringing matters before the stockholders at an annual or special meeting; |
| • | provide our board of directors the ability to authorize undesignated preferred stock. This ability makes it possible for our board of directors to issue, without stockholder approval, preferred stock with voting or other rights or preferences that could impede the success of any attempt to change control of us. These and other provisions may have the effect of deferring hostile takeovers or delaying changes in control or management of our Company; |
| • | provide that the authorized number of directors may be changed only by resolution of the board of directors; |
131
Table of Contents
| • | provide that all vacancies, including newly created directorships, may, except as otherwise required by law or, if applicable, the rights of holders of a series of preferred stock, be filled by the affirmative vote of a majority of directors then in office, even if less than a quorum; |
| • | at any time after affiliates of Crestview Partners II GP, L.P. no longer collectively beneficially own more than 50% of the outstanding shares of our common stock, |
| • | provide that any action required or permitted to be taken by the stockholders must be effected at a duly called annual or special meeting of stockholders and may not be effected by any consent in writing in lieu of a meeting of such stockholders, subject to the rights of the holders of any series of preferred stock with respect to such series (prior to such time, such actions may be taken without a meeting by written consent of holders of common stock having not less than the minimum number of votes that would be necessary to authorize such action at a meeting); |
| • | provide our certificate of incorporation and bylaws may be amended by the affirmative vote of the holders of at least two-thirds of our then outstanding common stock (prior to such time, our certificate of incorporation and bylaws may be amended by the affirmative vote of the holders of a majority of our then outstanding common stock); and |
| • | provide that special meetings of our stockholders may only be called by the board of directors or the chairman of the board (prior to such time, a special meeting may also be called at the request of stockholders holding a majority of the outstanding shares entitled to vote); |
| • | provide for our board of directors to be divided into three classes of directors, with each class as nearly equal in number as possible, serving staggered three-year terms, other than directors which may be elected by holders of preferred stock, if any. This system of electing and removing directors may tend to discourage a third party from making a tender offer or otherwise attempting to obtain control of us, because it generally makes it more difficult for stockholders to replace a majority of the directors; |
| • | provide that we renounce any interest in the business investments and opportunities of Crestview Partners, any of its affiliates, any director of the Company who is an employee of Crestview Partners or any of its affiliates or any of their officers, directors, agents, stockholders, members, partners, affiliates and subsidiaries and provide that they have no obligation to offer us such investments or opportunities; and |
| • | provide that our bylaws can be amended or repealed at any regular or special meeting of stockholders or by the board of directors, including the requirement that any amendment by the stockholders at a meeting, at any time after affiliates of Crestview Partners II GP, L.P. no longer collectively own more than 50% of the outstanding shares of our common stock, be upon the affirmative vote of at least 66 2⁄3% of the shares of common stock generally entitled to vote in the election of directors. |
Forum Selection
Our amended and restated certificate of incorporation will provide that unless we consent in writing to the selection of an alternative forum, the Court of Chancery of the State of Delaware will, to the fullest extent permitted by applicable law, be the sole and exclusive forum for:
| • | any derivative action or proceeding brought on our behalf; |
| • | any action asserting a claim of breach of a fiduciary duty owed by any of our directors, officers, employees or agents to us or our stockholders; |
| • | any action asserting a claim against us arising pursuant to any provision of the DGCL, our amended and restated certificate of incorporation or our bylaws; or |
| • | any action asserting a claim against us that is governed by the internal affairs doctrine, |
in each such case subject to such Court of Chancery having personal jurisdiction over the indispensable parties named as defendants therein.
132
Table of Contents
Our amended and restated certificate of incorporation will also provide that any person or entity purchasing or otherwise acquiring any interest in shares of our capital stock will be deemed to have notice of and to have consented to this forum selection provision. However, it is possible that a court could find our forum selection provision to be inapplicable or unenforceable.
Limitation of Liability and Indemnification Matters
Our amended and restated certificate of incorporation limits the liability of our directors for monetary damages for breach of their fiduciary duty as directors, except for liability that cannot be eliminated under the DGCL. Delaware law provides that directors of a company will not be personally liable for monetary damages for breach of their fiduciary duty as directors, except for liabilities:
| • | for any breach of their duty of loyalty to us or our stockholders; |
| • | for acts or omissions not in good faith or which involve intentional misconduct or a knowing violation of law; |
| • | for unlawful payment of dividends or unlawful stock repurchases or redemptions, as provided under Section 174 of the DGCL; or |
| • | for any transaction from which the director derived an improper personal benefit. |
Any amendment, repeal or modification of these provisions will be prospective only and would not affect any limitation on liability of a director for acts or omissions that occurred prior to any such amendment, repeal or modification.
Our amended and restated certificate of incorporation and amended and restated bylaws also provide that we will indemnify our directors and officers to the fullest extent permitted by Delaware law. Our amended and restated certificate of incorporation and amended and restated bylaws also permit us to purchase insurance on behalf of any officer, director, employee or other agent for any liability arising out of that person’s actions as our officer, director, employee or agent, regardless of whether Delaware law would permit indemnification. We intend to enter into indemnification agreements with each of our current and future directors and officers. These agreements will require us to indemnify these individuals to the fullest extent permitted under Delaware law against liability that may arise by reason of their service to us, and to advance expenses incurred as a result of any proceeding against them as to which they could be indemnified. We believe that the limitation of liability provision in our amended and restated certificate of incorporation and the indemnification agreements will facilitate our ability to continue to attract and retain qualified individuals to serve as directors and officers.
Transfer Agent and Registrar
The transfer agent and registrar for our common stock is American Stock Transfer & Trust Company, LLC.
Listing
Our common stock has been approved for listing on the NYSE under the symbol “NEPG.”
133
Table of Contents
SHARES ELIGIBLE FOR FUTURE SALE
Prior to this offering, there has been no public market for our common stock. Future sales of our common stock in the public market, or the availability of such shares for sale in the public market, could adversely affect the market price of our common stock prevailing from time to time. As described below, only a limited number of shares will be available for sale shortly after this offering due to contractual and legal restrictions on resale. Nevertheless, sales of a substantial number of shares of our common stock in the public market after such restrictions lapse, or the perception that those sales may occur, could adversely affect the prevailing market price of our common stock at such time and our ability to raise equity-related capital at a time and price we deem appropriate.
Sales of Restricted Shares
Upon completion of this offering, we will have outstanding an aggregate of 37,707,981 shares of common stock. Of these shares, all of the 13,000,000 shares of common stock to be sold in this offering (or 14,950,000 shares assuming the underwriters exercise the option to purchase additional shares in full) will be freely tradable without restriction unless the shares are held by any of our “affiliates” as such term is defined in Rule 144 under the Securities Act, and without further registration under the Securities Act. All remaining shares of common stock will be deemed “restricted securities” as such term is defined under Rule 144. The restricted securities were, or will be, issued and sold by us in private transactions and are eligible for public sale only if registered under the Securities Act or if they qualify for an exemption from registration under Rule 144 or Rule 701 under the Securities Act, which rules are summarized below.
As a result of the lock-up agreements described below and the provisions of Rule 144 and Rule 701 under the Securities Act, the shares of our common stock (excluding the shares to be sold in this offering) that will be available for sale in the public market are as follows:
| • | 106,306 shares will be eligible for sale on the date of this prospectus or prior to 180 days after the date of this prospectus and when permitted under Rule 144 or Rule 701; and |
| • | 23,499,259 shares will be eligible for sale upon the expiration of the lock-up agreement with the underwriters beginning 180 days after the date of this prospectus and when permitted under Rule 144 or Rule 701; and |
| • | 1,046,538 shares will be eligible for sale upon the expiration of the lock-up agreements with the Company beginning twelve months after the date of this prospectus and when permitted under Rule 144 or Rule 701. |
Lock-up Agreements
We, affiliates of Crestview Partners II GP, L.P., certain of our other existing stockholders and option holders and all of our directors and executive officers, representing approximately 99% in the aggregate of our common stock, have agreed not to sell any common stock or securities convertible into or exchangeable for shares of common stock for a period of 180 days from the date of this prospectus, subject to certain exceptions. Please see “Underwriting (Conflicts of Interest)” for a description of these lock-up provisions.
In addition, all of our executive officers and the persons identified as key employees under “Management”, have agreed with us not to sell, without our prior consent, more than 50% of the shares of common stock held by them after this offering for a period of twelve months from the date of this prospectus, subject to certain exceptions. We may in our sole discretion release the common stock subject to these restrictions in whole or in part at any time.
134
Table of Contents
Rule 144
In general, under Rule 144 under the Securities Act as currently in effect, a person (or persons whose shares are aggregated) who is not deemed to have been an affiliate of ours at any time during the three months preceding a sale, and who has beneficially owned restricted securities within the meaning of Rule 144 for at least six months (including any period of consecutive ownership of preceding non-affiliated holders) would be entitled to sell those shares, subject only to the availability of current public information about us. A non-affiliated person who has beneficially owned restricted securities within the meaning of Rule 144 for at least one year would be entitled to sell those shares without regard to the provisions of Rule 144.
A person (or persons whose shares are aggregated) who is deemed to be an affiliate of ours and who has beneficially owned restricted securities within the meaning of Rule 144 for at least six months would be entitled to sell within any three-month period a number of shares that does not exceed the greater of one percent of the then outstanding shares of our common stock or the average weekly trading volume of our common stock reported by the NYSE during the four calendar weeks preceding the filing of notice of the sale. Such sales are also subject to certain manner of sale provisions, notice requirements and the availability of current public information about us.
Rule 701
In general, under Rule 701 under the Securities Act, any of our employees, directors, officers, consultants or advisors who purchases shares from us in connection with a compensatory stock or option plan or other written agreement before the effective date of this offering is entitled to sell such shares 90 days after the effective date of this offering in reliance on Rule 144, without having to comply with the holding period requirement of Rule 144 and, in the case of non-affiliates, without having to comply with the public information, volume limitation or notice filing provisions of Rule 144. The SEC has indicated that Rule 701 will apply to typical stock options granted by an issuer before it becomes subject to the reporting requirements of the Exchange Act, along with the shares acquired upon exercise of such options, including exercises after the date of this prospectus.
Stock Issued Under Employee Plans
We intend to file a registration statement on Form S-8 under the Securities Act to register stock issuable under our LTIP, ESPP, and EIP. This registration statement on Form S-8 is expected to be filed following the effective date of the registration statement of which this prospectus is a part and will be effective upon filing. Accordingly, shares registered under such registration statement will be available for sale in the open market following the effective date, unless such shares are subject to vesting restrictions with us, Rule 144 restrictions applicable to our affiliates or the lock-up restrictions described above.
Registration Rights Agreement
Pursuant to the Registration Rights Agreement, we have granted certain stockholders, including affiliates of Crestview Partners II GP, L.P., demand registration rights, shelf registration rights and/or “piggyback” registration rights, in each case, with respect to certain shares of common stock owned by them. See “Certain Relationships and Related Party Transactions—Other Transactions with Affiliates—Registration Rights Agreement.”
135
Table of Contents
MATERIAL UNITED STATES FEDERAL INCOME TAX CONSIDERATIONS FOR NON-UNITED STATES HOLDERS
The following is a summary of the material United States federal income tax consequences related to the purchase, ownership and disposition of our common stock by a non-United States holder (as defined below), that holds our common stock as a “capital asset” (generally property held for investment). This summary is based on the provisions of the Code, United States Treasury regulations and administrative rulings and judicial decisions, all as in effect on the date hereof, and all of which are subject to change, possibly with retroactive effect. We have not sought any ruling from the IRS with respect to the statements made and the conclusions reached in the following summary, and there can be no assurance that the IRS or a court will agree with such statements and conclusions.
This summary does not address all aspects of United States federal income taxation that may be relevant to non-United States holders in light of their particular circumstances. In addition, this summary does not address provisions of the Code, the Medicare tax on certain investment income, any United States federal estate and gift tax laws, any state, local or non-U.S. tax laws or any tax treaties. This summary also does not address tax considerations applicable to investors that may be subject to special treatment under the United States federal income tax laws, such as (without limitation):
| • | banks, insurance companies or other financial institutions; |
| • | tax-exempt or governmental organizations; |
| • | dealers in securities or foreign currencies; |
| • | traders in securities that use the mark-to-market method of accounting for United States federal income tax purposes; |
| • | persons subject to the alternative minimum tax; |
| • | partnerships or other pass-through entities for United States federal income tax purposes or holders of interests therein; |
| • | persons we have entered into a constructive sale with respect to our common stock under the provisions of the Code; |
| • | persons that acquired our common stock through the exercise of employee stock options or otherwise as compensation or through a tax-qualified retirement plan; |
| • | certain former citizens or long-term residents of the United States; and |
| • | persons that hold our common stock as part of a straddle, appreciated financial position, synthetic security, hedge, conversion transaction or other integrated investment or risk reduction transaction. |
PROSPECTIVE INVESTORS ARE ENCOURAGED TO CONSULT THEIR TAX ADVISOR WITH RESPECT TO THE APPLICATION OF THE UNITED STATES FEDERAL INCOME TAX LAWS TO THEIR PARTICULAR SITUATION, AS WELL AS ANY TAX CONSEQUENCES OF THE PURCHASE, OWNERSHIP AND DISPOSITION OF OUR COMMON STOCK ARISING UNDER THE UNITED STATES FEDERAL ESTATE AND GIFT TAX LAWS OR UNDER THE LAWS OF ANY STATE, LOCAL, NON-UNITED STATES OR OTHER TAXING JURISDICTION.
Non-United States Holder Defined
For purposes of this discussion, a “non-United States holder” is a beneficial owner of our common stock that is not for United States federal income tax purposes any of the following:
| • | an individual who is a citizen or resident of the United States; |
136
Table of Contents
| • | a corporation (or other entity taxable as a corporation for United States federal income tax purposes) created or organized in or under the laws of the United States, any state thereof or the District of Columbia; |
| • | an estate, the income of which is subject to United States federal income tax regardless of its source; or |
| • | a trust (i) whose administration is subject to the primary supervision of a United States court and which has one or more United States persons who have the authority to control all substantial decisions of the trust or (ii) which has made a valid election under applicable United States Treasury regulations to be treated as a United States person. |
If a partnership (including an entity treated as a partnership for United States federal income tax purposes) holds our common stock, the tax treatment of a partner in the partnership generally will depend upon the status of the partner and upon the activities of the partnership. Accordingly, we urge partners in partnerships (including entities treated as partnerships for United States federal income tax purposes) considering the purchase of our common stock to consult their tax advisors regarding the United States federal income tax considerations of the purchase, ownership and disposition of our common stock by such partnership.
Distributions
Distributions of cash or property on our common stock will constitute dividends for United States federal income tax purposes to the extent paid from our current or accumulated earnings and profits, as determined under United States federal income tax principles. To the extent those distributions exceed our current and accumulated earnings and profits, the distributions will be treated as a non-taxable return of capital to the extent of the non-United States holder’s tax basis in our common stock and thereafter as capital gain from the sale or exchange of such common stock. See “—Gain on Disposition of Common Stock.” Any distribution made to a non-United States holder on our common stock generally will be subject to United States withholding tax at a rate of 30% of the gross amount of the distribution unless an applicable income tax treaty provides for a lower rate. To receive the benefit of a reduced treaty rate, a non-United States holder must provide the withholding agent with an applicable IRS Form W-8 (or other appropriate form) certifying qualification for the reduced rate.
Dividends paid to a non-United States holder that are effectively connected with a trade or business conducted by the non-United States holder in the United States (and, if required by an applicable income tax treaty, are treated as attributable to a permanent establishment maintained by the non-United States holder in the United States) generally will be taxed on a net income basis at the rates and in the manner generally applicable to United States persons (as defined under the Code). Such effectively connected dividends will not be subject to United States withholding tax if the non-United States holder satisfies certain certification requirements by providing the withholding agent a properly executed IRS Form W-8ECI certifying eligibility for exemption. If the non-United States holder is a foreign corporation, it may also be subject to a branch profits tax (at a 30% rate or such lower rate as specified by an applicable income tax treaty) on its effectively connected earnings and profits (as adjusted for certain items).
Gain on Disposition of Common Stock
A non-United States holder generally will not be subject to United States federal income tax on any gain realized upon the sale or other disposition of our common stock unless:
| • | the non-United States holder is an individual who is present in the United States for a period or periods aggregating 183 days or more during the calendar year in which the sale or disposition occurs and certain other conditions are met; |
| • | the gain is effectively connected with a trade or business conducted by the non-United States holder in the United States (and, if required by an applicable tax treaty, is attributable to a permanent establishment maintained by the non-United States holder in the United States); or |
137
Table of Contents
| • | our common stock constitutes a United States real property interest (“USRPI”) by reason of our status as a United States real property holding corporation (“USRPHC”) for United States federal income tax purposes. |
A non-United States holder described in the first bullet point above will be subject to United States federal income tax at a rate of 30% (or such lower rate as specified by an applicable income tax treaty) on the amount of such gain, which generally may be offset by United States source capital losses.
A non-United States holder whose gain is described in the second bullet point above generally will be taxed on a net income basis at the rates and in the manner generally applicable to United States persons (as defined under the Code) unless an applicable income tax treaty provides otherwise. If the non-United States holder is a corporation, it may also be subject to a branch profits tax (at a 30% rate or such lower rate as specified by an applicable income tax treaty) on its effectively connected earnings and profits (as adjusted for certain items) which will include such gain.
Generally, a corporation is a USRPHC if the fair market value of its USRPIs equals 50% or more of the sum of the fair market value of: (i) its worldwide real property interests and (ii) its other assets used or held for use in a trade or business. The tax relating to stock in a USRPHC does not apply to a non-United States holder whose holdings, actual and constructive, amount to 5% or less of our common stock at all times during the applicable period, provided that our common stock is regularly traded on an established securities market. We believe we are not currently a USRPHC, and do not anticipate being a USRPHC in the future. No assurance can be given, however, that we will not be a USRPHC or that our common stock will be considered regularly traded on an established securities market when a non-United States holder disposes of shares of our common stock.
Non-United States holders should consult their tax advisors with respect to the application of the foregoing rules to their ownership and disposition of our common stock.
Backup Withholding and Information Reporting
Any dividends paid to a non-United States holder must be reported annually to the IRS and to the non-United States holder. Copies of these information returns may be made available to the tax authorities in the country in which the non-United States holder resides or is established. Payments of dividends to a non-United States holder generally will not be subject to backup withholding if the non-United States holder establishes an exemption by properly certifying its non-United States status on an IRS Form W-8BEN, W-8BEN-E or other appropriate version of IRS Form W-8.
Payments of the proceeds from a sale or other disposition by a non-United States holder of our common stock effected by or through a United States office of a broker generally will be subject to information reporting and backup withholding (at the applicable rate) unless the non-United States holder (i) properly certifies its non-United States status on an IRS Form W-8BEN, W-8BEN-E or other appropriate version of IRS Form W-8 and certain other conditions are met or (ii) otherwise establishes an exemption. Information reporting and backup withholding generally will not apply to any payment of the proceeds from a sale or other disposition of our common stock effected outside the United States by a foreign office of a broker. However, unless such broker has documentary evidence in its records that the holder is a non-United States holder and certain other conditions are met, or the non-United States holder otherwise establishes an exemption, information reporting will apply to a payment of the proceeds of the disposition of our common stock effected outside the United States by such a broker if it has certain relationships within the United States.
Backup withholding is not an additional tax. Rather, the United States income tax liability (if any) of persons subject to backup withholding will be reduced by the amount of tax withheld. If withholding results in an overpayment of taxes, a refund may be obtained, provided that the required information is timely furnished to the IRS.
138
Table of Contents
Additional Withholding Requirements
Sections 1471 through 1474 of the Code, and the Treasury regulations and administrative guidance issued thereunder, impose a 30% withholding tax on any dividends on our common stock and on the gross proceeds from a disposition of our common stock in each case if paid to a “foreign financial institution” or a “non-financial foreign entity” (each as defined in the Code) (including, in some cases, when such foreign financial institution or entity is acting as an intermediary), unless (i) in the case of a foreign financial institution, such institution enters into an agreement with the United States government to withhold on certain payments, and to collect and provide to the United States tax authorities substantial information regarding United States account holders of such institution (which includes certain equity and debt holders of such institution, as well as certain account holders that are foreign entities with United States owners), (ii) in the case of a non-financial foreign entity, such entity certifies that it does not have any “substantial United States owners” (as defined in the Code) or provides the withholding agent with a certification identifying the direct and indirect substantial United States owners of the entity, or (iii) the foreign financial institution or non-financial foreign entity otherwise qualifies for an exemption from these rules. Foreign financial institutions located in jurisdictions that have an intergovernmental agreement with the United States governing these rules may be subject to different rules. Under certain circumstances, a holder might be eligible for refunds or credits of such taxes.
Payments subject to withholding tax under this law generally include dividends paid on common stock of a United States corporation, and gross proceeds from sales or other dispositions of such common stock after December 31, 2016. Non-United States holders are encouraged to consult their tax advisors regarding the possible implications of these withholding rules.
INVESTORS CONSIDERING THE PURCHASE OF OUR COMMON STOCK ARE URGED TO CONSULT THEIR OWN TAX ADVISORS REGARDING THE APPLICATION OF THE UNITED STATES FEDERAL INCOME TAX LAWS TO THEIR PARTICULAR SITUATIONS AND THE APPLICABILITY AND EFFECT OF UNITED STATES FEDERAL ESTATE AND GIFT TAX LAWS AND ANY STATE, LOCAL OR FOREIGN TAX LAWS AND TAX TREATIES.
139
Table of Contents
UNDERWRITING (CONFLICTS OF INTEREST)
Barclays Capital Inc. and Morgan Stanley & Co. LLC are acting as the representatives of the underwriters and joint book-running managers of this offering. Under the terms of an underwriting agreement, which will be filed as an exhibit to the registration statement, each of the underwriters named below has severally agreed to purchase the respective number of shares of common stock shown opposite its name below:
| Underwriters |
Number of Shares |
|||
| Barclays Capital Inc. |
||||
| Morgan Stanley & Co. LLC |
||||
| Jefferies LLC |
||||
| Macquarie Capital (USA) Inc. |
||||
| RBC Capital Markets, LLC |
||||
| Nomura Securities International, Inc. |
||||
| Stifel, Nicolaus & Company, Incorporated |
||||
|
|
|
|||
| Total |
13,000,000 | |||
|
|
|
|||
The underwriting agreement provides that the underwriters’ obligation to purchase shares of common stock depends on the satisfaction of the conditions contained in the underwriting agreement including:
| • | the obligation to purchase all of the shares of common stock offered hereby (other than those shares of common stock covered by their option to purchase additional shares as described below), if any of the shares are purchased; |
| • | the representations and warranties made by us to the underwriters are true; |
| • | there is no material change in our business or the financial markets; and |
| • | we deliver customary closing documents to the underwriters. |
Commissions and Expenses
The following table summarizes the underwriting discounts and commissions we will pay to the underwriters. These amounts are shown assuming both no exercise and full exercise of the underwriters’ option to purchase additional shares. The underwriting fee is the difference between the initial price to the public and the amount the underwriters pay for the shares.
| No Exercise | Full Exercise | |||||||
| Per Share |
$ | $ | ||||||
| Total |
$ | $ | ||||||
The representatives have advised us that the underwriters propose to offer the shares of common stock directly to the public at the public offering price on the cover of this prospectus and to selected dealers, which may include the underwriters, at such offering price less a selling concession not in excess of $ per share. After the offering, the representatives may change the offering price and other selling terms.
The expenses of the offering are estimated to be approximately $4,500,000 (excluding underwriting discounts and commissions). We have agreed to reimburse the underwriters for expenses related to clearance of this offering by the Financial Industry Regulatory Authority, Inc., which we estimate to be approximately $ .
140
Table of Contents
Option to Purchase Additional Shares
We granted the underwriters an option exercisable for 30 days after the date of this prospectus to purchase, from time to time, in whole or in part, up to an aggregate of 1,950,000 shares from us at the public offering price less underwriting discounts and commissions. This option may be exercised to the extent the underwriters sell more than 13,000,000 shares in connection with this offering. To the extent that this option is exercised, each underwriter will be obligated, subject to certain conditions, to purchase its pro rata portion of these additional shares based on the underwriter’s percentage underwriting commitment in the offering as indicated in the table at the beginning of this “Underwriting (Conflicts of Interest)” Section.
Lock-Up Agreements
Company Lock-Up
We have agreed that, for a period of 180 days after the date of this prospectus, subject to certain limited exceptions as described below, we will not directly or indirectly, without the prior written consent of Barclays Capital Inc. and Morgan Stanley & Co. LLC, on behalf of the underwriters, (1) offer for sale, sell, pledge, or otherwise dispose of (or enter into any transaction or device that is designed to, or could be expected to, result in the disposition by any person at any time in the future of) any shares of common stock or securities convertible into or exercisable or exchangeable for common stock (other than the stock and shares issued pursuant to employee benefit plans, qualified stock option plans or other employee compensation plans existing on the date of this prospectus or pursuant to currently outstanding options, warrants or rights not issued under one of those plans), or sell or grant options, rights or warrants with respect to any shares of common stock or securities convertible into or exchangeable for common stock (other than the grant of options pursuant to employee benefit plans, option plans, qualified stock option plans or other employee compensation plans existing on the date of this prospectus), (2) enter into any swap or other derivatives transaction that transfers to another, in whole or in part, any of the economic benefits or risks of ownership of such shares of common stock, whether any such transaction described in clause (1) or (2) above is to be settled by delivery of common stock or other securities, in cash or otherwise, (3) file or cause to be filed a registration statement, including any amendments thereto, with respect to the registration of any shares of common stock or securities convertible, exercisable or exchangeable into common stock or any of our other securities (other than any registration statement on Form S-8), or (4) publicly disclose the intention to do any of the foregoing.
Director, Executive Officer and Stockholder Lock-Ups
All of our directors, executive officers and certain of our existing stockholders and option holders representing approximately 99% in the aggregate of our common stock, of our outstanding stock have agreed that, for a period of 180 days after the date of this prospectus, subject to certain limited exceptions, they will not directly or indirectly, without the prior written consent of Barclays Capital Inc. and Morgan Stanley & Co. LLC, on behalf of the underwriters, (1) offer for sale, sell, pledge, or otherwise dispose of (or enter into any transaction or device that is designed to, or could be expected to, result in the disposition by any person at any time in the future of) any shares of common stock (including, without limitation, shares of common stock that may be deemed to be beneficially owned by them in accordance with the rules and regulations of the SEC and shares of common stock that may be issued upon exercise of any options or warrants) or securities convertible into or exercisable or exchangeable for common stock (other than the shares of stock to be sold in this offering), (2) enter into any swap or other derivatives transaction that transfers to another, in whole or in part, any of the economic benefits or risks of ownership of shares of common stock, whether any such transaction described in clause (1) or (2) above is to be settled by delivery of common stock or other securities, in cash or otherwise, or (3) publicly disclose the intention to do any of the foregoing. Such parties have further agreed that they will only make a demand or request for, or exercise any right with respect to, or take any action in preparation of, the registration by us under the Securities Act to the extent that (i) no transfer of the shares of common stock registered pursuant to the exercise of any such right and no registration statement shall be filed under the Securities Act with respect to any of the shares of common stock during the period of 180 days after the date of this prospectus, and (ii) no public announcement of the demand or request shall be made prior to 180 days after the date of this prospectus.
141
Table of Contents
The restrictions described in the immediately preceding paragraph do not apply to (1) transactions relating to shares of common stock or other securities acquired in the open market after the completion of this offering, (2) bona fide gifts, sales, charitable contributions or other dispositions of shares of any class of our capital stock, provided that the transferee/donee agrees to be bound by the same restrictions and the transferor/donor notifies Barclays Capital Inc. and Morgan Stanley & Co. LLC at least two business days prior to the proposed transfer or disposition, (3) the exercise of warrants, the conversion of convertible securities or the exercise of stock options granted pursuant to our or our affiliates’ stock option/incentive plans or otherwise outstanding on the date hereof, provided that such restrictions apply to shares of common stock issued upon such exercise or conversion, (4) the establishment of any contract, instruction or plan that satisfies all of the requirements of Rule 10b5-1 under the Exchange Act, provided that no sales of common stock or securities convertible into, or exchangeable or exercisable for, common stock, may be made pursuant to a Rule 10b5-1 plan prior to 180 days after the date of this prospectus, and provided that we are not required to report the establishment of the Rule 10b5-1 plan in any public report or filing with the SEC under the Exchange Act for a period of 180 days after the date of this prospectus and do not otherwise voluntarily effect any such public filing or report regarding the Rule 10b5-1 plan, (5) transfers of common stock to any beneficiary or any trust, limited liability company, partnership or corporation for the direct or indirect benefit of the director, executive officer or holder, provided that the transferee/donee agrees to be bound by the same restrictions, or (6) withholdings by, or transfers, sales or other dispositions of common stock to, us or our affiliates in connection with the “net” or “cashless” exercise of, or to satisfy the withholding tax obligations (including estimated taxes) of director, executive officer or holder in connection with the “net” or “cashless” exercise or vesting of, common stock, profits interests, restricted stock, restricted stock units, profits units or other equity-based awards. It is a condition to any transaction pursuant to clauses (1), (2), (5) or (6) above that each party (transferor or transferee) shall not be required by law (including without limitation the disclosure requirements of the Securities Act and the Exchange Act) to make, and agrees to not voluntarily make, any filing with the SEC or public announcement of the transaction prior to 180 days after the date of this prospectus (other than a filing on Form 5 made when required).
If the director, executive officer or holder is a corporation, partnership, limited liability company or other entity, such corporation, partnership, limited liability company or other entity may transfer its common stock to another corporation, partnership, limited liability company or other entity that is an affiliate (as defined under Rule 12b-2 of the Exchange Act) or may make any distribution or dividend to its equity holders (including, without limitation, general or limited partners, members, stockholders or affiliates) including upon the liquidation and dissolution of such corporation, partnership, limited liability company or other entity pursuant to a plan of liquidation approved by its equity holders, provided that no transferor or transferee be required by law (including without limitation the disclosure requirements of the Securities Act and the Exchange Act) to make, and agrees to not voluntarily make, any filing with the SEC or public announcement of the transfer prior to 180 days after the date of this prospectus (other than a filing on Form 5 made when required), and provided further that the transferee/donee agrees to be bound by the same restrictions.
In addition, the directors, executive officers and holders shall be permitted to make transfers, sales, tenders or other dispositions of their common stock to a bona fide third party pursuant to a tender or exchange offer for our securities or other transaction, including, without limitation, a merger, consolidation or other business combination, involving a Change in Control (as defined in our credit agreements) that, in each case, has been approved by our board of directors (including, without limitation, entering into any lock-up, voting or similar agreement pursuant to which the directors, executive officers and holders may agree to transfer, sell, tender or otherwise dispose of their common stock in connection with any such transaction, or vote any of their common stock in favor of any such transaction), provided that all common stock that is not so transferred, sold, tendered or otherwise disposed of remains subject to the restrictions detailed above, and provided further that if such tender offer or other transaction is not completed, any of the common stock subject to these restrictions will remain subject to the restrictions detailed above.
Barclays Capital Inc. and Morgan Stanley & Co. LLC, in their sole discretion, may release the common stock and other securities subject to the lock-up agreements described above in whole or in part at any time.
142
Table of Contents
When determining whether or not to release common stock and other securities from lock-up agreements, Barclays Capital Inc. and Morgan Stanley & Co. LLC will consider, among other factors, the holder’s reasons for requesting the release, the number of shares of common stock and other securities for which the release is being requested and market conditions at the time. At least three business days before the effectiveness of any release or waiver of any of the restrictions described above with respect to an officer or director of the Company, Barclays Capital Inc. and Morgan Stanley & Co. LLC will notify us of the impending release or waiver and we have agreed to announce the impending release or waiver by press release through a major news service at least two business days before the effective date of the release or waiver, except where the release or waiver is effected solely to permit a transfer of common stock that is not for consideration and where the transferee has agreed in writing to be bound by the same terms as the lock-up agreements described above to the extent and for the duration that such terms remain in effect at the time of transfer.
As described below under “Directed Share Program,” any participants in the Directed Share Program shall be subject to a 180-day lock up with respect to any shares sold to them pursuant to that program. This lock up will have similar restrictions as the lock-up agreements described above. Any shares sold in the Directed Share Program to our directors or executive officers shall be subject to the lock-up agreement described above.
Offering Price Determination
Prior to this offering, there has been no public market for our common stock. The initial public offering price was negotiated between the representatives and us. In determining the initial public offering price of our common stock, the representatives considered:
| • | the history and prospects for the industry in which we compete; |
| • | our financial information; |
| • | the ability of our management and our business potential and earning prospects; |
| • | the prevailing securities markets at the time of this offering; and |
| • | the recent market prices of, and the demand for, publicly traded shares of generally comparable companies. |
Indemnification
We have agreed to indemnify the underwriters against certain liabilities, including liabilities under the Securities Act and, in the case of the Company only, liabilities incurred in connection with the directed share program referred to below, and to contribute to payments that the underwriters may be required to make for these liabilities.
Directed Share Program
At our request, the underwriters have reserved for sale at the initial public offering price up to 650,000 shares offered hereby for officers, directors, employees and certain other persons associated with us. The number of shares available for sale to the general public will be reduced to the extent such persons purchase such reserved shares. Any reserved shares not so purchased will be offered by the underwriters to the general public on the same basis as the other shares offered hereby. Any participants in this program shall be prohibited from selling, pledging or assigning any shares sold to them pursuant to this program for a period of 180 days after the date of this prospectus, in the same manner as described above under “—Lock-Up Agreements—Director, Executive Officer and Stockholder Lock-Ups.”
143
Table of Contents
Stabilization, Short Positions and Penalty Bids
The representatives may engage in stabilizing transactions, short sales and purchases to cover positions created by short sales, and penalty bids or purchases for the purpose of pegging, fixing or maintaining the price of the common stock, in accordance with Regulation M under the Exchange Act:
| • | Stabilizing transactions permit bids to purchase the underlying security so long as the stabilizing bids do not exceed a specified maximum. |
| • | A short position involves a sale by the underwriters of shares in excess of the number of shares the underwriters are obligated to purchase in the offering, which creates the syndicate short position. This short position may be either a covered short position or a naked short position. In a covered short position, the number of shares involved in the sales made by the underwriters in excess of the number of shares they are obligated to purchase is not greater than the number of shares that they may purchase by exercising their option to purchase additional shares. In a naked short position, the number of shares involved is greater than the number of shares in their option to purchase additional shares. The underwriters may close out any short position by either exercising their option to purchase additional shares and/or purchasing shares in the open market. In determining the source of shares to close out the short position, the underwriters will consider, among other things, the price of shares available for purchase in the open market as compared to the price at which they may purchase shares through their option to purchase additional shares. A naked short position is more likely to be created if the underwriters are concerned that there could be downward pressure on the price of the shares in the open market after pricing that could adversely affect investors who purchase in the offering. |
| • | Syndicate covering transactions involve purchases of the common stock in the open market after the distribution has been completed in order to cover syndicate short positions. |
| • | Penalty bids permit the representatives to reclaim a selling concession from a syndicate member when the common stock originally sold by the syndicate member is purchased in a stabilizing or syndicate covering transaction to cover syndicate short positions. |
These stabilizing transactions, syndicate covering transactions and penalty bids may have the effect of raising or maintaining the market price of our common stock or preventing or retarding a decline in the market price of the common stock. As a result, the price of the common stock may be higher than the price that might otherwise exist in the open market. These transactions may be effected on the NYSE or otherwise and, if commenced, may be discontinued at any time.
Neither we nor any of the underwriters make any representation or prediction as to the direction or magnitude of any effect that the transactions described above may have on the price of the common stock. In addition, neither we nor any of the underwriters make any representation that the representatives will engage in these stabilizing transactions or that any transaction, once commenced, will not be discontinued without notice.
Electronic Distribution
A prospectus in electronic format may be made available on the Internet sites or through other online services maintained by one or more of the underwriters participating in this offering, or by their affiliates. In those cases, prospective investors may view offering terms online and, depending upon the particular underwriter or selling group member, prospective investors may be allowed to place orders online. The underwriters may agree with us to allocate a specific number of shares for sale to online brokerage account holders. Any such allocation for online distributions will be made by the representatives on the same basis as other allocations.
Other than the prospectus in electronic format, the information on any underwriter’s web site and any information contained in any other web site maintained by an underwriter or selling group member is not part of the prospectus or the registration statement of which this prospectus forms a part, has not been approved and/or endorsed by us or any underwriter in its capacity as underwriter and should not be relied upon by investors.
144
Table of Contents
Exchange Listing
Our common stock has been approved for listing on the NYSE under the symbol “NEPG.”
Discretionary Sales
The underwriters have informed us that they do not expect to sell more than 5% of the common stock in the aggregate to accounts over which they exercise discretionary authority.
Stamp Taxes
If you purchase shares of common stock offered in this prospectus, you may be required to pay stamp taxes and other charges under the laws and practices of the country of purchase, in addition to the offering price listed on the cover page of this prospectus.
Other Relationships
The underwriters and certain of their affiliates are full service financial institutions engaged in various activities, which may include securities trading, commercial and investment banking, financial advisory, investment management, investment research, principal investment, hedging, financing and brokerage activities. The underwriters and certain of their affiliates have, from time to time, performed, and may in the future perform, various commercial and investment banking and financial advisory services for the issuer and its affiliates, for which they received or may in the future receive customary fees and expenses. In particular, affiliates of each of Barclays Capital Inc. and Morgan Stanley & Co. LLC have acted as arrangers for and/or lenders under our credit facilities. In addition, an affiliate of Macquarie Capital (USA) Inc. is acting as sole financial advisor to CMI in connection with the CMI acquisition. In connection with these transactions, such underwriters and/or their affiliates may have received customary fees for its services and certain of its expenses may have been reimbursed.
In the ordinary course of their various business activities, the underwriters and certain of their affiliates may make or hold a broad array of investments and actively trade debt and equity securities (or related derivative securities) and financial instruments (including bank loans) for their own account and for the accounts of their customers, and such investment and securities activities may involve securities and/or instruments of the issuer or its affiliates. If the underwriters or their affiliates have a lending relationship with us, certain of those underwriters or their affiliates routinely hedge, and certain other of those underwriters or their affiliates may hedge, their credit exposure to us consistent with their customary risk management policies. Typically, the underwriters and their affiliates would hedge such exposure by entering into transactions which consist of either the purchase of credit default swaps or the creation of short positions in our securities or the securities of our affiliates, including potentially the shares of common stock offered hereby. Any such credit default swaps or short positions could adversely affect future trading prices of the shares of common stock offered hereby. The underwriters and certain of their affiliates may also communicate independent investment recommendations, market color or trading ideas and/or publish or express independent research views in respect of such securities or instruments and may at any time hold, or recommend to clients that they acquire, long and/or short positions in such securities and instruments.
Selling Restrictions
This prospectus does not constitute an offer to sell to, or a solicitation of an offer to buy from, anyone in any country or jurisdiction (i) in which such an offer or solicitation is not authorized, (ii) in which any person making such offer or solicitation is not qualified to do so or (iii) in which any such offer or solicitation would otherwise be unlawful. No action has been taken that would, or is intended to, permit a public offer of the shares of common stock or possession or distribution of this prospectus or any other offering or publicity material relating to the shares of common stock in any country or jurisdiction (other than the United States) where any such action for that purpose is required. Accordingly, each underwriter has undertaken that it will not, directly or indirectly, offer or sell any shares of common stock or have in its possession, distribute or publish any prospectus, form of
145
Table of Contents
application, advertisement or other document or information in any country or jurisdiction except under circumstances that will, to the best of its knowledge and belief, result in compliance with any applicable laws and regulations and all offers and sales of shares of common stock by it will be made on the same terms.
European Economic Area
In relation to each Member State of the European Economic Area which has implemented the Prospectus Directive (each, a “Relevant Member State”) an offer to the public of any common stock which are the subject of the offering contemplated herein may not be made in that Relevant Member State, except that an offer to the public in that Relevant Member State of any common stock may be made at any time under the following exemptions under the Prospectus Directive, if they have been implemented in that Relevant Member State:
| • | to legal entities which are qualified investors as defined under the Prospectus Directive; |
| • | by the underwriters to fewer than 100, or, if the Relevant Member State has implemented the relevant provisions of the 2010 PD Amending Directive, 150, natural or legal persons (other than qualified investors as defined in the Prospectus Directive), as permitted under the Prospectus Directive, subject to obtaining the prior consent of the representatives of the underwriters for any such offer; or |
| • | in any other circumstances falling within Article 3(2) of the Prospectus Directive, |
provided that no such offer of common stock shall result in a requirement for us or any underwriter to publish a prospectus pursuant to Article 3 of the Prospectus Directive or supplement a prospectus pursuant to Article 16 of the Prospectus Directive.
Each person in a Relevant Member State who receives any communication in respect of, or who acquires any common stock under, the offers contemplated here in this prospectus will be deemed to have represented, warranted and agreed to and with each underwriter and us that:
| • | it is a qualified investor as defined under the Prospectus Directive; and |
| • | in the case of any common stock acquired by it as a financial intermediary, as that term is used in Article 3(2) of the Prospectus Directive, (i) the common stock acquired by it in the offering have not been acquired on behalf of, nor have they been acquired with a view to their offer or resale to, persons in any Relevant Member State other than qualified investors, as that term is defined in the Prospectus Directive, or in the circumstances in which the prior consent of the representatives of the underwriters has been given to the offer or resale or (ii) where common stock have been acquired by it on behalf of persons in any Relevant Member State other than qualified investors, the offer of such common stock to it is not treated under the Prospectus Directive as having been made to such persons. |
For the purposes of this representation and the provision above, the expression an “offer of common stock to the public” in relation to any common stock in any Relevant Member State means the communication in any form and by any means of sufficient information on the terms of the offer and any common stock to be offered so as to enable an investor to decide to purchase or subscribe for the common stock, as the same may be varied in that Relevant Member State by any measure implementing the Prospectus Directive in that Relevant Member State, the expression “Prospectus Directive” means Directive 2003/71/EC (and amendments thereto, including the 2010 PD Amending Directive, to the extent implemented in the Relevant Member State), and includes any relevant implementing measure in each Relevant Member State and the expression “2010 PD Amending Directive” means Directive 2010/73/EU.
United Kingdom
This prospectus has only been communicated or caused to have been communicated and will only be communicated or caused to be communicated as an invitation or inducement to engage in investment activity (within the meaning of Section 21 of the Financial Services and Markets Act of 2000 (the “FSMA”)) as received in connection with the issue or sale of the common stock in circumstances in which Section 21(1) of the FSMA does not apply to us. All applicable provisions of the FSMA will be complied with in respect to anything done in relation to the common stock in, from or otherwise involving the U.K.
146
Table of Contents
Switzerland
The shares may not be publicly offered in Switzerland and will not be listed on the SIX Swiss Exchange (SIX) or on any other stock exchange or regulated trading facility in Switzerland. This document has been prepared without regard to the disclosure standards for issuance prospectuses under art. 652a or art. 1156 of the Swiss Code of Obligations or the disclosure standards for listing prospectuses under art. 27 ff. of the SIX Listing Rules or the listing rules of any other stock exchange or regulated trading facility in Switzerland. Neither this document nor any other offering or marketing material relating to the shares or the offering may be publicly distributed or otherwise made publicly available in Switzerland. Neither this document nor any other offering or marketing material relating to the offering, the Company, or the shares have been or will be filed with or approved by any Swiss regulatory authority. In particular, this document will not be filed with, and the offer of shares will not be supervised by, the Swiss Financial Market Supervisory Authority FINMA (FINMA), and the offer of shares has not been and will not be authorized under the Swiss Federal Act on Collective Investment Schemes (CISA). The investor protection afforded to acquirers of interests in collective investment schemes under the CISA does not extend to acquirers of the shares.
Japan
The securities have not been and will not be registered under the Financial Instruments and Exchange Law of Japan (the Financial Instruments and Exchange Law) and each underwriter has agreed that it will not offer or sell any securities, directly or indirectly, in Japan or to, or for the benefit of, any resident of Japan (which term as used herein means any person resident in Japan, including any corporation or other entity organized under the laws of Japan), or to others for re-offering or resale, directly or indirectly, in Japan or to a resident of Japan, except pursuant to an exemption from the registration requirements of, and otherwise in compliance with, the Financial Instruments and Exchange Law and any other applicable laws, regulations and ministerial guidelines of Japan.
Taiwan
The shares have not been and will not be registered with the Financial Supervisory Commission of Taiwan pursuant to relevant securities laws and regulations and may not be sold, issued or offered within Taiwan through a public offering or in circumstances which constitutes an offer within the meaning of the Securities and Exchange Act of Taiwan that requires a registration or approval of the Financial Supervisory Commission of Taiwan. No person or entity in Taiwan has been authorized to offer, sell, give advice regarding or otherwise intermediate the offering and sale of the shares in Taiwan.
Hong Kong
The contents of this document have not been reviewed or approved by any regulatory authority in Hong Kong. This document does not constitute an offer or invitation to the public in Hong Kong to acquire shares. Accordingly, unless permitted by the securities laws of Hong Kong, no person may issue or have in its possession for the purposes of issue, this document or any advertisement, invitation or document relating to the shares, whether in Hong Kong or elsewhere, which is directed at, or the contents of which are likely to be accessed or read by, the public in Hong Kong other than in relation to shares which are intended to be disposed of only to persons outside Hong Kong or only to “professional investors” (as such term is defined in the Securities and Futures Ordinance (Cap. 571, Laws of Hong Kong) (the “SFO”) and the subsidiary legislation made thereunder); or in circumstances which do not result in this document being a “prospectus” as defined in the Companies (Winding Up and Miscellaneous Provisions) Ordinance (Cap. 32, Laws of Hong Kong) (the “CO”); or which do not constitute an offer or an invitation to the public for the purposes of the SFO or the CO. The offer of the shares is personal to the person to whom this document has been delivered, and a subscription for shares will only be accepted from such person. No person to whom a copy of this document is issued may issue, circulate or distribute this document in Hong Kong, or make or give a copy of this document to any other person. You are advised to exercise caution in relation to the offer. If you are in any doubt about any of the contents of this document, you should obtain independent professional advice.
147
Table of Contents
Singapore
This prospectus has not been registered as a prospectus with the Monetary Authority of Singapore. Accordingly, this prospectus and any other document or material in connection with the offer or sale, or invitation for subscription or purchase, of the shares may not be circulated or distributed, nor may the shares be offered or sold, or be made the subject of an invitation for subscription or purchase, whether directly or indirectly, to persons in Singapore other than (i) to an institutional investor pursuant to Section 274 of the Securities and Futures Act, Chapter 289 of Singapore (the “SFA”), (ii) to a relevant person (as defined in Section 275(2) of the SFA), or any person pursuant to Section 275(1A), and in accordance with the conditions, specified in Section 275 of the SFA, or (iii) otherwise pursuant to, and in accordance with the conditions of, any other applicable provision of the SFA.
Where the shares are subscribed or purchased pursuant to an offer made in reliance on Section 275 of the SFA by a relevant person which is:
| • | a corporation (which is not an accredited investor) the sole business of which is to hold investments and the entire share capital of which is owned by one or more individuals, each of whom is an accredited investor; or |
| • | a trust (where the trustee is not an accredited investor) whose sole purpose is to hold investments and each beneficiary of the trust is an accredited investor, |
shares, debentures and units of shares, and debentures of that corporation, or the beneficiaries’ rights and interest (howsoever described) in that trust shall not be transferable for six months after that corporation or that trust has acquired the shares under Section 275 except:
| • | to an institutional investor or to a relevant person (as defined in Section 275(2) of the SFA), or any person pursuant to Section 275(1A) of the SFA (in the case of that corporation) or Section 276(4)(i)(B) of the SFA (in the case of that trust); |
| • | where no consideration is or will be given for the transfer; or |
| • | where the transfer is by operation of law. |
Conflicts of Interest
In connection with the repayment of certain borrowings under our credit facilities, affiliates of each of Barclays Capital Inc. and Morgan Stanley & Co. LLC are expected to receive a portion of the net proceeds of this offering in their capacities as lenders. See “Use of Proceeds.” These proceeds will give the affiliates of Barclays Capital Inc. and Morgan Stanley & Co. LLC more than 5% of the proceeds of this offering, and consequently, each of Barclays Capital Inc. and Morgan Stanley & Co. LLC will be deemed to have a “conflict of interest” within the meaning of FINRA Rule 5121(f)(5)(C). Accordingly, this offering will be made in compliance with the applicable provisions of Rule 5121. As such, any underwriter that has a conflict of interest pursuant to Rule 5121 will not confirm sales to accounts in which it exercises discretionary authority without the prior written consent of the customer. Pursuant to Rule 5121, a “qualified independent underwriter” (as defined in Rule 5121) must participate in the preparation of the prospectus and perform its usual standard of due diligence with respect to the registration statement and this prospectus. RBC Capital Markets, LLC has agreed to act as qualified independent underwriter for the offering and to undertake the legal responsibilities and liabilities of an underwriter under the Securities Act of 1933, as amended, or the Securities Act, specifically including those inherent in Section 11 of the Securities Act. We have also agreed to indemnify RBC Capital Markets, LLC against certain liabilities incurred in connection with it acting as a qualified independent underwriter in this offering, including liabilities under the Securities Act.
148
Table of Contents
The validity of the common stock offered hereby will be passed upon for us by Vinson & Elkins, L.L.P., Houston, Texas. Certain legal matters will be passed upon for the underwriters by Davis Polk & Wardwell LLP, New York, New York.
The financial statements as of December 31, 2014 and 2013, and for the years ended December 31, 2014 and 2013, the period from December 24, 2012 to December 31, 2012 (the “Successor Periods”), the period from January 1, 2012 to December 23, 2012 (the “Predecessor Period”), and the related financial statement schedule included in this Prospectus have been audited by Deloitte & Touche LLP, an independent registered public accounting firm, as stated in their report appearing herein (which report expresses an unqualified opinion on the financial statements and financial statement schedule and includes an explanatory paragraph referring to the acquisition of ASP NEP/NCP Holdco, Inc. using the acquisition method of accounting). Such financial statements and financial statement schedule have been so included in reliance upon the report of such firm given upon their authority as experts in accounting and auditing.
WHERE YOU CAN FIND MORE INFORMATION
We have filed with the SEC a registration statement on Form S-1 under the Securities Act to register our common stock being offered in this prospectus. This prospectus, which forms part of the registration statement, does not contain all of the information included in the registration statement and the attached exhibits. You will find additional information about us and our common stock in the registration statement. References in this prospectus to any of our contracts, agreements or other documents are not necessarily complete, and you should refer to the exhibits attached to the registration statement for copies of the actual contracts, agreements or documents.
You may read and copy the registration statement, the related exhibits and other information we file with the SEC at the SEC’s Public Reference Room at 100 F Street, N.E., Room 1580, Washington, D.C. 20549. You may also obtain copies of this information by mail from the Public Reference Room at prescribed rates. You may obtain information regarding the operation of the Public Reference Room by calling 1-800-SEC-0330. The SEC also maintains a website that contains reports, proxy statements and other information about companies like us who file electronically with the SEC. The address of that website is http://www.sec.gov. This reference to the SEC’s website is an inactive textual reference only and is not a hyperlink.
Upon the effectiveness of the registration statement, we will be subject to the reporting, proxy and information requirements of the Exchange Act, and will be required to file periodic reports, proxy statements and other information with the SEC. These periodic reports, proxy statements and other information will be available for inspection and copying at the SEC’s Public Reference Room and the website of the SEC referred to above, as well as on our website, http://www.nepinc.com. This reference to our website is an inactive textual reference only and is not a hyperlink. The contents of our website are not part of this prospectus, and you should not consider the contents of our website in making an investment decision with respect to our common stock. We will furnish our stockholders with annual reports containing audited financial statements and quarterly reports containing unaudited interim financial statements for each of the first three quarters of each year.
149
Table of Contents
INDEX TO CONSOLIDATED FINANCIAL STATEMENTS
| NEP Group, Inc. |
||||
| Condensed Consolidated Financial Statements |
||||
| Condensed Consolidated Balance Sheet as of December 31, 2014 and March 31, 2015 (Unaudited) |
F-2 | |||
| F-3 | ||||
| F-4 | ||||
| F-5 | ||||
| Notes to the Condensed Consolidated Financial Statements (Unaudited) |
F-6 | |||
| NEP Group, Inc. (Successor) and ASP NEP/NCP Holdco, Inc. (Predecessor) |
||||
| Consolidated Financial Statements |
||||
| F-21 | ||||
| Consolidated Balance Sheets as of December 31, 2013 and 2014 |
F-22 | |||
| F-23 | ||||
| F-24 | ||||
| F-25 | ||||
| F-26 | ||||
| Schedule II |
||||
| F-55 | ||||
F-1
Table of Contents
NEP Group, Inc. and Subsidiaries
Condensed Consolidated Balance Sheets
(Amounts in thousands, except shares and per share amounts)
(Unaudited)
| December 31, 2014 |
March 31, 2015 |
|||||||
| Assets |
||||||||
| Current assets: |
||||||||
| Cash and cash equivalents |
$ | 6,806 | $ | 9,623 | ||||
| Accounts receivable, net of allowance for doubtful accounts of $2,083 and $2,312 at December 31, 2014 and March 31, 2015, respectively |
60,319 | 55,209 | ||||||
| Deferred income taxes |
7,279 | 7,323 | ||||||
| Prepaid expenses and other current assets |
8,969 | 9,822 | ||||||
|
|
|
|
|
|||||
| Total current assets |
83,373 | 81,977 | ||||||
| Property, plant, and equipment, net |
401,437 | 403,205 | ||||||
| Other assets |
366 | 366 | ||||||
| Intangibles, net |
94,081 | 89,607 | ||||||
| Goodwill |
537,834 | 535,552 | ||||||
|
|
|
|
|
|||||
| Total assets |
$ | 1,117,091 | $ | 1,110,707 | ||||
|
|
|
|
|
|||||
| Liabilities and shareholders’ equity |
||||||||
| Current liabilities: |
||||||||
| Accounts payable |
$ | 19,196 | $ | 32,313 | ||||
| Accrued expenses |
25,386 | 24,512 | ||||||
| Current portion of long-term debt |
8,395 | 8,114 | ||||||
| Current portion of capital lease obligations |
12,916 | 10,410 | ||||||
| Deferred revenue |
5,410 | 6,664 | ||||||
|
|
|
|
|
|||||
| Total current liabilities |
71,303 | 82,013 | ||||||
| Long-term debt |
850,375 | 872,887 | ||||||
| Capital lease obligations |
31,730 | 29,053 | ||||||
| Other liabilities |
3,808 | 3,321 | ||||||
| Deferred taxes |
24,061 | 29,440 | ||||||
|
|
|
|
|
|||||
| Total liabilities |
$ | 981,277 | $ | 1,016,714 | ||||
| Commitments and contingencies (Note 8) |
||||||||
| Shareholders’ equity: |
||||||||
| Common stock: $0.01 par value; 400,000,000 shares authorized: 22,411,227 and 22,498,930 shares issued and outstanding at December 31, 2014 and March 31, 2015, respectively |
224 | 225 | ||||||
| Accumulated other comprehensive (loss) |
(7,758 | ) | (15,467 | ) | ||||
| Additional paid-in capital |
213,480 | 215,280 | ||||||
| Stock subscription |
(100 | ) | (100 | ) | ||||
| Retained deficit |
(70,032 | ) | (105,945 | ) | ||||
|
|
|
|
|
|||||
| Total shareholders’ equity |
135,814 | 93,993 | ||||||
|
|
|
|
|
|||||
| Total liabilities and shareholders’ equity |
$ | 1,117,091 | $ | 1,110,707 | ||||
|
|
|
|
|
|||||
See accompanying notes.
F-2
Table of Contents
NEP Group, Inc. and Subsidiaries
Condensed Consolidated Statements of Operations and Comprehensive Income (Loss)
(Amounts in thousands, except shares and per share amounts)
(Unaudited)
| Three Months Ended March 31, | ||||||||
| 2014 (as restated – see Note 15) |
2015 | |||||||
| Revenue |
$ | 95,171 | $ | 103,143 | ||||
| Costs of services, exclusive of depreciation and amortization |
32,765 | 31,526 | ||||||
| Engineering |
19,468 | 21,211 | ||||||
| Selling, general, and administrative |
18,054 | 21,536 | ||||||
| Depreciation and amortization |
30,181 | 36,929 | ||||||
|
|
|
|
|
|||||
| Loss from operations |
(5,297 | ) | (8,059 | ) | ||||
| Interest expense |
10,309 | 11,854 | ||||||
| Write-off of debt issuance costs |
451 | — | ||||||
| Other income |
(2,845 | ) | (1,595 | ) | ||||
| Other expense |
704 | 12,736 | ||||||
|
|
|
|
|
|||||
| Loss before income taxes |
(13,916 | ) | (31,054 | ) | ||||
| Income tax benefit (expense) |
3,199 | (4,859 | ) | |||||
|
|
|
|
|
|||||
| Net loss |
(10,717 | ) | (35,913 | ) | ||||
| Foreign translation adjustment |
3,681 | (7,709 | ) | |||||
|
|
|
|
|
|||||
| Comprehensive loss |
$ | (7,036 | ) | $ | (43,622 | ) | ||
|
|
|
|
|
|||||
| Earnings Per Common Share |
||||||||
| Basic |
||||||||
| Net loss attributable to common shareholders |
$ | (0.49) | $ | (1.60) | ||||
| Diluted |
||||||||
| Net loss attributable to common shareholders |
$ | (0.49) | $ | (1.60) | ||||
| Weighted average shares outstanding |
||||||||
| Basic |
22,066,421 | 22,474,929 | ||||||
| Diluted |
22,066,421 | 22,474,929 | ||||||
See accompanying notes.
F-3
Table of Contents
NEP Group, Inc. and Subsidiaries
Condensed Consolidated Statements of Shareholders’ Equity
(Amounts in thousands, except share amounts)
(Unaudited)
| Common Shares |
Common Stock |
Accumulated Other Comprehensive Income (as restated – see Note 15) |
Additional Paid-In Capital |
Stock Subscription |
Retained Deficit (as restated – see Note 15) |
Total (as restated – see Note 15) |
||||||||||||||||||||||
| Balance as of December 31, 2013 |
21,825,842 | $ | 218 | $ | 722 | $ | 204,446 | $ | (450 | ) | $ | (28,817 | ) | $ | 176,119 | |||||||||||||
| Foreign translation adjustment |
— | — | 3,681 | — | — | — | 3,681 | |||||||||||||||||||||
| Issuance of capital stock |
311,349 | 3 | — | 3,030 | — | — | 3,033 | |||||||||||||||||||||
| Stock-based compensation |
— | — | — | 490 | — | — | 490 | |||||||||||||||||||||
| Net loss |
— | — | — | — | — | (10,717 | ) | (10,717 | ) | |||||||||||||||||||
|
|
|
|
|
|
|
|
|
|
|
|
|
|
|
|||||||||||||||
| Balance as of March 31, 2014 |
22,137,191 | $ | 221 | $ | 4,403 | $ | 207,966 | $ | (450 | ) | $ | (39,534 | ) | $ | 172,606 | |||||||||||||
|
|
|
|
|
|
|
|
|
|
|
|
|
|
|
|||||||||||||||
| Common Shares |
Common Stock |
Accumulated Other Comprehensive Loss |
Additional Paid-In Capital |
Stock Subscription |
Retained Deficit |
Total | ||||||||||||||||||||||
| Balance as of December 31, 2014 |
22,411,227 | $ | 224 | $ | (7,758 | ) | $ | 213,480 | $ | (100 | ) | $ | (70,032 | ) | $ | 135,814 | ||||||||||||
| Foreign translation adjustment |
— | — | (7,709 | ) | — | — | — | (7,709 | ) | |||||||||||||||||||
| Issuance of capital stock |
87,703 | 1 | — | 1,252 | — | — | 1,253 | |||||||||||||||||||||
| Stock-based compensation |
— | — | — | 548 | — | — | 548 | |||||||||||||||||||||
| Net loss |
— | — | — | — | — | (35,913 | ) | (35,913 | ) | |||||||||||||||||||
|
|
|
|
|
|
|
|
|
|
|
|
|
|
|
|||||||||||||||
| Balance as of March 31, 2015 |
22,498,930 | $ | 225 | $ | (15,467 | ) | $ | 215,280 | $ | (100 | ) | $ | (105,945 | ) | $ | 93,993 | ||||||||||||
|
|
|
|
|
|
|
|
|
|
|
|
|
|
|
|||||||||||||||
See accompanying notes
F-4
Table of Contents
NEP Group, Inc. and Subsidiaries
Condensed Consolidated Statements of Cash Flows
(Amounts in thousands)
(Unaudited)
| Three Months Ended March 31, | ||||||||
| 2014 (as restated – see Note 15) |
2015 | |||||||
| Operating activities |
||||||||
| Net loss |
$ | (10,717 | ) | $ | (35,913 | ) | ||
| Adjustments to reconcile net loss to net cash provided by operating activities: |
||||||||
| Depreciation and amortization |
30,181 | 36,929 | ||||||
| Stock-based compensation |
490 | 548 | ||||||
| Amortization of debt issuance costs |
597 | 797 | ||||||
| Loss on sale or disposal of fixed assets |
148 | — | ||||||
| Mark-to-market adjustment on derivatives |
432 | 1,904 | ||||||
| Write-off of debt issuance costs |
451 | — | ||||||
| Deferred income taxes |
(3,306 | ) | 5,552 | |||||
| Provision for doubtful accounts |
76 | (248 | ) | |||||
| Changes in net assets and liabilities: |
||||||||
| Accounts receivable |
3,791 | 6,520 | ||||||
| Prepaid expenses and other assets |
(527 | ) | (488 | ) | ||||
| Accounts payable |
(385 | ) | (1,284 | ) | ||||
| Deferred revenue |
(3,219 | ) | 1,454 | |||||
| Other accruals and liabilities |
(2,557 | ) | (2,918 | ) | ||||
|
|
|
|
|
|||||
| Net cash provided by operating activities |
15,455 | 12,853 | ||||||
| Investing activities |
||||||||
| Capital expenditures |
(21,302 | ) | (23,412 | ) | ||||
| Acquisition of businesses |
(153,471 | ) | (12,506 | ) | ||||
|
|
|
|
|
|||||
| Net cash (used in) investing activities |
(174,773 | ) | (35,918 | ) | ||||
| Financing activities |
||||||||
| Borrowings from line of credit |
29,000 | 37,219 | ||||||
| Repayment on line of credit |
(6,000 | ) | (11,931 | ) | ||||
| Proceeds from debt issuance |
155,000 | — | ||||||
| Repayment of debt obligations |
— | (2,187 | ) | |||||
| Payment of debt issuance costs |
(5,953 | ) | (788 | ) | ||||
| Proceeds from issuance of common stock |
3,033 | 253 | ||||||
| Repayment of capital lease obligations |
(2,045 | ) | (4,998 | ) | ||||
|
|
|
|
|
|||||
| Net cash provided by financing activities |
173,035 | 17,568 | ||||||
| Effect of exchange rate changes on cash and cash equivalents |
(3,639 | ) | 8,314 | |||||
|
|
|
|
|
|||||
| Net increase in cash |
10,078 | 2,817 | ||||||
| Cash and cash equivalents at beginning of period |
3,915 | 6,806 | ||||||
|
|
|
|
|
|||||
| Cash and cash equivalents at end of period |
$ | 13,993 | $ | 9,623 | ||||
|
|
|
|
|
|||||
| Supplemental disclosures of cash flow information |
||||||||
| Cash paid for interest |
9,682 | 11,146 | ||||||
|
|
|
|
|
|||||
| Cash paid for taxes |
96 | 64 | ||||||
|
|
|
|
|
|||||
| Supplemental disclosures of non-cash operating, investing, and financing activities |
||||||||
| Investing—capital expenditures |
11,830 | 17,897 | ||||||
|
|
|
|
|
|||||
| Financing—capital leases |
1,930 | — | ||||||
|
|
|
|
|
|||||
See accompanying notes.
F-5
Table of Contents
NEP Group, Inc. and Subsidiaries
Notes to Condensed Consolidated Financial Statements
(amounts in thousands, except per share amounts)
1. Summary of Significant Accounting Policies
Principles of Consolidation
The consolidated financial statements include the accounts of the Company and its wholly owned subsidiaries. Such statements have been prepared in accordance with accounting principles generally accepted in the United States of America. All intercompany balances have been eliminated in consolidation.
Basis of Presentation
The accompanying unaudited interim Condensed Consolidated Financial Statements of NEP Group, Inc. and Subsidiaries (“NEP”) have been prepared in accordance with generally accepted accounting principles, or GAAP, in the United States for interim financial information and with the instructions to Article 10 of Regulation S-X. Accordingly, they do not include all of the information and footnotes required by GAAP for complete financial statements and should be read in conjunction with the Company’s annual financial statements included herein. In the opinion of management, the accompanying interim financial information reflects all adjustments, including normal recurring adjustments, necessary to present fairly NEP’s financial position and results of operations for each of the interim periods presented. Results of operations for interim periods are not necessarily indicative of the results of operations that may be expected for a full year or any future period.
Use of Estimates
The preparation of consolidated financial statements in conformity with accounting principles generally accepted in the United States requires the Company to make estimates and assumptions that affect the reported amounts of assets and liabilities at the balance sheet dates and the reported amounts of revenue and expenses during the reporting period. Actual amounts could differ from those estimates. On an ongoing basis, management reviews its estimates based on currently available information. Changes in facts and circumstances may result in revised estimates.
Recent Accounting Pronouncements
Revenue
In May 2014, the Financial Accounting Standards Board (the “FASB”) issued ASU No. 2014-09, Revenue from Contracts with Customers. This guidance supersedes the revenue recognition requirements in ASC 605, Revenue Recognition. This guidance is based on the principle that revenue is recognized to depict the transfer of goods or services to customers in an amount that reflects the consideration to which the entity expects to be entitled in exchange for those goods or services. The guidance also requires additional disclosure about the nature, amount, timing and uncertainty of revenue and cash flows arising from customer contracts, including significant judgments and changes in judgments and assets recognized from costs incurred to obtain or fulfill a contract. The amendments in this ASU are effective retrospectively for annual reporting periods beginning after December 15, 2016, including interim periods within that reporting period. Entities have the option of using full retrospective, cumulative effect or modified approach to adopt the guidance. The Company is evaluating the potential impact of this adoption on the Company’s consolidated financial statements.
F-6
Table of Contents
Debt
In April 2015, the FASB issued ASU No. 2015-03, Interest – Imputation of Interest (Subtopic 835-30): Simplifying the Presentation of Debt Issuance Costs. This guidance is part of the Company’s initiative to reduce the complexity in accounting standards (the Simplification Initiative). To simplify the presentation of debt issuance costs, the amendments in this ASU require that debt issuance costs related to a recognized debt liability be presented in the balance sheet as a direct deduction from the carrying amount of the debt liability, consistent with debt discounts. The amendments in this ASU are effective retrospectively for annual reporting periods beginning after December 15, 2015, including interim periods within that reporting period. Early adoption of the amendments is permitted. The Company has historically presented debt issuance costs in a manner consistent with the ASU; as such, there is no impact of this adoption on the Company’s consolidated financial statements.
2. Acquisitions
Screen Scene Group
On January 30, 2015, the Company acquired the Screen Scene Group. Screen Scene Group is headquartered in Dublin, Ireland and specializes in outsourced broadcast services, post-production and visual effects services, and specialized uplink and communication services. This acquisition expands the Company’s reach in Continental Europe and the UK as well as adds new post-production and visual effects capabilities to the Company’s range of client solutions. The aggregate purchase price for Screen Scene Group was approximately 11.9 million EUR, or $13.5 million, in cash and stock subject to a working capital adjustment and an earn-out consideration clause. The aggregate purchase price was funded by borrowings on the Company’s credit facility and the issuance of common stock. Transaction costs of approximately $0.5 million were incurred related to the acquisition and were included in selling, general, and administrative expenses (“SG&A”) for the three months ended March 31, 2015.
The purchase price has been allocated to the assets and liabilities acquired based upon their respective fair market values. Property, plant, and equipment were valued at fair value by estimating the replacement costs of such assets. The excess of the aggregate purchase price over the fair values of the net assets acquired was recognized as goodwill of $5.7 million. None of the goodwill is expected to be deducted for tax purposes.
The fair value estimates for the assets and liabilities acquired are still being evaluated and are assumed based upon preliminary calculations, valuations, and assumptions that are subject to change as the Company obtains additional information during the measurement period (up to one year from the acquisition date). The primary areas of those preliminary estimates that are not yet finalized relate to property, plant, and equipment, deferred tax assets, and deferred tax liabilities.
Faber
On December 19, 2014, the Company acquired Faber Audiovisuals (“Faber”). Headquartered in the Netherlands with outlets in Dubai and the United States, Faber is a leading supplier of display and audiovisuals solutions in the European and international markets. The acquisition extends the Company’s display solution capabilities beyond the United States. The aggregate purchase price for Faber was approximately $31.7 million (25.8 million EUR). The aggregate purchase price was primarily funded by cash on hand and borrowings under the Company’s credit facility.
The purchase price has been allocated to the assets and liabilities acquired based upon their respective fair market values. Property, plant, and equipment were valued at fair value by estimating the replacement costs of such assets. Acquired intangibles were valued using a discounted cash flow analysis, and these intangibles are subject to impairment testing, consistent with the Company’s related accounting policies. Significant assumptions were utilized in the valuation of the intangible assets acquired and were based on company specific information and projections which were not observable in the market and are thus considered Level 3 measurements as defined by GAAP. The excess of the aggregate purchase price over the fair values of the net assets acquired was recognized as goodwill of $26.5 million. None of the goodwill is expected to be deducted for tax purposes.
F-7
Table of Contents
The fair value estimates for the assets and liabilities acquired are still being evaluated and are assumed based upon preliminary calculations, valuations, and assumptions that are subject to change as the Company obtains additional information during the measurement period (up to one year from the acquisition date). The primary areas of those preliminary estimates that are not yet finalized relate to property, plant and equipment, intangible assets, deferred tax assets, and deferred tax liabilities.
Silk Studios
On December 1, 2014, the Company acquired Silk Studios (“Silk”). Silk operates a studio facility in Sydney, Australia, that hosts programs for many of the networks in the region. This acquisition expands the Company’s international reach as well as adds to the studio facilities that NEP Australia already operates in Sydney and Melbourne, Australia. The aggregate purchase price for Silk was approximately $6.4 million (7.5 million AUD). The aggregate purchase price was primarily funded by cash on hand and borrowings under the Company’s credit facility.
The purchase price has been allocated to the assets acquired based upon their respective fair market values. Property, plant, and equipment were valued at fair value by estimating the replacement costs of such assets. Acquired intangibles were valued using a discounted cash flow analysis, and these intangibles are subject to impairment testing, consistent with the Company’s related accounting policies. Significant assumptions were utilized in the valuation of the intangible assets acquired and were based on company specific information and projections, which were not observable in the market and are thus considered Level 3 measurements as defined by GAAP. The excess of the aggregate purchase price over the fair values of the net assets acquired was recognized as goodwill of $1.9 million. None of the goodwill is expected to be deducted for tax purposes.
The fair value estimates for the assets acquired are still being evaluated and are assumed based upon preliminary calculations, valuations, and assumptions that are subject to change as the Company obtains additional information during the measurement period (up to one year from the acquisition date). The primary areas of those preliminary estimates that are not yet finalized relate to property, plant, and equipment and intangible assets.
MIRA
On August 29, 2014, the Company acquired all of the assets of MIRA Mobile Television (“MIRA”). MIRA, based in Portland, Oregon, specializes in providing remote video production services for live events in the United States. The acquisition expands the Company’s presence in the broadcast services industry in the United States and Canada. The aggregate purchase price for MIRA was approximately $63.6 million. To finance this transaction, the Company increased the existing first lien term loan by $60.0 million and financed the remaining purchase price with cash on hand and borrowings under the Company’s credit facility.
The purchase price has been allocated to the assets acquired based upon their respective fair market values. Property, plant, and equipment were valued at fair value by estimating the replacement costs of such assets. Acquired intangibles were valued using a discounted cash flow analysis, and these intangibles are subject to impairment testing, consistent with the Company’s related accounting policies. Significant assumptions were utilized in the valuation of the intangible assets acquired and were based on company specific information and projections which were not observable in the market and are thus considered Level 3 measurements as defined by GAAP. The excess of the aggregate purchase price over the fair values of the net assets acquired was recognized as goodwill of $17.5 million, all of which is expected to be deducted for tax purposes.
The fair value estimates for the assets acquired are still being evaluated and are assumed based upon preliminary calculations, valuations, and assumptions that are subject to change as the Company obtains additional information during the measurement period (up to one year from the acquisition date). The primary areas of those preliminary estimates that are not yet finalized relate to property, plant and equipment, intangible assets, deferred tax assets, and deferred tax liabilities.
F-8
Table of Contents
GTV
On January 24, 2014, the Company acquired all of the outstanding common stock of GTV Holdings Pty Ltd (“GTV”). GTV, based in Sydney, Australia, specializes in providing outsourced television production services in Australia and the Asia-Pacific region. The acquisition expands the Company’s international presence in the outsourced media services industry. The aggregate purchase price for GTV was approximately $153.5 million (174.1 million AUD), subject to a working capital adjustment. To finance this transaction, the Company increased the first lien term loan under its existing credit facility by $155.0 million.
The purchase price has been allocated to the assets and liabilities acquired based upon their respective fair market values. Property, plant, and equipment were valued at fair value by estimating the replacement costs of such assets. Acquired intangibles were valued using a discounted cash flow analysis, and these intangibles are subject to impairment testing, consistent with the Company’s related accounting policies. Significant assumptions were utilized in the valuation of the intangible assets acquired and were based on company specific information and projections which were not observable in the market and are thus considered Level 3 measurements as defined by GAAP. The excess of the aggregate purchase price over the fair values of the net assets acquired was recognized as goodwill of $54.2 million. None of the goodwill is expected to be deducted for tax purposes.
For the aforementioned acquisitions, the following table summarizes the fair values of the assets acquired and liabilities assumed at the date of the acquisition:
| GTV | MIRA | Silk | Faber | SSG | ||||||||||||||||
| January 24, 2014 | August 29, 2014 | December 1, 2014 | December 19, 2014 | January 30, 2015 | ||||||||||||||||
| Assets: |
||||||||||||||||||||
| Current assets |
$ | 6,628 | $ | — | $ | — | $ | 3,243 | $ | 2,913 | ||||||||||
| Property, plant and equipment |
83,083 | 38,578 | 2,186 | 13,949 | 7,640 | |||||||||||||||
| Intangible assets |
18,735 | 7,570 | 2,293 | 5,167 | — | |||||||||||||||
| Goodwill |
54,202 | 17,452 | 1,896 | 26,463 | 5,741 | |||||||||||||||
| Other long-term assets |
1,918 | — | — | 44 | — | |||||||||||||||
|
|
|
|
|
|
|
|
|
|
|
|||||||||||
| Total assets acquired |
$ | 164,566 | $ | 63,600 | $ | 6,375 | $ | 48,866 | $ | 16,294 | ||||||||||
|
|
|
|
|
|
|
|
|
|
|
|||||||||||
| Liabilities: |
||||||||||||||||||||
| Accounts payable |
3,431 | — | — | 1,366 | 2,079 | |||||||||||||||
| Deferred revenue |
909 | — | — | 950 | — | |||||||||||||||
| Other liabilities |
6,755 | — | — | 3,319 | 709 | |||||||||||||||
| Long-term debt |
— | — | — | 11,503 | — | |||||||||||||||
|
|
|
|
|
|
|
|
|
|
|
|||||||||||
| Total liabilities assumed |
11,095 | — | — | 17,138 | 2,788 | |||||||||||||||
|
|
|
|
|
|
|
|
|
|
|
|||||||||||
| Net assets acquired |
$ | 153,471 | $ | 63,600 | $ | 6,375 | $ | 31,728 | $ | 13,506 | ||||||||||
|
|
|
|
|
|
|
|
|
|
|
|||||||||||
From the acquisition date through March 31, 2015, SSG contributed $3.2 million in revenues and $0.2 million in net income.
The following table presents supplemental unaudited pro forma financial information as if the above acquisitions had occurred on January 1, 2014. The unaudited pro forma results reflect certain adjustments related to past operating performance and acquisition accounting adjustments, such as increased amortization expense based on the fair value of assets acquired, the impact of acquisition financing and the related income tax effects. The unaudited pro forma results do not include any synergies which may have been achieved subsequent to the acquisition date. Accordingly, the unaudited pro forma results are not necessarily indicative of the results that actually would have occurred had the acquisition been completed on January 1, 2014, nor are they indicative of the future operating results of the Company.
F-9
Table of Contents
| Three Months Ended March 31, | ||||||||
| (in thousands, except per share amounts) | 2014 | 2015 | ||||||
| Total revenues |
$ | 115,822 | $ | 103,940 | ||||
|
|
|
|
|
|||||
| Net loss |
$ | (12,393 | ) | $ | (36,342 | ) | ||
|
|
|
|
|
|||||
| Loss per common share: |
||||||||
| Basic |
$ | (0.56 | ) | $ | (1.62 | ) | ||
|
|
|
|
|
|||||
| Diluted |
$ | (0.56 | ) | $ | (1.62 | ) | ||
|
|
|
|
|
|||||
| Weighted average common shares outstanding: |
||||||||
| Basic |
22,066,421 | 22,474,929 | ||||||
|
|
|
|
|
|||||
| Diluted (1) |
22,066,421 | 22,474,929 | ||||||
|
|
|
|
|
|||||
(1) Outstanding options aggregating incremental shares of 2,093,037 and 2,141,562 have been excluded from the three months ended March 31, 2014 and 2015 diluted loss per share calculations, respectively, as they are anti-dilutive due to the losses generated in each respective period.
3. Property, Plant, and Equipment
Property, plant, and equipment consisted of the following:
| December 31, 2014 | March 31, 2015 | |||||||
| Broadcast and production equipment |
$ | 556,317 | $ | 585,796 | ||||
| Furniture and fixtures |
3,614 | 3,558 | ||||||
| Building and leasehold improvements |
20,071 | 19,248 | ||||||
| Computer equipment |
1,748 | 1,896 | ||||||
| Vehicles |
25,771 | 25,639 | ||||||
| Construction in progress |
7,906 | 13,182 | ||||||
|
|
|
|
|
|||||
| 615,427 | 649,319 | |||||||
|
|
|
|
|
|||||
| Accumulated depreciation |
(213,990 | ) | (246,114 | ) | ||||
|
|
|
|
|
|||||
| Total property, plant, and equipment, net |
$ | 401,437 | $ | 403,205 | ||||
|
|
|
|
|
|||||
The Company’s depreciation expense was $28.1 million and $34.5 million for the three months ended March 31, 2014 and 2015, respectively.
The amount of interest expense capitalized to property, plant, and equipment by the Company was $0.1 million for both the three months ended March 31, 2014 and 2015.
4. Intangible Assets
Intangible assets relate primarily to those customer relationships obtained through acquisitions (see Note 2). The customer relationship amortization is recorded on a straight-line basis over the estimated useful life of each relationship with a weighted-average useful life remaining of 191 months and 188 months for the year ended December 31, 2014 and the three months ended March 31, 2015, respectively. The intangible asset weighted average useful life was 210 months for both the year ended December 31, 2014 and the three months ended March 31, 2015.
F-10
Table of Contents
The following table presents the gross carrying amount, accumulated amortization, and resulting net intangibles:
| December 31, 2014 |
March 31, 2015 |
|||||||
| Gross carrying amount |
$ | 111,682 | $ | 111,682 | ||||
| Accumulated amortization |
(15,829 | ) | (18,223 | ) | ||||
| Foreign currency impact |
(1,772 | ) | (3,852 | ) | ||||
|
|
|
|
|
|||||
| Net intangibles |
$ | 94,081 | $ | 89,607 | ||||
|
|
|
|
|
|||||
The Company incurred intangible asset amortization expense of $2.1 million and $2.4 million for the three months ended March 31, 2014 and 2015, respectively. The estimated aggregate intangible asset amortization expense for the remainder of 2015, the next five years, and thereafter is expected to be as follows:
| Remainder of 2015 |
$ | 7,126 | ||
| 2016 |
9,484 | |||
| 2017 |
9,374 | |||
| 2018 |
4,487 | |||
| 2019 |
4,256 | |||
| 2020 |
4,241 | |||
| Thereafter |
50,639 | |||
|
|
|
|||
| $ | 89,607 | |||
|
|
|
5. Goodwill
Goodwill represents the excess of the cost of an acquisition over the fair value of the net assets acquired (see Note 2). Goodwill is not amortized but is reviewed annually during the fourth quarter for impairment. The following table presents the Company’s rollforward of goodwill for the year ended December 31, 2014 and the three months ended March 31, 2015:
| United States | International | Total | ||||||||||
| Balance at December 31, 2014 |
$ | 418,205 | $ | 119,629 | $ | 537,834 | ||||||
| Goodwill from acquisition(s) |
— | 5,741 | 5,741 | |||||||||
| Foreign currency adjustment |
— | (8,023 | ) | (8,023 | ) | |||||||
|
|
|
|
|
|
|
|||||||
| Balance at March 31, 2015 |
$ | 418,205 | $ | 117,347 | $ | 535,552 | ||||||
|
|
|
|
|
|
|
|||||||
6. Long-Term Debt
Long-term debt consisted of the following:
| December 31, 2014 |
March 31, 2015 |
|||||||
| First lien term loan |
$ | 734,311 | $ | 732,466 | ||||
| Second lien term loan |
80,000 | 80,000 | ||||||
| First lien term loan—Faber |
3,180 | 2,551 | ||||||
| Revolving line of credit—Faber |
8,189 | 5,885 | ||||||
| Revolving line of credit |
48,500 | 75,500 | ||||||
|
|
|
|
|
|||||
| 874,180 | 896,402 | |||||||
| Less current portion |
8,395 | 8,114 | ||||||
| Less debt origination costs |
15,410 | 15,401 | ||||||
|
|
|
|
|
|||||
| Long-term portion |
$ | 850,375 | $ | 872,887 | ||||
|
|
|
|
|
|||||
F-11
Table of Contents
On January 25, 2015, the Company amended its Credit Agreements, which increased the maximum borrowing capacity under the revolving credit facility by $45.0 million, for a total maximum of $105.0 million. There were no changes in the terms and conditions of the Company’s credit facility as a result of this amendment.
The total amounts of outstanding letters of credit as of December 31, 2014 and March 31, 2015, were $1.9 million.
Five-year maturities of long-term debt as of March 31, 2015 were as follows:
| Remainder of 2015 |
$ | 6,161 | ||
| 2016 |
9,170 | |||
| 2017 |
9,170 | |||
| 2018 |
84,670 | |||
| 2019 |
9,170 | |||
| 2020 |
778,061 | |||
| Thereafter |
— | |||
|
|
|
|||
| $ | 896,402 | |||
|
|
|
7. Income Taxes
The Company’s income tax benefit was $3.2 million for the three months ended March 31, 2014, compared to income tax expense of $4.9 million for the three months ended March 31, 2015. The Company’s effective tax rate for the three months ended March 31, 2014 and 2015 was 23.0% and (15.6)%, respectively. The effective tax rate at March 31, 2014 was lower than the statutory U.S. federal income tax rate of 35% primarily due to foreign tax expense, taxable permanent differences, and the effect of a state rate change on the Company’s deferred tax assets and liabilities. The effective tax rate at March 31, 2015 was lower than the statutory U.S. federal income tax rate of 35% primarily due to the effect of a valuation allowance recorded within certain jurisdictions, for which no benefit of current year losses is expected to be realized.
The Company files income tax returns in the U.S. federal jurisdiction and various state and foreign jurisdictions. The Company is responsible for paying the taxes relating to such items, including any subsequent adjustments resulting from the redetermination of such tax liabilities by the applicable taxing authorities. In most tax jurisdictions, returns are subject to examination by the relevant authorities for a number of years after the returns have been filed.
8. Commitments and Contingencies
From time to time, the Company is involved in litigation relating to claims arising out of its operations in the ordinary course of business. As of the date hereof, the Company is not involved in any litigation that the Company believes will have a material adverse effect on its financial condition, results of operations, or liquidity.
F-12
Table of Contents
9. Loss Per Share
The computation of loss per share from operations is as follows:
| Three Months Ended March 31, | ||||||||
| 2014 (as restated- see Note 15) |
2015 | |||||||
| (in thousands, except per share amounts) |
||||||||
| Loss Per Common Share—Basic (numerator): |
||||||||
| Net loss |
$ | (10,717 | ) | $ | (35,913 | ) | ||
|
|
|
|
|
|||||
| Shares (denominator): |
||||||||
| Weighted average common shares outstanding |
22,066,421 | 22,474,929 | ||||||
|
|
|
|
|
|||||
| Basic loss per common share |
$ | (0.49 | ) | $ | (1.60 | ) | ||
|
|
|
|
|
|||||
| Loss Per Common Share—Diluted (numerator): |
||||||||
| Net loss |
$ | (10,717 | ) | $ | (35,913 | ) | ||
|
|
|
|
|
|||||
| Shares (denominator): |
||||||||
| Weighted average common shares outstanding |
22,066,421 | 22,474,929 | ||||||
| Stock-based awards (1) |
— | — | ||||||
|
|
|
|
|
|||||
| Total dilutive shares outstanding |
22,066,421 | 22,474,929 | ||||||
|
|
|
|
|
|||||
| Diluted loss per common share |
$ | (0.49 | ) | $ | (1.60 | ) | ||
|
|
|
|
|
|||||
| (1) | Outstanding options aggregating incremental shares of 2,093,037 and 2,141,562 have been excluded from March 31, 2014 and 2015 diluted loss per share calculations, respectively, as they are anti-dilutive due to the losses generated in each respective period. |
10. Share-Based Compensation
Stock Options
The NEP Group, Inc. Equity Incentive Plan (the “Option Plan”) provides for the grant of incentive stock options, nonqualified stock options, restricted shares, and other share-based awards to persons or entities that provide services to the Company or its affiliates who, in the opinion of the Company’s Board of Directors, are in a position to make a contribution to the long-term success of the Company. During the first quarter of 2015, the Board of Directors amended the Option Plan, increasing the number of shares available for issuance. As of March 31, 2015, the Option Plan authorizes the issuance of awards up to an aggregate of 2,478,306 shares of the Company’s common stock.
In accordance with ASC 718, Compensation—Stock Compensation, compensation expense for stock options is recorded over the vesting period based on the fair value at the date of grant. The fair value of stock options at the date of grant was calculated using the Black-Scholes model, and the assumptions are listed below:
| Three Months Ended March 31, | ||||||||
| 2014 | 2015 (1) | |||||||
| Expected dividend yield |
0.0 | % | N/A | |||||
| Expected life (years) |
7.0 | N/A | ||||||
| Expected volatility |
51.5 | % | N/A | |||||
| Risk-free interest rate |
2.1% - 2.2 | % | N/A | |||||
| Weighted average fair value of options granted |
$5.28 | N/A | ||||||
| (1) | There were no grants during this period, and therefore, all inputs are not applicable. |
F-13
Table of Contents
The Black-Scholes model determines the fair value of equity-based payment awards based on the fair value of the underlying common stock on the date of grant and requires the use of estimates and assumptions, including the fair value of the Company’s common stock, exercise price of the stock option, expected volatility, expected life, risk-free interest rate, and dividend rate.
Volatility. The Company estimates the expected volatility of its stock options by taking the average historical volatility of a group of comparable publicly traded companies over a period equal to the expected life of the options; it is not practical for the Company to estimate its own volatility due to the lack of a liquid market and historical prices.
Expected Life. The expected life or term of the units was determined in accordance with existing equity agreements as the underlying units are assumed to be exercised upon the passage of time and attainment of certain operating targets.
Risk-free Interest Rate. The risk-free interest rate is the estimated average interest rate based on U.S. Treasury zero-coupon notes with terms consistent with the expected life of the awards. The expected dividend yield is zero as the Company does not anticipate paying any recurring cash dividends in the foreseeable future.
Forfeiture Rate. The Company estimates the forfeiture rate of its stock-based awards based on an analysis of its actual forfeitures and analysis of employee turnover. The impact from a forfeiture rate adjustment would be recognized in full in the period in which the forfeiture rate changes, and, if the actual number of future forfeitures differs from the Company’s prior estimates, the Company may be required to record adjustments to equity-based compensation expense in future periods.
Dividend Yield. The Company has not historically paid and does not expect to pay dividends in the near future. As such, the dividend yield is 0%.
The aforementioned assumptions used in calculating the fair value of the stock-based awards represent management judgment. As a result, if factors change and different assumptions are used, the stock-based compensation expense could be materially different in the future. Fair value determinations will be less reliant on estimates and assumptions post-IPO as there will be underlying shares trading when new equity-based awards are granted. Compensation expense relating to all stock awards (employee and non-employee) is recorded on a straight-line basis.
Changes in the Company’s stock options were as follows:
| Options | Weighted Average Exercise Price |
Weighted Average Remaining Life (years) |
Aggregate Intrinsic Value |
|||||||||||||
| Options outstanding at December 31, 2014 |
2,141,562 | $ | 9.96 | 8.3 | $ | 11,344 | ||||||||||
| Granted |
— | — | ||||||||||||||
| Exercised |
— | — | ||||||||||||||
| Forfeited |
— | — | ||||||||||||||
|
|
|
|
|
|||||||||||||
| Options outstanding at March 31, 2015 |
2,141,562 | $ | 9.96 | 8.0 | $ | 11,344 | ||||||||||
|
|
|
|
|
|
|
|
|
|||||||||
| Options vested and expected to vest, March 31, 2015 |
676,221 | $ | 9.75 | 7.8 | $ | 3,482 | ||||||||||
|
|
|
|
|
|
|
|
|
|||||||||
| Options exercisable, March 31, 2015 |
676,221 | $ | 9.75 | 7.8 | $ | 3,482 | ||||||||||
|
|
|
|
|
|
|
|
|
|||||||||
During the three months ended March 31, 2014 and 2015, compensation expense related to stock options was $0.5 million. As of March 31, 2015, the total unrecognized compensation cost related to options outstanding was $6.8 million and is expected to be recognized over a weighted average period of 3.0 years.
F-14
Table of Contents
11. Segment Information
The Company has two reportable segments: United States and International. The key factor used to identify these reportable segments is geography as generally, the Company provides consistent services both in the United States and internationally. For both segments, revenue is derived from the following services: remote production services, studio production services, and video display services.
Financial information is reported on a consolidating basis, showing segment detail separately with an aggregate consolidated total, to the chief executive officer (“CEO”), who is the Company’s chief operating decision maker.
Segment financial information was as follows:
| Three months ended March 31, 2014 (as restated-see Note 15) |
||||||||||||
| United States | International | Total | ||||||||||
| Revenue |
$ | 59,011 | $ | 36,160 | $ | 95,171 | ||||||
|
|
|
|
|
|
|
|||||||
| (Loss) income from operations |
(8,451 | ) | 3,154 | $ | (5,297 | ) | ||||||
| Interest expense and other |
$ | 8,619 | ||||||||||
|
|
|
|||||||||||
| Loss before income taxes |
$ | (13,916 | ) | |||||||||
|
|
|
|||||||||||
| Depreciation and amortization |
$ | 24,372 | $ | 5,809 | $ | 30,181 | ||||||
| Capital expenditures |
$ | 29,838 | $ | 1,542 | $ | 31,380 | ||||||
| Segment assets |
$ | 775,171 | $ | 285,447 | $ | 1,060,618 | ||||||
| Three months ended March 31, 2015 | ||||||||||||
| United States | International | Total | ||||||||||
| Revenue |
$ | 65,370 | $ | 37,773 | $ | 103,143 | ||||||
|
|
|
|
|
|
|
|||||||
| (Loss) income from operations |
(10,471 | ) | 2,412 | $ | (8,059 | ) | ||||||
| Interest expense and other |
$ | 22,995 | ||||||||||
|
|
|
|||||||||||
| Loss before income taxes |
$ | (31,054 | ) | |||||||||
|
|
|
|||||||||||
| Depreciation and amortization |
$ | 29,241 | $ | 7,688 | $ | 36,929 | ||||||
| Capital expenditures |
$ | 30,632 | $ | 5,611 | $ | 36,243 | ||||||
| Segment assets |
$ | 813,159 | $ | 297,548 | $ | 1,110,707 | ||||||
12. Fair Value Measurements
The Company holds certain assets that are required to be measured at fair value on a recurring basis. These include cash and cash equivalents as well as derivative instruments.
In December 2013, the Company entered into a foreign exchange forward contract with a notional amount of 167.0 million AUD with a third-party financial institution, which was settled in the first quarter of 2014. The purpose of this contract was to mitigate the Company’s exposure to foreign exchange risk arising from the planned acquisition of GTV in 2014 (see Note 2 for further detail on the acquisition). The forward settled in early 2014, and as such, the Company recorded a loss on the settlement of $2.1 million in other expense for the three months ended March 31, 2014.
In March 2015, the Company entered into a foreign exchange forward contract with a notional amount of 750.0 million SEK with a third-party financial institution. The purpose of this contract is to limit the Company’s exposure to foreign exchange risk arising from the then-planned acquisition of Mediatec from the date of the definitive agreement until the acquisition date (see Note 14 for further detail on the acquisition, which closed
F-15
Table of Contents
subsequent to the three months ended March 31, 2015). As of March 31, 2015, the Company recorded the fair value of this contract of approximately $1.9 million as an other current liability, in accrued expenses. The Company recorded a loss on the forward of $1.9 million in other expense for the three months ended March 31, 2015.
Forward financial contracts are subject to counterparty credit risk; however, the Company only enters into forward financial contract with counterparties that it determines to be creditworthy at the time of entering into the contract. If any counterparty failed to perform according to the terms of the contract, the impact would be limited to the difference between the contract price and the market price applied to the contract volume on the date of settlement.
See Note 13, Derivatives and Hedging, for further detail on the income effect as well as the location on the consolidated balance sheets of the aforementioned foreign exchange forward contracts.
ASC 820 Fair Value Measurements and Disclosures, defines fair value, establishes a framework for measuring fair value, and explains the related disclosure requirements. ASC 820 indicates, among other things, that a fair value measurement assumes that the transaction to sell an asset or transfer a liability occurs in the principal market for the asset or liability or, in the absence of a principal market, the most advantageous market for the asset or liability and defines fair value based upon an exit price model.
The valuation techniques used to measure fair value under fair value accounting are based upon observable and unobservable inputs. Observable inputs reflect market data obtained from independent sources, while unobservable inputs are generally unsupported by market activity. ASC 820 establishes a valuation hierarchy for disclosure of the inputs to valuation used to measure fair value. This hierarchy prioritizes the inputs into three broad levels as follows:
Level 1—Quoted prices (unadjusted) for identical assets or liabilities in active markets
Level 2—Quoted prices for similar instruments in active markets; quoted prices for identical or similar instruments in markets that are not active; and model-driven valuations whose inputs are observable or whose significant value drivers are observable
Level 3—Unobservable inputs that are supported by little or no market activity and that are significant to the fair value of the assets or liabilities
The following section describes the valuation methodology used to measure the Company’s financial assets and liabilities that were accounted for at fair value:
Overview of valuation methodology:
| Level | Significant inputs | |||||
| Foreign exchange forward contract |
2 | Broker quotations, market transactions in either listed or over-the counter markets | ||||
The following tables set forth the Company’s financial liabilities that were accounted for at fair value (there were no financial assets accounted for at fair value for either period presented) on a recurring basis by the level of input within the ASC 820 fair value hierarchy. As required by GAAP for fair value measurements and disclosures, financial assets and liabilities are classified in their entirety based on the lowest level of input that is significant to the fair value measurement. The assessment of significance of a particular input to the fair value measurement requires judgment and may affect the valuation of fair value assets and liabilities and the placement within the fair value hierarchy levels. There were no transfers between Level 1 and Level 2 during the periods presented; there were also no transfers into or out of Level 3 during the periods presented below. It is the Company’s policy to recognize transfers into and transfers out of Level 3 as of the actual date of the event or change in circumstances that caused the transfer.
F-16
Table of Contents
As of December 31, 2014, there were no financial assets or liabilities. As of March 31, 2015, the financial liabilities accounted for at fair value were as follows:
| March 31, 2015 | ||||||||||||||||
| Level 1 | Level 2 | Level 3 | Total | |||||||||||||
| Liabilities: |
||||||||||||||||
| Foreign exchange forward contract |
$ | — | $ | 1,904 | $ | — | $ | 1,904 | ||||||||
|
|
|
|
|
|
|
|
|
|||||||||
| Total liabilities |
$ | — | $ | 1,904 | $ | — | $ | 1,904 | ||||||||
|
|
|
|
|
|
|
|
|
|||||||||
13. Derivatives and Hedging
The Company does not engage in speculative transactions for trading purposes. The Company uses derivative financial instruments in the normal course of business in certain circumstances to manage its exposure to rate changes in connection with its debt, which bears interest at variable rates and to manage its exposure to foreign currency exchange rates. The Company’s derivatives have historically included interest rate swap agreements, interest rate cap agreements, and foreign exchange forward contracts. The Company measures the fair value of these agreements and contracts based on market transactions and market observable inputs at the reporting date in their respective principal markets for all available periods. See Note 12, Fair Value Measurements, for the additional information about the fair value measurement of the derivative instruments.
Fair Value of Derivative Assets and Liabilities
| Consolidate balance sheet location | December 31, 2014 |
March 31, 2015 |
||||||||
| Derivative Liabilities: |
||||||||||
| Foreign exchange forward contract |
Accrued expenses | $ | — | $ | 1,904 | |||||
|
|
|
|
|
|||||||
| Total |
$ | — | $ | 1,904 | ||||||
|
|
|
|
|
|||||||
Derivatives not designated as hedging instruments:
| Consolidated statement of operations and comprehensive |
Three Months Ended March 31, |
|||||||||
| (Gain) loss recognized in income from derivatives: |
income (loss) location |
2014 | 2015 | |||||||
| Foreign exchange forward contract |
Other (income)/other expense | $ | 2,102 | $ | 1,904 | |||||
|
|
|
|
|
|||||||
| $ | 2,102 | $ | 1,904 | |||||||
|
|
|
|
|
|||||||
The Company has no derivatives designated as hedging instruments.
14. Subsequent Events
For the three months ended March 31, 2015, the Company evaluated subsequent events through May 20, 2015, the date on which the interim consolidated financial statements were originally issued and has updated such evaluation for disclosure purposes through July 20, 2015, the date of the Company’s issuance of its financial statements for inclusion in the registration statement on Form S-1.
On April 29, 2015, the Company acquired MPP Mediatec Group AB (“Mediatec”). Mediatec is headquartered in Sweden and specializes in outsourced broadcast services, studio production, and video display services. This acquisition expands the Company’s reach across Europe as well as its international presence in the broadcast and video display services industry. The aggregate purchase price for Mediatec was approximately
F-17
Table of Contents
696.4 million SEK, or $81.0 million, in cash consideration and includes the assumption of Mediatec’s existing debt of approximately 408.8 million SEK, or $47.5 million. The aggregate purchase price was funded by a $75.0 million additional borrowing under the Company’s second lien term loan and equity contributions received from the issuance of newly-issued shares of common stock.
On April 29, 2015, the Company acquired OB Invest NV and RecordLab TV and Media GmbH (“Outside Broadcast”). Outside Broadcast is headquartered in Belgium and specializes in outside broadcast services, including studio production as well as post-production and full-service, turn-key production solutions. This acquisition expands the Company’s reach across Europe as well as its international presence in the broadcast services industry. The aggregate purchase price for Outside Broadcast was approximately 10.6 million EUR, or $11.5 million in cash consideration and includes the assumption of Outside Broadcast’s existing debt of approximately 10.3 million EUR, or $11.2 million. The aggregate purchase price was funded by a $75.0 million additional borrowing under the Company’s second lien term loan and equity contributions received from the issuance of newly-issued shares of common stock.
On July 8, 2015, the Company entered into a definitive agreement to acquire Consolidated Media Industries B.V. (“CMI”). Headquartered in the Netherlands, CMI operates both the DutchView and Infostrada Creative Technologies brands. DutchView provides solutions for remote and studio production in Northern Europe. Infostrada Creative Technologies provides solutions for the creation, management and distribution of video content. This acquisition is expected to expand the Company’s reach in Northern Europe and add video and media management solutions to the Company’s current offerings. The aggregate purchase price for CMI is expected to be approximately 92.0 million EUR, or $101.9 million, in cash consideration and the assumption of CMI’s existing debt. The purchase price is subject to certain adjustments between the date of signing and the closing of the transaction. The acquisition is expected to close in the third quarter of 2015, subject to certain closing conditions. The aggregate purchase price is expected to be funded by cash on hand and borrowings under the revolving credit facility.
On July 17, 2015, the Board of Directors approved: (i) an increase in the authorized common stock and (ii) a common stock split. All per share amounts and common shares outstanding have been restated to reflect a 7.7-for-1 stock split, which was declared by the Board of Directors on July 17, 2015, and effective as of the close of business on that date. Accordingly, all common share and per share amounts in these interim consolidated financial statements and the notes thereto have been adjusted to reflect the 7.7-for-1 stock split as though it had occurred at the beginning of the initial period presented.
15. Restatement
Subsequent to the date of the original issuance, the Company concluded that it was required to restate its unaudited interim condensed consolidated financial statements as of and for the quarter ended March 31, 2014 to make the following changes to the original issuance:
| • | The Company incorrectly recorded the translation of foreign currencies of certain subsidiaries whose functional currency is not the U.S. dollar. The translation adjustments were incorrectly reflected as a component of other income and should have been included as a component of the foreign translation adjustment within the Condensed Consolidated Statements of Operations and Comprehensive Income (Loss). As a result, net loss was understated by approximately $3.1 million for the three months ended March 31, 2014. |
| • | The Company incorrectly disclosed the composition of segment assets between the United States segment and International segment. As a result, the previously disclosed United States segment assets were understated and the International segment assets were overstated in the amount of $215.1 million as of March 31, 2014. |
F-18
Table of Contents
| • | The Company incorrectly calculated the change in accounts payable, the effect of exchange rates on cash and cash equivalents, and the cash paid for interest within the Condensed Consolidated Statement of Cash Flows. As a result, the change in accounts payable was overstated by $11.8 million, the effect of exchange rates on cash and cash equivalents was overstated by $8.7 million, and the cash paid for interest was overstated by $0.1 million for the three months ended March 31, 2014. |
The previously filed unaudited interim condensed consolidated financial statements for the quarter ended March 31, 2014 have been restated to reflect the changes described above and their applicable income tax effects. The following tables reflect the financial statement line items impacted, together with the adjusted amounts. The following tables include only those financial statement line items and disclosures impacted by the restatement:
Restated Condensed Consolidated Statements of Operations and Comprehensive Loss
| Three Months Ended March 31, 2014 | ||||||||||||
| As Previously Reported |
Restatement Adjustments |
Restated | ||||||||||
| Other income |
$ | (5,929 | ) | $ | 3,084 | $ | (2,845 | ) | ||||
| Loss before income taxes |
(10,832 | ) | (3,084 | ) | (13,916 | ) | ||||||
| Net loss |
(7,633 | ) | (3,084 | ) | (10,717 | ) | ||||||
| Foreign translation adjustment |
597 | 3,084 | 3,681 | |||||||||
| Earnings Per Common Share |
||||||||||||
| Basic |
||||||||||||
| Net loss attributable to common shareholders |
$ | (0.35 | ) | $ | (0.14 | ) | $ | (0.49 | ) | |||
| Diluted |
||||||||||||
| Net loss attributable to common shareholders |
$ | (0.35 | ) | $ | (0.14 | ) | $ | (0.49 | ) | |||
Restated Condensed Consolidated Statement of Shareholders’ Equity
| Three Months Ended March 31, 2014 | ||||||||||||
| As Previously Reported |
Restatement Adjustments |
Restated | ||||||||||
| Foreign translation adjustment |
$ | 597 | $ | 3,084 | $ | 3,681 | ||||||
| Accumulated other comprehensive income |
1,319 | 3,084 | 4,403 | |||||||||
| Net loss |
(7,633 | ) | (3,084 | ) | (10,717 | ) | ||||||
| Retained deficit |
(36,450 | ) | (3,084 | ) | (39,534 | ) | ||||||
Restated Condensed Consolidated Statement of Cash Flows
| Three Months Ended March 31, 2014 | ||||||||||||
| As Previously Reported |
Restatement Adjustments |
Restated | ||||||||||
| Operating activities |
||||||||||||
| Net loss |
$ | (7,633 | ) | $ | (3,084 | ) | $ | (10,717 | ) | |||
| Changes in net assets and liabilities: |
||||||||||||
| Accounts payable |
(12,215 | ) | 11,830 | (385 | ) | |||||||
| Net cash provided by operating activities |
6,709 | 8,746 | 15,455 | |||||||||
| Effect of exchange rate changes on cash and cash equivalents |
5,107 | (8,746 | ) | (3,639 | ) | |||||||
| Supplemental disclosures of cash flow information |
||||||||||||
| Cash paid for interest |
9,791 | (109 | ) | 9,682 | ||||||||
F-19
Table of Contents
Restated Footnote 11. Segment Information
| Three Months Ended March 31, 2014 | ||||||||||||
| As Previously Reported |
Restatement Adjustments |
Restated | ||||||||||
| Interest expense and other |
$ | 5,535 | $ | 3,084 | $ | 8,619 | ||||||
| Loss before income taxes |
(10,832 | ) | (3,084 | ) | (13,916 | ) | ||||||
| Segment assets |
||||||||||||
| United States |
560,035 | 215,136 | 775,171 | |||||||||
| International |
500,583 | (215,136 | ) | 285,447 | ||||||||
F-20
Table of Contents
REPORT OF INDEPENDENT REGISTERED PUBLIC ACCOUNTING FIRM
To the Board of Directors and Shareholders of NEP Group, Inc.:
We have audited the accompanying consolidated balance sheets of NEP Group, Inc. and subsidiaries (the “Company”) as of December 31, 2014 and 2013 and the related consolidated statements of operations and comprehensive income (loss), shareholders’ equity, and cash flows for the years ended December 31, 2014, 2013, and the period from December 24, 2012 to December 31, 2012 (the “Successor Periods”). We have also audited the Company’s consolidated statements of operations and comprehensive income (loss), shareholders’ equity, and cash flows for the period from January 1, 2012 to December 23, 2012 (the “Predecessor Period”). Our audits also included the financial statement schedule listed in the Index. These financial statements and financial statement schedule are the responsibility of the Company’s management. Our responsibility is to express an opinion on the financial statements and financial statement schedule based on our audits.
We conducted our audits in accordance with the standards of the Public Company Accounting Oversight Board (United States). Those standards require that we plan and perform the audit to obtain reasonable assurance about whether the financial statements are free of material misstatement. The Company is not required to have, nor were we engaged to perform, an audit of its internal control over financial reporting. Our audits included consideration of internal control over financial reporting as a basis for designing audit procedures that are appropriate in the circumstances, but not for the purpose of expressing an opinion on the effectiveness of the Company’s internal control over financial reporting. Accordingly, we express no such opinion. An audit also includes examining, on a test basis, evidence supporting the amounts and disclosures in the financial statements, assessing the accounting principles used and significant estimates made by management, as well as evaluating the overall financial statement presentation. We believe that our audits provide a reasonable basis for our opinion.
In our opinion, such consolidated financial statements present fairly, in all material respects, the financial position of NEP Group, Inc. and subsidiaries as of December 31, 2014 and 2013, and the results of their operations and their cash flows for the years ended December 31, 2014, 2013, the period from December 23, 2012 to December 31, 2012 and for the period from January 1, 2012 to December 23, 2012, in conformity with accounting principles generally accepted in the United States of America. Also, in our opinion, such financial statement schedule, when considered in relation to the basic consolidated financial statements taken as a whole, present fairly in all material respects the information set forth therein.
As discussed in Note 2 to the consolidated financial statements, the Company accounted for the acquisition of ASP NEP/NCP Holdco, Inc. using the acquisition method of accounting.
/s/ DELOITTE & TOUCHE LLP
Pittsburgh, Pennsylvania
April 15, 2015 (July 20, 2015 as to the stock split discussed in Note 20)
F-21
Table of Contents
NEP Group, Inc. and Subsidiaries
(Amounts in thousands, except shares and per share amounts)
| December 31, | ||||||||
| 2013 | 2014 | |||||||
| Assets |
||||||||
| Current assets: |
||||||||
| Cash and cash equivalents |
$ | 3,915 | $ | 6,806 | ||||
| Accounts receivable, net of allowance for doubtful accounts of $1,414 and $2,083 at December 31, 2013, and 2014, respectively |
50,300 | 60,319 | ||||||
| Deferred income taxes |
2,255 | 7,279 | ||||||
| Prepaid expenses and other current assets |
6,640 | 8,969 | ||||||
|
|
|
|
|
|||||
| Total current assets |
63,110 | 83,373 | ||||||
| Property, plant, and equipment, net |
300,736 | 401,437 | ||||||
| Other assets |
222 | 366 | ||||||
| Intangibles, net |
70,873 | 94,081 | ||||||
| Goodwill |
444,855 | 537,834 | ||||||
|
|
|
|
|
|||||
| Total assets |
$ | 879,796 | $ | 1,117,091 | ||||
|
|
|
|
|
|||||
| Liabilities and shareholders’ equity |
||||||||
| Current liabilities: |
||||||||
| Accounts payable |
$ | 11,191 | $ | 19,196 | ||||
| Accrued expenses |
16,734 | 25,386 | ||||||
| Current portion of long-term debt |
5,300 | 8,395 | ||||||
| Current portion of capital lease obligations |
8,552 | 12,916 | ||||||
| Deferred revenue |
6,598 | 5,410 | ||||||
|
|
|
|
|
|||||
| Total current liabilities |
48,375 | 71,303 | ||||||
| Long-term debt |
606,084 | 850,375 | ||||||
| Capital lease obligations |
15,650 | 31,730 | ||||||
| Other liabilities |
1,517 | 3,808 | ||||||
| Deferred taxes |
32,051 | 24,061 | ||||||
|
|
|
|
|
|||||
| Total liabilities |
$ | 703,677 | $ | 981,277 | ||||
| Commitments and contingencies (Note 11) |
||||||||
| Shareholders’ equity: |
||||||||
| Common stock: $0.01 par value; 400,000,000 shares authorized: 21,825,842 and 22,411,227 shares issued and outstanding at December 31, 2013 and 2014, respectively |
218 | 224 | ||||||
| Accumulated other comprehensive income (loss) |
722 | (7,758 | ) | |||||
| Additional paid-in capital |
204,446 | 213,480 | ||||||
| Stock subscription |
(450 | ) | (100 | ) | ||||
| Retained deficit |
(28,817 | ) | (70,032 | ) | ||||
|
|
|
|
|
|||||
| Total shareholders’ equity |
176,119 | 135,814 | ||||||
|
|
|
|
|
|||||
| Total liabilities and shareholders’ equity |
$ | 879,796 | $ | 1,117,091 | ||||
|
|
|
|
|
|||||
See accompanying notes.
F-22
Table of Contents
NEP Group, Inc. and Subsidiaries
Consolidated Statements of Operations and Comprehensive Income (Loss)
(Amounts in thousands, except shares and per share amounts)
| Predecessor | Successor | |||||||||||||||
| 358-Day Period Ended December 23, 2012 |
December 24, 2012 (inception date) to December 31, 2012 |
Year Ended December 31, 2013 |
Year Ended December 31, 2014 |
|||||||||||||
| Revenue |
$ | 372,122 | $ | 4,356 | $ | 356,528 | $ | 442,752 | ||||||||
| Cost of services, exclusive of depreciation and amortization |
139,192 | 1,027 | 103,802 | 148,871 | ||||||||||||
| Engineering |
67,561 | 1,498 | 72,730 | 82,533 | ||||||||||||
| Selling, general, and administrative |
83,389 | 923 | 63,480 | 76,853 | ||||||||||||
| Depreciation and amortization |
73,609 | 2,198 | 101,111 | 133,636 | ||||||||||||
|
|
|
|
|
|
|
|
|
|||||||||
| Income (loss) from operations |
8,371 | (1,290 | ) | 15,405 | 859 | |||||||||||
| Interest expense |
15,958 | 1,147 | 38,341 | 43,424 | ||||||||||||
| Write off of debt issuance costs |
— | — | 21,157 | 451 | ||||||||||||
| Other income |
(1,391 | ) | — | (3,619 | ) | (7,099 | ) | |||||||||
| Other expense |
3,255 | 27 | 3,333 | 18,072 | ||||||||||||
|
|
|
|
|
|
|
|
|
|||||||||
| Loss before income taxes |
(9,451 | ) | (2,464 | ) | (43,807 | ) | (53,989 | ) | ||||||||
| Income tax (expense) benefit |
(2,981 | ) | 946 | 16,508 | 12,774 | |||||||||||
|
|
|
|
|
|
|
|
|
|||||||||
| Net loss |
(12,432 | ) | (1,518 | ) | (27,299 | ) | (41,215 | ) | ||||||||
| Foreign translation adjustment |
1,347 | (1 | ) | 723 | (8,480 | ) | ||||||||||
|
|
|
|
|
|
|
|
|
|||||||||
| Comprehensive loss |
$ | (11,085 | ) | $ | (1,519 | ) | $ | (26,576 | ) | $ | (49,695 | ) | ||||
|
|
|
|
|
|
|
|
|
|||||||||
| Earnings Per Common Share |
||||||||||||||||
| Basic |
||||||||||||||||
| Net loss attributable to common shareholders |
$ | (7.45 | ) | $ | (0.07 | ) | $ | (1.25 | ) | $ | (1.86 | ) | ||||
| Diluted |
||||||||||||||||
| Net loss attributable to common shareholders |
$ | (7.45 | ) | $ | (0.07 | ) | $ | (1.25 | ) | $ | (1.86 | ) | ||||
| Weighted average shares outstanding |
||||||||||||||||
| Basic |
1,668,793 | 21,703,089 | 21,811,728 | 22,128,922 | ||||||||||||
| Diluted |
1,668,793 | 21,703,089 | 21,811,728 | 22,128,922 | ||||||||||||
See accompanying notes.
F-23
Table of Contents
NEP Group, Inc. and Subsidiaries
Consolidated Statements of Shareholders’ Equity
(Amounts in thousands, except share amounts)
| Common Shares |
Common Stock |
Accumulated Other Comprehensive Loss |
Treasury Stock |
Additional Paid-In Capital |
Stock Subscription |
Retained Deficit |
Total | |||||||||||||||||||||||||
| Predecessor: |
||||||||||||||||||||||||||||||||
| Balance as of January 1, 2012 |
1,663,851 | $ | 17 | $ | (8,208 | ) | $ | — | $ | 169,895 | $ | (3,908 | ) | $ | (6,863 | ) | $ | 150,933 | ||||||||||||||
| Foreign translation adjustment |
— | — | 1,347 | — | — | — | — | 1,347 | ||||||||||||||||||||||||
| Purchase of treasury stock |
— | — | — | (1,500 | ) | — | — | — | (1,500 | ) | ||||||||||||||||||||||
| Common stock subscribed |
1,603 | — | — | — | 300 | — | — | 300 | ||||||||||||||||||||||||
| Stock subscription |
— | — | — | — | — | (300 | ) | — | (300 | ) | ||||||||||||||||||||||
| Issuance of capital stock |
3,339 | — | — | 1,500 | 625 | — | — | 2,125 | ||||||||||||||||||||||||
| Tax benefit from stock-based compensation |
— | — | — | — | 150 | — | — | 150 | ||||||||||||||||||||||||
| Stock-based compensation |
— | — | — | — | 3,036 | — | — | 3,036 | ||||||||||||||||||||||||
| Net loss |
— | — | — | — | — | — | (12,432 | ) | (12,432 | ) | ||||||||||||||||||||||
|
|
|
|
|
|
|
|
|
|
|
|
|
|
|
|
|
|||||||||||||||||
| Balance as of December 23, 2012 |
1,668,793 | $ | 17 | $ | (6,861 | ) | $ | — | $ | 174,006 | $ | (4,208 | ) | $ | (19,295 | ) | $ | 143,659 | ||||||||||||||
|
|
|
|
|
|
|
|
|
|
|
|
|
|
|
|
|
|||||||||||||||||
| Successor: |
||||||||||||||||||||||||||||||||
| Balance as of December 24, 2012 |
21,703,089 | $ | 217 | $ | — | $ | — | $ | 201,368 | $ | — | $ | — | $ | 201,585 | |||||||||||||||||
| Foreign translation adjustment |
— | — | (1 | ) | — | — | — | — | (1 | ) | ||||||||||||||||||||||
| Net loss |
— | — | — | — | — | — | (1,518 | ) | (1,518 | ) | ||||||||||||||||||||||
|
|
|
|
|
|
|
|
|
|
|
|
|
|
|
|
|
|||||||||||||||||
| Balance as of December 31, 2012 |
21,703,089 | $ | 217 | $ | (1 | ) | $ | — | $ | 201,368 | $ | — | $ | (1,518 | ) | $ | 200,066 | |||||||||||||||
| Foreign translation adjustment |
— | — | 723 | — | — | — | — | 723 | ||||||||||||||||||||||||
| Common stock subscribed |
46,200 | — | — | — | 450 | — | — | 450 | ||||||||||||||||||||||||
| Stock subscription |
— | — | — | — | — | (450 | ) | — | (450 | ) | ||||||||||||||||||||||
| Issuance of capital stock |
76,553 | 1 | — | — | 745 | — | — | 746 | ||||||||||||||||||||||||
| Stock-based compensation |
— | — | — | — | 1,883 | — | — | 1,883 | ||||||||||||||||||||||||
| Net loss |
— | — | — | — | — | — | (27,299 | ) | (27,299 | ) | ||||||||||||||||||||||
|
|
|
|
|
|
|
|
|
|
|
|
|
|
|
|
|
|||||||||||||||||
| Balance as of December 31, 2013 |
21,825,842 | $ | 218 | $ | 722 | $ | — | $ | 204,446 | $ | (450 | ) | $ | (28,817 | ) | $ | 176,119 | |||||||||||||||
| Foreign translation adjustment |
— | — | (8,480 | ) | — | — | — | — | (8,480 | ) | ||||||||||||||||||||||
| Stock subscription |
— | — | — | — | — | 350 | — | 350 | ||||||||||||||||||||||||
| Issuance of capital stock |
585,385 | 6 | — | — | 6,942 | — | — | 6,948 | ||||||||||||||||||||||||
| Stock-based compensation |
— | — | — | — | 2,092 | — | — | 2,092 | ||||||||||||||||||||||||
| Net loss |
— | — | — | — | — | — | (41,215 | ) | (41,215 | ) | ||||||||||||||||||||||
|
|
|
|
|
|
|
|
|
|
|
|
|
|
|
|
|
|||||||||||||||||
| Balance as of December 31, 2014 |
22,411,227 | $ | 224 | $ | (7,758 | ) | $ | — | $ | 213,480 | $ | (100 | ) | $ | (70,032 | ) | $ | 135,814 | ||||||||||||||
|
|
|
|
|
|
|
|
|
|
|
|
|
|
|
|
|
|||||||||||||||||
See accompanying notes.
F-24
Table of Contents
NEP Group, Inc. and Subsidiaries
Consolidated Statements of Cash Flows
(Amounts in thousands)
| Predecessor | Successor | |||||||||||||||
| 358-Day Period Ended December 23, 2012 |
December 24, 2012 (inception date) to December 31, 2012 |
Year Ended December 31, 2013 |
Year Ended December 31, 2014 |
|||||||||||||
| Operating activities |
||||||||||||||||
| Net loss |
$ | (12,432 | ) | $ | (1,518 | ) | $ | (27,299 | ) | $ | (41,215 | ) | ||||
| Adjustments to reconcile net loss to net cash provided by (used in) operating activities: |
||||||||||||||||
| Depreciation and amortization |
73,609 | 2,198 | 101,111 | 133,636 | ||||||||||||
| Stock-based compensation |
3,036 | — | 1,883 | 2,092 | ||||||||||||
| Amortization of debt issuance costs |
1,125 | 91 | 1,756 | 2,731 | ||||||||||||
| (Gain) loss on sale or disposal of fixed assets |
150 | 20 | (953 | ) | 241 | |||||||||||
| Other non-cash items |
(1,373 | ) | — | — | — | |||||||||||
| Mark-to-market adjustment on derivatives |
13 | — | (432 | ) | — | |||||||||||
| Write-off of debt issuance costs |
— | — | 21,157 | 451 | ||||||||||||
| Deferred income taxes |
1,569 | (946 | ) | (16,599 | ) | (13,849 | ) | |||||||||
| Provision for doubtful accounts |
(109 | ) | 39 | 1,140 | 618 | |||||||||||
| Changes in net assets and liabilities: |
||||||||||||||||
| Accounts receivable |
(10,598 | ) | 3,558 | (495 | ) | (2,990 | ) | |||||||||
| Prepaid expenses and other assets |
(357 | ) | 355 | (477 | ) | 551 | ||||||||||
| Accounts payable |
2,235 | 1,226 | (10,515 | ) | 149 | |||||||||||
| Deferred revenue |
2,511 | (22 | ) | 3,098 | (4,752 | ) | ||||||||||
| Other accruals and liabilities |
31,587 | (6,372 | ) | (2,636 | ) | 1,677 | ||||||||||
|
|
|
|
|
|
|
|
|
|||||||||
| Net cash provided by (used in) operating activities |
90,966 | (1,371 | ) | 70,739 | 79,340 | |||||||||||
| Investing activities |
||||||||||||||||
| Capital expenditures |
(69,607 | ) | (922 | ) | (64,060 | ) | (82,658 | ) | ||||||||
| Acquisition of businesses |
(40,885 | ) | (399,689 | ) | — | (255,103 | ) | |||||||||
| Proceeds from the sale of assets |
— | — | 2,137 | — | ||||||||||||
|
|
|
|
|
|
|
|
|
|||||||||
| Net cash (used in) investing activities |
(110,492 | ) | (400,611 | ) | (61,923 | ) | (337,761 | ) | ||||||||
| Financing activities |
||||||||||||||||
| Borrowings from line of credit |
72,000 | 1,000 | 59,000 | 97,500 | ||||||||||||
| Repayment on line of credit |
(37,500 | ) | (49,500 | ) | (42,500 | ) | (66,500 | ) | ||||||||
| Proceeds from debt issuance |
5,000 | 620,000 | — | 215,000 | ||||||||||||
| Repayment of debt obligations |
(13,145 | ) | (342,796 | ) | (17,800 | ) | (5,464 | ) | ||||||||
| Payment of debt issuance costs |
(265 | ) | (29,596 | ) | (8,324 | ) | (7,776 | ) | ||||||||
| Proceeds from issuance of common stock |
625 | 201,585 | 746 | 6,948 | ||||||||||||
| Proceeds from stock subscription |
— | — | — | 350 | ||||||||||||
| Proceeds from sale leaseback |
7,150 | — | — | 23,106 | ||||||||||||
| Proceeds from sale of treasury stock |
1,500 | — | — | — | ||||||||||||
| Purchase of treasury stock |
(1,500 | ) | — | — | — | |||||||||||
| Refund of OID on refinancing |
— | — | 4,100 | — | ||||||||||||
| Repayment of capital lease obligations |
(8,114 | ) | — | (7,024 | ) | (9,651 | ) | |||||||||
|
|
|
|
|
|
|
|
|
|||||||||
| Net cash provided by (used in) financing activities |
25,751 | 400,693 | (11,802 | ) | 253,513 | |||||||||||
| Effect of exchange rate changes on cash and cash equivalents |
(338 | ) | (1 | ) | (1,098 | ) | 7,799 | |||||||||
|
|
|
|
|
|
|
|
|
|||||||||
| Net increase (decrease) in cash |
5,887 | (1,290 | ) | (4,084 | ) | 2,891 | ||||||||||
| Cash and cash equivalents at beginning of period |
3,402 | 9,289 | 7,999 | 3,915 | ||||||||||||
|
|
|
|
|
|
|
|
|
|||||||||
| Cash and cash equivalents at end of period |
$ | 9,289 | $ | 7,999 | $ | 3,915 | $ | 6,806 | ||||||||
|
|
|
|
|
|
|
|
|
|||||||||
| Supplemental disclosures of cash flow information |
||||||||||||||||
| Cash paid for interest |
$ | 13,678 | $ | 926 | $ | 36,371 | $ | 40,525 | ||||||||
|
|
|
|
|
|
|
|
|
|||||||||
| Cash paid for taxes |
$ | — | $ | — | $ | 34 | $ | 322 | ||||||||
|
|
|
|
|
|
|
|
|
|||||||||
| Supplemental disclosures of non-cash operating, investing, and financing activities |
||||||||||||||||
| Investing—capital expenditures |
$ | 3,138 | $ | 236 | $ | 1,752 | $ | 5,066 | ||||||||
|
|
|
|
|
|
|
|
|
|||||||||
| Financing—capital leases |
$ | 6,505 | $ | — | $ | 6,105 | $ | 7,287 | ||||||||
|
|
|
|
|
|
|
|
|
|||||||||
See accompanying notes.
F-25
Table of Contents
NEP Group, Inc. and Subsidiaries
Notes to Consolidated Financial Statements
(amounts in thousands, except per share amounts)
1. Organization and Significant Accounting Policies
Nature of Business
NEP Group, Inc. and its subsidiaries (collectively referred to as the “Company” or “NEP Group” or the “Successor Company”) is a provider of customized broadcast solutions to the live sports and entertainment markets offering various broadcast and live event services. The Company’s engineers design live event solutions and work side-by-side with the Company’s clients to customize the Company’s solutions and provide real-time support during a broadcast or live event to ensure a seamlessly delivered production. Over time, the Company has developed a wide range of services operating inside and outside of the United States and has supported events worldwide.
Organizational History
The Company’s original predecessor was founded in 1986. On February 16, 2007, American Securities Capital Partners acquired 89.2% of NEP, Inc. with the executive management team retaining a 7.5% equity interest, and the remaining 3.3% being held by an unrelated shareholder (the “Original Acquisition”). On January 1, 2008, ASP NEP/NCP Holdco, Inc. and its subsidiaries were formed and acquired ASP NEP Holdco, Inc. (the “Predecessor Company”). All of the previous outstanding shares of common stock and options were exchanged for an equal number of shares and options of ASP NEP/NCP Holdco, Inc.
On December 23, 2012, ASP NEP/NCP Holdco., Inc. was acquired by funds affiliated with Crestview Partners II GP, L.P. (collectively, “Crestview”) and certain members of executive management; through this acquisition, NEP Group, Inc. was formed.
Summary of Significant Accounting Policies
Principles of Consolidation
The consolidated financial statements include the accounts of the Company and its wholly owned subsidiaries. Such statements have been prepared in accordance with accounting principles generally accepted in the United States of America. All intercompany balances have been eliminated in consolidation.
Cash and Cash Equivalents
Cash equivalents are highly liquid investments purchased with an original maturity of 90 days or less. Cash and cash equivalents are stated at cost, which approximates fair value.
Accounts Receivable and Allowance for Doubtful Accounts
Accounts receivable are recorded at invoiced amounts. The allowance for doubtful accounts reflects the Company’s best estimate of probable losses inherent in the receivable portfolio determined based on historical experience, specific allowances for known troubled accounts and other currently available evidence. The Company generally extends credit to clients without requiring collateral; however, prepayments are required from clients when a credit history has not been established. The allowance for doubtful accounts was $1.4 million and $2.1 million at December 31, 2013 and 2014, respectively.
Property, Plant and Equipment
Property, plant and equipment are recorded on the basis of cost. Expenditures for renewals and improvements that extend the useful life or utility of the asset are capitalized and depreciated over the remaining
F-26
Table of Contents
useful life of the asset, and expenditures for ordinary maintenance and repairs are expensed as incurred. Depreciation is computed using the straight-line method based on the estimated useful lives of the respective assets as follows:
| Furniture and fixtures |
4 to 10 years | |||
| Computer equipment |
3 to 5 years | |||
| Vehicles |
5 to 8 years | |||
| Broadcast and production equipment |
5 to 10 years |
Leasehold improvements in operating leases are depreciated over the lesser of the useful life or the remaining lease term (including required lease periods and renewals deemed to be reasonably assured) at the date of acquisition of the leasehold improvement.
Accelerated depreciation methods are utilized for income tax purposes. Upon disposal or retirement of property, plant and equipment, the cost and related accumulated depreciation are eliminated from the respective accounts and the resulting gain or loss is recognized in other income or other expense. Amortization of assets under capital leases is included in depreciation and amortization expense.
Leasing Arrangements
The Company conducts its operations from leased facilities and finances certain equipment purchases through lease agreements. In cases in which the lease meets any of the following criteria at inception, as defined in Financial Accounting Standards Board (“FASB”) Accounting Standards Codification (“ASC”) 840, Leases, the leasing arrangement is classified as a capital lease: transfer of ownership whereby the lease transfers ownership of the property by the end of the lease term; the lease contains a bargain purchase option; the lease term is equal to 75% or more of the estimated economic life of the leased property; the present value at the beginning of the lease term of the minimum lease payments, excluding that portion of payments representing executory costs (e.g., insurance, maintenance, and taxes to be paid by the lessor) equals or exceeds 90% of the excess of the fair value of the leased property to the lessor at lease inception over any related investment tax credit retained by the lessor and expected to be realized by the lessor. All of the Company’s capital leases are related to broadcast equipment and vehicles. Amortization of assets recorded under capital leases is included in depreciation and amortization expense. Leases not meeting any of the aforementioned capital lease criteria are treated as operating leases.
Goodwill and Intangible Assets
Goodwill represents the excess of the cost of an acquisition over the fair value of the net assets acquired. Goodwill is not amortized. Any intangibles acquired in business combinations are recorded based upon their fair value at the date of acquisition. Intangible assets with finite lives are amortized on a straight-line basis over the estimated economic lives of the assets and reviewed for impairment when indicators of potential impairment are present. Goodwill is tested for impairment at the reporting unit level at least annually; the Company performs its annual impairment test during the fourth quarter, as of October 1, and also tests for impairment whenever events or changes in circumstances indicate that the carrying value may not be recoverable.
Based on impairment tests performed, the Company has not recognized an impairment of the Company’s goodwill during any of the periods presented herein. The balance of goodwill was $444.9 million and $537.8 million as of December 31, 2013 and 2014, respectively.
The Company monitors its long-lived assets for impairment indicators on an ongoing basis in accordance with ASC 360, Property, Plant and Equipment. If impairment indicators exist, the Company performs the required analysis and records impairment charges, if necessary. In conducting its analysis, the Company compares the undiscounted cash flows expected to be generated from the long-lived assets to the related net book
F-27
Table of Contents
values. If the undiscounted cash flows exceed the net book value, the long-lived assets are considered not to be impaired; if the net book value exceeds the undiscounted cash flows, an impairment loss is measured and recognized and the book value of the long-lived asset is adjusted to fair value. An impairment loss is measured as the difference between the book value and the fair value of the long-lived assets. Cash flows are estimated using internal budgets based on recent sales data, projected future operational results, client commitments, as well as assumptions related to discount rates. Changes in economic or operating conditions impacting these estimates and assumptions could result in the impairment of long-lived assets. There were no impairment charges taken for the periods presented herein.
Fair Value of Financial Instruments
The carrying amounts of the Company’s financial instruments, including cash, accounts receivable, and accounts payable, approximate fair value due to their short maturities. The carrying value of the Company’s long-term debt obligations approximates market value because they have an interest rate that varies with market interest rates.
Debt Origination Costs
The origination costs related to the issuance of debt are recorded as a reduction to the related liability and are amortized to interest expense over the contractual term of the loan facility using the effective interest method.
Derivatives and Hedging
The Company does not engage in speculative transactions for trading purposes. The Company uses derivative financial instruments in the normal course of business to manage its exposure to interest rate changes under its debt agreements, which bear interest at variable rates, and to manage its exposure to foreign currency exchange rates.
The Company records derivative instruments as either assets or liabilities in the consolidated balance sheet at their fair value. The Company has not designated any derivative instruments as cash flow hedges, and changes in the fair value of derivative instruments are recorded in earnings. See Note 18, Fair Value Measurements, and Note 19, Derivatives and Hedging, for additional information about these contracts.
Foreign Currency Translation
For the Company’s foreign operations, the functional currency is the local currency. Assets and liabilities of these operations are translated at the exchange rate in effect on the balance sheet date while income and expenses are translated at the average exchange rates prevailing during the period.
Foreign currency gains and losses resulting from transactions, and the translation of consolidated financial statements are recorded in the Company’s consolidated financial statements based upon the provisions of ASC 830, Foreign Currency Matters. The effects of currency exchange rate changes on intercompany transactions and balances of a long-term investment nature are accumulated and carried as a component of accumulated other comprehensive income. The effects of currency exchange rate changes on intercompany transactions that are denominated in a currency other than an entity’s functional currency are charged or credited to earnings through other expense or other income for the period presented.
F-28
Table of Contents
Revenue Recognition
Revenue is recognized in accordance with ASC 605, Revenue Recognition, when the following criteria are met: (1) persuasive evidence of an arrangement exists; (2) service has occurred; (3) an established sales price has been set with the client; (4) collection of the sale revenue from the client is reasonably assured. The Company’s revenue is derived from the following services:
| • | Remote production services: These services provide the Company’s clients with a mobile control room to facilitate the capture and creation of live content, including a mobile unit equipped with the Company’s assets (e.g., cameras and related audio and video equipment) together with a NEP Group broadcast engineering team. |
| • | Studio production services: These services include the supply and operation of studios and/or control rooms that support live and near-live format television programming for entertainment clients. |
| • | Video display services: These services provide the Company’s clients with large-scale, modular, LED video screens and related capabilities together with a NEP Group technical display engineering team. |
In general, the Company recognizes revenue ratably as the related services are provided. Revenue from contracts associated with events are considered earned as the services are delivered; delivery, for those events, is considered to have occurred when services are delivered in conjunction with the broadcast of each event. For certain events, the Company incurs certain event-related direct costs for additional services required by the event that are passed through to the client as additional revenue with no mark-up or margin earned by us.
Unbilled receivables represent recorded revenue that has been earned and is billable by the Company at future dates based on contractual payment terms and is anticipated to be billed and collected within the 12 months following the balance sheet date.
The Company collects deposits in advance for certain events. These deposits are considered to be deferred revenue and are recognized ratably over the service period as the related services are provided.
Income Taxes
The Company utilizes the asset and liability method of accounting for income taxes, which requires the recognition of deferred tax assets and liabilities for expected future consequences of temporary differences between the financial reporting and income tax basis of assets and liabilities using enacted tax rates. The Company management makes estimates, assumptions and judgments to determine the Company’s provision for income taxes and also for deferred tax assets and liabilities, and any valuation allowances recorded against the Company’s deferred tax assets. The Company assesses the likelihood that its deferred tax assets will be recovered from future taxable income and, to the extent the Company believes that recovery is not likely, the Company must establish a valuation allowance.
The calculation of the Company’s current provision for income taxes involves the use of estimates, assumptions and judgments while taking into account current tax laws, interpretation of current tax laws and possible outcomes of future tax audits. The effects of future changes in tax laws or rates are not anticipated. Although the Company believes its estimates, assumptions and judgments to be reasonable, any changes in tax law or its interpretation and the resolutions of potential tax audits could impact the amounts provided for income taxes in the Company’s consolidated financial statements.
The calculation of the Company’s deferred tax asset balance involves the use of estimates, assumptions and judgments while taking into account estimates of the amounts and type of future taxable income. Actual future operating results and the underlying amount and type of income could differ materially from the Company’s estimates, assumptions and judgments thereby impacting the Company’s consolidated financial position and results of operations.
F-29
Table of Contents
The Company evaluates uncertain tax positions using the recognition threshold and measurement attribute for the financial statement recognition and measurement of uncertain tax positions taken or expected to be taken in the Company’s income tax return, and also provides guidance on derecognition, classification, interest and penalties, accounting in interim periods, disclosure and transition.
The Company includes interest and penalties related to unrecognized tax benefits within income tax expense in the accompanying consolidated statements of operations and comprehensive income (loss). The Company has not incurred any material interest or penalties related to unrecognized tax benefits in any of the periods presented.
Other Comprehensive Income (Loss)
Comprehensive income (loss) is defined as net income and all other non-owner changes in shareholders’ equity. Other comprehensive income (loss) results from items deferred from recognition into the consolidated statements of operations and comprehensive income (loss). The Company follows the provisions of ASC 220, Comprehensive Income, for the reporting and display of comprehensive income and its components. The Company’s accumulated other comprehensive income consists of foreign currency translation adjustments. Accumulated other comprehensive income (loss) (“AOCI”) is separately presented on the Company’s consolidated balance sheets as part of shareholders’ equity.
Equity-Based Compensation
The Company accounts for equity-based compensation using the fair value method as set forth in the ASC 718, Compensation—Stock Compensation, which requires the measurement and recognition of compensation expense for all share-based payment awards based on estimated fair values. This method requires companies to estimate the fair value of stock-based compensation on the date of grant using an option pricing model. The Company estimates the fair value of each equity-based payment award on the date of grant using the Black-Scholes pricing model.
The Black-Scholes model determines the fair value of equity-based payment awards based on the fair value of the underlying common stock on the date of grant and requires the use of estimates and assumptions, including the fair value of the Company’s common stock, exercise price of the stock option, expected volatility, expected life, risk-free interest rate and dividend rate. The Company estimates the expected volatility of its stock options by taking the average historical volatility of a group of comparable publicly traded companies over a period equal to the expected life of the options; it is not practical for the Company to estimate its own volatility due to the lack of a liquid market and historical prices. The expected term of the options was determined in accordance with existing equity agreements as the underlying options are assumed to be exercised upon the passage of time. The risk-free interest rate is the estimated average interest rate based on U.S. Treasury zero-coupon notes with terms consistent with the expected life of the awards. The expected dividend yield is zero as the Company does not anticipate paying any recurring cash dividends in the foreseeable future. The Company estimates the forfeiture rate of its stock-based awards based on an analysis of the Company’s actual forfeitures, analysis of employee turnover and other factors. The impact from a forfeiture rate adjustment would be recognized in full in the period in which the forfeiture rate changes, and, if the actual number of future forfeitures differs from the Company’s prior estimates, the Company may be required to record adjustments to equity-based compensation expense in future periods.
Equity awards issued to non-employees are accounted for at fair value. The Company believes that the fair value of the awards is more reliably measured than the fair value of services received. The Company records compensation expense based on the then-current fair values of the stock awards at each financial reporting date. Compensation recorded during the service period is adjusted in subsequent periods for changes in the stock award’s fair value until the earlier of the date at which the non-employee’s performance is complete or a performance commitment is reached, which is generally when the stock option award vests. Compensation expense relating to non-employee stock awards is recorded on a straight-line basis.
F-30
Table of Contents
Common Stock Valuation
Determining the fair value of the Company’s common stock requires complex and subjective judgment and estimates. There is inherent uncertainty in making these judgments and estimates. The absence of an active market for the Company’s common stock required the Company’s Board of Directors to estimate the fair value of the common stock for purpose of setting the exercise price of the options and estimating the fair value of the common stock at the time options were granted based on factors such as valuations of comparable companies, the status of the Company’s development and sales efforts, revenue growth, and additional objective and subjective factors relating to the Company’s business. The Company performed its analysis in accordance with applicable elements of the practice aid issued by the American Institute of Certified Public Accountants’ (“AICPA”) Practice Guide, Valuation of Privately Held Company Equity Securities Issues as Compensation; with this guidance, the Company’s Board of Directors exercised reasonable judgment and considered numerous and subjective factors to determine the best estimate of fair value of the Company’s common stock, including the following:
Company specific factors
| • | Actual and forecasted operating and financial performance based on management’s estimate |
| • | Historical acquisition valuations of the Company |
| • | The development and maintenance of client relationships |
| • | Client and industry recognition |
| • | The hiring and retention of key personnel |
| • | The historical lack of a public market for the Company’s common stock |
General economic factors
| • | Industry trends and competitive environment |
| • | Trends in client and the at-large public spending, including client and public confidence |
| • | Overall economic indicators |
| • | The general economic outlook |
The common stock valuations have historically leveraged the historical prices paid to acquire the Company’s common stock in change of ownership transactions, which were representative of fair value. The purchase price is allocated to those shares outstanding at the time of purchase to calculate the fair value of each share of common stock. This approach was applied consistently from the December 23, 2012, change in ownership forward. The Company’s valuation of common stock has historically been estimated utilizing a market approach. When coincident with the grant date of options, the Company has utilized the valuation ascribed in private equity change in ownership transactions. There is only one class of stock, common stock.
Earnings Per Share
Basic and diluted earnings per common share are computed in accordance with ASC 260, Earnings Per Share. Basic earnings per share of common stock is computed by dividing income (loss) by the weighted average number of shares of common stock outstanding during the period. Diluted earnings per common share gives effect to all potential dilutive issuances of shares of common stock outstanding during the period; the computation of diluted earnings per share does not assume conversion, exercise, or contingent exercise of securities that would have an anti-dilutive effect on earnings per share.
F-31
Table of Contents
Use of Estimates
The preparation of consolidated financial statements in conformity with accounting principles generally accepted in the United States requires the Company to make estimates and assumptions that affect the reported amounts of assets and liabilities at the balance sheet dates and the reported amounts of revenue and expenses during the reporting period. Actual amounts could differ from those estimates. On an ongoing basis, management reviews its estimates based on currently available information. Changes in facts and circumstances may result in revised estimates.
Recent Accounting Pronouncements
Income Taxes
In July 2013, the FASB issued Accounting Standards Update (“ASU”) No. 2013-11, Income Taxes: Presentation of an Unrecognized Tax Benefit When a Net Operating Loss Carryforward, a Similar Tax Loss, or a Tax Credit Carryforward Exists. This guidance provides that a liability related to an unrecognized tax benefit would be presented as a reduction of a deferred tax asset for a net operating loss carryforward, a similar tax loss or a tax credit carryforward if such settlement is required or expected in the event the uncertain tax position is disallowed. The new guidance becomes effective for the Company on January 1, 2014, however, early adoption is permitted, and it should be applied prospectively to unrecognized tax benefits that exist at the effective date with retrospective application permitted. The Company adopted the guidance during the year ended December 31, 2013. The guidance had no material impact to the Company’s consolidated financial position or results of operations for the periods presented.
On September 13, 2013, the U.S. Treasury Department and the Internal Revenue Service (“IRS”) issued final regulations that address costs incurred in acquiring, producing, or improving tangible property (the “tangible property regulations”). The tangible property regulations are generally effective for tax years beginning on or after January 1, 2014, and may be adopted in earlier years. The tangible property regulations require the Company to make tax accounting method changes as of January 1, 2014; however, management has evaluated the impact to the consolidated financial statements and determined the impact of these changes are not material to the Company’s consolidated financial position, its results of operations, or both.
Revenue
In May 2014, the FASB issued ASU No. 2014-09, Revenue from Contracts with Customers. This guidance supersedes the revenue recognition requirements in ASC 605, Revenue Recognition. This guidance is based on the principle that revenue is recognized to depict the transfer of goods or services to customers in an amount that reflects the consideration to which the entity expects to be entitled in exchange for those goods or services. The guidance also requires additional disclosure about the nature, amount, timing and uncertainty of revenue and cash flows arising from customer contracts, including significant judgments and changes in judgments and assets recognized from costs incurred to obtain or fulfill a contract. The amendments in this ASU are effective retrospectively for annual reporting periods beginning after December 15, 2016, including interim periods within that reporting period. Entities have the option of using full retrospective, cumulative effect or modified approach to adopt the guidance. The Company is evaluating the potential impact of this adoption on the Company’s consolidated financial statements.
2. Acquisitions
Faber
On December 19, 2014, the Company acquired Faber Audiovisuals (“Faber”). Headquartered in the Netherlands with outlets in Dubai and the United States, Faber is a leading supplier of display and audiovisuals solutions in the European and international markets. The acquisition extends the Company’s display solution
F-32
Table of Contents
capabilities beyond the United States. The aggregate purchase price for Faber was approximately $31.7 million (25.8 million EUR). The aggregate purchase price was primarily funded by cash on hand and borrowings under the Company’s credit facility. Transaction costs of approximately $0.8 million were incurred related to the acquisition and were included in the selling, general, and administrative expenses (“SG&A”) for the year ended December 31, 2014.
The purchase price has been allocated to the assets and liabilities acquired based upon their respective fair market values. Property, plant, and equipment were valued at fair value by estimating the replacement costs of such assets. Acquired intangibles were valued using a discounted cash flow analysis, and these intangibles are subject to impairment testing, consistent with the Company policy. Significant assumptions were utilized in the valuation of the intangible assets acquired and were based on company specific information and projections which were not observable in the market and are thus considered Level 3 measurements as defined by generally accepted accounting principles (“GAAP”). The excess of the aggregate purchase price over the fair values of the net assets acquired was recognized as goodwill of $26.5 million. None of the goodwill is expected to be deducted for tax purposes.
The fair value estimates for the assets and liabilities acquired are still being evaluated and are assumed based upon preliminary calculations, valuations, and assumptions that are subject to change as the Company obtains additional information during the measurement period (up to one year from the acquisition date). The primary areas of those preliminary estimates that are not yet finalized relate to property, plant and equipment, intangible assets, deferred tax assets, and deferred tax liabilities.
Silk Studios
On December 1, 2014, the Company acquired Silk Studios (“Silk”). Silk operates a studio facility in Sydney, Australia, that hosts programs for many of the networks in the region. This acquisition expands the Company’s international reach as well as adds to the studio facilities that NEP Australia already operates in Sydney and Melbourne, Australia. The aggregate purchase price for Silk was approximately $6.4 million (7.5 million AUD). The aggregate purchase price was primarily funded by cash on hand and borrowings under the Company’s credit facility.
The purchase price has been allocated to the assets acquired based upon their respective fair market values. Property, plant, and equipment were valued at fair value by estimating the replacement costs of such assets. Acquired intangibles were valued using a discounted cash flow analysis, and these intangibles are subject to impairment testing, consistent with the Company policy. Significant assumptions were utilized in the valuation of the intangible assets acquired and were based on company specific information and projections, which were not observable in the market and are thus considered Level 3 measurements as defined by GAAP. The excess of the aggregate purchase price over the fair values of the net assets acquired was recognized as goodwill of $1.9 million. None of the goodwill is expected to be deducted for tax purposes.
The fair value estimates for the assets acquired are still being evaluated and are assumed based upon preliminary calculations, valuations, and assumptions that are subject to change as the Company obtains additional information during the measurement period (up to one year from the acquisition date). The primary areas of those preliminary estimates that are not yet finalized relate to property, plant, and equipment and intangible assets.
MIRA
On August 29, 2014, the Company acquired all of the assets of MIRA Mobile Television (“MIRA”). MIRA, based in Portland, Oregon, specializes in providing remote video production services for live events in the United States. The acquisition expands the Company’s presence in the broadcast services industry in the United States and Canada. The aggregate purchase price for MIRA was approximately $63.6 million. To finance this
F-33
Table of Contents
transaction, the Company increased the existing first lien term loan by $60.0 million and financed the remaining purchase price with cash on hand and borrowings on the Company’s credit facility. Transaction costs of approximately $0.6 million were incurred related to the acquisition and were included in the SG&A expenses for the year ended December 31, 2014.
The purchase price has been allocated to the assets acquired based upon their respective fair market values. Property, plant, and equipment were valued at fair value by estimating the replacement costs of such assets. Acquired intangibles were valued using a discounted cash flow analysis, and these intangibles are subject to impairment testing, consistent with the Company policy. Significant assumptions were utilized in the valuation of the intangible assets acquired and were based on company specific information and projections which were not observable in the market and are thus considered Level 3 measurements as defined by GAAP. The excess of the aggregate purchase price over the fair values of the net assets acquired was recognized as goodwill of $17.5 million, all of which is expected to be deducted for tax purposes.
The fair value estimates for the assets acquired are still being evaluated and are assumed based upon preliminary calculations, valuations, and assumptions that are subject to change as the Company obtains additional information during the measurement period (up to one year from the acquisition date). The primary areas of those preliminary estimates that are not yet finalized relate to property, plant and equipment, intangible assets, deferred tax assets, and deferred tax liabilities.
GTV
On January 24, 2014, the Company acquired all of the outstanding common stock of GTV Holdings Pty Ltd (“GTV”). GTV, based in Sydney, Australia, specializes in providing outsourced television production services in Australia and the Asia-Pacific region. The acquisition expands the Company’s international presence in the outsourced media services industry. The aggregate purchase price for GTV was approximately $153.5 million (174.1 million AUD), subject to a working capital adjustment. To finance this transaction, the Company increased the first lien term loan under its existing credit facility by $155.0 million. Transaction costs of approximately $1.3 million were incurred related to the acquisition and were included in the SG&A expenses for the year ended December 31, 2014.
The purchase price has been allocated to the assets and liabilities acquired based upon their respective fair market values. Property, plant, and equipment were valued at fair value by estimating the replacement costs of such assets. Acquired intangibles were valued using a discounted cash flow analysis, and these intangibles are subject to impairment testing, consistent with the Company policy. Significant assumptions were utilized in the valuation of the intangible assets acquired and were based on company specific information and projections which were not observable in the market and are thus considered Level 3 measurements as defined by GAAP. The excess of the aggregate purchase price over the fair values of the net assets acquired was recognized as goodwill of $54.2 million. None of the goodwill is expected to be deducted for tax purposes.
NEP
On December 23, 2012, the Predecessor Company was acquired in a transaction that resulted in a change in ownership. As a result, NEP Group was formed by Crestview, an unrelated shareholder, and certain members of management. The acquisition was accounted for under the acquisition method of accounting. The aggregate net purchase price of approximately $792.0 million consisted of 21.6 million shares of common stock valued at approximately $201.6 million (net of transaction costs of $10 million) and borrowings under the credit agreement (see Note 9) of $590.4 million (net of debt issuance costs of $29.6 million). Transaction costs of $19.7 million were incurred and were included in SG&A expenses at December 23, 2012. The transaction also included the repayment of $392.3 million of existing debt. Of the 21.6 million shares of common stock issued, 20.0 million shares were issued to Crestview; the remaining 1.5 million shares were issued to management and trusts related to members of management. Common stock was valued by dividing the purchase price, representative of fair
F-34
Table of Contents
value, by the outstanding shares of common stock at the transaction date. The purchase price has been allocated to the assets acquired based upon their respective fair market values. As a result of the acquisition and change in ownership, previously issued options were accelerated; approximately $9.2 million in compensation expense relating to these options was recognized simultaneously with the acquisition and is not reflected in the results of operations in either the Successor Periods or Predecessor Periods. Property, plant, and equipment were valued at fair value by estimating the replacement costs of such assets. Acquired intangibles were valued using a discounted cash flow analysis, and these intangibles are subject to impairment testing, consistent with the Company’s related impairment policy. Significant assumptions were utilized in the valuation of the intangible assets acquired and were based on company specific information and projections which were not observable in the market and are thus considered Level 3 measurements as defined by generally accepted accounting principles, or GAAP. The excess of the aggregate purchase price over the fair values of the net assets acquired was recognized as goodwill of $444.0 million. Approximately $147.0 million of the goodwill of $444.0 million is expected to be deducted for tax purposes in future years.
Corplex, Inc.
On December 17, 2012, the Predecessor Company acquired all of the outstanding common stock of Corplex, Inc. (“Corplex”). Corplex, based in Chicago, Illinois, is a provider of broadcast services within the U.S. market. The acquisition was accounted for under the acquisition method of accounting. The aggregate purchase price for Corplex was approximately $14.0 million, net of debt acquired of approximately $6.0 million. Transaction costs of approximately $1.0 million were incurred and included in SG&A expenses. The purchase price has been allocated to the assets acquired based upon their respective fair market values. Property, plant, and equipment were valued at fair value by estimating the replacement costs of such assets. The excess of the aggregate purchase price over the fair values of the net assets acquired was recognized as goodwill of $3.5 million. The aggregate purchase price was primarily funded by cash on hand and borrowings under the Predecessor Company’s credit facility. None of the goodwill of $3.5 million is expected to be deducted for tax purposes.
Bow Tie TV Holdings Limited
On April 27, 2012, the Predecessor Company acquired all of the outstanding common stock of Bow Tie TV Holdings Limited (“Bow Tie TV”). Bow Tie TV, based in the United Kingdom, is a provider of broadcast services. The acquisition was accounted for under the acquisition method of accounting. The aggregate purchase price for Bow Tie TV was approximately $5.3 million. Transaction costs of approximately $0.4 million were incurred and included in SG&A expenses. The purchase price has been allocated to the assets acquired based upon their respective fair market values. Property, plant, and equipment were valued at fair value by estimating the replacement costs of such assets. The excess of the aggregate purchase price over the fair values of the net assets acquired was recognized as goodwill of $3.6 million. The aggregate purchase price was primarily funded by cash on hand and borrowings under the Company’s credit facility. All of the goodwill of $3.6 million is expected to be deducted for tax purposes.
Trio Video, LLC
On March 21, 2012, the Predecessor Company acquired certain operating assets and liabilities of Trio Video, LLC (“Trio”), a U.S.-based provider of broadcast services. The acquisition was accounted for under the acquisition method of accounting. Transaction costs of approximately $0.4 million were incurred and included in SG&A expenses. The purchase price has been allocated to the assets acquired based upon their respective fair market values. Property, plant, and equipment were valued at fair value by estimating the replacement costs of such assets. The aggregate purchase price was approximately $21.6 million and was primarily funded with cash on hand, borrowings under the Predecessor Company’s credit facility, and the issuance of a note payable. There was no goodwill related to this acquisition, and instead, there was a bargain purchase gain of $1.4 million as the purchase price was less than the fair value of the assets acquired. This gain was recorded in other income.
F-35
Table of Contents
For the aforementioned acquisitions, the following table summarizes the fair values of the assets acquired and liabilities assumed at the date of the acquisition:
| Predecessor | ||||||||||||
| Trio | Bowtie | Corplex | ||||||||||
| March 21, 2012 |
April 27, 2012 |
December 17, 2012 |
||||||||||
| Assets: |
||||||||||||
| Current assets |
1,510 | 1,341 | 1,978 | |||||||||
| Property, plant, and equipment |
20,650 | 1,981 | 18,739 | |||||||||
| Intangible assets |
— | — | — | |||||||||
| Goodwill |
— | 3,610 | 3,504 | |||||||||
| Other long-term assets |
— | — | — | |||||||||
|
|
|
|
|
|
|
|||||||
| Total assets acquired |
$ | 22,160 | $ | 6,932 | $ | 24,221 | ||||||
|
|
|
|
|
|
|
|||||||
| Liabilities: |
||||||||||||
| Accounts payable |
475 | 1,664 | 103 | |||||||||
| Deferred revenue |
— | — | — | |||||||||
| Other liabilities |
105 | — | 4,095 | |||||||||
| Long-term debt |
— | — | 5,986 | |||||||||
|
|
|
|
|
|
|
|||||||
| Total liabilities assumed |
580 | 1,664 | 10,184 | |||||||||
|
|
|
|
|
|
|
|||||||
| Net assets acquired |
$ | 21,580 | $ | 5,268 | $ | 14,037 | ||||||
|
|
|
|
|
|
|
|||||||
| Successor | ||||||||||||||||||||
| NEP | GTV | MIRA | Silk | Faber | ||||||||||||||||
| December 24, 2012 |
January 24, 2014 |
August 29, 2014 |
December 1, 2014 |
December 19, 2014 |
||||||||||||||||
| Assets: |
||||||||||||||||||||
| Current assets |
71,026 | $ | 6,628 | $ | — | $ | — | $ | 3,243 | |||||||||||
| Property, plant, and equipment |
325,154 | 83,083 | 38,578 | 2,186 | 13,949 | |||||||||||||||
| Intangible assets |
77,917 | 18,735 | 7,570 | 2,293 | 5,167 | |||||||||||||||
| Goodwill |
443,995 | 54,202 | 17,452 | 1,896 | 26,463 | |||||||||||||||
| Other long-term assets |
223 | 1,918 | — | — | 44 | |||||||||||||||
|
|
|
|
|
|
|
|
|
|
|
|||||||||||
| Total assets acquired |
$ | 918,315 | $ | 164,566 | $ | 63,600 | $ | 6,375 | $ | 48,866 | ||||||||||
|
|
|
|
|
|
|
|
|
|
|
|||||||||||
| Liabilities: |
||||||||||||||||||||
| Accounts payable |
19,959 | 3,431 | — | — | 1,366 | |||||||||||||||
| Deferred revenue |
3,521 | 909 | — | — | 950 | |||||||||||||||
| Other liabilities |
100,346 | 6,755 | — | — | 3,319 | |||||||||||||||
| Long-term debt |
394,800 | — | — | — | 11,503 | |||||||||||||||
|
|
|
|
|
|
|
|
|
|
|
|||||||||||
| Total liabilities assumed |
518,626 | 11,095 | — | — | 17,138 | |||||||||||||||
|
|
|
|
|
|
|
|
|
|
|
|||||||||||
| Net assets acquired |
$ | 399,689 | $ | 153,471 | $ | 63,600 | $ | 6,375 | $ | 31,728 | ||||||||||
|
|
|
|
|
|
|
|
|
|
|
|||||||||||
During the measurement period ended January 24, 2015, opening balance sheet adjustments were made to finalize the preliminary fair value estimates related to GTV assets and liabilities acquired. The measurement period adjustment resulted in a $0.2 million increase in property, plant, and equipment, a $2.6 million decrease in intangible assets, a $5.0 million increase in goodwill, a $0.6 million decrease to other long-term assets, and a $2.0 million increase in other liabilities. Accordingly, the effects were retrospectively applied and are shown in the table above.
From their respective acquisition dates through the period ended December 23, 2012, Trio, Bowtie and Corplex contributed $10.4 million, $3.3 million and $0.1 million in revenues, respectively, and $0.1 million, $0.3 million and $0 in net income, respectively. From their respective acquisition date, through the year ended
F-36
Table of Contents
December 31, 2014, GTV, MIRA, Silk, and Faber contributed $84.3 million, $7.6 million, $0.1 million, and $0.5 million in revenues, respectively, and $1.4 million, $(0.2) million, $0 million, and $0 million in net income (loss), respectively.
The following table presents supplemental unaudited pro forma financial information as if the above acquisitions had occurred on January 1, 2012. The unaudited pro forma results reflect certain adjustments related to past operating performance and acquisition accounting adjustments, such as increased amortization expense based on the fair value of assets acquired, the impact of acquisition financing and the related income tax effects. The unaudited pro forma results do not include any synergies which may have been achieved subsequent to the acquisition date. Accordingly, the unaudited pro forma results are not necessarily indicative of the results that actually would have occurred had the acquisition been completed on January 1, 2012, nor are they indicative of the future operating results of the Company.
| Predecessor | Successor | |||||||||||||||
| (in thousands, except per share amounts) | 358-Day Period Ended December 23, 2012 |
December 24, 2012 to December 31, 2012 |
Year Ended December 31, 2013 |
Year Ended December 31, 2014 |
||||||||||||
| Total revenues |
$ | 492,774 | $ | 7,052 | $ | 470,774 | $ | 480,208 | ||||||||
|
|
|
|
|
|
|
|
|
|||||||||
| Net loss |
$ | (4,450 | ) | $ | (1,340 | ) | $ | (16,239 | ) | $ | (30,248 | ) | ||||
|
|
|
|
|
|
|
|
|
|||||||||
| Earnings per common share: |
||||||||||||||||
| Basic |
$ | (2.67 | ) | $ | (0.06 | ) | $ | (0.74 | ) | $ | (1.37 | ) | ||||
|
|
|
|
|
|
|
|
|
|||||||||
| Diluted |
$ | (2.67 | ) | $ | (0.06 | ) | $ | (0.74 | ) | $ | (1.37 | ) | ||||
|
|
|
|
|
|
|
|
|
|||||||||
| Weighted average common shares outstanding: |
||||||||||||||||
| Basic |
1,668,793 | 21,703,089 | 21,811,728 | 22,128,922 | ||||||||||||
|
|
|
|
|
|
|
|
|
|||||||||
| Diluted (1) |
1,668,793 | 21,703,089 | 21,811,728 | 22,128,922 | ||||||||||||
|
|
|
|
|
|
|
|
|
|||||||||
| (1) | Outstanding options aggregating incremental shares of 196,793, 0, 1,854,737, and 2,098,203 have been excluded from the period from January 1 to December 23, 2012, the period from December 24, 2012 to December 31, 2012, and the years ended December 31, 2013 and 2014 diluted earnings per share (“EPS”) calculations, respectively, as they are anti-dilutive due to the losses generated in each respective period. |
3. Accounts Receivable
Accounts receivable consisted of the following:
| December 31, 2013 |
December 31, 2014 |
|||||||
| Billed receivables |
$ | 42,840 | $ | 54,698 | ||||
| Unbilled receivables |
8,874 | 7,704 | ||||||
| Allowance for doubtful accounts |
(1,414 | ) | (2,083 | ) | ||||
|
|
|
|
|
|||||
| Accounts receivable, net |
$ | 50,300 | $ | 60,319 | ||||
|
|
|
|
|
|||||
F-37
Table of Contents
4. Prepaid expenses and other current assets
Prepaid expenses and other current assets consisted of the following:
| December 31, 2013 |
December 31, 2014 |
|||||||
| Prepaid insurance |
$ | 558 | $ | 1,650 | ||||
| Prepaid taxes |
311 | 752 | ||||||
| Prepaid deposits |
3,068 | 4,107 | ||||||
| Prepaid maintenance agreements |
405 | 468 | ||||||
| Prepaid other |
2,298 | 1,992 | ||||||
|
|
|
|
|
|||||
| Total prepaids and other current assets |
$ | 6,640 | $ | 8,969 | ||||
|
|
|
|
|
|||||
5. Property, Plant, and Equipment
Property, plant, and equipment consisted of the following:
| December 31, 2013 |
December 31, 2014 |
|||||||
| Broadcast and production equipment |
$ | 360,697 | $ | 556,317 | ||||
| Furniture and fixtures |
1,195 | 3,614 | ||||||
| Building and leasehold improvements |
6,403 | 20,071 | ||||||
| Computer equipment |
1,079 | 1,748 | ||||||
| Vehicles |
19,188 | 25,771 | ||||||
| Construction in progress |
6,302 | 7,906 | ||||||
|
|
|
|
|
|||||
| 394,864 | 615,427 | |||||||
|
|
|
|
|
|||||
| Accumulated depreciation |
(94,128 | ) | (213,990 | ) | ||||
|
|
|
|
|
|||||
| Total property, plant, and equipment, net |
$ | 300,736 | $ | 401,437 | ||||
|
|
|
|
|
|||||
Due to the change of ownership on December 23, 2012, a valuation was performed on the Company’s fixed assets; as a result, the total property, plant and equipment net book value at December 23, 2012 of $244.3 million was written-up to fair value of $325.2 million. Accumulated depreciation at December 23, 2012 was $352.3 million; as part of the acquisition accounting, this balance was written off. The Predecessor Company’s depreciation expense was $69.6 million for the period from January 1, 2012 to December 23, 2012. The Successor Company’s depreciation expense was $2.0 million for the period from December 24, 2012 to December 31, 2012 and $94.0 million and $125.1 million for the years ended December 31, 2013 and 2014, respectively.
The amount of interest expense capitalized to property, plant, and equipment by the Predecessor Company was $0.2 million for the period from January 1, 2012 to December 23, 2012. The Successor Company capitalized interest expense of $0 for the period from December 24, 2012 to December 31, 2012, and $0.6 million and $0.3 million for the years ended December 31, 2013 and 2014, respectively.
6. Intangible Assets
Intangible assets relate primarily to those customer relationships obtained through acquisitions (see Note 2). The customer relationship amortization is recorded on a straight-line basis over the estimated useful life of each relationship with a weighted-average useful life remaining of 211 months and 191 months for the years ended December 31, 2013 and 2014, respectively. The intangible asset weighted average useful life was 223 months and 210 months for the years ended December 31, 2013 and 2014, respectively.
F-38
Table of Contents
The following table presents the gross carrying amount, accumulated amortization, and resulting net intangibles:
| December 31, 2013 |
December 31, 2014 |
|||||||
| Gross carrying amount |
$ | 77,917 | $ | 111,682 | ||||
| Accumulated amortization |
(7,257 | ) | (15,829 | ) | ||||
| Foreign currency impact |
213 | (1,772 | ) | |||||
|
|
|
|
|
|||||
| Net intangibles |
$ | 70,873 | $ | 94,081 | ||||
|
|
|
|
|
|||||
Due to the change of ownership on December 23, 2012, a valuation was performed on the Company’s intangible assets; as a result, the intangibles’ net book value at December 23, 2012 of $28.9 million was written-up to fair value of $77.9 million. The Predecessor Company incurred intangible asset amortization expense of $4.0 million for the period from January 1, 2012 to December 23, 2012. The Successor Company incurred intangible asset amortization expense of $0.2 million, $7.1 million, and $8.6 million for the period from December 24, 2012 to December 31, 2012 and the years ended December 31, 2013 and 2014, respectively. The estimated aggregate intangible asset amortization for the next five years and thereafter is expected to be as follows:
| 2015 |
$ | 9,688 | ||
| 2016 |
9,688 | |||
| 2017 |
9,578 | |||
| 2018 |
4,691 | |||
| 2019 |
4,446 | |||
| Thereafter |
55,990 | |||
|
|
|
|||
| $ | 94,081 | |||
|
|
|
7. Goodwill
Goodwill represents the excess of the cost of an acquisition over the fair value of the net assets acquired (see Note 2). Goodwill is not amortized but is reviewed annually during the fourth quarter for impairment (see Note 1). The following table presents the Company’s rollforward of goodwill for the years ended December 31, 2013 and 2014:
| United States | International | Total | ||||||||||
| Balance at December 31, 2012 |
$ | 400,753 | $ | 43,242 | $ | 443,995 | ||||||
| Foreign currency adjustment |
— | 860 | 860 | |||||||||
|
|
|
|
|
|
|
|||||||
| Balance at December 31, 2013 |
$ | 400,753 | $ | 44,102 | $ | 444,855 | ||||||
| Goodwill from acquisitions |
17,452 | 82,561 | 100,013 | |||||||||
| Foreign currency adjustment |
— | (7,034 | ) | (7,034 | ) | |||||||
|
|
|
|
|
|
|
|||||||
| Balance at December 31, 2014 |
$ | 418,205 | $ | 119,629 | $ | 537,834 | ||||||
|
|
|
|
|
|
|
|||||||
F-39
Table of Contents
8. Accrued Expenses
Accrued expenses consisted of the following:
| December 31, 2013 |
December 31, 2014 |
|||||||
| Accrued direct costs |
$ | 7,613 | 8,024 | |||||
| Accrued compensation |
4,679 | 10,377 | ||||||
| Accrued transaction costs |
— | 350 | ||||||
| Taxes payable |
1,658 | 2,061 | ||||||
| Accrued employee benefit costs |
1,385 | 860 | ||||||
| Other accruals |
1,399 | 3,714 | ||||||
|
|
|
|
|
|||||
| Total accrued expenses |
$ | 16,734 | $ | 25,386 | ||||
|
|
|
|
|
|||||
9. Long-Term Debt
Long-term debt consisted of the following:
| December 31, 2013 |
December 31, 2014 |
|||||||
| First lien term loan |
$ | 524,700 | $ | 734,311 | ||||
| Second lien term loan |
80,000 | 80,000 | ||||||
| First lien term loan—Faber |
— | 3,180 | ||||||
| Revolving line of credit—Faber |
— | 8,189 | ||||||
| Revolving line of credit |
17,500 | 48,500 | ||||||
|
|
|
|
|
|||||
| 622,200 | 874,180 | |||||||
| Less current portion |
5,300 | 8,395 | ||||||
| Less debt origination costs |
10,816 | 15,410 | ||||||
|
|
|
|
|
|||||
| Long-term portion |
$ | 606,084 | $ | 850,375 | ||||
|
|
|
|
|
|||||
The Company is party to two credit agreements with a financial institution and other lenders. The credit agreements were entered into on December 24, 2012 in order to finance the sale of the Company to Crestview and were comprised originally of a $60.0 million revolving credit facility and a $455.0 million first lien term loan, and a second lien term loan of $165.0 million (the “Credit Agreements”).
In January 2013, the Company completed the syndication of the Credit Agreements. During the syndication of the Credit Agreements, the Company refinanced $15.0 million of the second lien term loan by increasing the first lien term loan by an equal amount and prepaid $10.0 million of the second lien term loan. Upon completion of the debt syndication and refinancing, the total term loan balance was $610.0 million, which was comprised of $470.0 million of first lien term loan and $140.0 million of second lien term loan.
In February 2013, the Company completed a second refinancing, which resulted in the refinancing of $60.0 million of the second lien term loan to the first lien term loan. After completion of this refinancing, the term loan balance of $610.0 million was comprised of a $530.0 million first lien term loan and $80.0 million second lien term loan. As a result of the refinancing, the Company determined that a partial debt extinguishment resulted, and as such, $21.2 million of previously incurred deferred financing fees were written off.
In conjunction with the acquisition of GTV on January 24, 2014 (see Note 2), the Company amended its existing credit agreement with a financial institution to increase the existing first lien term loan outstanding by $155.0 million to $679.7 million. There were no changes in the terms and conditions of the Company’s credit facility.
F-40
Table of Contents
In August 2014, the Company amended the first lien term loan in conjunction with the acquisition of MIRA (see Note 2). As a result of this amendment, the existing first lien term loan increased by $60.0 million to $738.0 million. There were no changes in the terms and conditions of the Company’s credit facility.
As a result of the aforementioned amendments, the first lien term loan is payable in 22 consecutive quarterly installments of approximately $1.8 million, beginning on September 30, 2014, through December 31, 2019, with a final payment of $697.4 million to be made on January 22, 2020. The second lien term loan is payable in full at maturity, July 22, 2020.
The combined amount of outstanding borrowings under the revolving line of credit and the letters of credit may not exceed $60.0 million. Originally, the revolving credit facility was scheduled to expire on December 24, 2017. Subsequent to the February 2013 refinancing, the revolving line of credit is scheduled to expire on January 22, 2018. The total amounts available under the revolving line of credit at December 31, 2013 and 2014, were $42.1 million and $9.6 million, respectively. The total amounts of outstanding letters of credit as of December 31, 2013 and 2014, were $0.4 million and $1.9 million, respectively.
Interest is charged on the revolving credit facility, the first lien term loan, and the second lien term loan at either (1) the lender’s alternative base rate (“ABR”), which is the greatest of (a) the prime rate, (b) the federal funds effective rate plus 0.5%, and (c) the adjusted London Interbank Offered Rate (“LIBO rate”) determined on such date for a deposit in dollars with a maturity of one month plus 1% (3.25% at December 31, 2013 and 2014) plus an applicable margin or (2) the adjusted LIBO rate which is the greater of (a) multiplied by the statutory reserve rate and (b) 1.25% (1.25% at December 31, 2013 and 2014) plus an applicable margin, at the Company’s discretion. Interest on the revolving credit facility and the first lien term loan is payable quarterly for ABR loans and in one-, two-, three-, or six-month interest periods, at the Company’s discretion, for LIBO rate-based loans. As of December 31, 2013 and 2014, the first lien term loan and the second lien term loan balances were at the LIBO rate and portions of the revolver balances outstanding were at the ABR option and LIBO rate option. Interest rates for the Company’s first lien term loan, second lien term loan, and revolving line of credit were at 4.75%, 9.50%, and 4.165%—6.25%, respectively, at December 31, 2013. Interest rates for the Company’s first lien term loan, second lien term loan, and revolving line of credit were at 4.25%, 9.50%, and 4.157%—6.25%, respectively, at December 31, 2014.
The Credit Agreements are guaranteed on a senior basis by all of the Company’s subsidiaries and are collateralized by substantially all of the assets of the Company and its subsidiaries. The Credit Agreements contains certain covenants that require the Company to maintain a minimum leverage coverage ratio. The credit agreement further limits declaration of dividends and additional indebtedness and contains restrictions on the transferring of assets and the transferring or encumbering of the Company’s stock. The Company is currently in compliance with all financial covenants required under the Credit Agreements.
Borrowings under the Company’s Credit Agreements are subject to mandatory prepayment terms in the event of a debt or equity issuance, a recovery event, asset disposition, or excess cash flows, as defined in the Credit Agreements.
Faber Debt
In conjunction with the acquisition of Faber on December 19, 2014, the Company assumed Faber’s legacy debt. This debt is comprised of a 2.4 million EUR, or $3.0 million, loan; a 0.5 million EUR, or $0.6 million, loan; a credit facility with 1.3 million EUR, or $1.6 million, maximum line of credit; and an investment line of credit with 7.5 million EUR, or $9.2 million, maximum line of credit.
The 2.4 million EUR loan on Faber Audiovisuals B.V. is payable in quarterly installments of 0.1 million EUR, starting on June 30, 2014, with the balance payable in full on March 31, 2020. Initially, the loan bears interest at Euro Interbank Offer Rate (“EURIBOR”) plus 3.0%, and after 2014, the margin is based on the ratio
F-41
Table of Contents
of senior net debt to earnings before interest, taxes, depreciation, and amortization (“EBITDA”) as follows: (1) ratio greater than or equal to 1.75, the margin is 3.0%; (2) ratio less than 1.75 and greater than or equal to 1.50, the margin is 2.75%; and (3) ratio less than 1.50, the margin is 2.5%. The loan balance outstanding at December 31, 2014 was 2.2 million EUR, or $2.7 million. The interest rate was 3.08% at December 31, 2014.
The 0.5 million EUR loan, on LED Investment International, is payable in equal monthly installments of 61,475 EUR, or approximately $75,000, through July 2015. At December 31, 2014, the balance was 0.4 million EUR, or $0.5 million. The interest rate was 4.78% at December 31, 2014.
The lines of credit (1.3 million EUR maximum line of credit and an additional 7.5 million EUR maximum investment line of credit) on Faber Audiovisuals B.V. are available until March 31, 2020. The investment line of credit is reduced by quarterly curtailments of 0.3 million EUR, beginning with the quarter ended June 30, 2014. At December 31, 2014, the revolving credit line balance was 6.7 million EUR, or $8.2 million, with 1.1 million EUR, or $1.3 million available under the facilities. The interest rate was 2.32% at December 31, 2014.
Faber’s debt contains a certain covenant that requires a minimum leverage coverage ratio. The Company is currently in compliance with the financial covenant required under the credit agreement.
Five-year maturities of long-term debt as of December 31, 2014 were as follows:
| 2015 |
$ | 8,395 | ||
| 2016 |
9,393 | |||
| 2017 |
9,393 | |||
| 2018 |
57,893 | |||
| 2019 |
9,393 | |||
| Thereafter |
779,713 | |||
|
|
|
|||
| $ | 874,180 | |||
|
|
|
10. Income Taxes
The Company files income tax returns in the U.S. federal jurisdiction and various state and foreign jurisdictions. The Company is responsible for paying the taxes relating to such items, including any subsequent adjustments resulting from the redetermination of such tax liabilities by the applicable taxing authorities.
Income (loss) before income taxes was as follows:
| Predecessor | Successor | |||||||||||||||
| 358-Day Period Ended December 23, 2012 |
December 24, 2012 (inception date) to December 31, 2012 |
Year Ended December 31, 2013 |
Year Ended December 31, 2014 |
|||||||||||||
| United States |
$ | (6,203 | ) | $ | (2,387 | ) | $ | (42,039 | ) | $ | (55,632 | ) | ||||
| International |
(3,248 | ) | (77 | ) | (1,768 | ) | 1,643 | |||||||||
|
|
|
|
|
|
|
|
|
|||||||||
| Loss before income taxes |
$ | (9,451 | ) | $ | (2,464 | ) | $ | (43,807 | ) | $ | (53,989 | ) | ||||
|
|
|
|
|
|
|
|
|
|||||||||
F-42
Table of Contents
Income tax (expense) benefit consisted of the following:
| Predecessor | Successor | |||||||||||||||
| 358-Day Period Ended December 23, 2012 |
December 24, 2012 (inception date) to December 31, 2012 |
Year Ended December 31, 2013 |
Year Ended December 31, 2014 |
|||||||||||||
| Current: |
||||||||||||||||
| Federal |
$ | — | $ | — | $ | — | — | |||||||||
| State |
(1,243 | ) | — | (275 | ) | 35 | ||||||||||
| Foreign |
(169 | ) | — | 184 | (1,110 | ) | ||||||||||
|
|
|
|
|
|
|
|
|
|||||||||
| Total |
(1,412 | ) | — | (91 | ) | (1,075 | ) | |||||||||
| Deferred: |
||||||||||||||||
| Federal |
(1,714 | ) | 832 | 13,897 | 13,530 | |||||||||||
| State |
(508 | ) | 114 | 2,260 | 878 | |||||||||||
| Foreign |
653 | — | 442 | (559 | ) | |||||||||||
|
|
|
|
|
|
|
|
|
|||||||||
| Total |
(1,569 | ) | 946 | 16,599 | 13,849 | |||||||||||
|
|
|
|
|
|
|
|
|
|||||||||
| Income tax (expense) benefit |
$ | (2,981 | ) | $ | 946 | $ | 16,508 | $ | 12,774 | |||||||
|
|
|
|
|
|
|
|
|
|||||||||
A reconciliation of U.S. income tax computed at the statutory rate to the effective tax rate is as follows:
| Predecessor | ||||||||
| 358-Day Period Ended December 23, 2012 |
||||||||
| Tax Benefit (Expense) |
Rate | |||||||
| U.S. federal statutory rate |
$ | 2,980 | 35.0 | % | ||||
| Tax rate differential on foreign income |
— | — | ||||||
| State income tax, less applicable federal income tax |
(953 | ) | (11.2 | )% | ||||
| Permanently disallowed deductions |
(4,594 | ) | (53.9 | )% | ||||
| Change in state rate |
(211 | ) | (2.5 | )% | ||||
| Valuation allowance |
(111 | ) | (1.3 | )% | ||||
| Other |
(92 | ) | (1.1 | )% | ||||
|
|
|
|
|
|||||
| Effective tax rate |
$ | (2,981 | ) | (35.0 | )% | |||
|
|
|
|
|
|||||
| Successor | ||||||||||||||||||||||||
| December 24, 2012 (inception date) to December 31, 2012 |
Year Ended December 31, 2013 |
Year Ended December 31, 2014 |
||||||||||||||||||||||
| Tax Benefit (Expense) |
Rate | Tax Benefit (Expense) |
Rate | Tax Benefit (Expense) |
Rate | |||||||||||||||||||
| U.S. federal statutory rate |
$ | 862 | 35.0 | % | $ | 15,332 | 35.0 | % | $ | 18,896 | 35.0 | % | ||||||||||||
| Tax rate differential on foreign income |
— | — | — | — | (963 | ) | (1.8 | )% | ||||||||||||||||
| State income tax, less applicable federal income tax |
84 | 3.4 | % | 1,134 | 2.6 | % | 1,658 | 3.1 | % | |||||||||||||||
| Permanently disallowed deductions |
— | — | (201 | ) | (0.5 | )% | (1,045 | ) | (1.9 | )% | ||||||||||||||
| Change in state rate |
— | — | 231 | 0.5 | % | (220 | ) | (0.4 | )% | |||||||||||||||
| Valuation allowance |
— | — | (107 | ) | (0.2 | )% | (5,486 | ) | (10.2 | )% | ||||||||||||||
| Other |
— | — | 119 | 0.3 | % | (66 | ) | (0.1 | )% | |||||||||||||||
|
|
|
|
|
|
|
|
|
|
|
|
|
|||||||||||||
| Effective tax rate |
$ | 946 | 38.4 | % | $ | 16,508 | 37.7 | % | $ | 12,774 | 23.7 | % | ||||||||||||
|
|
|
|
|
|
|
|
|
|
|
|
|
|||||||||||||
F-43
Table of Contents
In general, the Company is responsible for filing consolidated U.S. federal, foreign and combined, unitary or separate state income tax returns. The Company is responsible for paying the taxes relating to such returns, including any subsequent adjustments resulting from the redetermination of such tax liability by the applicable taxing authorities. No provision has been made for U.S. federal, state, or additional foreign taxes related to approximately $0.2 million of undistributed earnings of foreign subsidiaries, which have been permanently re-invested. The deferred tax liability on this amount is approximately $0.1 million.
The components of net deferred tax assets and liabilities were as follows:
| December 31, 2013 |
December 31, 2014 |
|||||||
| Deferred tax assets: |
||||||||
| Bad debt reserves |
$ | 529 | $ | 726 | ||||
| Accrued expenses |
355 | 3,134 | ||||||
| Deferred rent |
442 | 523 | ||||||
| Compensation accruals |
1,825 | 2,095 | ||||||
| Stock options |
709 | 1,503 | ||||||
| Financing fees |
3,511 | 3,484 | ||||||
| Transaction costs |
272 | 960 | ||||||
| U.S. asset on U.K. net deferred tax liabilities |
— | 212 | ||||||
| Unrealized gain/loss |
— | 2,752 | ||||||
| Capital lease accrual |
— | 17,068 | ||||||
| Other |
132 | 134 | ||||||
| Net operating losses: |
||||||||
| Federal |
52,773 | 63,894 | ||||||
| State |
4,149 | 5,858 | ||||||
| Foreign |
517 | 8,996 | ||||||
|
|
|
|
|
|||||
| Deferred tax assets |
65,214 | 111,339 | ||||||
| Valuation allowance |
(1,783 | ) | (12,098 | ) | ||||
|
|
|
|
|
|||||
| Net deferred tax assets |
$ | 63,431 | $ | 99,241 | ||||
| Deferred tax liabilities: |
||||||||
| U.S. liability on U.K. net deferred tax assets |
$ | (348 | ) | $ | — | |||
| Property, plant, and equipment |
(64,849 | ) | (84,246 | ) | ||||
| Intangible assets |
(27,864 | ) | (31,774 | ) | ||||
| Unrealized gain/loss |
(166 | ) | (3 | ) | ||||
|
|
|
|
|
|||||
| Total deferred tax liabilities |
(93,227 | ) | (116,023 | ) | ||||
|
|
|
|
|
|||||
| Net deferred tax liabilities |
$ | (29,796 | ) | $ | (16,782 | ) | ||
|
|
|
|
|
|||||
| Reconciliation to the consolidated balance sheets: |
||||||||
| Current deferred tax asset, net |
$ | 2,255 | $ | 7,279 | ||||
| Noncurrent deferred tax liability, net |
(32,051 | ) | (24,061 | ) | ||||
|
|
|
|
|
|||||
| Net deferred tax liabilities |
$ | (29,796 | ) | $ | (16,782 | ) | ||
|
|
|
|
|
|||||
At December 31, 2013, the Company had federal, state, and foreign net operating loss carryforwards in the amount of $154.0 million, $80.6 million, and $2.6 million, respectively, which are set to expire in various periods from 2014 through 2033. At December 31, 2014, the Company has federal, state, and foreign net operating loss carryforwards in the amount of $182.6 million, $111.4 million, and $29.7 million, respectively, which are set to expire in various periods from 2015 through 2034. However, the foreign net operating loss carryforward is carried forward indefinitely. Utilization of the Company’s net operating loss carryforward may be subject to annual limitations due to ownership change limitations imposed by Internal Revenue Code Section 382. The Company has determined that the Section 382 annual limitations will not result in expiration of the Company’s net operating loss carryforwards before utilization.
Deferred taxes arise due to temporary differences in the basis of assets and liabilities and from net operating losses and credit carryforwards. In general, deferred tax assets represent future tax benefits to be received when certain expenses previously recognized in the Company’s consolidated statements of operations and
F-44
Table of Contents
comprehensive income (loss) become deductible expenses under applicable income tax laws, or loss and credit carryforwards are utilized. Accordingly, realization of deferred tax assets is dependent on future taxable income against which these deductions, losses, and credits can be utilized. In assessing the realizability of deferred tax assets, management considers whether it is more likely than not that some portion or all of the deferred tax assets will not be realized. During 2014, the Company has determined that it is more likely than not that the benefit of the federal deferred tax assets will not be realized due to the Company’s history of pre-tax losses, and as such, $3.7 million of valuation allowance was recorded in 2014 related to federal deferred tax assets. As of December 31, 2013 and 2014, the Company has determined that it is more likely than not that the benefit of certain state deferred tax assets, such as consolidated and separate company state net operating losses, will not be realized due to their expiration before expected utilization. The amount of valuation allowance recorded on certain state deferred tax assets as of December 31, 2013 and 2014 was $1.8 million and $3.1 million, respectively. Additionally, the Company acquired GTV in 2014, which is an Australian consolidated tax group that the Company has determined it is more likely than not that the benefit of the foreign deferred tax assets will not be realized due to a history of pre-tax losses. A valuation allowance of $5.3 million is recorded as of December 31, 2014, on the Company’s Australian foreign deferred taxes on cumulative temporary items and foreign tax attributes such as net operating loss carryforwards. As of December 31, 2013 and 2014, a valuation allowance of approximately $1.8 million and $12.1 million, respectively, has been recorded against the Company’s net deferred tax assets, as it is more likely than not that such tax benefits will not be realized.
The following is a reconciliation of the gross amounts of unrecognized income tax benefits:
| Predecessor | Successor | |||||||||||||||
| 358-Day Period Ended December 23, 2012 |
December 24, 2012 (inception date) to December 31, 2012 |
Year Ended December 31, 2013 |
Year Ended December 31, 2014 |
|||||||||||||
| Balance at January 1 |
$ | 342 | $ | 312 | $ | 312 | $ | 306 | ||||||||
| Gross increases for tax positions of prior years |
— | — | — | — | ||||||||||||
| Gross decreases for tax positions of prior years |
— | — | — | (13 | ) | |||||||||||
| Gross increases for tax positions of current year |
27 | — | 28 | — | ||||||||||||
| Lapse of statute of limitations |
(57 | ) | — | (34 | ) | — | ||||||||||
|
|
|
|
|
|
|
|
|
|||||||||
| Balance at December 31 |
$ | 312 | $ | 312 | $ | 306 | $ | 293 | ||||||||
|
|
|
|
|
|
|
|
|
|||||||||
As of December 23, 2012, approximately $0.2 million of the $0.3 million of the unrecognized tax benefits would reduce the Company’s effective tax rate if recognized. As of December 31, 2012, approximately $0.2 million of the $0.3 million and as of December 31, 2013, approximately $0.2 million of the $0.3 million of the unrecognized tax benefits would reduce the Company’s effective tax rate if recognized. As of December 31, 2014, approximately $0.2 million of the $0.3 million of the unrecognized tax benefits would reduce the Company’s effective tax rate if recognized.
The Company recognizes accrued interest and penalties related to unrecognized tax benefits in income tax expense. In 2013, the Company reversed insignificant amounts due to the expiration of the statute of limitations. In 2014, the Company continued to accrue an insignificant amount of interest expense in income tax expense. In 2013 and 2014, approximately $0.1 million and $0.1 million were accrued for payment of interest and penalties.
Due to the nature of the Company’s unrecognized tax benefits, the Company does not expect changes in its unrecognized tax benefit reserve in the next twelve months to have a material impact on its consolidated financial statements.
The statute of limitations for the Company’s federal and state income tax returns is generally three years. However, to the extent there are federal and state net operating losses being carried forward from prior years, those tax years remain open under statute until the net operating loss has been utilized, upon which time the
F-45
Table of Contents
three-year statute begins. As such, the Company’s federal and state tax returns that remain subject to examination would be primarily from 2004 and thereafter. The Company’s foreign state tax returns that remain subject to examination would be primarily from 2008 for the Netherlands, from 2010 and thereafter for Australia, and from 2011 and thereafter for the United Kingdom. It should be noted that the Company will have an initial filing in Luxembourg for tax year 2014.
11. Commitments and Contingencies
The Company leases certain facilities, office equipment, and vehicles. The Company’s corporate facility is leased through Development Partners, a real estate partnership, the ownership of which is comprised of certain members of management. This lease is subject to a renewal option for one five-year period. For the period from January 1, 2012 to December 23, 2012, the Predecessor Company made payments on the lease of approximately $0.8 million. Lease payments made during the period from December 24, 2012 to December 31, 2012 were immaterial. For each of the years ended December 31, 2013 and 2014, the Company made payments on the lease of approximately $0.8 million.
Another related party controlled by members of management, Magnolia Ave. Partnership, leases facilities to a subsidiary of the Company. The Predecessor Company made payments on the lease of $0.4 million for the period from January 1, 2012 to December 23, 2012. Lease payments made during the period from December 24, 2012 to December 31, 2012 were immaterial. For each of the years ended December 31, 2013 and 2014, the Company made payments on the lease totaling approximately $0.4 million.
In addition to the aforementioned facilities, the Company leases a facility from Clear Sky Properties, LLC, which was owned by certain shareholders of the Predecessor Company. For the period from January 1, 2012 to December 23, 2012, the Predecessor Company made payments on the lease totaling $0.6 million. Lease payments made during the period from December 24, 2012 to December 31, 2012 were immaterial, however, at this time and going forward, it was no longer a related-party transaction due to the change in ownership.
The Predecessor Company’s rent expense for all operating leases was $9.6 million for the period from January 1, 2012 to December 23, 2012. The Successor Company’s rent expense for all operating leases was $0.2 million for the period from December 24, 2012 to December 31, 2012, and approximately $10.5 million and $13.5 million for the years ended December 31, 2013 and 2014, respectively. Additional related-party transactions are noted in Note 15.
Future minimum lease payments, by year and in the aggregate, under capital and non-cancelable operating leases at December 31, 2014, were as follows:
| Capital | Operating | |||||||
| 2015 |
$ | 15,048 | $ | 14,099 | ||||
| 2016 |
13,240 | 11,927 | ||||||
| 2017 |
6,820 | 11,594 | ||||||
| 2018 |
6,036 | 10,693 | ||||||
| 2019 |
8,118 | 8,677 | ||||||
| Thereafter |
1,074 | 80,593 | ||||||
|
|
|
|
|
|||||
| Total minimum lease payments |
$ | 50,336 | $ | 137,583 | ||||
|
|
|
|||||||
| Less amounts representing interest |
5,690 | |||||||
|
|
|
|||||||
| Present value of capital lease obligations |
$ | 44,646 | ||||||
| Less current maturities of capital lease obligations |
12,916 | |||||||
|
|
|
|||||||
| Capital lease obligations |
$ | 31,730 | ||||||
|
|
|
|||||||
F-46
Table of Contents
During the year ended December 31, 2014, the Company entered into two sales-leaseback arrangements for the purpose of financing capital expenditures. The Company received a $17.0 million and $6.1 million, for a total of $23.1 million, for these sale leasebacks. The $17.0 million sales leaseback has a lease term of 53 months, starting December 15, 2014, and the $6.1 million sales leaseback has a lease term of 24 months, starting January 20, 2015. The future lease payments are included in the lease schedule above, and the capital financed is included in the property, plant, and equipment as broadcast and production equipment (see Note 5).
From time to time, the Company is involved in litigation relating to claims arising out of its operations in the ordinary course of business. As of the date hereof, the Company is not involved in any litigation that the Company believes will have a material adverse effect on its financial condition, results of operations, or liquidity.
12. Earnings (Loss) Per Share
The computation of earnings (loss) per share from operations is as follows:
| Predecessor | Successor | |||||||||||||||
| (in thousands, except per share amounts) | 358-Day Period Ended December 23, 2012 |
December 24, 2012 (inception date) to December 31, 2012 |
Year Ended December 31, 2013 |
Year Ended December 31, 2014 |
||||||||||||
| Earnings Per Common Share—Basic (numerator): |
||||||||||||||||
| Net loss |
$ | (12,432 | ) | $ | (1,518 | ) | $ | (27,299 | ) | $ | (41,215 | ) | ||||
|
|
|
|
|
|
|
|
|
|||||||||
| Shares (denominator): |
||||||||||||||||
| Weighted average common shares outstanding |
1,668,793 | 21,703,089 | 21,811,728 | 22,128,922 | ||||||||||||
|
|
|
|
|
|
|
|
|
|||||||||
| Basic earnings per common share |
$ | (7.45 | ) | $ | (0.07) | $ | (1.25) | $ | (1.86) | |||||||
|
|
|
|
|
|
|
|
|
|||||||||
| Earnings Per Common Share—Diluted (numerator): |
||||||||||||||||
| Net loss |
$ | (12,432 | ) | $ | (1,518 | ) | $ | (27,299 | ) | $ | (41,215 | ) | ||||
|
|
|
|
|
|
|
|
|
|||||||||
| Shares (denominator): |
||||||||||||||||
| Weighted average common shares outstanding |
1,668,793 | 21,703,089 | 21,811,728 | 22,128,922 | ||||||||||||
| Stock-based awards (1) |
— | — | — | — | ||||||||||||
|
|
|
|
|
|
|
|
|
|||||||||
| Total dilutive shares outstanding |
1,668,793 | 21,703,089 | 21,811,728 | 22,128,922 | ||||||||||||
|
|
|
|
|
|
|
|
|
|||||||||
| Diluted earnings per common share |
$ | (7.45 | ) | $ | (0.07) | $ | (1.25) | $ | (1.86) | |||||||
|
|
|
|
|
|
|
|
|
|||||||||
| (1) | Outstanding options aggregating incremental shares of 196,793, 0, 1,854,737, and 2,098,203 have been excluded from the period from January 1 to December 23, 2012, the period from December 24, 2012 to December 31, 2012, and the years ended December 31, 2013 and 2014 diluted EPS calculations, respectively, as they are anti-dilutive due to the losses generated in each respective period. |
13. Share-Based Compensation
Stock Options
The NEP Group, Inc. Equity Incentive Plan (the “Option Plan”) provides for the grant of incentive stock options, nonqualified stock options, restricted shares, and other share-based awards to persons or entities that provide services to the Company or its affiliates who, in the opinion of the Company’s Board of Directors, are in a position to make a contribution to the long-term success of the Company. The Option Plan authorized the issuance of awards up to an aggregate of 2,247,306 shares of the Company’s common stock.
F-47
Table of Contents
In accordance with ASC 718, Compensation—Stock Compensation, compensation expense for stock options is recorded over the vesting period based on the fair value at the date of grant. The fair value of stock options at the date of grant was calculated using the Black-Scholes model, and the assumptions are listed below:
| Predecessor | Successor | |||||||||||||||
| 358-Day Period Ended December 23, 2012 |
December 24, 2012 (inception date) to December 31, 2012 (1) |
Year Ended December 31, 2013 |
Year Ended December 31, 2014 |
|||||||||||||
| Expected dividend yield |
0.0 | % | N/A | 0.0 | % | 0.0 | % | |||||||||
| Expected life (years) |
7.0 | N/A | 7.0 | 7.0 | ||||||||||||
| Expected volatility |
51.3 | % | N/A | 51.8 | % | 51.5%-52.9 | % | |||||||||
| Risk-free interest rate |
1.0%-1.6 | % | N/A | 1.1%-2.4 | % | 2.0%-2.2 | % | |||||||||
| Weighted average fair value of options granted |
$ | 98.95 | N/A | $ | 5.15 | $ | 5.91 | |||||||||
| (1) | There were no grants during this period, and therefore, all inputs are not applicable. |
The Black-Scholes model determines the fair value of equity-based payment awards based on the fair value of the underlying common stock on the date of grant and requires the use of estimates and assumptions, including the fair value of the Company’s common stock, exercise price of the stock option, expected volatility, expected life, risk-free interest rate, and dividend rate.
Volatility. The Company estimates the expected volatility of its stock options by taking the average historical volatility of a group of comparable publicly traded companies over a period equal to the expected life of the options; it is not practical for the Company to estimate its own volatility due to the lack of a liquid market and historical prices.
Expected Life. The expected life or term of the units was determined in accordance with existing equity agreements as the underlying units are assumed to be exercised upon the passage of time and attainment of certain operating targets.
Risk-free Interest Rate. The risk-free interest rate is the estimated average interest rate based on US Treasury zero-coupon notes with terms consistent with the expected life of the awards. The expected dividend yield is zero as the Company does not anticipate paying any recurring cash dividends in the foreseeable future.
Forfeiture Rate. The Company estimates the forfeiture rate of its stock-based awards based on an analysis of its actual forfeitures and analysis of employee turnover. The impact from a forfeiture rate adjustment would be recognized in full in the period in which the forfeiture rate changes, and, if the actual number of future forfeitures differs from the Company’s prior estimates, the Company may be required to record adjustments to equity-based compensation expense in future periods.
Dividend Yield. The Company has not historically paid and does not expect to pay dividends in the near future. As such, the dividend yield is 0%.
The aforementioned assumptions used in calculating the fair value of the stock-based awards represent management judgment. As a result, if factors change and different assumption are used, the stock-based compensation expense could be materially different in the future. Fair value determinations will be less reliant on estimates and assumptions post-IPO as there will be underlying shares trading when new equity-based awards are granted. Compensation expense relating to all stock awards (employee and non-employee) is recorded on a straight-line basis.
F-48
Table of Contents
Changes in the Company’s stock options were as follows:
| Options | Weighted Average Exercise Price |
Weighted Average Remaining Life (years) |
Aggregate Intrinsic Value |
|||||||||||||
| Predecessor: |
||||||||||||||||
| Options outstanding at January 1, 2012 |
132,972 | $ | 122.24 | |||||||||||||
| Granted |
51,000 | 187.99 | ||||||||||||||
| Exercised |
— | — | ||||||||||||||
| Forfeited |
(81 | ) | 163.17 | |||||||||||||
|
|
|
|
|
|||||||||||||
| Options outstanding at December 23, 2012 |
183,891 | $ | 140.46 | 6.9 | $ | 13,612 | ||||||||||
| Options vested and expected to vest, December 23, 2012 |
129,344 | $ | 123.84 | 6.0 | $ | 8,113 | ||||||||||
|
|
|
|
|
|
|
|
|
|||||||||
| Options exercisable, December 23, 2012 |
129,344 | $ | 123.84 | 6.0 | $ | 8,113 | ||||||||||
|
|
|
|
|
|
|
|
|
|||||||||
| Successor: |
||||||||||||||||
| Options outstanding at December 31, 2012 |
— | $ | — | |||||||||||||
| Granted |
2,172,177 | 9.75 | ||||||||||||||
| Exercised |
— | — | ||||||||||||||
| Forfeited |
(222,499 | ) | 9.75 | |||||||||||||
|
|
|
|
|
|||||||||||||
| Options outstanding at December 31, 2013 |
1,949,678 | $ | 9.75 | 9.0 | $ | 10,042 | ||||||||||
| Options vested and expected to vest, December 31, 2013 |
— | $ | — | — | $ | — | ||||||||||
|
|
|
|
|
|
|
|
|
|||||||||
| Options exercisable, December 31, 2013 |
— | $ | — | — | $ | — | ||||||||||
|
|
|
|
|
|
|
|
|
|||||||||
| Options outstanding at December 31, 2013 |
1,949,678 | $ | 9.75 | |||||||||||||
| Granted |
413,682 | 10.86 | ||||||||||||||
| Exercised |
— | — | ||||||||||||||
| Forfeited |
(221,798 | ) | 9.75 | |||||||||||||
|
|
|
|
|
|||||||||||||
| Options outstanding at December 31, 2014 |
2,141,562 | 9.96 | 8.3 | $ | 11,344 | |||||||||||
|
|
|
|
|
|
|
|
|
|||||||||
| Options vested and expected to vest, December 31, 2014 |
352,629 | 9.75 | 8.0 | $ | 1,816 | |||||||||||
|
|
|
|
|
|
|
|
|
|||||||||
| Options exercisable, December 31, 2014 |
352,629 | 9.75 | 8.0 | $ | 1,816 | |||||||||||
|
|
|
|
|
|
|
|
|
|||||||||
During the period from January 1, 2012 to December 23, 2012, the period from December 24, 2012 to December 31, 2012, and the years ended December 31, 2013 and 2014, compensation expense related to stock options was $3.0 million, $0, $1.9 million, and $2.1 million, respectively. As of December 31, 2013 and 2014, the total unrecognized compensation cost related to options outstanding was $8.2 million and $7.4 million, respectively, and is expected to be recognized over a weighted average period of 4.0 and 3.3 years, respectively.
Tax benefits, relating to excess stock-based compensation deductions, are presented in the consolidated statements of cash flows as financing cash inflows. Tax benefits resulting from stock-based compensation deductions exceeded amounts reported for financial reporting purposes by $0.2 million for the period January 1, 2012 to December 23, 2012. All other periods were none.
14. Concentration of Sales to Major Clients
During the period from January 1, 2012 to December 23, 2012, a significant portion of the Predecessor Company’s sales were obtained from one client; sales to this client amounted to $73.8 million, or 20% of total revenues.
F-49
Table of Contents
For the year ended December 31, 2013, a significant portion of the Successor Company’s sales were to three clients; sales to these clients were $47.5 million, $36.0 million, and $35.4 million, or 13%, 10%, and 10% of total revenues, respectively. For the year ended December 31, 2014, a significant portion of the Company’s sales were to two clients; sales to these clients were $53.9 million and $63.8 million, or 12% and 14% of total revenues, respectively.
15. Related-Party Transactions
In addition to the related-party leases disclosed in Note 11, on December 24, 2012, the Company entered into a consulting agreement with an affiliate of its majority shareholder, Crestview. As part of this consulting agreement, the Company is to pay an annual management fee of $1.5 million, plus expense reimbursements of $0.5 million. These fees are payable in advance in equal quarterly installments. No amounts were paid or expensed during the period from December 24, 2012 to December 31, 2012. During each of the years ended December 31, 2013 and 2014, $2.0 million was paid.
At its inception, the Predecessor Company entered into a consulting agreement with its majority shareholders, American Securities Capital Partners. As part of this consulting agreement, the Predecessor Company was to pay an annual management fee of $2.3 million. For the period from January 1, 2012 to December 23, 2012, the Predecessor Company paid $2.3 million pursuant to the consulting agreement.
The Company has entered into a stock subscription agreement with an employee and shareholder that is collateralized with a recourse note. The outstanding balance under the recourse note was $0.5 million and $0.1 million at December 31, 2013 and 2014, respectively.
16. Employee Benefit Plan
The Company has a 401(k) Savings Plan (the “Plan”) that allows employees to contribute from their annual compensation, subject to statutory limitations. The Plan covers all employees who have attained age 21 and have completed at least three months of service. The Company matches up to 2.0% of employee contributions and may make additional discretionary contributions equal to a percentage of eligible compensation. The Predecessor Company’s contribution to the Plan was $1.8 million for the period from January 1, 2012 to December 23, 2012. The Successor Company’s contribution to the Plan was not significant for the period from December 24, 2012 to December 31, 2012. The Successor Company’s contribution to the Plan was approximately $0.8 million for each of the years ended December 31, 2013 and 2014.
17. Segment Information
The Company has two reportable segments: United States and International. The key factor used to identify these reportable segments is geography as generally, the Company provides consistent services both in the United States and internationally. For both segments, revenue is derived from the following services: remote production services, studio production services, and video display services.
Financial information is reported on a consolidating basis, showing segment detail separately with an aggregate consolidated total, to the chief executive officer (“CEO”), who is the Company’s chief operating decision maker.
F-50
Table of Contents
Segment financial information was as follows:
| Predecessor: | December 23, 2012 | |||||||||||
| United States | International | Total | ||||||||||
| Revenue |
$ | 310,485 | $ | 61,637 | $ | 372,122 | ||||||
|
|
|
|
|
|
|
|||||||
| Income from operations |
$ | 6,449 | $ | 1,922 | $ | 8,371 | ||||||
| Interest expense and other |
17,822 | |||||||||||
|
|
|
|||||||||||
| Loss before income taxes |
$ | (9,451 | ) | |||||||||
|
|
|
|||||||||||
| Depreciation and amortization |
$ | 64,250 | $ | 9,359 | $ | 73,609 | ||||||
| Capital expenditures |
$ | 53,498 | $ | 15,450 | $ | 68,948 | ||||||
| Segment assets |
$ | 600,950 | $ | 63,473 | $ | 664,423 | ||||||
| Successor: | December 31, 2012 | |||||||||||
| United States | International | Total | ||||||||||
| Revenue |
$ | 3,333 | $ | 1,023 | $ | 4,356 | ||||||
|
|
|
|
|
|
|
|||||||
| (Loss) income from operations |
$ | (1,315 | ) | $ | 25 | $ | (1,290 | ) | ||||
| Interest expense and other |
1,174 | |||||||||||
|
|
|
|||||||||||
| Loss before income taxes |
$ | (2,464 | ) | |||||||||
|
|
|
|||||||||||
| Depreciation and amortization |
$ | 2,011 | $ | 187 | $ | 2,198 | ||||||
| Capital expenditures |
$ | 236 | $ | — | $ | 236 | ||||||
| Segment assets |
$ | 799,495 | $ | 111,894 | $ | 911,389 | ||||||
| December 31, 2013 | ||||||||||||
| United States | International | Total | ||||||||||
| Revenue |
$ | 283,875 | $ | 72,653 | $ | 356,528 | ||||||
|
|
|
|
|
|
|
|||||||
| Income from operations |
$ | 11,157 | $ | 4,248 | $ | 15,405 | ||||||
| Interest expense and other |
59,212 | |||||||||||
|
|
|
|||||||||||
| Loss before income taxes |
$ | (43,807 | ) | |||||||||
|
|
|
|||||||||||
| Depreciation and amortization |
$ | 92,488 | $ | 8,622 | $ | 101,110 | ||||||
| Capital expenditures |
$ | 58,961 | $ | 7,144 | $ | 66,105 | ||||||
| Segment assets |
$ | 771,619 | $ | 108,177 | $ | 879,796 | ||||||
| December 31, 2014 | ||||||||||||
| United States | International | Total | ||||||||||
| Revenue |
$ | 269,343 | $ | 173,409 | $ | 442,752 | ||||||
|
|
|
|
|
|
|
|||||||
| (Loss) income from operations |
$ | (16,902 | ) | $ | 17,761 | $ | 859 | |||||
| Interest expense and other |
54,848 | |||||||||||
|
|
|
|||||||||||
| Loss before income taxes |
$ | (53,989 | ) | |||||||||
|
|
|
|||||||||||
| Depreciation and amortization |
$ | 106,313 | $ | 27,323 | $ | 133,636 | ||||||
| Capital expenditures |
$ | 73,617 | $ | 12,355 | $ | 85,972 | ||||||
| Segment assets |
$ | 815,373 | $ | 301,718 | $ | 1,117,091 | ||||||
18. Fair Value Measurements
The Company holds certain assets that are required to be measured at fair value on a recurring basis. These include cash and cash equivalents as well as derivative instruments.
F-51
Table of Contents
In December 2013, the Company entered into a foreign exchange forward contract with a notional amount of 167.0 million AUD with a third-party financial institution, which was settled in the first quarter of 2014. The purpose of this contract was to mitigate the Company’s exposure to foreign exchange risk arising from the planned acquisition of GTV in 2014 (see Note 2 for further detail on the acquisition). As of December 31, 2013 and 2014, the Company recorded the fair value of this contract of approximately $0.4 million and $0, respectively, in other current assets. The forward settled in early 2014, and as such, the Company recorded a loss on the settlement of $2.1 million in other expense for the year ended December 31, 2014.
Forward financial contracts are subject to counterparty credit risk; however, the Company only enters into forward financial contract with counterparties that they determine to be creditworthy at the time of entering into the contract. If any counterparty failed to perform according to the terms of the contract, the impact would be limited to the difference between the contract price and the market price applied to the contract volume on the date of settlement.
See Note 19, Derivatives and Hedging, for further detail on the income effect as well as the location on the consolidated balance sheets of the aforementioned interest rate cap agreements and foreign exchange forward contract.
ASC 820 Fair Value Measurements and Disclosures, defines fair value, establishes a framework for measuring fair value, and explains the related disclosure requirements. ASC 820 indicates, among other things, that a fair value measurement assumes that the transaction to sell an asset or transfer a liability occurs in the principal market for the asset or liability or, in the absence of a principal market, the most advantageous market for the asset or liability and defines fair value based upon an exit price model.
The valuation techniques used to measure fair value under fair value accounting are based upon observable and unobservable inputs. Observable inputs reflect market data obtained from independent sources, while unobservable inputs are generally unsupported by market activity. ASC 820 establishes a valuation hierarchy for disclosure of the inputs to valuation used to measure fair value. This hierarchy prioritizes the inputs into three broad levels as follows:
Level 1—Quoted prices (unadjusted) for identical assets or liabilities in active markets
Level 2—Quoted prices for similar instruments in active markets; quoted prices for identical or similar instruments in markets that are not active; and model-driven valuations whose inputs are observable or whose significant value drivers are observable
Level 3—Unobservable inputs that are supported by little or no market activity and that are significant to the fair value of the assets or liabilities
The following section describes the valuation methodology used to measure the Company’s financial assets and liabilities that were accounted for at fair value:
Overview of valuation methodology:
| Level | Significant inputs | |||||
| Foreign exchange forward contract |
2 | Broker quotations, market transactions in either listed or over-the counter markets | ||||
The following tables set forth the Company’s financial assets that were accounted for at fair value (there were no financial liabilities accounted for at fair value) on a recurring basis by the level of input within the ASC 820 fair value hierarchy. As required by GAAP for fair value measurements and disclosures, financial assets and liabilities are classified in their entirety based on the lowest level of input that is significant to the fair value measurement. The assessment of significance of a particular input to the fair value measurement requires judgment and may affect the valuation of fair value assets and liabilities and the placement within the fair value
F-52
Table of Contents
hierarchy levels. There were no transfers between Level 1 and Level 2 during the periods presented; there were also no transfers into or out of Level 3 during the periods presented below. It is the Company’s policy to recognize transfers into and transfers out of Level 3 as of the actual date of the event or change in circumstances that caused the transfer.
As of December 31, 2013 and 2014, the financial assets accounted for at fair value were as follows:
| December 31, 2013 | ||||||||||||||||
| Level 1 | Level 2 | Level 3 | Total | |||||||||||||
| Assets: |
||||||||||||||||
| Foreign exchange forward contract |
$ | — | $ | 432 | $ | — | $ | 432 | ||||||||
|
|
|
|
|
|
|
|
|
|||||||||
| Total assets |
$ | — | $ | 432 | $ | — | $ | 432 | ||||||||
|
|
|
|
|
|
|
|
|
|||||||||
| December 31, 2014 | ||||||||||||||||
| Level 1 | Level 2 | Level 3 | Total | |||||||||||||
| Assets: |
||||||||||||||||
| Foreign exchange forward contract |
$ | — | $ | — | $ | — | $ | — | ||||||||
|
|
|
|
|
|
|
|
|
|||||||||
| Total assets |
$ | — | $ | — | $ | — | $ | — | ||||||||
|
|
|
|
|
|
|
|
|
|||||||||
19. Derivatives and Hedging
The Company does not engage in speculative transactions for trading purposes. The Company uses derivative financial instruments in the normal course of business in certain circumstances to manage its exposure to rate changes in connection with its debt, which bears interest at variable rates and to manage its exposure to foreign currency exchange rates. The Company’s derivatives have historically included interest rate swap agreements, interest rate cap agreements, and foreign exchange forward contracts. The Company measures the fair value of these agreements and contracts based on market transactions and market observable inputs at the reporting date in their respective principal markets for all available periods. See Note 18, Fair Value Measurements, for the additional information about the fair value measurement of the derivative instruments.
Fair Value of Derivative Assets and Liabilities
| Consolidated balance sheet location |
December 31, 2013 |
December 31, 2014 |
||||||||||
| Derivative Assets: |
||||||||||||
| Foreign exchange forward contract |
Other assets | $ | 432 | $ | — | |||||||
|
|
|
|
|
|||||||||
| Total |
$ | 432 | $ | — | ||||||||
|
|
|
|
|
|||||||||
Derivatives not designated as hedging instruments:
| Predecessor | Successor | |||||||||||||||||
| Consolidated |
358-Day Period Ended December 23, 2012 |
December 24, 2012 (inception date) to December 31, 2012 |
Year Ended December 31, 2013 |
Year Ended December 31, 2014 |
||||||||||||||
| (Gain) loss recognized in income from derivatives: |
||||||||||||||||||
| Foreign exchange forward contract |
Other (income)/ other expense |
$ | — | $ | — | $ | (432 | ) | $ | 2,102 | ||||||||
|
|
|
|
|
|
|
|
|
|||||||||||
| Total |
$ | — | $ | — | $ | (432 | ) | $ | 2,102 | |||||||||
|
|
|
|
|
|
|
|
|
|||||||||||
F-53
Table of Contents
The Company has no derivatives designated as hedging instruments.
20. Subsequent Events
The Company has evaluated and disclosed subsequent events through April 15, 2015, the date on which the consolidated financial statements were originally issued and has updated such evaluation to give effect to the stock split through July 20, 2015, the date of the Company’s issuance of its financial statements for inclusion in the registration statement on Form S-1.
On January 25, 2015, the Company amended its Credit Agreements, which increased the maximum borrowing capacity under the revolving line of credit by $45.0 million, for a total maximum of $105.0 million. There were no changes in the terms and conditions of the Company’s credit facility as a result of this amendment.
On January 30, 2015, the Company acquired the Screen Scene Group. The Screen Scene Group is headquartered in Dublin, Ireland and specializes in outsourced broadcast services, post-production and visual effects services, and specialized uplink and communication services. This acquisition expands the Company’s reach in Continental Europe and the UK as well as adds new post-production and visual effects capabilities to the Company’s range of client solutions. The aggregate purchase price for the Screen Scene Group was approximately 12.1 million EUR, or $13.7 million, in cash and stock subject to a working capital adjustment and an earn-out consideration clause. The aggregate purchase price was funded by borrowings on the Company’s credit facility and the issuance of common stock.
On March 23, 2015, the Company entered into a definitive agreement to acquire MPP Mediatec Group AB (“Mediatec”). Mediatec is headquartered in Sweden and specializes in outsourced broadcast services, studio production, and video display services. This acquisition will expand the Company’s reach across Europe as well as its international presence in the broadcast services industry. The aggregate purchase price for Mediatec is expected to be approximately 750.0 million SEK, or $88.7 million, in cash consideration and will include the assumption of Mediatec’s existing debt of approximately 380.0 million SEK, or $44.9 million. The aggregate purchase price will be funded by additional borrowings under the Company’s second lien term loan and equity contributions received from the issuance of newly-issued shares of common stock. This acquisition is expected to close in Q2 2015.
On March 24, 2015, the Company entered into a foreign exchange forward contract with a notional amount of 750.0 million SEK with a third-party financial institution. The purpose of this contract is to limit the Company’s exposure to foreign exchange risk arising from the planned acquisition of Mediatec from the date of the definitive agreement until the acquisition date.
On July 17, 2015, the Board of Directors approved: (i) an increase in the authorized common stock and (ii) a common stock split. All per share amounts and common shares outstanding have been restated to reflect a 7.7-for-1 stock split, which was declared by the Board of Directors on July 17, 2015, and effective as of the close of business on that date. Accordingly, all common share and per share amounts in these consolidated financial statements and the notes thereto, other than those presented for the Predecessor Period, have been adjusted to reflect the 7.7-for-1 stock split as though it had occurred at the beginning of the initial period presented.
F-54
Table of Contents
Valuation and Qualifying Accounts for the years ended December 31, 2014 and 2013, the period from December 24 to December 31, 2012, and the period from January 1 to December 23, 2013.
| Balance at Beginning of Period |
Charged to Cost & Expense |
Deductions | Foreign Currency Fluctuation |
Balance at End of Period |
||||||||||||||||
| Period from January 1, to December 23, 2012 |
||||||||||||||||||||
| Allowance for doubtful trade accounts |
(344,598 | ) | (113,096 | ) | 185,380 | (1,678 | ) | (273,992 | ) | |||||||||||
| Period from December 24, to December 31, 2012 |
||||||||||||||||||||
| Allowance for doubtful trade accounts |
(273,992 | ) | — | — | — | (273,992 | ) | |||||||||||||
| Year Ended December 31, 2013 |
||||||||||||||||||||
| Allowance for doubtful trade accounts |
(273,992 | ) | (1,455,920 | ) | 316,174 | (787 | ) | (1,414,526 | ) | |||||||||||
| Year Ended December 31, 2014 |
||||||||||||||||||||
| Allowance for doubtful trade accounts |
(1,414,526 | ) | (831,097 | ) | 111,253 | 51,673 | (2,082,697 | ) | ||||||||||||
F-55
Table of Contents
13,000,000 Shares
NEP Group, Inc.
Common Stock
Prospectus
, 2015
Barclays
Morgan Stanley
Jefferies
Macquarie Capital
RBC Capital Markets
Nomura
Stifel
Through and including , 2015 (the 25th day after the date of this prospectus), all dealers effecting transactions in these securities, whether or not participating in this offering, may be required to deliver a prospectus. This is in addition to a dealer’s obligation to deliver a prospectus when acting as an underwriter and with respect to an unsold allotment or subscription.
Table of Contents
Part II
INFORMATION NOT REQUIRED IN PROSPECTUS
| Item 13. | Other expenses of issuance and distribution |
The following table sets forth an itemized statement of the amounts of all expenses (excluding underwriting discounts and commissions) payable by us in connection with the registration of the common stock offered hereby. With the exception of the Registration Fee, FINRA Filing Fee and NYSE listing fee), the amounts set forth below are estimates.
| SEC Registration Fee |
$ | 29,532 | ||
| FINRA Filing Fee |
38,623 | |||
| NYSE listing fee |
125,000 | |||
| Accountants’ fees and expenses |
1,730,000 | |||
| Legal fees and expenses |
1,600,000 | |||
| Printing and engraving expenses |
600,000 | |||
| Transfer agent and registrar fees |
4,500 | |||
| Miscellaneous |
372,345 | |||
|
|
|
|||
| Total |
$ | 4,500,000 | ||
|
|
|
| Item 14. | Indemnification of Directors and Officers |
Our amended and restated certificate of incorporation will provide that a director will not be liable to the corporation or its stockholders for monetary damages to the fullest extent permitted by the DGCL. In addition, if the DGCL is amended to authorize the further elimination or limitation of the liability of directors, then the liability of a director of the corporation, in addition to the limitation on personal liability provided for in our certificate of incorporation, will be limited to the fullest extent permitted by the amended DGCL. Our amended and restated certificate of incorporation will provide that the corporation will indemnify, and advance expenses to, any officer or director to the fullest extent authorized by the DGCL.
Section 145 of the DGCL provides that a corporation may indemnify directors and officers as well as other employees and individuals against expenses, including attorneys’ fees, judgments, fines and amounts paid in settlement in connection with specified actions, suits and proceedings whether civil, criminal, administrative or investigative, other than a derivative action by or in the right of the corporation, if they acted in good faith and in a manner they reasonably believed to be in or not opposed to the best interests of the corporation and, with respect to any criminal action or proceeding, had no reasonable cause to believe their conduct was unlawful. A similar standard is applicable in the case of derivative actions, except that indemnification extends only to expenses, including attorneys’ fees, incurred in connection with the defense or settlement of such action, and the statute requires court approval before there can be any indemnification where the person seeking indemnification has been found liable to the corporation. The statute provides that it is not exclusive of other indemnification that may be granted by a corporation’s certificate of incorporation, bylaws, disinterested director vote, stockholder vote, agreement or otherwise.
Our amended and restated certificate of incorporation will also contain indemnification rights for our directors and our officers. Specifically, our amended and restated certificate of incorporation will provide that we shall indemnify our officers and directors to the fullest extent authorized by the DGCL. Further, we may maintain insurance on behalf of our officers and directors against expense, liability or loss incurred by them in their capacities as officers and directors.
II-1
Table of Contents
We have obtained directors’ and officers’ insurance to cover our directors, officers and some of our employees for certain liabilities.
We will enter into written indemnification agreements with our directors and executive officers. Under these proposed agreements, if an officer or director makes a claim of indemnification to us, either a majority of the independent directors or independent legal counsel selected by the independent directors must review the relevant facts and make a determination whether the officer or director has met the standards of conduct under Delaware law that would permit (under Delaware law) and require (under the indemnification agreement) us to indemnify the officer or director.
The underwriting agreement provides for indemnification by the underwriters of us and our officers and directors, and by us of the underwriters, for certain liabilities arising under the Securities Act or otherwise in connection with this offering.
| Item 15. | Recent Sales of Unregistered Securities |
Set forth below is information regarding securities sold or granted by us within the past three years that were not registered under the Securities Act. Also included is the consideration, if any, received by us for such securities and information relating to the section of the Securities Act, or rule of the SEC, under which exemption from registration was claimed for such sales and grants.
1. Between December 2012 and May 2015, we issued an aggregate of 24,718,270 shares of common stock with an aggregate value of $252,422,240. We bought back 10,264 shares of common stock in March 2013. These issuances are described more fully below:
| • | In connection with our formation, we issued a total of 21,703,089 shares of our common stock on December 24, 2012 to affiliates of Crestview Partners II GP, L.P., certain members of our management and other accredited investors for total consideration of $211,393,725. |
| • | On February 8, 2013, we issued an additional 122,753 shares of our common stock to certain members of our management and other accredited investors for total consideration of $1,195,650. |
| • | On April 13, 2013, we issued 10,264 shares of our common stock to an accredited investor for total consideration of $99,975. |
| • | On January 17, 2014, January 24, 2014 and March 3, 2014, we issued 151,050, 155,162 and 5,135 shares of our common stock, respectively, to affiliates of Crestview Partners II GP, L.P., Patricof Partners, certain members of our management and other accredited investors for total consideration of $3,032,625. |
| • | On December 19, 2014, we issued 274,035 shares of our common stock to Cees Faber of Faber Audiovisuals as a new member of management in connection with our acquisition of Faber for total consideration of $3,914,790. |
| • | On January 7, 2015, we issued 17,710 shares of our common stock to Thomas McCracken, a retiring member of management of NEP for total consideration of $253,000. |
| • | On January 30, 2015, we issued 69,993 shares of our common stock to Open Gate Holdings Ltd. in connection with our acquisition of the Screen Scene Group, which resulted in a reduction in the purchase price for such acquisition of $999,900. |
| • | On April 24, 2015, we issued 1,750,002 shares of our common stock to Crestview Partners to raise additional capital for our acquisitions of Mediatec and Outside Broadcast for total consideration of $25,000,030. |
| • | On April 27, 2015, we issued 18,071 shares of our common stock to certain members of our management and other accredited investors for total consideration of $258,170. |
II-2
Table of Contents
| • | On April 30, 2015, we issued 237,306 shares of our common stock to certain new members of management and other accredited investors in connection with our acquisitions of Mediatec and Outside Broadcast for total consideration of $3,390,090. |
| • | On May 22, 2015, we issued 198,051 shares of our common stock to certain of our existing stockholders for total consideration of $2,829,310. |
| • | On May 22, 2015, we issued 5,644 shares of our common stock as part of an option exercise by a terminated employee at an exercise price of $9.75 for total consideration of $54,975. |
2. Since January 2013, we have issued to certain members of our management and other shareholders 2,429,196 nonqualified stock options with an exercise price of $9.75 per share if issued before December 2014 or $14.29 per share if issued December 2014 or after, the fair market value of our common stock on the dates of the grants. As of May 22, 2015, we had a total of 49,110 unallocated stock options.
The issuances of securities described in paragraph 1 above were deemed to be exempt from registration under the Securities Act in reliance on Section 4(2) of the Securities Act as transactions by an issuer not involving any public offering. Each recipient of securities in each such transaction represented by written, executed agreement his or her or its (i) intention to acquire the securities for investment only and not with a view to or for sale in connection with any distribution thereof, (ii) knowledge, sophistication and experience in business and financial matters and his or her or its ability to evaluate the merits and risks of the acquisition of the common shares, including the risk that the recipient could lose the entire value of the issued shares, (iii) receipt of all information which the recipient believed to be necessary in order to reach an informed decision as to the advisability of acquiring the issued shares, including answers to the recipient’s reasonable satisfaction to any and all questions regarding such information, and (iv) independent investigation of the Company, its management, and related matters as the recipient deemed to be necessary or advisable in connection with the acquisition of the issued shares. Appropriate legends were affixed to the share certificates and other instruments issued in such transactions. The sales of these securities were made without general solicitation or advertising.
The stock option grants described in paragraph 2 above are intended to be exempt from registration under the Securities Act in reliance on Rule 701, Section 4(2) of the Securities Act, or Regulation D. Rule 701 provides an exemption for certain offers and sales of securities made pursuant to the terms of compensatory benefit plans or written contracts relating to compensation by an issuer that is not subject to the reporting requirements of Section 13 or Section 15(d) of the Securities Exchange Act of 1934, as amended, and is not an investment company registered or required to be registered under the Investment Company Act of 1940. The Company was neither a reporting company nor an investment company subject to such registration requirements at the time such grants were made, and each stock option was granted pursuant to a written compensatory benefit plan created by the Company. Each recipient of the stock options was an employee, an officer, a director, or a consultant or advisor to the Company. The amount of stock options issued did not exceed 15% of the total assets of the Company, measured at the Company’s most recent balance sheet date at the time of the issuance.
| Item 16. | Exhibits and financial statement schedules |
See the Exhibit Index immediately following the signature page hereto, which is incorporated by reference as if fully set forth herein.
| Item 17. | Undertakings |
The undersigned registrant hereby undertakes to provide to the underwriters at the closing specified in the underwriting agreement certificates in such denominations and registered in such names as required by the underwriters to permit prompt delivery to each purchaser.
II-3
Table of Contents
Insofar as indemnification for liabilities arising under the Securities Act may be permitted to directors, officers and controlling persons of the registrant pursuant to the foregoing provisions, or otherwise, the registrant has been advised that in the opinion of the Securities and Exchange Commission such indemnification is against public policy as expressed in the Securities Act and is, therefore, unenforceable. In the event that a claim for indemnification against such liabilities (other than the payment by the registrant of expenses incurred or paid by a director, officer or controlling person of the registrant in the successful defense of any action, suit or proceeding) is asserted by such director, officer or controlling person in connection with the securities being registered, the registrant will, unless in the opinion of its counsel the matter has been settled by controlling precedent, submit to a court of appropriate jurisdiction the question whether such indemnification by it is against public policy as expressed in the Securities Act and will be governed by the final adjudication of such issue.
The undersigned registrant hereby undertakes that:
(1) For purposes of determining any liability under the Securities Act, the information omitted from the form of prospectus filed as part of this registration statement in reliance upon Rule 430A and contained in a form of prospectus filed by the registrant pursuant to Rule 424(b)(1) or (4) or 497(h) under the Securities Act shall be deemed to be part of this registration statement as of the time it was declared effective.
(2) For the purpose of determining any liability under the Securities Act, each post-effective amendment that contains a form of prospectus shall be deemed to be a new registration statement relating to the securities offered therein, and the offering of such securities at that time shall be deemed to be the initial bona fide offering thereof.
II-4
Table of Contents
SIGNATURES
Pursuant to the requirements of the Securities Act of 1933, the registrant has duly caused this Registration Statement to be signed on its behalf by the undersigned, thereunto duly authorized, in the City of Pittsburgh, State of Pennsylvania, on July 20, 2015.
| NEP Group, Inc. | ||
| By: | /s/ Kevin Rabbitt | |
| Name: | Kevin Rabbitt | |
| Title: | Chief Executive Officer | |
* * *
Each person whose signature appears below appoints Kevin Rabbitt, Gerry Delon and Dean Naccarato, and each of them, any of whom may act without the joinder of the other, as his true and lawful attorneys-in-fact and agents, with full power of substitution and re-substitution, for him or her and in his or her name, place and stead, in any and all capacities, to sign any and all amendments (including post-effective amendments) to this Registration Statement and any Registration Statement (including any amendment thereto) for this offering that is to be effective upon filing pursuant to Rule 462(b) under the Securities Act of 1933, as amended, and to file the same, with all exhibits thereto, and all other documents in connection therewith, with the Securities and Exchange Commission, granting unto said attorneys-in-fact and agents full power and authority to do and perform each and every act and thing requisite and necessary to be done, as fully to all intents and purposes as he or she might or would do in person, hereby ratifying and confirming all that said attorneys-in-fact and agents or any of them of their substitute and substitutes, may lawfully do or cause to be done by virtue hereof.
Pursuant to the requirements of the Securities Act of 1933, as amended, this Registration Statement has been signed below by the following persons in the capacities and on the dates indicated.
| Name |
Title |
Date | ||
| /s/ Kevin Rabbitt Kevin Rabbitt |
Chief Executive Officer and Director (Principal Executive Officer) |
July 20, 2015 | ||
| * Gerald Delon |
Chief Financial Officer (Principal Financial and Accounting Officer) |
July 20, 2015 | ||
| * Debra Honkus |
Director | July 20, 2015 | ||
| * Jeffrey Marcus |
Director | July 20, 2015 | ||
| * Brian Cassidy |
Director | July 20, 2015 | ||
| /s/ Howard Liszt Howard Liszt |
Director | July 20, 2015 | ||
| * Mark Patricof |
Director | July 20, 2015 | ||
| * Katherine Chung |
Director | July 20, 2015 | ||
II-5
Table of Contents
| Name |
Title |
Date | ||
| * Kenneth Schanzer |
Director | July 20, 2015 | ||
| * Hank Ratner |
Director | July 20, 2015 | ||
| *By: |
/s/ Kevin Rabbitt Kevin Rabbitt Attorney-in-Fact |
|||||
II-6
Table of Contents
INDEX TO EXHIBITS
| Exhibit |
Description | |
| 1.1** | Form of Underwriting Agreement | |
| 3.1** | Form of Amended and Restated Certificate of Incorporation of NEP Group, Inc. | |
| 3.2** | Form of Amended and Restated Bylaws of NEP Group, Inc. | |
| 4.1 | Form of Common Stock Certificate | |
| 5.1 | Opinion of Vinson & Elkins L.L.P. as to the legality of the securities being registered | |
| 10.1** | Second Amended and Restated First Lien Credit Agreement, dated as of December 24, 2012, as amended and restated on January 22, 2013, as further amended and restated on February 25, 2013, as further amended on September 17, 2013, as further amended on January 23, 2014, among NEP Group, Inc., NEP/NCP Holdco, Inc., as borrower, Barclays Bank Plc, as administrative agent, and the lenders and other parties thereto | |
| 10.2** | Amendment No. 4, dated August 28, 2014, to the Second Amended and Restated First Lien Credit Agreement, dated as of February 25, 2013, among NEP/NCP HOLDO, INC., NEP Group, Inc., as borrower, Barclays Bank Plc, as administrative agent, and the lenders and other parties thereto | |
| 10.3** | Incremental Amendment to the Second Amended and Restated First Lien Credit Agreement, dated as of January 27, 2015, among NEP Group, Inc., NEP/NCP Holdco, Inc., as borrower, Barclays Bank Plc, as administrative agent, and the lenders and other parties thereto | |
| 10.4** | Amendment No. 6, dated April 29, 2015, to Second Amended and Restated First Lien Credit Agreement, dated February 25, 2013, among NEP Group, Inc., NEP/NCP Holdco, Inc., as borrower, Barclays Bank Plc, as administrative agent, and the lenders and other parties thereto | |
| 10.5** | Amended and Restated Second Lien Credit Agreement, dated as of December 24, 2012, as amended and restated on January 22, 2013, as further amended on January 23, 2014, among NEP Group, Inc., NEP/NCP Holdco, Inc., as borrower, Morgan Stanley Senior Funding, Inc., as administrative agent, and the lenders and other parties thereto | |
| 10.6** | Amendment No. 2, dated April 29, 2015, to the Amended and Restated Second Lien Credit Agreement, dated as of January 22, 2013, among NEP/NCP HOLDCO, INC., NEP Group, Inc., as borrower, Morgan Stanley Senior Funding, Inc., as administrative agent, and the lenders and other parties thereto | |
| 10.7** | Form of Registration Rights Agreement | |
| 10.8** | Form of Stockholders Agreement | |
| 10.9** | Form of Holdback Agreement | |
| 10.10†** | Employment Agreement of Kevin Rabbitt, dated as of June 8, 2015 | |
| 10.11†** | Employment Agreement of Gerald Delon, dated as of June 9, 2015 | |
| 10.12†** | Employment Agreement of Keith Andrews, dated as of June 30, 2015 | |
| 10.13** | Form of Indemnification Agreement | |
| 10.14†** | Form of NEP Group, Inc. 2015 Long Term Incentive Plan | |
| 10.15** | Form of Lock-up Letter Agreement | |
| 10.16†** | Form of NEP Group, Inc. 2015 Long Term Incentive Plan Restricted Stock Agreement (Officers Only) | |
| 10.17†** | Form of NEP Group, Inc. 2015 Long Term Incentive Plan Restricted Stock Agreement (Non-Officer Employees and Directors) | |
II-7
Table of Contents
| Exhibit |
Description | |
| 10.18†** | Form of NEP Group, Inc. Employee Stock Purchase Plan | |
| 10.19†** | NEP Group, Inc. Equity Incentive Plan, as amended by the First Amendment, dated December 11, 2013, as further amended by the Second Amendment, dated August 12, 2014, as further amended by the Third Amendment, dated February 26, 2015 | |
| 10.20†** | Form of NEP Group, Inc. Equity Incentive Plan Stock Option Grant Certificate | |
| 21.1** | List of Subsidiaries of NEP Group, Inc. | |
| 23.1 | Consent of Vinson & Elkins L.L.P. (included as part of Exhibit 5.1 hereto) | |
| 23.2 | Consent of Deloitte & Touche LLP | |
| 24.1 | Power of Attorney (included on the signature page of this Registration Statement) | |
| * | To be filed by amendment. |
| † | Compensatory plan or arrangement. |
| ** | Previously filed. |
II-8