Attached files
| file | filename |
|---|---|
| EX-5.1 - EX-5.1 - Live Oak Bancshares, Inc. | d893770dex51.htm |
| EX-23.1 - EX-23.1 - Live Oak Bancshares, Inc. | d893770dex231.htm |
Table of Contents
As filed with the Securities and Exchange Commission on July 17, 2015
Registration No. 333-205126
UNITED STATES
SECURITIES AND EXCHANGE COMMISSION
Washington, D.C. 20549
Amendment No. 2
to
FORM S-1
REGISTRATION STATEMENT
UNDER
THE SECURITIES ACT OF 1933
LIVE OAK BANCSHARES, INC.
(Exact name of registrant as specified in its charter)
| North Carolina | 6022 | 26-4596286 | ||
| (State or other jurisdiction of incorporation or organization) |
(Primary Standard Industrial Classification Code Number) |
(I.R.S. Employer Identification Number) |
1741 Tiburon Drive
Wilmington, North Carolina 28403
(910) 790-5867
(Address, including zip code, and telephone number, including area code, of registrant’s principal executive offices)
James S. Mahan III
Chairman and Chief Executive Officer
Live Oak Bancshares, Inc.
1741 Tiburon Drive
Wilmington, North Carolina 28403
(910) 790-5867
(Name, address, including zip code, and telephone number, including area code, of agent for service)
Copies of all communications to:
| Todd H. Eveson Jonathan A. Greene Wyrick Robbins Yates & Ponton LLP 4101 Lake Boone Trail, Suite 300 Raleigh, North Carolina 27607 (919) 781-4000 |
Michael Paul Reed Christopher J. DeCresce Covington & Burling LLP 1201 Pennsylvania Avenue, NW Washington, DC 20004-2401 (202) 662-6000 |
Approximate date of commencement of proposed sale to the public: As soon as practicable after this Registration Statement becomes effective.
If any of the securities being registered on this Form are to be offered on a delayed or continuous basis pursuant to Rule 415 under the Securities Act of 1933 check the following box: ¨
If this Form is filed to register additional securities for an offering pursuant to Rule 462(b) under the Securities Act, please check the following box and list the Securities Act registration statement number of the earlier effective registration statement for the same offering. ¨
If this Form is a post-effective amendment filed pursuant to Rule 462(c) under the Securities Act, check the following box and list the Securities Act registration statement number of the earlier effective registration statement for the same offering. ¨
If this Form is a post-effective amendment filed pursuant to Rule 462(d) under the Securities Act, check the following box and list the Securities Act registration statement number of the earlier effective registration statement for the same offering. ¨
Indicate by check mark whether the registrant is a large accelerated filer, an accelerated filer, a non-accelerated filer, or a smaller reporting company. See the definitions of “large accelerated filer,” “accelerated filer” and “smaller reporting company” in Rule 12b-2 of the Exchange Act.
| Large accelerated filer | ¨ | Accelerated filer | ¨ | |||
| Non-accelerated filer | ¨ (Do not check if a smaller reporting company) | Smaller reporting company | x | |||
THE REGISTRANT HEREBY AMENDS THIS REGISTRATION STATEMENT ON SUCH DATE OR DATES AS MAY BE NECESSARY TO DELAY ITS EFFECTIVE DATE UNTIL THE REGISTRANT SHALL FILE A FURTHER AMENDMENT WHICH SPECIFICALLY STATES THAT THIS REGISTRATION STATEMENT SHALL THEREAFTER BECOME EFFECTIVE IN ACCORDANCE WITH SECTION 8(a) OF THE SECURITIES ACT OF 1933, AS AMENDED, OR UNTIL THE REGISTRATION STATEMENT SHALL BECOME EFFECTIVE ON SUCH DATE AS THE COMMISSION, ACTING PURSUANT TO SAID SECTION 8(a), MAY DETERMINE.
Table of Contents
SUBJECT TO COMPLETION, DATED JULY 17, 2015
The information in this preliminary prospectus is not complete and may be changed. We may not sell these securities until the registration statement filed with the Securities and Exchange Commission is effective. This preliminary prospectus is not an offer to sell these securities and we are not soliciting an offer to buy these securities in any jurisdiction where the offer or sale is not permitted.
PRELIMINARY PROSPECTUS
4,000,000 Shares

Common Stock
This is the initial public offering of Live Oak Bancshares, Inc., the parent company and registered bank holding company of Live Oak Banking Company in Wilmington, North Carolina. We are offering 4,000,000 shares of our common stock.
Prior to this offering, there has been no public market for our common stock. We currently estimate that the initial public offering price per share will be between $16.00 and $18.00. We have received approval to list our common stock on the NASDAQ Global Select Market under the symbol “LOB.”
We are an “emerging growth company” as defined under the federal securities laws and are eligible for reduced public company reporting requirements.
Investing in our common stock involves risks. See “Risk Factors” beginning on page 25, for a discussion of certain risks that you should consider before making an investment decision to purchase our common stock.
| Per Share | Total | |||||||
| Initial public offering price of common stock |
$ | $ | ||||||
| Underwriting discounts and commissions(1) |
||||||||
| Proceeds to us, before expenses |
||||||||
| (1) | The underwriters will also be reimbursed for certain expenses in this offering. See “Underwriting” for details. |
We have granted the underwriters an option to purchase up to 600,000 additional shares of our common stock at the initial public offering price, less underwriting discounts and commissions, for a period of up to 30 days from the date of this prospectus.
NEITHER THE SECURITIES AND EXCHANGE COMMISSION NOR ANY STATE SECURITIES COMMISSION OR OTHER REGULATORY BODY HAS APPROVED OR DISAPPROVED OF THESE SECURITIES OR DETERMINED IF THIS PROSPECTUS IS TRUTHFUL OR COMPLETE. ANY REPRESENTATION TO THE CONTRARY IS A CRIMINAL OFFENSE.
The shares of our common stock that you purchase in this offering will not be savings accounts, deposits or other obligations of any of our bank or non-bank subsidiaries and are not insured or guaranteed by the Federal Deposit Insurance Corporation or any other governmental agency.
The underwriters expect to deliver the shares of our common stock against payment on or about , 2015.
| SANDLER O’NEILL + PARTNERS, L.P. | ||||

|
||||
|
| ||||
Prospectus dated , 2015.
Table of Contents
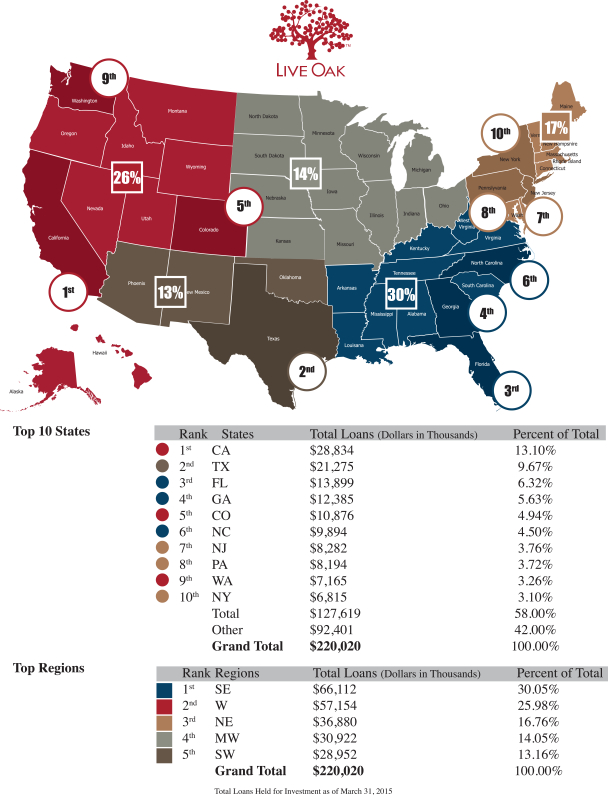
Table of Contents
| 1 | ||||
| 13 | ||||
| 15 | ||||
| GAAP RECONCILIATION AND MANAGEMENT EXPLANATION OF NON-GAAP FINANCIAL MEASURES |
22 | |||
| 25 | ||||
| 44 | ||||
| 46 | ||||
| 47 | ||||
| 49 | ||||
| 51 | ||||
| MANAGEMENT’S DISCUSSION AND ANALYSIS OF FINANCIAL CONDITION AND RESULTS OF OPERATIONS |
52 | |||
| 99 | ||||
| 118 | ||||
| 126 | ||||
| 132 | ||||
| 133 | ||||
| 135 | ||||
| 143 | ||||
| 155 | ||||
| 159 | ||||
| 163 | ||||
| 163 | ||||
| 163 | ||||
| F-1 |
i
Table of Contents
ABOUT THIS PROSPECTUS
You should rely only on the information contained in this prospectus. We and the underwriters have not authorized any person to provide you with different or inconsistent information. If anyone provides you with different or inconsistent information, you should not rely on it. We and the underwriters are not making an offer to sell these securities in any jurisdiction where the offer or sale is not permitted. You should assume that the information appearing in this prospectus is accurate only as of the date on the front of this prospectus. Our business, financial condition, results of operations and prospects may have changed since that date.
For investors outside the United States: neither we nor any of the underwriters have done anything that would permit this offering or possession or distribution of this prospectus in any jurisdiction where action for that purpose is required, other than in the United States. You are required to inform yourselves about and to observe any restrictions relating to this offering and the distribution of this prospectus outside of the United States.
Unless otherwise indicated or unless the context requires otherwise, all references in this prospectus to “LOB,” “we,” “us,” “our,” the “Company,” or similar references, mean Live Oak Bancshares, Inc. and its subsidiaries on a consolidated basis. References to “Live Oak Bank” or the “Bank” mean our wholly owned banking subsidiary, Live Oak Banking Company.
INDUSTRY AND MARKET DATA
Industry and market data used in this prospectus has been obtained from independent industry sources and publications available to the public, sometimes with a subscription fee, as well as from research reports prepared for other purposes. We did not commission the preparation of any of the sources or publications referred to in this prospectus. Industry publications and surveys and forecasts generally state that the information contained therein has been obtained from sources believed to be reliable. We have not independently verified the data obtained from these sources. Forward-looking information obtained from these sources is subject to the same qualifications and the additional uncertainties regarding the other forward-looking statements in this prospectus. Trademarks used in this prospectus are the property of their respective owners, although for presentational convenience we may not use the ® or the ™ symbols to identify such trademarks.
IMPLICATIONS OF BEING AN EMERGING GROWTH COMPANY
As a company with less than $1.0 billion in gross revenue during our last fiscal year, we qualify as an “emerging growth company” as defined in the Jumpstart Our Business Startups Act of 2012, or the JOBS Act. An emerging growth company may take advantage of reduced regulatory and reporting requirements that are otherwise generally applicable to public companies. As an emerging growth company:
| • | we may present only two years of audited financial statements and only two years of related “Management’s Discussion and Analysis of Financial Condition and Results of Operations”; |
| • | we are exempt from the requirement to obtain an attestation and report from our auditors on the assessment of our internal control over financial reporting pursuant to the Sarbanes-Oxley Act; |
| • | we are permitted to provide less extensive disclosure about our executive compensation arrangements; |
| • | we are not required to hold non-binding advisory votes on executive compensation or golden parachute arrangements; and |
| • | we can delay the adoption of new or revised accounting standards affecting public companies until those standards would otherwise apply to private companies. |
We may take advantage of these provisions for up to five years unless we earlier cease to be an emerging growth company. We will cease to be an emerging growth company if we have more than $1.0 billion in annual gross revenues, have more than $700.0 million in market value of our common stock held by non-affiliates as of
ii
Table of Contents
any June 30 before that time, or issue more than $1.0 billion of non-convertible debt in a three-year period. We may choose to take advantage of some but not all of these reduced regulatory and reporting requirements. We have elected in this prospectus to take advantage of scaled disclosure relating to executive compensation arrangements.
Following this offering, we may continue to take advantage of some or all of the reduced regulatory, accounting and reporting requirements that will be available to us as long as we continue to qualify as an emerging growth company. Under the JOBS Act, emerging growth companies can delay adopting new or revised accounting standards until such time as those standards apply to private companies. We have elected to avail ourselves of this extended transition period for complying with new or revised accounting standards and, therefore, we will not be subject to the same new or revised accounting standards as other public companies that are not emerging growth companies. It is possible that some investors could find our common stock less attractive because we may take advantage of these exemptions. If some investors find our common stock less attractive, there may be a less active trading market for our common stock and our stock price may be more volatile.
iii
Table of Contents
This summary highlights selected information contained in greater detail elsewhere in this prospectus and does not contain all the information that you need to consider in making your investment decision. You should carefully read this entire prospectus before deciding whether to invest in our common stock. You should pay special attention to, among other things, our consolidated financial statements and the related notes thereto and the “Risk Factors” and “Management’s Discussion and Analysis of Financial Condition and Results of Operations” sections of this prospectus to determine whether an investment in our common stock is appropriate for you.
Our Company
We are an established national online platform for small business lending. We believe we have used technology to fundamentally change small business lending by streamlining the borrower experience. We are able to better serve our customers by leveraging technological advantages and our deep industry experience to create an optimized borrowing experience for our customers. We believe our business model mitigates credit risk while capitalizing on technology to efficiently and prudently generate loans and manage our portfolio of loans outstanding. Our guiding principles, in order of priority, are soundness, profitability and growth.
We originate a range of short- and medium-term commercial and construction loans partially guaranteed by the U.S. Small Business Administration, or the SBA, to small businesses and professionals with what we believe are low risk characteristics. We carefully select industries, or “verticals,” on which to focus our lending efforts. Within each vertical we retain individuals who possess extensive industry-specific lending experience. We believe our focus on verticals has allowed Live Oak Bank to extend credit to small businesses and professionals at an average loan size of $1.0 million and has resulted in our historical credit quality outperforming industry averages. Based on a data set consisting of 292 lenders that have originated 300 loans or more under the SBA’s 7(a) program and greater than $25 million in total loans, assembled by our affiliate, Government Loan Solutions, Inc., or GLS, using two separate Freedom of Information Act requests for the fourteen year period ended September 30, 2014, we had the lowest default rate among the group at 1.52%. In terms of charge-off rates, we ranked fifth in the same data set at 0.35% for the same period. For the twelve months ended September 30, 2014, the U.S. government’s most recently completed fiscal year, we ranked as the nation’s second largest small business lender, by dollar volume, utilizing the SBA’s 7(a) program. We believe the opportunity to expand our small business lending to new verticals is significant, since we currently only focus our lending efforts towards ten out of more than 1,000 industries identified in the SBA database.
The SBA’s 7(a) program provides up to a 75% guaranty for loans of greater than $150,000. For loans of $150,000 or less, the program provides up to an 85% guaranty. The maximum 7(a) loan amount is $5 million. The guaranty is conditional and covers a portion of the risk of payment default by the borrower, but not the risk of improper closing and servicing by the lender. As such, prudent underwriting and closing processes are essential to effective utilization of the 7(a) program. We believe that the technology we use provides us with a competitive advantage in the closing and servicing of 7(a) program loans, streamlining a process that can otherwise involve an application that includes over 100 documents into an easily-monitored online process.
In addition to focusing on industry verticals, we emphasize developing detailed knowledge of our customers’ businesses. We develop this knowledge, in part, through regular visits to customers’ operations, wherever they are located. We believe that these regular visits generate both for us and for our customer a deep and personalized experience throughout the loan relationship. We develop strong insight into our customers’ credit characteristics and needs while at the same time continually expanding our knowledge base of the vertical in which the customer operates. In turn, we are able to provide our borrowers valuable insight into trends and developments in their industry. We service our customers efficiently throughout the loan process and monitor their performance by means of the technology-based platform we use, which eliminates the need to maintain traditional branch locations and therefore eliminates a significant component of traditional overhead expense associated with banking
1
Table of Contents
franchises. We believe our geographically diverse loan portfolio significantly mitigates risk that would be associated with having a loan portfolio concentrated in one geographic area.
We typically sell the SBA-guaranteed portion (generally 75% of the principal balance) of the loans we originate in the secondary market. We have historically received a premium for these sales. We also sell participating interests in the remaining portion of our loans while retaining an SBA-required 10% unguaranteed interest and the servicing rights to the entire loan. As a result of our business model, our net income to date has been driven primarily by non-interest income rather than interest income.
As of the date of this prospectus, we are no longer classified as a de novo bank. Following the completion of this offering, we expect our regulatory capital ratios to be enhanced. As part of our business strategy following this offering, we expect growth in our loan portfolio through increasing the number of loans we originate that permit future advances (such as construction loans) and by less frequently selling fully funded loans. We believe that by growing our loan portfolio, we will increase our net interest income. Increased levels of interest income are not expected to exceed the premium and servicing income realized from the sale of guaranteed loans. As a result of this strategy, there may be an increase in our held for sale loan portfolio due to an increasing construction loan portfolio.
Historically, since loan sales have served as a primary source of liquidity, we have sold loans immediately following achievement of fully funded status. However, with more stable funding in place, we intend to begin selling fully funded loans less frequently. We believe that by holding fully funded loans for a longer period of time, we will increase our net interest income. This new strategy will also, however, expose us to the risk that a market downturn occurs during the period when we are holding a fully funded loan resulting in a reduced number of potential buyers when we ultimately seek to execute a sale. We believe that this risk is mitigated by the historical stability of the SBA 7(a) secondary market and we intend to continue monitoring capital markets activity for potential downturns via GLS.
In addition, as part of our new strategy we will use the sale of unguaranteed portions of loans primarily to reduce concentration risk. We believe that the risk of retaining the SBA-guaranteed portion of loans we originate will be mitigated by the government guaranty and the fact that we have not historically received any denials or repairs of a guaranty submitted to the SBA to be honored. We also believe that the impact to our allowance for loan loss will also be minimal due to the government guaranty. With respect to the unguaranteed portion of loans that we originate and hold for our own portfolio, we believe that our underwriting policies and ongoing credit administration procedures will help to mitigate the risk of default associated with retaining these assets in our loan portfolio.
Our focus on originating SBA-guaranteed loans in select verticals nationwide has allowed us to organically develop loan portfolio credit characteristics that we believe are attractive. Our portfolio is geographically dispersed throughout all U.S. regions (Southeast, Northeast, Midwest, Southwest, and West) with each region representing between 13% and 30% of our total loan portfolio at March 31, 2015. Only one state (California at 13%) represented more than 10% of our aggregate held-for-investment loan portfolio at March 31, 2015. Additionally, at March 31, 2015 our average unguaranteed exposure per loan was approximately $133 thousand compared to an average outstanding principal balance per loan of approximately $814 thousand.
Our ability to develop and execute on our business model has yielded a compound annual growth rate, or CAGR, in loans originated of 55.2% from May 2007 through March 31, 2015. For the U.S. government’s 2014 fiscal year (ending September 30, 2014), we were the second most active SBA 7(a) lender in the United States by dollar volume, behind only Wells Fargo Bank.
2
Table of Contents
The following table presents the balance and associated percentage of each category of loans held for investment within our loan portfolio at March 31, 2015 and each of December 31, 2014, 2013 and 2012.
| At March 31, 2015 |
At December 31 | |||||||||||||||||||||||||||||||
| 2014 | 2013 | 2012 | ||||||||||||||||||||||||||||||
| Total Loans |
% of loans in Category of total loans |
Total Loans |
% of Loans in Category of Total Loans |
Total Loans |
% of Loans in Category of Total Loans |
Total Loans |
% of Loans in Category of Total Loans |
|||||||||||||||||||||||||
| (dollars in thousands) | ||||||||||||||||||||||||||||||||
| Commercial & Industrial |
$ | 86,151 | 39.16 | % | $ | 81,057 | 39.84 | % | $ | 57,359 | 40.36 | % | $ | 34,200 | 36.66 | % | ||||||||||||||||
| Death Care Management |
3,880 | 1.76 | 3,603 | 1.77 | 1,782 | 1.25 | 283 | 0.30 | ||||||||||||||||||||||||
| Family Entertainment Centers |
340 | 0.15 | 333 | 0.16 | — | 100.0 | — | — | ||||||||||||||||||||||||
| Healthcare Services |
12,945 | 5.88 | 12,319 | 6.06 | 8,739 | 6.15 | 4,996 | 5.36 | ||||||||||||||||||||||||
| Independent Pharmacies |
35,114 | 15.96 | 34,079 | 16.75 | 24,026 | 16.91 | 12,192 | 13.07 | ||||||||||||||||||||||||
| Investment Advisors |
12,135 | 5.52 | 9,660 | 4.75 | 2,817 | 1.98 | — | 0.00 | ||||||||||||||||||||||||
| Veterinary Practices |
21,580 | 9.81 | 20,902 | 10.27 | 19,978 | 14.06 | 15,719 | 16.85 | ||||||||||||||||||||||||
| Other |
157 | 0.07 | 161 | 0.08 | 17 | 0.01 | 1,010 | 1.08 | ||||||||||||||||||||||||
| Construction & Development |
14,533 | 6.61 | 9,526 | 4.68 | 10,286 | 7.24 | 8,503 | 9.12 | ||||||||||||||||||||||||
| Poultry Agriculture |
5,460 | 2.48 | 3,910 | 1.92 | — | — | — | — | ||||||||||||||||||||||||
| Death Care Management |
483 | 0.22 | 92 | 0.05 | 989 | 0.70 | 315 | 0.34 | ||||||||||||||||||||||||
| Healthcare Services |
5,150 | 2.34 | 2,957 | 1.45 | 4,997 | 3.52 | 3,136 | 3.36 | ||||||||||||||||||||||||
| Family Entertainment Centers |
152 | 0.07 | — | — | — | — | — | — | ||||||||||||||||||||||||
| Independent Pharmacies |
456 | 0.21 | 215 | 0.11 | 101 | 0.07 | 637 | 0.68 | ||||||||||||||||||||||||
| Veterinary Practices |
2,676 | 1.22 | 2,207 | 1.08 | 4,199 | 2.95 | 4,163 | 4.46 | ||||||||||||||||||||||||
| Other |
157 | 0.07 | 145 | 0.07 | — | 0.00 | 252 | 0.27 | ||||||||||||||||||||||||
| Owner Occupied |
||||||||||||||||||||||||||||||||
| Commercial Real Estate |
115,200 | 52.36 | 111,620 | 54.86 | 74,461 | 52.40 | 50,577 | 54.22 | ||||||||||||||||||||||||
| Poultry Agriculture |
283 | 0.13 | 259 | 0.13 | — | 100.0 | — | — | ||||||||||||||||||||||||
| Death Care Management |
19,270 | 8.76 | 18,879 | 9.28 | 11,668 | 8.21 | 3,703 | 3.97 | ||||||||||||||||||||||||
| Family Entertainment Centers |
761 | 0.35 | 872 | 0.43 | — | 100.0 | — | — | ||||||||||||||||||||||||
| Healthcare Services |
27,634 | 12.56 | 26,173 | 12.86 | 11,129 | 7.83 | 6,207 | 6.65 | ||||||||||||||||||||||||
| Independent Pharmacies |
4,578 | 2.08 | 4,750 | 2.33 | 3,490 | 2.46 | 3,008 | 3.22 | ||||||||||||||||||||||||
| Investment Advisors |
2,481 | 1.13 | 2,161 | 1.06 | 171 | 0.12 | — | 0.00 | ||||||||||||||||||||||||
| Veterinary Practices |
59,615 | 27.10 | 57,934 | 28.48 | 47,896 | 33.70 | 35,554 | 38.12 | ||||||||||||||||||||||||
| Other |
578 | 0.26 | 592 | 0.29 | 107 | 0.08 | 2,105 | 2.26 | ||||||||||||||||||||||||
| Commercial Land |
4,136 | 1.88 | 1,248 | 0.62 | — | 100.0 | — | — | ||||||||||||||||||||||||
| Poultry Agriculture |
4,136 | 1.88 | 1,248 | 0.62 | — | 100.0 | — | — | ||||||||||||||||||||||||
|
|
|
|
|
|
|
|
|
|
|
|
|
|
|
|
|
|||||||||||||||||
| Total Loans |
$ | 220,020 | 100.00 | % | $ | 203,451 | 100.00 | % | $ | 142,106 | 100.00 | % | $ | 93,280 | 100.00 | % | ||||||||||||||||
|
|
|
|
|
|
|
|
|
|
|
|
|
|
|
|
|
|||||||||||||||||
| Net Deferred Costs |
2,208 | 2,060 | 1,212 | 592 | ||||||||||||||||||||||||||||
| Discount on SBA 7(a) Unguaranteed |
(1,784 | ) | (1,575 | ) | (1,969 | ) | (1,203 | ) | ||||||||||||||||||||||||
|
|
|
|
|
|
|
|
|
|||||||||||||||||||||||||
| Loans, Net of Unearned |
$ | 220,444 | $ | 203,936 | $ | 141,349 | $ | 92,669 | ||||||||||||||||||||||||
|
|
|
|
|
|
|
|
|
|||||||||||||||||||||||||
3
Table of Contents
Technology-Based Platform
We believe that the small business lending market is both broad and underserved by traditional banks. Non-bank lenders have exposed traditional banks’ inability to effectively service the small business customer by utilizing technology-based platforms to increase small businesses’ access to financing. We believe that a simplified, highly automated, and efficient delivery channel can fundamentally change the economics of small-dollar loan origination for financial institutions. Since inception, we have used a technology-based platform to provide financing to small businesses.
We developed and utilize a technology-based platform to facilitate lending to the small business community on a national scale and we have leveraged this technology to optimize our loan origination process, customer experience, reporting metrics, and servicing activity. In 2012, we organized nCino, Inc., or nCino, as a subsidiary to develop this technology. We subsequently spun off nCino as a separate company. The nCino Bank Operating System that we utilize, which is a fully integrated operating system built on Salesforce.com, Inc.’s Force.com cloud computing infrastructure platform, is owned by nCino, and we license the rights to use it. We use the nCino Bank Operating System to generate a real-time view of our loan pipeline, processes, and borrower and credit data. The integration of this system into our day-to-day operations has improved work flow efficiency, minimized loan file and documentation exceptions, and provided unprecedented real-time clarity into our loan portfolio. For example, we are able to segregate data pertaining to loan origination, which we refer to as production, by, among other things, vertical, geography, loan officer, participating bank, referral source, Fair Isaac Corporation, or FICO, score, internal risk grade, debt service coverage, relationship manager and balance sheet exposure. We can examine loans in our loan pipeline by their status and determine what outstanding documents are required prior to submission to the SBA or for closing.
The technology we utilize also streamlines the paperwork that accompanies SBA loans. A typical SBA loan under the 7(a) program may require up to 150 separate loan documents to be submitted. Utilizing this technology-based platform, we collect, track, and organize these documents in a manner that maximizes efficiency and minimizes unnecessary customer contact. We have used this technology to transform the traditional means of loan origination by accelerating our ability to issue proposals, complete underwriting due diligence and finalize commitments often resulting in what we believe has been a competitive advantage over other similar lenders. Our customers are also able to benefit from the technology-based platform we use, as it allows them the ability to track their loan’s progress towards approval and funding through a secure online portal.
In 2012, nCino, Inc. was a majority-owned subsidiary of Live Oak Bancshares. In June 2014, however, we divested our ownership interest in nCino as a distribution to our shareholders with a subsequent investment of $6.1 million later in 2014. At December 31, 2014 the company owned 9.02% of nCino, all of which was sold in February 2015 and as a result we have no direct ownership interest in nCino as of the date of this prospectus. Certain of our directors, officers and employees collectively owned approximately 28.2% of nCino’s outstanding common stock as of March 31, 2015. In addition, our Chief Executive Officer, James “Chip” S. Mahan III, continues to serve as a member of the board of directors of nCino.
Technology-Based Platform Expansion
We are developing a new online lending platform in order to help us with the origination of small business loans of less than $350 thousand through the SBA 7(a) program. We have incurred and expect to incur further development and implementation costs in connection with the proposed expansion. The software development, along with vendor analysis and operational implementation of the platform, is performed in-house by our employees, many of whom previously worked for nCino. Effective April 1, 2015, certain nCino developers who helped create the nCino technology-based platform that we use became employees of the Bank. The combined base salaries of our in-house software developers are approximately $1.0 million per year. Depending on the success of our new online lending platform, we expect to hire additional loan officers, credit administration and
4
Table of Contents
back office personnel to originate, close and service loans originated through this platform. We anticipate that our costs and expenses will be consistent with costs we have historically incurred in connection with our build out of human capital as a function of the growth in our loan originations. According to FDIC data, as of December 31, 2014, there were $288 billion in small business loans of $250 thousand or less and SBA data indicates there were 28.2 million small businesses in the United States in 2011. We believe that this is a market underserved by traditional banking models due to the difficulty in applying traditional underwriting methods to this loan class in a cost effective manner. We intend for this lending platform to aggregate thousands of data points from seven third party data providers providing 17 different services as data sources and utilize automated proprietary small loan credit models and application technology. We believe the credit models and application technology will complement our existing expertise and judgment and align with the credit culture that is pervasive throughout our organization. When the new platform is ready, we intend to initially target the verticals that we currently serve. Based on our current website hit rate, we believe we will receive approximately 100,000 unique website hits in 2015 and that we will be able to convert a significant number of website hits through our demonstrated ability to connect on a personal level with small businesses. Furthermore, we believe that loan data we have derived from over 1 million small business loans over a 20-year period provides us with performance and predictive analytics that give us an advantage over our competitors.
We believe that utilizing the SBA 7(a) program allows us to deliver a product that is more affordable to small businesses. The SBA is encouraging its participating lenders to serve this market, and has replaced the requirement that lenders perform traditional cash analysis with a credit scoring module. This SBA credit scoring module uses the FICO Small Business Scoring Service product. This scoring module assists SBA lenders in the evaluation of credit risk through the use of commercial and consumer data. The module utilizes a variety of data sources and more than 100 combinations of consumer and business analytical models. As a tool for lenders, this scoring module can help streamline the loan approval process. We intend to utilize this scoring module, cash flow considerations and a proprietary score developed by using our extensive internal database of historical SBA-specific loan data, as well as other key data fields to filter on-line applicants. Loans approved through this channel will have a principal amount of less than $350 thousand and carry a 75% to 85% SBA guaranty, with an interest rate generally ranging from Prime + 2.75% to Prime + 4.75%.
Historical Performance
We have experienced significant growth in assets, loans, deposits and earnings during the last five years, all of which has been achieved organically, as we have not acquired any banks, thrifts, branches, or loans. At March 31, 2015, we had total assets of $723 million, total loans of $526 million, total deposits of $556 million, and total shareholders’ equity of $100 million. Since December 31, 2010, our assets have grown at a CAGR of 29%. For the quarter ended March 31, 2015, our interest income, noninterest income, noninterest expense and net income after tax was $7.0 million, $24.1 million, $14.7 million, and $8.1 million, respectively. Comparing the three month periods ended March 31, 2015 and 2014 our net interest income, noninterest income, noninterest expense and net income have increased by 70%, 97%, 2%, 2,602%, respectively. Our net interest income, noninterest income, noninterest expense and net income have grown from December 31, 2010 to December 31, 2014 at a CAGR of 35%, 23%, 32% and 4%, respectively. From December 31, 2010 to December 31, 2014, our net interest income, noninterest income, noninterest expense and net income before income tax adjusted for one-time nonrecurring expenses, have grown at a CAGR of 35%, 23%, 30% and 22%, respectively. For the year ended December 31, 2014, our net interest income, noninterest income, noninterest expense and net income after tax were $15 million, $60 million, $54 million and $10 million, respectively.
Adjusted for one-time nonrecurring income and expenses, an assumed tax rate of 38.5% as if we had been a C corporation during all of 2014 and during the year ended December 31, 2013, and exclusive of the initial deferred tax liability recorded as a result of the change in tax status from an S corporation to a C corporation, total noninterest income, noninterest expense and net income after tax increased by 66%, 50% and 93%, respectively for
5
Table of Contents
the quarter ended March 31, 2015 compared to the quarter ended March 31, 2014 and 36%, 24% and 39%, respectively, for the year ended December 31, 2014 compared to the year ended December 31, 2013. After the aforementioned nonrecurring adjustments, noninterest income, noninterest expense and net income after tax were $20 million, $15 million and $6 million, respectively for the quarter ended March 31, 2015 and $60 million, $50 million and $14 million, respectively, for the year ended December 31, 2014. After nonrecurring adjustments, noninterest income, noninterest expense and net income after tax was $12 million, $10 million and $3 million, respectively for the quarter ended March 31, 2014 and $44 million, $40 million and $10 million, respectively, for the year ended December 31, 2013. Inclusive of one-time nonrecurring income and expenses, our basic and diluted earnings per share increased by 35% over diluted earnings per share for the quarter ended March 31, 2015 compared to March 31, 2014 and 17% over diluted earnings per share for the year ended December 31, 2014 compared to the year ended December 31, 2013. For more information and a reconciliation of net interest income, noninterest income, noninterest expense and net income adjusted for non-recurring income and expenses to the closest corresponding GAAP measure, see “GAAP Reconciliation and Management Explanation of Non-GAAP Financial Measures.” GAAP is defined as accounting principles generally accepted in the United States of America.
Credit quality and on-going credit administration are cornerstones of our franchise. Non-performing loans represented 2.6% of our total assets at March 31, 2015 compared to 2.8% of our total assets at December 31, 2014. Adjusting to eliminate the portion of non-performing loans that carry a SBA guaranty, this ratio becomes 0.4%. Our ratio of net charge-offs to average total loans on book was 0.2% for the quarter ended March 31, 2015 and 0.28% for the year ended December 31, 2014. Our ratio of allowance for loan losses to loans held for investment was 2.4% at March 31, 2015 and our ratio of allowance for loan losses to non-performing loans not guaranteed by the SBA was 178% at March 31, 2015. In evaluating our credit quality we focus on the unguaranteed portion of our loan portfolio. As of March 31, 2015, approximately $185 million of our assets, or approximately 26%, were guaranteed by the SBA.
Vertical Immersion Strategy
We have focused our lending to small businesses and professionals in verticals in which we cultivate deep industry expertise.
6
Table of Contents
The following table sets forth our ten existing industry verticals.
|
% of total Loan Originations |
||||||||||||
| Year of Entry |
Vertical |
Three months ended March 31, 2015 |
Year ended December 31, 2014 |
Three months ended March 31, 2014 |
||||||||
| 2007 |
Veterinary Practices | 10.7 | 18.3 | 33.2 | ||||||||
| 2009 |
Healthcare Services (medical/dental/optometry) | 22.9 | 21.5 | 18.5 | ||||||||
| 2010 |
Independent Pharmacies | 10.2 | 17.6 | 24.0 | ||||||||
| 2012 |
Death Care Management (funeral/cemetery) | 4.8 | 8.5 | 10.4 | ||||||||
| 2013 |
Investment Advisors | 13.8 | 11.4 | 13.9 | ||||||||
| 2014 |
Family Entertainment Centers | 1.4 | 1.6 | — | ||||||||
| 2014 |
Poultry Agriculture | 36.1 | 20.2 | — | ||||||||
| 2015 |
Wine & Craft Beverage | — | — | — | ||||||||
| 2015 |
Self-Storage | — | — | — | ||||||||
| 2015 |
Hotels | — | — | — | ||||||||
We staff each vertical team with personnel that possess industry-specific knowledge, experience and contacts. For example, our General Manager in the Independent Pharmacies vertical owns two pharmacies and brings broad experience and expertise to his responsibilities of examining, evaluating and closing extensions of credit to independent pharmacies. Our Death Care Management vertical expertise includes the former president and chief operating officer of Service Corporation International (a company that operates a network of more than 2,000 funeral homes and cemeteries), and another individual with over 25 years of experience in the financial services industry has led mergers and acquisitions in the funeral trust space. Our Veterinary Practices vertical benefits from the experience of a licensed veterinarian and attorney who provides an informed perspective to our Veterinary Practices vertical team and customers. Our Family Entertainment Centers, Wine & Craft Beverage, and Self-Storage verticals are led by individuals with more than 20 years of experience each in their respective industries. The General Manager of our Poultry Agriculture vertical has 15 years of poultry agriculture lending experience and has originated more than $450 million in poultry loans. Additionally, we are engaged and active in each of the industries we serve by attending numerous conventions and over 250 trade shows per year, and by speaking at universities and industry events. The table below sets forth our income for each of our ten existing industry verticals for the periods presented.
| Three months ended March 31, 2015 | Year ended December 31, 2014 | |||||||||||||||||||||||||||||||
| Loans and fees on loans |
Loan servicing revenue (1) |
Net gains on sales of loans |
Total | Loans and fees on loans |
Loan servicing revenue (2) |
Net gains on sales of loans |
Total | |||||||||||||||||||||||||
| (in thousands) |
||||||||||||||||||||||||||||||||
| Veterinary Practices |
$1,861 | $1,686 | $3,708 | $7,255 | $ | 6,897 | $ | 6,801 | $ | 11,779 | $ | 25,477 | ||||||||||||||||||||
| Healthcare Services |
1,665 | 595 | 2,838 | 5,098 | 4,897 | 1,888 | 10,742 | 17,527 | ||||||||||||||||||||||||
| Independent Pharmacies |
929 | 685 | 2,221 | 3,835 | 3,284 | 2,414 | 11,570 | 17,268 | ||||||||||||||||||||||||
| Death Care Management |
605 | 365 | 1,161 | 2,131 | 2,544 | 1,187 | 6,621 | 10,352 | ||||||||||||||||||||||||
| Investment Advisors |
526 | 216 | 3,527 | 4,269 | 1,287 | 479 | 7,697 | 9,463 | ||||||||||||||||||||||||
| Family Entertainment Centers |
72 | 18 | — | 90 | 77 | 10 | 921 | 1,008 | ||||||||||||||||||||||||
| Poultry Agriculture |
981 | 22 | 2,007 | 3,010 | 735 | 18 | 392 | 1,145 | ||||||||||||||||||||||||
| Wine & Craft Beverage |
— | — | — | — | — | — | — | — | ||||||||||||||||||||||||
| Self-Storage |
— | — | — | — | — | — | — | — | ||||||||||||||||||||||||
| Hotels |
— | — | — | — | — | — | — | — | ||||||||||||||||||||||||
| Other |
77 | 6 | (1) | 82 | 170 | 26 | 255 | 451 | ||||||||||||||||||||||||
|
|
|
|
|
|
|
|
|
|
|
|
|
|
|
|
|
|||||||||||||||||
| Total |
$6,716 | $3,593 | $15,461 | $25,771 | $ | 19,891 | $ | 12,823 | $ | 49,977 | $ | 82,691 | ||||||||||||||||||||
|
|
|
|
|
|
|
|
|
|
|
|
|
|
|
|
|
|||||||||||||||||
| (1) | Excludes $513 thousand increase to revenue from loan servicing asset revaluation. |
| (2) | Excludes $2,201 thousand reduction to revenue from loan servicing asset revaluation. |
7
Table of Contents
We are currently exploring expanding our lending efforts into additional verticals. In selecting these industries, we analyze the SBA historical data relative to default/loss rate, competition, and the size of the industry as well as the business cycles and customer characteristics of each industry. We then look at credit parameters, product types, and pricing that we would need to use in order to establish a market presence in an industry and weigh those factors against our risk tolerance and profitability objectives. Through this analysis, we approximate the percentage of the potential demand we believe we could capture both initially and after market stabilization. We generally will not enter a new vertical, unless we believe we can capture a meaningful portion of the potential small business loan demand within it.
Our customer philosophy and credit culture extend beyond the loan origination phase. Our borrowers have access to a relationship manager in our Business Advisory Group, or BAG, from the time the loan closes through the life of the loan. We continuously work to provide superior service throughout the life of our relationship with each borrower. With our vertical emphasis, we are aware of industry-tailored best practices that we share to help our borrowers succeed.
BAG site visits are mandated for each loan. This enables our lenders to invest quality time with each prospective and current borrower as well as inspect the business. Another goal of the BAG is to obtain current quarterly financial statements and year-end statements from all borrowers. As of March 31, 2015, 96% of current financial statements were on hand for all borrowers. With effective financial reporting processes in place, we have early insight into potential problems that exist with our borrowers. We also engage with our customers in a variety of other ways, from covering the cost of a business consultant for a 3-day period to more complex situations such as working with a borrower to transition out of a practice. We strive to build and maintain a collaborative relationship with the business owner. Through the BAG, we aim to maintain a close relationship with every customer, maintain strong credit monitoring practices and have become a trusted resource for small business owners throughout the U.S.
The Credit Process
We utilize our industry-specific expertise and participation to identify and select credit-worthy borrowers and attractive financing projects prior to the formal underwriting process. We believe our familiarity with and active presence within our verticals allows us to provide ongoing customer service that is relevant for each business owner’s specific industry segment.
We attempt to identify verticals with a statistical history of performance and a low risk profile. We have chosen verticals that display some or all of the following characteristics:
| • | Stable cash flows |
| • | Barriers to entry |
| • | Broad customer bases without reliance on any single customer |
| • | Collateral shortfall |
| • | Limited or no foreign competition |
| • | Growing demand |
| • | Rapid cash cycles |
| • | Recession resistant |
| • | Limited malpractice risk |
| • | Underserved by other/traditional banking models |
8
Table of Contents
Through our industry expertise, distribution channels, speed-to-market, and differentiated level of borrower experience and customer service, we have increased annual production in each year since May 2007. The growth to date in production has been due to the maturity of certain industry verticals, the establishment of new industry verticals and our origination of loans that are generally larger than the average SBA loan.
The following table summarizes our production by industry vertical for the periods indicated:
| Three months ended March 31, |
Years Ended December 31, | |||||||||||||||||||||||||||||||||||||||
| 2015 | 2014 | 2014 | 2013 | 2012 | 2011 | 2010 | 2009 | 2008 | 2007 | |||||||||||||||||||||||||||||||
| (in thousands) |
||||||||||||||||||||||||||||||||||||||||
| Veterinary Practices |
$ | 26,492 | $ | 41,358 | $ | 155,217 | $ | 147,661 | $ | 174,768 | $ | 149,485 | $ | 150,788 | $ | 145,920 | $ | 161,230 | $ | 40,226 | ||||||||||||||||||||
| Healthcare Services |
56,892 | 24,985 | 182,406 | 109,317 | 81,363 | 69,860 | 56,580 | 13,385 | 150 | — | ||||||||||||||||||||||||||||||
| Independent Pharmacies |
25,221 | 32,525 | 149,453 | 106,391 | 103,358 | 86,757 | 48,919 | — | — | — | ||||||||||||||||||||||||||||||
| Death Care Management |
12,011 | 14,074 | 72,124 | 101,736 | 54,075 | — | — | — | — | — | ||||||||||||||||||||||||||||||
| Investment Advisors |
34,304 | 18,805 | 96,963 | 33,647 | — | — | — | — | — | — | ||||||||||||||||||||||||||||||
| Family Entertainment Centers |
3,580 | — | 13,503 | — | — | — | — | — | — | — | ||||||||||||||||||||||||||||||
| Poultry Agriculture |
89,559 | — | 171,644 | — | — | — | — | — | — | — | ||||||||||||||||||||||||||||||
| Other |
— | 3,550 | 6,780 | — | 199 | 535 | 30 | 1,275 | 1,209 | 775 | ||||||||||||||||||||||||||||||
|
|
|
|
|
|
|
|
|
|
|
|
|
|
|
|
|
|
|
|
|
|||||||||||||||||||||
| Total |
$ | 248,058 | $ | 135,297 | $ | 848,090 | $ | 498,752 | $ | 413,763 | $ | 306,637 | $ | 256,317 | $ | 160,580 | $ | 162,589 | $ | 41,001 | ||||||||||||||||||||
|
|
|
|
|
|
|
|
|
|
|
|
|
|
|
|
|
|
|
|
|
|||||||||||||||||||||
The following table shows the amount of the SBA-guaranteed portions of the loans we have originated and sold since May 2007:
| Three months ended March 31, |
Years Ended December 31, | |||||||||||||||||||||||||||||||||||||||
| 2015 | 2014 | 2014 | 2013 | 2012 | 2011 | 2010 | 2009 | 2008 | 2007 | |||||||||||||||||||||||||||||||
| (in thousands) |
||||||||||||||||||||||||||||||||||||||||
| Veterinary Practices |
$ | 29,148 | $ | 25,458 | $ | 97,960 | $ | 115,514 | $ | 129,291 | $ | 117,941 | $ | 107,326 | $ | 138,725 | $ | 52,897 | $ | — | ||||||||||||||||||||
| Healthcare Services |
29,012 | 16,352 | 99,063 | 57,361 | 46,446 | 50,948 | 30,120 | 7,453 | — | — | ||||||||||||||||||||||||||||||
| Independent Pharmacies |
19,328 | 21,398 | 104,446 | 83,647 | 66,856 | 69,553 | 31,805 | — | — | — | ||||||||||||||||||||||||||||||
| Death Care Management |
8,095 | 7,530 | 53,832 | 63,156 | 34,083 | — | — | — | — | — | ||||||||||||||||||||||||||||||
| Investment Advisors |
28,630 | 14,562 | 64,764 | 19,664 | — | — | — | — | — | — | ||||||||||||||||||||||||||||||
| Family Entertainment Centers |
— | — | 7,286 | — | — | — | — | — | — | — | ||||||||||||||||||||||||||||||
| Poultry Agriculture |
22,834 | — | 4,273 | — | — | — | — | — | — | — | ||||||||||||||||||||||||||||||
| Other |
— | 2,288 | 2,288 | — | — | — | — | — | 706 | — | ||||||||||||||||||||||||||||||
|
|
|
|
|
|
|
|
|
|
|
|
|
|
|
|
|
|
|
|
|
|||||||||||||||||||||
| Total |
$ | 137,047 | $ | 87,588 | $ | 433,912 | $ | 339,342 | $ | 276,676 | $ | 238,442 | $ | 169,251 | $ | 146,178 | $ | 53,603 | $ | — | ||||||||||||||||||||
|
|
|
|
|
|
|
|
|
|
|
|
|
|
|
|
|
|
|
|
|
|||||||||||||||||||||
Our vertical immersion strategy and our commitment to sound credit underwriting and credit administration are reflected in the credit quality of our loan portfolio. Our borrowers have historically had an average FICO score in excess of 700, using the lowest of scores provided by three credit bureaus at the time of underwriting, and an average debt service coverage ratio of approximately 2.0 to net operating income using the most current borrower financial statements available. To date, we have never had a denial or repair of the SBA guaranty for any loan submitted for payment. The SBA’s policy for honoring the guaranty is based on a thorough review of a lender’s purchase request and all relevant documentation. If a lender is deficient in its origination, management, and servicing of a loan, the SBA will attempt to reach a resolution with the lender, which may involve the lender agreeing to a monetary adjustment in the amount of the SBA’s guaranty. This adjustment is referred to as a repair. The SBA may consider a denial of its liability under its guaranty or litigation to recover funds the SBA already paid under its guaranty to the lender (or secondary market holder) if the lender is not negotiating in good faith, the lender is unwilling to agree to a repair that reflects the harm caused to the SBA, or the lender’s actions are sufficiently serious that a repair would be inappropriate.
We do not pay our lenders commissions. Our management believes that incentivizing our lenders to produce more loans through the payment of commissions creates an inherent conflict with sound credit administration. By
9
Table of Contents
choosing not to implement a commission-based payment structure, we believe we generate loans of greater credit quality, enhancing overall portfolio performance and aligning our lenders’ interests with those of the entire company. In addition, many of our lenders currently own stock of Live Oak. We believe this alignment of interests is a strategic differentiator at Live Oak.
We intend to strategically and opportunistically add new verticals to our portfolio in the future. Our Emerging Markets division continually identifies, researches and evaluates potential new industries.
Deposit Funding
We fund the loans and loan interests that we retain with deposits issued by the Bank. We have historically used deposit products with higher interest costs to the Bank than traditional banks to attract funds while our cost of funds compared to non-bank competitors has historically been significantly lower. We plan to expand the deposit products and services we offer to customers through the use of mobile banking solutions for small businesses, including online banking, discounted merchant services, and remote deposit capture which we believe will lower our cost of funds.
Our Executive Management Team and Board of Directors
Our executive management team has a combined 154 years of banking and financial experience, as well as extensive experience in developing technologies to support online operations and experience within our industry verticals.
James “Chip” S. Mahan III, Chief Executive Officer and Chairman of the Board, has more than 40 years of banking experience and has founded multiple banks, including Cardinal Bancshares, which he took public in 2002, and Security First Network Bank, the nation’s first Internet-only bank and predecessor of S1 Corporation.
William “Lee” L. Williams III is the Vice Chairman of the Company and one of the original founders of the Bank. Prior to starting Live Oak Bank, Mr. Williams spent 19 years in corporate banking at Wachovia and worked for 14 years at Vine Street Financial engaged in SBA lending.
Neil L. Underwood, President, has significant banking and technology experience, and was instrumental in the development of both nCino, Inc. and S1 Corporation.
David G. Lucht, Chief Risk Officer, joined the Live Oak team in May 2007 as a founding member. Prior to joining Live Oak, Mr. Lucht was the Chief Credit Officer and an Executive Vice President for First Merit Bank in Akron, Ohio, where he was responsible for leading the turnaround in credit culture and performance of that $10.5 billion bank.
S. Brett Caines, Chief Financial Officer, joined the Live Oak team in June 2007. Prior to joining the Bank, Mr. Caines worked as a Production Engineer for INVISTA and as a Process Engineer for Shell Chemical Company.
Our board of directors consists of experienced individuals, many of whom have direct experience with our chosen industry verticals, allowing them to understand and provide meaningful contributions to both our operations and strategy.
Corporate History
Live Oak Lending Company, our predecessor company, began originating loans to small businesses in May 2007. At that time, we began the application process to become a state-chartered financial institution insured by the Federal Deposit Insurance Corporation, or FDIC. We currently operate through Live Oak Bancshares, Inc.,
10
Table of Contents
formed in 2009, a North Carolina business corporation and registered bank holding company subject to regulation by the Board of Governors of the Federal Reserve System, or the Federal Reserve, and the North Carolina Commissioner of Banks. Our principal subsidiary is Live Oak Banking Company, a North Carolina chartered commercial bank that commenced operations on May 12, 2008 and is subject to regulation by the FDIC and the North Carolina Commissioner of Banks. Our other majority or wholly-owned subsidiaries are 504 Fund Advisors, LLC, or 504FA, Government Loan Solutions, or GLS, and Independence Aviation, LLC, or IA.
During 2011, we formed IA for the sole purpose of purchasing an aircraft to be used by us for business purposes. IA has no other business purpose other than to own and operate aircraft for corporate purposes.
504FA was organized as a joint venture with Pennant Management, Inc. during 2013 to serve as the investment advisor to the 504 Fund, a closed end mutual fund organized to invest in SBA Section 504 loans. 504FA is a SEC-registered investment advisor that serves the 504 Fund and also provides underwriting and management of SBA 504 loans held by the fund. As of the date of this prospectus, we own 91.3% of 504FA.
In 2013, we acquired GLS, which was originally founded in 2006. GLS is a management and technology consulting firm that advises and offers solutions and services to participants in the government guaranteed lending sector. GLS primarily provides services in connection with the settlement, accounting, and securitization processes for government guaranteed loans, including loans originated under the SBA 7(a) loan programs and USDA-guaranteed loans. GLS is our wholly owned subsidiary.
In January 2012, we formed nCino as our majority-owned subsidiary to further develop and sell the nCino Bank Operating System used to streamline the lending process of financial institutions. nCino’s only business is owning and selling access to its nCino Bank Operating System. At year-end 2013, we owned 45.94% of nCino. In June 2014 we divested our ownership interest in nCino to our shareholders in the form of a dividend. As of the date of this prospectus, we have no direct ownership interest in nCino.
Our principal executive office is located at 1741 Tiburon Drive, Wilmington, North Carolina 28403 and our telephone number is (910) 790-5867. Our Internet address is www.liveoakbank.com. Information on or accessible through our website is not incorporated by reference into and is not part of this prospectus.
Recent Developments
Recent Exploration of Private Offering
During January 2015, we had conversations with five institutional accredited investors regarding a possible private placement of up to 4,000,000 shares of our common stock. On March 14, 2015, we elected to pursue a registered initial public offering of common stock rather than pursue further the possible private placement. There were no offers to buy or indications of interest accepted in connection with the contemplated private placement. This prospectus supersedes any and all offering materials used in connection with the contemplated private placement of our common stock.
Preliminary Second Quarter Results
Our interim financial statements for the three months ended June 30, 2015 are not yet available. The following expectations regarding our results for the three and six month periods ended June 30, 2015 are solely management estimates based on currently available information. In light of the preliminary nature of this financial data, where we believe necessary, we have presented certain financial data in the form of a range. Our
11
Table of Contents
actual results may differ from the preliminary results reported below. Please see “Risk Factors,” “Forward-Looking Statements” and “Management’s Discussion and Analysis of Financial Condition and Results of Operations” for a discussion of factors that could result in differences between the preliminary financial data reported below and the final results we report for these periods.
For the three months ended June 30, 2015, we expect to report net income of between $3.6 million and $3.9 million, or between $0.13 and $.14 per basic share, as compared to $7.0 million, or $.33 per basic share, for the three months ended June 30, 2014, and $8.1 million, or $.28 per basic share for the three months ended March 31, 2015. This year-over-year decrease in net income is principally due to an expected $2.8 million tax provision for the three months ended June 30, 2015 as compared to the three months ended June 30, 2014 during which we had no tax provision due to operating as a pass through S Corporation. The second quarter of 2015 also experienced downward adjustments in the valuation of our servicing rights of $1.8 million compared to a $3.2 thousand valuation increase for the quarter ended June 30, 2014. The decrease in net income for the three months ended June 30, 2015, compared to the three months ended March 31, 2015, is primarily as a result of a $3.8 million one-time gain arising in the first quarter of 2015 related to the sale of our investment in nCino combined with an upward adjustment of $121.8 thousand for the valuation of our servicing rights in the three months ended March 31, 2015, compared to a downward adjustment of $1.8 million of our servicing rights for the three months ended June 30, 2015.
For the six months ended June 30, 2015, we expect to report net income of between $11.7 million and $12.0 million, or between $0.41 and $0.42 per basic share, as compared to $7.3 million, or $.35 per basic share, for the six months ended June 30, 2014. This expected increase in net income is primarily attributable to growth in loan production and revenues associated with growth in loans in the six months ended June 30, 2015.
We expect to report consolidated total loans held for sale and held for investment as of June 30, 2015 of approximately $594.1 million, representing a $68.6 million, or 13.0%, increase from March 31, 2015 and a $95.0 million, or 19.0%, increase from December 31, 2014. Growth in loans was driven by approximately $524.2 million in production in the six months ended June 30, 2015 as compared to approximately $326.8 million in production in the six month period ended June 30, 2014. We also expect to report total deposits as of June 30, 2015 of approximately $727.3 million, representing a $171.3 million increase from March 31, 2015 and a $205.3 million increase from December 31, 2014. Changes were primarily driven by the execution of our deposit growth strategy.
12
Table of Contents
| Common stock offered |
4,000,000 shares of our common stock. | |
| Option to purchase additional shares |
The underwriters will have an option to purchase up to 600,000 additional shares of our common stock in this offering, exercisable within 30 days from the date of this prospectus. | |
| Common stock to be outstanding immediately after this offering |
32,654,860 shares (33,254,860 shares if the underwriters exercise their option to purchase additional shares in full). | |
| Securities offered as a percentage of outstanding shares of common stock |
14%, assuming the underwriters do not exercise their option to purchase additional shares. | |
| Use of proceeds |
Assuming an initial public offering price of $17.00 per share, which is the midpoint of the estimated price range set forth on the cover page of this prospectus, we expect to receive net proceeds from this offering of approximately $62.9 million (or $72.6 million if the underwriters exercise their option to purchase additional shares in full), after deducting underwriting discounts and commissions and estimated offering expenses payable by us. | |
| We intend to use the net proceeds of this offering to: • support organic growth in our existing industry verticals; • for expansion into new industry verticals; • to develop a new online lending platform for originating loans less than $350 thousand; • to support the growth of our balance sheet as we increase the size of our held for investment loan portfolio; and • for general corporate purposes, including for possible acquisitions of, or investments in, bank or permissible non-bank entities, though, we do not have any agreements or understandings presently with respect to any acquisitions or investments. | ||
| See “Use of Proceeds.” | ||
| Dividends |
We intend to pay dividends on our common stock, when, as, and if declared by our board of directors or a duly authorized committee thereof. Our ability to declare and pay dividends is limited by state law and by applicable federal and state regulatory restrictions, including the regulations and guidelines of the Federal Reserve applicable to bank holding companies. | |
| In addition, because we are a bank holding company, our ability to pay dividends on our common stock will be highly dependent upon the receipt of dividends, fees and other amounts from the Bank, | ||
13
Table of Contents
| which, in turn, will be highly dependent upon the Bank’s historical and projected results of operations, liquidity, cash flows and financial condition, as well as various legal and regulatory prohibitions and other restrictions on the ability of the Bank to pay dividends, extend credit or otherwise transfer funds to us. For additional information, see “Dividend Policy.” | ||
| Listing |
We have received approval to list our common stock on the NASDAQ Global Select Market under the symbol “LOB.” | |
| Risk factors |
Investing in our common stock involves risks. See “Risk Factors” for a discussion of factors you should consider carefully before making a decision to invest in our common stock. | |
| Transfer agent and registrar |
Broadridge Corporate Issuer Solutions, Inc. | |
The number of shares of common stock to be outstanding after this offering is based on 28,654,860 shares of common stock outstanding as of July 7, 2015 and excludes the following:
| • | does not include as outstanding 2,268,736 shares of our common stock issuable upon the exercise of outstanding stock options as of July 7, 2015 at a weighted average exercise price of $7.28 per share; and |
| • | does not include as outstanding 4,265,070 shares of our common stock reserved for issuance in connection with stock awards available for issuance under our 2015 Omnibus Stock Incentive Plan, which assumed all prior equity plans, as of July 7, 2015. |
Unless expressly indicated or the context otherwise requires, all information in this prospectus assumes no exercise by the underwriters of their option to purchase up to an additional 600,000 shares of our common stock in this offering.
14
Table of Contents
SELECTED HISTORICAL CONSOLIDATED FINANCIAL DATA
The table below sets forth selected historical consolidated financial data and other information for the periods presented. We have derived the selected historical consolidated financial data as of and for the years ended December 31, 2014, 2013 and 2012 from our audited consolidated financial statements included elsewhere in this prospectus and the selected historical consolidated financial data as of and for the year ended December 31, 2011 from our audited consolidated financial statements for that year, which are not included in this prospectus. The information as of and for the three months ended March 31, 2015 and 2014 is unaudited but, in the opinion of our management, contains all adjustments, consisting only of normal recurring adjustments, necessary for a fair presentation of our financial condition and results of operations for those periods. Results of operations for the three months ended March 31, 2015 are not necessarily indicative of the results of operations that may be expected for the year ending December 31, 2015. Our historical results are not necessarily indicative of the results that may be expected in the future.
The selected historical consolidated financial information should be read in conjunction with and is qualified in its entirety by:
| • | our audited consolidated financial statements as of and for the years ended December 31, 2014, 2013 and 2012 and related notes included elsewhere in this prospectus; |
| • | our unaudited consolidated financial statements as of and for the three months ended March 31, 2015 and 2014 and related notes included elsewhere in this prospectus; and |
| • | the sections in this prospectus entitled “Management’s Discussion and Analysis of Financial Condition and Results of Operations” and “Risk Factors.” |
The performance, asset quality and capital ratios included herein are unaudited and derived from our audited financial statements as of and for the years presented. Average balances have been calculated using daily averages.
| As of March 31, 2015 |
As of December 31, | |||||||||||||||||||
| 2014 | 2013 | 2012 | 2011 | |||||||||||||||||
| (dollars in thousands) |
||||||||||||||||||||
| Selected Period End Balance Sheet Data |
||||||||||||||||||||
| Total assets |
$ | 723,032 | $ | 673,315 | $ | 430,355 | $ | 342,468 | $ | 266,157 | ||||||||||
| Cash and due from banks |
57,564 | 39,902 | 37,244 | 44,173 | 27,536 | |||||||||||||||
| Investment securities available for sale, at fair value |
50,777 | 49,318 | 19,446 | 15,416 | 16,842 | |||||||||||||||
| Loans held for sale |
305,079 | 295,180 | 159,438 | 145,183 | 111,877 | |||||||||||||||
| Loans held for investment, net of unearned |
220,444 | 203,936 | 141,349 | 92,669 | 85,721 | |||||||||||||||
| Total loans held for sale and investment |
525,523 | 499,116 | 300,787 | 237,852 | 197,598 | |||||||||||||||
| Allowance for loan losses |
(5,234 | ) | (4,407 | ) | (2,723 | ) | (5,108 | ) | (4,617 | ) | ||||||||||
| Servicing assets |
38,457 | 34,999 | 29,053 | 24,220 | 18,731 | |||||||||||||||
| Deposits |
556,083 | 522,080 | 356,620 | 286,674 | 222,163 | |||||||||||||||
| Long-term borrowings |
50,210 | 41,849 | 12,325 | 12,205 | 8,659 | |||||||||||||||
| Total shareholders’ equity |
100,153 | 91,814 | 48,390 | 33,057 | 27,583 | |||||||||||||||
| Tangible shareholders’ equity(1) |
100,050 | 91,711 | 47,963 | 33,057 | 27,583 | |||||||||||||||
15
Table of Contents
Selected Historical Consolidated Financial Data (continued)
| As of and for the three months ended March 31, |
As of and for the years ended December 31, | |||||||||||||||||||||||
| 2015 | 2014 | 2014 | 2013 | 2012 | 2011 | |||||||||||||||||||
| (dollars in thousands except per share data) |
||||||||||||||||||||||||
| Selected Income Statement Data |
||||||||||||||||||||||||
| Interest income |
$ | 6,958 | $ | 4,212 | $ | 20,509 | $ | 15,302 | $ | 11,725 | $ | 8,744 | ||||||||||||
| Interest expense |
1,917 | 1,251 | 5,852 | 4,521 | 3,628 | 2,737 | ||||||||||||||||||
|
|
|
|
|
|
|
|
|
|
|
|
|
|||||||||||||
| Net interest income |
5,041 | 2,961 | 14,657 | 10,781 | 8,097 | 6,007 | ||||||||||||||||||
| Provision for loan losses |
1,077 | 424 | 2,793 | (858 | ) | 2,110 | 2,855 | |||||||||||||||||
|
|
|
|
|
|
|
|
|
|
|
|
|
|||||||||||||
| Net interest income after provision for loan losses |
3,964 | 2,537 | 11,864 | 11,639 | 5,987 | 3,152 | ||||||||||||||||||
| Noninterest income: |
||||||||||||||||||||||||
| Net gains on sales of loans |
15,461 | 10,031 | 49,977 | 38,225 | 33,535 | 22,612 | ||||||||||||||||||
| Other noninterest income |
8,594 | 2,174 | 10,065 | 18,242 | 8,945 | 9,515 | ||||||||||||||||||
| Total noninterest income |
24,055 | 12,205 | 60,042 | 56,467 | 42,430 | 32,127 | ||||||||||||||||||
| Noninterest expense |
14,688 | 14,444 | 54,470 | 40,164 | 33,619 | 20,967 | ||||||||||||||||||
| Income tax expense |
5,278 | — | 7,388 | — | — | — | ||||||||||||||||||
| Net income |
8,053 | 298 | 10,048 | 27,942 | 14,798 | 14,312 | ||||||||||||||||||
| Net income attributable to noncontrolling interest |
20 | — | — | 120 | 1,297 | — | ||||||||||||||||||
|
|
|
|
|
|
|
|
|
|
|
|
|
|||||||||||||
| Net income attributable to Live Oak Bancshares, Inc. |
$ | 8,073 | $ | 298 | $ | 10,048 | $ | 28,062 | $ | 16,095 | $ | 14,312 | ||||||||||||
|
|
|
|
|
|
|
|
|
|
|
|
|
|||||||||||||
| Net income (net of tax effect)(2) |
$ | 8,190 | $ | 183 | $ | 10,723 | $ | 17,258 | $ | 9,899 | $ | 8,802 | ||||||||||||
| Per Share Data (Common Stock) Attributable to the Company |
||||||||||||||||||||||||
| Earnings: |
||||||||||||||||||||||||
| Basic |
$ | 0.28 | $ | 0.01 | $ | 0.42 | $ | 1.38 | $ | 0.83 | $ | 0.82 | ||||||||||||
| Diluted(3) |
0.27 | 0.01 | 0.41 | 1.37 | 0.80 | 0.70 | ||||||||||||||||||
| Earnings (net of tax effect)(2): |
||||||||||||||||||||||||
| Basic |
0.29 | 0.01 | 0.45 | 0.85 | 0.51 | 0.50 | ||||||||||||||||||
| Diluted(3) |
0.28 | 0.01 | 0.44 | 0.84 | 0.49 | 0.43 | ||||||||||||||||||
| Dividends(4) |
0.05 | 0.28 | 2.18 | 0.48 | 0.59 | 0.55 | ||||||||||||||||||
| Book value(5) |
3.50 | 4.34 | 3.21 | 2.38 | 1.63 | 1.46 | ||||||||||||||||||
| Tangible book value(1) |
3.50 | 4.34 | 3.20 | 2.36 | 1.63 | 1.46 | ||||||||||||||||||
| Selected Performance Metrics |
||||||||||||||||||||||||
| Return on average assets |
4.20 | % | 0.25 | % | 1.77 | % | 6.53 | % | 5.01 | % | 5.75 | % | ||||||||||||
| Return on average equity |
35.86 | 2.49 | 14.11 | 62.82 | 50.62 | 61.64 | ||||||||||||||||||
| Return on average assets (net of tax effect)(2)(6) |
4.28 | 0.15 | 1.89 | 4.02 | 3.08 | 3.54 | ||||||||||||||||||
| Return on average equity (net of tax effect)(2)(6) |
36.48 | 1.53 | 15.05 | 38.63 | 31.13 | 37.91 | ||||||||||||||||||
| Average yield on loans(7) |
4.97 | 4.92 | 5.00 | 5.04 | 4.91 | 4.82 | ||||||||||||||||||
| Average cost of deposits(7) |
0.98 | 1.12 | 1.06 | 1.13 | 1.10 | 1.22 | ||||||||||||||||||
| Net interest margin(7) |
2.97 | 2.94 | 3.03 | 2.95 | 2.83 | 2.81 | ||||||||||||||||||
| Efficiency ratio(1) |
50.48 | 95.24 | 72.85 | 59.73 | 66.54 | 54.98 | ||||||||||||||||||
| Noninterest income to total revenue(8) |
82.67 | 80.48 | 80.40 | 83.97 | 83.99 | 84.25 | ||||||||||||||||||
| Average equity to average assets |
11.72 | 10.03 | 12.56 | 10.40 | 9.89 | 9.33 | ||||||||||||||||||
| Dividend payout ratio (inclusive of tax distributions)(9) |
16.88 | 1,907.72 | 447.33 | 10.65 | 33.56 | 20.70 | ||||||||||||||||||
| Dividend payout ratio (net of tax effect)(2)(9) |
16.64 | 3,106.56 | 419.17 | 17.32 | 54.57 | 33.66 | ||||||||||||||||||
| Dividends paid(25) |
1,363 | 5,685 | 52,376 | 9,780 | 11,499 | 9,630 | ||||||||||||||||||
| Employees at period end(10) |
227 | 152 | 192 | 141 | 94 | 62 | ||||||||||||||||||
16
Table of Contents
Selected Historical Consolidated Financial Data (continued)
| As of and for the three months ended March 31, |
As of and for the years ended December 31, | |||||||||||||||||||||||
| 2015 | 2014 | 2014 | 2013 | 2012 | 2011 | |||||||||||||||||||
| (dollars in thousands except per share data and total number of loans originated) |
||||||||||||||||||||||||
| Selected Loan Metrics |
||||||||||||||||||||||||
| Annual number of loans originated(11) |
231 | 144 | 742 | 524 | 447 | 322 | ||||||||||||||||||
| Annual amount of loans originated(11) |
$ | 248,058 | $ | 135,205 | $ | 848,090 | $ | 498,752 | $ | 413,764 | $ | 306,637 | ||||||||||||
| Outstanding borrowers’ principal balance |
2,125,653 | 1,547,454 | 1,975,500 | 1,446,772 | 1,104,160 | 802,653 | ||||||||||||||||||
| Percent of total loans held for sale and investment guaranteed by the SBA(12) |
35.05 | % | 30.41 | % | 34.48 | % | 28.72 | % | 33.96 | % | 32.86 | % | ||||||||||||
| U.S. government guaranteed loans sold at a premium(13) |
$ | 137,047 | $ | 87,586 | $ | 433,912 | $ | 339,342 | $ | 276,676 | $ | 238,442 | ||||||||||||
| U.S. government guaranteed loans sold at par for excess servicing(13) |
— | — | — | — | — | — | ||||||||||||||||||
| Loans sold not guaranteed by U.S. government(13) |
28,483 | 5,523 | 55,233 | 42,932 | 52,574 | 12,680 | ||||||||||||||||||
| Total loans sold and serviced for others(13) |
165,530 | 93,741 | 489,145 | 382,274 | 329,250 | 251,122 | ||||||||||||||||||
| Outstanding balance of guaranteed loans sold(14) |
1,403,968 | 1,057,048 | 1,302,828 | 1,005,764 | 767,721 | 550,622 | ||||||||||||||||||
| Number of loans serviced(15) |
2,610 | 1,898 | 2,409 | 1,780 | 1,323 | 929 | ||||||||||||||||||
| Average net gain on sale of loans(16) |
$ | 93.40 | $ | 107.73 | $ | 102.17 | $ | 99.99 | $ | 101.85 | $ | 90.05 | ||||||||||||
| Average servicing fee on sale of loans(17) |
0.83 | % | 0.94 | % | 0.89 | % | 0.89 | % | 0.84 | % | 0.95 | % | ||||||||||||
| Average servicing fee on sale of loans guaranteed by the SBA(17) |
1.00 | 1.00 | 1.00 | 1.00 | 1.00 | 1.00 | ||||||||||||||||||
| Weighted average servicing fee of sold loans guaranteed by the SBA(18) |
1.10 | 1.14 | 1.11 | 1.16 | 1.24 | 1.39 | ||||||||||||||||||
| Average outstanding loan size(19) |
$ | 814.4 | $ | 815.3 | $ | 820.4 | $ | 812.8 | $ | 834.6 | $ | 864.0 | ||||||||||||
| Average balance of loans on balance sheet(20) |
204.8 | 188.3 | 210.9 | 173.9 | 185.1 | 214.2 | ||||||||||||||||||
| Average balance of loans on balance sheet not guaranteed by U.S. government(21) |
133.0 | 130.4 | 138.2 | 124.0 | 122.2 | 143.8 | ||||||||||||||||||
| Asset Quality Ratios |
||||||||||||||||||||||||
| Nonperforming loans and foreclosed assets(22) |
$ | 18,898 | $ | 12,157 | $ | 19,063 | $ | 9,038 | $ | 8,825 | $ | 9,871 | ||||||||||||
| Nonperforming loans and foreclosed assets not guaranteed by the SBA(22) |
2,968 | 1,635 | 3,508 | 2,055 | 3,763 | 3,080 | ||||||||||||||||||
| Nonperforming loans and foreclosed assets guaranteed by the SBA(22) |
15,964 | 10,522 | 15,555 | 6,983 | 5,062 | 6,791 | ||||||||||||||||||
| Nonperforming loans to total assets(22) |
2.61 | % | 2.48 | % | 2.78 | % | 2.02 | % | 2.51 | % | 3.71 | % | ||||||||||||
| Nonperforming loans not guaranteed by the SBA to total assets(22) |
0.41 | 0.33 | 0.47 | 0.40 | 1.03 | 1.16 | ||||||||||||||||||
| Nonperforming loans guaranteed by the SBA to total assets(22) |
2.21 | 2.15 | 2.31 | 1.62 | 1.48 | 2.55 | ||||||||||||||||||
| Nonperforming loans to loans held for investment(22) |
8.57 | 7.64 | 9.17 | 6.15 | 9.27 | 11.52 | ||||||||||||||||||
| Nonperforming loans not guaranteed by the SBA to loans held for investment(22) |
1.33 | 1.03 | 1.54 | 1.21 | 3.81 | 3.59 | ||||||||||||||||||
| Nonperforming loans guaranteed by the SBA to loans held for investment(22) |
7.24 | 6.62 | 7.63 | 4.94 | 5.46 | 7.93 | ||||||||||||||||||
| Allowance for loan losses to nonperforming loans(22) |
27.70 | 26.43 | 23.58 | 31.31 | 59.44 | 46.77 | ||||||||||||||||||
| Allowance for loan losses to nonperforming loans not guaranteed by the SBA(22) |
178.39 | 196.51 | 140.48 | 158.87 | 144.66 | 149.90 | ||||||||||||||||||
| Allowance for loan losses to nonperforming loans guaranteed by the SBA(22) |
32.79 | 30.54 | 28.33 | 38.99 | 100.91 | 67.99 | ||||||||||||||||||
| Allowance for loan losses to loans held for investment |
2.37 | 2.02 | 2.16 | 1.93 | 5.51 | 5.39 | ||||||||||||||||||
| Allowance for loan losses to loans held for investment not guaranteed by the SBA |
2.69 | 2.30 | 2.41 | 2.11 | 6.34 | 5.39 | ||||||||||||||||||
| Allowance for loan losses to loans held for investment guaranteed by the SBA |
25.12 | 19.66 | 20.69 | 21.87 | 42.39 | — | ||||||||||||||||||
| Net charge-offs |
$ | 251 | $ | (67 | ) | $ | 1,109 | $ | 1,888 | $ | 1,860 | $ | 1,461 | |||||||||||
| Net charge-offs of loans not guaranteed by the SBA |
251 | (67 | ) | 1,109 | 1,888 | 1,860 | 1,461 | |||||||||||||||||
| Net charge-offs of loans guaranteed by the SBA |
— | — | — | — | — | — | ||||||||||||||||||
| Net charge-offs to average loans on book outstanding(23) |
0.20 | % | (0.08 | )% | 0.28 | % | 0.66 | % | 0.82 | % | 0.85 | % | ||||||||||||
| Net charge-offs to average loans not guaranteed by the SBA on book outstanding(23) |
0.30 | (0.11 | ) | 0.41 | 1.01 | 1.19 | 1.33 | |||||||||||||||||
| Net charge-offs to average loans guaranteed by the SBA on book outstanding(23) |
— | — | — | — | — | — | ||||||||||||||||||
17
Table of Contents
Selected Historical Consolidated Financial Data (continued)
| As of March 31, | As of December 31, | |||||||||||||||||||||||
| 2015 | 2014 | 2014 | 2013 | 2012 | 2011 | |||||||||||||||||||
| Capital Ratios |
||||||||||||||||||||||||
| Tier 1 leverage ratio (Bank) |
8.66 | % | 9.09 | % | 9.34 | % | 10.39 | % | 10.63 | % | 11.84 | % | ||||||||||||
| Tier 1 risk-based capital ratio (Bank)(24) |
12.36 | 11.98 | 12.43 | 15.09 | 16.65 | 17.13 | ||||||||||||||||||
| Total risk-based capital ratio (Bank)(24) |
13.39 | 12.89 | 13.36 | 15.95 | 17.91 | 18.40 | ||||||||||||||||||
| Common Equity Tier 1 (Bank) |
12.36 | — | — | — | — | — | ||||||||||||||||||
| Total equity to total assets |
13.85 | 9.48 | 13.64 | 11.24 | 9.65 | 10.36 | ||||||||||||||||||
| Tangible shareholders’ equity to tangible assets(1) |
13.84 | 9.46 | 13.62 | 11.15 | 9.65 | 10.36 | ||||||||||||||||||
18
Table of Contents
Notes to Selected Historical Consolidated Financial Data
| (1) | These measures are not measures recognized under United States generally accepted accounting principles, or GAAP, and are therefore considered to be non-GAAP financial measures. See “GAAP Reconciliation and Management Explanation of Non-GAAP Financial Measures” for a reconciliation of these measures to their most comparable GAAP measures. |
| (2) | We have calculated our net income (net of tax effect), earnings per share (net of tax effect) on a basic and diluted basis, return on average assets (net of tax effect), return on average equity (net of tax effect) and dividend payout ratio (net of tax effect) for each year shown by calculating a provision for income taxes using an assumed annual effective income tax rate of 38.5% for the quarters ended March 31, 2015 and 2014 and the years ended December 31, 2014, 2013, 2012 and 2011, and adjusting our historical net income for each period presented to give effect to the pro forma provision for federal and state income taxes for such year. For the year ended December 31, 2014 we have also excluded the initial deferred tax liability recorded as a result of the change in tax status on August 3, 2014 due to our conversion from an S corporation to a C corporation. |
| (3) | We calculated our diluted earnings per share for each year shown as our net income divided by the weighted-average number of shares of our common stock outstanding during the relevant year adjusted for the dilutive effect of outstanding options to purchase shares of our common stock. See Note 1 to our audited consolidated financial statements appearing elsewhere in this prospectus for more information regarding the dilutive effect of our outstanding options. The number of pro forma shares outstanding are equal to historical, or stated, shares outstanding in each respective period, as adjusted for stock splits. We calculated earnings per share on a basic and diluted basis and pro forma earnings per share on a basic and diluted basis using the following outstanding share amounts: |
| Three month period ended March 31, |
Year ended December 31, | |||||||||||||||||||||||
| 2015 | 2014 | 2014 | 2013 | 2012 | 2011 | |||||||||||||||||||
| Share Data |
||||||||||||||||||||||||
| Weighted average shares outstanding (basic) |
28,620,120 | 20,373,983 | 23,973,398 | 20,347,660 | 19,467,300 | 17,567,510 | ||||||||||||||||||
| Weighted average shares outstanding (diluted) |
29,361,841 | 20,585,406 | 24,424,181 | 20,439,130 | 20,138,360 | 20,732,190 | ||||||||||||||||||
| Shares outstanding at end of period |
28,623,609 | 21,135,080 | 28,619,930 | 20,318,330 | 20,274,950 | 18,835,410 | ||||||||||||||||||
| (4) | Dividends declared include the cash distributions paid to our shareholders in the relevant year to provide them with funds to pay their income tax liabilities incurred as a result of the pass-through of our net taxable income for such year to our shareholders as holders of shares in an S corporation for income tax purposes. The aggregate amounts of such cash distributions relating to the payment of tax liabilities were $0.05 per share and $0.07 per share for the three months ended March 31, 2015 and 2014, respectively and $0.31 per share, $0.33 per share, $0.31 per share, and $0.38 per share for the years ended December 31, 2014, 2013, 2012 and 2011, respectively. |
| (5) | Book value per share equals our total shareholders’ equity as of the date presented divided by the number of shares of our common stock outstanding as of the date presented. The number of shares of our common stock outstanding as of March 31, 2015 and 2014 and December 31, 2014, 2013, 2012 and 2011 has been presented in note (3) above. |
| (6) | We have calculated our pro forma return on average assets and pro forma return on average equity for a year by calculating our pro forma net income for that year as described in note 2 above and dividing |
19
Table of Contents
| that by our average assets and average equity, as the case may be, for that year. We calculate our average assets and average equity for a year by dividing the sum of our total asset balance or total shareholder’s equity balance, as the case may be, as of the close of business on each day in the relevant year and dividing by the number of days in the year. |
| (7) | We calculate average yield on loans by dividing loan interest income by average loans. We calculate average cost of deposits by dividing deposit expense by average interest-earning deposits. Net interest margin represents net interest income divided by average interest-earning assets. |
| (8) | We calculate the ratio of noninterest income to total revenue as noninterest income (excluding securities gains or losses) divided by the sum of net interest income plus noninterest income (excluding securities gains or losses). |
| (9) | We calculate our dividend payout ratio for each year presented as the dividends paid per share for such period (excluding cash distributions made to shareholders in connection with tax liabilities as described in note 4 above) divided by our basic earnings per share and earnings (net of tax) for such year. |
| (10) | Full time employees exclude employees of nCino for periods when nCino was a consolidated subsidiary. There were six non-Bank employees as of December 31, 2014 and 2013. There were no non-Bank employees as of December 31, 2012. |
| (11) | Includes the number of notes and amount of the entire note with note dates in the respective year. |
| (12) | We originate loans primarily through the SBA 7(a) program. Typically, 75% of the note amount of loans originated through the SBA 7(a) program is guaranteed by the SBA. Total loans include the gross loans held for sale and held for investment. |
| (13) | We have historically operated an originate-sell-and-service model. We primarily sell the U.S. government guaranteed portion of loans at a premium with a 1% servicing fee. Prior to 2010, we primarily sold the guaranteed portion of loans at par for servicing in excess of 1%. Additionally, we sell portions of our loans not guaranteed by the SBA. These loans are typically sold at par. |
| (14) | This represents the outstanding principal balance of guaranteed loans, as of the last day of the applicable year, that have been sold into the secondary market. |
| (15) | This represents the number of loans outstanding as of the last day of the applicable year, that we service. We service all of the loans we originate. |
| (16) | We calculate average net gain on sale of loans by dividing net gains on sales of loans by total loans sold and serviced for others multiplied by 1,000. This ratio represents the average net gain on sale generated from every $1 million of loan sales. Net gain on sale for our guaranteed loans is composed primarily of four components: premium cash, establishment of the servicing asset related to that sale, a discount on the retained unguaranteed portion of the loan and the recognition into income of deferred costs and fees associated with the loan relative to the portion sold. Average net gains on sale of loans by category in the below tables is provided as additional information and does not reconcile directly with total net gains on sale of loans reflected in the Selected Historical Consolidated Financial Data. These averages do not sum to the total reflected in the Selected Historical Consolidated Financial Data because the computation of each individual ratio is derived only from the average balance in the corresponding loan category. For instance, total gains on the sale of guaranteed loans sold at a premium is divided by the respective average balance for only that loan category to arrive at the average |
20
Table of Contents
| gain for loans held for sale. As a result, the data reflected in this note 16 only reflects average net gains recognized for each loan category presented rather than net gains relative to total loans sold. |
| Average net gain on sale of loans (dollars in thousands) |
Three months ended March 31, |
Year ended December 31, | ||||||||||||||||||||||
| 2015 | 2014 | 2014 | 2013 | 2012 | 2011 | |||||||||||||||||||
| U.S. government guaranteed loans sold at a premium |
$ | 112.82 | $ | 114.53 | $ | 115.19 | $ | 113.11 | $ | 121.28 | $ | 91.94 | ||||||||||||
| U.S. government guaranteed loans sold at par for excess servicing |
— | — | — | — | — | — | ||||||||||||||||||
| Loans sold not guaranteed by U.S. government |
— | — | (0.08 | ) | (3.70 | ) | (0.40 | ) | 54.41 | |||||||||||||||
| Average net gain on sale of U.S. government guaranteed loans sold at a premium (dollars in thousands) |
||||||||||||||||||||||||
| 2015 | 2014 | 2014 | 2013 | 2012 | 2011 | |||||||||||||||||||
| Premium cash received |
$ | 98.05 | $ | 99.18 | $ | 101.81 | $ | 103.12 | $ | 108.11 | $ | 93.44 | ||||||||||||
| Servicing asset established |
24.62 | 23.79 | 25.17 | 24.88 | 23.17 | 20.98 | ||||||||||||||||||
| Discount on retained portion |
(5.55 | ) | (5.07 | ) | (5.94 | ) | (8.23 | ) | (4.30 | ) | (18.25 | ) | ||||||||||||
| Deferred fees and costs |
(4.30 | ) | (3.37 | ) | (5.86 | ) | (6.47 | ) | (5.68 | ) | (4.23 | ) | ||||||||||||
| Other adjustments |
— | — | (0.19 | ) | (0.02 | ) | — | |||||||||||||||||
|
|
|
|
|
|
|
|
|
|
|
|
|
|||||||||||||
| $ |
112.82 |
|
$ | 114.53 | $ | 115.18 | $ | 113.11 | $ | 121.28 | $ | 91.94 | ||||||||||||
| (17) | We calculate average servicing retained by dividing the total of the servicing percentage multiplied by the amount sold for each loan by the total loans sold and serviced for others. |
| (18) | We calculate the weighted average servicing fee of sold loans guaranteed by the SBA by dividing the servicing fee multiplied by the total outstanding guaranteed amount sold for each loan by the total outstanding guaranteed amount of loans sold and serviced for others. |
| (19) | We calculate average outstanding loan size by dividing the outstanding borrower principal balance by the number of loans. |
| (20) | We calculate average balance of loans by dividing total loans (gross) by the number of loans. We exclude any loans that have been completely charged off. |
| (21) | We calculate average balance of loans not guaranteed by the SBA by dividing the portion of total loans (gross) not guaranteed by the SBA by the number of loans. We exclude any loans that have been completely charged off. |
| (22) | Nonperforming loans include nonaccrual loans. |
| (23) | Average loans on book outstanding includes held for sale and held for investment loans. |
| (24) | The calculation of our risk-weighted assets for the year ended December 31, 2014 and prior periods has been calculated using the standardized method of the Basel II Framework, as implemented by the Federal Reserve and the FDIC. |
| (25) | The significant increase in dividends paid to shareholders during 2014 primarily reflects distributions due to a one-time tax effect to shareholders in connection with our conversion from an S-Corporation to a C-Corporation and gains realized from the spin-out of nCino to our shareholders. |
21
Table of Contents
GAAP RECONCILIATION AND MANAGEMENT EXPLANATION OF NON-GAAP FINANCIAL MEASURES
Some of the financial measures included in our selected historical consolidated financial data and elsewhere in this prospectus are not measures of financial performance recognized by GAAP. These non-GAAP financial measures are “tangible shareholders’ equity,” “tangible book value per share,” “tangible average equity to tangible average assets,” “efficiency ratio,” and “net income adjusted for non-recurring income and expense.” Our management uses these non-GAAP financial measures in its analysis of our performance.
| • | “Tangible shareholders’ equity” is total shareholders’ equity less goodwill and other intangible assets. We have not considered loan servicing rights as an intangible asset for purposes of this calculation. |
| • | “Tangible shareholders’ equity to tangible assets” is defined as the ratio of shareholders’ equity less goodwill and other intangible assets, divided by total assets. We believe this measure is important because it shows relative changes from period to period in equity and total assets, each exclusive of changes in intangible assets. We have not considered loan servicing rights as an intangible asset for purposes of this calculation. |
| • | “Efficiency ratio” is defined as total noninterest expense divided by the sum of net interest income and noninterest income. We believe this measure is important as an indicator of productivity because it shows the amount of revenue generated for each dollar spent. While the efficiency ratio is a measure of productivity, its value reflects the unique attributes of the “high-touch business model” we employ. |
| • | “Net income adjusted for non-recurring income and expense” is defined as net income adjusted to exclude significant one-time sources of income and uses of expenses and annualize an estimated corporate income tax expense across all periods being compared. We believe these measures are important as they allow for an evaluation of the core profitability of our business. |
| • | “Noninterest income, as adjusted” is defined as noninterest income adjusted to exclude significant one time sources of income, including the gain on the deconsolidation of nCino and gain on the sale of our subsequent re-investment in nCino. We believe these measures are important as they allow for an evaluation of the core profitability of our business. |
| • | “Noninterest expense, as adjusted” is defined as noninterest expense adjusted to exclude significant one time sources of expenses, including costs related to our exploration in 2014 of several capital-raising alternatives that ultimately resulted in a private placement of our common stock. We believe these measures are important as they allow for an evaluation of the core profitability of our business. |
| • | “Income tax, as adjusted” is defined as income tax expense adjusted to exclude significant one time sources of expenses. We believe these measures are important as they allow for an evaluation of the core profitability of our business. |
| • | “Tangible book value per share” is defined as total equity reduced by goodwill and other intangible assets divided by total common shares outstanding. We believe this measure is important because it shows changes from period to period in book value per share exclusive of changes in intangible assets. We have not considered loan servicing rights as an intangible asset for purposes of this calculation. |
We believe these non-GAAP financial measures provide useful information to management and investors that is supplementary to our financial condition, results of operations and cash flows computed in accordance with GAAP; however, we acknowledge that our non-GAAP financial measures have a number of limitations. As such, you should not view these measures as a substitute for results determined in accordance with GAAP, and they are not necessarily comparable to non-GAAP financial measures that other companies use. The following table provides a reconciliation of these non-GAAP financial measures to the most closely related GAAP measure.
22
Table of Contents
| Three months ended March 31, |
Years ended December 31, | |||||||||||||||||||||||
| 2015 | 2014 | 2014 | 2013 | 2012 | 2011 | |||||||||||||||||||
| (dollars in thousands, except share and per share data) |
||||||||||||||||||||||||
| Total shareholders’ equity |
$ | 100,153 | $ | 46,430 | $ | 91,814 | $ | 48,390 | $ | 33,057 | $ | 27,583 | ||||||||||||
| Less: |
||||||||||||||||||||||||
| Goodwill |
— | 272 | — | 272 | — | — | ||||||||||||||||||
| Other intangible assets |
103 | 155 | 103 | 155 | — | — | ||||||||||||||||||
|
|
|
|
|
|
|
|
|
|
|
|
|
|||||||||||||
| Tangible shareholders’ equity |
$ | 100,050 | $ | 46,003 | $ | 91,711 | $ | 47,963 | $ | 33,057 | $ | 27,583 | ||||||||||||
|
|
|
|
|
|
|
|
|
|
|
|
|
|||||||||||||
| Shares outstanding |
28,623,609 | 21,135,080 | 28,619,930 | 20,318,330 | 20,274,950 | 18,835,410 | ||||||||||||||||||
| Total assets |
$ | 723,032 | $ | 489,652 | $ | 673,315 | $ | 430,355 | $ | 342,468 | $ | 266,157 | ||||||||||||
| Less: |
||||||||||||||||||||||||
| Goodwill |
— | 272 | — | 272 | — | — | ||||||||||||||||||
| Other intangible assets |
103 | 155 | 103 | 155 | — | — | ||||||||||||||||||
|
|
|
|
|
|
|
|
|
|
|
|
|
|||||||||||||
| Tangible assets |
$ | 722,929 | $ | 489,225 | $ | 673,212 | $ | 429,928 | $ | 342,468 | $ | 266,157 | ||||||||||||
|
|
|
|
|
|
|
|
|
|
|
|
|
|||||||||||||
| Tangible shareholders’ equity to tangible assets |
13.84 | % | 9.40 | % | 13.62 | % | 11.16 | % | 9.65 | % | 10.36 | % | ||||||||||||
| Tangible book value per share |
$ | 3.50 | $ | 2.18 | $ | 3.20 | $ | 2.36 | $ | 1.63 | $ | 1.46 | ||||||||||||
| Three months ended March 31, |
Years ended December 31, | |||||||||||||||||||||||
| 2015 | 2014 | 2014 | 2013 | 2012 | 2011 | |||||||||||||||||||
| (dollars in thousands) |
||||||||||||||||||||||||
| Efficiency ratio |
||||||||||||||||||||||||
| Noninterest expense |
$ | 14,688 | $ | 14,444 | $ | 54,470 | $ | 40,164 | $ | 33,619 | $ | 20,967 | ||||||||||||
| Net interest taxable equivalent income |
5,041 | 2,961 | 14,657 | 10,781 | 8,097 | 6,007 | ||||||||||||||||||
| Noninterest taxable equivalent income (loss) |
24,055 | 12,205 | 60,042 | 56,467 | 42,430 | 32,127 | ||||||||||||||||||
| Less gain (loss) on sale of securities |
— | — | (74 | ) | 11 | — | — | |||||||||||||||||
|
|
|
|
|
|
|
|
|
|
|
|
|
|||||||||||||
| Adjusted operating revenue |
$ | 29,096 | $ | 15,166 | $ | 74,773 | $ | 67,237 | $ | 50,527 | $ | 38,134 | ||||||||||||
|
|
|
|
|
|
|
|
|
|
|
|
|
|||||||||||||
| Efficiency ratio |
50.48 | % | 95.24 | % | 72.85 | % | 59.73 | % | 66.54 | % | 54.98 | % | ||||||||||||
| Three months ended March 31, |
Years ended December 31, | |||||||||||||||||||||||
| 2015 | 2014 | 2014 | 2013 | 2012 | 2011 | |||||||||||||||||||
| (dollars in thousands, except share and per share data) |
||||||||||||||||||||||||
| Reconciliation of Net Income to net income adjusted for non-recurring income and expenses |
||||||||||||||||||||||||
| Net income |
$ | 8,073 | 298 | $ | 10,048 | $ | 28,062 | $ | 16,095 | $ | 14,312 | |||||||||||||
| Gain on deconsolidation of subsidiary |
— | — | — | (12,212 | ) | — | — | |||||||||||||||||
| Gain on sale of non-consolidated affiliate investment |
(3,782 | ) | — | — | — | — | — | |||||||||||||||||
| Costs related to exploration of alternative capital raises |
— | 1,673 | 1,673 | — | — | — | ||||||||||||||||||
| Stock grants |
— | 2,992 | 2,992 | — | — | — | ||||||||||||||||||
| Initial deferred tax liability recorded as a result of change from S to C corporation |
— | — | 3,252 | — | — | — | ||||||||||||||||||
| C corporation income tax expense for (last five months of 2014) |
5,278 | — | 4,136 | — | — | — | ||||||||||||||||||
|
|
|
|
|
|
|
|
|
|
|
|
|
|||||||||||||
| Adjusted net income before income tax |
9,569 | 4,963 | 22,101 | 15,850 | 16,095 | 14,312 | ||||||||||||||||||
| Estimated income tax at 38.5% |
3,684 | 1,911 | 8,509 | 6,103 | 6,197 | 5,511 | ||||||||||||||||||
|
|
|
|
|
|
|
|
|
|
|
|
|
|||||||||||||
| Net income, net of non-recurring income and expenses |
$ | 5,885 | $ | 3,052 | $ | 13,592 | $ | 9,747 | $ | 9,898 | $ | 8,801 | ||||||||||||
|
|
|
|
|
|
|
|
|
|
|
|
|
|||||||||||||
| Earnings Per Share: |
||||||||||||||||||||||||
| Basic |
$ | 0.21 | $ | 0.15 | $ | 0.57 | $ | 0.48 | $ | 0.51 | $ | 0.50 | ||||||||||||
| Diluted |
$ | 0.20 | $ | 0.15 | $ | 0.56 | $ | 0.48 | $ | 0.49 | $ | 0.42 | ||||||||||||
| Weighted-average shares outstanding: |
||||||||||||||||||||||||
| Basic |
28,620,120 | 20,373,983 | 23,973,398 | 20,347,660 | 19,467,300 | 17,567,510 | ||||||||||||||||||
| Diluted |
29,361,941 | 20,585,406 | 24,424,181 | 20,439,130 | 20,138,360 | 20,732,190 | ||||||||||||||||||
| Reconciliation of financial statement line items as reported to adjusted for non-recurring income and expenses |
||||||||||||||||||||||||
| Total noninterest income, as reported |
$ | 24,055 | $ | 12,205 | $ | 60,042 | $ | 56,467 | $ | 42,430 | $ | 32,414 | ||||||||||||
23
Table of Contents
| Three months ended March 31, |
Years ended December 31, | |||||||||||||||||||||||
| 2015 | 2014 | 2014 | 2013 | 2012 | 2011 | |||||||||||||||||||
| (dollars in thousands, except share and per share data) |
||||||||||||||||||||||||
| Gain on deconsolidation of subsidiary |
$ | — | $ | — | $ | — | $ | (12,212 | ) | $ | — | $ | — | |||||||||||
| Gain on sale of non-consolidated affiliate investment |
(3,782 | ) | — | — | — | — | — | |||||||||||||||||
|
|
|
|
|
|
|
|
|
|
|
|
|
|||||||||||||
| Noninterest income, as adjusted |
20,273 | 12,205 | 60,042 | 44,255 | 42,430 | 32,414 | ||||||||||||||||||
| Noninterest expense, as reported |
14,688 | 14,444 | 54,470 | 40,164 | 33,619 | 21,253 | ||||||||||||||||||
| Costs related to withdrawn 2014 initial public offering in lieu of private placement |
— | (1,673 | ) | (1,673 | ) | — | — | — | ||||||||||||||||
| Stock grants |
— | (2,992 | ) | (2,992 | ) | — | — | — | ||||||||||||||||
|
|
|
|
|
|
|
|
|
|
|
|
|
|||||||||||||
| Noninterest expense, as adjusted |
14,688 | 9,779 | 49,805 | 40,164 | 33,619 | 21,253 | ||||||||||||||||||
| Income tax expense, as reported |
5,278 | — | 7,388 | — | — | — | ||||||||||||||||||
| Initial deferred tax liability recorded as a result of change from S to C corporation |
— | — | (3,252 | ) | — | — | — | |||||||||||||||||
| C corporation income tax expense for (last five months of 2014) |
(5,278 | ) | — | (4,136 | ) | — | — | — | ||||||||||||||||
| Estimated income tax at 38.5% |
3,684 | 1,911 | 8,509 | 6,103 | 6,197 | 5,511 | ||||||||||||||||||
|
|
|
|
|
|
|
|
|
|
|
|
|
|||||||||||||
| Income tax expense, as adjusted |
$ | 3,684 | $ | 1,911 | $ | 8,509 | $ | 6,103 | $ | 6,197 | $ | 5,511 | ||||||||||||
24
Table of Contents
An investment in our common stock involves certain risks. You should carefully consider the risks described below, as well as the other information included in this prospectus, before making an investment decision. Our business, financial condition and results of operations could be materially adversely affected by any of these risks, or others. The trading price of our common stock could decline due to any of these risks, and you may lose all or part of your investment. This prospectus also contains forward-looking statements that involve risks and uncertainties. Our actual results could differ materially from those anticipated in these forward-looking statements as a result of certain factors, including the risks faced by us described below and elsewhere in this prospectus.
Risks Related to Our Business
We may experience increased delinquencies and credit losses, which could have a material adverse effect on our capital, financial condition, and results of operations.
Like other lenders, we face the risk that our customers will not repay their loans. A customer’s failure to repay us is usually preceded by missed monthly payments. In some instances, however, a customer may declare bankruptcy prior to missing payments, and, following a borrower filing bankruptcy, a lender’s recovery of the credit extended is often limited. Since many of our loans are secured by collateral, we may attempt to seize the collateral if and when a customer defaults on a loan. However, the value of the collateral might not equal the amount of the unpaid loan, and we may be unsuccessful in recovering the remaining balance from our customer. The resolution of nonperforming assets, including the initiation of foreclosure proceedings, requires significant commitments of time from management, which can be detrimental to the performance of their other responsibilities, and which expose us to additional legal costs. Elevated levels of loan delinquencies and bankruptcies in our market areas, generally, and among our customers specifically, can be precursors of future charge-offs and may require us to increase our allowance for loan and lease losses, or ALLL. Higher charge-off rates, delays in the foreclosure process or in obtaining judgments against defaulting borrowers or an increase in our ALLL may hurt our overall financial performance if we are unable to increase revenue to compensate for these losses, may increase our cost of funds, and could materially adversely affect our business, results of operations and financial condition.
SBA lending is an important part of our business. Our SBA lending program is dependent upon the federal government, and we face specific risks associated with originating SBA loans.
Our SBA lending program is dependent upon the federal government. As an SBA Preferred Lender, we enable our clients to obtain SBA loans without being subject to the potentially lengthy SBA approval process necessary for lenders that are not SBA Preferred Lenders. The SBA periodically reviews the lending operations of participating lenders to assess, among other things, whether the lender exhibits prudent risk management. When weaknesses are identified, the SBA may request corrective actions or impose enforcement actions, including revocation of the lender’s Preferred Lender status. If we lose our status as a Preferred Lender, we may lose some or all of our customers to lenders who are SBA Preferred Lenders, and as a result we could experience a material adverse effect to our financial results. Any changes to the SBA program, including changes to the level of guarantee provided by the federal government on SBA loans, may also have a material adverse effect on our business.
We generally sell the guaranteed portion of our SBA 7(a) loans in the secondary market. These sales have resulted in both premium income for us at the time of sale, and created a stream of future servicing income. We may not be able to continue originating these loans or selling them in the secondary market. Furthermore, even if we are able to continue originating and selling SBA 7(a) loans in the secondary market, we might not continue to realize premiums upon the sale of the guaranteed portion of these loans. When we sell the guaranteed portion of
25
Table of Contents
our SBA 7(a) loans, we incur credit risk on the non-guaranteed portion of the loans, and if a customer defaults on the non-guaranteed portion of a loan, we share any loss and recovery related to the loan pro-rata with the SBA. If the SBA establishes that a loss on an SBA guaranteed loan is attributable to significant technical deficiencies in the manner in which the loan was originated, funded or serviced by us, the SBA may seek recovery of the principal loss related to the deficiency from us, which could materially adversely affect our business, results of operations and financial condition.
The laws, regulations and standard operating procedures that are applicable to SBA loan products may change in the future. We cannot predict the effects of these changes on our business and profitability. Because government regulation greatly affects the business and financial results of all commercial banks and bank holding companies and especially our organization, changes in the laws, regulations and procedures applicable to SBA loans could adversely affect our ability to operate profitably.
We are dependent upon the use of intellectual property owned by third parties, and any change in our ability to use, or the terms upon which we may use, this intellectual property could have a material adverse effect on our business.
The technology-based platform that is pivotal to our success is dependent on the use of the nCino Bank Operating System and Salesforce.com, Inc.’s Force.com cloud computing infrastructure platform. We rely on a non-exclusive license to use nCino’s platform. Because our license is non-exclusive, the nCino Bank Operating System is available to other lenders and nothing would prevent our competitors from developing, licensing or using similar technology. Our license currently expires on November 1, 2015, though it will automatically renew for additional one (1) year terms unless either party gives 30 days’ prior written notice of its intent to terminate. Management is currently in the process of finalizing an extension of this agreement to a three year term. Notwithstanding the term of our agreement, our license may be terminated if we are in material breach of the license and do not cure the breach within 30 days. In addition, nCino relies on a license to use the Saleforce.com platform and if nCino were unable to maintain its rights under that license, our ability to rely on the nCino license could be adversely affected. We can offer no assurance that we will be able to renew or maintain our license to use the nCino Bank Operating System on terms that are acceptable. Termination of either of these licenses or the reduction or elimination of our licensed rights may result in our having to negotiate new licenses with less favorable terms, or the inability to obtain access to such licensed technology at all. If we were to lose access to this technology, or were only able to access the technology on less favorable terms, we would not be able to offer our customers the technology-based platform services they seek from us and our business would be materially and adversely affected.
A failure in or breach of our operational or security systems, or those of our third party service providers, including as a result of cyber-attacks, could disrupt our business, result in unintentional disclosure or misuse of confidential or proprietary information, damage our reputation, increase our costs and cause losses.
As a financial institution, our operations rely heavily on the secure data processing, storage and transmission of confidential and other information on our computer systems and networks. Any failure, interruption or breach in security or operational integrity of these systems could result in failures or disruptions in our online banking system, customer relationship management, general ledger, deposit and loan servicing and other systems. The security and integrity of our systems and the technology we use could be threatened by a variety of interruptions or information security breaches, including those caused by computer hacking, cyber-attacks, electronic fraudulent activity or attempted theft of financial assets. We may fail to promptly identify or adequately address any such failures, interruptions or security breaches if they do occur. While we have certain protective policies and procedures in place, the nature and sophistication of the threats continue to evolve. We may be required to expend significant additional resources in the future to modify and enhance our protective measures.
The nature of our business may make it an attractive target and potentially vulnerable to cyber-attacks, computer viruses, physical or electronic break-ins or similar disruptions. The technology-based platform we use
26
Table of Contents
processes sensitive data from our borrowers and investors. While we have taken steps to protect confidential information that we have access to, our security measures and the security measures employed by the owners of the technology in the platform that we use could be breached. Any accidental or willful security breaches or other unauthorized access to our systems could cause confidential customer, borrower and investor information to be stolen and used for criminal purposes. Security breaches or unauthorized access to confidential information could also expose us to liability related to the loss of the information, time-consuming and expensive litigation, and negative publicity. If security measures are breached because of third-party action, employee error, malfeasance or otherwise, or if design flaws in the technology-based platform that we use are exposed and exploited, our relationships with borrowers and investors could be severely damaged, and we could incur significant liability.
Because techniques used to sabotage or obtain unauthorized access to systems change frequently and generally are not recognized until they are launched against a target, we and our collaborators may be unable to anticipate these techniques or to implement adequate preventative measures. In addition, federal regulators and many federal and state laws and regulations require companies to notify individuals of data security breaches involving their personal data. These mandatory disclosures regarding a security breach are costly to implement and often lead to widespread negative publicity, which may cause customers, borrowers and investors to lose confidence in the effectiveness of our data security measures. Any security breach, whether actual or perceived, would harm our reputation, we could lose customers, borrowers, investors and partners and our business and operations could be adversely affected.
Additionally, we face the risk of operational disruption, failure, termination or capacity constraints of any of the third parties that facilitate our business activities, including exchanges, clearing agents, clearing houses or other financial intermediaries. Such parties could also be the source of an attack on, or breach of, our operational systems. Any failures, interruptions or security breaches in our information systems could damage our reputation, result in a loss of customer business, result in a violation of privacy or other laws, or expose us to civil litigation, regulatory fines or losses not covered by insurance.
Our business is dependent on the successful and uninterrupted functioning of our information technology and telecommunications systems and third-party providers. The failure of these systems, or the termination of a third-party software license or service agreement on which any of these systems is based, could interrupt our operations. Because our information technology and telecommunications systems interface with and depend on third-party systems, we could experience service denials if demand for such services exceeds capacity or such third-party systems fail or experience interruptions. If significant, sustained or repeated, a system failure or service denial could compromise our ability to operate effectively, damage our reputation, result in a loss of customer business, and/or subject us to additional regulatory scrutiny and possible financial liability, any of which could materially adversely affect our business, financial condition, results of operations and prospects, as well as the value of our common stock.
A return of recessionary conditions could result in increases in our level of nonperforming loans and/or reduce demand for our products and services, which could have a material adverse effect on our results of operations.
Like all financial institutions, we are subject to certain risks resulting from a weakened economy, such as increased charge-offs and levels of past-due loans and nonperforming assets. Although the U.S. economy has emerged from the severe recession that occurred from 2007 to 2009, economic growth has been slow and uneven, and unemployment levels remain elevated in many areas of the country. In addition, recovery by many businesses has been impaired by lower consumer spending. A return of prolonged deteriorating economic conditions could adversely affect the ability of our customers to repay their loans, the value of our investments, and our ongoing operations, costs and profitability. These events may cause us to incur losses and may materially adversely affect our business, results of operations and financial condition.
27
Table of Contents
Our loan portfolio mix, which includes owner-occupied commercial real estate loans, could result in increased credit risk in a challenging economy.
Our loan portfolio is concentrated in owner-occupied commercial real estate and owner-occupied commercial business loans. These types of loans generally are viewed as carrying more risk of default than residential real estate loans or certain other types of loans or investments. In fact, the FDIC has issued pronouncements alerting banks of its concern about heavy loan concentrations in certain types of commercial real estate loans, including acquisition, construction and development loans, and heavy loan concentrations in certain geographic segments. Because a portion of our loan portfolio is composed of these types of higher-risk loans, we face an increased risk of nonperforming loans that could result in a loss of earnings from these loans, an increase in the provision for loan losses, or an increase in loan charge-offs, any of which could have a material adverse impact on our business, results of operations and financial condition.
The current economic environment and any deterioration or downturn in the economies or real estate values in the markets we serve could have a material adverse effect on both borrowers’ ability to repay their loans and the value of the real property securing those loans. Our ability to recover on defaulted loans would then be diminished, and we would be more likely to suffer losses on defaulted loans. Any of these developments could materially adversely affect our business, financial condition, results of operations and prospects.
The fair value of our investment securities can fluctuate due to factors outside of our control.
As of March 31, 2015, the fair value of our investment securities portfolio was approximately $51 million. Factors beyond our control can significantly influence the fair value of securities in our portfolio and can cause potential adverse changes to the fair value of these securities. These factors include, but are not limited to, rating agency actions in respect of the securities, defaults by the issuer or with respect to the underlying securities, monetary tapering actions by the Federal Reserve, and changes in market interest rates and continued instability in the capital markets. Any of these factors, among others, could cause other-than-temporary impairments and realized or unrealized losses in future periods and declines in other comprehensive income, which could materially and adversely affect our business, results of operations, financial condition and prospects, as well as the value of our common stock. The process for determining whether impairment of a security is other-than-temporary usually requires complex, subjective judgments about the future financial performance and liquidity of the issuer and any collateral underlying the security in order to assess the probability of receiving all contractual principal and interest payments on the security. Our inability to accurately predict the future performance of an issuer or to efficiently respond to changing market conditions could result in a decline in the value of our investment securities portfolio, which could have a material and adverse effect on our business, results of operations and financial condition.
Our allowance for loan losses may prove to be insufficient to cover actual loan losses, which could have a material adverse effect on our financial condition and results of operations.
Our future success depends to a significant extent upon the quality of our assets, particularly loans. In originating loans, there is a substantial likelihood that we will experience credit losses. The risk of loss will vary with, among other things, general economic conditions, including the current economic environment and real estate market, the type of loan, the creditworthiness of the borrower over the term of the loan, and, in the case of a collateralized loan, the quality of the collateral for the loan.
Our loan customers may not repay their loans according to the terms of these loans, and the collateral securing the payment of these loans may be insufficient to assure repayment. As a result, we may experience significant loan losses, which could have a material adverse effect on our operating results. Our management makes various assumptions and judgments about the collectability of our loan portfolio, including the creditworthiness of our borrowers and the value of the real estate and other assets serving as collateral for the repayment of many of our
28
Table of Contents
loans. We maintain an allowance for loan losses in an attempt to cover any loan losses that may occur. In determining the size of the allowance, we rely on an analysis of our loan portfolio based on historical loss experience, volume and types of loans, trends in classification, volume and trends in delinquencies and non-accruals, national and local economic conditions, and other pertinent information.
If our assumptions are wrong, our current allowance may not be sufficient to cover future loan losses, and we may need to make adjustments to allow for different economic conditions or adverse developments in our loan portfolio. Material additions to our allowance in the form of provisions for loan losses would materially decrease our net income. We expect our allowance to continue to fluctuate; however, given current and future market conditions, our allowance may not be adequate to cover future loan losses.
In addition, federal and state regulators periodically review our allowance for loan losses and may require us to increase our provision for loan losses or recognize further loan charge-offs, based on judgments different than those of our management. Any increase in our allowance for loan losses or loan charge-offs as required by these regulators could have a negative effect on our operating results and could materially adversely affect our business, results of operations and financial condition.
The valuation of our servicing rights is based on estimates and subject to fluctuation based on market conditions and other factors that are beyond our control.
The fair value of our servicing rights is estimated based upon projections of expected future cash flows generated by the loans we service, historical prepayment rates, future prepayment estimates, portfolio characteristics, interest rates based on interest rate yield curves, volatility, market demand for servicing rights and other factors. While this evaluation process uses historical and other objective information, the valuation of our servicing rights is ultimately an estimate based on our experience, judgment and expectations regarding our servicing portfolio and the broader market. This is an inherently uncertain process and the value of our servicing rights may be adversely impacted by factors that are beyond our control, which may in turn have a material adverse effect on our business, results of operations and financial condition.
We anticipate that going forward we will experience increasing growth in our held for sale loan portfolio due to our increasing construction portfolio or strategic business decisions related to the timing of the sale of loans.
Our revenue model has historically been driven by selling loans, or a portion of the loans, that we originate in the secondary market when fully funded. The growth of our construction portfolio will result in a decrease in the volume of loans sold relative to production in any period, which, in turn, decreases our revenue relative to production in any period. Growth in our held for sale portfolio also exposes us to increased interest rate risk.
We are subject to liquidity risk in our operations.
Liquidity risk is the possibility of being unable, at a reasonable cost and within acceptable risk tolerances, to pay obligations as they come due, to capitalize on growth opportunities as they arise, or to pay regular dividends because of an inability to liquidate assets or obtain adequate funding on a timely basis. Liquidity is required to fund various obligations, including credit obligations to borrowers, loan originations, withdrawals by depositors, repayment of debt, dividends to shareholders, operating expenses, and capital expenditures. Our liquidity is derived primarily from the sale of loans in the secondary market, retail deposit growth and retention, principal and interest payments on loans and investment securities, net cash provided from operations, and access to other funding sources. Historically, we have relied on brokered and Internet funds as a large portion of our deposit base. Our access to funding sources in amounts adequate to finance our activities or at a reasonable cost could be impaired by factors that affect us specifically or the financial services industry in general. Factors that could adversely affect our access to liquidity sources include a decrease in the level of our business activity due to a market downturn, our lack of access to a traditional branch banking network designed to generate core deposits
29
Table of Contents
and adverse regulatory action against us. Our ability to borrow could also be impaired by factors that are not specific to us, such as a severe disruption in the financial markets or negative views and expectations about the prospects for the financial services industry as a whole. Our access to borrowed funds could become limited in the future, and we may be required to pay above market rates for additional borrowed funds, if we are able to obtain them at all, which may adversely affect our business, results of operations and financial condition.
The amount of other real estate owned, or OREO, may increase significantly, resulting in additional losses, and costs and expenses that will negatively affect our operations.
In connection with our banking business, we take title to real estate collateral from time to time through foreclosure or otherwise in connection with efforts to collect debts previously contracted. Such real estate is referred to as other real estate owned, or OREO. As the amount of OREO increases, our losses, and the costs and expenses to maintain the real estate, likewise increase. The amount of OREO we hold may increase due to various economic conditions or other factors. Any additional increase in losses and maintenance costs and expenses due to OREO may have material adverse effects on our business, financial condition, and results of operations. Such effects may be particularly pronounced in a market of reduced real estate values and excess inventory, which may make the disposition of OREO properties more difficult, increase maintenance costs and expenses, and reduce our ultimate realization from any OREO sales. In addition, at the time of acquisition of the OREO we are required to reflect its fair market value in our financial statements. If the OREO declines in value subsequent to its acquisition, we are required to recognize a loss. As a result, declines in the value of our OREO will have a negative effect on our business, results of operations and financial condition. As of March 31, 2015, we had two OREO properties with an aggregate carrying value of $34 thousand. For more information about amounts held in OREO, see Note 9 to our audited consolidated financial statements as of and for the year ended December 31, 2014 included elsewhere in this prospectus.
We are subject to environmental liability risk associated with our lending activities.
A significant portion of our loan portfolio is secured by real property. During the ordinary course of business, we may foreclose on and take title to properties securing certain loans. In doing so, there is a risk that hazardous or toxic substances could be found on these properties. If hazardous or toxic substances are found, we may be liable for remediation costs, as well as for personal injury and property damage. Environmental laws may require us to incur substantial expenses and may materially reduce the affected property’s value or limit our ability to use or sell the affected property. In addition, future laws or more stringent interpretations or enforcement policies with respect to existing laws may increase our exposure to environmental liability. The remediation costs and any other financial liabilities associated with an environmental hazard could have a material adverse effect on our business, results of operations and financial condition.
Our use of appraisals in deciding whether to make a loan secured by real property or how to value the loan in the future may not accurately describe the net value of the collateral that we can realize.
In considering whether to make a loan secured by real property, we generally require an appraisal of the property. However, an appraisal is only an estimate of the value of the property at the time the appraisal is made, and, as real estate values may experience changes in value in relatively short periods of time, especially given heightened economic uncertainty, this estimate might not accurately describe the net value of the real property collateral after the loan has been closed. If the appraisal does not reflect the amount that may be obtained upon any sale or foreclosure of the property, we may not realize an amount equal to the indebtedness secured by the property. In addition, we rely on appraisals and other valuation techniques to establish the value of our OREO and to determine certain loan impairments. If any of these valuations are inaccurate, our consolidated financial statements may not reflect the correct value of OREO, and our ALLL may not reflect accurate loan impairments. The valuation of the properties securing the loans in our portfolio may negatively impact the continuing value of those loans and could materially adversely affect our business, results of operations and financial condition.
30
Table of Contents
We could be subject to losses, regulatory action or reputational harm due to fraudulent and negligent acts on the part of loan applicants, our borrowers, our employees and vendors.
In deciding whether to extend credit or enter into other transactions with clients and counterparties, we may rely on information furnished by or on behalf of clients and counterparties, including financial statements, property appraisals, title information, employment and income documentation, account information and other financial information. We may also rely on representations of clients and counterparties as to the accuracy and completeness of such information and, with respect to financial statements, on reports of independent auditors. Any such misrepresentation or incorrect or incomplete information may not be detected prior to funding a loan or during our ongoing monitoring of outstanding loans. In addition, one or more of our employees or vendors could cause a significant operational breakdown or failure, either as a result of human error or where an individual purposefully sabotages or fraudulently manipulates our loan documentation, operations or systems. Any of these developments could have a material adverse effect on our business, results of operations and financial condition.
We may fail to realize all of the anticipated benefits, including estimated cost savings, of potential future acquisitions.
In the future, we may encounter difficulties in obtaining required regulatory approvals or unexpected contingent liabilities from businesses we may acquire. Integration of an acquired business can be complex and costly, sometimes including combining relevant accounting and data processing systems and management controls, as well as managing relevant relationships with employees, clients, suppliers and other business partners. Integration efforts could divert management attention and resources, which could adversely affect our business, results of operations and financial condition. Additionally, given continued market volatility and uncertainty, we may also experience increased credit costs or need to take additional markdowns and allowances for loan losses on assets and loans we may acquire. These increased credit costs, markdowns and allowances could materially adversely affect our financial condition and results of operations, as well as the value of our common stock.
Implementation of our growth strategy depends, in part, on our ability to successfully identify acquisition opportunities and strategic partners that will complement our operating philosophy, and also on the successful integration of their operations with our own. To successfully acquire target companies or establish complimentary lines of business, we must be able to correctly identify profitable or growing markets, as well as attract the necessary relationships and high caliber banking personnel to make these new business lines profitable. In addition, we may not be able to identify suitable opportunities for further growth and expansion. As consolidation of the financial services industry continues, the competition for suitable acquisition candidates may increase. We will compete with other financial services companies for acquisition opportunities, and many of these competitors have greater financial resources than we do and may be able to pay more for an acquisition than we are able or willing to pay. If we are unable to effectively implement our growth strategies, our business, results of operations and financial condition may be materially and adversely affected.
Changes in the interest rate environment could reduce our net interest income, which could reduce our profitability.
As a financial institution, our earnings depend on our net interest income, which is the difference between the interest income that we earn on interest-earning assets, such as investment securities and loans, and the interest expense that we pay on interest-bearing liabilities, such as deposits and borrowings. Additionally, changes in interest rates affect the premiums we may receive in connection with the sale of SBA 7(a) loans in the secondary market, pre-payment speeds of loans for which we own servicing rights, our ability to fund our operations with customer deposits, and the fair value of securities in our investment portfolio. Therefore, any change in general market interest rates, including changes in federal fiscal and monetary policies, affects us more than non-financial companies and can have a significant effect on our net interest income and results of operations. Our assets and liabilities may react differently to changes in overall market rates or conditions because there may be
31
Table of Contents
mismatches between the repricing or maturity characteristics of the assets and liabilities. As a result, an increase or decrease in market interest rates could have material adverse effects on our net interest margin, noninterest income, and results of operations. Further, since we began originating loans in May 2007 we have operated in a period of low market interest rates. In a rising interest rate environment, potential borrowers could seek to defer loans as they wait for interest rates to settle, and borrowers of variable rate loans may be subject to increased interest rates, which could result in a greater rate of default. Rising interest rates may also present additional challenges to our business that we have not anticipated.
We face strong competition from larger, more established competitors.
The banking business is highly competitive, and we experience strong competition from many other financial institutions, including some of the largest commercial banks headquartered in the country, all of which have small business lending divisions, as well as other federally and state chartered financial institutions such as community banks and credit unions, finance and business development companies, peer-to-peer and marketplace lenders and other non-bank lenders.
We compete with these institutions both in attracting deposits and in making loans, primarily on the basis of the interest rates we pay and yield on these products. Many of our competitors are well-established, much larger financial institutions. While we believe we can and do successfully compete with these other financial institutions in our industry verticals, we may face a competitive disadvantage as a result of our smaller size. Furthermore, nothing would prevent our competitors from developing or licensing a technology-based platform similar to the technology-based platform we currently use in our business. In addition, many of our non-bank competitors have fewer regulatory constraints and may have lower cost structures. We expect competition to continue to intensify due to financial institution consolidation, legislative, regulatory and technological changes, and the emergence of alternative banking sources.
Our ability to compete successfully will depend on a number of factors, including, among other things:
| • | our ability to build and maintain long-term customer relationships while ensuring high ethical standards and safe and sound banking practices; |
| • | the scope, relevance and pricing of products and services that we offer; |
| • | customer satisfaction with our products and services; |
| • | industry and general economic trends; and |
| • | our ability to keep pace with technological advances and to invest in new technology. |
Increased competition could require us to increase the rates we pay on deposits or lower the rates we offer on loans, which could reduce our profitability. Our failure to compete effectively in our primary markets could cause us to lose market share and could have a material adverse effect our business, results of operations and financial condition.
Prior to August 3, 2014, we were taxed as an S corporation under the Internal Revenue Code, and claims of taxing authorities related to our prior status as an S corporation could harm us.
We voluntarily terminated our S corporation status effective as of August 3, 2014, and we are now treated as a C corporation under the income tax provisions of the Internal Revenue Code of 1986, as amended, which is applicable to most corporations and imposes income tax on the corporation as an entity that is separate and distinct from its shareholders. If the open tax years in which we were an S corporation are audited by the Internal Revenue Service, and we are determined not to have qualified for, or to have violated, our S corporation status, we will be obligated to pay back taxes, interest and penalties, and we do not have the right to reclaim tax distributions that we have made to our shareholders during those periods. These amounts could include federal, state and any local taxes on all of our taxable income while we were an S corporation. Any such claims could result in additional costs to us and could have a material adverse effect on our business, results of operations and financial condition.
32
Table of Contents
Our loan portfolio may be affected by deterioration in real estate markets, including declines in the performance of loans.
Deterioration in real estate markets could result in declining prices and excess inventories. As a result, developers may experience financial deterioration and banking institutions may experience declines in the performance of construction, development and commercial loans. We make credit and reserve decisions based on the current conditions of borrowers or projects combined with our expectations for the future. If conditions are worse than forecast, we could experience higher charge-offs and delinquencies than is provided in the allowance for loan losses, which could materially adversely affect our business, results of operations and financial condition.
A prolonged U.S. government shutdown or default by the U.S. on government obligations would harm our results of operations.
Our results of operations, including revenue, non-interest income, expenses and net interest income, would be adversely affected in the event of widespread financial and business disruption on account of a default by the United States on U.S. government obligations or a prolonged failure to maintain significant U.S. government operations, particularly those pertaining to the SBA or the FDIC. Any such failure to maintain such U.S. government operations would impede our ability to originate SBA loans or our ability to sell such loans in the secondary market, which would materially adversely affect our business, results of operations and financial condition.
Deterioration in the fiscal position of the U.S. federal government and downgrades in U.S. Treasury and federal agency securities could adversely affect us and our subsidiary’s banking operations.
The long-term outlook for the fiscal position of the U.S. federal government is uncertain, as illustrated by the 2011 downgrade by certain rating agencies of the credit rating of the U.S. government and federal agencies. In addition to causing economic and financial market disruptions, any future downgrade, failure to raise the U.S. statutory debt limit, or deterioration in the fiscal outlook of the U.S. federal government, could, among other things, materially adversely affect the market value of the U.S. government and federal agency securities that we hold, the availability of those securities as collateral for borrowing, and our ability to access capital markets on favorable terms. In particular, it could increase interest rates and disrupt payment systems, money markets, and long-term or short-term fixed income markets, adversely affecting the cost and availability of funding, which could negatively affect our profitability. Also, the adverse consequences could extend to those to whom we extend credit and could adversely affect their ability to repay their loans. Any of these developments could materially adversely affect our business, results of operations and financial condition.
Deterioration in the commercial soundness of our counterparties could adversely affect us.
Our ability to engage in routine funding transactions could be adversely affected by the actions and commercial soundness of other financial institutions. Financial services institutions are interrelated as a result of trading, clearing, counterparty or other relationships, and we routinely execute transactions with counterparties in the financial industry. As a result, defaults by, or even rumors or questions about, one or more financial services institutions, or the financial services industry generally, could create another market-wide liquidity crisis similar to that experienced in late 2008 and early 2009 and could lead to losses or defaults by us or by other institutions. The deterioration or failure of our counterparties would have a material adverse effect on our business, results of operations and financial condition.
33
Table of Contents
We have different lending risks than larger, more diversified banks.
Our ability to diversify our economic risks is limited. We lend primarily to small businesses in selected industries, which may expose us to greater lending risks than those of banks lending to larger, better-capitalized businesses with longer operating histories. Small businesses generally have fewer financial resources in terms of capital or borrowing capacity than larger entities and may have limited operating histories. If economic conditions negatively impact the verticals in which we operate, our business, results of operations and financial condition may be adversely affected.
We attempt to manage our credit exposure through careful monitoring of loan applicants and through loan approval and review procedures. We have established an evaluation process designed to determine the adequacy of our allowance for loan losses. While this evaluation process uses historical and other objective information, the classification of loans and the establishment of loan losses is an estimate based on experience, judgment and expectations regarding our borrowers, and the economies in which we and our borrowers operate, as well as the judgment of our regulators. This is an inherently uncertain process, and our loan loss reserves may not be sufficient to absorb future loan losses or prevent a material adverse effect on our business, results of operations and financial condition.
We rely heavily on our management team and the unexpected loss of any of those personnel could adversely affect our operations; we depend on our ability to attract and retain key personnel.
We are a customer-focused and relationship-driven organization. We expect our future growth to be driven in a large part by the relationships maintained with our customers by our chief executive officer, president, and other senior officers. The unexpected loss of any of our key employees could have an adverse effect on our business, results of operations and financial condition. The implementation of our business strategy will also require us to continue to attract, hire, motivate and retain skilled personnel to develop new customer relationships as well as new financial products and services. We are not party to non-compete or non-solicitation agreements with any of our officers or employees. The market for qualified employees in the businesses in which we operate is competitive, and we may not be successful in attracting, hiring or retaining key personnel. Our inability to attract, hire or retain key personnel could have a material adverse effect on our business, results of operations and financial condition.
Our risk management framework may not be effective in mitigating risks and/or losses to us.
We have implemented a risk management framework to manage our risk exposure. This framework is comprised of various processes, systems and strategies, and is designed to manage the types of risk to which we are subject, including, among others, credit, market, liquidity, interest rate and compliance risks. Our framework also includes financial and other modeling methodologies which involve management assumptions and judgment. Our risk management framework may not be effective under all circumstances and it may fail to adequately mitigate risk or loss to us. If our framework is not effective, we could suffer unexpected losses and be subject to potentially adverse regulatory consequences, and our business, results of operations and financial condition could be materially and adversely affected.
Hurricanes or other adverse weather events could disrupt our operations, which could have an adverse effect on our business or results of operations.
North Carolina’s coastal region is affected, from time to time, by adverse weather events, particularly hurricanes. We cannot predict whether, or to what extent, damage caused by future hurricanes or other weather events will affect our operations. Weather events could cause a disruption in our day-to-day business activities and could have a material adverse effect on our business, results of operations and financial condition.
Outbreaks of avian disease, such as avian influenza, or the perception that outbreaks may occur, could have a material adverse effect on lending operations in our Poultry Agriculture vertical.
Pandemic events beyond our control, such as an outbreak of avian disease, or “bird flu,” could have a material adverse effect on the performance of our portfolio of loans in our Poultry Agriculture vertical and on the demand
34
Table of Contents
for new loans in this vertical. An outbreak of disease could result in governmental restrictions on the import and export of fresh and frozen chicken or other poultry products to or from our customers. This could result in the cancellation of orders and the curtailment of farming operations by our customers and could create adverse publicity that may have a material adverse effect on the performance of our existing loans and future business prospects in our Poultry Agriculture vertical. In addition, consumer fears about avian disease have, in the past, depressed demand for fresh poultry, which may adversely impact the demand for future loans and the performance of existing loans in our Poultry Agriculture vertical.
If we fail to maintain an effective system of internal control over financial reporting, we may not be able to accurately report our financial results. As a result, current and potential shareholders could lose confidence in our financial reporting which would harm our business and the trading price of our securities.
If we identify material weaknesses in our internal control over financial reporting or are otherwise required to restate our financial statements, we could be required to implement expensive and time-consuming remedial measures and could lose investor confidence in the accuracy and completeness of our financial reports. We may also face regulatory enforcement or other actions, including the potential delisting of our securities from NASDAQ. This could have a material adverse effect on our business, financial condition and results of operations, and could subject us to litigation.
Changes in accounting standards and management’s selection of accounting methods, including assumptions and estimates, could materially impact our financial statements.
From time to time the SEC and the Financial Accounting Standards Board, or FASB, change the financial accounting and reporting standards that govern the preparation of our financial statements. These changes can be hard to predict and can materially impact how we record and report our financial condition and results of operations. In some cases, we could be required to apply a new or revised standard retroactively, resulting in changes to previously reported financial results, or a cumulative charge to retained earnings. In addition, management is required to use certain assumptions and estimates in preparing our financial statements, including determining the fair value of certain assets and liabilities, among other items. If the assumptions or estimates are incorrect, we may experience unexpected material adverse consequences that could negatively affect our business, results of operations and financial condition.
Our business reputation is important and any damage to it could have a material adverse effect on our business.
Our reputation is very important to sustain our business, as we rely on our relationships with our current, former and potential clients and shareholders, and the industries that we serve. Any damage to our reputation, whether arising from legal, regulatory, supervisory or enforcement actions, matters affecting our financial reporting or compliance with SEC and exchange listing requirements, negative publicity, the conduct of our business or otherwise could have a material adverse effect on our business.
Insiders have substantial control over us, and this control may limit our shareholders’ ability to influence corporate matters and may delay or prevent a third party from acquiring control over us.
As of June 30, 2015, our directors and executive officers and their related entities currently beneficially own, in the aggregate, approximately 34.6% of our outstanding common stock. Further, we anticipate that our directors and executive officers and their related entities will beneficially own an aggregate of approximately 30.3% of our common stock following this offering (without giving effect to the exercise of the overallotment option granted to the underwriters and without giving effect to any potential purchases in this offering by these individuals). The significant concentration of stock ownership may adversely affect the trading price of our common stock due to investors’ perception that conflicts of interest may exist or arise. In addition, these shareholders will be able to exercise influence over all matters requiring shareholder approval, including the election of directors and approval of corporate transactions, such as a merger or other sale of our company or its assets. This concentration of ownership could limit your ability to influence corporate matters and
35
Table of Contents
may have the effect of delaying or preventing a change in control, including a merger, consolidation or other business combination involving us, or discouraging a potential acquirer from making a tender offer or otherwise attempting to obtain control, even if that change in control would benefit our other shareholders. For information regarding the ownership of our outstanding stock by our executive officers and directors and their affiliates, see the section titled “Principal Shareholders.”
The recognition of gains on the sale of loans contains certain assumptions.
Gains on the sale of loans comprise a significant component of our revenue. Noncash gains recognized in the quarters ended March 31, 2015 and 2014 and the years ended December 31, 2014, 2013 and 2012 were $1.3 million, $848 thousand, $3.5 million, $3.3 million and $3.8 million, respectively. The determination of these noncash gains is based on assumptions regarding the value of unguaranteed loans retained, servicing rights retained and deferred fees and costs. The value of retained unguaranteed loans and servicing rights are determined by our wholly owned subsidiary, GLS, which applies market derived factors such as prepayment rates, current market conditions and recent loan sales to arrive at valuations. Deferred fees and costs are determined using internal analysis of the cost to originate loans. Significant errors in assumptions used to compute gains on sale of loans could result in material revenue misstatements, which may have a material adverse effect on our business, results of operations and profitability. In addition, while we believe that the valuations provided by GLS are at arm’s length and reflect fair value, and are subject to validation by an independent third party on an annual basis, if such valuations are not reflective of fair market value, then our business, results of operations and financial condition may materially and adversely affected.
Risks Related to Our Regulatory Environment
We are subject to extensive regulation that could limit or restrict our activities.
We operate in a highly regulated industry and are subject to examination, supervision, and comprehensive regulation by various federal and state regulatory agencies. Our compliance with these regulations is costly and restricts certain of our activities, including the declaration and payment of cash dividends to shareholders, mergers and acquisitions, investments, loans and interest rates charged, interest rates paid on deposits, and locations of offices. We are also subject to capitalization guidelines established by our regulators, which require us to maintain adequate capital to support our growth and operations. Should we fail to comply with these regulatory requirements, federal and state regulators could impose additional restrictions on the activities of the Company and the Bank, which could materially and adversely affect our business, results of operations and financial condition.
The laws and regulations applicable to the banking industry have recently changed and may continue to change, and we cannot predict the effects of these changes on our business and profitability. Because government regulation greatly affects the business and financial results of all commercial banks and bank holding companies, our cost of compliance could adversely affect our business, results of operations and financial condition.
The Dodd-Frank Wall Street Reform and Consumer Protection Act, or the Dodd-Frank Act, was enacted on July 21, 2010. The provisions of the Dodd-Frank Act, and its implementing regulations may materially and adversely affect our business, results of operations and financial condition. Some or all of the changes, including the new rulemaking authority granted to the Consumer Financial Protection Bureau, or the CFPB, may result in greater liability, reporting requirements, assessment fees, operational restrictions, capital requirements, and other regulatory burdens applicable to us, and many of our non-bank competitors may remain free from such limitations. Institutions with over $10 billion in assets, unlike us, will also be subject to the CFPB’s supervisory and examination authority. The changes arising out of the Dodd-Frank Act could adversely affect our ability to attract and maintain depositors, to offer competitive products and services, and to expand our business.
Congress may consider additional proposals to change substantially the financial institution regulatory system and to expand or contract the powers of banking institutions and bank holding companies. Such legislation may change existing banking statutes and regulations, as well as our current operating environment significantly. If
36
Table of Contents
enacted, such legislation could increase or decrease the cost of doing business, limit or expand our permissible activities, or affect the competitive balance among banks, savings associations, credit unions, and other financial institutions. We cannot predict whether new legislation will be enacted and, if enacted, the effect that it, or any regulations, would have on our business, financial condition, or results of operations.
Our financial condition and results of operations are affected by credit policies of monetary authorities, particularly the Federal Reserve. Actions by monetary and fiscal authorities, including the Federal Reserve, could have an adverse effect on our deposit levels, loan demand, or business and earnings, as well as the value of the common stock.
We may be required to raise additional capital in the future, including to comply with new increased minimum capital thresholds established by our regulators as part of their implementation of Basel III, but that capital may not be available when it is needed and could be dilutive to our existing shareholders, which could adversely affect our financial condition and results of operations.
In July 2013, the Federal Reserve, FDIC and Office of the Comptroller of the Currency approved final rules that establish an integrated regulatory capital framework that addresses shortcomings in certain capital requirements. The rules implement in the United States the Basel III regulatory capital reforms from the Basel Committee on Banking Supervision and certain changes required by the Dodd-Frank Act.
The major provisions of the new rule applicable to us and the Bank are:
| • | The new rules implement higher minimum capital requirements, including a new common equity Tier 1 capital requirement, and establish criteria that instruments must meet in order to be considered common equity Tier 1 capital, additional Tier 1 capital, or Tier 2 capital. These enhancements both improve the quality and increase the quantity of capital required to be held by banking organizations, better equipping the U.S. banking system to deal with adverse economic conditions. The new minimum capital to risk-weighted assets, or RWA, requirements are a common equity Tier 1 capital ratio of 4.5% and a Tier 1 capital ratio of 6.0%, which is an increase from 4.0 %, and a total capital ratio that remains at 8.0 %. The minimum leverage ratio (Tier 1 capital to total consolidated assets) is 4.0%. The new rules maintain the general structure of the current prompt corrective action, or PCA, framework while incorporating increased minimum requirements. |
| • | Among the most important changes to the definition of capital are stricter eligibility criteria for regulatory capital instruments that disallow the inclusion of instruments such as trust preferred securities in Tier 1 capital going forward, and new constraints on the inclusion of minority interests, deferred tax assets, or DTAs, mortgage-servicing assets, or MSAs and certain investments in the capital of unconsolidated financial institutions. The new rules also affect the inclusion of mortgage servicing assets, or MSAs, as an element of capital. Specifically, MSAs are limited to 10% of a bank’s common equity Tier 1 capital and the combined balance of MSAs, deferred tax assets, and investments in the common stock of unconsolidated financial institutions is limited to 15% of a bank’s common equity Tier 1 capital. These combined assets must be deducted from common equity to the extent that they exceed the 15% threshold. Any portion of a bank’s MSAs that are not deducted from the calculation of common equity Tier 1 will be subject to a 100% risk weight that will increase to 250% in 2018. In addition, the new rules require that most regulatory capital deductions be made from common equity Tier 1 capital. |
| • | Under the new rules, in order to avoid limitations on capital distributions, including dividend payments and certain discretionary bonus payments to executive officers, a banking organization must hold a capital conservation buffer composed of common equity Tier 1 capital above its minimum risk-based capital requirements. This buffer will help to ensure that banking organizations conserve capital when it is most needed, allowing them to better weather periods of economic stress. The buffer is measured relative to RWA. Phase-in of the capital conservation buffer requirements, and corresponding limits on capital distributions and discretionary bonus payments, will begin on January 1, 2016. After the capital conservation buffer is fully phased in, a banking organization with a buffer greater than 2.5% would not be |
37
Table of Contents
| subject to limits on capital distributions or discretionary bonus payments; however, a banking organization with a buffer of less than 2.5% would be subject to increasingly stringent limitations as the buffer approaches zero. When the capital conservation buffer is fully phased in, it would prohibit a banking organization from making distributions or discretionary bonus payments during any quarter if its eligible retained income is negative in that quarter and its capital conservation buffer ratio was less than 2.5% at the beginning of the quarter. When the capital conservation buffer is fully phased in, the minimum capital requirements plus the capital conservation buffer will exceed the PCA well-capitalized thresholds. |
| • | The new rules also increase the risk weights for past-due loans, certain commercial real estate loans, and some equity exposures, and make selected other changes in risk weights and credit conversion factors. |
We and the Bank were required to comply with the new capital rules beginning on January 1, 2015.
In order to support the operations at the Bank, we may need to raise capital in the future. Our ability to raise capital, if needed, will depend in part on conditions in the capital markets at that time, which are outside our control.
Accordingly, we may be unable to raise capital, if needed, on terms acceptable to us if at all. If we cannot raise capital when needed, our ability to operate or further expand our operations could be materially impaired. In addition, if we decide to raise equity capital under such conditions, the interests of our shareholders could be diluted.
Our deposit operations are subject to extensive regulation and we expect additional regulatory requirements to be implemented in the future.
We are subject to significant anti-money laundering, “know your customer” and other regulations under applicable law, including the Bank Secrecy Act and the USA Patriot Act, and we could become subject in the future to additional regulatory requirements beyond those that are currently adopted, proposed or contemplated. We expect that federal and state bank regulators will increase their oversight, inspection and investigatory role over our deposit operations and the financial services industry generally. Furthermore, we intend to increase our deposit product offerings and grow our customer deposit portfolio in the future and, as a result, we are, and will continue to be, subject to heightened compliance and operating costs that could adversely affect our business, results of operations and financial condition. In addition, legal and regulatory proceedings and other contingencies will arise from time to time that may have an adverse effect on our business practices and results of operations.
The FDIC Deposit Insurance assessments that we are required to pay may continue to materially increase in the future, which would have an adverse effect on our earnings.
As a member institution of the FDIC, we are assessed a quarterly deposit insurance premium. Failed banks nationwide have significantly depleted the insurance fund and reduced the ratio of reserves to insured deposits. As a result, we may be required to pay significantly higher premiums or additional special assessments that could adversely affect our business, results of operations and financial condition.
On October 19, 2010, the FDIC adopted a Deposit Insurance Fund, or DIF, Restoration Plan, which requires the DIF to attain a 1.35% reserve ratio by September 30, 2020. The Dodd-Frank Act directs the FDIC to “offset the effect” of the increased reserve ratio for insured depository institutions with total consolidated assets of less than $10 billion. In addition, the FDIC modified the method by which assessments are determined and, effective April 1, 2011, adjusted assessment rates, which will range from 2.5 to 45 basis points (annualized), subject to adjustments for unsecured debt and, in the case of small institutions outside the lowest risk category and certain large and highly complex institutions, brokered deposits. Further increased FDIC assessment premiums, due to our risk classification, emergency assessments, or implementation of the modified DIF reserve ratio, could have a material adverse effect on our business, results of operations and financial condition.
38
Table of Contents
Risks Related to this Offering and our Common Stock
An active, liquid, and orderly market for our common stock may not develop and the market price of our common stock may be subject to substantial fluctuations, which may make it difficult for you to sell your shares at the volume, prices and times desired.
Prior to this offering, there was no market for shares of our common stock. An active trading market for our common stock might never develop or be sustained, which could depress the market price of our common stock and affect your ability to sell our shares. The initial public offering price was determined through negotiations between us and the representative of the underwriters and might bear no relationship to the price at which our common stock will trade following the completion of this offering. The trading price of our common stock following this offering is likely to be highly volatile and could be subject to wide fluctuations in response to various factors, some of which may be beyond our control. These factors include:
| • | our operating performance and the operating performance of similar companies; |
| • | the overall performance of the equity markets; |
| • | prevailing interest rates; |
| • | economic, financial, geopolitical, regulatory or judicial events affecting us or the financial markets generally; |
| • | the market for similar securities; |
| • | announcements by us or our competitors of acquisitions, business plans, or commercial relationships; |
| • | threatened or actual litigation; |
| • | any major change in our board of directors or management; |
| • | publication of research reports or news stories about us, our competitors, or our industry, or positive or negative recommendations or withdrawal of research coverage by securities analysts; |
| • | whether we declare dividends on our common stock from time to time; |
| • | our creditworthiness; |
| • | the ratings given to our securities by credit rating agencies, if any; |
| • | large volumes of sales of our shares of common stock by existing shareholders; and |
| • | general political and economic conditions. |
In addition, the stock market in general, and the market for banks and financial services companies in particular, has experienced extreme price and volume fluctuations that have often been unrelated or disproportionate to the operating performance of those companies. These fluctuations might be even more pronounced in the trading market for our stock shortly following this offering. Securities class action litigation has often been instituted against companies following periods of volatility in the overall market and in the market price of a company’s securities. This litigation, if instituted against us, could result in substantial costs, divert our management’s attention and resources, and harm our business, operating results, and financial condition.
Additional expenses following the offering from operating as a public company will adversely affect our profitability.
Following the offering, our noninterest expenses will increase as a result of the additional accounting, legal and various other additional expenses usually associated with operating as a public company and complying with public company disclosure obligations, particularly those obligations imposed by the Sarbanes-Oxley Act of 2002 and the Dodd-Frank Act.
39
Table of Contents
We are an “emerging growth company,” and the reduced reporting requirements applicable to emerging growth companies may make our common stock less attractive to investors.
We are an “emerging growth company,” as defined in the federal securities laws. For as long as we continue to be an emerging growth company, we may take advantage of exemptions from various reporting requirements that are applicable to other public companies that are not emerging growth companies, including reduced disclosure obligations regarding executive compensation in our periodic reports and proxy statements and exemptions from the requirements of holding a nonbinding advisory vote on executive compensation and shareholder approval of any golden parachute payments not previously approved. We could be an emerging growth company for up to five years, although we could lose that status sooner if our gross revenues exceed $1.0 billion, if we issue more than $1.0 billion in non-convertible debt in a three-year period, or if the market value of our common stock held by non-affiliates exceeds $700 million as of any June 30 before that time, in which case we would no longer be an emerging growth company as of the following December 31. We cannot predict if investors will find our common stock less attractive because we may rely on these exemptions, or if we choose to rely on additional exemptions in the future. If some investors find our common stock less attractive as a result, there may be a less active trading market for our common stock and our stock price may be more volatile.
We have broad discretion in the use of the net proceeds from this offering, and our use of those proceeds may not yield a favorable return on your investment.
We expect to use the net proceeds of this offering to support our long-term growth by enhancing our capital ratios to permit growth initiatives and for general working capital, which may include, among other things, funding growth in our existing industry verticals, expansion into new industry verticals, development of a new online lending platform for originating loans less than $350 thousand, increasing our capital to allow for the retention of more of the loans that we originate in order to increase our on balance sheet earning assets, and for general corporate purposes, including for possible acquisitions of, or investments in, bank or permissible non-bank entities. Our management has broad discretion over how these proceeds are used and could spend the proceeds in ways with which you may not agree. In addition, we may fail to use the proceeds of this offering effectively or in a manner that increases our market value or enhances our profitability. We have not established a timetable for the effective deployment of the proceeds, and we cannot predict how long it will take to deploy the proceeds. Investing the offering proceeds in securities until we are able to deploy the proceeds will provide lower margins than we generally earn on loans, potentially adversely affecting our business, results of operations and financial condition.
You will experience immediate and substantial dilution.
The initial public offering price will be substantially higher than the net tangible book value of each outstanding share of common stock immediately after this offering. If you purchase common stock in this offering, you will suffer immediate and substantial dilution. At the assumed initial public offering price of $17.00 per share, which is the midpoint of the estimated price range set forth on the cover page of this prospectus with net proceeds to us of $62.9 million, after deducting underwriting discounts and commissions and estimated offering expenses, investors who purchase shares in this offering from us will have contributed approximately 39.9% of the total amount of funding we have received to date, but the shares purchased from us in this offering will represent only approximately 14.3% of the total voting rights. The dilution will be $12.00 per share in the net tangible book value of the common stock from the assumed initial public offering price. In addition, if outstanding options or warrants to purchase shares of our common stock are exercised, there could be further dilution. For more information refer to “Dilution.”
Securities analysts may not initiate or continue coverage on our common stock.
The trading market for our common stock will depend in part on the research and reports that securities analysts publish about us and our business. We do not have any control over these securities analysts, and they
40
Table of Contents
may not cover our common stock. If securities analysts do not cover our common stock, the lack of research coverage may adversely affect its market price. If we are covered by securities analysts, and our common stock is the subject of an unfavorable report, the price of our common stock may decline. If one or more of these analysts cease to cover us or fail to publish regular reports on us, we could lose visibility in the financial markets, which could cause the price or trading volume of our common stock to decline.
Future sales of shares of our common stock by existing shareholders could depress the market price of our common stock.
Upon completion of this offering, there will be 32,654,860 shares of our common stock outstanding. The 4,000,000 shares being sold in this offering will be freely tradeable immediately after this offering (except for shares purchased by affiliates) and of the remaining 28,654,860 shares outstanding on a pro forma as adjusted basis as of July 7, 2015 (assuming no exercise of outstanding options after July 7, 2015), 5,313,620 shares may be resold under Rule 144 as of the date of this prospectus, and 23,341,240 shares may be sold upon expiration of lock-up agreements 180 days after the date of this offering (subject in some cases to volume limitations). In addition, as of July 7, 2015, there were outstanding options to purchase 2,268,736 shares of our common stock that, if exercised, will result in these additional shares becoming available for sale upon expiration of the lock-up agreements. A large portion of these shares and options are held by a small number of persons. Sales by these shareholders or option holders of a substantial number of shares after this offering could significantly reduce the market price of our common stock. We also intend to register all common stock that we may issue under our stock plans. Effective upon the completion of this offering, an aggregate of 4,265,070 shares of our common stock will be reserved for future issuance under these plans (assuming no exercise of outstanding options after July 7, 2015). Once we register these shares, which we plan to do shortly after the completion of this offering, they can be freely sold in the public market upon issuance, subject to the lock-up agreements referred to above. If a large number of these shares are sold in the public market, the sales could reduce the trading price of our common stock. See “Shares Eligible for Future Sale” for a more detailed description of sales that may occur in the future.
Our ability to pay cash dividends on our securities is limited and we may be unable to pay future dividends.
We may not declare or pay dividends on our securities, including our common stock, in the future. Any future determination relating to dividend policy will be made at the discretion of our board of directors and will depend on a number of factors, including our future earnings, capital requirements, financial condition, future prospects, regulatory restrictions, and other factors that our board of directors may deem relevant. The holders of our capital stock are entitled to receive dividends when, and if, declared by our board of directors out of funds legally available for that purpose. As part of our consideration to pay cash dividends, we intend to retain adequate funds from future earnings to support the development and growth of our business. In addition, our ability to pay dividends is restricted by federal policies and regulations. It is the current policy of the Federal Reserve that bank holding companies should pay cash dividends on capital stock only out of net income available over the past year and only if prospective earnings retention is consistent with the organization’s expected future needs and financial condition. Further, our principal source of funds to pay dividends is cash dividends that we receive from Live Oak Bank, which, in turn, will be highly dependent upon the Bank’s historical and projected results of operations, liquidity, cash flows and financial condition, as well as various legal and regulatory prohibitions and other restrictions on the ability of the Bank to pay dividends, extend credit or otherwise transfer funds to the Company.
Additional issuances of common stock or securities convertible into common stock may dilute holders of our common stock.
We may, in the future, determine that it is advisable, or we may encounter circumstances where we determine it is necessary, to issue additional shares of common stock, securities convertible into, exchangeable for or that represent an interest in common stock, or common stock-equivalent securities to fund strategic initiatives or other
41
Table of Contents
business needs or to build additional capital. Our board of directors is authorized to cause us to issue additional shares of common stock from time to time for adequate consideration without any additional action on the part of our shareholders. The market price of our common stock could decline as a result of other offerings, as well as other sales of a large block of common stock or the perception that such sales could occur.
We are subject to extensive regulation, and ownership of our common stock may have regulatory implications for holders thereof.
We are subject to extensive federal and state banking laws, including the Bank Holding Company Act of 1956, as amended, or BHCA, and federal and state banking regulations, that will impact the rights and obligations of owners of our common stock, including, for example, our ability to declare and pay dividends on our common stock. Shares of our common stock are voting securities for purposes of the BHCA and any bank holding company or foreign bank that is subject to the BHCA may need approval to acquire or retain more than 5% of the then outstanding shares of our common stock, and any holder (or group of holders deemed to be acting in concert) may need regulatory approval to acquire or retain 10% or more of the shares of our common stock. A holder or group of holders may also be deemed to control us if they own 25% or more of our total equity. Under certain limited circumstances, a holder or group of holders acting in concert may exceed the 25% percent threshold and not be deemed to control us until they own 33% percent or more of our total equity. The amount of total equity owned by a holder or group of holders acting in concert is calculated by aggregating all shares held by the holder or group, whether as a combination of voting or non-voting shares or through other positions treated as equity for regulatory or accounting purposes and meeting certain other conditions. Holders of our common stock should consult their own counsel with regard to regulatory implications.
Holders should not expect us to redeem outstanding shares of our common stock.
Our common stock is a perpetual equity security. This means that it has no maturity or mandatory redemption date and will not be redeemable at the option of the holders. Any decision we may make at any time to propose the repurchase or redemption of shares of our common stock will depend upon, among other things, our evaluation of our capital position, the composition of our shareholders’ equity, general market conditions at that time and other factors we deem relevant. Our ability to redeem shares of our common stock is subject to regulatory restrictions and limitations, including those of the Federal Reserve Board.
Offerings of debt, which would rank senior to our common stock upon liquidation, may adversely affect the market price of our common stock.
We may attempt to increase our capital resources or, if our or the Bank’s regulatory capital ratios fall below the required minimums, we or the Bank could be forced to raise additional capital by making additional offerings of debt or equity securities, senior or subordinated notes, preferred stock and common stock. Upon liquidation, holders of our debt securities and lenders with respect to other borrowings will receive distributions of our available assets prior to the holders of our common stock.
Anti-takeover provisions could adversely affect our shareholders.
In some cases, shareholders would receive a premium for their shares if we were acquired by another company. However, state and federal law and our articles of incorporation and bylaws make it difficult for anyone to acquire us without approval of our board of directors. For example, our articles of incorporation require a supermajority vote of two-thirds of our outstanding common stock in order to effect a sale or merger of the company in certain circumstances. Consequently, a takeover attempt may prove difficult, and shareholders may not realize the highest possible price for their securities. See “Description of Our Securities — Certain Provisions of Our Articles of Incorporation and Bylaws Having Potential Anti-Takeover Effects.”
42
Table of Contents
Shares of our common stock are not insured deposits and may lose value.
Shares of our common stock will not be savings accounts, deposits or other obligations of any depository institution and will not be insured or guaranteed by the FDIC or any other governmental agency or instrumentality, any other deposit insurance fund or by any other public or private entity. An investment in our common stock is inherently risky for the reasons described in this “Risk Factors” section and elsewhere in this prospectus. As a result, if you acquire shares of our common stock, you may lose some or all of your investment.
43
Table of Contents
SPECIAL NOTE REGARDING FORWARD-LOOKING STATEMENTS
Information set forth in this prospectus may contain “forward-looking statements” within the meaning of Section 27A of the Securities Act of 1933, as amended, or the Securities Act, and Section 21E of the Securities Exchange Act of 1934, as amended, or the Exchange Act, which statements represent our judgment concerning the future and are subject to business, economic and other risks and uncertainties, both known and unknown, that could cause our actual operating results and financial position to differ materially from the forward-looking statements. Such forward-looking statements can be identified by the use of forward-looking terminology such as “may,” “will,” “expect,” “anticipate,” “estimate,” “believe,” or “continue,” or the negative thereof or other variations thereof or comparable terminology.
We caution that any such forward-looking statements are further qualified by important factors that could cause our actual operating results to differ materially from those in the forward-looking statements, including, without limitation:
| • | deterioration in the financial condition of borrowers resulting in significant increases in loan losses and provisions for those losses; |
| • | changes in SBA loan products, including specifically the Section 7(a) program, or changes in SBA standard operating procedures; |
| • | changes in interest rates that affect the level and composition of deposits, loan demand and the values of loan collateral, securities and interest sensitive assets and liabilities; |
| • | the failure of assumptions underlying the establishment of reserves for possible loan losses; |
| • | changes in loan underwriting, credit review or loss reserve policies associated with economic conditions, examination conclusions, or regulatory developments; |
| • | a reduction in or the termination of our ability to use the technology-based platform that is critical to the success of our business model; |
| • | changes in financial market conditions, either internationally, nationally or locally in areas in which we conduct our operations, including, without limitation, reduced rates of business formation and growth, commercial and residential real estate development, and real estate prices; |
| • | changes in accounting principles, policies, and guidelines applicable to bank holding companies and banking; |
| • | fluctuations in markets for equity, fixed-income, commercial paper and other securities, which could affect availability, market liquidity levels, and pricing; |
| • | effective on January 1, 2015 and subject to certain transition periods, changes in minimum capital requirements, adjustments to prompt corrective action thresholds, increased quality of regulatory capital, revised risk-weighting of certain assets, and implementation of a “capital conservation buffer,” included in the final rule promulgated by the Federal Reserve on July 2, 2013, to implement the so-called “Basel III” accords; |
| • | the effects of competition from other commercial banks, thrifts, mortgage banking firms, consumer finance companies, credit unions, securities brokerage firms, insurance companies, money market and other mutual funds and other financial institutions operating in our market area and elsewhere, including institutions operating regionally, nationally and internationally, together with such competitors offering banking products and services by mail, telephone and the Internet; |
| • | governmental monetary and fiscal policies, including the effects of the Federal Reserve’s “Quantitative Easing” program, as well as other legislative and regulatory changes; |
| • | changes in political and economic conditions, including continuing political and economic effects of the global economic downturn and other major developments; |
44
Table of Contents
| • | the impact of heightened regulatory scrutiny of financial products, primarily led by the CFPB; |
| • | our ability to comply with any requirements imposed on the Company or the Bank by our respective regulators, and the potential negative consequences that may result; |
| • | the effect of any mergers, acquisitions or other transactions, to which we or the Bank may from time to time be a party, including, without limitation, our ability to successfully integrate any businesses that we acquire; and |
| • | the risk factors described under the heading “Risk Factors” in this prospectus. |
Given these risks, uncertainties and other factors, you should not place undue reliance on these forward-looking statements. Also, these forward-looking statements represent our estimates and assumptions only as of the date such forward-looking statements are made.
You should read carefully this prospectus and the documents that we have filed as exhibits to the registration statement, of which this prospectus is a part, completely and with the understanding that our actual future results may be materially different from what we expect. We hereby qualify all of our forward-looking statements by these cautionary statements. Except as required by law, we assume no obligation to update these forward-looking statements publicly or to update the reasons actual results could differ materially from those anticipated in these forward-looking statements, even if new information becomes available in the future.
45
Table of Contents
We estimate that the net proceeds to us from the sale of the shares of common stock offered by us in this public offering will be approximately $62.9 million, or $72.6 million if the underwriters elect to exercise their option to purchase additional shares in full, based on an assumed initial public offering price of $17.00 per share, which is the midpoint of the estimated price range set forth on the cover page of this prospectus, and after deducting underwriting discounts and commissions and estimated offering expenses payable by us. Each $1.00 increase (decrease) in the assumed initial public offering price of $17.00 per share would increase (decrease) the net proceeds to us from this offering by $3.8 million, or $4.4 million if the underwriters elect to exercise their option to purchase additional shares in full, assuming the number of shares offered by us, as indicated on the cover page of this prospectus, remains the same and after deducting the underwriting discounts and commissions and estimated offering expenses payable by us.
We intend to use the net proceeds of this offering to:
| • | support organic growth in our existing industry verticals; |
| • | for expansion into new industry verticals; |
| • | to develop a new online lending platform for the origination of loans less than $350 thousand; |
| • | to support the growth of our balance sheet as we increase the size of our held-for-investment loan portfolio; and |
| • | for general corporate purposes, including for possible acquisitions of, or investments in, bank or permissible non-bank entities, though, we do not have any agreements or understandings presently with respect to any acquisitions or investments. |
Before we apply any of the net proceeds of this offering, the net proceeds likely will be temporarily invested in short-term investment securities. We will have broad discretion in allocating the net proceeds of this offering.
46
Table of Contents
The following table sets forth our cash and due from banks and our consolidated capitalization, including regulatory capital ratios, at March 31, 2015 on:
| • | an actual basis; and |
| • | on an as adjusted basis to give effect to the net proceeds from the sale by us of 4,000,000 shares of common stock in this offering (assuming the underwriters do not exercise their option to purchase additional shares) at an assumed initial public offering price of $17.00 per share, which is the midpoint of the estimated price range set forth on the cover page of this prospectus, after deducting underwriting discounts and commissions and estimated offering expenses payable by us. |
You should read the following table in conjunction with “Management’s Discussion and Analysis of Financial Condition and Results of Operations” and our consolidated financial statements and related notes thereto, which are included elsewhere in this prospectus.
| As of March 31, 2015 | ||||||||||||
| Shareholders’ equity: |
Actual | As Adjusted (1) |
||||||||||
| (dollars in thousands, except share and per share data and ratios) |
||||||||||||
| Cash and due from banks |
$ | 47,564 | $ | 110,483 | ||||||||
|
|
|
|
|
|||||||||
| Long term debt |
50,210 | 50,210 | ||||||||||
|
|
|
|
|
|||||||||
| Shareholders’ equity: |
||||||||||||
| Common stock, no par value, 110,000,000 shares authorized, 28,623,609 shares issued and outstanding, actual; 32,623,609 shares issues and outstanding, as adjusted |
103,937 | 166,856 | ||||||||||
| Accumulated deficit |
(3,993 | ) | (3,993 | ) | ||||||||
| Accumulated other comprehensive income |
209 | 209 | ||||||||||
| Non-controlling interest |
15 | 15 | ||||||||||
| Total shareholders’ equity |
100,168 | 163,087 | ||||||||||
|
|
|
|
|
|||||||||
| Total capitalization |
147,732 | 210,651 | ||||||||||
|
|
|
|
|
|||||||||
| Book value per common share |
3.50 | 5.00 | ||||||||||
| Tangible book value per common share(2) |
3.50 | 5.00 | ||||||||||
| Capital ratios: |
Minimum Regulatory Requirement |
|||||||||||
| Tangible common equity to tangible assets(2) |
13.84 | % | 20.74 | % | ||||||||
| Company regulatory capital ratios: |
||||||||||||
| Tier 1 leverage capital |
11.38 | 18.34 | 5.00 | % | ||||||||
| CET 1 risk-based capital |
15.90 | 27.06 | 6.50 | |||||||||
| Tier 1 risk-based capital |
15.90 | 27.06 | 8.00 | |||||||||
| Total risk-based capital |
16.85 | 27.99 | 10.00 | |||||||||
| Bank regulatory capital ratios(3): |
||||||||||||
| Tier 1 leverage capital |
8.66 | 9.20 | 5.00 | |||||||||
| CET 1 risk-based capital |
12.36 | 14.00 | 6.50 | |||||||||
| Tier 1 risk-based capital |
12.36 | 14.00 | 8.00 | |||||||||
| Total risk-based capital |
13.39 | 15.00 | 10.00 | |||||||||
| (1) | A $1.00 increase (or decrease) in the assumed initial public offering price of $17.00 per share, which is the midpoint of the estimated offering price range set forth on the cover page of this prospectus, would increase (or decrease), as applicable, our net proceeds, after deducting underwriting discounts and commissions and |
47
Table of Contents
| estimated offering expenses payable by us, by $3.8 million (assuming no exercise of the underwriters’ option to purchase additional shares and assuming that the number of shares offered by us, as set forth on the cover page of this prospectus, remains the same). Similarly, an increase or decrease of 400,000 shares of common stock sold in this offering by us would increase or decrease, as applicable, our net proceeds, after deducting underwriting discounts and commissions and estimated offering expenses payable by us, by $6.5 million, based on an assumed initial public offering price of $17.00 per share, which is the midpoint of the estimated offering price range set forth on the cover page of this prospectus. |
| (2) | These measures are not measures recognized under GAAP and are therefore considered to be non-GAAP financial measures. See the information set forth under the caption “ GAAP Reconciliation and Management Explanation of Non-GAAP Financial Measures” for a reconciliation of these measures to their most directly comparable GAAP measures. |
| (3) | The as adjusted column assumes that $10 million of net cash proceeds from the offering are transferred to the Bank as common equity. |
48
Table of Contents
If you invest in our common stock, your interest will be diluted to the extent of the difference between the public offering price per share of our common stock and the pro forma net tangible book value per share of our common stock after this offering.
Net tangible book value per share is equal to the amount of our shareholders’ equity less intangible assets, divided by the number of shares of common stock outstanding at March 31, 2015. The net tangible book value of our common stock at March 31, 2015 was approximately $100.1 million, or $3.50 per share, based on the number of shares of common stock outstanding at March 31, 2015.
As adjusted net tangible book value per share gives effect to the net proceeds from the sale by us of shares of common stock in this offering (assuming the underwriters do not exercise their option to purchase additional shares) at an assumed initial public offering price of $17.00 per share, which is the midpoint of the estimated price range set forth on the cover page of this prospectus, and after deducting underwriting discounts and commissions and estimated offering expenses payable by us. At March 31, 2015, the as adjusted net tangible book value of our common stock would have been approximately $163.0 million, or $5.00 per share. This represents an immediate increase in as adjusted net tangible book value of $1.50 per share to existing shareholders and an immediate dilution of $12.00 per share to new investors, or approximately 70.6% of the public offering price of $17.00 per share. Dilution is determined by subtracting as adjusted net tangible book value per share after this offering from the public offering price of $17.00 per share. The following table illustrates this per share dilution:
| Assumed initial public offering price per share |
$ | 17.00 | ||||||
| Net tangible book value per share as of March 31, 2015 |
$ | 3.50 | ||||||
| Increase in net tangible book value per share attributable to new investors in this offering |
1.50 | |||||||
|
|
|
|||||||
| As adjusted net tangible book value per share |
5.00 | |||||||
|
|
|
|||||||
| Dilution per share to new investors in this offering |
$ | 12.00 | ||||||
|
|
|
Each $1.00 increase (decrease) in the assumed initial public offering price of $17.00 per share would increase (decrease) our as adjusted book value by approximately $3.8 million, or approximately $0.12 per share, and the dilution per share to new investors in this offering by approximately $0.88 per share, assuming that the number of shares offered by us, as set forth on the cover page of this prospectus remains the same and after deducting underwriting discounts and commissions and estimated offering expenses payable by us. We may also increase or decrease the number of shares we are offering. An increase of 400,000 in the number of shares offered by us, assuming the assumed initial public offering of $17.00 per share remains the same, would result in as adjusted tangible book value of approximately $169.4 million, or $5.13 per share, and the dilution per share to new investors in this offering would be $11.87 per share. Similarly, a decrease of 400,000 in the number of shares offered by us, assuming the assumed initial public offering price of $17.00 per share remains the same, would result in as adjusted tangible book value of approximately $156.5 million, or $4.86 per share, and the dilution per share to new investors in this offering would be $12.14 per share. The as adjusted information discussed above is illustrative only and will adjust based on the actual public offering price and other terms of this offering determined at pricing.
If the underwriters exercise their option to purchase additional shares in full, our as adjusted book value as of March 31, 2015, would have been $172.7 million, or $5.20 per share, representing an immediate increase in as adjusted book value to our existing shareholders of $1.70 per share and immediate dilution to new investors in this offering of $11.80 per share.
49
Table of Contents
The following table summarizes the total consideration paid to us and the average price paid per share by existing shareholders and new investors purchasing common stock in this offering. This information is presented on an as adjusted basis as of March 31, 2015, after giving effect to our sale of 4,000,000 shares of common stock in this offering (assuming the underwriters do not exercise their option) at an assumed initial public offering price of $17.00 per share, which is the midpoint of the estimated price range set forth on the cover page of this prospectus.
| Shares Purchased | Total Consideration | Average Price Per Share |
||||||||||||||||||
| Number | Percent | Amount | Percent | |||||||||||||||||
| Existing shareholders |
28,623,609 | 87.7 | % | $ | 102,470,473 | 60.1 | % | $ | 3.58 | |||||||||||
| New investors in this offering |
4,000,000 | 12.3 | 68,000,000 | 39.9 | 17.00 | |||||||||||||||
|
|
|
|
|
|
|
|
|
|||||||||||||
| Total |
32,623,609 | 100.0 | % | $ | 170,470,473 | 100.0 | % | |||||||||||||
|
|
|
|
|
|
|
|
|
|||||||||||||
If the underwriters exercise their option to purchase additional shares in full, our existing shareholders would own approximately 86.2% and our new investors would own approximately 13.8% of the total number of shares of our common stock outstanding after this offering.
The information above excludes 2,268,736 shares of our common stock issuable upon exercise of outstanding stock options at July 7, 2015 at a weighted-average exercise price of $7.28 per share and 4,265,070 shares of our common stock reserved for issuance in connection with stock awards available for issuance under our 2015 Omnibus Stock Incentive Plan as of July 7, 2015. To the extent that any of these stock options are exercised, investors participating in the offering will experience further dilution.
50
Table of Contents
It has been our practice since inception in May 2007 to make distributions to our common shareholders. Until August 3, 2014, we were taxed as an “electing small business corporation”, or S corporation, under Subchapter S of the Internal Revenue Code of 1986, as amended, or the Code. As such, we were not liable for income taxes on our income, but instead we historically paid distributions to our shareholders to assist them in paying income taxes on the pro rata portion of our taxable income that “passed through” to each of our shareholders.
On April 29, 2015, we paid a dividend of $0.03 per share to our shareholders of record as of April 17, 2015. On March 12, 2015, we paid a special dividend to our shareholders for undistributed 2014 tax amounts related to their allocable share of 2014 S corporation taxable income. The amount of this dividend was $1.4 million. In addition, throughout 2014, we distributed approximately $7.1 million to the shareholders for tax amounts related to the S corporation earnings and the taxable gain resulting from our divestiture of nCino, Inc. to our shareholders. We voluntarily terminated our S corporation status effective August 3, 2014, and are now taxed as a C corporation under the Code
We are organized under the North Carolina Business Corporation Act, which prohibits the payment of a dividend if, after giving it effect, we would not be able to pay our debts as they become due in the usual course of business or our total assets would be less than the sum of our total liabilities plus the amount that would be needed, if we were to be dissolved, to satisfy the preferential rights upon dissolution of any preferred shareholders. In addition, because we are a bank holding company, the Federal Reserve may impose restrictions on cash dividends paid by us. The Federal Reserve has issued a policy statement on the payment of cash dividends by bank holding companies, which expresses the Federal Reserve’s view that a bank holding company should pay cash dividends only to the extent that the holding company’s net income for the past four quarters, net of any dividends previously paid during that period, is sufficient to cover both the cash dividends and a rate of earnings retention that is consistent with the bank holding company’s capital needs, asset quality and overall financial condition. The Federal Reserve has also indicated that it would be inappropriate for a bank holding company experiencing serious financial problems to borrow funds to pay dividends. Furthermore, under the prompt corrective action regulations adopted by the Federal Reserve, the Federal Reserve may prohibit a bank holding company from paying any dividends if any of the holding company’s bank subsidiaries are classified as undercapitalized.
Our ability to pay dividends is largely dependent upon the amount of cash dividends that the Bank pays to
us, which distributions are restricted under North Carolina banking laws and regulations. The Bank may make distributions only to the extent that the Bank remains adequately capitalized. In addition, regulatory authorities may limit payment of
dividends by any bank when it is determined that such a limitation is in the public interest and is necessary to ensure financial soundness of the bank. The Office of the
North Carolina Commissioner of Banks and the FDIC also are authorized to
prohibit the payment of dividends by a bank under certain circumstances. Such requirements and policies may limit our ability to obtain dividends from the Bank for our cash needs, including payment of dividends to our shareholders and the payment of
operating expenses. For additional information on these limitations, see “Supervision and Regulation — Regulation of the Company — Dividends” and “— Live Oak Bank — Dividends.”
Following this offering, we currently intend to declare and pay dividends to common shareholders of up to 10% of our after tax earnings. However, any determination to pay future dividends to shareholders will be dependent upon our operational results, financial condition, capital requirements, business projections, general business conditions, statutory and regulatory restrictions and any other factors that our board of directors deem appropriate. Our board of directors may change or eliminate the payment of future dividends at its discretion, without notice to shareholders.
51
Table of Contents
MANAGEMENT’S DISCUSSION AND ANALYSIS OF FINANCIAL CONDITION
AND RESULTS OF OPERATIONS
The following discussion and analysis of our financial condition and results of operations should be read in conjunction with the financial information contained in “Selected Historical Consolidated Financial Data” and our consolidated financial statements and the accompanying notes included elsewhere in this prospectus. This discussion and analysis contains forward-looking statements that are subject to certain risks and uncertainties and are based on certain assumptions that we believe are reasonable but may prove to be inaccurate. Certain risks, uncertainties and other factors, including those set forth under “Cautionary Note Regarding Forward-Looking Statements,” “Risk Factors” and elsewhere in this prospectus, may cause actual results to differ materially from those projected results discussed in the forward-looking statements appearing in this discussion and analysis. We assume no obligation to update any of these forward-looking statements, except as required by law.
Overview of Company Operations
We are an established national online platform for small business lending. We leverage a comprehensive technology-based platform with deep industry experience to optimize the credit extension process and borrowing experience for our customers.
We are organized as a bank holding company headquartered in Wilmington, North Carolina and were incorporated under the laws of North Carolina in December 2008. We conduct business operations primarily through our commercial bank subsidiary, Live Oak Banking Company. The Bank was established in May 2008 as a North Carolina-chartered commercial bank. We believe there is significant opportunity in lending to small businesses nationwide. By focusing on credit quality in verticals where we have a deep understanding, we have the ability to fill a specific market niche. We believe that this niche focus combined with a national presence promotes the origination of high-quality loans. We have never sought to grow for the sake of growth. Rather, we strive to establish ourselves as the preferred lender to, and partner of, small business professionals. As a result, we have provided financing totaling $2.9 billion since May 2007 to fulfill the needs of new and existing business across the U.S.
Our strategy centers on a business model that we believe mitigates credit risk while capitalizing on novel technology in the financial services industry. In the execution of this strategy we focus on extending primarily variable rate loans that are guaranteed by the U.S. Small Business Administration, or the SBA, to small businesses and professionals with what we believe are low risk characteristics. As a result of this strategy, variable rate loans comprised 92.6% and 94.3% of the held-for-investment and held-for-sale loan portfolios, respectively, at March 31, 2015. The cloud-based software we use allows us to maintain a streamlined loan delivery system on a national platform. Our compliance with SBA regulations is enhanced by our lending and credit professionals who possess strong SBA lending backgrounds, and the technology-based platform we use.
Historically we have typically sold the SBA-guaranteed portion (generally 75% of the principal balance) of the loans we originate in the secondary market while we retain servicing, with the remainder of each loan either participated out to a third party or retained on our books. We have historically received a premium for these sales. We also sell participating interests in the remaining portion of our loans while retaining an SBA-required 10% unguaranteed interest and the servicing rights to the entire loan. As a result of our business model, our net income to date has been driven primarily by non-interest income rather than interest income.
We focus on specific industries, which we call “verticals,” with a series of what we believe are low risk characteristics and substantial market size potential. We believe industry specific focus complements our status as an SBA 7(a) Preferred Lender. We carefully select verticals to focus our lending efforts. We are currently exploring expanding our lending efforts into additional verticals. In selecting these industries, we analyze the SBA historical data relative to default/loss rate, competition, and the size of the industry as well as the business cycles and customer characteristics of each industry. We then look at credit parameters, product types, and pricing that we would need to use in order to establish a market presence in an industry and weigh those factors against our risk tolerance and profitability objectives. Through this analysis, we approximate the percentage of the potential demand we believe we could capture both initially and after market stabilization. We are generally reluctant to enter a new vertical, unless we believe we could capture a meaningful portion of the potential small business loan demand within it.
52
Table of Contents
Within each vertical we retain individuals who possess extensive industry-specific lending experience. We believe our focus on verticals has allowed us to extend credit to small businesses at an average loan size of $1.0 million and has resulted in our credit quality outperforming industry averages. Based on a data set consisting of 292 SBA 7(a) lenders that have originated 300 loans or more and greater than $25 million dollars in total loans, assembled by our affiliate, Government Loan Solutions, Inc. using two separate Freedom of Information Act requests for the fourteen year period ended September 30, 2014, we had the lowest default rate among the group at 1.52%. In terms of charge-off rates, we ranked fifth in the same data set at 0.35% for the same period. For the twelve months ended September 30, 2014, the U.S. Government’s most recently completed fiscal quarter, we ranked as the nation’s second largest small business lender, by dollar volume, utilizing the SBA’s 7(a) program.
Provision expense for the quarter ended March 31, 2015 was $1.1 million or 154% greater than that recorded for the three months ended March 31, 2014. The higher the provision expense in the first quarter of 2015 was primarily attributed to growth in loan originations and reserves on impaired loans. Reserves on impaired loans increased $483 thousand in the first quarter of 2015 compared to a decrease of $329 thousand in the first quarter of 2014.
In 2014 we experienced a significantly higher provision for loan losses compared to 2013. Provision expenses in 2014 were incurred as a result of an increase in reserves on impaired loans of $1.1 million, coupled with loan loss provisions totaling approximately $1.7 million in response to substantial loan growth and increases in qualitative reserves, partially mitigated by our declining loss ratios. Much of our loan growth in 2014 occurred within new lending verticals with higher loss factors due to the Company’s lack of historical experience in those industries. By comparison, provision expenses for 2013 were incurred as a result of a decline in reserves on impaired loans of $2.1 million partially offset by loan loss provisions totaling $1.3 million as a result of improving credit quality and a migration from peer to actual loss history in maturing lending verticals.
We service our customers efficiently throughout the loan process and monitor their performance by means of the technology-based platform we use, which eliminates the need to maintain traditional branch locations and therefore eliminates a significant component of traditional overhead expense associated with banking franchises. As a result, the Bank has no brick-and-mortar branch locations and does not employ any tellers. Our headquarters serves as our sole deposit gathering location for local customers seeking a more traditional interaction for their banking needs. We believe this lack of a concentrated geographic branch footprint significantly mitigates risk that would be associated with having the loan portfolio concentrated in one geographic area.
Conversion from S Corporation to C Corporation
Effective August 3, 2014, we terminated our status as an S corporation and became a C corporation under the Code for income tax purposes. Upon conversion to a C corporation, we recorded a net deferred tax liability of $3.3 million on our balance sheet as of August 4, 2014. Upon recognition of the deferred tax liability we also recorded an offsetting adjustment to income tax expense of $3.3 million, which decreased our after-tax earnings and shareholders’ equity by the same amount.
Critical Accounting Policies and Estimates
We have identified accounting policies that are the most critical to fully understand and evaluate our reported financial results and require management’s most difficult, subjective or complex judgments. Management has reviewed the following critical accounting policies and related disclosures with the audit & risk committee of the Board of Directors.
| • | Determination of the allowance for loan losses; |
| • | Valuation of servicing assets; and |
| • | Valuation of foreclosed assets. |
For a full description of these critical accounting policies, see Note 1 to our audited financial statements contained elsewhere in this prospectus.
53
Table of Contents
Executive Overview of Historical Financial Performance
To date, we have originated loans in all 50 states and certain U.S. territories, primarily across five established industry verticals: veterinary practices, healthcare services, independent pharmacies, death care management and investment advisors. New verticals include family entertainment centers and poultry agriculture, and, in 2015 thus far, wine and craft beverages and self-storage. We believe that our commitment to serving the banking needs of small business clients, the use of an integrated technology-based platform, and our level of servicing has contributed to growth in annual loan production since we commenced operations in 2007. For the U.S. government’s 2014 fiscal year, or the four quarters ending September 30, 2014, we were the second most active SBA 7(a) lender in the United States, by dollar volume, with over $800 million of loans to small businesses in the United States, behind only Wells Fargo Bank.
We have achieved approximately a 55.2% CAGR in loan production from May 2007 through March 31, 2015. The following tables summarize the annual production of the Bank and the amount of the SBA-guaranteed portion of the loans we have sold by industry vertical since May 2007:
| Three Months Ended March 31, 2015 |
Year Ended December 31, | |||||||||||||||||||||||||||||||||||||||
| 2014 | 2013 | 2012 | 2011 | 2010 | 2009 | 2008 | 2007 | Total | ||||||||||||||||||||||||||||||||
| (dollars in thousands) | ||||||||||||||||||||||||||||||||||||||||
| Veterinary Practices |
$ | 26,492 | $ | 155,217 | $ | 147,661 | $ | 174,768 | $ | 149,485 | $ | 150,788 | $ | 145,920 | $ | 161,230 | $ | 40,226 | $ | 1,151,787 | ||||||||||||||||||||
| Healthcare Services |
56,892 | 182,406 | 109,317 | 81,363 | 69,860 | 56,580 | 13,385 | 150 | — | 569,953 | ||||||||||||||||||||||||||||||
| Independent Pharmacies |
25,221 | 149,453 | 106,391 | 103,358 | 86,757 | 48,919 | — | — | — | 520,099 | ||||||||||||||||||||||||||||||
| Death Care Management |
12,011 | 72,124 | 101,736 | 54,075 | — | — | — | — | — | 239,946 | ||||||||||||||||||||||||||||||
| Investment Advisors |
34,304 | 96,963 | 33,647 | — | — | — | — | — | — | 164,914 | ||||||||||||||||||||||||||||||
| Family Entertainment Centers |
3,580 | 13,503 | — | — | — | — | — | — | — | 17,083 | ||||||||||||||||||||||||||||||
| Poultry Agriculture |
89,559 | 171,644 | — | — | — | — | — | — | — | 261,203 | ||||||||||||||||||||||||||||||
| Other |
— | 6,780 | — | 199 | 535 | 30 | 1,275 | 1,209 | 775 | 10,803 | ||||||||||||||||||||||||||||||
|
|
|
|
|
|
|
|
|
|
|
|
|
|
|
|
|
|
|
|
|
|||||||||||||||||||||
| Total |
$ | 248,058 | $ | 848,090 | $ | 498,752 | $ | 413,763 | $ | 306,637 | $ | 256,317 | $ | 160,580 | $ | 162,589 | $ | 41,001 | $ | 2,935,787 | ||||||||||||||||||||
|
|
|
|
|
|
|
|
|
|
|
|
|
|
|
|
|
|
|
|
|
|||||||||||||||||||||
The following table shows the amount of the SBA-guaranteed portions of the loans we have originated that we have sold since May 2007:
| Three Months Ended March 31, 2015 |
Year Ended December 31, | |||||||||||||||||||||||||||||||||||||||
| 2014 | 2013 | 2012 | 2011 | 2010 | 2009 | 2008 | 2007 | Total | ||||||||||||||||||||||||||||||||
| (dollars in thousands) | ||||||||||||||||||||||||||||||||||||||||
| Veterinary Practices |
$ | 29,148 | $ | 97,960 | $ | 115,514 | $ | 129,291 | $ | 117,941 | $ | 107,326 | $ | 138,725 | $ | 52,897 | $ | — | $ | 788,802 | ||||||||||||||||||||
| Healthcare Services |
29,012 | 99,063 | 57,361 | 46,446 | 50,948 | 30,120 | 7,453 | — | — | 320,403 | ||||||||||||||||||||||||||||||
| Independent Pharmacies |
19,328 | 104,446 | 83,647 | 66,856 | 69,553 | 31,805 | — | — | — | 375,635 | ||||||||||||||||||||||||||||||
| Death Care Management |
8,095 | 53,832 | 63,156 | 34,083 | — | — | — | — | — | 159,166 | ||||||||||||||||||||||||||||||
| Investment Advisors |
28,630 | 64,764 | 19,664 | — | — | — | — | — | — | 113,058 | ||||||||||||||||||||||||||||||
| Family Entertainment Centers |
— | 7,286 | — | — | — | — | — | — | — | 7,286 | ||||||||||||||||||||||||||||||
| Poultry Agriculture |
22,834 | 4,273 | — | — | — | — | — | — | — | 27,107 | ||||||||||||||||||||||||||||||
| Other |
— | 2,288 | — | — | — | — | — | 706 | — | 2,994 | ||||||||||||||||||||||||||||||
|
|
|
|
|
|
|
|
|
|
|
|
|
|
|
|
|
|
|
|
|
|||||||||||||||||||||
| Total |
$ | 137,047 | $ | 433,912 | $ | 339,342 | $ | 276,676 | $ | 238,442 | $ | 169,251 | $ | 146,178 | $ | 53,603 | $ | — | $ | 1,794,451 | ||||||||||||||||||||
|
|
|
|
|
|
|
|
|
|
|
|
|
|
|
|
|
|
|
|
|
|||||||||||||||||||||
54
Table of Contents
Credit quality and on-going credit administration are the foundation of our business. The composition of the $2.9 billion in loans originated from May 2007 through March 31, 2015 is reflected below to highlight the portion of loans sold in the secondary market versus the portion of loans retained, as well as the credit quality of those originated loans.
| Guaranteed | Unguaranteed | |||||||||||||||||||
| (dollars in thousands) | ||||||||||||||||||||
| Dollars | % of Total |
Dollars | % of Total |
Total | ||||||||||||||||
| Originated loans |
$ | 2,190,655 | 74.6 | $ | 745,132 | 25.4 | $ | 2,935,787 | ||||||||||||
| Sold loans |
1,795,706 | 89.4 | 212,233 | 10.6 | 2,007,939 | |||||||||||||||
| Unfunded commitments at March 31, 2015 |
210,488 | 73.9 | 74,291 | 26.1 | 284,779 | |||||||||||||||
| Charge-offs |
— | — | 8,847 | 100.0 | 8,847 | |||||||||||||||
| Lost SBA guarantees |
— | — | — | — | — | |||||||||||||||
| Composition of loans at March 31, 2015: |
||||||||||||||||||||
| Total loans held for sale |
164,206 | 53.8 | 140,874 | 46.2 | 305,079 | |||||||||||||||
| Total loans held for investment |
21,548 | 9.8 | 198,896 | 90.2 | 220,444 | |||||||||||||||
| Total loans held for sale and investment |
185,754 | 35.3 | 339,770 | 64.7 | 525,524 | |||||||||||||||
| Impaired nonaccrual loans |
15,964 | 84.5 | 2,934 | 15.5 | 18,897 | |||||||||||||||
| Impaired accrual loans |
4,045 | 60.5 | 2,645 | 39.5 | 6,691 | |||||||||||||||
| Potential problem loans (1) |
$ | 1,291 | 9.1 | $ | 12,971 | 90.9 | $ | 14,262 | ||||||||||||
| (1) | Potential problem loans are defined as currently unimpaired loans that management has identified as having possible credit problems that may cause the borrowers difficulty in complying with current repayment terms. |
The vertical approach we employ allows us to immerse ourselves in an industry, enabling us to obtain better clarity on both the business and the borrower, which we believe augments our small business lending ability and the credit quality of our originated loan portfolio. Concentration factors are consistently managed across the portfolio. We closely monitor geographic concentration, industry concentration and concentrations by customer, among other factors. Furthermore, we believe our national lending footprint mitigates the risk of geographically concentrated economic events.
Results of Operations
Performance Summary
Three Months Ended March 31, 2015 vs. Three Months Ended March 31, 2014
For the three months ended March 31, 2015, we reported net income attributable to the Company of $8.1 million, an increase of $7.8 million, compared to net income of $298 thousand for the three months ended March 31, 2014. The net income increase resulted primarily from an increase in noninterest income to $24.1 million at March 31, 2015 from $12.2 million at March 31, 2014 a $11.9 million, or 97.1%, increase. Additionally, noninterest expense was largely unchanged for the three months ended March 31, 2015, compared to March 31, 2014. For the three months ended March 31, 2015, noninterest expense totaled $14.7 million compared to $14.4 million for the three months ended March 31, 2014, a 1.7% increase. Net income attributable to the Company of $8.1 million for the three months ended March 31, 2015 includes income tax expense of $5.3 million as a result of the conversion to a C corporation in August 2014. We had no income tax expense in the three months ended March 31, 2014. Income before taxes for the quarters ended March 31, 2015 and March 31, 2014 totaled $13.3 million and $298 thousand, respectively.
Year ended December 31, 2014 vs. Year ended December 31, 2013
For the year ended December 31, 2014, we reported net income attributable to the Company of $10.0 million, a decrease of $18.1 million, or (64.2)%, compared to net income of $28.1 million for the year ended December 31, 2013. The net income decrease resulted primarily from an increase in non-operating expenses
55
Table of Contents
incurred in 2014 and the impact of the conversion to a C corporation in August 2014, offset by a moderate increase in noninterest income. The recognition of a one-time gain in January 2013 in connection with the deconsolidation of our previously consolidated subsidiary, nCino, in the amount of $12.2 million resulted in marginal growth in noninterest income of $3.6 million in 2014. Offsetting this one-time gain in fiscal year 2013 were losses recognized for equity method investments of $2.8 million, principally related to allocated losses from nCino of $1.8 million subsequent to its deconsolidation. In June 2014 we divested our ownership in nCino to our shareholders in the form of a dividend with a subsequent cost method investment in nCino of $6.1 million in August of 2014. As of the date of this prospectus we do not own any equity of nCino. For the year ended December 31, 2014, noninterest expense totaled $54.5 million, an increase of 35.6% compared to the year ended December 31, 2013. Net income, excluding non-recurring expenses related to a stock grant to key employees, recognition of a deferred tax liability upon conversion from an S corporation to a C corporation, expenses related to the exploration of capital raising alternatives and C corporation income tax expense for the last five months of 2014, net of an effective tax rate of 38.5% for the full year, totaled approximately $13.6 million in 2014. Adjusted for significant non-recurring income and expenses for fiscal years 2013 and 2014, noninterest income increased $15.8 million or 36% while noninterest expense increased $9.6 million, or 24% in fiscal year 2014 compared to fiscal year 2013. Other than the reasons for the increase in net income before adjustment for non-recurring income and expenses, additional primary drivers of the increase in net income excluding non-recurring items was the exclusion of the deconsolidation gain of $12.2 million from 2013 income along with the exclusion of 2014 expenses related to the foregone initial public offering of $1.7 million and $3.0 million in stock grant expense. After-tax net income adjusted for non-recurring income and expenses for the year ended December 31, 2014 increased $3.8 million, or 39%, compared to the year ended December 31, 2013. For more information and a reconciliation of net income adjusted for non-recurring income and expense see “GAAP Reconciliation and Management Explanation of Non-GAAP Financial Measures.”
For the year ended December 31, 2014, revenue generated from our core banking operations of net interest income, loan servicing revenue, and net gain on sale of loans increased $4.6 million, $2.6 million, and $11.8 million, respectively, compared to the corresponding amounts for the year ended December 31, 2013. The net gain on sale of loans was positively impacted by an increase in the volume of guaranteed loans sold of $94.6 million, as well as by an increase in the revenue recognized for each loan sold. Gross revenue recognized for loan sales increased from an average $113.1 thousand per million for fiscal year 2013 to an average of $115.2 thousand per million for fiscal year 2014, due to changes in market rates. For the same period, the net loss resulting from the revaluation of servicing rights totaled $2.2 million, a decrease of $146 thousand compared to the year ended December 31, 2013, as a result of amortization of the serviced portfolio, changes in prepayment speeds, and prevailing market conditions. As the current market improves or deteriorates, the value of the existing servicing asset responds accordingly. For core banking activities, noninterest expense increased approximately $9.2 million, or 24.0%, compared to the year ended December 31, 2013, primarily as the result of increasing personnel and infrastructure to support growth in the loan portfolio. For the year ended December 31, 2014, the allowance for loan loss provision expense increased $3.7 million, or 425.5%, compared to the year ended December 31, 2013, due to a change in the methodology in the reserve for impaired loans and a $63 million increase in total loans held for investment.
Year ended December 31, 2013 vs. Year ended December 31, 2012
For the year ended December 31, 2013, we reported net income attributable to the Company of $28.1 million, an increase of $12.0 million, or 74.4%, compared to net income of $16.1 million for the year ended December 31, 2012. The increase resulted primarily from the recognition of a one-time gain in January 2013 in connection with the deconsolidation of our previously consolidated subsidiary, nCino in the amount of $12.2 million. Offsetting this one-time gain were losses recognized for equity method investments of $2.8 million, principally related to allocated losses from nCino subsequent to its deconsolidation. For the year ended December 31, 2013, revenue generated from our core banking operations of net interest income and net gain on sale of loans increased $2.7 million and $4.7 million, respectively, compared to the corresponding amounts for the year ended December 31, 2012. The net gain on sale of loans was positively impacted by an increase in the
56
Table of Contents
volume of guaranteed loans sold of $62.6 million, and negatively impacted by a reduction in the revenue recognized for each loan sold as the premium market for guaranteed 7(a) loans compressed from an average $121.3 thousand per million for fiscal year 2012 to an average of $113.1 thousand per million for fiscal year 2013, due to changes in market rates. For the same period, servicing revenue and revaluation of servicing rights decreased $420 thousand as a result of amortization of the serviced portfolio, changes in prepayment speeds, and prevailing market conditions. As the current market improves or deteriorates, the value of the existing servicing asset responds accordingly. Noninterest expense increased $6.5 million, or 19.3%, compared to the year ended December 31, 2012, primarily as a result of increasing personnel and infrastructure to support growth in the loan portfolio. For the year ended December 31, 2013, an allowance for loan loss provision expense decreased $3.0 million, or 140.7%, compared to the year ended December 31, 2012, due to improving credit quality.
Net Interest Income and Margin
Net interest income, a secondary contributor to our earnings, represents the difference between the income that we earn on our interest-earning assets and the cost to us of our interest-bearing liabilities. Our net interest income depends upon the volume of interest-earning assets and interest-bearing liabilities and the interest rates that we earn or pay on them. Net interest income is affected by changes in the amount and mix of interest-earning assets and interest-bearing liabilities, referred to as “volume changes.” It is also affected by changes in yields earned on interest-earning assets and rates paid on interest-bearing deposits and other borrowed funds, referred to as “rate changes.”
Three Months Ended March 31, 2015 vs. Three Months Ended March 31, 2014
For the three months ended March 31, 2015, our net interest income increased $2.1 million, or 70.2%, to $5.0 million compared to the three months ended March 31, 2014. This increase was due to growth in average interest earning assets, relatively stable asset yields and a relatively stable cost of funds. Average interest earning assets increased by $280.5 million, or 68.6%, for the three months ended March 31, 2015 compared to the three months ended March 31, 2014, while the related yield on average interest earning assets decreased by three basis points to 4.09%. While the corresponding cost of funds on interest bearing liabilities for the three months ended March 31, 2014 declined slightly by three basis points to 1.18%, the average balance in interest bearing liabilities increased by $248.8 million, or 60.3%. As indicated in the following rate volume table, the slight drop in the cost of funds was outpaced by the effect of increased volumes of interest bearing liabilities, resulting in increased interest expense for the three months ended March 31, 2015 of $0.7 million. For the three months ended March 31, 2015 compared to the three months ended March 31, 2014, our net interest margin increased from 2.90% to 2.97%.
57
Table of Contents
Average Balances and Yields. The following table presents average balances for assets and liabilities, the total dollar amounts of interest income and dividends from average interest-earning assets, the total dollar amounts of interest expense on average interest-bearing liabilities, and the resulting average yields and costs. The yields and costs for the periods indicated are derived by dividing the income or expense by the average balances for assets or liabilities, respectively, for the periods presented. Loan fees are included in interest income on loans.
| Three Months Ended March 31, | ||||||||||||||||||||||||
| 2015 | 2014 | |||||||||||||||||||||||
| Average Balance |
Interest | Average Yield/ Rate |
Average Balance |
Interest | Average Yield/ Rate |
|||||||||||||||||||
| (dollars in thousands) | ||||||||||||||||||||||||
| Interest earning assets: |
||||||||||||||||||||||||
| Interest earning balances in other banks |
$ | 82,036 | $ | 66 | 0.33 | % | $ | 52,518 | $ | 23 | 0.18 | % | ||||||||||||
| Investment securities |
58,910 | 176 | 1.21 | 19,407 | 100 | 2.06 | ||||||||||||||||||
| Loans held for sale |
336,520 | 4,164 | 5.02 | 202,582 | 2,472 | 4.88 | ||||||||||||||||||
| Loans held for investment |
211,944 | 2,552 | 4.88 | 134,370 | 1,617 | 4.81 | ||||||||||||||||||
|
|
|
|
|
|
|
|
|
|
|
|
|
|||||||||||||
| Total interest earning assets |
689,410 | 6,958 | 4.09 | 408,877 | 4,212 | 4.12 | ||||||||||||||||||
|
|
|
|
|
|
|
|
|
|
|
|
|
|||||||||||||
| Less: allowance for loan losses |
(4,403 | ) | (2,734 | ) | ||||||||||||||||||||
| Non-interest earning assets |
93,816 | 77,479 | ||||||||||||||||||||||
|
|
|
|
|
|||||||||||||||||||||
| Total assets |
$ | 778,823 | $ | 483,622 | ||||||||||||||||||||
|
|
|
|
|
|||||||||||||||||||||
| Interest bearing liabilities: |
||||||||||||||||||||||||
| Money market accounts |
$ | 310,992 | $ | 596 | 0.78 | % | $ | 212,648 | $ | 632 | 1.19 | % | ||||||||||||
| Certificates of deposit |
297,153 | 880 | 1.20 | 186,167 | 466 | 1.00 | ||||||||||||||||||
|
|
|
|
|
|
|
|
|
|
|
|
|
|||||||||||||
| Total deposits |
608,145 | 1,476 | 0.98 | 398,815 | 1,098 | 1.10 | ||||||||||||||||||
|
|
|
|
|
|
|
|
|
|
|
|
|
|||||||||||||
| Small business lending fund |
6,800 | 25 | 1.50 | 6,800 | 25 | 1.50 | ||||||||||||||||||
| Notes payable to investors |
— | — | — | 3,623 | 91 | 10.00 | ||||||||||||||||||
| Other borrowings |
46,510 | 416 | 3.63 | 3,342 | 37 | 4.43 | ||||||||||||||||||
|
|
|
|
|
|
|
|
|
|
|
|
|
|||||||||||||
| Total interest bearing liabilities |
661,455 | 1,917 | 1.18 | 412,580 | 1,251 | 1.21 | ||||||||||||||||||
|
|
|
|
|
|
|
|
|
|
|
|
|
|||||||||||||
| Non-interest bearing deposits |
13,415 | 12,435 | ||||||||||||||||||||||
| Non-interest bearing liabilities |
12,662 | 6,473 | ||||||||||||||||||||||
| Redeemable equity |
— | 3,605 | ||||||||||||||||||||||
| Shareholders’ equity |
91,316 | 48,529 | ||||||||||||||||||||||
| Noncontrolling interest |
(25 | ) | — | |||||||||||||||||||||
|
|
|
|
|
|||||||||||||||||||||
| Total liabilities and shareholders’ equity |
$ | 778,823 | $ | 483,622 | ||||||||||||||||||||
|
|
|
|
|
|||||||||||||||||||||
| Net interest income and interest rate spread |
$ | 5,041 | 2.92 | % | $ | 2,961 | 2.91 | % | ||||||||||||||||
|
|
|
|
|
|
|
|
|
|||||||||||||||||
| Net interest margin |
2.97 | 2.90 | ||||||||||||||||||||||
|
|
|
|
|
|||||||||||||||||||||
| Ratio of average interest-earning assets to average interest- bearing liabilities |
104.23 | % | 99.10 | % | ||||||||||||||||||||
|
|
|
|
|
|||||||||||||||||||||
58
Table of Contents
Rate/Volume Analysis. The following table sets forth the effects of changing rates and volumes on our net interest income. The rate column shows the effects attributable to changes in rate (changes in rate multiplied by current volume). The volume column shows the effects attributable to changes in volume (changes in volume multiplied by prior rate). The net column represents the sum of the prior columns. For purposes of this table, changes attributable to changes in both rate and volume that cannot be segregated have been allocated proportionally based on the changes due to rate and the changes due to volume.
| Three Months Ended March 31, | ||||||||||||||||||||||||
| 2015 | 2014 | |||||||||||||||||||||||
| Increase (Decrease) Due to | Increase (Decrease) Due to | |||||||||||||||||||||||
| Rate | Volume | Total | Rate | Volume | Total | |||||||||||||||||||
| (dollars in thousands) | ||||||||||||||||||||||||
| Interest income: |
||||||||||||||||||||||||
| Interest earning balances in other banks |
$ | 25 | $ | 18 | $ | 43 | $ | (30 | ) | $ | (4 | ) | $ | (34 | ) | |||||||||
| Investment securities |
(85 | ) | 161 | 76 | (28 | ) | 24 | (4 | ) | |||||||||||||||
| Loans held for sale |
46 | 1,646 | 1,692 | (127 | ) | 521 | 394 | |||||||||||||||||
| Loans held for investment |
1 | 934 | 935 | (60 | ) | 475 | 415 | |||||||||||||||||
| Subsidiary note receivable |
— | — | — | (30 | ) | (30 | ) | (60 | ) | |||||||||||||||
|
|
|
|
|
|
|
|
|
|
|
|
|
|||||||||||||
| Total interest income |
(13 | ) | 2,759 | 2,746 | (275 | ) | 986 | 711 | ||||||||||||||||
|
|
|
|
|
|
|
|
|
|
|
|
|
|||||||||||||
| Interest expense: |
||||||||||||||||||||||||
| Money market accounts |
(276 | ) | 240 | (36 | ) | (81 | ) | 126 | 45 | |||||||||||||||
| Certificates of deposit |
111 | 303 | 414 | 69 | 97 | 166 | ||||||||||||||||||
| Notes payable to investors |
(46 | ) | (45 | ) | (91 | ) | — | — | — | |||||||||||||||
| Other borrowings |
(53 | ) | 432 | 379 | (41 | ) | 30 | (11 | ) | |||||||||||||||
|
|
|
|
|
|
|
|
|
|
|
|
|
|||||||||||||
| Total interest bearing liabilities |
(264 | ) | 930 | 666 | (53 | ) | 253 | 200 | ||||||||||||||||
|
|
|
|
|
|
|
|
|
|
|
|
|
|||||||||||||
| Net interest income |
$ | (251 | ) | $ | 1,829 | $ | 2,080 | $ | (225 | ) | $ | 733 | $ | 511 | ||||||||||
|
|
|
|
|
|
|
|
|
|
|
|
|
|||||||||||||
Year ended December 31, 2014 vs. Year ended December 31, 2013
For the year ended December 31, 2014, net interest income increased $3.9 million, or 36%, to $14.7 million compared to the year ended December 31, 2013. This increase was due to growth in average interest earning assets combined with higher asset yields and a relatively stable cost of funds. Average interest earning assets increased by $117.7 million, or 32.2%, from fiscal year 2013 to 2014, while the related yield on average interest earning assets increased by six basis points to 4.24%, or an equivalent of $5.2 million. As a strategic initiative to develop market share as a de novo bank, we offered loans at highly competitive market rates in the development phase of our business. As the business evolved, we began pricing loans commensurate with premium market rates and the added value that accompanies each loan from our business advisory group, or BAG. We formed the BAG in 2010 to enhance our borrower experience by focusing specifically on the needs of our borrowers within each vertical. The BAG provides complementary advisory service to customers, such as receivables and inventory review, in conjunction with periodic financial health reviews which deepen existing relationships. While the corresponding cost of funds on interest bearing liabilities for fiscal year 2014 declined slightly by two basis points to 1.23%, the average balance in interest bearing liabilities increased by $111.7 million or 30.8%. As indicated in the below rate volume table, the slight drop in the cost of funds was outpaced by the effects of the increased volumes of interest bearing liabilities resulting in increased interest expense for fiscal year 2014 of $1.3 million. The primary mitigating factor to rising cost of funds was growth in total deposits in conjunction with the reduction of rates by seven basis points during fiscal year 2014. For the year ended December 31, 2014 compared to the year ended December 31, 2013, our net interest margin increased from 2.95% to 3.03% due to the aforementioned affects. As a bank without a branch network, we gather deposits over the Internet and in the community in which we are headquartered. Due to the nature of a branchless bank and low overhead required for deposit gathering, the rates we are able to offer are above the industry average. The Bank began, on a limited basis, publicly promoting its deposit products in fiscal year 2012, which accounts for the increase in interest bearing liabilities.
59
Table of Contents
Year ended December 31, 2013 vs. Year ended December 31, 2012
For the year ended December 31, 2013, net interest income increased $2.7 million, or 33.1%, to $10.8 million compared to the year ended December 31, 2012. This increase was due to growth in average interest earning assets combined with higher asset yields and a relatively stable cost of funds. Average interest earning assets increased by $80.3 million, or 28.1%, from fiscal year 2012 to 2013, while the related yield on average interest earning assets increased by eight basis points to 4.18%, or an equivalent of $3.6 million. As a strategic initiative to develop market share as a de novo bank, we offered loans at highly competitive market rates in the development phase of our business. As the business evolved, we began pricing loans commensurate with premium market rates and the added value that accompanies each loan from our BAG. While the corresponding cost of funds on interest bearing liabilities for fiscal year 2013 declined slightly by four basis points to 1.25%, the average balance in interest bearing liabilities increased by $80.1 million or 28.4%. As indicated in the below rate volume table, the slight drop in the cost of funds was outpaced by the effects of the increased volumes of interest bearing liabilities resulting in increased interest expense for fiscal year 2013 of $893 thousand. The primary mitigating factor to rising cost of funds was growth in money market funds in conjunction with lowering of money market rates by 13 basis points during fiscal year 2013. For the year ended December 31, 2013 compared to the year ended December 31, 2012, our net interest margin increased from 2.83% to 2.95% due to the aforementioned effects. As a bank without a branch network, we gather deposits over the Internet and in the community in which we are headquartered. Due to the nature of a branchless bank and low overhead required for deposit gathering, the rates we are able to offer are above the industry average. The Bank began, on a limited basis, publicly promoting its deposit products in fiscal year 2012, which accounts for the increase in interest bearing liabilities.
60
Table of Contents
Average Balances and Yields. The following table presents information regarding average balances for assets and liabilities, the total dollar amounts of interest income and dividends from average interest-earning assets, the total dollar amounts of interest expense on average interest-bearing liabilities, and the resulting average yields and costs. The yields and costs for the periods indicated are derived by dividing the income or expense by the average balances for assets or liabilities, respectively, for the periods presented. Loan fees are included in interest income on loans.
| Year Ended December 31, | ||||||||||||||||||||||||||||||||||||
| 2014 | 2013 | 2012 | ||||||||||||||||||||||||||||||||||
| Average Balance |
Interest | Average Yield/ Rate |
Average Balance |
Interest | Average Yield/ Rate |
Average Balance |
Interest | Average Yield/ Rate |
||||||||||||||||||||||||||||
| (dollars in thousands) | ||||||||||||||||||||||||||||||||||||
| Interest earning assets: |
||||||||||||||||||||||||||||||||||||
| Interest earning balances in other banks |
$ | 56,053 | $ | 163 | 0.29 | % | $ | 58,319 | $ | 126 | 0.22 | % | $ | 42,259 | $ | 80 | 0.19 | % | ||||||||||||||||||
| Investment securities |
29,634 | 455 | 1.53 | 17,543 | 391 | 2.23 | 15,726 | 467 | 2.97 | |||||||||||||||||||||||||||
| Loans held for sale |
306,026 | 15,421 | 5.04 | 232,632 | 11,815 | 5.08 | 189,924 | 9,456 | 4.98 | |||||||||||||||||||||||||||
| Loans held for investment |
91,964 | 4,470 | 4.86 | % | 54,468 | 2,666 | 4.89 | % | 37,841 | 1,722 | 4.55 | |||||||||||||||||||||||||
| Subsidiary note receivable |
— | — | — | 3,039 | 304 | 10.00 | — | — | 0.00 | |||||||||||||||||||||||||||
|
|
|
|
|
|
|
|
|
|
|
|
|
|
|
|
|
|
|
|||||||||||||||||||
| Total interest earning assets |
483,677 | 20,509 | 4.24 | 366,001 | 15,302 | 4.18 | 285,755 | 11,725 | 4.10 | |||||||||||||||||||||||||||
|
|
|
|
|
|
|
|
|
|
|
|
|
|
|
|
|
|
|
|||||||||||||||||||
| Less: Allowance for loan losses |
(3,228 | ) | (5,146 | ) | (5,279 | ) | ||||||||||||||||||||||||||||||
| Non-interest earning assets |
86,853 | 68,779 | 41,013 | |||||||||||||||||||||||||||||||||
|
|
|
|
|
|
|
|||||||||||||||||||||||||||||||
| Total assets |
$ | 567,302 | $ | 429,634 | $ | 321,489 | ||||||||||||||||||||||||||||||
|
|
|
|
|
|
|
|||||||||||||||||||||||||||||||
| Interest bearing liabilities: |
||||||||||||||||||||||||||||||||||||
| Savings |
$ | — | $ | — | — | % | $ | — | $ | — | 0.00 | % | $ | 275 | $ | 3 | 1.09 | % | ||||||||||||||||||
| Money market accounts |
215,745 | 2,270 | 1.05 | 186,265 | 2,401 | 1.29 | 107,513 | 1,530 | 1.42 | |||||||||||||||||||||||||||
| Certificates of deposit |
231,675 | 2,461 | 1.06 | 163,686 | 1,546 | 0.94 | 161,826 | 1,442 | 0.89 | |||||||||||||||||||||||||||
|
|
|
|
|
|
|
|
|
|
|
|
|
|
|
|
|
|
|
|||||||||||||||||||
| Total Deposits |
447,420 | 4,731 | 1.06 | 349,951 | 3,947 | 1.13 | 269,614 | 2,975 | 1.10 | |||||||||||||||||||||||||||
|
|
|
|
|
|
|
|
|
|
|
|
|
|
|
|
|
|
|
|||||||||||||||||||
| Small business lending fund |
6,800 | 102 | 1.50 | 6,800 | 102 | 1.50 | 6,800 | 102 | 1.50 | |||||||||||||||||||||||||||
| Notes payable to investors |
2,717 | 272 | 10.00 | 3,623 | 362 | 9.99 | 3,623 | 362 | 9.99 | |||||||||||||||||||||||||||
| Other borrowings |
16,983 | 747 | 4.40 | 1,826 | 110 | 6.02 | 2,044 | 189 | 9.25 | |||||||||||||||||||||||||||
|
|
|
|
|
|
|
|
|
|
|
|
|
|
|
|
|
|
|
|||||||||||||||||||
| Total interest bearing liabilities |
473,920 | 5,852 | 1.23 | 362,200 | 4,521 | 1.25 | 282,081 | 3,628 | 1.29 | |||||||||||||||||||||||||||
|
|
|
|
|
|
|
|
|
|
|
|
|
|
|
|
|
|
|
|||||||||||||||||||
| Non-interest bearing deposits |
11,492 | 15,732 | 5,265 | |||||||||||||||||||||||||||||||||
| Non-interest bearing liabilities |
8,264 | 4,350 | 2,775 | |||||||||||||||||||||||||||||||||
| Redeemable equity |
2,391 | 2,681 | 216 | |||||||||||||||||||||||||||||||||
| Shareholders’ equity |
71,235 | 44,671 | 31,799 | |||||||||||||||||||||||||||||||||
| Noncontrolling interest |
— | — | (647 | ) | ||||||||||||||||||||||||||||||||
|
|
|
|
|
|
|
|||||||||||||||||||||||||||||||
| Total liabilities and shareholders’ equity |
$ | 567,302 | $ | 429,634 | $ | 321,489 | ||||||||||||||||||||||||||||||
|
|
|
|
|
|
|
|||||||||||||||||||||||||||||||
| Net interest income and interest rate spread |
$ | 14,657 | 3.01 | % | $ | 10,781 | 2.93 | % | $ | 8,097 | 2.82 | % | ||||||||||||||||||||||||
|
|
|
|
|
|
|
|
|
|
|
|
|
|||||||||||||||||||||||||
| Net interest margin |
3.03 | 2.95 | 2.83 | |||||||||||||||||||||||||||||||||
|
|
|
|
|
|
|
|||||||||||||||||||||||||||||||
| Ratio of average interest-earning assets to average interest-bearing liabilities |
102.06 | % | 101.05 | % | 101.30 | % | ||||||||||||||||||||||||||||||
|
|
|
|
|
|
|
|||||||||||||||||||||||||||||||
Rate/Volume Analysis. The following table sets forth the effects of changing rates and volumes on our net interest income. The rate column shows the effects attributable to changes in rate (changes in rate multiplied by current volume). The volume column shows the effects attributable to changes in volume (changes in volume
61
Table of Contents
multiplied by prior rate). The net column represents the sum of the prior columns. For purposes of this table, changes attributable to changes in both rate and volume that cannot be segregated have been allocated proportionally based on the changes due to rate and the changes due to volume.
| Year Ended December 31, | ||||||||||||||||||||||||
| 2014 | 2013 | |||||||||||||||||||||||
| Increase (Decrease) Due to | Increase (Decrease) Due to | |||||||||||||||||||||||
| Rate | Volume | Total | Rate | Volume | Total | |||||||||||||||||||
| (dollars in thousands) | ||||||||||||||||||||||||
| Interest income: |
||||||||||||||||||||||||
| Interest earning balances in other banks |
$ | 43 | $ | (6 | ) | $ | 37 | $ | 13 | $ | 33 | $ | 46 | |||||||||||
| Investment securities |
(164 | ) | 228 | 64 | (123 | ) | 47 | (76 | ) | |||||||||||||||
| Loans held for sale |
(107 | ) | 3,713 | 3,606 | 212 | 2,147 | 2,359 | |||||||||||||||||
| Loans held for investment |
(25 | ) | 1,829 | 1,804 | 159 | 785 | 944 | |||||||||||||||||
| Subsidiary note receivable |
(152 | ) | (152 | ) | (304 | ) | 152 | 152 | 304 | |||||||||||||||
|
|
|
|
|
|
|
|
|
|
|
|
|
|||||||||||||
| Total interest income |
(405 | ) | 5,612 | 5,207 | 413 | 3,164 | 3,577 | |||||||||||||||||
|
|
|
|
|
|
|
|
|
|
|
|
|
|||||||||||||
| Interest expense: |
||||||||||||||||||||||||
| Savings |
— | — | — | (1 | ) | (2 | ) | (3 | ) | |||||||||||||||
| Money market accounts |
(476 | ) | 345 | (131 | ) | (197 | ) | 1,068 | 871 | |||||||||||||||
| Certificates of deposit |
233 | 682 | 915 | 87 | 17 | 104 | ||||||||||||||||||
| Notes payable to investors |
1 | (91 | ) | (90 | ) | — | — | — | ||||||||||||||||
| Other borrowings |
(153 | ) | 791 | 638 | (62 | ) | (17 | ) | (79 | ) | ||||||||||||||
|
|
|
|
|
|
|
|
|
|
|
|
|
|||||||||||||
| Total interest bearing liabilities |
(395 | ) | 1,727 | 1,332 | (173 | ) | 1,066 | 893 | ||||||||||||||||
|
|
|
|
|
|
|
|
|
|
|
|
|
|||||||||||||
| Net interest income |
$ | (10 | ) | $ | 3,885 | $ | 3,875 | $ | 586 | $ | 2,098 | $ | 2,684 | |||||||||||
|
|
|
|
|
|
|
|
|
|
|
|
|
|||||||||||||
Provision for Loan Losses. The provision for loan losses represents our derivation of the amount necessary to be charged against the current period’s earnings to maintain the allowance for loan losses at a level that is adequate in relation to the estimated losses inherent in the loan portfolio. We consider a number of factors in determining the required level of our loan reserves and the provision required to achieve the appropriate reserve level, including loan growth, credit risk rating trends, nonperforming loan levels, delinquencies, loan portfolio concentrations and economic and market trends.
Losses inherent in loan relationships are mitigated by the portion of the loan that is guaranteed by the SBA. A typical SBA 7(a) loan carries a 75% guarantee, which greatly reduces the risk profile of these loans. Our focus on compliance with regulations and guidance from the SBA is paramount to our continued success within this space. As discussed in the paragraphs below, we believe that the risk associated with our portfolio should be assessed with greater emphasis placed on the unguaranteed exposure.
Three Months Ended March 31, 2015 vs. Three Months Ended March 31, 2014
For the three months ended March 31, 2015, the provision for loan losses was $1.1 million, an increase of $0.7 million, or 154.0%, compared to the same period in 2014. The higher provision for loan losses for the three months ended March 31, 2015 was in response to substantial loan growth. Much of our loan growth occurred within new lending verticals with higher loss factors due to our lack of historical experience in those industries. Net loan charge-offs were $250.6 thousand for the three months ended March 31, 2015 compared to net recoveries of $66.9 thousand for the three months ended March 31, 2014. In addition, at March 31, 2015, nonperforming loans not guaranteed by the SBA totaled $2.9 million, which was 1.3% of our held-for-investment loan portfolio compared to $1.6 million, or 1.0%, of loans held for investment at March 31, 2014.
Year ended December 31, 2014 vs. Year ended December 31, 2013
For the year ended December 31, 2014, the provision for loan losses was $2.8 million, an increase of $3.7 million, or 425.5%, compared to the same period in 2013. The higher provision for loan losses in 2014 was
62
Table of Contents
primarily the result of an increase in reserves on impaired loans of $1.1 million, coupled with loan loss provisions totaling approximately $1.7 million in response to substantial loan growth and increases in qualitative reserves, partially mitigated by our declining loss ratios. Much of our loan growth occurred within new lending verticals with higher loss factors due to the Company’s lack of historical experience in those industries. Net loan charge-offs were $1.1 million for the fiscal year ended December 31, 2014, compared to $1.89 million for fiscal year 2013, equating to 0.28% and 0.66% of average loans for the respective periods. In addition, at December 31, 2014, nonperforming loans not guaranteed by the SBA totaled $3.1 million, which was 1.5% of our held-for-investment loan portfolio compared to $1.7 million, or 1.2%, of loans held for investment at December 31, 2013.
Year ended December 31, 2013 vs. Year ended December 31, 2012
For the year ended December 31, 2013, the provision for loan losses was recorded as a recovery of $858 thousand, a decrease of $3.0 million, or (140.7%), compared to the same period in 2012. The lower provision for loan losses for the year ended 2013 was primarily the result of a decline in specific reserves on impaired loans of $2.1 million partially offset by loan loss provisions totaling approximately $1.3 million, as a result of improving credit quality and a migration from peer to actual loss history in maturing lending verticals, from December 31, 2013 to December 31, 2012. Evidence of the improving credit quality is reflected principally in the stabilization of net loan charge-offs for 2013. Net loan charge-offs were $1.89 million for the fiscal year ended December 31, 2013, compared to $1.86 million for fiscal year 2012, equating to 0.66% and 0.82% of average loans for the respective periods. In addition, at December 31, 2013, nonperforming loans not guaranteed by the SBA totaled $1.7 million, which was 1.2% of our held for investment loan portfolio compared to $3.5 million, or 3.8%, of loans held for investment at December 31, 2012. The stabilization of charge off experience, declining nonperforming loan balances which were not guaranteed by the SBA, and our migration from peer-based historical loss data to our own actual historical loss rates, all contributed to a lower provision in fiscal year 2013. However, the impact of these trends was somewhat offset by significant growth in our loans held for investment portfolio.
Noninterest Income
Noninterest income, a primary contributor to our earnings, principally represents income from the sale of SBA-guaranteed loans. This income is comprised of loan servicing revenue and revaluation and net gains on sales of loans. Our revenue from the sale of loans depends upon volume and rates of loans as well as the cost and availability of funds to bridge between funding and closing of sale. In addition, the loan servicing revaluation is significantly impacted by changes in market rates and other underlying assumptions such as cost to service, prepayment speeds and default rates. Other less common elements of noninterest income include nonrecurring gains and losses on investments.
The following table shows the components of noninterest income and the dollar and percentage changes for the three months ended March 31, 2015 and 2014.
| Three Months Ended March 31 |
2014/2015 Increase | |||||||||||||||
| 2015 | 2014 | Amount | Percent | |||||||||||||
| (dollars in thousands) | ||||||||||||||||
| Noninterest income: |
||||||||||||||||
| Loan servicing revenue |
$ | 3,984 | $ | 3,320 | $ | 664 | 20.0 | % | ||||||||
| Loan servicing revaluation |
122 | (620 | ) | 742 | 119.7 | |||||||||||
| Net gains on sales of loans |
15,461 | 10,031 | 5,430 | 54.1 | ||||||||||||
| Equity in income (loss) of non-consolidated affiliates |
(26 | ) | (994 | ) | 968 | 97.4 | ||||||||||
| Gain on sale of investment in non-consolidated affiliate |
3,782 | — | 3,782 | 100.0 | ||||||||||||
| Other noninterest income |
732 | 468 | 264 | 56.4 | ||||||||||||
|
|
|
|
|
|
|
|
|
|||||||||
| Total noninterest income |
$ | 24,055 | $ | 12,205 | $ | 11,850 | 97.1 | % | ||||||||
|
|
|
|
|
|
|
|
|
|||||||||
63
Table of Contents
Three Months Ended March 31, 2015 vs. Three Months Ended March 31, 2014
For the three months ended March 31, 2015, noninterest income increased by $11.9 million, or 97.1%, compared to the three months ended March 31, 2014. Increases in the serviced loan portfolio and the volume of loans sold in the secondary market, the core components of our business, contributed $6.1 million to noninterest income growth, including $664 thousand of increased servicing revenue and $5.4 million of increased gains on sale of loans.
While portions of the loans that we originate are sold and generate premium revenue, servicing rights for all loans that we originate are retained by the Bank. In exchange for continuing to service loans that are sold, the Bank receives fee income represented in loan servicing revenue equivalent to one percent of the outstanding sold loan balance. In addition, the cost of servicing sold loans is approximately 0.40% which is included in the loan servicing revaluation computations. Unrecognized servicing revenue is reflected in a servicing asset recorded on our balance sheet. Revenues associated with the servicing of loans are recognized over the expected life of the loan as a reduction of the servicing asset. For the three months ended March 31, 2015, loan servicing revenue increased $664 thousand, or 20.0%, compared to the three months ended March 31, 2014, as a result of an increase in the average outstanding balance of guaranteed loans sold. At March 31, 2015, the outstanding balance of guaranteed loans sold in the secondary market was $1.4 billion, with a weighted average servicing rate of 1.10%. At March 31, 2014, the outstanding balance of guaranteed loans sold was $1.1 billion, with a weighted average servicing rate of 1.14%. Prior to January 2010, we sold loans for servicing in excess of 1.0%. As loans sold for servicing in excess of 1.0% prior to fiscal year 2010 amortize, we expect that the weighted average servicing rate will approach and stabilize at approximately 1.0%.
We revalue our serviced loan portfolio at least quarterly. The revaluation considers the amortization of the portfolio, current market conditions for premium loan sales, and current prepayment speeds. For the three months ended March 31, 2015, the loan servicing revaluation adjustment decreased by $742 thousand or 119.7%, moving to a positive $121.8 thousand compared to the three months ended March 31, 2014. At March 31, 2015, the positive loan servicing revaluation balance of $121.8 thousand was principally attributed to $1.6 million related to changes in market conditions partially offset by $1.3 million in amortization of the serviced portfolio and $201 thousand related to changes in prepayment speeds. In comparison, the loan servicing revaluation balance at March 31, 2014 of $620 thousand was composed of $1.8 million from amortization of the serviced portfolio and $121 thousand from changes in prepayment speeds, partially offset by $1.2 million in value arising from positive market conditions at that time.
For the three months ended March 31, 2015, net gains on sales of loans increased $5.4 million, or 54.1%, compared to the three months ended March 31, 2014. The increase was primarily due to an increase in the volume of guaranteed loans sold by $49.5 million, or 56.5%, from $87.6 million for the three months ended March 31, 2014 to $137.0 million for the three months ended March 31, 2015. The premium market had a negligible impact on the net gain on sale of loans. The average net gain on sale was somewhat higher at $114.5 thousand of revenue for each $1 million in loans sold for the three months ended March 31, 2014, compared to $112.8 thousand of revenue for each $1 million sold for the three months ended March 31, 2015. Cash received for the loans sold during the three months ended March 31, 2015 and 2014 was $181.0 million and $103.1 million, respectively.
The growth of noninterest income for the three months ended March 31, 2015 compared to the three months ended March 31, 2014 was enhanced by a gain of $3.8 million on the sale of our subsequent investment in nCino. This sale of our investment in this non-consolidated affiliate comprised 100% of our investment in nCino. Gross proceeds from this sale were used to repay in full the $6.1 million in short term borrowings outstanding at December 31, 2014. At March 31, 2015, we did not have any equity or cost method investments in non-consolidated affiliates.
64
Table of Contents
The following table shows the components of noninterest income and the dollar and percentage changes for the years ended December 31, 2014, 2013 and 2012.
| 2013/2014 | 2012/2013 | |||||||||||||||||||||||||||
| Year Ended December 31 | Increase (Decrease) | Increase (Decrease) | ||||||||||||||||||||||||||
| 2014 | 2013 | 2012 | Amount | Percent | Amount | Percent | ||||||||||||||||||||||
| (dollars in thousands) | ||||||||||||||||||||||||||||
| Noninterest income — excluding nCino, LLC: |
||||||||||||||||||||||||||||
| Loan servicing revenue |
$ | 15,599 | $ | 11,535 | $ | 9,268 | $ | 4,064 | 35.2 | % | $ | 2,267 | 24.5 | % | ||||||||||||||
| Loan servicing revaluation |
(4,977 | ) | (3,609 | ) | (922 | ) | (1,368 | ) | 37.9 | 2,687 | 291.4 | |||||||||||||||||
| Net gains on sales of loans |
49,977 | 38,225 | 33,535 | 11,752 | 30.7 | 4,690 | 14.0 | |||||||||||||||||||||
| Gain on deconsolidation of subsidiary |
— | 12,212 | — | (12,212 | ) | 100.0 | 12,212 | 100.0 | ||||||||||||||||||||
| Equity in income (loss) of non-consolidated affiliates |
(2,221 | ) | (2,756 | ) | — | 535 | (19.4 | ) | (2,756 | ) | (100.0 | ) | ||||||||||||||||
| Gain on sale of securities available for sale |
(74 | ) | 11 | — | (85 | ) | (772.7 | ) | 11 | 100 | ||||||||||||||||||
| Other noninterest income |
1,738 | 684 | 57 | 1,054 | 154.1 | 627 | 1,100.0 | |||||||||||||||||||||
|
|
|
|
|
|
|
|
|
|
|
|
|
|
|
|||||||||||||||
| Subtotal |
$ | 60,042 | $ | 56,302 | $ | 41,938 | $ | 3,740 | 6.6 | % | $ | 14,364 | 34.3 | % | ||||||||||||||
| Noninterest income — nCino, LLC: |
||||||||||||||||||||||||||||
| Software professional services |
$ | — | $ | 103 | 234 | (103 | ) | (100.0 | )% | (131 | ) | (56.0 | )% | |||||||||||||||
| Software subscription fee |
— | 56 | 297 | (56 | ) | (100.0 | ) | (241 | ) | (81.1 | ) | |||||||||||||||||
| Sales of support contracts |
— | 6 | 11 | (6 | ) | (100.0 | ) | (5 | ) | (45.5 | ) | |||||||||||||||||
|
|
|
|
|
|
|
|
|
|
|
|
|
|
|
|||||||||||||||
| Subtotal |
— | 165 | 542 | (165 | ) | (100.0 | )% | (377 | ) | (69.6 | )% | |||||||||||||||||
|
|
|
|
|
|
|
|
|
|
|
|
|
|
|
|||||||||||||||
| Total noninterest income |
$ | 60,042 | $ | 56,467 | $ | 42,480 | $ | 3,575 | 6.3 | % | $ | 13,987 | 32.9 | % | ||||||||||||||
|
|
|
|
|
|
|
|
|
|
|
|
|
|
|
|||||||||||||||
Year ended December 31, 2014 vs. Year ended December 31, 2013
For the year ended December 31, 2014, noninterest income increased by $3.6 million, or 6.3%, compared to the year ended December 31, 2013. Increases in loan production, the core component of our business, as well as the volume of loans sold in the secondary market, contributed $15.9 million to noninterest income growth, including $4.1 million of increased servicing revenue and $11.8 million of increased gains on sale of loans.
For the year ended December 31, 2014, net gains on sales of loans increased $11.8 million, or 30.7%, compared to the year ended December 31, 2013. The increase was primarily due to an increase in the volume of guaranteed loans sold by $94.6 million, or 27.9%, from $339.3 million for the year ended December 31, 2013 to $433.9 million for the year ended December 31, 2014. The increase was also the result of an improvement in the premium market from an average of $113.1 thousand per $1 million for the year ended December 31, 2013 to an average of $115.2 thousand per $1 million sold for the year ended December 31, 2014. The book value of loans sold during the years ended December 31, 2014 and 2013 was $434 million and $339 million, respectively. Cash received for the loans sold during the year ended December 31, 2014 and 2013 was $478 million and $374 million, respectively.
While portions of the loans that we originate are sold, generating premium revenue, servicing rights for all loans that we originate are retained by the Bank. In exchange for continuing to service loans that are sold, the Bank receives fee income represented in loan servicing revenue equivalent to one percent of the loan balance. In addition, the cost of servicing sold loans is approximately 0.40% which is included in the loan servicing revaluation computations. Unrecognized servicing revenue is reflected in a servicing asset recorded on our balance sheet. Revenues associated with the servicing of loans are recognized over the expected life of the loan as a reduction of the servicing asset. For the year ended December 31, 2014, loan servicing revenue increased $4.1 million, or 35.2%, compared to the year ended December 31, 2013, as a result of an increase in the average
65
Table of Contents
outstanding balance of guaranteed loans sold due to an increase in the volume of loans sold throughout the year. At year end December 31, 2014, the outstanding balance of loans sold in the secondary market was $1.3 billion, with a weighted average servicing rate of 1.11%. For the year ended December 31, 2013, the outstanding balance of loans sold was $1 billion, with a weighted average servicing rate of 1.16%. Prior to January 2010, we sold loans for servicing in excess of 1.0%. As loans sold for servicing in excess of 1.0% prior to fiscal year 2010 amortize, we expect that the weighted average servicing rate will approach and stabilize at approximately 1.0%.
For the year ended December 31, 2014, the loan servicing revaluation adjustment increased by $1.4 million or 37.9% over the year ended December 31, 2013. Much of this increase was associated with the continued growth in the loan portfolio serviced. At December 31, 2014 our loan servicing revaluation balance of $5.0 million was comprised of $5.9 million in amortization of the serviced portfolio and $550 thousand related to changes in prepayment speeds, partially offset by $1.5 million in an upward adjustment in value arising from market conditions at that time. In comparison, the loan servicing revaluation balance at December 31, 2013 of $3.6 million was comprised of $3.6 million from amortization of the serviced portfolio and $77 thousand from a negative adjustment in value arising from market conditions at that time, partially offset by $29 thousand in revenue related to changes in prepayment speeds.
The growth of noninterest income from fiscal year 2013 to fiscal year 2014 was heavily dampened by the one-time gain of $12.2 million in fiscal year 2013. For the year ended December 31, 2013, the gain on the deconsolidation of our investment in nCino was $12.2 million, which resulted from the combination of a gain of $9.7 million related to the measurement of the retained investment in nCino at fair value and $2.5 million related to the recovery of negative net assets in nCino at the date of deconsolidation.
For the year ended December 31, 2014, we had one equity method investment: 504 Fund Advisors, LLC, or 504 FA, which totaled $231.4 thousand. Losses attributable to 504 FA for the year ended December 31, 2014 totaled $410.8 thousand compared to a partial-year net loss of $107.8 thousand for the year ended December 31, 2013.
For the six months ended June 30, 2014, we carried ownership in nCino as an equity method investment. Our ownership of nCino was distributed pro rata to our shareholders at June 30, 2014. Losses attributable to nCino for the six months ended June 30, 2014, totaled $1.8 million compared to a net loss of $2.6 million for the year ended December 31, 2013.
On August 4, 2014, we acquired 9.0% ownership through the purchase of shares from an existing nCino shareholder. For the year ended December 31, 2014, we carried ownership of nCino as a cost method investment totaling $6.1 million. As of the date of this prospectus, we no longer hold an ownership interest in nCino.
Year ended December 31, 2013 vs. Year ended December 31, 2012
For the year ended December 31, 2013, noninterest income increased by $14.0 million, or 32.9%, compared to the year ended December 31, 2012. Increases in loan production, the core component of our business, as well as the volume of loans sold in the secondary market, contributed $7.0 million to noninterest income growth, including $2.3 million of increased servicing revenue and $4.7 million of increased net gains on sale of loans.
For the year ended December 31, 2013, net gains on sales of loans increased $4.7 million, or 14.0%, compared to the year ended December 31, 2012. The increase was primarily due to an increase in the volume of guaranteed loans sold by $62.6 million, or 22.6%, from $276.7 million for the year ended December 31, 2012 to $339.3 million for the year ended December 31, 2013. The increase was partially offset by a decrease in the premium market from an average of $121.3 thousand per $1 million for the year ended December 31, 2012 to an average of $113.1 thousand per $1.0 million sold for the year ended December 31, 2013. We believe the decrease in 2013 represented a return to premiums more in line with historical trends. The book value of loans sold during the years ended December 31, 2013 and 2012 was $339 million and $277 million, respectively. Cash received for the loans sold during the year ended December 31, 2013 and 2012 was $374 million and $307 million, respectively.
66
Table of Contents
For the year ended December 31, 2013, loan servicing revenue increased $2.3 million, or 24.5%, compared to the year ended December 31, 2012, as a result of an increase in the average outstanding balance of guaranteed loans sold due to an increase in the volume of loans sold throughout the year. At year end December 31, 2013, the outstanding balance of loans sold in the secondary market was $1 billion, with a weighted average servicing rate of 1.16%. For the year ended December 31, 2012, the outstanding balance of loans sold was $767.7 million, with a weighted average servicing rate of 1.24%. Prior to January 2010, we sold loans for servicing in excess of 1.0%. As loans sold prior to fiscal 2010 amortize, we expect that the weighted average servicing rate will approach and stabilize at approximately 1.0%.
For the year ended December 31, 2013, the loan servicing revaluation adjustment increased by $2.7 million or 291.4% over the year ended December 31, 2012. Much of this increase was associated with the significant growth in the loan portfolio serviced and related amortization. At December 31, 2013, the loan servicing valuation balance of $3.6 million was comprised of $3.5 million from amortization of the serviced portfolio and $77 thousand from a negative adjustment in value arising from market conditions at that time, partially offset by $29 thousand in revenue related to changes in prepayment speeds. In comparison, the loan servicing valuation balance at December 31, 2012 of $922 thousand was comprised of $3.3 million from amortization of the serviced portfolio, partially offset by a $640 thousand charge related to changes in prepayment speeds and $1.7 million positive adjustment in value arising from market conditions at that time. We revalue servicing rights retained at least quarterly and consider the amortization of the portfolio, current market conditions for premium loan sales, and current prepayment speeds. Loans sold prior to 2010 resulted in a larger servicing asset component per loan sale as a function of the servicing retained in excess of 1.0%. Accordingly, the amortization of servicing rights retained from periods prior to fiscal 2011 results in significant decreases in the servicing asset value in subsequent periods. Additionally, the progression into a higher interest rate environment results in a higher prepayment speed, as our loans have historically been primarily variable rate loans adjusting quarterly, which reduces the servicing asset value.
On January 28, 2013, our ownership in nCino declined by 21.54%, from 64.36% to 42.82%. This decrease in ownership and related influence occurred as a result of nCino selling additional equity to outside investors for $7.5 million, which we refer to as the nCino Capital Raise. As a result, we deconsolidated nCino and accounted for our remaining 42.82% investment using the equity method. We did not receive any consideration in conjunction with the nCino Capital Raise.
The fair value of our retained noncontrolling investment in nCino at the date of deconsolidation ($9.7 million) was determined based upon the sales price of nCino equity in conjunction with the nCino Capital Raise ($1.485 per share multiplied by 6,500,000 nCino shares, identical to those sold to and owned by us). The nCino Capital Raise was comprised of 71 individual investors and raised an aggregate of $7.5 million. A second capital raise of $1.4 million occurred in April 2013, comprised of 41 individual investors at $1.485 per share as well. Due to the quantity of individual investors, we considered the nCino Capital Raise a reasonable representation of the entity’s fair value. In addition, due to cumulative losses experienced by nCino, our carrying amount in the remaining noncontrolling interest at the date of deconsolidation was a negative $2.5 million. Management’s interpretation on ASC 810’s guidance on deconsolidation of a subsidiary indicates that when the carrying amount of the net assets of the subsidiary is negative, the investment carrying amount should be adjusted to zero, with the contra credited to income.
We accounted for our investment in nCino as an equity method investment. Our carrying value of the investment in nCino was $11.3 million as of December 31, 2013. The fair value of the nCino investment at December 31, 2013 was approximately $21.1 million. Total nCino units owned by us at December 31, 2013 totaled 8,174,409. Based on this transaction and our evaluation of financial valuation data prepared by the investors in the transaction, we did not consider the investment impaired at December 31, 2013.
Our 2013 ownership of nCino up to the January 28, 2013 deconsolidation date was 64.36%. The net losses attributable to nCino for that period were $337 thousand, with $217 thousand of that amount allocated to us. For fiscal 2012, our ownership of nCino was also 64.36%. The net losses attributable to nCino for the full year of
67
Table of Contents
2012 were $3.6 million, with $2.3 million of that amount allocated to us. nCino was formed in 2012, so there were no business operations in fiscal 2011.
For the year ended December 31, 2013, we had two equity method investments: nCino, and 504 FA, which totaled $11.5 million. Losses attributable to these entities for the year ended December 31, 2013 totaled $2.8 million.
Noninterest Expense
Noninterest expense comprises all operating costs of the Company, such as travel, professional services, advertising and marketing expenses, exclusive of interest and income tax expense.
The following table shows the components of noninterest expense and the related dollar and percentage changes for the three months ended March 31, 2015 and 2014.
| Three Months Ended March 31 |
2014/2015 Increase (Decrease) |
|||||||||||||||
| 2015 | 2014 | Amount | Percent | |||||||||||||
| (dollars in thousands) | ||||||||||||||||
| Noninterest expense |
||||||||||||||||
| Salaries and employee benefits |
$ | 8,355 | $ | 9,701 | $ | (1,346 | ) | (13.9 | )% | |||||||
| Non staff expenses: |
||||||||||||||||
| Travel expense |
1,460 | 750 | 710 | 94.7 | % | |||||||||||
| Professional services expense |
908 | 935 | (27 | ) | (2.9 | )% | ||||||||||
| Advertising and Marketing expense |
1,008 | 798 | 210 | 26.3 | % | |||||||||||
| Occupancy expense |
457 | 437 | 20 | 4.6 | % | |||||||||||
| Data processing expense |
893 | 429 | 464 | 108.2 | % | |||||||||||
| Equipment expense |
404 | 253 | 151 | 59.7 | % | |||||||||||
| Other expense |
1,203 | 1,141 | 62 | 7.7 | % | |||||||||||
|
|
|
|
|
|
|
|
|
|||||||||
| Total non-staff expenses |
6,333 | 4,743 | 1,590 | 33.5 | ||||||||||||
| Total noninterest expense |
$ | 14,688 | $ | 14,444 | $ | 244 | 1.7 | % | ||||||||
|
|
|
|
|
|
|
|
|
|||||||||
Three Months Ended March 31, 2015 vs. Three Months Ended March 31, 2014
For the three months ended March 31, 2015, we recognized $14.7 million in total noninterest expense, an increase of $244 thousand, or 1.7%, compared to the three months ended March 31, 2014. The nominal growth in total noninterest expense was the result of a $1.3 million decrease in staff expenses for the period ended March 31, 2015, offset by increases in travel, data processing and advertising expense. During the period ended March 31, 2014, $3.0 million in compensation expense was recognized for stock grants to key employees. Noninterest expense not related to compensation increased $1.6 million during the period ended March 31, 2015 compared to the same period in 2014.
Salaries and employee benefits: For the three months ended March 31, 2015, total personnel expense decreased by $1.3 million, or (13.9)%, to $8.4 million compared to the three months ended March 31, 2014. This decrease resulted primarily from $4.4 million of stock grants and associated tax payments during the three months ended March 31, 2014. Excluding the stock grant and associated taxes, salaries and benefits increased $3.0 million, or 57.6%, for the three months ended March 31, 2015 from $5.3 million for the three months ended March 31, 2014. The increase was the result of further investment in human capital to support our growing loan production and service portfolio.
Travel expense: For the three months ended March 31, 2015, total travel costs increased by $710 thousand, or 94.7%, to $1.5 million compared to the three months ended March 31, 2014. Travel costs are a crucial element of our national footprint since we do not maintain brick and mortar locations. The increase in travel-related expenses was the result of our growing loan production 83.5% from $135.2 million for the three months ended March 31, 2014 to $248.1 million for the three months ended March 31, 2015. Travel costs also increased due to
68
Table of Contents
our customer relationship management strategy via our business advisory group, or BAG, one of our primary differentiators, as a result of servicing a $2.1 billion loan portfolio as of March 31, 2015. Travel expense represented 9.9% of total noninterest expense.
Professional service expense: For the three months ended March 31, 2015, the total cost of professional services decreased by $27 thousand, or (2.9)%, compared to the three months ended March 31, 2014. The decrease was primarily attributable to consulting expenses we incurred during the three months ended March 31, 2014 during the exploration of various capital raising opportunities.
Data processing expense: For the three months ended March 31, 2015, the total costs associated with data processing and development increased $464 thousand, or 108.2%, to $893 thousand from $429 thousand for the three months ended March 31, 2014. This increase was primarily due to the resources dedicated to customization of the nCino platform for the Bank.
Advertising and Marketing expense: For the three months ended March 31, 2015, the total costs of advertising and marketing was $1.0 million, an increase of $0.2 million, or 26.3%, compared to the three months ended March 31, 2014. The increase was due primarily to our efforts to promote brand recognition in newer verticals through advertising and trade show presence.
The following table shows the components of noninterest expense and the related dollar and percentage changes for the years ended December 31, 2014, 2013 and 2012.
| Year Ended December 31 | 2013/2014 Increase (Decrease) |
2012/2013 Increase (Decrease) |
||||||||||||||||||||||||||
| 2014 | 2013 | 2012 | Amount | Percent | Amount | Percent | ||||||||||||||||||||||
| (dollars in thousands) | ||||||||||||||||||||||||||||
| Noninterest expense — excluding nCino, Inc.: |
||||||||||||||||||||||||||||
| Salaries and employee benefits |
$ | 29,165 | $ | 20,417 | $ | 15,757 | $ | 8,748 | 42.85 | % | $ | 4,660 | 29.57 | % | ||||||||||||||
| Non staff expenses: |
||||||||||||||||||||||||||||
| Travel expense |
5,392 | 4,442 | 2,825 | 950 | 21.39 | % | 1,617 | 57.24 | % | |||||||||||||||||||
| Professional services expense |
4,100 | 2,181 | 1,812 | 1,919 | 87.99 | % | 369 | 20.36 | % | |||||||||||||||||||
| Advertising and Marketing expense |
3,316 | 2,305 | 1,975 | 1,011 | 43.86 | % | 330 | 16.71 | % | |||||||||||||||||||
| Occupancy expense |
1,771 | 1,676 | 666 | 95 | 5.67 | % | 1,010 | 151.65 | % | |||||||||||||||||||
| Data processing expense |
2,660 | 1,748 | 1,405 | 912 | 52.17 | % | 343 | 24.41 | % | |||||||||||||||||||
| Equipment expense |
1,422 | 1,042 | 707 | 380 | 36.47 | % | 335 | 47.38 | % | |||||||||||||||||||
| Other expense |
6,644 | 5,881 | 4,133 | 763 | 12.97 | % | 1,748 | 42.29 | % | |||||||||||||||||||
|
|
|
|
|
|
|
|
|
|
|
|
|
|
|
|||||||||||||||
| Total non-staff expenses excluding nCino, Inc. |
25,305 | 19,275 | 13,523 | 6,030 | 31.28 | % | 5,752 | 42.53 | % | |||||||||||||||||||
|
|
|
|
|
|
|
|
|
|
|
|
|
|
|
|||||||||||||||
| Total noninterest expense excluding nCino, Inc. |
54,470 | 39,692 | 29,280 | 14,778 | 37.23 | % | 10,412 | 35.56 | % | |||||||||||||||||||
| Noninterest expense — nCino, Inc.: |
||||||||||||||||||||||||||||
| Salaries and employee benefits |
— | 349 | 2,211 | (349 | ) | (100.00 | )% | (1,862 | ) | (84.22 | )% | |||||||||||||||||
| Travel expense |
— | 16 | 290 | (16 | ) | (100.00 | )% | (274 | ) | (94.48 | )% | |||||||||||||||||
| Professional services expense |
— | 56 | 768 | (56 | ) | (100.00 | )% | (712 | ) | (92.71 | )% | |||||||||||||||||
| Advertising and Marketing expense |
— | 11 | 206 | (11 | ) | (100.00 | )% | (195 | ) | (94.66 | )% | |||||||||||||||||
| Occupancy expense |
— | 2 | 13 | (2 | ) | (100.00 | )% | (11 | ) | (84.62 | )% | |||||||||||||||||
| Data processing expense |
— | 1 | 15 | (1 | ) | (100.00 | )% | (14 | ) | (93.33 | )% | |||||||||||||||||
| Equipment expense |
— | — | 31 | — | (100.00 | )% | (31 | ) | (100.00 | )% | ||||||||||||||||||
| Other expense |
— | 37 | 855 | (37 | ) | (100.00 | )% | (818 | ) | (95.61 | )% | |||||||||||||||||
|
|
|
|
|
|
|
|
|
|
|
|
|
|
|
|||||||||||||||
| Total noninterest expense of nCino, LLC |
— | 472 | 4,389 | (472 | ) | (100.00 | )% | (3,917 | ) | 89.25 | )% | |||||||||||||||||
|
|
|
|
|
|
|
|
|
|
|
|
|
|
|
|||||||||||||||
| Total noninterest expense |
$ | 54,470 | $ | 40,164 | $ | 33,669 | $ | 14,306 | 35.62 | % | $ | 6,495 | 19.29 | % | ||||||||||||||
|
|
|
|
|
|
|
|
|
|
|
|
|
|
|
|||||||||||||||
69
Table of Contents
Year ended December 31, 2014 vs. Year ended December 31, 2013
For the year ended December 31, 2014, we recognized $54.5 million in total noninterest expense, an increase of $14.3 million, or 35.6%, compared to the year ended December 31, 2013. Excluding nCino, total noninterest expense increased by $14.8 million, or 37.2%, for the year ended December 31, 2014 compared to the year ended December 31, 2013. We discuss the primary drivers of this increase below.
Salaries and employee benefits: For the year ended December 31, 2014, total personnel expense increased by $8.4 million, or 40.4%, compared to the year ended December 31, 2013. Excluding nCino, personnel expense increased by $8.7 million, or 42.9%, from the year ended December 31, 2013 to $29.2 million for the year ended December 31, 2014 and represented 53.5% of our total noninterest expense for the year ended December 31, 2014. This increase primarily resulted from an increase in our full-time equivalent employees from 141 at December 31, 2013 to 192 at December 31, 2014 to support our loan production, balance sheet, and income growth. The increase in personnel expenses from 2013 to 2014 also included $4.4 million of salary and employee benefits in restricted stock and stock grant related expenses.
Travel expense: For the year ended December 31, 2014, total travel costs increased by $934 thousand, or 21.0%, compared to the year ended December 31, 2013. Travel costs are a crucial element of our national footprint since we do not maintain brick and mortar locations. The increase in travel-related expenses is the result of growing loan production 70.0% from $498.8 million for the year ended December 31, 2013 to $848.1 million for the year ended December 31, 2014. Travel costs also increased due to our relationship management via our BAG, one of our primary differentiators, as a result of servicing a $2.0 billion loan portfolio as of December 31, 2014, compared to a $1.4 billion loan portfolio as of December 31, 2013. Travel expense was $5.4 million for fiscal year 2014 and represented 9.9% of total noninterest expense. Exclusive of nCino, travel expense increased $950 thousand, or 21.4%, from 2013 to 2014.
Professional service expense: For the year ended December 31, 2014, the total cost of professional services increased by $1.9 million, or 83.3%, compared to the year ended December 31, 2013. The increase is primarily attributable to the expenses we incurred in 2014 in exploring various capital raising opportunities. Professional service expense related solely to nCino declined by $56 thousand from fiscal year 2013 to 2014 as a result of the deconsolidation in January of 2013.
Advertising and Marketing expense: For the year ended December 31, 2014, the total costs of advertising and marketing totaled $3.3 million, an increase of $1.0 million, or 43.2%, compared to the year-ended December 31, 2013. The primary driver of the increase is growing brand recognition in newer verticals. Excluding nCino, advertising and marketing increased 43.9%.
Year ended December 31, 2013 vs. Year ended December 31, 2012
For the year ended December 31, 2013, we recognized $40.2 million in total noninterest expense, an increase of $6.5 million, or 19.3%, compared to the year ended December 31, 2012. Excluding nCino, total noninterest expense increased by $10.4 million, or 35.6%, for the year ended December 31, 2013 compared to the year ended December 31, 2012. We discuss the primary drivers of this increase.
Salaries and employee benefits: For the year ended December 31, 2013, total personnel expense increased $2.8 million, or 15.6%, compared to the year ended December 31, 2012. Excluding nCino, personnel expense increased by $4.7 million, or 29.6%, from the year ended December 31, 2012 to $20.4 million for the year ended December 31, 2013 and represented 51.4% of our total noninterest expense for the year ended December 31, 2013. This increase primarily resulted from an increase in our full-time equivalent employees from 94 at December 31, 2012 to 141 at December 31, 2013 to support our loan production, balance sheet, and income growth. Salaries and benefits expense for nCino declined from fiscal year 2012 to 2013 by $1.9 million, or 84.2%, compared to the year ended December 31, 2012, due to the deconsolidation of this investment in January of 2013. The increase in personnel expenses from 2013 to 2014 also included $623 thousand of salary and employee benefits in restricted stock and stock grant related expenses.
70
Table of Contents
Travel expense: For the year ended December 31, 2013, total travel costs increased by $1.3 million, or 43.1%, compared to the year ended December 31, 2012. The increase in travel-related expenses is the result of growing loan production 20.5% from $413.8 million for the year ended December 31, 2012 to $498.8 million for the year ended December 31, 2013. Travel costs also increased due to our relationship management via our BAG, as a result of servicing a $1.4 billion loan portfolio as of December 31, 2013 compared to a $1.1 billion loan portfolio as of December 31, 2012. Travel expense, excluding nCino, was $4.4 million for fiscal year 2013 and represented 11.2% of total noninterest expense. Exclusive of nCino, travel expense increased $1.6 million, or 57.2%, from 2012 to 2013.
Professional service expense: For the year ended December 31, 2013, the total cost of professional services decreased by $343 thousand, or 13.3%, compared to the year ended December 31, 2012. The primary basis for this decline in expenses is due to fees paid by nCino in the development of its technology products. Professional service expense related solely to nCino declined by $712 thousand from fiscal year 2012 to 2013 as a result of the deconsolidation in January of 2013.
Discussion and Analysis of Financial Condition
March 31, 2015 vs. December 31, 2014
Total assets at March 31, 2015 were $723.0 million, an increase of $49.7 million, or 7.4%, compared to total assets of $673.3 million at December 31, 2014.
Cash and cash equivalents were $47.6 million at March 31, 2015, an increase of $17.7 million, or 59.1%, compared to $29.9 million at December 31, 2014, primarily as a result of increases in the deposit portfolio.
Total investment securities increased $1.5 million during the first three months of 2015, from $49.3 million at December 31, 2014 to $50.8 million at March 31, 2015, an increase of 3.0%. The portfolio is comprised of U.S. federal agency securities, residential mortgage backed securities and a mutual fund.
Loans held for sale increased $9.9 million, or 3.4%, during the first three months of 2015, from $295.2 million at December 31, 2014 to $305.1 million at March 31, 2015. The increase was primarily the result of new loan originations.
Loans held for investment increased $16.5 million, or 8.1%, during the first three months of 2015, from $203.9 million at December 31, 2014 to $220.4 million at March 31, 2015. The increase was primarily the result of new loan originations.
Premises and equipment increased $2.8 million, or 8.1%, during the first quarter of 2015, from $35.3 million to $38.1 million. The increase was the result of construction progress on our second office building in Wilmington, North Carolina.
Servicing assets increased $3.5 million, or 9.9%, during the first three months of 2015, from $35.0 million to $38.5 million. The increase was primarily the result of loan sales during the first quarter of 2015 significantly outpacing the amortization of the existing serviced portfolio. Market conditions affecting the value of the sold loan portfolio were largely unchanged during the quarter ended March 31, 2015 compared to December 31, 2014.
At March 31, 2015, we did not have any investments in non-consolidated subsidiaries. This is a decrease of $6.3 million from December 31, 2014. During the period ended March 31, 2015, 100% of our cost method investment in nCino was sold for a gain of $3.8 million and our ownership in 504 FA increased from 50% to 91.3%, resulting in it becoming a consolidated subsidiary with an 8.7% noncontrolling interest held by a third party investor.
Total deposits were $556.1 million at March 31, 2015, an increase of $34.0 million, or 6.5%, from $522.1 million at December 31, 2014. The increase in deposits was primarily to support our growth in loan origination.
71
Table of Contents
At March 31, 2015, we did not carry a balance of short term borrowings. During the period ended March 31, 2015, the $6.1 million short term borrowing was paid in full.
Long term borrowings increased $8.4 million, or 20.0%, from $41.8 million at December 31, 2014, to $50.2 million at March 31, 2015. The increase was primarily the result of construction financing for our second building and operational expenses of our holding company.
Shareholders’ equity at March 31, 2015 was $100.2 million as compared to $91.8 million at December 31, 2014. The book value per share was $3.50 at March 31, 2015 and average equity to average assets was 11.7% for the three months ended March 31, 2015 as compared to a book value per share of $3.21 and average equity to average assets of 10.8% for the year ended December 31, 2014. The change in shareholders’ equity reflects net income to common shareholders for the three months ended March 31, 2015 of $8.1 million. We did not declare any cash dividends during the three months ended March 31, 2015.
March 31, 2015 vs. December 31, 2014 , 2013 and 2012
For the quarter ended March 31, 2015, total assets increased $49.7 million, or 7.4%, to $723.0 million compared to total assets of $673.3 at December 31, 2014. Our loan originations for the three months ended March 31, 2015 totaled $248.1 million. While our new loan originations totaled $848.1 million for the twelve months ended December 31, 2014, we were able to maximize annual return on capital and assets by selling portions of our loans for a premium. As a result, our total assets increased only $243.0 million, or 56.5%, to $673.3 million at December 31, 2014, from $430.4 million at December 31, 2013, primarily due to growth in our combined held for investment and held for sale loan portfolios of $198.3 million. Our total assets increased $87.9 million, or 25.7%, to $430.4 million at December 31, 2013, as compared to $342.5 million at December 31, 2012, primarily due to growth of $62.9 million in our combined held for investment and held for sale loan portfolios.
Construction loans are eligible for sale in the secondary market when they fully fund. At March 31, 2015, our undisbursed loan commitments related to construction loans totaled $284.8 million. If all construction loans in our portfolio at March 31, 2015 were fully funded, the Bank would have had an additional $365.8 million in guaranteed loans available for sale. At December 31, 2014 our undisbursed loan commitments related to construction loans amounted to $240.8 million. If all construction loans on the books at December 31, 2014 were fully funded the Bank would have an additional $311.4 million in guaranteed loans classified as available for sale. The noninterest revenue on these loans will not be recognized until they are actually sold.
Loans. As of December 31, 2014, 2013, and 2012, the cumulative total outstanding principal balance of guaranteed loans sold since May 2007 totaled $1.3 billion, $1.0 billion, and $767.7 million, respectively. We sell a significant portion of our loans in the secondary market while we continue to service the loans we sell in full. As of March 31, 2015, and December 31, 2014, 2013, and 2012, combined loans held for investment and held for sale totaled $525.5 million, $499.1 million, $300.8 million, and $237.9 million, respectively. Any loan or portion of a loan that we have the intent and ability to sell is carried as held for sale.
The average age of our held for sale portfolio as of December 31, 2014 was 13.6 months from origination date. Less than 10% of our current held for sale portfolio is older than two years. The majority of held for sale loans over one year old are comprised of construction loans. Construction loans typically have extended build out periods that inherently result in longer lead times between origination and the ultimate sale date. Approximately 20% of our held for sale portfolio is aged between one and two years. All loans classified as special mention (risk grade 5) or worse or being identified as impaired are excluded in our held for sale loan portfolio.
72
Table of Contents
As of March 31, 2015, and December 31, 2014, 2013, and 2012, loans held for investment totaled $220.4 million, $203.9 million $141.3 million, and $92.7 million, respectively. The significant increase in loans held for investment is the result of a change in the classification of loans held for investment. Traditionally, the SBA requires the originating lender to retain 10% of the outstanding loan balance comprised of unguaranteed dollars. Only with permission may an SBA lender sell down to a 5% retained unguaranteed balance. In fiscal year 2012, we were granted permission by the SBA to sell an additional 5% of the unguaranteed balance on loans originated prior to June 30, 2012, resulting in a reclassification of $35.1 million of loans from held for investment to held for sale during that year. This permission expired on June 30, 2014, and resulted in a held for investment classification for a full 10% of the principal balance of SBA 7(a) loans. The following table presents the balance and associated percentage of each category of loans held for investment within our loan portfolio at the three most recently completed fiscal year ends.
| At March 31, 2015 |
At December 31 | |||||||||||||||||||||||||||||||
| 2014 | 2013 | 2012 | ||||||||||||||||||||||||||||||
| Total Loans |
% of loans in Category of total loans |
Total Loans |
% of Loans in Category of Total Loans |
Total Loans |
% of Loans in Category of Total Loans |
Total Loans |
% of Loans in Category of Total Loans |
|||||||||||||||||||||||||
| (dollars in thousands) | ||||||||||||||||||||||||||||||||
| Commercial & Industrial |
$ | 86,151 | 39.16 | % | $ | 81,057 | 39.84 | % | $ | 57,359 | 40.36 | % | $ | 34,200 | 36.66 | % | ||||||||||||||||
| Death Care Management |
3,880 | 1.76 | 3,603 | 1.77 | 1,782 | 1.25 | 283 | 0.30 | ||||||||||||||||||||||||
| Family Entertainment Centers |
340 | 0.15 | 333 | 0.16 | — | 100.0 | — | — | ||||||||||||||||||||||||
| Healthcare Services |
12,945 | 5.88 | 12,319 | 6.06 | 8,739 | 6.15 | 4,996 | 5.36 | ||||||||||||||||||||||||
| Independent Pharmacies |
35,114 | 15.96 | 34,079 | 16.75 | 24,026 | 16.91 | 12,192 | 13.07 | ||||||||||||||||||||||||
| Investment Advisors |
12,135 | 5.52 | 9,660 | 4.75 | 2,817 | 1.98 | — | 0.00 | ||||||||||||||||||||||||
| Veterinary Practices |
21,580 | 9.81 | 20,902 | 10.27 | 19,978 | 14.06 | 15,719 | 16.85 | ||||||||||||||||||||||||
| Other |
157 | 0.07 | 161 | 0.08 | 17 | 0.01 | 1,010 | 1.08 | ||||||||||||||||||||||||
| Construction & Development |
14,533 | 6.61 | 9,526 | 4.68 | 10,286 | 7.24 | 8,503 | 9.12 | ||||||||||||||||||||||||
| Poultry Agriculture |
5,460 | 2.48 | 3,910 | 1.92 | — | — | — | — | ||||||||||||||||||||||||
| Death Care Management |
483 | 0.22 | 92 | 0.05 | 989 | 0.70 | 315 | 0.34 | ||||||||||||||||||||||||
| Healthcare Services |
5,150 | 2.34 | 2,957 | 1.45 | 4,997 | 3.52 | 3,136 | 3.36 | ||||||||||||||||||||||||
| Family Entertainment Centers |
152 | 0.07 | — | — | — | — | — | — | ||||||||||||||||||||||||
| Independent Pharmacies |
456 | 0.21 | 215 | 0.11 | 101 | 0.07 | 637 | 0.68 | ||||||||||||||||||||||||
| Veterinary Practices |
2,676 | 1.22 | 2,207 | 1.08 | 4,199 | 2.95 | 4,163 | 4.46 | ||||||||||||||||||||||||
| Other |
156 | 0.07 | 145 | 0.07 | — | 0.00 | 252 | 0.27 | ||||||||||||||||||||||||
| Owner Occupied |
||||||||||||||||||||||||||||||||
| Commercial Real Estate |
115,200 | 52.36 | 111,620 | 54.86 | 74,461 | 52.40 | 50,577 | 54.22 | ||||||||||||||||||||||||
| Poultry Agriculture |
283 | 0.13 | 259 | 0.13 | — | 100.0 | — | — | ||||||||||||||||||||||||
| Death Care Management |
19,270 | 8.76 | 18,879 | 9.28 | 11,668 | 8.21 | 3,703 | 3.97 | ||||||||||||||||||||||||
| Family Entertainment Centers |
761 | 0.35 | 872 | 0.43 | — | 100.0 | — | — | ||||||||||||||||||||||||
| Healthcare Services |
27,634 | 12.56 | 26,173 | 12.86 | 11,129 | 7.83 | 6,207 | 6.65 | ||||||||||||||||||||||||
| Independent Pharmacies |
4,578 | 2.08 | 4,750 | 2.33 | 3,490 | 2.46 | 3,008 | 3.22 | ||||||||||||||||||||||||
| Investment Advisors |
2,481 | 1.13 | 2,161 | 1.06 | 171 | 0.12 | — | 0.00 | ||||||||||||||||||||||||
| Veterinary Practices |
59,615 | 27.10 | 57,934 | 28.48 | 47,896 | 33.70 | 35,554 | 38.12 | ||||||||||||||||||||||||
| Other |
578 | 0.26 | 592 | 0.29 | 107 | 0.08 | 2,105 | 2.26 | ||||||||||||||||||||||||
| Commercial Land |
4,136 | 1.88 | 1,248 | 0.62 | — | 100.0 | — | — | ||||||||||||||||||||||||
| Poultry Agriculture |
4,136 | 1.88 | 1,248 | 0.62 | — | 100.0 | — | — | ||||||||||||||||||||||||
|
|
|
|
|
|
|
|
|
|
|
|
|
|
|
|
|
|||||||||||||||||
| Total |
$ | 220,020 | 100.00 | % | $ | 203,451 | 100.00 | % | $ | 142,106 | 100.00 | % | $ | 93,280 | 100.00 | % | ||||||||||||||||
|
|
|
|
|
|
|
|
|
|
|
|
|
|
|
|
|
|||||||||||||||||
Regardless of the classification reflected above and discussed in more detail below, the loans we originate are generally to small businesses where operating cash flow is the primary source of repayment, but may also include collateralization by real estate, inventory, accounts receivable, equipment and/or personal guarantees. When collateral includes real estate it is typically owner-occupied. These common attributes among all loans we fund is a product of our specialization as a SBA lender.
Commercial & Industrial. Commercial and Industrial, or C&I, loans increased $5.1 million, or 6.3%, during the three months ended March 31, 2015 to $86.2 million. Increases in C&I loans from December 31, 2013, to December 31, 2014 occurred in all verticals, with most of the growth occurring in Independent Pharmacies due to our marketing efforts and brand
73
Table of Contents
recognition in the pharmacy industry. Overall, C&I loans increased $23.7 million, or 41.3%, from December 31, 2013, to December 31, 2014. Our growth in and expansion into verticals such as Independent Pharmacies and Investment Advisors resulted in higher growth rates in the C&I portfolio. Real estate collateral on C&I loans is often not part of the loan balance and is owner occupied. The premises for industries in C&I loans tend to have either a small real estate component or the business occupies a leasehold space. Terms for C&I loans are generally ten years.
Construction & Development. Construction and Development, or C&D, loans increased $5.0 million, or 52.5%, during the three months ended March 31, 2015, to $14.5 million with the largest increase in our Healthcare vertical. C&D loans decreased $760 thousand, or 7.4%, from December 31, 2013, to December 31, 2014. The decrease was primarily the result of a reduction in the construction periods for loans in our Healthcare Services and Veterinary Practices verticals as we built our internal infrastructure and expanded our construction department by hiring additional employees to manage and disburse project funds. Loan origination in the construction and development category increased substantially due to industry emphasis on facility expansion primarily in the Poultry Agriculture vertical. Terms for C&D loans are generally approximately 20 to 25 years.
Owner Occupied Commercial Real Estate. Commercial Real Estate, or CRE, loans increased $3.6 million, or 3.2%, to $115.2 million during the three months ended March 31, 2015. Loans categorized as CRE loans increased $37.2 million, or 49.9%, from December 31, 2013, to December 31, 2014. The largest percentage increase was in the Investment Advisor vertical, which grew 1,163.7%, as we grew market share in fiscal year 2014 through an increase in distribution channels and brand recognition. Financing provided to this vertical tends to be for refinance or acquisition purposes, with very limited construction and development. Loans classed as CRE loans in the Healthcare Services, Death Care Management, and Veterinary Practices verticals increased $15.0 million, $7.2 million, $10.0 million, respectively, in fiscal year 2014 as a result of the completion of construction projects from prior year originations.
Loan Concentration
Loan concentrations may exist when there are borrowers engaged in similar activities or types of loans extended to a diverse group of borrowers that could cause those borrowers or portfolios to be similarly impacted by economic or other conditions. The breakdown of total held for sale loans, as a percentage of total loans by industry sector is as follows:
74
Table of Contents
| At March 31, 2015 | At December 31, 2014 | At December 31, 2013 | At December 31, 2012 | |||||||||||||||||||||||||||||||||||||||||||||
| Concentration Risk (SBA Guaranteed) |
Concentration Risk (SBA Guaranteed) |
Concentration Risk (SBA Guaranteed) |
Concentration Risk (SBA Guaranteed) |
|||||||||||||||||||||||||||||||||||||||||||||
| Unguaranteed | Guaranteed | Total | Unguaranteed | Guaranteed | Total | Unguaranteed | Guaranteed | Total | Unguaranteed | Guaranteed | Total | |||||||||||||||||||||||||||||||||||||
| (dollars in thousands) |
||||||||||||||||||||||||||||||||||||||||||||||||
| Commercial & Industrial |
$ | 46,344 | $ | 21,957 | $ | 68,301 | $ | 52,348 | $ | 26,905 | $ | 79,253 | $ | 32,024 | $ | 19,714 | $ | 51,738 | $ | 32,283 | $ | 23,269 | $ | 55,552 | ||||||||||||||||||||||||
| Agriculture |
1 | 2 | 3 | — | — | — | — | — | — | — | — | — | ||||||||||||||||||||||||||||||||||||
| Death Care Management |
1,979 | 3,100 | 5,079 | 2,312 | 2,855 | 5,167 | 1,166 | 2,740 | 3,906 | 279 | 547 | 826 | ||||||||||||||||||||||||||||||||||||
| Family Entertainment Centers |
511 | 1,051 | 1,562 | 500 | 963 | 1,463 | — | — | — | — | — | — | ||||||||||||||||||||||||||||||||||||
| Healthcare |
7,839 | 3,411 | 11,250 | 5,250 | 4,979 | 10,230 | 3,404 | 2,866 | 6,270 | 4,804 | 5,498 | 10,302 | ||||||||||||||||||||||||||||||||||||
| Independent Pharmacies |
17,594 | 5,784 | 23,378 | 24,513 | 6,696 | 31,209 | 13,272 | 8,058 | 21,330 | 14,353 | 8,757 | 23,110 | ||||||||||||||||||||||||||||||||||||
| Registered Investment Advisors |
9,182 | 3,691 | 12,873 | 9,471 | 5,667 | 15,139 | 3,355 | 2,719 | 6,074 | — | — | — | ||||||||||||||||||||||||||||||||||||
| Veterinary Industry |
8,238 | 4,918 | 13,156 | 9,301 | 5,744 | 15,046 | 9,800 | 3,202 | 13,002 | 12,797 | 8,325 | 21,122 | ||||||||||||||||||||||||||||||||||||
| Other Industries |
1,000 | — | 1,000 | 1,000 | — | 1,000 | 1,026 | 131 | 1,157 | 50 | 142 | 192 | ||||||||||||||||||||||||||||||||||||
| Construction & Development |
22,980 | 108,030 | 131,010 | 5,739 | 28,568 | 34,307 | 12,195 | 44,930 | 57,125 | 5,961 | 38,560 | 44,521 | ||||||||||||||||||||||||||||||||||||
| Agriculture |
8,190 | 40,952 | 49,142 | 2,246 | 11,230 | 13,476 | — | — | — | — | — | — | ||||||||||||||||||||||||||||||||||||
| Death Care Management |
1,099 | 3,622 | 4,721 | 36 | 179 | 214 | 1,374 | 5,235 | 6,609 | 126 | 1,451 | 1,578 | ||||||||||||||||||||||||||||||||||||
| Family Entertainment Centers |
228 | 1,139 | 1,367 | — | — | — | — | — | — | — | — | — | ||||||||||||||||||||||||||||||||||||
| Healthcare |
8,530 | 38,637 | 47,167 | 1,764 | 8,695 | 10,459 | 6,493 | 26,427 | 32,920 | 1,510 | 12,520 | 14,030 | ||||||||||||||||||||||||||||||||||||
| Independent Pharmacies |
684 | 3,420 | 4,104 | — | — | — | 151 | 158 | 309 | 676 | 3,166 | 3,841 | ||||||||||||||||||||||||||||||||||||
| Veterinary Industry |
4,014 | 19,089 | 23,103 | 1,677 | 8,385 | 10,062 | 4,176 | 13,110 | 17,286 | 3,650 | 21,423 | 25,073 | ||||||||||||||||||||||||||||||||||||
| Other |
235 | 1,171 | 1,406 | 16 | 79 | 95 | — | — | — | — | — | — | ||||||||||||||||||||||||||||||||||||
| Owner Occupied |
63,082 | 25,121 | 88,203 | 78,964 | 77,943 | 156,906 | 40,708 | 9,391 | 50,099 | 38,370 | 7,365 | 45,735 | ||||||||||||||||||||||||||||||||||||
| Agriculture |
425 | — | 425 | 1,809 | 9,043 | 10,852 | — | — | — | — | — | — | ||||||||||||||||||||||||||||||||||||
| Death Care Management |
13,501 | 2,152 | 15,653 | 15,572 | 4,744 | 20,315 | 12,015 | 3,528 | 15,543 | 3,273 | 449 | 3,723 | ||||||||||||||||||||||||||||||||||||
| Family Entertainment Centers |
1,600 | — | 1,600 | 1,771 | 806 | 2,577 | — | — | — | — | — | — | ||||||||||||||||||||||||||||||||||||
| Healthcare |
18,812 | 10,629 | 29,441 | 24,668 | 33,787 | 58,455 | 6,173 | 1,822 | 7,995 | 5,987 | 107 | 6,094 | ||||||||||||||||||||||||||||||||||||
| Independent Pharmacies |
2,997 | — | 2,997 | 5,082 | 3,155 | 8,237 | 3,528 | — | 3,528 | 1,661 | 658 | 2,318 | ||||||||||||||||||||||||||||||||||||
| Registered Investment Advisors |
2,147 | 1,732 | 3,879 | 2,731 | 2,464 | 5,195 | 220 | 109 | 329 | — | — | — | ||||||||||||||||||||||||||||||||||||
| Veterinary Industry |
22,940 | 10,608 | 33,548 | 26,237 | 22,932 | 49,168 | 18,088 | 3,932 | 22,020 | 27,449 | 6,151 | 33,600 | ||||||||||||||||||||||||||||||||||||
| Other |
660 | — | 660 | 1,094 | 1,012 | 2,106 | 684 | — | 684 | — | — | — | ||||||||||||||||||||||||||||||||||||
| Commercial Land |
7,808 | 6,179 | 13,987 | 5,472 | 16,121 | 21,593 | — | — | — | — | — | — | ||||||||||||||||||||||||||||||||||||
| Agriculture |
7,808 | 6,179 | 13,987 | 5,472 | 16,121 | 21,593 | — | — | — | — | — | — | ||||||||||||||||||||||||||||||||||||
|
|
|
|
|
|
|
|
|
|
|
|
|
|
|
|
|
|
|
|
|
|
|
|
|
|||||||||||||||||||||||||
| Total |
$ | 140,213 | $ | 161,288 | $ | 301,501 | $ | 142,522 | $ | 149,536 | $ | 292,059 | $ | 84,927 | $ | 74,035 | $ | 158,963 | $ | 76,614 | $ | 69,194 | $ | 145,808 | ||||||||||||||||||||||||
|
|
|
|
|
|
|
|
|
|
|
|
|
|
|
|
|
|
|
|
|
|
|
|
|
|||||||||||||||||||||||||
75
Table of Contents
Whenever a loan held for sale exhibits credit quality issues (i.e., the loan is on nonaccrual, delinquent more than 30 days, downgraded to special mention, risk grade 5, or greater) it is transferred to loans held for investment. Accordingly all loans experiencing charge-offs are classified as held for investment. For loans transferred from held for sale to held for investment during the three months ended March 31, 2015 and 2014 and during the twelve months ended December 31, 2014, 2013 and 2012 there have been -0-, $146 thousand, $211 thousand, $539 thousand and $1,036 thousand in charge offs, respectively. For loans transferred from held for investment to held for sale during the three months ended March 31, 2015 and 2014 and the twelve months ended December 31, 2014, 2013 and 2012 there have been -0-, -0-, $15 thousand, $3 thousand and $77 thousand in charge offs, respectively. As of March 31, 2015, December 31, 2014, 2013 and 2012 there were no loans classified as held for sale which were identified as being impaired or on nonaccrual status.
The breakdown of total held for investment loans, as a percentage of total loans by industry sector is as follows:
76
Table of Contents
| At March 31, 2015 | At December 31, 2014 | At December 31, 2013 | December 31, 2012 | |||||||||||||||||||||||||||||||||||||||||||||
| Concentration Risk (SBA Guaranteed) |
Concentration Risk (SBA Guaranteed) |
Concentration Risk (SBA Guaranteed) |
Concentration Risk (SBA Guaranteed) |
|||||||||||||||||||||||||||||||||||||||||||||
| Unguaranteed | Guaranteed | Total | Unguaranteed | Guaranteed | Total | Unguaranteed | Guaranteed | Total | Unguaranteed | Guaranteed | Total | |||||||||||||||||||||||||||||||||||||
| (dollars in thousands) | ||||||||||||||||||||||||||||||||||||||||||||||||
| Commercial & Industrial |
$ | 76,507 | $ | 9,644 | $ | 86,151 | $ | 71,507 | $ | 9,550 | $ | 81,057 | $ | 52,250 | $ | 5,109 | $ | 57,359 | $ | 34,200 | $ | 3,470 | $ | 30,730 | ||||||||||||||||||||||||
| Death Care Management |
3,880 | — | 3,880 | 3,603 | — | 3,603 | 1,782 | — | 1,782 | 283 | — | 283 | ||||||||||||||||||||||||||||||||||||
| Family Entertainment Centers |
340 | — | 340 | 333 | — | 333 | — | — | — | — | — | — | ||||||||||||||||||||||||||||||||||||
| Healthcare Services |
9,474 | 3,471 | 12,946 | 8,779 | 3,540 | 12,319 | — | — | — | — | — | — | ||||||||||||||||||||||||||||||||||||
| Dental Industry |
— | — | — | — | — | — | 7,164 | 1,575 | 8,739 | 4,996 | 432 | 4,564 | ||||||||||||||||||||||||||||||||||||
| Independent Pharmacies |
32,670 | 2,444 | 35,114 | 31,686 | 2,393 | 34,079 | 24,026 | — | 24,026 | 12,192 | — | 12,192 | ||||||||||||||||||||||||||||||||||||
| Investment Advisors |
12,135 | — | 12,135 | 9,660 | — | 9,660 | 2,817 | — | 2,817 | — | — | — | ||||||||||||||||||||||||||||||||||||
| Veterinary Practices |
17,968 | 3,612 | 21,580 | 17,406 | 3,496 | 20,902 | 16,444 | 3,534 | 19,978 | 15,719 | 3,038 | 12,681 | ||||||||||||||||||||||||||||||||||||
| Other |
39 | 117 | 156 | 40 | 121 | 161 | 17 | — | 17 | 1,009 | — | 1,009 | ||||||||||||||||||||||||||||||||||||
| Construction & Development |
14,533 | — | 14,533 | 9,526 | — | 9,526 | 10,286 | — | 10,286 | 8,503 | 758 | 7,745 | ||||||||||||||||||||||||||||||||||||
| Poultry Agriculture |
5,460 | — | 5,460 | 3,910 | — | 3,910 | — | — | — | — | — | — | ||||||||||||||||||||||||||||||||||||
| Death Care Management |
483 | — | 483 | 92 | — | 92 | 989 | — | 989 | 315 | — | 315 | ||||||||||||||||||||||||||||||||||||
| Family Entertainment Centers |
152 | — | 152 | — | — | — | — | — | — | — | — | — | ||||||||||||||||||||||||||||||||||||
| Healthcare Services |
5,150 | — | 5,150 | 2,957 | — | 2,957 | — | — | — | — | — | — | ||||||||||||||||||||||||||||||||||||
| Dental Industry |
— | — | — | — | — | — | 4,997 | — | 4,997 | 3,388 | 758 | 2,630 | ||||||||||||||||||||||||||||||||||||
| Independent Pharmacies |
456 | — | 456 | 215 | — | 215 | 101 | — | 101 | 637 | — | 637 | ||||||||||||||||||||||||||||||||||||
| Veterinary Practices |
2,676 | — | 2,676 | 2,207 | — | 2,207 | 4,199 | — | 4,199 | 4,163 | — | 4,163 | ||||||||||||||||||||||||||||||||||||
| Other |
156 | — | 156 | 145 | — | 145 | — | — | — | — | — | — | ||||||||||||||||||||||||||||||||||||
| Owner Occupied |
103,354 | 11,846 | 115,200 | 99,858 | 11,762 | 111,620 | 67,152 | 7,309 | 74,461 | 50,551 | 7,754 | 42,797 | ||||||||||||||||||||||||||||||||||||
| Poultry Agriculture |
283 | — | 283 | 259 | — | 259 | — | — | — | — | — | — | ||||||||||||||||||||||||||||||||||||
| Death Care Management |
17,763 | 1,507 | 19,270 | 17,354 | 1,525 | 18,879 | 11,668 | — | 11,668 | 3,703 | — | 3,703 | ||||||||||||||||||||||||||||||||||||
| Family Entertainment Centers |
761 | — | 761 | 872 | — | 872 | — | — | — | — | — | — | ||||||||||||||||||||||||||||||||||||
| Healthcare Services |
25,715 | 1,919 | 27,634 | 24,254 | 1,919 | 26,173 | — | — | — | — | — | — | ||||||||||||||||||||||||||||||||||||
| Dental Industry |
— | — | — | — | — | — | 10,329 | 800 | 11,129 | 10 | 1 | 11 | ||||||||||||||||||||||||||||||||||||
| Independent Pharmacies |
4,578 | — | 4,578 | 4,750 | — | 4,750 | 3,490 | — | 3,490 | 3,008 | 1,385 | 1,623 | ||||||||||||||||||||||||||||||||||||
| Investment Advisors |
2,481 | — | 2,481 | 2,161 | — | 2,161 | 171 | — | 171 | — | — | — | ||||||||||||||||||||||||||||||||||||
| Veterinary Practices |
51,470 | 8,145 | 59,615 | 49,903 | 8,031 | 57,934 | 41,387 | 6,509 | 47,896 | 35,528 | 4,575 | 30,953 | ||||||||||||||||||||||||||||||||||||
| Other |
303 | 275 | 578 | 305 | 287 | 592 | 107 | — | 107 | 1,732 | — | 1,732 | ||||||||||||||||||||||||||||||||||||
| Commercial Land |
4,136 | — | 4,136 | 1,248 | — | 1,248 | — | — | — | — | — | — | ||||||||||||||||||||||||||||||||||||
| Poultry Agriculture |
4,136 | — | 4,136 | 1,248 | — | 1,248 | — | — | — | — | — | — | ||||||||||||||||||||||||||||||||||||
|
|
|
|
|
|
|
|
|
|
|
|
|
|
|
|
|
|
|
|
|
|
|
|
|
|||||||||||||||||||||||||
| Total |
$ | 198,530 | $ | 21,490 | $ | 220,020 | $ | 182,139 | $ | 21,312 | $ | 203,451 | $ | 129,688 | $ | 12,418 | $ | 142,106 | $ | 93,254 | $ | 11,982 | $ | 81,272 | ||||||||||||||||||||||||
|
|
|
|
|
|
|
|
|
|
|
|
|
|
|
|
|
|
|
|
|
|
|
|
|
|||||||||||||||||||||||||
77
Table of Contents
Loans held for investment generally consist of loans classified as special mention (5 rated) or worse, identified as impaired and the unguaranteed portion required to be retained by the SBA. At March 31, 2015, our total guaranteed loans held for investment classified as special mention or worse totaled $21.5 million with $16.0 million on a nonaccrual basis. Of our total guaranteed loans held for investment at December 31, 2014, $21.3 million was classified as special mention or worse with $15.6 million on a non-accrual basis. Presently, we classify the guaranteed portion of all performing loans as held for sale.
Loans to veterinarians represent $81.0 million, or 39.8%, of the total held for investment balance. The Veterinarian vertical was our original vertical and formed the basis of our existing model. From inception in May 2007 through December 31, 2014, we originated $1.1 billion of loans to small business professionals in the Veterinarian vertical, with $802.5 million in outstanding principal remaining in our servicing portfolio and $81.0 million held for investment. Loans to Independent Pharmacies represent the next largest vertical at $39.0 million, or 19.2%, of the total held for investment balance. From May 2007 through December 31, 2014, we originated $494.9 million to small business professionals in the Independent Pharmacies vertical with $387.1 million in outstanding principal remaining in our servicing portfolio and $78.5 million on book. We believe the risk associated with industry concentration is mitigated by the geographical diversity of our overall loan portfolio with loans originated in each of the fifty U.S. states and certain U.S. territories. Additionally, we have demonstrated the ability to expand our lending activities into selected new verticals and we intend to continue this expansion in the future. To the extent that we are successful in expanding into new verticals, we believe any risk related to concentration within any one industry will be further mitigated.
The following table provides a summary of total loans by size and category as of March 31, 2015 and December 31, 2014. The breakout of the categories is based on total held for investment balances.
| March 31, 2015 | December 31, 2014 | |||||||||||||||
| Less than $5 million | Less than $5 million | |||||||||||||||
| Amount | Number | Amount | Number | |||||||||||||
| (dollars in thousands) | ||||||||||||||||
| Commercial & Industrial |
$ |
86,151 |
|
1,173 | $ | 81,057 | 1,067 | |||||||||
| Agriculture |
— | 2 | — | — | ||||||||||||
| Death Care Management |
3,880 | 31 | 3,603 | 27 | ||||||||||||
| Family Entertainment Centers |
340 | 3 | 333 | 3 | ||||||||||||
| Healthcare Services |
12,945 | 163 | 12,319 | 153 | ||||||||||||
| Independent Pharmacies |
35,114 | 404 | 34,079 | 381 | ||||||||||||
| Investment Advisors |
12,135 | 188 | 9,660 | 141 | ||||||||||||
| Veterinary Practices |
21,580 | 379 | 20,902 | 358 | ||||||||||||
| Other |
156 | 3 | 161 | 4 | ||||||||||||
| Construction & Development |
|
14,533 |
|
217 | 9,526 | 166 | ||||||||||
| Poultry Agriculture |
5,460 | 91 | 3,910 | 64 | ||||||||||||
| Death Care Management |
483 | 9 | 92 | 5 | ||||||||||||
| Family Entertainment Centers |
152 | 3 | — | — | ||||||||||||
| Healthcare Services |
5,150 | 74 | 2,957 | 54 | ||||||||||||
| Independent Pharmacies |
456 | 6 | 215 | 4 | ||||||||||||
| Veterinary Practices |
2,676 | 32 | 2,207 | 37 | ||||||||||||
| Other |
156 | 2 | 145 | 2 | ||||||||||||
| Owner Occupied |
|
115,200 |
|
1,118 | 111,620 | 1,062 | ||||||||||
| Poultry Agriculture |
283 | 2 | 259 | 2 | ||||||||||||
| Death Care Management |
19,270 | 147 | 18,879 | 142 | ||||||||||||
| Family Entertainment Centers |
761 | 5 | 872 | 6 | ||||||||||||
| Healthcare Services |
27,634 | 282 | 26,173 | 267 | ||||||||||||
| Independent Pharmacies |
4,578 | 48 | 4,750 | 49 | ||||||||||||
| Investment Advisors |
2,481 | 27 | 2,161 | 22 | ||||||||||||
| Veterinary Practices |
59,615 | 602 | 57,934 | 568 | ||||||||||||
| Other |
578 | 5 | 592 | 6 | ||||||||||||
| Commercial Land |
4,136 | 39 | 1,248 | 22 | ||||||||||||
| Poultry Agriculture |
4,136 | 39 | 1,248 | 22 | ||||||||||||
|
|
|
|
|
|
|
|
|
|||||||||
| Total |
$ |
220,020 |
|
2,547 | $ | 203,451 | 2,317 | |||||||||
|
|
|
|
|
|
|
|
|
|||||||||
78
Table of Contents
The maximum loan size under the SBA 7(a) program is $5.0 million. The average loan size at origination for our portfolio in our chosen industries in 2014 was $1.0 million. At December 31, 2014, no single loan had an outstanding borrower principal balance greater than $4.7 million. At December 31, 2014, the average outstanding balance per loan was approximately $820 thousand. Outstanding principal balance equaled or exceeded $3.0 million on 18 client relationships and cumulatively totaled $63.5 million at December 31, 2014. Of this $63.5 million in outstanding principal, $6.3 million was held for investment. The outstanding principal balance of the full loan portfolio totaled $2.0 billion of which $203.5 million was held for investment.
Loan Maturity
As of March 31, 2015, $645 thousand, or 0.3%, of the held for investment balance matures in less than five years. Loans maturing in greater than five years total $219.4 million. The variable rate portion of our total held for investment portfolio at March 31, 2015 was 92.6%. As of December 31, 2014, $1.8 billion, or 92.4%, of our borrowers’ total outstanding principal loans were variable rate loans that adjust at specified dates based on the prime lending rate or other variable indices. As of December 31, 2014, $1.7 billion, or 84.4%, of our borrowers’ total outstanding principal loans were variable rate loans that adjust on either a calendar monthly or calendar quarterly basis using the prime lending rate or other variable indices. At December 31, 2014, 92.8%, or $462.9 million, of our combined held for sale and held for investment loan portfolio was comprised of variable rate loans. At December 31, 2014, $1.6 million, or 0.8%, of the held for investment balance matures in less than five years. Loans maturing in greater than five years total $201.9 million of the total $203.5 million. The variable rate portion of the total held for investment loans is 92.8%, which reflects our strategy to minimize interest rate risk through the use of variable rate products.
79
Table of Contents
| At March 31, 2015 Remaining Contractual Maturity of Total Held for Investment Loans |
At December 31, 2014 Remaining Contractual Maturity of Total Held for Investment Loans |
|||||||||||||||||||||||||||||||
| One Year or Less |
After One Year and Through Five Years |
After Five Years |
Total | One Year or Less |
After One Year and Through Five Years |
After Five Years |
Total | |||||||||||||||||||||||||
| (dollars in thousands) |
||||||||||||||||||||||||||||||||
| Fixed rate loans: |
$ | — | $ | — | $ | 16,225 | $ | 16,225 | $ | — | $ | — | $ | 14,675 | $ | 14,675 | ||||||||||||||||
| Commercial & Industrial |
— | — | 4,281 | 4,281 | — | — | 4,115 | 4,115 | ||||||||||||||||||||||||
| Death Care Management |
— | — | 919 | 919 | — | — | 924 | 924 | ||||||||||||||||||||||||
| Healthcare Services |
— | — | 1,068 | 1,068 | — | — | 1,208 | 1,208 | ||||||||||||||||||||||||
| Independent Pharmacies |
— | — | 683 | 683 | — | — | 691 | 691 | ||||||||||||||||||||||||
| Investment Advisors |
— | — | 432 | 432 | — | — | 447 | 447 | ||||||||||||||||||||||||
| Veterinary Practices |
— | — | 1,177 | 1,177 | — | — | 845 | 845 | ||||||||||||||||||||||||
| Construction & Development |
— | — | 145 | 145 | — | — | 58 | 58 | ||||||||||||||||||||||||
| Death Care Management |
— | — | 28 | 28 | — | — | 45 | 45 | ||||||||||||||||||||||||
| Healthcare |
— | — | 24 | 24 | ||||||||||||||||||||||||||||
| Veterinary Practices |
— | — | 93 | 93 | — | — | 13 | 13 | ||||||||||||||||||||||||
| Owner Occupied |
— | — | 11,058 | 11,058 | — | — | 10,502 | 10,502 | ||||||||||||||||||||||||
| Poultry Agriculture |
— | — | 117 | 117 | — | — | 118 | 118 | ||||||||||||||||||||||||
| Death Care Management |
— | — | 3,741 | 3,741 | — | — | 3,761 | 3,761 | ||||||||||||||||||||||||
| Healthcare Services |
— | — | 3,358 | 3,358 | — | — | 3,102 | 3,102 | ||||||||||||||||||||||||
| Investment Advisors |
— | — | 399 | 399 | — | — | 286 | 286 | ||||||||||||||||||||||||
| Veterinary Practices |
— | — | 3,443 | 3,443 | — | — | 3,235 | 3,235 | ||||||||||||||||||||||||
| Secured By Farmland |
— | — | 740 | 740 | — | — | — | — | ||||||||||||||||||||||||
| Agriculture |
— | — | 740 | 740 | — | — | — | — | ||||||||||||||||||||||||
| Variable rate loans: |
— | 645 | 203,150 | 203,796 | — | 1,555 | 187,221 | 188,776 | ||||||||||||||||||||||||
| Commercial & Industrial |
— | 344 | 81,526 | 81,869 | — | 1,215 | 75,727 | 76,942 | ||||||||||||||||||||||||
| Death Care Management |
— | — | 2,961 | 2,961 | — | 23 | 2,656 | 2,679 | ||||||||||||||||||||||||
| Family Entertainment Centers |
— | — | 340 | 340 | — | — | 333 | 333 | ||||||||||||||||||||||||
| Healthcare Services |
— | 9 | 11,867 | 11,876 | — | 60 | 11,051 | 11,111 | ||||||||||||||||||||||||
| Independent Pharmacies |
— | 69 | 34,362 | 34,431 | — | 96 | 33,292 | 33,388 | ||||||||||||||||||||||||
| Investment Advisors |
— | — | 11,703 | 11,703 | — | — | 9,213 | 9,213 | ||||||||||||||||||||||||
| Veterinary Practices |
— | 266 | 20,136 | 20,402 | — | 1,036 | 19,021 | 20,057 | ||||||||||||||||||||||||
| Other |
— | — | 156 | 156 | — | — | 161 | 161 | ||||||||||||||||||||||||
| Construction & Development |
— | — | 14,388 | 14,388 | — | — | 9,468 | 9,468 | ||||||||||||||||||||||||
| Poultry Agriculture |
— | — | 5,460 | 5,460 | — | — | 3,910 | 3,910 | ||||||||||||||||||||||||
| Death Care Management |
— | — | 455 | 455 | — | — | 79 | 79 | ||||||||||||||||||||||||
| Family Entertainment Centers |
— | — | 152 | 152 | — | — | — | — | ||||||||||||||||||||||||
| Healthcare Services |
— | — | 5,126 | 5,126 | — | — | 2,957 | 2,957 | ||||||||||||||||||||||||
| Independent Pharmacies |
— | — | 456 | 456 | — | — | 215 | 215 | ||||||||||||||||||||||||
| Veterinary Practices |
— | — | 2,583 | 2,583 | — | — | 2,162 | 2,162 | ||||||||||||||||||||||||
| Other |
— | — | 156 | 156 | — | — | 145 | 145 | ||||||||||||||||||||||||
| Owner Occupied |
— | 301 | 103,840 | 104,141 | — | 340 | 100,778 | 101,118 | ||||||||||||||||||||||||
| Poultry Agriculture |
— | — | 166 | 166 | — | — | 141 | 141 | ||||||||||||||||||||||||
| Death Care Management |
— | — | 15,528 | 15,528 | — | — | 15,118 | 15,118 | ||||||||||||||||||||||||
| Family Entertainment Centers |
— | — | 761 | 761 | — | — | 872 | 872 | ||||||||||||||||||||||||
| Healthcare Services |
— | — | 24,276 | 24,276 | — | — | 23,072 | 23,072 | ||||||||||||||||||||||||
| Independent Pharmacies |
— | — | 4,578 | 4,578 | — | — | 4,750 | 4,750 | ||||||||||||||||||||||||
| Investment Advisors |
— | — | 2,081 | 2,081 | — | — | 1,874 | 1,874 | ||||||||||||||||||||||||
| Veterinary Practices |
— | 23 | 56,149 | 56,173 | — | 50 | 54,649 | 54,699 | ||||||||||||||||||||||||
| Other |
— | 278 | 300 | 578 | — | 290 | 302 | 592 | ||||||||||||||||||||||||
| Commercial Land |
— | — | 3,397 | 3,397 | — | — | 1,248 | 1,248 | ||||||||||||||||||||||||
| Poultry Agriculture |
— | — | 3,397 | 3,397 | — | — | 1,248 | 1,248 | ||||||||||||||||||||||||
|
|
|
|
|
|
|
|
|
|
|
|
|
|
|
|
|
|||||||||||||||||
| Total |
$ | — | $ | 645 | $ | 219,375 | $ | 220,020 | $ | — | $ | 1,555 | $ | 201,896 | $ | 203,451 | ||||||||||||||||
|
|
|
|
|
|
|
|
|
|
|
|
|
|
|
|
|
|||||||||||||||||
Investment Securities
Investment securities totaled $50.8 million at March 31, 2015, an increase of $1.5 million, or 3.0%, compared to $49.3 million at December 31, 2014. The increase in our investment portfolio in the first quarter of 2015 was primarily related to our $1.9 million investment in the 504 Fund mutual fund offset by principal reduction on mortgage backed securities.
Our investment securities portfolio consists entirely of available-for-sale securities. We purchase securities for our investment securities portfolio to manage interest rate risk, ensure a stable source of liquidity and to provide a steady source of income in excess of our cost of funds.
80
Table of Contents
The following table sets forth the amortized cost and fair values of our securities portfolio at the dates indicated.
| At March 31 | At December 31, | |||||||||||||||||||||||||||||||
| 2015 | 2014 | 2013 | 2012 | |||||||||||||||||||||||||||||
| Amortized Cost |
Fair Value |
Amortized Cost |
Fair Value |
Amortized Cost |
Fair Value |
Amortized Cost |
Fair Value |
|||||||||||||||||||||||||
| (dollars in thousands) | ||||||||||||||||||||||||||||||||
| Available-for-sale securities: |
||||||||||||||||||||||||||||||||
| Agency direct obligations |
$ | 35,218 | $ | 35,498 | $ | 35,207 | $ | 35,309 | $ | 5,315 | $ | 5,262 | $ | 3,425 | $ | 3,517 | ||||||||||||||||
| Agency mortgage-backed securities |
13,318 | 13,379 | 13,973 | 14,009 | 14,322 | 14,184 | 11,449 | 11,899 | ||||||||||||||||||||||||
| Mutual Fund |
1,900 | 1,900 | — | — | — | — | — | — | ||||||||||||||||||||||||
|
|
|
|
|
|
|
|
|
|
|
|
|
|
|
|
|
|||||||||||||||||
| Total available-for-sale |
$ | 50,436 | $ | 50,777 | $ | 49,180 | $ | 49,318 | $ | 19,637 | $ | 19,446 | $ | 14,874 | $ | 15,416 | ||||||||||||||||
|
|
|
|
|
|
|
|
|
|
|
|
|
|
|
|
|
|||||||||||||||||
| Total securities |
$ | 50,436 | $ | 50,777 | $ | 49,180 | $ | 49,318 | $ | 19,637 | $ | 19,446 | $ | 14,874 | $ | 15,416 | ||||||||||||||||
|
|
|
|
|
|
|
|
|
|
|
|
|
|
|
|
|
|||||||||||||||||
The $48.9 million of U.S. agency direct obligations and agency mortgage-backed securities in our investment portfolio as of March 31, 2015 was spread across five different issuers. There are 24 unique securities that have an average balance of $2.0 million, with the largest single security having a fair value of $10.0 million as of March 31, 2015.
At March 31, 2015, the duration of our overall available-for-sale securities portfolio was approximately 3.58 years.
The following table sets forth the stated maturities and weighted average yields of investment securities at March 31, 2015. Certain mortgage related securities have adjustable interest rates and will reprice annually within the various maturity ranges excluding mutual funds. These repricing schedules are not reflected in the tables below.
| At March 31, 2015 | ||||||||||||||||||||||||||||
| Total Amortized Cost |
After One to Five Years |
After Five to Ten Years |
After Ten Years | |||||||||||||||||||||||||
| Amortized Cost |
Average Yield |
Amortized Cost |
Average Yield |
Amortized Cost |
Average Yield |
|||||||||||||||||||||||
| (dollars in thousands) | ||||||||||||||||||||||||||||
| Available-for sale-securities: |
||||||||||||||||||||||||||||
| Agency direct obligations |
$ | 35,218 | $ | 35,218 | 1.06 | % | $ | — | — | % | $ | — | — | % | ||||||||||||||
| Agency mortgage-backed securities |
13,318 | — | — | 1,316 | 2.84 | 12,002 | 2.97 | |||||||||||||||||||||
|
|
|
|
|
|
|
|
|
|
|
|
|
|
|
|||||||||||||||
| Total available for sale securities |
$ | 48,536 | $ | 35,218 | 1.06 | $ | 1,316 | 2.84 | $ | 12,002 | 2.97 | |||||||||||||||||
|
|
|
|
|
|
|
|
|
|
|
|
|
|
|
|||||||||||||||
| Total securities |
$ | 48,536 | $ | 35,218 | 1.06 | % | $ | 1,316 | 2.84 | % | $ | 12,002 | 2.97 | % | ||||||||||||||
|
|
|
|
|
|
|
|
|
|
|
|
|
|
|
|||||||||||||||
81
Table of Contents
Deposits
The following table sets forth the composition of our deposits.
| March 31 | At December 31, | |||||||||||||||||||||||||||||||
| 2015 | 2014 | 2013 | 2012 | |||||||||||||||||||||||||||||
| Total | Percent | Total | Percent | Total | Percent | Total | Percent | |||||||||||||||||||||||||
| (dollars in thousands) | ||||||||||||||||||||||||||||||||
| Period end: |
||||||||||||||||||||||||||||||||
| Noninterest-bearing demand deposits |
$ | 4,390 | 0.79 | % | $ | 14,728 | 2.82 | % | $ | 13,022 | 3.65 | % | $ | 2,479 | 0.86 | % | ||||||||||||||||
| Interest-bearing deposits: |
||||||||||||||||||||||||||||||||
| Savings |
— | — | — | — | — | — | — | — | ||||||||||||||||||||||||
| Money market |
281,084 | 50.55 | 211,682 | 40.55 | 191,041 | 53.57 | 156,295 | 54.52 | ||||||||||||||||||||||||
| Time deposits |
270,609 | 48.66 | 295,670 | 56.63 | 152,557 | 42.78 | 127,900 | 44.62 | ||||||||||||||||||||||||
|
|
|
|
|
|
|
|
|
|
|
|
|
|
|
|
|
|||||||||||||||||
| Total period end deposits |
$ | 556,083 | 100.00 | % | $ | 522,080 | 100.00 | % | $ | 356,620 | 100.00 | % | $ | 286,674 | 100.00 | % | ||||||||||||||||
|
|
|
|
|
|
|
|
|
|
|
|
|
|
|
|
|
|||||||||||||||||
| Average: |
||||||||||||||||||||||||||||||||
| Noninterest-bearing demand deposits |
$ | 13,415 | 2.16 | % | $ | 11,492 | 2.51 | % | $ | 15,732 | 4.30 | % | $ | 5,265 | 1.92 | % | ||||||||||||||||
| Interest-bearing deposits: |
||||||||||||||||||||||||||||||||
| Savings |
— | — | — | — | — | — | 275 | 0.10 | ||||||||||||||||||||||||
| Money market |
310,992 | 50.03 | % | 215,745 | 47.01 | 186,265 | 50.94 | 107,513 | 39.11 | |||||||||||||||||||||||
| Time deposits |
297,153 | 47.81 | % | 231,675 | 50.48 | 163,686 | 44.76 | 161,826 | 58.87 | |||||||||||||||||||||||
|
|
|
|
|
|
|
|
|
|
|
|
|
|
|
|
|
|||||||||||||||||
| Total average deposits |
$ | 621,560 | 100.00 | % | $ | 458,912 | 100.00 | % | $ | 365,683 | 100.00 | % | $ | 274,879 | 100.00 | % | ||||||||||||||||
|
|
|
|
|
|
|
|
|
|
|
|
|
|
|
|
|
|||||||||||||||||
Our deposits increased to $556.1 million at March 31, 2015 from $522.1 million at December 31, 2014, an increase of $34.0 million, or 6.5%. This increase was primarily due to the growth of our customer base, enhanced by a nationwide marketing campaign with attractive rates in a market with the continued lack of attractive alternative investments for our customers. Our noninterest-bearing deposits decreased $10.3 million, or 70.2%, during this period, and our interest-bearing deposits increased $44.3 million, or 8.7%, during the same period. The growth in accounts during the first quarter of 2015 was primarily in core money market and time deposits.
We made a concerted effort to change our deposit mix beginning in 2012 to emphasize core deposit money market accounts and reduce our wholesale funding percentages. During 2013, our focus was to continue to increase our core deposits and sustain our percentage mix. During 2014, we advertised attractive rates with laddered maturity terms for time deposits in our local market to match funding with our new Poultry Agriculture vertical loans. In early 2015, we launched a nationwide marketing campaign through a rate listing website and also started allowing customers to open accounts online.
At March 31, 2015, the aggregate balance of time deposit accounts individually equal to or greater than $100,000 totaled $244 million. At March 31, 2015, 53% of all time deposit accounts in amounts equal to or greater than $100,000 were scheduled to mature within one year. The maturity profile of our time deposits at March 31, 2015 is as follows:
| Maturity Period at March 31, 2015 |
Three months or less |
More than three months to six months |
More than six months to twelve months |
More than twelve months |
||||||||||||
| (dollars in thousands) | ||||||||||||||||
| Time deposits, $100,000 and over |
$ | 16,330 | $ | 22,139 | $ | 90,497 | $ | 115,102 | ||||||||
| Other time deposits |
2,198 | 2,139 | 11,303 | 10,901 | ||||||||||||
| Total time deposits |
$ | 18,528 | $ | 24,278 | $ | 101,800 | $ | 126,003 | ||||||||
82
Table of Contents
On September 19, 2014, we entered into a $6.1 million short term line of credit with an unaffiliated commercial bank. Interest accrues at 30 day LIBOR plus 3.50% for a term of 12 months with a rate at December 31, 2014 of 3.654%. At December 31, 2014, we had $6.1 million outstanding on the loan. On February 23, 2015, we repaid the loan in full.
Total long-term borrowings increased $8.4 million at March 31, 2015 from December 31, 2014, as a result of the following:
On May 12, 2014, Independence Aviation LLC financed the purchase of an airplane by entering into a promissory note with an unaffiliated commercial bank in the amount of $6 million which carries a fixed rate of 4.97% for a term of 59 months. Monthly payments are set at $48 thousand with all principal and accrued interest due on May 12, 2019. There is $5.8 million outstanding on this note at March 31, 2015.
On August 1, 2014, we entered into a note payable line of credit of $15 million with an unaffiliated commercial bank, secured by 100% of Live Oak Banking Company’s outstanding common stock. At March 31, 2015 there was $7.2 million advanced on this line of credit. Interest accrues at 30 day LIBOR plus 4.00% for a term of 36 months with a rate at March 31, 2015 of 4.173%. Payments are interest only with all principal and accrued interest due on August 1, 2017. The terms of this loan require us to maintain minimum capital, liquidity and asset quality ratios. There is $7.8 million remaining available credit on this line of credit at March 31, 2015.
On September 11, 2014, we financed the construction of an additional building located on our Tiburon Drive campus for a $24 million construction line of credit with an unaffiliated commercial bank, secured by both properties at our Tiburon Drive main office location. At March 31, 2015, $19.5 million had been advanced on the construction line of credit. Payments are interest only through September 11, 2016 at a fixed rate of 3.95% for a term of 84 months. Monthly principal and interest payments beginning in October 2016 will be $146 thousand with all principal and accrued interest due on September 11, 2021. The terms of this loan require us to maintain minimum capital, liquidity and Texas ratios. There is $4.5 million remaining available credit on this construction line at March 31, 2015.
On September 18, 2014, we entered into a note payable line of credit of $8.1 million with an unaffiliated commercial bank, with $5 million outstanding at March 31, 2015. The note is unsecured and accrues interest at 30 day LIBOR plus 3.50% for a term of 36 months with a rate at March 31, 2015 of 3.671%. Payments are interest only with all principal and accrued interest due on September 18, 2017. There is $3.1 million remaining available credit on this note at March 31, 2015.
On March 10, 2015, we refinanced an existing loan between Independence Aviation LLC and Live Oak Banking Company with an unaffiliated commercial bank in the amount of $1.2 million, which carries a fixed rate of 4.96% for a term of 51 months. Monthly payments are set at $9 thousand with all principal and accrued interest due on June 10, 2019.
With the acquisition of GLS on September 1, 2013, we assumed the liability for a note payable due to a former GLS partner with an outstanding balance of $250 thousand at the time of acquisition. The outstanding balance includes all interest due. At March 31, 2015, the note has six months remaining with equal monthly payments of $10 thousand until scheduled maturity on August 1, 2015.
Small Business Lending Fund
In April 2011, we elected to participate in the Small Business Lending Fund program, or the SBLF program, whereby the U.S. Treasury agreed to purchase $6.8 million in senior debt securities from us. During the initial interest period the applicable interest rate is set at 1.5%. For all remaining interest periods, which commenced on September 13, 2011, upon receipt of SBLF funds, the interest rate is determined based on a formula which encompasses the percentage change in qualified lending as well as a non-qualifying portion percentage. This rate can range from 1.5% to 10.8%. At March 31, 2015, the interest rate was 1.5%. Interest is payable quarterly in
83
Table of Contents
arrears. With the approval of our primary federal regulator, the Federal Reserve, we may exit the SBLF program at any time simply by repaying the full principal amount of the senior debt securities together with any accrued but unpaid interest. We may also repay our SBLF funding in partial payments, as long as each partial payment is at least 25% of the original funding amount. All SBLF senior debt securities will mature on September 13, 2021, at which time all principal and accrued but unpaid interest will be due.
Risk Management
Overview. Managing risk is an essential part of successfully managing a financial institution. Our most prominent risk exposures are credit risk, interest rate risk and market risk. Credit risk is the risk of not collecting the interest and/or the principal balance of a loan or investment when it is due. Interest rate risk is the potential reduction of net interest income as a result of changes in interest rates as well as a reduction in the value of our servicing asset based on a borrower’s propensity to refinance a variable rate loan in a rising rate environment. Changes in interest rates may result in changes in the values of financial instruments, such as available for sale securities, which are accounted for on a mark-to-market basis, and the value of our variable rate loans for sale in the secondary market as prepayment speeds will increase for variable rate loans in a rising rate environment
Other risks that we face include operational risks, liquidity risks and reputation risk. Operational risks include risks related to fraud, regulatory compliance, processing errors, technology, and disaster recovery. Liquidity risk is the possible inability to fund obligations to depositors, lenders or borrowers due to unforeseen circumstances. Reputation risk is the risk that negative publicity or press, whether true or not, could cause a decline in our customer base or revenue.
Credit Risk
Analysis of Nonperforming and Classified Assets. We place loans on nonaccrual status when they become 90 days past due as to principal or interest payments, or prior to that, if we have determined based upon current information available to us that the timely collection of principal or interest is not probable. When a loan is placed on nonaccrual status, any interest previously accrued as income but not actually collected is reversed and recorded as a reduction of loan interest and fee income. Typically, collections of interest and principal received on a nonaccrual loan are applied to the outstanding principal as determined at the time of collection of the loan.
Troubled debt restructurings occur when, because of economic or legal reasons pertaining to the debtor’s financial difficulties, we grant debtors concessions that we would not otherwise consider. Such concessions would include, but are not limited to, the transfer of assets or the issuance of equity interests by the debtor to us to satisfy all or part of the debt, modification of the terms of debt or the substitution or addition of debtor(s).
84
Table of Contents
The following table provides information with respect to our nonperforming assets and troubled debt restructurings at the dates indicated.
| At March 31, | At December 31, | |||||||||||||||
| 2015 | 2014 | 2013 | 2012 | |||||||||||||
| (dollars in thousands) | ||||||||||||||||
| Nonaccrual loans: |
||||||||||||||||
| Commercial & Industrial |
$6,780 | $ | 7,133 | $ | 4,099 | $ | 2,955 | |||||||||
| Healthcare Services |
2,537 | 2,652 | 772 | 581 | ||||||||||||
| Independent Pharmacies |
1,219 | 1,224 | — | — | ||||||||||||
| Veterinary Practices |
3,024 | 3,257 | 3,327 | 2,374 | ||||||||||||
| Owner Occupied Commercial Real Estate |
12,118 | 11,559 | 4,598 | 5,638 | ||||||||||||
| Death Care Management |
1,699 | 1,721 | — | — | ||||||||||||
| Healthcare Services |
2,307 | 2,312 | 58 | — | ||||||||||||
| Veterinary Practices |
7,837 | 7,251 | 4,540 | 4,935 | ||||||||||||
| Other Industries |
275 | 275 | — | 703 | ||||||||||||
|
|
|
|
|
|
|
|
|
|||||||||
| Total nonperforming loans |
$ | 18,898 | $ | 18,692 | $ | 8,697 | $ | 8,593 | ||||||||
|
|
|
|
|
|
|
|
|
|||||||||
| Total accruing loans past due 90 days or more |
$ | — | $ | — | $ | — | $ | — | ||||||||
|
|
|
|
|
|
|
|
|
|||||||||
| Foreclosed assets |
$ | 34 | $ | 371 | $ | 341 | $ | 232 | ||||||||
|
|
|
|
|
|
|
|
|
|||||||||
| Nonaccrual troubled debt restructuring |
$ | 10,721 | $ | 9,805 | $ | 5,781 | $ | 5,426 | ||||||||
|
|
|
|
|
|
|
|
|
|||||||||
| Total troubled debt restructurings |
11,513 | 10,611 | 9,736 | 9,120 | ||||||||||||
| Less nonaccrual troubled debt restructurings |
(10,721 | ) | (9,805 | ) | (5,781 | ) | (5,426 | ) | ||||||||
|
|
|
|
|
|
|
|
|
|||||||||
| Total nonperforming assets and troubled debt restructurings |
$ | 19,724 | $ | 19,869 | $ | 12,993 | $ | 12,519 | ||||||||
|
|
|
|
|
|
|
|
|
|||||||||
| Total nonperforming loans to total loans |
8.57% | 9.17 | % | 6.15 | % | 9.27 | % | |||||||||
| Total nonperforming loans to total assets |
2.61% | 2.78 | % | 2.02 | % | 2.51 | % | |||||||||
| Total nonperforming assets and troubled debt restructurings to total assets |
2.73% | 2.95 | % | 3.02 | % | 3.65 | % | |||||||||
85
Table of Contents
| At March 31, 2015 |
At December 31, | |||||||||||||||
| 2014 | 2013 | 2012 | ||||||||||||||
| (dollars in thousands) | ||||||||||||||||
| Nonaccrual loans guaranteed by U.S. government: |
||||||||||||||||
| Commercial & Industrial |
$ | 6,358 | $ | 6,620 | $ | 3,849 | $ | 2,386 | ||||||||
| Healthcare Services |
2,306 | 2,368 | 660 | 432 | ||||||||||||
| Independent Pharmacies |
1,135 | 1,139 | — | — | ||||||||||||
| Veterinary Practices |
2,917 | 3,113 | 3,189 | 1,954 | ||||||||||||
| Owner Occupied Commercial Real Estate |
9,606 | 8,935 | 3,134 | 2,676 | ||||||||||||
| Death Care Management |
1,487 | 1,505 | — | — | ||||||||||||
| Healthcare Services |
1,918 | 1,919 | — | — | ||||||||||||
| Veterinary Practices |
5,926 | 5,236 | 3,134 | 2,676 | ||||||||||||
| Other Industries |
275 | 275 | — | — | ||||||||||||
|
|
|
|
|
|
|
|
|
|||||||||
| Total nonperforming loans guaranteed by the SBA |
$ | 15,964 | $ | 15,555 | $ | 6,983 | $ | 5,062 | ||||||||
|
|
|
|
|
|
|
|
|
|||||||||
| Total accruing loans past 90 days or more guaranteed by the SBA |
$ | — | $ | — | $ | — | $ | — | ||||||||
|
|
|
|
|
|
|
|
|
|||||||||
| Foreclosed assets guaranteed by the SBA |
$ | — | $ | — | $ | — | $ | — | ||||||||
|
|
|
|
|
|
|
|
|
|||||||||
| Nonaccrual troubled debt restructuring guaranteed by the SBA |
9,099 | 8,433 | 4,814 | 3,097 | ||||||||||||
|
|
|
|
|
|
|
|
|
|||||||||
| Total troubled debt restructurings guaranteed by the SBA |
9,099 | 8,433 | 6,139 | 4,476 | ||||||||||||
| Less nonaccrual troubled debt restructurings guaranteed by the SBA |
(9,099 | ) | (8,433 | ) | (4,814 | ) | (3,097 | ) | ||||||||
|
|
|
|
|
|
|
|
|
|||||||||
| Total nonperforming assets and troubled debt restructurings guaranteed by the SBA |
$ | 15,964 | $ | 15,555 | $ | 8,308 | $ | 6,441 | ||||||||
|
|
|
|
|
|
|
|
|
|||||||||
| Total nonperforming loans not guaranteed by the SBA to total held for investment loans |
1.33 | % | 1.54 | % | 1.21 | % | 3.81 | % | ||||||||
|
|
|
|
|
|
|
|
|
|||||||||
| Total nonperforming loans not guaranteed by the SBA to total assets |
0.41 | % | 0.47 | % | 0.40 | % | 1.03 | % | ||||||||
|
|
|
|
|
|
|
|
|
|||||||||
| Total nonperforming assets and troubled debt restructurings not guaranteed by the SBA to total assets |
0.52 | % | 0.64 | % | 1.09 | % | 1.77 | % | ||||||||
|
|
|
|
|
|
|
|
|
|||||||||
Our total nonperforming assets and troubled debt restructurings at March 31, 2015 were $19.7 million, which represented a $145 thousand, or 0.7%, decrease from December 31, 2014. Total nonperforming assets at March 31, 2015 were composed of $18.9 million in nonaccrual loans and $33.5 thousand of foreclosed assets. Of the $18.9 million of nonperforming assets, $16.0 million carried a SBA guaranty, leaving unguaranteed exposure of $2.9 million in total nonperforming assets at March 31, 2015.
As a percentage of the Bank’s total capital, nonperforming loans represented 24.9% at March 31, 2015. Considering that the greater magnitude of risk resides in the unguaranteed portion of nonperforming loans and adjusting the ratio to include only the unguaranteed portion of nonperforming loans as a percent of the Bank’s total capital results in a ratio of 3.9% at March 31, 2015.
As of March 31, 2015, our potential problem loans and impaired loans totaled $41.3 million. Risk Grades 5 through 8 represent the spectrum of criticized and impaired loans. Loans in the Veterinary Practices vertical comprise 56.6% of the total potential problem and impaired loans. At March 31, 2015, the portion of criticized loans guaranteed by the SBA totaled $21.5 million resulting in unguaranteed exposure risk of $19.8 million, or 10.0% of our total held for investment unguaranteed exposure.
Total SBA-guaranteed loans deemed impaired at December 31, 2014, 2013 and 2012 were $19.5 million, $9.8 million and $7.0 million, respectively. As of December 31, 2014, our total nonperforming assets and troubled debt restructurings were $19.9 million, which represented a $6.9 million, or 52.9%, increase from
86
Table of Contents
December 31, 2013. The nonperforming assets were comprised of $18.7 million of nonaccrual loans, $371 thousand of foreclosed assets. Of the $19.1 million of nonperforming assets, $15.6 million carried a SBA guaranty, which mitigates the risk of the nonperforming asset yielding unguaranteed exposure of $3.5 million. Our unguaranteed exposure relating to nonperforming assets at December 31, 2014 decreased $1.5 million from the year ended December 31, 2013.
As a percentage of the Bank’s total capital, nonperforming loans represented 30.2% for the year ended December 31, 2014, compared to nonperforming loans at 17.3% of the Bank’s total capital for the year ended December 31, 2013. Considering that the greater magnitude of risk resides in the unguaranteed portion of nonperforming loans and adjusting the ratio to include only the unguaranteed portion of nonperforming loans as a percent of the Bank’s total capital results in ratios at December 31, 2014 and 2013 of 5.1% and 3.4%, respectively.
As of December 31, 2013, our total nonperforming assets and troubled debt restructurings totaled $13.0 million, a $0.5 million, or 3.8%, increase from December 31, 2012. The nonperforming assets were comprised of $8.7 million of nonaccrual loans, $0.3 million of foreclosed assets. Of the $13.0 million of nonperforming assets and troubled debt restructurings, $8.3 million carried a U.S. government guaranty, which mitigates the risk of the nonperforming asset yielding unguaranteed exposure of $4.7 million.
As a percentage of the Bank’s total capital, nonperforming loans represented 17.3% for the year ended December 31, 2013 compared to nonperforming loans at 21.1% for the year ended December 31, 2012. Adjusting the same measurement considering that the greater magnitude of risk resides in the unguaranteed portion of nonperforming loans results in ratios to the Bank’s total capital at December 31, 2013 and 2012, of 3.4% and 8.7%, respectively.
As of December 31, 2014, our potential problem and impaired loans totaled $41.0 million. Risk Grades 5 through 8 represent the spectrum of criticized and impaired loans. Loans in the Veterinary Practices vertical comprise 56.2% of the total potential problem and impaired loans. The majority of the impaired loans in this industry were originated in our early years. We believe that our underwriting and credit quality standards have improved as our business has matured. The portion of criticized loans guaranteed by the SBA totaled $21.3 million resulting in unguaranteed exposure risk of $19.7 million, or 10.8% of our total unguaranteed exposure. This compares to total criticized and impaired loans of $31.2 million at December 31, 2013, of which $12.4 million was guaranteed by the SBA.
The Bank does not classify loans that experience insignificant payment delays and payment shortfalls as impaired. The Bank considers an “insignificant period of time” from payment delays to be a period of 90 days or less. The Bank would provide a modification for a customer experiencing what we consider to be a short term event that has temporarily impacted cash flow. This could be due, among other reasons, to illness, weather, impact from a onetime expense, stronger than expected start-up, slower than expected start-up, construction issues or other short term issues. In all cases, credit will review the request to determine if the customer is stressed and how the event has impacted the ability of the customer to repay the loan long term. To date, the only types of short term modifications the Bank has given are payment deferral and interest only extensions. The Bank does not alter the rate or lengthen the amortization of the note due to insignificant payment delays. Short terms modifications are not classified as troubled debt restructurings, or TDRs, because they do not meet the definition set by the FDIC and Accounting Standards.
The dollar amount of short-term modifications of loans held for investment not classified as TDRs during fiscal 2014, 2013 and 2012 was $3.4 million, $1.3 million and $1.3 million, respectively. There were 23, 9 and 11 short-term modifications not classified as TDRs in fiscal 2014, 2013 and 2012, respectively.
Management endeavors to be proactive in its approach to identify and resolve problem loans and is focused on working with the borrowers and guarantors of these loans to provide loan modifications when warranted. We implement an aggressive approach to identifying and classifying loans as criticized, Risk Grade 5. For example,
87
Table of Contents
for the years ended December 31, 2014 and 2013, Risk Grade 5 loans alone totaled $9.8 million and $9.9 million, respectively. While the level of nonperforming assets fluctuates in response to changing economic and market conditions, the relative size and composition of the loan portfolio, and our management’s degree of success in resolving problem assets, we believe our aggressive stance to early identification and intervention is the key to successfully managing a small business loan portfolio.
Interest income that would have been recorded for the year ended December 31, 2014 and for the year ended December 31, 2013 had nonaccrual loans been current throughout the period amounted to $0.4 million and $0.2 million, respectively.
Allowance for Loan Losses. The allowance for loan losses, a material estimate which could change significantly in the near-term in the event of rapidly deteriorating credit quality, is established through a provision for loan losses charged to earnings to account for losses that are inherent in the loan portfolio and estimated to occur, and is maintained at a level that management considers adequate to absorb losses in the loan portfolio. Loan losses are charged against the allowance for loan losses when management believes that the collectability of the principal loan balance is unlikely. Subsequent recoveries, if any, are credited to the allowance for loan losses when received.
Our judgment in determining the adequacy of the allowance is inherently subjective as it requires estimates that are susceptible to significant revision as more information becomes available and as situations and information change.
The allowance for loan losses is evaluated on a monthly basis by management and takes into consideration such factors as changes in the nature and volume of the loan portfolio, overall portfolio quality, review of specific problem loans and current economic conditions and trends that may affect the borrower’s ability to repay.
The allowance for loan losses consists of the following key elements:
| • | Specific allowance for identified impaired loans. For such loans that are identified as impaired, an allowance is established when the discounted cash flows (or collateral value if the loan is collateral dependent) or observable market price of the impaired loan are lower than the carrying value of that loan. |
Independent appraisals are obtained for all collateral dependent loans deemed impaired when collateral value is expected to exceed $5 thousand. After initially measured for impairment, new appraisals are ordered on at least an annual basis for all real estate secured loans. Non-real estate secured loan appraisal values are reevaluated and assessed throughout the year based upon interim changes in collateral and market conditions. Liquidation expense discounts for real estate secured loans generally include a 6% to 10% sales commission. For circumstances where real estate appraisals are over one year old, a 10% to 20% discount is generally applied.
| • | General valuation allowance. This component represents a valuation allowance on the remainder of the loan portfolio, after excluding impaired loans. For this portion of the allowance, loans are reviewed based on industry, stage and structure and are assigned allowance percentages based on historical loan loss experience adjusted for qualitative factors. Qualitative factors that, in management’s judgment, affect the collectability of the portfolio as of the evaluation date, may include changes in lending policies and procedures; changes in national and local economic and business conditions, including the condition of various market segments; changes in the nature and volume of the portfolio; changes in the experience, ability and depth of lending management and staff; changes in the volume and severity of past due and classified loans and in the volume of nonaccruals, troubled debt restructurings, and other loan modifications; the existence and effect of any concentrations of credit and changes in the level of such concentrations; and the effect of external factors, such as competition and legal and regulatory requirements, on the level of estimated and inherent credit losses in the Bank’s current portfolio. |
88
Table of Contents
The following table sets forth the breakdown of the allowance for loan losses by loan category at the dates indicated.
| At March 31, 2015 |
At December 31, | |||||||||||||||||||||||||||||||||||||||||||||||
| 2014 | 2013 | |||||||||||||||||||||||||||||||||||||||||||||||
| Amount | Total Loans |
% of Total Allowance |
% of Loans in Category of Total Loans |
Amount | Total Loans |
% of Total Allowance |
% of Loans in Category of Total Loans |
Amount | Total Loans |
% of Total Allowance |
% of Loans in Category of Total Loans |
|||||||||||||||||||||||||||||||||||||
| (dollars in thousands) | ||||||||||||||||||||||||||||||||||||||||||||||||
| Commercial & Industrial |
$ | 2,063 | $ | 86,151 | 39.42 | % | 39.16 | % | $ | 1,369 | $ | 81,057 | 31.06 | % | 39.84 | % | $ | 862 | $ | 57,359 | 31.66 | % | 40.36 | % | ||||||||||||||||||||||||
| Death Care Management |
2 | 3,880 | 0.04 | 1.76 | 2 | 3,603 | 0.04 | 1.77 | 2 | 1,782 | 0.07 | 1.25 | ||||||||||||||||||||||||||||||||||||
| Family Entertainment Centers |
35 | 340 | 0.66 | 0.15 | 29 | 333 | 0.66 | 0.16 | — | — | — | — | ||||||||||||||||||||||||||||||||||||
| Healthcare Services |
1,367 | 12,946 | 26.12 | 5.88 | 875 | 12,319 | 19.85 | 6.06 | 334 | 8,739 | 12.27 | 6.15 | ||||||||||||||||||||||||||||||||||||
| Independent Pharmacies |
435 | 35,114 | 8.31 | 15.96 | 336 | 34,079 | 7.62 | 16.75 | 132 | 24,026 | 4.85 | 16.91 | ||||||||||||||||||||||||||||||||||||
| Investment Advisors |
3 | 12,135 | 0.06 | 5.52 | 7 | 9,660 | 0.16 | 4.75 | 74 | 2,817 | 2.72 | 1.98 | ||||||||||||||||||||||||||||||||||||
| Veterinary Practices |
212 | 21,580 | 4.06 | 9.81 | 114 | 20,902 | 2.59 | 10.27 | 304 | 19,978 | 11.16 | 14.06 | ||||||||||||||||||||||||||||||||||||
| Other |
9 | 156 | 0.17 | 0.07 | 6 | 161 | 0.14 | 0.08 | 16 | 17 | 0.59 | 0.01 | ||||||||||||||||||||||||||||||||||||
| Construction & Development |
755 | 14,533 | 14.42 | 6.61 | 586 | 9,526 | 13.30 | 4.68 | 350 | 10,286 | 12.85 | 7.24 | ||||||||||||||||||||||||||||||||||||
| Poultry Agriculture |
449 | 5,460 | 8.59 | 2.48 | 362 | 3,910 | 8.22 | 1.92 | — | — | — | — | ||||||||||||||||||||||||||||||||||||
| Death Care Management |
3 | 483 | 0.06 | 0.22 | 1 | 92 | 0.02 | 0.05 | 10 | 989 | 0.37 | 0.70 | ||||||||||||||||||||||||||||||||||||
| Family Entertainment Centers |
16 | 152 | 0.31 | 0.07 | — | — | — | — | — | — | — | — | ||||||||||||||||||||||||||||||||||||
| Healthcare Services |
203 | 5,150 | 3.87 | 2.34 | 145 | 2,957 | 3.29 | 1.45 | 242 | 4,997 | 8.89 | 3.52 | ||||||||||||||||||||||||||||||||||||
| Independent Pharmacies |
8 | 456 | 0.15 | 0.21 | 4 | 215 | 0.09 | 0.11 | 2 | 101 | 0.07 | 0.07 | ||||||||||||||||||||||||||||||||||||
| Veterinary Practices |
29 | 2,676 | 0.56 | 1.22 | 27 | 2,207 | 0.61 | 1.08 | 96 | 4,199 | 3.52 | 2.95 | ||||||||||||||||||||||||||||||||||||
| Other |
47 | 156 | 0.89 | 0.07 | 47 | 145 | 1.07 | 0.07 | — | — | 0.00 | 0.00 | ||||||||||||||||||||||||||||||||||||
| Owner Occupied |
2,062 | 115,200 | 39.40 | 52.36 | 2,291 | 111,620 | 51.99 | 54.86 | 1,511 | 74,461 | 55.49 | 52.40 | ||||||||||||||||||||||||||||||||||||
| Poultry Agriculture |
22 | 283 | 0.42 | 0.13 | 25 | 259 | 0.57 | 0.13 | ||||||||||||||||||||||||||||||||||||||||
| Death Care Management |
25 | 19,270 | 0.48 | 8.76 | 77 | 18,879 | 1.75 | 9.28 | 60 | 11,668 | 2.20 | 8.21 | ||||||||||||||||||||||||||||||||||||
| Family Entertainment Centers |
94 | 761 | 1.80 | 0.35 | 89 | 872 | 2.02 | 0.43 | — | — | — | — | ||||||||||||||||||||||||||||||||||||
| Healthcare Services |
650 | 27,634 | 12.42 | 12.56 | 794 | 26,173 | 18.02 | 12.86 | 320 | 11,129 | 11.75 | 7.83 | ||||||||||||||||||||||||||||||||||||
| Independent Pharmacies |
36 | 4,578 | 0.68 | 2.08 | 32 | 4,750 | 0.72 | 2.33 | 54 | 3,490 | 1.98 | 2.46 | ||||||||||||||||||||||||||||||||||||
| Investment Advisors |
— | 2,481 | 0.00 | 1.13 | — | 2,161 | — | 1.06 | 4 | 171 | 0.15 | 0.12 | ||||||||||||||||||||||||||||||||||||
| Veterinary Practices |
1,121 | 59,615 | 21.42 | 27.10 | 1,122 | 57,934 | 25.46 | 28.48 | 965 | 47,896 | 35.44 | 33.70 | ||||||||||||||||||||||||||||||||||||
| Other |
114 | 578 | 2.19 | 0.26 | 152 | 592 | 3.45 | 0.29 | 108 | 107 | 3.97 | 0.08 | ||||||||||||||||||||||||||||||||||||
| Commercial Land |
354 | 4,136 | 6.75 | 1.88 | 161 | 1,248 | 3.65 | 0.61 | — | — | — | — | ||||||||||||||||||||||||||||||||||||
| Poultry Agriculture |
354 | 4,136 | 6.75 | 1.88 | 161 | 1,248 | 3.65 | 0.61 | — | — | — | — | ||||||||||||||||||||||||||||||||||||
|
|
|
|
|
|
|
|
|
|
|
|
|
|
|
|
|
|
|
|
|
|
|
|
|
|||||||||||||||||||||||||
| Total |
$ | 5,234 | $ | 220,020 | 100.00 | % | 100.00 | % | $ | 4,407 | $ | 203,451 | 100.00 | % | 100.00 | % | $ | 2,723 | $ | 142,106 | 100.00 | % | 100.00 | % | ||||||||||||||||||||||||
|
|
|
|
|
|
|
|
|
|
|
|
|
|
|
|
|
|
|
|
|
|
|
|
|
|||||||||||||||||||||||||
89
Table of Contents
Loan Risk Grades.
The following tables summarize the risk grades of each category as of March 31, 2015, December 31, 2014, 2013 and 2012.
| March 31, 2015 |
Risk Grades 1 - 4 |
Risk Grade 5 |
Risk Grade 6 |
Risk Grade 7 |
Total | |||||||||||||||
| (dollars in thousands) | ||||||||||||||||||||
| Commercial & Industrial |
$ | 68,832 | $ | 4,027 | $ | 12,568 | $ | 724 | $ | 86,151 | ||||||||||
| Agriculture |
— | — | — | — | — | |||||||||||||||
| Death Care Management |
3,880 | — | — | — | 3,880 | |||||||||||||||
| Family Entertainment Centers |
340 | — | — | — | 340 | |||||||||||||||
| Healthcare Services |
7,511 | 544 | 4,167 | 724 | 12,946 | |||||||||||||||
| Independent Pharmacies |
29,177 | 2,039 | 3,898 | — | 35,114 | |||||||||||||||
| Investment Advisors |
12,135 | — | — | — | 12,135 | |||||||||||||||
| Veterinary Practices |
15,789 | 1,288 | 4,503 | — | 21,580 | |||||||||||||||
| Other Industries |
— | 156 | — | — | 156 | |||||||||||||||
| Construction & Development |
14,533 | — | — | — | 14,533 | |||||||||||||||
| Poultry Agriculture |
5,460 | — | — | — | 5,460 | |||||||||||||||
| Death Care Management |
483 | — | — | — | 483 | |||||||||||||||
| Family Entertainment |
152 | — | — | — | 152 | |||||||||||||||
| Healthcare Services |
5,150 | — | — | — | 5,150 | |||||||||||||||
| Independent Pharmacies |
456 | — | — | — | 456 | |||||||||||||||
| Veterinary Practices |
2,676 | — | — | — | 2,676 | |||||||||||||||
| Other |
156 | — | — | — | 156 | |||||||||||||||
| Owner Occupied Commercial Real Estate |
91,223 | 4,957 | 15,979 | 3,041 | 115,200 | |||||||||||||||
| Poultry Agriculture |
283 | — | — | — | 283 | |||||||||||||||
| Death Care Management |
16,944 | 627 | 1,698 | — | 19,269 | |||||||||||||||
| Family Entertainment Centers |
761 | — | — | — | 761 | |||||||||||||||
| Healthcare Services |
23,875 | 1,308 | 2,451 | — | 27,634 | |||||||||||||||
| Independent Pharmacies |
4,539 | 40 | — | — | 4,579 | |||||||||||||||
| Investment Advisors |
2,481 | — | — | — | 2,481 | |||||||||||||||
| Veterinary Practices |
42,038 | 2,982 | 11,830 | 2,765 | 59,615 | |||||||||||||||
| Other Industries |
302 | — | — | 276 | 578 | |||||||||||||||
| Commercial Land |
4,136 | — | — | — | 4,136 | |||||||||||||||
| Poultry Agriculture |
4,136 | — | — | — | 4,136 | |||||||||||||||
|
|
|
|
|
|
|
|
|
|
|
|||||||||||
| Total |
$ | 178,724 | $ | 8,984 | $ | 28,547 | $ | 3,765 | $ | 220,020 | ||||||||||
|
|
|
|
|
|
|
|
|
|
|
|||||||||||
90
Table of Contents
| Risk Grades 1 - 4 |
Risk Grade 5 |
Risk Grade 6 |
Risk Grade 7 |
Total | ||||||||||||||||
| (dollars in thousands) | ||||||||||||||||||||
| December 31, 2014 |
||||||||||||||||||||
| Commercial & Industrial |
$ | 63,777 | $ | 4,546 | $ | 11,907 | $ | 827 | $ | 81,057 | ||||||||||
| Death Care Management |
3,603 | — | — | — | 3,603 | |||||||||||||||
| Family Entertainment Centers |
333 | — | — | — | 333 | |||||||||||||||
| Healthcare Services |
6,995 | 538 | 3,959 | 827 | 12,319 | |||||||||||||||
| Independent Pharmacies |
27,673 | 2,726 | 3,680 | — | 34,079 | |||||||||||||||
| Investment Advisors |
9,660 | — | — | — | 9,660 | |||||||||||||||
| Veterinary Practices |
15,513 | 1,121 | 4,268 | — | 20,902 | |||||||||||||||
| Other Industries |
— | 161 | — | — | 161 | |||||||||||||||
| Construction & Development |
9,526 | — | — | — | 9,526 | |||||||||||||||
| Poultry Agriculture |
3,910 | — | — | — | 3,910 | |||||||||||||||
| Death Care Management |
92 | — | — | — | 92 | |||||||||||||||
| Healthcare Services |
2,957 | — | — | — | 2,957 | |||||||||||||||
| Independent Pharmacies |
215 | — | — | — | 215 | |||||||||||||||
| Veterinary Practices |
2,207 | — | — | — | 2,207 | |||||||||||||||
| Other |
145 | — | — | — | 145 | |||||||||||||||
| Owner Occupied Commercial Real Estate |
87,883 | 5,219 | 15,452 | 3,066 | 111,620 | |||||||||||||||
| Poultry Agriculture |
259 | — | — | — | 259 | |||||||||||||||
| Death Care Management |
16,519 | 639 | 1,721 | — | 18,879 | |||||||||||||||
| Family Entertainment Centers |
872 | — | — | — | 872 | |||||||||||||||
| Healthcare Services |
22,778 | 938 | 2,457 | — | 26,173 | |||||||||||||||
| Independent Pharmacies |
4,709 | 41 | — | — | 4,750 | |||||||||||||||
| Investment Advisors |
2,161 | — | — | — | 2,161 | |||||||||||||||
| Veterinary Practices |
40,281 | 3,601 | 11,261 | 2,791 | 57,934 | |||||||||||||||
| Other Industries |
304 | — | 13 | 275 | 592 | |||||||||||||||
| Commercial Land |
1,248 | — | — | — | 1,248 | |||||||||||||||
| Poultry Agriculture |
1,248 | — | — | — | 1,248 | |||||||||||||||
|
|
|
|
|
|
|
|
|
|
|
|||||||||||
| Total |
$ | 162,434 | $ | 9,765 | $ | 27,359 | $ | 3,893 | $ | 203,451 | ||||||||||
|
|
|
|
|
|
|
|
|
|
|
|||||||||||
91
Table of Contents
| Risk Grades 1 - 4 |
Risk Grade 5 |
Risk Grade 6 |
Risk Grade 7 |
Total | ||||||||||||||||
| (dollars in thousands) | ||||||||||||||||||||
| December 31, 2013 |
||||||||||||||||||||
| Commercial & Industrial |
$ | 44,786 | $ | 4,769 | $ | 4,126 | $ | 3,678 | $ | 57,359 | ||||||||||
| Death Care Management |
1,782 | — | — | — | 1,782 | |||||||||||||||
| Healthcare Services |
5,538 | 941 | 1,507 | 753 | 8,739 | |||||||||||||||
| Independent Pharmacies |
20,969 | 2,353 | 704 | — | 24,026 | |||||||||||||||
| Investment Advisors |
2,817 | — | — | — | 2,817 | |||||||||||||||
| Veterinary Practices |
13,663 | 1,475 | 1,915 | 2,925 | 19,978 | |||||||||||||||
| Other Industries |
17 | — | — | — | 17 | |||||||||||||||
| Construction & Development |
8,981 | 1,305 | — | — | 10,286 | |||||||||||||||
| Death Care Management |
989 | — | — | — | 989 | |||||||||||||||
| Healthcare Services |
4,934 | 63 | — | — | 4,997 | |||||||||||||||
| Independent Pharmacies |
101 | — | — | — | 101 | |||||||||||||||
| Veterinary Practices |
2,957 | 1,242 | — | — | 4,199 | |||||||||||||||
| Owner Occupied Commercial Real Estate |
57,120 | 3,797 | 10,023 | 3,521 | 74,461 | |||||||||||||||
| Death Care Management |
11,312 | — | 356 | — | 11,668 | |||||||||||||||
| Healthcare Services |
9,218 | 423 | 1,430 | 58 | 11,129 | |||||||||||||||
| Independent Pharmacies |
3,189 | — | 301 | — | 3,490 | |||||||||||||||
| Investment Advisors |
171 | — | — | — | 171 | |||||||||||||||
| Veterinary Practices |
33,226 | 3,374 | 7,833 | 3,463 | 47,896 | |||||||||||||||
| Other Industries |
4 | — | 103 | — | 107 | |||||||||||||||
|
|
|
|
|
|
|
|
|
|
|
|||||||||||
| Total |
$ | 110,887 | $ | 9,871 | $ | 14,149 | $ | 7,199 | $ | 142,106 | ||||||||||
|
|
|
|
|
|
|
|
|
|
|
|||||||||||
| Risk Grades 1 - 4 |
Risk Grade 5 |
Risk Grade 6 |
Risk Grade 7 |
Total | ||||||||||||||||
| (dollars in thousands) | ||||||||||||||||||||
| December 31, 2012 |
||||||||||||||||||||
| Commercial & Industrial |
$ | 26,266 | $ | 2,639 | $ | 2,762 | $ | 2,533 | $ | 34,200 | ||||||||||
| Death Care Management |
283 | — | — | — | 283 | |||||||||||||||
| Healthcare Services |
4,138 | 53 | 224 | 581 | 4,996 | |||||||||||||||
| Independent Pharmacies |
11,185 | 1,007 | — | — | 12,192 | |||||||||||||||
| Veterinary Practices |
9,650 | 1,579 | 2,538 | 1,952 | 15,719 | |||||||||||||||
| Other Industries |
1,010 | — | — | — | 1,010 | |||||||||||||||
| Construction & Development |
7,644 | — | 859 | — | 8,503 | |||||||||||||||
| Death Care Management |
315 | — | — | — | 315 | |||||||||||||||
| Healthcare Services |
2,277 | — | 859 | — | 3,136 | |||||||||||||||
| Independent Pharmacies |
637 | — | — | — | 637 | |||||||||||||||
| Veterinary Practices |
4,163 | — | — | — | 4,163 | |||||||||||||||
| Other Industries |
252 | — | — | — | 252 | |||||||||||||||
| Owner Occupied Commercial Real Estate |
31,333 | 5,689 | 9,336 | 4,219 | 50,577 | |||||||||||||||
| Death Care Management |
3,703 | — | — | — | 3,703 | |||||||||||||||
| Healthcare Services |
4,068 | — | 2,139 | — | 6,207 | |||||||||||||||
| Independent Pharmacies |
1,315 | — | 1,693 | — | 3,008 | |||||||||||||||
| Veterinary Practices |
20,964 | 5,689 | 4,682 | 4,219 | 35,554 | |||||||||||||||
| Other Industries |
1,283 | — | 822 | — | 2,105 | |||||||||||||||
|
|
|
|
|
|
|
|
|
|
|
|||||||||||
| Total |
$ | 65,243 | $ | 8,328 | $ | 12,957 | $ | 6,752 | $ | 93,280 | ||||||||||
|
|
|
|
|
|
|
|
|
|
|
|||||||||||
92
Table of Contents
Analysis of Loan Loss Experience. The following table sets forth an analysis of the allowance for loan losses for the years indicated.
| As of and for the Three Months Ended March 31, |
As of and for the Year Ended December 31, | |||||||||||||||||||||||
| 2015 | 2014 | 2014 | 2013 | 2012 | 2011 | |||||||||||||||||||
| (dollars in thousands) | ||||||||||||||||||||||||
| Allowance for Loan & Lease Losses: |
||||||||||||||||||||||||
| Beginning Balance |
$ | 4,407 | $ | 2,723 | $ | 2,723 | $ | 5,108 | $ | 4,617 | $ | 3,438 | ||||||||||||
| Provision |
1,077 | 423 | 2,793 | (858 | ) | 2,110 | 2,855 | |||||||||||||||||
| Charge offs |
(251 | ) | — | (1,213 | ) | (1,948 | ) | (1,986 | ) | (1,732 | ) | |||||||||||||
| Commercial & Industrial |
(172 | ) | — | (698 | ) | (688 | ) | (454 | ) | (663 | ) | |||||||||||||
| Healthcare Services |
(28 | ) | — | (209 | ) | (419 | ) | (70 | ) | (58 | ) | |||||||||||||
| Independent Pharmacies |
(144 | ) | — | (294 | ) | — | — | — | ||||||||||||||||
| Veterinary Practices |
— | — | (195 | ) | (269 | ) | (384 | ) | (605 | ) | ||||||||||||||
| Owner Occupied |
(79 | ) | — | (515 | ) | (1,260 | ) | (1,532 | ) | (1,069 | ) | |||||||||||||
| Death Care Management |
— | — | (135 | ) | — | — | — | |||||||||||||||||
| Healthcare Services |
— | — | (25 | ) | (76 | ) | — | — | ||||||||||||||||
| Veterinary Practices |
(79 | ) | — | (263 | ) | (819 | ) | (1,501 | ) | (1,069 | ) | |||||||||||||
| Other |
— | — | (92 | ) | (365 | ) | (31 | ) | — | |||||||||||||||
| Recoveries |
1 | 67 | 104 | 60 | 126 | 271 | ||||||||||||||||||
| Commercial & Industrial |
— | 4 | 32 | 27 | 120 | 225 | ||||||||||||||||||
| Healthcare Services |
— | 1 | 17 | 2 | 8 | — | ||||||||||||||||||
| Veterinary Practices |
— | 3 | 15 | 25 | 112 | 225 | ||||||||||||||||||
| Owner Occupied |
1 | 63 | 72 | 33 | 6 | 46 | ||||||||||||||||||
| Veterinary Practices |
1 | 63 | 72 | 32 | 6 | 46 | ||||||||||||||||||
| Other |
— | — | — | 1 | — | — | ||||||||||||||||||
| Net transfer to loans held for sale |
— | — | — | 361 | 241 | (215 | ) | |||||||||||||||||
|
|
|
|
|
|
|
|
|
|
|
|
|
|||||||||||||
| Ending Balance |
$ | 5,234 | $ | 3,213 | $ | 4,407 | $ | 2,723 | $ | 5,108 | $ | 4,617 | ||||||||||||
|
|
|
|
|
|
|
|
|
|
|
|
|
|||||||||||||
Interest Rate Risk and Market Risk
Interest rate risk is a significant market risk and can result from timing and volume differences in the repricing of our rate-sensitive assets and liabilities, widening or tightening of credit spreads, changes in the general level of market interest rates and changes in the shape and level of market yield curves. We manage the interest rate sensitivity of our interest-bearing liabilities and interest-earning assets in an effort to minimize the adverse effects of changes in the interest rate environment. Management of interest rate risk is carried out primarily through strategies involving our available-for-sale securities, loan portfolio, and available funding sources.
We have a total cumulative gap in interest-earning assets and interest-bearing liabilities of 10.64% as of December 31, 2014, indicating that, overall, our assets will reprice before our liabilities. The majority of both our loans and deposits have short-term repricing capabilities. We have a funding model which differs from that of traditional banks. The majority of our revenue is attributable to non-interest income so we are less dependent on net interest income when compared to a traditional bank model. With our non-traditional funding model, we do not have the traditional bank branch network and can operate with lower overhead costs to offset the higher cost of funds used to attract deposits.
We have an Asset/Liability Committee to communicate, coordinate and control all aspects involving interest rate risk management. The Asset/Liability Committee, which includes five members of our board of directors, establishes and monitors the volume, maturities, pricing and mix of assets and funding sources with the objective of managing assets and funding sources to provide results that are consistent with liquidity, growth, risk limits and profitability goals. Adherence to relevant policies is monitored on an ongoing basis by the Asset/Liability Committee.
93
Table of Contents
The matching of assets and liabilities may be analyzed by examining the extent to which such assets and liabilities are “interest rate sensitive.” An asset or liability is said to be interest rate sensitive within a specific time period if it will mature or reprice within that time period. We analyze our interest rate sensitivity position to manage the risk associated with interest rate movements through the use of two simulation models: economic value of equity, or EVE, and net interest income, or NII, simulations. The EVE simulation provides a long-term view of interest rate risk because it analyzes all of the Bank’s future cash flows. EVE is defined as the present value of the Bank’s assets, less the present value of its liabilities, adjusted for any off-balance sheet items. The results show a theoretical change in the economic value of our shareholders’ equity as interest rates change.
EVE and NII simulations are completed quarterly and presented to the Asset/Liability Committee. The simulations provide an estimate of the impact of changes in interest rates on equity and net interest income under a range of assumptions. The numerous assumptions used in the simulation process are reviewed by the Asset/Liability Committee on a quarterly basis. Changes to these assumptions can significantly affect the results of the simulation. The simulation incorporates assumptions regarding the potential timing in the repricing of certain assets and liabilities when market rates change and the changes in spreads between different market rates. The simulation analysis incorporates management’s current assessment of the risk that pricing margins will change adversely over time due to competition or other factors.
Simulation analysis is only an estimate of our interest rate risk exposure at a particular point in time. We continually review the potential effect changes in interest rates could have on the repayment of rate sensitive assets and funding requirements of rate sensitive liabilities.
The table below sets forth an approximation of our NII sensitivity exposure for the 12-month periods ending December 31, 2015 and 2016 and our EVE sensitivity at December 31, 2014. The simulation uses projected repricing of assets and liabilities at December 31, 2014 on the basis of contractual maturities, anticipated repayments and scheduled rate adjustments. Prepayment rates can have a significant impact on interest income simulation. Because of the large percentage of variable rate loans and mortgage-backed securities we hold, rising or falling interest rates have a significant impact on the prepayment speeds of our earning assets that in turn affect the rate sensitivity position. Our loan portfolio consists primarily of SBA 7(a) loans, 84.4% quarterly or monthly adjustable with the prime rate or 3-month LIBOR, and our prepayment speeds react differently in a rising rate environment. Generally, when interest rates rise, our prepayments tend to increase; the opposite reaction from typical bank loan portfolios. In a rising rate environment, our quarterly adjustable borrowers seek to fix their payments so the loans prepay faster as borrowers refinance into fixed rate products with another lender. When interest rates fall, prepayments tend to slow down. Our asset sensitivity would be reduced if prepayments slow and vice versa. While we believe such assumptions to be reasonable, approximate actual future activity may differ from the assumed prepayment rates presented below.
| Estimated Increase/Decrease in Net Interest Income |
Estimated Percentage Change in EVE | |||||
| Basis Point (“bp”) Change in Interest Rates |
12 Months Ending December 31, 2015 |
12 Months Ending December 31, 2016 |
As of December 31, 2014 | |||
| +400 |
13.0% | 16.1% | (6.0)% | |||
| +300 |
9.7 | 12.0 | (5.0) | |||
| +200 |
6.4 | 8.0 | (3.6) | |||
| +100 |
3.2 | 4.0 | (2.0) | |||
| -100 |
(6.1) | (7.7) | 0.7 | |||
Rates are increased instantaneously at the beginning of the projection. The results show that we are asset sensitive and that net interest income will increase as rates rise and will decrease as rates decline. Sensitivity will increase in the second year of the projection due to interest rates increasing or decreasing for the full year and also due to the other assumptions used in the analysis as noted previously. Interest rates do not normally move all at once or evenly over time, but we believe that the analysis is useful to understanding the potential direction and magnitude of net interest income changes due to changing interest rates.
94
Table of Contents
The EVE analysis shows that we would theoretically lose market value in a rising rate environment. The analysis assumes that amortizing assets will experience higher prepayments as rates increase, causing asset values to decline. The opposite will be true for a declining rate environment, where we will expect to see our market value increase as the variable-rate loans and securities in our portfolio increase in value. This is primarily due to the increased prepayment speeds in a rising rate environment in our predominantly variable-rate loan portfolio, causing our assets to devalue at a faster rate than our liabilities.
Liquidity Risk
Liquidity Management. Liquidity management is the ability to meet current and future financial obligations of a short-term nature. Our primary sources of funds consist of loan sales in the secondary market, deposit inflows, and the sale of unguaranteed loans. While maturities and scheduled amortization of loans and securities are predictable sources of funds, deposit flows, loan prepayments, loan sales and security sales are greatly influenced by general interest rates, economic conditions, and competition.
Our primary source of funds to originate new loans is derived from deposits, loans sales and premium cash received; and, since inception, we have relied heavily on brokered deposits and Internet deposits to supplement our funding needs. All funds obtained from these sources are designated as brokered deposits. In addition, we use a rate listing service to advertise rates to banks, credit unions, and other institutional entities. We designate deposits obtained from this source as Internet deposits. To date, depositors of brokered and Internet funds have been willing to place deposits with us at competitive market rates. To attract deposits from local and nationwide consumer and commercial markets, we have historically paid above-market rates, which we have been able to pay due to our low overhead and branchless business model. We utilize local print media, marketing at trade shows, rate listing services and website advertising to attract deposits from consumer and commercial sources. In 2012, the Bank embarked on a course to increase relationship deposits in the local area and among our existing customers through above market rate offerings. In early 2015, we began advertising above market rates for time deposits on a rate listing website to a nationwide market for individual accounts only and have begun offering customers the ability to open accounts online. There is risk in using rate to attract depositor relationships. We believe this risk is mitigated to some degree by our ability to continue to offer higher rates due to the low overhead of our deposit model. Tapping into the existing loan customer base as a deposit source has been less successful than our marketing efforts in our local market. Due to the limited number of deposit products currently offered, there has not been a substantial attraction of our loan customer base. Additionally, we do not have a source of low-cost, long term borrowings outside of our certificate of deposit offerings.
With a higher rate offering to generate interest, we attracted some longer term certificates of deposit. We intend to have various term offerings to match our funding needs. Plans for the last half of 2015 are to market commercial checking accounts to selected business customers. We intend to target our marketing efforts on our existing vertical lines of business in phases, beginning first with the veterinary market since they are our longest-term customer base. The commercial checking account will be a no-fee based account with emphasis on electronic banking and tailored to individual vertical needs. Personal checking accounts will be offered to the business owners and their employees as well. Also, we plan to expand the deposit products and services offered to customers through the use of mobile banking solutions. With no plans to establish a brick-and-mortar branch network, online and mobile banking offers a means to meet customer needs and better efficiency through technology compared to traditional branch networks. We believe that mobile banking provides us the opportunity to further leverage the technological competency we have demonstrated since inception. We believe we have an opportunity to provide deposit solutions for our growing small business loan customer base.
We regularly adjust our investment in liquid assets based upon our assessment of (1) expected loan demand, (2) expected deposit flows, (3) yields available on interest-earning deposits and securities and (4) the objectives of our asset/liability management, funds management and liquidity policies. The objective of the liquidity policy is to reduce the risk to our earnings and capital arising from the inability to meet obligations in a timely manner
95
Table of Contents
without incurring unacceptable losses. This entails ensuring sufficient funds are available at a reasonable cost to meet potential demands from both fund providers and borrowers. Liquid assets, defined as cash, due from banks, certificates of deposit, federal funds sold, repurchase agreements, and available-for-sale securities, were 14.9% of total assets at March 31, 2015. Excess liquid assets are generally invested in investment grade available-for-sale securities.
Our most liquid assets are cash and cash equivalents. The levels of these assets depend on our operating, financing, lending and investing activities during any given period. At March 31, 2015, liquid assets totaled $108.3 million. Cash and due from banks totaled $47.6 million and certificates of deposit with other banks totaled $10.0 million. Securities classified as available-for-sale, which provide additional sources of liquidity, totaled $50.8 million at March 31, 2015. Additionally, at March 31, 2015, we had the ability to access $73.6 million from the Federal Reserve Bank’s Discount Window on a collateralized basis. We also maintain $25.5 million of unsecured and $1.0 million in secured lines of credit from five financial institutions to access federal funds. We had no outstanding balances on the unsecured or secured lines of credit as of March 31, 2015. In addition, we have a $5.0 million repurchase agreement in place with Raymond James at March 31, 2015. In addition, as of March 31, 2015, we had an outstanding liability of $4.7 million related to a guaranty to an unaffiliated commercial bank on a secured loan for an employee. In long term borrowings, we had $45.5 million outstanding at March 31, 2015 primarily related to the construction line of credit on our new facility with $4.5 million remaining to disburse. In addition, we have $10.9 million available credit on other notes payable for funding needs. We believe that our liquid assets combined with the available lines provide adequate liquidity to meet our current financial obligations for at least the next 12 months.
| Payments Due by Period | ||||||||||||||||||||
| Total | Less than One Year |
One to Three Years |
Three to Five Years |
More Than Five Years |
||||||||||||||||
| (dollars in thousands) | ||||||||||||||||||||
| Contractual Obligations |
||||||||||||||||||||
| Deposits without stated maturity |
$ | 281,084 | $ | 281,084 | $ | — | $ | — | $ | — | ||||||||||
| Time deposits |
270,609 | 144,605 | 77,876 | 48,128 | — | |||||||||||||||
| Long term borrowings |
50,210 | 395 | 14,453 | 12,691 | 22,682 | |||||||||||||||
| Operating lease obligations |
1,599 | 387 | 889 | 323 | — | |||||||||||||||
| Total |
$ | 628,569 | $ | 456,206 | $ | 92,940 | $ | 56,545 | $ | 22,961 | ||||||||||
Capital Management. Our management seeks to maintain adequate capital to support anticipated asset growth, operating needs and unexpected risks, and to ensure that we and the Bank are in compliance with all current and anticipated regulatory capital guidelines. Our primary sources of new capital include retained earnings and proceeds from the sale and issuance of capital stock or other securities. To date, we have employed a self-funding capital model. Expected future use or activities for which capital may be set aside include balance sheet growth and associated relative increases in market or credit exposure, investment activity, potential product and business expansions, acquisitions and strategic or infrastructure investments.
96
Table of Contents
Regulatory capital ratios for us and the Bank exceeded minimum federal regulatory guidelines for a well-capitalized depository institution as of March 31, 2015, December 31, 2014, 2013 and 2012. See Note 13 to the consolidated financial statements for further information. Capital ratios for us and the Bank, compared to the minimum regulatory ratios to be considered “well capitalized” and “adequately capitalized,” are set forth below.
| At March 31, 2015 |
At December 31, | Minimum Ratio to be “Well Capitalized” |
Minimum Ratio to be “Adequately Capitalized” |
|||||||||||||||||||||
| 2014 | 2013 | 2012 | ||||||||||||||||||||||
| The Company: |
||||||||||||||||||||||||
| Common Equity Tier 1 |
15.90 | N/A | N/A | N/A | 6.5 | 4.5 | ||||||||||||||||||
| Total risk-based capital ratio |
16.85 | 19.63 | % | 17.96 | % | 17.21 | % | 10.0 | 8.0 | |||||||||||||||
| Tier 1 risk-based capital ratio |
15.90 | 17.41 | 14.99 | 13.05 | 8.0 | 6.0 | ||||||||||||||||||
| Tier 1 leverage ratio |
11.38 | 13.38 | 10.30 | 8.39 | 5.0 | 4.0 | ||||||||||||||||||
| Tangible equity to tangible assets ratio |
13.84 | 13.62 | 11.15 | 9.65 | N/A | N/A | ||||||||||||||||||
| Tangible equity to risk-weighted assets ratio |
18.31 | 18.12 | 14.96 | 14.08 | N/A | N/A | ||||||||||||||||||
| Live Oak Bank: |
||||||||||||||||||||||||
| Common Equity Tier 1 |
12.36 | N/A | N/A | N/A | 6.5 | 4.5 | ||||||||||||||||||
| Total risk-based capital ratio |
13.39 | 13.36 | 15.95 | 17.91 | 10.0 | 8.0 | ||||||||||||||||||
| Tier 1 risk-based capital ratio |
12.36 | 12.43 | 15.09 | 16.65 | 8.0 | 6.0 | ||||||||||||||||||
| Tier 1 leverage ratio |
8.66 | 9.34 | 10.39 | 10.63 | 5.0 | 4.0 | ||||||||||||||||||
Off-Balance Sheet Arrangements
In the normal course of operations, we engage in a variety of financial transactions that, in accordance with accounting principles generally accepted in the United States of America, are not recorded in our financial statements. These transactions involve, to varying degrees, elements of credit, interest rate and liquidity risk. Such transactions are used primarily to manage customers’ requests for funding and take the form of loan commitments, lines of credit and letters of credit.
The contractual amounts of commitments to extend credit represent the amounts of potential accounting loss should the contract be fully drawn upon, the customer defaults and any existing collateral has no value. We use the same credit policies in making commitments and conditional obligations as we do for on-balance sheet instruments. Financial instruments whose contract amounts represent credit risk at December 31, 2014, 2013 and 2012 are as follows:
| At March 31, 2015 |
At December 31, | |||||||||||||||
| 2014 | 2013 | 2012 | ||||||||||||||
| (dollars in thousands) | ||||||||||||||||
| Commitments to extend credit(1) |
$ | 586,037 | $ | 537,957 | $ | 221,487 | $ | 216,010 | ||||||||
| Plexus Capital — Fund II investment commitment |
100 | 100 | 100 | — | ||||||||||||
| Plexus Capital — Fund III investment commitment |
350 | 350 | 413 | 138 | ||||||||||||
|
|
|
|
|
|
|
|
|
|||||||||
| Total commitments |
$ | 586,487 | $ | 538,407 | $ | 222,000 | $ | 216,148 | ||||||||
|
|
|
|
|
|
|
|
|
|||||||||
| (1) | Commitments to extend credit are agreements to lend to a customer as long as there is no violation of any condition established in the contract. Commitments may require payment of a fee and generally have fixed expiration dates or other termination clauses. |
Impact of Recent Accounting Pronouncements
The information required by this item is included in Note 1 to the audited consolidated financial statements included elsewhere in this prospectus.
97
Table of Contents
Effect of Inflation and Changing Prices
The financial statements and related financial data presented in this prospectus have been prepared in accordance with U.S. GAAP, which requires the measurement of financial condition and operating results in terms of historical dollars without considering the change in the relative purchasing power of money over time due to inflation. The primary impact of inflation on our operations is reflected in increased operating costs. Unlike most industrial companies, virtually all the assets and liabilities of a financial institution are monetary in nature. As a result, interest rates generally have a more significant impact on a financial institution’s performance than do general levels of inflation. Interest rates do not necessarily move in the same direction or to the same extent as the prices of goods and services.
98
Table of Contents
Our Company
We are an established national online platform for small business lending. We believe we have used technology to fundamentally change small business lending by streamlining the borrower experience. We are able to better serve our customers by leveraging technological advantages and combining that with deep industry experience to create an optimized borrowing experience for our customers. We believe that our business model mitigates credit risk while capitalizing on technology to efficiently and prudently generate loans and manage our portfolio of loans outstanding. Our guiding principles, in order of priority, are soundness, profitability and growth.
We originate loans partially guaranteed by the U.S. Small Business Administration, or the SBA, to small businesses and professionals with what
we believe are low risk characteristics. We carefully select industries, or “verticals,” on which to focus our lending efforts. Within each vertical we retain individuals who possess extensive industry-specific lending experience. We
believe our focus on verticals has allowed Live Oak Bank to extend credit to small businesses and professionals at an average loan size of $1.0 million and has resulted in our credit quality outperforming industry averages.
Based on a data
set consisting of 292 lenders that have originated 300 loans or more under the SBA’s 7(a) program and greater than $25 million dollars in total loans, assembled by our affiliate, Government Loan Solutions, Inc., or GLS, using two separate
Freedom of Information Act requests for the fourteen year period ended September 30, 2014, we had the lowest default rate among the group at 1.52%. In terms of charge-off rates, we ranked
fifth in the same data set at 0.35% for the same period. For the twelve months ended September 30, 2014, the U.S. government’s most recently completed fiscal quarter, we ranked as the
nation’s second largest small business lender, by dollar volume, utilizing the SBA’s 7(a) program. We believe the opportunity to expand our small business lending to new verticals is
significant, since we currently only focus our lending efforts towards ten out of more than 1,000 industries identified in the SBA database. The SBA’s 7(a) program provides up to a 75% guaranty for loans greater than $150,000. For loans of
$150,000 or less, the program provides up to an 85% guaranty. The maximum 7(a) loan amount is $5 million. The guaranty is conditional and covers a portion of the risk of payment default by the borrower, but not the risk of improper closing and
servicing by the lender. As such, prudent underwriting and closing processes are essential to effective utilization of the 7(a) program. We believe that the technology we use provides us with a competitive advantage in the closing and servicing of
7(a) program loans.
In addition to focusing on industry verticals, we emphasize developing detailed knowledge of our customers’ businesses. We develop this knowledge, in part, through regular visits to customers’ operations, wherever they are located. We believe that these regular visits generate both for us and for our customer a deep and personalized experience throughout the loan relationship. We develop strong insight into our customers’ credit characteristics and needs while at the same time continually expanding our knowledge base of the vertical in which the customer operates. In turn, we are able to provide our borrowers valuable insight into trends and developments in their industry. We service our customers efficiently throughout the loan process and monitor their performance by means of the technology-based platform we use, which eliminates the need to maintain traditional branch locations and therefore eliminates a significant component of traditional overhead expense associated with banking franchises. We believe this lack of a concentrated geographic branch footprint significantly mitigates risk that would be associated with having the loan portfolio concentrated in one geographic area.
We typically sell the SBA-guaranteed portion (generally 75% of the principal balance) of the loans we originate in the secondary market. We have historically received a premium for these sales. We also sell participating interests in the remaining portion of our loans while retaining an SBA-required 10% unguaranteed interest and the servicing rights to the entire loan. As a result of our business model, our net income to date has been driven primarily by non-interest income rather than interest income.
99
Table of Contents
As part of our business strategy following this offering, we expect growth in our loan portfolio through increasing the number of loans we originate that permit future advances (such as construction loans) and by less frequently selling fully funded loans. We believe that by growing our loan portfolio, we will increase our net interest income. Increased levels of interest income are not expected to exceed the premium and servicing income realized from the sale of guaranteed loans.
GLS has maintained a database of transactions involving the SBA-guaranteed portion of loans since 2002 that includes outsourced trades managed by GLS for it lender clients and trade level data contributions from its loan purchasing partners. Through these mechanisms, GLS records approximately 200 to 300 trades per month for use in its valuation, consulting and analytics businesses. The below chart reflects historical gain on sale trends comprised of the trade level data maintained in the GLS database for loans with 10-year and 25-year maturities with an interest rate of Prime plus 2.00%, which is consistent with our typical loan structure.
Gain on Sale ($000) per $1MM Sold
Historical SBA Average
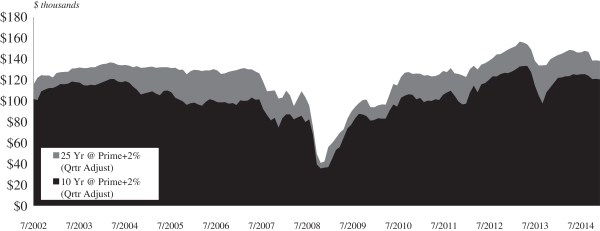
Our focus on originating SBA-guaranteed loans in select verticals nationwide has allowed us to organically develop loan portfolio credit characteristics that we believe are attractive. Our portfolio is geographically dispersed throughout all U.S. regions (Southeast, Northeast, Midwest, Southwest, and West) with each region representing between 12% and 29% of our total loan portfolio during 2014. Only one state (California at 13.2%) represented more than 10% of our aggregate held-for-investment loan portfolio at year-end 2014. Additionally, at March 31, 2015 our average unguaranteed exposure per loan was approximately $133,000 compared to an average outstanding principal loan balance of approximately $814,000.
Our ability to develop and execute on our business model has yielded a CAGR in loans originated of 55.2% from May 2007 through March 31, 2015. For the U.S. government’s 2014 fiscal year (ending September 30, 2014), we were the second most active SBA 7(a) lender in the United States by dollar volume, behind only Wells Fargo Bank. The total 7(a) loan originations were $19.45 billion for the government’s fiscal year 2014.
Technology-Based Platform
We believe that the small business lending market is both broad and underserved by traditional banks. Non-bank lenders have exposed traditional banks’ inability to effectively service the small business customer by utilizing technology-based platforms to increase small businesses’ access to financing. Since inception, we have used a technology-based platform to provide financing to small businesses. To date, our average loan size is $1 million with an established origination channel for small business lending via the technology-based platform we use. We believe the industry-standard processes for originating small-dollar loans to businesses needs to be
100
Table of Contents
revamped. We further believe that a simplified, highly automated, and efficient delivery channel can fundamentally change the economics of small loan origination for financial institutions.
We developed and utilize a technology-based platform to facilitate lending to the small business community on a national scale and we have leveraged this technology to optimize our loan origination process, customer experience, reporting metrics, and servicing activity. The nCino Bank Operating System that we utilize, which is a fully integrated operating system built on Salesforce.com, Inc.’s Force.com cloud computing infrastructure platform, is owned by nCino, Inc., or nCino, and we license the rights to use it. We use the nCino Bank Operating System to generate a real-time view of our loan pipeline, processes, and borrower and credit data. The integration of this system into our day-to-day operations has improved work flow efficiency, minimized loan file and documentation exceptions, and provided unprecedented real-time clarity into our loan portfolio. For example, we are able to segregate data pertaining to loan origination, which we refer to as production, among other things, vertical, geography, loan officer, participating bank, referral source, FICO score, internal risk grade, debt service coverage, relationship manager and balance sheet exposure. We can examine loans our loan pipeline by their status and determine what outstanding documents are required prior to submission to the SBA or for closing. We believe that the efficiencies we realize through this platform contribute significantly to our ability to generate revenue at a ratio of in excess of $400 thousand per employee per year. This is compared to a market median of less than $200 thousand of revenue per employee per year for similarly sized banks and less than $300 thousand per employee per year for the top 10% of such similarly sized peer group.
The technology we utilize also streamlines the paperwork that accompanies SBA loans. A typical SBA loan under the 7(a) program may require up to 150 separate loan documents to be submitted. Utilizing this technology-based platform, we collect, track, and organize these documents in a manner that maximizes efficiency and minimizes unnecessary customer contact. We have used this technology to transform the traditional means of loan origination by accelerating our ability to issue proposals, complete due diligence and finalize commitments. Our customers are also able to benefit from the technology-based platform we use, as it allows them the ability to track their loan’s progress towards approval and funding through a secure online portal. After the loan closes, each customer receives a customer satisfaction survey to rate the experience on a scale of 1 to 10, with a score of 10 as the best possible score. Historically, the average of the scores has been greater than 9.0.
Our software service agreement for use of the nCino Bank Operating System program and Salesforce.com, Inc’s Force.com cloud computing infrastructure program currently expires on November 1, 2015. The term of the license automatically extends for renewal terms of one year, unless either party provides the other with 30 days, prior written notice of its intent to terminate the agreement. Management is currently in the process of extending this license for an additional three-year term. The agreement obligates nCino to provide the Bank with a subscription for the nCino Bank Operating System and also to provide the Bank with certain support and professional services customary for software license agreements. Under the terms of the agreement, nCino retains all intellectual property rights and title to the software. The agreement also contains customary representations, warranties and limitation of liability provisions. The agreement grants a license for a specified number of users at an estimated annual cost of approximately $481 thousand.
In 2012, nCino, Inc. was a majority-owned subsidiary of Live Oak Bancshares. During 2014, however, we divested our ownership interest to our shareholders and we have no direct ownership interest in nCino as of the date of this prospectus. Certain of our directors, officers and employees own approximately 28.2% of nCino’s outstanding common stock as of March 31, 2015. In addition, our Chief Executive Officer, James “Chip” S. Mahan III, continues to serve as a member of the board of directors of nCino and our President, Neil L. Underwood was one of the creators of nCino.
Technology-Based Platform Expansion
Effective April 1, 2015, certain nCino developers who helped create the nCino technology-based platform that we use became employees of the Bank. The nature of the costs expected to be incurred with the development of
101
Table of Contents
our online lending platform include development and implementation costs. The software development, along with vendor analysis and operational implementation of the platform, is performed in-house by employees of our Company, many of whom previously worked for nCino. The combined base salaries of our in-house software developers are approximately $1.0 million per year. Depending on the success of our new online lending platform, additional loan officers, credit administration and back office personnel will be hired to originate, close and service loans originated through this platform. We anticipate that our costs and expenses will be consistent with the build out of human capital as a function of the growth in loan origination. With this team, we are developing a new online lending platform in order to help us with the origination of small business loans less than $350 thousand through the SBA 7(a) program. The platform we currently use, which we license from nCino, has the capability to originate loans less than $350 thousand, however, we believe that the current system would not allow us to do so efficiently. We believe our new platform will allow us to make smaller loans to small businesses in an efficient and cost effective manner by reducing the cost per transaction through automation. According to FDIC data, as of December 31, 2014, the most recent date that this information is available, there were $288 billion in small business loans of $250 thousand or less and SBA data indicates there were 28.2 million small businesses in the United States in 2011. We believe that this is a market underserved by traditional banking models due to the difficulty in applying traditional underwriting methods to this loan class in a cost effective manner. Our lending platform will aggregate thousands of data points from seven third party data providers providing 17 different services as data sources, including vendors, to assist in our analysis of the small business credit and utilize automated proprietary small loan credit models and application technology. The sources for data used to make our decision include vendors in the fraud detection, ID verification, and credit scoring industries as well as our own proprietary loan performance data provided by GLS. We believe the credit models and application technology will complement our existing expertise and judgment and align with the credit culture that is pervasive throughout our organization. With this new platform, we intend to initially target the verticals that we currently serve. Based on our current hit rate, we believe we will receive approximately 100,000 unique website hits in 2015 and that we will be able to convert a significant number of website hits through our demonstrated ability to connect on a personal level with small businesses. Furthermore, we believe that loan data we have derived from over 1 million small business loans over a 20-year period provides us with performance and predictive analytics that give us an advantage over our competitors.
We believe that utilizing the SBA 7(a) program allows us to deliver a product that is more affordable to small businesses. The SBA is encouraging its participating lenders to serve this market, and has replaced the requirement that lenders perform traditional cash analysis with a credit scoring module. The SBA’s credit scoring module uses the FICO Small Business Scoring Service product. This scoring module assists SBA lenders in the evaluation of credit risk through the use of commercial and consumer data. The module utilizes a variety of data sources and more than 100 combinations of consumer and business analytical models. As a tool for lenders, this scoring module can help streamline the loan approval process. We intend to utilize this scoring module, cash flow considerations and a proprietary score developed by using our extensive internal database of historical SBA specific loan data, as well as other key data fields to filter on-line applicants. Loans approved through this channel will have a principal amount of less than $350 thousand and carry a 75% to 85% SBA guaranty, with an interest rate ranging from Prime + 2.75% to Prime + 4.75%.
Vertical Immersion Strategy
We have focused our lending to small businesses and professionals in specific industry segments, or verticals, in which we build deep industry expertise. Our ten existing industry verticals consist of the following:
Veterinary Practices – Through private practices and hospitals, our veterinary customers provide care for the health of animals through the diagnosis, treatment, and research of diseases of animals, primarily household pets.
Healthcare Services – The Healthcare Services vertical primarily includes dental and medical professionals operating as individuals or in small groups to provide services to clients. Dentists diagnose and treat problems related to oral health and provide care instruction. Medical professionals include general or specialized physicians providing individual patient care. Physicians diagnose and treat injuries and illnesses; prescribe, perform, and interpret diagnostic tests; and counsel patients on a variety of health related issues.
102
Table of Contents
Independent Pharmacies – Independent pharmacists dispense medications prescribed by healthcare practitioners and provide information to their customers about medications and the use of medications. They differentiate themselves from franchise, or chain, pharmacies through drug compounding and offerings of specialized services, such as home delivery.
Death Care Management – Our Death Care Management vertical includes funeral homes, cemeteries, and crematories. Funeral homes and crematories organize and manage the details of funeral services. Services vary in complexity and style depending upon the client and range from small, intimate groups to large celebrations of life.
Investment Advisors – Investment advisors provide financial guidance to their client base. Specific activities include the management of personal/family investment portfolios, guidance with investments and taxes, and general advisement on life decisions effecting wealth management and financial planning.
Family Entertainment Centers – Family entertainment centers includes a variety of activities typically in a specialized setting. Our borrowers provide to their customers locations to engage in a variety of family activities including miniature golf, roller skating, bowling, arcades and gaming, go-karting, and waterpark play.
Poultry Agriculture – Our poultry farming customers grow chickens for the purpose of consumption. Poultry farmers contract with large poultry companies, called integrators, to raise chickens. Poultry farmers provide a facility, controlled environmental conditions, and labor to grow chickens to the desired size until picked up by the integrator.
Wine & Craft Beverage* – The Craft Beverage industry includes producers of wine, spirits and beer as well as affiliated industries such as custom crush facilities, bulk wine storage facilities, mobile bottling lines, fulfillment service providers, and manufacturers of barrels, corks, foils and bottles.
Self-Storage* – Our borrowers provide self-storage units to consumers. The number of Self-Storage facilities in the United States has more than doubled between 1998 and 2005. This growth is attributed to increased mobility of the U.S. work force and the tendency of many Americans to acquire more belongings than they have the ability to store within their dwelling.
Hotels* – According to the American Hotel and Lodging Association, there are 52,887 hotel properties in the United States that generated an aggregate of $163 billion of revenue in 2013, up 5.4% over 2012 revenues. We plan to develop an SBA product targeted toward projects in the mid-scale and economy chain scale segments of the hotel industry.
*These groups were started in 2015 and did not generate any loans in 2014. There is no financial disclosure relating to these verticals in the prospectus. For more information, see “— Recently Added Verticals” below.
We are engaged and active in each of the industries we serve by attending conventions and trade shows, and by speaking at universities and industry events. We staff each vertical team with personnel that possess industry-specific knowledge, experience and contacts. For example, our General Manager in the Independent Pharmacies owns two pharmacies and brings broad experience and expertise to his responsibilities of examining, evaluating and closing extensions of credit to independent pharmacies. Our Death Care Management vertical expertise includes the former president and chief operating officer of Service Corporation International (a company that operates a network of more than 2,000 funeral homes and cemeteries), and another individual with over 25 years of experience in the financial services industry has led M&A in the funeral trust space. Our Veterinary Practices vertical benefits from the experience of a licensed veterinarian and attorney who provides an informed perspective to our Veterinary Practices vertical team and customers. Our Family Entertainment Centers, Wine & Craft Beverage, and Self-Storage verticals are led by individuals with more than 20 years each in their respective industries. The General Manager of our Poultry Agriculture vertical has 15 years of agriculture lending experience and has originated more than $450 million in poultry loans.
Recently Added Verticals
Funeral and Cemetery Trust Services
We believe that the trust services market for the funeral and cemetery industry is underserved in the United States. Over the past decade, numerous banks have exited this business, which we believe is due to the lack of
103
Table of Contents
knowledgeable employees, inadequate compliance oversight and the misunderstanding of state regulations pertaining to the administration of the trust funds. According to IBISWorld, the U.S. funeral market generated annual revenue of near $16 billion in 2014, while the cemetery market generated annual revenues of near $4 billion. These industries have combined sales of near $4 billion annually for both preneed trust and preneed insurance products. We estimate that the assets under care for the preneed contracts are in excess of $20 billion. In addition to the provision of a much needed service and cross selling opportunities, earnings will be enhanced by fee income from trust services as well as generation of low cost deposits as a result of trust assets held in cash. We believe other banks accept funeral and cemetery trust funds without the proper administration and investment skills necessary to provide a quality product for the funeral home or cemetery owner. We intend to fill this gap in our existing Death Care Management vertical with a seasoned team of funeral and cemetery trust professionals operating under our established business model.
Our team of ten trust professionals average almost 20 years each in the funeral and cemetery trust industry. Our people are the foundation of this line of business and will be the crucial relationship element from which we intend to grow our business. The team consists of four Senior Relationship Managers who have served many of the largest funeral and cemetery trust companies in this industry, a dedicated funeral and cemetery trust legal counsel, a sales and marketing representative with over 30 years in the industry, a CPA/CPF with over 20 years in the trust industry and three seasoned operations specialists. We believe our team coupled with the technology-based platform we use provides us with a significant advantage to capitalize within an existing vertical and deliver high quality profitable trust services to the funeral and cemetery industry.
Wine & Craft Beverage
The Wine & Craft Beverage industry includes producers of wine, spirits and beer as well as affiliated industries such as custom crush facilities, bulk wine storage facilities, mobile bottling lines, fulfillment service providers, and manufacturers of barrels, corks, foils and bottles. According to the International Organization of Vine and Wine, an intergovernmental organization, the United States is the largest wine market in the world. The industry is vibrant with over 8,000 wineries in the U.S. The Craft Beer industry has experienced significant growth since 2009, growing from approximately 1,600 breweries in the U.S. to approximately 2,800 in 2013. Craft Beer production in the year 2013 was 15,585,364 barrels (7.8% of total beer market in the U.S.). This figure represents a 17.7% increase in production over 2012. We have hired a team of three commercial lenders with decades of experience in the winery industry. The addition of these professionals provides us with an experienced team that has an intimate understanding of the Wine & Craft Beverage industry.
Self-Storage
According to the Self-Storage Association, the non-profit trade association of the self-storage industry, this industry has been the fastest growing segment of the commercial real estate industry over the last forty years. The industry demonstrated recession resistant qualities during the economic downturn in 2008. Self-Storage represents a relatively new opportunity within the SBA lending industry. Prior to October 1, 2010, the SBA viewed Self-Storage as investment real estate instead of an operating business and therefore excluded these projects from eligibility. This timeline limits both the historical data available for review as well but provides an opportunity for any SBA lender to establish a recognized brand within this industry and a first mover advantage. We have hired a seasoned Self-Storage professional with 20 years of sales leadership experience to serve as our domain expert for this vertical. There are approximately 48,500 primary Self-Storage facilities and approximately 52,500 total facilities in the United States with industry revenues exceeding $24 billion.
Hotels
According to the American Hotel and Lodging Association, there are 52,887 hotel properties in the US that generated an aggregate of $163 billion of revenue in 2013, up 5.4% over 2012 revenues. Live Oak plans to develop an SBA product targeted toward projects in the mid-scale and economy chain scale segments of the hotel industry. Travel and tourism is among the largest services export industries and is one of the largest employers in the United States. Additionally, the hotel industry ranks as one of the top 10 largest industries in 49 of the 50 states.
104
Table of Contents
The table below sets forth our income for each of our ten industry verticals for the periods presented.
| Three months ended March 31, 2015 | Year ended December 31, 2014 | |||||||||||||||||||||||||||||||
| Loans and fees on loans |
Loan servicing revenue (1) |
Net gains on sales of loans |
Total | Loans and fees on loans |
Loan servicing revenue (2) |
Net gains on sales of loans |
Total | |||||||||||||||||||||||||
| (in thousands) | ||||||||||||||||||||||||||||||||
| Veterinary Practices |
$1,861 | $1,686 | $3,708 | $7,254 | $ | 6,897 | $ | 6,801 | $ | 11,779 | $ | 25,477 | ||||||||||||||||||||
| Healthcare Services |
1,665 | 595 | 2,838 | 5,097 | 4,897 | 1,888 | 10,742 | 17,527 | ||||||||||||||||||||||||
| Independent Pharmacies |
929 | 685 | 2,221 | 3,835 | 3,284 | 2,414 | 11,570 | 17,268 | ||||||||||||||||||||||||
| Death Care Management |
605 | 365 | 1,161 | 2,131 | 2,544 | 1,187 | 6,621 | 10,352 | ||||||||||||||||||||||||
| Investment Advisors |
526 | 216 | 3,527 | 4,269 | 1,287 | 479 | 7,697 | 9,463 | ||||||||||||||||||||||||
| Family Entertainment Centers |
72 | 18 | — | 90 | 77 | 10 | 921 | 1,008 | ||||||||||||||||||||||||
| Poultry Agriculture |
981 | 22 | 2,007 | 30,010 | 735 | 18 | 392 | 1,145 | ||||||||||||||||||||||||
| Wine & Craft Beverage |
— | — | — | — | — | — | — | — | ||||||||||||||||||||||||
| Self-Storage |
— | — | — | — | — | — | — | — | ||||||||||||||||||||||||
| Hotels |
— | — | — | — | — | — | — | — | ||||||||||||||||||||||||
| Other |
77 | 6 | (1) | 82 | 170 | 26 | 255 | 451 | ||||||||||||||||||||||||
|
|
|
|
|
|
|
|
|
|
|
|
|
|
|
|
|
|||||||||||||||||
| Total |
$6,716 | $3,593 | $15,461 | $25,770 | $ | 19,891 | $ | 12,823 | $ | 49,977 | $ | 82,691 | ||||||||||||||||||||
|
|
|
|
|
|
|
|
|
|
|
|
|
|
|
|
|
|||||||||||||||||
| (1) | Excludes $513 thousand increase to revenue from loan servicing asset revaluation. |
| (2) | Excludes $2,201 thousand reduction to revenue from loan servicing asset revaluation. |
In addition to our ten existing verticals, we are currently analyzing potential expansion into five new industries, including home health care, independent attorneys, recreational vehicle parks, independent insurance agents and assisted living facilities.
Our customer philosophy and credit culture extend beyond the loan origination phase. Our borrowers have access to a relationship manager in our BAG, from the time the loan closes through the life of the loan. We continuously work to provide superior service throughout the life of our relationship with the borrower. With our vertical emphasis, we are aware of industry-tailored best practices that we share to help our borrowers succeed.
BAG site visits are mandated for each loan. This enables lenders to invest quality time with each prospective and current borrower as well as inspect the business. Another goal of the BAG is to obtain current quarterly financial statements and year-end statements from all borrowers. As of March 31, 2015, 96% of current financial statements were on hand for all borrowers. With effective financial reporting processes in place, we have early insight into potential problems that exist with our borrowers. We also engage with our customers in a variety of other ways, from covering the cost of a business consultant for a 3-day period to more complex situations such as working with a borrower to transition out of a practice. We strive to build and maintain a collaborative relationship with the business owner. Through the BAG, we aim to maintain a close relationship with every customer, maintain strong credit monitoring practices and have become trusted resource for small business owners throughout the U.S.
The Credit Process
We utilize our industry-specific expertise and participation to identify and select credit-worthy borrowers and attractive financing projects prior to the formal underwriting process. Credit training is mandatory for all employees originating, underwriting, closing, and servicing loans via an internally developed program we refer to as “Credit Boot Camp.” We believe our familiarity with and active presence in the verticals we focus on allows us to provide ongoing customer service that is relevant for each business owner’s specific industry segment.
105
Table of Contents
We attempt to identify verticals with a statistical history of performance and a low risk profile. We have chosen verticals that display some or all of the following characteristics:
| • | Stable cash flows |
| • | Barriers to entry |
| • | Broad customer bases without reliance on any single customer |
| • | Collateral shortfall |
| • | Limited to no foreign competition |
| • | Growing demand |
| • | Rapid cash cycles |
| • | Recession resistant |
| • | Limited malpractice risk |
| • | Underserved by other/traditional banking models |
The below table, derived from data obtained from the U.S. Small Business Administration, reflects the top 16 performing SBA loan industry categories by data listed for the period from October 1, 2000 to September 30, 2014. SBA data is categorized by the North American Industry Classification System, or NAICS.
| Rank |
NAICS Industry |
Loans Disbursed |
Disbursed ($000) |
Cumulative | ||||||||||||||
| Failure % | Chrg Off % | |||||||||||||||||
| 1 |
Lessors of Miniwarehouses and Self-Storage Units | 374 | 343,518 | 0.45 | % | 0.08 | % | |||||||||||
| 2 |
Breweries | 626 | 205,701 | 2.69 | % | 0.36 | % | |||||||||||
| 3 |
Broilers and Other Meat Type Chicken Production | 4,177 | 2,005,884 | 3.80 | % | 1.06 | % | |||||||||||
| 4 |
Chicken Egg Production | 593 | 238,085 | 4.34 | % | 1.14 | % | |||||||||||
| 5 |
Pharmacies and Drug Stores | 3,851 | 1,373,739 | 4.47 | % | 1.00 | % | |||||||||||
| 6 |
Investment Advice | 1,422 | 275,461 | 4.71 | % | 2.26 | % | |||||||||||
| 7 |
Solid Waste Collection | 890 | 228,305 | 5.39 | % | 1.78 | % | |||||||||||
| 8 |
Offices of Optometrists | 3,363 | 719,185 | 5.83 | % | 1.55 | % | |||||||||||
| 9 |
Funeral Homes and Funeral Services | 2,597 | 1,291,091 | 5.90 | % | 0.76 | % | |||||||||||
| 10 |
Veterinary Services | 7,383 | 3,424,999 | 6.01 | % | 1.39 | % | |||||||||||
| 11 |
All Other Miscellaneous General Purpose Machinery Manufacturing |
569 | 211,788 | 6.35 | % | 1.97 | % | |||||||||||
| 12 |
Other Scientific and Technical Consulting Services | 1,455 | 217,095 | 6.66 | % | 3.25 | % | |||||||||||
| 13 |
Insurance Agencies and Brokerages | 7,069 | 1,337,140 | 6.67 | % | 2.66 | % | |||||||||||
| 14 |
Support Activities for Oil and Gas Operations | 1,001 | 321,533 | 6.68 | % | 2.63 | % | |||||||||||
| 15 |
Lessors of Nonresidential Buildings (except Miniwarehouses) |
2,040 | 1,137,347 | 6.80 | % | 1.25 | % | |||||||||||
| 16 |
Offices of Dentists | 17,276 | 5,936,115 | 6.80 | % | 1.76 | % | |||||||||||
106
Table of Contents
Through our industry expertise, distribution channels, speed-to-market, and differentiated level of borrower experience and customer service, we have increased annual production in each year since May 2007. The growth to date in production has been due to the maturity of certain industry verticals, the establishment of new industry verticals and our origination of loans that are generally larger than the average SBA loan. The following table summarizes our annual production by industry vertical:
| Three Months Ended March 31, 2015 |
Year Ended December 31, | |||||||||||||||||||||||||||||||||||||||
| 2014 | 2013 | 2012 | 2011 | 2010 | 2009 | 2008 | 2007 | Total | ||||||||||||||||||||||||||||||||
| (dollars in thousands) | ||||||||||||||||||||||||||||||||||||||||
| Veterinary Practices |
$26,492 | $ | 155,217 | $ | 147,661 | $ | 174,768 | $ | 149,485 | $ | 150,788 | $ | 145,920 | $ | 161,230 | $ | 40,226 | $ | 1,151,787 | |||||||||||||||||||||
| Healthcare Services |
56,892 | 182,406 | 109,317 | 81,363 | 69,860 | 56,580 | 13,385 | 150 | — | 569,953 | ||||||||||||||||||||||||||||||
| Independent Pharmacies |
25,221 | 149,453 | 106,391 | 103,358 | 86,757 | 48,919 | — | — | — | 520,099 | ||||||||||||||||||||||||||||||
| Death Care Management |
12,011 | 72,124 | 101,736 | 54,075 | — | — | — | — | — | 239,946 | ||||||||||||||||||||||||||||||
| Investment Advisors |
34,304 | 96,963 | 33,647 | — | — | — | — | — | — | 164,914 | ||||||||||||||||||||||||||||||
| Family Entertainment Centers |
3,580 | 13,503 | — | — | — | — | — | — | — | 17,083 | ||||||||||||||||||||||||||||||
| Poultry Agriculture |
89,559 | 171,644 | — | — | — | — | — | — | — | 261,203 | ||||||||||||||||||||||||||||||
| Other |
— | 6,780 | — | 199 | 535 | 30 | 1,275 | 1,209 | 775 | 10,803 | ||||||||||||||||||||||||||||||
|
|
|
|
|
|
|
|
|
|
|
|
|
|
|
|
|
|
|
|
|
|||||||||||||||||||||
| Total |
$248,058 | $ | 848,090 | $ | 498,752 | $ | 413,763 | $ | 306,637 | $ | 256,317 | $ | 160,580 | $ | 162,589 | $ | 41,001 | $ | 2,935,787 | |||||||||||||||||||||
|
|
|
|
|
|
|
|
|
|
|
|
|
|
|
|
|
|
|
|
|
|||||||||||||||||||||
The following table shows the amount of the SBA-guaranteed portions of the loans we have originated that we have sold since May 2007:
| Three Months Ended March 31, 2015 |
Year Ended December 31, | |||||||||||||||||||||||||||||||||||||||
| 2014 | 2013 | 2012 | 2011 | 2010 | 2009 | 2008 | 2007 | Total | ||||||||||||||||||||||||||||||||
| (dollars in thousands) | ||||||||||||||||||||||||||||||||||||||||
| Veterinary Practices |
$ | 29,148 | $ | 97,960 | $ | 115,514 | $ | 129,291 | $ | 117,941 | $ | 107,326 | $ | 138,725 | $ | 52,897 | $ | — | $ | 788,802 | ||||||||||||||||||||
| Healthcare Services |
29,012 | 99,063 | 57,361 | 46,446 | 50,948 | 30,120 | 7,453 | — | — | 320,403 | ||||||||||||||||||||||||||||||
| Independent Pharmacies |
19,328 | 104,446 | 83,647 | 66,856 | 69,553 | 31,805 | — | — | — | 375,635 | ||||||||||||||||||||||||||||||
| Death Care Management |
8,095 | 53,832 | 63,156 | 34,083 | — | — | — | — | — | 159,166 | ||||||||||||||||||||||||||||||
| Investment Advisors |
28,630 | 64,764 | 19,664 | — | — | — | — | — | — | 113,058 | ||||||||||||||||||||||||||||||
| Family Entertainment Centers |
— | 7,286 | — | — | — | — | — | — | — | 7,286 | ||||||||||||||||||||||||||||||
| Poultry Agriculture |
22,834 | 4,273 | — | — | — | — | — | — | — | 27,107 | ||||||||||||||||||||||||||||||
| Other |
— | 2,288 | — | — | — | — | — | 706 | — | 2,994 | ||||||||||||||||||||||||||||||
|
|
|
|
|
|
|
|
|
|
|
|
|
|
|
|
|
|
|
|
|
|||||||||||||||||||||
| Total |
$ | 137,047 | $ | 433,912 | $ | 339,342 | $ | 276,676 | $ | 238,442 | $ | 169,251 | $ | 146,178 | $ | 53,603 | $ | — | $ | 1,794,451 | ||||||||||||||||||||
|
|
|
|
|
|
|
|
|
|
|
|
|
|
|
|
|
|
|
|
|
|||||||||||||||||||||
Our vertical immersion strategy and our commitment to sound credit underwriting and credit administration are reflected in the credit quality of our loan portfolio. Our borrowers have historically had an average Fair Isaac Corporation, or FICO, score in excess of 700 using the lowest of scores provided by three credit bureaus at the time of underwriting and an average debt service coverage ratio of approximately 2.0 to net operating income
107
Table of Contents
using the most current borrower financial statements available. To date, we have never had a denial or repair of the SBA guaranty for any loan submitted for payment. The SBA’s policy for honoring the guaranty is based on a thorough review of a lender’s purchase request and all relevant documentation. If a lender is deficient in its origination, management, and servicing of a loan, the SBA will attempt to reach a resolution with the lender, which may involve the lender agreeing to a monetary adjustment in the amount of SBA’s guaranty. This adjustment is referred to as a repair. The SBA may consider a denial of its liability under its guaranty or litigation to recover funds the SBA already paid under its guaranty to the lender (or secondary market holder) if the lender is not negotiating in good faith, the lender is unwilling to agree to a repair that reflects the harm caused to the SBA, or the lender’s actions are sufficiently serious that a repair would be inappropriate.
We do not pay our lenders commissions. Our management believes that incentivizing our lenders to produce more loans through the payment of commissions creates an inherent conflict with sound credit administration. By choosing not to implement a commission-based payment structure, we believe we generate loans of greater credit quality, enhancing overall portfolio performance and aligning lenders’ interests with those of the entire company. In addition, many of our lenders currently own stock of Live Oak. We believe this alignment of interests is a strategic differentiator at Live Oak, and sets us apart from other employers. Live Oak Bank was selected as the top bank to work for by American Banker Magazine in 2014 and the top small business to work for in North Carolina by Business North Carolina Magazine in 2015.
We intend to strategically and opportunistically add new industries to our portfolio in the future. Our Emerging Markets division continually identifies, researches and evaluates potential new industry verticals.
Deposit Funding
We fund the loans and loan interests that we retain with deposits issued by the Bank. We have historically used deposit products with higher interest costs to the Bank than traditional banks to attract funds while our cost of funds compared to non-bank competitors has historically been significantly lower. We plan to expand the deposit products and services we offer to customers through the use of mobile banking solutions for small businesses, including online banking, discounted merchant services, and remote deposit capture in an effort to increase our core deposits.
Our Executive Management Team, Key Employees and Board of Directors
Our executive management team has a combined 154 years of banking and financial experience, as well as extensive experience in developing technologies to support online operations as well as experience within our industry verticals.
James S. Mahan III — Chairman and Chief Executive Officer
Mr. Mahan is the Founder, CEO and Chairman of the board of directors of the Company. Mr. Mahan is a founding member of nCino and serves on nCino’s board of directors. Prior to Live Oak Bank, Mr. Mahan was the Chief Executive Officer and Chairman of the Board for S1 Corporation and founder of Security First Network Bank, the world’s first Internet bank. Under his leadership, S1 Corporation grew to become a $234 million software and services provider in only six years, averaging more than 200 percent growth year over year. At its peak, S1 had a market capitalization of over $6 billion. During his term as CEO, Mahan was ranked as one of the 10 Most Influential Personalities in Financial Services by FutureBanker magazine. Prior to founding Security First Network Bank and S1 Corporation, Mahan launched Cardinal Bancshares, where he served as Chairman and Chief Executive Officer. Mahan built Cardinal into an institution with approximately $675 million in total assets and took the company public in 1992. Before launching Cardinal, Mr. Mahan spent several years with Citizens Union National Bank & Trust Co., serving as President, Chief Operating Officer and Vice Chairman and becoming Chairman and Chief Executive Officer in 1984. In 1986, Mr. Mahan formed an investment group that purchased Citizens Union and subsequently sold it to BankOne Corp. of Columbus, Ohio. Mr. Mahan began his career in 1973 at Wachovia Bank & Trust Co. in Winston-Salem, NC, after graduating with a Bachelor’s degree in Economics from Washington & Lee University in Lexington, VA.
108
Table of Contents
William L. Williams III — Vice Chairman of the Board of Directors
Mr. Williams III is the Vice Chairman of the Company and one of the original founders of the Bank. Prior to starting Live Oak Bank, Mr. Williams spent 19 years in corporate banking at Wachovia and worked for 14 years at Vine Street Financial doing SBA lending. Mr. Williams began his banking career in 1973 at Wachovia, where he worked with Wachovia Services, Inc, then Wachovia Regional Corporate Lending, calling on and lending to mid-market regional companies. In 1987, he relocated to Wilmington, NC, where he managed the Wachovia Corporate Lending group for the three county area of Southeastern North Carolina. In 1992, he re-joined Mr. Mahan at Cardinal Bancshares as they began Vine Street Financial, a niche SBA lending division, of Vine Street Trust Company. Mr. Williams held several positions within this group including President and Senior SBA lender. Through a series of mergers/acquisitions, Vine Street Financial became a division of BB&T, where Mr. Williams served as a senior SBA lender, resigning in May of 2007 to found Live Oak Bank. Mr. Williams graduated in 1973 from the University of North Carolina-Chapel Hill with a BS degree in Business Administration. He has, and is currently serving on several private company boards, as Managing Member, and has served in the capacity of President and Treasurer on numerous charitable and “not for profit” groups in Wilmington and elsewhere in North Carolina. Mr. Williams’ 40 years of corporate banking experience, including deep experience in the SBA lending sector and his involvement as a founder and organizer of our Company, make him uniquely qualified to serve as Vice Chairman of our board of directors and as an executive officer of the Bank.
Neil L. Underwood — President and Director
Mr. Underwood currently serves as President of the Company and Live Oak Bank. Mr. Underwood is a cofounder of nCino and helps to set technological direction for the company. Prior to joining the bank, Underwood served as General Manager of S1 Corporation (SONE), where he was responsible for the S1 Enterprise division. S1, since acquired by ACI Worldwide, Inc. (ACIW), built and deployed Financial Services systems such as online banking, payments and mobile solutions to over 3,000 financial institutions worldwide. Before S1, Mr. Underwood played a key role in launching the Americas division of Brokat Technologies AG, a global financial services software supplier based in Stuttgart, Germany. Acting as Chief Operating Officer, he was responsible for Retail and Wholesale Banking solutions for the Americas. Mr. Underwood came to Brokat as a principal of Transaction Software, which was acquired in May of 1999. A native of Miami, FL, Underwood holds a Bachelor’s Degree of Science in Industrial Engineering from the Georgia Institute of Technology. Mr. Underwood’s experience in the technology sector, coupled with a talented approach to management and resource utilization, makes him ideally suited to serve as a member of our board and president of the Bank.
David G. Lucht — Chief Risk Officer and Director
Mr. Lucht is the Chief Risk Officer for Live Oak Bank. Before joining Live Oak Bank in May of 2007 as a founding member of executive management and the board of directors, Mr. Lucht held executive positions with several different banking institutions, including Chief Credit Officer and Executive Vice President for First Merit Bank, Akron, OH, where he was responsible for leading a turnaround in credit culture and performance of the $10.5 billion bank. Prior to First Merit, Mr. Lucht served as Senior Credit Officer of National City Bank, Cleveland, OH. A native of Ohio, Mr. Lucht began his banking career with National City Bank in 1985 after graduating from Kent State University with his Master’s in Business Administration. He obtained his undergraduate Bachelor of Science degree in Marketing at Miami University in Ohio. Mr. Lucht’s approach to the identification and management of credit risk is one of the keystones of our organization. He has helped to positively shape the corporate culture of the Company since inception and his leadership at the board and executive management levels, which has contributed to our success to date, qualifies him to serve as a member of our board and as an executive officer.
S. Brett Caines — Chief Financial Officer
Mr. Caines is the Chief Financial Officer for the Company and the Bank. Mr. Caines joined Live Oak Lending, Inc., the precursor to Live Oak Banking Company, in 2007 as its finance officer after obtaining an MBA from the
109
Table of Contents
University of North Carolina, Wilmington. Mr. Caines was integral in the establishment of Live Oak Banking Company and its initial operations that commenced in 2008. In his role as finance officer, Mr. Caines was foundational in the formation of the Accounting and Capital Markets Departments. In January 2011, Mr. Caines became the Chief Financial Officer of the Company and Live Oak Bank. Prior to joining Live Oak Lending Company, Mr. Caines worked as a Production Engineer for INVISTA and as a Process Engineer for Shell Chemical Company. Mr. Caines holds a Bachelor of Science degree in Chemical Engineering from North Carolina State University.
J. William Holt, III — Chief Revenue Officer
Mr. Holt joined the Company in 2014 as the Chief Revenue Officer. Prior to joining the Company, Mr. Holt held executive positions with several large financial institutions. His 26 year career in commercial banking includes responsibilities for leading and managing technology, product solutions and communication of strategies to enable financial results. He is also experienced in recruiting talent and managing execution to achieve financial results. Mr. Holt is a graduate of Furman University in Greenville, SC with a Bachelor of Science in Economics and Business Administration.
J. Wesley Sutherland — Chief Accounting Officer
Mr. Sutherland joined the Company in 2014 as the Chief Accounting Officer. He has 20 years of experience in navigating the accounting and reporting issues confronting the financial institution industry. Prior to joining the Company, Mr. Sutherland was the founder and owner of an accounting and consulting firm, an audit partner in the financial institutions services group of Dixon Hughes (now Dixon Hughes Goodman) and had served as the president of a $300 million mutual savings bank. Mr. Sutherland worked, earlier in his career, in the banking practices of two national firms and served as a financial analyst for a Fortune 500 company. He is a graduate of James Madison University in Harrisonburg, VA with a Bachelor of Business Administration in Accounting.
William H. Cameron — Director
Mr. Cameron has served on the Company’s board of directors since November 2013 and chairs the Company’s nominating and corporate governance committee and serves on both the audit and compensation committees. Mr. Cameron has extensive prior experience as a director of a financial institution, having served as a founding director of Port City Capital Bank and as a director of Crescent Financial Corporation and Crescent State Bank (now Yadkin Financial Corporation and Yadkin Bank) following its acquisition of Port City Capital Bank in 2006. Mr. Cameron has extensive executive experience in corporate and real estate finance, real estate development, and private equity. He has been President of Cameron Management, Inc. since 2000 and has held leadership positions in a number of businesses over the last 25 years. Mr. Cameron served as Chief Operating Officer of Atlantic Telecasting Corporation, the NBC television affiliate in Wilmington, North Carolina. Mr. Cameron holds a B.S. in Business Administration and a Juris Doctor degree from the University of North Carolina at Chapel Hill. He has successfully completed the North Carolina Bank Directors’ College and has participated in numerous Advanced Bank Directors’ College programs. As an active business, civic and charitable leader, Mr. Cameron serves on the board of numerous organizations including Cape Fear Memorial Foundation and Champion McDowell Davis Foundation. He is president of Cameron Management, Inc. and president of the Dan Cameron Family Foundation, Inc. which has made significant contributions to the economic and cultural development of the Wilmington area. We believe Mr. Cameron’s prior experience as a director of two FDIC insured financial institutions over a period of 10 years brings to our board critical skills related to financial oversight of complex organizations, strategic planning and corporate governance and qualifies him to serve as one of our directors.
Diane B. Glossman — Director
Ms. Glossman has served as a member of our board of directors since August 2014. She serves on the audit & risk committee and the Bank’s Asset Liability Management Committee. Ms. Glossman is a retired investment analyst with over 25 years of experience as an analyst and over a decade of governance experience on boards.
110
Table of Contents
Ms. Glossman also currently serves on the boards of directors of Ambac Assurance Company, WMI Holdings Corp., Powa Technologies Group Ltd and QBE NA . She periodically performs consulting projects, primarily for various financial institutions. Previously, Ms. Glossman served on the board of directors of A.M. Todd Company from 1998 to July 2011, and as an independent trustee on State Street Global Advisors mutual fund board from October 2009 to April 2011. Ms. Glossman was a six-time member of Institutional Investor’s All-America Research Team and a member of the top ranked Global Bank Research team, along with winning the 2003 Wall Street Journal survey in the broker/dealer category, and was ranked for several years in the Reuters large cap and mid cap bank surveys by both fund managers and companies. Further, she was a frequent commentator on industry and company events for such entities as The Nightly Business Report, The Wall Street Journal, Financial Times, New York Times, The Economist, CNN, CNBC, and various trade publications. Ms. Glossman earned a B.S. in economics from the Wharton School at the University of Pennsylvania with a double major in finance and health care administration, having also attended the University of California at Davis. Ms. Glossman was awarded her Chartered Financial Analyst designation (CFA). We believe that Ms. Glossman’s depth of experience and financial expertise to qualify her to serve as one of our directors.
Glen F. Hoffsis — Director
Dr. Glen F. Hoffsis has served as a member of our board of directors since March 2007. He serves on the nominating and corporate governance committee and the Bank’s Asset Liability Management Committee. He is a veterinarian who has devoted most of his career to veterinary colleges as a clinician, teacher, researcher and administrator. Retiring in July 2013 as dean of the College of Veterinary Medicine at the University of Florida, Hoffsis was appointed dean of the newly established Lincoln Memorial University College of Veterinary Medicine effective July 2014, after serving as a consultant to LMU-CVM for several months. He has held many professional positions and currently serves on the board of directors of Banfield Pet Hospitals of Portland, OR. He is a diplomate of the American College of Veterinary Internal Medicine. Dr. Hoffsis is well known and respected within the veterinary profession. We believe that his wide range of knowledge and perspective relative to the business of veterinary medicine brings important skills to our board and qualifies him to serve on the board.
Don W. Jackson — Director
Dr. Jackson was appointed to the Company’s board of directors on June 23, 2015. For 35 years until his retirement in 2013, Dr. Jackson was associated with the meat and poultry business, helping to lead six organizations during that time. In December 2008, Dr. Jackson was named president and CEO of Pilgrim’s Pride Corporation which he successfully guided through an exit from Chapter 11 bankruptcy. From 2000 to 2008, Dr. Jackson was president of Foster Farms’ poultry division. Prior to that he served as executive vice president for foodservice of the former ConAgra Poultry Company, and worked for 22 years with Seaboard Farms, including four years as president and CEO of their poultry division. We believe that Dr. Jackson’s wide range of business experience and knowledge relative to the poultry industry brings important skills and industry insight to our board and qualifies him to serve on the board.
Howard K. Landis III — Director
Mr. Landis has served as a member of our board of directors since March 2007. He serves on the audit & risk committee and compensation committee. Since 2005, Mr. Landis has been a general partner of Plexus Capital, a small business investment company. He has 25 years of experience in the banking industry, which includes serving as the CEO of RBC Centura Bank’s US Operations from 2001 to 2004 after serving as Chief Credit Officer, Chief Risk Officer, and President of Centura Bank. Mr. Landis graduated with a Bachelor of Science in Business Administration and a Master’s in Business Administration from the University of North Carolina at Chapel Hill. We believe Mr. Landis’ 25 years of prior experience in the banking industry, including his service as CEO of a FDIC-insured financial institution with over $20 billion in total assets, brings to our board critical skills related to financial oversight of complex organizations, strategic planning and corporate governance and qualifies him to serve as one of our directors.
111
Table of Contents
Miltom E. Petty — Director
Mr. Petty has served as a member of our board of directors since August 2010. He serves as the chair of our audit & risk committee. Since June, 1977, Mr. Petty has served as the Chief Financial Officer of Carolina Hosiery Mills, Inc., a privately held manufacturing and real estate development company. Since August 2013, Mr. Petty has served as a director of Trust Company of the South. Mr. Petty graduated with a Bachelor of Science degree in Business Administration from the University of North Carolina at Chapel Hill. He has held an active CPA license from the State of North Carolina for 40 years. We believe Mr. Petty’s experience as a chief financial officer of Carolina Hosiery Mills, Inc., familiarity with accounting standards, and his ability to serve as our audit & risk committee financial expert, bring to our board important skills and qualify him to serve on our board.
Jerald L. Pullins — Director
Mr. Pullins has served as a member of our board of directors since October 2011. He serves on the audit & risk committee, the Bank’s Asset Liability Management Committee and is chair of the compensation committee. Mr. Pullins brings nearly thirty-five years of experience in the healthcare, real estate, mortgage banking, funeral, cemetery and insurance industries. This combined with his MA degree from the University of Kansas and MBA from the University of Texas provides a wealth of financial expertise to the Board. He received an honorable discharge as a 1st Lieutenant from the United States Army after serving in Vietnam. Throughout his successful career, he has directed and managed finance, administration, accounting and operational functions at companies across a range of industries. Mr. Pullins is Chairman of the Board of US Physical Therapy and serves as Chairman of the Governance and Nominating Committee. Mr. Pullins is also a member of US Physical Therapy’s Audit Committee and Compensation Committee. He is a managing member of SeniorCare Homes, LLC, which develops, owns and operates supervised residential homes for seniors with memory impairment conditions. We believe that his wide range of knowledge of accounting, finance and administration across many business industries brings important skills to our board and qualifies him to serve on the board.
U.S. Small Business Administration
The SBA was established in 1953 to aid, counsel, assist and protect the interests of small business concerns. The SBA operates as an independent agency of the federal government and provides small businesses with the following four programmatic functions: (i) access to capital, (ii) entrepreneurial development, (iii) government contracting and (iv) advocacy. The Office of Capital Access, or the OCA, within the SBA helps small businesses access capital and obtain financing which might not otherwise be available through traditional sources. In turn, the government provides a credit enhancement to lenders through a partial guaranty.
The OCA is primarily responsible for the 7(a) and 504 loan programs. All of the Bank’s loans that have been extended under the SBA 7(a) loan program must meet a certain set of specified criteria. Under this program, the United States government guarantees between 50% and 90% of each loan. To date, the Bank has received the guaranteed portion on all originated loans.
Live Oak Banking Company has status as a member of the Preferred Lenders Program, or PLP, as designated by the SBA. Through the PLP, the SBA delegates the final credit extension decision to certain lending institutions, as well as most servicing and liquidation authority. To be considered for PLP status, lenders must not only exhibit a strong record with the SBA, but also demonstrate clear proficiency in processing and servicing SBA loans. The Bank’s technology-based platform has served as a contributing factor in demonstrating these proficiencies. Of the lenders actively extending SBA loans, approximately 15% have the PLP designation.
Lending Activities
General. We provide a range of short- to medium-term commercial and construction loans with an emphasis on SBA 7(a) loans, mortgage, and construction loans. Our loans are typically secured by liens on business assets
112
Table of Contents
and mortgages on commercial properties and in part by SBA guarantees. Management focuses on global net operating cash flow and the borrower’s ability to repay, which normally is measured as the cash flow generated from the borrower’s operations. Management’s minimum coverage for global net operating cash flow from recurring operational sources ranges from 1.15% to 1.75% of the borrower’s debt service requirements. Additionally, management views collateral as a secondary or tertiary source of repayment necessary to meet regulatory loan-to-value guidelines. We have traditionally carried a large percentage of variable rate loans in our portfolio. Variable rate loans accounted for 92.6% of the held for investment loan balances outstanding as of March 31, 2015, while fixed rate loans accounted for 7.4% of the balances.
Our loan policies and procedures establish the basic guidelines governing our lending operations. Generally, these guidelines address the types of loans that we seek, target markets, underwriting and collateral requirements, terms, interest rate and yield considerations and compliance with laws and regulations. All loans or credit lines are subject to approval procedures and amount limitations. Our policies are reviewed and approved at least annually by the board of directors of our subsidiary bank. We supplement our own supervision of the loan underwriting and approval process with periodic loan audits by internal personnel and outside professionals experienced in loan review work.
SBA 7(a) Loans.
SBA 7(a) Guaranty Loan — The SBA 7(a) guaranty loan is a maximum loan amount of $5 million, which has a maximum guarantee from the SBA of 85% for loans of $150,000 or less and 75% for loans greater than $150,000. This loan is available to all eligible commercial borrowers for acquisition, construction, permanent financing, and in some cases, refinancing.
SBA Express Loan — This SBA guaranty program provides for a smaller SBA loan, up to $350 thousand, with a 50% guaranty. This loan is available to all SBA eligible borrowers for smaller needs, such as equipment financing and working capital needs.
SBA 7(a) Pari-Passu Loan — This SBA 7(a) loan structure is used on the occasion when the loan requested amount exceeds the $5 million maximum loan amount of the SBA 7(a) loan. The structure ties a conventional first mortgage loan with the SBA 7(a) $5 million (75% guaranteed) loan in a second mortgage position for a total combined amount of greater than $5 million. These two loans share the collateral and the SBA guaranty on a “Pari-Passu” basis.
SBA 504 Loan — This SBA loan program is used only for acquisitions, expansions, and new construction. This program is structured such that the Bank provides for a conventional first mortgage and the SBA authorizes a second mortgage loan, fully funded by the SBA and fully subordinate to both payment and liquidation to the first mortgage. Further, the SBA 504 second mortgage loan benefits the borrower by offering a 20-year fixed rate based approximately on the 10-year Treasury Note plus 110 basis points.
Commercial Loans
The Bank also originates non-SBA-affiliated loans from time to time, including conventional commercial business loans to small and medium-sized businesses in the United States. Conventional commercial loans to borrowers are based on the soundness of the borrower’s historic financial statements and business model and may include (by way of example and not limitation): (a) the release of the SBA 7(a) guaranty on an existing seasoned loan, where the Bank has the opportunity to re-qualify the borrower for a new SBA 7(a) or SBA 504 loan financing a new project; or (b) standard conventional commercial loans where loan characteristics place the loan in a very sound credit quality class and payment of SBA fees are unjustified.
The Bank does not engage in sub-prime lending or consumer finance and there are no plans to engage in any such activities in the future. Furthermore, it is the Bank’s policy not to make loans to insiders that would come within the scope of Regulation O of the Federal Reserve Board of Governors.
113
Table of Contents
Construction Loans
Due to the inherently risky nature of construction lending, the Bank maintains strict controls on loans involving funds to be used for the construction or upfit of commercial space. Almost all of our construction loans are disbursed under the SBA 7(a) program, which typically carries a minimum U.S. government guaranty of 75%.
During underwriting, construction loans are evaluated by our senior lenders who have considerable experience in the vertical. Each proposed loan is evaluated based on cash-flow of the business relative to the total anticipated debt load, rather than pro-forma estimates for future growth or the liquidation of collateral in the event of a default. The Bank does view collateral as a means of repayment in underwriting construction loans.
All of the Bank’s construction projects are for properties that are owner-occupied and non-speculative in nature. An experienced third party inspector reviews the plans and specifications (and corresponding budget) of each project prior to closing, as well as monitors the draw process following regular site visits after closing. In addition to evaluating each project, Live Oak Bank underwrites each proposed general contractor to determine whether or not it is capable of performing the proposed project. In some instances, Live Oak requires a “Completion Guaranty” from our third party monitoring firm to ensure all entities (the Bank and the customer) that the deal will be completed on time and within budget.
Significant resources are dedicated to the management of this aspect of our business. All construction draws and corresponding documentation are managed from our corporate headquarters in Wilmington, North Carolina. All draws require an inspection report performed by a third-party monitoring company. Construction-specific technology is employed to create a transparent and viable portfolio that is monitored to mitigate risk.
Credit Underwriting and Loan Approval Process
Certain credit risks are inherent in making loans. These risks include prepayment risks, risks resulting from uncertainties in the future value of collateral, risks resulting from changes in economic and industry conditions, and risks inherent in dealing with individual borrowers. We attempt to mitigate repayment risks by adhering to internal credit limits, a multi-layered approval process for larger loans, documentation examination, and follow-up procedures for any exceptions to credit policies.
The credit committee of the Bank’s management establishes policies to protect the Bank from excessive credit risk. The credit committee meets at least quarterly and consists of the Chief Risk Officer, Chief Credit Officer, Senior Credit Officer, Credit Officer, President, and a designated General Manager. A member of the Bank’s board of directors may participate as a member of the credit committee. The credit committee approves any loan with over $750 thousand of unguaranteed credit exposure. A quorum will be a minimum of three members, one of which must be a co-chair (the Chief Risk Officer, Chief Credit Officer and Senior Credit Officer are the co-chairs). A majority of the members must be in favor of the credit for approval. Any tie votes will be broken by either the chairman or vice-chairman of the credit committee. Our credit administration department approves loans with under $750 thousand of unguaranteed credit exposure. All credits with net exposure between $500 thousand and $750 thousand are presented to the credit committee for review while any credits under $500 thousand are available for review by the credit committee. Loan approvals will expire after 90 days. Any loan not closed within that time period needs to have the approval reaffirmed.
Preferred Lenders Program
Live Oak Bank has status as a member of the PLP, as designated by the SBA. The SBA established the Preferred Lenders Program, or “PLP”, in 1983 to streamline the procedures necessary to provide financial assistance to small businesses. The preferred lender status allows Live Oak Bank to expedite SBA loan approval, closing and servicing functions through this delegated authority. Approximately 15% of active SBA lenders have PLP status; however, for fiscal year 2014, PLP lenders accounted for 24% of the number of loans approved in the SBA 7(a) program and 61% of the approved amount.
114
Table of Contents
Credit Administration and Loan Review
We emphasize a strong credit culture based on traditional credit measures and our knowledge of our identified industry verticals through experienced relationship managers. We maintain a continuous internal loan review system and engage an independent consultant on a periodic basis to review loan files on a test basis and assess our loan grading. Our policy requires credit review, internal and external, to review 30% of the Bank’s loan portfolio on an annual basis.
Our dedication to a strong credit culture is based on a long-term view of our portfolio that is not driven by short-term earnings goals. Our organization’s guiding principles are soundness, profitability and growth, in that order. The primacy of soundness as a guiding principle of our organization drives a focus on credit administration processes. Credit administration processes were designed by our Chief Risk Officer, David G. Lucht. Mr. Lucht has 29 years of experience in commercial banking, with a focus on credit underwriting, credit administration and SBA lending. Our credit administration, credit review and loan operation systems focus on approving sound credits while meeting numerous regulatory requirements including compliance regulations. Our strong credit culture impacts the way we think about loan officer compensation. The compensation of our loan officers is not based on origination. Instead, loan officers are incented based on the performance of our organization as a whole and are further expected to make a significant investment in our common stock. This compensation structure drives credit mindedness in our loan officers because they are incentivized by our overall profitability rather than the volume of loan originations.
While our loan portfolio is composed largely of SBA loans, the historical national SBA default rate is typically higher than that of SBA loans held in the Bank’s portfolio. We believe this differential is attributed largely to our focus on credit administration and vertical immersion strategy. The below table reflects historical national SBA default rates compared to those of the Bank, specific to only those loans as originated in each year presented.
| Vintage |
Live Oak Loan Originations |
Default Rate | Live Oak NAICS SBA % |
Charge-off Rate | ||||||||||||||||||||
| Live Oak (%) |
All SBA (%) |
Live Oak (%) |
All SBA (%) |
|||||||||||||||||||||
| (dollars in thousands) |
||||||||||||||||||||||||
| Year Ended December 31, 2008 |
$ | 162,589 | 14.32 | 25.84 | 17.17 | 1.98 | 9.91 | |||||||||||||||||
| Year Ended December 31, 2009 |
160,580 | 4.93 | 14.22 | 9.10 | 0.47 | 3.48 | ||||||||||||||||||
| Year Ended December 31, 2010 |
256,317 | 1.68 | 7.55 | 4.47 | 0.16 | 1.15 | ||||||||||||||||||
| Year Ended December 31, 2011 |
306,637 | 2.93 | 4.29 | 2.44 | 0.23 | 0.45 | ||||||||||||||||||
| Year Ended December 31, 2012 |
413,764 | 1.29 | 2.95 | 1.24 | 0.09 | 0.17 | ||||||||||||||||||
| Year Ended December 31, 2013 |
498,752 | 0.56 | 1.21 | 0.65 | 0.07 | 0.05 | ||||||||||||||||||
| Year Ended December 31, 2014 |
848,090 | — | 0.14 | 0.05 | — | — | ||||||||||||||||||
| Three Months Ended March 31, 2015 |
248,058 | — | — | — | — | — | ||||||||||||||||||
|
|
|
|
|
|
|
|
|
|
|
|
|
|||||||||||||
| Total |
$ | 2,894,787 | 1.84 | 4.03 | 4.29 | 0.21 | 0.93 | |||||||||||||||||
|
|
|
|
|
|
|
|
|
|
|
|
|
|||||||||||||
Lending Limits
Our lending activities are subject to a variety of lending limits imposed by federal and state law. In general, the Bank is subject to a legal limit on loans to a single borrower equal to 15% of the Bank’s capital and unimpaired surplus, plus an additional 10% of the Bank’s capital and surplus if the amount that exceeds the 15% limit is secured by readily marketable collateral. Based upon the capitalization of the Bank as of March 31, 2015, the Bank’s legal lending limit to any individual borrower was $8.8 million. In addition, the Bank has imposed an internal lending limit of $2 million, $1.5 million and $1 million for loans risk graded 1-2, 3 and 4, respectively, to any individual borrower.
115
Table of Contents
Loan Participations and Sale of SBA Guaranteed Assets
We have sold over $1.8 billion in SBA guaranteed loan assets in the secondary market since May 2007. We also periodically sell participations in non-guaranteed loan assets to other financial institutions. The sale of loan assets to other financial institutions allows us to manage our balance sheet and achieve a less concentrated loan portfolio. Financial institutions that have purchased the non-guaranteed portion of loans which we have originated are currently experiencing a twelve month loss rate of 0.21%.
Competition
Commercial banking in the United States is extremely competitive. We compete with national banking organizations including the largest commercial banks headquartered in the country, all of which have small business lending divisions. We also compete with other federally and state chartered financial institutions such as community banks and credit unions, finance and business development companies, peer-to-peer and marketplace lenders and other non-bank lenders. Most of our competitors have higher legal lending limits than we do and are also able to provide more services and make greater use of media advertising.
Despite the intense level of competition among small business lenders, we believe that we occupy a category of lender distinct from our competitors, having both the benefit of deposit funding and the ability to grow quality assets. One of our principal advantages is the technology-based platform we use, which we believe has accelerated our ability to issue proposals, complete credit due diligence and finalize commitments. We believe that our personnel also provide a competitive advantage, not only because they are industry participants with relevant experience in our identified verticals but also because many have made meaningful equity investments in our company, fostering a sense of ownership.
We license the nCino bank operating system on a nonexclusive basis. As a result, this technology is available to other lenders. While the nCino bank operating system that we utilize is available to other lenders, we believe that our ability to actively develop and improve upon the existing platform with our in-house developers gives us a competitive advantage over our competitors who also may use this platform.
Properties
The following table sets forth the location of our main office, as well as additional offices and certain information relating to the facilities.
| Office |
Address |
Year Opened |
Approximate Square |
Owned or Leased | ||||
| Main Office |
1741 Tiburon Dr | 2013 | 36,000 | Owned | ||||
| Satellite Wilmington Office |
2605 Irongate Dr Ste. 100 | 2013 | 10,632 | Leased | ||||
| Atlanta Loan Production Office |
3060 Peachtree Rd Ste. 1220 | 2010 | 4,455 | Leased | ||||
| Fayetteville, AR Office |
2827 E Millennium Pl Ste 2 | 2014 | 1,575 | Leased | ||||
| Gainesville, GA Office |
500 Jesse Jewell Pkwy Ste. 200 |
2014 | 843 | Leased | ||||
| Santa Rosa, CA Office |
100 B Street Ste. 100 |
2015 | 2,386 | Leased | ||||
| Houston, TX Relationship Office |
16801 Greenspoint Park Dr Ste. 395 | 2015 | 3,387 | Leased | ||||
116
Table of Contents
We believe that our properties are maintained in good operating condition and are suitable and adequate for our operational needs.
Employees
As of March 31, 2015, we had 227 full-time employees and 36 part-time employees. None of our employees is covered by a collective bargaining agreement and we consider relations with our employees to be good.
Legal Proceedings
As of the date of this prospectus, we are not aware of any threatened or pending material legal proceedings against us or our subsidiary bank.
117
Table of Contents
General
The following table sets forth information concerning our directors and executive officers. Each member of our board of directors also serves as a member of the board of directors of Live Oak Bank.
| Name |
Age | With Company Since |
Position | |||||||
| James S. Mahan III(2) |
64 | 2007 | Chairman and Chief Executive Officer | |||||||
| William L. Williams III(3) |
63 | 2007 | Vice Chairman and Director | |||||||
| Neil L. Underwood |
46 | 2010 | President and Director | |||||||
| David G. Lucht(3) |
58 | 2007 | Chief Risk Officer and Director | |||||||
| S. Brett Caines |
36 | 2007 | Chief Financial Officer | |||||||
| William H. Cameron(1)(2)(3) |
61 | 2013 | Director | |||||||
| Diane B. Glossman(1) |
59 | 2014 | Director | |||||||
| Glen F. Hoffsis(3) |
74 | 2007 | Director | |||||||
| Don W. Jackson |
64 | 2015 | Director | |||||||
| Howard K. Landis III(1)(2) |
58 | 2007 | Director | |||||||
| Miltom E. Petty(1) |
63 | 2010 | Director | |||||||
| Jerald L. Pullins(1)(2) |
73 | 2010 | Director | |||||||
| (1) | Member of the audit & risk committee. |
| (2) | Member of the compensation committee. |
| (3) | Member of the nominating and corporate governance committee. |
Executive Officers and Directors
A biographical summary of the experience of our executive officers and directors is set forth below:
James S. Mahan III — Chairman and Chief Executive Officer
Mr. Mahan is the Founder, CEO and Chairman of the board of directors of the Company. Mr. Mahan is a founding member of nCino and serves on nCino’s board of directors. Prior to Live Oak Bank, Mr. Mahan was the Chief Executive Officer and Chairman of the Board for S1 Corporation and founder of Security First Network Bank, the world’s first Internet bank. Under his leadership, S1 Corporation grew to become a $234 million software and services provider in only six years, averaging more than 200 percent growth year over year. At its peak, S1 had a market capitalization of over $6 billion. During his term as CEO, Mahan was ranked as one of the 10 Most Influential Personalities in Financial Services by FutureBanker magazine. Prior to founding Security First Network Bank and S1 Corporation, Mahan launched Cardinal Bancshares, where he served as Chairman and Chief Executive Officer. Mahan built Cardinal into an institution with approximately $675 million in total assets and took the company public in 1992. Before launching Cardinal, Mr. Mahan spent several years with Citizens Union National Bank & Trust Co., serving as President, Chief Operating Officer and Vice Chairman and becoming Chairman and Chief Executive Officer in 1984. In 1986, Mr. Mahan formed an investment group that purchased Citizens Union and subsequently sold it to BankOne Corp. of Columbus, Ohio. Mr. Mahan began his career in 1973 at Wachovia Bank & Trust Co. in Winston-Salem, NC, after graduating with a Bachelor’s degree in Economics from Washington & Lee University in Lexington, VA.
William L. Williams III — Vice Chairman of the Board of Directors
Mr. Williams III is the Vice Chairman of the Company and one of the original founders of the Bank. Prior to starting Live Oak Bank, Mr. Williams spent 19 years in corporate banking at Wachovia and worked for 14 years
118
Table of Contents
at Vine Street Financial doing SBA lending. Mr. Williams began his banking career in 1973 at Wachovia, where he worked with Wachovia Services, Inc, then Wachovia Regional Corporate Lending, calling on and lending to mid-market regional companies. In 1987, he relocated to Wilmington, NC, where he managed the Wachovia Corporate Lending group for the three county area of Southeastern North Carolina. In 1992, he re-joined Mr. Mahan at Cardinal Bancshares as they began Vine Street Financial, a niche SBA lending division, of Vine Street Trust Company. Mr. Williams held several positions within this group including President and Senior SBA lender. Through a series of mergers/acquisitions, Vine Street Financial became a division of BB&T, where Mr. Williams served as a senior SBA lender, resigning in May of 2007 to found Live Oak Bank. Mr. Williams graduated in 1973 from the University of North Carolina-Chapel Hill with a BS degree in Business Administration. He has, and is currently serving on several private company boards, as Managing Member, and has served in the capacity of President and Treasurer on numerous charitable and “not for profit” groups in Wilmington and elsewhere in North Carolina. Mr. Williams’ 40 years of corporate banking experience, including deep experience in the SBA lending sector and his involvement as a founder and organizer of our Company, make him uniquely qualified to serve as Vice Chairman of our board of directors and as an executive officer of the Bank.
Neil L. Underwood — President and Director
Mr. Underwood currently serves as President of the Company and Live Oak Bank. Mr. Underwood is a cofounder of nCino and helps to set technological direction for the company. Prior to joining the Bank, Underwood served as General Manager of S1 Corporation (SONE), where he was responsible for the S1 Enterprise division. S1, since acquired by ACI Worldwide, Inc. (ACIW), built and deployed Financial Services systems such as online banking, payments and mobile solutions to over 3,000 financial institutions worldwide. Before S1, Mr. Underwood played a key role in launching the Americas division of Brokat Technologies AG, a global financial services software supplier based in Stuttgart, Germany. Acting as Chief Operating Officer, he was responsible for Retail and Wholesale Banking solutions for the Americas. Mr. Underwood came to Brokat as a principal of Transaction Software, which was acquired in May of 1999. A native of Miami, FL, Underwood holds a Bachelor’s Degree of Science in Industrial Engineering from the Georgia Institute of Technology. Mr. Underwood’s experience in the technology sector, coupled with a talented approach to management and resource utilization, makes him ideally suited to serve as a member of our board and president of the Bank.
David G. Lucht — Chief Risk Officer and Director
Mr. Lucht is the Chief Risk Officer for Live Oak Bank. Before joining Live Oak Bank in May of 2007 as a founding member of executive management and the board of directors, Mr. Lucht held executive positions with several different banking institutions, including Chief Credit Officer and Executive Vice President for First Merit Bank, Akron, OH, where he was responsible for leading a turnaround in credit culture and performance of the $10.5 billion bank. Prior to First Merit, Mr. Lucht served as Senior Credit Officer of National City Bank, Cleveland, OH. A native of Ohio, Mr. Lucht began his banking career with National City Bank in 1985 after graduating from Kent State University with his Master’s in Business Administration. He obtained his undergraduate Bachelor of Science degree in Marketing at Miami University in Ohio. Mr. Lucht’s approach to the identification and management of credit risk is one of the keystones of our organization. He has helped to positively shape the corporate culture of the Company since inception and his leadership at the board and executive management levels, which has contributed to our success to date, qualifies him to serve as a member of our board and as an executive officer.
S. Brett Caines — Chief Financial Officer
Mr. Caines is the Chief Financial Officer for the Company and the Bank. Mr. Caines joined Live Oak Lending, Inc., the precursor to Live Oak Banking Company, in 2007 as its finance officer after obtaining an MBA from the University of North Carolina, Wilmington. Mr. Caines was integral in the establishment of Live Oak Banking Company and its initial operations that commenced in 2008. In his role as finance officer, Mr. Caines was
119
Table of Contents
foundational in the formation of the Accounting and Capital Markets Departments. In January 2011, Mr. Caines became the Chief Financial Officer of the Company and Live Oak Bank. Prior to joining Live Oak Lending Company, Mr. Caines worked as a Production Engineer for INVISTA and as a Process Engineer for Shell Chemical Company. Mr. Caines holds a Bachelor of Science degree in Chemical Engineering from North Carolina State University.
William H. Cameron — Director
Mr. Cameron has served on the Company’s board of directors since November 2013 and chairs the Company’s nominating and corporate governance committee and serves on both the audit and compensation committees. Mr. Cameron has extensive prior experience as a director of a financial institution, having served as a founding director of Port City Capital Bank and as a director of Crescent Financial Corporation and Crescent State Bank (now Yadkin Financial Corporation and Yadkin Bank) following its acquisition of Port City Capital Bank in 2006. Mr. Cameron has extensive executive experience in corporate and real estate finance, real estate development, and private equity. He has been President of Cameron Management, Inc. since 2000 and has held leadership positions in a number of businesses over the last 25 years. Mr. Cameron served as Chief Operating Officer of Atlantic Telecasting Corporation, the NBC television affiliate in Wilmington, North Carolina. Mr. Cameron holds a B.S. in Business Administration and a Juris Doctor degree from the University of North Carolina at Chapel Hill. He has successfully completed the North Carolina Bank Directors’ College and has participated in numerous Advanced Bank Directors’ College programs. As an active business, civic and charitable leader, Mr. Cameron serves on the board of numerous organizations including Cape Fear Memorial Foundation and Champion McDowell Davis Foundation. He is president of Cameron Management, Inc. and president of the Dan Cameron Family Foundation, Inc. which has made significant contributions to the economic and cultural development of the Wilmington area. We believe Mr. Cameron’s prior experience as a director of two FDIC insured financial institutions over a period of 10 years brings to our board critical skills related to financial oversight of complex organizations, strategic planning and corporate governance and qualifies him to serve as one of our directors.
Diane B. Glossman — Director
Ms. Glossman has served as a member of our board of directors since August 2014. She serves on the audit & risk committee and the Bank’s Asset Liability Management Committee. Ms. Glossman is a retired investment analyst with over 25 years of experience as an analyst and over a decade of governance experience on boards. Ms. Glossman also currently serves on the boards of directors of Ambac Assurance Company, WMI Holdings Corp., Powa Technologies Group Ltd and QBE NA . She periodically performs consulting projects, primarily for various financial institutions. Previously, Ms. Glossman served on the board of directors of A.M. Todd Company from 1998 to July 2011, and as an independent trustee on State Street Global Advisors mutual fund board from October 2009 to April 2011. Ms. Glossman was a six-time member of Institutional Investor’s All-America Research Team and a member of the top ranked Global Bank Research team, along with winning the 2003 Wall Street Journal survey in the broker/dealer category, and was ranked for several years in the Reuters large cap and mid cap bank surveys by both fund managers and companies. Further, she was a frequent commentator on industry and company events for such entities as The Nightly Business Report, The Wall Street Journal, Financial Times, New York Times, The Economist, CNN, CNBC, and various trade publications. Ms. Glossman earned a B.S. in economics from the Wharton School at the University of Pennsylvania with a double major in finance and health care administration, having also attended the University of California at Davis. Ms. Glossman was awarded her Chartered Financial Analyst designation (CFA). We believe that Ms. Glossman’s depth of experience and financial expertise to qualify her to serve as one of our directors.
Glen F. Hoffsis — Director
Dr. Glen F. Hoffsis has served as a member of our board of directors since March 2007. He serves on the nominating and corporate governance committee and the Bank’s Asset Liability Management Committee. He is a
120
Table of Contents
veterinarian who has devoted most of his career to veterinary colleges as a clinician, teacher, researcher and administrator. Retiring in July 2013 as dean of the College of Veterinary Medicine at the University of Florida, Hoffsis was appointed dean of the newly established Lincoln Memorial University College of Veterinary Medicine effective July 2014, after serving as a consultant to LMU-CVM for several months. He has held many professional positions and currently serves on the board of directors of Banfield Pet Hospitals of Portland, OR. He is a diplomate of the American College of Veterinary Internal Medicine. Dr. Hoffsis is well known and respected within the veterinary profession. We believe that his wide range of knowledge and perspective relative to the business of veterinary medicine brings important skills to our board and qualifies him to serve on the board.
Don W. Jackson — Director
Dr. Jackson was appointed to the Company’s board of directors on June 23, 2015. For 35 years until his retirement in 2013, Dr. Jackson was associated with the meat and poultry business, helping to lead six organizations during that time. In December 2008, Dr. Jackson was named president and CEO of Pilgrim’s Pride Corporation which he successfully guided through an exit from Chapter 11 bankruptcy. From 2000 to 2008, Dr. Jackson was president of Foster Farms’ poultry division. Prior to that he served as executive vice president for foodservice of the former ConAgra Poultry Company, and worked for 22 years with Seaboard Farms, including four years as president and CEO of their poultry division. We believe that Dr. Jackson’s wide range of business experience and knowledge relative to the poultry industry brings important skills and industry insight to our board and qualifies him to serve on the board.
Howard K. Landis III — Director
Mr. Landis has served as a member of our board of directors since March 2007. He serves on the audit & risk committee and compensation committee. Since 2005, Mr. Landis has been a general partner of Plexus Capital, a small business investment company. He has 25 years of experience in the banking industry, which includes serving as the CEO of RBC Centura Bank’s US Operations from 2001 to 2004 after serving as Chief Credit Officer, Chief Risk Officer, and President of Centura Bank. Mr. Landis graduated with a Bachelor of Science in Business Administration and a Master’s in Business Administration from the University of North Carolina at Chapel Hill. We believe Mr. Landis’ 25 years of prior experience in the banking industry, including his service as CEO of a FDIC-insured financial institution with over $20 billion in total assets, brings to our board critical skills related to financial oversight of complex organizations, strategic planning and corporate governance and qualifies him to serve as one of our directors.
Miltom E. Petty — Director
Mr. Petty has served as a member of our board of directors since August 2010. He serves as the chair of our audit & risk committee. Since June, 1977, Mr. Petty has served as the Chief Financial Officer of Carolina Hosiery Mills, Inc., a privately held manufacturing and real estate development company. Since August 2013, Mr. Petty has served as a director of Trust Company of the South. Mr. Petty graduated with a Bachelor of Science degree in Business Administration from the University of North Carolina at Chapel Hill. He has held an active CPA license from the State of North Carolina for 40 years. We believe Mr. Petty’s experience as a chief financial officer of Carolina Hosiery Mills, Inc., familiarity with accounting standards, and his ability to serve as our audit & risk committee financial expert, bring to our board important skills and qualify him to serve on our board.
Jerald L. Pullins — Director
Mr. Pullins has served as a member of our board of directors since October 2011. He serves on the audit & risk committee, the Bank’s Asset Liability Management Committee and is chair of the compensation committee. Mr. Pullins brings nearly thirty-five years of experience in the healthcare, real estate, mortgage banking, funeral,
121
Table of Contents
cemetery and insurance industries. This experience, combined with his MA degree from the University of Kansas and MBA from the University of Texas, provides a wealth of financial expertise to the Board. He received an honorable discharge as a 1st Lieutenant from the United States Army after serving in Vietnam. Throughout his successful career, he has directed and managed finance, administration, accounting and operational functions at companies across a range of industries. Mr. Pullins is Chairman of the Board of US Physical Therapy and serves as Chairman of the Governance and Nominating Committee. Mr. Pullins is also a member of US Physical Therapy’s Audit Committee and Compensation Committee. He is a managing member of SeniorCare Homes, LLC, which develops, owns and operates supervised residential homes for seniors with memory impairment conditions. We believe that his wide range of knowledge of accounting, finance and administration across many business industries brings important skills to our board and qualifies him to serve on the board.
Director Independence
In connection with this offering, we have received approval to list our common stock on the NASDAQ Global Select Market. Under the rules of NASDAQ, independent directors must comprise a majority of a listed company’s board of directors within a specified period of time after the completion of this offering. In addition, the rules of NASDAQ require that, subject to specified exceptions, each member of a listed company’s audit, compensation, and nominating and corporate governance committees be independent, provided however that, in accordance with the phase-in provisions set forth in the rules of NASDAQ, our audit & risk committee will have at least one independent member by the effective date of the registration statement of which this prospectus is a part, at least two independent members within 90 days of the effective date of the registration statement of which this prospectus is a part and all members will be independent within one year of the effective date of the registration statement of which this prospectus is a part. Under the rules of NASDAQ, a director will only qualify as an “independent director” if, in the opinion of that company’s board of directors, that person does not have a relationship that would interfere with the exercise of independent judgment in carrying out the responsibilities of a director. Audit & risk committee members must also satisfy the independence criteria set forth in Rule 10A-3 under the Exchange Act, and compensation committee members must also satisfy the independence criteria set forth in Rule 10C-1 under the Exchange Act.
In order to be considered independent for purposes of Rule 10A-3 and Rule 10C-1, a member of an audit committee or compensation committee of a listed company may not, other than in his or her capacity as a member of the committee, the board of directors, or any other board committee: (1) accept, directly or indirectly, any consulting, advisory, or other compensatory fee from the listed company or any of its subsidiaries; or (2) be an affiliated person of the listed company or any of its subsidiaries.
Our board of directors has undertaken a review of the independence of each director and considered whether each director has a material relationship with us that could compromise his or her ability to exercise independent judgment in carrying out his responsibilities. As a result of this review, our board of directors determined that Ms. Glossman and Messrs. Cameron, Hoffsis, Landis and Petty are “independent directors” as defined under the applicable rules and regulations of the SEC and the listing requirements and rules of NASDAQ. Under NASDAQ rules, independent directors must comprise a majority of our Board of Directors within a specified period of time after the completion of this offering. NASDAQ rules, as well as those of the SEC, also impose several other requirements with respect to the independence of our directors.
Family Relationships
There is no family relationship between any of our directors, executive officers or persons nominated to become a director or executive officer.
122
Table of Contents
Board of Directors
Composition of our Board of Directors upon the Closing of this Offering
Our bylaws provide that our board of directors must consist of between five and twelve directors, and such number of directors within this range may be determined from time to time by resolution of our board of directors or our shareholders. As of the date of this prospectus and upon closing of this offering, we will have 11 directors.
Our articles of incorporation provide that our directors may be removed only for cause by the affirmative vote of the holders of at least a majority of the votes that all our shareholders would be entitled to cast in an annual election of directors. Directors are elected at the annual meeting of our shareholders. Those nominees who receive the highest number of votes are deemed to have been elected. Shareholders are not entitled to cumulative voting in the election of our directors.
Committees of our Board of Directors
Our board of directors has the authority to appoint committees to perform certain management and administrative functions. Our board of directors has three permanent committees: the audit & risk committee, the compensation committee, and the nominating and corporate governance committee. The board adopted written charters for each of these committees in February 2014, all of which will be available on our website upon the closing of this offering. In addition, from time to time, special committees may be established under the direction of our board of directors when necessary to address specific issues.
Audit & Risk Committee
We have an audit & risk committee consisting of Messrs. Petty (Chair), Landis, Cameron, Pullins and Ms. Glossman. Upon the closing of this offering, our audit & risk committee will be responsible for, among other things:
| • | appointing, terminating, compensating, and overseeing the work of any accounting firm engaged to prepare or issue an audit report or other audit, review or attest services; |
| • | reviewing and approving, in advance, all audit and non-audit services to be performed by the independent auditor, taking into consideration whether the independent auditor’s provision of non-audit services to us is compatible with maintaining the independent auditor’s independence; |
| • | reviewing and discussing the adequacy and effectiveness of our accounting and financial reporting processes and controls and the audits of our financial statements; |
| • | establishing and overseeing procedures for the receipt, retention, and treatment of complaints received by us regarding accounting, internal accounting controls or auditing matters, including procedures for the confidential, anonymous submission by our employees regarding questionable accounting or auditing matters; |
| • | investigating any matter brought to its attention within the scope of its duties and engaging independent counsel and other advisors as the audit & risk committee deems necessary; |
| • | determining compensation of the independent auditors and of advisors hired by the audit & risk committee and ordinary administrative expenses; |
| • | reviewing and discussing with management and the independent auditor the annual and quarterly financial statements prior to their release; |
| • | monitoring and evaluating the independent auditor’s qualifications, performance, and independence on an ongoing basis; |
123
Table of Contents
| • | reviewing reports to management prepared by the internal audit function, as well as management’s response; |
| • | reviewing and assessing the adequacy of the formal written charter on an annual basis; |
| • | reviewing and approving related-party transactions for potential conflict of interest situations on an ongoing basis; |
| • | monitoring our risk profile and providing input to management on risk appetite, risk profile, and regulatory requirements; |
| • | approving our risk management framework and periodically reviewing and evaluating the adequacy and effectiveness of such framework; |
| • | overseeing management’s implementation of and conformance with our significant risk management policies, procedures, limits and tolerances; |
| • | discussing with management our major risk exposures and reviewing the steps management has taken to identify, monitor and control such exposures; |
| • | reviewing the independence, authority and adequacy of our risk management function; and |
| • | handling such other matters that are specifically delegated to the audit & risk committee by our board from time to time. |
Our board of directors has affirmatively determined that Mr. Petty satisfies the requirements for independence and financial literacy under the rules and regulations of NASDAQ and the SEC, and that he qualifies as an “audit committee financial expert” as defined in the SEC rules and satisfies the financial sophistication requirements of NASDAQ. As discussed above in “Management — Director Independence,” Mr. Pullins is not independent for audit committee purposes under SEC rules, and we will rely on the phase-in rules of NASDAQ with respect to the independence of the audit committee following this offering.
Compensation Committee
We have a compensation committee consisting of Messrs. Pullins (Chair), Landis, and Cameron, each of whom is a non-employee member of our board of directors, and Mr. Mahan, Chairman and CEO who is an employee member of our board of directors. Upon the closing of this offering, our compensation committee will be responsible for, among other things:
| • | reviewing and approving the compensation, employment agreements and severance arrangements, and other benefits of all of our executive officers and key employees; |
| • | reviewing and approving, on an annual basis, the corporate goals and objectives relevant to the compensation of the executive officers, and evaluating their performance in light thereof; |
| • | reviewing and making recommendations, on an annual basis, to the board with respect to director compensation; |
| • | reviewing any analysis or report on executive compensation required to be included in the annual proxy statement and periodic reports pursuant to applicable federal securities rules and regulations, and recommending the inclusion of such analysis or report in our proxy statement and period reports; |
| • | reviewing and assessing, periodically, the adequacy of the formal written charter; and |
| • | such other matters that are specifically delegated to the compensation committee by our board from time to time. |
Our board of directors has determined that each member of our compensation committee, other than Messrs. Mahan and Pullins, meet the requirements for independence under the rules of NASDAQ and SEC rules and
124
Table of Contents
regulations, and qualifies as an “outside director” for purposes of Section 162(m) of the Code. We intend to rely on the phase-in rules of NASDAQ with respect to the independence of the compensation committee following this offering.
Nominating and Corporate Governance Committee
Upon the effectiveness of this registration statement, our nominating and corporate governance committee will consist of Messrs. Cameron (Chair) and Hoffsis, each of whom is a non-employee member of our board of directors, and Messrs. Lucht and Williams, who are employee members of our board of directors. Upon completion of this offering, our nominating and corporate governance committee will be responsible for, among other things:
| • | identifying and screening candidates for our board, and recommending nominees for election as directors; |
| • | establishing procedures to exercise oversight of the evaluation of the board and management; |
| • | developing and recommending to the board a set of corporate governance guidelines, as well as reviewing these guidelines and recommending any changes to the board; |
| • | reviewing the structure of the board’s committees and recommending to the board for its approval directors to serve as members of each committee, and where appropriate, making recommendations regarding the removal of any member of any committee; |
| • | developing and reviewing our code of conduct, evaluating management’s communication of the importance of our code of conduct, and monitoring compliance with our code of conduct; |
| • | reviewing and assessing the adequacy of the formal written charter on an annual basis; and |
| • | generally advising our board on corporate governance and related matters. |
Our board of directors has determined that each member of our nominating and corporate governance committee, other than Messrs. Lucht and Williams, meet the requirements for independence under the rules of NASDAQ. We intend to rely on the phase-in rules of NASDAQ with respect to the independence of the nominating and corporate governance committee.
Compensation Committee Interlocks and Insider Participation
With the exception of Mr. Mahan, none of the members of our compensation committee is or has been an officer or employee of our company. None of our executive officers currently serve, or in the past year has served, as a member of the compensation committee or director (or other board committee performing equivalent functions or, in the absence of any such committee, the entire board of directors) of any entity that has one or more executive officers serving on our compensation committee or our board of directors.
Code of Conduct
In connection with this offering, we adopted a revised code of ethics relating to the conduct of our business by all of our employees, officers, and directors, as well as a code of conduct specifically for our principal executive officer and senior financial officers. This policy will be posted on our website upon completion of this offering.
125
Table of Contents
EXECUTIVE COMPENSATION AND OTHER MATTERS
The following summary compensation table shows all cash and non-cash compensation paid to or received or deferred by James S. Mahan III, Neil L. Underwood, David G. Lucht and S. Brett Caines who we refer to as our “named executive officers,” for services rendered to us and the Bank in all capacities during the fiscal year ended December 31, 2014. Compensation paid to our named executive officers consisted of cash salary, non-equity incentive plan compensation paid in cash, 401(k) matching contributions, insurance premiums paid on behalf of each of the named executive officers and certain perquisites.
Summary Compensation Table
| Name and Principal Position |
Year | Salary | Bonus | Option Awards |
Stock Awards |
Non-Equity Incentive Plan Compensation(1) |
Non-Qualified Deferred Compensation Earnings |
All Other Compensation(2) |
Total | |||||||||||||||||||||||||||
| James S. Mahan III |
2014 | $ | 512,025 | $ | — | $ | — | $ | — | $ | 190,878 | $ | — | $ | 90,741 | $ | 793,644 | |||||||||||||||||||
| Chairman and Chief Executive Officer |
2013 | 547,617 | — | — | — | 288,171 | — | 42,084 | 877,872 | |||||||||||||||||||||||||||
| Neil L. Underwood |
2014 | 424,383 | — | — | — | 155,142 | — | 40,785 | 620,310 | |||||||||||||||||||||||||||
| President |
2013 | 424,218 | — | — | 955,548 | 203,658 | — | 494,643 | (3) | 2,078,067 | ||||||||||||||||||||||||||
| David G. Lucht |
2014 | 390,000 | — | — | 1,320,000 | (4) | 142,634 | — | 845,821 | (3) | 2,698,455 | |||||||||||||||||||||||||
| Executive Vice President and Chief Risk Officer |
2013 | 390,000 | — | — | — | 196,731 | — | 41,676 | 628,407 | |||||||||||||||||||||||||||
| S. Brett Caines |
2014 | 239,128 | — | — | 1,320,000 | (4) | 85,208 | — | 843,193 | (3) | 2,487,529 | |||||||||||||||||||||||||
| Chief Financial Officer |
2013 | 220,983 | — | — | — | 106,807 | — | 38,945 | 366,735 | |||||||||||||||||||||||||||
| (1) | Final payout from the terminated 2013 Employee Profit Sharing Plan, paid in 2014. The amount paid is based on the employee’s base salary and the plan’s profit sharing formula. |
| (2) | Includes accrued but unused vacation time, 401(k) matching contributions and the dollar value of insurance premiums paid on behalf of the named officers for group term life, health, dental and disability insurance. Also includes an automobile allowance, business travel allowance, personal use of Company aircraft and country club dues paid to, or on behalf of, the named executives. The cost for personal use of the Company’s aircraft was calculated using Standard Industry Fare Level (“SIFL”) rules utilizing Professional Flight Management software. The unreimbursed cost of an employee’s nonbusiness use of the Company’s aircraft must be included as income for federal income tax purposes. SIFL is the IRS accepted method for valuing the use. The value, based on the SIFL method, is included in other compensation. |
| (3) | Also includes $661,592 in payments to cover taxes associated with a restricted stock award granted and fully vested in 2014 and $150,205 in non-cash compensation related to distributed nCino shares. |
| (4) | Discretionary award based on Messrs. Lucht and Caines’ long-term employment and instrumental involvement in the early development of the Company. The Company chose to recognize their contribution to the Company’s success and provided incentive to retain their services to aid in the future success of the Company. |
Employment Agreements
Our named executive officers serve at the discretion of our board of directors and are not party to employment agreements.
126
Table of Contents
Omnibus Plan
The shareholders of the Company approved the 2015 Omnibus Stock Incentive Plan at the 2015 annual meeting of shareholders, which replaced the 2008 Incentive Stock Option Plan, the Restricted Stock Plan and the 2008 Non-statutory Stock Option Plan. The 2015 Omnibus Plan authorizes the issuance of awards covering up to 4,300,000 shares of the Company’s common stock. The awards may be issued in the form of incentive stock option grants, non-qualified stock option grants, restricted stock grants, long-term incentive compensation units, or stock appreciation rights. There were no awards granted under this plan in 2014 or 2013. There are 4,265,070 shares of our common stock reserved for issuance in connection with stock awards available for issuance under this 2015 Omnibus Plan as of July 7, 2015.
2008 Incentive Stock Option Plan
At the 2008 annual meeting of shareholders, the shareholders approved the adoption of the Live Oak Banking Company 2008 Incentive Stock Option Plan, or the 2008 Plan.
Options granted under the 2008 Plan are intended to qualify as “incentive stock options” within the meaning of Section 422 of the Internal Revenue Code. Under the Code, options are afforded favorable tax treatment to recipients upon compliance with certain restrictions but do not result in tax deductions to the Company. The purpose of the 2008 Plan is to increase the performance incentive for employees of the Bank, to encourage the continued employment of current employees and to attract new employees by facilitating their purchase of a stock interest in the Company.
The 2008 Plan is administered by the compensation committee of the board of directors. No member of the Board who is not also an employee of the Company or the Bank is eligible to receive stock options under the 2008 Plan. Employees of the Bank are eligible to receive options under the 2008 Plan at no cost to them other than the option exercise price. Any options granted under the 2008 Plan are subject to a minimum three-year vesting schedule, whereby 33% of the total options granted would vest on each anniversary of the date of grant until all options are vested. Generally, the exercise price for options granted pursuant to the 2008 Plan may not be less than 100% of the fair market value of the shares on the date of grant. No option will be exercisable more than ten years after the date that it is granted. In the case of an employee who owns more than 10% of the outstanding shares of common stock of the Company at the time the stock option is granted, the option price may not be less than 110% of the fair market value of the shares on the date of the grant, and the option shall not be exercisable more than five years from the date it is granted. The optionee cannot transfer or assign any option other than by will or in accordance with the laws of descent and distribution. In the event the optionee is discharged for cause or voluntary separation on the part of an optionee (but not separation due to retirement or disability) the options, vested and unvested will immediately terminate. In the event of an optionee’s retirement, any unvested options will vest and the options will continue to be exercisable for three months following retirement. In the event an optionee becomes disabled or dies, any unvested options will vest and the options will continue to be exercisable for twelve months following the date of disability or death.
Subject to alternative minimum tax rules under the Code, a recipient of a stock option under the 2008 Plan will not be taxed upon either the grant of the option or on the date he or she exercises such option. Unless subject to the alternative minimum tax, a recipient will be taxed only upon the sale of the stock underlying the option and will be taxed on the difference between the option price and the sales price of the stock. The taxable amount will be treated as capital gain. If the incentive option requirements are satisfied, the Company will receive no corresponding deduction for any portion of the stock option.
In the event of increases, decreases or changes in the Company’s outstanding common stock resulting from a stock dividend, recapitalization, reclassification, stock split, combination or similar event, or resulting from an exchange of shares or merger or other reorganization in which the Bank is the surviving entity, the Board shall make equitable proportionate adjustments in the aggregate number and kind of shares available under the 2008 Plan, the number and kind of shares which are covered by each then outstanding incentive stock option, and in the exercise price of each unexercised incentive stock option. Unless amended by the Board, the standard option grant agreement shall be binding upon any successor to the Company. However, except upon a “change in control” (as defined in the option grant agreement), the 2008 Plan and any options granted thereunder shall terminate upon the effective date of the Company’s dissolution or liquidation.
127
Table of Contents
The Board may, from time to time, amend, modify, suspend, terminate or discontinue the 2008 Plan without notice. However, no such action will adversely affect any optionee’s rights under any then outstanding incentive stock option without such optionee’s prior written consent. In addition, approval of the Company’s shareholders is required for any modification or amendment of the 2008 Plan that (a) increases the aggregate number of shares of common stock available for issuance under the 2008 Plan, (b) changes the provisions of the 2008 Plan with respect to the determination of persons to whom incentive stock options may be granted, or (c) otherwise materially increases the benefits accruing to optionees under the 2008 Plan. Consistent with the terms of the 2008 Plan, the Board may modify any outstanding incentive stock option pursuant to a written agreement with the optionee.
The 2008 Plan was adopted by the board of directors of the Company in connection with the reorganization of the Bank into the holding company form of organization on March 31, 2009. Upon adoption of the 2008 Plan by the Company, all outstanding options to purchase shares of the Bank were converted into options to purchase shares of the Company’s common stock. The 2008 Plan was replaced by the 2015 Omnibus Plan, and no further grants of stock options will be made under the 2008 Plan.
Restricted Stock Plan
The board of directors previously adopted and the shareholders previously approved a restricted stock plan which provided for the grant of restricted common stock to eligible employees. Under the plan, the Company issued shares of its common stock to employees. The transfer of these shares is restricted such that the employee cannot transfer the shares until the shares “vest” and the transfer restrictions lapse. The purpose of the plan is to encourage and motivate key employees to contribute to the successful performance of the Company and to promote the growth of the value of the Company’s common stock. The plan provides participating employees with an ownership interest in the Company and thus achieves a unity of purpose between employees and shareholders. The plan also helps retain key employees.
The plan is administered by the compensation committee. In order to be eligible for participation in the plan, an individual must be a full-time employee of the Company or one of its subsidiaries and must be identified by the compensation committee as an employee who is in a position to contribute to the long-term success of the Company. In determining awards under the plan, the compensation committee took into account the nature of the services rendered by the eligible employees, their present and potential contributions to the success of the Company, and such other factors as the compensation committee deemed relevant.
Each issuance of restricted stock is evidenced by a restricted stock grant agreement between the Company and the employee. The grant agreement sets forth the terms and conditions of the restrictions on the shares, including the vesting schedule, if any. This plan was replaced by the 2015 Omnibus Plan, and no further shares of our common stock will be issued under the plan.
128
Table of Contents
Outstanding Equity Awards at Fiscal Year-End
There were no outstanding equity awards held by any of our named executive officers at December 31, 2014. No stock options were exercised by the named executive officers during 2014. On March 26, 2014, S. Brett Caines and David G. Lucht were awarded 300,000 shares of stock each at the then current market value of $4.40 per share. Based on the Company’s granted shares, Mr. Caines and Mr. Lucht were granted 115,542 shares of nCino common stock each at the then current market value of $1.30 per share during the transfer of shares based on each shareholder’s percentage ownership in the Company.
Employee Bonus Plan
Our employee bonus plan (the “Bonus Plan”) allows eligible employees to participate in a bonus pool based on our profitability. The Bonus Plan awards each participating employee a quarterly bonus based on the bank’s ability to meet and/or exceed its quarterly budget for bank-level pre-tax net income. No quarterly bonus shall exceed 3% of the employee’s annual base salary. Should the bank fail to meet its quarterly budget, yet exceed its annual budget, the quarterly bonus that was not paid out is eligible to be made up at the end of the fiscal year. Eligible employees and directors participating in the Bonus Plan for the full year will receive 12% of base salary when the bank meets is bank-level pre-tax budget.
Employee Stock Purchase Plan
In 2010, we adopted an Employee Stock Purchase Plan (2010 ESPP). Under this plan, eligible employees were able to withhold post-tax dollars from their monthly payroll to be placed in a money market account for bi-annual purchases of the Company’s common stock. In order for employees to be eligible to contribute to this program, they must have completed one year of service with the Company. Eligible employees’ money market accounts were swept on March 15th and September 15th each year, up to the amount that would purchase whole shares of stock, not to exceed $25,000 per employee per calendar year. In order to preserve the S-Corporation election, the we discontinued the 2010 ESPP in October 2013.
Subsequent to conversion to a C corporation in 2014, we again adopted an Employee Stock Purchase Plan (ESPP) on October 8, 2014, within the meaning of Section 423 of the Internal Revenue Code of 1986, as amended. Under this plan eligible employees were able to purchase available shares with post-tax dollars as of the grant date. In order for employees to be eligible to participate in this plan they must be employed or on an authorized leave of absence from the Company or any subsidiary immediately prior to the grant date. ESPP stock purchases cannot exceed $25,000 per employee per calendar year. Options to purchase shares under the ESPP in 2014 were granted at a 15% discount to fair market value.
Director Compensation
Each non-employee director is paid a retainer of $2,000 per month. The chairman of the audit & risk committee receives an additional monthly retainer of $1,000. The Outside Director Profit Sharing Plan was terminated in 2013. Effective January 1, 2014, each non-employee director is eligible to participate in the Bank’s Bonus Plan based on their annualized fees in the same quarterly percentage payout awarded to eligible employees under the Bonus Plan.
The following table presents a summary of all compensation paid by us to our directors who are not employees for their service as such during the year ended December 31, 2014.
| Name(6) |
Fees Earned or Paid in Cash |
Stock Awards |
Option Awards |
Non-Equity Incentive Plan Compensation(5) |
Nonqualified Deferred Compensation Earnings |
All Other Compensation |
Total | |||||||||||||||||||||
| William H. Cameron |
$ | 24,000 | — | $ | 132,000 | $ | 6,367 | — | $ | 704 | (1) | $ | 163,071 | |||||||||||||||
| Diane B. Glossman(2) |
10,000 | — | 319,020 | 480 | — | — | 329,500 | |||||||||||||||||||||
| Glen F. Hoffsis |
24,000 | — | 132,000 | 8,837 | — | — | 164,837 | |||||||||||||||||||||
| Howard K. Landis III |
24,000 | — | 132,000 | 8,837 | — | — | 164,837 | |||||||||||||||||||||
| Miltom E. Petty(3) |
36,000 | — | 132,000 | 13,255 | — | — | 181,255 | |||||||||||||||||||||
| Jerald L. Pullins |
24,000 | — | 132,000 | 8,837 | — | 455,600 | (4) | 620,437 | ||||||||||||||||||||
129
Table of Contents
| (1) | Includes personal use of the Company’s aircraft, calculated using SIFL rules utilizing Professional Flight Management software. |
| (2) | Ms. Glossman joined the board of directors effective August 22, 2014. |
| (3) | Includes an additional monthly retainer of $1,000 per month for service as chairman of the audit & risk committee. |
| (4) | Includes $405,600 in payments to cover taxes associated with stock options and consulting fees of $50,000. |
| (5) | Includes $36,000 final payout under the terminated 2013 Outside Director Profit Sharing Plan and $12,000 payout under the 2014 Bonus Plan. |
| (6) | Don W. Jackson joined the board of directors after December 31, 2014. |
2008 Nonstatutory Stock Option Plan
At the 2008 annual meeting of shareholders, the shareholders approved the adoption of the Live Oak Banking Company 2008 Nonstatutory Stock Option Plan, or the 2008 Directors’ Plan.
Options granted under the 2008 Directors’ Plan do not qualify as “incentive stock options” within the meaning of Section 422 of the Internal Revenue Code. The purpose of the 2008 Directors’ Plan is to encourage the continued participation of members of our board of directors, to align the interests of directors with those of shareholders and to facilitate the recruitment of new members of the board of directors as necessary or desirable.
The 2008 Directors’ Plan is administered by the board of directors. Members of the board of directors of the Company and members of the board of directors of its subsidiaries, including the Bank, are eligible to receive options under the 2008 Directors’ Plan at no cost to them other than the option exercise price. Any options granted under the 2008 Directors’ Plan are subject to a minimum three-year vesting schedule, whereby 33% of the total options granted would vest on each anniversary of the date of grant until all options are vested. Generally, the exercise price for options granted pursuant to the 2008 Directors’ Plan may not be less than 100% of the fair market value of the shares on the date of grant. No option will be exercisable more than ten years after the date that it is granted. The optionee cannot transfer or assign any option other than by will or in accordance with the laws of descent and distribution. In the event a director’s tenure as a member of the board of directors terminates for any reason, options granted under the 2008 Directors’ Plan, vested and unvested, will immediately terminate. In the event of an optionee’s retirement, any unvested options will vest and the options will continue to be exercisable for three months following retirement. In the event an optionee becomes disabled or dies, any unvested options will vest and the options will continue to be exercisable for twelve months following the date of disability or death.
In the event of increases, decreases or changes in our outstanding common stock resulting from a stock dividend, recapitalization, reclassification, stock split, combination or similar event, or resulting from an exchange of shares or merger or other reorganization in which the Bank is the surviving entity, the Board shall make equitable proportionate adjustments in the aggregate number and kind of shares available under the 2008 Directors’ Plan, the number and kind of shares which are covered by each then outstanding incentive stock option, and in the exercise price of each unexercised incentive stock option. Unless amended by our board of directors, the standard option grant agreement shall be binding upon any successor to the Company. However, except upon a “change in control” (as defined in the option grant agreement), the 2008 Directors’ Plan and any options granted thereunder shall terminate upon the effective date of the Company’s dissolution or liquidation.
Our board of directors may, from time to time, amend, modify, suspend, terminate or discontinue the 2008 Directors’ Plan without notice. However, no such action will adversely affect any optionee’s rights under any then outstanding stock option without such optionee’s prior written consent. In addition, approval of our shareholders is required for any modification or amendment of the 2008 Directors’ Plan that (a) increases the aggregate number of shares of common stock available for issuance under the 2008 Directors’ Plan, (b) changes the provisions of the 2008 Directors’ Plan with respect to the determination of persons to whom stock options
130
Table of Contents
may be granted, or (c) otherwise materially increases the benefits accruing to optionees under the 2008 Directors’ Plan. Consistent with the terms of the 2008 Directors’ Plan, the Board may modify any outstanding stock option pursuant to a written agreement with the optionee.
The 2008 Directors’ Plan was adopted by our board of directors in connection with the reorganization of the Bank into the holding company form of organization on March 31, 2009. Upon adoption of the 2008 Directors’ Plan by the Company, all outstanding options to purchase shares of the Bank were converted into options to purchase shares of the Company’s common stock. The 2008 Directors’ Plan was replaced by the 2015 Omnibus Plan, and no further grants of stock options will be made under the 2008 Directors’ Plan.
Outside Director Profit Sharing Plan
Effective January 1, 2013, we adopted an outside director profit sharing plan. Eligible directors participated in an award based on their annual director fees in the same quarterly percentage payout awarded under our employee profit sharing plan. The Outside Director Profit Sharing Plan was terminated in 2013.
131
Table of Contents
CERTAIN RELATIONSHIPS AND RELATED-PARTY TRANSACTIONS
Transactions with Affiliates
Neither we nor the Bank have any outstanding loans to directors, executive officers or their related interests. Traditionally, we do not make such loans and it is the policy of the Bank not to make loans that are subject to Regulation O of the Board of Governors of the Federal Reserve System. To the extent loans are ever made to directors or officers in the future, such loans (i) will be made in the ordinary course of business; (ii) will be made on substantially the same terms, including interest rates and collateral, as those prevailing at the time for comparable loans with persons not related to the lender and (iii) will not involve more than the normal risk of collectability or present other unfavorable features. At December 31, 2014, total loans outstanding to members of the Board, executive officers and affiliates were $6.7 million. We refer to such loans as related party loans. During the first three months of 2015, $150 thousand in principal advances were made and $1 million in principal curtailments were received, resulting in total related party loans of $5.8 million at March 31, 2015.
The Bank leases the premises of its former main office from Cameron Management. William H. Cameron, a member of our board of directors, is a principal of Cameron Management. The current lease for this facility expires July 31, 2015. Total lease payments of $25,000 and $100,000 were paid to Cameron Management by the Bank during the three months ended March 31, 2015 and year ended December 31, 2014, respectively. In the opinion of management, the terms of the lease are no less favorable to the Bank than would be available from an independent third party lessor and Mr. Cameron was not affiliated with the Company or the Bank when the lease was originally executed in 2013.
The Bank currently sub-leases office space to nCino, pursuant to a lease signed in November 2013. nCino is an affiliate of us and the Bank. At December 31, 2013, the Company owned 45.9% of the outstanding common stock of nCino and our directors, officers and employees owned an additional 18.4%. At December 31, 2014 the Company owned 9.0% of the outstanding common stock of nCino and our directors, officers and certain of our employees collectively owned 39.8% of nCino’s common stock. In addition, Messrs. Mahan, Underwood and Lucht were members of the board of directors of nCino during 2014. In June 2014 the Company divested its ownership in nCino to shareholders in the form of a dividend. As of March 31, 2015, the Company owned none of the outstanding common stock of nCino and directors, officers and employees of the Company collectively owned approximately 28.2% of nCino’s outstanding common stock. In addition, Mr. Mahan is the only remaining member of the board of directors of nCino from the Company as of March 31, 2015. In the opinion of management, the terms and conditions of nCino’s lease are no less favorable to the Bank than those that would be available to an independent third party lessee. nCino paid the Bank total lease payments of $20,000 and $78,000 during the three months ended March 31, 2015 and year ended December 31, 2014, respectively.
The Bank is currently party to a software service agreement with nCino. In the opinion of management, the terms of the Bank’s software service agreement with nCino are no less favorable to the Bank than would be available from an independent third party software provider. Total payments of approximately $432,000 and $1.6 million were paid to nCino by the Bank during the three months ended March 31, 2015 and year ended December 31, 2014, respectively. The Bank’s transactions with nCino comply with the quantitative and qualitative requirements of Sections 23A and 23B of the Federal Reserve Act, as amended, and Regulation W of the Board of Governors of the Federal Reserve System.
As of March 31, 2015 and December 31, 2014, the Bank had invested an aggregate of $550,000 in Plexus Fund II and Plexus Fund III, each of which are qualifying small business investment funds managed by Plexus Capital, a registered small business investment company based in Raleigh, North Carolina. The Bank has committed to invest an additional $450,000 in Plexus Fund III, upon capital call. Mr. Landis, a member of our board of directors, is a principal of Plexus Capital.
132
Table of Contents
The following table sets forth certain information with respect to the beneficial ownership of our common stock as of June 30, 2015, as adjusted to reflect the sale of common stock in this offering (assuming the underwriters do not exercise their option to purchase additional shares), for:
| • | each of our named executive officers; |
| • | each of our directors; |
| • | all of our named executive officers and directors as a group; and |
| • | each person, or group of affiliated persons, known by us to be the beneficial owner of more than 5% of our outstanding shares of common stock. |
Beneficial ownership is determined in accordance with the rules of the SEC and includes voting or investment power with respect to the securities. Shares of common stock that may be acquired by an individual or group within 60 days of June 30, 2015 pursuant to the exercise of options, warrants or other rights, are deemed to be outstanding for the purpose of computing the percentage ownership of such individual or group, but are not deemed to be outstanding for the purpose of computing the percentage ownership of any other person shown in the table. The table below calculates the percentage of beneficial ownership of our common stock based on 28,654,860 shares of voting and non-voting common stock outstanding as of June 30, 2015.
Except as indicated in footnotes to this table, we believe that the shareholders named in this table have sole voting and investment power with respect to all shares of common stock shown to be beneficially owned by them, based on information provided to us by such shareholders. Unless otherwise indicated, the address for each director and executive officer listed is: c/o Live Oak Bancshares, Inc., 1741 Tiburon Drive, Wilmington, NC 28403.
The underwriters have reserved out of the shares of our common stock being offered by this prospectus 400,000 shares for sale at the initial public offering price to our directors, officers and certain other persons identified by us who have expressed an interest in purchasing our common stock in the offering. However, because these indications of interest are not binding agreements or commitments to purchase, the underwriters may determine to sell more, less or no shares in this offering to these persons, or these persons may determine to purchase more, less or no shares in this offering. The foregoing discussion and the table below do not reflect any potential purchases by these individuals.
| Shares Beneficially Owned Prior to this Offering |
Shares Beneficially Owned After this Offering |
|||||||||||||||
| Name |
Number | % | Number | % | ||||||||||||
| Directors and named executive officers: |
||||||||||||||||
| James S. Mahan III(1) |
6,100,478 | 21.3 | 6,100,478 | 18.7 | ||||||||||||
| William L. Williams III(2) |
1,252,520 | 4.4 | 1,252,520 | 3.8 | ||||||||||||
| Neil L. Underwood |
1,050,010 | 3.7 | 1,050,010 | 3.2 | ||||||||||||
| David G. Lucht(3) |
265,000 | * | 265,000 | * | ||||||||||||
| S. Brett Caines(5) |
426,050 | 1.5 | 426,050 | 1.3 | ||||||||||||
| William H. Cameron(4)(7) |
215,670 | * | 215,670 | * | ||||||||||||
| Diane B. Glossman |
5,000 | * | 5,000 | * | ||||||||||||
| Glen F. Hoffsis(7) |
64,290 | * | 64,290 | * | ||||||||||||
| Howard K. Landis III(7) |
202,993 | * | 202,993 | * | ||||||||||||
| Miltom E. Petty(7) |
84,410 | * | 84,410 | * | ||||||||||||
| Jerald L. Pullins(7) |
239,380 | * | 239,380 | * | ||||||||||||
| Don W. Jackson |
— | * | — | * | ||||||||||||
| All directors and executive officers as a group (12 persons) |
9,905,801 | 34.6 | 9,905,801 | 30.3 | ||||||||||||
| Greater than 5% shareholders: |
||||||||||||||||
| Maurice J. Koury |
1,950,560 | 6.8 | 1,950,560 | 6.0 | ||||||||||||
| Wellington Management(6) |
7,048,300 | 24.6 | 7,048,300 | 21.6 | ||||||||||||
133
Table of Contents
| * | Represents beneficial ownership of less than one percent. |
| (1) | Includes 3,101,708 shares held by the James S. Mahan III Revocable Trust over which Mr. Mahan has sole investment and voting power and 2,998,770 shares held by the Marguerite D. Mahan Revocable Trust. |
| (2) | William L. Williams III has shared voting rights on 1,200,000 jointly-held shares, shared voting rights on 14,110 shares held by Spoint-ILM, LLC, includes 14,100 shares held in an IRA custodial account and 650,000 shares are pledged as security for personal loans. |
| (3) | Includes shared voting rights on 265,000 jointly-held shares. |
| (4) | Includes 470 shares held by the GST-Exempt Trust for William H. Cameron and excludes 10,890 shares held by the Mary Jo Cameron Revocable Trust. |
| (5) | Includes shared voting rights on 351,000 jointly-held shares. |
| (6) | Includes 2,324,770 voting and 4,723,530 non-voting shares of common stock held by the following funds managed by Wellington Management: 2,155,050 held by Bay Pond Investors USB, LLC; 2,962,740 shares held by Bay Pond Partners, L.P.; 836,200 shares held by Ithan Creek Investors USB, LLC; 553,950 shares held by Wolf Creek Investors USB, LLC; and 540,360 shares held by Wolf Creek Partners, L. P. The funds managed by Wellington Management own 100% of all of the outstanding shares of the Company’s non-voting common stock. |
| (7) | Includes 3,000 options that fully vested on March 26, 2015. |
134
Table of Contents
The following is a summary of the material provisions of our articles of incorporation and bylaws.
General
Our amended and restated articles of incorporation authorize the issuance of 110,000,000 total shares of common stock. Of these authorized shares, there are 100,000,000 authorized shares of voting common stock, no par value per share, of which there were 23,900,079 shares outstanding on March 31, 2015, and 10,000,000 authorized shares of non-voting common stock, of which there were 4,723,530 shares outstanding on March 31, 2015. Our articles of incorporation also authorize the issuance of 1,000,000 shares of preferred stock, of which there were no shares outstanding at March 31, 2015.
The common stock we are offering through this prospectus is voting common stock. Upon completion of this offering (assuming the underwriters do not exercise their option to purchase additional shares), there will be 32,654,860 shares of voting and non-voting common stock outstanding. Up to an additional 2,268,736 shares of voting common stock will be issuable upon exercise of outstanding options granted under our stock option plans.
Common Stock
Aside from voting rights, as described more fully below, all rights of holders of voting common stock are identical to the rights of holders of non-voting common stock. Our non-voting common stock automatically converts to voting common stock if it is transferred to a subsequent holder in a “permitted transfer,” as that term is defined in our amended and restated articles of incorporation.
A “permitted transfer” is a transfer (i) to an affiliate of the holder or to the Company, (ii) in a widespread public distribution (including a transfer to an underwriter for the purpose of conducting a widespread public distribution such as the public offering contemplated by this prospectus), (iii) in transfers in which no transferee (or group of associated transferees) would receive 2% or more of any class of the voting securities of the Company, or (iv) to a transferee that would control more than 50% of the voting securities of the Company without any transfer from the transferor.
Dividend Rights
As a North Carolina corporation, we are not directly subject to the restrictions on the payment of cash dividends applicable to the Bank. The Federal Reserve has issued a policy statement on the payment of cash dividends by bank holding companies, which expresses the Federal Reserve’s view that a bank holding company should pay cash dividends only to the extent that the holding company’s net income for the past year is sufficient to cover both the cash dividends and a rate of earning retention that is consistent with the holding company’s capital needs, asset quality and overall financial condition. See the section entitled “Supervision and Regulation” for more information.
Holders of shares of our common stock are entitled to receive such cash dividends as the board of directors may declare out of legally available funds. However, our payment of cash dividends will be subject to the restrictions of North Carolina law applicable to the declaration of distributions to shareholders by a business corporation. Under such provisions, distributions, including cash dividends, may not be paid if, after giving effect to such cash dividend or other distribution, a corporation would not be able to pay its debts as they become due in the usual course of business or the corporation’s total assets would be less than the sum of its total liabilities plus the amount that would be needed to satisfy certain preferential liquidation rights. Our ability to pay cash dividends to the holders of shares of our common stock is, at the present time and for the foreseeable future, largely dependent upon the amount of cash dividends that our subsidiary bank pays to us.
135
Table of Contents
Voting Rights
Each share of our voting common stock entitles the holder thereof to one vote on all matters upon which shareholders have the right to vote. Our shareholders are not entitled to cumulate their votes for the election of directors.
Shares of our non-voting common stock do not have voting rights, except to the extent otherwise required by law.
Assessment and Redemption
Our common stock is not subject to redemption or any sinking fund and all outstanding shares are fully paid and non-assessable.
Liquidation Rights
In the event of any liquidation, dissolution or winding up of our affairs, the holders of shares of our common stock are entitled to receive, after payment of all debts and liabilities, all of our remaining assets available for distribution in cash or in kind. In the event of any liquidation, dissolution or winding up of our subsidiary bank, we, as the sole shareholder of such bank’s common stock, would be entitled to receive all remaining assets of the bank available for distribution in cash or in kind after payment of all debts and liabilities of the bank including all deposits and accrued interest on deposits.
Preemptive Rights; Redemption
Holders of shares of our common stock are not entitled to preemptive rights with respect to any shares that may be issued. Our common stock is not subject to call or redemption.
Preferred Stock
Our articles of incorporation, as amended, authorize the issuance of 1,000,000 shares of preferred stock, no par value per share. As of the date of this prospectus, there were no shares of our preferred stock issued and outstanding.
Our articles of incorporation, subject to certain limitations, authorize our board of directors from time to time by resolution and without further shareholder action, to provide for the issuance of shares of preferred stock, in one or more series, and to fix the preferences, limitations and relative rights of such shares of preferred stock.
Authorized But Unissued Shares
North Carolina law does not require shareholder approval for any issuance of authorized shares. Authorized but unissued shares may be used for a variety of corporate purposes, including future public or private offerings to raise additional capital or to facilitate corporate acquisitions. One of the effects of the existence of authorized but unissued shares may be to enable the board of directors to issue shares to persons friendly to current management, which issuance could render more difficult or discourage an attempt to obtain control of us by means of a merger, tender offer, proxy contest or otherwise. This would protect the continuity of our management and possibly deprive the shareholders of opportunities to sell their shares of common stock at prices higher than prevailing market prices.
Certain Provisions of Our Articles of Incorporation and Bylaws Having Potential Anti-Takeover Effects
General
The following is a summary of the material provisions of our articles of incorporation and bylaws that address matters of corporate governance and the rights of shareholders. Certain of these provisions may delay or prevent
136
Table of Contents
takeover attempts not first approved by our board of directors (including takeovers which certain shareholders may deem to be in their best interests). These provisions also could delay or frustrate the removal of incumbent directors or the assumption of control by shareholders. All references to the “articles of incorporation” and “bylaws” are to the articles of incorporation and bylaws of the Company in effect at the date of this prospectus.
Removal of Directors; Filling Vacancies
Our articles of incorporation provide that shareholders may remove one or more of the directors with cause which includes: (i) criminal prosecution and conviction during the course of a director’s service for an act of fraud, embezzlement, theft or personal dishonesty; (ii) the prosecution and conviction of any criminal offense involving dishonesty or breach of trust; or (iii) the occurrence of any event resulting in a director being excluded from coverage, or having coverage limited as to the director when compared to other covered directors under any of the fidelity bonds or insurance policies covering the directors, officers or employees. Vacancies occurring in the board of directors may be filled by the shareholders, by a majority of the remaining directors even though such majority constitutes less than a quorum, or by the sole remaining director. A director elected to fill a vacancy shall serve only until the next meeting of shareholders at which directors are elected.
Amendment of Bylaws
Subject to certain restrictions described below, either a majority of the board of directors or our shareholders may amend or repeal the bylaws. A bylaw adopted, amended or repealed by the shareholders may not be readopted, amended or repealed by the board. Generally, our shareholders may adopt, amend or repeal the bylaws in accordance with the North Carolina Business Corporation Act.
Special Meetings of Shareholders
Our bylaws provide that special meetings of shareholders may be called only by our chairman, president or at the request of the board of directors.
Supermajority Vote for Change-in-Control
Unless approved by a majority of the board of directors who are not affiliated with a proposed transaction, approval by holders of at least two-thirds of the outstanding shares of our common stock is required to effect any agreement, plan or arrangement providing for a merger, consolidation, share exchange or any other transaction requiring approval of the shareholders. With approval of the board of directors, the approval by holders of a majority of our voting securities would be required to affect any such transaction.
Certain Provisions of North Carolina Law
We have opted out of the North Carolina Shareholder Protection Act and the North Carolina Control Share Acquisition Act. The Shareholder Protection Act generally requires that, unless certain “fair price” and other conditions are met, the affirmative vote of the holders of 95.0% of the voting shares of a corporation is necessary to adopt or authorize a business combination with any other entity, if that entity is the beneficial owner, directly or indirectly, of more than 20.0% of the voting shares of the company. The Control Share Acquisition Act provides that any person or party who acquires or makes a bona fide offer to acquire “control shares” (defined as a number of shares which, when added to other shares held, gives the holder voting power in the election of directors equal to 20.0%, 33.3% or a majority of all voting power) may only vote those shares if the remaining shareholders of the corporation, by resolution, permit those shares to be voted. If the shareholders of the corporation permit the “control shares” to be accorded voting rights and the holder of the “control shares” has a majority of all voting power for the election of directors, the other shareholders of the corporation have the right to the redemption of their shares at the fair value of the shares at the date prior to the date on which the vote was taken which gave voting rights to the “control shares.”
137
Table of Contents
Certain Provisions of Federal Law
The acquisition of more than 10.0% of our outstanding common stock may, in certain circumstances, be subject to the provisions of the Change in Bank Control Act of 1978. The FDIC has also adopted a regulation pursuant to the Change in Bank Control Act which generally requires persons who at any time intend to acquire control of an FDIC-insured state-chartered non-member bank, either directly or indirectly through an acquisition of control of its holding company, to provide 60 days prior written notice and certain financial and other information to the FDIC. Control for the purpose of this Act exists in situations in which the acquiring party has voting control of at least 25.0% of any class of voting stock or the power to direct the management or policies of the bank or the holding company. However, under FDIC regulations, control is presumed to exist where the acquiring party has voting control of at least 10.0% of any class of voting securities if (a) the bank or holding company has a class of voting securities which is registered under Section 12 of the Exchange Act, or (b) the acquiring party would be the largest holder of a class of voting shares of the bank or the holding company. The statute and underlying regulations authorize the FDIC to disapprove a proposed acquisition on certain specified grounds.
Prior approval of the Federal Reserve Board would be required for any acquisition of control of the company or the bank by any bank holding company under the Bank Holding Company Act. Control for purposes of the Bank Holding Company Act would be based on, among other factors, a 25.0% voting stock test or on the ability of the holding company otherwise to control the election of a majority of our board of directors. As part of such acquisition, the acquiring company (unless already so registered) would be required to register as a bank holding company under the Bank Holding Company Act.
The Exchange Act requires that a purchaser of any class of a corporation’s securities registered under the Exchange Act notify the SEC and such corporation within 10 days after its purchases exceed 5.0% of the outstanding shares of that class of securities. This notice must disclose the background and identity of the purchaser, the source and amount of funds used for the purchase, the number of shares owned and, if the purpose of the transaction is to acquire control of the corporation, any plans to materially alter the corporation’s business or corporate structure. In addition, any tender offer to acquire a corporation’s securities is subject to the limitations and disclosure requirements of the Exchange Act.
Indemnification of Directors and Officers
Insofar as indemnification for liabilities arising under the Securities Act of 1933 may be permitted to our directors, officers and controlling persons under the provisions discussed above or otherwise, we have been advised that, in the opinion of the SEC, such indemnification is against public policy as expressed in the Securities Act and is, therefore, unenforceable.
Common Stock Financing
In August 2014, we completed a common stock financing with Wellington Management, an institutional accredited investor. In the transaction, we issued 7,048,300 split-adjusted shares, in the aggregate, of our voting common stock and non-voting common stock at a purchase price per share of $10.63, for an aggregate purchase price of $74.9 million. As of March 31, 2015, Wellington Management beneficially held approximately 24.6% of our outstanding common stock, of which 2,324,770 shares are voting common stock and 4,723,530 shares are non-voting common stock.
In connection with the common stock financing, we also entered into a Significant Shareholders Agreement with Wellington Management and certain key holders of our common stock. Under this agreement, the parties agreed to vote their shares of common stock in such a manner so as to elect certain individuals or designees to our board of directors, including our Chairman and Chief Executive Officer, James S. Mahan III, our three executive officers who currently serve as members of the board of directors, and a board member designated by Wellington Management. Additionally, the Significant Shareholders Agreement requires that the board of
138
Table of Contents
directors include certain non-management directors. The Significant Shareholders Agreement agreement also provides for tag-along rights for Wellington Management in connection with the sale of shares of our common stock by certain insiders. This agreement will terminate upon the closing of the offering contemplated by this prospectus.
Also in connection with the common stock financing, we entered into a Registration and Other Rights Agreement with the Wellington Management. This agreement provides Wellington Management with demand registration rights, piggyback registration rights, certain information and board observation rights, and rights of participation with respect to future stock offers. With the exception of the demand registration rights and piggyback registration rights afforded under the agreement, such rights terminate upon the closing of the offering contemplated by this prospectus. See “ — Registration Rights” below for more detail on the demand registration rights and piggyback registration rights held by Wellington Management.
Registration Rights
U.S. Treasury
Under certain circumstances, which do not apply to this offering, the U.S. Treasury has the right to require us to register on its behalf our outstanding subordinated debt securities we issued to the U.S. Treasury under the Small Business Lending Fund program. Holders of our outstanding SBLF debt securities have no right to exchange or convert such securities into any other of the Company’s securities.
Wellington Management
Wellington Management controlled holders of shares of our common stock are entitled to the following rights with respect to the registration of such shares for public resale under the Securities Act, pursuant to a Registration and Other Rights agreement by and among us and such stockholders. We refer to the shares owned by Wellington Management controlled stockholders collectively as “registrable securities.”
The registration of registrable securities as a result of the following rights being exercised would enable the holders to trade these shares without restriction under the Securities Act when the applicable registration statement is declared effective. We will be required to pay all expenses, other than underwriting discounts and commissions, related to any registration statement filed pursuant to the exercise of these registration rights.
Demand Registration Rights
If at any time after six months following the effective date of this offering the holders of at least a majority of the registrable securities then outstanding request in writing that we file a registration statement on Form S-1 covering the registration of registrable securities with an anticipated aggregate offering price of at least $5.0 million, we may be required to register such registrable securities. Additionally, if, at any time we are eligible to use a Form S-3 registration statement, the holders of at least a majority of the registrable securities then outstanding request in writing that we file a registration statement on Form S-3 covering the registration of registrable securities with an anticipated aggregate offering price of at least $1.0 million, we may be required to register such registrable securities. Depending on certain conditions set forth in the registration and other rights agreement by and among us and such stockholders, however, we may defer either such registration for up to 60 days. If the holders requesting registration intend to distribute their shares by means of an underwriting, the underwriters of such offering will have the right to limit the number of shares to be underwritten for reasons related to the marketing of the shares.
Piggyback Registration Rights
If at any time we propose to register any of our securities under the Securities Act, the holders of registrable securities will be entitled to notice of the registration and to include all or a portion of their registrable securities in the registration. These piggyback registration rights are subject to specific conditions and limitations set forth
139
Table of Contents
in the registration and other rights agreement by and among us and such stockholders, including the right of the underwriters to limit the number of shares included in any such registration under specific circumstances. We have the right to terminate or withdraw any registration initiated by us prior to the effectiveness of such registration statement whether or not the holders of registrable securities have elected to include their shares in the registration.
The registration rights granted to Wellington Management controlled holders will terminate on the fifth anniversary of this offering.
Transfer Agent and Securities Registrar
The transfer agent and securities registrar for our common stock is Broadridge Corporate Issuer Solutions, Inc., Brentwood, New York.
Exchange Listing
We have received approval to list our common stock on the NASDAQ Global Select Market under the symbol “LOB.”
140
Table of Contents
SHARES ELIGIBLE FOR FUTURE SALE
Prior to this offering, there has been no public market for shares of our common stock. Future sales of substantial amounts of shares of our common stock, including shares issued upon the exercise of outstanding options, in the public market after this offering, or the possibility of these sales occurring, could adversely affect the prevailing market price for our common stock or impair our ability to raise equity capital.
Upon completion of this offering, we expect to have 32,654,860 shares of common stock outstanding (assuming the underwriters do not exercise their option to purchase additional shares). Of these shares, the 4,000,000 shares of our common stock sold by us in this offering will be freely tradable without further restriction or registration under the Securities Act, except that any shares purchased by our “affiliates” may generally only be resold in compliance with Rule 144 under the Securities Act, which is described below. The remaining 28,654,860 outstanding shares, will be deemed to be “restricted securities” as that term is defined in Rule 144. Restricted securities may be resold in the U.S. only if they are registered for resale under the Securities Act or an exemption from registration is available.
Lock-Up Agreements
Our executive officers and directors, certain executive officers and directors of Live Oak Bank and certain other persons, who will own in the aggregate approximately 23,341,240 shares of our common stock after this offering (assuming they do not purchase any shares in this offering), have entered into lock-up agreements under which they have generally agreed not to sell or otherwise transfer their shares for a period of 180 days after the closing of this offering. For additional information, see “Underwriting — Lock-Up Agreements.” As a result of these contractual restrictions, shares of our common stock subject to lock-up agreements will not be eligible for sale until these agreements expire or the underwriters waive or release the shares of our common stock from these restrictions.
Following the lock-up period, all of the shares of our common stock that are restricted securities or are held by our affiliates as of the date of this prospectus will be eligible for resale in the U.S. only if they are registered for resale under the Securities Act or an exemption from registration, such as Rule 144, is available.
Rule 144
In general, under Rule 144 as currently in effect, beginning 90 days after the effective date of the registration statement of which this prospectus is a part, any person who is not an affiliate of ours and has held their shares for at least six months, including the holding period of any prior owner other than one of our affiliates, may sell their shares without regard to volume limitations. Sales of our common stock by any such person would be subject to the availability of current public information about us if the shares to be sold were beneficially owned by such person for less than one year. In addition, under Rule 144, any person who is not an affiliate of ours and has held their shares for at least one year, including the holding period of any prior owner other than one of our affiliates, would be entitled to sell an unlimited number of shares immediately upon the closing of this offering without regard to whether current public information about us is available. Beginning 90 days after the effective date of the registration statement of which this prospectus is a part, a person who is an affiliate of ours and who has beneficially owned restricted securities for at least six months, including the holding period of any prior owner other than one of our affiliates, is entitled to sell a number of restricted shares within any three-month period a number of shares that does not exceed the greater of:
| • | 1% of the number of shares of our common stock then-outstanding, which will equal approximately 326,548 shares immediately after this offering (or 332,548 shares if the underwriters exercise their option to purchase additional shares of our common stock in full); and |
| • | the average weekly trading volume in our common stock during the four calendar weeks preceding the date of filing of a Notice of Proposed Sale of Securities pursuant to Rule 144 with respect to the sale. |
141
Table of Contents
Sales under Rule 144 by our affiliates are also subject to manner of sale provisions and notice requirements and the availability of current public information about us.
Subject to the 180-day lock-up period described above, approximately 5,313,620 shares of our common stock will be eligible for sale under Rule 144 subject to limitations on sales by affiliates. We cannot estimate the number of shares of our common stock that our existing shareowners will elect to sell under Rule 144.
Rule 701
Rule 701 generally allows a shareholder who purchased shares of our common stock pursuant to a written compensatory plan or contract and who is not deemed to have been an affiliate of our company during the immediately preceding 90 days to sell these shares in reliance upon Rule 144 but without being required to comply with the public information, holding period, volume limitation, or notice provisions of Rule 144. Rule 701 also permits affiliates of our company to sell their Rule 701 shares under Rule 144 without complying with the holding period requirements of Rule 144. However, all holders of Rule 701 shares are required to wait until 90 days after the date of this prospectus before selling such shares pursuant to Rule 701.
Form S-8 Registration Statement
We intend to file with the SEC a registration statement on Form S-8 covering the shares of common stock reserved for issuance upon the exercise of stock options under our stock incentive plans and Employee Stock Purchase Plan. That registration statement is expected to be filed and become effective as soon as practicable after the closing of this offering. Upon effectiveness of this S-8 registration statement, the shares of common stock covered by that registration statement will be eligible for sale in the public market, subject to the lock-up agreements and Rule 144 restrictions described above.
Registration Rights
For a description of registration rights held by third parties with respect to certain of our outstanding securities, see “Description of Our Securities — Registration Rights.”
142
Table of Contents
Bank holding companies and state commercial banks are extensively regulated under both federal and state law. The following is a brief summary of certain statutes and rules and regulations that affect or will affect the Company and Live Oak Bank. This summary contains what management believes to be the material information related to the supervision and regulation of the Company and Live Oak Bank but is not intended to be an exhaustive description of the statutes or regulations applicable to their respective businesses. Supervision, regulation and examination of the Company and Live Oak Bank by the regulatory agencies are intended primarily for the protection of depositors, the Deposit Insurance Fund (“DIF”) of the Federal Deposit Insurance Corporation (“FDIC”) and the financial system rather than shareholders of the Company and Live Oak Bank. We cannot predict whether or in what form any proposed statute or regulation will be adopted or the extent to which the business of the Company and Live Oak Bank may be affected by a statute or regulation. Changes in such laws and regulations may have a material effect on our business and prospects.
Federal Bank Holding Company Regulation and Structure
As a registered bank holding company, we are subject to regulation under the Bank Holding Company Act, or BHCA, and to the supervision, examination and reporting requirements of the Board of Governors of the Federal Reserve System (the “Federal Reserve”). Live Oak Bank has a North Carolina state charter and is subject to regulation, supervision and examination by the FDIC and the North Carolina Commissioner of Banks, or NCCOB.
The BHCA requires every bank holding company to obtain the prior approval of the Federal Reserve before:
| • | it may acquire direct or indirect ownership or control of any voting shares of any bank if, after the acquisition, the bank holding company will directly or indirectly own or control more than 5% of the voting shares of the bank; |
| • | it or any of its subsidiaries, other than a bank, may acquire all or substantially all of the assets of any bank; or |
| • | it may merge or consolidate with any other bank holding company. |
The BHCA further provides that the Federal Reserve may not approve any transaction that would result in a monopoly or that would substantially lessen competition in the banking business, unless the public interest in meeting the needs of the communities to be served outweighs the anti-competitive effects. The Federal Reserve is also required to consider the financial and managerial resources and future prospects of the bank holding companies and banks involved and the convenience and needs of the communities to be served. Consideration of financial resources generally focuses on capital adequacy, and consideration of convenience and needs issues focuses, in part, on the performance under the Community Reinvestment Act of 1977, both of which are discussed elsewhere in more detail.
Subject to various exceptions, the BHCA and the Change in Bank Control Act, together with related regulations, require Federal Reserve approval prior to any person or company acquiring “control” of a bank holding company. Control is conclusively presumed to exist if an individual or company acquires 25% or more of any class of voting securities of a bank holding company. Control is also presumed to exist, although rebuttable, if a person or company acquires 10% or more, but less than 25%, of any class of voting securities and either:
| • | the bank holding company has registered securities under Section 12 of the Securities Exchange Act of 1934, as amended, or the Exchange Act; or |
| • | no other person owns a greater percentage of that class of voting securities immediately after the transaction. |
143
Table of Contents
Our common stock will be registered under Section 12 of the Exchange Act following the conclusion of this offering. The regulations provide a procedure for challenging rebuttable presumptions of control.
The BHCA generally prohibits a bank holding company from retaining direct or indirect ownership or control of any voting shares of any company which is not a bank or bank holding company or engaging in activities other than banking, managing or controlling banks or other permissible subsidiaries and acquiring or retaining direct or indirect control of any company engaged in any activities other than activities closely related to banking or managing or controlling banks. In determining whether a particular activity is permissible, the Federal Reserve considers whether performing the activity can be expected to produce benefits to the public that outweigh possible adverse effects, such as undue concentration of resources, decreased or unfair competition, conflicts of interest or unsound banking practices. The Federal Reserve has the power to order a bank holding company or its subsidiaries to terminate any activity or control of any subsidiary when the continuation of the activity or control constitutes a serious risk to the financial safety, soundness or stability of any bank subsidiary of that bank holding company.
Under the BHCA, a bank holding company may file an election with the Federal Reserve to be treated as a financial holding company and engage in an expanded list of financial activities. The election must be accompanied by a certification that all of the company’s insured depository institution subsidiaries are “well capitalized” and “well managed.” Additionally, the Community Reinvestment Act of 1977 rating of each subsidiary bank must be satisfactory or better. If, after becoming a financial holding company and undertaking activities not permissible for a bank holding company, the company fails to continue to meet any of the prerequisites for financial holding company status, the company must enter into an agreement with the Federal Reserve to comply with all applicable capital and management requirements. If the company does not return to compliance within 180 days, the Federal Reserve may order the company to divest its subsidiary banks or the company may discontinue or divest investments in companies engaged in activities permissible only for a bank holding company that has elected to be treated as a financial holding company. We have not filed an election to become a financial holding company.
Under Federal Reserve policy and as has been recently codified by the Dodd-Frank Act, the Company is expected to act as a source of financial strength for Live Oak Bank and to commit resources to support Live Oak Bank. This support may be required at times when we might not be inclined to provide it or it might not be in our best interests or the best interests of our shareholders. In addition, any capital loans made by the Company to Live Oak Bank will be repaid only after Live Oak Bank’s deposits and various other obligations are repaid in full.
Live Oak Bank is also subject to numerous state and federal statutes and regulations that affect its business, activities and operations and is supervised and examined by state and federal bank regulatory agencies. The FDIC and the NCCOB regularly examine the operations of Live Oak Bank and are given the authority to approve or disapprove mergers, consolidations, the establishment of branches and similar corporate actions. These agencies also have the power to prevent the continuance or development of unsafe or unsound banking practices or other violations of law.
Bank Merger Act
Section 18(c) of the Federal Deposit Insurance Act, popularly known as the “Bank Merger Act,” requires the prior written approval of appropriate federal bank regulatory agencies before any bank may (i) merge or consolidate with, (ii) purchase or otherwise acquire the assets of, or (iii) assume the deposit liabilities of, another bank if the resulting institution is to be a state nonmember bank.
The Bank Merger Act prohibits the applicable federal bank regulatory agency from approving any proposed merger transaction that would result in a monopoly, or would further a combination or conspiracy to monopolize or to attempt to monopolize the business of banking in any part of the United States. Similarly, the Bank Merger
144
Table of Contents
Act prohibits the applicable federal bank regulatory agency from approving a proposed merger transaction whose effect in any section of the country may be substantially to lessen competition, or to tend to create a monopoly, or which in any other manner would be in restraint of trade. An exception may be made in the case of a merger transaction whose effect would be to substantially lessen competition, tend to create a monopoly, or otherwise restrain trade, if the applicable federal bank regulatory agency finds that the anticompetitive effects of the proposed transaction are clearly outweighed in the public interest by the probable effect of the transaction in meeting the convenience and needs of the community to be served.
In every proposed merger transaction, the applicable federal bank regulatory agency must also consider the financial and managerial resources and future prospects of the existing and proposed institutions, the convenience and needs of the community to be served, and the effectiveness of each insured depository institution involved in the proposed merger transaction in combating money-laundering activities, including in overseas branches.
State Law
Live Oak Bank is subject to extensive supervision and regulation by the NCCOB. The NCCOB oversees state laws that set specific requirements for bank capital and that regulate deposits in, and loans and investments by, banks, including the amounts, types, and in some cases, rates. The NCCOB supervises and performs periodic examinations of North Carolina-chartered banks to assure compliance with state banking statutes and regulations, and banks are required to make regular reports to the NCCOB describing in detail their resources, assets, liabilities, and financial condition. Among other things, the NCCOB regulates mergers and consolidations of state-chartered banks, capital requirements for banks, loans to officers and directors, record keeping, types and amounts of loans and investments, and the establishment of branches.
The NCCOB has extensive enforcement authority over North Carolina banks. Such authority includes the ability to issue cease and desist orders and to seek civil money penalties. The NCCOB may also take possession of a North Carolina bank in various circumstances, including for a violation of its charter or of applicable laws, operating in an unsafe and unsound manner, or as a result of an impairment of its capital, and may appoint a receiver.
On October 1, 2012, the North Carolina Banking Law Modernization Act became effective and many of the state banking laws to which Live Oak Bank is subject were amended. Under the revised banking laws, the NCCOB continues to enforce specific requirements for bank capital, the payment of dividends, loans to officers and directors, record keeping, and types and amounts of loans and investments made by commercial banks.
The Company is also required to maintain registration as a bank holding company with the NCCOB. Subject to certain exceptions, the Company may not acquire control over another bank or bank holding company or consummate a merger or other combination transaction with another company without the prior approval of the NCCOB. The NCCOB also has authority to assert civil money penalties against a holding company if the NCCOB determines such holding company to be in violation of any banking laws and the holding company fails to comply with an NCCOB order to cease and desist from such violations of law.
Payment of Dividends and Other Restrictions
The Company is a legal entity separate and distinct from the Bank. While there are various legal and regulatory limitations under federal and state law on the extent to which banks can pay dividends or otherwise supply funds to holding companies, the principal source of cash revenues for the Company is dividends from the Bank. The relevant federal and state regulatory agencies have authority to prohibit a state bank or bank holding company, which would include the Bank and the Company, from engaging in what, in the opinion of such regulatory body, constitutes an unsafe or unsound practice in conducting its business. The payment of dividends could, depending upon the financial condition of a bank, be deemed to constitute an unsafe or unsound practice in conducting its business.
145
Table of Contents
North Carolina commercial banks, such as Live Oak Bank, are subject to legal limitations on the amounts of dividends they are permitted to pay. Specifically, an insured depository institution, such as Live Oak Bank, is prohibited from making capital distributions, including the payment of dividends, if, after making such distribution, the institution would become “undercapitalized” (as such term is defined in the applicable law and regulations).
The Federal Reserve has issued a policy statement on the payment of cash dividends by bank holding companies, which expresses the Federal Reserve’s view that a bank holding company should pay cash dividends only to the extent that the holding company’s net income for the past four quarters is sufficient to cover both the cash dividends and a rate of earning retention that is consistent with the holding company’s capital needs, asset quality and overall financial condition. The Federal Reserve also indicated that it would be inappropriate for a holding company experiencing serious financial problems to borrow funds to pay dividends. Furthermore, under the prompt corrective action regulations adopted by the Federal Reserve, the Federal Reserve may prohibit a bank holding company from paying any dividends if any of the holding company’s bank subsidiaries are classified as undercapitalized.
A bank holding company is required to give the Federal Reserve prior written notice of any purchase or redemption of its outstanding equity securities if the gross consideration for the purchase or redemption, when combined with the net consideration paid for all such purchases or redemptions during the preceding 12 months, is equal to 10% or more of its consolidated net worth. The Federal Reserve may disapprove such a purchase or redemption if it determines that the proposal would constitute an unsafe or unsound practice or would violate any law, regulation, Federal Reserve order or any condition imposed by, or written agreement with, the Federal Reserve.
Capital Adequacy
The Company must comply with the Federal Reserve’s established capital adequacy standards, and Live Oak Bank is required to comply with the capital adequacy standards established by the FDIC. The Federal Reserve has promulgated two basic measures of capital adequacy for bank holding companies: a risk-based measure and a leverage measure. A bank holding company must satisfy all applicable capital standards to be considered in compliance.
The risk-based capital standards are designed to make regulatory capital requirements more sensitive to differences in risk profile among banks and bank holding companies, account for off-balance-sheet exposure and minimize disincentives for holding liquid assets.
Assets and off-balance-sheet items are assigned to broad risk categories, each with appropriate weights. The resulting capital ratios represent capital as a percentage of total risk-weighted assets and off-balance-sheet items. Under revised capital standards that apply to us and the Bank as of January 1, 2015, the minimum risk-based capital ratios are a common equity Tier 1 capital to risk-weighted assets ratio of 4.5%, a Tier 1 capital to risk-weighted assets ratio of 6%, and a total capital to risk-weighted assets ratio of 8%. In addition, to avoid restrictions on capital distributions and discretionary bonus payments, we and the Bank are required to meet a capital conservation buffer of common equity Tier 1 capital in addition to the minimum common equity Tier 1 capital ratio. The capital conservation buffer will be phased in beginning January 1, 2016 until January 1, 2019, at which point it will be set at 2.5% common equity Tier 1 capital to risk-weighted assets, which sits “on top” of the 4.5% minimum common equity Tier 1 to risk-weighted assets ratio. Common equity Tier 1 capital is predominantly comprised of retained earnings and common stock instruments (that meet strict delineated criteria), net of treasury stock, and after making necessary capital deductions and adjustments. Tier 1 capital is comprised of common equity Tier 1 capital plus Additional Tier 1 capital, which consists of noncumulative perpetual preferred stock and similar instruments meeting specified eligibility criteria and “TARP” preferred stock and other instruments issued under the Emergency Economic Stabilization Act of 2008. Total capital is comprised of Tier 1 capital plus Tier 2 capital, which consists of subordinated debt with a minimum original maturity of at least five years and a limited amount of loan loss reserves.
146
Table of Contents
At March 31, 2015, Live Oak Bank’s risk-based capital ratios, as calculated under the revised capital standards applicable as of January 1, 2015, were 12.36% common equity Tier 1 capital to risk weighted assets, 12.36% Tier 1 capital to risk weighted assets, and 13.39% total capital to risk weighted assets.
In addition, the Federal Reserve has established minimum leverage ratio guidelines for bank holding companies. These guidelines provide for a minimum ratio of Tier 1 capital to average total on-balance sheet assets, less goodwill and certain other intangible assets, of 4% for bank holding companies. The Company’s ratio at March 31, 2015 was 8.66% compared to 13.38% at December 31, 2014. The guidelines also provide that bank holding companies experiencing internal growth or making acquisitions will be expected to maintain strong capital positions substantially above the minimum supervisory levels without significant reliance on intangible assets. Furthermore, the Federal Reserve has indicated that it will consider a “tangible Tier 1 Capital leverage ratio” and other indications of capital strength in evaluating proposals for expansion or new activities.
Failure to meet capital guidelines could subject a bank to a variety of enforcement remedies, including issuance of a capital directive, the termination of deposit insurance by the FDIC, a prohibition on taking brokered deposits and certain other restrictions on its business. As described below, the FDIC can impose substantial additional restrictions upon FDIC-insured depository institutions that fail to meet applicable capital requirements.
The Federal Deposit Insurance Act, or FDI Act, requires the federal regulatory agencies to take “prompt corrective action” if a depository institution does not meet minimum capital requirements. The FDI Act establishes five capital tiers: “well capitalized,” “adequately capitalized,” “undercapitalized,” “significantly undercapitalized” and “critically undercapitalized.” A depository institution’s capital tier will depend upon how its capital levels compare to various relevant capital measures and certain other factors, as established by regulation.
The federal bank regulatory agencies have adopted regulations establishing relevant capital measures and relevant capital levels applicable to FDIC-insured banks. The relevant capital measures are the Total Risk-Based Capital ratio, Tier 1 Risk-Based Capital ratio, Common Equity Tier 1 Capital ratio and the leverage ratio. As of January 1, 2015, an FDIC-insured bank was:
| • | “well capitalized” if it has a Total Risk-Based Capital ratio of 10% or greater, a Tier 1 Risk-Based Capital ratio of 8% or greater, a Common Equity Tier 1 Capital ratio of 6.5% or greater and a leverage ratio of 5% or greater and is not subject to any order or written directive by the appropriate regulatory authority to meet and maintain a specific capital level for any capital measure; |
| • | “adequately capitalized” if it has a Total Risk-Based Capital ratio of 8% or greater, a Tier 1 Risk-Based Capital ratio of 6% or greater, a Common Equity Tier 1 Capital ratio of 4.5% or greater and a leverage ratio of 4% or greater and is not “well capitalized”; |
| • | “undercapitalized” if it has a Total Risk-Based Capital ratio of less than 8%, a Tier 1 Risk-Based Capital ratio of less than 6%, a Common Equity Tier 1 Capital ratio of less than 4% or a leverage ratio of less than 4%; |
| • | “significantly undercapitalized” if it has a Total Risk-Based Capital ratio of less than 6%, a Tier 1 Risk-Based Capital ratio of less than 4%, a Common Equity Tier 1 Capital ratio of less than 3% or a leverage ratio of less than 3%; and |
| • | “critically undercapitalized” if its tangible equity is equal to or less than 2% of average quarterly tangible assets. |
An institution may be downgraded to, or deemed to be in, a capital category that is lower than is indicated by its capital ratios if it is determined to be in an unsafe or unsound condition or if it receives an unsatisfactory examination rating with respect to certain matters. As of March 31, 2015, Live Oak Bank had capital levels that qualify as “well capitalized” under the regulations applicable as of January 1, 2015.
The FDI Act generally prohibits an FDIC-insured bank from making a capital distribution (including payment of a dividend) or paying any management fee to its holding company if the bank is or would thereafter be
147
Table of Contents
“undercapitalized.” “Undercapitalized” banks are subject to growth limitations and are required to submit a capital restoration plan. The federal regulators may not accept a capital plan without determining, among other things, that the plan is based on realistic assumptions and is likely to succeed in restoring the bank’s capital. In addition, for a capital restoration plan to be acceptable, the bank’s parent holding company must guarantee that the institution will comply with such capital restoration plan until the institution has been adequately capitalized on average during each of four consecutive calendar quarters. The aggregate liability of the parent holding company under such guaranty is limited to the lesser of: (i) an amount equal to 5% of the bank’s total assets at the time it became “undercapitalized”; and (ii) the amount which is necessary (or would have been necessary) to bring the institution into compliance with all capital standards applicable with respect to such institution as of the time it fails to comply with the plan. If a bank fails to submit an acceptable plan, it is treated as if it is “significantly undercapitalized.”
“Significantly undercapitalized” insured banks may be subject to a number of requirements and restrictions, including orders to sell sufficient voting stock to become “adequately capitalized,” requirements to reduce total assets and the cessation of receipt of deposits from correspondent banks. “Critically undercapitalized” institutions are subject to the appointment of a receiver or conservator. A bank that is not “well capitalized” is also subject to certain limitations relating to brokered deposits.
The regulatory capital framework under which the Company and Live Oak Bank operate has recently changed in significant respects as a result of the Dodd-Frank Act, which was enacted in July 2010, and other regulations, including the separate regulatory capital requirements put forth by the Basel Committee on Banking Supervision, commonly known “Basel III.”
In July 2013, the Federal Reserve, FDIC and Office of the Comptroller of the Currency approved final rules that establish an integrated regulatory capital framework that addresses shortcomings in certain capital requirements. The rules implement in the United States the Basel III regulatory capital reforms from the Basel Committee on Banking Supervision and certain changes required by the Dodd-Frank Act. The rules began to apply to us and the Bank beginning January 1, 2015.
The major provisions of the new rule applicable to us and the Bank are:
| • | The new rules implement higher minimum capital requirements described above in this section, including a new common equity Tier 1 capital requirement and capital conservation buffer, and establish criteria that instruments must meet in order to be considered common equity Tier 1 capital, additional Tier 1 capital, or Tier 2 capital. Among the most important changes are stricter eligibility criteria for regulatory capital instruments that would disallow the inclusion of instruments such as trust preferred securities in Tier 1 capital going forward, and new constraints on the inclusion of minority interests, mortgage-servicing assets (MSAs), deferred tax assets (DTAs), and certain investments in the capital of unconsolidated financial institutions. These enhancements both improve the quality and increase the quantity of capital required to be held by banking organizations compared to the previous capital rules, better equipping the U.S. banking system to deal with adverse economic conditions. |
| • | The new rules also affect the inclusion of mortgage servicing assets, or MSAs, as an element of capital. Specifically, MSAs are limited to 10% of a bank’s common equity Tier 1 capital and the combined balance of MSAs, deferred tax assets, and investments in the common stock of unconsolidated financial institutions is limited to 15% of a bank’s common equity Tier 1 capital. These combined assets must be deducted from common equity to the extent that they exceed the 15% threshold. Any portion of a bank’s MSAs that are not deducted from the calculation of common equity Tier 1 will be subject to a 100% risk weight that will increase to 250% in 2018. |
| • | The new rules also increase the risk weights for past-due loans, certain commercial real estate loans, and some equity exposures, and make selected other changes in risk weights and credit conversion factors. |
Compliance by the Company and Live Oak Bank with these new capital requirements will likely affect their respective operations.
148
Table of Contents
The Volcker Rule
Under provisions of the Dodd-Frank Act referred to as the “Volcker Rule,” certain limitations are placed on the ability of insured depository institutions and their affiliates to engage in sponsoring, investing in and transacting with certain investment funds, including hedge funds and private equity funds. The Volcker Rule also places restrictions on proprietary trading, which could impact certain hedging activities. The Volcker Rule becomes fully effective in July 2015, and banking entities currently have until July 2016 to divest certain legacy investments in covered funds. The Volcker Rule is not expected to have a material impact on our operations.
Acquisitions
We must comply with numerous laws related to any potential acquisition activity. Under the BHCA, a bank holding company may not directly or indirectly acquire ownership or control of more than 5% of the voting shares or substantially all of the assets of any bank or merge or consolidate with another bank holding company without the prior approval of the Federal Reserve. The acquisition of non-banking companies is also regulated by the Federal Reserve. Current federal law authorizes interstate acquisitions of banks and bank holding companies without geographic limitation. Furthermore, a bank headquartered in one state is authorized to merge with a bank headquartered in another state, as long as neither of the states has opted out of such interstate merger authority prior to such date, and subject to any state requirement that the target bank shall have been in existence and operating for a minimum period of time, not to exceed five years, and to certain deposit market-share limitations. After a bank has established branches in a state through an interstate merger transaction, the bank may establish and acquire additional branches at any location in the state where a bank headquartered in that state could have established or acquired branches under applicable federal or state law. Additionally, since passage of the Dodd-Frank Act, a bank is now permitted to open a de novo branch in any state if that state would permit a bank organized in that state to open a branch.
Restrictions on Affiliate Transactions
Sections 23A and 23B of the Federal Reserve Act establish parameters for a bank to conduct “covered transactions” with its affiliates, with the objective of limiting risk to the insured bank. Generally, Sections 23A and 23B (i) limit the extent to which the bank or its subsidiaries may engage in “covered transactions” with any one affiliate to an amount equal to 10% of such bank’s capital stock and surplus, and limit the aggregate of all such transactions with all affiliates to an amount equal to 20% of such capital stock and surplus and (ii) require that all such transactions be on terms substantially the same, or at least as favorable, to the bank or subsidiary as those that would be provided to a non-affiliate. The term “covered transaction” includes the making of loans to the affiliate, purchase of assets from the affiliate, issuance of a guaranty on behalf of the affiliate and several other types of transactions.
The Dodd-Frank Act imposes new restrictions on transactions between affiliates by amending these two sections of the Federal Reserve Act. Under the Dodd-Frank Act, restrictions on transactions with affiliates are enhanced by (i) including among “covered transactions” transactions between bank and affiliate-advised investment funds; (ii) including among “covered transactions” transactions between a bank and an affiliate with respect to securities repurchase agreements and derivatives transactions; (iii) adopting stricter collateral rules; and (iv) imposing tighter restrictions on transactions between banks and their financial subsidiaries.
FDIC Insurance Assessments
The assessment rate paid by each DIF member institution is based on its relative risks of default as measured by regulatory capital ratios and other factors. Specifically, the assessment rate is based on the institution’s capitalization risk category and supervisory subgroup category. An institution’s capitalization risk category is based on the FDIC’s determination of whether the institution is well capitalized, adequately capitalized or less than adequately capitalized. Live Oak Bank’s insurance assessments during 2014 and 2013 were $251 thousand
149
Table of Contents
and $263 thousand, respectively. Because of the growing number of bank failures and costs to the DIF, the FDIC required a special assessment during 2009. An institution’s supervisory subgroup category is based on the FDIC’s assessment of the financial condition of the institution and the probability that FDIC intervention or other corrective action will be required. The FDIC may terminate insurance of deposits upon a finding that an institution has engaged in unsafe and unsound practices, is in an unsafe or unsound condition to continue operations, or has violated any applicable law, regulation, rule, order or condition imposed by the FDIC.
The Dodd-Frank Act expands the base for FDIC insurance assessments, requiring that assessments be based on the average consolidated total assets less tangible equity capital of a financial institution. On February 7, 2011, the FDIC approved a final rule to implement the foregoing provision of the Dodd-Frank Act. Among other things, the final rule revises the assessment rate schedule to provide initial base assessment rates ranging from 5 to 35 basis points, subject to adjustments which could increase or decrease the total base assessment rates. The FDIC has three possible adjustments to an institution’s initial base assessment rate: (1) a decrease of up to five basis points (or 50% of the initial base assessment rate) for long-term unsecured debt, including senior unsecured debt (other than debt guaranteed under the Temporary Liquidity Guarantee Program) and subordinated debt; (2) an increase for holding long-term unsecured or subordinated debt issued by other insured depository institutions known as the Depository Institution Debt Adjustment; and (3) for institutions not well rated and well capitalized, an increase not to exceed 10 basis points for brokered deposits in excess of 10 percent of domestic deposits.
The law also gives the FDIC enhanced discretion to set assessment rate levels.
The FDIC also collects a deposit-based assessment from insured financial institutions on behalf of the Financing Corporation, or the FICO. The funds from these assessments are used to service debt issued by FICO in its capacity as a financial vehicle for the Federal Savings & Loan Insurance Corporation. The FICO assessment rate is set quarterly and in 2014 ranged from .155 basis points in the first quarter to .150 basis points in the fourth quarter per $100 of assessable deposits. These assessments will continue until the debt matures in 2017 through 2019.
Community Reinvestment Act
The Community Reinvestment Act requires federal bank regulatory agencies to encourage financial institutions to meet the credit needs of low and moderate-income borrowers in their local communities. An institution’s size and business strategy determines the type of examination that it will receive. Large, retail-oriented institutions are examined using a performance-based lending, investment and service test. Small institutions are examined using a streamlined approach. All institutions may opt to be evaluated under a strategic plan formulated with community input and pre-approved by the bank regulatory agency.
The Community Reinvestment Act regulations provide for certain disclosure obligations. Each institution must post a notice advising the public of its right to comment to the institution and its regulator on the institution’s Community Reinvestment Act performance and to review the institution’s Community Reinvestment Act public file. Each lending institution must maintain for public inspection a file that includes a listing of branch locations and services, a summary of lending activity, a map of its communities and any written comments from the public on its performance in meeting community credit needs. The Community Reinvestment Act requires public disclosure of the regulators’ written Community Reinvestment Act evaluations of financial institutions. This promotes enforcement of Community Reinvestment Act requirements by providing the public with the status of a particular institution’s community reinvestment record.
The Gramm-Leach-Bliley Act made various changes to the Community Reinvestment Act. Among other changes, Community Reinvestment Act agreements with private parties must be disclosed and annual Community Reinvestment Act reports relating to such agreements must be made available to a bank’s primary federal regulator. A bank holding company will not be permitted to become a financial holding company and no
150
Table of Contents
new activities authorized under the Gramm-Leach-Bliley Act may be commenced by a holding company or by a bank financial subsidiary if any of its bank subsidiaries received less than a satisfactory Community Reinvestment Act rating in its latest Community Reinvestment Act examination. Live Oak Bank operates under an approved CRA strategic plan and received an “Outstanding” rating in its last CRA examination, which was conducted as of April 15, 2013.
Additional Legislative and Regulatory Matters
The Uniting and Strengthening America by Providing Appropriate Tools Required to Intercept and Obstruct Terrorism Act of 2001, or the USA PATRIOT Act, requires each financial institution: (i) to establish an anti-money laundering program; (ii) to establish due diligence policies, procedures and controls with respect to its private banking accounts involving foreign individuals and certain foreign banks; and (iii) to avoid establishing, maintaining, administering or managing correspondent accounts in the United States for, or on behalf of, foreign banks that do not have a physical presence in any country. The USA PATRIOT Act also requires the Secretary of the Treasury to prescribe by regulation minimum standards that financial institutions must follow to verify the identity of customers, both foreign and domestic, when a customer opens an account. In addition, the USA PATRIOT Act contains a provision encouraging cooperation among financial institutions, regulatory authorities and law enforcement authorities with respect to individuals, entities and organizations engaged in, or reasonably suspected of engaging in, terrorist acts or money laundering activities.
Sarbanes-Oxley mandates for public companies, such as the Company following this offering, a variety of reforms intended to address corporate and accounting fraud and provides for the establishment of the PCAOB, which enforces auditing, quality control and independence standards for firms that audit SEC-reporting companies. Sarbanes-Oxley imposes higher standards for auditor independence and restricts the provision of consulting services by auditing firms to companies they audit and requires that certain audit partners be rotated periodically. It also requires chief executive officers and chief financial officers, or their equivalents, to certify the accuracy of periodic reports filed with the SEC, subject to civil and criminal penalties if they knowingly or willfully violate this certification requirement, and increases the oversight and authority of audit committees of publicly traded companies.
Fiscal and Monetary Policy
Banking is a business which depends on interest rate differentials for success. In general, the difference between the interest paid by a bank on its deposits and its other borrowings, and the interest received by a bank on its loans and securities holdings, constitutes a significant portion of a bank’s earnings. Thus, our earnings and growth will be subject to the influence of economic conditions generally, both domestic and foreign, and also to the monetary and fiscal policies of the United States and its agencies, particularly the Federal Reserve. The Federal Reserve regulates the supply of money through various means, including open market dealings in United States government securities, the discount rate at which banks may borrow from the Federal Reserve and the reserve requirements on deposits. The nature and timing of any changes in such policies and their effect on our business and results of operations cannot be predicted.
Current and future legislation and the policies established by federal and state regulatory authorities will affect our future operations. Banking legislation and regulations may limit our growth and the return to our investors by restricting certain of our activities.
In addition, capital requirements could be changed and have the effect of restricting the activities of the Company or requiring additional capital to be maintained. We cannot predict with certainty what changes, if any, will be made to existing federal and state legislation and regulations or the effect that such changes may have on our business and results of operations.
151
Table of Contents
Real Estate Lending Evaluations
The federal regulators have adopted uniform standards for evaluations of loans secured by real estate or made to finance improvements to real estate. Banks are required to establish and maintain written internal real estate lending policies consistent with safe and sound banking practices and appropriate to the size of the institution and the nature and scope of its operations. The regulations establish loan to value ratio limitations on real estate loans. Live Oak Bank’s respective loan policies establish limits on loan to value ratios that are equal to or less than those established in such regulations.
Commercial Real Estate Concentrations
Lending operations of commercial banks may be subject to enhanced scrutiny by federal banking regulators based on a bank’s concentration of commercial real estate, or CRE, loans. On December 6, 2006, the federal banking regulators issued final guidance to remind financial institutions of the risk posed by commercial real estate, or CRE, lending concentrations. CRE loans generally include land development, construction loans, and loans secured by multifamily property, and nonfarm, nonresidential real property where the primary source of repayment is derived from rental income associated with the property. The guidance prescribes the following guidelines for bank examiners to help identify institutions that are potentially exposed to significant CRE risk and may warrant greater supervisory scrutiny:
| • | total reported loans for construction, land development and other land, or C&D, represent 100% or more of the institution’s total capital; or |
| • | total CRE loans represent 300% or more of the institution’s total capital, and the outstanding balance of the institution’s CRE loan portfolio has increased over 50% or more during the prior 36 months. |
As of March 31, 2015, our C&D concentration as a percentage of bank capital totaled 234.07% and our CRE concentration, net of owner-occupied loans, as a percentage of capital totaled 28.82%.
Limitations on Incentive Compensation
In October 2009, the Federal Reserve issued proposed guidance designed to help ensure that incentive compensation policies at banking organizations do not encourage excessive risk-taking or undermine the safety and soundness of the organization. In connection with the proposed guidance, the Federal Reserve announced that it would review incentive compensation arrangements of bank holding companies such as the Company as part of the regular, risk-focused supervisory process.
In June 2010, the Federal Reserve issued the incentive compensation guidance in final form and was joined by the FDIC, and the Office of the Comptroller of the Currency. The final guidance, which covers all employees that have the ability to materially affect the risk profile of an organization, either individually or as part of a group, is based upon the key principles that a banking organization’s incentive compensation arrangements should (i) provide employees incentives that appropriately balance risk and reward and, thus, do not encourage risk-taking beyond the organization’s ability to effectively identify and manage risks, (ii) be compatible with effective internal controls and risk management, and (iii) be supported by strong corporate governance, including active and effective oversight by the organization’s board of directors. Any deficiencies in compensation practices that are identified may be incorporated into the organization’s supervisory ratings, which can affect its ability to make acquisitions or perform other actions. The guidance provides that enforcement actions may be taken against a banking organization if its incentive compensation arrangements or related risk-management control or governance processes pose a risk to the organization’s safety and soundness and the organization is not taking prompt and effective measures to correct the deficiencies.
152
Table of Contents
Economic Environment
The policies of regulatory authorities, including the monetary policy of the Federal Reserve, have a significant effect on the operating results of bank holding companies and their subsidiaries. Among the means available to the Federal Reserve to affect the money supply are open market operations in U.S. government securities, changes in the discount rate on member bank borrowings and changes in reserve requirements against member bank deposits. These means are used in varying combinations to influence overall growth and distribution of bank loans, investments and deposits, and their use may affect interest rates charged on loans or paid on deposits. The Federal Reserve’s monetary policies have materially affected the operating results of commercial banks in the past and are expected to continue to do so in the future. The nature of future monetary policies and the effect of these policies on our business and earnings cannot be predicted.
Evolving Legislation and Regulatory Action
In 2009, many emergency government programs enacted in 2008 in response to the financial crisis and the recession slowed or wound down, and global regulatory and legislative focus has generally moved to a second phase of broader regulatory reform and a restructuring of the entire financial regulatory system. The Dodd-Frank Act was signed into law in 2010 and implements many new changes in the way financial and banking operations are regulated in the United States, including through the creation of a new resolution authority, mandating higher capital and liquidity requirements, requiring banks to pay increased fees to regulatory agencies and numerous other provisions intended to strengthen the financial services sector. Pursuant to the Dodd-Frank Act the Financial Stability Oversight Council, or the FSOC, was created and is charged with overseeing and coordinating the efforts of the primary U.S. financial regulatory agencies (including the Federal Reserve, the FDIC and the SEC) in establishing regulations to address systemic financial stability concerns. Under the Dodd-Frank Act the CFPB was also created as a new consumer financial services regulator. The CFPB is authorized to prevent unfair, deceptive and abusive practices and ensure that consumers have access to markets for consumer financial products and services and that such markets are fair, transparent and competitive.
New laws or regulations or changes to existing laws and regulations, including changes in interpretation or enforcement, could materially adversely affect our financial condition or results of operations. Many aspects of the Dodd-Frank Act are subject to further rulemaking and will take effect over several years. As a result, the overall financial impact on the Company and Live Oak Bank cannot be anticipated at this time.
Small Business Lending Fund
The Small Business Jobs Act of 2010 created the Small Business Lending Fund to invest capital into community banking organizations. Through the fund, the U.S. Department of the Treasury (the “U.S. Treasury”) invested in financial institutions through the purchase of senior preferred stock or indebtedness. The U.S. Treasury could invest up to 5% of risk-weighted assets for financial institutions with $1 billion of total assets or less as of December 31, 2009, or up to 3% of risk-weighted assets for financial institutions with more than $1 billion, but less than $10 billion, in total assets on that date. In April 2011, the Company elected to participate in the program and issued $6.8 million in senior securities to the U.S. Treasury (“SBLF Securities”).
The starting point for interest rates on long term indebtedness issued by participants to the U.S. Treasury is 7.7% for S corporations. Financial institutions could “buy down” the rate to as low as 1.5% by increasing their level of qualified small business lending. The increase will be measured based on the increase over a “baseline level,” which is generally the average amount of small business lending reported by that institution in its call report for the four full quarters immediately preceding the date of enactment of the Small Business Jobs and Credit Act, less (a) net loan charge-offs with respect to small business lending, and (b) gains realized from mergers, acquisitions or purchases of loans after origination. For every 2.5% by which the amount of small business lending has increased, the dividend or interest rate on senior preferred stock is reduced. If, however, small business lending has remained the same or decreased relative to the baseline level in the eighth quarter, the
153
Table of Contents
interest rate the participant would pay would increase to 10.8% beginning in the tenth quarter and continuing until the end of the four-and-a-half year period from initial funding. After the four-and-a-half-year period from initial funding, the interest rate will increase to 13.8% until the long term debt issued to the U.S. Treasury is redeemed.
By the terms of the SBLF Securities, if we miss a quarterly interest payment on such securities, we will not be allowed to effectuate a repurchase or declare or pay dividends on our securities until all accrued interest on the SBLF Securities has been paid in full. If we miss an interest payment on SBLF Securities for five quarterly interest periods or more, whether or not consecutive, the U.S. Treasury will have the right, but not the obligation, to elect a representative to serve as an observer on our board of directors, until we pay full interest for four consecutive interest periods.
The SBLF Securities hold certain consent rights with respect to (i) any authorization or issuance of stock ranking senior to the SBLF Securities, (ii) any amendment to the terms of the SBLF Securities or our organizational documents that adversely affects the rights of the SBLF Securities, (iii) any merger or exchange which would affect the rights of the SBLF Securities and (iv) any sale of all or substantially all of our assets if the proceeds will not be used to redeem all outstanding SBLF Securities. We may redeem the SBLF Securities at any time, in whole or in part, with the approval of the Federal Reserve and in increments of at least 25% of the original principal amount, or 100% of the remaining amount if less than the 25% of the principal amount is outstanding.
Federal and State Taxation
The Company and its subsidiaries file a consolidated federal income tax return and separate state income tax returns in North Carolina. All the returns are filed on a calendar year basis. Consolidated income tax returns have the effect of eliminating intercompany income and expense, including dividends, from the computation of consolidated taxable income for the taxable year in which the items occur. In accordance with an income tax sharing agreement, income tax charges or credits are allocated among Live Oak and its subsidiaries on the basis of their respective taxable income or taxable loss that is included in the consolidated income tax return.
Banks and bank holding companies are subject to federal and state income taxes in essentially the same manner as other corporations. Taxable income is generally calculated under applicable sections of the Internal Revenue Code of 1986, as amended (the “Code”), with some modifications required by state law. Although Live Oak’s federal income tax liability is determined under provisions of the Code, which is applicable to all taxpayers, Sections 581 through 597 of the Code apply specifically to financial institutions.
154
Table of Contents
CERTAIN MATERIAL U.S. FEDERAL INCOME TAX CONSIDERATIONS
The following discussion summarizes certain material U.S. federal income tax consequences applicable to “U.S. holders” (as defined below) with respect to the purchase, ownership and disposition of our common stock. This summary is limited to investors who will hold our common stock as a capital asset and does not discuss all aspects of U.S. federal income taxation that may be important to particular investors in light of their individual circumstances. In addition, this summary does not address any state, local or non-U.S. tax consequences or any tax consequences applicable to any holders of common stock that are not U.S. holders.
This discussion does not address the tax consequences to investors who are subject to special tax rules, including:
| • | banks and other financial institutions; |
| • | insurance companies; |
| • | governments and governmental entities; |
| • | dealers in securities or currencies; |
| • | traders in securities that elect to use a mark-to-market method of accounting; |
| • | persons who will hold our common stock as part of a straddle, hedge, conversion, constructive sale, or other integrated security transaction for U.S. federal income tax purposes; |
| • | regulated investment companies; |
| • | real estate investment trusts; |
| • | thrift institutions; |
| • | a person who purchases or sells our common stock as part of a wash sale for tax purposes; |
| • | U.S. expatriates; |
| • | tax-exempt organizations; |
| • | persons whose functional currency is not the U.S. dollar; |
| • | persons who are subject to alternative minimum tax; |
| • | persons acquiring their shares of our common stock through the exercise of an employee stock option or otherwise as compensation; and |
| • | partnerships and other pass-through entities. |
These investors may be subject to tax rules that differ significantly from those summarized below.
If a partnership (including any other entity treated as a partnership for U.S. federal income tax purposes) is a holder of our common stock, the U.S. federal income tax treatment of a partner in the partnership will generally depend on the status of the partner and the activities of the partnership. If you are an entity taxable as a partnership, or a member or partner of an entity taxable as a partnership, holding our common stock, you should consult your own tax advisors as to the particular U.S. federal income tax consequences of the purchase, ownership and disposition of our common stock.
For purposes of this summary, you are a “U.S. holder” if you are a beneficial owner of our common stock and you are for U.S. federal income tax purposes (i) an individual citizen or resident of the U.S., (ii) a corporation created or organized in the U.S. or under the laws of the U.S., any state thereof or the District of Columbia, (iii) an estate the income of which is subject to U.S. federal income taxation regardless of its source, or (iv) a trust if it (A) is subject to the primary supervision of a court within the U.S. and one or more U.S. persons have the authority to control all substantial decisions of the trust, or (B) has a valid election in effect under applicable U.S.Treasury regulations to be treated as a U.S. person.
155
Table of Contents
This summary is based upon current provisions of the Code, U.S. Treasury regulations promulgated under the Code and judicial and administrative authority, all of which are subject to differing interpretations or change, possibly with retroactive effect. You are urged to consult your own tax advisor regarding the U.S. federal, state, local, and non-U.S. income and other tax considerations of the purchase, ownership, and disposition of our common stock.
U.S. Holders
Distributions on Our Common Stock
In general, if distributions are made with respect to our common stock, the distributions will be treated as dividends to the extent of our current and accumulated earnings and profits as determined for U.S. federal income tax purposes. Any portion of a distribution in excess of our current and accumulated earnings and profits is treated first as a nontaxable return of capital reducing your tax basis in our common stock. Any amount in excess of your tax basis is treated as capital gain, the tax treatment of which is discussed below under “U.S. Holders — Sale or Redemption of Our Common Stock.”
Under current law, distributions paid to a U.S. holder that is an individual or other non-corporate holder of our common stock will generally be subject to a reduced maximum federal income tax rate, to the extent such distributions are treated as dividends and are treated as “qualified dividend income” for U.S. federal income tax purposes. The maximum tax rates for qualified dividend income are based on such U.S. holder’s level of overall taxable income for the year, and the applicable thresholds are adjusted annually for inflation.
Qualified dividend income will be subject to a maximum rate of 20% to the extent such a U.S. holder’s taxable income exceeds the threshold for the highest marginal income tax bracket, which for 2015 is $464,850 for joint filers or surviving spouses, $439,000 for heads of household, $413,200 for single filers, and $232,425 for married taxpayers filing separately. A zero percent income tax rate will apply to qualified dividend income to the extent such a U.S. holder’s taxable income, exclusive of qualified dividend income, is less than other applicable thresholds, which for 2015 are $74,900 for joint filers or surviving spouses, $50,200 for heads of household, $37,450 for single filers, and $37,450 for married taxpayers filing separately. All other qualified dividend income for such a U.S. holder will be subject to a maximum tax rate of 15%.
The rate reduction does not apply to dividends that are paid to individual shareholders with respect to common stock that is held for 60 days or less during the 121-day period beginning on the date that is 60 days before the date on which our common stock becomes ex-dividend. Furthermore, the rate reduction does not apply to dividends received to the extent that an individual holder elects to treat the dividends as “investment income” for purposes of determining the holder’s limit for the deduction of investment interest under Section 163(d) of the Code. In addition, see “Medicare Tax on Unearned Income” below for the possible application of an additional 3.8% Medicare tax on certain dividends and other “net investment income.”
Dividends received by corporate holders of our common stock may be eligible for a dividends received deduction equal to 70% of the amount of the distribution, subject to applicable limitations, including limitations related to “debt financed portfolio stock” under Section 246A of the Code and to the holding period requirements of Section 246 of the Code. In addition, any amount received by a corporate holder that is treated as a dividend may, depending on the circumstances, constitute an “extraordinary dividend” subject to the provisions of Section 1059 of the Code. Under Code Section 1059, a corporate holder that has held shares for two years or less before the dividend announcement date generally must reduce the income tax basis of all of the holder’s shares (but not below zero) by the “non-taxed portion” of any “extraordinary dividend” and, if the non-taxed portion exceeds the holder’s income tax basis for the shares, must treat any excess as gain from the sale or exchange of the shares in the year the payment is received. Individual holders of our common stock who receive any “extraordinary dividends” that are treated as “qualified dividend income” (as discussed above) will be required to treat any losses on the sale of such common stock as long-term capital losses to the extent of such dividends. We strongly encourage you to consult your own tax advisor regarding the extent, if any, to which these provisions may apply to you in light of your particular facts and circumstances.
156
Table of Contents
In general, for purposes of meeting the holding period requirements for both the dividends received deduction and the reduced maximum tax rate on qualified dividends described above, U.S. holders may not count towards their holding period any period in which they (i) have the option to sell, are under a contractual obligation to sell, or have made (and not closed) a short sale of our common stock, or substantially identical stock or securities, (ii) are the grantor of an option to buy our common stock, or substantially identical stock or securities or (iii) otherwise have diminished their risk of loss on our common stock by holding one or more other positions with respect to substantially similar or related property. The U.S. Treasury regulations provide that a taxpayer has diminished its risk of loss on stock by holding a position in substantially similar or related property if the taxpayer is, for example, the beneficiary of a guarantee, surety agreement or similar arrangement that provides for payments that will substantially offset decreases in the fair market value of the stock.
In addition, the Code disallows the dividends received deduction as well as the reduced maximum tax rate on qualified dividend income if the recipient of a dividend is obligated to make related payments with respect to positions in substantially similar or related property. This disallowance applies even if the minimum holding period has been met. U.S. holders are advised to consult their own tax advisors regarding the implications of these rules in light of their particular circumstances.
Sale or Redemption of Our Common Stock
On the sale, exchange, or other disposition of our common stock to a party other than us, you generally will realize capital gain or loss in an amount equal to the difference between (i) the amount of cash and the fair market value of any property you receive on the sale (not including any amount attributable to declared and unpaid dividends, which will be taxable as described above under “U.S. Holders – Distributions on Our Common Stock,” to U.S. holders of record who have not previously included such dividends in income) and (ii) your adjusted income tax basis in the common stock. Any such capital gain or loss will constitute long-term capital gain or loss if you have held (or are treated as having held) your common stock for more than one year as of the date of the sale or exchange.
Under current law, if a U.S. holder is an individual or other non-corporate holder, net long-term capital gain realized by such U.S. holder is subject to a reduced maximum tax rate of 20%, 15% or 0% depending upon the taxable income level of such U.S. holder. The applicable income threshold and applicable maximum rates for long-term capital gain are the same as apply to qualified dividend income of an individual holder and are set forth above under “Distributions on Our Common Stock.” The deduction of capital losses is subject to limitations. See “Medicare Tax on Unearned Income” below for the possible application of an additional Medicare tax on certain “net investment income.” We strongly encourage you to consult your own tax advisors regarding applicable rates, holding periods and netting rules for capital gains and losses in light of your particular facts and circumstances. Certain limitations exist on the deduction of capital losses by both corporate and non-corporate taxpayers.
Medicare Tax on Unearned Income
For taxable years beginning after December 31, 2012, a U.S holder that is an individual, an estate, or a trust that does not fall into a special class of trusts that is exempt from such tax will be subject to a 3.8% Medicare tax on the lesser of (i) the U.S. holder’s “net investment income” (“undistributed net taxable income” in the case of a trust) for the relevant taxable year and (ii) the excess of the U.S. holder’s modified adjusted gross income for the taxable year over a certain threshold (which in the case of individuals will be $250,000 for joint filers or surviving spouses, $125,000 for married taxpayers filing separately, and $200,000 for other individuals). A U.S. holder’s net investment income will generally include the dividend income and any net gains from the disposition of our common stock, unless such dividend income or net gains are derived in the ordinary course of the conduct of a trade or business (other than a trade or business that consists of certain passive or trading activities). If you are a U.S. holder that is an individual, estate or trust, you are urged to consult your own tax advisor regarding the applicability of this Medicare tax to your income and gains in respect of your investment in our common stock.
157
Table of Contents
Information Reporting and Backup Withholding
Information reporting will generally apply to non-corporate U.S. holders with respect to payments of dividends on our common stock and to certain payments of proceeds on the sale or other disposition of our common stock. Certain non-corporate U.S. holders may be subject to U.S. backup withholding on payments of dividends on our common stock and certain payments of proceeds on the sale or other disposition of our common stock unless the beneficial owner of our common stock furnishes the payor or its agent with a taxpayer identification number, certified under penalties of perjury, and certain other information, or otherwise establishes, in the manner prescribed by law, an exemption from backup withholding. The applicable rate for backup withholding is based on the individual income tax rates and for 2015 will be 28% of applicable proceeds.
U.S. backup withholding is not an additional tax. Any amounts withheld under the backup withholding rules may be allowed as a credit against a U.S. holder’s U.S. federal income tax liability, which may entitle the U.S. holder to a refund, provided the U.S. holder timely furnishes the required information to the Internal Revenue Service.
THE FOREGOING DISCUSSION IS ONLY A SUMMARY. IT DOES NOT ADDRESS ALL ASPECTS OR DETAILS OF FEDERAL TAXATION THAT MIGHT BE RELEVANT OR MATERIAL TO INVESTORS IN CONNECTION WITH AN INVESTMENT IN OUR COMMON STOCK. THIS TAX DISCUSSION IS INCLUDED FOR GENERAL INFORMATION ONLY AND DOES NOT ADDRESS SPECIFIC STATE, LOCAL, FOREIGN OR OTHER TAX LAWS. DUE TO THE INDIVIDUAL NATURE OF TAX CONSEQUENCES, PROSPECTIVE INVESTORS ARE ENCOURAGED TO CONSULT THEIR OWN TAX ADVISORS REGARDING THE PARTICULAR TAX CONSEQUENCES OF INVESTING IN OUR COMMON STOCK, INCLUDING THE EFFECT AND APPLICABILITY OF FEDERAL, STATE, LOCAL, FOREIGN AND OTHER TAX LAWS.
158
Table of Contents
We are offering the shares of our common stock described in this prospectus in an underwritten offering in which we and Sandler O’Neill & Partners, L.P., Keefe Bruyette & Woods, Inc. and SunTrust Robinson Humphrey, Inc., as representatives for the underwriters named below, will enter into an underwriting agreement with respect to the shares of our common stock being offered hereby. Subject to certain conditions, each underwriter has severally agreed to purchase, and we have agreed to sell, the number of shares of our common stock indicated in the following table:
| Underwriter |
Number of Shares | |||
| Sandler O’Neill & Partners, L.P. |
||||
| Keefe Bruyette & Woods, Inc. |
||||
| SunTrust Robinson Humphrey, Inc. |
||||
|
|
|
|||
| Total |
4,000,000 | |||
|
|
|
|||
The underwriters are offering the shares of our common stock subject to a number of conditions, including receipt and acceptance of the common stock by the underwriters. The obligations of the underwriters to pay for and accept delivery of the shares offered by this prospectus are subject to the approval of certain legal matters by their counsel and to certain other conditions, including the listing of our common stock on the NASDAQ Global Select Market.
Commission and Discounts
Shares of our common stock sold by the underwriters to the public will be offered at the initial public offering price set forth on the cover of this prospectus. Any shares of our common stock sold by the underwriters to securities dealers may be sold at a discount of up to $ per share from the initial public offering price. Any of these securities dealers may resell any shares of our common stock purchased from the underwriters to other brokers or dealers at a discount of up to $ per share from the initial public offering price. If all of the shares of our common stock are not sold at the initial public offering price, the representative may change the offering price and the other selling terms. Sales of shares of our common stock made outside of the United States may be made by affiliates of the underwriters.
The following table shows the initial public offering price, underwriting discount and proceeds before expenses to us. The information assumes either no exercise or full exercise by the underwriters of their over-allotment option to purchase an additional 600,000 shares, discussed below:
| Per Share | No Exercise | Full Exercise | ||||||||||
| Public offering price |
$ | $ | $ | |||||||||
| Underwriting discounts and commissions paid by us |
||||||||||||
| Proceeds to us (before expenses) |
||||||||||||
We estimate the expenses of this offering, not including the underwriting discounts, to be $1.6 million and are payable by us. We have agreed to reimburse the underwriters up to $605,000 for certain of their out-of-pocket expenses, including, without limitation, legal fees and expenses, marketing, syndication and travel expenses. In accordance with FINRA Rule 5110, these reimbursed expenses and fees are deemed underwriting compensation for this offering.
Option to Purchase Additional Shares
We have granted the underwriters an option to buy up to 600,000 additional shares of our common stock, at the public offering price less underwriting discounts. The underwriters may exercise this option, in whole or from time to time in part. The underwriters have 30 days from the date of this prospectus to exercise this option. If the underwriters exercise this option, each underwriter will be obligated, subject to the conditions in the underwriting agreement, to purchase a number of additional shares of our common stock proportionate to such underwriter’s initial amount relative to the total amount reflected next to their name in the table above.
159
Table of Contents
Lock-Up Agreements
We, our executive officers and directors, certain executive officers and directors of Live Oak Bank and certain other persons have entered into lock-up agreements with the underwriters. Under these agreements, we and each of these persons may not, without the prior written approval of the representative, subject to limited exceptions:
| • | offer, pledge, sell, contract to sell, sell any option or contract to purchase, purchase any option or contract to sell, grant any option, right or warrant for the sale of, or otherwise dispose of or transfer any shares of our common stock or any securities convertible into or exchangeable or exercisable for our common stock, whether now owned or hereafter acquired or with respect to which such person has or hereafter acquires the power of disposition, or exercise any right with respect to the registration thereof, or file or cause to be filed any registration statement in connection therewith under the Securities Act; or |
| • | enter into any swap or any other agreement or any transaction that transfers, in whole or in part, directly or indirectly, the economic consequence of ownership of the shares of our common stock or such other securities, whether any such swap or transaction is to be settled by delivery of shares of our common stock or such other securities, in cash or otherwise. |
These restrictions will be in effect for a period of 180 days after the date of the underwriting agreement. The representatives may, in their sole discretion, waive or release all or some of the securities from these lock-up agreements.
Directed Share Program
The underwriters have reserved out of the shares of common stock being offered by this prospectus 400,000 shares for sale at the initial public offering price to our directors, officers and certain other persons identified by us who have expressed an interest in purchasing our common stock in the offering. The number of shares available for sale to the general public in the offering will be reduced to the extent these persons purchase the reserved shares. Any reserved shares not so purchased will be offered by the underwriters to the general public on the same terms as the other shares. Any shares sold in the directed share program to directors and officers will be subject to the 180-day lock-up agreements described above.
However, because these indications of interest are not binding agreements or commitments to purchase, the underwriters may determine to sell more, less or no shares in this offering to these persons, or these persons may determine to purchase more, less or no shares in this offering.
Pricing of the Offering
Prior to this offering, there has been no established public market for our common stock. The initial public offering price will be determined by negotiations among us and the representative of the underwriters. In addition to prevailing market conditions, among the factors to be considered in determining the initial public offering price of our common stock will be our historical performance, estimates of our business potential and our earnings prospects, an assessment of our management and the consideration of the above factors in relation to market valuation of companies in related businesses. The estimated initial public offering price range set forth on the cover page of this preliminary prospectus is subject to change as a result of market conditions and other factors. An active trading market for the shares of our common stock may not develop. It is also possible that the shares will not trade in the public market at or above the initial public offering price following the closing of this offering.
Exchange Quotation
We have received approval to list our common stock on the NASDAQ Global Select Market under the symbol “LOB.”
160
Table of Contents
Indemnification and Contribution
We have agreed to indemnify the underwriters and their affiliates, selling agents and controlling persons against certain liabilities, including certain liabilities under the Securities Act. If we are unable to provide this indemnification, we will contribute to the payments the underwriters and their affiliates, selling agents and controlling persons may be required to make in respect of those liabilities.
Price Stabilization, Short Positions and Penalty Bids
To facilitate this offering, the underwriters may, but are not obligated to, engage in transactions that stabilize, maintain or otherwise affect the price of our common stock, including:
| • | stabilizing transactions; |
| • | short sales; and |
| • | purchases to cover positions created by short sales. |
Stabilizing transactions consist of bids or purchases made for the purpose of preventing or retarding a decline in the market price of our common stock while this offering is in progress. These transactions may also include making short sales of our common stock, which involve the sale by the underwriters of a greater number of shares of common stock than they are required to purchase in this offering. Short sales may be “covered short sales,” which are short positions in an amount not greater than the underwriters’ over-allotment option referred to above, or may be “naked short sales,” which are short positions in excess of that amount.
The underwriters may close out any covered short position either by exercising their over-allotment option, in whole or in part, or by purchasing shares in the open market. In making this determination, the underwriters will consider, among other things, the price of shares available for purchase in the open market compared to the price at which they may purchase shares through the over-allotment option. The underwriters must close out any naked short position by purchasing shares in the open market. A naked short position is more likely to be created if the underwriters are concerned that there may be downward pressure on the price of the common stock in the open market that could adversely affect investors who purchased in this offering.
As an additional means of facilitating our initial public offering, the underwriters may bid for, and purchase, shares of our common stock in the open market. The underwriting syndicate also may reclaim selling concessions allowed to an underwriter or a dealer for distributing shares of our common stock in this offering, if the syndicate repurchases previously distributed shares of our common stock to cover syndicate short positions or to stabilize the price of our common stock.
As a result of these activities, the price of our common stock may be higher than the price that otherwise might exist in the open market. If these activities are commenced, they may be discontinued by the underwriters at any time without notice. The underwriters may carry out these transactions on NASDAQ, in the over-the-counter market or otherwise.
Passive Market Making
In connection with this offering, the underwriters and selling group members may engage in passive market making transactions in our common stock on NASDAQ in accordance with Rule 103 of Regulation M under the Exchange Act during a period before the commencement of offers or sales of our common stock and extending through the completion of the distribution of this offering. A passive market maker must display its bid at a price not in excess of the highest independent bid of that security. However, if all independent bids are lowered below the passive market maker’s bid, the bid must then be lowered when specified purchase limits are exceeded. Passive market making may cause the price of our common stock to be higher than the price that otherwise would exist in the open market in the absence of those transactions. The underwriters and dealers are not required to engage in a passive market making and may end passive market making activities at any time.
161
Table of Contents
Electronic Distribution
A prospectus in electronic format may be made available by e-mail or on the websites or through online services maintained by one or more of the underwriters or their affiliates. In those cases, prospective investors may view offering terms online and may be allowed to place orders online. The underwriters may agree with us to allocate a specific number of shares for sale to online brokerage account holders. Any such allocation for online distributions will be made by the underwriters on the same basis as other allocations. Other than the prospectus in electronic format, the information on the underwriters’ websites and any information contained on any other website maintained by any of the underwriters is not part of this prospectus, has not been approved and/or endorsed by the underwriters or us and should not be relied upon by investors.
Our Relationship with the Underwriters
From time to time, certain of the underwriters and their respective affiliates provide investment banking services to us in the ordinary course of their respective businesses. These underwriters and their affiliates may receive customary compensation and expense reimbursement for such services.
162
Table of Contents
WHERE YOU CAN FIND MORE INFORMATION
We have filed with the SEC a registration statement on Form S-1, which includes exhibits, schedules and amendments, under the Securities Act with respect to this offering of our common stock. Although this prospectus, which forms a part of the registration statement, contains all material information included in the registration statement, parts of the registration statement have been omitted as permitted by rules and regulations of the SEC. We refer you to the registration statement and its exhibits for further information about us, our securities, and this offering. The registration statement and its exhibits, as well as any other documents that we have filed with the SEC, may be inspected and copied at the SEC’s public reference room at 100 F Street, N.E., Washington, D.C. 20549-1004. The public may obtain information about the operation of the public reference room by calling the SEC at 1-800-SEC-0330. In addition, the SEC maintains a website at http://www.sec.gov that contains the registration statement and its exhibits, schedules, and amendments.
After we have completed this offering, we will become subject to the information and reporting requirements of the Securities Exchange Act of 1934 and will file annual, quarterly, and current reports, proxy statements, and other information with the SEC. We intend to make these filings available on our website once the offering is completed. You may read and copy any reports, statements, or other information on file at the public reference rooms. You can also request copies of these documents, for a copying fee, by writing to the SEC, or you can review these documents on the SEC’s website, as described above or via our website at www.liveoakbank.com. In addition, we will provide electronic or paper copies of our filings free of charge upon request. We intend to furnish to our shareholders our annual reports containing our audited consolidated financial statements certified by an independent registered public accounting firm.
The validity of the shares of common stock offered by this prospectus will be passed upon for us by Wyrick Robbins Yates & Ponton LLP, Raleigh, North Carolina. Todd H. Eveson, a partner in the law firm of Wyrick Robbins Yates & Ponton LLP, beneficially owns 10,000 shares of Live Oak Bancshares, Inc. common stock.
Covington & Burling LLP, Washington, D.C., is acting as counsel for the underwriters in this offering.
Our consolidated financial statements for the years ended December 31, 2014, 2013 and 2012 have been included in this prospectus and in the registration statement in reliance upon the report of Dixon Hughes Goodman LLP, independent registered public accounting firm, given upon the authority of said firm as experts in accounting and auditing.
163
Table of Contents
Live Oak Bancshares, Inc.
Table of Contents
| Interim Consolidated Financial Statements |
||||
| Consolidated Balance Sheets at March 31, 2015 (unaudited) and December 31, 2014 |
F-2 | |||
| Consolidated Statements of Income for the three months ended March 31, 2015 and 2014 (unaudited) |
F-3 | |||
| F-4 | ||||
| F-5 | ||||
| Consolidated Statements of Cash Flows for the three months ended March 31, 2015 and 2014 (unaudited) |
F-6 | |||
| F-7 | ||||
| Audited Financial Statements for the years ended December 31, 2014, 2013, and 2012 |
||||
| F-38 | ||||
| F-39 | ||||
| F-40 | ||||
| F-41 | ||||
| F-42 | ||||
| F-43 | ||||
| F-44 | ||||
F-1
Table of Contents
Consolidated Balance Sheets
As of March 31, 2015 (unaudited) and December 31, 2014*
(Dollars in thousands)
| March 31, 2015 |
December 31, 2014* |
|||||||
| Assets |
||||||||
| Cash and due from banks |
$ | 47,564 | $ | 29,902 | ||||
| Certificates of deposit with other banks |
10,000 | 10,000 | ||||||
| Investment securities available-for-sale |
50,777 | 49,318 | ||||||
| Loans held for sale |
305,079 | 295,180 | ||||||
| Loans held for investment |
220,444 | 203,936 | ||||||
| Allowance for loan losses |
(5,234 | ) | (4,407 | ) | ||||
|
|
|
|
|
|||||
| Net loans |
215,210 | 199,529 | ||||||
| Premises and equipment, net |
38,124 | 35,279 | ||||||
| Foreclosed assets |
34 | 371 | ||||||
| Servicing assets |
38,457 | 34,999 | ||||||
| Investments in non-consolidated affiliates |
— | 6,345 | ||||||
| Other assets |
17,787 | 12,392 | ||||||
|
|
|
|
|
|||||
| Total assets |
$ | 723,032 | $ | 673,315 | ||||
|
|
|
|
|
|||||
| Liabilities and Shareholders’’ Equity |
||||||||
| Liabilities |
||||||||
| Deposits: |
||||||||
| Noninterest-bearing |
$ | 4,390 | $ | 14,728 | ||||
| Interest-bearing |
551,693 | 507,352 | ||||||
|
|
|
|
|
|||||
| Total deposits |
556,083 | 522,080 | ||||||
| Short term borrowings |
— | 6,100 | ||||||
| Long term borrowings |
50,210 | 41,849 | ||||||
| Other liabilities |
16,571 | 11,472 | ||||||
|
|
|
|
|
|||||
| Total liabilities |
622,864 | 581,501 | ||||||
|
|
|
|
|
|||||
| Shareholders’ equity |
||||||||
| Non-cumulative perpetual preferred stock (Series A), 6,800 shares authorized, issued and outstanding |
— | — | ||||||
| Preferred stock, no par value, 1,000,000 authorized, none issued or outstanding |
— | — | ||||||
| Class A common stock, no par value, 100,000,000 shares authorized, 23,900,079 and 23,896,400, shares issued and outstanding, respectively |
48,799 | 48,657 | ||||||
| Class B common stock, no par value, 10,000,000 shares authorized, 4,723,530 shares issued and outstanding |
50,015 | 50,015 | ||||||
| Retained earnings (accumulated deficit) |
1,130 | (6,943 | ) | |||||
| Accumulated other comprehensive income |
209 | 85 | ||||||
|
|
|
|
|
|||||
| Total shareholders’ equity attributed to Live Oak Bancshares, Inc |
100,153 | 91,814 | ||||||
|
|
|
|
|
|||||
| Noncontrolling interest |
15 | — | ||||||
|
|
|
|
|
|||||
| Total equity |
100,168 | 91,814 | ||||||
|
|
|
|
|
|||||
| Total liabilities and shareholders’ equity |
$ | 723,032 | $ | 673,315 | ||||
|
|
|
|
|
|||||
| * | Derived from audited financial statements. |
See Notes to Consolidated Financial Statements
F-2
Table of Contents
Consolidated Statements of Income
For the three months ended March 31, 2015 and 2014 (unaudited)
(Dollars in thousands, except per share data)
| Three Months Ended March 31, | ||||||||
| 2015 | 2014 | |||||||
| Interest income |
||||||||
| Loans and fees on loans |
$ | 6,716 | $ | 4,089 | ||||
| Investment securities, taxable |
176 | 100 | ||||||
| Other interest earning assets |
66 | 23 | ||||||
|
|
|
|
|
|||||
| Total interest income |
6,958 | 4,212 | ||||||
|
|
|
|
|
|||||
| Interest expense |
||||||||
| Deposits |
1,476 | 1,098 | ||||||
| Borrowings |
441 | 153 | ||||||
|
|
|
|
|
|||||
| Total interest expense |
1,917 | 1,251 | ||||||
|
|
|
|
|
|||||
| Net interest income |
5,041 | 2,961 | ||||||
|
|
|
|
|
|||||
| Provision for loan losses |
1,077 | 424 | ||||||
|
|
|
|
|
|||||
| Net interest income after provision for loan losses |
3,964 | 2,537 | ||||||
|
|
|
|
|
|||||
| Noninterest income |
||||||||
| Loan servicing revenue and revaluation |
4,106 | 2,700 | ||||||
| Net gains on sales of loans |
15,461 | 10,031 | ||||||
| Equity in loss of non-consolidated affiliates |
(26 | ) | (994 | ) | ||||
| Gain on sale of sale of investment in non-consolidated affiliate |
3,782 | — | ||||||
| Other noninterest income |
732 | 468 | ||||||
|
|
|
|
|
|||||
| Total noninterest income |
24,055 | 12,205 | ||||||
|
|
|
|
|
|||||
| Noninterest expense |
||||||||
| Salaries and employee benefits |
8,355 | 9,701 | ||||||
| Travel expense |
1,460 | 750 | ||||||
| Professional services expense |
908 | 935 | ||||||
| Advertising and marketing expense |
1,008 | 798 | ||||||
| Occupancy expense |
457 | 437 | ||||||
| Data processing expense |
893 | 429 | ||||||
| Equipment expense |
404 | 253 | ||||||
| Other expense |
1,203 | 1,141 | ||||||
|
|
|
|
|
|||||
| Total noninterest expense |
14,688 | 14,444 | ||||||
|
|
|
|
|
|||||
| Income before taxes |
13,331 | 298 | ||||||
| Income tax expense |
5,278 | — | ||||||
|
|
|
|
|
|||||
| Net income |
8,053 | 298 | ||||||
| Net loss attributable to noncontrolling interest |
20 | — | ||||||
|
|
|
|
|
|||||
| Net income attributable to Live Oak Bancshares, Inc. |
$ | 8,073 | $ | 298 | ||||
|
|
|
|
|
|||||
| Basic earnings per share |
$ | 0.28 | $ | 0.01 | ||||
|
|
|
|
|
|||||
| Diluted earnings per share |
$ | 0.27 | $ | 0.01 | ||||
|
|
|
|
|
|||||
See Notes to Consolidated Financial Statements
F-3
Table of Contents
Consolidated Statements of Comprehensive Income
For the three Months ended March 31, 2015 and 2014 (unaudited)
(Dollars in thousands)
| Three Months Ended March 31, | ||||||||
| 2015 | 2014 | |||||||
| Net income |
$ | 8,053 | $ | 298 | ||||
| Other comprehensive income (loss) before tax: |
||||||||
| Net unrealized gain (loss) on investment securities arising during the period |
203 | 105 | ||||||
| Reclassification adjustment for (gain) loss on sale of securities available for sale included in net income |
— | — | ||||||
|
|
|
|
|
|||||
| Other comprehensive income (loss) before tax |
203 | 105 | ||||||
| Income tax expense |
79 | — | ||||||
|
|
|
|
|
|||||
| Other comprehensive income (loss), net of tax |
124 | 105 | ||||||
|
|
|
|
|
|||||
| Total comprehensive income |
$ | 8,177 | $ | 403 | ||||
|
|
|
|
|
|||||
See Notes to Consolidated Financial Statements
F-4
Table of Contents
Consolidated Statements of Changes in Shareholders’ Equity
For the three months ended March 31, 2015 and 2015 (unaudited)
(Dollars in thousands, except per share data)
| Common stock | Retained earnings |
Accumulated other comprehensive income (loss) |
Non- controlling interest |
Total equity |
||||||||||||||||||||||||
| Shares | Amount | |||||||||||||||||||||||||||
| Class A | Class B | |||||||||||||||||||||||||||
| Balance at December 31, 2013 |
20,318,330 | — | $ | 18,319 | $ | 30,262 | $ | (191 | ) | $ | — | $ | 48,390 | |||||||||||||||
| Net income |
— | — | — | 298 | — | — | 298 | |||||||||||||||||||||
| Other comprehensive income |
— | — | — | — | 105 | — | 105 | |||||||||||||||||||||
| Sales of common stock |
22,720 | — | 100 | — | — | — | 100 | |||||||||||||||||||||
| Stock option exercise |
108,330 | — | 50 | — | — | — | 50 | |||||||||||||||||||||
| Issuance of common stock grants |
685,700 | — | 2,992 | — | — | — | 2,992 | |||||||||||||||||||||
| Stock option based compensation expense |
— | — | 37 | — | — | — | 37 | |||||||||||||||||||||
| Restricted stock expense |
— | — | 143 | — | — | — | 143 | |||||||||||||||||||||
| Dividends (distributions to shareholders) |
— | — | — | (5,685 | ) | — | — | (5,685 | ) | |||||||||||||||||||
|
|
|
|
|
|
|
|
|
|
|
|
|
|
|
|||||||||||||||
| Balance at March 31, 2014 |
21,135,080 | — | $ | 21,641 | $ | 24,875 | $ | (86 | ) | $ | — | $ | 46,430 | |||||||||||||||
|
|
|
|
|
|
|
|
|
|
|
|
|
|
|
|||||||||||||||
| Balance at December 31, 2014 |
23,896,400 | 4,723,530 | $ | 98,672 | $ | (6,943 | ) | $ | 85 | $ | — | $ | 91,814 | |||||||||||||||
| Net income (loss) |
— | — | — | 8,073 | — | (20 | ) | 8,053 | ||||||||||||||||||||
| Other comprehensive income |
— | — | — | — | 124 | — | 124 | |||||||||||||||||||||
| Consolidation of investment with non-controlling interest |
— | — | — | — | — | 35 | 35 | |||||||||||||||||||||
| Stock option exercise |
3,679 | — | 16 | — | — | — | 16 | |||||||||||||||||||||
| Stock option based compensation expense |
— | — | 118 | — | — | — | 118 | |||||||||||||||||||||
| Restricted stock expense |
— | — | 8 | — | — | — | 8 | |||||||||||||||||||||
|
|
|
|
|
|
|
|
|
|
|
|
|
|
|
|||||||||||||||
| Balance at March 31, 2015 |
23,900,079 | 4,723,530 | $ | 98,814 | $ | 1,130 | $ | 209 | $ | 15 | $ | 100,168 | ||||||||||||||||
|
|
|
|
|
|
|
|
|
|
|
|
|
|
|
|||||||||||||||
See Notes to Consolidated Financial Statements
F-5
Table of Contents
Consolidated Statements of Cash Flows
For the three months ended March 31, 2015 and 2014 (unaudited)
(Dollars in thousands)
| Three Months Ended March 31, | ||||||||
| 2015 | 2014 | |||||||
| Cash flows from operating activities |
||||||||
| Net income |
$ | 8,053 | $ | 298 | ||||
| Adjustments to reconcile net income to net cash provided (used) by operating activities: |
||||||||
| Depreciation and amortization |
433 | 468 | ||||||
| Provision for loan losses |
1,077 | 424 | ||||||
| Amortization of premium on securities, net of accretion |
15 | 22 | ||||||
| Amortization of discount on unguaranteed loans |
319 | 34 | ||||||
| Deferred tax expense |
226 | — | ||||||
| Originations of loans held for sale |
(223,905 | ) | (121,768 | ) | ||||
| Proceeds from sales of loans held for sale |
180,991 | 103,140 | ||||||
| Net gains (loss) on sale of foreclosed assets |
7 | — | ||||||
| Net increase in servicing assets |
(3,458 | ) | (1,465 | ) | ||||
| Net gains on sale of loans held for sale |
(15,461 | ) | (10,031 | ) | ||||
| Gain on sale of investment in non-consolidated affiliate |
(3,782 | ) | — | |||||
| Net loss on disposal of premises and equipment |
3 | — | ||||||
| Stock option based compensation expense |
118 | 37 | ||||||
| Stock grants |
— | 2,992 | ||||||
| Restricted stock expense |
8 | 143 | ||||||
| Equity in loss of non-consolidated affiliates |
26 | 994 | ||||||
| Changes in assets and liabilities: |
||||||||
| Accounts receivable and other assets |
92 | 372 | ||||||
| Accrued expenses and other liabilities |
5,265 | (2,865 | ) | |||||
|
|
|
|
|
|||||
| Net cash used by operating activities |
(49,973 | ) | (27,205 | ) | ||||
|
|
|
|
|
|||||
| Cash flows from investing activities |
||||||||
| Purchases of securities available-for-sale |
(1,900 | ) | — | |||||
| Proceeds from sales, maturities, calls, and principal paydown of securities available-for-sale |
629 | 514 | ||||||
| Proceeds from sale of foreclosed assets |
330 | — | ||||||
| Proceeds from sale of investment in non-consolidated affiliate |
9,896 | — | ||||||
| Net cash acquired in consolidation of equity method investment |
319 | — | ||||||
| Loan originations and principal collections, net |
26,725 | (21,145 | ) | |||||
| Purchases of premises and equipment |
(3,281 | ) | (428 | ) | ||||
|
|
|
|
|
|||||
| Net cash used by investing activities |
32,718 | (21,059 | ) | |||||
|
|
|
|
|
|||||
| Cash flows from financing activities |
||||||||
| Net increase in deposits |
34,003 | 59,380 | ||||||
| Proceeds from long term borrowings |
8,468 | — | ||||||
| Repayment of long term borrowings |
(107 | ) | (55 | ) | ||||
| Proceeds from short term borrowings |
— | 4,000 | ||||||
| Repayment of short term borrowings |
(6,100 | ) | — | |||||
| Stock option exercise |
16 | 50 | ||||||
| Sale of common stock, net |
— | 100 | ||||||
| Shareholder dividend distributions |
(1,363 | ) | (4,887 | ) | ||||
|
|
|
|
|
|||||
| Net cash provided by financing activities |
34,917 | 58,588 | ||||||
|
|
|
|
|
|||||
| Net increase in cash and cash equivalents |
17,662 | 10,324 | ||||||
| Cash and cash equivalents, beginning |
29,902 | 37,244 | ||||||
|
|
|
|
|
|||||
| Cash and cash equivalents, ending |
$ | 47,564 | $ | 47,568 | ||||
|
|
|
|
|
|||||
| Supplemental disclosure of cash flow information |
||||||||
| Interest paid |
$ | 1,915 | $ | 1,254 | ||||
| Income tax |
1,974 | — | ||||||
| Supplemental disclosures of noncash operating, investing, and financing activities |
||||||||
| Unrealized holding gains (losses) on available-for-sale securities, net of taxes |
$ | 203 | $ | 105 | ||||
| Transfers of loans accounted for as secured borrowing collateral to other assets |
4,674 | — | ||||||
| Dividends declared but not paid |
169 | 3,638 | ||||||
| Transfer of Loans held for sale to Loans held for Investment |
2,294 | 5,279 | ||||||
| Transfer of Loans held for Investment to Loans held for Sale |
1,370 | 339 | ||||||
| Contingent Consideration in Acquisition of Controlling Interest in Equity Method of Investment |
170 | — | ||||||
See Notes to Consolidated Financial Statements
F-6
Table of Contents
Live Oak Bancshares, Inc.
Notes to Consolidated Financial Statements
Note 1. Basis of Presentation
Nature of Operations
Live Oak Bancshares, Inc. (the “Company” or “LOB”) is a bank holding company headquartered in Wilmington, North Carolina incorporated under the laws of North Carolina in December 2008. The Company conducts business operations primarily through our commercial bank subsidiary, Live Oak Banking Company (“the Bank”). The Bank was established in May 2008 as a North Carolina-chartered commercial bank. The Bank specializes in providing lending services to small businesses nationwide in targeted industries. The Bank identifies and grows within credit-worthy industries through expertise within those industries. A significant portion of the loans originated by the Bank are guaranteed by the Small Business Administration (“SBA”) under the 7(a) program. In 2010, the Bank formed Live Oak Number One, Inc., a wholly-owned subsidiary, to hold properties foreclosed on by the Bank.
In addition to the Bank, the Company owns Independence Aviation, LLC which was formed for the purpose of purchasing and operating aircraft used for business purposes of the Company, Government Loan Solutions (“GLS”), a management and technology consulting firm that specializes in the settlement, accounting, and securitization processes for government guaranteed loans, including loans originated under the SBA 7(a) loan programs and USDA-guaranteed loans, and 504 Fund Advisors, LLC (“504 FA”), formed to serve as the investment advisor to the 504 Fund, a closed end mutual fund organized to invest in SBA section 504 loans.
The Company acquired control over 504FA, previously carried as an equity method investment, on February 2, 2015 by increasing its ownership from 50.0% to 91.3%. The acquisition of an additional 41.3% of ownership occurred in exchange for contingent consideration estimated to total $170 thousand. With 8.7% of ownership remaining with a third party investor, amounts of earnings and equity in 504FA are now disclosed in the Company’s financial statements as related to a noncontrolling interest.
The Company earns revenue primarily from the sale of SBA-guaranteed loans. This income is comprised of loan servicing revenue and revaluation and net gains on sales of loans. Net interest income is a secondary contributor to our earnings. Offsetting these revenues are the cost of funding sources, provision for loan losses, any costs related to foreclosed assets and other operating costs such as salaries and employee benefits, travel, professional services, advertising and marketing and tax expense.
General
In the opinion of management, all adjustments necessary for a fair presentation of the financial position and results of operations for the periods presented have been included, and all intercompany transactions have been eliminated in consolidation. Results of operations for the three months ended March 31, 2015 are not necessarily indicative of the results of operations that may be expected for the year ending December 31, 2015. The consolidated balance sheet as of December 31, 2014 has been derived from the audited consolidated financial statements contained in the Company’s registration statement on Form S-1. A description of the significant accounting policies followed by the Company are as set forth in Note 1 of the Notes to Consolidated Financial Statements in the Company’s registration statement on Form S-1.
The preparation of financial statements in conformity with U.S. GAAP requires management to make estimates and assumptions that affect reported amounts of assets and liabilities and the reported amounts of revenues and expenses during the reporting period. Actual results could differ significantly from those estimates.
All information in the Notes to Consolidated Financial Statements has been presented in thousands, except percentage, time period, stock option, share and per share data.
F-7
Table of Contents
Live Oak Bancshares, Inc.
Notes to Consolidated Financial Statements
Note 1. Basis of Presentation (Continued)
Stock Split
On September 23, 2014, the Board of Directors declared a ten-for-one stock split of the Company’s Class A and Class B common shares, which was effected in the form of a common stock dividend distributed on October 10, 2014. Except for the amount of authorized shares, all references to share and per share amounts in the consolidated financial statements and accompanying notes to the consolidated financial statements have been retroactively restated to reflect the stock split.
Business Segments
Management has determined that the Company has one significant operating segment, which is providing a lending platform for small businesses nationwide. In determining the appropriateness of segment definition, the Company considers the materiality of a potential segment, the components of the business about which financial information is available and regularly evaluates relative to resource allocation and performance assessment.
Reclassifications
Certain reclassifications have been made to the prior period’s financial statements to place them on a comparable basis with the current year. Net income and shareholders’ equity previously reported were not affected by these reclassifications.
Note 2. Recent Accounting Pronouncements
In January 2015, the Financial Accounting Standards Board (“FASB”) issued Accounting Standards Update No. 2015-01, “Simplifying Income Statement Presentation by Eliminating the Concept of Extraordinary Items” (“ASU 2015-01”). ASU 2015-01 eliminated from U.S. GAAP the concept of an extraordinary item, which is an event or transaction that is both unusual in nature and infrequently occurring. The guidance will be effective for the Company for interim and annual reporting periods beginning after December 15, 2015. Early adoption is permitted. The Company does not expect this guidance to have a material effect on its financial statements.
In February 2015, the FASB issued Accounting Standards Update No. 2015-02, “Amendments to the Consolidation Analysis” (“ASU 2015-02”). ASU 2015-02 amended the consolidation requirements in Accounting Standards Codification (“ASC”) 810 Consolidation. The amendments change the consolidation analysis required under U.S. GAAP, and modify how variable interests held by a reporting entity’s related parties affect its consolidation conclusions. The amendments will be effective for the Company for interim and annual reporting periods beginning after December 15, 2015. Early adoption is permitted. The Company does not expect these amendments to have a material effect on its financial statements.
F-8
Table of Contents
Live Oak Bancshares, Inc.
Notes to Consolidated Financial Statements
Note 3. Earnings Per Share
Basic and diluted earnings per share are computed based on the weighted average number of shares outstanding during each period. Diluted earnings per share reflects the potential dilution that could occur if convertible debt, stock options or restricted stock grants were exercised, resulting in the issuance of common stock that then shared in the net income of the Company.
| Three Months Ended March 31, | ||||||||
| 2015 | 2014 | |||||||
| Basic earnings per share: |
||||||||
| Net income available to common shareholders |
$ | 8,073 | $ | 298 | ||||
|
|
|
|
|
|||||
| Weighted-average basic shares outstanding |
28,620,120 | 20,373,983 | ||||||
|
|
|
|
|
|||||
| Basic earnings per share |
$ | .28 | $ | .01 | ||||
|
|
|
|
|
|||||
| Diluted earnings per share: |
||||||||
| Net income available to common shareholders, for diluted EPS |
$ | 8,073 | $ | 298 | ||||
|
|
|
|
|
|||||
| Total weighted-average basic shares outstanding |
28,620,120 | 20,373,983 | ||||||
| Add effect of dilutive stock options and restricted grants |
741,721 | 211,423 | ||||||
|
|
|
|
|
|||||
| Total weighted-average diluted shares outstanding |
29,361,841 | 20,585,406 | ||||||
|
|
|
|
|
|||||
| Diluted earnings per share |
$ | .27 | $ | .01 | ||||
|
|
|
|
|
|||||
| Anti-dilutive securities |
720,447 | 1,550,000 | ||||||
|
|
|
|
|
|||||
Pro forma earnings per share
Because the Company was not a taxable entity prior to August 3, 2014, pro forma amounts for income tax expense and basic and diluted earnings per share have been presented below assuming the Company’s effective tax rate of 38.5% for the three months ended March 31, 2014.
| Three Months Ended March 31, 2014 |
||||
| Pro forma net income available to common shareholders, after tax |
$ | 183 | ||
|
|
|
|||
| Pro forma basic earnings per share |
$ | .01 | ||
|
|
|
|||
| Pro forma diluted earnings per share |
$ | .01 | ||
|
|
|
|||
F-9
Table of Contents
Live Oak Bancshares, Inc.
Notes to Consolidated Financial Statements
Note 4. Securities
The carrying amount of securities and their approximate fair values are reflected in the following table:
| Amortized Cost |
Unrealized Gains |
Unrealized Losses |
Fair Value |
|||||||||||||
| March 31, 2015 |
||||||||||||||||
| US government agencies |
$ | 35,218 | $ | 285 | $ | 5 | $ | 35,498 | ||||||||
| Residential mortgage-backed securities |
13,318 | 104 | 43 | 13,379 | ||||||||||||
| Mutual fund |
1,900 | — | — | 1,900 | ||||||||||||
|
|
|
|
|
|
|
|
|
|||||||||
| $ | 50,436 | $ | 389 | $ | 48 | $ | 50,777 | |||||||||
|
|
|
|
|
|
|
|
|
|||||||||
| December 31, 2014 |
||||||||||||||||
| US government agencies |
$ | 35,207 | $ | 127 | $ | 25 | $ | 35,309 | ||||||||
| Residential mortgage-backed securities |
13,973 | 92 | 56 | 14,009 | ||||||||||||
|
|
|
|
|
|
|
|
|
|||||||||
| $ | 49,180 | $ | 219 | $ | 81 | $ | 49,318 | |||||||||
|
|
|
|
|
|
|
|
|
|||||||||
There were no calls, sales or maturities of securities during the quarters ended March 31, 2015 and March 31, 2014. On March 31, 2015, the Company invested $1.9 million in The 504 Fund mutual fund. This is a closed end mutual fund comprised of SBA 504 loans and is managed by a subsidiary, 504 Fund Advisors. The mutual fund was purchased at current market value; 190,380.762 shares at $9.98 per share.
The following tables show gross unrealized losses and fair value, aggregated by investment category and length of time that the individual securities have been in a continuous unrealized loss position.
| Less Than 12 Months | 12 Months or More | Total | ||||||||||||||||||||||
| Fair Value |
Unrealized Losses |
Fair Value |
Unrealized Losses |
Fair Value |
Unrealized Losses |
|||||||||||||||||||
| March 31, 2015 |
||||||||||||||||||||||||
| US government agencies |
$ | — | $ | — | $ | 1,243 | $ | 5 | $ | 1,243 | $ | 5 | ||||||||||||
| Residential mortgage-backed securities |
761 | 6 | 5,000 | 37 | 5,761 | 43 | ||||||||||||||||||
|
|
|
|
|
|
|
|
|
|
|
|
|
|||||||||||||
| Total |
$ | 761 | $ | 6 | $ | 6,243 | $ | 42 | $ | 7,004 | $ | 48 | ||||||||||||
|
|
|
|
|
|
|
|
|
|
|
|
|
|||||||||||||
| Less Than 12 Months | 12 Months or More | Total | ||||||||||||||||||||||
| Fair Value |
Unrealized Losses |
Fair Value |
Unrealized Losses |
Fair Value |
Unrealized Losses |
|||||||||||||||||||
| December 31, 2014 |
||||||||||||||||||||||||
| US government agencies |
$ | — | $ | — | $ | 1,224 | $ | 25 | $ | 1,224 | $ | 25 | ||||||||||||
| Residential mortgage-backed securities |
2,234 | 4 | 5,158 | 52 | 7,392 | 56 | ||||||||||||||||||
|
|
|
|
|
|
|
|
|
|
|
|
|
|||||||||||||
| Total |
$ | 2,234 | $ | 4 | $ | 6,382 | $ | 77 | $ | 8,616 | $ | 81 | ||||||||||||
|
|
|
|
|
|
|
|
|
|
|
|
|
|||||||||||||
At March 31, 2015, there were six securities, consisting of one US agency security and five mortgage-backed securities, in unrealized loss positions for greater than 12 months; and one mortgage-backed security in an unrealized loss position for less than 12 months. Unrealized losses at December 31, 2014, were comprised of six securities, consisting of one US agency security and five mortgage-backed securities, in unrealized loss positions for greater than 12 months; and one mortgage-backed security in an unrealized loss position for less than 12 months.
F-10
Table of Contents
Live Oak Bancshares, Inc.
Notes to Consolidated Financial Statements
Note 4. Securities (Continued)
These unrealized losses are primarily the result of volatility in the market and are related to market interest rates. Since none of the unrealized losses relate to marketability of the securities or the issuer’s ability to honor redemption obligations, none of the securities are deemed to be other than temporarily impaired.
All residential mortgage-backed securities in the Company’s portfolio at March 31, 2015 and December 31, 2014 were backed by U.S. government sponsored enterprises (“GSEs”).
The following is a summary of investment securities by maturity:
| March 31, 2015 Available for sale |
||||||||
| Amortized cost |
Fair value |
|||||||
| One to five years |
$ | 35,218 | $ | 35,498 | ||||
| Five to ten years |
1,316 | 1,349 | ||||||
| After 10 years |
12,002 | 12,030 | ||||||
|
|
|
|
|
|||||
| $ | 48,536 | $ | 48,877 | |||||
|
|
|
|
|
|||||
The table above reflects contractual maturities. Actual results will differ as the loans underlying the mortgage-backed securities may repay sooner than scheduled. This table excludes mutual fund investments.
At March 31, 2015 and December 31, 2014 investment securities with a fair market value of $1.3 million and $1.3 million, respectively, were pledged to secure a line of credit with the Company’s correspondent bank.
Note 5. Loans and Allowance for Loan Losses
Loan Portfolio Segments
The following describe the risk characteristics relevant to each of the portfolio segments. Each loan category is assigned a risk grade during the origination and closing process based on criteria described later in this section.
Commercial and Industrial
Commercial and industrial loans (C&I) receive similar underwriting treatment as commercial real estate loans in that the repayment source is analyzed to determine its ability to meet cash flow coverage requirements as set forth by Bank policies. Repayment of the Bank’s C&I loans generally comes from the generation of cash flow as the result of the borrower’s business operations. This business cycle itself brings a certain level of risk to the portfolio. In some instances, these loans may carry a higher degree of risk due to a variety of reasons — illiquid collateral, specialized equipment, highly depreciable assets, uncollectable accounts receivable, revolving balances, or simply being unsecured. As a result of these characteristics, the SBA guarantee on these loans is an important factor in mitigating risk.
Construction and Development
Construction and development loans are for the purpose of acquisition and development of land to be improved through the construction of commercial buildings. Such loans are usually paid off through the conversion to permanent financing for the long-term benefit of the borrower’s ongoing operations. At the
F-11
Table of Contents
Live Oak Bancshares, Inc.
Notes to Consolidated Financial Statements
Note 5. Loans and Allowance for Loan Losses (Continued)
completion of the project, if the loan is converted to permanent financing or if scheduled loan amortization begins, it is then reclassified to the Owner Occupied Commercial Real Estate segment. Underwriting of construction and development loans typically includes analysis of not only the borrower’s financial condition and ability to meet the required debt obligations, but also the general market conditions associated with the area and type of project being funded.
Owner Occupied Commercial Real Estate
Owner occupied commercial real estate loans are extensions of credit secured by owner occupied collateral. Underwriting generally involves intensive analysis of the financial strength of the borrower and guarantor, liquidation value of the subject collateral, the associated unguaranteed exposure, and any available secondary sources of repayment, with the greatest emphasis given to a borrower’s capacity to meet cash flow coverage requirements as set forth by Bank policies. Such repayment of owner-occupied loans is commonly derived from the successful ongoing operations of the business occupying the property. These typically include small businesses and professional practices.
Commercial Land
Commercial land loans are extensions of credit secured by farmland. Such loans are often for land improvements relative to agricultural endeavors which may include construction of new specialized facilities. These loans are usually paid off through the conversion to permanent financing, or if scheduled loan amortization begins, for the long-term benefit of the borrower’s ongoing operations. Underwriting generally involves intensive analysis of the financial strength of the borrower and guarantor, liquidation value of the subject collateral, the associated unguaranteed exposure, and any available secondary sources of repayment, with the greatest emphasis given to a borrower’s capacity to meet cash flow coverage requirements as set forth by Bank policies.
Each of the loan types referenced in the sections above is further segmented into verticals in which the Bank chooses to operate — Death Care, Healthcare (medical, dental, ophthalmic), Pharmacy, Investment Advisors, Veterinary, Family Entertainment, Agriculture, Wine & Craft Beverages and Self-Storage. Wine & Craft Beverages and Self-Storage are new areas of emphasis for which there is no loan activity as of March 31, 2015. The Bank chooses to finance businesses operating in these industries because of certain similarities. The similarities range from historical default and loss characteristics to business operations. However, there are differences that create the necessity to underwrite these loans according to varying criteria and guidelines. When underwriting a loan, the Bank considers numerous factors such as cash flow coverage, the credit scores of the guarantors, revenue growth and practice ownership experience and debt service capacity. Minimum guidelines have been set with regard to these various factors and deviations from those guidelines requiring compensating strengths when considering a proposed loan.
F-12
Table of Contents
Live Oak Bancshares, Inc.
Notes to Consolidated Financial Statements
Note 5. Loans and Allowance for Loan Losses (Continued)
Loans consist of the following:
| March 31, 2015 |
December 31, 2014 |
|||||||
| Commercial & Industrial |
$ | 86,151 | $ | 81,057 | ||||
| Death Care Management |
3,880 | 3,603 | ||||||
| Family Entertainment Centers |
340 | 333 | ||||||
| Healthcare |
12,946 | 12,319 | ||||||
| Independent Pharmacies |
35,114 | 34,079 | ||||||
| Registered Investment Advisors |
12,135 | 9,660 | ||||||
| Veterinary Industry |
21,580 | 20,902 | ||||||
| Other Industries |
156 | 161 | ||||||
| Construction & Development |
14,533 | 9,526 | ||||||
| Agriculture |
5,460 | 3,910 | ||||||
| Death Care Management |
483 | 92 | ||||||
| Family Entertainment Centers |
152 | — | ||||||
| Healthcare |
5,150 | 2,957 | ||||||
| Independent Pharmacies |
456 | 215 | ||||||
| Veterinary Industry |
2,676 | 2,207 | ||||||
| Other Industries |
156 | 145 | ||||||
| Owner Occupied Commercial Real Estate |
115,200 | 111,620 | ||||||
| Agriculture |
283 | 259 | ||||||
| Death Care Management |
19,269 | 18,879 | ||||||
| Family Entertainment Centers |
761 | 872 | ||||||
| Healthcare |
27,634 | 26,173 | ||||||
| Independent Pharmacies |
4,579 | 4,750 | ||||||
| Registered Investment Advisors |
2,481 | 2,161 | ||||||
| Veterinary Industry |
59,615 | 57,934 | ||||||
| Other Industries |
578 | 592 | ||||||
| Commercial Land |
4,136 | 1,248 | ||||||
| Agriculture |
4,136 | 1,248 | ||||||
| Total Loans2 |
220,020 | 203,451 | ||||||
| Net Deferred Costs |
2,208 | 2,060 | ||||||
| Discount on SBA 7(a) Unguaranteed1 |
(1,784 | ) | (1,575 | ) | ||||
|
|
|
|
|
|||||
| Loans, Net of Unearned |
$ | 220,444 | $ | 203,936 | ||||
|
|
|
|
|
|||||
| 1 | The Company measures the carrying value of the retained portion of loans sold at fair value under ASC Subtopic 825-10. The value of these retained loan balances is discounted based on the estimates derived from comparable unguaranteed loan sales. |
| 2 | Total loans include $21.5 million and $21.3 million of U.S. Government Guaranteed loans as of March 31, 2015 and December 31, 2014, respectively. |
F-13
Table of Contents
Live Oak Bancshares, Inc.
Notes to Consolidated Financial Statements
Note 5. Loans and Allowance for Loan Losses (Continued)
Credit Risk Profile
The Bank uses internal loan reviews to assess the performance of individual loans by industry segment. Annually, an independent review of the loan portfolio is performed by an external firm. The Bank’s annual review of each borrower’s financial performance validates adequacy of the risk grade assigned.
The Bank uses a grading system to rank the quality of each loan. The grade is periodically evaluated and adjusted as performance dictates. Loan grades 1 through 4 are passing grades, grade 5 is special mention. Collectively, grades 6 through 8 represent classified loans in the Bank’s portfolio. The following guidelines govern the assignment of these risk grades:
Exceptional Loans (1 Rated): These loans are of the highest quality, with strong, well-documented sources of repayment. Debt service coverage (“DSC”) is over 1.75X based on historical results. Secondary source of repayment is strong, with a loan to value (“LTV”) of 65% or less if secured solely by commercial real estate (“CRE”). Discounted collateral coverage from all sources should exceed 125%. Guarantors have credit scores above 740.
Quality Loans (2 Rated): These loans are of good quality, with good well-documented sources of repayment. DSC is over 1.25X based on historical or pro-forma results. Secondary source of repayment is good, with a LTV of 75% or less if secured solely by CRE. Discounted collateral coverage should exceed 100%. Guarantors have credit scores above 700.
Acceptable Loans (3 rated): These loans are of acceptable quality, with acceptable sources of repayment. DSC of over 1.00X based on historical or pro-forma results. Companies that do not meet these credit metrics must be evaluated to determine if they should be graded below this level.
Acceptable Loans (4 rated): These loans are considered very weak pass. These loans are riskier than a 3-rated credit, but due to various mitigates is not considered a Special Mention or worse. The mitigating factors must clearly be identified to offset further downgrade. Examples of loans that may be put in this category include start-up loans, loans with Sub 1:1 cash flow coverage with other sources of repayment.
Special mention (5 rated): These loans are to be considered as emerging problems, with potentially unsatisfactory characteristics. These loans require greater management attention. A loan may be put into this category if the Bank is unable to obtain financial reporting from a company to fully evaluate its position.
Substandard (6 rated): Loans graded Substandard are inadequately protected by current sound net worth, paying capacity of the borrower, or pledged collateral. They typically have unsatisfactory characteristics causing more than acceptable levels of risk, and have one or more well-defined weaknesses that could jeopardize the repayment of the debt.
Doubtful (7 rated): Loans graded Doubtful have inherent weaknesses that make collection or liquidation in full questionable. Loans graded Doubtful must be placed on non-accrual status.
Loss (8 rated): Loss rated loans are considered uncollectible and of such little value that their continuance as an active Bank asset is not warranted. The asset should be charged off, even though partial recovery may be possible in the future.
F-14
Table of Contents
Live Oak Bancshares, Inc.
Notes to Consolidated Financial Statements
Note 5. Loans and Allowance for Loan Losses (Continued)
The following tables summarize the risk grades of each category:
| Risk Grades 1 - 4 |
Risk Grade 5 |
Risk Grades 6 - 8 |
Total1 | |||||||||||||
| March 31, 2015 |
||||||||||||||||
| Commercial & Industrial |
$ | 68,832 | $ | 4,027 | $ | 13,292 | $ | 86,151 | ||||||||
| Death Care Management |
3,880 | — | — | 3,880 | ||||||||||||
| Family Entertainment Centers |
340 | — | — | 340 | ||||||||||||
| Healthcare |
7,511 | 544 | 4,891 | 12,946 | ||||||||||||
| Independent Pharmacies |
29,177 | 2,039 | 3,898 | 35,114 | ||||||||||||
| Registered Investment Advisors |
12,135 | — | — | 12,135 | ||||||||||||
| Veterinary Industry |
15,789 | 1,288 | 4,503 | 21,580 | ||||||||||||
| Other Industries |
— | 156 | — | 156 | ||||||||||||
| Construction & Development |
14,533 | — | — | 14,533 | ||||||||||||
| Agriculture |
5,460 | — | — | 5,460 | ||||||||||||
| Death Care Management |
483 | — | — | 483 | ||||||||||||
| Family Entertainment Centers |
152 | — | — | 152 | ||||||||||||
| Healthcare |
5,150 | — | — | 5,150 | ||||||||||||
| Independent Pharmacies |
456 | — | — | 456 | ||||||||||||
| Veterinary Industry |
2,676 | — | — | 2,676 | ||||||||||||
| Other Industries |
156 | — | — | 156 | ||||||||||||
| Owner Occupied Commercial Real Estate |
91,223 | 4,957 | 19,020 | 115,200 | ||||||||||||
| Agriculture |
283 | — | — | 283 | ||||||||||||
| Death Care Management |
16,944 | 627 | 1,698 | 19,269 | ||||||||||||
| Family Entertainment Centers |
761 | — | — | 761 | ||||||||||||
| Healthcare |
23,875 | 1,308 | 2,451 | 27,634 | ||||||||||||
| Independent Pharmacies |
4,539 | 40 | — | 4,579 | ||||||||||||
| Registered Investment Advisors |
2,481 | — | — | 2,481 | ||||||||||||
| Veterinary Industry |
42,038 | 2,982 | 14,595 | 59,615 | ||||||||||||
| Other Industries |
302 | — | 276 | 578 | ||||||||||||
| Commercial Land |
4,136 | — | — | 4,136 | ||||||||||||
| Agriculture |
4,136 | — | — | 4,136 | ||||||||||||
|
|
|
|
|
|
|
|
|
|||||||||
| Total |
$ | 178,724 | $ | 8,984 | $ | 32,312 | $ | 220,020 | ||||||||
|
|
|
|
|
|
|
|
|
|||||||||
F-15
Table of Contents
Live Oak Bancshares, Inc.
Notes to Consolidated Financial Statements
Note 5. Loans and Allowance for Loan Losses (Continued)
| Risk Grades 1 - 4 |
Risk Grade 5 |
Risk Grades 6 - 8 |
Total1 | |||||||||||||
| December 31, 2014 |
||||||||||||||||
| Commercial & Industrial |
$ | 63,777 | $ | 4,546 | $ | 12,734 | $ | 81,057 | ||||||||
| Death Care Management |
3,603 | — | — | 3,603 | ||||||||||||
| Family Entertainment Centers |
333 | — | — | 333 | ||||||||||||
| Healthcare |
6,995 | 538 | 4,786 | 12,319 | ||||||||||||
| Independent Pharmacies |
27,673 | 2,726 | 3,680 | 34,079 | ||||||||||||
| Registered Investment Advisors |
9,660 | — | — | 9,660 | ||||||||||||
| Veterinary Industry |
15,513 | 1,121 | 4,268 | 20,902 | ||||||||||||
| Other Industries |
— | 161 | — | 161 | ||||||||||||
| Construction & Development |
9,526 | — | — | 9,526 | ||||||||||||
| Agriculture |
3,910 | — | — | 3,910 | ||||||||||||
| Death Care Management |
92 | — | — | 92 | ||||||||||||
| Healthcare |
2,957 | — | — | 2,957 | ||||||||||||
| Independent Pharmacies |
215 | — | — | 215 | ||||||||||||
| Veterinary Industry |
2,207 | — | — | 2,207 | ||||||||||||
| Other Industries |
145 | — | — | 145 | ||||||||||||
| Owner Occupied Commercial Real Estate |
87,883 | 5,219 | 18,518 | 111,620 | ||||||||||||
| Agriculture |
259 | — | — | 259 | ||||||||||||
| Death Care Management |
16,519 | 639 | 1,721 | 18,879 | ||||||||||||
| Family Entertainment Centers |
872 | — | — | 872 | ||||||||||||
| Healthcare |
22,778 | 938 | 2,457 | 26,173 | ||||||||||||
| Independent Pharmacies |
4,709 | 41 | — | 4,750 | ||||||||||||
| Registered Investment Advisors |
2,161 | — | — | 2,161 | ||||||||||||
| Veterinary Industry |
40,281 | 3,601 | 14,052 | 57,934 | ||||||||||||
| Other Industries |
304 | — | 288 | 592 | ||||||||||||
| Commercial Land |
1,248 | — | — | 1,248 | ||||||||||||
| Agriculture |
1,248 | — | — | 1,248 | ||||||||||||
|
|
|
|
|
|
|
|
|
|||||||||
| Total |
$ | 162,434 | $ | 9,765 | $ | 31,252 | $ | 203,451 | ||||||||
|
|
|
|
|
|
|
|
|
|||||||||
| 1 | Total loans include $21.5 million of U.S. Government Guaranteed loans as of March 31, 2015, segregated by risk grade as follows: Risk Grades 1 – 4 = $0, Risk Grade 5 = $500 thousand, Risk Grades 6 – 8 = $21.0 million. As of December 31, 2014 total loans include $21.3 million of U.S. Government Guaranteed loans, segregated by risk grade as follows: Risk Grades 1 – 4 = $0, Risk Grade 5 = $1.1 million, Risk Grades 6 – 8 = $20.2 million. |
F-16
Table of Contents
Live Oak Bancshares, Inc.
Notes to Consolidated Financial Statements
Note 5. Loans and Allowance for Loan Losses (Continued)
Past Due Loans
Loans are considered past due if the required principal and interest payments have not been received as of the date such payments were due. Also, loans less than 30 days past due and accruing are included within current loans shown below. The following tables shows an age analysis of past due loans as of March 31, 2015 and December 31, 2014.
| Less Than 30 Days Past Due & Not Accruing |
30-89 Days Past Due & Accruing |
30-89 Days Past Due & Not Accruing |
Greater Than 90 Days Past Due |
Total Loans Past Due |
Current Loans |
Total Loans |
Loans 90 Days or More Past Due & Still Accruing |
|||||||||||||||||||||||||
| March 31, 2015 |
||||||||||||||||||||||||||||||||
| Commercial & Industrial |
$ | 1,030 | $ | 1,087 | $ | — | $ | 5,750 | $ | 7,867 | $ | 78,284 | $ | 86,151 | $ | — | ||||||||||||||||
| Death Care Management |
— | — | — | — | — | 3,880 | 3,880 | — | ||||||||||||||||||||||||
| Family Entertainment Centers |
— | — | — | — | — | 340 | 340 | — | ||||||||||||||||||||||||
| Healthcare |
225 | 36 | — | 2,312 | 2,573 | 10,373 | 12,946 | — | ||||||||||||||||||||||||
| Independent Pharmacies |
— | 738 | — | 1,219 | 1,957 | 33,157 | 35,114 | — | ||||||||||||||||||||||||
| Registered Investment Advisors |
— | — | — | — | — | 12,135 | 12,135 | — | ||||||||||||||||||||||||
| Veterinary Industry |
805 | 313 | — | 2,219 | 3,337 | 18,243 | 21,580 | — | ||||||||||||||||||||||||
| Other Industries |
— | — | — | — | — | 156 | 156 | — | ||||||||||||||||||||||||
| Construction & Development |
— | — | — | — | — | 14,533 | 14,533 | — | ||||||||||||||||||||||||
| Agriculture |
— | — | — | — | — | 5,460 | 5,460 | — | ||||||||||||||||||||||||
| Death Care Management |
— | — | — | — | — | 483 | 483 | — | ||||||||||||||||||||||||
| Family Entertainment Centers |
— | — | — | — | — | 152 | 152 | — | ||||||||||||||||||||||||
| Healthcare |
— | — | — | — | — | 5,150 | 5,150 | — | ||||||||||||||||||||||||
| Independent Pharmacies |
— | — | — | — | — | 456 | 456 | — | ||||||||||||||||||||||||
| Veterinary Industry |
— | — | — | — | — | 2,676 | 2,676 | — | ||||||||||||||||||||||||
| Other Industries |
— | — | — | — | — | 156 | 156 | — | ||||||||||||||||||||||||
| Owner Occupied Commercial Real Estate |
2,540 | 4,714 | 1,855 | 7,723 | 16,832 | 98,368 | 115,200 | — | ||||||||||||||||||||||||
| Agriculture |
— | — | — | — | — | 283 | 283 | — | ||||||||||||||||||||||||
| Death Care Management |
— | — | — | 1,699 | 1,699 | 17,570 | 19,269 | — | ||||||||||||||||||||||||
| Family Entertainment Centers |
— | — | — | — | — | 761 | 761 | — | ||||||||||||||||||||||||
| Healthcare |
225 | 144 | — | 2,082 | 2,451 | 25,183 | 27,634 | — | ||||||||||||||||||||||||
| Independent Pharmacies |
— | — | — | — | — | 4,579 | 4,579 | — | ||||||||||||||||||||||||
| Registered Investment Advisors |
— | — | — | — | — | 2,481 | 2,481 | — | ||||||||||||||||||||||||
| Veterinary Industry |
2,315 | 4,570 | 1,855 | 3,667 | 12,407 | 47,208 | 59,615 | — | ||||||||||||||||||||||||
| Other Industries |
— | — | — | 275 | 275 | 303 | 578 | — | ||||||||||||||||||||||||
| Commercial Land |
— | — | — | — | — | 4,136 | 4,136 | — | ||||||||||||||||||||||||
| Agriculture |
— | — | — | — | — | 4,136 | 4,136 | — | ||||||||||||||||||||||||
|
|
|
|
|
|
|
|
|
|
|
|
|
|
|
|
|
|||||||||||||||||
| Total1 |
$ | 3,570 | $ | 5,801 | $ | 1,855 | $ | 13,473 | $ | 24,699 | $ | 195,321 | $ | 220,020 | $ | — | ||||||||||||||||
|
|
|
|
|
|
|
|
|
|
|
|
|
|
|
|
|
|||||||||||||||||
F-17
Table of Contents
Live Oak Bancshares, Inc.
Notes to Consolidated Financial Statements
Note 5. Loans and Allowance for Loan Losses (Continued)
| Less Than 30 Days Past Due & Not Accruing |
30-89 Days Past Due & Accruing |
30-89 Days Past Due & Not Accruing |
Greater Than 90 Days Past Due |
Total Loans Past Due |
Current Loans |
Total Loans |
Loans 90 Days or More Past Due & Still Accruing |
|||||||||||||||||||||||||
| December 31, 2014 |
||||||||||||||||||||||||||||||||
| Commercial & Industrial | $ | 1,025 | $ | 1,433 | $ | 236 | $ | 5,872 | $ | 8,566 | $ | 72,491 | $ | 81,057 | $ | — | ||||||||||||||||
| Death Care Management |
— | — | — | — | — | 3,603 | 3,603 | — | ||||||||||||||||||||||||
| Family Entertainment Centers |
— | — | — | — | — | 333 | 333 | — | ||||||||||||||||||||||||
| Healthcare |
— | 1,059 | 232 | 2,420 | 3,711 | 8,608 | 12,319 | — | ||||||||||||||||||||||||
| Independent Pharmacies |
— | 98 | — | 1,224 | 1,322 | 32,757 | 34,079 | — | ||||||||||||||||||||||||
| Registered Investment Advisors |
— | — | — | — | — | 9,660 | 9,660 | — | ||||||||||||||||||||||||
| Veterinary Industry |
1,025 | 276 | 4 | 2,228 | 3,533 | 17,369 | 20,902 | — | ||||||||||||||||||||||||
| Other Industries |
— | — | — | — | — | 161 | 161 | — | ||||||||||||||||||||||||
| Construction & Development |
— | — | — | — | — | 9,526 | 9,526 | — | ||||||||||||||||||||||||
| Agriculture |
— | — | — | — | — | 3,910 | 3,910 | — | ||||||||||||||||||||||||
| Death Care Management |
— | — | — | — | — | 92 | 92 | — | ||||||||||||||||||||||||
| Healthcare |
— | — | — | — | — | 2,957 | 2,957 | — | ||||||||||||||||||||||||
| Independent Pharmacies |
— | — | — | — | — | 215 | 215 | — | ||||||||||||||||||||||||
| Veterinary Industry |
— | — | — | — | — | 2,207 | 2,207 | — | ||||||||||||||||||||||||
| Other Industries |
— | — | — | — | — | 145 | 145 | — | ||||||||||||||||||||||||
| Owner Occupied Commercial Real Estate |
2,464 | 5,246 | 2,181 | 6,914 | 16,805 | 94,815 | 111,620 | — | ||||||||||||||||||||||||
| Agriculture |
— | — | — | — | — | 259 | 259 | — | ||||||||||||||||||||||||
| Death Care Management |
— | — | — | 1,721 | 1,721 | 17,158 | 18,879 | — | ||||||||||||||||||||||||
| Family Entertainment Centers |
— | — | — | — | — | 872 | 872 | — | ||||||||||||||||||||||||
| Healthcare |
— | 145 | 230 | 2,082 | 2,457 | 23,716 | 26,173 | — | ||||||||||||||||||||||||
| Independent Pharmacies |
— | — | — | — | — | 4,750 | 4,750 | — | ||||||||||||||||||||||||
| Registered Investment Advisors |
— | — | — | — | — | 2,161 | 2,161 | — | ||||||||||||||||||||||||
| Veterinary Industry |
2,464 | 5,101 | 1,951 | 2,836 | 12,352 | 45,582 | 57,934 | — | ||||||||||||||||||||||||
| Other Industries |
— | — | — | 275 | 275 | 317 | 592 | — | ||||||||||||||||||||||||
| Commercial Land |
— | — | — | — | — | 1,248 | 1,248 | — | ||||||||||||||||||||||||
| Agriculture |
— | — | — | — | — | 1,248 | 1,248 | — | ||||||||||||||||||||||||
|
|
|
|
|
|
|
|
|
|
|
|
|
|
|
|
|
|||||||||||||||||
| Total1 |
$ | 3,489 | $ | 6,679 | $ | 2,417 | $ | 12,786 | $ | 25,371 | $ | 178,080 | $ | 203,451 | $ | — | ||||||||||||||||
|
|
|
|
|
|
|
|
|
|
|
|
|
|
|
|
|
|||||||||||||||||
| 1 | Total loans include $21.5 million of U.S. Government Guaranteed loans as of March 31, 2015, of which $12.3 million is greater than 90 days past due, $3.9 million is 30-89 days past due and $5.3 million is included in current loans as presented above. As of December 31, 2014, total loans include $21.3 million of U.S. Government Guaranteed loans, of which $11.7 million is greater than 90 days past due, $3.5 million is 30-89 days past due and $6.1 million is included in current loans as presented above. |
Nonaccrual Loans
Loans that become 90 days delinquent, or in cases where there is evidence that the borrower’s ability to make the required payments is impaired, are placed in nonaccrual status and interest accrual is discontinued. If interest on nonaccrual loans had been accrued in accordance with the original terms, interest income would have increased by approximately $77 and $443 thousand, for the three months ended March 31, 2015 and the year ended December 31, 2014, respectively. All nonaccrual loans are included in the held for investment portfolio.
F-18
Table of Contents
Live Oak Bancshares, Inc.
Notes to Consolidated Financial Statements
Note 5. Loans and Allowance for Loan Losses (Continued)
Nonaccrual loans as of March 31, 2015 and December 31, 2014 are as follows:
| March 31, 2015 |
Loan Balance |
Guaranteed Balance |
Unguaranteed Exposure |
|||||||||
| Commercial & Industrial |
$ | 6,780 | $ | 6,358 | $ | 422 | ||||||
| Healthcare |
2,537 | 2,306 | 231 | |||||||||
| Independent Pharmacies |
1,219 | 1,135 | 84 | |||||||||
| Veterinary Industry |
3,024 | 2,917 | 107 | |||||||||
| Owner Occupied Commercial Real Estate |
12,118 | 9,606 | 2,512 | |||||||||
| Death Care Management |
1,699 | 1,487 | 212 | |||||||||
| Healthcare |
2,307 | 1,918 | 389 | |||||||||
| Veterinary Industry |
7,837 | 5,926 | 1,911 | |||||||||
| Other Industries |
275 | 275 | — | |||||||||
|
|
|
|
|
|
|
|||||||
| Total |
$ | 18,898 | $ | 15,964 | $ | 2,934 | ||||||
|
|
|
|
|
|
|
|||||||
| December 31, 2014 |
Loan Balance |
Guaranteed Balance |
Unguaranteed Exposure |
|||||||||
| Commercial & Industrial |
$ | 7,133 | $ | 6,620 | $ | 513 | ||||||
| Healthcare |
2,652 | 2,368 | 284 | |||||||||
| Independent Pharmacies |
1,224 | 1,139 | 85 | |||||||||
| Veterinary Industry |
3,257 | 3,113 | 144 | |||||||||
| Owner Occupied Commercial Real Estate |
11,559 | 8,935 | 2,624 | |||||||||
| Death Care Management |
1,721 | 1,505 | 216 | |||||||||
| Healthcare |
2,312 | 1,919 | 393 | |||||||||
| Veterinary Industry |
7,251 | 5,236 | 2,015 | |||||||||
| Other Industries |
275 | 275 | — | |||||||||
|
|
|
|
|
|
|
|||||||
| Total |
$ | 18,692 | $ | 15,555 | $ | 3,137 | ||||||
|
|
|
|
|
|
|
|||||||
Allowance for Loan Loss Methodology
The methodology and the estimation process for calculating the Allowance for Loan Losses (“ALL”) is described below:
Estimated credit losses should meet the criteria for accrual of a loss contingency, i.e., a provision to the allowance for loan losses (“ALL”), set forth in GAAP. The Company’s methodology for determining the ALL is based on the requirements of GAAP, the Interagency Policy Statement on the ALL and other regulatory and accounting pronouncements. The ALL is determined by the sum of three separate components: (i) the impaired loan component, which addresses specific reserves for impaired loans; (ii) the general reserve component, which addresses reserves for pools of homogeneous loans; and (iii) an unallocated reserve component (if any) based on management’s judgment and experience. The loan pools and impaired loans are mutually exclusive; any loan that is impaired is excluded from its homogenous pool for purposes of that pool’s reserve calculation, regardless of the level of impairment.
The ALL policy for pooled loans is governed in accordance with banking regulatory guidance for homogenous pools of non-impaired loans that have similar risk characteristics. The Company follows a consistent and structured approach for assessing the need for reserves within each individual loan pool.
F-19
Table of Contents
Live Oak Bancshares, Inc.
Notes to Consolidated Financial Statements
Note 5. Loans and Allowance for Loan Losses (Continued)
Loans are considered impaired when, based on current information and events, it is probable that the creditor will be unable to collect all interest and principal payments due according to the originally contracted, or reasonably modified, terms of the loan agreement. The Company has determined that loans that meet the criteria defined below must be reviewed quarterly to determine if they are impaired.
| • | All commercial loans classified substandard or worse. |
| • | Any other delinquent loan that is in a nonaccrual status, or any loan that is delinquent more than 89 days and still accruing interest. |
| • | Any loan which has been modified such that it meets the definition of a Troubled Debt Restructuring (TDR). |
Any loan determined to be impaired is subjected to an impairment analysis, which is a calculation of the portion of the loan which is probable not to be repaid. This portion is the loan’s “impairment”, and is established as a specific reserve against the loan, or charged against the ALL.
Individual specific reserve amounts imply probability of loss and may not be carried in the reserve indefinitely. When the amount of the actual loss becomes reasonably quantifiable, the amount of the loss is charged off against the ALL, whether or not all liquidation and recovery efforts have been completed. If the total amount of the individual specific reserve that will eventually be charged off cannot yet be sufficiently quantified, but some portion of the impairment can be viewed as an imminent loss, that smaller portion should be charged off against the ALL and the individual specific reserve reduced by a corresponding amount.
For loans that have a low probability of being repaid in full, impaired loans, the reserve amount is calculated on a loan-specific basis. The Company utilizes two methods of analyzing impaired loans not guaranteed by the SBA:
| • | The Fair Market Value of Collateral utilizes the value at which the collateral could be sold considering the appraised value, appraisal discount rate, prior liens and selling costs. The amount of the reserve is the Loan Balance less the Valuation Amount. |
| • | The Present Value of Future Cash Flows takes into account the amount and timing of cash flows and the effective interest rate used to discount the cash flows. |
The allowance and the portion that relates to loans individually and collectively evaluated for impairment for three months ended March 31, 2015 and 2014 is summarized in the following tables:
| Construction & Development |
Owner Occupied Commercial Real Estate |
Commercial & Industrial |
Commercial Land |
Total | ||||||||||||||||
| March 31, 2015 |
||||||||||||||||||||
| Allowance for Loan Losses: |
||||||||||||||||||||
| Beginning Balance |
$ | 586 | $ | 2,291 | $ | 1,369 | $ | 161 | $ | 4,407 | ||||||||||
| Charge offs |
— | (79 | ) | (172 | ) | — | (251 | ) | ||||||||||||
| Recoveries |
— | 1 | — | — | 1 | |||||||||||||||
| Provision |
169 | (151 | ) | 866 | 193 | 1,077 | ||||||||||||||
|
|
|
|
|
|
|
|
|
|
|
|||||||||||
| Ending Balance |
$ | 755 | $ | 2,062 | $ | 2,063 | $ | 354 | $ | 5,234 | ||||||||||
|
|
|
|
|
|
|
|
|
|
|
|||||||||||
F-20
Table of Contents
Live Oak Bancshares, Inc.
Notes to Consolidated Financial Statements
Note 5. Loans and Allowance for Loan Losses (Continued)
| Construction & Development |
Owner Occupied Commercial Real Estate |
Commercial & Industrial |
Total | |||||||||||||
| March 31, 2014 |
||||||||||||||||
| Allowance for Loan Losses: |
||||||||||||||||
| Beginning Balance |
$ | 350 | $ | 1,511 | $ | 862 | $ | 2,723 | ||||||||
| Charge offs |
— | — | — | — | ||||||||||||
| Recoveries |
— | 63 | 4 | 67 | ||||||||||||
| Provision |
130 | 347 | (54 | ) | 423 | |||||||||||
|
|
|
|
|
|
|
|
|
|||||||||
| Ending Balance |
$ | 480 | $ | 1,921 | $ | 812 | $ | 3,213 | ||||||||
|
|
|
|
|
|
|
|
|
|||||||||
The following tables detail the recorded investment in loans related to each segment in the allowance for loan losses by portfolio segment and disaggregated on the basis of impairment evaluation methodology at March 31, 2015, December 31, 2014 and March 31, 2014:
| Construction & Development |
Owner Occupied Commercial Real Estate |
Commercial & Industrial |
Commercial Land |
Total | ||||||||||||||||
| March 31, 2015 |
||||||||||||||||||||
| Allowance for Loan Losses: |
||||||||||||||||||||
| Loans individually evaluated for impairment |
$ | — | $ | 1,044 | $ | 1,166 | $ | — | $ | 2,210 | ||||||||||
| Loans collectively evaluated for impairment |
755 | 1,018 | 897 | 354 | 3,024 | |||||||||||||||
|
|
|
|
|
|
|
|
|
|
|
|||||||||||
| Total allowance for loan losses |
$ | 755 | $ | 2,062 | $ | 2,063 | $ | 354 | $ | 5,234 | ||||||||||
|
|
|
|
|
|
|
|
|
|
|
|||||||||||
| Loans receivable1: |
||||||||||||||||||||
| Loans individually evaluated for impairment |
$ | — | $ | 15,605 | $ | 9,983 | $ | — | $ | 25,588 | ||||||||||
| Loans collectively evaluated for impairment |
14,533 | 99,595 | 76,168 | 4,136 | 194,432 | |||||||||||||||
|
|
|
|
|
|
|
|
|
|
|
|||||||||||
| Total loans receivable |
$ | 14,533 | $ | 115,200 | $ | 86,151 | $ | 4,136 | $ | 220,020 | ||||||||||
|
|
|
|
|
|
|
|
|
|
|
|||||||||||
| Construction & Development |
Owner Occupied Commercial Real Estate |
Commercial & Industrial |
Commercial Land |
Total | ||||||||||||||||
| December 31, 2014 |
||||||||||||||||||||
| Allowance for Loan Losses: |
||||||||||||||||||||
| Loans individually evaluated for impairment |
$ | — | $ | 1,051 | $ | 676 | $ | — | $ | 1,727 | ||||||||||
| Loans collectively evaluated for impairment |
586 | 1,240 | 693 | 161 | 2,680 | |||||||||||||||
|
|
|
|
|
|
|
|
|
|
|
|||||||||||
| Total allowance for loan losses |
$ | 586 | $ | 2,291 | $ | 1,369 | $ | 161 | $ | 4,407 | ||||||||||
|
|
|
|
|
|
|
|
|
|
|
|||||||||||
| Loans Receivable1: |
||||||||||||||||||||
| Loans individually evaluated for impairment |
$ | — | $ | 16,551 | $ | 10,226 | $ | — | $ | 26,777 | ||||||||||
| Loans collectively evaluated for impairment |
9,526 | 95,069 | 70,831 | 1,248 | 176,674 | |||||||||||||||
|
|
|
|
|
|
|
|
|
|
|
|||||||||||
| Total loans receivable |
$ | 9,526 | $ | 111,620 | $ | 81,057 | $ | 1,248 | $ | 203,451 | ||||||||||
|
|
|
|
|
|
|
|
|
|
|
|||||||||||
F-21
Table of Contents
Live Oak Bancshares, Inc.
Notes to Consolidated Financial Statements
Note 5. Loans and Allowance for Loan Losses (Continued)
| Construction & Development |
Owner Occupied Commercial Real Estate |
Commercial & Industrial |
Total | |||||||||||||
| March 31, 2014 |
||||||||||||||||
| Allowance for Loan Losses: |
||||||||||||||||
| Loans individually evaluated for impairment |
$ | 17 | $ | 192 | $ | 116 | $ | 325 | ||||||||
| Loans collectively evaluated for impairment |
463 | 1,729 | 696 | 2,888 | ||||||||||||
|
|
|
|
|
|
|
|
|
|||||||||
| Total allowance for loan losses |
$ | 480 | $ | 1,921 | $ | 812 | $ | 3,213 | ||||||||
|
|
|
|
|
|
|
|
|
|||||||||
| Loans Receivable1: |
||||||||||||||||
| Ending balance: |
||||||||||||||||
| Loans individually evaluated for impairment |
$ | 2,000 | $ | 10,026 | $ | 6,305 | $ | 18,331 | ||||||||
| Loans collectively evaluated for impairment |
11,526 | 69,136 | 58,943 | 139,605 | ||||||||||||
|
|
|
|
|
|
|
|
|
|||||||||
| Total loans receivable |
$ | 13,526 | $ | 79,162 | $ | 65,248 | $ | 157,936 | ||||||||
|
|
|
|
|
|
|
|
|
|||||||||
| 1 | Loans receivable includes $21.5 million of U.S. Government Guaranteed loans as of March 31, 2015, of which $19.6 million are included in loans individually evaluated for impairment and $1.9 million are included in loans collectively evaluated for impairment, as presented above. As of December 31, 2014, loans receivable includes $21.3 million of U.S. Government Guaranteed loans, of which $19.5 million are included in loans individually evaluated for impairment and $2.0 million are included in loans collectively evaluated for impairment, as presented above. Also, as of March 31, 2014, loans receivable includes $16.4 million of U.S. Government Guaranteed loans, of which $13.4 million are included in loans individually evaluated for impairment and $3.0 million are included in loans collectively evaluated for impairment, as presented above Loans individually evaluated for impairment as of March 31, 2015 and December 31, 2014 are summarized in the following tables. |
| March 31, 2015 |
Unpaid Principal Balance |
Guaranteed Balance |
Unguaranteed Exposure |
|||||||||
| Commercial & Industrial |
$ | 9,983 | $ | 8,194 | $ | 1,789 | ||||||
| Healthcare |
4,093 | 3,470 | 623 | |||||||||
| Independent Pharmacies |
2,185 | 1,484 | 701 | |||||||||
| Veterinary Industry |
3,705 | 3,240 | 465 | |||||||||
| Owner Occupied Commercial Real Estate |
15,605 | 11,815 | 3,790 | |||||||||
| Death Care Management |
1,699 | 1,487 | 212 | |||||||||
| Healthcare |
2,307 | 1,919 | 388 | |||||||||
| Veterinary Industry |
11,324 | 8,134 | 3,190 | |||||||||
| Other Industries |
275 | 275 | — | |||||||||
|
|
|
|
|
|
|
|||||||
| Total |
$ | 25,588 | $ | 20,010 | $ | 5,579 | ||||||
|
|
|
|
|
|
|
|||||||
F-22
Table of Contents
Live Oak Bancshares, Inc.
Notes to Consolidated Financial Statements
Note 5. Loans and Allowance for Loan Losses (Continued)
| December 31, 2014 |
Unpaid Principal Balance |
Guaranteed Balance |
Unguaranteed Exposure |
|||||||||
| Commercial & Industrial |
$ | 10,226 | $ | 8,341 | $ | 1,885 | ||||||
| Healthcare |
4,217 | 3,540 | 677 | |||||||||
| Independent Pharmacies |
2,203 | 1,492 | 711 | |||||||||
| Veterinary Industry |
3,806 | 3,309 | 497 | |||||||||
| Owner Occupied Commercial Real Estate |
16,551 | 11,155 | 5,396 | |||||||||
| Death Care Management |
1,721 | 1,505 | 216 | |||||||||
| Healthcare |
2,312 | 1,919 | 393 | |||||||||
| Veterinary Industry |
12,243 | 7,456 | 4,787 | |||||||||
| Other Industries |
275 | 275 | — | |||||||||
|
|
|
|
|
|
|
|||||||
| Total |
$ | 26,777 | $ | 19,496 | $ | 7,281 | ||||||
|
|
|
|
|
|
|
|||||||
The following table presents evaluated balances of loans classified as impaired at March 31, 2015, December 31, 2014 and March 31, 2014 that carried an associated reserve as compared to those with no reserve. The recorded investment includes accrued interest, net deferred loan fees or costs and any non-accreted loan discount.
| March 31, 2015 |
Unpaid Principal Balance |
Recorded Investment |
Total Reserve |
Average Recorded Investment |
Income Recognized |
|||||||||||||||
| Loans with no allowance |
$ | 1,097 | $ | 1,082 | $ | — | $ | 2,004 | $ | 5 | ||||||||||
| Commercial & Industrial |
236 | 233 | — | 378 | 3 | |||||||||||||||
| Healthcare |
3 | 3 | — | 96 | — | |||||||||||||||
| Independent Pharmacies |
192 | 192 | — | 86 | 3 | |||||||||||||||
| Veterinary Industry |
41 | 38 | — | 196 | — | |||||||||||||||
| Owner Occupied Commercial Real Estate |
861 | 849 | — | 1,626 | 2 | |||||||||||||||
| Healthcare |
40 | 40 | — | 149 | — | |||||||||||||||
| Veterinary Industry |
821 | 809 | — | 1,477 | 2 | |||||||||||||||
| Loans with an allowance |
24,491 | 24,476 | 2,210 | 23,122 | 72 | |||||||||||||||
| Commercial & Industrial |
9,748 | 9,765 | 1,166 | 8,991 | 35 | |||||||||||||||
| Healthcare |
4,090 | 4,089 | 821 | 3,652 | 23 | |||||||||||||||
| Independent Pharmacies |
1,993 | 1,991 | 210 | 1,731 | 9 | |||||||||||||||
| Veterinary Industry |
3,665 | 3,685 | 135 | 3,608 | 3 | |||||||||||||||
| Owner Occupied Commercial Real Estate |
14,743 | 14,711 | 1,044 | 14,131 | 37 | |||||||||||||||
| Death Care Management |
1,699 | 1,697 | 11 | 1,532 | — | |||||||||||||||
| Healthcare |
2,267 | 2,263 | 79 | 1,987 | — | |||||||||||||||
| Veterinary Industry |
10,502 | 10,477 | 952 | 10,329 | 37 | |||||||||||||||
| Other Industries |
275 | 274 | 2 | 283 | — | |||||||||||||||
|
|
|
|
|
|
|
|
|
|
|
|||||||||||
| Total |
$ | 25,588 | $ | 25,558 | $ | 2,210 | $ | 25,126 | $ | 77 | ||||||||||
|
|
|
|
|
|
|
|
|
|
|
|||||||||||
F-23
Table of Contents
Live Oak Bancshares, Inc.
Notes to Consolidated Financial Statements
Note 5. Loans and Allowance for Loan Losses (Continued)
| December 31, 2014 |
Unpaid Principal Balance |
Recorded Investment |
Total Reserve |
Average Recorded Investment |
Interest Income Recognized |
|||||||||||||||
| Loans with no allowance |
$ | 1,213 | $ | 1,197 | $ | — | $ | 1,998 | $ | 113 | ||||||||||
| Commercial & Industrial |
239 | 237 | — | 363 | 64 | |||||||||||||||
| Healthcare |
3 | 3 | — | 88 | 2 | |||||||||||||||
| Independent Pharmacies |
194 | 194 | — | 86 | 57 | |||||||||||||||
| Veterinary Industry |
42 | 40 | — | 189 | 5 | |||||||||||||||
| Owner Occupied Commercial Real Estate |
974 | 960 | — | 1,635 | 49 | |||||||||||||||
| Death Care Management |
— | — | — | 66 | — | |||||||||||||||
| Healthcare |
41 | 41 | — | 147 | — | |||||||||||||||
| Veterinary Industry |
933 | 919 | — | 1,422 | 49 | |||||||||||||||
| Loans with an allowance |
25,564 | 23,805 | 1,727 | 20,076 | 361 | |||||||||||||||
| Commercial & Industrial |
9,987 | 9,747 | 676 | 6,583 | 97 | |||||||||||||||
| Healthcare |
4,214 | 4,202 | 361 | 3,333 | 38 | |||||||||||||||
| Independent Pharmacies |
2,009 | 2,005 | 206 | 621 | 17 | |||||||||||||||
| Veterinary Industry |
3,764 | 3,540 | 109 | 2,629 | 42 | |||||||||||||||
| Owner Occupied Commercial Real Estate |
15,577 | 14,058 | 1,051 | 13,493 | 264 | |||||||||||||||
| Death Care Management |
1,721 | 1,720 | 20 | 414 | — | |||||||||||||||
| Healthcare |
2,271 | 2,268 | 82 | 1,967 | — | |||||||||||||||
| Veterinary Industry |
11,310 | 9,796 | 947 | 11,036 | 264 | |||||||||||||||
| Other Industries |
275 | 274 | 2 | 76 | — | |||||||||||||||
|
|
|
|
|
|
|
|
|
|
|
|||||||||||
| Total |
$ | 26,777 | $ | 25,002 | $ | 1,727 | $ | 22,074 | $ | 474 | ||||||||||
|
|
|
|
|
|
|
|
|
|
|
|||||||||||
| March 31, 2014 |
Unpaid Principal Balance |
Recorded Investment |
Total Reserve |
Average Recorded Investment |
Income Recognized |
|||||||||||||||
| Loans with no allowance |
$ | 1,158 | $ | 1,073 | $ | — | $ | 1,140 | $ | 34 | ||||||||||
| Commercial & Industrial |
222 | 219 | — | 148 | 3 | |||||||||||||||
| Healthcare |
92 | 90 | — | 41 | — | |||||||||||||||
| Veterinary Industry |
130 | 129 | — | 107 | 3 | |||||||||||||||
| Owner Occupied Commercial Real Estate |
936 | 854 | — | 992 | 31 | |||||||||||||||
| Veterinary Industry |
936 | 854 | — | 992 | 31 | |||||||||||||||
| Loans with an allowance |
17,173 | 16,497 | 325 | 16,066 | 82 | |||||||||||||||
| Commercial & Industrial |
6,083 | 5,644 | 116 | 5,362 | 14 | |||||||||||||||
| Healthcare |
2,150 | 1,633 | 7 | 1,589 | — | |||||||||||||||
| Veterinary Industry |
3,933 | 4,011 | 109 | 3,773 | 14 | |||||||||||||||
| Owner Occupied Commercial Real Estate |
11,090 | 10,853 | 209 | 10,704 | 68 | |||||||||||||||
| Dental Industry |
1,127 | 1,152 | 2 | 1,054 | — | |||||||||||||||
| Veterinary Industry |
9,963 | 9,701 | 207 | 9,650 | 68 | |||||||||||||||
| Total |
$ | 18,331 | $ | 17,571 | $ | 325 | $ | 17,207 | $ | 116 | ||||||||||
|
|
|
|
|
|
|
|
|
|
|
|||||||||||
F-24
Table of Contents
Live Oak Bancshares, Inc.
Notes to Consolidated Financial Statements
Note 5. Loans and Allowance for Loan Losses (Continued)
The following tables represent the types of troubled debt restructurings (“TDR”) that were made during the three months ended:
| March 31, 2015 |
Number of Loans |
Loan Balance |
Guaranteed Balance |
Unguaranteed Exposure |
||||||||||||
| Commercial & Industrial |
3 | $ | 225 | $ | — | $ | 225 | |||||||||
| Healthcare |
3 | 225 | — | 225 | ||||||||||||
| Interest Only |
3 | 225 | — | 225 | ||||||||||||
| Owner Occupied Commercial Real Estate |
1 | 40 | — | 40 | ||||||||||||
| Healthcare |
1 | 40 | — | 40 | ||||||||||||
| Interest Only |
1 | 40 | — | 40 | ||||||||||||
|
|
|
|
|
|
|
|
|
|||||||||
| Total Loans |
4 | $ | 265 | $ | — | $ | 265 | |||||||||
|
|
|
|
|
|
|
|
|
|||||||||
| March 31, 2014 |
Number of Loans |
Loan Balance |
Guaranteed Balance |
Unguaranteed Exposure |
||||||||||||
| Commercial & Industrial |
3 | $ | 218 | $ | — | $ | 218 | |||||||||
| Veterinary Industry |
3 | 218 | — | 218 | ||||||||||||
| Payment Deferral |
3 | 218 | — | 218 | ||||||||||||
|
|
|
|
|
|
|
|
|
|||||||||
| Total Loans |
3 | $ | 218 | $ | — | $ | 218 | |||||||||
|
|
|
|
|
|
|
|
|
|||||||||
The following tables represent the recorded investment in TDR loans entered into during the three months ended:
| March 31, 2015 |
Number of Loans |
Pre-modification Recorded Investment |
Post-modification Recorded Investment |
|||||||||
| Commercial & Industrial |
3 | $ | 229 | $ | 225 | |||||||
| Healthcare |
3 | 229 | 225 | |||||||||
| Interest Only |
3 | 229 | 225 | |||||||||
| Owner Occupied Commercial Real Estate |
1 | 41 | 40 | |||||||||
| Healthcare |
1 | 41 | 40 | |||||||||
| Interest Only |
1 | 41 | 40 | |||||||||
|
|
|
|
|
|
|
|||||||
| Total Loans |
4 | $ | 270 | $ | 265 | |||||||
|
|
|
|
|
|
|
|||||||
| March 31, 2014 |
Number of Loans |
Pre-modification Recorded Investment |
Post-modification Recorded Investment |
|||||||||
| Owner Occupied Commercial Real Estate |
3 | $ | 219 | $ | 218 | |||||||
| Veterinary Industry |
3 | 219 | 218 | |||||||||
| Payment Deferral |
3 | 219 | 218 | |||||||||
|
|
|
|
|
|
|
|||||||
| Total Loans |
3 | $ | 219 | $ | 218 | |||||||
|
|
|
|
|
|
|
|||||||
F-25
Table of Contents
Live Oak Bancshares, Inc.
Notes to Consolidated Financial Statements
Note 5. Loans and Allowance for Loan Losses (Continued)
Concessions made to improve a loan’s performance have varying degrees of success. The following tables present loans that were modified as TDRs within the twelve months ending March 31, 2015 and 2014, for which there was a payment default:
| March 31, 2015 |
Post-modification | |||||||
| Number of Loans |
Recorded Investment |
|||||||
| Default (Charge-Off) |
||||||||
| Owner Occupied Commercial Real Estate |
2 | $ | 1,771 | |||||
| Death Care Management |
1 | 1,697 | ||||||
| Payment Deferral |
1 | 1,697 | ||||||
| Veterinary Industry |
1 | 74 | ||||||
| Interest Only |
1 | 74 | ||||||
| Default (NonAccrual) |
||||||||
| Commercial & Industrial |
3 | 223 | ||||||
| Healthcare |
3 | 223 | ||||||
| Interest Only |
3 | 223 | ||||||
| Owner Occupied Commercial Real Estate |
1 | 40 | ||||||
| Healthcare |
1 | 40 | ||||||
| Interest Only |
1 | 40 | ||||||
| No Defaults (paying as restructured) |
||||||||
| Commercial & Industrial |
2 | 308 | ||||||
| Independent Pharmacies |
2 | 308 | ||||||
| Extend Amortization |
1 | 167 | ||||||
| Interest Only |
1 | 140 | ||||||
| Total Loans |
8 | 2,341 | ||||||
| Total TDRs paying as restructured |
2 | 308 | ||||||
|
|
|
|
|
|||||
| Total TDRs |
8 | $ | 2,341 | |||||
|
|
|
|
|
|||||
| March 31, 2014 |
Post-modification | |||||||
| Number of Loans |
Recorded Investment |
|||||||
| Default (Charge-Off) |
1 | $ | 61 | |||||
| Owner Occupied Commercial Real Estate |
1 | 61 | ||||||
| Veterinary Industry |
1 | 61 | ||||||
| Extend Amortization, Interest Only |
1 | 61 | ||||||
| Default (NonAccrual) |
||||||||
| Owner Occupied Commercial Real Estate |
3 | 218 | ||||||
| Veterinary Industry |
3 | 218 | ||||||
| Payment Deferral |
3 | 218 | ||||||
| Total Loans |
4 | 279 | ||||||
| Total TDRs paying as restructured |
— | — | ||||||
|
|
|
|
|
|||||
| Total TDRs |
4 | $ | 279 | |||||
|
|
|
|
|
|||||
F-26
Table of Contents
Live Oak Bancshares, Inc.
Notes to Consolidated Financial Statements
Note 6. Servicing Assets
Loans serviced for others are not included in the accompanying balance sheet. The unpaid principal balances of loans serviced for others were $1.4 billion and $1.3 billion at March 31, 2015 and December 31, 2014, respectively.
The following summarizes the activity pertaining to servicing rights:
| Three Months Ended March 31, | ||||||||
| 2015 | 2014 | |||||||
| Balance at January 1 |
$ | 34,999 | $ | 29,053 | ||||
| Additions, net |
3,336 | 1,674 | ||||||
| Changes in fair value |
122 | (620 | ) | |||||
|
|
|
|
|
|||||
| Balance at end of period |
$ | 38,457 | $ | 30,518 | ||||
|
|
|
|
|
|||||
The fair value of servicing rights was determined using discount rates ranging from 7.29% to 12.0% on March 31, 2015, and 8.1% to 14.2% on March 31, 2014. The fair value of servicing rights was determined using prepayment speeds ranging from 1.8% to 9.55% on March 31, 2015 and 4.0% to 8.67% on March 31, 2014, depending on the stratification of the specific right. Changes to fair value are reported in net gains on sales of loans.
The fair value of servicing rights is highly sensitive to changes in the above underlying assumptions. Changes in prepayment speed assumptions have the most significant impact on the fair value of servicing rights. Generally, as interest rates rise on variable rate loans, loan prepayments increase due to an increase in refinance activity, which results in a decrease in the fair value of servicing assets. Measurement of fair value is limited to the conditions existing and the assumptions used as of a particular point in time, and those assumptions may not be appropriate if they are applied at a different time.
F-27
Table of Contents
Live Oak Bancshares, Inc.
Notes to Consolidated Financial Statements
Note 7. Borrowings
As of March 31, 2015 and December 31, 2014 total outstanding short and long-term borrowings consisted of the following:
| March 31, 2015 |
December 31, 2014 |
|||||||
| Short term borrowings |
||||||||
| On September 18, 2014, the Company entered into a line of credit of $6.1 million with an unaffiliated commercial bank, secured by 1,900,000 shares of nCino common stock. At December 31, 2014 there was $6.1 million advanced on the line of credit. Interest accrues at 30 day LIBOR (.16% at December 31, 2014) plus 3.50% for a term of 12 months. Payments are interest only with all principal and accrued interest due on September 18, 2015. This loan was paid in full on February 23, 2015. | $ | — | $ | 6,100 | ||||
|
|
|
|
|
|||||
| Total short term borrowings |
$ | — | $ | 6,100 | ||||
|
|
|
|
|
|||||
| Long term borrowings |
||||||||
| In April 2011, the Company elected to participate in the U.S. Treasury’s Small Business Lending Fund program (“SBLF”) whereby the U.S. Treasury agreed to purchase $6.8 million in senior securities. During the initial interest period the applicable interest rate is set at 1.5%. For all remaining interest periods, which commenced on January 1, 2012, the interest rate is determined based on a formula which encompasses the percentage change in qualified lending as well as a non-qualifying portion percentage. This rate can range from 1.5% to 10.8%. At March 31, 2015 the interest rate was 1.50%. Interest is payable quarterly in arrears. With the approval of the Bank’s regulator, the Bank may exit the Small Business Lending Fund at any time simply by repaying the funding provided along with any accrued but unpaid interest. If the institution wishes to repay its SBLF funding in partial payments, each partial payment must be at least 25% of the original funding amount. All senior securities will mature on September 13, 2021 at which time all principal and accrued interest will be due. | $ | 6,800 | $ | 6,800 | ||||
| On May 12, 2014, Independence Aviation financed the purchase of an airplane by entering into a promissory note with the same aforementioned unaffiliated commercial bank in the amount of $6 million which carries a fixed rate of 4.97% for a term of 59 months. Monthly payments are set at $48 thousand with all principal and accrued interest due on May 12, 2019. | 5,771 | 5,842 | ||||||
| On September 11, 2014, The Company financed the construction of an additional building located on the Company’s Tiburon Drive main campus for a $24 million construction line of credit with an unaffiliated commercial bank, secured by both properties at its Tiburon Drive main facility location. Payments are interest only through September 11, 2016 at a fixed rate of 3.95% for a term of 84 months. Monthly principal and interest payments beginning in October 2016 will be $146 thousand with all principal and accrued interest due on September 11, 2021. The terms of this loan require the Company to maintain minimum capital, liquidity and Texas ratios. There is $4.5 million of remaining available credit on this construction line at March 31, 2015. | 19,507 | 16,914 | ||||||
F-28
Table of Contents
Live Oak Bancshares, Inc.
Notes to Consolidated Financial Statements
Note 7. Borrowings (Continued)
| March 31, 2015 |
December 31, 2014 |
|||||||
| On September 18, 2014, the Company entered into a note payable line of credit of $8.1 million with an unaffiliated commercial bank, with the first advance of $5 million on December 14, 2014. The note is unsecured and accrues interest at LIBOR plus 3.50% for a term of 36 months. Payments are interest only with all principal and accrued interest due on September 18, 2017. There is $3.1 million of remaining available credit on this note at March 31, 2015. | 5,000 | 5,000 | ||||||
| On August 1, 2014, the Company entered into a note payable line of credit of $15 million with an unaffiliated commercial bank, secured by 100% of Live Oak Banking Company’s outstanding common stock. Interest accrues at LIBOR plus 4.00% for a term of 36 months. Payments are interest only with all principal and accrued interest due on August 1, 2017. The terms of this loan require the Company to maintain minimum capital, liquidity and Texas ratios. There is $7.8 million of remaining available credit on this line of credit at March 31, 2015. | 7,210 | 7,210 | ||||||
| On March 10, 2015, Independence Aviation refinanced an existing loan with Live Oak Banking Company and entered into a new loan with an unaffiliated commercial bank in the amount of $1.2 million which carries a fixed rate of 4.96% for a term of 51 months. Monthly payments are set at $9 thousand with all principal and accrued interest due on June 10, 2019. | 1,195 | — | ||||||
| On February 23, 2015 the Company transferred two related party loans to an unrelated third party financial institution in exchange for $4.7 million. The exchange price equated to the unpaid principal balance plus accrued but uncollected interest at the time of transfer. The terms of the transfer agreement with the third party institution identified the transaction as a secured borrowing for accounting purposes. Interest accrues at prime plus 1% with monthly principal and interest payments over a term of 60 months. Maturity date is October 5, 2019. The pledged collateral is classified in other assets with a fair value of $4.6 million at March 31, 2015. Underlying loans carry a risk grade of 3 and are current with no delinquencies. The terms of this loan require the Company to maintain minimum capital, liquidity and Texas ratios. | 4,675 | — | ||||||
| With the acquisition of GLS on September 1, 2013, the Company assumed the obligation to pay a former GLS partner $250 thousand at $10 thousand a month over a 24 month period. | 52 | 83 | ||||||
|
|
|
|
|
|||||
| Total long term borrowings |
$ | 50,210 | $ | 41,849 | ||||
|
|
|
|
|
|||||
Note 8. Fair Value of Financial Instruments
Fair Value Hierarchy
There are three levels of inputs in the fair value hierarchy that may be used to measure fair value. Financial instruments are considered Level 1 when valuation can be based on quoted prices in active markets for identical assets or liabilities. Level 2 financial instruments are valued using quoted prices for similar assets or liabilities; quoted prices in markets that are not active; or models using inputs that are observable or can be corroborated by observable market data of substantially the full term of the assets or liabilities. Financial instruments are considered Level 3 when their values are determined using pricing models, discounted cash flow methodologies or similar techniques and at least one significant model assumption or input is unobservable and when determination of the fair value requires significant management judgment or estimation.
F-29
Table of Contents
Live Oak Bancshares, Inc.
Notes to Consolidated Financial Statements
Note 8. Fair Value of Financial Instruments (Continued)
Financial Instruments Measured at Fair Value
The following sections provide a description of the valuation methodologies used for instruments measured at fair value, as well as the general classification of such instruments pursuant to the fair value hierarchy:
Securities: Where quoted prices are available in an active market, securities are classified within Level 1 of the valuation hierarchy. Level 1 securities would include highly liquid government bonds, mortgage products and exchange traded equities. If quoted market prices are not available, then fair values are estimated by using pricing models, quoted prices of securities with similar characteristics, or discounted cash flow. Level 2 securities would include U.S. agency securities, mortgage-backed agency securities, obligations of states and political subdivisions and certain corporate, asset backed and other securities. In certain cases where there is limited activity or less transparency around inputs to the valuation, securities are classified within Level 3 of the valuation hierarchy.
Impaired Loans: Impairment of a loan is based on the fair value of the collateral of the loan for collateral-dependent loans. Fair value of the loan’s collateral, when the loan is dependent on collateral, is determined by appraisals or independent valuation which is then adjusted for the cost related to liquidation of the collateral. For non-collateral dependent loans impairment is determined by the present value of expected future cash flows. Impaired loans classified as Level 3 are based on management’s judgment and estimation.
Servicing Assets: Servicing rights do not trade in an active, open market with readily observable prices. While sales of servicing rights do occur, the precise terms and conditions typically are not readily available. Accordingly, the Company estimates the fair value of servicing rights using discounted cash flow models incorporating numerous assumptions from the perspective of market participant including servicing income, servicing costs, market discount rates and prepayment speeds. Due to the nature of the valuation inputs, servicing rights are classified within Level 3 of the valuation hierarchy.
Foreclosed Assets: Foreclosed real estate is adjusted to fair value less selling costs upon transfer of the loans to foreclosed real estate. Subsequently, foreclosed real estate is carried at the lower of carrying value or fair value less selling costs. Fair value is based upon independent market prices, appraised values of the collateral or management’s estimation of the value of the collateral. When the fair value of the collateral is based on an observable market price or a current appraised value, the Company records the foreclosed asset as nonrecurring Level 2. When an appraised value is not available or management determines the fair value of the collateral is further impaired below the appraised value and there is no observable market price, the Company records foreclosed real estate as nonrecurring Level 3. Foreclosed assets classified as Level 3 are based on management’s judgment and estimation.
F-30
Table of Contents
Live Oak Bancshares, Inc.
Notes to Consolidated Financial Statements
Note 8. Fair Value of Financial Instruments (Continued)
Recurring Fair Value
The tables below present the recorded amount of assets and liabilities measured at fair value on a recurring basis.
| March 31, 2015 |
Total | Level 1 | Level 2 | Level 3 | ||||||||||||
| Investment securities available-for-sale |
||||||||||||||||
| US government agencies |
$ | 35,498 | $ | — | $ | 35,498 | $ | — | ||||||||
| Residential mortgage backed securities |
13,379 | — | 13,379 | — | ||||||||||||
| Mutual fund |
1,900 | 1,900 | — | — | ||||||||||||
| Servicing assets1 |
38,457 | — | — | 38,457 | ||||||||||||
|
|
|
|
|
|
|
|
|
|||||||||
| Total assets at fair value |
$ | 89,234 | $ | 1,900 | $ | 48,877 | $ | 38,457 | ||||||||
|
|
|
|
|
|
|
|
|
|||||||||
| December 31, 2014 |
Total | Level 1 | Level 2 | Level 3 | ||||||||||||
| Investment securities available-for-sale |
||||||||||||||||
| US government agencies |
$ | 35,309 | $ | — | $ | 35,309 | $ | — | ||||||||
| Residential mortgage backed securities |
14,009 | — | 14,009 | — | ||||||||||||
| Servicing assets1 |
34,999 | — | — | 34,999 | ||||||||||||
|
|
|
|
|
|
|
|
|
|||||||||
| Total assets at fair value |
$ | 84,317 | $ | — | $ | 49,318 | $ | 34,999 | ||||||||
|
|
|
|
|
|
|
|
|
|||||||||
| 1 | See Note 6 for a rollforward of recurring Level 3 fair values for servicing assets. |
Non-recurring Fair Value
The tables below present the recorded amount of assets and liabilities measured at fair value on a non-recurring basis.
| March 31, 2015 |
Total | Level 1 | Level 2 | Level 3 | ||||||||||||
| Impaired loans |
$ | 22,351 | $ | — | $ | — | $ | 22,351 | ||||||||
| Foreclosed assets |
34 | — | — | 34 | ||||||||||||
|
|
|
|
|
|
|
|
|
|||||||||
| Total assets at fair value |
$ | 22,385 | $ | — | $ | — | $ | 22,385 | ||||||||
|
|
|
|
|
|
|
|
|
|||||||||
| December 31, 2014 |
Total | Level 1 | Level 2 | Level 3 | ||||||||||||
| Impaired loans |
$ | 24,016 | $ | — | $ | — | $ | 24,016 | ||||||||
| Foreclosed assets |
371 | — | — | 371 | ||||||||||||
|
|
|
|
|
|
|
|
|
|||||||||
| Total assets at fair value |
$ | 24,387 | $ | — | $ | — | $ | 24,387 | ||||||||
|
|
|
|
|
|
|
|
|
|||||||||
F-31
Table of Contents
Live Oak Bancshares, Inc.
Notes to Consolidated Financial Statements
Note 8. Fair Value of Financial Instruments (Continued)
Level 3 Analysis
For Level 3 assets and liabilities measured at fair value on a recurring or non-recurring basis as of March 31, 2015 and December 31, 2014 the significant unobservable inputs used in the fair value measurements were as follows:
| March 31, 2015 |
Fair Value | Valuation Technique |
Significant Unobservable Inputs |
Range | ||||||
| Level 3 Assets with Significant |
||||||||||
| Impaired Loans |
$ | 22,351 | Discounted appraisals | Appraisal adjustments(1) | 10% to 20% | |||||
| Discounted expected cash flows | Interest rate & repayment term | Weighted Average discount rate 4.88% | ||||||||
| Foreclosed Assets |
$ | 34 | Discounted appraisals | Appraisal adjustments(1) | 10% to 20% | |||||
| December 31, 2014 |
Fair Value | Valuation Technique |
Significant Unobservable Inputs |
Range | ||||||
| Level 3 Assets with Significant |
||||||||||
| Impaired Loans |
$ | 24,016 | Discounted appraisals | Appraisal adjustments(1) | 10% to 20% | |||||
| Discounted expected cash flows | Interest rate & repayment term | Weighted Average discount rate 4.88% | ||||||||
| Foreclosed Assets |
$ | 371 | Discounted appraisals | Appraisal adjustments(1) | 10% to 20% | |||||
| (1) | Appraisals may be adjusted by management for customized discounting criteria, estimated sales costs, and proprietary qualitative adjustments. |
Estimated Fair Value of Other Financial Instruments
GAAP also requires disclosure of fair value information about financial instruments carried at book value in the balance sheet. In cases where quoted market prices are not available, fair values are based on estimates using present value or other valuation techniques. Those techniques are significantly affected by the assumptions used, including the discount rate and estimates of future cash flows. In that regard, the derived fair value estimates cannot be substantiated by comparison to independent markets and, in many cases, could not be realized in immediate settlement of the instruments. Accordingly, the aggregate fair value amounts presented do not represent the underlying value of the Company.
The following methods and assumptions were used by the Company in estimating its fair value disclosures for financial instruments not measured at fair value on the balance sheets:
Cash and due from banks: The carrying amounts reported in the balance sheet for cash and due from banks approximate their fair values.
Certificates of Deposit with Other Banks: The fair value of certificates of deposit with other banks is estimated based on discounting cash flows using the rates currently offered for instruments of similar remaining maturities.
F-32
Table of Contents
Live Oak Bancshares, Inc.
Notes to Consolidated Financial Statements
Note 8. Fair Value of Financial Instruments (Continued)
Loans: For variable-rate loans that reprice frequently and with no significant change in credit risk, fair values are based on carrying amounts. The fair values for other loans are estimated using discounted cash flow analysis, based on interest rates currently being offered for loans with similar terms to borrowers of similar credit quality. Loan fair value estimates include judgments regarding future expected loss experience and risk characteristics. Fair values for impaired loans are estimated using discounted cash flow analysis or underlying collateral values, where applicable.
Loans held for sale: The fair values of loans held for sale are based on quoted market prices, where available, and determined by discounting estimated cash flows using interest rates approximating the Company’s current origination rates for similar loans adjusted to reflect the inherent credit risk.
Accrued Interest: The carrying amounts of accrued interest approximate fair value.
Servicing assets: The fair values of servicing assets are based upon discounted cash flows using market-based assumptions.
Deposits: The fair values disclosed for demand deposits (e.g., interest and non-interest checking, passbook savings, and certain types of money market accounts) are, by definition, equal to the amount payable on demand at the reporting date (i.e., their carrying amounts). The carrying amounts of variable-rate, fixed-term money market accounts and certificates of deposit approximate their fair values at the reporting date. Fair values for fixed-rate certificates of deposit are estimated using a discounted cash flow calculation that applies interest rates currently being offered on certificates to a schedule of aggregated expected monthly maturities on time deposits.
Short and long term borrowings: The fair values of the Company’s borrowings are estimated using discounted cash flow analyses based on the Company’s current incremental debt rates for similar types of debt arrangements.
F-33
Table of Contents
Live Oak Bancshares, Inc.
Notes to Consolidated Financial Statements
Note 8. Fair Value of Financial Instruments (Continued)
The carrying amounts and estimated fair values of the Company’s financial instruments are as follows:
| March 31, 2015 |
Carrying Amount |
Quoted Price In Active Markets for Identical Assets /Liabilities (Level 1) |
Significant Other Observable Inputs (Level 2) |
Significant Unobservable Inputs (Level 3) |
Ending Balance |
|||||||||||||||
| Financial assets |
||||||||||||||||||||
| Cash and due from banks |
$ | 47,564 | $ | 47,564 | $ | — | $ | — | $ | 47,564 | ||||||||||
| Certificates of deposit with other banks |
10,000 | 10,104 | — | — | 10,104 | |||||||||||||||
| Investment securities, available for sale |
50,777 | 1,900 | 48,877 | — | 50,777 | |||||||||||||||
| Loans held for sale |
305,079 | — | — | 315,965 | 315,965 | |||||||||||||||
| Loans, net of allowance for loan losses |
215,210 | — | — | 204,364 | 204,364 | |||||||||||||||
| Servicing assets |
38,457 | — | — | 38,457 | 38,457 | |||||||||||||||
| Accrued interest receivable |
3,625 | 3,625 | — | — | 3,625 | |||||||||||||||
| Financial liabilities |
||||||||||||||||||||
| Deposits |
556,083 | — | 558,276 | — | 558,276 | |||||||||||||||
| Accrued interest payable |
192 | 192 | — | — | 192 | |||||||||||||||
| Long term borrowings |
50,210 | — | — | 50,581 | 50,581 | |||||||||||||||
| December 31, 2014 |
Carrying Amount |
Quoted Price In Active Markets for Identical Assets /Liabilities (Level 1) |
Significant Other Observable Inputs (Level 2) |
Significant Unobservable Inputs (Level 3) |
Ending Balance |
|||||||||||||||
| Financial assets |
||||||||||||||||||||
| Cash and due from banks |
$ | 29,902 | $ | 29,902 | $ | — | $ | — | $ | 29,902 | ||||||||||
| Certificates of deposit with other banks |
10,000 | 9,861 | — | — | 9,861 | |||||||||||||||
| Investment securities, available for sale |
49,318 | — | 49,318 | — | 49,318 | |||||||||||||||
| Loans held for sale |
295,180 | — | — | 304,504 | 304,504 | |||||||||||||||
| Loans, net of allowance for loan losses |
199,529 | — | — | 194,007 | 194,007 | |||||||||||||||
| Servicing assets |
34,999 | — | — | 34,999 | 34,999 | |||||||||||||||
| Accrued interest receivable |
3,059 | 3,059 | — | — | 3,059 | |||||||||||||||
| Financial liabilities |
||||||||||||||||||||
| Deposits |
522,080 | — | 522,058 | — | 522,058 | |||||||||||||||
| Accrued interest payable |
190 | 190 | — | — | 190 | |||||||||||||||
| Short term borrowings |
6,100 | — | — | 6,100 | 6,100 | |||||||||||||||
| Long term borrowings |
41,849 | — | — | 44,738 | 44,738 | |||||||||||||||
Note 9. Commitments and Contingencies
Litigation
In the normal course of business the Company is involved in various legal proceedings. Management believes that the outcome of such proceedings will not materially affect the financial position, results of operations or cash flows of the Company.
F-34
Table of Contents
Live Oak Bancshares, Inc.
Notes to Consolidated Financial Statements
Note 9. Commitments and Contingencies (Continued)
Financial Instruments with Off-balance-sheet Risk
The Company is party to financial instruments with off-balance-sheet risk in the normal course of business to meet the financing needs of its customers. These financial instruments include commitments to extend credit and standby letters of credit. These instruments involve, to varying degrees, credit risk in excess of the amount recognized in the balance sheet.
The Company’s exposure to credit loss in the event of nonperformance by the other party to the financial instrument for commitments to extend credit and standby letters of credit is represented by the contractual amount of those instruments. The Company uses the same credit policies in making commitments and conditional obligations as for on-balance-sheet instruments. A summary of the Company’s commitments at March 31, 2015 and December 31, 2014 is as follows:
| March 31, 2015 |
December 31, 2014 |
|||||||
| Commitments to extend credit |
$ | 584,698 | $ | 537,951 | ||||
| Plexus Capital—Fund II Investment Commitment |
100 | 100 | ||||||
| Plexus Capital—Fund III Investment Commitment |
350 | 350 | ||||||
|
|
|
|
|
|||||
| Total unfunded off-balance sheet credit risk |
$ | 585,148 | $ | 538,401 | ||||
|
|
|
|
|
|||||
Commitments to extend credit are agreements to lend to a customer as long as there is no violation of any condition established in the contract. Commitments generally have fixed expiration dates or other termination clauses and may require payment of a fee. Since many of the commitments are expected to expire without being drawn upon, the total commitment amounts do not necessarily represent future cash requirements. The Company evaluates each customer’s creditworthiness on a case-by-case basis. The amount of collateral obtained, if deemed necessary by the Company upon extension of credit, is based on management’s credit evaluation of the party. Collateral held varies, but may include accounts receivable, inventory, property and equipment, residential real estate and income-producing commercial properties. In 2012, the Company began issuing commitment letters after approval of the loan by the Credit Department. The commitment letter expires ninety days after the issuance.
Standby letters of credit are conditional commitments issued by the Company to guarantee the performance of a customer to a third party. Those guarantees are primarily issued to support public and private borrowing arrangements. The credit risk involved in issuing letters of credit is essentially the same as that involved in extending loan facilities to customers. Collateral held varies as specified above and is required in instances which the Company deems necessary. There were no standby letters of credit for the periods presented.
Concentrations of Credit Risk
Although the Company is not subject to any geographic concentrations, a substantial amount of the Company’s loans and commitments to extend credit have been granted to customers in the independent pharmacy and veterinary verticals. The concentrations of credit by type of loan are set forth in Note 4. The distribution of commitments to extend credit approximates the distribution of loans outstanding. The Company does not have a significant number of credits to any single borrower or group of related borrowers whereby their retained exposure exceeds $2.0 million.
The Company from time-to-time may have cash and cash equivalents on deposit with financial institutions that exceed federally-insured limits.
F-35
Table of Contents
Live Oak Bancshares, Inc.
Notes to Consolidated Financial Statements
Note 10. Stock Plans
On March 20, 2015, the Company adopted the 2015 Omnibus Plan which replaced the previously existing Incentive Stock Option (ISO) Plan and Non-Qualified Stock Option (NQSO) Plan. The 2015 Omnibus Plan authorized a maximum of 4,300,000 common voting shares with an expiration date of March 20, 2025. Options or restricted shares granted under this plan expire no more than 10 years from date of grant. Exercise prices under the plan are set by the Board of Directors at the date of grant, but shall not be less than 100% of fair market value of the related stock at the date of the grant.
Stock Options
Compensation cost relating to share-based payment transactions are recognized in the financial statements with measurement based upon the fair value of the equity or liability instruments issued. For the quarters ended March 31, 2015 and 2014, the Company recognized $118 thousand and $37 thousand in compensation expense for stock options, respectively.
Stock option activity under the plan during the first quarter of 2015 is summarized below.
| Shares | Weighted Average Exercise Price |
Weighted Average Remaining Contractual Term |
Aggregate Intrinsic Value |
|||||||||||||
| Outstanding at December 31, 2014 |
1,740,770 | $ | 5.52 | — | $ | — | ||||||||||
| Exercised |
3,679 | 4.40 | — | — | ||||||||||||
| Forfeited |
20,823 | 5.10 | — | — | ||||||||||||
| Granted |
394,753 | 10.63 | — | — | ||||||||||||
|
|
|
|
|
|||||||||||||
| Outstanding at March 31, 2015 |
2,111,021 | $ | 6.48 | 9.19 years | $ | 8,759,162 | ||||||||||
|
|
|
|
|
|
|
|
|
|||||||||
| Exercisable at March 31, 2015 |
180,509 | $ | 3.87 | 8.54 years | $ | 1,220,457 | ||||||||||
|
|
|
|
|
|
|
|
|
|||||||||
The following is a summary of non-vested stock option activity for the Company for the quarter ended March 31, 2015.
| Shares | Weighted Average Grant Date Fair Value |
|||||||
| Non-vested at December 31, 2014 |
1,707,430 | $ | 1.19 | |||||
| Granted |
394,753 | 3.87 | ||||||
| Vested |
150,848 | 0.58 | ||||||
| Forfeited |
20,823 | 0.95 | ||||||
|
|
|
|
|
|||||
| Non-vested at March 31, 2015 |
1,930,512 | $ | 1.79 | |||||
|
|
|
|
|
|||||
F-36
Table of Contents
Live Oak Bancshares, Inc.
Notes to Consolidated Financial Statements
Note 10. Stock Plans (Continued)
Restricted Stock
Restricted stock activity under the plan during the first quarter of 2015 is summarized below.
| Shares | Weighted Average Exercise Price |
|||||||
| Outstanding at December 31, 2014 |
— | $ | — | |||||
| Vested |
— | — | ||||||
| Forfeited |
— | — | ||||||
| Granted |
9,243 | 10.63 | ||||||
|
|
|
|
|
|||||
| Outstanding at March 31, 2015 |
9,243 | $ | 10.63 | |||||
|
|
|
|
|
|||||
| Non-vested at March 31, 2015 |
9,243 | $ | 10.63 | |||||
|
|
|
|
|
|||||
For the quarters ended March 31, 2015 and 2014, the Company recognized $8 thousand and $143 thousand in compensation expense for restricted stock, respectively.
At March 31, 2015, unrecognized compensation costs relating to stock options amounted to $3.3 million which will be expensed over the next 6.08 years. At March 31, 2015, unrecognized compensation costs relating to restricted stock amounted to $90 thousand which will be expensed over the next 3.00 years.
The weighted average fair value of each stock option grant is estimated on the date of grant using the Black-Scholes option-pricing model. The expected volatility is based on historical volatility. The risk-free interest rates for periods within the contractual life of the awards are based on the U.S. Treasury yield curve in effect at the time of the grant. The expected life is based on historical exercise experience. The dividend yield assumption is based on the Company’s history and expectation of dividend payouts. Weighted average assumptions used for options granted during 2015 were as follows: risk free rate of 1.64%, dividend yield of 2.35%, volatility of 43.62% and average life of 4-7 years.
Note 11. Subsequent Events
Management has evaluated subsequent events through the date the financial statements were available to be issued and determined that the following events required disclosure:
Dividend Declaration
On April 17, 2015 the Company declared a dividend of $0.03 per voting and non-voting share outstanding to shareholders of record on that date with a payment date of April 30, 2015.
F-37
Table of Contents

REPORT OF INDEPENDENT REGISTERED PUBLIC ACCOUNTING FIRM
To the Shareholders and the Board of Directors
Live Oak Bancshares, Inc.
Wilmington, North Carolina
We have audited the accompanying consolidated balance sheets of Live Oak Bancshares, Inc. (the “Company”) as of December 31, 2014, 2013 and 2012, and the related consolidated statements of income, comprehensive income, changes in shareholders’ equity and cash flows for each of the years then ended. These consolidated financial statements are the responsibility of the Company’s management. Our responsibility is to express an opinion on these consolidated financial statements based on our audits.
We conducted our audits in accordance with the standards of the Public Company Accounting Oversight Board (United States). Those standards require that we plan and perform the audit to obtain reasonable assurance about whether the financial statements are free of material misstatement. We were not engaged to perform an audit of the Company’s internal control over financial reporting. Our audit included consideration of internal control over financial reporting as a basis for designing audit procedures that are appropriate in the circumstances, but not for the purpose of expressing an opinion on the effectiveness of the Company’s internal control over financial reporting. Accordingly, we express no such opinion. An audit includes examining, on a test basis, evidence supporting the amounts and disclosures in the financial statements. An audit also includes assessing the accounting principles used and significant estimates made by management, as well as evaluating the overall financial statement presentation. We believe that our audits provide a reasonable basis for our opinion.
In our opinion, the consolidated financial statements referred to above present fairly, in all material respects, the financial position of Live Oak Bancshares, Inc. as of December 31, 2014, 2013 and 2012 and the results of their operations and their cash flows for each of the years then ended, in conformity with accounting principles generally accepted in the United States of America.
/s/ Dixon Hughes Goodman LLP
Greenville, North Carolina
March 6, 2015 (Except for the Reclassifications and Corrections described in Note 1, for which the date is May 27, 2015)
F-38
Table of Contents
Live Oak Bancshares, Inc.
December 31, 2014, 2013 and 2012
| December 31, | ||||||||||||
| 2014 | 2013 | 2012 | ||||||||||
| (In thousands) | ||||||||||||
| Assets |
||||||||||||
| Cash and due from banks |
$ | 29,902 | $ | 37,244 | $ | 44,173 | ||||||
| Certificates of deposit with other banks |
10,000 | — | — | |||||||||
| Investment securities available-for-sale |
49,318 | 19,446 | 15,416 | |||||||||
| Loans held for sale |
295,180 | 159,438 | 145,183 | |||||||||
| Loans held for investment |
203,936 | 141,349 | 92,669 | |||||||||
| Allowance for loan losses |
(4,407 | ) | (2,723 | ) | (5,108 | ) | ||||||
|
|
|
|
|
|
|
|||||||
| Net loans |
199,529 | 138,626 | 87,561 | |||||||||
| Premises and equipment, net |
35,279 | 25,036 | 18,951 | |||||||||
| Foreclosed assets |
371 | 341 | 232 | |||||||||
| Servicing assets |
34,999 | 29,053 | 24,220 | |||||||||
| Investments in non-consolidated affiliates |
6,345 | 11,467 | — | |||||||||
| Other assets |
12,392 | 9,704 | 6,732 | |||||||||
|
|
|
|
|
|
|
|||||||
| Total assets |
$ | 673,315 | $ | 430,355 | $ | 342,468 | ||||||
|
|
|
|
|
|
|
|||||||
| Liabilities and Shareholders’ Equity |
||||||||||||
| Liabilities |
||||||||||||
| Deposits: |
||||||||||||
| Noninterest-bearing |
$ | 14,728 | $ | 13,022 | $ | 2,479 | ||||||
| Interest-bearing |
507,352 | 343,598 | 284,195 | |||||||||
|
|
|
|
|
|
|
|||||||
| Total deposits |
522,080 | 356,620 | 286,674 | |||||||||
| Short term borrowings |
6,100 | — | — | |||||||||
| Long term borrowings |
41,849 | 12,325 | 12,205 | |||||||||
| Other liabilities |
11,472 | 9,415 | 10,668 | |||||||||
|
|
|
|
|
|
|
|||||||
| Total liabilities |
581,501 | 378,360 | 309,547 | |||||||||
|
|
|
|
|
|
|
|||||||
| Redeemable equity securities |
— | 3,605 | 1,161 | |||||||||
| Shareholders’ equity |
||||||||||||
| Non-cumulative perpetual preferred stock (Series A), 6,800 shares authorized, issued and outstanding |
— | — | — | |||||||||
| Preferred stock, no par value, 1,000,000 authorized, none issued or outstanding |
— | — | — | |||||||||
| Class A common stock, no par value, 100,000,000 shares authorized, 23,896,400, 20,318,330 and 20,274,950 shares issued and outstanding, respectively |
48,657 | 18,319 | 20,535 | |||||||||
| Class B common stock, no par value, 10,000,000 shares authorized, 4,723,530 shares issued and outstanding in 2014 |
50,015 | — | — | |||||||||
| Retained earnings (accumulated deficit) |
(6,493 | ) | 30,262 | 11,980 | ||||||||
| Accumulated other comprehensive income (loss) |
85 | (191 | ) | 542 | ||||||||
|
|
|
|
|
|
|
|||||||
| Total shareholders’ equity, attributed to Live Oak Bancshares, Inc. |
91,814 | 48,390 | 33,057 | |||||||||
|
|
|
|
|
|
|
|||||||
| Noncontrolling interest |
— | — | (1,297 | ) | ||||||||
|
|
|
|
|
|
|
|||||||
| Total equity |
91,814 | 48,390 | 31,760 | |||||||||
|
|
|
|
|
|
|
|||||||
| Total liabilities and shareholders’ equity |
$ | 673,315 | $ | 430,355 | $ | 342,468 | ||||||
|
|
|
|
|
|
|
|||||||
See Notes to Consolidated Financial Statements
F-39
Table of Contents
Live Oak Bancshares, Inc.
Consolidated Statements of Income
For the years ended December 31, 2014, 2013 and 2012
| December 31, | ||||||||||||
| 2014 | 2013 | 2012 | ||||||||||
| (In thousands, except per share data) | ||||||||||||
| Interest income |
||||||||||||
| Loans and fees on loans |
$ | 19,891 | $ | 14,481 | $ | 11,178 | ||||||
| Investment securities, taxable |
455 | 391 | 467 | |||||||||
| Other interest earning assets |
163 | 430 | 80 | |||||||||
|
|
|
|
|
|
|
|||||||
| Total interest income |
20,509 | 15,302 | 11,725 | |||||||||
|
|
|
|
|
|
|
|||||||
| Interest expense |
||||||||||||
| Deposits |
4,731 | 3,947 | 2,975 | |||||||||
| Borrowings |
1,121 | 574 | 653 | |||||||||
|
|
|
|
|
|
|
|||||||
| Total interest expense |
5,852 | 4,521 | 3,628 | |||||||||
|
|
|
|
|
|
|
|||||||
| Net interest income |
14,657 | 10,781 | 8,097 | |||||||||
| Provision for (recovery of) loan losses |
2,793 | (858 | ) | 2,110 | ||||||||
|
|
|
|
|
|
|
|||||||
| Net interest income after provision for loan losses |
11,864 | 11,639 | 5,987 | |||||||||
|
|
|
|
|
|
|
|||||||
| Noninterest income |
||||||||||||
| Loan servicing revenue and revaluation |
10,622 | 7,926 | 8,346 | |||||||||
| Net gains on sales of loans |
49,977 | 38,225 | 33,535 | |||||||||
| Gain on deconsolidation of subsidiary |
— | 12,212 | — | |||||||||
| Equity in loss of non-consolidated affiliates |
(2,221 | ) | (2,756 | ) | — | |||||||
| Gain (loss) on sale of sale of securities available for sale |
(74 | ) | 11 | — | ||||||||
| Other noninterest income |
1,738 | 849 | 549 | |||||||||
|
|
|
|
|
|
|
|||||||
| Total noninterest income |
60,042 | 56,467 | 42,430 | |||||||||
|
|
|
|
|
|
|
|||||||
| Noninterest expense |
||||||||||||
| Salaries and employee benefits |
29,165 | 20,766 | 17,968 | |||||||||
| Travel expense |
5,392 | 4,458 | 3,115 | |||||||||
| Professional services expense |
4,100 | 2,237 | 2,580 | |||||||||
| Advertising and marketing expense |
3,316 | 2,316 | 2,181 | |||||||||
| Occupancy expense |
1,771 | 1,678 | 679 | |||||||||
| Data processing expense |
2,660 | 1,749 | 1,420 | |||||||||
| Equipment expense |
1,422 | 1,042 | 738 | |||||||||
| Other expense |
6,644 | 5,918 | 4,938 | |||||||||
|
|
|
|
|
|
|
|||||||
| Total noninterest expense |
54,470 | 40,164 | 33,619 | |||||||||
|
|
|
|
|
|
|
|||||||
| Income before taxes |
17,436 | 27,942 | 14,798 | |||||||||
| Income tax expense |
7,388 | — | — | |||||||||
|
|
|
|
|
|
|
|||||||
| Net income |
10,048 | 27,942 | 14,798 | |||||||||
|
|
|
|
|
|
|
|||||||
| Net loss attributable to noncontrolling interest |
— | 120 | 1,297 | |||||||||
|
|
|
|
|
|
|
|||||||
| Net income attributable to Live Oak Bancshares, Inc. |
$ | 10,048 | $ | 28,062 | $ | 16,095 | ||||||
|
|
|
|
|
|
|
|||||||
| Basic earnings per share |
$ | .42 | $ | 1.38 | $ | .83 | ||||||
|
|
|
|
|
|
|
|||||||
| Diluted earnings per share |
$ | .41 | $ | 1.37 | $ | .80 | ||||||
|
|
|
|
|
|
|
|||||||
See Notes to Consolidated Financial Statements
F-40
Table of Contents
Live Oak Bancshares, Inc.
Consolidated Statements of Comprehensive Income
For the years ended December 31, 2014, 2013 and 2012
| December 31, | ||||||||||||
| 2014 | 2013 | 2012 | ||||||||||
| (In thousands) | ||||||||||||
| Net income |
$ | 10,048 | $ | 27,942 | $ | 14,798 | ||||||
| Other comprehensive income (loss) before tax: |
||||||||||||
| Net unrealized gain (loss) on investment securities arising during the period |
255 | (722 | ) | 39 | ||||||||
| Reclassification adjustment for (gain) loss on sale of securities available for sale included in net income |
74 | (11 | ) | — | ||||||||
|
|
|
|
|
|
|
|||||||
| Other comprehensive income (loss) before tax |
329 | (733 | ) | 39 | ||||||||
| Income tax expense |
53 | — | — | |||||||||
|
|
|
|
|
|
|
|||||||
| Other comprehensive income (loss), net of tax |
276 | (733 | ) | 39 | ||||||||
|
|
|
|
|
|
|
|||||||
| Total comprehensive income |
$ | 10,324 | $ | 27,209 | $ | 14,837 | ||||||
|
|
|
|
|
|
|
|||||||
See Notes to Consolidated Financial Statements
F-41
Table of Contents
Live Oak Bancshares, Inc.
Consolidated Statements of Changes in Shareholders’ Equity
For the years ended December 31, 2014, 2013 and 2012
| Common stock | Retained earnings |
Accumulated other comprehensive income (loss) |
Non- controlling interest |
Total equity |
||||||||||||||||||||||||
| Shares | ||||||||||||||||||||||||||||
| Class A | Class B | Amount | ||||||||||||||||||||||||||
| (In thousands) | ||||||||||||||||||||||||||||
| Balance at December 31, 2011 |
1,711,830 | 17,123,580 | $ | 19,696 | $ | 7,384 | $ | 503 | $ | — | $ | 27,583 | ||||||||||||||||
|
|
|
|
|
|
|
|
|
|
|
|
|
|
|
|||||||||||||||
| Net income (loss) |
— | — | — | 16,095 | — | (1,297 | ) | 14,798 | ||||||||||||||||||||
| Other comprehensive income |
— | — | — | — | 39 | — | 39 | |||||||||||||||||||||
| Sales of common stock |
23,790 | 238,180 | 588 | — | — | — | 588 | |||||||||||||||||||||
| Stock option exercise |
94,500 | 945,500 | 792 | — | — | — | 792 | |||||||||||||||||||||
| Employee stock purchase program |
12,270 | 125,300 | 289 | — | — | — | 289 | |||||||||||||||||||||
| Reclass to redeemable equity securities |
— | — | (1,161 | ) | — | — | — | (1,161 | ) | |||||||||||||||||||
| Stock option based compensation expense |
— | — | 81 | — | — | — | 81 | |||||||||||||||||||||
| Restricted stock expense |
— | 250 | — | — | — | 250 | ||||||||||||||||||||||
| Dividends (distributions to shareholders) |
— | — | — | (11,499 | ) | — | — | (11,499 | ) | |||||||||||||||||||
|
|
|
|
|
|
|
|
|
|
|
|
|
|
|
|||||||||||||||
| Balance at December 31, 2012 |
1,842,390 | 18,432,560 | 20,535 | 11,980 | 542 | (1,297 | ) | 31,760 | ||||||||||||||||||||
|
|
|
|
|
|
|
|
|
|
|
|
|
|
|
|||||||||||||||
| Net income (loss) |
— | — | — | 28,062 | — | (120 | ) | 27,942 | ||||||||||||||||||||
| Other comprehensive loss |
— | — | — | — | (733 | ) | — | (733 | ) | |||||||||||||||||||
| Repurchase of common stock |
(13,480 | ) | (134,860 | ) | (444 | ) | — | — | — | (444 | ) | |||||||||||||||||
| Stock option exercise |
4,560 | 45,440 | 100 | — | — | — | 100 | |||||||||||||||||||||
| Issuance of common stock on acquisition |
4,540 | 45,460 | 150 | — | — | — | 150 | |||||||||||||||||||||
| Employee stock purchase program |
8,100 | 83,620 | 234 | — | — | — | 234 | |||||||||||||||||||||
| Reclass to redeemable equity securities |
— | — | (2,444 | ) | — | — | — | (2,444 | ) | |||||||||||||||||||
| Reclassification of all stock to single class |
18,472,220 | (18,472,220 | ) | — | — | — | — | — | ||||||||||||||||||||
| Deconsolidation of subsidiary |
— | — | — | — | — | 1,417 | 1,417 | |||||||||||||||||||||
| Stock option based compensation expense |
— | — | 38 | — | — | — | 38 | |||||||||||||||||||||
| Restricted stock expense |
— | 150 | — | — | — | 150 | ||||||||||||||||||||||
| Dividends (distributions to shareholders) |
— | — | — | (9,780 | ) | — | — | (9,780 | ) | |||||||||||||||||||
|
|
|
|
|
|
|
|
|
|
|
|
|
|
|
|||||||||||||||
| Balance at December 31, 2013 |
20,318,330 | — | 18,319 | 30,262 | (191 | ) | — | 48,390 | ||||||||||||||||||||
|
|
|
|
|
|
|
|
|
|
|
|
|
|
|
|||||||||||||||
| Net income |
— | — | — | 10,048 | — | — | 10,048 | |||||||||||||||||||||
| Other comprehensive income |
— | — | — | — | 276 | — | 276 | |||||||||||||||||||||
| Reclass from redeemable equity securities |
— | — | 3,605 | — | — | — | 3,605 | |||||||||||||||||||||
| Sales of common stock |
65,914 | — | 273 | — | — | — | 273 | |||||||||||||||||||||
| Stock option exercise |
191,660 | — | 177 | — | — | — | 177 | |||||||||||||||||||||
| Employee stock purchase program |
23,006 | — | 331 | — | — | — | 331 | |||||||||||||||||||||
| Issuance of common stock grants |
685,700 | — | 2,992 | — | — | — | 2,992 | |||||||||||||||||||||
| Common stock issued in private placement, net of offering cost |
2,324,770 | 4,723,530 | 74,631 | — | — | — | 74,631 | |||||||||||||||||||||
| Debt conversion to common stock |
287,020 | — | 3,052 | — | — | — | 3,052 | |||||||||||||||||||||
| Stock option based compensation expense |
— | — | 272 | — | — | — | 272 | |||||||||||||||||||||
| Reclassification adjustment for change in taxable status |
— | — | (5,123 | ) | 5,123 | — | — | — | ||||||||||||||||||||
| Restricted stock expense |
— | — | 143 | — | — | — | 143 | |||||||||||||||||||||
| Dividends (distributions to shareholders) |
— | — | — | (52,376 | ) | — | — | (52,376 | ) | |||||||||||||||||||
|
|
|
|
|
|
|
|
|
|
|
|
|
|
|
|||||||||||||||
| Balance at December 31, 2014 |
23,896,400 | 4,723,530 | $ | 98,672 | $ | (6,943 | ) | $ | 85 | $ | — | $ | 91,814 | |||||||||||||||
|
|
|
|
|
|
|
|
|
|
|
|
|
|
|
|||||||||||||||
See Notes to Consolidated Financial Statements
F-42
Table of Contents
Live Oak Bancshares, Inc.
Consolidated Statements of Cash Flows
For the years ended December 31, 2014, 2013 and 2012
| December 31, | ||||||||||||
| 2014 | 2013 | 2012 | ||||||||||
| (In thousands) | ||||||||||||
| Cash flows from operating activities |
||||||||||||
| Net income |
$ | 10,048 | $ | 27,942 | $ | 14,798 | ||||||
| Adjustments to reconcile net income to net cash provided (used) by operations: |
||||||||||||
| Depreciation and amortization |
2,159 | 1,459 | 673 | |||||||||
| Provision for (recovery of) loan losses |
2,793 | (858 | ) | 2,110 | ||||||||
| Amortization of premium on securities, net of accretion |
87 | 120 | 99 | |||||||||
| Amortization (accretion) of discount on unguaranteed loans |
(701 | ) | 1,410 | (136 | ) | |||||||
| Deferred tax expense |
4,092 | — | — | |||||||||
| Originations of loans held for sale |
(765,123 | ) | (449,569 | ) | (372,694 | ) | ||||||
| Proceeds from sales of loans held for sale |
539,122 | 420,499 | 362,785 | |||||||||
| Net gains (loss) on sale of foreclosed assets |
— | (37 | ) | 1 | ||||||||
| Net increase in servicing assets |
(5,946 | ) | (4,833 | ) | (5,489 | ) | ||||||
| Net gains on sale of loans held for sale |
(49,977 | ) | (38,225 | ) | (33,535 | ) | ||||||
| Loss (gain) on sale of securities available-for-sale |
74 | (11 | ) | — | ||||||||
| Net (gain) loss on sale of premises and equipment |
(256 | ) | 152 | 31 | ||||||||
| Stock option based compensation expense |
272 | 38 | 81 | |||||||||
| Stock grants |
2,992 | — | — | |||||||||
| Restricted stock expense |
143 | 150 | 250 | |||||||||
| Gain on deconsolidation of subsidiary |
— | (12,212 | ) | — | ||||||||
| Equity in loss of non-consolidated affiliates |
2,221 | 2,756 | — | |||||||||
| Non-cash basis recovery in deconsolidation of subsidiary |
— | 3,976 | — | |||||||||
| Changes in assets and liabilities: |
||||||||||||
| Accounts receivable and other assets |
(2,407 | ) | 2,243 | (843 | ) | |||||||
| Accrued expenses and other liabilities |
(1,101 | ) | 825 | 3,611 | ||||||||
|
|
|
|
|
|
|
|||||||
| Net cash used by operating activities |
(261,508 | ) | (44,175 | ) | (28,258 | ) | ||||||
|
|
|
|
|
|
|
|||||||
| Cash flows from investing activities |
||||||||||||
| Purchases of securities available-for-sale |
(34,721 | ) | (11,858 | ) | (1,773 | ) | ||||||
| Proceeds from sales, maturities, calls, and principal paydown of securities available-for-sale |
5,017 | 6,986 | 3,139 | |||||||||
| Proceeds from sale of foreclosed assets |
— | 622 | 1,010 | |||||||||
| Investment in certificates of deposit |
(10,000 | ) | — | — | ||||||||
| Capital investments in non-consolidated affiliates |
(6,613 | ) | (8,890 | ) | — | |||||||
| Loan originations and principal collections, net |
76,930 | 297 | (822 | ) | ||||||||
| Proceeds from sale of premises and equipment |
2,200 | 30 | — | |||||||||
| Purchases of premises and equipment |
(14,346 | ) | (7,726 | ) | (14,191 | ) | ||||||
|
|
|
|
|
|
|
|||||||
| Net cash provided (used) in investing activities |
18,467 | (20,539 | ) | (12,637 | ) | |||||||
|
|
|
|
|
|
|
|||||||
| Cash flows from financing activities |
||||||||||||
| Net increase in deposits |
165,460 | 69,946 | 64,511 | |||||||||
| Proceeds from long term borrowings |
34,966 | — | 3,623 | |||||||||
| Repayment of long term borrowings |
(2,390 | ) | (130 | ) | (77 | ) | ||||||
| Proceeds from short term borrowings |
6,100 | — | — | |||||||||
| Stock option exercise |
177 | 100 | 792 | |||||||||
| Sale of common stock, net |
75,235 | 234 | 877 | |||||||||
| Repurchase of common stock |
— | (444 | ) | — | ||||||||
| Shareholder dividend distributions |
(43,849 | ) | (11,921 | ) | (12,194 | ) | ||||||
|
|
|
|
|
|
|
|||||||
| Net cash provided by financing activities |
235,699 | 57,785 | 57,532 | |||||||||
|
|
|
|
|
|
|
|||||||
| Net increase (decrease) in cash and cash equivalents |
(7,342 | ) | (6,929 | ) | 16,637 | |||||||
| Cash and cash equivalents, beginning |
37,244 | 44,173 | 27,536 | |||||||||
|
|
|
|
|
|
|
|||||||
| Cash and cash equivalents, ending |
$ | 29,902 | $ | 37,244 | $ | 44,173 | ||||||
|
|
|
|
|
|
|
|||||||
| Supplemental disclosure of cash flow information |
||||||||||||
| Interest paid |
$ | 5,769 | $ | 4,525 | $ | 3,630 | ||||||
| Income tax |
3,820 | — | — | |||||||||
| Supplemental disclosures of noncash operating, investing, and financing activities |
||||||||||||
| Unrealized holding gains (losses) on available-for-sale securities |
$ | 329 | $ | (733 | ) | $ | 39 | |||||
| Conversion of convertible subordinated debt into common stock |
3,052 | — | — | |||||||||
| Transfers from loans to foreclosed real estate and other repossessions |
311 | 1,273 | 2,529 | |||||||||
| Transfers from foreclosed real estate to SBA receivable |
281 | 432 | 1,286 | |||||||||
| Loans to facilitate the sale of foreclosed assets |
— | 147 | — | |||||||||
| Conversion of receivable to equity investment in nCino |
— | 4,320 | — | |||||||||
| Issuance of common stock on acquisition |
— | 150 | — | |||||||||
| Dividends declared but not paid |
1,532 | 2,841 | 4,982 | |||||||||
| Non-cash dividend |
9,514 | — | — | |||||||||
| Transfer of loans held for sale to loans held for investment |
13,611 | 22,039 | 14,763 | |||||||||
| Transfer of loans held for investment to loans held for sale |
4,548 | 7,934 | 35,100 | |||||||||
See Notes to Consolidated Financial Statements
F-43
Table of Contents
Live Oak Bancshares, Inc.
Notes to Consolidated Financial Statements
For the years ended December 31, 2014, 2013 and 2012
Note 1. Organization and Summary of Significant Accounting Policies
Organization
Live Oak Banking Company (the “Bank”) was organized and incorporated under the laws of the State of North Carolina and commenced operations on May 12, 2008. In the first quarter of 2009, Live Oak Bancshares (the “Company”) was formed to acquire all the outstanding shares of Live Oak Banking Company. The Bank is headquartered in the city of Wilmington, North Carolina and has a sales office in Atlanta, Georgia. The Bank specializes in providing lending services to small businesses nationwide in targeted industries. The Bank identifies and grows within credit-worthy industries through expertise within those industries. A significant portion of the loans originated by the Bank are guaranteed by the Small Business Administration (“SBA”) under the 7(a) Loan Program. The guaranteed portion of the loan is available for sale in the secondary market. The Bank routinely engages in the sale of participating interests of the unguaranteed portion. As a state chartered bank, the Bank is subject to regulation by the North Carolina Commissioner of Banks and the Federal Deposit Insurance Corporation.
In 2010, the Bank formed Live Oak Number One, Inc. to hold properties foreclosed on by the Bank. Live Oak Number One is a wholly-owned subsidiary.
During 2011, the Company formed Independence Aviation, LLC, a wholly-owned subsidiary, for the purpose of purchasing an aircraft to be used for business purposes by the Company.
In January 2012, the Company formed nCino, LLC (“nCino”) to further develop and sell cloud-based banking software that was built off of the Force.com platform and transformed into a bank operating system used to streamline the lending process of financial institutions. In 2012 nCino was a majority-owned subsidiary of the Company. In 2013 the Company’s ownership changed such that nCino became a minority-owned subsidiary of the Company. In December 2013 the legal structure of nCino converted from an LLC to a corporation. At year-end 2013, the Company owned 45.94% of nCino. In June of 2014 the Company divested its ownership in nCino to shareholders in the form of a dividend with a subsequent investment of $6.1 million later in 2014. At December 31, 2014, the Company owned 9.02% of nCino.
In September 2013, the Company acquired Government Loan Solutions (“GLS”) as a wholly-owned subsidiary. GLS is a management and technology consulting firm that advises, and offers solutions and services to participants in the government guaranteed lending sector. GLS, which was founded in 2006, primarily provides services in connection with the settlement, accounting, and securitization processes for government guaranteed loans, including loans originated under the SBA 7(a) loan programs and USDA guaranteed loans. The Company accounted for the transaction as a business combination under the acquisition method of accounting, and as such the assets acquired and liabilities assumed in the transaction were recorded at their respective fair values as of the acquisition date. The purchase price was $150 thousand comprised of common stock of the Company. The allocation of the purchase price resulted in tangible assets of $35 thousand, a book of business and business model valued at $155 thousand, goodwill of $272 thousand and liabilities of $314 thousand. Goodwill associated with GLS was written off in 2014.
In December 2013, the Company jointly formed 504 Fund Advisors, LLC (“504 Fund”) with Pennant Management, Inc. (“Pennant Management”). As of December 31, 2014, 504 Fund was a 50% owned investment established for the purpose of underwriting and managing SBA 504 loans held by The Pennant 504 Fund (“Pennant 504”). The portfolio managers of Pennant 504 are employees of GLS and an outside owner/manager of the 504 Fund. The Company’s wholly owned subsidiaries, Live Oak Bank and GLS, provide various advisory
F-44
Table of Contents
Live Oak Bancshares, Inc.
Notes to Consolidated Financial Statements
For the years ended December 31, 2014, 2013 and 2012
Note 1. Organization and Summary of Significant Accounting Policies (Continued)
and human resource services to Pennant 504, for which both are reimbursed. The services provided to Pennant 504 do not result in either the Bank or GLS having the ability to directly influence management operations or decisions that directly impact the financial standing of the Company or its subsidiaries. Pennant Management serves as 504 Fund’s investment advisor and has voting authority with respect to 100% of the value of its outstanding interests. Accordingly, the Company’s investment in the 504 Fund is accounted for under the equity method. The Company’s cumulative investment in the 504 Fund was $750 thousand and $250 thousand in 2014 and 2013, respectively. Under the equity method, the carrying amount of this investment was $231 thousand at December 31, 2014.
Basis of Presentation
All information in the Notes to Consolidated Financial Statements has been presented in thousands, except percentage, time period, stock option, share and per share data. The accounting and reporting policies of the Company and the Bank follow generally accepted accounting principles and general practices within the financial services industry. The following is a description of the significant accounting and reporting policies the Company follows in preparing and presenting its consolidated financial statements.
Consolidation Policy
The consolidated financial statements include the financial statements of the Company and wholly-owned subsidiaries of Live Oak Banking Company, Live Oak Number One, Independence Aviation and GLS. All significant intercompany balances and transactions have been eliminated in consolidation. In addition, the Company evaluates its relationships with other entities to identify whether they are variable interest entities and to assess whether it is the primary beneficiary of such entities. If the determination is made that the Company is the primary beneficiary, then that entity is included in the consolidated financial statements. If an entity is not a variable interest entity, the Company also evaluates arrangements in which there is a general partner or managing member to determine whether consolidation is appropriate.
Investments in unconsolidated subsidiaries representing ownership of at least 20% but less than or equal to 50%, are accounted for under the equity method. For these investments, the Company records its investment in non-consolidated affiliates and the portion of income or loss in equity in income of non-consolidated affiliates. The Company periodically evaluates these investments for impairment.
On January 28, 2013, the Company’s ownership in nCino declined by 21.54%, from 64.36% to 42.82%. This decrease in ownership and related influence occurred as a result of nCino selling additional equity to outside investors for $7.5 million. As a result, the Company deconsolidated nCino, accounting for its remaining 42.82% investment using the equity method. The gain on the deconsolidation of nCino holdings was $12.2 million, which arose from the combination of a gain of $9.7 million related to the remeasurement of the retained investment in nCino at fair value and $2.5 million related to the recovery of negative net assets in the investee at the date of transfer. The fair value of the investment is a Level 3 measurement (see Note 9) based upon the consideration paid by outside investors for a 33.5% ownership interest in nCino. The Company’s investment in nCino was accounted for as an equity method investment at December 31, 2013. As previously indicated, the Company divested its ownership in nCino via a dividend to shareholders in June 2014. In August 2014 the Company again invested $6.1 million in nCino for 9.02% ownership. The Company’s carrying value of its investment in nCino was $6.1 million and $11.3 million as of December 31, 2014 and 2013, respectively. Due to the decreased level of influence, the Company’s investment in nCino at December 31, 2014 was accounted for as a cost method investment.
F-45
Table of Contents
Live Oak Bancshares, Inc.
Notes to Consolidated Financial Statements
For the years ended December 31, 2014, 2013 and 2012
Note 1. Organization and Summary of Significant Accounting Policies (Continued)
The Company will continue to be one of nCino’s customers; however, the power to direct the joint venture’s most significant activities is now controlled by outside investors.
Business Segments
Operating segments are components of an enterprise about which separate financial information is available that is evaluated regularly by the chief operating decision maker in deciding how to allocate resources and in assessing performance. Management has determined that the Company has one significant operating segment, which is providing a lending platform for small businesses nationwide. In determining the appropriateness of segment definition, the Company considers the materiality of a potential segment, the components of the business about which financial information is available and regularly evaluates relative to resource allocation and performance assessment.
Private Placement
The Company issued and sold 7,048,300 shares of common stock in a private placement on August 5, 2014 consisting of 2,323,770 voting shares and 4,723,530 non-voting shares in exchange for total proceeds of $74.6 million, net of offering costs.
The Company also terminated its S-Corporation status and became a taxable corporate entity (C-Corporation) on August 3, 2014. The consolidated statement of shareholders’ equity presents a contribution to the capital of the corporate entity followed by a constructive distribution to the owners .
Stock Split
On September 23, 2014, the board of directors declared a ten-for-one stock split of the Company’s Class A and Class B common shares, which was effected in the form of a common stock dividend distributed on October 10, 2014. Except for the amount of authorized shares, all references to share and per share amounts in the consolidated financial statements and accompanying notes to the consolidated financial statements have been retroactively adjusted to reflect the stock split.
Use of Estimates
In preparing financial statements in conformity with accounting principles generally accepted in the United States of America (“GAAP”), management is required to make estimates and assumptions that affect the reported amounts of assets and liabilities as of the date of the balance sheet and reported amounts of revenues and expenses during the reporting period. Actual results could differ from those estimates. Material estimates that are particularly susceptible to significant change in the near term relate to the determination of the allowance for loan losses and, valuations of servicing assets.
Cash and Cash Equivalents
For the purpose of presentation in the statement of cash flows, cash and cash equivalents are defined as those amounts included in the balance sheet caption “cash and due from banks”.
F-46
Table of Contents
Live Oak Bancshares, Inc.
Notes to Consolidated Financial Statements
For the years ended December 31, 2014, 2013 and 2012
Note 1. Organization and Summary of Significant Accounting Policies (Continued)
To comply with banking regulations, the Company is required to maintain certain average cash reserve balances. The daily average cash reserve requirement was approximately $17.2 million, $11.9 million and $9.9 million for the years ended December 31, 2014, 2013 and 2012, respectively.
Certificates of Deposit with other Banks
Certificates of deposit with other banks have maturities ranging from March 2016 through December 2018 and bear interest at rates ranging from 0.55% to 1.85%. None of the certificates of deposit had maturities of three months or less at the time of origination. All investments in certificates of deposit are with FDIC insured financial institutions and none exceed the maximum insurable amount of $250 thousand.
Securities
Certain debt securities that management has the positive intent and ability to hold to maturity are classified as “held-to-maturity” and recorded at amortized cost. Trading securities are recorded at fair value with changes in fair value included in earnings. Securities not classified as held-to-maturity or trading, are classified as “available-for-sale” and recorded at fair value. Unrealized gains and losses are excluded from earnings and reported in other comprehensive income. The Company’s entire portfolio for the periods presented is available-for-sale.
Purchase premiums and discounts are recognized in interest income using the interest method over the terms of the securities. At each reporting date, the Company evaluates each investment security in a loss position for other than temporary impairment (“OTTI”). The Company evaluates declines in market value below cost for debt securities by assessing the likelihood of selling the security prior to recovering its cost basis. If the Company intends to sell the debt security or it is more-likely-than-not that the Company will be required to sell the debt security prior to recovering its cost basis, the Company will write down the security to fair value with the full charge recorded in earnings. If the Company does not intend to sell the debt security and it is not more-likely-than-not that the Company will be required to sell the debt security prior to recovery, the security will not be considered other-than-temporarily impaired unless there are credit losses associated with the security. In that case: (1) where credit losses exist, the portion of the impairment related to those credit losses should be recognized in earnings; (2) any remaining difference between the fair value and the cost basis should be recognized as part of other comprehensive income. For equity securities, any other-than-temporary impairment is recognized with the full charge recorded in earnings. To determine whether an impairment of equity securities is OTTI, the Company considers whether it has the ability and intent to hold the investment until there is a market price recovery and considers whether evidence indicating the cost of the investment is recoverable outweighs evidence to the contrary.
In determining whether OTTI exists, management considers many factors, including (1) the length of time and the extent to which the fair value has been less than cost, (2) the financial condition and near-term prospects of the issuer, and (3) the intent and ability of the Company to retain its investment in the issuer for a period of time sufficient to allow for any anticipated recovery in fair value. Gains and losses on the sales of securities are recorded on the trade date and are determined using the specific identification method.
F-47
Table of Contents
Live Oak Bancshares, Inc.
Notes to Consolidated Financial Statements
For the years ended December 31, 2014, 2013 and 2012
Note 1. Organization and Summary of Significant Accounting Policies (Continued)
Loans Held For Sale
Management designates loans as held for sale based on its intent to sell guaranteed portions in the SBA Secondary Market and unguaranteed portions to participant banks and credit unions. Salability requirements of the guaranteed portion include, but are not limited to, full disbursement of the loan commitment amount. Loans originated and intended for sale are carried at the lower of cost or estimated fair value. The cost basis of loans held for sale includes the deferral of loan origination fees and costs. Deferred fees and costs are accreted and amortized for loans classified held for sale until the sale occurs. At loan settlement, the pro-rata portion, based on the percent of the total loan sold, of the remaining deferred fees and costs are recognized as an adjustment to the gain on sale.
As part of our management of the loans held in our portfolio, we will occasionally transfer loans from held for investment to held for sale. Upon transfer, any associated allowance for loan and lease loss is charged off and the carrying value of the loans is adjusted to the estimated fair value. The loans are subsequently accounted for at the lower of cost or fair value, with valuation changes recorded in other non-interest income. Gains or losses on the sale of these loans are also recorded in non-interest income. In certain circumstances, loans designated as held for sale may later be transferred back to the loan portfolio based upon our intent and ability to hold the loans for the foreseeable future. We transfer these loans to loans held for investment at the lower of cost or fair value.
In accordance with SBA regulation, the Bank is required to retain 10% of the principal balance of any SBA 7(a) loan comprised of unguaranteed dollars. With written consent from the SBA, the Bank may sell down to a 5% exposure comprised of unguaranteed dollars. During 2012, the SBA approved the Bank to sell to the 5% retention level participating interests of the unguaranteed portion of loans originated on or before June 30, 2012 that have been fully funded for a period of eighteen months. This approval expired on June 30, 2014. Loans held for sale generally consists of guaranteed dollars and the unguaranteed portion up to the SBA retention minimums discussed above. The gain on sale recognized in income is the sum of the premium on the guaranteed loan, the fair value of the servicing assets recognized, less the discount recorded on the unguaranteed portion of the loan retained.
Generally, all guaranteed portions and unguaranteed portions that meet the required retention balances prescribed by the Small Business Administration and meet salability requirements were classified as held for sale. A negative change in the credit quality of a loan results in the loan classification changing from held for sale to held for investment.
The following summarizes the activity pertaining to loans held for sale for the years ended December 31, 2014, 2013 and 2012:
| 2014 | 2013 | 2012 | ||||||||||
| Balance at beginning of year |
$ | 159,438 | $ | 145,183 | $ | 111,877 | ||||||
| Originations |
519,677 | 315,372 | 276,447 | |||||||||
| Proceeds from sales |
(433,912 | ) | (339,342 | ) | (276,676 | ) | ||||||
| Gain on sale of loans |
49,977 | 38,225 | 33,535 | |||||||||
|
|
|
|
|
|
|
|||||||
| Balance at end of period |
$ | 295,180 | $ | 159,438 | $ | 145,183 | ||||||
|
|
|
|
|
|
|
|||||||
F-48
Table of Contents
Live Oak Bancshares, Inc.
Notes to Consolidated Financial Statements
For the years ended December 31, 2014, 2013 and 2012
Note 1. Organization and Summary of Significant Accounting Policies (Continued)
Loans Held for Investment
Loans receivable that management has the intent and ability to hold for the foreseeable future or until maturity or pay-off are reported at their outstanding principal amount adjusted for any charge-offs, the allowance for loan losses, and any deferred fees or costs on originated loans and unamortized premium or discount on purchased loans. Loan origination fees, net of certain direct origination costs, are deferred and recognized as an adjustment of the related loan yield using the interest method. For sold loans, loan origination fees, net of certain direct origination costs, are recognized as a gain on sale of loans once the loan has sold. Discounts and premiums on any purchased loans are amortized to income using the interest method over the remaining period to contractual maturity, adjusted for anticipated prepayments. Loans designated as held for investment, include the required retention amount defined by the SBA comprised of unguaranteed dollars and loans designated as troubled debt restructurings, nonaccrual, greater than thirty days past due, and risk grade at a 5 or worse as defined by internal risk rating metrics.
Interest income on loans is recognized as earned on a daily accrual basis. The accrual of interest on loans is discontinued when principal or interest is past due 90 days or the loan is determined to be impaired. Impaired loans, or portions thereof, are charged off when deemed uncollectable.
Allowance for Loan Losses
The allowance for loan losses is established as losses are estimated to have occurred through a provision for loan losses charged to earnings. Loan losses are charged against the allowance when management believes the un-collectability of a loan balance is confirmed. Subsequent recoveries, if any, are credited to the allowance.
The allowance for loan loss is evaluated on a regular basis by management and is based upon management’s periodic review of the collectability of the loans in light of historical experience, the nature and volume of the loan portfolio, adverse situations that may affect the borrower’s ability to repay, estimated value of any underlying collateral and prevailing economic conditions. This evaluation is inherently subjective as it requires estimates that are susceptible to significant revision as more information becomes available.
A loan is considered impaired when, based on current information and events, it is probable that the Company will be unable to collect the scheduled payments of principal or interest when due according to the contractual terms of the loan agreement. Factors considered by management in determining impairment include payment status and other circumstances impacting the probability of collecting scheduled principal and interest payments when due.
Management determines the significance of payment delays and payment shortfalls on a case-by-case basis, taking into consideration all of the circumstances surrounding the loan and the borrower, including the length of the delay, the reasons for the delay, the borrower’s prior payment record, and the amount of the shortfall in relation to the principal and interest owed. Impairment is measured on a loan-by-loan basis for commercial and construction loans by either the present value of expected future cash flows discounted at the loan’s effective interest rate, the loan’s obtainable market price, or the fair value of the collateral if the loan is collateral dependent. Loans classified as troubled debt restructured (“TDR”) loans are considered impaired. Loans that experience insignificant payment delays and payment shortfalls generally are not classified as impaired.
A TDR is a restructuring of a loan in which a concession is granted to a borrower experiencing financial difficulty. A loan is accounted for as a TDR if the Company, for reasons related to the borrower’s financial difficulties, grants a concession to the borrower that it would not otherwise grant. A TDR typically involves a
F-49
Table of Contents
Live Oak Bancshares, Inc.
Notes to Consolidated Financial Statements
For the years ended December 31, 2014, 2013 and 2012
Note 1. Organization and Summary of Significant Accounting Policies (Continued)
modification of terms such as a reduction of the interest rate below the current market rate for a loan with similar risk characteristics or the waiving of certain financial loan covenants without corresponding offsetting compensation or additional support. The Company measures the impairment loss of a TDR using the methodology for individually impaired loans.
Interest is accrued and credited to income based on the principal amount outstanding. The accrual of interest on impaired loans is discontinued when, in management’s opinion, the borrower may be unable to meet payments as they become due or when the loan becomes ninety days past due. When interest accrual is discontinued, all unpaid accrued interest for the current year is reversed. Interest income is subsequently recognized on the cash-basis or cost-recovery method, as appropriate. When facts and circumstances indicate the borrower has regained the ability to meet the required payments, the loan is returned to accrual status. Past due status of loans is determined based on contractual terms. Cash payments of interest on nonaccrual loans will be applied to the principal balance of the loan. Interest accruals are resumed on nonaccrual loans only when the loan is brought current with respect to interest and principal and when, in the judgment of management, the loans are estimated to be fully collectible as to all principal and interest. Management’s judgment is based on an assessment of the borrower’s financial condition and a recent history of payment performance.
Large groups of smaller balance homogeneous loans are collectively evaluated for impairment. Accordingly, the Company does not separately identify individual consumer and residential loans for impairment disclosures, unless such loans were the subject of a restructuring agreement.
Foreclosed Assets
Real estate properties acquired through, or in lieu of, loan foreclosure are to be sold and are initially recorded at fair value less anticipated cost to sell at the date of foreclosure, establishing a new cost basis. Any write down at the time of transfer to foreclosed assets is charged to the allowance for loan losses. Subsequent write downs are charged to other expense. After foreclosure, valuations are periodically performed by management, and the real estate is carried at the lower of carrying amount or fair value, less cost to sell. Costs relating to improvement of the property are capitalized while holding costs of the property are charged to expense in the period incurred.
Premises and Equipment
Premises, furniture and equipment, land improvements and leasehold improvements are carried at cost, less accumulated depreciation. Land is carried at cost. Additions and major replacements or improvements which extend useful lives of property or equipment are capitalized. Maintenance, repairs, and minor improvements are expensed as incurred. Upon retirement or other disposition of the assets, the cost and related depreciation are removed and any resulting gain or loss is reflected in income. Depreciation is computed by the straight-line method over the following estimated useful lives:
| Years | ||
| Building |
39 | |
| Transportation |
4-20 | |
| Land Improvements |
7-15 | |
| Furniture and equipment |
3-7 | |
| Computers and software |
3-7 | |
| Leasehold improvements |
1-3 |
F-50
Table of Contents
Live Oak Bancshares, Inc.
Notes to Consolidated Financial Statements
For the years ended December 31, 2014, 2013 and 2012
Note 1. Organization and Summary of Significant Accounting Policies (Continued)
Servicing Assets
All sales of the guaranteed portion of loans are executed on a servicing retained basis. The standard SBA loan sale agreement is structured to provide the Company with a “servicing spread” paid from a portion of the interest cash flow of the loan. SBA regulations require the Bank to retain a portion of the cash flow from the interest payments received for a sold loan. This retention requirement is at least 100 basis points in servicing spread with the sale of a guaranteed loan. The portion of the servicing spread that exceeds adequate compensation for the servicing function is recognized as a servicing asset. Industry practice recognizes adequate compensation for servicing SBA loans as 40 basis points. The fair value of the servicing asset is measured at the discounted present value of the excess servicing spread over the expected life of the related loan using appropriate discount rates and assumptions based on industry statistics for prepayment speeds.
Servicing assets are recognized as separate assets when rights are acquired through purchase or through sale of financial assets and are carried at fair value. Generally, purchased servicing rights are capitalized at the cost to acquire the rights. For sales of loans, a portion of the cost of originating the loan is allocated to the servicing right based on fair value. Fair value is based on market prices for comparable servicing contracts, when available, or alternatively, is based on a valuation model that calculates the present value of estimated future net servicing income. The valuation model incorporates assumptions that market participants would use in estimating future net servicing income, such as adequate compensation for servicing, the discount rate, the custodial earnings rate, an inflation rate, ancillary income, prepayment speeds and default rates and losses. Capitalized servicing rights are carried at fair value as of the reporting date. Changes to fair value are reported in net gains on sales of loans.
Servicing fee income is recorded for fees earned for servicing loans. The fees are based on a contractual percentage of the outstanding principal or a fixed amount per loan and are recorded as income when earned.
The Company’s investment in a loan is allocated between the retained portion of the loan, the servicing asset, and the sold portion of the loan on the date the loan is sold.
When only a portion of a loan is sold, GAAP requires the Company to reallocate the carrying basis between the portion of the loan sold and the portion of the loan retained based on the relative fair value of the respective portions as of the date of sale. The maximum gain on sale that can be recognized is the difference between the fair value of the guaranteed portion sold and the reallocated basis of the portion of the loan sold. The Company measures the fair value of the guaranteed portion of the loan by the cash premium at which the sale was consummated. The limitation on the maximum gain allowed to be recognized results in a discount recorded on the unguaranteed dollars retained. The carrying value of the retained portion of the loan is discounted based in part on the estimates derived from the Company’s comparable nonguaranteed loan sales.
Common Stock
On November 26, 2013, The Company amended its Articles of Incorporation to combine its Class A Voting Common Stock and its Class B Non-Voting Common Stock into a single class of Voting Common Stock with no par value. The combination of the two classes of stock had no effect on the total number of shares outstanding or total equity. Previously the Company had Class A and Class B Common Stock with no par value issued at a 1:10 ratio. The rights, preferences and privileges of Class A and Class B Common Stock were identical in all respects, except that Class A Common Stock entitled the holder to one vote per share, whereas Class B Common Stock was non-voting, except to the extent otherwise required by law.
F-51
Table of Contents
Live Oak Bancshares, Inc.
Notes to Consolidated Financial Statements
For the years ended December 31, 2014, 2013 and 2012
Note 1. Organization and Summary of Significant Accounting Policies (Continued)
On June 11, 2014 the Company amended its Articles of Incorporation to create two classes of common stock. These two classes are identified as Class A and Class B for Voting Common Stock and Non-Voting Common Stock, respectively, in the accompanying 2014 consolidated balance sheet and statement of shareholders’ equity. Voting and Non-Voting Common Stock holders have identical rights and privileges, with the exception that Non-Voting shares have no voting power unless circumstances arise where instances creating the Non-Voting Common Shares are modified in any way that negatively impact rights of holder. Stock splits or dividends of Voting and Non-Voting Common Shares shall be in like stock (voting for voting and non-voting for non-voting). Any number of Non-Voting Common Stock may be converted to an equal number of Voting Common Stock at the option of the holder; provided that holder is not the initial transferee or an affiliate of initial transferee.
Advertising Expense
Due to the Company’s presence at annual trade shows and the significant discounts received for prepaid print advertising, the Company has a high volume of prepaid marketing expenses, totaling $816 thousand, $396 thousand and $605 thousand at December 31, 2014, 2013 and 2012, respectively. Marketing costs are recognized in the month the event or advertisement takes place. These costs are included in marketing and advertising expense as presented in the statement of operations.
Income Taxes
Income tax expense is the total of the current year income tax due or refundable and the change in deferred tax assets and liabilities (excluding deferred tax assets and liabilities related to business combinations or components of other comprehensive income). Deferred tax assets and liabilities are the expected future tax amounts for the temporary differences between carrying amounts and tax bases of assets and liabilities, computed using enacted tax rates. The effect of a change in tax rates on deferred assets and liabilities is recognized in income taxes during the period that includes the enactment date. A valuation allowance, if needed, reduces deferred tax assets to the expected amount more likely than not to be realized. Realization of deferred tax assets is dependent upon the level of historical income, prudent and feasible tax planning strategies, reversals of deferred tax liabilities and estimates of future taxable income.
The Company evaluates uncertain tax positions at the end of each reporting period. The Company may recognize the tax benefit from an uncertain tax position only if it is more likely than not that the tax position will be sustained on examination by the taxing authorities, based on the technical merits of the position. The tax benefit recognized in the financial statements from any such position is measured based on the largest benefit that has a greater than fifty percent likelihood of being realized upon ultimate settlement. For tax positions not meeting the “more likely than not” test, no tax benefit is recorded. Any interest and/or penalties related to income taxes are reported as a component of income tax expense.
The Company has determined that it does not have any material unrecognized tax benefits or obligations as of December 31, 2014. Fiscal years ending on or after December 31, 2010 remain subject to examination by federal and state tax authorities.
Comprehensive Income
Annual comprehensive income reflects the change in the Company’s equity during the year arising from transactions and events other than investment by and distributions to shareholders. The only components of other comprehensive income consist of realized and unrealized gains and losses related to investment securities. Due the Company being a pass through entity prior to July 31, 2014, adjustments to 2013 and 2012 comprehensive income are not tax effected.
F-52
Table of Contents
Live Oak Bancshares, Inc.
Notes to Consolidated Financial Statements
For the years ended December 31, 2014, 2013 and 2012
Note 1. Organization and Summary of Significant Accounting Policies (Continued)
Stock Compensation Plans
The Company recognizes compensation cost relating to share-based payment transactions in the financial statements in accordance with GAAP. The cost is measured based on the fair value of the equity or liability instruments issued. The expense measures the cost of employee services received in exchange for stock options and restricted stock based on the grant-date fair value of the award, and recognizes the cost over the vesting period as indicated in the option agreement.
Fair Value of Financial Instruments
GAAP defines fair value as the exchange price that would be received for an asset or paid to transfer a liability (an exit price) in the principal or most advantageous market for the asset or liability in an orderly transaction between market participants on the measurement date. The Company determines the fair values of its financial instruments based on the fair value hierarchy established per GAAP which requires an entity to maximize the use of observable inputs and minimize the use of unobservable inputs when measuring fair value. Investment securities available-for-sale and servicing assets are recorded at fair value on a recurring basis. Loans held for sale, certain impaired loans and foreclosed assets are carried at fair value on a non-recurring basis.
nCino Revenue Recognition
After formation in 2012, the investment in nCino was consolidated until deconsolidation occurred in January 2013. Accordingly, the following disclosure applies to the year ended December 31, 2012. nCino enters into arrangements to deliver multiple products or services (multiple-elements). nCino applies software revenue recognition rules and allocates the total revenues among elements based on vendor-specific objective evidence (“VSOE”) of fair value of each element.
Revenues are derived from three sources:
| (i) | Seat License fees, related to term (or time-based) software license revenue; |
| (ii) | Customer Support and Maintenance fees, related to email and phone support, bug fixes and unspecified software updates and upgrades released when, and if available during the maintenance term; and |
| (iii) | Professional Services fees, related to professional services related to implementation of the Company’s software, reimbursable travel and training. |
Revenues are recognized when all of the following criteria are met:
| • | Persuasive evidence of an arrangement exists. Evidence of an arrangement consists of a written contract signed by both the customer and management prior to the end of the period. |
| • | Delivery or performance has occurred. nCino’s software is delivered to the customer. Delivery is considered to have occurred when all of a customer’s users (number as defined in the MSA contract) have been granted access by the Company to the system and are using it to process Loans. |
| • | Fees are fixed or determinable. Arrangements where a significant portion of the fee is due beyond 90 days from delivery are not considered to be fixed or determinable. Revenues from such arrangements is recognized as payments become due, assuming all other revenue recognition criteria have been met. Fees from seat licenses are generally due in monthly installments or, in certain cases, in advance via annual installments over the term of the agreement beginning on the effective date of the license. Accordingly, fees from seat licenses are not considered to be fixed or determinable until they become due. |
F-53
Table of Contents
Live Oak Bancshares, Inc.
Notes to Consolidated Financial Statements
For the years ended December 31, 2014, 2013 and 2012
Note 1. Organization and Summary of Significant Accounting Policies (Continued)
| • | Collectability is probable. Collectability is assessed on a customer-by-customer basis, based primarily on creditworthiness as determined by credit checks and analysis, as well as customer payment history. Payment terms generally range from 30 to 90 days from invoice date. If it is determined prior to revenue recognition that collection of an arrangement fee is not probable, revenues are deferred until collection becomes probable or cash is collected, assuming all other revenue recognition criteria are satisfied. |
Professional services related to the implementation of nCino’s software products are generally performed on a fixed fee basis. Professional services revenue is recognized as the terms of the professional services contracts are completed and culminated with acceptance by the customer.
nCino Unearned Revenue
Unearned revenue represents revenues collected from sales of the nCino’s professional service fees, seat licenses, and customer support and annual maintenance services fees that have not been earned as of the balance sheet date. The unearned revenue balance does not represent the total contract value of all noncancelable license agreements in effect. See above nCino Revenue Recognition narrative regarding periods to which this policy applies.
Earnings per share
Basic and diluted earnings per share are computed based on the weighted average number of shares outstanding during each period. Diluted earnings per share reflects the potential dilution that could occur if convertible debt, stock options or restricted stock grants were exercised, resulting in the issuance of common stock that then shared in the net income of the Company.
|
|
December 31, |
|
||||||||||
| 2014 | 2013 | 2012 | ||||||||||
| Basic earnings per share: |
||||||||||||
| Net income available to common shareholders |
$ | 10,048 | $ | 28,062 | $ | 16,095 | ||||||
|
|
|
|
|
|
|
|||||||
| Weighted-average basic shares outstanding |
23,973,398 | 20,347,660 | 19,467,300 | |||||||||
|
|
|
|
|
|
|
|||||||
| Basic earnings per share |
$ | .42 | $ | 1.38 | $ | .83 | ||||||
|
|
|
|
|
|
|
|||||||
| Diluted earnings per share: |
||||||||||||
| Net income available to common shareholders, for diluted EPS |
$ | 10,048 | $ | 28,062 | $ | 16,095 | ||||||
|
|
|
|
|
|
|
|||||||
| Total weighted-average basic shares outstanding |
23,973,398 | 20,347,660 | 19,467,300 | |||||||||
| Add effect of dilutive stock options and restricted grants |
450,783 | 91,470 | 671,060 | |||||||||
|
|
|
|
|
|
|
|||||||
| Total weighted-average diluted shares outstanding |
24,424,181 | 20,439,130 | 20,138,360 | |||||||||
|
|
|
|
|
|
|
|||||||
| Diluted earnings per share |
$ | .41 | $ | 1.37 | $ | .80 | ||||||
|
|
|
|
|
|
|
|||||||
| Anti-dilutive securities |
328,020 | — | — | |||||||||
|
|
|
|
|
|
|
|||||||
Pro forma earnings per share
Because the Company was not a taxable entity prior to August 3, 2014, pro forma amounts for income tax expense and basic and diluted earnings per share have been presented below assuming the Company’s effective tax rate of 38.5% for the years ended December 31, 2014, 2013 and 2012, respectively, as if it had been a
F-54
Table of Contents
Live Oak Bancshares, Inc.
Notes to Consolidated Financial Statements
For the years ended December 31, 2014, 2013 and 2012
Note 1. Organization and Summary of Significant Accounting Policies (Continued)
C Corporation during those periods. In addition, the pro forma results for the year ended December 31, 2014 excludes the initial deferred tax liability recorded as a result of the change in tax status as discussed in Note 8.
| December 31, | ||||||||||||
| 2014 | 2013 | 2012 | ||||||||||
| Pro forma net income available to common shareholders, after tax |
$ | 10,723 | $ | 17,258 | $ | 9,899 | ||||||
|
|
|
|
|
|
|
|||||||
| Pro forma basic earnings per share |
$ | .45 | $ | .85 | $ | .51 | ||||||
|
|
|
|
|
|
|
|||||||
| Pro forma diluted earnings per share |
$ | .44 | $ | .84 | $ | .49 | ||||||
|
|
|
|
|
|
|
|||||||
Reclassifications and Corrections
Certain reclassifications have been made to the prior period’s financial statements to place them on a comparable basis with the current year. Net income and shareholders’ equity previously reported were not affected by these reclassifications.
F-55
Table of Contents
Live Oak Bancshares, Inc.
Notes to Consolidated Financial Statements
For the years ended December 31, 2014, 2013 and 2012
Note 1. Organization and Summary of Significant Accounting Policies (Continued)
During May 2015, the Company determined that certain amounts as presented within the consolidated financial statements as of and for the years ended December 31, 2014, 2013 and 2012, which were previously issued on March 6, 2015 contained immaterial errors. More specifically, the consolidated statements of cash flows failed to identify non-cash transfers of held for sale loan balances to/from loans held for investment and incorrectly presented proceeds from the sale of unguaranteed loans, originations and the amortization of discount on unguaranteed loans during 2014. Additionally, the previously issued consolidated statement of cash flows and the Parent Company Only Financial Statements, Statement of Cash Flows as shown in Note 14, failed to exclude a non-cash conversion of a receivable to an equity interest in nCino during 2013. The effect of correcting these errors within the consolidated statement of cash flows increased net cash used by operating activities by $144 million, $49 million and $10 million, for each of the years ended December 31, 2014, 2013 and 2012, respectively. An offsetting effect of the same amount in the opposite direction was reflected in cash flows from investing activities for each period presented. The effect of these corrections on each line item in the consolidated statements of cash flows for each period presented is shown below:
| Consolidated Statement of Cash Flows Year ended December 31, 2014 |
As Reported |
Change | As Restated |
|||||||||
| Cash flows from operating activities |
||||||||||||
| Amortization of discount on unguaranteed loans |
$ | 2,575 | $ | (3,276 | ) | $ | (701 | ) | ||||
| Originations of loans held for sale |
(519,677 | ) | (245,446 | ) | (765,123 | ) | ||||||
| Proceeds from sales of loans held for sale |
433,912 | 105,210 | 539,122 | |||||||||
| Net cash (used) provided by operating activities |
(117,996 | ) | (143,512 | ) | (261,508 | ) | ||||||
| Cash flows from investing activities |
||||||||||||
| Loan originations and principal collections, net |
(66,582 | ) | 143,512 | 76,930 | ||||||||
| Net cash used by investing activities |
(125,045 | ) | 143,512 | 18,467 | ||||||||
| Supplemental disclosures of noncash operating, investing and financing activities |
||||||||||||
| Transfer of loans held for sale to loans held for investment |
$ | — | $ | 13,611 | $ | 13,611 | ||||||
| Transfer of loans held for investment to loans held for sale |
— | 4,548 | 4,548 | |||||||||
| Consolidated Statement of Cash Flows Year ended December 31, 2013 |
||||||||||||
| Cash flows from operating activities |
||||||||||||
| Originations of loans held for sale |
$ | (315,372 | ) | $ | (134,197 | ) | $ | (449,569 | ) | |||
| Proceeds from sales of loans held for sale |
339,342 | 81,157 | 420,499 | |||||||||
| Other assets |
(2,077 | ) | 4,320 | 2,243 | ||||||||
| Net cash (used) provided by operating activities |
4,545 | (48,720 | ) | (44,175 | ) | |||||||
| Cash flows from investing activities |
||||||||||||
| Investments in non-consolidated affiliates |
(4,570 | ) | (4,320 | ) | (8,890 | ) | ||||||
| Loan originations and principal collections, net |
(52,743 | ) | 53,040 | 297 | ||||||||
| Net cash used by investing activities |
(69,259 | ) | 48,720 | (20,539 | ) | |||||||
F-56
Table of Contents
Live Oak Bancshares, Inc.
Notes to Consolidated Financial Statements
For the years ended December 31, 2014, 2013 and 2012
Note 1. Organization and Summary of Significant Accounting Policies (Continued)
| As Reported |
Change | As Restated |
||||||||||
| Supplemental disclosures of noncash operating, investing and financing activities |
||||||||||||
| Conversion of receivable to equity investment in nCino |
$ | — | $ | 4,320 | $ | 4,320 | ||||||
| Transfer of loans held for sale to loans held for investment |
— | 22,039 | 22,039 | |||||||||
| Transfer of loans held for investment to loans held for sale |
— | 7,934 | 7,934 | |||||||||
| Parent Company Only Statement of Cash Flows (see Note 14) Year ended December 31, 2013 |
||||||||||||
| Cash flows from operating activities |
||||||||||||
| Net change in other assets |
$ | (73 | ) | $ | 4,320 | $ | 4,247 | |||||
| Net cash provided by (used in) operating activities |
9,463 | 4,320 | 13,783 | |||||||||
| Cash flows from investing activities |
||||||||||||
| Capital investment in non-consolidated affiliates |
(4,570 | ) | (4,320 | ) | (8,890 | ) | ||||||
| Net cash used in investing activities |
(946 | ) | (4,320 | ) | (5,266 | ) | ||||||
| Consolidated Statement of Cash Flows Year ended December 31, 2012 |
||||||||||||
| Cash flows from operating activities |
||||||||||||
| Originations of loans held for sale |
$ | (276,447 | ) | $ | (96,247 | ) | $ | (372,694 | ) | |||
| Proceeds from sales of loans held for sale |
276,676 | 86,109 | 362,785 | |||||||||
| Net cash (used) provided by operating activities |
(18,120 | ) | (10,138 | ) | (28,258 | ) | ||||||
| Cash flows from investing activities |
||||||||||||
| Loan originations and principal collections, net |
(10,960 | ) | 10,138 | (822 | ) | |||||||
| Net cash used by investing activities |
(22,775 | ) | 10,138 | (12,637 | ) | |||||||
| Supplemental disclosures of noncash operating, investing and financing activities |
||||||||||||
| Transfer of loans held for sale to loans held for investment |
$ | — | $ | 14,763 | $ | 14,763 | ||||||
| Transfer of loans held for investment to loans held for sale |
— | 35,100 | 35,100 | |||||||||
Additionally, the Company determined that changes in discounts on loans held for investment had erroneously been included within the loan servicing revaluation line item in Note 4 of these consolidated financial statements. A revision has been made to reclassify adjustments related to these discounts from the Note 4 line item titled “Changes in fair value” to “Additions, net” to better reflect valuation adjustments related specifically to the servicing asset. As a result, Note 4 has been revised to reflect the corrected roll forward of the servicing asset. The impact of this correction increased the Additions, net and further reduced Changes in fair value by $2,776, $1,262 and $958 for the years ended December 31, 2014, 2013 and 2012, respectively.
Lastly, the Company determined that in conjunction with the termination of our S-Corporation status to become a C Corporation on August 3, 2014, the consolidated statement of shareholders’ equity should have been adjusted to reclassify the accumulated deficit at the time of conversion, totaling $5.1 million, to common stock. The effect of this reclassification is reflected in the line identified as “reclassification adjustment for change in taxable status” in the accompanying consolidated statements of changes in shareholders’ equity. The impact of this reclassification decreased total Class A common stock from $53,780 thousand to $48,657 thousand and
F-57
Table of Contents
Live Oak Bancshares, Inc.
Notes to Consolidated Financial Statements
For the years ended December 31, 2014, 2013 and 2012
Note 1. Organization and Summary of Significant Accounting Policies (Continued)
increased the retained earnings (accumulated deficit) from $(12,066) thousand to $(6,943) thousand at December 31, 2014.
None of these restatements had an effect on the Company’s consolidated balance sheets, consolidated statements of income, consolidated statements of comprehensive income, consolidated statements of shareholders’ equity or consolidated statements of cash flows, other than reclassifications within shareholders’ equity of the consolidated balance sheet and the related statement of changes in shareholders’ equity and line items within the statements of cash flows as presented above. Total equity remained unchanged from the aforementioned reclassification and net increase (decrease) in cash and cash equivalents remained unchanged. Due to the nature of these corrections the Company is presenting the corrected balances prospectively in these restated consolidated financial statements as of December 31, 2014 and for the years ended December 31, 2014, 2013 and 2012.
Recent Accounting Pronouncements
The following is a summary of recent authoritative pronouncements that could impact the accounting, reporting, and/or disclosure of financial information by the Company.
In May 2014, the FASB issued ASU 2014-09, Revenue from Contracts with Customers (Topic 606). ASU 2014-09 is intended to clarify the principles for recognizing revenue and to develop a common revenue standard for U.S. GAAP. ASU 2014-09 is effective for annual reporting periods beginning after December 15, 2017 and interim periods within annual periods beginning after December 15, 2018. Adoption by the Company is not expected to have a material impact on the consolidated financial statements and related disclosures.
In June 2014, the FASB issued ASU 2014-12, Compensation — Stock Compensation (Topic 718) — Accounting for Share-Based Payments When the Terms of an Award Provide That a Performance Target Could Be Achieved After the Requisite Service Period. ASU 2014-12 is intended to clarify the accounting for the timing of expense recognition related to employee share-based payments in which a performance target that effects vesting could be achieved after the requisite service period. ASU 2014-12 is effective for annual periods and interim periods within those annual periods beginning after December 15, 2015. Adoption by the Company is not expected to have a material impact on the consolidated financial statements and related disclosures.
Other accounting standards that have been issued or proposed by the FASB or other standards-setting bodies are not expected to have a material impact on the Company’s financial position, results of operations and cash flows.
F-58
Table of Contents
Live Oak Bancshares, Inc.
Notes to Consolidated Financial Statements
For the years ended December 31, 2014, 2013 and 2012
Note 2. Securities
The carrying amount of securities and their approximate fair values at December 31, 2014, 2013 and 2012 is:
| Amortized Cost |
Unrealized Gains |
Unrealized Losses |
Fair Value |
|||||||||||||
| 2014 |
||||||||||||||||
| US government agencies |
$ | 35,207 | $ | 127 | $ | 25 | $ | 35,309 | ||||||||
| Residential mortgage-backed securities |
13,973 | 92 | 56 | 14,009 | ||||||||||||
|
|
|
|
|
|
|
|
|
|||||||||
| $ | 49,180 | $ | 219 | $ | 81 | $ | 49,318 | |||||||||
|
|
|
|
|
|
|
|
|
|||||||||
| 2013 |
||||||||||||||||
| US government agencies |
$ | 5,315 | $ | 56 | $ | 109 | $ | 5,262 | ||||||||
| Residential mortgage-backed securities |
14,322 | 109 | 247 | 14,184 | ||||||||||||
|
|
|
|
|
|
|
|
|
|||||||||
| $ | 19,637 | $ | 165 | $ | 356 | $ | 19,446 | |||||||||
|
|
|
|
|
|
|
|
|
|||||||||
| 2012 |
||||||||||||||||
| US government agencies |
$ | 3,425 | $ | 96 | $ | 4 | $ | 3,517 | ||||||||
| Residential mortgage-backed securities |
11,449 | 451 | 1 | 11,899 | ||||||||||||
|
|
|
|
|
|
|
|
|
|||||||||
| $ | 14,874 | $ | 547 | $ | 5 | $ | 15,416 | |||||||||
|
|
|
|
|
|
|
|
|
|||||||||
There were no calls or maturities of securities during 2014. Three securities were sold for $2.6 million resulting in a net loss on sale of securities of $74 thousand during the year ended December 31, 2014. A total of nine securities totaling $34.7 million were purchased during the year ended December 31, 2014. Securities purchases consisted of five US government agency securities for $30 million, two mortgage-backed securities for $3.7 million and two municipal securities for $1 million. The US agency securities purchases and $10 million in certificate of deposit investments reflected on the balance sheet were part of a strategic investment plan with maturities ranging from 2-4 year terms, utilizing excess cash from the $74.6 million private placement capital raise that took place in August 2014. There was one security called for $1.7 million during 2013. Four securities were sold for $1.6 million resulting in a net gain on sale of securities of $11 thousand during the year ending December 31, 2013. There were no investments sold during the year ended December 31, 2012.
The following table shows gross unrealized losses and fair value, aggregated by investment category and length of time that the individual securities have been in a continuous unrealized loss position, for the investment securities with unrealized losses at December 31, 2014.
| Less Than 12 Months | 12 Months or More | Total | ||||||||||||||||||||||
| Fair Value |
Unrealized Losses |
Fair Value |
Unrealized Losses |
Fair Value |
Unrealized Losses |
|||||||||||||||||||
| US government agencies |
$ | — | $ | — | $ | 1,224 | $ | 25 | $ | 1,224 | $ | 25 | ||||||||||||
| Residential mortgage-backed securities |
2,234 | 4 | 5,158 | 52 | 7,392 | 56 | ||||||||||||||||||
|
|
|
|
|
|
|
|
|
|
|
|
|
|||||||||||||
| Total |
$ | 2,234 | $ | 4 | $ | 6,382 | $ | 77 | $ | 8,616 | $ | 81 | ||||||||||||
|
|
|
|
|
|
|
|
|
|
|
|
|
|||||||||||||
At December 31, 2014, there were six securities, consisting of one US agency security and five mortgage-backed securities, in unrealized loss positions for greater than 12 months; and one mortgage-backed security in an unrealized loss position for less than 12 months. These unrealized losses are primarily the result of volatility in the market and are related to market interest rates. Since none of the unrealized losses relate to marketability of
F-59
Table of Contents
Live Oak Bancshares, Inc.
Notes to Consolidated Financial Statements
For the years ended December 31, 2014, 2013 and 2012
Note 2. Securities (Continued)
the securities or the issuer’s ability to honor redemption obligations, none of the securities are deemed to be other than temporarily impaired. Investments in an unrealized loss position as of December 31, 2013 and 2012 were all in a continuous loss position for less than 12 months.
All residential mortgage-backed securities in the Company’s portfolio at December 31, 2014, 2013 and 2012 were backed by U.S. government sponsored enterprises (“GSEs”).
The following is a summary of investment securities by maturity at December 31, 2014:
| Available for sale | ||||||||
| Amortized cost |
Fair value |
|||||||
| One to five years |
$ | 33,958 | $ | 34,085 | ||||
| Five to ten years |
2,674 | 2,674 | ||||||
| After 10 years |
12,548 | 12,559 | ||||||
|
|
|
|
|
|||||
| $ | 49,180 | $ | 49,318 | |||||
|
|
|
|
|
|||||
The table above reflects contractual maturities. Actual results will differ as the loans underlying the mortgage-backed securities may repay sooner than scheduled.
At December 31, 2014, 2013 and 2012 investment securities with a fair market value of $1.3 million, $1.3 million and $1.4 million, respectively, were pledged to secure a line of credit with the Company’s correspondent bank.
Note 3. Loans and Allowance for Loan Losses
Loan Portfolio Segments
The following describe the risk characteristics relevant to each of the portfolio segments. Each loan category is assigned a risk grade during the origination and closing process based on criteria described later in this section.
Commercial and Industrial
Commercial and industrial loans (C&I) receive similar underwriting treatment as commercial real estate loans in that the repayment source is analyzed to determine its ability to meet cash flow coverage requirements as set forth by Bank policies. Repayment of the Bank’s C&I loans generally comes from the generation of cash flow as the result of the borrower’s business operations. This business cycle itself brings a certain level of risk to the portfolio. In some instances, these loans may carry a higher degree of risk due to a variety of reasons – illiquid collateral, specialized equipment, highly depreciable assets, uncollectable accounts receivable, revolving balances, or simply being unsecured. As a result of these characteristics, the SBA guarantee on these loans is an important factor in mitigating risk.
Construction and Development
Construction and development loans are for the purpose of acquisition and development of land to be improved through the construction of commercial buildings. Such loans are usually paid off through the conversion to permanent financing for the long-term benefit of the borrower’s ongoing operations. At the completion of the project, if the loan is converted to permanent financing or if scheduled loan amortization
F-60
Table of Contents
Live Oak Bancshares, Inc.
Notes to Consolidated Financial Statements
For the years ended December 31, 2014, 2013 and 2012
Note 3. Loans and Allowance for Loan Losses (Continued)
begins, it is then reclassified to the Owner Occupied Commercial Real Estate segment. Underwriting of construction and development loans typically includes analysis of not only the borrower’s financial condition and ability to meet the required debt obligations, but also the general market conditions associated with the area and type of project being funded.
Owner Occupied Commercial Real Estate
Owner occupied commercial real estate loans are extensions of credit secured by owner occupied collateral. Underwriting generally involves intensive analysis of the financial strength of the borrower and guarantor, liquidation value of the subject collateral, the associated unguaranteed exposure, and any available secondary sources of repayment, with the greatest emphasis given to a borrower’s capacity to meet cash flow coverage requirements as set forth by Bank policies. Such repayment of owner-occupied loans is commonly derived from the successful ongoing operations of the business occupying the property. These typically include small businesses and professional practices.
Commercial Land
Commercial land loans are extensions of credit secured by farmland. Such loans are often for land improvements relative to agricultural endeavors which may include construction of new specialized facilities. These loans are usually paid off through the conversion to permanent financing, or if scheduled loan amortization begins, for the long-term benefit of the borrower’s ongoing operations. Underwriting generally involves intensive analysis of the financial strength of the borrower and guarantor, liquidation value of the subject collateral, the associated unguaranteed exposure, and any available secondary sources of repayment, with the greatest emphasis given to a borrower’s capacity to meet cash flow coverage requirements as set forth by Bank policies.
Each of the loan types referenced in the sections above is further segmented into verticals in which the Bank chooses to operate — Death Care Management, Healthcare Services (medical, dental, ophthalmic), Independent Pharmacies, Investment Advisors, Veterinary Practices, Family Entertainment Centers, Poultry Agriculture and Wine & Craft Beverages. Wine & Craft Beverages is a new area of emphasis for which there is no loan activity as of December 31, 2014. The Bank chooses to finance businesses operating in these industries because of certain similarities. The similarities range from historical default and loss characteristics to business operations. However, there are differences that create the necessity to underwrite these loans according to varying criteria and guidelines. When underwriting a loan, the Bank considers numerous factors such as cash flow coverage, the credit scores of the guarantors, revenue growth and practice ownership experience and debt service capacity. Minimum guidelines have been set with regard to these various factors and deviations from those guidelines requiring compensating strengths when considering a proposed loan.
F-61
Table of Contents
Live Oak Bancshares, Inc.
Notes to Consolidated Financial Statements
For the years ended December 31, 2014, 2013 and 2012
Note 3. Loans and Allowance for Loan Losses (Continued)
Loans consist of the following:
| 2014 | 2013 | 2012 | ||||||||||
| Commercial & Industrial |
$ | 81,057 | $ | 57,359 | $ | 34,200 | ||||||
| Death Care Management |
3,603 | 1,782 | 283 | |||||||||
| Family Entertainment Centers |
333 | — | — | |||||||||
| Healthcare Services |
12,319 | 8,739 | 4,996 | |||||||||
| Independent Pharmacies |
34,079 | 24,026 | 12,192 | |||||||||
| Investment Advisors |
9,660 | 2,817 | — | |||||||||
| Veterinary Practices |
20,902 | 19,978 | 15,719 | |||||||||
| Other Industries |
161 | 17 | 1,010 | |||||||||
| Construction & Development |
9,526 | 10,286 | 8,503 | |||||||||
| Poultry Agriculture |
3,910 | — | — | |||||||||
| Death Care Management |
92 | 989 | 315 | |||||||||
| Healthcare Services |
2,957 | 4,997 | 3,136 | |||||||||
| Independent Pharmacies |
215 | 101 | 637 | |||||||||
| Veterinary Practices |
2,207 | 4,199 | 4,163 | |||||||||
| Other Industries |
145 | — | 252 | |||||||||
| Owner Occupied Commercial Real Estate |
111,620 | 74,461 | 50,577 | |||||||||
| Poultry Agriculture |
259 | — | — | |||||||||
| Death Care Management |
18,879 | 11,668 | 3,703 | |||||||||
| Family Entertainment Centers |
872 | — | — | |||||||||
| Healthcare Services |
26,173 | 11,129 | 6,207 | |||||||||
| Independent Pharmacies |
4,750 | 3,490 | 3,008 | |||||||||
| Investment Advisors |
2,161 | 171 | — | |||||||||
| Veterinary Practices |
57,934 | 47,896 | 35,554 | |||||||||
| Other Industries |
592 | 107 | 2,105 | |||||||||
| Commercial Land |
1,248 | — | — | |||||||||
| Poultry Agriculture |
1,248 | — | — | |||||||||
| Total Loans2 |
203,451 | 142,106 | 93,280 | |||||||||
| Net Deferred Costs |
2,060 | 1,212 | 592 | |||||||||
| Discount on SBA 7(a) Unguaranteed1 |
(1,575 | ) | (1,969 | ) | (1,203 | ) | ||||||
|
|
|
|
|
|
|
|||||||
| Loans, Net of Unearned |
$ | 203,936 | $ | 141,349 | $ | 92,669 | ||||||
|
|
|
|
|
|
|
|||||||
| 1 | The Company measures the carrying value of the retained portion of loans sold at fair value under ASC Subtopic 825-10. The value of these retained loan balances is discounted based on the estimates derived from comparable unguaranteed loan sales. |
| 2 | Total loans include $21.3 million, $12.4 and $12.0 million of U.S. Government Guaranteed loans as of December 31, 2014, 2013 and 2012, respectively. |
Credit Risk Profile
The Bank uses internal loan reviews to assess the performance of individual loans by industry segment. Annually, an independent review of the loan portfolio is performed by an external firm. The Bank’s annual review of each borrower’s financial performance validates adequacy of the risk grade assigned.
F-62
Table of Contents
Live Oak Bancshares, Inc.
Notes to Consolidated Financial Statements
For the years ended December 31, 2014, 2013 and 2012
Note 3. Loans and Allowance for Loan Losses (Continued)
The Bank uses a grading system to rank the quality of each loan. The grade is periodically evaluated and adjusted as performance dictates. Loan grades 1 through 4 are passing grades, grade 5 is special mention. Collectively, grades 6 through 8 represent classified loans in the Bank’s portfolio. The following guidelines govern the assignment of these risk grades:
Exceptional Loans (1 Rated): These loans are of the highest quality, with strong, well-documented sources of repayment. Debt service coverage (“DSC”) is over 1.75X based on historical results. Secondary source of repayment is strong, with a loan to value (“LTV”) of 65% or less if secured solely by commercial real estate (“CRE”). Discounted collateral coverage from all sources should exceed 125%. Guarantors have credit scores above 740.
Quality Loans (2 Rated): These loans are of good quality, with good well-documented sources of repayment. DSC is over 1.25X based on historical or pro-forma results. Secondary source of repayment is good, with a LTV of 75% or less if secured solely by CRE. Discounted collateral coverage should exceed 100%. Guarantors have credit scores above 700.
Acceptable Loans (3 rated): These loans are of acceptable quality, with acceptable sources of repayment. DSC of over 1.00X based on historical or pro-forma results. Companies that do not meet these credit metrics must be evaluated to determine if they should be graded below this level.
Acceptable Loans (4 rated): These loans are considered very weak pass. These loans are riskier than a 3-rated credit, but due to various mitigates is not considered a Special Mention or worse. The mitigating factors must clearly be identified to offset further downgrade. Examples of loans that may be put in this category include start-up loans, loans with Sub 1:1 cash flow coverage with other sources of repayment.
Special mention (5 rated): These loans are to be considered as emerging problems, with potentially unsatisfactory characteristics. These loans require greater management attention. A loan may be put into this category if the Bank is unable to obtain financial reporting from a company to fully evaluate its position.
Substandard (6 rated): Loans graded Substandard are inadequately protected by current sound net worth, paying capacity of the borrower, or pledged collateral. They typically have unsatisfactory characteristics causing more than acceptable levels of risk, and have one or more well-defined weaknesses that could jeopardize the repayment of the debt.
Doubtful (7 rated): Loans graded Doubtful have inherent weaknesses that make collection or liquidation in full questionable. Loans graded Doubtful must be placed on non-accrual status.
Loss (8 rated): Loss rated loans are considered uncollectible and of such little value that their continuance as an active Bank asset is not warranted. The asset should be charged off, even though partial recovery may be possible in the future.
F-63
Table of Contents
Live Oak Bancshares, Inc.
Notes to Consolidated Financial Statements
For the years ended December 31, 2014, 2013 and 2012
Note 3. Loans and Allowance for Loan Losses (Continued)
The following tables summarize the risk grades of each category as of December 31, 2014, 2013 and 2012.
| Risk Grades 1 - 4 |
Risk Grade 5 |
Risk Grades 6 - 8 |
Total | |||||||||||||
| 2014 |
||||||||||||||||
| Commercial & Industrial |
$ | 63,777 | $ | 4,546 | $ | 12,734 | $ | 81,057 | ||||||||
| Death Care Management |
3,603 | — | — | 3,603 | ||||||||||||
| Family Entertainment Centers |
333 | — | — | 333 | ||||||||||||
| Healthcare Services |
6,995 | 538 | 4,786 | 12,319 | ||||||||||||
| Independent Pharmacies |
27,673 | 2,726 | 3,680 | 34,079 | ||||||||||||
| Investment Advisors |
9,660 | — | — | 9,660 | ||||||||||||
| Veterinary Practices |
15,513 | 1,121 | 4,268 | 20,902 | ||||||||||||
| Other Industries |
— | 161 | — | 161 | ||||||||||||
| Construction & Development |
9,526 | — | — | 9,526 | ||||||||||||
| Poultry Agriculture |
3,910 | — | — | 3,910 | ||||||||||||
| Death Care Management |
92 | — | — | 92 | ||||||||||||
| Healthcare Services |
2,957 | — | — | 2,957 | ||||||||||||
| Independent Pharmacies |
215 | — | — | 215 | ||||||||||||
| Veterinary Practices |
2,207 | — | — | 2,207 | ||||||||||||
| Other Industries |
145 | — | — | 145 | ||||||||||||
| Owner Occupied Commercial Real Estate |
87,883 | 5,219 | 18,518 | 111,620 | ||||||||||||
| Poultry Agriculture |
259 | — | — | 259 | ||||||||||||
| Death Care Management |
16,519 | 639 | 1,721 | 18,879 | ||||||||||||
| Family Entertainment Centers |
872 | — | — | 872 | ||||||||||||
| Healthcare Services |
22,778 | 938 | 2,457 | 26,173 | ||||||||||||
| Independent Pharmacies |
4,709 | 41 | — | 4,750 | ||||||||||||
| Investment Advisors |
2,161 | — | — | 2,161 | ||||||||||||
| Veterinary Practices |
40,281 | 3,601 | 14,052 | 57,934 | ||||||||||||
| Other Industries |
304 | — | 288 | 592 | ||||||||||||
| Commercial Land |
1,248 | — | — | 1,248 | ||||||||||||
| Poultry Agriculture |
1,248 | — | — | 1,248 | ||||||||||||
|
|
|
|
|
|
|
|
|
|||||||||
| Total |
$ | 162,434 | $ | 9,765 | $ | 31,252 | $ | 203,451 | ||||||||
|
|
|
|
|
|
|
|
|
|||||||||
F-64
Table of Contents
Live Oak Bancshares, Inc.
Notes to Consolidated Financial Statements
For the years ended December 31, 2014, 2013 and 2012
Note 3. Loans and Allowance for Loan Losses (Continued)
| Risk Grades 1 - 4 |
Risk Grade 5 |
Risk Grades 6 - 8 |
Total | |||||||||||||
| 2013 |
||||||||||||||||
| Commercial & Industrial |
$ | 44,786 | $ | 4,769 | $ | 7,804 | $ | 57,359 | ||||||||
| Death Care Management |
1,782 | — | — | 1,782 | ||||||||||||
| Healthcare Services |
5,538 | 941 | 2,260 | 8,739 | ||||||||||||
| Independent Pharmacies |
20,969 | 2,353 | 704 | 24,026 | ||||||||||||
| Investment Advisors |
2,817 | — | — | 2,817 | ||||||||||||
| Veterinary Practices |
13,663 | 1,475 | 4,840 | 19,978 | ||||||||||||
| Other Industries |
17 | — | — | 17 | ||||||||||||
| Construction & Development |
8,981 | 1,305 | — | 10,286 | ||||||||||||
| Death Care Management |
989 | — | — | 989 | ||||||||||||
| Healthcare Services |
4,934 | 63 | — | 4,997 | ||||||||||||
| Independent Pharmacies |
101 | — | — | 101 | ||||||||||||
| Veterinary Practices |
2,957 | 1,242 | — | 4,199 | ||||||||||||
| Owner Occupied Commercial Real Estate |
57,120 | 3,797 | 13,544 | 74,461 | ||||||||||||
| Death Care Management |
11,312 | — | 356 | 11,668 | ||||||||||||
| Healthcare Services |
9,218 | 423 | 1,488 | 11,129 | ||||||||||||
| Independent Pharmacies |
3,189 | — | 301 | 3,490 | ||||||||||||
| Investment Advisors |
171 | — | — | 171 | ||||||||||||
| Veterinary Practices |
33,226 | 3,374 | 11,296 | 47,896 | ||||||||||||
| Other Industries |
4 | — | 103 | 107 | ||||||||||||
|
|
|
|
|
|
|
|
|
|||||||||
| Total |
$ | 110,887 | $ | 9,871 | $ | 21,348 | $ | 142,106 | ||||||||
|
|
|
|
|
|
|
|
|
|||||||||
| Risk Grades 1 - 4 |
Risk Grade 5 |
Risk Grades 6 - 8 |
Total | |||||||||||||
| 2012 |
||||||||||||||||
| Commercial & Industrial |
$ | 26,266 | $ | 2,639 | $ | 5,295 | $ | 34,200 | ||||||||
| Death Care Management |
283 | — | — | 283 | ||||||||||||
| Healthcare Services |
4,183 | 53 | 805 | 4,996 | ||||||||||||
| Independent Pharmacies |
11,185 | 1,007 | — | 12,192 | ||||||||||||
| Veterinary Practices |
9,650 | 1,579 | 4,490 | 15,719 | ||||||||||||
| Other Industries |
1,110 | — | — | 1,010 | ||||||||||||
| Construction & Development |
7,644 | — | 859 | 8,503 | ||||||||||||
| Death Care Management |
315 | — | — | 315 | ||||||||||||
| Healthcare Services |
2,277 | — | 859 | 3,136 | ||||||||||||
| Independent Pharmacies |
637 | — | — | 637 | ||||||||||||
| Veterinary Practices |
4,163 | — | — | 4,163 | ||||||||||||
| Other Industries |
252 | — | — | 252 | ||||||||||||
| Owner Occupied Commercial Real Estate |
31,333 | 5,689 | 13,555 | 50,577 | ||||||||||||
| Death Care Management |
3,703 | — | — | 3,703 | ||||||||||||
| Healthcare Services |
4,068 | — | 2,139 | 6,207 | ||||||||||||
| Independent Pharmacies |
1,315 | — | 1,693 | 3,008 | ||||||||||||
| Veterinary Practices |
20,964 | 5,689 | 8,901 | 35,554 | ||||||||||||
| Other Industries |
1,283 | — | 822 | 2,105 | ||||||||||||
|
|
|
|
|
|
|
|
|
|||||||||
| Total |
$ | 65,243 | $ | 8,328 | $ | 19,709 | $ | 93,280 | ||||||||
|
|
|
|
|
|
|
|
|
|||||||||
F-65
Table of Contents
Live Oak Bancshares, Inc.
Notes to Consolidated Financial Statements
For the years ended December 31, 2014, 2013 and 2012
Note 3. Loans and Allowance for Loan Losses (Continued)
| 1 | Total loans include $21.3 million of U.S. Government Guaranteed loans as of December 31, 2014, segregated by risk grade as follows: Risk Grades 1 – 4 = $0, Risk Grade 5 = $1.1 million, Risk Grades 6 –8 = $20.2 million. As of December 31, 2013 total loans include $12.4 million of U.S. Government Guaranteed loans, segregated by risk grade as follows: Risk Grades 1 – 4 = $0, Risk Grade 5 = $1.1 million, Risk Grades 6 – 8 = $11.3 million. As of December 31, 2012, total loans include $12.0 million of U.S. Government Guaranteed loans segregated by risk grade as follows: Risk Grades 1 – 4 = $0, Risk Grade 5 = $1.3 million, Risk Grades 6 – 8 = $10.7 million. |
Past Due Loans
Loans are considered past due if the required principal and interest payments have not been received as of the date such payments were due. Also, loans less than 30 days past due and accruing are included within current loans shown below. The following table shows an age analysis of past due loans as of December 31, 2014, 2013 and 2012.
| Less Than 30 Days Past Due & Not Accruing |
30-89 Days Past Due & Accruing |
30-89 Days Past Due & Not Accruing |
Greater Than 90 Days Past Due |
Total Loans Past Due |
Current Loans |
Total Loans |
Loans 90 Days or More Past Due & Still Accruing |
|||||||||||||||||||||||||
| 2014 |
||||||||||||||||||||||||||||||||
| Commercial & Industrial |
$ | 1,025 | $ | 1,433 | $ | 236 | $ | 5,872 | $ | 8,566 | $ | 72,491 | $ | 81,057 | $ | — | ||||||||||||||||
| Death Care Management |
— | — | — | — | — | 3,603 | 3,603 | — | ||||||||||||||||||||||||
| Family Entertainment Centers |
— | — | — | — | — | 333 | 333 | — | ||||||||||||||||||||||||
| Healthcare Services |
— | 1,059 | 232 | 2,420 | 3,711 | 8,608 | 12,319 | — | ||||||||||||||||||||||||
| Independent Pharmacies |
— | 98 | — | 1,224 | 1,322 | 32,757 | 34,079 | — | ||||||||||||||||||||||||
| Investment Advisors |
— | — | — | — | — | 9,660 | 9,660 | — | ||||||||||||||||||||||||
| Veterinary Practices |
1,025 | 276 | 4 | 2,228 | 3,533 | 17,369 | 20,902 | — | ||||||||||||||||||||||||
| Other Industries |
— | — | — | — | — | 161 | 161 | — | ||||||||||||||||||||||||
| Construction & Development |
— | — | — | — | — | 9,526 | 9,526 | — | ||||||||||||||||||||||||
| Poultry Agriculture |
— | — | — | — | — | 3,910 | 3,910 | — | ||||||||||||||||||||||||
| Death Care Management |
— | — | — | — | — | 92 | 92 | — | ||||||||||||||||||||||||
| Healthcare Services |
— | — | — | — | — | 2,957 | 2,957 | — | ||||||||||||||||||||||||
| Independent Pharmacies |
— | — | — | — | — | 215 | 215 | — | ||||||||||||||||||||||||
| Veterinary Practices |
— | — | — | — | — | 2,207 | 2,207 | — | ||||||||||||||||||||||||
| Other Industries |
— | — | — | — | — | 145 | 145 | — | ||||||||||||||||||||||||
| Owner Occupied Commercial Real Estate |
2,464 | 5,246 | 2,181 | 6,914 | 16,805 | 94,815 | 111,620 | — | ||||||||||||||||||||||||
| Poultry Agriculture |
— | — | — | — | — | 259 | 259 | — | ||||||||||||||||||||||||
| Death Care Management |
— | — | — | 1,721 | 1,721 | 17,158 | 18,879 | — | ||||||||||||||||||||||||
| Family Entertainment Centers |
— | — | — | — | — | 872 | 872 | — | ||||||||||||||||||||||||
| Healthcare Services |
— | 145 | 230 | 2,082 | 2,457 | 23,716 | 26,173 | — | ||||||||||||||||||||||||
| Independent Pharmacies |
— | — | — | — | — | 4,750 | 4,750 | — | ||||||||||||||||||||||||
| Investment Advisors |
— | — | — | — | — | 2,161 | 2,161 | — | ||||||||||||||||||||||||
| Veterinary Practices |
2,464 | 5,101 | 1,951 | 2,836 | 12,352 | 45,582 | 57,934 | — | ||||||||||||||||||||||||
| Other Industries |
— | — | — | 275 | 275 | 317 | 592 | — | ||||||||||||||||||||||||
| Commercial Land |
— | — | — | — | — | 1,248 | 1,248 | — | ||||||||||||||||||||||||
| Poultry Agriculture |
— | — | — | — | — | 1,248 | 1,248 | — | ||||||||||||||||||||||||
|
|
|
|
|
|
|
|
|
|
|
|
|
|
|
|
|
|||||||||||||||||
| Total1 |
$ | 3,489 | $ | 6,679 | $ | 2,417 | $ | 12,786 | $ | 25,371 | $ | 178,080 | $ | 203,451 | $ | — | ||||||||||||||||
|
|
|
|
|
|
|
|
|
|
|
|
|
|
|
|
|
|||||||||||||||||
F-66
Table of Contents
Live Oak Bancshares, Inc.
Notes to Consolidated Financial Statements
For the years ended December 31, 2014, 2013 and 2012
Note 3. Loans and Allowance for Loan Losses (Continued)
| Less Than 30 Days Past Due & Not Accruing |
30-89 Days Past Due & Accruing |
30-89 Days Past Due & Not Accruing |
Greater Than 90 Days Past Due |
Total Loans Past Due |
Current Loans |
Total Loans |
Loans 90 Days or More Past Due & Still Accruing |
|||||||||||||||||||||||||
| 2013 |
||||||||||||||||||||||||||||||||
| Commercial & Industrial |
$ | 891 | $ | 219 | $ | 388 | $ | 2,820 | $ | 4,318 | $ | 53,041 | $ | 57,359 | $ | — | ||||||||||||||||
| Death Care Management |
— | — | — | — | — | 1,782 | 1,782 | — | ||||||||||||||||||||||||
| Healthcare Services |
122 | — | — | 650 | 772 | 7,967 | 8,739 | — | ||||||||||||||||||||||||
| Independent Pharmacies |
— | — | — | — | — | 24,026 | 24,026 | — | ||||||||||||||||||||||||
| Investment Advisors |
— | — | — | — | — | 2,817 | 2,817 | — | ||||||||||||||||||||||||
| Veterinary Practices |
769 | 219 | 388 | 2,170 | 3,546 | 16,432 | 19,978 | — | ||||||||||||||||||||||||
| Other Industries |
— | — | — | — | — | 17 | 17 | — | ||||||||||||||||||||||||
| Construction & Development |
— | — | — | — | — | 10,286 | 10,286 | — | ||||||||||||||||||||||||
| Death Care Management |
— | — | — | — | — | 989 | 989 | — | ||||||||||||||||||||||||
| Healthcare Services |
— | — | — | — | — | 4,997 | 4,997 | — | ||||||||||||||||||||||||
| Independent Pharmacies |
— | — | — | — | — | 101 | 101 | — | ||||||||||||||||||||||||
| Veterinary Practices |
— | — | — | — | — | 4,199 | 4,199 | — | ||||||||||||||||||||||||
| Other Industries |
||||||||||||||||||||||||||||||||
| Owner Occupied Commercial Real Estate |
2,620 | 3,601 | 438 | 1,540 | 8,199 | 66,262 | 74,461 | — | ||||||||||||||||||||||||
| Death Care Management |
— | — | — | — | — | 11,668 | 11,668 | — | ||||||||||||||||||||||||
| Healthcare Services |
— | — | — | 58 | 58 | 11,071 | 11,129 | — | ||||||||||||||||||||||||
| Independent Pharmacies |
— | — | — | — | — | 3,490 | 3,490 | — | ||||||||||||||||||||||||
| Investment Advisors |
— | — | — | — | — | 171 | 171 | — | ||||||||||||||||||||||||
| Veterinary Practices |
2,620 | 3,498 | 438 | 1,482 | 8,038 | 39,858 | 47,896 | — | ||||||||||||||||||||||||
| Other Industries |
— | 103 | — | — | 103 | 4 | 107 | — | ||||||||||||||||||||||||
|
|
|
|
|
|
|
|
|
|
|
|
|
|
|
|
|
|||||||||||||||||
| Total1 |
$ | 3,511 | $ | 3,820 | $ | 826 | $ | 4,360 | $ | 12,517 | $ | 129,589 | $ | 142,106 | $ | — | ||||||||||||||||
|
|
|
|
|
|
|
|
|
|
|
|
|
|
|
|
|
|||||||||||||||||
| Less Than 30 Days Past Due & Not Accruing |
30-89 Days Past Due & Accruing |
30-89 Days Past Due & Not Accruing |
Greater Than 90 Days Past Due |
Total Loans Past Due |
Current Loans |
Total Loans |
Loans 90 Days or More Past Due & Still Accruing |
|||||||||||||||||||||||||
| 2012 |
||||||||||||||||||||||||||||||||
| Commercial & Industrial |
$ | 129 | $ | 73 | $ | 209 | $ | 2,617 | $ | 3,028 | $ | 31,172 | $ | 34,200 | $ | |||||||||||||||||
| Death Care Management |
— | — | — | — | — | 283 | 283 | — | ||||||||||||||||||||||||
| Healthcare Services |
— | 73 | 72 | 509 | 654 | 4,342 | 4,996 | — | ||||||||||||||||||||||||
| Independent Pharmacies |
— | — | — | — | — | 12,192 | 12,192 | — | ||||||||||||||||||||||||
| Veterinary Practices |
129 | — | 137 | 2,108 | 2,374 | 13,345 | 15,719 | — | ||||||||||||||||||||||||
| Other Industries |
— | — | — | — | — | 1,010 | 1,010 | — | ||||||||||||||||||||||||
| Construction & Development |
— | — | — | — | — | 8,503 | 8,503 | — | ||||||||||||||||||||||||
| Death Care Management |
— | — | — | — | — | 315 | 315 | — | ||||||||||||||||||||||||
| Healthcare Services |
— | — | — | — | — | 3,136 | 3,136 | — | ||||||||||||||||||||||||
| Independent Pharmacies |
— | — | — | — | — | 637 | 637 | — | ||||||||||||||||||||||||
| Veterinary Practices |
— | — | — | — | — | 4,163 | 4,163 | — | ||||||||||||||||||||||||
| Other Industries |
252 | 252 | ||||||||||||||||||||||||||||||
| Owner Occupied Commercial Real Estate |
2,048 | 412 | — | 3,590 | 6,050 | 44,527 | 50,577 | — | ||||||||||||||||||||||||
| Death Care Management |
— | — | — | — | — | 3,703 | 3,703 | — | ||||||||||||||||||||||||
| Healthcare Services |
— | — | — | — | — | 6,207 | 6,207 | — | ||||||||||||||||||||||||
| Independent Pharmacies |
— | — | — | — | — | 3,008 | 3,008 | — | ||||||||||||||||||||||||
| Veterinary Practices |
2,048 | 412 | — | 2,887 | 5,347 | 30,207 | 35,554 | — | ||||||||||||||||||||||||
| Other Industries |
— | — | — | 703 | 703 | 1,402 | 2,105 | — | ||||||||||||||||||||||||
|
|
|
|
|
|
|
|
|
|
|
|
|
|
|
|
|
|||||||||||||||||
| Total1 |
$ | 2,177 | $ | 485 | $ | 209 | $ | 6,207 | $ | 9,078 | $ | 84,202 | $ | 93,280 | $ | — | ||||||||||||||||
|
|
|
|
|
|
|
|
|
|
|
|
|
|
|
|
|
|||||||||||||||||
F-67
Table of Contents
Live Oak Bancshares, Inc.
Notes to Consolidated Financial Statements
For the years ended December 31, 2014, 2013 and 2012
Note 3. Loans and Allowance for Loan Losses (Continued)
| 1 | Total loans include $21.3 million of U.S. Government Guaranteed loans as of December 31, 2014, of which $11.7 million is greater than 90 days past due, $3.5 million is 30-89 days past due and $6.1 million is included in current loans as presented above. As of December 31, 2013, total loans include $12.4 million of U.S. Government Guaranteed loans, of which $4.1 million is greater than 90 days past due, $2.6 million is 30-89 days past due and $5.8 million is included in current loans as presented above. As of December 31, 2012, total loans include $12.0 million of U.S. Government Guaranteed loans of which $4.7 million is greater than 90 days past due and $7.3 million is included in current loans as presented above. |
Nonaccrual Loans
Loans that become 90 days delinquent, or in cases where there is evidence that the borrower’s ability to make the required payments is impaired, are placed in nonaccrual status and interest accrual is discontinued. If interest on nonaccrual loans had been accrued in accordance with the original terms, interest income would have increased by approximately $443 thousand, $247 thousand and $119 thousand for the years ended December 31, 2014, 2013 and 2012, respectively.
Nonaccrual loans as of December 31, 2014, 2013 and 2012 are as follows:
| 2014 |
Loan Balance |
Guaranteed Balance |
Unguaranteed Exposure |
|||||||||
| Commercial & Industrial |
$ | 7,133 | $ | 6,620 | $ | 513 | ||||||
| Healthcare Services |
2,652 | 2,368 | 284 | |||||||||
| Independent Pharmacies |
1,224 | 1,139 | 85 | |||||||||
| Veterinary Practices |
3,257 | 3,113 | 144 | |||||||||
| Owner Occupied Commercial Real Estate |
11,559 | 8,935 | 2,624 | |||||||||
| Death Care Management |
1,721 | 1,505 | 216 | |||||||||
| Healthcare Services |
2,312 | 1,919 | 393 | |||||||||
| Veterinary Practices |
7,251 | 5,236 | 2,015 | |||||||||
| Other Industries |
275 | 275 | — | |||||||||
|
|
|
|
|
|
|
|||||||
| Total |
$ | 18,692 | $ | 15,555 | $ | 3,137 | ||||||
|
|
|
|
|
|
|
|||||||
| 2013 |
Loan Balance |
Guaranteed Balance |
Unguaranteed Exposure |
|||||||||
| Commercial & Industrial |
$ | 4,099 | $ | 3,849 | $ | 250 | ||||||
| Healthcare Services |
772 | 660 | 112 | |||||||||
| Veterinary Practices |
3,327 | 3,189 | 138 | |||||||||
| Owner Occupied Commercial Real Estate |
4,598 | 3,134 | 1,464 | |||||||||
| Healthcare Services |
58 | — | 58 | |||||||||
| Veterinary Practices |
4,540 | 3,134 | 1,406 | |||||||||
|
|
|
|
|
|
|
|||||||
| Total |
$ | 8,697 | $ | 6,983 | $ | 1,714 | ||||||
|
|
|
|
|
|
|
|||||||
F-68
Table of Contents
Live Oak Bancshares, Inc.
Notes to Consolidated Financial Statements
For the years ended December 31, 2014, 2013 and 2012
Note 3. Loans and Allowance for Loan Losses (Continued)
| 2012 |
Loan Balance |
Guaranteed Balance |
Unguaranteed Exposure |
|||||||||
| Commercial & Industrial |
$ | 2,955 | $ | 2,386 | $ | 569 | ||||||
| Healthcare Services |
581 | 432 | 149 | |||||||||
| Veterinary Practices |
2,374 | 1,954 | 420 | |||||||||
| Owner Occupied Commercial Real Estate |
5,638 | 2,676 | 2,962 | |||||||||
| Veterinary Practices |
4,935 | 2,676 | 2,259 | |||||||||
| Other |
703 | — | 703 | |||||||||
|
|
|
|
|
|
|
|||||||
| Total |
$ | 8,593 | $ | 5,062 | $ | 3,531 | ||||||
|
|
|
|
|
|
|
|||||||
| 1 | As of December 31, 2014, 2013 and 2012, U.S. Government Guaranteed loans on nonaccrual status are included in our held for investment portfolio. |
Allowance for Loan Loss Methodology
The methodology and the estimation process for calculating the Allowance for Loan Losses (“ALL”) is described below:
Estimated credit losses should meet the criteria for accrual of a loss contingency, i.e., a provision to the allowance for loan losses (“ALL”), set forth in GAAP. The Company’s methodology for determining the ALL is based on the requirements of GAAP, the Interagency Policy Statement on the ALL and other regulatory and accounting pronouncements. The ALL is determined by the sum of three separate components: (i) the impaired loan component, which addresses specific reserves for impaired loans; (ii) the general reserve component, which addresses reserves for pools of homogeneous loans; and (iii) an unallocated reserve component (if any) based on management’s judgment and experience. The loan pools and impaired loans are mutually exclusive; any loan that is impaired is excluded from its homogenous pool for purposes of that pool’s reserve calculation, regardless of the level of impairment.
The ALL policy for pooled loans is governed in accordance with banking regulatory guidance for homogenous pools of non-impaired loans that have similar risk characteristics. The Company follows a consistent and structured approach for assessing the need for reserves within each individual loan pool.
Loans are considered impaired when, based on current information and events, it is probable that the creditor will be unable to collect all interest and principal payments due according to the originally contracted, or reasonably modified, terms of the loan agreement. The Company has determined that loans that meet the criteria defined below must be reviewed quarterly to determine if they are impaired.
| • | All commercial loans classified substandard or worse. |
| • | Any other delinquent loan that is in a nonaccrual status, or any loan that is delinquent more than 89 days and still accruing interest. |
| • | Any loan which has been modified such that it meets the definition of a Troubled Debt Restructuring (TDR). |
Any loan determined to be impaired is subjected to an impairment analysis, which is a calculation of the portion of the loan which is probable not to be repaid. This portion is the loan’s “impairment”, and is established as a specific reserve against the loan, or charged against the ALL.
F-69
Table of Contents
Live Oak Bancshares, Inc.
Notes to Consolidated Financial Statements
For the years ended December 31, 2014, 2013 and 2012
Note 3. Loans and Allowance for Loan Losses (Continued)
Individual specific reserve amounts imply probability of loss and may not be carried in the reserve indefinitely. When the amount of the actual loss becomes reasonably quantifiable, the amount of the loss is charged off against the ALL, whether or not all liquidation and recovery efforts have been completed. If the total amount of the individual specific reserve that will eventually be charged off cannot yet be sufficiently quantified, but some portion of the impairment can be viewed as an imminent loss, that smaller portion should be charged off against the ALL and the individual specific reserve reduced by a corresponding amount.
For loans that have a low probability of being repaid in full, impaired loans, the reserve amount is calculated on a loan-specific basis. There are three methods of analyzing impaired loans:
| • | The Fair Market Value of Collateral utilizes the value at which the collateral could be sold considering the appraised value, appraisal discount rate, prior liens and selling costs. The amount of the reserve is the Loan Balance less the Valuation Amount. |
| • | The Present Value of Future Cash Flows takes into account the amount and timing of cash flows and the effective interest rate used to discount the cash flows. |
| • | Loan Pricing uses observable market price. The amount, source and date of the observable market price is documented. The Bank does not use this method as of December 31, 2014. |
The allowance and the portion that relates to loans individually and collectively evaluated for impairment for year-end 2014, 2013 and 2012 is summarized in the following tables:
| Construction & Development |
Owner Occupied Commercial Real Estate |
Commercial & Industrial |
Commercial Land |
Total | ||||||||||||||||
| December 31, 2014 |
||||||||||||||||||||
| Allowance for Loan Losses: |
||||||||||||||||||||
| Beginning Balance |
$ | 350 | $ | 1,511 | $ | 862 | $ | — | $ | 2,723 | ||||||||||
| Charge offs |
— | (515 | ) | (698 | ) | — | (1,213 | ) | ||||||||||||
| Recoveries |
— | 72 | 32 | — | 104 | |||||||||||||||
| Provision |
236 | 1,223 | 1,173 | 161 | 2,793 | |||||||||||||||
|
|
|
|
|
|
|
|
|
|
|
|||||||||||
| Ending Balance |
$ | 586 | $ | 2,291 | $ | 1,369 | $ | 161 | $ | 4,407 | ||||||||||
|
|
|
|
|
|
|
|
|
|
|
|||||||||||
| Ending Balance Allocated to: |
||||||||||||||||||||
| Loans individually evaluated for impairment |
$ | — | $ | 1,051 | $ | 676 | $ | — | $ | 1,727 | ||||||||||
| Loans collectively evaluated for impairment |
586 | 1,240 | 693 | 161 | 2,680 | |||||||||||||||
|
|
|
|
|
|
|
|
|
|
|
|||||||||||
| Ending Balance |
$ | 586 | $ | 2,291 | $ | 1,369 | $ | 161 | $ | 4,407 | ||||||||||
|
|
|
|
|
|
|
|
|
|
|
|||||||||||
| Loans Receivables1: |
||||||||||||||||||||
| Ending balance: |
||||||||||||||||||||
| Loans individually evaluated for impairment |
$ | — | $ | 16,551 | $ | 10,226 | $ | — | $ | 26,777 | ||||||||||
| Loans collectively evaluated for impairment |
9,526 | 95,069 | 70,831 | 1,248 | 176,674 | |||||||||||||||
|
|
|
|
|
|
|
|
|
|
|
|||||||||||
| Ending Balance |
$ | 9,526 | $ | 111,620 | $ | 81,057 | $ | 1,248 | $ | 203,451 | ||||||||||
|
|
|
|
|
|
|
|
|
|
|
|||||||||||
F-70
Table of Contents
Live Oak Bancshares, Inc.
Notes to Consolidated Financial Statements
For the years ended December 31, 2014, 2013 and 2012
Note 3. Loans and Allowance for Loan Losses (Continued)
| Construction & Development |
Owner Occupied Commercial Real Estate |
Commercial & Industrial |
Total | |||||||||||||
| December 31, 2013 |
||||||||||||||||
| Allowance for Loan Losses: |
||||||||||||||||
| Beginning Balance |
$ | 166 | $ | 2,667 | $ | 2,275 | $ | 5,108 | ||||||||
| Charge offs |
— | (1,260 | ) | (688 | ) | (1,948 | ) | |||||||||
| Recoveries |
— | 33 | 27 | 60 | ||||||||||||
| Provision |
198 | (847 | ) | (209 | ) | (858 | ) | |||||||||
| Net transfer from (to) loans held for sale |
(14 | ) | 918 | (543 | ) | 361 | ||||||||||
|
|
|
|
|
|
|
|
|
|||||||||
| Ending Balance |
$ | 350 | $ | 1,511 | $ | 862 | $ | 2,723 | ||||||||
|
|
|
|
|
|
|
|
|
|||||||||
| Ending Balance Allocated to: |
||||||||||||||||
| Loans individually evaluated for impairment |
$ | — | $ | 400 | $ | 254 | $ | 654 | ||||||||
| Loans collectively evaluated for impairment |
350 | 1,111 | 608 | 2,069 | ||||||||||||
|
|
|
|
|
|
|
|
|
|||||||||
| Ending Balance |
$ | 350 | $ | 1,511 | $ | 862 | $ | 2,723 | ||||||||
|
|
|
|
|
|
|
|
|
|||||||||
| Loans Receivables1: |
||||||||||||||||
| Ending balance: |
||||||||||||||||
| Loans individually evaluated for impairment |
$ | — | $ | 10,013 | $ | 4,677 | $ | 14,690 | ||||||||
| Loans collectively evaluated for impairment |
10,286 | 64,448 | 52,682 | 127,416 | ||||||||||||
|
|
|
|
|
|
|
|
|
|||||||||
| Ending Balance |
$ | 10,286 | $ | 74,461 | $ | 57,359 | $ | 142,106 | ||||||||
|
|
|
|
|
|
|
|
|
|||||||||
| Construction & Development |
Owner Occupied Commercial Real Estate |
Commercial & Industrial |
Total | |||||||||||||
| December 31, 2012 |
||||||||||||||||
| Allowance for Loan Losses: |
||||||||||||||||
| Beginning Balance |
$ | 46 | $ | 3,299 | $ | 1,272 | $ | 4,617 | ||||||||
| Charge offs |
— | (1,532 | ) | (454 | ) | (1,986 | ) | |||||||||
| Recoveries |
— | 6 | 120 | 126 | ||||||||||||
| Provision |
106 | 862 | 1,142 | 2,110 | ||||||||||||
| Net transfer from (to) loans held for sale |
14 | 32 | 195 | 241 | ||||||||||||
|
|
|
|
|
|
|
|
|
|||||||||
| Ending Balance |
$ | 166 | $ | 2,667 | $ | 2,275 | $ | 5,108 | ||||||||
|
|
|
|
|
|
|
|
|
|||||||||
| Ending Balance Allocated to: |
||||||||||||||||
| Loans individually evaluated for impairment |
$ | — | $ | 1,733 | $ | 1,054 | $ | 2,787 | ||||||||
| Loans collectively evaluated for impairment |
166 | 934 | 1,221 | 2,321 | ||||||||||||
|
|
|
|
|
|
|
|
|
|||||||||
| Ending Balance |
$ | 166 | $ | 2,667 | $ | 2,275 | $ | 5,108 | ||||||||
|
|
|
|
|
|
|
|
|
|||||||||
| Loans Receivables1: |
||||||||||||||||
| Ending balance: |
||||||||||||||||
| Loans individually evaluated for impairment |
$ | — | $ | 8,945 | $ | 4,064 | $ | 13,009 | ||||||||
| Loans collectively evaluated for impairment |
8,503 | 41,632 | 30,136 | 80,271 | ||||||||||||
|
|
|
|
|
|
|
|
|
|||||||||
| Ending Balance |
$ | 8,503 | $ | 50,577 | $ | 34,200 | $ | 93,280 | ||||||||
|
|
|
|
|
|
|
|
|
|||||||||
F-71
Table of Contents
Live Oak Bancshares, Inc.
Notes to Consolidated Financial Statements
For the years ended December 31, 2014, 2013 and 2012
Note 3. Loans and Allowance for Loan Losses (Continued)
| 1 | Loans receivable includes $21.3 million of U.S. Government Guaranteed loans as of December 31, 2014, of which $19.5 million are included in loans individually evaluated for impairment and $2.0 million are included in loans collectively evaluated for impairment, as presented above. As of December 31, 2013, loans receivable includes $12.4 million of U.S. Government Guaranteed loans, of which $9.8 million are included in loans individually evaluated for impairment and $2.6 million are included in loans collectively evaluated for impairment, as presented above. As of December 31, 2012, loans receivable includes $12.0 million of U.S. Government Guaranteed loans of which $7.0 million are included in loans individually evaluated for impairment and $5.0 million are included in Loans collectively evaluated for impairment, as presented above. |
Loans individually evaluated for impairment as of December 31, 2014, 2013 and 2012 are summarized in the following tables.
| 2014 |
Unpaid Principal Balance |
Guaranteed Balance1 |
Unguaranteed Exposure |
|||||||||
| Commercial & Industrial |
$ | 10,226 | $ | 8,341 | $ | 1,885 | ||||||
| Healthcare Services |
4,217 | 3,540 | 677 | |||||||||
| Veterinary Practices |
3,806 | 3,309 | 497 | |||||||||
| Independent Pharmacies |
2,203 | 1,492 | 711 | |||||||||
| Owner Occupied Commercial Real Estate |
16,551 | 11,155 | 5,396 | |||||||||
| Healthcare Services |
2,312 | 1,919 | 393 | |||||||||
| Veterinary Practices |
12,243 | 7,456 | 4,787 | |||||||||
| Death Care Management |
1,721 | 1,505 | 216 | |||||||||
| Other Industries |
275 | 275 | — | |||||||||
|
|
|
|
|
|
|
|||||||
| Total |
$ | 26,777 | $ | 19,496 | $ | 7,281 | ||||||
|
|
|
|
|
|
|
|||||||
| 2013 |
Unpaid Principal Balance |
Guaranteed Balance1 |
Unguaranteed Exposure |
|||||||||
| Commercial & Industrial |
$ | 4,677 | $ | 4,100 | $ | 577 | ||||||
| Healthcare Services |
772 | 660 | 112 | |||||||||
| Veterinary Practices |
3,905 | 3,440 | 465 | |||||||||
| Owner Occupied Commercial Real Estate |
10,013 | 5,740 | 4,273 | |||||||||
| Healthcare Services |
58 | — | 58 | |||||||||
| Veterinary Practices |
9,955 | 5,740 | 4,215 | |||||||||
|
|
|
|
|
|
|
|||||||
| Total |
$ | 14,690 | $ | 9,840 | $ | 4,850 | ||||||
|
|
|
|
|
|
|
|||||||
| 2012 |
Unpaid Principal Balance |
Guaranteed Balance1 |
Unguaranteed Exposure |
|||||||||
| Commercial & Industrial |
$ | 4,064 | $ | 3,031 | $ | 1,033 | ||||||
| Healthcare Services |
714 | 432 | 282 | |||||||||
| Veterinary Practices |
3,350 | 2,599 | 751 | |||||||||
| Owner Occupied Commercial Real Estate |
8,945 | 3,932 | 5,013 | |||||||||
| Healthcare Services |
703 | — | 703 | |||||||||
| Veterinary Practices |
8,242 | 3,932 | 4,310 | |||||||||
|
|
|
|
|
|
|
|||||||
| Total |
$ | 13,009 | $ | 6,963 | $ | 6,046 | ||||||
|
|
|
|
|
|
|
|||||||
| 1 | Loans individually evaluated for impairment as of December 31, 2014, 2013 and 2012 are included in the held for investment portfolio. |
F-72
Table of Contents
Live Oak Bancshares, Inc.
Notes to Consolidated Financial Statements
For the years ended December 31, 2014, 2013 and 2012
Note 3. Loans and Allowance for Loan Losses (Continued)
The following table presents evaluated balances of loans classified as impaired at December 31, 2014, 2013 and 2012 that carried an associated reserve as compared to those with no reserve. The recorded investment includes accrued interest, net deferred loan fees or costs and any non-accreted loan discount.
| 2014 |
Unpaid Principal Balance |
Recorded Investment |
Total Reserve |
Average Recorded Investment |
Interest Income Recognized |
|||||||||||||||
| Loans with no allowance |
$ | 1,213 | $ | 1,197 | $ | — | $ | 1,998 | $ | 113 | ||||||||||
| Commercial & Industrial |
239 | 237 | — | 363 | 64 | |||||||||||||||
| Healthcare Services |
3 | 3 | — | 88 | 2 | |||||||||||||||
| Independent Pharmacies |
194 | 194 | — | 86 | 57 | |||||||||||||||
| Veterinary Practices |
42 | 40 | — | 189 | 5 | |||||||||||||||
| Owner Occupied Commercial Real Estate |
974 | 960 | — | 1,635 | 49 | |||||||||||||||
| Death Care Management |
— | — | — | 66 | — | |||||||||||||||
| Healthcare Services |
41 | 41 | — | 147 | — | |||||||||||||||
| Veterinary Practices |
933 | 919 | — | 1,422 | 49 | |||||||||||||||
| Loans with an allowance |
25,564 | 23,805 | 1,727 | 20,076 | 361 | |||||||||||||||
| Commercial & Industrial |
9,987 | 9,747 | 676 | 6,583 | 97 | |||||||||||||||
| Healthcare Services |
4,214 | 4,202 | 361 | 3,333 | 38 | |||||||||||||||
| Independent Pharmacies |
2,009 | 2,005 | 206 | 621 | 17 | |||||||||||||||
| Veterinary Practices |
3,764 | 3,540 | 109 | 2,629 | 42 | |||||||||||||||
| Owner Occupied Commercial Real Estate |
15,577 | 14,058 | 1,051 | 13,493 | 264 | |||||||||||||||
| Death Care Management |
1,721 | 1,720 | 20 | 414 | — | |||||||||||||||
| Healthcare Services |
2,271 | 2,268 | 82 | 1,967 | — | |||||||||||||||
| Veterinary Practices |
11,310 | 9,796 | 947 | 11,036 | 264 | |||||||||||||||
| Other Industries |
275 | 274 | 2 | 76 | — | |||||||||||||||
|
|
|
|
|
|
|
|
|
|
|
|||||||||||
| Total |
$ | 26,777 | $ | 25,002 | $ | 1,727 | $ | 22,074 | $ | 474 | ||||||||||
|
|
|
|
|
|
|
|
|
|
|
|||||||||||
| 2013 |
Unpaid Principal Balance |
Recorded Investment |
Total Reserve |
Average Recorded Investment |
Interest Income Recognized |
|||||||||||||||
| Loans with no allowance |
$ | 241 | $ | 334 | $ | — | $ | 598 | $ | 8 | ||||||||||
| Commercial & Industrial |
— | 24 | — | 2 | — | |||||||||||||||
| Healthcare Services |
— | 24 | — | 2 | — | |||||||||||||||
| Owner Occupied Commercial Real Estate |
241 | 310 | — | 596 | 8 | |||||||||||||||
| Healthcare Services |
58 | 58 | — | 38 | 2 | |||||||||||||||
| Veterinary Practices |
183 | 252 | — | 558 | 6 | |||||||||||||||
| Loans with an allowance |
14,449 | 14,912 | 654 | 13,041 | 389 | |||||||||||||||
| Commercial & Industrial |
4,677 | 4,910 | 254 | 4,486 | 86 | |||||||||||||||
| Healthcare Services |
772 | 812 | 35 | 644 | 6 | |||||||||||||||
| Veterinary Practices |
3,905 | 4,098 | 219 | 3,842 | 80 | |||||||||||||||
| Owner Occupied Commercial Real Estate |
9,772 | 10,002 | 400 | 8,555 | 303 | |||||||||||||||
| Veterinary Practices |
9,772 | 10,002 | 400 | 8,555 | 303 | |||||||||||||||
|
|
|
|
|
|
|
|
|
|
|
|||||||||||
| Total |
$ | 14,690 | $ | 15,246 | $ | 654 | $ | 13,639 | $ | 397 | ||||||||||
|
|
|
|
|
|
|
|
|
|
|
|||||||||||
F-73
Table of Contents
Live Oak Bancshares, Inc.
Notes to Consolidated Financial Statements
For the years ended December 31, 2014, 2013 and 2012
Note 3. Loans and Allowance for Loan Losses (Continued)
| 2012 |
Unpaid Principal Balance |
Recorded Investment |
Total Reserve |
Average Recorded Investment |
Interest Income Recognized |
|||||||||||||||
| Loans with no allowance |
$ | 133 | $ | 137 | $ | — | $ | 284 | $ | — | ||||||||||
| Owner Occupied |
133 | 137 | — | 284 | — | |||||||||||||||
| Other |
— | — | — | — | — | |||||||||||||||
| Veterinary Practices |
133 | 137 | — | 284 | — | |||||||||||||||
| Loans with an allowance |
12,876 | 13,513 | 2,787 | 10,911 | 199 | |||||||||||||||
| Commercial & Industrial |
4,064 | 4,414 | 1,054 | 3,571 | 65 | |||||||||||||||
| Healthcare Services |
714 | 778 | 330 | 525 | 7 | |||||||||||||||
| Veterinary Practices |
3,350 | 3,636 | 724 | 3,046 | 58 | |||||||||||||||
| Owner Occupied Commercial Real Estate |
8,812 | 9,099 | 1,733 | 7,340 | 134 | |||||||||||||||
| Other |
703 | 730 | 73 | 125 | — | |||||||||||||||
| Veterinary Practices |
8,109 | 8,369 | 1,660 | 7,215 | 134 | |||||||||||||||
|
|
|
|
|
|
|
|
|
|
|
|||||||||||
| Total |
$ | 13,009 | $ | 13,650 | $ | 2,787 | $ | 11,195 | $ | 199 | ||||||||||
|
|
|
|
|
|
|
|
|
|
|
|||||||||||
| 1 | Loans individually evaluated for impairment as of December 31, 2014, 2013 and 2012 are included in the held for investment portfolio. |
The following tables represent the types of troubled debt restructurings (“TDR”) that were made during the twelve months ended
December 31, 2014:
| Number of Loans |
Loan Balance |
Guaranteed Balance |
Unguaranteed Exposure |
|||||||||||||
| Commercial & Industrial |
6 | $ | 2,066 | $ | 1,513 | $ | 553 | |||||||||
| Veterinary Practices |
3 | 1,559 | 1,513 | 46 | ||||||||||||
| Payment Deferral |
3 | 1,559 | 1,513 | 46 | ||||||||||||
| Independent Pharmacies |
3 | 507 | — | 507 | ||||||||||||
| Extend Amortization |
2 | 363 | — | 363 | ||||||||||||
| Interest Only |
1 | 144 | — | 144 | ||||||||||||
| Owner Occupied Commercial Real Estate |
2 | 1,725 | 1,505 | 220 | ||||||||||||
| Veterinary Practices |
1 | 4 | — | 4 | ||||||||||||
| Interest Only |
1 | 4 | — | 4 | ||||||||||||
| Death Care Management |
1 | 1,721 | 1,505 | 216 | ||||||||||||
| Payment Deferral |
1 | 1,721 | 1,505 | 216 | ||||||||||||
|
|
|
|
|
|
|
|
|
|||||||||
| Total Loans |
8 | $ | 3,791 | $ | 3,018 | $ | 773 | |||||||||
|
|
|
|
|
|
|
|
|
|||||||||
F-74
Table of Contents
Live Oak Bancshares, Inc.
Notes to Consolidated Financial Statements
For the years ended December 31, 2014, 2013 and 2012
Note 3. Loans and Allowance for Loan Losses (Continued)
December 31, 2013:
| Number of Loans |
Loan Balance |
Guaranteed Balance |
Unguaranteed Exposure |
|||||||||||||
| Owner Occupied Commercial Real Estate |
3 | $ | 161 | $ | — | $ | 161 | |||||||||
| Veterinary Practices |
3 | 161 | — | 161 | ||||||||||||
| Extend Amortization |
1 | 30 | — | 30 | ||||||||||||
| Extend Amortization, Interest Only |
1 | 65 | — | 65 | ||||||||||||
| Payment Deferral |
1 | 66 | — | 66 | ||||||||||||
|
|
|
|
|
|
|
|
|
|||||||||
| Total Loans |
3 | $ | 161 | $ | — | $ | 161 | |||||||||
|
|
|
|
|
|
|
|
|
|||||||||
December 31, 2012:
| Number of Loans |
Loan Balance |
Guaranteed Balance |
Unguaranteed Exposure |
|||||||||||||
| Commercial & Industrial |
8 | $ | 1,508 | $ | 1,015 | $ | 493 | |||||||||
| Healthcare Services |
2 | 142 | — | 142 | ||||||||||||
| Extend Amortization |
2 | 142 | — | 142 | ||||||||||||
| Veterinary Practices |
6 | 1,366 | 1,015 | 351 | ||||||||||||
| Extend Amortization |
2 | 845 | 776 | 69 | ||||||||||||
| Extend Amortization, Interest Only |
2 | 137 | — | 137 | ||||||||||||
| Payment Deferral |
2 | 384 | 239 | 145 | ||||||||||||
| Owner Occupied Commercial Real Estate |
7 | 3,615 | 1,043 | 2,572 | ||||||||||||
| Veterinary Practices |
7 | 3,615 | 1,043 | 2,572 | ||||||||||||
| Interest Only |
1 | 430 | — | 430 | ||||||||||||
| Payment Deferral |
6 | 3,185 | 1,043 | 2,142 | ||||||||||||
|
|
|
|
|
|
|
|
|
|||||||||
| Total Loans |
15 | $ | 5,123 | $ | 2,058 | $ | 3,065 | |||||||||
|
|
|
|
|
|
|
|
|
|||||||||
The following tables represent the recorded investment in TDR loans entered into during the twelve months ended:
December 31, 2014:
| Number of Loans |
Pre-modification Recorded Investment |
Post-modification Recorded Investment |
||||||||||
| Commercial & Industrial |
6 | $ | 2,064 | $ | 2,064 | |||||||
| Veterinary Practices |
3 | 1,558 | 1,558 | |||||||||
| Payment Deferral |
3 | 1,558 | 1,558 | |||||||||
| Independent Pharmacies |
3 | 506 | 506 | |||||||||
| Extend Amortization |
2 | 363 | 363 | |||||||||
| Interest Only |
1 | 143 | 143 | |||||||||
| Owner Occupied Commercial Real Estate |
2 | 1,723 | 1,723 | |||||||||
| Veterinary Practices |
1 | 4 | 4 | |||||||||
| Interest Only |
1 | 4 | 4 | |||||||||
| Death Care Management |
1 | 1,719 | 1,719 | |||||||||
| Payment Deferral |
1 | 1,719 | 1,719 | |||||||||
|
|
|
|
|
|
|
|||||||
| Total Loans |
8 | $ | 3,787 | $ | 3,787 | |||||||
|
|
|
|
|
|
|
|||||||
F-75
Table of Contents
Live Oak Bancshares, Inc.
Notes to Consolidated Financial Statements
For the years ended December 31, 2014, 2013 and 2012
Note 3. Loans and Allowance for Loan Losses (Continued)
December 31, 2013:
| Number of Loans |
Pre-modification Recorded Investment |
Post-modification Recorded Investment |
||||||||||
| Owner Occupied Commercial Real Estate |
3 | $ | 255 | $ | 232 | |||||||
| Veterinary Practices |
3 | 255 | 232 | |||||||||
| Extend Amortization |
1 | 59 | 51 | |||||||||
| Extend Amortization, Interest Only |
1 | 74 | 90 | |||||||||
| Payment Deferral |
1 | 122 | 91 | |||||||||
|
|
|
|
|
|
|
|||||||
| Total Loans |
3 | $ | 255 | $ | 232 | |||||||
|
|
|
|
|
|
|
|||||||
December 31, 2012:
| Number of Loans |
Pre-modification Recorded Investment |
Post-modification Recorded Investment |
||||||||||
| Commercial & Industrial |
$ | 8 | $ | 1,469 | $ | 1,628 | ||||||
| Healthcare Services |
2 | 145 | 176 | |||||||||
| Extend Amortization |
2 | 145 | 176 | |||||||||
| Veterinary Practices |
6 | 1,324 | 1,452 | |||||||||
| Extend Amortization |
2 | 785 | 876 | |||||||||
| Extend Amortization |
2 | 145 | 165 | |||||||||
| Payment Deferral |
2 | 394 | 411 | |||||||||
| Owner Occupied Commercial Real Estate |
7 | 3,639 | 3,750 | |||||||||
| Veterinary Practices |
7 | 3,639 | 3,750 | |||||||||
| Interest Only |
1 | 438 | 455 | |||||||||
| Payment Deferral |
6 | 3,201 | 3,295 | |||||||||
|
|
|
|
|
|
|
|||||||
| Total Loans |
$ | 15 | $ | 5,108 | $ | 5,378 | ||||||
|
|
|
|
|
|
|
|||||||
F-76
Table of Contents
Live Oak Bancshares, Inc.
Notes to Consolidated Financial Statements
For the years ended December 31, 2014, 2013 and 2012
Note 3. Loans and Allowance for Loan Losses (Continued)
Concessions made to improve a loan’s performance have varying degrees of success. The following tables present loans that were modified as TDRs within the previous twelve months ending December 31, 2014, 2013 and 2012, for which there was a payment default:
December 31, 2014:
| Number of Loans |
Post-modification Recorded Investment |
|||||||
| Default (Charge-off) |
||||||||
| Commercial & Industrial |
2 | $ | 1,558 | |||||
| Veterinary Practices |
2 | 1,558 | ||||||
| Payment Deferral |
2 | 1,558 | ||||||
| Owner Occupied Commercial Real Estate |
2 | 1,723 | ||||||
| Death Care Management |
1 | 1,719 | ||||||
| Payment Deferral |
1 | 1,719 | ||||||
| Veterinary Practices |
1 | 4 | ||||||
| Interest Only |
1 | 4 | ||||||
| Default (NonAccrual) |
1 | — | ||||||
| Commercial & Industrial |
1 | — | ||||||
| Veterinary Practices |
1 | — | ||||||
| Payment Deferral |
1 | — | ||||||
|
|
|
|
|
|||||
| Total TDRs in default |
5 | 3,281 | ||||||
|
|
|
|
|
|||||
| No Defaults (paying as restructured) |
3 | 506 | ||||||
| Commercial & Industrial |
3 | 506 | ||||||
| Independent Pharmacies |
3 | 506 | ||||||
| Extend Amortization |
2 | 363 | ||||||
| Interest Only |
1 | 143 | ||||||
|
|
|
|
|
|||||
| Total TDRs paying as restructured |
3 | 506 | ||||||
|
|
|
|
|
|||||
| Total TDRs |
8 | $ | 3,787 | |||||
|
|
|
|
|
|||||
December 31, 2013:
| Number of Loans |
Post-modification Recorded Investment |
|||||||
| Default (Charge-off) |
||||||||
| Commercial & Industrial |
1 | $ | 51 | |||||
| Veterinary Practices |
1 | 51 | ||||||
| Extend Amortization |
1 | 51 | ||||||
| Default (NonAccrual) |
||||||||
| Owner Occupied Commercial Real Estate |
2 | 181 | ||||||
| Veterinary Practices |
2 | 181 | ||||||
| Extend Amortization, Interest Only |
1 | 90 | ||||||
| Payment Deferral |
1 | 91 | ||||||
|
|
|
|
|
|||||
| Total TDRs in default |
3 | 232 | ||||||
|
|
|
|
|
|||||
| Total TDRs paying as restructured |
— | — | ||||||
|
|
|
|
|
|||||
| Total TDRs |
3 | $ | 232 | |||||
|
|
|
|
|
|||||
F-77
Table of Contents
Live Oak Bancshares, Inc.
Notes to Consolidated Financial Statements
For the years ended December 31, 2014, 2013 and 2012
Note 3. Loans and Allowance for Loan Losses (Continued)
December 31, 2012:
| Number of Loans |
Post-modification Recorded Investment |
|||||||
| Default (Charge-off) |
||||||||
| Commercial & Industrial |
2 | $ | 876 | |||||
| Veterinary Practices |
2 | 876 | ||||||
| Extend Amortization |
2 | 876 | ||||||
| Default (NonAccrual) |
||||||||
| Commercial & Industrial |
4 | 341 | ||||||
| Healthcare Services |
2 | 176 | ||||||
| Extend Amortization |
2 | 176 | ||||||
| Veterinary Practices |
2 | 165 | ||||||
| Extend Amortization, Interest Only |
2 | 165 | ||||||
| Owner Occupied Commercial Real Estate |
5 | 2,361 | ||||||
| Veterinary Practices |
5 | 2,361 | ||||||
| Interest Only |
1 | 455 | ||||||
| Payment Deferral |
4 | 1,906 | ||||||
|
|
|
|
|
|||||
| Total TDRs in default |
11 | 3,578 | ||||||
|
|
|
|
|
|||||
| No Defaults (paying as restructured) |
||||||||
| Commercial & Industrial |
2 | 411 | ||||||
| Veterinary Practices |
2 | 411 | ||||||
| Payment Deferral |
2 | 411 | ||||||
| Owner Occupied Commercial Real Estate |
2 | 1,389 | ||||||
| Veterinary Practices |
2 | 1,389 | ||||||
| Payment Deferral |
2 | 1,389 | ||||||
|
|
|
|
|
|||||
| Total TDRs paying as restructured |
4 | 1,800 | ||||||
|
|
|
|
|
|||||
| Total TDRs |
15 | $ | 5,378 | |||||
|
|
|
|
|
|||||
| 1 | Loan is interest only, interest rate reduction and extended amortization. |
Note 4. Servicing Assets
Loans serviced for others are not included in the accompanying balance sheet. The unpaid principal balances of loans serviced for others were $1.3 billion, $1.0 billion and $766.2 million at December 31, 2014, 2013, and 2012, respectively.
The following summarizes the activity pertaining to servicing rights:
| 2014 | 2013 | 2012 | ||||||||||
| Balance at beginning of year |
$ | 29,053 | $ | 24,220 | $ | 18,731 | ||||||
| Additions, net |
10,923 | 8,442 | 6,411 | |||||||||
| Changes in fair value |
(4,977 | ) | (3,609 | ) | (922 | ) | ||||||
|
|
|
|
|
|
|
|||||||
| Balance at end of period |
$ | 34,999 | $ | 29,053 | $ | 24,220 | ||||||
|
|
|
|
|
|
|
|||||||
F-78
Table of Contents
Live Oak Bancshares, Inc.
Notes to Consolidated Financial Statements
For the years ended December 31, 2014, 2013 and 2012
Note 4. Servicing Assets (Continued)
The fair value of servicing rights was determined using discount rates ranging from 8.5% to 13.4% on December 31, 2014, 9.1% to 16.3% on December 31, 2013 and 8.9% to 15.0% on December 31, 2012. The fair value of servicing rights was determined using prepayment speeds ranging from 4.4% to 8.5% on December 31, 2014, 0% to 11.88% on December 31, 2013 and 0% to 9.60% on December 31, 2012, depending on the stratification of the specific right.
The fair value of servicing rights is highly sensitive to changes in the above underlying assumptions. Changes in prepayment speed assumptions have the most significant impact on the fair value of servicing rights. Generally, as interest rates rise on variable rate loans, loan prepayments increase due to an increase in refinance activity, which results in an decrease in the fair value of servicing assets. Measurement of fair value is limited to the conditions existing and the assumptions used as of a particular point in time, and those assumptions may not be appropriate if they are applied at a different time.
Note 5. Premises, Equipment and Leases
Components of Premises and Equipment
Components of premises and equipment and total accumulated depreciation at December 31, 2014, 2013 and 2012 are as follows:
| 2014 | 2013 | 2012 | ||||||||||
| Buildings |
$ | 8,000 | $ | 8,285 | $ | — | ||||||
| Land improvements |
1,487 | 1,575 | — | |||||||||
| Furniture and equipment |
3,077 | 3,064 | 521 | |||||||||
| Computers and software |
630 | 557 | 281 | |||||||||
| Leasehold improvements |
239 | 237 | 277 | |||||||||
| Land |
3,623 | 3,623 | 1,750 | |||||||||
| Transportation |
14,047 | 9,383 | 9,383 | |||||||||
| Deposits on fixed assets |
7,323 | 709 | 8,120 | |||||||||
|
|
|
|
|
|
|
|||||||
| Premises and equipment, total |
38,426 | 27,433 | 20,332 | |||||||||
| Less accumulated depreciation |
(3,147 | ) | (2,397 | ) | (1,381 | ) | ||||||
|
|
|
|
|
|
|
|||||||
| Premises and equipment, net of depreciation |
$ | 35,279 | $ | 25,036 | $ | 18,951 | ||||||
|
|
|
|
|
|
|
|||||||
Deposits on fixed assets consist of construction in process on a newly leased off-site facility and the Company’s second building at is headquarters campus. Depreciation expense for the years ended December 31, 2014, 2013 and 2012 amounted to $2.2 million, $1.5 million and $673 thousand, respectively.
F-79
Table of Contents
Live Oak Bancshares, Inc.
Notes to Consolidated Financial Statements
For the years ended December 31, 2014, 2013 and 2012
Note 5. Premises, Equipment and Leases (Continued)
Lease Obligations
Pursuant to the terms of non-cancelable lease agreements in effect at December 31, 2014 pertaining to Company premises and equipment, future minimum rent commitments under various operating leases are as follows:
| Year |
Amount | |||
| 2015 |
$ | 340 | ||
| 2016 |
242 | |||
| 2017 |
213 | |||
| 2018 |
198 | |||
|
|
|
|||
| Total |
$ | 993 | ||
|
|
|
|||
The Company’s total rent expense related to the aforementioned leases for 2014, 2013, and 2012 was $373 thousand, $286 thousand and $459 thousand, respectively.
Note 6. Deposits
The aggregate amount of time deposits in denominations of $250 thousand or more at December 31, 2014 was approximately $177 million. The aggregate amount of time deposits in denominations of $100 thousand or more at December 31, 2013 and 2012 was approximately $112 million and $118 million, respectively. At December 31, 2014, the scheduled maturities of time deposits are as follows:
| Amount | ||||
| 2015 |
$ | 186,642 | ||
| 2016 |
39,246 | |||
| 2017 |
45,741 | |||
| 2018 |
9,274 | |||
| 2019 |
14,767 | |||
|
|
|
|||
| $ | 295,670 | |||
|
|
|
|||
Note 7. Borrowings
As of December 31, 2014, 2013 and 2012 total outstanding long-term borrowings consisted of the following:
| December 31, | ||||||||||||
| 2014 | 2013 | 2012 | ||||||||||
| Short term borrowings |
||||||||||||
| On September 18, 2014, the Company entered into a line of credit of $6.1 million with an unaffiliated commercial bank, secured by 1,900,000 shares of nCino common stock. At December 31, 2014 there was $6.1 million advanced on the line of credit. Interest accrues at 30 day LIBOR (.16% at December 31, 2014) plus 3.50% for a term of 12 months. Payments are interest only with all principal and accrued interest due on September 18, 2015. There was no remaining available credit on this line of credit at December 31, 2014 | $ | 6,100 | $ | — | $ | — | ||||||
|
|
|
|
|
|
|
|||||||
| Total short term borrowings |
$ | 6,100 | $ | — | $ | — | ||||||
|
|
|
|
|
|
|
|||||||
F-80
Table of Contents
Live Oak Bancshares, Inc.
Notes to Consolidated Financial Statements
For the years ended December 31, 2014, 2013 and 2012
Note 7. Borrowings (Continued)
| Long term borrowings |
2014 | 2013 | 2012 | |||||||||
| In April 2011, the Company elected to participate in the U.S. Treasury’s Small Business Lending Fund program (“SBLF”) whereby the U.S. Treasury agreed to purchase $6.8 million in senior securities. During the initial interest period the applicable interest rate is set at 1.5%. For all remaining interest periods, which commenced on January 1, 2012, the interest rate is determined based on a formula which encompasses the percentage change in qualified lending as well as a non-qualifying portion percentage. This rate can range from 1.5% to 10.8%. At December 31, 2014 the interest rate was 1.50%. Interest is payable quarterly in arrears. With the approval of the Bank’s primary regulator, the Federal Reserve, the Bank may exit the Small Business Lending Fund at any time simply by repaying the funding provided along with any accrued but unpaid interest. If the institution wishes to repay its SBLF funding in partial payments, each partial payment must be at least 25% of the original funding amount. All senior securities will mature on September 13, 2021 at which time all principal and accrued interest will be due. | $ | 6,800 | $ | 6,800 | $ | 6,800 | ||||||
| Effective January 1, 2012, the Company issued $3.6 million in five-year 10% fixed rate Senior Notes payable to outside investors and existing shareholders maturing on December 31, 2016. Interest payments are made quarterly beginning March 31, 2012, with principal repayment due at maturity. On August 22, 2014 the terms of Senior Notes were amended to allow conversion to equity. On September 30, 2014, the Senior Notes payable to investors were converted to equity in the Company at $10.63 per share, with cash paid in lieu of fractional shares at a rate of $10.63 per share. | — | 3,623 | 3,623 | |||||||||
| On June 29, 2011, the Bank financed the purchase of an airplane by entering into a promissory note with an unaffiliated commercial bank in the amount of $1.9 million which carried a fixed rate of 5.75% for a term of 59 months. Monthly payments were set at $16 thousand with all principal and accrued interest due on June 29, 2016. The airplane securing this note was sold during 2014 and the note payable was paid in full on September 19, 2014. | — | 1,693 | 1,782 | |||||||||
| On May 12, 2014, Independence Aviation financed the purchase of an airplane by entering into a promissory note with the same aforementioned unaffiliated commercial bank in the amount of $6 million which carries a fixed rate of 4.97% for a term of 59 months. Monthly payments are set at $48 thousand with all principal and accrued interest due on May 12, 2019. | 5,842 | — | — | |||||||||
| On September 11, 2014, The Company financed the construction of an additional building located on the Company’s Tiburon Drive main campus for a $24 million construction line of credit with an unaffiliated commercial bank, secured by both properties at its Tiburon Drive main facility location. As of December 31, 2014, $16.9 million had been advanced on the construction line of credit. Payments are interest only through September 11, 2016 at a fixed rate of 3.95% for a term of 84 months. Monthly principal and interest payments beginning in October 2016 will be $146 thousand with all principal and accrued interest due on September 11, 2021. The terms of this loan require the Company to maintain minimum capital, liquidity and Texas ratios. There is $7.1 million of remaining available credit on this construction line at December 31, 2014. | 16,914 | — | — | |||||||||
F-81
Table of Contents
Live Oak Bancshares, Inc.
Notes to Consolidated Financial Statements
For the years ended December 31, 2014, 2013 and 2012
Note 7. Borrowings (Continued)
| Long term borrowings |
2014 | 2013 | 2012 | |||||||||
| On September 18, 2014, the Company entered into a note payable line of credit of $8.1 million with an unaffiliated commercial bank, with the first advance of $5 million on December 14, 2014. The note is unsecured and accrues interest at LIBOR plus 3.50% for a term of 36 months. Payments are interest only with all principal and accrued interest due on September 18, 2017. There were no interest payments made for the year ended December 31, 2014. There is $3.1 million of remaining available credit on this note at December 31, 2014. | $ | 5,000 | $ | — | $ | — | ||||||
| On August 1, 2014, the Company entered into a note payable line of credit of $15 million with an unaffiliated commercial bank, secured by 100% of Live Oak Banking Company’s outstanding common stock. At December 31, 2014 there was $7.2 million advanced on this line of credit. Interest accrues at LIBOR plus 4.00% for a term of 36 months. Payments are interest only with all principal and accrued interest due on August 1, 2017. The terms of this loan require the Company to maintain minimum capital, liquidity and Texas ratios. There is $7.8 million of remaining available credit on this line of credit at December 31, 2014. | 7,210 | — | — | |||||||||
| With the acquisition of GLS on September 1, 2013, the Company assumed the obligation to pay a former GLS partner $250 thousand at $10 thousand a month over a 24 month period. | 83 | 209 | — | |||||||||
|
|
|
|
|
|
|
|||||||
| Total long term borrowings | $ | 41,849 | $ | 12,325 | $ | 12,205 | ||||||
|
|
|
|
|
|
|
|||||||
Principal amounts due for the next five years on all long-term debt at December 31, 2014 are as follows: 2015 — $367 thousand; 2016 — $437 thousand; 2017 — $13.1 million; 2018 — $922 thousand; 2019 — $5.2 million; thereafter — $21.8 million.
Note 8. Income Taxes
Income tax expense was as follows:
| Year Ended December 31 2014 |
||||
| Current income tax expense |
$ | 3,296 | ||
| Deferred income tax expense |
4,092 | |||
|
|
|
|||
| Income tax expense, as reported |
$ | 7,388 | ||
|
|
|
|||
In connection with the private placement discussed in Note 1, the Company terminated its S-Corporation status and became a taxable entity (C Corporation) on August 3, 2014. As such, periods prior to August 3, 2014 will not reflect income tax expense. The reported income tax expense for the year ended December 31, 2014 reflects the initial recording of the deferred tax net liability of $3.2 million, which is the result of timing differences in the recognition of income/deductions for generally accepted accounting principles (GAAP) and tax purposes. Note 1 of the notes to consolidated financial statements present pro forma results of operations as if the Company were a C corporation for all periods.
F-82
Table of Contents
Live Oak Bancshares, Inc.
Notes to Consolidated Financial Statements
For the years ended December 31, 2014, 2013 and 2012
Note 8. Income Taxes (Continued)
Reported income tax expense differed from the amounts computed by applying the U.S. federal statutory income tax rate of 35% to income before income taxes for the five months ended December 31, 2014 (the period the Company was a taxable entity) as follows:
| Year Ended December 31 2014 |
||||
| Income tax expense computed at the statutory rate |
$ | 3,391 | ||
| Initial recording of deferred tax liability |
3,252 | |||
| State income tax, net of federal benefit |
339 | |||
| Increase in taxes due to nondeductible expenses |
406 | |||
|
|
|
|||
| $ | 7,388 | |||
|
|
|
|||
Components of deferred tax assets and liabilities are as follows:
| December 31 2014 |
||||
| Deferred tax assets: |
||||
| Allowance for loan losses |
$ | 1,697 | ||
| SBA guaranty reserve |
273 | |||
| Other |
412 | |||
|
|
|
|||
| 2,382 | ||||
|
|
|
|||
| Deferred tax liabilities: |
||||
| Unguaranteed loan discount |
3,144 | |||
| Premises and equipment |
2,461 | |||
| Deferred loan fees and costs, net |
869 | |||
|
|
|
|||
| 6,474 | ||||
|
|
|
|||
| Net deferred tax liability |
$ | 4,092 | ||
|
|
|
|||
The Company does not have any uncertain tax positions and does not have any interest and penalties recorded in the income statement for the year ended December 31, 2014. The Company files a consolidated income tax return in the US federal tax jurisdiction.
Note 9. Fair Value of Financial Instruments
Fair Value Hierarchy
There are three levels of inputs in the fair value hierarchy that may be used to measure fair value. Financial instruments are considered Level 1 when valuation can be based on quoted prices in active markets for identical assets or liabilities. Level 2 financial instruments are valued using quoted prices for similar assets or liabilities; quoted prices in markets that are not active; or models using inputs that are observable or can be corroborated by observable market data of substantially the full term of the assets or liabilities. Financial instruments are considered Level 3 when their values are determined using pricing models, discounted cash flow methodologies or similar techniques and at least one significant model assumption or input is unobservable and when determination of the fair value requires significant management judgment or estimation.
F-83
Table of Contents
Live Oak Bancshares, Inc.
Notes to Consolidated Financial Statements
For the years ended December 31, 2014, 2013 and 2012
Note 9. Fair Value of Financial Instruments (Continued)
Financial Instruments Measured at Fair Value
The following sections provide a description of the valuation methodologies used for instruments measured at fair value, as well as the general classification of such instruments pursuant to the fair value hierarchy:
Securities: Where quoted prices are available in an active market, securities are classified within Level 1 of the valuation hierarchy. Level 1 securities would include highly liquid government bonds, mortgage products and exchange traded equities. If quoted market prices are not available, then fair values are estimated by using pricing models, quoted prices of securities with similar characteristics, or discounted cash flow. Level 2 securities would include U.S. agency securities, mortgage-backed agency securities, obligations of states and political subdivisions and certain corporate, asset backed and other securities. In certain cases where there is limited activity or less transparency around inputs to the valuation, securities are classified within Level 3 of the valuation hierarchy.
Impaired Loans: Impairment of a loan is based on the fair value of the collateral of the loan for collateral-dependent loans. Fair value of the loan’s collateral, when the loan is dependent on collateral, is determined by appraisals or independent valuation which is then adjusted for the cost related to liquidation of the collateral. For non-collateral dependent loans impairment is determined by the present value of expected future cash flows.
Servicing Assets: Servicing rights do not trade in an active, open market with readily observable prices. While sales of servicing rights do occur, the precise terms and conditions typically are not readily available. Accordingly, the Company estimates the fair value of servicing rights using discounted cash flow models incorporating numerous assumptions from the perspective of market participant including servicing income, servicing costs, market discount rates and prepayment speeds. Due to the nature of the valuation inputs, servicing rights are classified within Level 3 of the valuation hierarchy.
Foreclosed Assets: Foreclosed real estate is adjusted to fair value less selling costs upon transfer of the loans to foreclosed real estate. Subsequently, foreclosed real estate is carried at the lower of carrying value or fair value less selling costs. Fair value is based upon independent market prices, appraised values of the collateral or management’s estimation of the value of the collateral. When the fair value of the collateral is based on an observable market price or a current appraised value, the Company records the foreclosed asset as nonrecurring Level 2. When an appraised value is not available or management determines the fair value of the collateral is further impaired below the appraised value and there is no observable market price, the Company records foreclosed real estate as nonrecurring Level 3.
Recurring Fair Value
The tables below present the recorded amount of assets and liabilities measured at fair value on a recurring basis.
| December 31, 2014 |
Total | Level 1 | Level 2 | Level 3 | ||||||||||||
| Investment securities available-for-sale |
||||||||||||||||
| US government agencies |
$ | 35,309 | $ | — | $ | 35,309 | $ | — | ||||||||
| Residential mortgage backed securities |
14,009 | — | 14,009 | — | ||||||||||||
| Servicing assets |
34,999 | — | — | 34,999 | ||||||||||||
|
|
|
|
|
|
|
|
|
|||||||||
| Total assets at fair value |
$ | 84,317 | $ | — | $ | 49,318 | $ | 34,999 | ||||||||
|
|
|
|
|
|
|
|
|
|||||||||
F-84
Table of Contents
Live Oak Bancshares, Inc.
Notes to Consolidated Financial Statements
For the years ended December 31, 2014, 2013 and 2012
Note 9. Fair Value of Financial Instruments (Continued)
| December 31, 2013 |
Total | Level 1 | Level 2 | Level 3 | ||||||||||||
| Investment securities available-for-sale |
||||||||||||||||
| US government agencies |
$ | 5,262 | $ | — | $ | 5,262 | $ | — | ||||||||
| Residential mortgage backed securities |
14,184 | — | 14,184 | — | ||||||||||||
| Servicing assets |
29,053 | — | — | 29,053 | ||||||||||||
|
|
|
|
|
|
|
|
|
|||||||||
| Total assets at fair value |
$ | 48,499 | $ | — | $ | 19,446 | $ | 29,053 | ||||||||
|
|
|
|
|
|
|
|
|
|||||||||
| December 31, 2012 |
Total | Level 1 | Level 2 | Level 3 | ||||||||||||
| Investment securities available-for-sale |
||||||||||||||||
| US government agencies |
$ | 3,517 | $ | — | $ | 3,517 | $ | — | ||||||||
| Residential mortgage backed securities |
11,899 | — | 11,899 | — | ||||||||||||
| Servicing assets |
24,220 | — | — | 24,220 | ||||||||||||
|
|
|
|
|
|
|
|
|
|||||||||
| Total assets at fair value |
$ | 39,636 | $ | — | $ | 15,416 | $ | 24,220 | ||||||||
|
|
|
|
|
|
|
|
|
|||||||||
See Note 5 for a rollforward of recurring Level 3 fair values for servicing assets.
Non-recurring Fair Value
The tables below present the recorded amount of assets and liabilities measured at fair value on a non-recurring basis.
| December 31, 2014 |
Total | Level 1 | Level 2 | Level 3 | ||||||||||||
| Impaired loans |
$ | 24,016 | $ | — | $ | — | $ | 24,016 | ||||||||
| Foreclosed assets |
371 | — | — | 371 | ||||||||||||
|
|
|
|
|
|
|
|
|
|||||||||
| Total assets at fair value |
$ | 24,387 | $ | — | $ | — | $ | 24,387 | ||||||||
|
|
|
|
|
|
|
|
|
|||||||||
| December 31, 2013 |
Total | Level 1 | Level 2 | Level 3 | ||||||||||||
| Impaired loans |
$ | 13,907 | $ | — | $ | — | $ | 13,907 | ||||||||
| Foreclosed assets |
341 | — | — | 341 | ||||||||||||
|
|
|
|
|
|
|
|
|
|||||||||
| Total assets at fair value |
$ | 14,248 | $ | — | $ | — | $ | 14,248 | ||||||||
|
|
|
|
|
|
|
|
|
|||||||||
| December 31, 2012 |
Total | Level 1 | Level 2 | Level 3 | ||||||||||||
| Impaired loans |
$ | 10,089 | $ | — | $ | — | $ | 10,089 | ||||||||
| Foreclosed assets |
232 | — | — | 232 | ||||||||||||
|
|
|
|
|
|
|
|
|
|||||||||
| Total assets at fair value |
$ | 10,321 | $ | — | $ | — | $ | 10,321 | ||||||||
|
|
|
|
|
|
|
|
|
|||||||||
F-85
Table of Contents
Live Oak Bancshares, Inc.
Notes to Consolidated Financial Statements
For the years ended December 31, 2014, 2013 and 2012
Note 9. Fair Value of Financial Instruments (Continued)
Level 3 Analysis
For Level 3 assets and liabilities measured at fair value on a recurring or non-recurring basis as of December 31, 2014, 2013 and 2012, the significant unobservable inputs used in the fair value measurements were as follows:
| December 31, 2014 |
||||||||||||
| Level 3 Assets with Significant Unobservable |
Fair Value |
Valuation Technique | Significant Unobservable Inputs |
Range | ||||||||
| Impaired Loans |
$24,016 | Discounted appraisals | Appraisal adjustments(1) | 10% to 20% | ||||||||
| |
Discounted expected cash flows |
|
|
Interest rate & repayment term |
|
Weighted Average discount rate 4.88% | ||||||
| Foreclosed Assets |
$371 | Discounted appraisals | Appraisal adjustments | (1) | 10% to 20% | |||||||
| December 31, 2013 |
||||||||||||
| Level 3 Assets with Significant Unobservable |
Fair Value |
Valuation Technique | Significant Unobservable Inputs |
Range | ||||||||
| Impaired Loans |
$13,907 | Discounted appraisals | Appraisal adjustments(1) | 6% to 10% | ||||||||
| |
Discounted expected cash flows |
|
|
Interest rate & repayment term |
|
Weighted Average discount rate 4.42% | ||||||
| Foreclosed Assets |
$341 | Discounted appraisals | Appraisal adjustments | (1) | 6% to 10% | |||||||
| December 31, 2012 |
||||||||
| Level 3 Assets with Significant Unobservable |
Fair Value |
Valuation Technique | Significant Unobservable Inputs |
Range | ||||
| Impaired Loans |
$10,089 | Discounted appraisals | Appraisal adjustments(1) | 6% to 10% | ||||
| Foreclosed Assets |
$232 | Discounted appraisals | Appraisal adjustments(1) | 6% to 10% |
| (1) | Appraisals may be adjusted by management for customized discounting criteria, estimated sales costs, and proprietary qualitative adjustments. Prior to 2014 appraisal adjustments included a $25 thousand reduction on each impaired loan reflecting costs the Company anticipated to incur as part of the SBA’s required collection process. |
Impaired loans and foreclosed assets classified as Level 3 are based on management’s judgment and estimation.
Estimated Fair Value of Other Financial Instruments
GAAP also requires disclosure of fair value information about financial instruments carried at book value in the balance sheet. In cases where quoted market prices are not available, fair values are based on estimates using present value or other valuation techniques. Those techniques are significantly affected by the assumptions used, including the discount rate and estimates of future cash flows. In that regard, the derived fair value estimates cannot be substantiated by comparison to independent markets and, in many cases, could not be realized in immediate settlement of the instruments. Accordingly, the aggregate fair value amounts presented do not represent the underlying value of the Company.
F-86
Table of Contents
Live Oak Bancshares, Inc.
Notes to Consolidated Financial Statements
For the years ended December 31, 2014, 2013 and 2012
Note 9. Fair Value of Financial Instruments (Continued)
The following methods and assumptions were used by the Company in estimating its fair value disclosures for financial instruments not measured at fair value on the balance sheets:
Cash and due from banks: The carrying amounts reported in the balance sheet for cash and due from banks approximate their fair values.
Certificates of Deposit with Other Banks: The fair value of certificates of deposit with other banks is estimated based on discounting cash flows using the rates currently offered for instruments of similar remaining maturities.
Loans: For variable-rate loans that reprice frequently and with no significant change in credit risk, fair values are based on carrying amounts. The fair values for other loans are estimated using discounted cash flow analysis, based on interest rates currently being offered for loans with similar terms to borrowers of similar credit quality. Loan fair value estimates include judgments regarding future expected loss experience and risk characteristics. Fair values for impaired loans are estimated using discounted cash flow analysis or underlying collateral values, where applicable.
Loans held for sale: The fair values of loans held for sale are based on quoted market prices, where available, and determined by discounting estimated cash flows using interest rates approximating the Company’s current origination rates for similar loans adjusted to reflect the inherent credit risk.
Accrued Interest: The carrying amounts of accrued interest approximate fair value.
Servicing assets: The fair values of servicing assets are based upon discounted cash flows using market-based assumptions.
Deposits: The fair values disclosed for demand deposits (e.g., interest and non-interest checking, passbook savings, and certain types of money market accounts) are, by definition, equal to the amount payable on demand at the reporting date (i.e., their carrying amounts). The carrying amounts of variable-rate, fixed-term money market accounts and certificates of deposit approximate their fair values at the reporting date. Fair values for fixed-rate certificates of deposit are estimated using a discounted cash flow calculation that applies interest rates currently being offered on certificates to a schedule of aggregated expected monthly maturities on time deposits.
Short and long term borrowings: The fair values of the Company’s borrowings are estimated using discounted cash flow analyses based on the Company’s current incremental debt rates for similar types of debt arrangements.
F-87
Table of Contents
Live Oak Bancshares, Inc.
Notes to Consolidated Financial Statements
For the years ended December 31, 2014, 2013 and 2012
Note 9. Fair Value of Financial Instruments (Continued)
The carrying amounts and estimated fair values of the Company’s financial instruments are as follows:
| December 31, 2014 |
Carrying Amount |
Quoted Price In Active Markets for Identical Assets/ Liabilities (Level 1) |
Significant Other Observable Inputs (Level 2) |
Significant Unobservable Inputs (Level 3) |
Ending Balance |
|||||||||||||||
| Financial assets |
||||||||||||||||||||
| Cash and due from banks |
$ | 29,902 | $ | 29,902 | $ | — | $ | — | $ | 29,902 | ||||||||||
| Certificates of deposit with other banks |
10,000 | 9,861 | — | — | 9,861 | |||||||||||||||
| Investment securities, available for sale |
49,318 | — | 49,318 | — | 49,318 | |||||||||||||||
| Loans held for sale |
295,180 | — | — | 304,504 | 304,504 | |||||||||||||||
| Loans, net of allowance for loan losses |
199,529 | — | — | 194,007 | 194,007 | |||||||||||||||
| Servicing assets |
34,999 | — | — | 34,999 | 34,999 | |||||||||||||||
| Accrued interest receivable |
3,059 | 3,059 | — | — | 3,059 | |||||||||||||||
| Financial liabilities |
||||||||||||||||||||
| Deposits |
522,080 | — | 522,058 | — | 522,058 | |||||||||||||||
| Accrued interest payable |
190 | 190 | — | — | 190 | |||||||||||||||
| Short term borrowings |
6,100 | — | — | 6,100 | 6,100 | |||||||||||||||
| Long term borrowings |
41,849 | — | — | 44,738 | 44,738 | |||||||||||||||
| December 31, 2013 |
||||||||||||||||||||
| Financial assets |
||||||||||||||||||||
| Cash and due from banks |
$ | 37,244 | $ | 37,244 | $ | — | $ | — | $ | 37,244 | ||||||||||
| Investment securities, available for sale |
19,446 | — | 19,446 | — | 19,446 | |||||||||||||||
| Loans held for sale |
159,438 | — | — | 172,169 | 172,169 | |||||||||||||||
| Loans, net of allowance for loan losses |
138,626 | — | — | 142,444 | 142,444 | |||||||||||||||
| Servicing assets |
29,053 | — | — | 29,053 | 29,053 | |||||||||||||||
| Accrued interest receivable |
1,842 | 1,842 | — | — | 1,842 | |||||||||||||||
| Financial liabilities |
||||||||||||||||||||
| Deposits |
356,620 | — | 354,611 | — | 354,611 | |||||||||||||||
| Accrued interest payable |
107 | 107 | — | — | 107 | |||||||||||||||
| Long term borrowings |
12,325 | — | — | 14,334 | 14,334 | |||||||||||||||
| December 31, 2012 |
||||||||||||||||||||
| Financial assets |
||||||||||||||||||||
| Cash and due from banks |
$ | 44,173 | $ | 44,173 | $ | — | $ | — | $ | 44,173 | ||||||||||
| Investment securities, available for sale |
15,416 | — | 15,416 | — | 15,416 | |||||||||||||||
| Loans held for sale |
145,183 | — | — | 155,851 | 155,851 | |||||||||||||||
| Loans, net of allowance for loan losses |
87,561 | — | — | 88,937 | 88,937 | |||||||||||||||
| Servicing assets |
24,220 | — | — | 24,220 | 24,220 | |||||||||||||||
| Accrued interest receivable |
1,457 | 1,457 | — | — | 1,457 | |||||||||||||||
| Financial liabilities |
||||||||||||||||||||
| Deposits |
286,674 | — | 286,046 | — | 286,046 | |||||||||||||||
| Accrued interest payable |
81 | 81 | — | — | 81 | |||||||||||||||
| Long term borrowings |
12,205 | — | — | 14,560 | 14,560 | |||||||||||||||
F-88
Table of Contents
Live Oak Bancshares, Inc.
Notes to Consolidated Financial Statements
For the years ended December 31, 2014, 2013 and 2012
Note 10. Benefit Plans
Defined Contribution Plan
The Company maintains an employee benefit plan pursuant to Section 401(k) of the Internal Revenue Code. The plan covers substantially all employees who are at least 21 years of age and have completed one month of service. Participants may contribute a percentage of compensation, subject to a maximum allowed under the Code. In addition, the Company makes certain matching contributions and may make additional contributions at the discretion of the board of directors. Company expense relating to the plan for the years ended December 31, 2014, 2013, and 2012 amounted to $867 thousand, $602 thousand and $397 thousand, respectively.
Flexible Benefits Plan
The Company maintains a Flexible Benefits Plan which covers substantially all employees. Participants may set aside pre-tax dollars to provide for future expenses such as health care.
Employee Stock Purchase Plan
In 2010, the Company adopted an Employee Stock Purchase Plan (2010 ESPP). Under this plan, eligible employees were able to withhold post-tax dollars from their monthly payroll to be placed in a money market account for bi-annual purchases of the Company’s Class A and Class B stock. In order for employees to be eligible to contribute to this program, they must have completed one year of service with the Company. Eligible employees’ money market accounts were swept on March 15th and September 15th each year, up to the amount that would purchase whole shares of stock, not to exceed $25 thousand per employee per calendar year. In order to preserve the S-Corporation election, the Company discontinued the 2010 ESPP in October 2013.
Subsequent to conversion to a C corporation in 2014, the Company again adopted an Employee Stock Purchase Plan (ESPP) on October 8, 2014, within the meaning of Section 423 of the Internal Revenue Code of 1986, as amended. Under this plan eligible employees were able to purchase available shares with post-tax dollars as of the grant date. In order for employees to be eligible to participate in this plan they must be employed or on an authorized leave of absence from the Company or any subsidiary immediately prior to the grant date. ESPP stock purchases cannot exceed $25 thousand per employee per calendar year. Options to purchase shares under the ESPP in 2014 were granted at a 15% discount to fair market value. Expense recognized in relation to the ESPP was $58 thousand in fiscal 2014.
Restricted Stock Plan
In 2010, the Company adopted a Restricted Stock Plan. Under this plan, a total of 1,350,000 shares of Common Stock are available for issuance to eligible employees. Restricted stock grants vest in equal installments over a two to four year period from the date of the grant. In 2010, a total of 500,010 restricted shares were issued at $1.50 per share and these shares fully vested in 2013. In 2013, 100,000 restricted shares were granted at $3.00 per share to an eligible employee and 50,000 restricted shares were granted at $2.99 per share in connection with the GLS acquisition.
F-89
Table of Contents
Live Oak Bancshares, Inc.
Notes to Consolidated Financial Statements
For the years ended December 31, 2014, 2013 and 2012
Note 10. Benefit Plans (Continued)
The following is a summary of non-vested stock restricted stock activity for the Company for the year ended December 31, 2014.
| Shares | Weighted Average Grant Date Fair Value |
|||||||
| Non-vested at December 31, 2013 |
120,834 | $ | 3.00 | |||||
| Granted |
— | — | ||||||
| Vested |
(47,917 | ) | 3.00 | |||||
| Forfeited |
(72,917 | ) | 3.00 | |||||
|
|
|
|
|
|||||
| Non-vested at December 31, 2014 |
— | $ | — | |||||
|
|
|
|
|
|||||
Total recognized restricted stock expense was $143 thousand, $150 thousand and $250 thousand for the years ended December 31, 2014, 2013, and 2012, respectively. At December 31, 2014, there was no unrecognized restricted stock expense or unvested shares, to be recognized in the future.
Employee Profit Sharing Plan
The Employee Profit Sharing Plan allows eligible employees to participate in a profit sharing bonus pool based on the profitability of the Company. The plan awards each participating employee a quarterly and annual bonus based on the ratio of the employee’s salary at the end of the period to the aggregate salaries of all participating employees. The employees profit sharing plan terminated in 2013, accordingly there were no expenses related to this plan in 2014. Total expenses related to this plan were $4.0 million and $4.5 million for the years ended December 31, 2013 and 2012, respectively.
Employee/Outside Director Bonus Plan
In 2014, the Company adopted a Bonus Plan whereby eligible employees and outside directors are qualified to receive quarterly and annual bonus payments based on each individual’s base pay/annual director fees and the profitability of the Company. Total expenses related to the bonus plan for employees were $2.2 million and $12 thousand for the outside directors for the year ended December 31, 2014.
Outside Director Profit Sharing Plan
Effective January 1, 2013, the Company adopted the Outside Director Profit Sharing Plan. Eligible directors participate in a discretionary award based on their annual director fees in the same quarterly percentage payout awarded under the Company’s Former Employee Profit Sharing Plan. The Outside Director Profit Sharing Plan was terminated in 2013. The outside directors received a final payout of $36 thousand under this plan paid in 2014.
Stock Option Plans
In 2008 the Company adopted both an Incentive Stock Option (ISO) Plan and a Non-Qualified Stock Option (NQSO) Plan. Options granted under both plans expire no more than 10 years from date of grant. Exercise prices under both plans are set by the board of directors at the date of grant, but shall not be less than 100% of fair market value of the related stock at the date of the grant. Options vest over three to seven year periods from the date of the grant for both plans.
F-90
Table of Contents
Live Oak Bancshares, Inc.
Notes to Consolidated Financial Statements
For the years ended December 31, 2014, 2013 and 2012
Note 10. Benefit Plans (Continued)
Compensation cost relating to share-based payment transactions are recognized in the financial statements with measurement based upon the fair value of the equity or liability instruments issued. For the years ended December 31, 2014, 2013, and 2012, the Company recognized $272 thousand, $38 thousand and $81 thousand in compensation expense for stock options, respectively.
Activity under the stock option plan during the year ended December 31, 2014 is summarized below.
| Shares | Weighted Average Exercise Price |
Weighted Average Remaining Contractual Term |
Aggregate Intrinsic Value |
|||||||||||||
| Outstanding at December 31, 2013 |
225,000 | $ | 1.68 | — | — | |||||||||||
| Exercised |
191,660 | .92 | — | — | ||||||||||||
| Forfeited |
170,590 | 4.40 | — | — | ||||||||||||
| Granted |
1,878,020 | 5.49 | — | — | ||||||||||||
|
|
|
|
|
|||||||||||||
| Outstanding at December 31, 2014 |
1,740,770 | $ | 5.52 | 9.29 years | $ | 8,897,318 | ||||||||||
|
|
|
|
|
|
|
|
|
|||||||||
| Exercisable at December 31, 2014 |
33,340 | $ | 1.52 | 6.79 years | $ | 303,594 | ||||||||||
|
|
|
|
|
|
|
|
|
|||||||||
The following is a summary of non-vested stock option activity for the Company.
| Shares | Weighted Average Grant Date Fair Value |
|||||||
| Non-vested at December 31, 2011 |
621,660 | $ | 0.33 | |||||
| Granted |
— | — | ||||||
| Vested |
421,660 | 0.27 | ||||||
| Forfeited |
— | — | ||||||
|
|
|
|
|
|||||
| Non-vested at December 31, 2012 |
200,000 | 0.45 | ||||||
| Granted |
— | — | ||||||
| Vested |
108,250 | 0.45 | ||||||
| Forfeited |
— | — | ||||||
|
|
|
|
|
|||||
| Non-vested at December 31, 2013 |
91,750 | 0.45 | ||||||
| Granted |
1,878,020 | 1.13 | ||||||
| Vested |
91,750 | 0.44 | ||||||
| Forfeited |
170,590 | 0.58 | ||||||
|
|
|
|
|
|||||
| Non-vested at December 31, 2014 |
1,707,430 | $ | 1.19 | |||||
|
|
|
|
|
|||||
At December 31, 2014, unrecognized compensation costs relating to stock options amounted to $2 million which will be expensed over the next 6.01 years.
The weighted average fair value of each stock option grant is estimated on the date of grant using the Black-Scholes option-pricing model. The expected volatility is based on historical volatility. The risk-free interest rates for periods within the contractual life of the awards are based on the U.S. Treasury yield curve in effect at the time of the grant. The expected life is based on historical exercise experience. The dividend yield assumption is
F-91
Table of Contents
Live Oak Bancshares, Inc.
Notes to Consolidated Financial Statements
For the years ended December 31, 2014, 2013 and 2012
Note 10. Benefit Plans (Continued)
based on the Company’s history and expectation of dividend payouts, exclusive of dividends commensurate with shareholders tax burdens as a pass through entity through July 31, 2014. Weighted average assumptions used for options granted during 2014 were as follows: risk free rate of 2.27%, dividend yield of 5.18%, volatility of 29.70% and average life of 4-7 years. There were no grants under the plans during 2013 or 2012.
Redeemable Equity Securities
In 2013 the Company entered into an agreement with a third party financial institution which provides personal loans to the Company’s employees. In this arrangement the Company was obligated to repurchase its shares collateralizing personal employee loans only in the event of default. The repurchase of Company stock in under this arrangement is at the greater of $3.00 per share or the price per share required to pay and satisfy in full each loan, including without limitation the entire principal balance and any accrued unpaid interest and any applicable fees and costs owed with respect to the applicable loan until paid in full. Due to this arrangement containing provisions allowing for a cash settlement, the intrinsic value was reflected as mezzanine equity. During 2014, the obligation for the Company to repurchase stock under the above arrangement was terminated.
Note 11. Commitments and Contingencies
Litigation
In the normal course of business the Company is involved in various legal proceedings. Management believes that the outcome of such proceedings will not materially affect the financial position, results of operations or cash flows of the Company.
Financial Instruments with Off-balance-sheet Risk
The Company is party to financial instruments with off-balance-sheet risk in the normal course of business to meet the financing needs of its customers. These financial instruments include commitments to extend credit and standby letters of credit. These instruments involve, to varying degrees, credit risk in excess of the amount recognized in the balance sheet.
The Company’s exposure to credit loss in the event of nonperformance by the other party to the financial instrument for commitments to extend credit and standby letters of credit is represented by the contractual amount of those instruments. The Company uses the same credit policies in making commitments and conditional obligations as for on-balance-sheet instruments. A summary of the Company’s commitments at December 31, 2014, 2013 and 2012 is as follows:
| 2014 | 2013 | 2012 | ||||||||||
| Commitments to extend credit |
$ | 537,951 | $ | 221,487 | $ | 216,010 | ||||||
| Plexus Capital — Fund II Investment Commitment |
100 | 100 | — | |||||||||
| Plexus Capital — Fund III Investment Commitment |
350 | 413 | 138 | |||||||||
|
|
|
|
|
|
|
|||||||
| Total unfunded off-balance sheet credit risk |
$ | 538,401 | $ | 222,000 | $ | 216,148 | ||||||
|
|
|
|
|
|
|
|||||||
F-92
Table of Contents
Live Oak Bancshares, Inc.
Notes to Consolidated Financial Statements
For the years ended December 31, 2014, 2013 and 2012
Note 11. Commitments and Contingencies (Continued)
Commitments to extend credit are agreements to lend to a customer as long as there is no violation of any condition established in the contract. Commitments generally have fixed expiration dates or other termination clauses and may require payment of a fee. Since many of the commitments are expected to expire without being drawn upon, the total commitment amounts do not necessarily represent future cash requirements. The Company evaluates each customer’s creditworthiness on a case-by-case basis. The amount of collateral obtained, if deemed necessary by the Company upon extension of credit, is based on management’s credit evaluation of the party. Collateral held varies, but may include accounts receivable, inventory, property and equipment, residential real estate and income-producing commercial properties. In 2012, the Company began issuing commitment letters after approval of the loan by the Credit Department. The commitment letter expires ninety days after the issuance.
Standby letters of credit are conditional commitments issued by the Company to guarantee the performance of a customer to a third party. Those guarantees are primarily issued to support public and private borrowing arrangements. The credit risk involved in issuing letters of credit is essentially the same as that involved in extending loan facilities to customers. Collateral held varies as specified above and is required in instances which the Company deems necessary. There were no standby letters of credit for the periods presented.
Concentrations of Credit Risk
Although the Company is not subject to any geographic concentrations, a substantial amount of the Company’s loans and commitments to extend credit have been granted to customers in the independent pharmacies and veterinary practices verticals. The concentrations of credit by type of loan are set forth in Note 2. The distribution of commitments to extend credit approximates the distribution of loans outstanding. The Company does not have a significant number of credits to any single borrower or group of related borrowers whereby their retained exposure exceeds $2.0 million.
The Company from time-to-time may have cash and cash equivalents on deposit with financial institutions that exceed federally-insured limits.
Note 12. Regulatory Matters
Dividends
The Bank, as a North Carolina banking corporation, may pay dividends to shareholders provided the bank does not make distributions that reduce its capital below its applicable required capital, pursuant to North Carolina General Statutes Section 53C-4-7. However, regulatory authorities may limit payment of dividends by any bank when it is determined that such a limitation is in the public interest and is necessary to ensure financial soundness of the bank.
Capital Requirements
The Company (on a consolidated basis) and the Bank are subject to various regulatory capital requirements administered by the federal banking agencies. Failure to meet minimum capital requirements can initiate certain mandatory and possibly additional discretionary actions by regulators that, if undertaken, could have a direct material effect on the Company’s and Bank’s financial statements. Under capital adequacy guidelines and the regulatory framework for prompt corrective action, the Company and the Bank must meet specific capital guidelines that involve quantitative measures of their assets, liabilities and certain off-balance-sheet items as calculated under regulatory accounting principles. The capital amounts and classification are also subject to qualitative judgments by the regulators about components, risk weightings, and other factors. Prompt corrective action provisions are not applicable to bank holding companies.
F-93
Table of Contents
Live Oak Bancshares, Inc.
Notes to Consolidated Financial Statements
For the years ended December 31, 2014, 2013 and 2012
Note 12. Regulatory Matters (Continued)
Quantitative measures established by regulation to ensure capital adequacy require the Company and the Bank to maintain minimum amounts and ratios (set forth in the following table) of total and Tier 1 capital (as defined in the regulations) to risk-weighted assets (as defined) and of Tier 1 capital (as defined) to average assets (as defined). Management believes, as of December 31, 2014, 2013 and 2012, that the Company and the Bank meet all capital adequacy requirements to which they are subject.
As of December 31, 2014, the most recent notification from the Federal Deposit Insurance Corporation categorized the Bank as well capitalized under the regulatory framework for prompt corrective action. To be categorized as well capitalized, an institution must maintain minimum total risk-based, Tier 1 risk-based and Tier 1 leverage ratios as set forth in the following tables. There are no conditions or events since the notification that management believes have changed the Bank’s category.
Capital amounts and ratios as of December 31, 2014, 2013 and 2012, are presented in the table below.
| Actual | Minimum Capital Requirement |
Minimum To Be Well Capitalized Under Prompt Corrective Action Provisions |
||||||||||||||||||||||
| Amount | Ratio | Amount | Ratio | Amount | Ratio | |||||||||||||||||||
| Consolidated-December 31, 2014 |
||||||||||||||||||||||||
| Total Capital |
||||||||||||||||||||||||
| (to Risk-Weighted Assets) |
$ | 99,340 | 19.63 | % | $ | 40,490 | 8.00 | % | $ | 50,612 | 10.00 | % | ||||||||||||
| Tier I Capital |
||||||||||||||||||||||||
| (to Risk-Weighted Assets) |
$ | 88,132 | 17.41 | % | $ | 20,245 | 4.00 | % | $ | 30,367 | 6.00 | % | ||||||||||||
| Tier I Capital |
||||||||||||||||||||||||
| (to Average Assets) |
$ | 88,132 | 13.38 | % | $ | 26,349 | 4.00 | % | $ | 32,936 | 5.00 | % | ||||||||||||
| Bank-December 31, 2014 |
||||||||||||||||||||||||
| Total Capital |
||||||||||||||||||||||||
| (to Risk-Weighted Assets) |
$ | 63,243 | 13.36 | % | $ | 37,857 | 8.00 | % | $ | 47,321 | 10.00 | % | ||||||||||||
| Tier I Capital |
||||||||||||||||||||||||
| (to Risk-Weighted Assets) |
$ | 58,836 | 12.43 | % | $ | 18,928 | 4.00 | % | $ | 28,392 | 6.00 | % | ||||||||||||
| Tier I Capital |
||||||||||||||||||||||||
| (to Average Assets) |
$ | 58,836 | 9.34 | % | $ | 25,200 | 4.00 | % | $ | 31,500 | 5.00 | % | ||||||||||||
| Bank-December 31, 2013 |
||||||||||||||||||||||||
| Total Capital |
||||||||||||||||||||||||
| (to Risk-Weighted Assets) |
$ | 50,812 | 15.95 | % | $ | 25,486 | 8.00 | % | $ | 31,857 | 10.00 | % | ||||||||||||
| Tier I Capital |
||||||||||||||||||||||||
| (to Risk-Weighted Assets) |
$ | 48,089 | 15.09 | % | $ | 12,747 | 4.00 | % | $ | 19,121 | 6.00 | % | ||||||||||||
| Tier I Capital |
||||||||||||||||||||||||
| (to Average Assets) |
$ | 48,089 | 10.39 | % | $ | 18,514 | 4.00 | % | $ | 23,142 | 5.00 | % | ||||||||||||
| Bank - December 31, 2012 |
||||||||||||||||||||||||
| Total Capital |
||||||||||||||||||||||||
| (to Risk-Weighted Assets) |
$ | 41,438 | 17.91 | % | $ | 18,505 | 8.00 | % | $ | 22,593 | 10.00 | % | ||||||||||||
| Tier I Capital |
||||||||||||||||||||||||
| (to Risk-Weighted Assets) |
$ | 38,514 | 16.65 | % | $ | 13,900 | 4.00 | % | $ | 17,529 | 6.00 | % | ||||||||||||
| Tier I Capital |
||||||||||||||||||||||||
| (to Average Assets) |
$ | 38,514 | 10.63 | % | $ | 17,990 | 4.00 | % | $ | 20,889 | 5.00 | % | ||||||||||||
F-94
Table of Contents
Live Oak Bancshares, Inc.
Notes to Consolidated Financial Statements
For the years ended December 31, 2014, 2013 and 2012
Note 12. Regulatory Matters (Continued)
The Company’s most significant asset in 2013 and 2012 was its investment in the Bank. Consequently, the information concerning capital ratios is substantially the same for the Company and the Bank for those years.
Note 13. Transactions with Related Parties
The Company has entered into transactions with its directors, employees, significant shareholders and their affiliates (related parties). Such transactions were made in the ordinary course of business on substantially the same terms and conditions, including interest rates, as those prevailing at the same time for comparable transactions with other customers, and did not, in the opinion of management, involve more than normal risk or present other unfavorable features.
At December 31, 2013 there were no related party loans. During 2014 the Company disbursed $2.0 million in principal additions and transferred $5.1 million due to changes in related-party status, with total principal curtailments received of $419 thousand. At December 31, 2014 total related party loans were $6.7 million.
Deposits from related parties held by the Company at December 31, 2014, 2013, and 2012 amounted to $89.0 million, $33.3 million, and $25.8 million, respectively.
During the years ended December 31, 2014, 2013 and 2012, the Company invested $63 thousand, $125 thousand and $138 thousand, respectively, in Plexus Funds II and III, L.P. which is included in other assets at December 31, 2014, 2013 and 2012 with a balance of $1 million, $1 million and $363 thousand, respectively. A member of the Company’s board of directors is also a member of Plexus Capital, the administrator of Plexus Fund II, L.P.
During the years ended December 31, 2014 and 2013, the Company leased office space from related parties. The Company’s total lease payments to related parties for 2014, 2013, and 2012 was $100 thousand, $119, and $218 thousand, respectively.
In January 2012, the Company formed nCino to further develop and sell cloud-based banking software that was initially built off of the Force.com platform and transformed into a bank operating system used to streamline the lending process at the Bank. nCino was a majority-owned subsidiary of the Company during the year ended December 31, 2012. In January 2013, the investment in nCino was deconsolidated and subsequently accounted for under the equity method. In June 2014, the Company divested its investment in nCino in the form of a dividend to shareholders with a subsequent investment of $6.1 million later in 2014. The investment in nCino is included in investments in non-consolidated affiliates December 31, 2014. In 2014 and 2013 (subsequent to deconsolidation) the Company had business transactions with nCino amounting to $1.6 million and $1 million, respectively, for services purchased related to the Bank’s loan technology-based platform.
F-95
Table of Contents
Live Oak Bancshares, Inc.
Notes to Consolidated Financial Statements
For the years ended December 31, 2014, 2013 and 2012
Note 14. Parent Company Only Financial Statements
The following balance sheets, statements of income and statements of cash flows for Live Oak Bancshares, Inc. should be read in conjunction with the consolidated financial statements and the notes thereto.
Balance Sheets
| December 31, | ||||||||||||
| 2014 | 2013 | 2012 | ||||||||||
| Assets |
||||||||||||
| Cash and cash equivalents |
$ | 38,911 | $ | 52 | $ | 3,566 | ||||||
| Investment in subsidiaries |
61,957 | 51,036 | 37,886 | |||||||||
| Equity method investments in non-consolidated affiliates |
231 | 11,467 | — | |||||||||
| Note receivable from subsidiary |
— | 3,624 | ||||||||||
| Premises and equipment, net |
20,662 | — | — | |||||||||
| Other assets |
13,013 | 435 | 362 | |||||||||
|
|
|
|
|
|
|
|||||||
| Total assets |
$ | 134,774 | $ | 62,990 | $ | 45,438 | ||||||
|
|
|
|
|
|
|
|||||||
| Liabilities and Shareholders’ Equity |
||||||||||||
| Short term borrowings |
$ | 6,100 | $ | — | $ | — | ||||||
| Long term borrowings |
35,924 | 10,423 | 10,423 | |||||||||
| Dividends payable |
— | — | 2,027 | |||||||||
| Other liabilities |
936 | 572 | 67 | |||||||||
|
|
|
|
|
|
|
|||||||
| Total liabilities |
42,960 | 10,995 | 12,517 | |||||||||
|
|
|
|
|
|
|
|||||||
| Redeemable equity securities |
— | 3,605 | 1,161 | |||||||||
| Shareholders’ equity: |
||||||||||||
| Common stock |
103,795 | 18,319 | 20,535 | |||||||||
| Retained earnings (deficit) |
(12,066 | ) | 30,262 | 11,980 | ||||||||
| Accumulated other comprehensive income (loss) |
85 | (191 | ) | 542 | ||||||||
|
|
|
|
|
|
|
|||||||
| Total shareholders’ equity attributed to Live Oak Bancshares, Inc. |
91,814 | 48,390 | 33,057 | |||||||||
| Noncontrolling interest |
— | — | (1,297 | ) | ||||||||
|
|
|
|
|
|
|
|||||||
| Total equity |
91,814 | 48,390 | 31,760 | |||||||||
|
|
|
|
|
|
|
|||||||
| Total liabilities and shareholders’ equity |
$ | 134,774 | $ | 62,990 | $ | 45,438 | ||||||
|
|
|
|
|
|
|
|||||||
F-96
Table of Contents
Live Oak Bancshares, Inc.
Notes to Consolidated Financial Statements
For the years ended December 31, 2014, 2013 and 2012
Note 14. Parent Company Only Financial Statements (Continued)
Statements of Income
| Years Ended December 31, | ||||||||||||
| 2014 | 2013 | 2012 | ||||||||||
| Interest income |
$ | 49 | $ | 334 | $ | 365 | ||||||
| Interest expense |
864 | 470 | 553 | |||||||||
|
|
|
|
|
|
|
|||||||
| Net interest loss |
(815 | ) | (136 | ) | (188 | ) | ||||||
|
|
|
|
|
|
|
|||||||
| Noninterest income: |
||||||||||||
| Dividends from banking subsidiary |
10,368 | 9,780 | 11,499 | |||||||||
| Gain on deconsolidation of subsidiary |
— | 12,212 | — | |||||||||
| Equity in income (loss) of non-consolidated affiliates |
(2,221 | ) | (2,756 | ) | — | |||||||
| Other |
260 | — | — | |||||||||
|
|
|
|
|
|
|
|||||||
| Total noninterest income |
8,407 | 19,236 | 11,499 | |||||||||
|
|
|
|
|
|
|
|||||||
| Noninterest expense: |
||||||||||||
| Salaries and employee benefits |
5,028 | 232 | 343 | |||||||||
| Professional fees |
2,323 | 284 | 243 | |||||||||
| Other |
643 | 89 | 1 | |||||||||
|
|
|
|
|
|
|
|||||||
| Total noninterest expense |
7,994 | 605 | 587 | |||||||||
|
|
|
|
|
|
|
|||||||
| Net income (loss) before equity in undistributed income of subsidiaries |
(402 | ) | 18,495 | 10,724 | ||||||||
| Equity in undistributed income of subsidiaries in excess of dividends from subsidiaries |
9,695 | 9,447 | 4,074 | |||||||||
|
|
|
|
|
|
|
|||||||
| Net income before tax |
9,293 | 27,942 | 14,798 | |||||||||
| Income tax benefit |
(755 | ) | — | — | ||||||||
|
|
|
|
|
|
|
|||||||
| Net income |
10,048 | 27,942 | 14,798 | |||||||||
|
|
|
|
|
|
|
|||||||
| Net loss attributable to noncontrolling interest |
— | 120 | 1,297 | |||||||||
|
|
|
|
|
|
|
|||||||
| Net income attributable to Live Oak Bancshares, Inc. |
$ | 10,048 | $ | 28,062 | $ | 16,095 | ||||||
|
|
|
|
|
|
|
|||||||
F-97
Table of Contents
Live Oak Bancshares, Inc.
Notes to Consolidated Financial Statements
For the years ended December 31, 2014, 2013 and 2012
Note 14. Parent Company Only Financial Statements (Continued)
Statements of Cash Flows
| Years Ended December 31, | ||||||||||||
| 2014 | 2013 | 2012 | ||||||||||
| Cash flows from operating activities |
||||||||||||
| Net income |
$ | 10,048 | $ | 27,942 | $ | 14,798 | ||||||
| Adjustments to reconcile net income to net cash provided by (used in) operating activities: |
||||||||||||
| Equity in undistributed net loss (income) of subsidiaries in excess of dividends of subsidiaries |
(9,695 | ) | (9,757 | ) | (4,074 | ) | ||||||
| Equity in loss of non-consolidated affiliates |
2,221 | 2,756 | — | |||||||||
| Gain on deconsolidation of subsidiary |
— | (12,212 | ) | — | ||||||||
| Stock option based compensation expense |
272 | 38 | 81 | |||||||||
| Restricted stock expense |
143 | 150 | 250 | |||||||||
| Stock grants |
2,992 | — | — | |||||||||
| Net change in other assets |
(6,899 | ) | 4,247 | (362 | ) | |||||||
| Net change in other liabilities |
1,351 | 619 | (80 | ) | ||||||||
|
|
|
|
|
|
|
|||||||
| Net cash provided by (used in) operating activities |
433 | 13,783 | 10,613 | |||||||||
|
|
|
|
|
|
|
|||||||
| Cash flows from investing activities |
||||||||||||
| Capital investment in subsidiaries |
(950 | ) | — | (194 | ) | |||||||
| Capital investment in non-consolidated affiliates |
(6,614 | ) | (8,890 | ) | — | |||||||
| Net change in advances to subsidiaries |
— | 3,624 | (3,624 | ) | ||||||||
| Purchases of premises and equipment |
(20,227 | ) | — | — | ||||||||
|
|
|
|
|
|
|
|||||||
| Net cash used in investing activities |
(27,791 | ) | (5,266 | ) | (3,818 | ) | ||||||
|
|
|
|
|
|
|
|||||||
| Cash flows from financing activities |
||||||||||||
| Proceeds from borrowings |
35,224 | — | 3,623 | |||||||||
| Repayments of borrowings |
(571 | ) | — | (3,165 | ) | |||||||
| Repurchase of common stock |
— | (444 | ) | — | ||||||||
| Stock options exercised |
177 | 100 | 792 | |||||||||
| Proceeds from sale of common stock, net |
75,235 | 234 | 877 | |||||||||
| Shareholder dividend distributions |
(43,848 | ) | (11,921 | ) | (9,356 | ) | ||||||
|
|
|
|
|
|
|
|||||||
| Net cash provided by (used in) financing activities |
66,217 | (12,031 | ) | (7,229 | ) | |||||||
|
|
|
|
|
|
|
|||||||
| Net change in cash and cash equivalents |
38,859 | (3,514 | ) | (434 | ) | |||||||
| Cash and cash equivalents at beginning of year |
52 | 3,566 | 4,000 | |||||||||
|
|
|
|
|
|
|
|||||||
| Cash and cash equivalents at end of year |
$ | 38,911 | $ | 52 | $ | 3,566 | ||||||
|
|
|
|
|
|
|
|||||||
F-98
Table of Contents
Live Oak Bancshares, Inc.
Notes to Consolidated Financial Statements
For the years ended December 31, 2014, 2013 and 2012
Note 15. Subsequent Events
Management has evaluated subsequent events through the date the financial statements were available to be issued and determined that the following events required disclosure:
Change to Self Insured Health Plan
On January 1, 2015 the Company switched from a fully insured health, pharmacy, dental, vision and short-term disability plan (“health plan”) to a self-insured health plan managed by a third party administrator. Both medical and pharmacy claims are backed by a stop-loss contract that limits maximum out of pocket expenses to 25% of total expected claims paid.
Proposed Acquisition of Independence Trust Company
On January 13, 2015 the Company entered into an Agreement and Plan of Merger with Independence Holding Corporation and its wholly-owned subsidiary, Independence Trust Company, a federally charted savings bank (together referred to as “ITC” hereafter). Under this agreement, the Company will acquire control of ITC in a purchase of 100% of the outstanding shares of ITC for an all cash price of $8,350,000. As of December 31, 2014, ITC had total unaudited assets of $4.7 million and equity of $4.5 million. The acquisition of ITC is subject to regulatory approval.
ITC currently acts as a trustee of preneed funeral, preneed cemetery, merchandise and services and perpetual care cemetery trust assets in 32 states.
Option Grants
Effective January 30 and February 20, 2015, the Company issued an aggregate of 394,753 options vesting over seven years. Exercise price is $10.63 per share and weighted average date of grant fair value using the Black-Scholes option-pricing model is $3.83 per share. Vesting is to occur at 10% per year for the first five years and then 25% in years six and seven. Unrecognized compensation expense associated with these grants is $1.5 million to be recognized over the next seven years.
Change in Control of 504 Fund Advisors, LLC
On February 2, 2015 the Company acquired control of 504 Fund Advisors, LLC (“504 Fund”) by increasing its ownership from 50% to 91.3%. The acquisition of an additional 41.3% of ownership occurred in exchange for future net income of 504 Fund. Total contingent consideration is $620 thousand. Total unaudited assets as of January 31, 2015 were $1.1 million and capital was $410 thousand. The Company has invested $750 thousand in 504 Fund since inception in May 2007. Under the equity method, the carrying amount of this investment was $231 thousand at December 31, 2014.
nCino sale and Repayment of Short Term Borrowing
On February 12, 2015 the Company sold 100% of its 9.02% ownership in nCino to third party investors for an after tax gain of $2.3 million. This investment was accounted for under the cost method. On February 23, 2015, gross proceeds from this sale were used to repay in full the $6.1 million in short term borrowings disclosed in Note 7.
F-99
Table of Contents
Live Oak Bancshares, Inc.
Notes to Consolidated Financial Statements
For the years ended December 31, 2014, 2013 and 2012
Note 15. Subsequent Events (Continued)
Secured Borrowing
On February 23, 2015 the Company transferred two related party loans to an unrelated third party financial institution in exchange for $4.7 million. The exchange price equated to the unpaid principal balance plus accrued but uncollected interest at the time of transfer. The terms of the transfer agreement with the third party institution identified the transaction as a secured borrowing for accounting purposes. As such, upon receipt of funds from the third party institution the Company recorded a secured borrowing for $4.7 million.
F-100
Table of Contents
4,000,000 Shares
Common Stock
PRELIMINARY PROSPECTUS
Prospectus dated , 2015
SANDLER O’NEILL + PARTNERS, L.P.

Through and including , 2015 (the 25th day after the date of this prospectus), all dealers effecting transactions in these securities, whether or not participating in this offering, may be required to deliver a prospectus. This is in addition to the dealer’s obligation to deliver a prospectus when acting as underwriters and with respect to their unsold allotments or subscriptions.
Table of Contents
PART II
INFORMATION NOT REQUIRED IN PROSPECTUS
| Item 13. | Other Expenses of Issuance and Distribution. |
The following table sets forth the fees and expenses, other than underwriting discounts and commissions, payable by us in connection with the issuance and distribution of the common stock being registered hereunder, all of which will be borne by us. All amounts shown are estimates except the SEC registration fee, the NASDAQ listing fee, and the FINRA filing fee.
| Amount To Be Paid |
||||
| SEC registration fee |
$ | 10,022 | ||
| FINRA filing fee |
$ | 13,438 | ||
| NASDAQ listing fee |
$ | 150,000 | ||
| Accounting fees and expenses |
$ | 200,000 | ||
| Legal fees and expenses |
$ | 750,000 | ||
| Printing fees |
$ | 140,000 | ||
| Miscellaneous expenses |
$ | 350,000 | ||
|
|
|
|||
| Total Expenses |
$ | 1,613,460 | ||
|
|
|
|||
| Item 14. | Indemnification of Directors and Officers. |
Sections 55-8-50 through 55-8-58 of the North Carolina General Statutes permit a corporation to indemnify its directors, officers, employees or agents under either or both a statutory or nonstatutory scheme of indemnification. Under the statutory scheme, a corporation may, with certain exceptions, indemnify a director, officer, employee or agent of the corporation who was, is, or is threatened to be made, a party to any threatened, pending or completed legal action, suit or proceeding, whether civil, criminal, administrative, or investigative, because of the fact that such person was a director, officer, agent or employee of the corporation, or is or was serving at the request of such corporation as a director, officer, employee or agent of another corporation or enterprise. This indemnity may include the obligation to pay any judgment, settlement, penalty, fine (including an excise tax assessed with respect to an employee benefit plan) and reasonable expenses incurred in connection with a proceeding (including counsel fees), but no such indemnification may be granted unless such director, officer, agent or employee (i) conducted himself in good faith, (ii) reasonably believed (a) that any action taken in his official capacity with the corporation was in the best interest of the corporation or (b) that in all other cases his conduct at least was not opposed to the corporation’s best interest, and (iii) in the case of any criminal proceeding, had no reasonable cause to believe his conduct was unlawful. Whether a director has met the requisite standard of conduct for the type of indemnification set forth above is determined by the board of directors, a committee of directors, special legal counsel or the shareholders in accordance with Section 55-8-55. A corporation may not indemnify a director under the statutory scheme in connection with a proceeding by or in the right of the corporation in which the director was adjudged liable to the corporation or in connection with a proceeding in which a director was adjudged liable on the basis of having received an improper personal benefit.
In addition to, and separate and apart from the indemnification described above under the statutory scheme, Section 55-8-57 of the North Carolina General Statutes permits a corporation to indemnify or agree to indemnify any of its directors, officers, employees or agents against liability and expenses (including attorney’s fees) in any proceeding (including proceedings brought by or on behalf of the corporation) arising out of their status as such or their activities in such capacities, except for any liabilities or expenses incurred on account of activities that were, at the time taken, known or believed by the person to be clearly in conflict with the best interests of the
II-1
Table of Contents
corporation. The bylaws of the Company provide for indemnification to the fullest extent permitted by law for persons who serve as a director, officer, agent or employee of the Company or at the request of the Company serve as a director, officer, agent or employee for any other corporation, partnership, joint venture, trust or other enterprise, or as a trustee or administrator under an employee benefit plan. Accordingly, the Company may indemnify its directors, officers, agents or employees in accordance with either the statutory or nonstatutory standards.
Sections 55-8-52 and 55-8-56 of the North Carolina General Statutes require a corporation, unless its articles of incorporation provide otherwise, to indemnify a director or officer who has been wholly successful, on the merits or otherwise, in the defense of any proceeding to which such director or officer was a party. Unless prohibited by the articles of incorporation, a director or officer also may make application and obtain court-ordered indemnification if the court determines that such director or officer is fairly and reasonably entitled to such indemnification as provided in Sections 55-8-54 and 55-8-56.
Finally, Section 55-8-57 of the North Carolina General Statutes provides that a corporation may purchase and maintain insurance on behalf of an individual who is or was a director, officer, employee or agent of the corporation against certain liabilities incurred by such persons, whether or not the corporation is otherwise authorized by the North Carolina Business Corporation Act to indemnify such party. The Company has purchased a standard directors’ and officers’ liability policy which will, subject to certain limitations, indemnify the Company and its officers and directors for damages they become legally obligated to pay as a result of any negligent act, error, or omission committed by directors or officers while acting in their capacity as such.
As permitted by North Carolina law, Article VI of the Articles of Incorporation of the Company limits the personal liability of directors for monetary damages for breaches of duty as a director arising out of any legal action whether by or in the right of the Company or otherwise, provided that such limitation will not apply to (i) acts or omissions that the director at the time of such breach knew or believed were clearly in conflict with the best interests of the Company, (ii) any liability under Section 55-8-33 of the General Statutes of North Carolina, or (iii) any transaction from which the director derived an improper personal benefit (which does not include a director’s reasonable compensation or other reasonable incidental benefit for or on account of his service as a director, officer, employee, independent contractor, attorney, or consultant of the Company).
| Item 15. | Recent Sales of Unregistered Securities. |
On August 4, 2014, we sold 7,048,300 shares of common stock at a purchase price per share of $10.63, for an aggregate purchase price of $74.9 million in a private placement to accredited institutional investors in a transaction exempt from registration pursuant to Rule 506 of Regulation D promulgated under the Securities Act of 1933, as amended. No underwriters were used for this transaction and there were no underwriting discounts or commissions on this sale.
On September 30, 2014, we issued a total of 287,020 shares of common stock to 39 accredited investors in connection with the conversion of outstanding senior notes owned by such investors. This conversion was effected at a conversion price of $10.63 per share. No underwriters were used for this transaction and there were no underwriting discounts or commissions on this sale.
During the fourth quarter of 2014, we sold 36,662 shares of our common stock at a price of $9.04 to our employees pursuant to an Employee Stock Purchase Plan, generating gross proceeds of approximately $331,424. Also during the fourth quarter of 2014, we sold 6,818 shares of common stock at a price of $10.63 per share to a total of 17 investors pursuant to a private placement memorandum. No underwriters were used for these transactions and there were no underwriting discounts or commissions on these sales.
In addition to the sales described above, between March 31, 2012 and March 31, 2015, we issued a total of 270,430 shares of common stock at prices ranging from $2.00 per share to $4.40 per share to eight of our
II-2
Table of Contents
employees. During this period, we also issued a total of 1,061,660 shares of common stock upon the exercise of stock options previously granted to our employees and members of our board of directors and 685,700 shares of common stock in connection with restricted stock awards to our employees.
The issuances of securities described above were made in reliance upon exemptions from federal securities registration under Section 4(a)(2) of the Securities Act, and Rule 506 thereunder, as transactions not constituting a public offering of securities because the shares were issued privately without general solicitation.
| Item 16. | Exhibits and Financial Statement Schedules. |
(a) Exhibits
| Exhibit No. |
Description | |
| 1.1 | Form of Underwriting Agreement* | |
| 3.1 | Amended and Restated Articles of Incorporation of Live Oak Bancshares, Inc.* | |
| 3.2 | Amended Bylaws of Live Oak Bancshares, Inc.* | |
| 4.1 | Form of Common Stock Certificate* | |
| 4.2 | Registration and Other Rights Agreement between Live Oak Bancshares, Inc. and Wellington purchasers* | |
| 5.1 | Opinion of Wyrick Robbins Yates & Ponton LLP | |
| 10.1 | 2008 Incentive Stock Option Plan, as amended* | |
| 10.2 | 2008 Nonstatutory Stock Option Plan* | |
| 10.3 | 2014 Employee Stock Purchase Plan* | |
| 10.4 | 2015 Omnibus Stock Incentive Plan* | |
| 10.5 | SBLF Letter Agreement, dated September 13, 2011, by and among Live Oak Bancshares, Inc. and the Secretary of the United States Treasury* | |
| 10.6 | Tax Sharing Agreement, effective as of February 6, 2012, between Live Oak Bancshares, Inc. and Live Oak Banking Company* | |
| 10.7 | Securities Purchase Agreement, dated May 28, 2015 between Live Oak Bancshares, Inc. and Wellington purchasers* | |
| 10.8 | First Amendment to Securities Purchase Agreement, dated July 31, 2014 between Live Oak Bancshares, Inc. and Wellington purchasers* | |
| 10.9 | Second Amendment to Securities Purchase Agreement, dated August 1, 2014 between Live Oak Bancshares, Inc. and Wellington purchasers* | |
| 10.10 | Software Service Agreement between Live Oak Bancshares, Inc. and nCino, Inc* | |
| 21.1 | List of Subsidiaries* | |
| 23.1 | Consent of Dixon Hughes Goodman LLP | |
| 23.2 | Consent of Wyrick Robbins Yates & Ponton LLP (Included in its opinion filed as Exhibit 5.1) | |
| 24.1 | Power of Attorney* | |
| 24.2 | Power of Attorney* | |
| * | Previously filed |
II-3
Table of Contents
| Item 17. | Undertakings. |
The undersigned registrant hereby undertakes to provide the underwriters at the closing specified in the underwriting agreement certificates in such denominations and registered in such names as required by the underwriters to permit prompt delivery to each purchaser.
The undersigned registrant hereby undertakes that:
(1) for purposes of determining any liability under the Securities Act of 1933, the information omitted from the form of prospectus filed as part of this registration statement in reliance upon Rule 430A and contained in a form of prospectus filed by the registrant pursuant to Rule 424(b)(1) or (4) or 497(h) under the Securities Act shall be deemed to be part of this registration statement as of the time it was declared effective;
(2) for the purpose of determining any liability under the Securities Act of 1933, each post-effective amendment that contains a form of prospectus shall be deemed to be a new registration statement relating to the securities offered therein, and the offering of such securities at that time shall be deemed to be the initial bona fide offering thereof; and
Insofar as indemnification for liabilities arising under the Securities Act of 1933 may be permitted to directors, officers and controlling persons of the registrant pursuant to the provisions described in Item 14, or otherwise, the registrant has been advised that in the opinion of the Securities and Exchange Commission such indemnification is against public policy as expressed in the Act and is, therefore, unenforceable. In the event that a claim for indemnification against such liabilities (other than the payment by the registrant of expenses incurred or paid by a director, officer or controlling person of the registrant in the successful defense of any action, suit or proceeding) is asserted by such director, officer or controlling person in connection with the securities being registered, the registrant will, unless in the opinion of its counsel the matter has been settled by controlling precedent, submit to a court of appropriate jurisdiction the question whether such indemnification by it is against public policy as expressed in the Act and will be governed by the final adjudication of such issue.
II-4
Table of Contents
SIGNATURES
Pursuant to the requirements of the Securities Act of 1933, as amended, the Registrant has duly caused this Amendment No. 2 to the registration statement to be signed on its behalf by the undersigned, thereunto duly authorized, in the City of Wilmington, State of North Carolina on July 17, 2015.
| LIVE OAK BANCSHARES, INC. (Registrant) | ||
| By: | /s/ James S. Mahan III | |
| James S. Mahan III | ||
| Chairman and Chief Executive Officer (Principal Executive Officer) | ||
Pursuant to the requirements of the Securities Act of 1933, this Amendment No. 2 to the registration statement has been signed by the following persons in the capacities indicated.
| Date | ||||
| /s/ James S. Mahan III James S. Mahan III Chairman and Chief Executive Officer (Principal Executive Officer) |
July 17, 2015 | |||
| /s/ S. Brett Caines S. Brett Caines Chief Financial Officer (Principal Financial Officer and Principal Accounting Officer) |
July 17, 2015 | |||
| /s/ William L. Williams III* William L. Williams III Vice Chairman of the Board of Directors |
July 17, 2015 | |||
| /s/ David G. Lucht* David G. Lucht Chief Risk Officer and Director |
July 17, 2015 | |||
| /s/ Neil L. Underwood* Neil L. Underwood President and Director |
July 17, 2015 | |||
| /s/ Milton E. Petty* Miltom E. Petty Director |
July 17, 2015 | |||
| /s/ William H. Cameron* William H. Cameron Director |
July 17, 2015 | |||
| /s/ Diane B. Glossman* Diane B. Glossman Director |
July 17, 2015 |
II-5
Table of Contents
| /s/ Howard K. Landis III* Howard K. Landis III Director |
July 17, 2015 | |||
| /s/ Jerald L. Pullins* Jerald L. Pullins Director |
July 17, 2015 | |||
| /s/ Glen F. Hoffsis* Glen F. Hoffsis Director |
July 17, 2015 | |||
| /s/ Don Jackson Don Jackson Director |
July 17, 2015 | |||
| * |
/s/ James S. Mahan III |
|||
| James S. Mahan III Attorney-in-fact |
||||
II-6
Table of Contents
EXHIBIT INDEX
| Exhibit No. |
Description | |
| 1.1 | Form of Underwriting Agreement* | |
| 3.1 | Amended and Restated Articles of Incorporation of Live Oak Bancshares, Inc.* | |
| 3.2 | Amended Bylaws of Live Oak Bancshares, Inc.* | |
| 4.1 | Form of Common Stock Certificate* | |
| 4.2 | Registration and Other Rights Agreement between Live Oak Bancshares, Inc. and Wellington purchasers* | |
| 5.1 | Form of Opinion of Wyrick Robbins Yates & Ponton LLP | |
| 10.1 | 2008 Incentive Stock Option Plan, as amended* | |
| 10.2 | 2008 Nonstatutory Stock Option Plan* | |
| 10.3 | 2014 Employee Stock Purchase Plan* | |
| 10.4 | 2015 Omnibus Stock Incentive Plan* | |
| 10.5 | SBLF Letter Agreement, dated September 13, 2011, by and among Live Oak Bancshares, Inc. and the Secretary of the United States Treasury* | |
| 10.6 | Tax Sharing Agreement, effective as of February 6, 2012, between Live Oak Bancshares, Inc. and Live Oak Banking Company* | |
| 10.7 | Securities Purchase Agreement, dated May 28, 2015 between Live Oak Bancshares, Inc. and Wellington purchasers* | |
| 10.8 | First Amendment to Securities Purchase Agreement, dated July 31, 2014 between Live Oak Bancshares, Inc. and Wellington purchasers* | |
| 10.9 | Second Amendment to Securities Purchase Agreement, dated August 1, 2014 between Live Oak Bancshares, Inc. and Wellington purchasers* | |
| 10.10 | Software Service Agreement between Live Oak Bancshares, Inc. and nCino, Inc* | |
| 21.1 | List of Subsidiaries* | |
| 23.1 | Consent of Dixon Hughes Goodman LLP | |
| 23.2 | Consent of Wyrick Robbins Yates & Ponton LLP (Included in its opinion filed as Exhibit 5.1) | |
| 24.1 | Power of Attorney* | |
| 24.2 | Power of Attorney* | |
| * | Previously filed |
II-7