Attached files
| file | filename |
|---|---|
| 8-K - 8-K - ELAH Holdings, Inc. | rely-8k_20150714.htm |

CJS securities summer conference July 14, 2015 Exhibit 99.1
Cautions about forward-looking statements and other notices Use of Non-GAAP Measures. This presentation includes references to the non-GAAP financial measures of earnings before interest, taxes, depreciation and amortization (“EBITDA”) and, with certain additional adjustments (“Adjusted EBITDA”). Management believes that the non-GAAP measures of EBITDA and Adjusted EBITDA enhance the understanding of the financial performance of the operations of Real Alloy (and prior to its acquisition, the former global recycling and specification alloys business of Aleris Corporation) by investors and lenders. As a complement to financial measures recognized under GAAP, management believes that EBITDA and Adjusted EBITDA assist investors who follow the practice of some investment analysts who adjust GAAP financial measures to exclude items that may obscure underlying performance and distort comparability. Because EBITDA and Adjusted EBITDA are not measures recognized under GAAP, they are not intended to be presented herein as a substitute for earnings (loss) from continuing operations, net earnings (loss), net income attributable to Aleris or Real Alloy, or segment income, as indicators of operating performance. EBITDA and Adjusted EBITDA are primarily performance measurements used by our senior management and Board of Directors to evaluate certain operating results. Reconciliation to the GAAP equivalent of the non-GAAP measure of EBITDA and Adjusted EBITDA for Real Alloy is provided herein, in our Current Report on Form 8-K filed with the SEC on June 29, 2015, and in Note 4 on page S-35 of the Prospectus Supplement No. 1 dated January 29, 2015 for the rights offering as filed with the SEC. Cautionary Statement Regarding Forward-Looking Statements. This presentation contains forward-looking statements, which are based on our current expectations, estimates and projections about the Company’s and its subsidiaries’ businesses and prospects, as well as management’s beliefs and certain assumptions made by management. Words such as “anticipates,” “expects,” “intends,” “plans,” “believes,” “seeks,” “estimates,” “may,” “should,” “will” and variations of these words are intended to identify forward-looking statements. Such statements speak only as of the date hereof and are subject to change. The Company undertakes no obligation to revise or update publicly any forward-looking statements for any reason. These statements include, but are not limited to, statements about the Company’s long-term investment decisions, further acquisitions, potential de-leveraging and expansion and business strategies; anticipated growth opportunities; the amount of capital-raising necessary to achieve those strategies; utilization of federal net operating loss tax carryforwards; the effect of listing on a national securities exchange, including potential improvements to liquidity; Real Alloy’s improvements to operating efficiencies and cost of sales; as well as future performance, growth, operating results, financial condition and prospects. Such statements are not guarantees of future performance and are subject to certain risks, uncertainties, and assumptions that are difficult to predict. Accordingly, actual results could differ materially and adversely from those expressed in any forward-looking statements as a result of various factors. Important factors that may cause such a difference include, but are not limited to the Company’s ability to successfully identify, consummate and integrate acquisitions and/or other businesses; changes in business or other market conditions; the difficulty of keeping expense growth at modest levels while increasing revenues; the difficulty of making operating and cost improvements; the Company’s ability to successfully defend against current and new litigation and indemnification matters, as well as demands by investment banks for defense, indemnity, and contribution claims; the Company’s ability to access and realize value from its federal net operating loss tax carryforwards; the Company’s ability to identify and recruit management; the Company’s ability to maintain the listing requirements of the NASDAQ; and other risks detailed from time to time in the Company’s SEC filings, including but not limited to the most recently filed Annual Report on Form 10-K and subsequent reports filed on Forms 10-Q and 8- K.
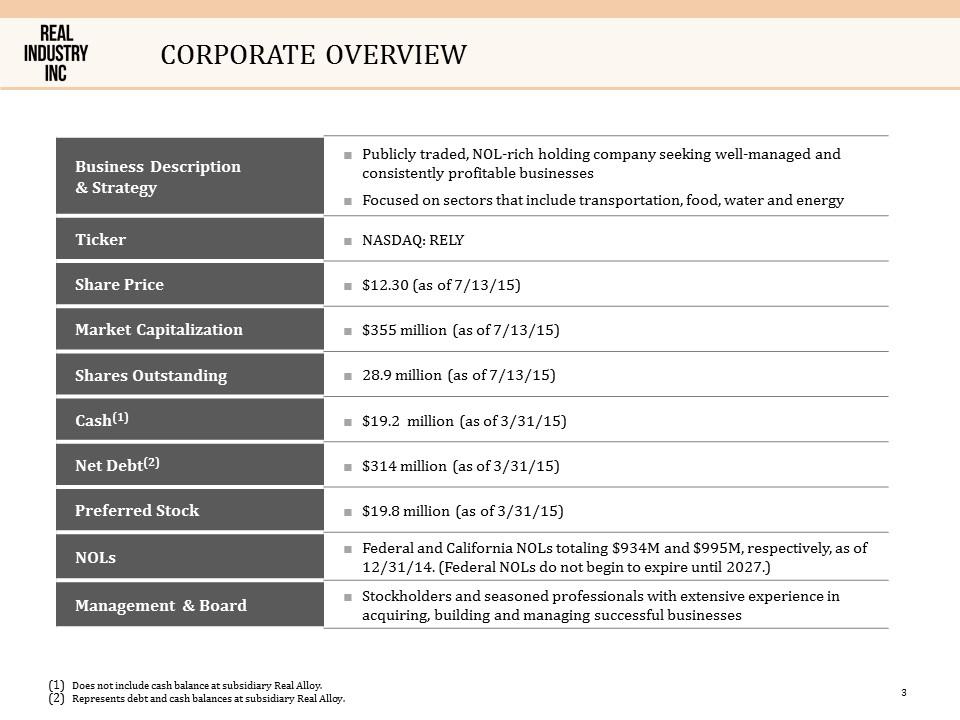
Corporate overview Business Description & Strategy Publicly traded, NOL-rich holding company seeking well-managed and consistently profitable businesses Focused on sectors that include transportation, food, water and energy Ticker NASDAQ: RELY Share Price $12.30 (as of 7/13/15) Market Capitalization $355 million (as of 7/13/15) Shares Outstanding 28.9 million (as of 7/13/15) Cash(1) $19.2 million (as of 3/31/15) Net Debt(2) $314 million (as of 3/31/15) Preferred Stock $19.8 million (as of 3/31/15) NOLs Federal and California NOLs totaling $934M and $995M, respectively, as of 12/31/14. (Federal NOLs do not begin to expire until 2027.) Management & Board Stockholders and seasoned professionals with extensive experience in acquiring, building and managing successful businesses Does not include cash balance at subsidiary Real Alloy. Represents debt and cash balances at subsidiary Real Alloy.
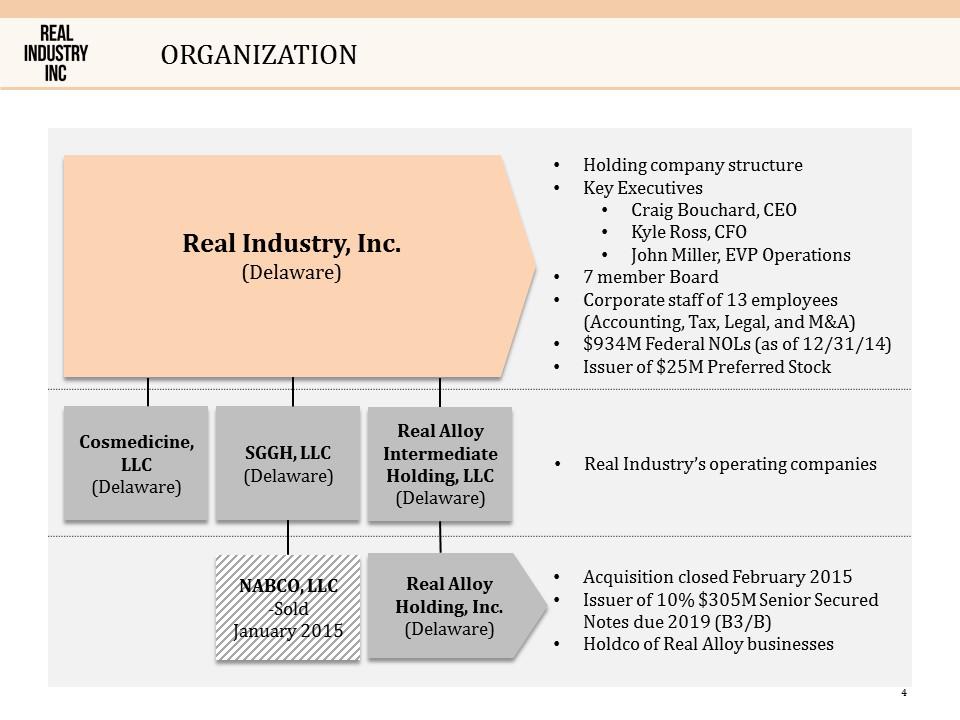
organization Real Alloy Intermediate Holding, LLC (Delaware) Real Alloy Holding, Inc. (Delaware) Real Industry, Inc. (Delaware) SGGH, LLC (Delaware) NABCO, LLC -Sold January 2015 Cosmedicine, LLC (Delaware) Holding company structure Key Executives Craig Bouchard, CEO Kyle Ross, CFO John Miller, EVP Operations 7 member Board Corporate staff of 13 employees (Accounting, Tax, Legal, and M&A) $934M Federal NOLs (as of 12/31/14) Issuer of $25M Preferred Stock Real Industry’s operating companies Acquisition closed February 2015 Issuer of 10% $305M Senior Secured Notes due 2019 (B3/B) Holdco of Real Alloy businesses
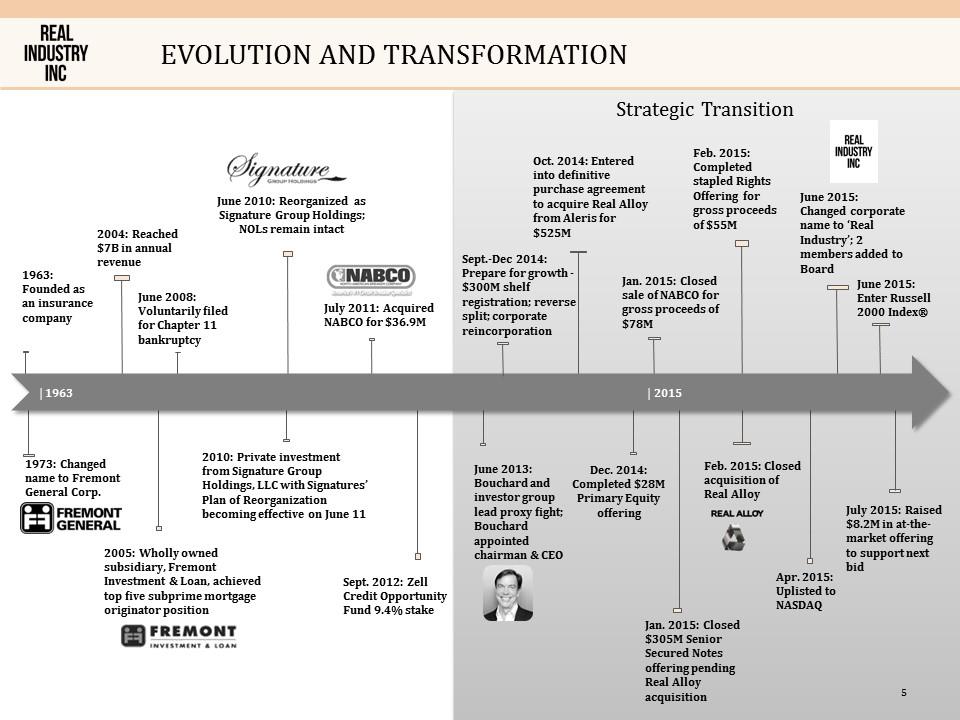
Evolution and transformation 2004: Reached $7B in annual revenue 1973: Changed name to Fremont General Corp. Strategic Transition 1963: Founded as an insurance company 2005: Wholly owned subsidiary, Fremont Investment & Loan, achieved top five subprime mortgage originator position June 2008: Voluntarily filed for Chapter 11 bankruptcy June 2010: Reorganized as Signature Group Holdings; NOLs remain intact 2010: Private investment from Signature Group Holdings, LLC with Signatures’ Plan of Reorganization becoming effective on June 11 July 2011: Acquired NABCO for $36.9M Sept. 2012: Zell Credit Opportunity Fund 9.4% stake June 2013: Bouchard and investor group lead proxy fight; Bouchard appointed chairman & CEO Oct. 2014: Entered into definitive purchase agreement to acquire Real Alloy from Aleris for $525M Dec. 2014: Completed $28M Primary Equity offering Jan. 2015: Closed sale of NABCO for gross proceeds of $78M Jan. 2015: Closed $305M Senior Secured Notes offering pending Real Alloy acquisition 2010 Feb. 2015: Completed stapled Rights Offering for gross proceeds of $55M Feb. 2015: Closed acquisition of Real Alloy June 2015: Changed corporate name to ‘Real Industry’; 2 members added to Board July 2015: Raised $8.2M in at-the-market offering to support next bid June 2015: Enter Russell 2000 Index® Apr. 2015: Uplisted to NASDAQ | 1963 | 2015 Sept.-Dec 2014: Prepare for growth - $300M shelf registration; reverse split; corporate reincorporation
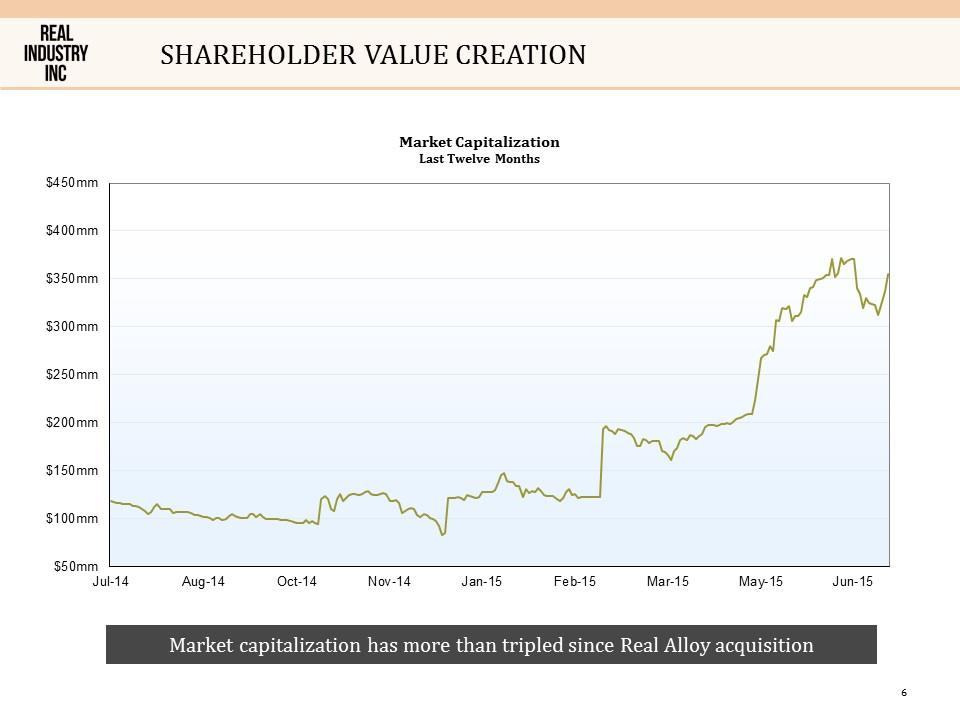
shareholder value creation Market capitalization has more than tripled since Real Alloy acquisition
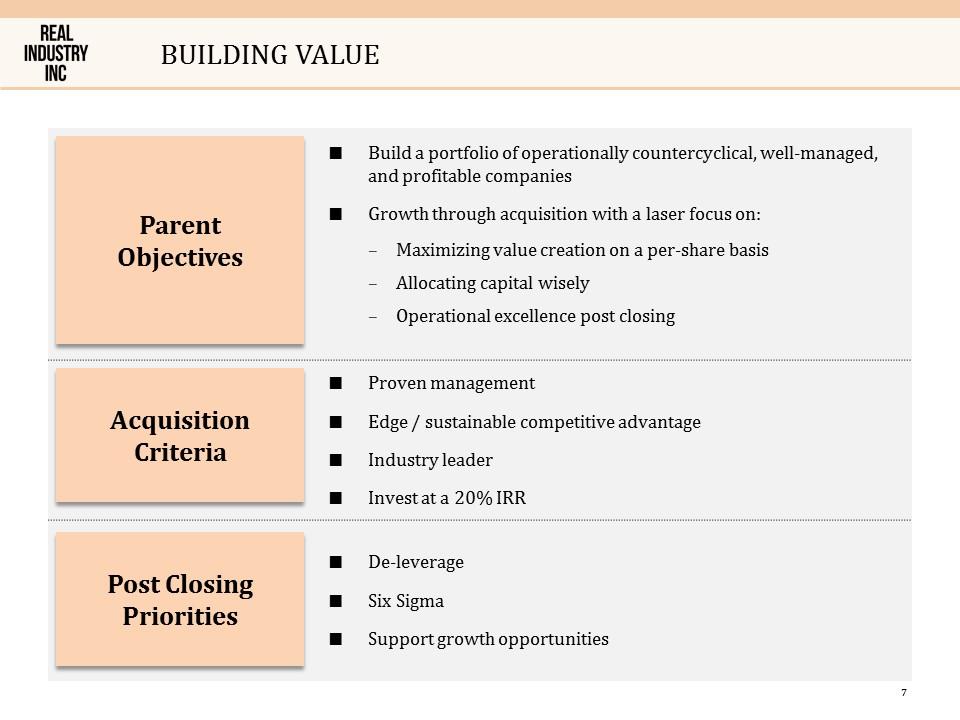
Building value Build a portfolio of operationally countercyclical, well-managed, and profitable companies Growth through acquisition with a laser focus on: Maximizing value creation on a per-share basis Allocating capital wisely Operational excellence post closing Parent Objectives Acquisition Criteria Post Closing Priorities Proven management Edge / sustainable competitive advantage Industry leader Invest at a 20% IRR De-leverage Six Sigma Support growth opportunities
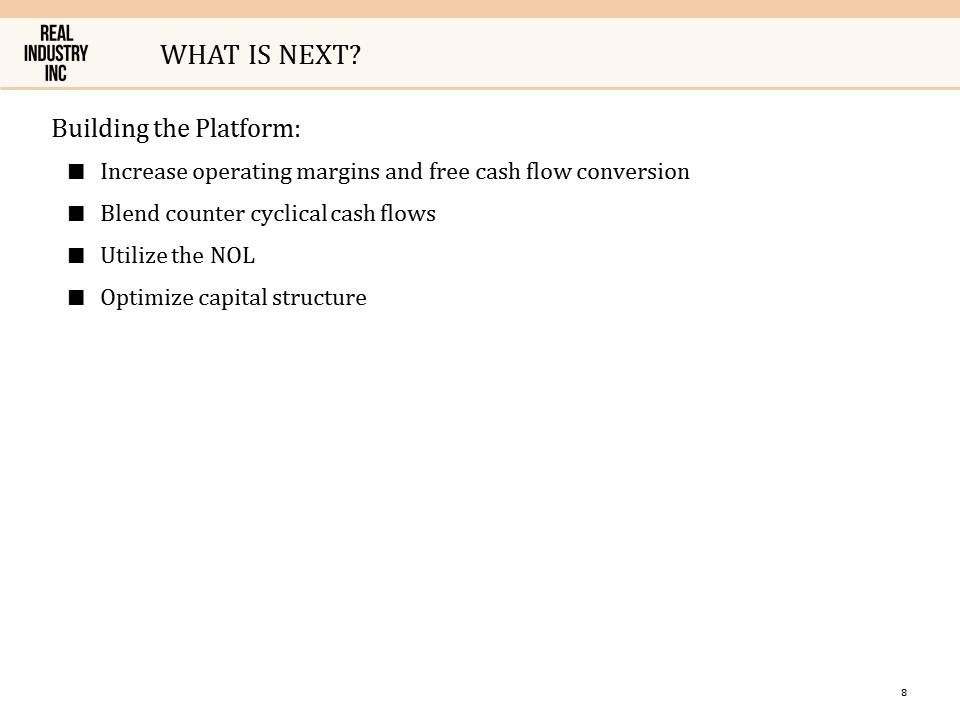
What is next? Building the Platform: Increase operating margins and free cash flow conversion Blend counter cyclical cash flows Utilize the NOL Optimize capital structure
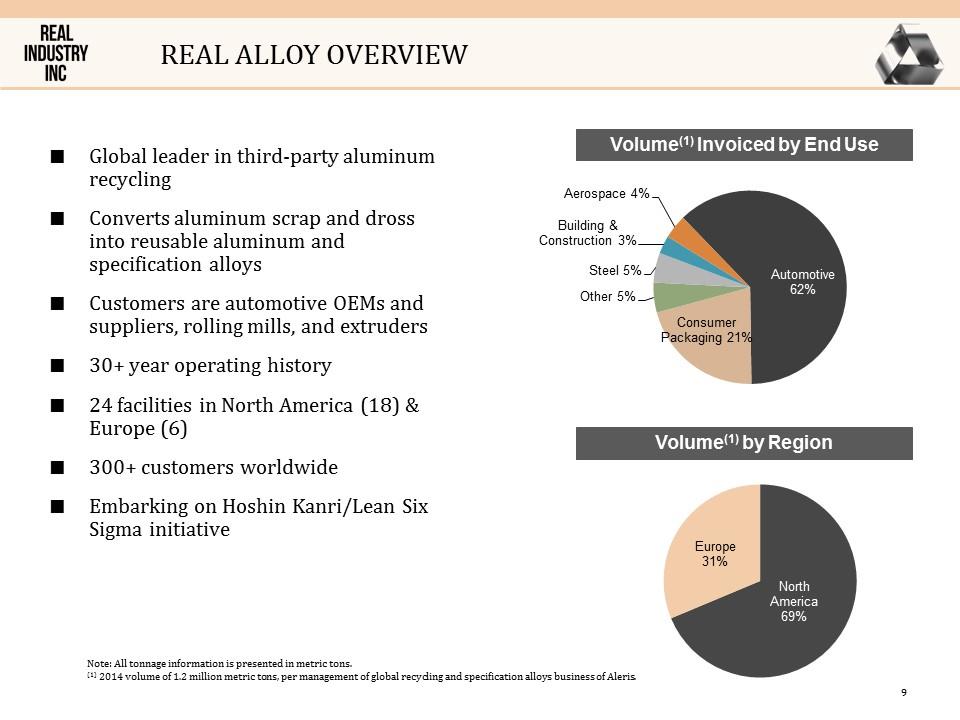
Real alloy OVERVIEW Global leader in third-party aluminum recycling Converts aluminum scrap and dross into reusable aluminum and specification alloys Customers are automotive OEMs and suppliers, rolling mills, and extruders 30+ year operating history 24 facilities in North America (18) & Europe (6) 300+ customers worldwide Embarking on Hoshin Kanri/Lean Six Sigma initiative Volume(1) Invoiced by End Use Volume(1) by Region Note: All tonnage information is presented in metric tons. (1) 2014 volume of 1.2 million metric tons, per management of global recycling and specification alloys business of Aleris.
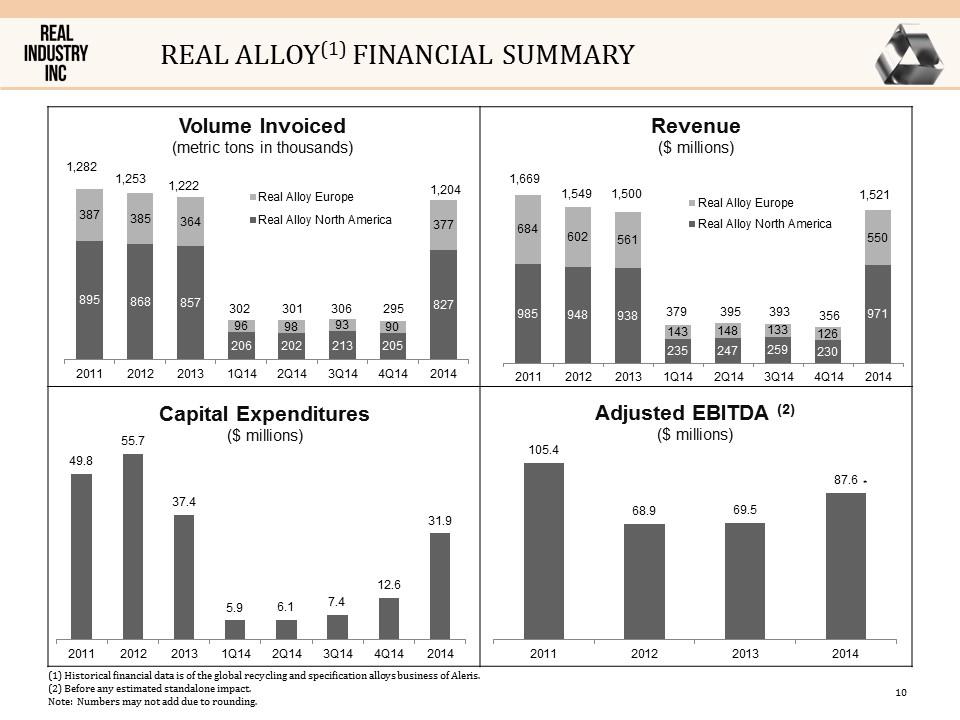
Real alloy(1) FINANCIAL SUMMARY Revenue ($ millions) Volume Invoiced (metric tons in thousands) (1) Historical financial data is of the global recycling and specification alloys business of Aleris. (2) Before any estimated standalone impact. Note: Numbers may not add due to rounding. *
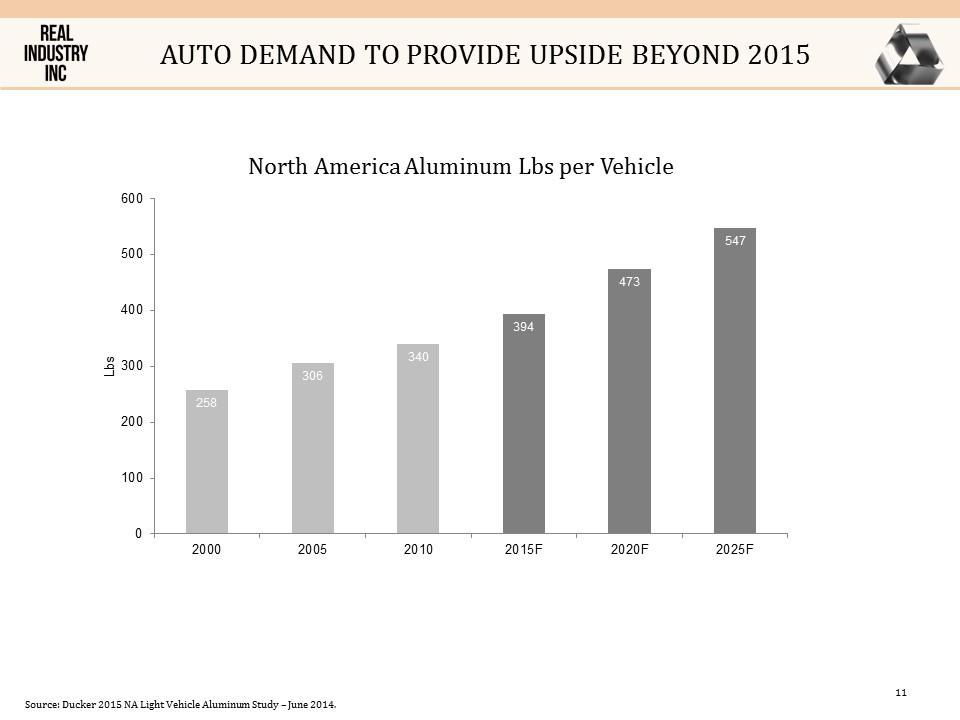
Auto demand to provide upside beyond 2015 Source: Ducker 2015 NA Light Vehicle Aluminum Study – June 2014.
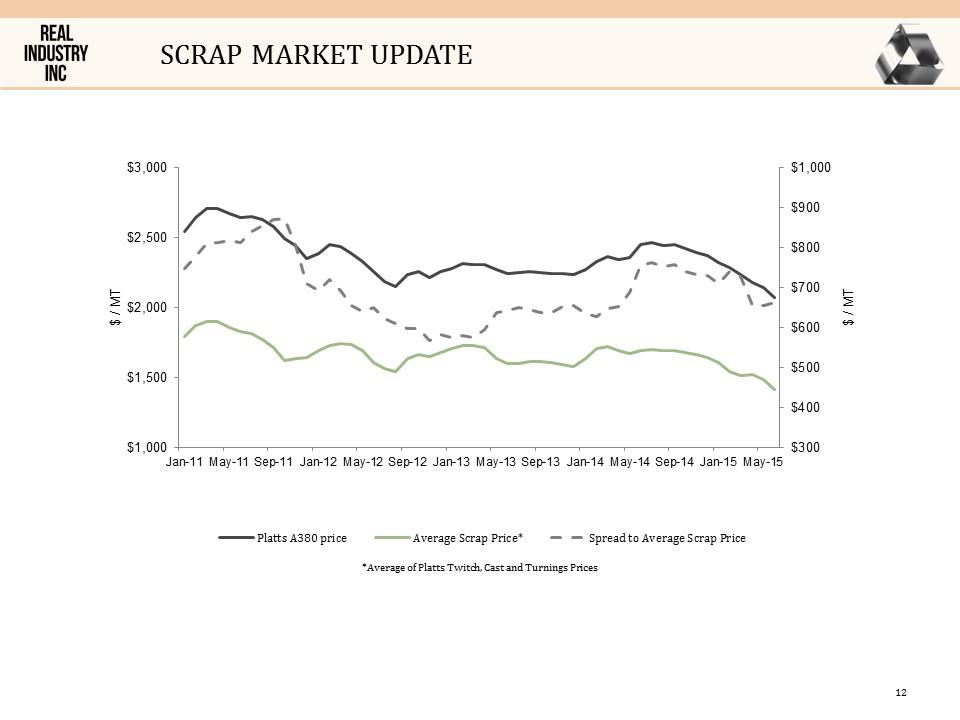
Scrap market update *Average of Platts Twitch, Cast and Turnings Prices
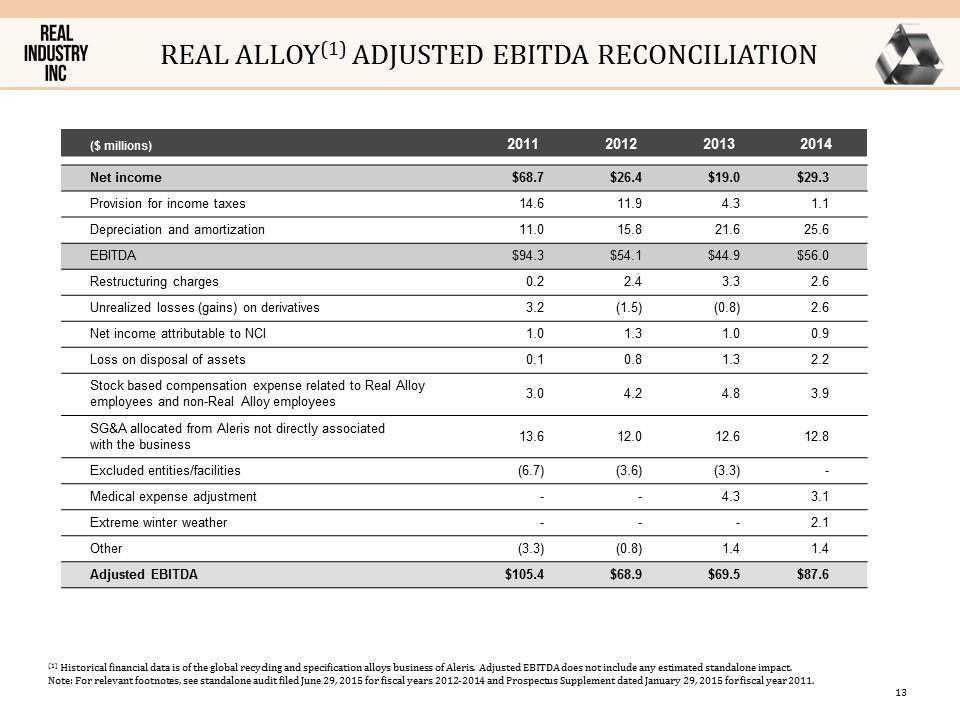
Real alloy(1) ADJUSTED EBITDA RECONCILIATION ($ millions) 2011 2012 2013 2014 Net income $68.7 $26.4 $19.0 $29.3 Provision for income taxes 14.6 11.9 4.3 1.1 Depreciation and amortization 11.0 15.8 21.6 25.6 EBITDA $94.3 $54.1 $44.9 $56.0 Restructuring charges 0.2 2.4 3.3 2.6 Unrealized losses (gains) on derivatives 3.2 (1.5) (0.8) 2.6 Net income attributable to NCI 1.0 1.3 1.0 0.9 Loss on disposal of assets 0.1 0.8 1.3 2.2 Stock based compensation expense related to Real Alloy employees and non-Real Alloy employees 3.0 4.2 4.8 3.9 SG&A allocated from Aleris not directly associated with the business 13.6 12.0 12.6 12.8 Excluded entities/facilities (6.7) (3.6) (3.3) - Medical expense adjustment - - 4.3 3.1 Extreme winter weather - - - 2.1 Other (3.3) (0.8) 1.4 1.4 Adjusted EBITDA $105.4 $68.9 $69.5 $87.6 (1) Historical financial data is of the global recycling and specification alloys business of Aleris. Adjusted EBITDA does not include any estimated standalone impact. Note: For relevant footnotes, see standalone audit filed June 29, 2015 for fiscal years 2012-2014 and Prospectus Supplement dated January 29, 2015 for fiscal year 2011.
appendix
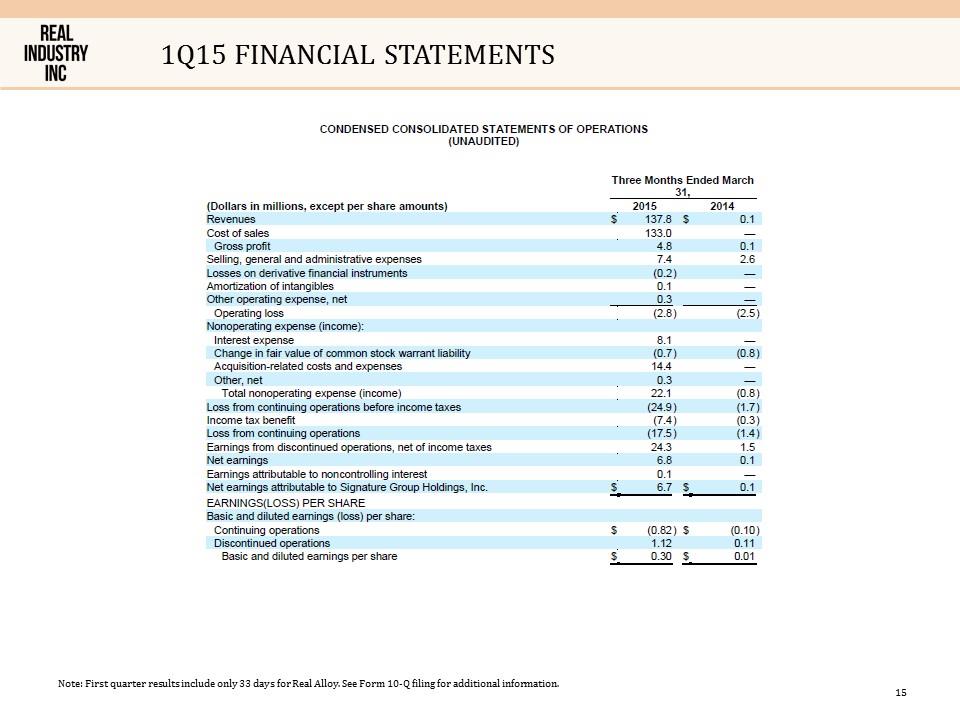
1q15 financial statements Note: First quarter results include only 33 days for Real Alloy. See Form 10-Q filing for additional information.
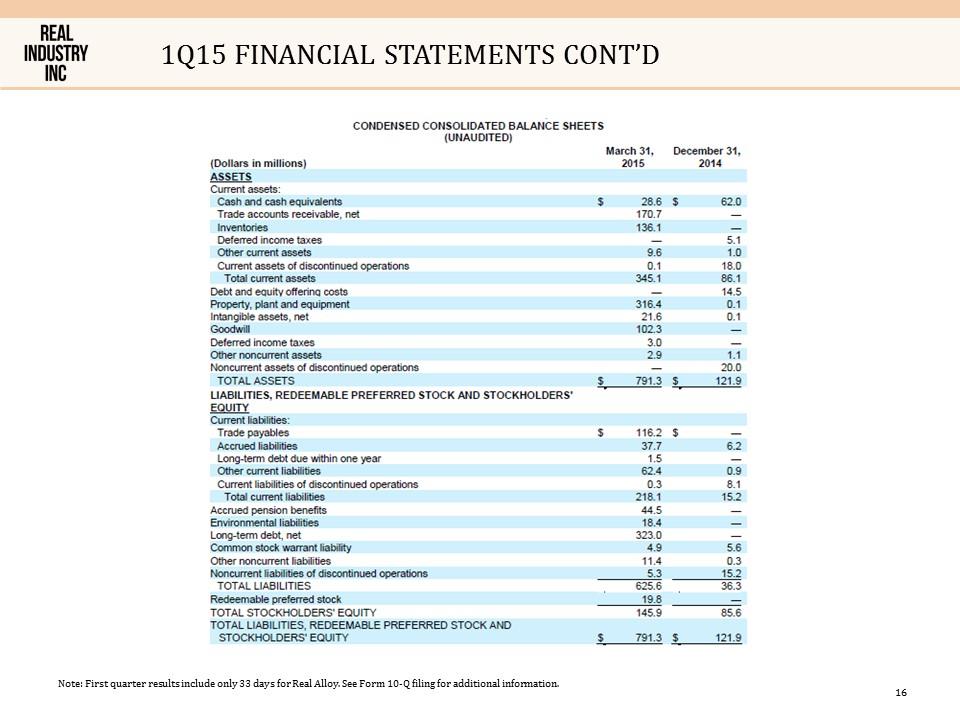
1q15 financial statements cont’d Note: First quarter results include only 33 days for Real Alloy. See Form 10-Q filing for additional information.
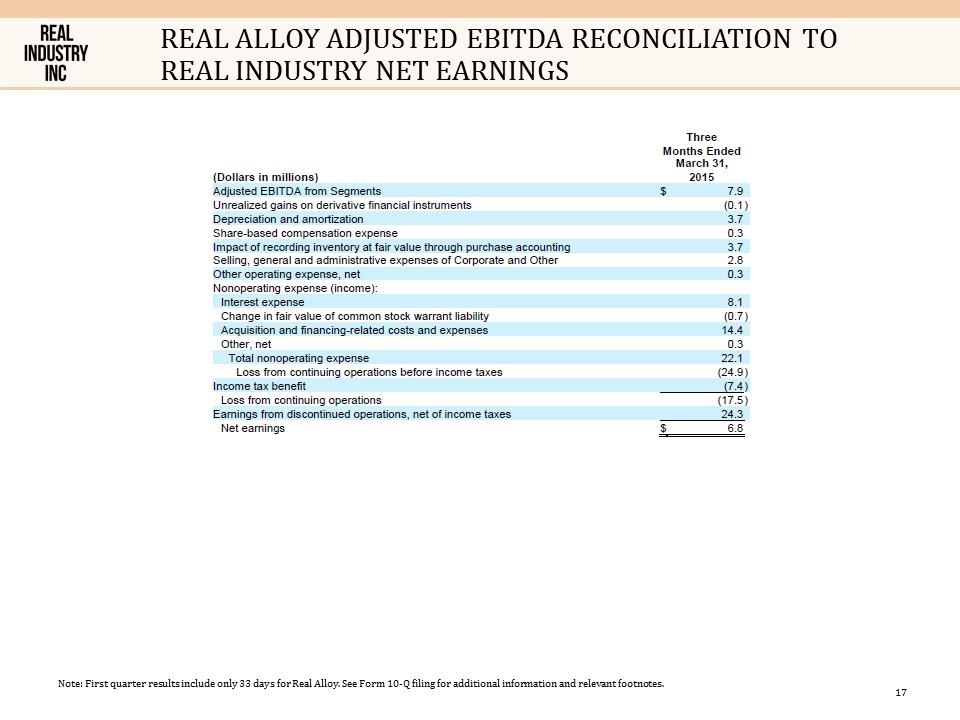
Real alloy adjusted ebitda reconciliation to real industry net earnings Note: First quarter results include only 33 days for Real Alloy. See Form 10-Q filing for additional information and relevant footnotes.
