Attached files
| file | filename |
|---|---|
| 8-K - FORM 8-K - Element Solutions Inc | eh1500971_8k.htm |
| EX-99.1 - EXHIBIT 99.1 - Element Solutions Inc | eh1500971_ex9901.htm |
| EX-2.1 - EXHIBIT 2.1 - Element Solutions Inc | eh1500971_ex0201.htm |
| EX-99.3 - EXHIBIT 99.3 - Element Solutions Inc | eh1500971_ex9903.htm |
| EX-10.1 - EXHIBIT 10.1 - Element Solutions Inc | eh1500971_ex1001.htm |
| EX-99.2 - EXHIBIT 99.2 - Element Solutions Inc | eh1500971_ex9902.htm |
| EX-2.2 - EXHIBIT 2.2 - Element Solutions Inc | eh1500971_ex0202.htm |
EXHIBIT 99.4
Proposed Acquisition of Alent plc Investor Presentation July 13, 2015
R: 000 G : 050 B: 128 R: 066 G: 094 B: 133 R: 113 G: 144 B: 185 R: 154 G: 179 B: 213 R: 233 G: 231 B: 229 R: 211 G: 207 B: 203 R: 000 G: 025 B: 064 R: 211 G: 207 B: 203 R: 243 G: 243 B: 243 Table column Table highlight 1 Please note that this presentation is intended to qualify for the safe harbor from liability established by the Private Secur iti es Litigation Reform Act of 1995. In this presentation, we discuss events or results that have not yet occurred or been realized, commonly referred to as “forward - looking statements” within the meaning of the federal securities laws, including statements regarding the impact of the acquisitions by Platform Specialty Products Corporation (“Platform”) of Percival S.A, including its agrochemical business, Agriphar (“ Agriphar ”), the Chemtura AgroSolutions business of Chemtura Corporation (“ Chemtura AgroSolutions ” or “CAS ”), Arysta LifeScience Limited. (“ Arysta ”), as well as the proposed acquisition by Platform of the Electronic Chemicals and Photomasks businesses (the “EC and PM businesses”) of OM Group, Inc. (the “OMG Acquisition”) and the proposed offer by Platform to acquire the entire issued and to be issued share capital of Alent ( the “ Alent Acquisition”) on the business and financial results of Platform, including sales, adjusted EBITDA, capital expenditures, cash flows, earnings per share, expected or estimated revenue, the outlook for Platform’s markets and the demand for its products, estimated sales, segment e arn ings, net interest expense, income tax provision, restructuring and other charges, cash flows from operations, consistent profitable growth, free cash fl ow, future revenues and gross operating and adjusted EBITDA margin improvement requirement and expansion, organic net sales growth, bank debt covenants, the success of new product introductions, growth in costs and expenses, the impact of commodities and currencies and Platform’s ability to manage its risk in these are as, Platform’s ability to raise new debt or equity and to consummate acquisitions, estimated synergies in Platform’s new combined agrochemical businesses, and relating to the OMG Acquisition or Alent Acquisition, and the impact in general of acquisitions, divestitures, restructurings, and other unusual items, including Platform's abilit y t o successfully integrate and obtain the anticipated results and synergies from its consummated and future acquisitions. These statements are based on management's estimates and assumptions with respect to future events and financial performance and are believed to be reasonable, though are inherently uncertain and difficult to predict. Actual results could differ materially from those proje cte d as a result of certain factors. A discussion of factors that could cause results to vary is included in Platform’s registration statement filed with the Securities and Exchange Commission (the “SEC”) on June 17, 2015, as amended, and periodic and other reports filed by Platform with the SEC, including under the heading “Risk Factors” in Platform’s Annual Report on Form 10 - K for the fiscal year ended December 31, 2014. Platform undertakes no obligation to update any forward - looking statement, whether as a result of new information, future events or otherwise. This presentation also contains non - GAAP financial measures that may not be directly comparable to other similarly titled measur es used by other companies, including EBITDA and adjusted EBITDA. For purposes of Regulation G, a non - GAAP financial measure is a numerical measure of a company’s historical or future financial performance, financial position or cash flows that excludes amounts, or is subject to adjustments that have the eff ect of excluding amounts, that are included in the most directly comparable measure calculated and presented in accordance with GAAP in the statements of operat ion s, balance sheets, or statements of cash flows of such company; or includes amounts, or is subject to adjustments that have the effect of including am ounts, that are excluded from the most directly comparable measure so calculated and presented. Pursuant to the requirements of Regulation G, Platform has prov ide d reconciliations of the non - GAAP financial measures to the most directly comparable GAAP financial measures in the Appendix of this presentation. These n on - GAAP measures are provided because management of Platform uses these financial measures in monitoring and evaluating Platform’s ongoing financial result s a nd trends. Management uses this non - GAAP information as an indicator of business performance, and evaluates overall management with respect to such indicat ors. These non - GAAP measures should be considered in addition to, but not as a substitute for, measures of financial performance prepared in acco rda nce with GAAP. Historical financial information relating to Agriphar was obtained directly from Percival S.A., its privately - held former parent company. Although we believe it is reliable, this information has not been verified, internally or independently. Historical financial information relating to Chemtura AgroSolutions was derived from segment reporting in Chemtura Corporation’s periodic reports and earnings press releases. Financial information for Arysta was derived from Arysta’s registration statement on Form F - 1 filed with the SEC on September 9, 2014, which was withdrawn since Platform’s acquisition of Arysta and should not be relied upon, and from Arysta’s management . Historical financial information related to the EC and PM businesses of OM Group, Inc. was derived from OM Group, Inc.’s management estimates. T he EC and PM businesses’ method of calculating their Adjusted EBITDA differs from Platform’s method of calculating Adjusted E BIT DA. Historical financial information for Alent was derived from Alent’s periodic reports and management estimates. Alent’s method of calculating its Adjusted EBITDA also differs from Platform’s method. In addition, Alent’s financial information is prepared in accordance with non - GAAP that may or may not be comparable to Platform’s financial statements. Consequently, there is no assurance that the financial results and information for Agriphar , Chemtura AgroSolutions , Arysta, the EC and PM businesses, or Alent contained in this presentation are accurate or complete, or representative in any way of Platform’s actual and future results as a consolidated company. Safe Harbor
R: 000 G : 050 B: 128 R: 066 G: 094 B: 133 R: 113 G: 144 B: 185 R: 154 G: 179 B: 213 R: 233 G: 231 B: 229 R: 211 G: 207 B: 203 R: 000 G: 025 B: 064 R: 211 G: 207 B: 203 R: 243 G: 243 B: 243 Table column Table highlight 2 No Offer or Solicitation This presentation is for information purposes only and is not intended to, and does not, constitute or form part of any offer or invitation, or the solicitation of an offer, to purchase, otherwise acquire, subscribe for, sell or otherwise dispose of, any securities or the solicitation of any vote o r a pproval in any jurisdiction pursuant to the transaction or otherwise. The transaction will be implemented solely pursuant to the terms of a scheme document, which wi ll contain the full terms and conditions of the transaction, including details of how to vote in respect of the transaction. Any vote or other action in re spe ct of the transaction should be made only on the basis of the information in the scheme document. Important Additional Information The shares of common stock of Platform to be issued under the transaction (“New Platform Shares”) have not been and are not e xpe cted to be registered under the Securities Act of 1933, as amended (the “Act”) or under the securities laws of any state or other jurisdiction of the Uni ted States. It is expected that the New Platform Shares will be issued in reliance upon an exemption from the registration requirements of the Act, set forth in Sect ion 3(a)(10) thereof. Shareholders of Alent ( whether or not US persons) who are or will be affiliates (within the meaning of the Act) of Platform or Alent prior to, or of Platform after, the effective date will be subject to certain US transfer restrictions relating to the New Platform Shares received pursuant to the scheme of arrange men t. Platform reserves the right, subject to the prior consent of the U.K. Panel on Takeovers and Mergers and the terms of the Co - ope ration Agreement dated July 13, 2015, to elect to implement the transaction by way of a takeover offer (as such term is defined in the U.K. Companies Act 200 6). Any securities to be issued in connection with such transaction may be issued in reliance on an exemption from the registration requirements of, or, alterna tiv ely, registered under the Act. If, in the future, Platform exercises its right to implement the transaction by way of a takeover offer in which New Platform Shares ar e to be issued in a manner that is not exempt from the registration requirements of the Act, Platform will file a registration statement with the SEC that will con tain a prospectus with respect to the issuance of New Platform Shares. In this event, shareholders of Alent are urged to read these documents and any other relevant documents filed with the SEC, as well as any amendments or supplements to those documents, because they will contain important information, and such documents wi ll be available free of charge at the SEC’s website at http://www.sec.gov or by contacting Platform’s Investor Relations department in writing at 1450 Centrepark Boulevard, Suite 210, West Palm Beach, Florida 33401 . None of the securities referred to in this presentation have been approved or disapproved by the SEC, any state securities commiss ion in the United States or any other US regulatory authority, nor have such authorities passed upon or determined the adequacy or accuracy of the informatio n c ontained in this presentation. Any representation to the contrary is a criminal offence in the United States. No profit forecast or estimates No statement contained herein (including any statement of estimated synergies) is intended as a profit forecast or estimate f or any period and no statement contained herein should be interpreted to mean that earnings per Platform’s share for the current or future financial years w oul d necessarily match or exceed the historical published earnings per Platform’s share . Important Information
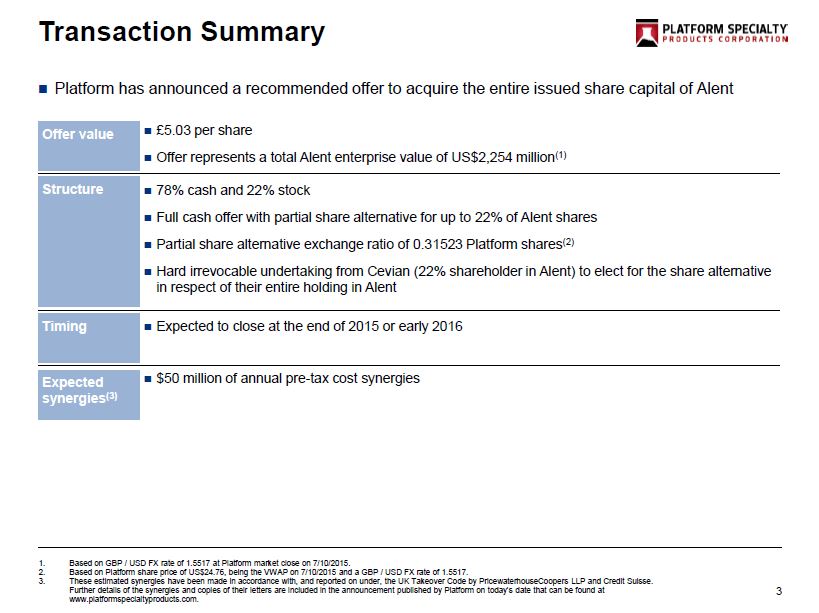
R: 000 G : 050 B: 128 R: 066 G: 094 B: 133 R: 113 G: 144 B: 185 R: 154 G: 179 B: 213 R: 233 G: 231 B: 229 R: 211 G: 207 B: 203 R: 000 G: 025 B: 064 R: 211 G: 207 B: 203 R: 243 G: 243 B: 243 Table column Table highlight 3 Transaction Summary Structure Other terms £5.03 per share Offer represents a total Alent enterprise value of US$2,254 million (1) 78% cash and 22% stock Full cash offer with partial share alternative for up to 22% of Alent shares Partial share alternative exchange ratio of 0.31523 Platform shares (2) Hard irrevocable undertaking from Cevian ( 22% shareholder in Alent ) to elect for the share alternative in respect of their entire holding in Alent Expected to close at the end of 2015 or early 2016 Offer value Structure Timing Platform has announced a recommended offer to acquire the entire issued share capital of Alent $50 million of annual pre - tax cost synergies Expected synergies (3) 1. Based on GBP / USD FX rate of 1.5517 at Platform market close on 7/10/2015. 2. Based on Platform share price of US$24.76, being the VWAP on 7/10/2015 and a GBP / USD FX rate of 1.5517. 3. These estimated synergies have been made in accordance with, and reported on under, the UK Takeover Code by PricewaterhouseCo op ers LLP and Credit Suisse. Further details of the synergies and copies of their letters are included in the announcement published by Platform on today’ s d ate that can be found at www.platformspecialtyproducts.com.
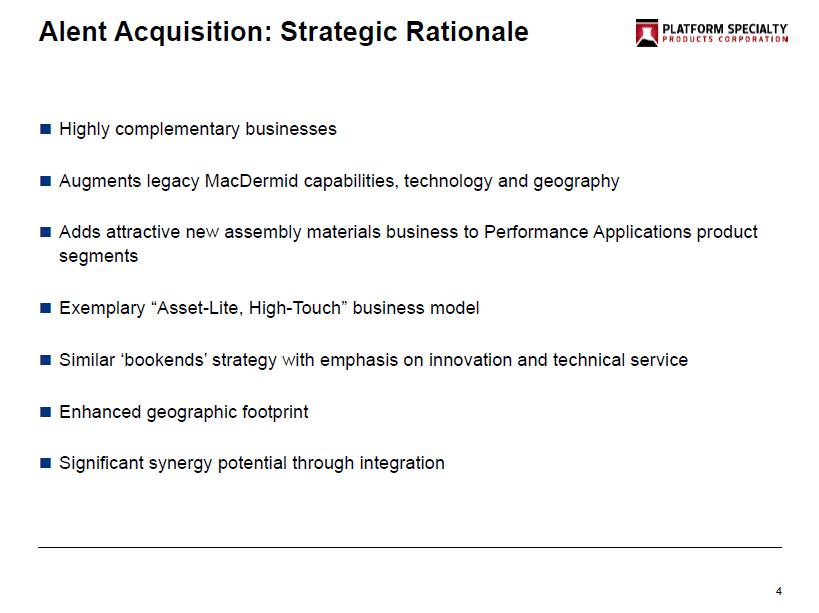
R: 000 G : 050 B: 128 R: 066 G: 094 B: 133 R: 113 G: 144 B: 185 R: 154 G: 179 B: 213 R: 233 G: 231 B: 229 R: 211 G: 207 B: 203 R: 000 G: 025 B: 064 R: 211 G: 207 B: 203 R: 243 G: 243 B: 243 Table column Table highlight 4 Alent Acquisition: Strategic Rationale Highly complementary businesses Augments legacy MacDermid capabilities, technology and geography Adds attractive new assembly materials business to Performance Applications product segments Exemplary “Asset - Lite , High - Touch” business model Similar ‘bookends’ strategy with emphasis on innovation and technical service Enhanced geographic footprint Significant synergy potential through integration
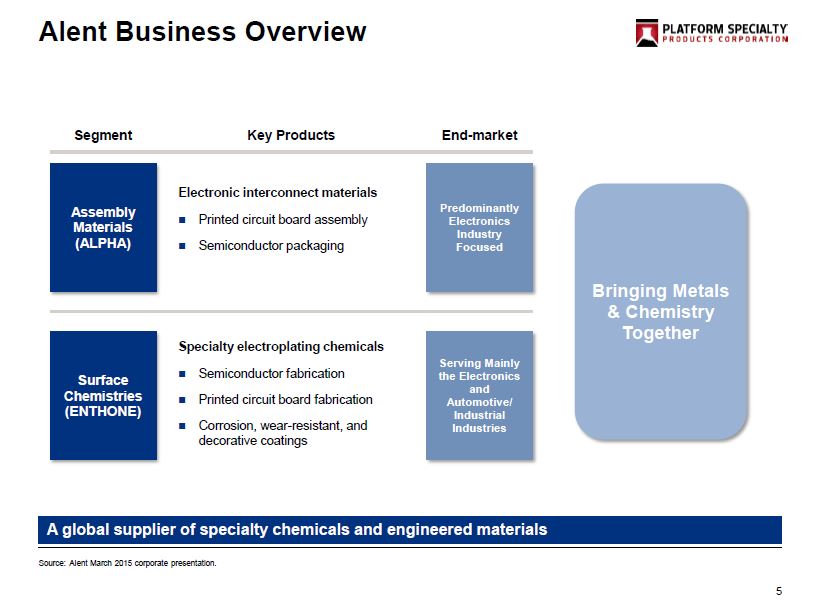
R: 000 G : 050 B: 128 R: 066 G: 094 B: 133 R: 113 G: 144 B: 185 R: 154 G: 179 B: 213 R: 233 G: 231 B: 229 R: 211 G: 207 B: 203 R: 000 G: 025 B: 064 R: 211 G: 207 B: 203 R: 243 G: 243 B: 243 Table column Table highlight 5 Alent Business Overview Key Products Segment End - market Electronic interconnect materials Printed circuit board assembly Semiconductor packaging Assembly Materials (ALPHA) Surface Chemistries (ENTHONE) Specialty electroplating chemicals Semiconductor fabrication Printed circuit board fabrication Corrosion, wear - resistant, and decorative coatings Predominantly Electronics Industry Focused Serving Mainly the Electronics and Automotive/ Industrial Industries Bringing Metals & Chemistry Together A global supplier of specialty chemicals and engineered materials Source: Alent March 2015 corporate presentation.
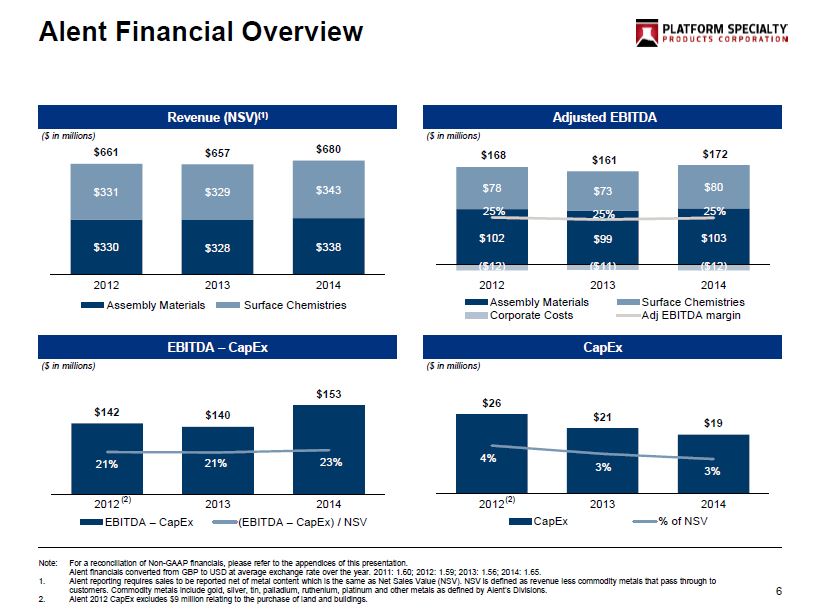
R: 000 G : 050 B: 128 R: 066 G: 094 B: 133 R: 113 G: 144 B: 185 R: 154 G: 179 B: 213 R: 233 G: 231 B: 229 R: 211 G: 207 B: 203 R: 000 G: 025 B: 064 R: 211 G: 207 B: 203 R: 243 G: 243 B: 243 Table column Table highlight 6 Alent Financial Overview Revenue (NSV) (1) Adjusted EBITDA EBITDA – CapEx CapEx Note: For a reconciliation of Non - GAAP financials, please refer to the appendices of this presentation. Alent financials converted from GBP to USD at average exchange rate over the year. 2011: 1.60; 2012: 1.59; 2013: 1.56; 2014: 1.65. 1 . Alent reporting requires sales to be reported net of metal content which is the same as Net Sales Value (NSV). NSV is defined as re ven ue less commodity metals that pass through to customers. Commodity metals include gold, silver, tin, palladium, ruthenium, platinum and other metals as defined by Alent’s Divisions . 2. Alent 2012 CapEx excludes $9 million relating to the purchase of land and buildings. $330 $328 $338 $331 $329 $343 $661 $657 $680 2012 2013 2014 $142 $140 $153 21% 21% 23% 2012 2013 2014 EBITDA – CapEx (EBITDA – CapEx) / NSV $26 $21 $19 4% 3% 3% 2012 2013 2014 CapEx % of NSV $102 $99 $103 $78 $73 $80 ($12) ($11) ($12) $168 $161 $172 25% 25% 25% 2012 2013 2014 Assembly Materials Surface Chemistries Corporate Costs Adj EBITDA margin ($ in millions) ($ in millions) ($ in millions) ($ in millions) (2) (2) Assembly Materials Surface Chemistries
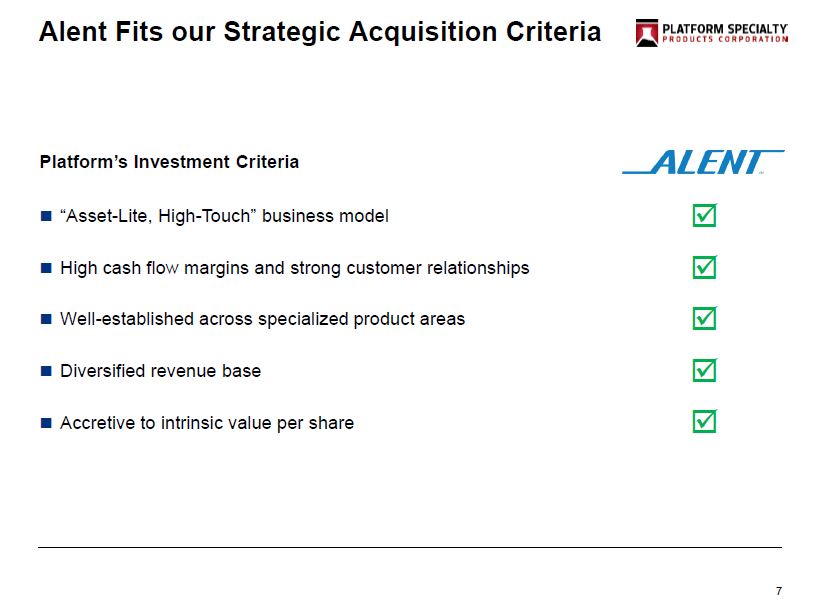
R: 000 G : 050 B: 128 R: 066 G: 094 B: 133 R: 113 G: 144 B: 185 R: 154 G: 179 B: 213 R: 233 G: 231 B: 229 R: 211 G: 207 B: 203 R: 000 G: 025 B: 064 R: 211 G: 207 B: 203 R: 243 G: 243 B: 243 Table column Table highlight 7 Alent Fits our Strategic Acquisition Criteria Platform’s Investment Criteria “Asset - Lite, High - Touch” business model High cash flow margins and strong customer relationships Well - established across specialized product areas Diversified revenue b ase Accretive to intrinsic value per share
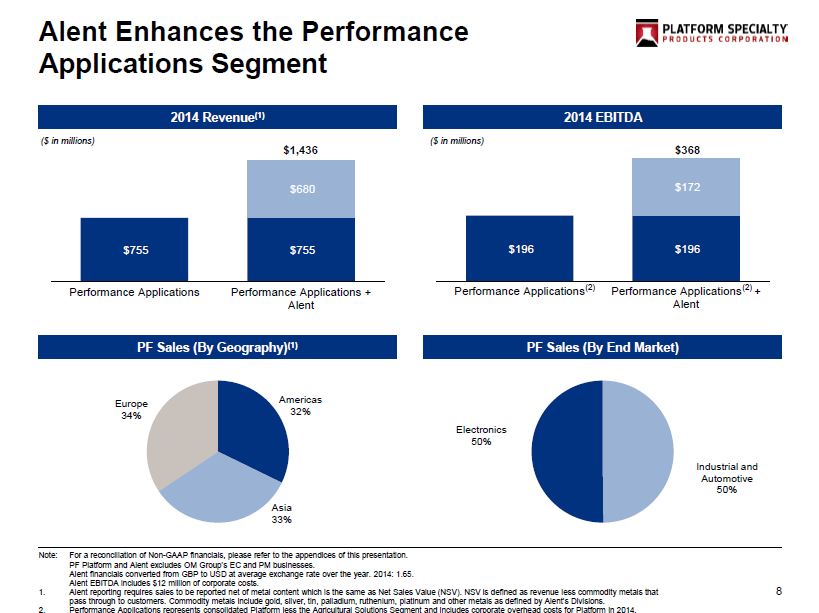
R: 000 G : 050 B: 128 R: 066 G: 094 B: 133 R: 113 G: 144 B: 185 R: 154 G: 179 B: 213 R: 233 G: 231 B: 229 R: 211 G: 207 B: 203 R: 000 G: 025 B: 064 R: 211 G: 207 B: 203 R: 243 G: 243 B: 243 Table column Table highlight $196 $196 $172 $368 Performance Applications Performance Applications + Alent 8 Alent Enhances the Performance Applications Segment Note: For a reconciliation of Non - GAAP financials, please refer to the appendices of this presentation. PF Platform and Alent excludes OM Group’s EC and PM businesses. Alent financials converted from GBP to USD at average exchange rate over the year. 2014: 1.65. Alent EBITDA includes $12 million of corporate costs. 1. Alent reporting requires sales to be reported net of metal content which is the same as Net Sales Value (NSV). NSV is defined as re ven ue less commodity metals that pass through to customers. Commodity metals include gold, silver, tin, palladium, ruthenium, platinum and other metals as def ine d by Alent’s Divisions . 2. Performance Applications represents consolidated Platform less the Agricultural Solutions Segment and includes corporate over head costs for Platform in 2014. 2014 Revenue (1) 2014 EBITDA PF Sales (By E nd Market) PF Sales (By Geography) (1) Americas 32% Asia 33% Europe 34% $755 $755 $680 Performance Applications Performance Applications + Alent ($ in millions) Industrial and Automotive 50% Electronics 50% ($ in millions) $1,436 (2) (2)
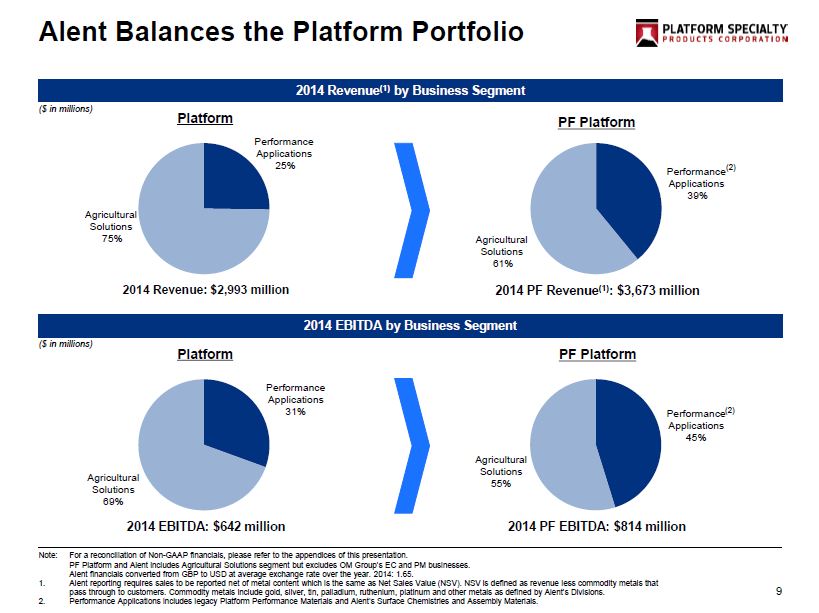
R: 000 G : 050 B: 128 R: 066 G: 094 B: 133 R: 113 G: 144 B: 185 R: 154 G: 179 B: 213 R: 233 G: 231 B: 229 R: 211 G: 207 B: 203 R: 000 G: 025 B: 064 R: 211 G: 207 B: 203 R: 243 G: 243 B: 243 Table column Table highlight Performance Applications 45% Agricultural Solutions 55% Performance Applications 25% Agricultural Solutions 75% Performance Applications 39% Agricultural Solutions 61% 9 Alent Balances the Platform Portfolio Note: For a reconciliation of Non - GAAP financials, please refer to the appendices of this presentation. PF Platform and Alent includes Agricultural Solutions segment but excludes OM Group’s EC and PM businesses. Alent financials converted from GBP to USD at average exchange rate over the year. 2014: 1.65. 1. Alent reporting requires sales to be reported net of metal content which is the same as Net Sales Value (NSV). NSV is defined as re ven ue less commodity metals that pass through to customers. Commodity metals include gold, silver, tin, palladium, ruthenium, platinum and other metals as def ine d by Alent’s Divisions . 2. Performance Applications includes legacy Platform Performance Materials and Alent’s Surface Chemistries and Assembly Materials. 2014 Revenue (1) by Business Segment 2014 EBITDA by Business Segment ($ in millions) ($ in millions) Platform PF Platform Platform PF Platform 2014 Revenue: $2,993 million 2014 EBITDA: $642 million 2014 PF Revenue (1) : $ 3,673 million Performance Applications 31% Agricultural Solutions 69% 2014 PF EBITDA: $814 million (2) (2)
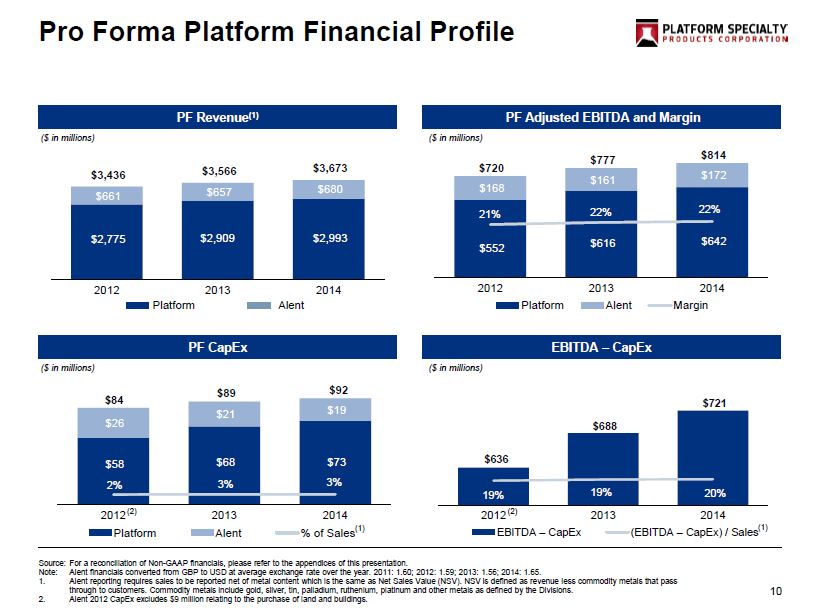
R: 000 G : 050 B: 128 R: 066 G: 094 B: 133 R: 113 G: 144 B: 185 R: 154 G: 179 B: 213 R: 233 G: 231 B: 229 R: 211 G: 207 B: 203 R: 000 G: 025 B: 064 R: 211 G: 207 B: 203 R: 243 G: 243 B: 243 Table column Table highlight $636 $688 $721 19% 19% 20% 2012 2013 2014 EBITDA – CapEx (EBITDA – CapEx) / Sales $ 2,775 $2,909 $2,993 $661 $657 $680 $3,436 $3,566 $3,673 2012 2013 2014 $58 $68 $73 $26 $21 $19 $84 $89 $92 2% 3% 3% 2012 2013 2014 Platform Alent % of Sales 10 Pro Forma Platform Financial Profile Source: For a reconciliation of Non - GAAP financials, please refer to the appendices of this presentation . Note: Alent financials converted from GBP to USD at average exchange rate over the year. 2011: 1.60; 2012 : 1.59 ; 2013 : 1.56 ; 2014 : 1.65 . 1. Alent reporting requires sales to be reported net of metal content which is the same as Net Sales Value (NSV). NSV is defined as re ven ue less commodity metals that pass through to customers. Commodity metals include gold, silver, tin, palladium, ruthenium, platinum and other metals as defined by the Divisions . 2. Alent 2012 CapEx excludes $9 million relating to the purchase of land and buildings. PF Revenue (1) PF Adjusted EBITDA and Margin PF CapEx ($ in millions) ($ in millions) ($ in millions) ($ in millions) EBITDA – CapEx $552 $616 $642 $168 $161 $172 $720 $777 $814 21% 22% 22% 2012 2013 2014 Platform Alent Margin (2) (1 ) (2) (1 ) Platform Alent
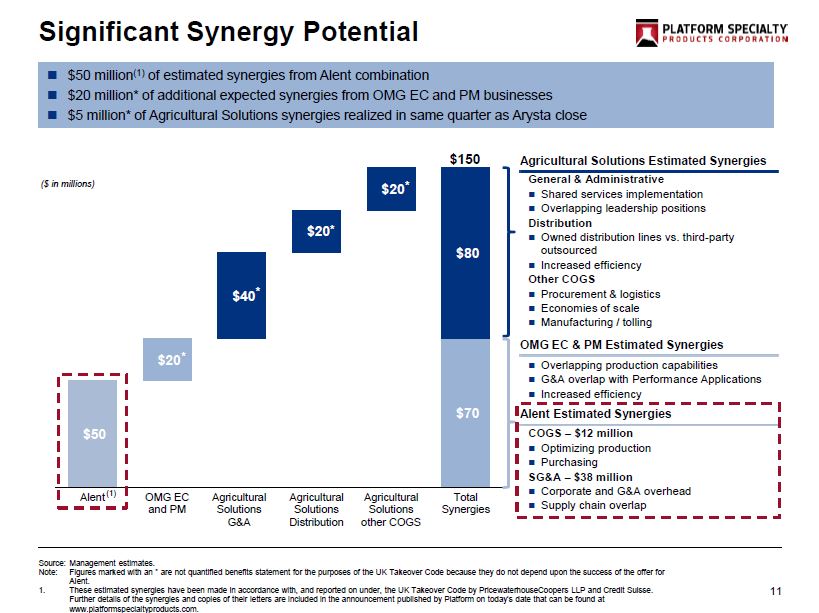
R: 000 G : 050 B: 128 R: 066 G: 094 B: 133 R: 113 G: 144 B: 185 R: 154 G: 179 B: 213 R: 233 G: 231 B: 229 R: 211 G: 207 B: 203 R: 000 G: 025 B: 064 R: 211 G: 207 B: 203 R: 243 G: 243 B: 243 Table column Table highlight $50 $50 $70 $110 $130 $70 $50 $20 $40 $20 $20 $80 Alent OMG EC and PM Agricultural Solutions G&A Agricultural Solutions Distribution Agricultural Solutions other COGS Total Synergies 11 Significant Synergy Potential $ 50 million (1) of estimated synergies from Alent combination $20 million* of additional expected synergies from OMG EC and PM businesses $5 million* of Agricultural Solutions synergies realized in same quarter as Arysta close $150 Overlapping production capabilities G&A overlap with Performance Applications Increased efficiency General & Administrative Shared services implementation Overlapping leadership positions Distribution Owned distribution lines vs. third - party outsourced Increased efficiency Other COGS Procurement & logistics Economies of scale Manufacturing / tolling Agricultural Solutions Estimated Synergies OMG EC & PM Estimated Synergies Source: Management estimates . Note: Figures marked with an * are not quantified benefits statement for the purposes of the UK Takeover Code because they do not depend upon the succe ss of the offer for Alent . 1. These estimated synergies have been made in accordance with, and reported on under, the UK Takeover Code by PricewaterhouseCo op ers LLP and Credit Suisse. Further details of the synergies and copies of their letters are included in the announcement published by Platform on today’s date that can be found at www.platformspecialtyproducts.com. ($ in millions) COGS – $12 million Optimizing production Purchasing SG&A – $38 million Corporate and G&A overhead Supply chain overlap Alent Estimated Synergies (1) * * * *
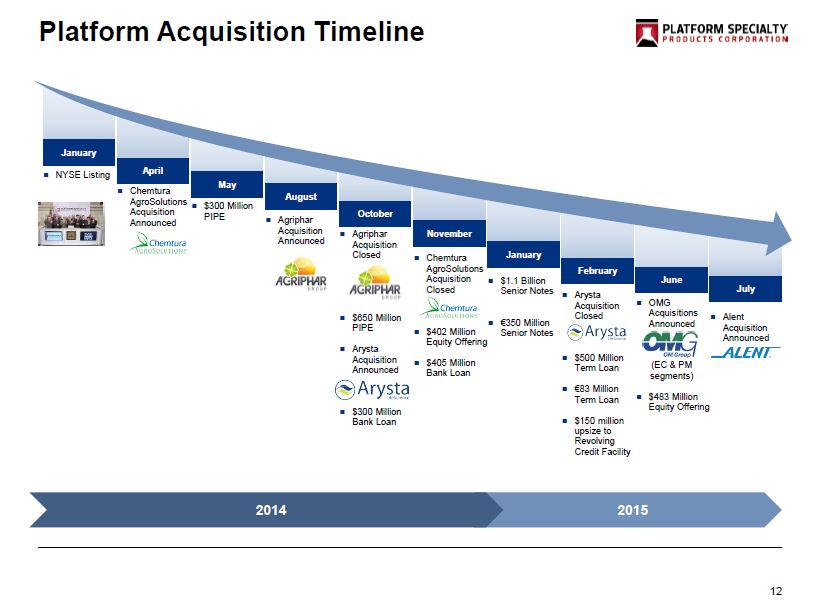
R: 000 G : 050 B: 128 R: 066 G: 094 B: 133 R: 113 G: 144 B: 185 R: 154 G: 179 B: 213 R: 233 G: 231 B: 229 R: 211 G: 207 B: 203 R: 000 G: 025 B: 064 R: 211 G: 207 B: 203 R: 243 G: 243 B: 243 Table column Table highlight 12 Platform Acquisition Timeline January April May August October November January February June NYSE Listing Chemtura AgroSolutions Acquisition Announced $300 Million PIPE Agriphar Acquisition Announced Agriphar Acquisition Closed $650 Million PIPE Arysta Acquisition Announced $300 Million Bank Loan Chemtura AgroSolutions Acquisition Closed $402 Million Equity Offering $405 Million Bank Loan $1.1 Billion Senior Notes € 350 Million Senior Notes Arysta Acquisition Closed $500 Million Term Loan € 83 Million Term Loan $150 million upsize to Revolving Credit Facility OMG Acquisitions Announced $483 Million Equity Offering (EC & PM segments) 2015 July 2014 Alent Acquisition Announced
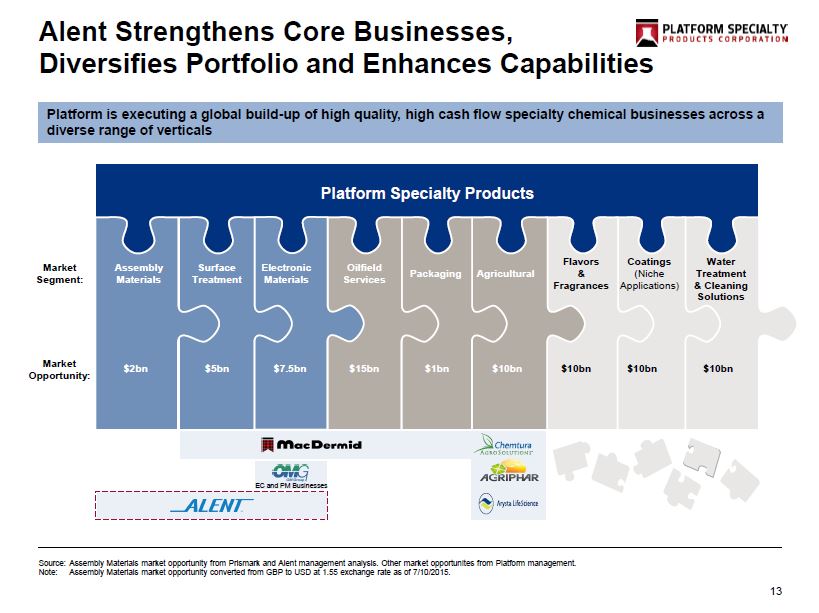
R: 000 G : 050 B: 128 R: 066 G: 094 B: 133 R: 113 G: 144 B: 185 R: 154 G: 179 B: 213 R: 233 G: 231 B: 229 R: 211 G: 207 B: 203 R: 000 G: 025 B: 064 R: 211 G: 207 B: 203 R: 243 G: 243 B: 243 Table column Table highlight 13 Alent Strengthens Core Businesses, Diversifies Portfolio and Enhances Capabilities Platform is executing a global build - up of high quality, high cash flow specialty chemical businesses across a diverse range of verticals Market Segment: Platform Specialty Products Water Treatment & Cleaning Solutions Coatings (Niche Applications ) Flavors & Fragrances Agricultural EC and PM Businesses Source: Assembly Materials market opportunity from Prismark and Alent management analysis. Other market opportunites from Platform management. Note: Assembly Materials market opportunity converted from GBP to USD at 1.55 exchange rate as of 7/10/2015. Packaging Oilfield Services Electronic Materials Surface Treatment Assembly Materials Market Opportunity: $7.5bn $10bn $10bn $ 10bn $10bn $1bn $15bn $5bn $2bn
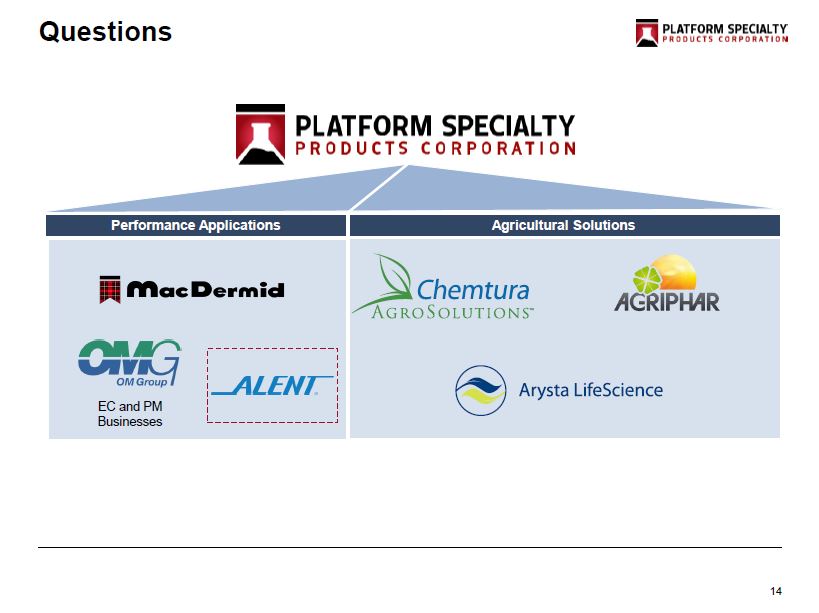
R: 000 G : 050 B: 128 R: 066 G: 094 B: 133 R: 113 G: 144 B: 185 R: 154 G: 179 B: 213 R: 233 G: 231 B: 229 R: 211 G: 207 B: 203 R: 000 G: 025 B: 064 R: 211 G: 207 B: 203 R: 243 G: 243 B: 243 Table column Table highlight 14 Questions Agricultural Solutions Performance Applications EC and PM Businesses
Appendix 15
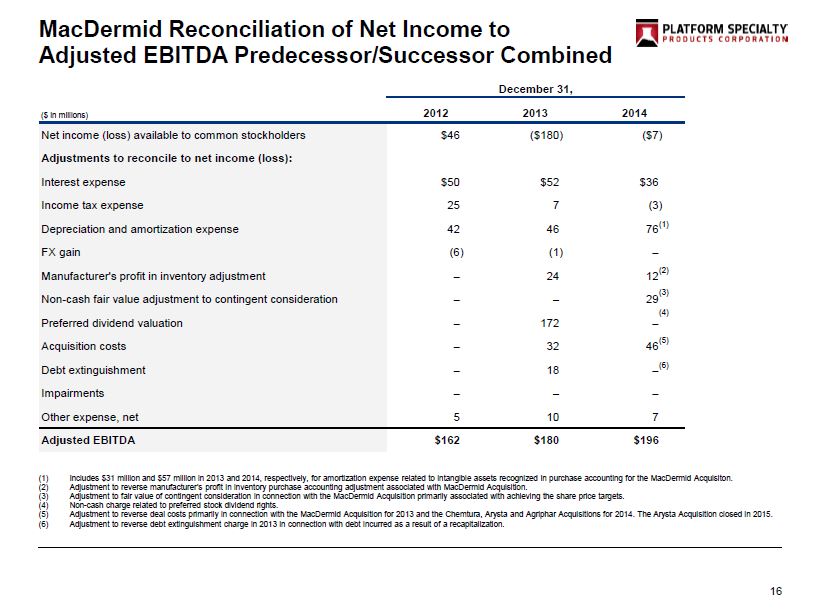
R: 000 G : 050 B: 128 R: 066 G: 094 B: 133 R: 113 G: 144 B: 185 R: 154 G: 179 B: 213 R: 233 G: 231 B: 229 R: 211 G: 207 B: 203 R: 000 G: 025 B: 064 R: 211 G: 207 B: 203 R: 243 G: 243 B: 243 Table column Table highlight 16 MacDermid Reconciliation of Net Income to Adjusted EBITDA Predecessor/Successor Combined December 31, 2012 2013 2014 Net income (loss) available to common stockholders $46 ($180) ($7) Adjustments to reconcile to net income (loss): Interest expense $50 $52 $36 Income tax expense 25 7 (3) Depreciation and amortization expense 42 46 76 FX gain (6) (1) – Manufacturer's profit in inventory adjustment – 24 12 Non-cash fair value adjustment to contingent consideration – – 29 Preferred dividend valuation – 172 – Acquisition costs – 32 46 Debt extinguishment – 18 – Impairments – – – Other expense, net 5 10 7 Adjusted EBITDA $162 $180 $196 (1) Includes $31 million and $57 million in 2013 and 2014, respectively, for amortization expense related to intangible assets recognized in purchase acco unt ing for the MacDermid Acquisiton . (2) Adjustment to reverse manufacturer's profit in inventory purchase accounting adjustment associated with MacDermid Acquisition. (3) Adjustment to fair value of contingent consideration in connection with the MacDermid Acquisition primarily associated with achieving the share price targets. (4) Non - cash charge related to preferred stock dividend rights. (5) Adjustment to reverse deal costs primarily in connection with the MacDermid Acquisition for 2013 and the Chemtura , Arysta and Agriphar Acquisitions for 2014 . The Arysta Acquisition closed in 2015. (6) Adjustment to reverse debt extinguishment charge in 2013 in connection with debt incurred as a result of a recapitalization. (1) (2) (3) (4) (5) (6) ($ in millions)
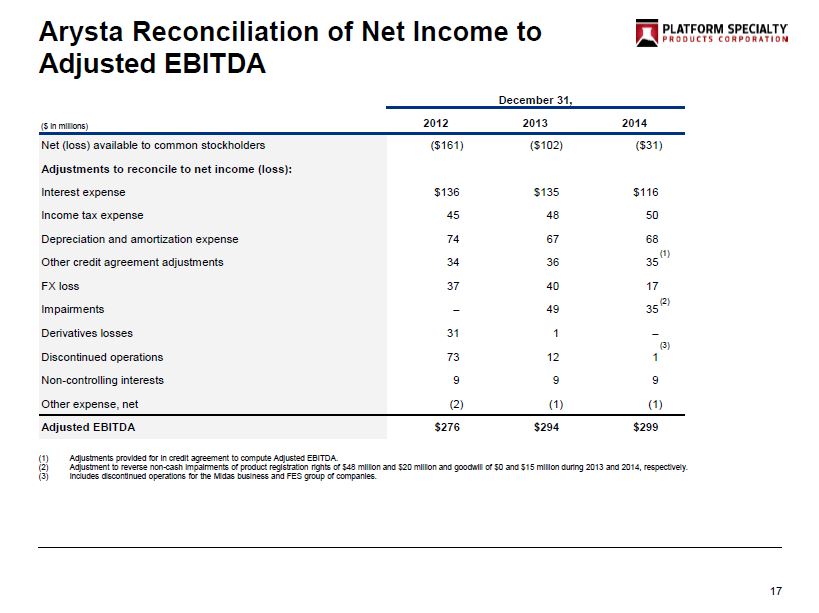
R: 000 G : 050 B: 128 R: 066 G: 094 B: 133 R: 113 G: 144 B: 185 R: 154 G: 179 B: 213 R: 233 G: 231 B: 229 R: 211 G: 207 B: 203 R: 000 G: 025 B: 064 R: 211 G: 207 B: 203 R: 243 G: 243 B: 243 Table column Table highlight December 31, 2012 2013 2014 Net (loss) available to common stockholders ($161) ($102) ($31) Adjustments to reconcile to net income (loss): Interest expense $136 $135 $116 Income tax expense 45 48 50 Depreciation and amortization expense 74 67 68 Other credit agreement adjustments 34 36 35 FX loss 37 40 17 Impairments – 49 35 Derivatives losses 31 1 – Discontinued operations 73 12 1 Non-controlling interests 9 9 9 Other expense, net (2) (1) (1) Adjusted EBITDA $276 $294 $299 17 Arysta Reconciliation of Net Income to Adjusted EBITDA (1) Adjustments provided for in credit agreement to compute Adjusted EBITDA. (2) Adjustment to reverse non - cash impairments of product registration rights of $48 million and $20 million and goodwill of $ 0 and $15 million during 2013 and 2014, respectively. (3) Includes discontinued operations for the Midas business and FES group of companies. (1) (2) (3) ($ in millions)
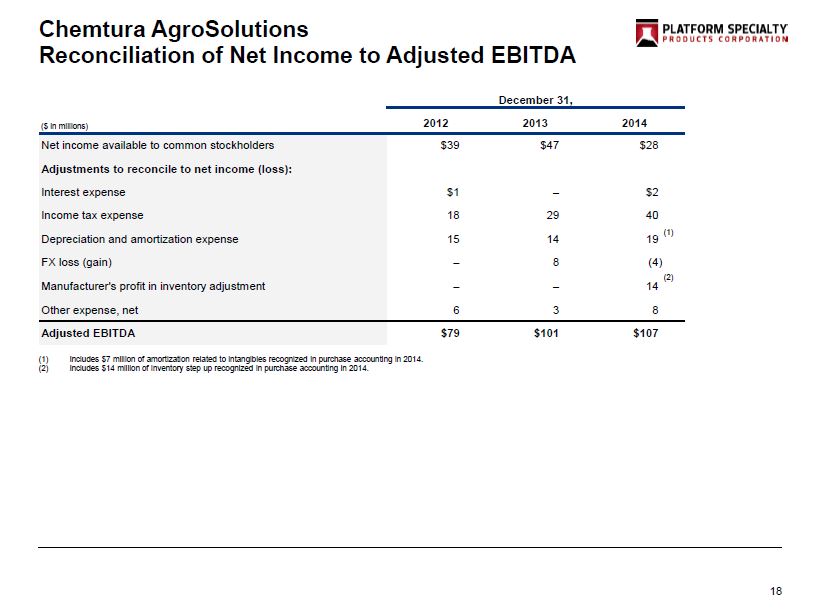
R: 000 G : 050 B: 128 R: 066 G: 094 B: 133 R: 113 G: 144 B: 185 R: 154 G: 179 B: 213 R: 233 G: 231 B: 229 R: 211 G: 207 B: 203 R: 000 G: 025 B: 064 R: 211 G: 207 B: 203 R: 243 G: 243 B: 243 Table column Table highlight 18 Chemtura AgroSolutions Reconciliation of Net Income to Adjusted EBITDA December 31, 2012 2013 2014 Net income available to common stockholders $39 $47 $28 Adjustments to reconcile to net income (loss): Interest expense $1 – $2 Income tax expense 18 29 40 Depreciation and amortization expense 15 14 19 FX loss (gain) – 8 (4) Manufacturer's profit in inventory adjustment – – 14 Other expense, net 6 3 8 Adjusted EBITDA $79 $101 $107 (1) Includes $7 million of amortization related to intangibles recognized in purchase accounting in 2014. (2) Includes $14 million of inventory step up recognized in purchase accounting in 2014. (1) (2) ($ in millions)
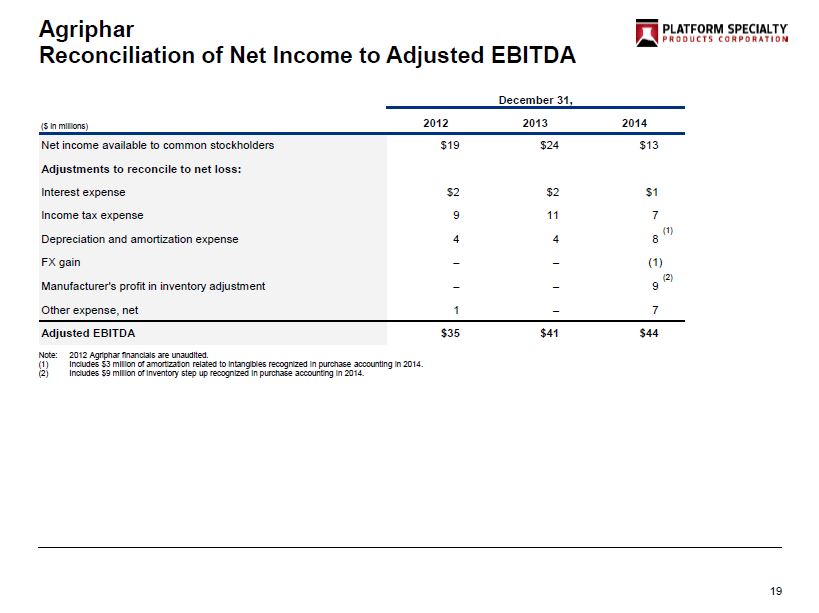
R: 000 G : 050 B: 128 R: 066 G: 094 B: 133 R: 113 G: 144 B: 185 R: 154 G: 179 B: 213 R: 233 G: 231 B: 229 R: 211 G: 207 B: 203 R: 000 G: 025 B: 064 R: 211 G: 207 B: 203 R: 243 G: 243 B: 243 Table column Table highlight 19 Agriphar Reconciliation of Net Income to Adjusted EBITDA December 31, 2012 2013 2014 Net income available to common stockholders $19 $24 $13 Adjustments to reconcile to net loss: Interest expense $2 $2 $1 Income tax expense 9 11 7 Depreciation and amortization expense 4 4 8 FX gain – – (1) Manufacturer's profit in inventory adjustment – – 9 Other expense, net 1 – 7 Adjusted EBITDA $35 $41 $44 (1) (2) ($ in millions) Note: 2012 Agriphar financials are unaudited. ( 1) Includes $3 million of amortization related to intangibles recognized in purchase accounting in 2014 . (2) Includes $9 million of inventory step up recognized in purchase accounting in 2014.
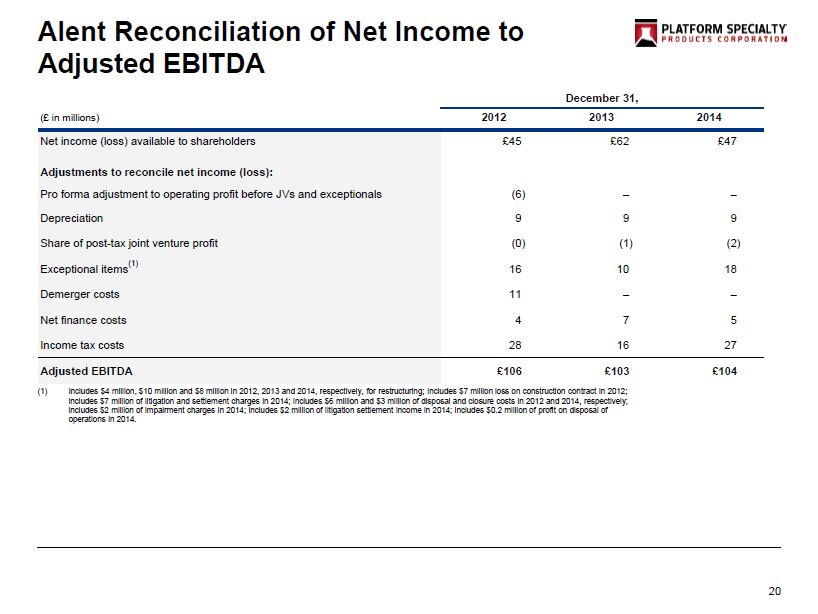
R: 000 G : 050 B: 128 R: 066 G: 094 B: 133 R: 113 G: 144 B: 185 R: 154 G: 179 B: 213 R: 233 G: 231 B: 229 R: 211 G: 207 B: 203 R: 000 G: 025 B: 064 R: 211 G: 207 B: 203 R: 243 G: 243 B: 243 Table column Table highlight December 31, (£ in millions) 2012 2013 2014 Net income (loss) available to shareholders £45 £62 £47 Adjustments to reconcile net income (loss): Pro forma adjustment to operating profit before JVs and exceptionals (6) – – Depreciation 9 9 9 Share of post-tax joint venture profit (0) (1) (2) Exceptional items 16 10 18 Demerger costs 11 – – Net finance costs 4 7 5 Income tax costs 28 16 27 Adjusted EBITDA £106 £103 £104 20 Alent Reconciliation of Net Income to Adjusted EBITDA (1) (1) Includes $4 million, $10 million and $8 million in 2012, 2013 and 2014, respectively, for restructuring; includes $7 million loss on construction contract in 2012; includes $ 7 million of litigation and settlement charges in 2014; includes $6 million and $3 million of disposal and closure costs in 2012 and 2014, respectively; includes $ 2 million of impairment charges in 2014; includes $ 2 million of litigation settlement income in 2014; includes $ 0.2 million of profit on disposal of operations in 2014.