Attached files
| file | filename |
|---|---|
| EX-31.1 - EX-31.1 - SCHOOL SPECIALTY INC | d941702dex311.htm |
| EX-31.2 - EX-31.2 - SCHOOL SPECIALTY INC | d941702dex312.htm |
| EX-99.1 - EX-99.1 - SCHOOL SPECIALTY INC | d941702dex991.htm |
| EX-32.2 - EX-32.2 - SCHOOL SPECIALTY INC | d941702dex322.htm |
| EX-21.1 - EX-21.1 - SCHOOL SPECIALTY INC | d941702dex211.htm |
| EX-32.1 - EX-32.1 - SCHOOL SPECIALTY INC | d941702dex321.htm |
| EX-23.1 - EX-23.1 - SCHOOL SPECIALTY INC | d941702dex231.htm |
| XML - IDEA: XBRL DOCUMENT - SCHOOL SPECIALTY INC | R9999.htm |
UNITED STATES
SECURITIES AND EXCHANGE COMMISSION
Washington, D.C. 20549
FORM 10-K
| þ | ANNUAL REPORT PURSUANT TO SECTION 13 OR 15(d) OF THE SECURITIES EXCHANGE ACT OF 1934: |
For the fiscal year ended April 25, 2015
OR
| ¨ | TRANSITION REPORT PURSUANT TO SECTION 13 OR 15(d) OF THE SECURITIES EXCHANGE ACT OF 1934 |
Commission File No. 000-24385
SCHOOL SPECIALTY, INC.
(Exact name of Registrant as specified in its charter)
| Delaware | 39-0971239 | |
| (State or other jurisdiction of | (I.R.S. Employer | |
| incorporation or organization) | Identification No.) | |
| W6316 Design Drive | ||
| Greenville, Wisconsin | 54942 | |
| (Address of principal executive offices) | (Zip Code) | |
Registrant’s telephone number, including area code: (920) 734-5712
Securities registered pursuant to Section 12(b) of the Act:
| Title of each class |
Name of each exchange on which registered | |
| None | None |
Securities registered pursuant to Section 12(g) of the Act: Common Stock, $0.001 par value
Indicate by check mark if the Registrant is a well-known seasoned issuer, as defined in Rule 405 of the Securities Act. Yes ¨ No þ
Indicate by check mark if the Registrant is not required to file reports pursuant to Section 13 or Section 15(d) of the Act. Yes ¨ No þ
Indicate by check mark whether the Registrant (1) has filed all reports required to be filed by Section 13 or 15(d) of the Securities Exchange Act of 1934 during the preceding 12 months (or for such shorter period that the Registrant was required to file such reports), and (2) has been subject to such filing requirements for the past 90 days. Yes þ No ¨
Indicate by check mark whether the registrant has submitted electronically and posted on its corporate website, if any, every Interactive Data File required to be submitted and posted pursuant to Rule 405 of Regulation S-T during the preceding 12 months (or for such shorter period that the registrant was required to submit and post such files). Yes þ No ¨
Indicate by check mark whether the Registrant is a large accelerated filer, an accelerated filer, a non-accelerated filer, or a smaller reporting company. See definitions of “large accelerated filer,” “accelerated filer” and “smaller reporting company” in Rule 12b-2 of the Exchange Act. (Check one):
| Large accelerated filer ¨ | Accelerated filer þ | Non-accelerated filer ¨ | Smaller reporting company ¨ | |||
| (Do not check if smaller reporting company) |
Indicate by check mark if disclosure of delinquent filers pursuant to Item 405 of Regulation S-K is not contained herein, and will not be contained, to the best of Registrant’s knowledge, in definitive proxy or information statements incorporated by reference in Part III of this Form 10-K or any amendment to this Form 10-K. þ
Indicate by check mark whether the registrant is a shell company (as defined in Rule 12b-2 of the Exchange Act). Yes ¨ No þ
The aggregate market value of the Registrant’s common stock held by non-affiliates as of October 25, 2014 was $88,311,720. As of June 15, 2015, there were 1,000,004 shares of the Registrant’s common stock outstanding.
Indicate by check mark whether the registrant has filed all documents and reports required to be filed by Section 12, 13 or 15(d) of the Securities Exchange Act of 1934 subsequent to the distribution of securities under a plan confirmed by a court. Yes þ No ¨
INCORPORATION BY REFERENCE
Part III is incorporated by reference from the Proxy Statement from the Annual Meeting of Shareholders to be held on September 28, 2015.
PART I
| Item 1. | Business |
Unless the context requires otherwise, all references to “School Specialty,” “SSI,” the “Company,” “we” or “our” refer to School Specialty, Inc. and its subsidiaries. Prior to April 26, 2015, our fiscal year ended on the last Saturday in April of each year. In this Annual Report on Form 10-K (“Annual Report”), we refer to these fiscal years by reference to the calendar year in which they ended (e.g., the fiscal year ended April 25, 2015 is referred to as “fiscal 2015”).
Company Overview
School Specialty is a leading distributor of supplies, furniture, technology products, supplemental learning products (“instructional solutions”) and curriculum solutions, primarily to the education marketplace. The Company provides educators with its own innovative and proprietary products and services, from basic school supplies to 21st century classroom designs to Science, Reading, Language and Math teaching materials, as well as planning and development tools. Through its nationwide distribution network, School Specialty also provides its customers with access to a broad spectrum of trusted, third-party brands across its business segments. This assortment strategy enables the Company to offer a broad range of products primarily serving the pre-kindergarten through twelfth grade (“preK-12”) education market at the state, district and school levels. The Company is expanding its presence outside the education market into channels such as e-commerce partnerships with e-tailers and retailers and the healthcare facilities. School Specialty offers its products through two operating groups: Distribution and Curriculum.
We believe our Distribution group offers educators the broadest range and deepest assortment of basic school supplies, instructional solutions, furniture and equipment, technology products, physical education products, and other classroom and school equipment available from a single supplier. This breadth of offering and unique positioning creates competitive advantages in our ability to aggregate an assortment of products to meet customer requirements across multiple categories. This group further differentiates itself through its distribution network and nationwide sales force, able to reach virtually all schools nationwide, as well as the Canadian marketplace. Another core differentiator is our commitment to innovation; working with teachers and administrators to develop proprietary products that result in innovative approaches to early childhood development and advanced student learning.
Our Curriculum group develops proprietary curriculum programs to help educators deepen students’ subject matter understanding and accelerate the learning process. This group offers curriculum solutions for Science, Reading and Math and works with teachers and educators to drive new offerings based on Common Core State Standards, Next Generation Science Standards, as well as its own and third-party, customized products for various grade levels (primarily preK-12). The Curriculum group also offers a number of innovative and highly targeted teaching solutions for educators that were designed to help students who are performing below grade level or could benefit from supplemental learning materials in a specific area of learning. This group continues to expand its portfolio of instructional programs, combining print-based and digital instructional and assessment tools to deliver value to educators and build competitive advantages in the marketplace.
Across both groups, we reach our customers through a sales force of approximately 350 professionals (65 of which are inside sales representatives), 8 million catalogs, and our proprietary e-commerce websites. In fiscal 2015, we believe we sold products to approximately 65% of the approximately 135,000 schools in the United States and we believe we reached a majority of the 3.4 million teachers in those schools. For fiscal 2015, we generated revenues of $621.9 million.
The following is a more complete description of our two operating groups, or segments. Financial information about our segments, as well as geographic information, is included in Note 16 under Item 8, Financial Statements and Supplementary Data.
2
Distribution Segment. Our Distribution segment provides a wide assortment of products, solutions and services primarily to the preK-12 education market, e-tail and retail channel partners, and to the healthcare market. Products include a comprehensive line of everyday consumables, specialized supplies, indoor and outdoor furniture and equipment, technology products, instructional teaching materials, and planning and organizational products, among others. Distribution products are sold via a nationwide sales force and distribution network, with reach to the majority of schools throughout the United States. Distribution products also are sold direct to teachers and to consumers through the Company’s various e-commerce platforms. Distribution products are marketed using a management structure that focuses on five product categories which include:
| • | Supplies |
| • | Furniture |
| • | Instructional Solutions |
| • | Student Organization and Planning Products |
| • | A/V Technology |
By working closely with school administrators, teachers and other educators, the Distribution segment employs a curation strategy, offering a solutions-based approach across multiple product categories. The Company helps schools with their purchasing decisions by offering a suite of value-added products and services to fit within budget parameters, while also helping to manage supply chain issues, and back-to-school logistics to help school administrators save both time and money. This segment also offers project management services through its Project by Design® team (“PBD”), both for school retrofits and new school construction. As a systems integrator for schools, PBD is able to help schools outfit both indoor and outdoor school facilities with state-of-the-art furniture and equipment, while also serving as a single source for additional proprietary and/or third-party branded products.
Distribution products include both proprietary branded products and other national brands. Among the segment’s well-known proprietary brands are Childcraft®, Sax® Arts & Crafts, Califone®, Premier AgendasTM, Classroom Select®, Sportime®, Abilitations®, Hammond & StephensTM, SPARK®, Brodhead Garrett®, School Smart®, and Projects by Design®. Distribution products and services accounted for approximately 86% of our revenues for fiscal 2015.
Curriculum Segment. Our Curriculum segment is a publisher of proprietary and nonproprietary core, supplemental and intervention curriculum in the following areas of the preK-12 education market:
| • | Science |
| • | Math |
| • | Comprehension, Vocabulary, Spelling and Grammar |
| • | Reading and Math Intervention |
| • | Security |
Products in our Curriculum segment are typically sold to teachers, curriculum specialists and other educators with direct responsibility for advancing student outcomes.
The Curriculum segment develops standards-based curriculum products, supplemental and intervention curriculum materials, instructional programs and student assessment tools. Its offerings are tailored to address specific learning needs, drive improved student performance, engage learners and accelerate the learning process. A team of almost 35 product development associates leverage long-standing relationships with outside developers, authors, co-publishing strategic partners and consultants to develop educational products and solutions that satisfy curriculum standards and improve classroom teaching effectiveness.
3
Our product portfolio is guided by preK-12 curriculum standards, which can vary by state. However, there is a consistency throughout the portfolio that allows for the creation of nationally marketed programs that can be customized to meet state-specific curriculum standards where needed. We believe our Curriculum segment provides a broad collection of educational programs that effectively combines supplemental curriculum solutions, academic planning and organization, inquiry based (hands-on) learning, comprehensive learning kits, extensive performance assessments, and consultant-led or web-delivered teacher training. New reading solutions, for example, combine research proven materials, technology, and teaching methods to create dynamic, systematic, and individualized instruction for each student. Additionally, these group solutions are designed to address Common Core State Standards at various grade levels as well as Next Generation Science Standards.
Our Curriculum segment product lines include Delta Education®, FOSS®, CPO ScienceTM, Frey Scientific®, Educator’s Publishing Service®, Academy of Reading®, Academy of Math®, Wordly Wise 3000®, Explode the Code®, ThinkMath!TM, Making Connections®, S.P.I.R.E. ® and EPS® E.P.I.C. TM. Our Curriculum products accounted for approximately 14% of our revenues in fiscal 2015.
School Specialty, Inc., founded in October 1959, was acquired by U.S. Office Products in May 1996. In June 1998, School Specialty was spun-off from U.S. Office Products in a tax-free transaction. In August 2000, we reincorporated from Delaware to Wisconsin. In accordance with the Reorganization Plan (as defined below), in June 2013, the Company was reincorporated in Delaware. Our principal offices are located at W6316 Design Drive, Greenville, Wisconsin 54942, and our telephone number is (920) 734-5712. Our general website address is www.schoolspecialty.com. You may obtain, free of charge, copies of this Annual Report on Form 10-K as well as our Quarterly Reports on Form 10-Q and our Current Reports on Form 8-K (and amendments to those reports) filed with, or furnished to, the Securities Exchange Commission as soon as reasonably practicable after we have filed or furnished such reports by accessing our website at http://www.schoolspecialty.com, selecting “Investors” and then selecting the “SEC Filings” link. Information contained in any of our websites is not deemed to be a part of this Annual Report.
Industry Overview
The United States preK-12 education market is a large industry that has historically exhibited attractive and stable growth characteristics, despite fluctuations in the U.S. economy. For example, during the recessions of 1981-1983, 1991-1992 and 2001-2002, preK-12 education funding in the United States grew at compound annual growth rates (“CAGRs”) of 5.3%, 5.0% and 4.7%, respectively. However, the significant downturn in the general economy from 2008 through 2013 had a major impact on all sectors of the economy, including education.
Public education funding for school districts during 2013-2014 came from three major sources: state funding which provided about 47%; local funding which provided about 43%; and federal funding which provided about 10%. The ongoing pressure on state budgets has negatively impacted school funding and, in turn, school spending has been more negatively affected than it had been during and following prior recessions. In addition, local tax revenues have been negatively affected by lower property tax receipts, further restricting educational spending.
Over the long-term, we expect total educational expenditures (excluding capital outlays and interest on debt) to stabilize and then rise as state and local funding returns to more normalized levels. While macroeconomic events over the past five years have created an unprecedented reduction in school budgets, spending per student and student enrollment are the two primary drivers of future education expenditures, and each is predicted to rise over the next several years.
According to the National Center for Education Statistics (“NCES”), enrollment in public elementary and secondary schools has increased every year between 2009 and 2013. This slow but steady growth trend is projected to continue through at least 2020. At the same time, per pupil expenditures are expected to rise each
4
year, just as they have every year since 1995-1996. NCES projects that public and private preK-12 enrollment will rise from 55.1 million in the 2013-2014 school year to 57.9 million by the 2021-2022 school year. Total public school enrollment is projected to increase each year from 2013-2020. Similarly, according to Education Market Research, spending for technology products, instructional materials such as textbooks and supplements and other educational resources, such as trade books, periodicals and tests are expected to increase at an average rate of 8.1 percent from 2012-2013 through 2015-2016. Furthermore, there is increased activity at the federal level to increase investments in education, with a renewed focus on early learning. We believe there is also increasing demand for new school construction and retrofits at the federal, state and local level. This belief is supported by industry reports from McGraw-Hill which estimate the size of new K-12 school construction spending to be $24 billion in 2014 growing to $36 billion by 2017.
Our focus within the North America preK-12 education market is on basic school supplies, indoor and outdoor furniture and equipment, technology solutions, instructional solutions and curriculum-based teaching materials in targeted subject areas. Our customers are teachers, curriculum specialists, individual schools and school districts who purchase products and instructional solutions and teaching materials for school and classroom use. The addressable market size for our products has generally tracked education funding, with increased spending in the technology arena. Our customers are also parents who purchase similar products for their children via our proprietary e-commerce platform or those of our e-tail/retail channel partners, as well as administrators in various healthcare related markets.
The supplemental educational products and equipment market is highly fragmented with many retail and wholesale companies providing products and equipment, a majority of which are family- or employee-owned, regional companies. The standards-based curriculum market is highly competitive and School Specialty competes with several large, well-known education companies as well as smaller, niche companies. In certain states, Curriculum purchases are heavily influenced state-wide adoption calendars; in open territory states, Curriculum adoptions are more often made at the district level. According to industry reports from the American Association of Publishers and Education Market Research, the K-12 Curriculum market was estimated to be $10 billion in 2014 and is expected to grow to in excess of $12 billion by 2017.
We believe there is increasing customer demand for single source suppliers, prompt order fulfillment and competitive pricing in today’s economic environment, particularly as school districts centralize their purchasing decision-making and/or increasingly seek to participate in local, state, regional or national purchasing cooperatives. We believe these changes should drive growth in our instructional and educational products as well as our general school supplies, furniture and equipment and other technology-based in-class solutions. We also believe that in the long-term, these industry trends will have a favorable competitive impact on our business, and that we are well positioned to utilize our operational capabilities, recognized proprietary and third-party brands, respected educational content and curriculum development expertise, and broad product offering to meet evolving customer demands.
Bankruptcy Filing
On January 28, 2013, School Specialty, Inc. and certain of its subsidiaries (collectively, the “Debtors”) filed voluntary petitions for relief under Chapter 11 of the United States Code (the “Bankruptcy Code”) in the United States Bankruptcy Court for the District of Delaware (the “Bankruptcy Court”). The cases (the “Chapter 11 Cases”) were jointly administered as Case No. 13-10125 (KJC) under the caption “In re School Specialty, Inc., et al.” The Debtors continued to operate their business as “debtors-in-possession” under the jurisdiction of the Bankruptcy Court and in accordance with the applicable provisions of Chapter 11 and orders of the Bankruptcy Court. The Company’s foreign subsidiaries were not part of the Chapter 11 Cases.
The Chapter 11 Cases were filed in response to an environment of ongoing declines in school spending and a lack of sufficient liquidity, including trade credit provided by the Debtors’ vendors, to permit the Debtors to
5
pursue their business strategy to position the School Specialty brands successfully for the long-term. As a result of the Chapter 11 filing, the Company’s common stock was delisted from the NASDAQ Stock Market, effective March 1, 2013.
On May 23, 2013, the Bankruptcy Court entered an order confirming the Debtors’ Second Amended Joint Plan of Reorganization Under Chapter 11 of the Bankruptcy Code (the “Reorganization Plan”), and a corrected copy of such order was entered by the Bankruptcy Court on June 3, 2013. The Reorganization Plan, which is described in additional detail below, became effective on June 11, 2013 (the “Effective Date”). Pursuant to the Reorganization Plan, on the Effective Date, the Company’s existing credit agreements, outstanding convertible subordinated debentures, equity plans and certain other agreements were cancelled. In addition, all outstanding equity interests of the Company that were issued and outstanding prior to the Effective Date were cancelled on the Effective Date. Also on the Effective Date, in accordance with and as authorized by the Reorganization Plan, the Company reincorporated in Delaware and issued a total of 1,000,004 shares of Common Stock of the reorganized Company to holders of certain allowed claims against the Debtors in exchange for such claims. As of June 12, 2013, there were 60 record holders of the new common stock of the reorganized Company issued pursuant to the Reorganization Plan.
The Reorganization Plan
General
The Reorganization Plan generally provided for the payment in full in cash on or as soon as practicable after the Effective Date of specified claims, including:
| • | All claims (the “DIP Financing Claims”) under the Debtor-in-Possession Credit Agreement (the “ABL DIP Agreement”) by and among Wells Fargo Capital Finance, LLC (as Administrative Agent, Co-Collateral Agent, Co-Lead Arranger and Joint Book Runner) and GE Capital Markets, Inc. (as Co-Collateral Agent, Co-Lead Arranger and Joint Book Runner and Syndication Agent), General Electric Capital Corporation (as syndication agent), the lenders party to the ABL DIP Agreement, and the Company and certain of its subsidiaries; |
| • | Certain pre-petition secured claims; |
| • | All claims relating to the costs and expenses of administering the Chapter 11 Cases; and |
| • | All priority claims. |
In addition, the Reorganization Plan generally provides for the treatment of allowed claims against, and equity interests in, the Debtors as follows:
| • | The lenders under the Senior Secured Super Priority Debtor-in-Possession Credit Agreement (the “Ad Hoc DIP Agreement”) by and among the Company, certain of its subsidiaries, U.S. Bank National Association, as Administrative Agent and Collateral Agent and the lenders party thereto were entitled to receive (i) cash in an approximate amount of $98.3 million, and (ii) 65% of the common stock of the reorganized Company; |
| • | Each holder of an allowed general unsecured claim is entitled to receive a deferred cash payment equal to 20% of such allowed claim, plus interest, on the terms described in the Reorganization Plan; |
| • | Each holder of an unsecured claim arising from the provision of goods and/or services to the Debtors in the ordinary course of its pre-petition trade relationship with the Debtors, with whom the reorganized Debtors continue to do business after the Effective Date, is entitled to receive a deferred cash payment equal to 20% of such claim, plus interest, on the terms described in the Reorganization Plan. Such holders may increase their percentage recoveries to 45%, plus interest, by electing to provide the reorganized Debtors with customary trade terms for a specified period, as described in the Reorganization Plan; |
6
| • | Each holder of the Company’s 3.75% Convertible Subordinated Debentures due 2026, as further described elsewhere in this report, received its pro rata share of 35% of the common stock of the reorganized Company; |
| • | Each holder of an allowed general unsecured claim or allowed trade unsecured claim of $3,000 or less, or any holder of a general unsecured claim or trade unsecured claim in excess of $3,000 that agreed to voluntarily reduce the amount of its claim to $3,000 under the terms described in the Reorganization Plan, was entitled to receive a cash payment equal to 20% of such allowed claim on or as soon as practicable after the Effective Date; and |
| • | Holders of equity interests in the Company prior to the Effective Date, including claims arising out of or with respect to such equity interests, were not entitled to receive any distribution under the Reorganization Plan. |
Exit Facilities
As of the Effective Date, the Debtors closed on the exit credit facilities, the proceeds of which were or will be, among other things, used to (i) pay in cash the DIP Financing Claims, to the extent provided for in the Reorganization Plan, (ii) make required distributions under the Reorganization Plan, (iii) satisfy certain Reorganization Plan-related expenses, and (iv) fund the reorganized Company’s working capital needs. The terms of the exit credit facilities are described under Item 7, Management’s Discussion and Analysis of Financial Condition and Results of Operations, below.
Equity Interests
As mentioned above, all shares of the Company’s common stock outstanding prior to the Effective Date were cancelled and extinguished as of the Effective Date. In accordance with the Reorganization Plan, on the Effective Date, the reorganized Company issued the new common stock, subject to dilution pursuant to the 2014 Incentive Plan (as defined and described below). The Company issued 1,000,004 shares of new common stock on the Effective Date pursuant to the Reorganization Plan, which constitutes the total number of shares of new common stock outstanding immediately following the Effective Date, subject to dilution pursuant to the 2014 Incentive Plan.
On the Effective Date, equity interests in the Company’s U.S. subsidiaries were deemed cancelled and extinguished and of no further force and effect, and each reorganized subsidiary was deemed to issue and distribute the new subsidiary equity interests. The ownership and terms of such new subsidiary equity interests in the reorganized subsidiaries are the same as the ownership and terms of the equity interests in these subsidiaries immediately prior to the Effective Date, except as otherwise provided in the Reorganization Plan.
Recent Acquisitions
We have acquired one business since the beginning of fiscal 2011:
Fiscal 2011
Telex. On April 4, 2011, we completed the acquisition of a portion of the operating assets of Telex, a division of Bosch Security Systems, Inc., for an aggregate purchase price of $0.4 million. The assets acquired relate to Telex’s distribution of headphones, earphones, headsets, and their replaceable cords used in the education marketplace. The earphone and headphone models acquired included the Discovery, Odyssey, Explorer and 610 models. This business has been integrated into the Company’s Califone business unit within the Distribution segment.
7
Competitive Strengths
We attribute our strong competitive position to the following key factors:
A Market Leader in Fragmented Industry. We are one of the largest providers of educational supplies, furniture and equipment, and both standards-based and supplemental curriculum products to the preK-12 education markets in the United States and Canada. Within our industry, we compete with many retail and wholesale competitors, a majority of which are family or employee-owned, regional companies. We believe that our scale and scope of operations relative to our education market competitors provide several competitive advantages, including a broader product offering, advantageous purchasing power, a national distribution network and the ability to manage the seasonality and peak shipping requirements of the school purchasing cycle.
Large Product Offering and Premier Brands. With over 123,000 items ranging from classroom supplies, school furniture and playground equipment, technology solutions and both standards-based and supplemental curriculum solutions, we believe we are the only national provider of a broad range of supplemental educational products and equipment to meet substantially all of the needs of schools and teachers in the preK-12 education market. Our breadth of offerings creates opportunities to repurpose or repackage traditional supplemental materials with supplemental curriculum solutions into kits or groups of related items that our customers value. In addition, we believe we have many of the most established brands in the industry that are recognized by educators across the country, with some brands more than 100 years old. This assortment strategy of our own proprietary brands, mixed with other trusted third-party brands, provides us with an assortment of solutions we believe is unmatched in the industry. In addition, over 35% of our revenues are derived from our proprietary products, many of which are curriculum-based, and typically generate higher margins than our non-proprietary products.
Strong Customer Reach and Relationships. We have developed a highly integrated, three-tiered sales and marketing approach, consisting of: a national sales force; paper-based catalogs and digital marketing campaigns; and our proprietary e-commerce websites. We believe this approach provides us with a unique ability to reach teachers and curriculum specialists as well as school district and individual school administrators. The wide assortment of products and solutions we offer has enabled us to establish strong and long-standing relationships with many of the largest school districts across the United States and Canada. We reach our customers through the industry’s largest sales force of approximately 350 professionals (65 of which are inside sales representatives), catalog mailings and our proprietary e-commerce websites. In fiscal 2015, we estimate that we sold products to approximately 65% of the estimated 135,000 schools in the United States and reached a majority of the 3.4 million teachers in those schools. We also estimate that, on average, we have enjoyed more than a 10-year relationship with our top accounts, and have recently invested in building our inside sales force to expand our nationwide reach. We utilize our extensive customer databases to selectively target the appropriate customers for our catalog offerings and digital marketing campaigns. Additionally, we have invested heavily in the development of our e-commerce websites, which provide broad product offerings and which we believe generate higher internet sales than many of our education competitors. Revenues derived directly from internet sales, which were approximately 25% of our sales in fiscal 2015 compared to less than 17% of our sales in fiscal 2009, have increased as more school districts and teachers go online to order supplies.
Highly Diversified Business Mix. Our broad product portfolio and geographic reach minimize our concentration and exposure to any one school district, state, product or supplier. In fiscal 2015, our top 10 school district customers collectively accounted for just over 11% of revenues and our customers within any one state collectively accounted for just over 11% of revenues. For the same period, our top 100 products accounted for slightly less than 13% of revenues. Products from our top 10 suppliers generated just over 24% of revenues in fiscal 2015. We believe this diversification somewhat limits our exposure to state and local funding cycles and to product demand trends, and at the same time, opens up opportunities for growth as educational spending increases, both with current and new customer accounts.
Strong Repeat Business. Over 70% of our revenues are generated from the sale of consumable products, which typically need to be replaced each school year. We continue to maintain strong relationships with schools,
8
school districts and other customers and believe our retention rate of our school and school district customers is approximately 90% in a highly competitive business. We continue to evaluate and modify our product assortment, particularly in the consumable product area to ensure we have the right solutions for our customers and to capitalize on the recurring revenue opportunities from many of our long-standing accounts.
Strong Cost Controls and Focus on Working Capital. Despite our revenue declines in recent years, we believe our focus on cost reductions and aggressive management of working capital, are positioning the Company to capitalize on future revenue growth opportunities, irrespective of the economy and school funding levels. In fiscal 2015, several operational improvement initiatives resulted in significant cost reductions, and greater efficiencies throughout our organization. These initiatives also resulted in better working capital management and cash flow, which provided us with additional resources to invest in key growth areas of our business across both our Distribution and Curriculum business segments. We continue to focus on growing revenues and profits within our Curriculum and Distribution segments, improving our mix of proprietary products and our operations to enhance the customer experience. We also enjoy highly predictable working capital cycles which enable us to effectively manage our capital structure and invest in growth areas of our business and in our infrastructure.
Focus on Growth Opportunities through Transformation Initiatives and Partnerships. We believe we have multiple long term revenue growth and margin improvement opportunities, including enhancing our sales efforts in under-penetrated states, expanding our private-label business, further developing and refining our educational supplies, furniture, technology and curriculum offerings, increasing sourcing from overseas, optimizing direct marketing operations, increasing supply chain efficiency and expanding our product line through strategic extensions. We are actively pursuing partnering opportunities for content development and distribution. We also believe our movement toward organizing around product and customer categories has better synchronized our go-to-market strategies, product development efforts and supplier relationships. Additionally, we have and continue to expand our business outside of school districts by pursuing alternative distribution channels, such as e-commerce and health care markets, which we expect will further increase our brand recognition and lead to additional sales opportunities throughout the upcoming fiscal year and beyond.
Growth Strategy
We have implemented a number of operational changes that have strengthened our operations, lowered our cost structure and improved efficiencies throughout our organization. We are currently in the process of implementing a shared services operating model that better aligns critical business functions areas and will enable us to improve both our top- and bottom-line results. Our near-term strategy is focused on the following areas:
| • | Optimizing our Distribution Centers to improve customer delivery cycles both in terms of speed and accuracy and to operate at a lower cost. Enhancing product management and marketing capabilities to promote our innovation and breath of offerings and bring new and innovative products to market; |
| • | Expanding in alternative channels that have annual purchasing cycles and which will lessen our reliance on the heavy back-to-school spending season; |
| • | Introducing new and innovative curriculum-based training solutions, incorporating products, services and consulting in light of the increased need for school security; |
| • | Identifying and exiting product lines with inadequate returns, while focusing on higher-margin, growth oriented product lines and categories; |
| • | Continue building out our digital solutions and bundled packages, while enhancing our e-commerce platform; and |
| • | Driving a change in culture that focuses on accountability and collaboration towards the attainment of our growth and margin improvement objectives. |
9
The Company’s longer term initiatives are intended to enhance organic growth, improve margins, and better evaluate capital investments and allocation of resources. Among the key initiatives are:
| • | Aligning our sales, marketing and merchandising organizations to develop and execute sustainable growth strategies core product categories such as early childhood development, physical education, art, furniture, technology, and instructional solutions; |
| • | Developing multi-year customer retention and growth plans by geography, category and product lines; |
| • | Improving our customer service capabilities throughout all business areas to improve the customer experience; |
| • | Upgrading our IT systems and related technologies to create efficiencies within our organization, streamline processes, improve business oversight and provide insights that will enable us to better service customer needs; |
| • | Identifying potential acquisition opportunities which would synergistically enhance the revenue and EBITDA of the Company; |
| • | Leveraging our breadth of products to expand into new markets and customer segments, and expanding our product offering where appropriate; and |
| • | Improving communication, both internally and externally to educate all parties on our business operations, product and solution offerings and capabilities. |
As part of our various initiatives, we are highly focused on generating organic growth within our business, improving our margin structure, lowering our cost basis while pursuing strategic investments and generating higher returns for our stockholders.
Organic Growth. We are focused on growing revenues and profits from our existing product lines and possible line extensions. We are cautiously optimistic that schools are at or near the bottom of funding levels and industry data suggests school spending will increase over the coming years based on continued growth in student population and spending per student. As schools return to more normalized spending we plan to increase our share of this spending and organically grow our revenues by:
| • | Optimizing product mix within each category; |
| • | Unifying and aligning our marketing efforts with sales and merchandising; |
| • | Enhancing the usability of our website and our web-based marketing initiatives to capture an increasing portion of online customer sales; |
| • | Developing new and updating current curriculum, supplemental learning and technology solutions in response to education standards and educator needs; |
| • | Introducing new curriculum-based security solutions that address the increased need for school security; |
| • | Focusing our sales reach to further expand into adjacent markets, such as office supplies and health care; |
| • | Capitalizing on expected upcoming curriculum changes relating to Common Core State Standard and Next Generation Science Standards; |
| • | Increasing our focus and selling resources in under-penetrated states and districts; |
| • | Growing within key accounts and school districts through improved cross-selling of products and services; and |
| • | Expanding our relationships with etail/retail partners and large purchasing cooperatives. |
10
Margin Improvement. As we grow our revenues, we are seeking to increase product gross margins through a mix of product innovation, buying programs and supply chain improvements. Among the key initiatives are:
| • | Continuing to expand our private label business through the introduction of new products; |
| • | Increasing the number of products sourced from low-cost, overseas manufacturers; |
| • | Improving the efficiency of our supply chain activities, and driving overall efficiencies through our company-wide, process improvement initiatives; |
| • | Realizing the benefits of consolidation of distribution centers and elimination of redundant expenses; |
| • | Utilizing our purchasing scale to negotiate more favorable supplier terms and conditions; |
| • | Driving new product innovation and introduction of products and solutions across both business segments that will generate better margins and returns; and |
| • | Eliminating those product offerings which are not justified by the return they provide the Company. |
Reduction of Corporate Operating Expenses. We continue to focus on reducing our operating expenses to streamline our business and free up resources to invest in other key areas that will generate top-line growth and improve bottom-line performance. Among the initiatives we are focused on are:
| • | Consolidate resources across various departments in a manner that will lower our overall staffing levels and improve operational effectiveness; |
| • | Implement lean principles in our operations to improve efficiencies; |
| • | Overhaul our marketing campaigns to have more direct interaction with customers and through more targeted catalog distribution; |
| • | Leverage shared corporate resources throughout our business segments to lower costs and optimize financial, IT, HR and marketing support; and |
| • | Institute a blend of an inside/outside sales model coverage to lower selling expenses and improve account coverage. |
Evaluation of Capital Investment and Allocation: We have identified several areas for investment in fiscal 2016 that will strengthen our operations and back-end support, digital and e-commerce platform and solution sets, and overall systems management capabilities. This will be part of the continuous improvement initiatives that are underway. We are also in the process of major review of all of our product lines and businesses to determine those with unacceptable or inadequate profitability, while simultaneously analyzing the appropriate solutions to maximize our returns, either from disposition or further capital investment. This analysis is to identify both cost saving drivers and new investment opportunities that will strengthen our bottom-line performance both near- and long-term. The Company also intends to continue to analyze acquisition opportunities which may fill product offering gaps and provide improvement in the revenue and EBITDA of the Company.
Product Lines
We market our proprietary brands and third-party product assortments across a wide variety of industry categories including general school supplies, arts and crafts, physical education, instructional solutions and special needs, classroom furniture and equipment, outdoor furniture and equipment, technology solutions, and both standards-based and supplemental curriculum solutions. These products are marketed and sold through our two primary business segments: Distribution and Curriculum.
11
Our Distribution offerings are focused in the following areas:
Supplies Category: We believe we are the largest marketer of school and classroom supplies into the education market. Through our School Specialty Distribution catalogs, which offer both national brands and many of our proprietary School Smart® products, we provide an extensive offering of basic supplies that are consumed in schools and classrooms as well as in home use. This offering includes office products, classroom supplies, janitorial and sanitation supplies, school equipment, planning and development products, physical education products, art supplies and paper, among others. These products are more commodity in nature and require an efficient supply chain and distribution and logistics expertise to be competitive. As a result of our large distribution network and supply chain expertise, our customers view us as a preferred supplier in the Supplies category. Our School Smart private label products are primarily sourced direct from low-cost, overseas manufacturers, which we believe will allow us to enhance our product offering and improve profitability.
Our leading market position in the art supplies area of this category is led by Sax® Arts & Crafts, which offers products and programs focused on nurturing creativity and self-expression through hands-on learning. The product line ranges from original cross-curricular lesson plans and teaching resource materials to basic art materials, such as paints, brushes and papers.
We also offer a full range of physical education programs, solutions, resources and equipment designed to help improve student and staff wellness. Our products, which are primarily offered under our Sportime® brand, range from traditional sports equipment to unique and innovative products designed to encourage participation by all, as well as research-based teaching materials that foster health and wellness both inside and outside of educational facilities. We also offer proven, research-based physical education and health solutions under our SPARK® brand, which is a curriculum and product-based program focused on promoting healthy, active lifestyles and combating childhood obesity. Each SPARK program provides a coordinated package of curriculum, on-site teacher training, and content-matched equipment from our Sportime® product line. The program maximizes physical activity during physical education classes by providing teachers with alternative games, dances and sports that ensure all students are actively engaged and learning.
Instructional Solutions: We believe we are one of the largest marketers of educator supplies and related educational materials and technology solutions, as well as instructional learning materials. Our Instructional Solutions category includes supplemental learning materials (reading, math and science), teaching resources, special needs and special education products and early childhood offerings. Innovation, proprietary products, brand strength and direct merchandising are key success factors. These product offerings create opportunity for margin enhancement through innovation and unique assortments.
We offer several proprietary and innovative instructional solutions and teaching materials to schools and school districts, all designed to help teachers teach and students remain on par with grade-level learning requirements. We also offer a full range of solutions for children with special learning needs through our Abilitations® and Integrations® product lines as well as several third party brands. Our proprietary solutions and products are designed to help educate children with learning, behavioral, sensory or physical differences and are focused on helping educators and therapists make a real difference in a child’s life.
Our early childhood offering provides educators of young children with products that promote learning and development. Our full-line, highly proprietary offering provides educators with everything from advanced literacy and dramatic play to manipulatives, and basic arts and crafts. We have several proprietary brands targeting the early childhood market and our flagship brand, Childcraft® is a well-known and trusted brand in the education market.
Furniture Category: We believe we are one of the most comprehensive providers of school furniture in the United States, offering a full range of school-specific furniture and equipment, for both in-school, in-classroom and outdoor use. Our offering allows us to equip an entire facility, refurbish a specific location within a school, such as a cafeteria, gymnasium or media center, or to replace individual items such as student desks and chairs. We manufacture award-winning early childhood wood furniture in our Bird-in-Hand Woodworks® facility. We
12
launched a product line of proprietary furniture under our Classroom Select® brand and also provide innovative furniture offerings through our Royal Seating®, Childcraft®, Korners for Kids® and Bird-in-Hand® product lines. We are authorized national or regional distributors for leading third-party lines. In addition, we offer our proprietary service, Projects by Design®, which provides turn-key needs assessment and conforming design, budget analysis and project management for new construction projects.
Planning and Student Development: We believe we are one of the largest providers of planning and student organization products in the United States and Canada, which is delivered through student agendas and planners. Our offerings are focused on developing better personal, social and organizational skills, as well as serving as an effective tool for students and parents to track and monitor their daily activities, assignments and achievements. Many of our agendas and planners are customized at the school level to include each school’s academic, athletic and extra-curricular activities. Our agendas are primarily marketed under the Premier™ brand name. We are also a leading publisher of school forms, including record books, grade books, teacher planners and other printed forms under the brand name Hammond & StephensTM.
A/V Technology: We believe we are among the leading providers of educator-inspired quality audio technology products, including multi-media, audio visual and presentation equipment for the preK-12 education market. These products are marketed under the brand name Califone®. We also offer a host of other technology solutions under Califone and other third-party brands and are focused on expanding our assortment of products to take advantage of increased investments by schools and school districts in new and emerging technology platforms.
Our product development managers apply their extensive education industry experience to design instructional solutions and supplemental curriculum- and age-specific products to enhance the learning experience. New product ideas are reviewed with customer focus groups and advisory panels comprised of educators to ensure new offerings will be well received and meet an educational need.
Our merchandising managers continually review and update the product lines for each business. They determine whether current offerings are attractive to educators and anticipate future demand. The merchandising managers also travel to product fairs and conventions seeking out new product lines. This annual review process results in a continual reshaping and expansion of the educational materials and products we offer.
Our Curriculum offerings are focused in the following areas:
Science: Our science product category, largely comprised of highly recognized proprietary or exclusive offerings, provides learning resources focused on promoting scientific education and inquiry, literacy and achievement to the preK-12 education market. Our products range from laboratory supplies, equipment and furniture to highly effective hands-on learning curriculums. Our science brands include FOSS® (Full Option Science System), Frey Scientific®, Delta Science ModulesTM, Delta Education®, CPO ScienceTM, and Neo/SCI®. We have structured our solutions to engage students, focusing on science and engineering practices that promote scientific inquiry, literacy and achievements, all while aligning to the Next Generation Science Standards and supporting Common Core State Standards.
Science classroom resources offered by Delta Education for example, are focused on the pre-K to 8th-grade education level. Our science curriculum products embody the best in inquiry-based STEM (“Science, Technology, Engineering and Math”) education. Delta provides the research-based FOSS® curriculum and other programs such as Delta Science Modules, as well as hands-on classroom resources. The Full Option Science System® (FOSS) has evolved from a philosophy of teaching and learning at the Lawrence Hall of Science that has guided the development of successful active learning science curricula for more than 40 years. The FOSS program bridges research and practice by providing tools and strategies to engage students and teachers in enduring experiences that lead to a deeper understanding of the natural and designed worlds. Science is a
13
discovery activity, and our belief is that the best way for students to appreciate the scientific enterprise, learn important scientific and engineering concepts, and develop the ability to think well is to actively participate in scientific practices through the use of manipulatives which enhance their own investigations and analyses. The FOSS Program was created specifically to provide students and teachers with meaningful experiences through active participation in scientific practices.
At Frey Scientific, we offer a wide selection of science education products, supplemental curriculum, lab equipment and supplies, all of which are a part of STEM solutions that advance effective learning. By working with a network of classroom teachers at various grade levels, we continually seek to understand and adapt to customers’ needs and Next Generation Science Standards. Our dedicated science education specialists, many with advanced degrees and teaching experience, provide powerful insights that continue to enhance our product line. Frey Scientific elementary, middle and high school education products include supplemental curriculum, Inquiry Investigations® hands-on kits with virtual labs, innovative equipment and precision instrumentation, essential science classroom supplies and laboratory design services and furniture.
Literacy & Intervention: Our reading and math intervention and supplemental learning programs, which are standards- and curriculum-based products, are focused on providing educators and parents with effective tools to encourage and enhance literacy and mathematics skills, serving the K-12 grade levels. Educator’s Publishing Service (EPS) provides tailored reading and language arts instruction for students with special needs and proprietary instructional materials for educators. For over 60 years, EPS Literacy and Intervention has been the leader in developing and publishing programs to help struggling students, including those with dyslexia and other reading difficulties, as well as providing materials that support on-level students so they can continue to meet their educational goals. Today, EPS provides K-12 blended, customized intervention solutions to help at-risk and on-level students build proficiency in reading and math. A variety of programs connect time-tested content and innovation to give educators the power of differentiation to reach all of their students and meet the changing demands of today’s classrooms. From screening through to intervention, progress monitoring, reporting and professional development, EPS offers an integrated approach to address the Common Core State Standards and Response to Intervention (RTI).
Our Academy of Reading® and Academy of Math® products offer comprehensive reading, math and response to intervention solutions to help K-12 schools close the achievement gap for students who fall below proficiency benchmarks. Our print and technology resources combine to meet the instructional needs of students possessing learning disabilities or who are at risk for reading and math failure. Some of our other innovative teaching materials include Explode the Code®, Making Connections® and Making Connections Intervention®, path driver for Math and path driver for Reading, Sitton Spelling and WordSkills®, S.P.I.R.E®, and WordlyWise®, among others.
For further information regarding our Distribution and Curriculum segments, see our “Segment Information” in the Notes to Consolidated Financial Statements under Item 8, Financial Statements and Supplementary Data.
Intellectual Property
We maintain a number of patents, trademarks, trade names, service marks and other intangible property rights that we believe have significant value and are important to our business. Our trademarks, trade names and service marks include the following: School Specialty®, Education Essentials®, School Smart®, Projects by Design®, Academy of Reading®, Academy of Math®, abc School Supply®, Integrations®, Abilitations®, Brodhead Garrett®, Califone®, Childcraft®, ClassroomDirect®, Frey Scientific®, Hammond & StephensTM, Premier AgendasTM, Sax® Arts & Crafts, Sax® Family & Consumer Sciences, Sportime®, Delta Education®, Neo/SCI®, CPO Science™, EPS® and AutoSkill®. We also sell products under brands we license, such as FOSS®, ThinkMath!™, SPARKTM and FranklinCovey® Seven Habits.
14
Sales and Marketing
Product procurement decisions within the education market are generally made at the classroom level by teachers and curriculum specialists and at the district and school levels by administrators. The Company currently has an expansive sales force that sells our products at the classroom, school and district level to educators nationwide.
Our Distribution segment sales and marketing approach utilizes a sales force of approximately 280 professionals, approximately 40 distinct catalog titles, and School Specialty Online®, an e-commerce solution that enables us to tailor our product offerings and pricing to individual school districts and school administrators. In fiscal 2015, we took steps to realign our nationwide sales team and our go-to-market strategy, which also included the build out of an inside sales team focused on under penetrated states.
In the Supplies category, we leverage our national sales force, which we believe represents the largest distribution network in the market, and our supply chain expertise, to reduce our customers’ cost of acquisition in the most commonly purchased, highest volume commodity items used by schools. In the Instructional Solution category, we market our products through direct marketing channels. We compete by offering deep assortments in the most commonly purchased products, by leveraging our size to reduce product costs, and by driving customer retention and acquisition through sophisticated database analytics. In the Furniture category, our unique Projects by Design® service gives us significant competitive advantages by providing customers with value-added construction management support, from interior design through installation and field support. In the non-construction segment of furniture, we capitalize on relationship selling through the largest direct sales force in the market.
Schools typically purchase educational supplies and supplemental educational products based on established relationships with relatively few vendors. We seek to establish and maintain these critical relationships by assigning accounts within a specific geographic territory to a local area account manager who is supported by a customer service team. The account managers frequently call on existing customers to ascertain and fulfill their supplemental educational resource and basic supply needs. The customer service representatives maintain contact with these customers throughout the order cycle and assist in order processing.
We have a national sales, marketing, distribution and customer service structure. We believe that this structure significantly improves our effectiveness through better sales management, resulting in higher regional penetration and significant cost savings through the reduction of distribution centers.
Projects by Design. Projects by Design® is a service we provide our customers free of charge to aid in the design, building and renovation of schools. Our professional designers prepare a detailed analysis of the building and individual classrooms to optimize the layout of student and teacher desks, student lockers and other classroom equipment and fixtures. Customers have the ability to view prospective classrooms through our innovative software in order to efficiently manage the project. We believe this service makes us an attractive alternative to other furniture and school fixture and equipment suppliers.
Our Curriculum segment sales and marketing approach utilizes a field sales force of approximately 70 professionals, supported by about 40 inside sales associates. The sales coverage is nationwide, with the largest student populated states served by a larger contingent of sales professionals. The field and inside sales associates are supported by 10 targeted catalogs and our brand-specific websites to deliver premium educational products to teachers and curriculum specialists.
Generally, for each Curriculum product line, a major catalog containing its full product offering is distributed near the end of the calendar year and during the course of the year we mail additional supplemental catalogs. Schools, teachers and curriculum specialists can also access websites for product information and purchasing. Further, we believe that by cross-marketing our Curriculum brands to Distribution customers, we can achieve substantial incremental sales.
15
Internet Operations. Our internet channel activities through School Specialty Online are focused on enhancing customer loyalty, driving down cost by receiving more orders electronically and creating a customer self-service portal. Our brands are available through School Specialty Online which allows our customers a single access point for purchasing. Our systems provide functionality to meet the specific needs of school districts and school customers, who generally purchase Distribution products, as well as the needs of individual teachers and curriculum specialists, who tend to buy Curriculum products. School Specialty Online allows our customers to manage funding through the use of purchase order spending limitation, approval workflows, order management and reporting. In addition, we offer schools and districts the ability to fully integrate their procurement systems with School Specialty Online, which gives us another important link to our customers and a significant competitive advantage. It also includes other features that are more helpful to teachers, curriculum specialists and others with more sophisticated online ordering needs, including product search, custom catalogs and email notification, allowing users to have access to the full line of School Specialty products. We have maintained an electronic ordering system for the past 20 years and offer e-commerce solutions directed exclusively at the education market. Each of our Curriculum product lines has a dedicated website for its own products. We also continue to explore expanding our offerings provided through third party internet sources. As such, we have added a channel agreement with Amazon.com under which we have created our own branded storefront within the office and school segment of the Amazon.com shopping portal. We believe that this channel will allow us to reach educators and segments of the education space that we did not reach previously. Over the past two years, we have significantly invested in our ecommerce platform to improve website functionality, make the online ordering process easier and faster and improve the overall customer experience, which we believe, will help us grow organically.
Pricing. Pricing for our Distribution and Curriculum product offerings varies by product and market channel. We generally offer a negotiated discount from catalog prices for products from our Distribution catalogs, and respond to quote and bid requests. The pricing structure of proprietary Curriculum products offered through direct marketing is generally less subject to negotiation.
Procurement
Non-Proprietary Products. Each year, we add new items to our catalogs and our offerings. We begin to purchase and stock these items before the catalogs are released so that we can immediately satisfy customer demand. We typically negotiate annual supply contracts with our vendors. Contracts with larger vendors usually provide negotiated pricing and/or extended terms and often include volume discounts and rebate programs. We have exclusive distribution rights on several furniture and equipment lines.
Proprietary Products. We develop many proprietary products and generally outsource the manufacturing of these items.
Global Sourcing. We are decreasing our product unit costs by consolidating our international supplier network. We are also improving product quality by being very selective in our sourcing relationships. Working in conjunction with our supply partners, we have streamlined our international procurement process, gained real-time visibility, added in-process quality checks, and established new systems and procedures to ensure product safety.
Private Label Product. We launched the School Smart brand in 2005. Since that time we have focused our strategy on providing a private brand alternative for educators, using a combination of off-shoring and out-sourcing of products. In fiscal 2015, our revenue for School Smart branded products was approximately $55 million. We continue to evaluate the balance of branded and private brand products and we believe that there are additional opportunities to grow sales through new products, product line extensions and new product configurations.
We maintain close and stable relationships with our vendors to facilitate a streamlined procurement process. At the same time, we continually review alternative supply sources in an effort to improve quality and customer
16
satisfaction and reduce product cost. Increasingly, transactions with our vendors are processed through an electronic procurement process. This electronic process reduces costs and improves accuracy and efficiency in our procurement and fulfillment process. When more than one of our business units buys from the same vendor, we typically negotiate one contract to fully leverage our combined purchasing power.
Logistics
We believe we have one of the largest and most sophisticated distribution networks among our direct competitors with three fully automated and seamlessly integrated distribution centers, two supporting the Distribution segment and one supporting the Curriculum segment, totaling approximately 1 million square feet of operating space. We believe this network represents a significant competitive advantage, allowing us to reach any school in a fast and efficient fashion. We have enhanced our distribution model, allowing most of our customers to receive their orders of in-stock items within 3 to 5 days, and have the capability of expediting delivery of certain shipments to next-day if and as required by specific customers. We utilize a third-party logistics provider in Asia to consolidate inbound shipments of items sourced overseas, lowering our transportation and inventory storage costs.
In order to maintain the proprietary nature of certain furniture products, we operate one manufacturing facility. Our Lancaster, Pennsylvania plant manufactures wood furniture for our early childhood offerings. Products that we manufacture accounted for less than 10% of sales during fiscal 2015, 2014, and 2013.
Over the past two years, through a series of initiatives, we have realigned our Distribution Centers and warehouses to be closer to the majority of our customers and key suppliers. We have also invested significantly in lean manufacturing principles and upgraded technology and logistics platforms, which have strengthened our operational footprint, enabling us to provide better, more accurate and faster shipments to our customers. This remains one of our key corporate priorities.
Information Systems
We believe that through the utilization of technology for process improvement in areas such as procurement, inventory management, customer order management, order fulfillment, and information management, we are able to offer customers more convenient and cost-effective ways to order products, improve the order fulfillment process to increase on-time and complete performance and effectively focus our sales and marketing strategies.
We have implemented a common enterprise resource planning (“ERP”) platform across the majority of our businesses. This platform primarily includes software from Oracle’s E-Business suite. One of the major benefits from the common ERP platform is the consolidation of both product and customer information, which is designed to enhance our ability to execute our sales and marketing strategies. In addition, by utilizing common business systems across the Company, we have improved business processes, reduced cycle time and enhanced integration between the business units. We believe the technologies of the systems will readily support continued growth and integration of our existing businesses. Our distribution centers utilize interfaced warehouse management software to manage orders from our ERP and legacy systems.
Competition
The supplemental educational products and equipment market is highly fragmented with many retail and wholesale companies providing products and equipment, many of which are family- or employee-owned, regional companies. We also compete, to a much lesser extent, with alternate channel competitors such as office product contract stationers, office supply superstores, purchasing cooperatives and internet-based businesses.
17
Their primary advantages over us include size, location, greater financial resources and purchasing power. Their primary disadvantage is that their product mix typically covers a very small portion of a school’s needs (measured by volume). We believe we compete favorably with these companies on the basis of service, product offering and customer reach. The standards-based curriculum market is highly competitive and School Specialty competes with several large, well-known education companies as well as small, niche companies.
Employees
As of June 15, 2015, we had approximately 1,160 full-time employees. We have reduced the number of full-time employees as we have integrated and aligned core function areas across the Company, such as operations, supply chain management, procurement and logistics, marketing, finance, information technology and human resources. Additionally, to meet the seasonal demands of our customers, we employ many seasonal employees during the late spring and summer months. Historically, we have been able to meet our requirements for seasonal employment. None of our employees are represented by a labor union and we consider our relations with our employees to be good.
Backlog
We had no material backlog at April 25, 2015. Our customers typically purchase products on an as-needed basis.
| Item 1A. | Risk Factors |
Forward-Looking Statements
Statements in this Annual Report which are not historical are “forward-looking” statements within the meaning of the Private Securities Litigation Reform Act of 1995. The forward-looking statements include: (1) statements made under Item 1, Business and Item 7, Management’s Discussion and Analysis of Financial Condition and Results of Operations, including, without limitation, statements with respect to internal growth plans, projected revenues, margin improvement, capital expenditures and adequacy of capital resources; (2) statements included or incorporated by reference in our future filings with the Securities and Exchange Commission; and (3) information contained in written material, releases and oral statements issued by, or on behalf of, School Specialty including, without limitation, statements with respect to projected revenues, costs, earnings and earnings per share. Forward-looking statements also include statements regarding the intent, belief or current expectation of School Specialty or its officers. Forward-looking statements include statements preceded by, followed by or that include forward-looking terminology such as “may,” “should,” “believes,” “expects,” “anticipates,” “estimates,” “continues” or similar expressions.
All forward-looking statements included in this Annual Report are based on information available to us as of the date hereof. We do not undertake to update any forward-looking statements that may be made by or on behalf of us, in this Annual Report or otherwise. Our actual results may differ materially from those contained in the forward-looking statements identified above. Factors which may cause such a difference to occur include, but are not limited to, the risk factors set forth below.
The agreements governing our debt contain various covenants that limit our discretion in the operation of our business, could prohibit us from engaging in transactions we believe to be beneficial and could lead to the acceleration of our debt and/or an increased cost of capital.
Our existing and future debt agreements impose and may impose operating and financial restrictions on our activities. These restrictions require us to comply with or maintain certain financial tests and ratios, and restrict our ability and our subsidiaries’ ability to:
| • | incur additional debt; |
| • | create liens; |
18
| • | make acquisitions; |
| • | redeem and/or prepay certain debt; |
| • | sell or dispose of a minority equity interest in any subsidiary or other assets; |
| • | make capital expenditures; |
| • | make certain investments; |
| • | enter new lines of business; |
| • | engage in consolidations, mergers and acquisitions; |
| • | repurchase or redeem capital stock; |
| • | guarantee obligations; |
| • | engage in certain transactions with affiliates; and |
| • | pay dividends and make other distributions. |
Our credit facilities also require us to comply with certain financial ratios, including a maximum net total leverage ratio, a minimum fixed charge coverage ratio, and minimum interest coverage ratio, as well as minimum liquidity levels at the end of each month. These restrictions may hamper our ability to operate our business or could seriously harm our business by, among other things, limiting our ability to take advantage of financing, mergers and acquisitions, and other corporate opportunities. In the event that we fail to comply with the financial ratios or minimum liquidity levels contained in our credit facilities, the lenders could elect to declare all amounts outstanding to be immediately due and payable and terminate all commitments to extend further credit. If the lenders accelerate the repayment of borrowings, we may not have sufficient assets to repay the amounts due. Also, should there be an event of default, or a need to obtain waivers following an event of default, we may be subject to higher borrowing costs and/or more restrictive covenants in future periods.
See the Liquidity and Capital Resources section of Item 7, Management’s Discussion and Analysis of Financial Condition and Results of Operations, for a more detailed discussion of the Company’s projected compliance with these debt covenants.
Our common stock is thinly traded, and as a result our investors do not have a meaningful degree of liquidity.
Since October 2013, our common stock has been sporadically quoted on the OTCQB marketplace, meaning that the number of persons interested in purchasing our common stock at or near bid prices at any given time may be relatively small or nonexistent. We cannot predict the extent to which an active public market for our common stock will develop or be sustained. As a consequence, there may be extended periods of time when trading activity in our shares is minimal or nonexistent. We cannot give investors any assurance that a broader or more active public trading market for our common stock will develop or be sustained. An investor may find it difficult or impossible to dispose of shares or obtain accurate information as to the market value of the common stock. Investors may be unable to sell their shares of common stock at or above their purchase price if at all, which may result in substantial losses.
Our bankruptcy proceedings, which improved our capital structure and short-term liquidity position, contemplated that we would refine and implement our strategy and business plan, based upon assumptions and analyses developed by us. If these assumptions and analyses prove to be incorrect, we may be unsuccessful in executing our strategy and business plan, which could have a material adverse effect on our business, financial condition, and results of operations.
Our bankruptcy proceedings, which improved our capital structure and short-term liquidity position, contemplated that we would refine and implement our strategy and business plan based upon assumptions and
19
analyses developed by us in light of our experience and perception of historical trends, current conditions and expected future developments, as well as other factors that we considered appropriate under the circumstances. Whether actual future results and developments will be consistent with our expectations and assumptions depends on a number of factors, including but not limited to (i) our ability to obtain adequate liquidity and financing sources and establish an appropriate level of debt; (ii) our ability to restore customers’ confidence in our viability as a continuing entity and to attract and retain sufficient customers; (iii) our ability to retain key employees in those businesses that we intend to continue to emphasize, and (iv) the overall strength and stability of general economic conditions and, in particular, the school funding environment. The failure of any of these factors could materially adversely affect the successful execution of our strategy and business plan.
In connection with our bankruptcy proceedings, we prepared projected financial information to demonstrate to the Bankruptcy Court the feasibility of our Reorganization Plan and our ability to continue operations upon emergence from bankruptcy. The projections reflect numerous assumptions concerning anticipated future performance and prevailing and anticipated market and economic conditions that were and continue to be beyond our control and that may not materialize. Further, the projections were limited by the information available to us as of the date of their preparation, which is subject to change. Accordingly, our actual financial condition and results of operations may differ, perhaps materially, from what we have anticipated. Consequently, there can be no assurance that the results or developments contemplated by the Reorganization Plan or our strategy and business plan will occur or, even if they do occur, that they will have the anticipated effects on us and our subsidiaries or our businesses or operations. The failure of any such results or developments to materialize as anticipated could materially adversely affect the successful execution of the transactions contemplated by the Reorganization Plan or subsequent strategy and business plan. In addition, the accounting treatment required for our bankruptcy reorganization may have an impact on our results going forward.
We are highly leveraged. As of April 25, 2015, we had $182 million of total debt. This level of debt could adversely affect our operating flexibility and put us at a competitive disadvantage.
Our level of debt and the limitations imposed on us by our credit agreements could have important consequences for investors, including the following:
| • | we will have to use a portion of our cash flow from operations for debt service rather than for our operations; |
| • | we may not be able to obtain additional debt financing for future working capital, capital expenditures or other corporate purposes or may have to pay more for such financing; |
| • | the debt under our credit agreements is at a variable interest rates, making us more vulnerable to increases in interest rates; |
| • | we could be less able to take advantage of significant business opportunities, such as acquisition opportunities, and to react to changes in market or industry conditions; |
| • | we will be more vulnerable to general adverse economic and industry conditions; and |
| • | we may be disadvantaged compared to competitors with less leverage. |
We expect to service our debt primarily from cash flow from operations. Our ability to service our debt obligations thus depends on our future performance, which will be affected by financial, business, economic and other factors. We are not able to control many of these factors, such as economic conditions in the markets where we operate and pressure from competitors. The cash flow we generate may not be sufficient to allow us to service our debt obligations. If we do not have sufficient capital, we may be required to refinance all or part of our existing debt, sell assets or borrow additional funds. We may not be able to take such actions on terms that are acceptable to us, if at all. In addition, the terms of our existing or future debt agreements may restrict us from adopting any of these refinancing alternatives.
20
As a result of the Chapter 11 Cases, our historical financial information may not be indicative of our future financial performance.
Our capital structure was significantly altered under the Reorganization Plan. Under fresh-start reporting rules that applied to us upon the effective date of the Reorganization Plan, our assets and liabilities were adjusted to fair value and our accumulated deficit was restated to zero. Accordingly, our financial condition and results of operations subsequent to the effective date of the Reorganization Plan are not comparable to the financial condition and results of operations reflected in our historical financial statements. It is also possible that additional restructuring and related charges may be identified and recorded in future periods. Such charges could be material to our consolidated financial position and results of operations.
Our net operating loss carryforwards may be limited and other tax attributes may be reduced.
The Company incurred a Federal net operating loss in fiscal 2015. However, in conjunction with matters that resulted in the Chapter 11 Cases and Reorganization Plan, the Company experienced a change in ownership under Section 382 of the Internal Revenue Code. This could limit annual federal net operating loss utilization to an amount equal to the net equity value of our stock at the time of the ownership change multiplied by the federal long-term tax exempt rate.
In addition, the Company’s Reorganization Plan resulted in a reduction of tax attributes, including net operating losses and tax attributes particularly related to goodwill and intangible assets, as a result of the cancellation of pre-bankruptcy indebtedness and obligations. The reduction of these tax attributes may result in increased tax expense in future years.
Our business depends upon the growth of the student population and school expenditures and can be adversely impacted by fixed or declining school budgets.
Our growth strategy and profitability depend in part on growth in the student population and expenditures per student in preK-12 schools. The level of student enrollment is largely a function of demographics, while expenditures per student are affected by federal, state and local government budgets. In addition, the current macroeconomic weakness has resulted in significantly reduced school budgets. In school districts in states that primarily rely on local tax proceeds for funding, significant reductions in those proceeds for any reason can restrict district expenditures and impact our results of operations. Any significant and sustained decline in student enrollment and/or expenditures per student could have a material adverse effect on our business, financial condition, and results of operations. Because school budgets are fixed on a yearly basis, any shift by schools in expenditures during a given fiscal year to areas that are not part of our business, such as facility operating costs and employee related expenditures, could also materially affect our business.
A decline in school spending will impact our ability to maintain operating margins.
We have seen a decline in our operating margin in recent years, primarily as a result of our revenue declines, which we believe are primarily related to the continued school spending cuts. The Company will continue to aggressively pursue further cost reductions if school spending continues to decline, but the Company does not intend to cut costs in areas that it believes could have a significant impact on future revenue growth. To the extent we are unable to identify additional cost reductions that can be made consistent with our strategy and the weakness in school spending persists, our operating margin may continue to decline. Additionally, spending declines can cause schools to consider purchasing lower priced products, which will lower the Company’s operating margins.
Increasing use of web-based products is affecting our printed supplemental materials business.
The growth in web-based and digital-based supplements has reduced the physical paper-based supplements the Company currently markets. While we continue to enhance some of our product lines with digital alternatives, it is possible that our paper-based products could be further supplanted and/or replaced by online sources other than our own.
21
Increased costs and other difficulties associated with the distribution of our products would adversely affect our results of operations.
Higher than expected costs and other difficulties associated with the distribution of our products could affect our results of operations. To the extent we incur difficulties or higher-than-expected costs related to updating our distribution centers, such costs may have a material adverse effect on our business, financial condition and results of operations. Any disruption in our ability to service our customers may also impact our revenues or profits. Moreover, as we update our distribution model, reduce the number of distribution centers or change the product mix of our remaining distribution centers, we may encounter unforeseen costs or difficulties that may have an adverse impact on our financial performance.
Our business is highly seasonal.
Because most of our customers want their school supplies delivered before or shortly after the commencement of the school year, we record most of our revenues from June to October. During this period, we receive, ship and bill the majority of orders for our products so that schools and teachers receive their products by the start of each school year. To the extent we do not sell our products to schools during the peak shipping season, many of such sales opportunities will be lost and will not be available in subsequent quarters. Our inventory levels increase in April through June in anticipation of the peak shipping season. We usually earn more than 100% of our annual net income in the first two quarters of our fiscal year and operate at a net loss in our third and fourth fiscal quarters. This seasonality causes our operating results and operating cash flows to vary considerably from quarter to quarter within our fiscal years.
If our key suppliers or service providers were unable or unwilling to provide the products and services we require, our business could be adversely affected.
We depend upon a limited number of suppliers for some of our products, especially furniture and proprietary products. We also depend upon a limited number of service providers for the delivery of our products. If these suppliers or service providers are unable or unwilling to provide the products or services that we require or materially increase their costs (especially during our peak season of June through October), our ability to deliver our products on a timely and profitable basis could be impaired and thus could have a material adverse effect on our business, financial condition and results of operations. Many of our agreements with our suppliers are terminable at any time or on short notice, with or without cause, and, we cannot assure that any or all of our relationships will not be terminated or that such relationships will continue as presently in effect.
Our business is highly competitive.
The market for supplemental educational products and equipment is highly competitive and fragmented with many retail and wholesale companies that market supplemental educational products and equipment to schools with preK-12 as a primary focus of their business. We also face competition from alternate channel marketers, including office supply superstores, office product contract stationers, and purchasing cooperatives that have not traditionally focused on marketing supplemental educational products and equipment. Our competitors impact the prices we are able to charge and we expect to continue to face pricing pressure from our competitors in the future, especially on our commodity-type products. These competitors are likely to continue to expand their product lines and interest in supplemental educational products and equipment. Some of these competitors have greater financial resources and buying power than we do. We believe that the supplemental educational products and equipment market will consolidate over the next several years, which could increase competition in both our markets. We also face increased competition and pricing pressure as a result of the accessibility of the internet.
22
If any of our key personnel discontinue their role with us, our business could be adversely affected.
Our business depends to a large extent on the abilities and continued efforts of our executive officers and senior management. If we are unable to attract and retain key personnel and qualified employees, our business could be adversely affected. We do not intend to maintain key man life insurance covering any of our executive officers or other members of our management.
A failure to successfully implement our business strategy could materially and adversely affect our operations and growth opportunities.
Our ability to achieve our business and financial objectives is subject to a variety of factors, many of which are beyond our control, and we may not be successful in implementing our strategy. This includes limitations due to the inability to obtain financing and/or the restrictiveness of our debt covenants. In addition, the implementation of our strategy may not lead to improved operating results. We may decide to alter or discontinue aspects of our business strategy and may adopt alternative or additional strategies due to business or competitive factors or factors not currently expected, such as unforeseen costs and expenses or events beyond our control. Any failure to successfully implement our business strategy could materially and adversely affect our results of operations and growth opportunities.
We face risks associated with our increasing emphasis on imported goods and private label products.
Increases in the cost or a disruption in the flow of our imported goods may adversely impact our revenues and profits and have an adverse impact on our cash flows. Our business strategy includes an increased emphasis on offering private label products and sourcing quality merchandise directly from low-cost suppliers. As a result, we expect to rely more heavily on imported goods from China and other countries and we expect the sale of imported goods to continue to increase as a percentage of our total revenues. To the extent we rely more heavily on the sale of private label products, our potential exposure to product liability claims may increase. In addition, our reputation may become more closely tied to our private label products and may suffer to the extent our customers are not satisfied with the quality of such products. Private label products will also increase our risks associated with returns and inventory obsolescence. Our reliance on imported merchandise subjects us to a number of risks, including: (a) increased difficulties in ensuring quality control; (b) disruptions in the flow of imported goods due to factors such as raw material shortages, work stoppages, strikes, and political unrest in foreign countries; (c) problems with oceanic shipping, including shipping container shortages; (d) economic crises and international disputes; (e) increases in the cost of purchasing or shipping foreign merchandise resulting from a failure of the United States to maintain normal trade relations with China and the other countries we do business in; (f) import duties, import quotas, and other trade sanctions; and (g) increases in shipping rates imposed by the trans-Pacific shipping cartel. If imported merchandise becomes more expensive or unavailable, we may not be able to transition to alternative sources in time to meet our customers’ demands. A disruption in the flow of our imported merchandise or an increase in the cost of those goods due to these or other factors would significantly decrease our revenues and profits and have an adverse impact on our cash flows.
We may be involved in lawsuits to defend against third party claims of intellectual property infringement, which in each case could require us to spend significant time and money and could prevent us from selling our products or conduct our business as presently conducted.
From time to time we are involved in litigation because others allege that we infringe on their intellectual property. These claims and any resulting lawsuits could subject us to significant liability for damages and invalidate our proprietary rights. In addition, these lawsuits, regardless of their merits, could be time consuming and expensive to resolve and may divert management’s time and attention. Any intellectual property litigation alleging our infringement of a third-party’s intellectual property also could force us or our customers to: i) stop producing or using products that use the challenged intellectual property, ii) obtain from the owner of the infringed intellectual property, at our expense, a license to sell or use the relevant technology at an additional cost, which license may not be available on reasonable terms, or at all, iii) redesign those products or services
23
that use the infringed technology or iv) change the ways in which we conduct our business so as to avoid infringing the technology. Any costs we incur from having to take any of these actions could be material.
Currency exchange rates may impact our financial condition and results of operations and may affect the comparability of our results between financial periods.
To the extent we source merchandise from overseas manufacturers and sell products internationally, exchange rate fluctuations could have an adverse effect on our results of operations and ability to service our U.S. dollar-denominated debt. All of our debt is in U.S. dollars while a portion of our revenue is derived from imported products and international sales. Therefore, fluctuations in the exchange rate of foreign currencies versus the U.S. dollar could impact our costs and revenues. In addition, for the purposes of financial reporting, any change in the value of the foreign currencies against the U.S. dollar during a given financial reporting period would result in a foreign currency loss or gain. Consequently, our reported earnings could fluctuate as a result of foreign exchange translation and may not be comparable from period to period.
It is difficult to forecast our revenue stream given the seasonal purchasing patterns of our customers and delays in passage of state budgets.
The seasonal purchasing patterns of our customers, the fact that our customers typically purchase products on an as-needed basis, and the lack of visibility into education funding levels if state budgets are delayed make it difficult for us to accurately forecast our revenue stream, which may vary significantly from period to period. Financial analysts and others that may seek to project our future performance face similar difficulties. The difficulty in accurately forecasting our revenue increases the likelihood that our financial results will differ materially from any projected financial results. Any shortfall in our financial results from our, or third-party, projected results could cause a decline in the trading price of our common stock.
We may have a material amount of intangible assets which are potentially subject to impairment.
At April 25, 2015, intangible assets represent approximately 20% of our total assets. We are required to evaluate goodwill for impairment on an annual basis and other intangibles if indicators of impairment exists. As discussed in Note 7 to the consolidated financial statements in Item 8 of this report, the Company recorded a goodwill impairment charge of $41.1 million in fiscal 2013, an impairment charge of $2.7 million in fiscal 2015 related to definite-lived intangible assets, and an impairment charge of $4.7 million related to indefinite-lived intangible assets in the third quarter of fiscal 2013. The impairments were determined as part of the fair value assessment of these assets. The fair value assessments of these assets are based on significant assumptions, including earnings projections and discount rates. Changes in these assumptions can have a significant impact on the fair value assessment and the resulting conclusion as to any potential asset impairment and the amount of any such impairment.
We have a material amount of capitalized product development costs which might be written-down.
We had capitalized product development costs of $19.6 million and $27.3 million at April 25, 2015 and April 26, 2014, respectively, related to internally developed products, which are amortized to expense over the lesser of five years or the product’s life cycle. Any changes in the estimated sales volume or life cycle of the underlying products could cause the currently capitalized costs or costs capitalized in the future to be impaired.
Our operations are dependent on our information systems.
We have integrated the operations of most of our divisions and subsidiaries, which operate on systems located at both our Greenville, Wisconsin, headquarters and our third-party hosted ERP system provider’s facilities. In addition, there are divisions running legacy systems hosted at their locations. All systems rely on continuous telecommunication connections to the main computers. If any of these connections becomes disrupted, or unavailable, for an extended period of time, the disruption could materially and adversely affect our business, operations and financial performance.
24
Increased cyber-security requirements and potential threats could pose a risk to our systems, networks, services and data.
Even though we have taken precautions to protect ourselves from unexpected events that could interrupt new and existing business operations and systems, we cannot be sure that fire, flood or other natural disasters would not disable our systems and/or prevent them from communicating between business segments. The occurrence of any such event could have a material adverse effect on our business, results of operations and financial condition.
We rely on our intellectual property in the design and marketing of our products.
We rely on certain trademarks, trade names and service names, along with licenses to use and exploit certain intellectual property related to designs of proprietary products, trademarks, trade names and service names (collectively, the “marks”) in the design and marketing of some of our products. We could lose our ability to use our brands if our marks were found to be generic or non-descriptive, as well as the right to sell proprietary products which are based upon licensed intellectual property. While no single mark is material to our business, the termination of a number of these marks could have an adverse effect on our business. The loss of certain licensed intellectual property related to proprietary products (for example, FOSS) may have a materially adverse effect on our business. We also rely on certain copyrights, patents and licenses other than those described above, the termination of which could have an adverse effect on our business.
| Item 1B. | Unresolved Staff Comments |
None.
| Item 2. | Properties |
Our corporate headquarters is located in a leased facility. The lease on this facility expires in April 2021. The facility is located at W6316 Design Drive, Greenville, Wisconsin, a combined office and warehouse facility of approximately 332,000 square feet, which also services both our Curriculum and Distribution segments. In addition, we leased or owned the following principal facilities as of June 30, 2015:
| Locations |
Approximate Square Footage |
Owned/ Leased |
Lease Expiration | |||||||
| Bellingham, Washington |
25,000 | Leased | 31-Jul-20 | |||||||
| Cambridge, Massachusetts (1) |
18,000 | Leased | 30-Apr-18 | |||||||
| Cameron, Texas . |
277,000 | Leased | 30-Sep-15 | |||||||
| Fresno, California (3) |
163,000 | Leased | 31-Oct-17 | |||||||
| Lancaster, Pennsylvania (2) |
73,000 | Leased | 30-Jun-17 | |||||||
| Lancaster, Pennsylvania |
125,000 | Leased | 30-Jun-17 | |||||||
| Mansfield, Ohio (2) |
315,000 | Leased | 31-Oct-16 | |||||||
| Nashua, New Hampshire (1) |
348,000 | Leased | 31-Dec-18 | |||||||
| San Fernando, California |
37,000 | Leased | 31-Jan-16 | |||||||
| (1) | Location primarily services the Curriculum segment. |
| (2) | Location services both business segments. |
| (3) | Subleased through October 31, 2017 |
The 73,000 square foot Lancaster, Pennsylvania facility is used for manufacturing wood products. The other facilities are distribution centers and/or office space. We believe that our properties are adequate to support our operations for the foreseeable future. We regularly review the utilization and consolidation of our facilities.
25
| Item 3. | Legal Proceedings |
The Company is not currently party to any material pending legal proceedings, other than routine litigation incidental to the Company’s business in the ordinary course.
| Item 4. | Mine Safety Disclosure. |
Not applicable.
26
EXECUTIVE OFFICERS OF THE REGISTRANT
As of June 30, 2015, the following persons served as executive officers of School Specialty:
| Name and Age of Officer |
||
| Joseph M. Yorio Age 50 |
Mr. Yorio joined the Company as its President and Chief Executive Officer and a member of the Board of Directors in April 2014. Prior to joining the Company, Mr. Yorio served as President and Chief Executive Officer of NYX Global LLC, a business services and consulting company, from January 2011 to April 2014. Concurrently, he also performed the duties and responsibilities of Managing Director for Vertx (a NYX Global client), a developer, manufacturer, marketer and distributor of tactical and outdoor apparel and equipment. Prior to that, Mr. Yorio was President from March 2009 to December 2010 and Chief Executive Officer from June 2009 to December 2010 of Xe Services LLC (now known as Academi), a private aerospace and defense company. In addition, Mr. Yorio previously held a variety of executive, operations and sales positions primarily focused on distribution and logistics. He served as the Vice President, U.S. and North American Air Hub Operations with DHL Express, where he was responsible for sortation, inbound and outbound freight from the largest private airport in North America servicing the global markets. Prior to that, he was President of the Central Midwest Division of Corporate Express, where he led a self-sustaining operating division that included six distribution centers. He also served in the U.S. Army as a 75th Ranger Regiment and Special Forces officer and is a medically retired combat veteran. Mr. Yorio holds a B.A. degree in psychology from Saint Vincent College, a Master’s Certificate in executive leadership from Cornell University, S.C. Johnson Graduate School of Management, and an M.B.A in management from Florida Institute of Technology, Nathan M. Bisk College of Business. | |
| Ryan Bohr Age 41 |
Mr. Bohr has served as Executive Vice President and Chief Financial Officer of the Company since October 2014. Prior to joining the Company, Mr. Bohr served as Chief Executive Officer of Fresh Matters LLC, an early stage specialty beverage company, from January 2014 to October 2014 after serving as operations advisor to the Company during 2013. Prior to that, Mr. Bohr was a Partner at Hilco Equity Partners, a private equity firm focused on special situations, where he worked from March 2003 to December 2012. While with Hilco Equity, Mr. Bohr played a key role in all aspects of the Fund’s activities, including fundraising, day-to-day operations for certain portfolio companies and execution of the firm’s investment strategy across the consumer and industrial industries. In addition, Mr. Bohr has previously held other senior operating and financial positions and worked in private equity, investment banking and public accounting for several years. Mr. Bohr holds a BBA degree in accounting from the University of Notre Dame and earned the CPA designation in 1996. | |
| Edward J. Carr, Jr. Age 49 |
Mr. Carr has served as Executive Vice President and Chief Sales Officer of the Company since January 2015. Prior to joining the Company, Mr. Carr served as Corporate Vice President of Sales with Reinhart Foodservice (RFS), LLC, a multi-billion dollar foodservice distribution company with over 30 distribution centers serving independent and chain restaurants, schools and healthcare facilities throughout the United States, from January 2014 to January 2015. In this position, he was responsible for managing the RFS’s largest customer accounts and developing and overseeing the national go-to-market strategy and sales force. Mr. Carr served as the RFS Board member on the Boards of Directors for the International Foodservice Distributors Association (IFDA) and the Distribution |
27
| Name and Age of Officer |
||
| Market Advantage (DMA). Prior to RFS, Mr. Carr served as Executive Vice President of Sales and Marketing of Nicholas and Company, an independent food service distributor, from June 2006 to January 2014. In this role, Mr. Carr was responsible for all strategies related to account acquisition, retention and penetration. He oversaw and led all sales initiatives and was successful in driving marketing programs across multiple sales channels and industry subsets. Mr. Carr represented Nicholas and Company nationally with the IFDA, Independent Marketing Alliance (IMA), DMA, and Markon Produce Cooperative. He also served as the co-chair of the IFDA Supplier Advisory Council while at both RFS and Nicholas and Company. From 1996 to 2006, Mr. Carr held several leadership positions with Corporate Express, one of the world’s largest business-to-business suppliers of essential office and computer products and services, where he most recently served as President, Pennsylvania Division. Prior to this role, he served as Vice President of Sales, Central Midwest Division and Division Sales Manager, Washington Division. Prior to Corporate Express, Mr. Carr held management positions with Western Parcel Express and with Airborne Express. He is a graduate of the University of Utah, with a B.S. in Mass Communications, Public Relations. | ||
| Todd A. Shaw Age 49 |
Mr. Shaw has served as the Executive Vice President, Operations of the Company since December 2014. Mr. Shaw previously served as the Company’s Vice President, Operational Excellence and Continuous Improvement from July 2014 to November 2014. Prior to joining the Company, Mr. Shaw served as Vice President of Operations of Prolitec Inc., a provider of air treatment and indoor air quality technologies from September 2011 to July 2014. Prior to that, Mr. Shaw served as Chief Operating Officer of NYX Global LLC, a business services and consulting company, from October 2010 to September 2011. From May 2009 to October 2010, Mr. Shaw served as Senior Vice President of Facility Services and Logistics of Xe Services LLC (now known as Academi), a private aerospace and defense company. Earlier in his career, he worked primarily in operational roles, serving as Division Manager with Shorr Packaging Corporation, Vice President of Operations with Corporate Express, and Area Operations Director with Unisource Worldwide. Mr. Shaw attended the University of Wisconsin—Platteville where he studied criminal justice. | |
| Kevin Baehler Age 51 |
Mr. Baehler has served as Senior Vice President, Corporate Controller and Chief Accounting Officer of the Company since October 2014. Mr. Baehler joined the Company in 2004 as Corporate Controller, and was promoted to Vice President, Corporate Controller in 2007. From June 2007 to April 2008, he served as interim Chief Financial Officer. In April 2008, after stepping down as interim Chief Financial Officer, he was appointed to the position of Senior Vice President, Corporate Controller. From January 2014 to October 2014, he served as interim Chief Financial Officer. Since joining the Company, he has been responsible for all aspects of the Company’s financial reporting process. Prior to joining the Company, Mr. Baehler spent six years with GE Healthcare, a division of General Electric Company in various financial positions, most recently as Assistant Global Controller. Mr. Baehler obtained his undergraduate degree in accounting from the University of Wisconsin—Whitewater and he is a Certified Public Accountant. |
The term of office of each executive officer is from one annual meeting of the Board of Directors until the next annual meeting of the Board of Directors or until a successor for each is selected. There are no arrangements or understandings between any of our executive officers and any other person (not an officer or director of School Specialty acting as such) pursuant to which any of our executive officers was selected as an officer of School Specialty.
28
PART II
| Item 5. | Market for Registrant’s Common Equity, Related Stockholder Matters and Issuer Purchases of Equity Securities |
Market Information
The Company’s common stock traded on the OTCQB market place of the OTC Market Groups as of February 6, 2013 under the symbol “SCHSQ” through June 11, 2013, the Effective Date of the Reorganization Plan. The Company’s common stock currently trades on the OTCQB market place of the OTC Market Groups under the symbol “SCOO”. The table below sets forth the reported high and low closing sale prices for shares of our common stock, during the indicated quarters.
| Fiscal 2015 |
High | Low | ||||||
| Quarter ended July 26, 2014 |
$ | 121.00 | $ | 107.00 | ||||
| Quarter ended October 25, 2014 |
120.50 | 118.00 | ||||||
| Quarter ended January 24, 2015 |
120.00 | 110.25 | ||||||
| Quarter ended April 25, 2015 |
110.25 | 95.00 | ||||||
| Fiscal 2014 |
High | Low | ||||||
| Six weeks ended June 11, 2013 (Predecessor) |
N/A | N/A | ||||||
| Seven weeks ended July 27, 2013 (Successor) |
N/A | N/A | ||||||
| Quarter ended October 26, 2013 |
N/A | N/A | ||||||
| Quarter ended January 25, 2014 |
$ | 88.00 | $ | 74.00 | ||||
| Quarter ended April 26, 2014 |
110.50 | 74.50 | ||||||
The first trade of the Successor Company’s common stock occurred in the third quarter of fiscal 2014.
Holders
As of June 30, 2015, there were approximately 60 record holders of the common stock of the Company.
Dividends
We have not declared or paid any cash dividends on our common stock to date. We currently intend to retain our future earnings to pay down debt, finance the growth, development and expansion of our business or for other endeavors deemed prudent. Accordingly, we do not expect to pay cash dividends on our common stock in the foreseeable future. In addition, our ability to pay dividends is restricted or prohibited from time to time by financial covenants in our credit agreements and debt instruments. Our asset based lending facility and our term loan credit agreement contains restrictions on, and in some circumstances may prevent, our payment of dividends.
29
PERFORMANCE GRAPH
The following graph compares the total shareholder return on our Common Stock since October 30, 2013 with that of the Russell 3000 Stock Market Index and a peer group index including: Office Depot, Inc. (ODP), Staples, Inc. (SPLS), Cambium Learning Group, Inc. (ABCD), The McGraw-Hill Companies, Inc. (MHP), Pearson PLC (PSO), Scholastic Corporation (SCHL), Scientific Learning Corp (SCIL) and Virco Manufacturing Corp (VIRC).
The total return calculations set forth below assume $100 invested on October 30, 2013, which is the first date on which shares of the Successor Company were traded. The total return calculations assume the reinvestment of any dividends into additional shares of the same class of securities at the frequency with which dividends were paid on such securities through April 25, 2015. The stock price performance shown in the graph below should not be considered indicative of potential future stock price performance.
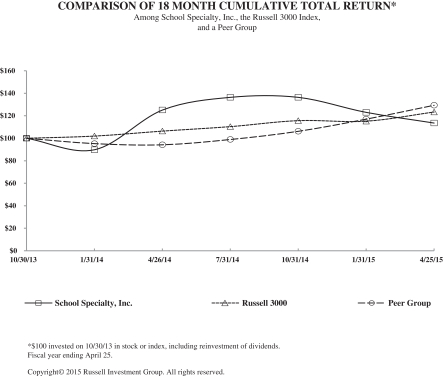
| 10/30/13 | 1/31/14 | 4/26/14 | 7/31/14 | 10/31/14 | 1/31/15 | 4/25/15 | ||||||||||||||||||||||
| School Specialty, Inc. |
100.00 | 89.77 | 125.06 | 136.36 | 136.36 | 123.01 | 113.52 | |||||||||||||||||||||
| Russell 3000 |
100.00 | 101.93 | 106.36 | 110.34 | 115.67 | 115.17 | 123.33 | |||||||||||||||||||||
| Peer Group |
100.00 | 95.23 | 94.18 | 98.90 | 106.17 | 116.99 | 129.32 | |||||||||||||||||||||
30
| Item 6. | Selected Financial Data |
SELECTED FINANCIAL DATA
(In thousands, except per share data)
| Fiscal Year | ||||||||||||||||||||||||||
| Successor Company | Predecessor Company | |||||||||||||||||||||||||
| 2015 | 2014 | 2014 | 2013 | 2012 | 2011 | |||||||||||||||||||||
| (52 weeks) | (46 weeks ended April 26, 2014) |
(6 weeks ended June 11, 2013) |
(52 weeks) | (52 weeks) | (53 weeks) | |||||||||||||||||||||
| Statement of Operations Data: |
||||||||||||||||||||||||||
| Revenues |
$ | 621,868 | $ | 572,045 | $ | 58,697 | $ | 674,998 | $ | 731,991 | $ | 762,078 | ||||||||||||||
| Cost of revenues |
393,710 | 349,845 | 35,079 | 411,118 | 448,977 | 454,557 | ||||||||||||||||||||
|
|
|
|
|
|
|
|
|
|
|
|
|
|||||||||||||||
| Gross profit |
228,158 | 222,200 | 23,618 | 263,880 | 283,014 | 307,521 | ||||||||||||||||||||
| Selling, general and administrative expenses |
232,479 | 213,144 | 27,473 | 267,491 | 274,967 | 287,560 | ||||||||||||||||||||
| (Gain) on sale of product line |
— | — | — | — | (4,376 | ) | — | |||||||||||||||||||
| Facility exit costs and restructuring |
6,056 | 6,552 | — | — | — | — | ||||||||||||||||||||
| Impairment charge |
2,713 | — | — | 45,789 | 107,501 | 411,390 | ||||||||||||||||||||
|
|
|
|
|
|
|
|
|
|
|
|
|
|||||||||||||||
| Operating (loss) income |
(13,090 | ) | 2,504 | (3,855 | ) | (49,400 | ) | (95,078 | ) | (391,429 | ) | |||||||||||||||
| Interest expense |
19,599 | 16,882 | 3,235 | 28,600 | 27,182 | 28,157 | ||||||||||||||||||||
| Loss on early extinguishment of debt |
— | — | — | 10,201 | — | — | ||||||||||||||||||||
| Change in fair value of interest rate swap |
(45 | ) | 483 | — | — | — | — | |||||||||||||||||||
| Refund of early termination fee |
— | (4,054 | ) | — | — | — | — | |||||||||||||||||||
| Reorganization item, net |
271 | 6,420 | (84,799 | ) | 22,979 | — | — | |||||||||||||||||||
| Early termination of long-term indebtedness |
— | — | — | 26,247 | — | — | ||||||||||||||||||||
| Impairment of long-term asset |
— | — | — | 1,414 | — | — | ||||||||||||||||||||
| Impairment of investment in unconsolidated affiliate |
— | — | — | 7,749 | 9,012 | 6,861 | ||||||||||||||||||||
| Expense associated with convertible debt exchange |
— | — | — | — | 1,090 | 1,920 | ||||||||||||||||||||
|
|
|
|
|
|
|
|
|
|
|
|
|
|||||||||||||||
| Income (loss) before provision for (benefit from) income taxes |
(32,915 | ) | (17,227 | ) | 77,709 | (146,590 | ) | (132,362 | ) | (428,367 | ) | |||||||||||||||
| Provision for (benefit from) income taxes |
617 | 258 | 1,641 | (334 | ) | 167 | (73,132 | ) | ||||||||||||||||||
|
|
|
|
|
|
|
|
|
|
|
|
|
|||||||||||||||
| Earnings (loss) before losses from investment in unconsolidated affiliate |
(33,532 | ) | (17,485 | ) | 76,068 | (146,256 | ) | (132,529 | ) | (355,235 | ) | |||||||||||||||
| Losses of unconsolidated affiliate |
— | — | — | (1,436 | ) | (1,488 | ) | (1,038 | ) | |||||||||||||||||
|
|
|
|
|
|
|
|
|
|
|
|
|
|||||||||||||||
| Net income (loss) |
$ | (33,532 | ) | $ | (17,485 | ) | $ | 76,068 | $ | (147,692 | ) | $ | (134,017 | ) | $ | (356,273 | ) | |||||||||
|
|
|
|
|
|
|
|
|
|
|
|
|
|||||||||||||||
| Weighted average shares outstanding: |
||||||||||||||||||||||||||
| Basic and Diluted |
1,000 | 1,000 | 18,922 | 18,922 | 18,878 | 18,870 | ||||||||||||||||||||
| Earnings (loss) per share of common stock: |
||||||||||||||||||||||||||
| Basic and Diluted |
$ | (33.53 | ) | $ | (17.49 | ) | $ | 4.02 | $ | (7.81 | ) | $ | (7.10 | ) | $ | (18.88 | ) | |||||||||
| Successor Company | Predecessor Company | |||||||||||||||||||||||||
| April 25, 2015 |
April 26, 2014 |
April 27, 2013 |
April 28, 2012 |
April 30, 2011 |
||||||||||||||||||||||
| Balance Sheet Data: |
||||||||||||||||||||||||||
| Working capital (deficit) |
$ | 100,595 | $ | 111,922 | $ | (30,325 | ) | $ | 89,709 | $ | (17,507 | ) | ||||||||||||||
| Total assets |
312,952 | 339,619 | 427,573 | 463,521 | 637,544 | |||||||||||||||||||||
| Long-term debt |
156,549 | 153,987 | — | 289,668 | 198,036 | |||||||||||||||||||||
| Total debt |
182,193 | 166,375 | 198,302 | 290,623 | 296,279 | |||||||||||||||||||||
| Stockholders’ equity (deficit) |
66,377 | 103,057 | (79,192 | ) | 67,946 | 201,629 | ||||||||||||||||||||
31
| Item 7. | Management’s Discussion and Analysis of Financial Condition and Results of Operations (“MD&A”) |
You should read the following discussion and analysis in conjunction with our consolidated financial statements and related notes, included elsewhere in this Annual Report.
Factors Affecting Comparability
Fresh Start Accounting Adjustments
The Company adopted fresh start accounting and reporting effective June 11, 2013, the Fresh Start Reporting Date. The financial statements as of the Fresh Start Reporting Date report the results of the Successor Company with no beginning retained earnings or accumulated deficit. Any financial statement presentation of the Successor Company represents the financial position and results of operations of a new reporting entity and is not comparable to prior periods presented by the Predecessor Company. The financial statements for periods ended prior to the Fresh Start Reporting Date do not include the effect of any changes in the Predecessor Company’s capital structure or changes in the fair value of assets and liabilities as a result of fresh start accounting.
Accordingly, management has provided a non-GAAP analysis entitled “Non-GAAP Financial Information—Combined Results” for the twelve months ended April 26, 2014. Non-GAAP Financial Information—Combined Results combines GAAP results of the Successor Company for the forty-six weeks ended April 26, 2014 and GAAP results of the Predecessor Company for the six weeks ended June 11, 2013. Management’s non-GAAP analysis compares the Successor Company’s GAAP results for the twelve months ended April 25, 2015 and April 27, 2013 for certain financial items to the Non-GAAP Financial Information—Combined Results.
Background
We are a leading distributor of educational products, services and programs serving the preK-12 education market across the United States and Canada. We offer more than 60,000 items through an innovative two-pronged marketing approach that targets both school administrators and individual teachers.
On January 28, 2013, we filed voluntary petitions for relief under Chapter 11 of the United States Code (the “Bankruptcy Code”) in the United States Bankruptcy Court for the District of Delaware (the “Bankruptcy Court”). The cases (the “Chapter 11 Cases”) were jointly administered as Case No. 13-10125 (KJC) under the caption “In re School Specialty, Inc., et al.” We continued to operate our business as “debtors-in-possession” under the jurisdiction of the Bankruptcy Court and in accordance with the applicable provisions of Chapter 11 and orders of the Bankruptcy Court. Our foreign subsidiaries were not part of the Chapter 11 Cases.
On May 23, 2013, the Bankruptcy Court entered an order confirming the Reorganization Plan, and a corrected copy of the Reorganization Plan was entered by the Bankruptcy Court on June 3, 2013. The Reorganization Plan became effective on June 11, 2013 (the “Effective Date”). Pursuant to the Reorganization Plan, on the Effective Date, the Company’s existing credit agreements, outstanding convertible subordinated debentures, equity plans and certain other agreements were cancelled. In addition, all outstanding equity interests of the Company that were issued and outstanding prior to the Effective Date were cancelled on the Effective Date. Also on the Effective Date, in accordance with and as authorized by the Reorganization Plan, the Company reincorporated in Delaware and issued a total of 1,000,004 shares of Common Stock of the reincorporated company to holders of certain allowed claims against the Debtors in exchange for such claims. As of June 12, 2013, there were 60 record holders of the new common stock of the reorganized Company issued pursuant to the Reorganization Plan. The Reorganization Plan is described in additional detail above in Item 1, Business. The consolidated financial statements as of and for the year ended April 25, 2015 and as of April 26, 2014 and for the forty-six weeks then ended and any references to “Successor” or “Successor Company” show the financial position and results of operations of the reorganized Company subsequent to bankruptcy emergence on June 11, 2013. References to “Predecessor” or “Predecessor Company” refer to the financial position and results of operations of the Company prior to the bankruptcy emergence.
32
Our goal is to grow profitably as a leading provider of supplies, product, services and curriculum for the education market. We have experienced revenue declines in each of the last five fiscal years due primarily to the significant impact the current macroeconomic conditions have had on school spending. We believe revenue growth can be realized in future years. We expect to achieve this goal over the long-term through an organic growth strategy based on leveraging our strong brand names and distribution capabilities and transforming the Company’s sales and marketing to a more market/category focused approach with a balance of new customer acquisition and customer retention, and exploring new markets or revenue streams. New revenue streams include exploring opportunities in areas that could expand our addressable market, such as distribution to non-education customers, expansion into new product categories, continued growth in the alternative channel segment, and potentially, abroad in select international markets. In addition, the Company is committed to continuing to invest in its internal product development efforts in order to expand curriculum-based product offerings.
In fiscal 2015, the Company had an operating loss of $13.1 million. During the forty-six weeks ended April 26, 2014 the Company had operating income of $2.5 million and during the six weeks ended June 11, 2013 the Company had an operating loss of $3.9 million. The Company’s operating loss included $6.1 million of facility exit and restructuring costs and $2.7 million of impairment charges in fiscal 2015 and $6.6 million of facility exit and restructuring costs in the forty-six weeks ended April 26, 2014. Due to the significance of the restructuring costs and impairment charges in fiscal 2015 and fiscal 2014, the Company believes it is more meaningful to compare operating income and margin excluding these restructuring costs and pre-petition bankruptcy related charges. Excluding the impact of the restructuring costs and bankruptcy charges, the Company’s operating loss was $4.3 million for fiscal 2015 and its operating income was $9.1 million for the forty-six weeks ended April 26, 2014. In fiscal 2015, the Company’s revenue declined 1.4% from combined fiscal 2014 compared to a decline of 6.6% in combined fiscal 2014 compared to fiscal 2013. The Company did have positive revenue growth in certain product categories, most notably Furniture and Science. Gross margin declined in fiscal 2015 through a combination of product mix and incremental product development amortization. These declines, though, have been significantly offset by expense reductions. In fiscal 2015, the Company completed an organizational realignment to drive growth, achieve efficiencies, and increase profit margins. These organizational realignment actions included the following:
| • | Sales Force Realignment—This included adapting the sales force to a newly implemented coverage model to improve customer service, increase customer touch points, and grow revenues. This included the expansion of the Company’s inside sales organization in order to increase contact with smaller districts. |
| • | Top Grading Assessments—This included a review of business functions and employee performance. |
| • | Right-Sizing the Organization—This included integrating disparate departments across the organization to optimize operational efficiency and to match the employee footprint to the size of the business. This resulted in better aligning departments in a shared service model. |
The implementation of these actions was completed in fiscal 2015. These actions resulted in lowering the employee count from 1,450 to approximately 1,180 while consolidating redundant roles and activities. We estimate the annualized impact of these actions will be approximately $20 million.
While remaining focused on lowering costs through consolidation and process improvements, the Company is equally focused on revenue growth. While overall revenue was relatively stable in fiscal 2015, product categories with revenue growth were offset by categories that continued to have revenue declines. The Company believes it can generate revenue growth through initiatives that improve or enhance:
| • | Collaboration among sales, marketing, merchandising, and operations, |
| • | Product innovation, |
| • | Product category specific sales and support expertise, |
| • | Effectiveness of the sales model, and |
| • | Customer experiences. |
33
Our business and working capital needs are highly seasonal, with peak sales levels occurring from June through October. During this period, we receive, ship and bill the majority of our business so that schools and teachers receive their products by the start of each school year. Our inventory levels increase in April through June in anticipation of the peak shipping season. The majority of shipments are made between June and October and the majority of cash receipts are collected from September through December. As a result, we usually earn more than 100% of our annual net income in the first two quarters of our fiscal year and operate at a net loss in our third and fourth fiscal quarters.
Results of Operations
The following table sets forth certain information as a percentage of revenues on a historical basis concerning our results of operations for fiscal 2015, forty-six weeks ending April 26, 2014, the six weeks ending June 11, 2013 and fiscal 2013:
| Successor Company | Predecessor Company | |||||||||||||||||
| Fiscal Year 2015 |
Forty-Six Weeks Ended April 26, 2014 |
Six Weeks Ended June 11, 2013 |
Fiscal Year 2013 |
|||||||||||||||
| Revenues |
100.0 | % | 100.0 | % | 100.0 | % | 100.0 | % | ||||||||||
| Cost of revenues |
63.3 | 61.2 | 59.8 | 60.9 | ||||||||||||||
|
|
|
|
|
|
|
|
|
|||||||||||
| Gross profit |
36.7 | 38.8 | 40.2 | 39.1 | ||||||||||||||
| Selling, general and administrative expenses |
37.4 | 37.3 | 46.8 | 39.6 | ||||||||||||||
| Facility exit costs and restructuring |
1.0 | 1.1 | 0.0 | 0.0 | ||||||||||||||
| Impairment charge |
0.4 | 0.0 | 0.0 | 6.8 | ||||||||||||||
|
|
|
|
|
|
|
|
|
|||||||||||
| Operating income (loss) |
-2.1 | 0.4 | -6.6 | -7.3 | ||||||||||||||
| Interest expense |
3.2 | 3.0 | 5.5 | 4.2 | ||||||||||||||
| Loss on early extinguishment of debt |
0.0 | 0.0 | 0.0 | 1.5 | ||||||||||||||
| Early termination of long-term indebtedness |
0.0 | 0.0 | 0.0 | 3.9 | ||||||||||||||
| Impairment of long-term asset |
0.0 | 0.0 | 0.0 | 0.2 | ||||||||||||||
| Impairment of investment in unconsolidated affiliate |
0.0 | 0.0 | 0.0 | 1.1 | ||||||||||||||
| Change in fair value of interest rate swap |
0.0 | 0.1 | 0.0 | 0.0 | ||||||||||||||
| Refund of early termination fee |
0.0 | -0.7 | 0.0 | 0.0 | ||||||||||||||
| Reorganization items, net |
0.0 | 1.1 | -144.5 | 0.0 | ||||||||||||||
|
|
|
|
|
|
|
|
|
|||||||||||
| Income (loss) before provision for (benefit from) income taxes |
-5.3 | -3.1 | 132.4 | -18.2 | ||||||||||||||
| Provision for (benefit from) income taxes |
0.1 | 0.0 | 2.8 | 3.4 | ||||||||||||||
|
|
|
|
|
|
|
|
|
|||||||||||
| Income (loss) before losses from investment in unconsolidated affiliate |
-5.4 | -3.1 | 129.6 | -21.6 | ||||||||||||||
| Losses of unconsolidated affiliate |
0.0 | 0.0 | 0.0 | 0.0 | ||||||||||||||
|
|
|
|
|
|
|
|
|
|||||||||||
| Net income (loss) |
-5.4 | % | -3.1 | % | 129.6 | % | -21.6 | % | ||||||||||
|
|
|
|
|
|
|
|
|
|||||||||||
Non-GAAP Financial Information—Combined Results
As a result of the emergence from bankruptcy occurring six weeks into fiscal 2014, management believes that the presentation of Non-GAAP Financial Information—Combined Results offers a more useful non-GAAP normalized comparison to GAAP results for the twelve months ended April 25, 2015 and April 27, 2013. The Non-GAAP Financial Information—Combined Results presented below are reconciled to the most comparable GAAP measures. Thus, the combined results noted below for fiscal 2014 include the full fifty-two weeks of the fiscal year.
34
Consolidated Results
Successor Company GAAP results for the Twelve Months Ended April 25, 2015 Compared to Non-GAAP Combined Results for the Twelve Months Ended April 26, 2014
Overview of Fiscal 2015
Revenues
| Successor Company |
Successor Company |
Predecessor Company |
Non-GAAP Combined |
|||||||||||||||
| Twelve Months Ended April 25, 2015 |
Forty-Six Weeks Ended April 26, 2014 |
Six Weeks Ended June 11, 2013 |
Twelve Months Ended April 26, 2014 |
|||||||||||||||
| Revenues |
$ | 621,868 | $ | 572,045 | $ | 58,697 | $ | 630,742 | ||||||||||
Revenues for the twelve months ended April 25, 2015 decreased 1.4%, or $8.8 million from the combined twelve months ended April 26, 2014.
Distribution segment revenues decreased $10.9 million, from the combined revenue in fiscal 2014 of $542.4 million to $531.5 million in fiscal 2015. The student planner and agenda products accounted for $8.7 million of the decline. We believe schools consider agenda products more discretionary in nature and some schools are de-emphasizing paper-based agendas in favor of digital products. In addition, schools are shifting their remaining agenda purchases to those with less content and, thus, lower average selling prices. The Company’s agenda product line’s average selling price decreased by approximately 5%, which resulted in $2.5 million of the decline in the category. Commercial printing generated zero revenues in fiscal 2015 as compared to $4.3 million of revenues generated in fiscal 2014 prior to the sale of the print plant assets in November 2013. Furniture revenues were up $3.8 million for the twelve months of fiscal 2015 as the Company has been successful in both re-establishing credit terms with most furniture vendors and gaining back customer confidence in the year following the emergence from bankruptcy. Overall furniture orders are up over 13.8%, year-over-year, in fiscal 2015. Revenue in the remaining product categories declined by $1.5 million in fiscal 2015.
Curriculum segment revenues increased $2.1 million, from $88.3 million of combined revenue in fiscal 2014 to $90.4 million in fiscal 2015. The Company experienced strong sales of its science curriculum products in Texas in connection with the state’s recent adoption of new science standards.
Gross Profit
| Successor Company |
Successor Company |
Predecessor Company |
Non-GAAP Combined |
|||||||||||||||
| Twelve Months Ended April 25, 2015 |
Forty-Six Weeks Ended April 26, 2014 |
Six Weeks Ended June 11, 2013 |
Twelve Months Ended April 26, 2014 |
|||||||||||||||
| Gross profit |
$ | 228,158 | $ | 222,200 | $ | 23,618 | $ | 245,818 | ||||||||||
Gross profit of $228.2 million for fiscal 2015 was down 7.2% from the combined gross profit of $245.8 million in fiscal 2014. Gross margin was 36.7% for fiscal 2015 as compared to combined gross margin of 39.0% for fiscal 2014. The primary driver of the gross margin decline was incremental product development amortization of $7.1 million in fiscal 2015 which contributed 120 basis points of the gross margin decline.
Distribution segment gross profit decreased $11.8 million from $199.7 million of combined gross profit in fiscal 2014 to $187.9 million in fiscal 2015. Distribution gross margins declined by 150 basis points from 36.8% in fiscal 2014 to 35.3% in fiscal 2015. The decrease in gross margin is primarily related to the Company’s agenda product category. Approximately 130 basis points of the gross margin decline relates to the Company’s student planner and agenda product category, as both the mix of agendas as a percentage of the overall segment revenues and gross margins within the agendas category declined. The lower gross margins within the agenda
35
category are related to a combination of the lower average selling prices of agendas and incremental product development amortization. The remaining decline in gross margin is related to volume decline and product mix within the remaining product categories.
Curriculum segment gross profit decreased $5.8 million from a combined $46.1 million of gross profit in fiscal 2014 to $40.3 million in fiscal 2015. Gross margin was down 720 basis points from 52.2% in fiscal 2014 to 45.0% in fiscal 2015 resulting from, incremental product development amortization of $5.8 million. The incremental product development amortization was related to a combination of the increased amortization of the investment in custom CPO and FOSS product in support of the Texas Science adoption and approximately $2.5 million of product development write downs.
Selling, General and Administrative Expenses
| Successor Company |
Successor Company |
Predecessor Company |
Non-GAAP Combined |
|||||||||||||||
| Twelve Months Ended April 25, 2015 |
Forty-Six Weeks Ended April 26, 2014 |
Six Weeks Ended June 11, 2013 |
Twelve Months Ended April 26, 2014 |
|||||||||||||||
| Selling, general and administrative expenses |
$ | 232,479 | $ | 213,144 | $ | 27,473 | $ | 240,617 | ||||||||||
SG&A includes selling expenses, the most significant of which are: sales wages and commissions; operations expenses, which includes customer service, warehouse and out-bound freight costs; catalog costs; general administrative overhead, which includes information systems, accounting, legal and human resources; and depreciation and intangible asset amortization expense.
SG&A decreased $8.1 million from $240.6 million in fiscal 2014 to $232.5 million in fiscal 2015. As a percent of revenue, SG&A decreased from 38.1% in fiscal 2014 to 37.4% in fiscal 2015. The previously mentioned restructurings and employee reductions contributed to the improved SG&A leverage.
SG&A attributable to the Distribution and Curriculum segments decreased $9.9 million and Corporate SG&A increased $1.8 million in fiscal 2015 as compared to combined SG&A in fiscal 2014.
Distribution segment SG&A decreased $4.3 million, or 2.4%, from $183.4 million of combined SG&A in fiscal 2014 to $179.1 million in fiscal 2015. The segment had a decrease of $1.6 million in its marketing costs primarily associated with a decrease in catalog costs as the Company reduced the number of seasonal catalog mailings and reduced circulation of other catalogs. This reduction reflects the Company’s continued strategy of increasing customer interactions through digital marketing campaigns and a more efficient use of printed catalogs. Compensation and benefit costs for the Distribution segment decreased $4.3 million which is net of a $1.0 million current year increase related to the elimination of an unpaid furlough week. Headcount for the Distribution segment has been reduced by approximately 14% compared to fiscal 2014. These decreases were partially offset by $1.9 million of additional outbound freight costs. Distribution segment SG&A decreased as a percent of revenue from 33.8% in fiscal 2014 to 33.7% in fiscal 2015.
Curriculum segment SG&A decreased $5.6 million, or 11.5%, from $48.9 million of combined SG&A in fiscal 2014 to $43.3 million fiscal 2015. The segment had a decrease of $0.7 million in its marketing costs primarily associated with a decrease in catalog costs as the Company reduced the number of seasonal catalog mailings. Compensation and benefit costs for the Curriculum segment decreased by $3.0 million. Headcount for the Curriculum segment has been reduced by approximately 25% compared to fiscal 2014. Curriculum segment SG&A decreased as a percent of revenue from 55.4% in fiscal 2014 to 47.9% in fiscal 2015.
The Corporate SG&A increase of $1.8 million is related primarily to process improvement implementation costs such as consulting fees and warehouse implementation costs associated with transitioning the majority of
36
fulfillment activities to the Company’s Mansfield, Ohio distribution center. Approximately $0.6 million of the increase is attributable to the fiscal 2015 write down of the Company’s Salina, Kansas facility which was classified as an asset held for sale, and was sold for $1.6 million in the fourth quarter of fiscal 2015.
Facility Exit Costs and Restructuring
In fiscal 2015, the Company recorded $6.1 million of restructuring charges related primarily to severance and adjustments to estimated lease termination costs associated with a prior year distribution center closure. Severance in fiscal 2015 associated with the integration of functions and transition to an integrated shared services model was $5.5 million of the $6.1 million total facility exit and restructuring costs.
In fiscal 2014, the Company recorded $6.6 million of bankruptcy-related facility exit costs and restructuring charges. The closure of the Company’s distribution centers and printing plants resulted in charges of $3.8 million which included lease termination costs and other shutdown related expenditures. Severance costs in fiscal 2014 were $2.8 million of the $3.8 million total facility exit and restructuring costs.
Impairment Charges
The Company recorded an impairment charge of $2.7 million in fiscal 2015 related to the amortizable asset associated with the agenda product category’s digital content and digital delivery development efforts. The Company is focused on the print-based agenda products and does not currently plan to continue to invest in the digital agenda product offerings.
Interest Expense
| Successor Company |
Successor Company |
Predecessor Company |
Non-GAAP Combined |
|||||||||||||||
| Twelve Months Ended April 25, 2015 |
Forty-Six Weeks Ended April 26, 2014 |
Six Weeks Ended June 11, 2013 |
Twelve Months Ended April 26, 2014 |
|||||||||||||||
| Interest expense |
$ | 19,599 | $ | 16,882 | $ | 3,235 | $ | 20,117 | ||||||||||
Interest expense decreased $0.5 million, from $20.1 million in fiscal 2014 to $19.6 million in fiscal 2015.
Non-cash interest increased in fiscal 2015 by $0.6 million as compared to fiscal 2014. Non-cash interest expense associated with paid-in-kind interest on deferred vendor obligations increased by $0.9 million, mainly due to the increase in deferred vendor obligations. This increase was partially offset by a decrease of $0.3 million in non-cash interest related to debt fee amortization and original issue discount accretion. In fiscal 2015, interest expense associated with the Successor Company’s New Term Loan was approximately $0.7 million lower than the term loan interest expense in fiscal 2014, primarily due to a lower interest rate under the New Term Loan as compared to the Predecessor Company’s term loan. In fiscal 2015, interest expense associated with the Successor Company’s New ABL Facility was approximately $0.2 million lower than the interest expense for fiscal 2014, primarily due to a lower average outstanding balance.
Change in Fair Value of Interest Rate Swap
In the second quarter of fiscal 2014, the Company entered into an interest rate swap agreement that effectively fixes the interest payments on a portion of the Company’s variable-rate debt. The swap, which has a termination date of September 11, 2016, effectively fixes the LIBOR-based interest rate on the debt in the amount of the notional amount of the swap at 9.985%. The notional amount of the swap at April 25, 2015 was $72.5 million. During the year ended April 25, 2015, the fair value of the derivative increased by less than $0.1 million and, accordingly, a non-cash gain of less than $0.1 million was recorded.
37
Partial Refund of Early Termination Fee
During the third quarter of fiscal 2013, the Company recorded a $25.1 million prepayment charge related to the acceleration of the obligations under the Bayside term loan credit agreement. The charge was triggered by the Company’s non-compliance with the minimum liquidity covenant. The early payment fee represented the present value of interest payments due to Bayside (our pre-bankruptcy term loan lender) during the term of the term loan agreement. The $25.1 million early termination fee plus approximately $1.3 million of potential interest expense was placed in an escrow account. The escrow funds, totaling $26.4 million, were released to Bayside early in the second quarter of fiscal 2014.
During the second quarter of fiscal 2014, the parties reached an agreement whereby the early termination fee was fixed at $21.0 million. As such, Bayside retained $21.0 million, and refunded to the Company the $5.4 million escrow. The refund was received by the Company in the second quarter of fiscal 2014, of which $4.1 million was a partial refund of the early termination fee and the remainder was a refund of interest expense.
Reorganization Items, Net
In the first quarter of fiscal 2015, the Company recorded a $0.3 million net reorganization loss. This consisted of professional advisory fees and other costs related to the continued implementation of the Reorganization Plan and the resolution of unresolved claims.
In fiscal 2014, the Company recorded a $78.4 million net reorganization gain. This consists of $162.4 million of cancellation of indebtedness income related to the settlement of prepetition liabilities and changes in the Predecessor’s capital structure arising from implementation of the Reorganization Plan, offset by $30.2 million of fresh start adjustments, $21.4 million of cancellation of debt upon the issuance of equity, $19.4 million of professional, financing and other fees, $7.0 million of contract rejections and $5.1 million of other reorganization adjustments.
Provision for (Benefit from) Income Taxes
| Successor Company |
Successor Company |
Predecessor Company |
Non-GAAP Combined |
|||||||||||||||
| Twelve Months Ended April 25, 2015 |
Forty-Six Weeks Ended April 26, 2014 |
Six Weeks Ended June 11, 2013 |
Twelve Months Ended April 26, 2014 |
|||||||||||||||
| Provision for (benefit from) income taxes |
$ | 617 | $ | 258 | $ | 1,641 | $ | 1,899 | ||||||||||
The provision for income taxes was $0.6 million for fiscal 2015 as compared to a combined provision for income taxes of $1.9 million for fiscal 2014.
The provision recorded in fiscal 2015 is related to foreign and state taxes. The Company generated a taxable loss in fiscal 2015. The effective rate for fiscal 2015 was (1.9%). As future realization of deferred tax assets, including net operating loss carryforwards, did not meet the more likely than not threshold, the Company recorded a full valuation allowance as of April 25, 2015. The effective tax rate for fiscal 2015 was (1.9%) which was significantly lower than the statutory rate as a result of the valuation allowances.
The combined effective tax rate for fiscal 2014 was 3.1%. This rate was significantly lower than the statutory rate because the net reorganization income realized during this period was primarily related to cancellation of indebtedness income. During the six weeks ended June 11, 2013, the Company excluded from taxable income $129,084 of cancellation of indebtedness income as defined under Internal Revenue Code (“IRC”) Section 108. IRC Section 108 excludes from taxable income the amount of indebtedness discharged under a Chapter 11 case. IRC Section 108 also requires a reduction of tax attributes equal to the amount of excluded taxable income. As a result, the Company reduced the available federal and state net operating loss
38
carryforward and adjusted the tax reporting basis of tangible and intangible assets for the discharge of indebtedness income. In addition to the adjustment to the tax reporting basis as described above, the fresh start accounting adjustments also created additional basis differences in basis between for income tax and financial reporting purposes. Because the Company had recorded a full valuation allowance in fiscal 2013, the reduction of tax attributes resulted in a corresponding reduction of the valuation allowance. Thus, the reduction of tax attributes did not result in an increased effective tax rate for fiscal 2014.
Non-GAAP Combined Results for the Twelve Months Ended April 26, 2014 to the Predecessor GAAP results for the Twelve Months Ended April 27, 2013.
Overview of Fiscal 2014
Revenues for the combined periods of fiscal 2014 decreased 6.6% to $630.7 million as compared to $675.0 million in fiscal 2013. The Distribution and Curriculum segments experienced combined revenue declines of 7.1% and 3.3% in fiscal 2014, respectively. The revenue declines in both the Distribution and the Curriculum segments were partially attributable to the lower school spending as the Company believes state budget funding for education continued to decline. According to the National Bureau of Economic Research, state revenue collections underperformed forecasts during the latest recession. Since approximately 50% of school funding is provided by states, the Company believes the decreased state revenues are adversely affecting school funding and the related spending by schools. State tax receipts, a key component of school funding, have shown modest signs of recovery. In addition, the Company believes that customer uncertainty related to the bankruptcy negatively impacted fiscal 2014 revenues.
Combined gross margin decreased 10 basis points to 39.0% in fiscal 2014 as compared to 39.1% in fiscal 2013.
Combined SG&A decreased $26.9 million or 150 basis points as a percent of revenue in fiscal 2014 as compared to fiscal 2013. SG&A attributable to the Distribution and Curriculum segments decreased a combined $27.6 million and Corporate SG&A increased $0.7 million in fiscal 2014 as compared fiscal 2013.
Operating loss was $1.4 million in fiscal 2014 as compared to $49.4 million in fiscal 2013. Operating margins increased from 0.2% in fiscal 2013 to 0.8% in fiscal 2014 excluding the impact of the restructuring costs, impairment charges and bankruptcy related charges. The increase in operating margins was a result of expense reductions as a result of the Process Improvement Program described above partially offset by declines in school spending in fiscal 2014 due to the uncertainty in education funding levels and state budgetary concerns.
Revenues
| Successor Company |
Predecessor Company |
Non-GAAP Combined |
Predecessor Company |
|||||||||||||||
| Forty-Six Weeks Ended April 26, 2014 |
Six Weeks Ended June 11, 2013 |
Twelve Months Ended April 26, 2014 |
Twelve Months Ended April 27, 2013 |
|||||||||||||||
| Revenues |
$ | 572,045 | $ | 58,697 | $ | 630,742 | $ | 674,998 | ||||||||||
Combined revenues decreased 6.6% from $675.0 million in fiscal 2013 to $630.7 million in fiscal 2014.
Distribution segment combined revenues decreased 7.1% from $583.7 million in fiscal 2013 to $542.4 million in fiscal 2014. Approximately $12 million of the decline was related to the supplies product lines, while the furniture product lines declined approximately $18 million. This decline was primarily due to the fact that revenue in the back-to-school season was negatively impacted by factors related to the Chapter 11 Cases. These factors included continued customer uncertainty during the Chapter 11 Cases which we believe was a contributing factor to the decline in incoming orders. Approximately $10 million of the decline was related to our
39
student planner and agenda products. We believe schools consider agenda products more discretionary in nature and some schools are de-emphasizing paper-based agendas in favor of digital products.
Curriculum segment combined revenues decreased by 3.3% from $91.3 million in fiscal 2013 to $88.3 in fiscal 2014. The decline is related primarily to large curriculum orders in Florida and Mississippi in fiscal 2013, which were not expected to recur in fiscal 2014.
Gross Profit
| Successor Company |
Predecessor Company |
Non-GAAP Combined |
Predecessor Company |
|||||||||||||||
| Forty-Six Weeks Ended April 26, 2014 |
Six Weeks Ended June 11, 2013 |
Twelve Months Ended April 26, 2014 |
Twelve Months Ended April 27, 2013 |
|||||||||||||||
| Gross profit |
$ | 222,200 | $ | 23,618 | $ | 245,818 | $ | 263,880 | ||||||||||
Combined gross profit decreased 6.8% from $263.9 million in fiscal 2013 to $245.8 million in fiscal 2014. The decrease in consolidated revenue resulted in approximately $17.3 million of the decline in gross profit had consolidated gross margin remained constant. Gross margin decreased 10 basis points, from 39.1% in fiscal 2013 to combined 39.0% in fiscal 2014.
Distribution segment combined gross profit decreased $15.3 million from $215.0 million in fiscal 2013 to $199.7 in fiscal 2014. Combined gross margin was unchanged between fiscal 2013 and fiscal 2014 at 36.8%. Declines in vendor rebates earned negatively impacted gross margin in fiscal 2014 by approximately 40 basis points, but favorable product mix offset this decline.
Curriculum segment combined gross profit decreased $2.8 million from $48.9 million in fiscal 2013 to $46.1 million in fiscal 2014. Combined gross margin decreased 140 basis points from 53.6% in fiscal 2013 to 52.2% in fiscal 2014. The decrease in segment revenue resulted in approximately $1.6 million of the decline in segment gross profit had segment gross margin remained constant. The remaining decline was primarily related to product mix as sales of curriculum-related products were still under pressure because common core standards had not been finalized across states, and school budgets had not improved.
Selling, General and Administrative Expenses
| Successor Company |
Predecessor Company |
Non-GAAP Combined |
Predecessor Company |
|||||||||||||||
| Forty-Six Weeks Ended April 26, 2014 |
Six Weeks Ended June 11, 2013 |
Twelve Months Ended April 26, 2014 |
Twelve Months Ended April 27, 2013 |
|||||||||||||||
| Selling, general and administrative expenses |
$ | 213,144 | $ | 27,473 | $ | 240,617 | $ | 267,491 | ||||||||||
SG&A includes selling expenses, the most significant of which are wages and sales commissions; operations expenses, which include customer service, warehouse and out-bound freight costs; catalog costs; general administrative overhead, which includes information systems, accounting, legal and human resources; and depreciation and intangible asset amortization expense.
As a percent of revenue, combined SG&A decreased from 39.6% in fiscal 2013 to 38.1% in fiscal 2014. Combined SG&A decreased $26.9 million from $267.5 million in fiscal 2013 to $240.6 million in fiscal 2014. Combined SG&A attributable to the Distribution and Curriculum segments decreased a combined $27.6 million and combined Corporate SG&A increased $0.7 million in fiscal 2014 as compared to fiscal 2013.
Distribution segment combined SG&A decreased $23.1 million, or 11.2%, from $206.5 million in fiscal 2013 to $183.4 million in fiscal 2014. Approximately $4.3 million of the decline was due to variable costs such
40
as transportation and warehousing expenses associated with the decline in revenue. In addition, the segment had a decrease of $5.2 million in marketing costs primarily associated with a decrease in catalog costs as the Company reduced the number of seasonal catalog mailings and reduced circulation of other catalogs. Depreciation and amortization expense decreased by $5.5 million, primarily as a result of fresh start accounting. The remaining decrease is primarily compensation and benefit costs associated with headcount reductions. As a percent of revenue, Distribution segment combined SG&A decreased from 35.4% in fiscal 2013 to 33.8% in fiscal 2014.
Curriculum segment combined SG&A decreased $4.5 million, or 8.5%, from $53.5 million in fiscal 2013 to $48.9 million in fiscal 2014. Decreases in depreciation and amortization associated with fresh start accounting comprised $3.5 million of this decline. The remaining decline was primarily attributable to reduced compensation and benefit costs associated with headcount reductions. As a percent of revenue, Curriculum segment combined SG&A decreased from 58.6% in fiscal 2013 to 55.4% in fiscal 2014.
The increase in combined Corporate SG&A was related to approximately $6.4 million of costs incurred primarily to implement the process improvement actions. In addition, approximately $1.9 million of the increase in fiscal 2014 was related to incremental freight and warehousing costs incurred due to backorders that resulted from supply chain interruptions related to the Company’s bankruptcy. The bankruptcy created uncertainty in the vendor base which contributed to an increase in backorders of approximately 90%. By the end of the fiscal year, backorder levels had been reduced to below historic norms. These costs were partially offset by $4.7 million of pre-petition expenses associated with attorney and advisor fees incurred in preparation of the Company’s bankruptcy filing and $2.8 million of costs associated with the Company’s shutdown of the Mt. Joy, Pennsylvania distribution center in fiscal 2013.
Facility Exit Costs and Restructuring
In fiscal 2014, the Successor Company recorded $6.6 million of facility exit costs and restructuring charges. The closure of the Company’s distribution centers and printing plants resulted in charges of $3.8 million which included lease termination costs and other shutdown related expenditures. Severance in fiscal 2014 was $2.8 million.
Impairment Charges
The Company recorded $45.8 million of impairment charges in fiscal 2013. Due to a triggering event in the third quarter of fiscal 2013, the Company recorded a goodwill impairment charge of $41.1 million, which consisted of $27.5 million, $9.7 million and $3.9 million for the Planning and Student Development, Reading and Califone reporting units, respectively. An impairment charge of $4.7 million was related to indefinite-lived intangible assets of the Curriculum segment.
Interest Expense
| Successor Company |
Predecessor Company |
Non-GAAP Combined |
Predecessor Company |
|||||||||||||||
| Forty-Six Weeks Ended April 26, 2014 |
Six Weeks Ended June 11, 2013 |
Twelve Months Ended April 26, 2014 |
Twelve Months Ended April 27, 2013 |
|||||||||||||||
| Interest expense |
$ | 16,882 | $ | 3,235 | $ | 20,117 | $ | 28,600 | ||||||||||
Combined interest expense decreased $8.5 million from $28.6 million in fiscal 2013 to $20.1 million in fiscal 2014. The decrease is related to $11.3 million of interest expense incurred by the Predecessor Company in fiscal 2013 on its convertible debt, of which $6.8 million was non-cash. The Company incurred no additional interest expense on the convertible debt subsequent to the Chapter 11 filing. The convertible debt was canceled in accordance with the Reorganization Plan with those debt holders receiving 35% of the equity of the Successor
41
Company. In addition, decreased borrowings on the Company’s New ABL Facility as compared to the Company’s 2012 ABL Facility resulted in $1.6 million of decreased interest expense in fiscal 2014. These decreased borrowings were related to the recapitalization of the Company under the Reorganization Plan. Interest expense related to the Company’s Ad Hoc DIP Term Loan decreased by $1.5 million in fiscal 2014.
The decreases in combined interest expense were partially offset with $6.1 million of additional interest expense related to the Successor Company’s New Term Loan as compared to the Predecessor Company’s pre-bankruptcy Term Loan interest expense in fiscal 2013. This increase was due to higher average borrowings under the New Term Loan partially offset by a decrease in the interest rate.
Loss on Early Extinguishment of Debt
The Company recorded a $10.2 million charge in fiscal 2013 associated with the unamortized debt issuance costs related to the pre-bankruptcy credit facilities.
Early Termination of Long-Term Indebtedness
During the third quarter of fiscal 2013, the Company recorded a $25.1 million prepayment charge related to the acceleration of the obligations under the Bayside term loan credit agreement. The charge was triggered by the Company’s non-compliance with the minimum liquidity covenant. The early prepayment fee represented the present value of interest payments due to Bayside during the term of the term loan credit agreement. The $25.1 million early termination fee plus approximately $1.3 million of potential interest expense was placed in an escrow account. These escrow funds, totaling $26.4 million, were released to Bayside early in the second quarter of fiscal 2014.
During the second quarter of fiscal 2014, the parties reached an agreement whereby the early termination fee was fixed at $21.0 million. As such, Bayside retained $21.0 million, and refunded to the Company the $5.4 million excess. The refund was received by the Company in the second quarter of fiscal 2014, of which $4.1 million was a partial refund of the early termination fee and the remainder was a recovery of interest expense.
Impairment of Long-Term Asset
In the second quarter of fiscal 2013 the Company recorded a $1.4 million impairment charge related to the note receivable it had recorded on its balance sheet from the sale of the Visual Media business in fiscal 2008. The Company received proceeds of $3.0 million in conjunction with the settlement of the note receivable that was used to pay down a portion of the then-outstanding term loan.
Impairment of Unconsolidated Affiliate Investment
The Company recorded an impairment of its investment in Carson-Dellosa in fiscal 2013. The value of the Company’s 35% ownership interest was re-evaluated in fiscal 2013 as Carson-Dellosa operating results did not achieve expectations and prospective forecasts were lowered based on continued school spending declines in the supplemental education market. The decline in current and projected cash flows resulted in the value of the Company’s ownership interest being $7.7 million less than the Company’s carrying amount in fiscal 2013. The write-down have been reflected in other expense.
Change in fair value of interest rate swap
In the second quarter of fiscal 2014, the Company entered into an interest rate swap agreement that effectively fixes the interest payments on a portion of the Company’s variable-rate debt. The swap, which has a termination date of September 11, 2016, effectively fixes the LIBOR-based interest rate on the debt in the amount of the notional amount of the swap at 9.985%. The notional amount of the swap at April 26, 2014 was $72.5 million. As of April 26, 2014, the fair value of the derivative decreased by $0.5 million and, accordingly, a non-cash loss of $0.5 million was recorded.
42
Reorganization Items, Net
| Successor Company |
Predecessor Company |
Non-GAAP Combined |
Predecessor Company |
|||||||||||||||
| Forty-Six Weeks Ended April 26, 2014 |
Six Weeks Ended June 11, 2013 |
Twelve Months Ended April 26, 2014 |
Twelve Months Ended April 27, 2013 |
|||||||||||||||
| Reorganization items, net |
$ | 6,420 | $ | (84,799 | ) | $ | (78,379 | ) | $ | 22,979 | ||||||||
In fiscal 2014, the Company recorded a $78.4 million combined net reorganization gain. This consists of $162.4 million of cancellation of indebtedness income related to the settlement of prepetition liabilities and changes in the Predecessor’s capital structure arising from implementation of the Reorganization Plan, offset by $30.2 million of fresh start adjustments, $21.4 million upon the issuance of equity in excess of debt carrying amount, $20.3 million of professional, financing and other fees, $7.0 million of contract rejections and $5.1 million of other reorganization adjustments.
Included in the $20.3 million of professional and other financing fees are $6.9 million of professional fees incurred after the Effective Date which pertained to post-emergence activities related to the implementation of the Reorganization Plan and other transition costs attributable to the reorganization.
Provision for/(Benefit from) Income Taxes
| Successor Company |
Predecessor Company |
Non-GAAP Combined |
Predecessor Company |
|||||||||||||||
| Forty-Six Weeks Ended April 26, 2014 |
Six Weeks Ended June 11, 2013 |
Twelve Months Ended April 26, 2014 |
Twelve Months Ended April 27, 2013 |
|||||||||||||||
| Provision for (benefit from) income taxes |
$ | 258 | $ | 1,641 | $ | 1,899 | $ | (334 | ) | |||||||||
The provision for taxes was $1.6 million for the Predecessor Company for the six weeks ended June 11, 2013. Approximately $1.5 million of this provision related to foreign withholding taxes associated with prior deemed dividend distributions from the Company’s foreign subsidiary. The pre-tax income for the six weeks ended June 11, 2013 for the Predecessor Company results from the Reorganization gain. This gain is primarily related to cancellation of indebtedness income which is not taxable, but reduces the Company’s net operating loss carryforwards and other tax attributes. Because the Company had previously recorded a full valuation allowance against its deferred tax assets, this reduction in tax attributes does not impact the tax provision. The provision for taxes was $0.3 million for the Successor Company for the forty-six weeks ended April 26, 2014. This provision is related primarily to foreign and state taxes. Any U.S. federal tax benefit associated with the Successor Company’s pre-tax loss was offset with valuation allowances as the Company determined its deferred tax assets are not more likely than not of being realized, at this time.
Liquidity and Capital Resources
At April 25, 2015, the Company had working capital of $100.6 million. The Company’s capitalization at April 25, 2015 was $248.6 million and consisted of total debt of $182.2 million and stockholders’ equity of $66.4 million.
As discussed in Note 3—Bankruptcy Proceedings, all of the Predecessor Company debt was cancelled as of the Effective date.
On June 11, 2013, in accordance with the Reorganization Plan, the Company entered into a Loan Agreement (the “Asset-Based Credit Agreement”) among the Company, Bank of America, N.A, as Agent, SunTrust Bank, as Syndication Agent, Merrill Lynch, Pierce, Fenner & Smith Incorporated and SunTrust Robinson Humphrey, Inc., as Joint Lead Arrangers and Bookrunners, and the Lenders that are party to the Asset-Based Credit Agreement (the “Asset-Based Lenders”).
43
Under the Asset-Based Credit Agreement, the Asset-Based Lenders agreed to provide a revolving senior secured asset-based credit facility (the “New ABL Facility”) in an aggregate principal amount of $175 million. Outstanding amounts under the New ABL Facility will bear interest at a rate per annum equal to, at the Company’s election: (1) a base rate (equal to the greatest of (a) the prime lending rate, (b) the federal funds rate plus 0.50%, and (c) the 30-day LIBOR rate plus 1.00% per annum) (the “Base Rate”) plus an applicable margin (equal to a specified margin based on the interest rate elected by the Company, the fixed charge coverage ratio under the New ABL Facility and the applicable point in the life of the New ABL Facility) (the “Applicable Margin”), or (2) a LIBOR rate plus the Applicable Margin (the “LIBOR Rate”). Interest on loans under the New ABL Facility bearing interest based upon the Base Rate will be due monthly in arrears, and interest on loans bearing interest based upon the LIBOR Rate will be due on the last day of each relevant interest period or, if sooner, on the respective dates that fall every three months after the beginning of such interest period.
The New ABL Facility will mature on June 11, 2018. The Company may prepay advances under the New ABL Facility in whole or in part at any time without penalty or premium. The Company will be required to make specified prepayments upon the occurrence of certain events, including: (1) the amount outstanding on the New ABL Facility exceeding the Borrowing Base, and (2) the Company’s receipt of net cash proceeds of any sale or disposition of assets that are first priority collateral for the New ABL Facility.
Pursuant to a Guaranty and Collateral Agreement dated as of June 11, 2013 (the “New ABL Security Agreement”), the New ABL Facility is secured by a first priority security interest in substantially all assets of the Company and the guarantor subsidiaries. Under an intercreditor agreement between the Asset-Based Lenders and the Term Loan Lenders, as defined and described below, the Asset-Based Lenders have a first priority security interest in substantially all working capital assets of the Company and the guarantor subsidiaries, and a second priority security interest in all other assets, subordinate only to the first priority security interest of the Term Loan Lenders in such other assets.
The Asset-Based Credit Agreement contains customary events of default and financial, affirmative and negative covenants, including but not limited to a springing financial covenant relating to the Company’s fixed charge coverage ratio and restrictions on indebtedness, liens, investments, asset dispositions and dividends and other restricted payments. The Company was in compliance with the financial covenants during fiscal 2015 and expects to remain in compliance with these covenants over the next 12 months.
Also on June 11, 2013, the Company entered into a credit agreement (the “New Term Loan Credit Agreement”) among the Company, Credit Suisse AG, as Administrative Agent and Collateral Agent, and the lenders party to the New Term Loan Credit Agreement (the “Term Loan Lenders”).
Under the New Term Loan Credit Agreement, the Term Loan Lenders agreed to make a term loan (the “New Term Loan”) to the Company in aggregate principal amount of $145 million. The outstanding principal amount of the New Term Loan will bear interest at a rate per annum equal to the applicable LIBOR rate (with a 1% floor) plus 8.50%, or the base rate plus a margin of 7.50% as determined by the elective form of borrowings under the New Term Loan Credit Agreement by the Company. Interest on loans under the New Term Loan Credit Agreement bearing interest based upon the base rate will be due quarterly in arrears, and interest on loans bearing interest based upon the LIBOR rate will be due on the last day of each relevant interest period or, if sooner, on the respective dates that fall every three months after the beginning of such interest period.
The New Term Loan matures on June 11, 2019. The New Term Loan Credit Agreement requires prepayments at specified levels upon the Company’s receipt of net proceeds from certain events, including: (1) certain dispositions of property, divisions, business units or business lines; and (2) other issuances of debt other than Permitted Debt, as defined in the New Term Loan Credit Agreement. The New Term Loan Credit Agreement also requires prepayments at specified levels from the Company’s excess cash flow. The Company is also permitted to voluntarily prepay the New Term Loan in whole or in part. Any prepayments are to be made at par, plus an early payment fee calculated in accordance with the terms of the New Term Loan Credit Agreement if prepaid prior to the second anniversary of October 31, 2016.
44
Pursuant to a Guarantee and Collateral Agreement dated as of June 11, 2013 (the “New Term Loan Security Agreement”), the New Term Loan is secured by a first priority security interest in substantially all assets of the Company and the guarantor subsidiaries. Under an intercreditor agreement between the Asset-Based Lenders and the Term Loan Lenders, the Term Loan Lenders have a second priority security interest in substantially all working capital assets of the Company and the subsidiary guarantors, subordinate only to the first priority security interest of the Asset-Based Lenders in such assets, and a first priority security interest in all other assets.
The New Term Loan Credit Agreement contains customary events of default and financial, affirmative and negative covenants, including but not limited to quarterly financial covenants that commenced on the fiscal quarter ending January 25, 2014, relating to the Company’s (1) minimum interest coverage ratio and (2) maximum net total leverage ratio and restrictions on indebtedness, liens, investments, asset dispositions and dividends and other restricted payments. The Company was in compliance with the financial covenants during fiscal 2015 and expects to remain compliant with these covenants over the next twelve months.
On October 31, 2014 the Company obtained amendments to both its Asset-Based Credit Agreement and New Term Loan Credit Agreement. The amendments provide the Company additional flexibility in its execution of certain restructuring actions by increasing the dollar amount of EBITDA covenant add backs for non-recurring, unusual or extraordinary charges, business optimization expenses or other restructuring charges or reserves and cash expenses relating to earn outs or similar obligations. The Company closely evaluates its expected ability to remain in compliance with the financial covenants under our New ABL Security Agreement and New Term Loan Credit Agreement. Based on current projections, the Company believes it will maintain compliance with these financial covenants through the next twelve months.
Net cash provided by operating activities was $5.4 million for fiscal 2015 and $19.5 million for the forty-six weeks ended April 26, 2014 (Successor Company), and net cash used in operating activities was $20.0 million in the six weeks ended June 11, 2013 (Predecessor Company). The increase of $5.8 million is due to a reduction in bankruptcy-related costs or other financing related fees of $26.9 million which were paid in fiscal 2014, partially offset by the impact of working capital changes of $17.0 million, excluding accrued bankruptcy fees. Operating cash flow in fiscal 2014 was benefited by approximately $15.0 million of inventory prepayments made in the fourth quarter of fiscal 2013. These prepayments were necessary due to the impact the bankruptcy filing had on vendor relationships and terms. As the Company was able to return vendors to more customary terms in the year following the bankruptcy, large inventory prepayments were not necessary in fiscal 2015.
Net cash used in investing activities was $15.6 million for fiscal 2015. Net cash provided by investing activities was $9.9 million for the forty-six weeks ended April 26, 2014 (Successor Company) and net cash used in investing activities was $0.7 million for the six weeks ended June 11, 2013 (Predecessor Company). The change was primarily due to the release of $26.3 million of restricted cash in fiscal 2014 which related primarily to the Bayside early termination fee dispute, which was settled in the second quarter of fiscal 2014. The decrease related to the restricted cash was partially offset by decreased spending of $1.6 million on property, plant, and equipment in fiscal 2015.
Net cash used by financing activities was $36.0 million for the forty six weeks ended April 26, 2014 (Successor Company). Net cash provided by financing activities was $15.5 million for the six weeks ended June 11, 2013 (Predecessor Company). The combined net cash used in financing activities for fiscal 2014 was $21.5 million. Net cash provided by financing activities was $11.1 million for fiscal 2015, or an increase of $31.6 million from fiscal 2014. The combined increase of $31.6 million relates primarily to the payment of the $26.4 million of early termination fee in fiscal 2014. Outstanding borrowings on the New ABL Facility were $24.2 million as of April 25, 2015, while the excess availability on that date for the New ABL Facility was $51.6 million. Consistent with previous years, the Company expects excess availability to increase during its 2015 back to school season.
We believe that our cash flow from operations, borrowings available from our existing credit facility and other sources of capital will be sufficient to meet our liquidity requirements for operations, including anticipated capital expenditures and our contractual obligations for the foreseeable future.
45
Off Balance Sheet Arrangements
None.
Summary of Contractual Obligations
The following table summarizes our contractual debt and operating lease obligations as of April 25, 2015:
| Payments Due (in thousands) |
||||||||||||||||||||
| Total | Less than 1 year |
1 – 3 years | 3 – 5 years |
More than 5 years |
||||||||||||||||
| Long-term debt obligations (1) |
$ | 223,620 | $ | 40,733 | $ | 29,729 | $ | 153,158 | $ | — | ||||||||||
| Deferred cash payment obligations (1) |
24,027 | — | — | 24,027 | — | |||||||||||||||
| Operating lease obligations |
20,004 | 6,639 | 8,536 | 3,571 | 1,258 | |||||||||||||||
| Purchase obligations (2) |
— | — | — | — | — | |||||||||||||||
|
|
|
|
|
|
|
|
|
|
|
|||||||||||
| Total contractual obligations |
$ | 267,651 | $ | 47,372 | $ | 38,265 | $ | 180,756 | $ | 1,258 | ||||||||||
|
|
|
|
|
|
|
|
|
|
|
|||||||||||
| (1) | Long-term debt obligations and deferred cash payment obligations include principal and interest using either fixed rates or variable rates in effect as of April 25, 2015. |
| (2) | As of April 25, 2015, we did not have any material long-term purchase obligations. The Company’s short-term purchase obligations as of April 25, 2015 were primarily for the purchase of inventory in the normal course of business. |
Fluctuations in Quarterly Results of Operations
Our business is subject to seasonal influences. Our historical revenues and profitability have been dramatically higher in the first two quarters of our fiscal year, primarily due to increased shipments to customers coinciding with the start of each school year. Quarterly results also may be materially affected by variations in our costs for the products sold, the mix of products sold and general economic conditions. Therefore, results for any quarter are not indicative of the results that we may achieve for any subsequent fiscal quarter or for a full fiscal year.
The following table sets forth certain unaudited consolidated quarterly financial data for fiscal years 2015 and 2014 (in thousands, except per share data). We derived this quarterly data from our unaudited consolidated financial statements.
| Fiscal 2015 | ||||||||||||||||||||
| Successor Company | ||||||||||||||||||||
| First | Second | Third | Fourth | Total | ||||||||||||||||
| Revenues |
$ | 199,469 | $ | 238,670 | $ | 77,754 | $ | 105,975 | $ | 621,868 | ||||||||||
| Gross profit |
78,566 | 86,822 | 26,808 | 35,962 | 228,158 | |||||||||||||||
| Operating income (loss) |
16,491 | 17,000 | (26,292 | ) | (20,289 | ) | (13,090 | ) | ||||||||||||
| Net income (loss) |
11,014 | 11,923 | (30,651 | ) | (25,818 | ) | (33,532 | ) | ||||||||||||
| Basic earnings per share of common stock: |
||||||||||||||||||||
| Earnings/(loss) |
$ | 11.01 | $ | 11.92 | $ | (30.65 | ) | $ | (25.82 | ) | $ | (33.53 | ) | |||||||
|
|
|
|
|
|
|
|
|
|
|
|||||||||||
| Diluted earnings per share of common stock: |
||||||||||||||||||||
| Earnings/(loss) |
$ | 11.01 | $ | 11.92 | $ | (30.65 | ) | $ | (25.82 | ) | $ | (33.53 | ) | |||||||
|
|
|
|
|
|
|
|
|
|
|
|||||||||||
46
| Fiscal 2014 | ||||||||||||||||||||||||||
| Predecessor Company |
Successor Company | |||||||||||||||||||||||||
| 6 weeks | 7 weeks | Second | Third | Fourth | Total | |||||||||||||||||||||
| Revenues |
$ | 58,697 | $ | 143,499 | $ | 245,629 | $ | 74,664 | $ | 108,253 | $ | 572,045 | ||||||||||||||
| Gross profit |
23,618 | 59,758 | 93,205 | 26,448 | 42,789 | 222,200 | ||||||||||||||||||||
| Operating income (loss) |
(3,855 | ) | 21,296 | 19,243 | (24,653 | ) | (13,382 | ) | 2,504 | |||||||||||||||||
| Net income (loss) |
76,068 | 16,943 | 14,697 | (30,135 | ) | (18,990 | ) | (17,485 | ) | |||||||||||||||||
| Basic earnings per share of common stock: |
||||||||||||||||||||||||||
| Earnings/(loss) |
$ | 4.02 | $ | 16.94 | $ | 14.70 | $ | (30.14 | ) | $ | (18.99 | ) | $ | (17.49 | ) | |||||||||||
|
|
|
|
|
|
|
|
|
|
|
|
|
|||||||||||||||
| Diluted earnings per share of common stock: |
||||||||||||||||||||||||||
| Earnings/(loss) |
$ | 4.02 | $ | 16.94 | $ | 14.70 | $ | (30.14 | ) | $ | (18.99 | ) | $ | (17.49 | ) | |||||||||||
|
|
|
|
|
|
|
|
|
|
|
|
|
|||||||||||||||
The summation of quarterly net income (loss) per share may not equate to the calculation for the full fiscal year as quarterly calculations are performed on a discrete basis.
Inflation
Inflation, particularly in fuel and other oil-related costs, has had and could continue to have an effect on our results of operations, in both our cost of revenues and SG&A expenses, and our internal and external sources of liquidity.
Critical Accounting Policies
We believe the policies identified below are critical to our business and the understanding of our results of operations. The impact and any associated risks related to these policies on our business are discussed throughout this section where applicable. Refer to the notes to our consolidated financial statements in Item 8 for detailed discussion on the application of these and other accounting policies. The preparation of the consolidated financial statements requires management to make estimates and assumptions that affect the reported amounts of assets and liabilities and the disclosure of contingent assets and liabilities at the date of the financial statements and the reported amounts of revenues and expenses during the reporting period. We evaluate our estimates and assumptions on an ongoing basis and base them on a combination of historical experience and various other assumptions that we believe to be reasonable under the circumstances. Actual results could differ from those estimates. Our critical accounting policies that require significant judgments and estimates and assumptions used in the preparation of our consolidated financial statements are as follows:
Revenue Recognition
Revenue, net of estimated returns and allowances, is recognized upon the shipment of products or upon the completion of services to customers, which corresponds to the time when risk of ownership transfers, the selling price is fixed, the customer is obligated to pay, collectability is reasonably assured and we have no significant remaining obligations. Cash received in advance from customers is deferred on our balance sheet as a current liability until revenue is recognized.
Catalog Costs and Related Amortization
We spend approximately $15 million annually to produce and distribute catalogs. We accumulate all direct costs incurred, net of vendor cooperative advertising payments, in the development, production and circulation of our catalogs on our balance sheet until such time as the related catalog is mailed. They are subsequently amortized into SG&A over the expected sales realization cycle, which is one year or less. Consequently, any difference between our estimated and actual revenue stream for a particular catalog and the related impact on amortization expense is neutralized within a period of one year or less. Our estimate of the expected sales
47
realization cycle for a particular catalog is based on, among other possible considerations, our historical sales experience with identical or similar catalogs and our assessment of prevailing economic conditions and various competitive factors. We track our subsequent sales realization, reassess the marketplace, and compare our findings to our previous estimate and adjust the amortization of our future catalogs, if necessary.
Development Costs
We accumulate external and certain internal costs incurred in the development of our products which can include a master copy of a book, video or other media, on our balance sheet. As of April 25, 2015, we had $19.6 million in development costs on our balance sheet. A majority of these costs are associated with science and reading curriculum businesses. The capitalized development costs are subsequently amortized into cost of revenues over the expected sales realization cycle of the products, which is typically five years. During fiscal 2015 we amortized development costs of $14.3 million to expense. The fiscal 2015 amortization includes write downs totaling $2.3 million in the Distribution segment and $1.4 in the Curriculum segment based on the company’s reassessment of revenue projections for certain products. We continue to monitor the expected sales realization cycle for each product, and will adjust the remaining expected life of the development costs or recognize impairments, if warranted.
Goodwill and Intangible Assets, and Long-Lived Assets
At April 25, 2015, intangible assets represented approximately 20% of our total assets. We review our goodwill and other indefinite life intangible assets for impairment annually, or more frequently if indicators of impairment exist. A significant amount of judgment is involved in determining if an indicator of impairment has occurred. Such indicators may include, among others: a significant decline in our expected future cash flows; a sustained, significant decline in our stock price and market capitalization; a significant adverse change in legal factors or in the business climate; unanticipated competition; the testing for recoverability of a significant asset group within a reporting unit; and slower growth rates. Any adverse change in these factors could have a significant impact on the recoverability of these assets and could have a material impact on our consolidated financial statements.
As it relates to goodwill and indefinite life intangible assets, we apply the impairment rules in accordance with FASB ASC Topic 350, “Intangibles—Goodwill and Other”. As required by FASB ASC Topic 350, the recoverability of these assets is subject to a fair value assessment, which includes judgments regarding financial projections, including forecasted cash flows and discount rates, and comparable market values. As it relates to finite life intangible assets, we apply the impairment rules as required by FASB ASC Topic 360-10-15, “Impairment or Disposal of Long-Lived Assets” which also requires significant judgments related to the expected future cash flows attributable to the primary asset. Key assumptions used in the impairment analysis include, but are not limited to, expected future cash flows, business plan projections, revenue growth rates, and the discount rate utilized for discounting such cash flows. The impact of modifying any of these assumptions can have a significant impact on the estimate of fair value and, thus, the estimated recoverability, or impairment, if any, of the asset.
In completing the fiscal 2015 assessment, the Science and Reading reporting units each had fair value in excess of carrying value of greater than 10%. The fair value of the Distribution reporting unit was in excess of its carrying value by 3%. In order to conclude upon the assumptions for the discounted cash flow analysis, the Company considered multiple factors, including (a) macroeconomic conditions, (b) industry and market factors such as school funding trends and school construction forecasts, (c) overall financial performance such as planned revenue, profitability and cash flows and (d) the expected impact of current revenue enhancing and cost saving initiatives. A reduction in the revenue growth rate or profitability assumptions of 100 basis points would result in a failure in the first step of the goodwill assessment. In addition, the discount rate assumptions can have a material impact on the fair value determinations. An increase in the discount rate of 100 basis points for the Distribution reporting unit would result in a failure in the first step of the goodwill assessment.
48
As discussed in Note 7—Goodwill and Other Intangible Assets of the consolidated financial statements, the Company recorded goodwill impairment charges of $41.1 million in fiscal 2013. In addition, the Company recorded an impairment charge of $2.7 million in fiscal 2015 related to definite-lived intangible assets and a charge of $4.7 million in fiscal 2013 related to indefinite-lived intangible assets. The goodwill impairment recorded in fiscal 2013 reduced the Predecessor’s Company’s goodwill balance to zero. The impairments were determined as part of the fair value assessment of these assets.
Valuation Allowance for Deferred Tax Assets
We initially recorded a tax valuation allowance against our deferred tax assets in the fourth quarter of fiscal 2012. In recording the valuation allowance, management considered whether it was more likely than not that some or all of the deferred tax assets would be realized as the Company has generated net operating losses in recent years and does not have an ability to carry these back to previous years. This analysis included consideration of scheduled reversals of deferred tax liabilities, projected future taxable income, carry back potential and tax planning strategies, in accordance with FASB ASC Topic 740, “Income Taxes”. At April 25, 2015, our valuation allowance totaled $41.7 million.
Fresh Start Accounting
The Company adopted fresh start accounting and reporting on the Effective Date in accordance with FASB ASC 852, Reorganizations (“FASB ASC 852”), as the holders of existing voting shares immediately before confirmation of the Plan received less than 50% of the voting shares of the emerging entity and the reorganization value of the Company’s assets immediately before the date of confirmation was less than the post-petition liabilities and allowed claims. FASB ASC 852 provides for, among other things, a determination of the value to be assigned to the assets of the reorganized Company as of a date selected for financial reporting purposes.
Enterprise value represents the fair value of an entity’s interest-bearing debt and stockholders’ equity. In the disclosure statement associated with the Reorganization Plan, which was confirmed by the Bankruptcy Court, the Company estimated a range of enterprise values between $275.0 million and $325.0 million, with a midpoint of $300.0 million. Based on current and anticipated economic conditions and the direct impact these conditions have on our business, the Company deemed it appropriate to use the midpoint between the low end and high end of the range to determine the final enterprise value of $300.0 million, comprised of debt valued at approximately $179.0 million and equity valued at approximately $121.0 million.
The Company adjusted its enterprise value of $300.0 million for certain items such as post-petition liabilities to determine a reorganization value attributable to assets of $415.4 million. Under fresh start accounting, the reorganization value was allocated to the Company’s assets based on their respective fair values in conformity with the purchase method of accounting for business combinations included in FASB ASC 805, Business Combinations. The excess reorganization value over the fair value of identified tangible and intangible assets of $21.6 million was recorded as goodwill.
The adoption of fresh-start reporting by the Company resulted in a new reporting entity for financial reporting purposes reflecting the Successor’s capital structure and with no beginning retained earnings (deficit) as of the Effective Date. Any presentation of the Successor Company’s consolidated financial statements as of and for periods subsequent to the Effective Date represents the financial position, results of operations and cash flows of a new reporting entity and will not be comparable to any presentation of the Predecessor’s consolidated financial statements as of and for periods prior to the Effective Date, and the adoption of fresh-start reporting. The Predecessor’s consolidated financial statements for periods prior to the Effective Date have not been adjusted to reflect any changes in the Predecessor’s capital structure as a result of the Plan nor have they been adjusted to reflect any changes in the fair value of assets and liabilities as a result of the adoption of fresh-start reporting.
49
In accordance with FASB ASC 852, the Predecessor Company’s results of operations prior to the Effective Date include (i) a pre-emergence gain of $161.9 million resulting from the discharge of liabilities under the Reorganization Plan; (ii) pre-emergence charges to earnings of $46.9 million recorded as reorganization items resulting from certain costs and expenses relating to the Reorganization Plan becoming effective, including the cancellation of certain debt upon issuance of new equity and the cancellation of equity-based awards of the Predecessor; and (iii) a pre-emergence decrease in earnings of $30.3 million resulting from the aggregate changes to the net carrying value of the Predecessor Company’s pre-emergence assets and liabilities to reflect their fair values under fresh start accounting, as well as the recognition of goodwill.
For further details on fresh start accounting, see Note 4 of the consolidated financial statements.
| Item 7A. | Quantitative and Qualitative Disclosures About Market Risk |
Our financial instruments include cash and cash equivalents, accounts receivable, accounts payable, accrued liabilities and debt. Market risks relating to our operations result primarily from changes in interest rates. Interest rates on our borrowings under our credit facility are primarily dependent upon LIBOR rates. Assuming no change in our financial structure, if variable interest rates were to have averaged 100 basis points higher during fiscal 2015 and fiscal 2014, pre-tax earnings would have decreased by approximately $0.5 million and $0.6 million respectively. This amount was determined by considering a hypothetical 100 basis point increase in interest rates on average variable-rate debt outstanding. These decreases in pre-tax earnings reflect that our interest rate on $72.5 million of our New Term Loan is, effectively, fixed due to an interest rate swap agreement with a notional amount of $72.5 million which hedges changes in the variable interest rate (See Note 10—Debt). The estimated fair value of long-term debt approximated its carrying value at April 25, 2015 and April 26, 2014.
| Item 8. | Financial Statements and Supplementary Data |
REPORT OF INDEPENDENT REGISTERED PUBLIC ACCOUNTING FIRM
To the Board of Directors and Stockholders of
School Specialty, Inc.
Greenville, Wisconsin
We have audited the accompanying consolidated balance sheets of School Specialty, Inc. and subsidiaries (the “Company”) as of April 25, 2015 and April 26, 2014 (Successor Company), and the related consolidated statements of operations, comprehensive income (loss), stockholders’ equity (deficit), and cash flows for the fiscal year ended April 25, 2015 (Successor Company), the forty-six weeks ended April 26, 2014 (Successor Company) and six weeks ended June 11, 2013 (Predecessor Company), and the fiscal year ended April 27, 2013 (Predecessor Company). Our audits also included the financial statement schedule listed in the Index at Item 15. These financial statements and financial statement schedule are the responsibility of the Company’s management. Our responsibility is to express an opinion on the financial statements and financial statement schedule based on our audits.
We conducted our audits in accordance with the standards of the Public Company Accounting Oversight Board (United States). Those standards require that we plan and perform the audit to obtain reasonable assurance about whether the financial statements are free of material misstatement. An audit includes examining, on a test basis, evidence supporting the amounts and disclosures in the financial statements. An audit also includes assessing the accounting principles used and significant estimates made by management, as well as evaluating the overall financial statement presentation. We believe that our audits provide a reasonable basis for our opinion.
In our opinion, such consolidated financial statements present fairly, in all material respects, the financial position of School Specialty, Inc. and subsidiaries as of April 25, 2015 and April 26, 2014, (Successor Company)
50
and the results of their operations and their cash flows for the fiscal years ended April 25, 2015, (Successor Company), the forty-six weeks ended April 26, 2014 (Successor Company) and six weeks ended June 11, 2013 (Predecessor Company) and the fiscal year ended April 27, 2013 (Predecessor Company), in conformity with accounting principles generally accepted in the United States of America. Also, in our opinion, such financial statement schedule, when considered in relation to the basic consolidated financial statements taken as a whole, present fairly, in all material respects, the information set forth therein.
We have also audited, in accordance with the standards of the Public Company Accounting Oversight Board (United States), the Company’s internal control over financial reporting as of April 25, 2015, based on the criteria established in Internal Control — Integrated Framework (2013) issued by the Committee of Sponsoring Organizations of the Treadway Commission and our report dated July 9, 2015 expressed an adverse opinion on the Company’s internal control over financial reporting.
/s/ Deloitte & Touche LLP
Milwaukee, Wisconsin
July 9, 2015
51
FINANCIAL STATEMENTS
SCHOOL SPECIALTY, INC.
CONSOLIDATED BALANCE SHEETS
(In Thousands, Except Share Data)
| April 25, 2015 |
April 26, 2014 |
|||||||
| ASSETS |
||||||||
| Current assets: |
||||||||
| Cash and cash equivalents |
$ | 8,920 | $ | 9,008 | ||||
| Accounts receivable, less allowance for doubtful accounts of $806 and $984, respectively |
58,685 | 62,631 | ||||||
| Inventories, net |
96,935 | 93,387 | ||||||
| Deferred catalog costs |
7,424 | 8,057 | ||||||
| Prepaid expenses and other current assets |
15,868 | 18,043 | ||||||
| Refundable income taxes |
1,549 | — | ||||||
| Asset held for sale |
— | 2,200 | ||||||
|
|
|
|
|
|||||
| Total current assets |
189,381 | 193,326 | ||||||
| Property, plant and equipment, net |
32,024 | 39,045 | ||||||
| Goodwill |
21,588 | 21,588 | ||||||
| Intangible assets, net |
41,055 | 48,251 | ||||||
| Development costs and other, net |
28,187 | 36,646 | ||||||
| Deferred taxes long-term |
2 | 48 | ||||||
| Investment in unconsolidated affiliate |
715 | 715 | ||||||
|
|
|
|
|
|||||
| Total assets |
$ | 312,952 | $ | 339,619 | ||||
|
|
|
|
|
|||||
| LIABILITIES AND STOCKHOLDERS’ EQUITY |
||||||||
| Current liabilities: |
||||||||
| Current maturities of long-term debt |
$ | 25,644 | $ | 12,388 | ||||
| Accounts payable |
41,587 | 42,977 | ||||||
| Accrued compensation |
7,341 | 8,966 | ||||||
| Deferred revenue |
2,490 | 2,613 | ||||||
| Other accrued liabilities |
11,724 | 14,460 | ||||||
|
|
|
|
|
|||||
| Total current liabilities |
88,786 | 81,404 | ||||||
| Long-term debt less current maturities |
156,549 | 153,987 | ||||||
| Other liabilities |
1,240 | 1,171 | ||||||
|
|
|
|
|
|||||
| Total liabilities |
246,575 | 236,562 | ||||||
| Commitments and contingencies—Note 20 |
||||||||
| Stockholders’ equity: |
||||||||
| Preferred stock, $0.001 par value per share, 500,000 shares authorized; none outstanding |
— | — | ||||||
| Common stock, $0.001 par value per share, 2,000,000 shares authorized; 1,000,004 shares outstanding |
1 | 1 | ||||||
| Capital in excess of par value |
118,544 | 120,955 | ||||||
| Accumulated other comprehensive income (loss) |
(1,151 | ) | (414 | ) | ||||
| Accumulated deficit |
(51,017 | ) | (17,485 | ) | ||||
|
|
|
|
|
|||||
| Total stockholders’ equity |
66,377 | 103,057 | ||||||
|
|
|
|
|
|||||
| Total liabilities and stockholders’ equity |
$ | 312,952 | $ | 339,619 | ||||
|
|
|
|
|
|||||
See accompanying notes to consolidated financial statements.
52
SCHOOL SPECIALTY, INC.
CONSOLIDATED STATEMENTS OF OPERATIONS
(In Thousands, Except Per Share Amounts)
| Successor Company | Predecessor Company | |||||||||||||||||
| Fiscal Year Ended April 25, 2015 |
Forty-Six Weeks Ended April 26, 2014 |
Six
Weeks Ended June 11, 2013 |
Fiscal Year Ended April 27, 2013 |
|||||||||||||||
| Revenues |
$ | 621,868 | $ | 572,045 | $ | 58,697 | $ | 674,998 | ||||||||||
| Cost of revenues |
393,710 | 349,845 | 35,079 | 411,118 | ||||||||||||||
|
|
|
|
|
|
|
|
|
|||||||||||
| Gross profit |
228,158 | 222,200 | 23,618 | 263,880 | ||||||||||||||
| Selling, general and administrative expenses |
232,479 | 213,144 | 27,473 | 267,491 | ||||||||||||||
| Facility exit costs and restructuring |
6,056 | 6,552 | — | — | ||||||||||||||
| Impairment charge |
2,713 | — | — | 45,789 | ||||||||||||||
|
|
|
|
|
|
|
|
|
|||||||||||
| Operating income (loss) |
(13,090 | ) | 2,504 | (3,855 | ) | (49,400 | ) | |||||||||||
| Other expense: |
||||||||||||||||||
| Interest expense |
19,599 | 16,882 | 3,235 | 28,600 | ||||||||||||||
| Loss on early extinguishment of debt |
— | — | — | 10,201 | ||||||||||||||
| Early termination of long-term indebtedness |
— | — | — | 26,247 | ||||||||||||||
| Impairment of long-term asset |
— | — | — | 1,414 | ||||||||||||||
| Impairment of investment in unconsolidated affiliate |
— | — | — | 7,749 | ||||||||||||||
| Change in fair value of interest rate swap |
(45 | ) | 483 | — | — | |||||||||||||
| Refund of early termination fee |
— | (4,054 | ) | — | — | |||||||||||||
| Reorganization items, net |
271 | 6,420 | (84,799 | ) | 22,979 | |||||||||||||
|
|
|
|
|
|
|
|
|
|||||||||||
| Income (loss) before provision for (benefit from) income taxes |
(32,915 | ) | (17,227 | ) | 77,709 | (146,590 | ) | |||||||||||
| Provision for (benefit from) income taxes |
617 | 258 | 1,641 | (334 | ) | |||||||||||||
|
|
|
|
|
|
|
|
|
|||||||||||
| Income (loss) before losses from investment in unconsolidated affiliate |
(33,532 | ) | (17,485 | ) | 76,068 | (146,256 | ) | |||||||||||
| Losses of unconsolidated affiliate |
— | — | — | (1,436 | ) | |||||||||||||
|
|
|
|
|
|
|
|
|
|||||||||||
| Net income (loss) |
$ | (33,532 | ) | $ | (17,485 | ) | $ | 76,068 | $ | (147,692 | ) | |||||||
|
|
|
|
|
|
|
|
|
|||||||||||
| Weighted average shares outstanding: |
||||||||||||||||||
| Basic and Diluted |
1,000 | 1,000 | 18,922 | 18,922 | ||||||||||||||
| Net income (loss) per share: |
||||||||||||||||||
| Basic and Diluted |
$ | (33.53 | ) | $ | (17.49 | ) | $ | 4.02 | $ | (7.81 | ) | |||||||
See accompanying notes to consolidated financial statements.
53
SCHOOL SPECIALTY, INC.
CONSOLIDATED STATEMENTS OF COMPREHENSIVE INCOME (LOSS)
(In Thousands)
| Successor Company | Predecessor Company | |||||||||||||||||
| Fiscal Year Ended April 25, 2015 |
Forty-Six Weeks Ended April 26, 2014 |
Six Weeks Ended June 11, 2013 |
Fiscal Year Ended April 27, 2013 |
|||||||||||||||
| Net income (loss) |
$ | (33,532 | ) | $ | (17,485 | ) | $ | 76,068 | $ | (147,692 | ) | |||||||
| Other comprehensive (loss) income |
||||||||||||||||||
| Foreign currency translation adjustments |
(737 | ) | (414 | ) | (101 | ) | (1,250 | ) | ||||||||||
|
|
|
|
|
|
|
|
|
|||||||||||
| Total comprehensive income (loss) |
$ | (34,269 | ) | $ | (17,899 | ) | $ | 75,967 | $ | (148,942 | ) | |||||||
|
|
|
|
|
|
|
|
|
|||||||||||
See accompanying notes to consolidated financial statements.
54
SCHOOL SPECIALTY, INC.
CONSOLIDATED STATEMENTS OF STOCKHOLDERS’ EQUITY (DEFICIT)
FOR FISCAL 2015, THE FORTY-SIX WEEKS ENDED APRIL 26, 2014, SIX WEEKS ENDED JUNE 11, 2013 AND FISCAL 2013
(In Thousands)
| Common Stock |
Additional Paid-in Capital |
Accumulated Deficit |
Treasury Stock |
Accumulated Other Comprehensive Income (Loss) |
Total Stockholders’ Equity (Deficit) |
|||||||||||||||||||
| Balance at April 28, 2012 (Predecessor Company) |
$ | 24 | $ | 444,428 | $ | (213,500 | ) | $ | (186,637 | ) | $ | 23,631 | $ | 67,946 | ||||||||||
|
|
|
|
|
|
|
|
|
|
|
|
|
|||||||||||||
| Tax deficiency on option exercises |
(91 | ) | (91 | ) | ||||||||||||||||||||
| Share-based compensation expense |
1,895 | 1,895 | ||||||||||||||||||||||
| Foreign currency translation adjustment |
(1,250 | ) | (1,250 | ) | ||||||||||||||||||||
| Net loss |
(147,692 | ) | (147,692 | ) | ||||||||||||||||||||
|
|
|
|
|
|
|
|
|
|
|
|
|
|||||||||||||
| Balance at April 27, 2013 (Predecessor Company) |
24 | 446,232 | (361,192 | ) | (186,637 | ) | 22,381 | (79,192 | ) | |||||||||||||||
|
|
|
|
|
|
|
|
|
|
|
|
|
|||||||||||||
| Net income |
76,068 | 76,068 | ||||||||||||||||||||||
| Foreign currency translation adjustment |
(101 | ) | (101 | ) | ||||||||||||||||||||
| Cancellation of Predecessor Company common stock |
(24 | ) | (24 | ) | ||||||||||||||||||||
| Elimination of Predecessor Company capital in excess of par |
(446,232 | ) | (446,232 | ) | ||||||||||||||||||||
| Elimination of Predecessor Company accumulated deficit |
285,124 | 285,124 | ||||||||||||||||||||||
| Elimination of Predecessor Company treasury stock |
186,637 | 186,637 | ||||||||||||||||||||||
| Elimination of Predecessor Company accumulated other comprehensive loss |
(22,280 | ) | (22,280 | ) | ||||||||||||||||||||
|
|
|
|
|
|
|
|
|
|
|
|
|
|||||||||||||
| Balance, June 11, 2013 (Predecessor Company) |
— | — | — | — | — | — | ||||||||||||||||||
|
|
|
|
|
|
|
|
|
|
|
|
|
|||||||||||||
| Issuance of Successor Company Common Stock |
1 | 1 | ||||||||||||||||||||||
| Establishment of Successor Company capital in excess of par |
120,955 | 120,955 | ||||||||||||||||||||||
|
|
|
|
|
|
|
|
|
|
|
|
|
|||||||||||||
| Balance, June 12, 2013 (Successor Company) |
1 | 120,955 | — | — | — | 120,956 | ||||||||||||||||||
|
|
|
|
|
|
|
|
|
|
|
|
|
|||||||||||||
| Net loss |
(17,485 | ) | (17,485 | ) | ||||||||||||||||||||
| Foreign currency translation adjustment |
(414 | ) | (414 | ) | ||||||||||||||||||||
|
|
|
|
|
|
|
|
|
|
|
|
|
|||||||||||||
| Balance, April 26, 2014 (Successor Company) |
1 | 120,955 | (17,485 | ) | — | (414 | ) | 103,057 | ||||||||||||||||
|
|
|
|
|
|
|
|
|
|
|
|
|
|||||||||||||
| Net loss |
(33,532 | ) | (33,532 | ) | ||||||||||||||||||||
| Share-based compensation expense |
581 | 581 | ||||||||||||||||||||||
| Foreign currency translation adjustment |
(737 | ) | (737 | ) | ||||||||||||||||||||
| Change in Fresh Start estimate |
(2,992 | ) | (2,992 | ) | ||||||||||||||||||||
|
|
|
|
|
|
|
|
|
|
|
|
|
|||||||||||||
| Balance, April 25, 2015 (Successor Company) |
$ | 1 | $ | 118,544 | $ | (51,017 | ) | $ | — | $ | (1,151 | ) | $ | 66,377 | ||||||||||
|
|
|
|
|
|
|
|
|
|
|
|
|
|||||||||||||
See accompanying notes to consolidated financial statements.
55
SCHOOL SPECIALTY, INC.
CONSOLIDATED STATEMENTS OF CASH FLOWS
(In Thousands)
| Successor Company | Predecessor Company | |||||||||||||||||
| Fiscal Year Ended April 25, 2015 |
Forty-Six Weeks Ended April 26, 2014 |
Six Weeks Ended June 11, 2013 |
Fiscal Year Ended April 27, 2013 |
|||||||||||||||
| Cash flows from operating activities: |
||||||||||||||||||
| Net income (loss) |
$ | (33,532 | ) | $ | (17,485 | ) | $ | 76,068 | $ | (147,692 | ) | |||||||
| Adjustments to reconcile net income (loss) to net cash provided by (used in) operating activities: |
||||||||||||||||||
| Depreciation and intangible asset amortization expense |
19,233 | 18,876 | 2,983 | 33,220 | ||||||||||||||
| Amortization of development costs |
14,310 | 6,306 | 918 | 7,179 | ||||||||||||||
| Non-cash reorganization items |
— | 1,292 | (99,668 | ) | — | |||||||||||||
| Losses of unconsolidated affiliate |
— | — | — | 1,436 | ||||||||||||||
| Loss on early extinguishment of debt |
— | — | — | 10,201 | ||||||||||||||
| Early termination of long-term indebtedness |
— | — | — | 1,247 | ||||||||||||||
| Fees related to DIP financing |
— | — | — | 9,855 | ||||||||||||||
| Amortization of debt fees and other |
1,946 | 2,139 | 9 | 2,019 | ||||||||||||||
| Change in fair value of interest rate swap |
(45 | ) | 483 | — | — | |||||||||||||
| Share-based compensation expense |
581 | — | — | 1,895 | ||||||||||||||
| Impairment of goodwill and intangible assets |
2,713 | — | — | 45,789 | ||||||||||||||
| Impairment of investment in unconsolidated affiliate |
— | — | — | 7,749 | ||||||||||||||
| Impairment of long-term asset |
— | — | — | 1,414 | ||||||||||||||
| Deferred taxes |
45 | — | — | 5,206 | ||||||||||||||
| Loss on disposal of property, equipment, other |
774 | |||||||||||||||||
| Non-cash interest expense |
2,033 | 1,282 | — | 6,828 | ||||||||||||||
| Changes in current assets and liabilities: |
||||||||||||||||||
| Accounts receivable |
3,437 | 3,843 | (8,011 | ) | 3,960 | |||||||||||||
| Inventories |
(3,548 | ) | 9,295 | (18,255 | ) | 7,922 | ||||||||||||
| Deferred catalog costs |
633 | (887 | ) | 1,754 | 2,813 | |||||||||||||
| Prepaid expenses and other current assets |
422 | 20,121 | 722 | (20,221 | ) | |||||||||||||
| Accounts payable |
846 | 5,013 | 11,012 | 110 | ||||||||||||||
| Accrued liabilities |
(4,465 | ) | (24,563 | ) | 12,488 | 15,430 | ||||||||||||
| Accrued bankruptcy related reorganization costs |
— | (6,188 | ) | — | 6,188 | |||||||||||||
|
|
|
|
|
|
|
|
|
|||||||||||
| Net cash provided by (used in) operating activities |
5,383 | 19,527 | (19,980 | ) | 2,548 | |||||||||||||
|
|
|
|
|
|
|
|
|
|||||||||||
| Cash flows from investing activities: |
||||||||||||||||||
| Additions to property, plant and equipment |
(10,732 | ) | (12,050 | ) | (243 | ) | (4,734 | ) | ||||||||||
| Proceeds from note receivable |
— | — | — | 3,000 | ||||||||||||||
| Change in restricted cash |
— | 26,302 | — | (26,302 | ) | |||||||||||||
| Investment in product development costs |
(6,649 | ) | (5,866 | ) | (463 | ) | (7,579 | ) | ||||||||||
| Investment in product line |
— | — | — | (1,250 | ) | |||||||||||||
| Proceeds from sale of assets |
1,813 | 1,511 | — | — | ||||||||||||||
|
|
|
|
|
|
|
|
|
|||||||||||
| Net cash provided by (used in) investing activities |
(15,568 | ) | 9,897 | (706 | ) | (36,865 | ) | |||||||||||
|
|
|
|
|
|
|
|
|
|||||||||||
| Cash flows from financing activities: |
||||||||||||||||||
| Proceeds from bank borrowings |
321,946 | 277,605 | 87,538 | 1,336,767 | ||||||||||||||
| Repayment of bank borrowings |
(309,796 | ) | (291,919 | ) | (79,977 | ) | (1,260,659 | ) | ||||||||||
| Issuance of debt |
— | — | 165,924 | — | ||||||||||||||
| Repayment of debtor-in-possesion financing |
— | — | (148,619 | ) | — | |||||||||||||
| Payment of early termination fee |
— | (26,399 | ) | — | — | |||||||||||||
| Recovery of interest and reduction of early termination fee |
— | 5,399 | — | — | ||||||||||||||
| Early termination of long-term indebtedness |
— | — | — | (1,247 | ) | |||||||||||||
| Fees related to DIP financing |
— | — | — | (9,855 | ) | |||||||||||||
| Payment of debt fees and other |
(1,034 | ) | (636 | ) | (9,415 | ) | (10,404 | ) | ||||||||||
|
|
|
|
|
|
|
|
|
|||||||||||
| Net cash provided by (used in) financing activities |
11,116 | (35,950 | ) | 15,451 | 54,602 | |||||||||||||
|
|
|
|
|
|
|
|
|
|||||||||||
| Effect of exchange rate changes on cash |
(1,019 | ) | — | — | — | |||||||||||||
| Net (decrease) increase in cash and cash equivalents |
(88 | ) | (6,526 | ) | (5,235 | ) | 20,285 | |||||||||||
| Cash and cash equivalents, beginning of period |
9,008 | 15,534 | 20,769 | 484 | ||||||||||||||
|
|
|
|
|
|
|
|
|
|||||||||||
| Cash and cash equivalents, end of period |
$ | 8,920 | $ | 9,008 | $ | 15,534 | $ | 20,769 | ||||||||||
|
|
|
|
|
|
|
|
|
|||||||||||
| Supplemental disclosures of cash flow information: |
||||||||||||||||||
| Interest paid |
$ | 15,705 | $ | 11,109 | $ | 5,578 | $ | 20,162 | ||||||||||
| Income taxes paid |
$ | 3,461 | $ | 1,346 | $ | — | $ | 534 | ||||||||||
| Bankruptcy related reorganization costs paid (included in operating activities, above) |
$ | 957 | $ | 23,118 | $ | 3,802 | $ | 16,791 | ||||||||||
See accompanying notes to consolidated financial statements.
56
SCHOOL SPECIALTY, INC.
NOTES TO CONSOLIDATED FINANCIAL STATEMENTS
FOR FISCAL 2015, THE FORTY-SIX WEEKS ENDED APRIL 26, 2014,
SIX WEEKS ENDED JUNE 11, 2013 AND FISCAL 2013
(In Thousands, Except Per Share Amounts)
NOTE 1—ORGANIZATION AND BASIS OF PRESENTATION
School Specialty, Inc. and subsidiaries (the “Company”) is a leading distributor of supplies, furniture, technology products and curriculum solutions to the education market place, with operations, in the United States and Canada. Primarily serving the pre-kindergarten through twelfth grade (“preK-12”) market, the Company also sells through non-traditional channels, such as e-commerce in conjunction with e-tail and retail relationships.
During the period January 28, 2013 through June 11, 2013, School Specialty, Inc. and certain of its subsidiaries operated as debtors-in-possession under bankruptcy court jurisdiction (see Note 3). In accordance with Financial Accounting Standards Board Accounting Standards Codification (“ASC”) 852, Reorganizations, for periods including and subsequent to the filing of the Chapter 11 petition, all expenses, gains and losses that resulted from the reorganization were reported separately as reorganization items in the Consolidated Statements of Operations. Net cash used for reorganization items was disclosed separately in the Consolidated Statements of Cash Flows, and liabilities subject to compromise were reported separately in the Consolidated Balance Sheets.
As discussed in Note 4—Fresh Start Accounting, as of June 11, 2013 (the “Effective Date”), the Company adopted fresh start accounting in accordance with ASC 852. The adoption of fresh start accounting resulted in the Company becoming a new entity for financial reporting purposes. Accordingly, the financial statements on or prior to June 11, 2013 are not comparable with the financial statements for periods after June 11, 2013. The consolidated financial statements as of April 25, 2015 and April 26, 2014 and for the twelve months ended April 25, 2015 and the forty six weeks ended April 26, 2014 and any references to “Successor” or “Successor Company” relate to the financial position and results of operations of the reorganized Company subsequent to bankruptcy emergence on June 11, 2013. References to “Predecessor” or “Predecessor Company” refer to the financial position and results of operations of the Company prior to the bankruptcy emergence.
The accompanying consolidated financial statements and related notes to consolidated financial statements are prepared in conformity with accounting principles generally accepted in the United States of America, and include the accounts of School Specialty, Inc. and all of its subsidiaries. All inter-company accounts and transactions have been eliminated. As discussed in Note 6—Investment in Unconsolidated Affiliate, the Company’s investment in its unconsolidated affiliate is accounted for under the cost method as of the fourth quarter of fiscal 2013 as the Company no longer had significant influence over the consolidated affiliate.
NOTE 2—SUMMARY OF SIGNIFICANT ACCOUNTING POLICIES
Use of Estimates
The preparation of financial statements in conformity with accounting principles generally accepted in the United States requires management to make estimates and assumptions that affect the reported amounts of assets and liabilities and the disclosure of contingent assets and liabilities at the date of the financial statements and the reported amounts of revenues and expenses during the reporting period. Actual results could differ from those estimates.
Definition of Fiscal Year
The Company’s fiscal year ends on the last Saturday in April in each year. As used in these consolidated financial statements and related notes to consolidated financial statements, “fiscal 2015,” “fiscal 2014” and “fiscal
57
SCHOOL SPECIALTY, INC.
NOTES TO CONSOLIDATED FINANCIAL STATEMENTS—(Continued)
FOR FISCAL 2015, THE FORTY-SIX WEEKS ENDED APRIL 26, 2014,
SIX WEEKS ENDED JUNE 11, 2013 AND FISCAL 2013
(In Thousands, Except Per Share Amounts)
2013” refer to the Company’s fiscal years ended April 25, 2015, April 26, 2014, and April 27, 2013, respectively. On April 29, 2015 the Board of Directors of the Company approved a change in the Company’s fiscal year end from the last Saturday in April to the last Saturday in December. See Footnote 22—SUBSEQUENT EVENTS.
Cash and Cash Equivalents
The Company considers cash investments with original maturities of three months or less from the date of purchase to be cash equivalents.
Inventories
Inventories, which consist primarily of products held for sale, are stated at the lower of cost or market on a first-in, first-out basis in accordance with FASB ASC Topic 330, “Inventories”. Excess and obsolete inventory reserves recorded were $5,679 and $8,416 as of April 25, 2015 and April 26, 2014, respectively.
Property, Plant and Equipment
Property, plant and equipment are stated at cost. Additions and improvements are capitalized, whereas maintenance and repairs are expensed as incurred. Depreciation of property, plant and equipment is calculated using the straight-line method over the estimated useful lives of the respective assets. The estimated useful lives range from twenty-five to forty years for buildings and their components and three to fifteen years for furniture, fixtures and equipment.
Goodwill and Non-amortizable Intangible Assets
Goodwill represents the excess of reorganization value over fair-value of identified net assets upon emergence from bankruptcy. Prior to bankruptcy, goodwill represented the excess of cost over the fair value of net assets acquired in business combinations accounted for under the purchase method. Certain intangible assets of the Predecessor-Company including a perpetual license agreement and various trademarks and tradenames were estimated to have indefinite lives and were not subject to amortization. Under FASB ASC Topic 350, “Intangibles—Goodwill and Other,” goodwill and indefinite-lived intangible assets are not subject to amortization but rather must be tested for impairment annually or more frequently if events or circumstances indicate they might be impaired. The Company performs the annual impairment test during the fourth quarter of each fiscal year.
In the third quarter of fiscal 2013, the Company concluded that a triggering event had occurred which required the Company to assess whether the fair values of the reporting units were below their carrying values. The triggering event was a combination of the declines in the Company’s forecasted future years’ operating results and cash flows, and the liquidity concerns and eventual default under pre-bankruptcy credit agreements. As a result of the Company’s performance of the goodwill and indefinite-lived intangible asset impairment test in the third quarter of fiscal 2013, the Company recorded impairment charges of $41,089 for goodwill and $4,700 for indefinite-lived intangible assets. See Note 7—Goodwill and Other Intangible Assets for details of these impairment charges. There was no impairment charge recorded in fiscal 2015 or fiscal 2014 related to goodwill or indefinite-lived intangible assets.
Impairment of Long-Lived Assets
As required by FASB ASC Topic 360-10-35 “Impairment or Disposal of Long-Lived Assets,” the Company reviews property, plant and equipment, definite-lived, amortizable intangible assets and development costs for
58
SCHOOL SPECIALTY, INC.
NOTES TO CONSOLIDATED FINANCIAL STATEMENTS—(Continued)
FOR FISCAL 2015, THE FORTY-SIX WEEKS ENDED APRIL 26, 2014,
SIX WEEKS ENDED JUNE 11, 2013 AND FISCAL 2013
(In Thousands, Except Per Share Amounts)
impairment if events or circumstances indicate an asset might be impaired. Amortizable intangible assets include customer relationships, publishing rights, trademarks and tradenames and copyrights and are being amortized over their estimated useful lives. The Company assesses impairment and writes down to fair value long-lived assets when facts and circumstances indicate that the carrying value may not be recoverable through future undiscounted cash flows. The analysis of recoverability is based on management’s assumptions, including future revenue and cash flow projections. In fiscal 2015, the Company concluded $3,690 of its long-lived development costs would not be recovered by future cash flows from related products and, as such, recorded an impairment of certain product development costs. This incremental charge was related to lowered revenue projections for certain products as the Company re-evaluates its strategy for certain product offerings. This change was recorded as accelerated development cost amortization included in the Company’s costs of revenue.
In fiscal 2015, the Company recorded an impairment charge of $2,713 related to its definite-lived intangible asset for content within its Agenda product category. This content was associated with the development of digital capabilities for its agenda product offering.
Development Costs
Development costs represent external and internal costs incurred in the development of a master copy of a book, workbook, video or other supplemental educational materials and products. The Company capitalizes development costs and amortizes these costs into costs of revenues over the lesser of five years or the product’s life cycle in amounts proportionate to expected revenues. At April 25, 2015 and April 26, 2014, net development costs totaled $19,557 and $27,305, respectively, and are included as a component of development costs and other assets, net, in the consolidated balance sheets.
Fair Value of Financial Instruments
U.S. GAAP defines fair value as the price that would be received for an asset or paid to transfer a liability (exit price) in an orderly transaction between market participants in the principal or most advantageous market for the asset or liability. U.S. GAAP also classifies the inputs used to measure fair value into the following hierarchy:
| Level 1: |
Quoted prices in active markets for identical assets or liabilities. | |
| Level 2: |
Quoted prices in active markets for similar assets or liabilities, quoted prices for identical or similar assets or liabilities in markets that are not active, or input other than quoted prices that are observable for the asset or liability. | |
| Level 3: |
Unobservable inputs for the asset or liability. | |
The following table sets forth the non-financial items measured at fair value on a non-recurring basis during fiscal years 2015 and 2014. All items were categorized as Level 3 within the fair value hierarchy. Refer to these notes to the consolidated financial statements for descriptions valuation techniques and inputs used to develop these fair value measurements:
| Description |
Balance Sheet Location |
Fiscal 2015 | Fiscal 2014 | Categorization | ||||||||||
| Assets held for sale |
Assets held for sale | — | $ | 2,200 | Level 3 | |||||||||
59
SCHOOL SPECIALTY, INC.
NOTES TO CONSOLIDATED FINANCIAL STATEMENTS—(Continued)
FOR FISCAL 2015, THE FORTY-SIX WEEKS ENDED APRIL 26, 2014,
SIX WEEKS ENDED JUNE 11, 2013 AND FISCAL 2013
(In Thousands, Except Per Share Amounts)
In accordance with FASB ASC Topic 825, “Financial Instruments” and FASB ASC Topic 820, “Fair Value Measurement,” the carrying amounts of the Company’s financial instruments including cash and cash equivalents, accounts receivable, accounts payable, and accrued liabilities approximate fair value given the short maturity of these instruments.
The following table sets forth the financial instruments where carrying amounts may vary from fair value as of April 25, 2015:
| Description |
Balance Sheet Location |
Carrying Value | Fair Value | Categorization | ||||||||||
| New ABL Facility |
Current maturities of long-term debt | $ | 24,200 | $ | 24,200 | Level 3 | ||||||||
| New Term Loan |
Long-term debt less current maturities | 142,462 | 142,462 | Level 2 | ||||||||||
| Deferred Cash Payment Obligations |
Long-term debt less current maturities | 17,684 | 15,565 | Level 3 | ||||||||||
The Company has estimated the April 25, 2015 fair value of the amounts outstanding under its New ABL Facility approximated its carrying value at the end of fiscal 2015 given the variable interest rates and the proximate maturity date of the facility. The Company estimated the April 25, 2015 fair value of its amounts outstanding under its New Term Loan based on traded prices. The Company estimated the fair value for its Deferred Cash Payment Obligations based upon the net present value of the future cash flows using a discount rate that is consistent with our New Term Loan.
The Company’s Consolidated Balance Sheets as of April 25, 2015 and April 26, 2014 reflect its interest rate swap agreement at fair value. The fair values of the interest rate swap agreement as of April 25, 2015 and April 26, 2014 (valued under Level 2) were $438 and $483, respectively, and are included in “Other Liabilities” of the Consolidated Balance Sheet.
The following table sets forth the financial instruments where carrying amounts may vary from fair value as of April 26, 2014:
| Description |
Balance Sheet Location |
Carrying Value | Fair Value | Categorization | ||||||||||
| New ABL Facility |
Current maturities of long-term debt | $ | 10,600 | $ | 10,600 | Level 3 | ||||||||
| New Term Loan |
Long-term debt less current maturities | 143,913 | 143,913 | Level 2 | ||||||||||
| Deferred Cash Payment Obligations |
Long-term debt less current maturities | 14,335 | 14,335 | Level 3 | ||||||||||
Income Taxes
In accordance with FASB ASC Topic 740, “Income Taxes”, income taxes have been computed utilizing the asset and liability approach which requires the recognition of deferred tax assets and liabilities for the tax consequences of temporary differences by applying enacted statutory tax rates applicable to future years to differences between the financial statement carrying amounts and the tax basis of existing assets and liabilities. Valuation allowances are provided when it is anticipated that some or all of a deferred tax asset is not likely to be realized.
60
SCHOOL SPECIALTY, INC.
NOTES TO CONSOLIDATED FINANCIAL STATEMENTS—(Continued)
FOR FISCAL 2015, THE FORTY-SIX WEEKS ENDED APRIL 26, 2014,
SIX WEEKS ENDED JUNE 11, 2013 AND FISCAL 2013
(In Thousands, Except Per Share Amounts)
Revenue Recognition
Revenue, net of estimated returns and allowances, is recognized upon the shipment of products or upon the completion of services to customers, which corresponds to the time when risk of ownership transfers, the selling price is fixed, the customer is obligated to pay, collectability is reasonably assured and we have no significant remaining obligations. These criteria may be met upon shipment of customer receipt for products, or upon completion of services provided to customers. Cash received in advance from customers is deferred on our balance sheet as a current liability until revenue is recognized.
Concentration of Credit Risks
The Company grants credit to customers in the ordinary course of business. The majority of the Company’s customers are school districts and schools. Concentration of credit risk with respect to trade receivables is limited due to the significant number of customers and their geographic dispersion. During fiscal 2015, the forty-six weeks ended April 26, 2014, the six weeks ended June 11, 2013, fiscal 2013, no customer represented more than 10% of revenues or accounts receivable.
Vendor Rebates
The Company receives reimbursements from vendors (vendor rebates) based on annual purchased volume of products from its respective vendors. The Company’s vendor rebates are earned based on pre-determined percentage rebates on the purchased volume of products within a calendar year. The majority of the rebates are not based on minimum purchases or milestones, and therefore the Company recognizes the rebates on an accrual basis and reduces cost of revenues over the estimated period the related products are sold.
Deferred Catalog Costs
Deferred catalog costs represent costs which have been paid to produce Company catalogs, net of vendor cooperative advertising payments, which will be used in and benefit future periods. Deferred catalog costs are amortized in amounts proportionate to expected revenues over the life of the catalog, which is one year or less. Amortization expense related to deferred catalog costs is included in the consolidated statements of operations as a component of selling, general and administrative expenses. Such amortization expense for fiscal 2015, the forty-six weeks ended April 26, 2014, six weeks ended June 11, 2013, and fiscal 2013 was $9,751, $10,178, $1,553, and $16,057, respectively.
Restructuring
The Company accounts for restructuring costs associated with both the closure or disposal of distribution centers and severance related to headcount reductions in accordance with FASB ASC Topic 712, “Compensation—Retirement Benefits.” During fiscal 2015, the forty-six weeks ended April 26, 2014 and the six weeks ended June 11, 2013, the Company recorded $5,477, $4,210 and ($161), respectively, of severance expense. During fiscal 2013, the Company recorded $1,561 of severance expense. As of April 25, 2015, April 26, 2014, and April 27, 2013, there was $1,579, $193, and $716, respectively, of accrued restructuring costs recorded in other accrued liabilities on the consolidated balance sheet primarily related to various cost reduction activities. See Note 19 for details of these restructuring charges.
Shipping and Handling Costs
In accordance with FASB ASC Topic 605-45-45, “Revenue Recognition—Principal Agent Considerations—Other Presentation,” the Company accounts for shipping and handling costs billed to customers
61
SCHOOL SPECIALTY, INC.
NOTES TO CONSOLIDATED FINANCIAL STATEMENTS—(Continued)
FOR FISCAL 2015, THE FORTY-SIX WEEKS ENDED APRIL 26, 2014,
SIX WEEKS ENDED JUNE 11, 2013 AND FISCAL 2013
(In Thousands, Except Per Share Amounts)
as a component of revenues. The Company accounts for shipping and handling costs incurred as a cost of revenues for shipments made directly from vendors to customers. For shipments made from the Company’s warehouses, the Company accounts for shipping and handling costs incurred as a selling, general and administrative expense. The amount of shipping and handling costs included in selling, general and administrative expenses for fiscal 2015, the forty-six weeks ended April 26, 2014, six weeks ended June 11, 2013, and fiscal 2013 was $31,061, $26,231, $3,249, and $31,631, respectively.
Foreign Currency Translation
The financial statements of foreign subsidiaries have been translated into U.S. dollars in accordance with FASB ASC Topic 830, “Foreign Currency Matters.” All balance sheet accounts have been translated using the exchange rates in effect at the balance sheet date. Amounts in the statements of operations have been translated using the weighted average exchange rate for the reporting period. Resulting translation adjustments are included in foreign currency translation adjustment within other comprehensive income.
Share-Based Compensation Expense
The Company accounts for its share-based compensation plans under the recognition and measurement principles of FASB ASC Topic 718, “Compensation—Stock Compensation” and FASB ASC Topic 505, “Equity-Based Payments to Non-Employees”. See Note 15.
Recent Accounting Pronouncements
In May 2014, the FASB issued ASU No. 2014-09, “Revenue from Contracts with Customers”. ASU No. 2014-09 provides guidance for revenue recognition. The standard’s core principle is that a company will recognize revenue when it transfers promised goods or services to customers in an amount that reflects the consideration to which the company expects to be entitled in exchange for those goods or services. In doing so, companies will need to use more judgment and make more estimates than under today’s guidance. These may include identifying performance obligations in the contract, estimating the amount of variable consideration to include in the transaction price and allocating the transaction price to each separate performance obligation. This guidance will be effective for the Company in the first quarter of its fiscal year ending December 24, 2017. The Company is currently in the process of evaluating the impact of adoption of this ASU on the Company’s consolidated financial statements.
In August 2014, the FASB issued ASU No. 2014-15, “Presentation of Financial Statements—Going Concern.” ASU 2014-15 defines management’s responsibility to evaluate whether there is substantial doubt about an organization’s ability to continue as a going concern and to provide related footnote disclosures. ASU 2014-15 is effective in the annual period ending after December 15, 2016. The adoption of this update is not expected to have a material impact on the Company’s consolidated financial statements.
NOTE 3—BANKRUPTCY PROCEEDINGS
On January 28, 2013 (the “Petition Date”), School Specialty, Inc. and certain of its subsidiaries (collectively, the “Debtors”) filed voluntary petitions for relief under Chapter 11 of the United States Code (the “Bankruptcy Code”) in the United States Bankruptcy Court for the District of Delaware (the “Bankruptcy Court”). The cases (the “Chapter 11 Cases”) were jointly administered as Case No. 13-10125 (KJC) under the
62
SCHOOL SPECIALTY, INC.
NOTES TO CONSOLIDATED FINANCIAL STATEMENTS—(Continued)
FOR FISCAL 2015, THE FORTY-SIX WEEKS ENDED APRIL 26, 2014,
SIX WEEKS ENDED JUNE 11, 2013 AND FISCAL 2013
(In Thousands, Except Per Share Amounts)
caption “In re School Specialty, Inc., et al.” The Debtors continued to operate their business as “debtors-in-possession” (“DIP”) under the jurisdiction of the Bankruptcy Court and in accordance with the applicable provisions of Chapter 11 and orders of the Bankruptcy Court. The Company’s foreign subsidiaries (collectively, the “Non-Filing Entities”) were not part of the Chapter 11 Cases.
The Chapter 11 Cases were filed in response to an environment of ongoing declines in school spending and a lack of sufficient liquidity, including trade credit provided by the Debtors’ vendors, to permit the Debtors to pursue their business strategy to position the School Specialty brands successfully for the long term. As a result of the Chapter 11 filing, the Company’s common stock was delisted from the NASDAQ Stock Market, effective March 1, 2013.
On May 23, 2013, the Bankruptcy Court entered an order confirming the Debtors’ Second Amended Joint Plan of Reorganization Under Chapter 11 of the Bankruptcy Code (the “Reorganization Plan”), and a corrected copy of such order was entered by the Bankruptcy Court on June 3, 2013. The Reorganization Plan, which is described in additional detail below, became effective on June 11, 2013 (the “Effective Date”.) Pursuant to the Reorganization Plan, on the Effective Date, the Company’s existing credit agreements, outstanding convertible subordinated debentures, equity plans and certain other agreements were cancelled. In addition, all outstanding equity interests of the Company that were issued and outstanding prior to the Effective Date were cancelled on the Effective Date. Also on the Effective Date, in accordance with and as authorized by the Reorganization Plan, the Company reincorporated in Delaware and issued a total of 1,000,004 shares of Common Stock of the reorganized Company to holders of certain allowed claims against the Debtors in exchange for such claims. As of June 12, 2013, there were 60 record holders of the new common stock of the reorganized Company issued pursuant to the Reorganization Plan.
Reorganization Plan
General
The Reorganization Plan generally provided for the payment in full in cash on or as soon as practical after the Effective Date of specified claims, including:
| • | All claims (the “DIP Financing Claims”) under the Debtor-in-Possession Credit Agreement (the “ABL DIP Agreement”) by and among Wells Fargo Capital Finance, LLC (as Administrative Agent, Co-Collateral Agent, Co-Lead Arranger and Joint Book Runner) and GE Capital Markets, Inc. (as Co-Collateral Agent, Co-Lead Arranger and Joint Book Runner and Syndication Agent), General Electric Capital Corporation (as syndication agent), the lenders party to the ABL DIP Facility (as defined below), and the Company and certain of its subsidiaries; |
| • | Certain pre-petition secured claims; |
| • | All claims relating to the costs and expenses of administering the Chapter 11 Cases; and |
| • | All priority claims. |
In addition, the Reorganization Plan generally provides for the treatment of allowed claims against, and equity interests in, the Debtors as follows:
| • | The lenders under the Senior Secured Super Priority Debtor-in-Possession Credit Agreement (the “Ad Hoc DIP Agreement”) by and among the Company, certain of its subsidiaries, U.S. Bank National Association, as Administrative Agent and Collateral Agent and the lenders party thereto were entitled |
63
SCHOOL SPECIALTY, INC.
NOTES TO CONSOLIDATED FINANCIAL STATEMENTS—(Continued)
FOR FISCAL 2015, THE FORTY-SIX WEEKS ENDED APRIL 26, 2014,
SIX WEEKS ENDED JUNE 11, 2013 AND FISCAL 2013
(In Thousands, Except Per Share Amounts)
| to receive (i) cash in an approximate amount of $98,000, and (ii) 65% of the common stock of the reorganized Company. The fair value of the 65% ownership interest was approximately $78,600 as of the Effective Date. Approximately $57,200 of this value was in satisfaction of the portion of the Ad Hoc DIP not settled in cash with approximately $21,375 representing excess value received by the Ad Hoc DIP lenders. The $21,375 of excess value received by the Ad Hoc DIP lenders was recognized as a reorganization loss; |
| • | Each holder of an allowed general unsecured claim is entitled to receive a deferred cash payment equal to 20% of such allowed claim, plus interest, on the terms described in the Reorganization Plan; |
| • | Each holder of an unsecured claim arising from the provision of goods and/or services to the Debtors in the ordinary course of its pre-petition trade relationship with the Debtors, with whom the reorganized Debtors continue to do business after the Effective Date, is entitled to receive a deferred cash payment equal to 20% of such claim, plus interest, on the terms described in the Reorganization Plan. Such holders may increase their percentage recoveries to 45%, plus interest, by electing to provide the reorganized Debtors with customary trade terms for a specified period, as described in the Reorganization Plan; |
| • | Each holder of the Company’s 3.75% Convertible Subordinated Debentures due 2026, as further described elsewhere in this report, received its pro rata share of 35% of the common stock of the reorganized Company; |
| • | Each holder of an allowed general unsecured claim or allowed trade unsecured claim of $3 or less, or any holder of a general unsecured claim or trade unsecured claim in excess of $3 that agreed to voluntarily reduce the amount of its claim to $3 under the terms described in the Reorganization Plan, was entitled to receive a cash payment equal to 20% of such allowed claim on or as soon as practicable after the Effective Date; and |
| • | Holders of equity interests in the Company prior to the Effective Date, including claims arising out of or with respect to such equity interests, were not entitled to receive any distribution under the Reorganization Plan. |
Exit Facilities
As of the Effective Date, the Debtors closed on the exit credit facilities, the proceeds of which were or will be, among other things, used to (i) pay in cash the DIP Financing Claims, to the extent provided for in the Reorganization Plan, (ii) make required distributions under the Reorganization Plan, (iii) satisfy certain Reorganization Plan-related expenses, and (iv) fund the reorganized Company’s working capital needs. The terms of the exit credit facilities are described under Note 10 of the Notes to Condensed Consolidated Financial Statements—Debt.
Equity Interests
As mentioned above, all shares of the Company’s common stock outstanding prior to the Effective Date were cancelled and extinguished as of the Effective Date. The Company issued 1,000,004 shares of new common stock on the Effective Date pursuant to the Reorganization Plan, which constitutes the total number of shares of new common stock outstanding immediately following the Effective Date.
On the Effective Date, equity interests in the Company’s U.S. subsidiaries were deemed cancelled and extinguished and of no further force and effect, and each reorganized subsidiary was deemed to issue and
64
SCHOOL SPECIALTY, INC.
NOTES TO CONSOLIDATED FINANCIAL STATEMENTS—(Continued)
FOR FISCAL 2015, THE FORTY-SIX WEEKS ENDED APRIL 26, 2014,
SIX WEEKS ENDED JUNE 11, 2013 AND FISCAL 2013
(In Thousands, Except Per Share Amounts)
distribute the new subsidiary equity interests. The ownership and terms of such new subsidiary equity interests in the reorganized subsidiaries are the same as the ownership and terms of the equity interests in these subsidiaries immediately prior to the Effective Date, except as otherwise provided in the Reorganization Plan.
Financial Statement Presentation
We have prepared the accompanying consolidated financial statements in accordance with FASB ASC Topic 852 “Reorganizations” (“FASB ASC 852”). FASB ASC 852 required that the financial statements distinguish transactions and events that were directly associated with the reorganization from the ongoing operations of the business. Accordingly, certain expenses including professional fees, realized gains and losses and provisions for losses that were realized from the reorganization and restructuring process were classified as reorganization items on the consolidated statement of operations.
In connection with the Company’s emergence from Chapter 11, the Company was required to adopt fresh start accounting as of June 11, 2013 in accordance with ASC 852 “Reorganizations”. The Company elected to use June 8, 2013 (the “Convenience Date”), which was the week ended date nearest to the Effective Date, to avoid disruption to the Company’s weekly accounting processes. The Company performed a qualitative and quantitative assessment in order to determine the appropriateness of using the Convenience Date for fresh start accounting instead of the Effective Date. The Company’s assessment determined that the use of the Convenience Date did not have a material impact on either the predecessor or successor periods in fiscal 2014 and there were no qualitative factors that would preclude the use of the Convenience Date for accounting and reporting purposes. The adoption of fresh start accounting resulted in the Company becoming a new entity for financial reporting purposes. Accordingly, the financial statements on or prior to June 11, 2013 are not comparable with the financial statements for periods after June 11, 2013. The consolidated financial statements for fiscal 2015 and as of April 26, 2014 and for the forty-six weeks then ended and any references to “Successor” or “Successor Company” show the financial position and results of operations of the reorganized Company subsequent to bankruptcy emergence on June 11, 2013. References to “Predecessor” or “Predecessor Company” refer to the financial position and results of operations of the Company prior to the bankruptcy emergence.
NOTE 4—FRESH START ACCOUNTING
On the Effective Date, the Company adopted fresh start accounting and reporting in accordance with FASB ASC 852. The Company was required to apply the provisions of fresh start reporting to its financial statements, as the holders of existing voting shares of the Predecessor Company received less than 50% of the voting shares of the emerging entity and the reorganization value of the Predecessor Company’s assets immediately before the date of confirmation was less than the post-petition liabilities and allowed claims.
Fresh start reporting generally requires resetting the historical net book value of assets and liabilities to fair value as of the Effective Date by allocating the entity’s enterprise value as set forth in the Reorganization Plan to its assets and liabilities pursuant to accounting guidance related to business combinations. The financial statements as of the Effective Date report the results of the Successor Company with no beginning retained earnings or accumulated deficit. Any presentation of the Successor Company represents the financial position and results of operations of a new reporting entity and is not comparable to prior periods. The consolidated financial statements for periods ended prior to the Effective Date do not include the effect of any changes in capital structure or changes in the fair value of assets and liabilities as a result of fresh start accounting.
65
SCHOOL SPECIALTY, INC.
NOTES TO CONSOLIDATED FINANCIAL STATEMENTS—(Continued)
FOR FISCAL 2015, THE FORTY-SIX WEEKS ENDED APRIL 26, 2014,
SIX WEEKS ENDED JUNE 11, 2013 AND FISCAL 2013
(In Thousands, Except Per Share Amounts)
In accordance with FASB ASC 852, the Predecessor Company’s results of operations prior to the Effective Date include (i) a pre-emergence gain of $161,943 resulting from the discharge of liabilities under the Reorganization Plan; (ii) pre-emergence charges to earnings of $46,878 recorded as reorganization items resulting from certain costs and expenses relating to the Reorganization Plan becoming effective, including the cancellation of certain debt upon issuance of new equity and the cancellation of equity-based awards of the Predecessor; and (iii) a pre-emergence decrease in earnings of $30,266 resulting from the aggregate changes to the net carrying value of the Predecessor Company’s pre-emergence assets and liabilities to reflect their fair values under fresh start accounting, as well as the recognition of goodwill. See Note 5, “Reorganization Items, Net” for additional information.
Enterprise Value / Reorganization Value Determination
Enterprise value represents the fair value of an entity’s interest-bearing debt and stockholders’ equity. In the disclosure statement associated with the Reorganization Plan, which was confirmed by the Bankruptcy Court, the Company estimated a range of enterprise values between $275,000 and $325,000, with a midpoint of $300,000. Based on current and anticipated economic conditions and the direct impact these conditions have on our business, the Company deemed it appropriate to use the midpoint between the low end and high end of the range to determine the final enterprise value of $300,000, comprised of debt valued at approximately $179,000 and equity valued at approximately $121,000.
FASB ASC 852 provides for, among other things, a determination of the value to be assigned to the assets of the reorganized Company as of a date selected for financial reporting purposes. The Company adjusted its enterprise value of $300,000 for certain items such as post-petition liabilities to determine a reorganization value attributable to assets of $415,410. Under fresh start accounting, the reorganization value was allocated to the Company’s assets based on their respective fair values in conformity with the purchase method of accounting for business combinations included in FASB ASC 805, Business Combinations. The excess reorganization value over the fair value of identified tangible and intangible assets of $21,588 was recorded as goodwill.
The reorganization value represents the amount of resources available, or that become available, for the satisfaction of post-petition liabilities and allowed claims, as negotiated between the Company and its creditors (the “Interested Parties”). This value, along with other terms of the Reorganization Plan, was determined only after extensive arms-length negotiations between the Interested Parties. Each Interested Party developed its view of what the value should be based upon expected future cash flows of the business after emergence from Chapter 11, discounted at rates reflecting perceived business and financial risks. This value is viewed as the fair value of the entity before considering liabilities and is intended to approximate the amount a willing buyer would pay for the assets of the Successor Company immediately after restructuring. The reorganization value was determined using numerous projections and assumptions that are inherently subject to significant uncertainties and the resolution of contingencies beyond the control of the Company. Accordingly, there can be no assurance that the estimates, assumptions and amounts reflected in the valuation will be realized.
Methodology, Analysis and Assumptions
The Company’s valuation was based upon a discounted cash flow methodology, which included a calculation of the present value of expected un-levered after-tax free cash flows reflected in our long-term financial projections, including the calculation of the present value of the terminal value of cash flows, and supporting analysis that included a comparison of selected financial data of the Company with similar data of
66
SCHOOL SPECIALTY, INC.
NOTES TO CONSOLIDATED FINANCIAL STATEMENTS—(Continued)
FOR FISCAL 2015, THE FORTY-SIX WEEKS ENDED APRIL 26, 2014,
SIX WEEKS ENDED JUNE 11, 2013 AND FISCAL 2013
(In Thousands, Except Per Share Amounts)
other publicly held companies comparable to the Company in terms of end markets, operational characteristics, growth prospects and geographical footprint. The Company also considered precedent transaction analysis but ultimately determined there was insufficient data for a meaningful analysis. A detailed discussion of this methodology and supporting analysis is presented below.
The Company’s multi-year business plan was the foundation for developing long-term financial projections used in the valuation of our business. The business planning and forecasting process included a review of Company, industry and macroeconomic factors including, but not limited to, achievement of future financial results, projected changes associated with our reorganization initiatives, anticipated changes in general market conditions including variations in market regions, and known new business initiatives and challenges.
The following represents a detailed discussion of the methodology and supporting analysis used to value our business using the business plan and long-term financial projections developed by the Company:
Discounted Cash Flow Methodology
The Discounted Cash Flow (“DCF”) analysis is a forward-looking enterprise valuation methodology that relates the value of an asset or business to the present value of expected future cash flows to be generated by that asset or business. Under this methodology, projected future cash flows are discounted by the business’ weighted average cost of capital (“WACC”). The WACC reflects the estimated blended rate of return that debt and equity investors would require to invest in the business based on its capital structure. Our DCF analysis has two components: (1) the present value of the expected un-levered after-tax free cash flows for a determined period, and (2) the present value of the terminal value of cash flows, which represents a firm value beyond the time horizon of the long-term financial projections.
The DCF calculation was based on management’s financial projections of un-levered after-tax free cash flows for the period 2014 to 2017. The Company used a WACC of 13.3% to discount future cash flows and terminal values. This WACC was determined based upon an estimated cost of debt for similar sized companies, rather than the anticipated cost of debt of the reorganized Company upon emergence from bankruptcy, and a market cost of equity using a capital asset pricing model. Assumptions used in the DCF analysis, including the appropriate components of the WACC, were deemed to be those of “market participants” upon analysis of peer groups’ capital structures.
In conjunction with our analysis of publicly traded companies described below, the Company used a range of exit multiples of 2013 earnings before interest, taxes, depreciation and amortization (“EBITDA”) between 4.4 and 8.1, with a lower than midpoint exit multiple of 5.5 selected, to determine the present value of the terminal value of cash flows. The selected exit multiple is weighted towards those comparable companies which are more similar to the Company’s Distribution (formerly referred to as “Educational Resources”) segment which represents a higher percentage of consolidated revenues as compared to the Curriculum (formerly referred to as “Accelerated Learning”) segment.
The sum of the present value of the projected un-levered after-tax free cash flows was added to the present value of the terminal value of cash flows to determine the Company’s enterprise value.
Publicly Traded Company Analysis
As part of our valuation analysis, the Company identified publicly traded companies whose businesses are relatively similar to each of our reporting segments and have comparable operational characteristics to derive
67
SCHOOL SPECIALTY, INC.
NOTES TO CONSOLIDATED FINANCIAL STATEMENTS—(Continued)
FOR FISCAL 2015, THE FORTY-SIX WEEKS ENDED APRIL 26, 2014,
SIX WEEKS ENDED JUNE 11, 2013 AND FISCAL 2013
(In Thousands, Except Per Share Amounts)
comparable revenue and EBITDA multiples for our DCF analysis. Criteria for selecting comparable companies for the analysis included, among other relevant characteristics, similar lines of businesses, business risks, growth prospects, maturity of businesses, market presence, size, and scale of operations. The analysis included a detailed multi-year financial comparison of each company’s income statement, balance sheet and statement of cash flows. In addition, each company’s performance, profitability, margins, leverage and business trends were also examined. Based on these analyses, a number of financial multiples and ratios were calculated to gauge each company’s relative performance and valuation. The ranges of ratios derived were then applied to the Company’s projected financial results to develop a range of implied values.
Enterprise Value, Accounting Policies and Reorganized Consolidated Balance Sheet
In determining the final enterprise value attributed to the Company of $300,000, the Company blended its DCF methodology and publicly traded company analysis, with more emphasis on the DCF methodology.
Fresh start accounting and reporting permits the selection of appropriate accounting policies for Successor Company. The Predecessor Company’s significant accounting policies that were disclosed in the Annual Report on Form 10-K for the year ended April 27, 2013 were generally adopted by the Successor Company as of the Effective Date, though many of the account balances were affected by the reorganization and fresh start adjustments presented below.
The adjustments presented below were made to the June 11, 2013 consolidated balance sheet and contain estimates of fair value. Estimates of fair value represent the Company’s best estimates, which are based on industry and data trends, and by reference to relevant market rates and discounted cash flow valuation methods, among other factors. The determination of the fair value of assets and liabilities is subject to significant estimation and assumptions. In accordance with ASC No. 805, the allocation of the reorganization value is subject to additional adjustment until the Company completed its analysis. The Company finalized its analysis in fiscal 2015.
The condensed consolidated balance sheet, reorganization adjustments and fresh start adjustments presented below summarize the impact of the Reorganization Plan and the adoption of fresh start accounting as of the Effective Date. Certain fresh start adjustments were updated between the Effective Date and finalization of fresh start accounting in fiscal 2015. The Successor Company updated the estimated value of unsecured claims certain holders of which elected to provide the Company with customary trade terms and thereby recover 45% of their claims, in accordance with the Reorganization Plan (Note 3).
68
SCHOOL SPECIALTY, INC.
NOTES TO CONSOLIDATED FINANCIAL STATEMENTS—(Continued)
FOR FISCAL 2015, THE FORTY-SIX WEEKS ENDED APRIL 26, 2014,
SIX WEEKS ENDED JUNE 11, 2013 AND FISCAL 2013
(In Thousands, Except Per Share Amounts)
REORGANIZED CONDENSED CONSOLIDATED BALANCE SHEET
AS OF JUNE 11, 2013
| June 11, 2013 | ||||||||||||||||
| Predecessor Company |
Reorganization Adjustments |
Fresh Start Adjustments |
Successor Company |
|||||||||||||
| ASSETS |
||||||||||||||||
| Current assets: |
||||||||||||||||
| Cash and cash equivalents |
$ | 11,052 | $ | 4,363 | (1) | $ | — | $ | 15,415 | |||||||
| Restricted cash |
26,421 | — | — | 26,421 | ||||||||||||
| Accounts receivable |
66,894 | — | (250 | )(8) | 66,644 | |||||||||||
| Inventories |
110,830 | — | (8,147 | )(8) | 102,683 | |||||||||||
| Other current assets |
45,819 | 321 | (2) | (788 | )(8) | 45,352 | ||||||||||
|
|
|
|
|
|
|
|
|
|||||||||
| Total current assets |
261,016 | 4,684 | (9,185 | ) | 256,515 | |||||||||||
| Property, plant and equipment, net |
37,604 | (6,202 | )(2) | 14,148 | (8) | 45,550 | ||||||||||
| Goodwill |
— | — | 21,588 | (8)(9) | 21,588 | |||||||||||
| Intangible assets, net |
109,155 | — | (56,795 | )(8) | 52,360 | |||||||||||
| Development costs and other |
31,142 | 8,255 | (3) | — | 39,397 | |||||||||||
|
|
|
|
|
|
|
|
|
|||||||||
| Total assets |
$ | 438,917 | $ | 6,737 | $ | (30,244 | ) | $ | 415,410 | |||||||
|
|
|
|
|
|
|
|
|
|||||||||
| LIABILITIES AND STOCKHOLDERS’ EQUITY |
||||||||||||||||
| Current liabilities: |
||||||||||||||||
| Accounts payable |
$ | 38,226 | $ | — | $ | — | $ | 38,226 | ||||||||
| Accrued compensation |
7,229 | (315 | )(2) | — | 6,914 | |||||||||||
| Other accrued liabilities |
60,301 | 9,947 | (2)(4)(6) | 22 | (8) | 70,270 | ||||||||||
|
|
|
|
|
|
|
|
|
|||||||||
| Total current liabilities |
105,756 | 9,632 | 22 | 115,410 | ||||||||||||
| Long-term debt |
205,863 | (39,939 | )(5) | — | 165,924 | |||||||||||
| Other liabilities |
925 | 12,195 | (2)(6) | — | 13,120 | |||||||||||
| Liabilities subject to compromise |
223,988 | (223,988 | )(6) | — | — | |||||||||||
|
|
|
|
|
|
|
|
|
|||||||||
| Total liabilities |
$ | 536,532 | $ | (242,100 | ) | $ | 22 | $ | 294,454 | |||||||
|
|
|
|
|
|
|
|
|
|||||||||
| Commitments and contingencies |
||||||||||||||||
| Stockholders’ equity: |
||||||||||||||||
| Common stock—Predecessor |
$ | 24 | $ | (24 | )(7) | $ | — | $ | — | |||||||
| Capital in excess of par value—Predecessor |
446,232 | (446,232 | )(7) | — | — | |||||||||||
| Treasury Stock—Predecessor |
(186,637 | ) | 186,637 | (7) | — | — | ||||||||||
| Accumulated (deficit) and other comprehensive income—Predecessor |
(357,234 | ) | 387,500 | (7) | (30,266 | )(7)(8) | — | |||||||||
| Common stock—Successor |
— | 1 | (7) | — | 1 | |||||||||||
| Capital in excess of par value—Successor |
— | 120,955 | (7) | — | 120,955 | |||||||||||
|
|
|
|
|
|
|
|
|
|||||||||
| Total stockholders’ equity |
(97,615 | ) | 248,837 | (30,266 | ) | 120,956 | ||||||||||
|
|
|
|
|
|
|
|
|
|||||||||
| Total liabilities and stockholders’ equity |
$ | 438,917 | $ | 6,737 | $ | (30,244 | ) | $ | 415,410 | |||||||
|
|
|
|
|
|
|
|
|
|||||||||
| (1) | The Company deposited $7,647 of proceeds from its exit financing into a segregated cash account which was used to pay administrative claims and certain advisors in the bankruptcy proceedings. The Company utilized $3,284 of its cash balance immediately prior to emergence to fund a portion of the cash requirements from exit financing. |
| (2) | The Company recorded adjustments related to various contract rejections or amendments completed as part of the Reorganization Plan. This included a $6,202 write down of property, plant and equipment related to the amendment of capital lease obligations for the Mansfield, OH distribution center and the rejection of |
69
SCHOOL SPECIALTY, INC.
NOTES TO CONSOLIDATED FINANCIAL STATEMENTS—(Continued)
FOR FISCAL 2015, THE FORTY-SIX WEEKS ENDED APRIL 26, 2014,
SIX WEEKS ENDED JUNE 11, 2013 AND FISCAL 2013
(In Thousands, Except Per Share Amounts)
| capital lease obligations for the Company’s Agawam, MA property. In addition, the Company recorded $920 related to various contract damages relating to lease rejections and severance obligations, classified between long-term and short-term liabilities. |
| (3) | In connection with entering into the exit credit facilities, the Company capitalized $8,255 of deferred financing costs. |
| (4) | Pursuant to the Chapter 11 Cases, additional professional fees of $2,057 were recorded. In addition, certain administrative and convenience claims of $8,435 were recorded as current liabilities, offset by accrued interest expense converted to new Successor Company equity. |
| (5) | The table below presents refinancing of the Predecessor long-term debt. The Company issued $78,620 of new Successor Company equity (including $21,375 in excess of debt carrying amount), partially offset by $17,306 of debt discount and other financing costs. The current portion of the reorganized debt was $25,251, which includes $23,823 of new Successor Company ABL loan. |
| June 11, 2013 | ||||
| Predecessor Company long-term debt |
$ | 205,863 | ||
| Reorganization adjustments: |
||||
| Issuance of Successor Company equity |
(78,620 | ) | ||
| Equity issuance in excess of debt carrying amount |
21,375 | |||
| Financing costs and professional fees paid with exit financing |
17,306 | |||
|
|
|
|||
| Reorganized Successor Company long-term debt |
$ | 165,924 | ||
|
|
|
|||
| (6) | Liabilities subject to compromise generally refer to pre-petition obligations, secured or unsecured, that may be impaired by a plan of reorganization. FASB ASC 852 requires such liabilities, including those that became known after filing the Chapter 11 petitions, be reported at the amounts expected to be allowed, even if they may be settled for lesser amounts. These liabilities represented the estimated amount expected to be resolved on known or potential claims through the Chapter 11 process. Liabilities subject to compromise also includes items that may be assumed under the Reorganization Plan, and may be subsequently reclassified to liabilities not subject to compromise. Liabilities subject to compromise also include certain pre-petition liabilities including accrued interest and accounts payable. At April 27, 2013, liabilities subject to compromise were $228,302, of which administrative claim payments of $4,314 were made in the Predecessor period of the current year. The table below identifies the principal categories of liabilities subject to compromise at June 11, 2013: |
| June 11, 2013 | ||||
| Accounts payable |
$ | 47,683 | ||
| 2011 Debentures |
163,688 | |||
| Pre-petition accrued interest on 2011 Debentures |
979 | |||
| Sale-leaseback obligations |
11,638 | |||
|
|
|
|||
| Liabilities subject to compromise |
$ | 223,988 | ||
|
|
|
|||
70
SCHOOL SPECIALTY, INC.
NOTES TO CONSOLIDATED FINANCIAL STATEMENTS—(Continued)
FOR FISCAL 2015, THE FORTY-SIX WEEKS ENDED APRIL 26, 2014,
SIX WEEKS ENDED JUNE 11, 2013 AND FISCAL 2013
(In Thousands, Except Per Share Amounts)
| (7) | The Company recorded elimination of (1) the Predecessor Company’s common stock, (2) the Predecessor Company’s capital in excess of par value, net of stock options cancellation of $3,624, (3) the Predecessor Company’s treasury stock, and (4) the Predecessor Company’s accumulated deficit and accumulated other comprehensive loss. The following table represents reorganization value to be allocated to assets reconciled to the Successor Company Equity. The Company recorded Successor Company common stock of $1 and capital in excess of par value of $120,955. |
| June 11, 2013 | ||||
| Total reorganization value to be allocated to assets |
$ | 415,410 | ||
| Less: Debt |
(179,044 | ) | ||
| Less: Other liabilities |
(115,410 | ) | ||
|
|
|
|||
| Successor Company Equity |
$ | 120,956 | ||
|
|
|
|||
| (8) | The following table represents the adjustments for fresh start accounting primarily related to recording goodwill, recording our intangible assets, fixed assets, and other assets and liabilities at fair value and related deferred income taxes in accordance with ASC 805. Additionally, such fresh start accounting adjustments reflect the increase in inventory reserve of $6,600, and elimination of certain capitalized costs of $1,426. The Company also recorded other fresh start accounting adjustments relating to (1) deferred rent included in current liabilities, (2) vendor rebates receivables in current assets, and (3) other current assets and liabilities as a result of fresh start accounting. In addition, the impact of fresh start accounting adjustments on the accumulated retained earnings was eliminated. |
| June 11, 2013 | ||||
| Fresh start accounting adjustments: |
||||
| Goodwill |
$ | 21,588 | ||
| Fair value adjustment to intangible assets |
(56,795 | ) | ||
| Fair value adjustment to fixed assets |
15,522 | |||
| Fresh start accounting adjustments relating to inventory |
(8,147 | ) | ||
| Other fresh start accounting adjustments |
(2,434 | ) | ||
|
|
|
|||
| Total fresh start accounting adjustments |
$ | (30,266 | ) | |
|
|
|
|||
| (9) | The following table represents a reconciliation of the enterprise value attributed to assets, determination of the total reorganization value to be allocated to these assets and the determination of goodwill: |
| June 11, 2013 | ||||
| Enterprise value attributed to School Specialty |
$ | 300,000 | ||
| Plus: other liabilities (excluding debt) |
115,410 | |||
|
|
|
|||
| Total reorganization value to be allocated to assets |
415,410 | |||
| Less: fair value assigned to tangible and intangible assets |
(393,822 | ) | ||
|
|
|
|||
| Value of School Specialty assets in excess of fair value (Goodwill) |
$ | 21,588 | ||
|
|
|
|||
In fiscal 2015, the Company revised its fresh-start estimate for the amount of deferred cash payment obligations (see Note 10—Debt). The change in estimate is related to an increased number of unsecured trade
71
SCHOOL SPECIALTY, INC.
NOTES TO CONSOLIDATED FINANCIAL STATEMENTS—(Continued)
FOR FISCAL 2015, THE FORTY-SIX WEEKS ENDED APRIL 26, 2014,
SIX WEEKS ENDED JUNE 11, 2013 AND FISCAL 2013
(In Thousands, Except Per Share Amounts)
creditors which elected to provide the Company customary trade terms which entitled those creditors to a 45% recovery of their unsecured claim rather than a 20% recovery. This change in estimate resulted in a decrease of $2,992 to the Successor Company’s equity and a corresponding increase in long-term debt.
NOTE 5—REORGANIZATION ITEMS, NET
Reorganization items directly associated with the process of reorganizing the business under Chapter 11 of the Bankruptcy Code have been recorded on a separate line item on the condensed consolidated statements of operations. The following table displays the details of reorganization items for fiscal 2015, the forty-six weeks ended April 26, 2014, and the six weeks ended June 11, 2013:
| Successor Company |
Predecessor Company |
|||||||||||
| Fiscal 2015 | Forty-Six Weeks Ended April 26, 2014 |
Six Weeks Ended June 11, 2013 |
||||||||||
| Liabilities subject to compromise |
$ | — | $ | — | $ | 223,988 | ||||||
| Issuance of capital in excess of par value |
— | — | (42,335 | ) | ||||||||
| Reclassified into other balance sheet liability accounts |
— | 458 | (19,710 | ) | ||||||||
|
|
|
|
|
|
|
|||||||
| Settlement of liabilities subject to compromise |
$ | — | $ | 458 | $ | 161,943 | ||||||
| Fresh start accounting adjustments: |
||||||||||||
| Goodwill |
$ | — | $ | — | $ | 21,588 | ||||||
| Fair value adjustment to intangible assets |
— | — | (56,795 | ) | ||||||||
| Fair value adjustment to fixed assets |
— | — | 15,522 | |||||||||
| Fresh start accounting adjustments relating to inventory |
— | — | (8,147 | ) | ||||||||
| Other fresh start accounting adjustments |
— | — | (2,434 | ) | ||||||||
|
|
|
|
|
|
|
|||||||
| Total fresh start accounting adjustments |
$ | — | $ | — | $ | (30,266 | ) | |||||
| Other reorganization adjustments: |
||||||||||||
| Asset write-downs due to contract rejections |
$ | — | $ | — | $ | (7,011 | ) | |||||
| Professional fees |
(271 | ) | (6,878 | ) | (10,512 | ) | ||||||
| Cancellation of equity-based awards |
— | — | (3,624 | ) | ||||||||
| Financing fees |
— | — | (2,853 | ) | ||||||||
| Issuance of equity in excess of debt carrying amount |
— | — | (21,375 | ) | ||||||||
| Other |
— | — | (1,503 | ) | ||||||||
|
|
|
|
|
|
|
|||||||
| Total other reorganization adjustments |
$ | (271 | ) | $ | (6,878 | ) | $ | (46,878 | ) | |||
|
|
|
|
|
|
|
|||||||
| Total Reorganization items, net |
$ | (271 | ) | $ | (6,420 | ) | $ | 84,799 | ||||
|
|
|
|
|
|
|
|||||||
The 2011 Debentures and related accrued interest within the liabilities subject to compromise at June 11, 2013 were settled by the issuance of new common stock representing 35% ownership in the Successor Company, with an estimated fair value of $42,335. The portion of accounts payable within the liabilities subject to compromise that will be paid in accordance with the Reorganization Plan were classified between long-term and short-term liabilities. Administrative claims totaling $8,335 were classified as short-term with any remaining settlements under the Reorganization Plan classified as Deferred Cash Payments in long-term debt (see Note 10 of the Notes to Consolidated Financial Statements—Debt). Since the value of Common Stock issued and the
72
SCHOOL SPECIALTY, INC.
NOTES TO CONSOLIDATED FINANCIAL STATEMENTS—(Continued)
FOR FISCAL 2015, THE FORTY-SIX WEEKS ENDED APRIL 26, 2014,
SIX WEEKS ENDED JUNE 11, 2013 AND FISCAL 2013
(In Thousands, Except Per Share Amounts)
amounts to be paid in cash at a later date were less than the liabilities subject to compromise, the Predecessor Company recorded a gain on reorganization of $161,943 for the six weeks ended June 11, 2013.
Fresh start accounting adjustments resulted in a net asset write down of $30,266 which has partially offset the gain related to the settlement of liabilities subject to compromise. The fresh start accounting adjustments are related to the preliminary valuation done in accordance with the adoption of the fresh start accounting. See Note 4—Fresh Start Accounting for information on these fresh start valuation adjustments.
A portion of the gain related to the settlement of liabilities subject to compromise is further offset by $46,878 of other reorganizational adjustments. Equity issued to the Ad Hoc DIP lenders in excess of the debt carrying amount was $21,375. Professional fees and financing fees associated with the Predecessor Company’s debtor-in-possession financings were $13,365. The cancellation of equity awards outstanding as of the Effective Date triggered $3,624 of unrecognized share-based compensation expense. In addition, the rejection of certain leases pursuant to the Reorganization Plan resulted in an additional $7,011 of expense.
NOTE 6—INVESTMENT IN UNCONSOLIDATED AFFILIATE
Investment in unconsolidated affiliate was accounted for under the equity method through the end of the third quarter in fiscal 2013. Effective with the commencement of the Company’s Chapter 11 Cases, the Company no longer maintained a seat on the unconsolidated affiliate’s board of directors. As a result, the Company no longer had significant influence over the unconsolidated affiliate and began to account for the investment in the unconsolidated affiliate under the cost method effective at the beginning of the fourth quarter of fiscal 2013.
The investment in unconsolidated affiliate consisted of the following:
| Percent- Owned |
April 25, 2015 | April 26, 2014 | ||||||||||
| Carson-Dellosa Publishing, LLC |
35 | % | $ | 715 | $ | 715 | ||||||
On November 13, 2009, the Company completed the divestiture of the School Specialty Publishing business unit to Carson-Dellosa Publishing, LLC (“Carson-Dellosa”), a newly-formed business entity. Under the divestiture agreement, the Company combined its publishing unit net assets with those of Cookie Jar Education, Inc. and received a 35% interest, accounted for under the equity method, in Carson-Dellosa. For the year ended April 27, 2013, the Company recorded a pre-tax loss of $1,436, respectively, resulting from its 35% minority equity interest in Carson-Dellosa.
During the fourth quarter of fiscal 2013, the Company evaluated its investment in Carson-Dellosa for impairment and, based on updated current forward-looking projections, concluded the Carson-Dellosa investment had an other-than-temporary impairment. As such, the Company recorded an impairment of $7,749 in fiscal 2013 in other expense in the Company’s Consolidated Statements of Operations. The resulting fair value of $715 in fiscal 2013 was estimated using a discounted cash flow model and is considered a Level 3 fair value measurement due to the use of significant unobservable inputs related to the timing and amount of future earnings based on projections of Carson-Dellosa’s future financing structure, contractual and market-based revenues and operating costs.
In performing the impairment assessment, the Company estimated the fair value of Carson-Dellosa using the Income Approach (discounted cash flow analysis). The discounted cash flow (“DCF”) valuation method
73
SCHOOL SPECIALTY, INC.
NOTES TO CONSOLIDATED FINANCIAL STATEMENTS—(Continued)
FOR FISCAL 2015, THE FORTY-SIX WEEKS ENDED APRIL 26, 2014,
SIX WEEKS ENDED JUNE 11, 2013 AND FISCAL 2013
(In Thousands, Except Per Share Amounts)
requires an estimation of future cash flows of an entity and then discounting those cash flows to their present value using an appropriate discount rate. The discount rate selected should reflect the risks inherent in the projected cash flows. The key inputs and assumptions of the DCF method are the projected cash flows, the terminal value of the reporting unit and the discount rate. The growth rate used for the terminal value calculation was 0% and the discount rate was 11.3%. There were no impairment events in fiscal 2014 or fiscal 2015 that warranted further testing.
The investment amount represents the Company’s maximum exposure to loss as a result of the Company’s ownership interest. Losses are reflected in “Losses of unconsolidated affiliate.”
NOTE 7—GOODWILL AND OTHER INTANGIBLE ASSETS
The following table presents details of the Company’s intangible assets, including the estimated useful lives, excluding goodwill:
| April 25, 2015 |
Gross Value | Accumulated Amortization |
Net Book Value |
|||||||||
| Amortizable intangible assets: |
||||||||||||
| Customer relationships (13 years) |
$ | 11,300 | $ | (1,666 | ) | $ | 9,634 | |||||
| Publishing rights (20 years) |
4,000 | (383 | ) | 3,617 | ||||||||
| Trademarks (20 years) |
22,700 | (2,175 | ) | 20,525 | ||||||||
| Developed technology (7 years) |
6,600 | (1,808 | ) | 4,792 | ||||||||
| Content (5 years) |
4,400 | (4,400 | ) | — | ||||||||
| Perpetual license agreements (5 years) |
1,200 | (460 | ) | 740 | ||||||||
| Favorable leasehold interests (10 years) |
2,160 | (414 | ) | 1,746 | ||||||||
|
|
|
|
|
|
|
|||||||
| Total intangible assets |
$ | 52,360 | $ | (11,306 | ) | $ | 41,055 | |||||
|
|
|
|
|
|
|
|||||||
| April 26, 2014 |
Gross Value | Accumulated Amortization |
Net Book Value |
|||||||||
| Amortizable intangible assets: |
||||||||||||
| Customer relationships (13 years) |
$ | 11,300 | $ | (797 | ) | $ | 10,503 | |||||
| Publishing rights (20 years) |
4,000 | (183 | ) | 3,817 | ||||||||
| Trademarks (20 years) |
22,700 | (1,040 | ) | 21,660 | ||||||||
| Developed technology (7 years) |
6,600 | (864 | ) | 5,736 | ||||||||
| Content (5 years) |
4,400 | (807 | ) | 3,593 | ||||||||
| Perpetual license agreements (5 years) |
1,200 | (220 | ) | 980 | ||||||||
| Favorable leasehold interests (10 years) |
2,160 | (198 | ) | 1,962 | ||||||||
|
|
|
|
|
|
|
|||||||
| Total intangible assets |
$ | 52,360 | $ | (4,109 | ) | $ | 48,251 | |||||
|
|
|
|
|
|
|
|||||||
Intangible asset amortization expense included in selling, general and administrative expenses for fiscal 2015, the forty-six weeks ended April 26, 2014, six weeks ended June 11, 2013, and fiscal 2013 was $4,483, $4,109, $1,138, and $10,054, respectively. In fiscal 2015, the Company recorded an impairment of $2,713 related to the Content intangible asset, which reduced the net book value of the intangible asset to zero as of April 25, 2015. This impairment was related to the Company’s strategy to reduce future investments in digital content and digital delivery for its Agenda product category.
74
SCHOOL SPECIALTY, INC.
NOTES TO CONSOLIDATED FINANCIAL STATEMENTS—(Continued)
FOR FISCAL 2015, THE FORTY-SIX WEEKS ENDED APRIL 26, 2014,
SIX WEEKS ENDED JUNE 11, 2013 AND FISCAL 2013
(In Thousands, Except Per Share Amounts)
Estimated intangible asset amortization expense for each of the five succeeding fiscal years is:
| 2016 |
$ | 3,603 | ||
| 2017 |
$ | 3,603 | ||
| 2018 |
$ | 3,603 | ||
| 2019 |
$ | 3,383 | ||
| 2020 |
$ | 3,363 |
This estimated intangible amortization expense over the succeeding five years is based on the reorganization fair value of the Company’s intangible assets.
The following information presents changes to goodwill during the two-year period ended April 25, 2015:
| Reporting Unit | Distribution Segment |
Reporting Units | Curriculum Segment |
|||||||||||||||||||||
| Successor Company |
Distribution | Science | Reading | Total | ||||||||||||||||||||
| Fresh Start Valuation: |
||||||||||||||||||||||||
| Goodwill |
$ | 14,666 | $ | 14,666 | $ | 4,580 | $ | 2,342 | $ | 6,922 | $ | 21,588 | ||||||||||||
|
|
|
|
|
|
|
|
|
|
|
|
|
|||||||||||||
| Balance at April 26, 2014 |
$ | 14,666 | $ | 14,666 | $ | 4,580 | $ | 2,342 | $ | 6,922 | $ | 21,588 | ||||||||||||
|
|
|
|
|
|
|
|
|
|
|
|
|
|||||||||||||
| Balance at April 25, 2015 |
$ | 14,666 | $ | 14,666 | $ | 4,580 | $ | 2,342 | $ | 6,922 | $ | 21,588 | ||||||||||||
|
|
|
|
|
|
|
|
|
|
|
|
|
|||||||||||||
In accordance with the accounting guidance on goodwill and other intangible assets, the Company performs its impairment test of goodwill at the reporting unit level and indefinite-lived intangible assets at the unit of account level annually each fiscal year, or more frequently if events or circumstances change that would more likely than not reduce the fair value of its reporting units below their carrying values. The Company performs its annual impairment test in the fourth quarter of the fiscal year and will occur at the beginning of the Company’s last fiscal month of each fiscal year. The Company believes performing the test in the fourth quarter is preferable as the test is predicated on projected cash flow assumptions developed and finalized in the fourth quarter of each fiscal year.
A reporting unit is the level at which goodwill impairment is tested and can be an operating segment or one level below an operating segment, also known as a component. A component of an operating segment is a reporting unit if the component constitutes a business for which discrete financial information is available for segment management to regularly review the operating results of that component. As the Company has reorganized and modified its internal reporting structure, it has determined that the Distribution segment consists of one reporting unit. The Curriculum segment of the Successor Company consists of the Science and Reading reporting units.
Goodwill impairment is assessed under a two-step method. In the first step, the Company determines the fair value of the reporting unit, generally by utilizing a combination of the income approach (weighted 90%) and the market approach (weighted 10%) derived from comparable public companies. The Company believes that each approach has its merits. However, in the instances where the Company has utilized both approaches, the Company has weighted the income approach more heavily than the market approach because the Company
75
SCHOOL SPECIALTY, INC.
NOTES TO CONSOLIDATED FINANCIAL STATEMENTS—(Continued)
FOR FISCAL 2015, THE FORTY-SIX WEEKS ENDED APRIL 26, 2014,
SIX WEEKS ENDED JUNE 11, 2013 AND FISCAL 2013
(In Thousands, Except Per Share Amounts)
believes that management’s assumptions generally provide greater insight into the reporting unit’s fair value. This fair value determination was categorized as level 3 in the fair value hierarchy pursuant to FASB ASC Topic 820, “Fair Value Measurement”. The estimated fair value of the reporting units is dependent on several significant assumptions, including earnings projections and discount rates.
If a reporting unit’s fair value, as determined in the first step of the goodwill assessment, is less than the unit’s carrying value, the second step of the assessment methodology is completed. In step two, the Company allocates the fair value of the reporting units to all of the assets and liabilities of the reporting units, including any unrecognized intangible assets, in a hypothetical calculation to determine the implied fair value of the goodwill. The impairment charge, if any, is measured as the difference between the implied fair value of goodwill and its carrying value. This allocation requires management’s estimated and judgments as to the expectations of future cash flows and the allocation of those cash flows to identifiable intangible assets.
Assumptions utilized in the impairment analysis are subject to significant management judgment. Changes in estimates or the application of alternative assumptions could have produced significantly different results
In performing the impairment assessments for fiscal 2015, 2014, and 2013, the Company estimated the fair value of its reporting units using the following valuation methods and assumptions:
| 1. | Income Approach (discounted cash flow analysis)—the discounted cash flow (“DCF”) valuation method requires an estimation of future cash flows of a reporting unit and then discounting those cash flows to their present value using an appropriate discount rate. The discount rate selected should reflect the risks inherent in the projected cash flows. The key inputs and assumptions of the DCF method are the projected cash flows, the terminal value of the reporting units and the discount rate. The growth rates used for the terminal value calculations and the discount rates of the respective reporting units for the Successor and Predecessor companies were as follows: |
| Fiscal 2015 | Fiscal 2014 | |||||||||||||||
| Terminal Value Growth Rates |
Discount Rate |
Terminal Value Growth Rates |
Discount Rate |
|||||||||||||
| Distribution |
1.7 | % | 12.9 | % | 0 | % | 12.2 | % | ||||||||
| Reading |
1.0 | % | 11.2 | % | 1.0 | % | 15.3 | % | ||||||||
| Science |
1.7 | % | 10.4 | % | 1.0 | % | 12.8 | % | ||||||||
| Fiscal 2013 | ||||||||||||||||
| Terminal Value Growth Rates |
Discount Rate |
|||||||||||||||
| Education Resources |
2.0 | % | 14.5 | % | ||||||||||||
| Califone |
2.0 | % | 14.5 | % | ||||||||||||
| Science |
1.5 | % | 11.5 | % | ||||||||||||
| Planning and Student Development |
2.0 | % | 11.5 | % | ||||||||||||
| Reading |
2.0 | % | 11.5 | % | ||||||||||||
| Health |
2.0 | % | 11.5 | % | ||||||||||||
| 2. | Market Approach (market multiples)—this method begins with the identification of a group of peer companies in the same or similar industries as the company reporting unit being valued. A valuation average multiple is then computed for the peer group based upon a valuation metric. The Company selected a ratio |
76
SCHOOL SPECIALTY, INC.
NOTES TO CONSOLIDATED FINANCIAL STATEMENTS—(Continued)
FOR FISCAL 2015, THE FORTY-SIX WEEKS ENDED APRIL 26, 2014,
SIX WEEKS ENDED JUNE 11, 2013 AND FISCAL 2013
(In Thousands, Except Per Share Amounts)
| of enterprise value to projected earnings before interest, taxes, depreciation and amortization (“EBITDA”) and, for certain reporting units in fiscal 2013, a ratio of enterprise value to projected revenue as appropriate valuation metrics. Various operating performance measurements of the reporting unit being valued are then benchmarked against the peer group and a discount rate or premium is applied to reflect favorable or unfavorable comparisons. The resulting multiple is then applied to the reporting unit being valued to arrive at an estimate of its fair value. A control premium is then applied to the equity value. In fiscal 2015 and 2014, eleven companies were deemed relevant to the Reading reporting unit and ten companies were deemed relevant for the Distribution reporting unit. In fiscal 2015, ten companies were deemed relevant for the Science reporting unit. In fiscal 2013, eleven and eight companies, respectively, were deemed relevant to the Planning and Student Development, Health, and Reading reporting units and ten and nine companies, respectively, were deemed relevant to the Education Resources and Califone reporting units under the guideline public company method to provide an indication of value. A control premium was then applied to the enterprise value of the reporting unit. The control premium was established based on a review of transactions over a 36 month period. The resulting multiples and control premiums were as follows: |
| Fiscal 2015 | Fiscal 2014 | |||||||||||||||
| EBITDA Multiples |
Control Premium |
EBITDA Multiples |
Control Premium |
|||||||||||||
| Distribution |
6.2x | 10.3 | % | 6.2x | 10.3 | % | ||||||||||
| Reading |
7.7x | 11.7 | % | 7.7x | 11.7 | % | ||||||||||
| Science |
6.2x | 11.7 | % | N/A | N/A | |||||||||||
| Fiscal 2013 | ||||||||||||
| EBITDA Multiples |
Revenue Multiples |
Control Premium |
||||||||||
| Education Resources |
6.2x | N/A | 10.3 | % | ||||||||
| Califone |
6.2x | N/A | 10.3 | % | ||||||||
| Reading |
7.7x | 1.1x | 11.7 | % | ||||||||
| Health |
7.7x | 1.1x | 11.7 | % | ||||||||
| Planning and Student Development |
7.7x | 1.1x | 11.7 | % | ||||||||
In completing the fiscal 2015 assessment, the Science and Reading reporting units each had fair value in excess of carrying value of greater than 10%. The fair value of the Distribution reporting unit was in excess of its carrying value by 3%. In order to conclude upon the assumptions for the discounted cash flow analysis, the Company considered multiple factors, including (a) macroeconomic conditions, (b) industry and market factors such as school funding trends and school construction forecasts, (c) overall financial performance such as planned revenue, profitability and cash flows and (d) the expected impact of revenue enhancing and cost saving initiatives. A reduction in the revenue growth rate or profitability assumptions of 100 basis points would result in a failure in the first step of the goodwill assessment for both the Distribution and Science reporting units. In addition, the discount rate assumptions can have a material impact on the fair value determinations. An increase in the discount rate of 100 basis points for the Distribution reporting unit would result in a failure in the first step of the goodwill assessment.
In connection with the preparation of the financial statements for the third quarter of fiscal 2013, the Company concluded a triggering event had occurred which would more likely than not reduce the fair value of the reporting units below their carrying value. The triggering event was a combination of the declines in the Company’s forecasted future years’ operating results and cash flows, and the liquidity concerns and eventual default under pre-bankruptcy credit agreements. Due to persistent weakness in the industry and the Company’s
77
SCHOOL SPECIALTY, INC.
NOTES TO CONSOLIDATED FINANCIAL STATEMENTS—(Continued)
FOR FISCAL 2015, THE FORTY-SIX WEEKS ENDED APRIL 26, 2014,
SIX WEEKS ENDED JUNE 11, 2013 AND FISCAL 2013
(In Thousands, Except Per Share Amounts)
revenue, as well as the anticipated near-term operational challenges resulting from the Chapter 11 Cases, projected cash flows and terminal value growth rates were reduced in the fiscal 2013 third quarter discounted cash flow analysis, with corresponding adjustments of discount rates to reflect risks inherent in those updated projected cash flows. As a result of the Company’s performance of the goodwill and indefinite-lived intangible asset impairment test as detailed below, the Company recorded an impairment charge of $41,089 for goodwill and $4,700 for indefinite-lived intangible assets. In performing this impairment assessment, the Company estimated the fair value of its reporting units using the valuation methods and assumptions described above.
Based upon the assessment performed in the third quarter of fiscal 2013, the Califone, Planning and Student Development and Reading reporting units failed step one of the goodwill impairment test, requiring a step two analysis with respect to those reporting units. As a result of the fiscal 2013 step two analysis, $41,089 of goodwill was considered impaired during the third quarter of fiscal 2013. As shown above in the table, the Califone reporting unit, which was part of the former Distribution segment, and the Reading and Planning and Student Development reporting units, which were part of the former Curriculum segment, were determined to have impairments of their goodwill balance as of January 26, 2013.
Due to the fiscal 2013 triggering events described above, the Company also performed an impairment test of its indefinite-lived intangible assets during the third quarter of fiscal 2013. The Company utilized an income approach, whereby the assets are valued by reference to the amount of royalty income generated if the assets were licensed to a third party. In this method, a sample of comparable guideline royalty or license agreements was analyzed. The Company recorded a $4,700 impairment charge related to non-amortizable tradenames in the former Curriculum segment. No impairments of indefinited-lived intangibles were recorded in fiscal 2014. Thus Successor Company does not have any indefinite-lived intangible assets.
Due to the triggering events identified above in the discussion of Goodwill and Non-Amortizable Intangible Assets, the Company also performed an impairment test of its long-lived assets in the third quarter of fiscal 2013. The Company compared the sum of the undiscounted cash flows during the remaining useful life of the primary asset for each identified asset group to the carrying value of the asset group. No impairment was recorded as a result of this analysis.
NOTE 8—PROPERTY, PLANT AND EQUIPMENT
Property, plant and equipment consist of the following:
| Successor | ||||||||
| April 25, 2015 |
April 26, 2014 |
|||||||
| Projects in progress |
$ | 5,585 | $ | 10,854 | ||||
| Buildings and leasehold improvements |
3,302 | 3,595 | ||||||
| Furniture, fixtures and other |
36,464 | 30,525 | ||||||
| Machinery and warehouse equipment |
11,394 | 6,770 | ||||||
|
|
|
|
|
|||||
| Total property, plant and equipment |
56,745 | 51,744 | ||||||
| Less: Accumulated depreciation |
(24,721 | ) | (12,699 | ) | ||||
|
|
|
|
|
|||||
| Net property, plant and equipment |
$ | 32,024 | $ | 39,045 | ||||
|
|
|
|
|
|||||
78
SCHOOL SPECIALTY, INC.
NOTES TO CONSOLIDATED FINANCIAL STATEMENTS—(Continued)
FOR FISCAL 2015, THE FORTY-SIX WEEKS ENDED APRIL 26, 2014,
SIX WEEKS ENDED JUNE 11, 2013 AND FISCAL 2013
(In Thousands, Except Per Share Amounts)
Depreciation expense for fiscal 2015, the forty-six weeks ended April 26, 2014, six weeks ended June 11, 2013, and fiscal 2013 was $14,750, $14,767, $1,845, and $23,166, respectively.
NOTE 9—ASSET HELD FOR SALE
In fiscal 2014, a company-wide process improvement program was launched to better align the Company’s operating groups, enhance systems and processes and drive efficiency throughout the organization to improve the customer experience. As part of this program, the Salina, Kansas facility was closed in the third quarter of fiscal 2014. The Salina distribution center ceased processing customer shipments in the second quarter of fiscal 2014. The facility was classified as held for sale on the April 26, 2014 consolidated balance sheet. In the fourth quarter of fiscal 2015 the asset was sold for $1,598. Accordingly, the Company recorded a loss on the sale of $602. This loss recorded as “Facility exit costs and restructuring” on the consolidated statement of operations. The proceeds realized from the sale were used to reduce the New ABL balance.
NOTE 10—DEBT
Long-Term Debt
Long-term debt as of April 25, 2015 and April 26, 2014 consisted of the following:
| Successor | ||||||||
| April 25, 2015 |
April 26, 2014 |
|||||||
| New ABL Facility, maturing in 2018 |
$ | 24,200 | $ | 10,600 | ||||
| New Term Loan, maturing in 2019 |
142,462 | 143,913 | ||||||
| New Term Loan Original Issue Discount |
(2,153 | ) | (2,473 | ) | ||||
| Deferred Cash Payment Obligations, maturing in 2019 |
17,684 | 14,335 | ||||||
|
|
|
|
|
|||||
| Total debt |
182,193 | 166,375 | ||||||
| Less: Current maturities |
(25,644 | ) | (12,388 | ) | ||||
|
|
|
|
|
|||||
| Total long-term debt |
$ | 156,549 | $ | 153,987 | ||||
|
|
|
|
|
|||||
Successor Company Debt
ABL Facility
On June 11, 2013, the Company entered into a Loan Agreement (the “Asset-Based Credit Agreement”) by and among the Company, Bank of America, N.A, as Agent, SunTrust Bank, as Syndication Agent, Merrill Lynch, Pierce, Fenner & Smith Incorporated and SunTrust Robinson Humphrey, Inc., as Joint Lead Arrangers and Bookrunners, and the Lenders that are party to the Asset-Based Credit Agreement (the “Asset-Based Lenders”). In the third quarter of fiscal 2015, the Company amended the Asset-Based Credit Agreement facility. The main purpose for the amendment was to provide the Company additional flexibility in its execution of certain restructuring actions by increasing the dollar amount of earnings before interest, taxes, depreciation and amortization (“EBITDA”) covenant add backs for non-recurring, unusual or extraordinary charges, business optimization expenses or other restructuring charges or reserves and cash expenses relating to earn outs or similar obligations.
79
SCHOOL SPECIALTY, INC.
NOTES TO CONSOLIDATED FINANCIAL STATEMENTS—(Continued)
FOR FISCAL 2015, THE FORTY-SIX WEEKS ENDED APRIL 26, 2014,
SIX WEEKS ENDED JUNE 11, 2013 AND FISCAL 2013
(In Thousands, Except Per Share Amounts)
Under the Asset-Based Credit Agreement, the Asset-Based Lenders agreed to provide a revolving senior secured asset-based credit facility (the “New ABL Facility”) in an aggregate principal amount of $175,000. Outstanding amounts under the New ABL Facility will bear interest at a rate per annum equal to, at the Company’s election: (1) a base rate (equal to the greatest of (a) the prime lending rate, (b) the federal funds rate plus 0.50%, and (c) the 30-day LIBOR rate plus 1.00% per annum) (the “Base Rate”) plus an applicable margin (equal to a specified margin based on the interest rate elected by the Company, the fixed charge coverage ratio under the New ABL Facility and the applicable point in the life of the New ABL Facility) (the “Applicable Margin”), or (2) a LIBOR rate plus the Applicable Margin (the “LIBOR Rate”). Interest on loans under the New ABL Facility bearing interest based upon the Base Rate will be due monthly in arrears, and interest on loans bearing interest based upon the LIBOR Rate will be due on the last day of each relevant interest period or, if sooner, on the respective dates that fall every three months after the beginning of such interest period.
The effective interest rate under the New ABL Facility for fiscal 2015 was 8.49%, which includes amortization of loan origination fees of $1,105 and commitment fees on unborrowed funds of $707.
The New ABL Facility will mature on June 11, 2018. The Company may prepay advances under the New ABL Facility in whole or in part at any time without penalty or premium. The Company will be required to make specified prepayments upon the occurrence of certain events, including: (1) the amount outstanding on the New ABL Facility exceeding the Borrowing Base (as determined in accordance with the terms of the New ABL Facility), and (2) the Company’s receipt of net cash proceeds of any sale or disposition of assets that are first priority collateral for the New ABL Facility.
Pursuant to a Guaranty and Collateral Agreement dated as of June 11, 2013 (the “New ABL Security Agreement”), the New ABL Facility is secured by a first priority security interest in substantially all assets of the Company and the guarantor subsidiaries. Under an intercreditor agreement between the Asset-Based Lenders and the Term Loan Lenders, as defined and described below, the Asset-Based Lenders have a first priority security interest in substantially all working capital assets of the Company and the guarantor subsidiaries, and a second priority security interest in all other assets, subordinate only to the first priority security interest of the New Term Loan Lenders in such other assets.
The Asset-Based Credit Agreement contains customary events of default and financial, affirmative and negative covenants, including but not limited to a springing financial covenant relating to the Company’s fixed charge coverage ratio and restrictions on indebtedness, liens, investments, asset dispositions and dividends and other restricted payments.
Outstanding borrowings on the New ABL Facility were $24.2 million as April 25, 2015, while the excess availability on that date for the New ABL Facility was $51.6 million.
Term Loan
Also on June 11, 2013, the Company entered into a Credit Agreement (the “New Term Loan Credit Agreement”) among the Company, Credit Suisse AG, as Administrative Agent and Collateral Agent, and the Lenders defined in the New Term Loan Credit Agreement (the “Term Loan Lenders”). In the third quarter of fiscal 2015, the Company amended the New Term Loan Credit Agreement. The main purpose for the amendment was to provide the Company additional flexibility in its execution of certain restructuring actions by increasing
80
SCHOOL SPECIALTY, INC.
NOTES TO CONSOLIDATED FINANCIAL STATEMENTS—(Continued)
FOR FISCAL 2015, THE FORTY-SIX WEEKS ENDED APRIL 26, 2014,
SIX WEEKS ENDED JUNE 11, 2013 AND FISCAL 2013
(In Thousands, Except Per Share Amounts)
the dollar amount of EBITDA covenant add backs for non-recurring, unusual or extraordinary charges, business optimization expenses or other restructuring charges or reserves and cash expenses relating to earn outs or similar obligations.
Under the New Term Loan Credit Agreement, the Term Loan Lenders agreed to make a term loan (the “New Term Loan”) to the Company in aggregate principal amount of $145,000, including an original issue discount of $2,900. The outstanding principal amount of the New Term Loan will bear interest at a rate per annum equal to the applicable LIBOR rate (with a 1% floor) plus 8.50%, or the base rate plus a margin of 7.50%. Interest on loans under the New Term Loan Credit Agreement bearing interest based upon the base rate will be due quarterly in arrears, and interest on loans bearing interest based upon the LIBOR Rate will be due on the last day of each relevant interest period or, if sooner, on the respective dates that fall every three months after the beginning of such interest period.
The effective interest rate under the term loan credit facility for fiscal 2015 was 10.3%, which includes amortization of loan origination fees of $841 and original issue discount amortization of $320. As of April 25, 2015, the outstanding balance on the New Term Loan Credit Agreement was $140,309, net of the unamortized original issue discount. Of this amount, $1,444 was reflected as currently maturing, long-term debt in the accompanying consolidated balance sheets.
The New Term Loan matures on June 11, 2019. The New Term Loan Credit Agreement requires prepayments at specified levels upon the Company’s receipt of net proceeds from certain events, including: (1) certain dispositions of property, divisions, business units or business lines; and (2) other issuances of debt other than Permitted Debt (as defined in the New Term Loan Credit Agreement). The New Term Loan Credit Agreement also requires prepayments at specified levels from the Company’s excess cash flow. The Company is also permitted to voluntarily prepay the New Term Loan in whole or in part. Any prepayments are to be made at par, plus an early payment fee calculated in accordance with the terms of the amended New Term Loan Credit Agreement if prepaid prior to October 31, 2016.
Pursuant to a Guarantee and Collateral Agreement dated as of June 11, 2013 (the “New Term Loan Security Agreement”), the Term Loan is secured by a first priority security interest in substantially all assets of the Company and the guarantor subsidiaries. Under an intercreditor agreement between the Asset-Based Lenders and the Term Loan Lenders, the Term Loan Lenders have a second priority security interest in substantially all working capital assets of the Company and the subsidiary guarantors, subordinate only to the first priority security interest of the Asset-Based Lenders in such assets, and a first priority security interest in all other assets.
The New Term Loan Credit Agreement contains customary events of default and financial, affirmative and negative covenants, including but not limited to quarterly financial covenants commencing on the fiscal quarter ended October 26, 2013, relating to the Company’s (1) minimum interest coverage ratio and (2) maximum net total leverage ratio and restrictions on indebtedness, liens, investments, asset dispositions and dividends and other restricted payments.
The New Term Loan required the Company to enter into an interest rate hedge, within 90 days of the Effective Date, in an amount equal to at least 50% of the aggregate principal amount outstanding under the New Term Loan. The purpose of the interest rate hedge is to effectively subject a portion of the New Term Loan to a fixed or maximum interest rate. As such, the Company entered into an interest rate swap agreement on August 27, 2013 that effectively fixes the interest payments on a portion of the Company’s variable-rate debt.
81
SCHOOL SPECIALTY, INC.
NOTES TO CONSOLIDATED FINANCIAL STATEMENTS—(Continued)
FOR FISCAL 2015, THE FORTY-SIX WEEKS ENDED APRIL 26, 2014,
SIX WEEKS ENDED JUNE 11, 2013 AND FISCAL 2013
(In Thousands, Except Per Share Amounts)
The swap, which has a termination date of September 11, 2016, effectively fixes the LIBOR-based interest rate on the debt in the amount of the notional amount of the swap at 9.985%. The notional amount of the swap at April 25, 2015 was $72,500. During fiscal 2015, the fair value of the derivative increased by $45 and a gain of that amount has been recognized for that period. During the forty-six weeks ended April 26, 2014 the fair value of the derivative decreased by $483 and a loss of the amount has been recognized for that period. The gain or loss is recorded in “Change in fair value of interest rate swap” on the consolidated statement of operations.
Under this swap agreement, the Company will pay the counterparty interest on the notional amount at a fixed rate per annum of 1.485% and the counterparty will pay the Company interest on the notional amount at a variable rate per annum equal to the greater of 1-month LIBOR or 1.0%. The 1-month LIBOR rate applicable to this agreement was 0.180% at April 25, 2015. The notional amounts do not represent amounts exchanged by the parties, and thus are not a measure of exposure of the Company. The amounts exchanged are normally based on the notional amounts and other terms of the swaps. The variable rates are subject to change over time as 1-month LIBOR fluctuates.
The Company has estimated the fair value of its New Term Loan as of April 25, 2015 to approximate face value.
Deferred Cash Payment Obligations
In connection with the Reorganization Plan, general unsecured creditors are entitled to receive a deferred cash payment obligation of 20% of the allowed claim in full settlement of the allowed unsecured claims. Such payment accrues quarterly paid-in-kind interest of 5% per annum beginning on the Effective Date. Trade unsecured creditors had the ability to make a trade election to provide agreed upon customary trade terms. If the election was made, those unsecured trade creditors received a deferred cash payment obligation of 45% of the allowed claim in full settlement of those claims. As of the Effective Date, the deferred payment obligations under the trade elections began to accrue quarterly paid-in-kind interest of 10% per annum. All deferred cash payment obligations, along with interest paid-in-kind, are payable in December 2019.
The Company’s reconciliation of general unsecured claims was completed in fiscal 2015. As of April 25, 2015, the Company’s deferred payment obligations are $17,684, of which $3,045 represents a 20% recovery for the creditors and $12,070 represents a 45% recovery for the creditors with the remaining $2,569 related to accrued paid-in-kind interest.
Predecessor Company Debt
As discussed in Note 3—Bankruptcy Proceedings, all of the Predecessor Company debt was cancelled as of the Effective Date.
82
SCHOOL SPECIALTY, INC.
NOTES TO CONSOLIDATED FINANCIAL STATEMENTS—(Continued)
FOR FISCAL 2015, THE FORTY-SIX WEEKS ENDED APRIL 26, 2014,
SIX WEEKS ENDED JUNE 11, 2013 AND FISCAL 2013
(In Thousands, Except Per Share Amounts)
NOTE 11—INCOME TAXES
The provision for income taxes consists of:
| Successor Company | Predecessor Company | |||||||||||||||||
| Fiscal Year Ended April 25, 2015 |
Forty-Six Weeks Ended April 26, 2014 |
Six Weeks Ended June 11, 2013 |
Fiscal Year Ended April 27, 2013 |
|||||||||||||||
| Current income tax expense/(benefit): |
||||||||||||||||||
| Federal |
$ | — | $ | — | $ | — | $ | (6,518 | ) | |||||||||
| State |
252 | 258 | 132 | 548 | ||||||||||||||
| Foreign |
365 | — | 1,509 | 430 | ||||||||||||||
|
|
|
|
|
|
|
|
|
|||||||||||
| Total |
617 | 258 | 1,641 | (5,540 | ) | |||||||||||||
| Deferred income tax expense/(benefit): |
||||||||||||||||||
| Federal |
— | — | — | 5,205 | ||||||||||||||
| State |
— | — | — | (10 | ) | |||||||||||||
| Foreign |
— | — | — | 11 | ||||||||||||||
|
|
|
|
|
|
|
|
|
|||||||||||
| Total |
— | — | — | 5,206 | ||||||||||||||
|
|
|
|
|
|
|
|
|
|||||||||||
| Total provision for/(benefit from) income taxes |
$ | 617 | $ | 258 | $ | 1,641 | $ | (334 | ) | |||||||||
|
|
|
|
|
|
|
|
|
|||||||||||
Deferred taxes are comprised of the following:
| Successor Company | Predecessor Company |
|||||||||||||
| April 25, 2015 | April 26, 2014 | April 27, 2013 | ||||||||||||
| Current deferred tax assets (liabilities): |
||||||||||||||
| Inventory |
$ | 3,823 | $ | 5,211 | $ | 5,645 | ||||||||
| Allowance for doubtful accounts |
303 | 384 | 347 | |||||||||||
| Accrued liabilities |
(748 | ) | (1,235 | ) | (77 | ) | ||||||||
| Convertible debt instruments and debt isssuance cost |
(868 | ) | (859 | ) | 4,259 | |||||||||
| Net operating loss carryforward |
— | — | 300 | |||||||||||
| Early debt termination |
— | — | 9,624 | |||||||||||
| Valuation allowance |
(2,510 | ) | (3,501 | ) | (20,098 | ) | ||||||||
|
|
|
|
|
|
|
|||||||||
| Total current deferred tax assets |
— | — | — | |||||||||||
|
|
|
|
|
|
|
|||||||||
| Long-term deferred tax assets (liabilities): |
||||||||||||||
| Foreign tax and AMT credit carryforward |
11,075 | 11,075 | 11,586 | |||||||||||
| Net operating loss carryforward |
10,208 | — | 7,662 | |||||||||||
| Property and equipment |
(6,534 | ) | (11,033 | ) | (8,263 | ) | ||||||||
| Accrued liabilities |
635 | 1,233 | 12,380 | |||||||||||
| Intangible assets |
19,145 | 23,550 | 20,115 | |||||||||||
| Investment in noncontrolling interest |
5,879 | 4,331 | 7,745 | |||||||||||
| Development costs and other |
(1,211 | ) | (2,036 | ) | ||||||||||
| Convertible debt instruments |
— | — | — | |||||||||||
| Valuation allowance |
(39,195 | ) | (27,072 | ) | (51,174 | ) | ||||||||
|
|
|
|
|
|
|
|||||||||
| Total long-term deferred tax assets |
2 | 48 | 51 | |||||||||||
|
|
|
|
|
|
|
|||||||||
| Net deferred tax assets |
$ | 2 | $ | 48 | $ | 51 | ||||||||
|
|
|
|
|
|
|
|||||||||
83
SCHOOL SPECIALTY, INC.
NOTES TO CONSOLIDATED FINANCIAL STATEMENTS—(Continued)
FOR FISCAL 2015, THE FORTY-SIX WEEKS ENDED APRIL 26, 2014,
SIX WEEKS ENDED JUNE 11, 2013 AND FISCAL 2013
(In Thousands, Except Per Share Amounts)
Pursuant to the Reorganization Plan, on the Effective Date, the Company realized cancellation of indebtedness income. During the six weeks ended June 11, 2013, the Company excluded from taxable income $129,084 of cancellation of indebtedness income as defined under Internal Revenue Code (“IRC”) Section 108. IRC Section 108 excludes from taxable income the amount of indebtedness discharged under a Chapter 11 case. IRC Section 108 also requires a reduction of tax attributes equal to the amount of excluded taxable income. As a result, the Company reduced the available federal and state net operating loss carryforward and adjusted the tax reporting basis of tangible and intangible assets for the discharge of indebtedness income. In addition, to the adjustment to the tax reporting basis as described above, the fresh start accounting adjustments also created additional basis differences between income tax and financial reporting.
The Company has determined that an ownership change occurred in fiscal 2013 that is subject to IRC Section 382. Due to the limitations imposed under Section 382, certain federal and state deferred tax attributes may be significantly reduced over the next five years.
The Company previously had concluded that the realization of substantially all of its deferred tax assets did not meet the more likely than not threshold and recorded a tax valuation allowance. In fiscal 2015, the Company increased its tax valuation allowance to $41,705 from $30,573 at the end of fiscal 2014. This increase related primarily to the tax net operating loss. In fiscal 2014, the Company reduced its valuation allowance to $30,573 related to the reduction of tax attributes associated with the cancellation of indebtedness and other fresh start adjustments. As of April 25, 2015, the Company had an immaterial amount of unremitted earnings from foreign investments.
The Company’s effective income tax rate varied from the U.S. federal statutory tax rate as follows:
| Successor Company | Predecessor Company | |||||||||||||||||
| Fiscal Year Ended April 25, 2015 |
Forty-Six Weeks Ended April 26, 2014 |
Six Weeks Ended June 11, 2013 |
Fiscal Year Ended April 27, 2013 |
|||||||||||||||
| U.S. federal statutory rate |
35.0 | % | 35.0 | % | 35.0 | % | 35.0 | % | ||||||||||
| State income taxes, net of federal income tax benefit |
3.1 | % | -1.0 | % | 0.1 | % | -0.2 | % | ||||||||||
| Foreign income tax |
-1.1 | % | — | 0.7 | % | 0.1 | % | |||||||||||
| Deemed dividend, meals and entertainment and other |
0.0 | % | -1.4 | % | — | -0.5 | % | |||||||||||
| Goodwill and intangible asset impairment |
— | — | — | -6.2 | % | |||||||||||||
| Bankruptcy-related reorganization costs |
— | — | 3.7 | % | -3.6 | % | ||||||||||||
| Non-taxable fresh-start adjustments |
— | — | -8.1 | % | — | |||||||||||||
| Non-taxable debt cancellation income |
— | — | -58.1 | % | — | |||||||||||||
| Realized built in loss adjustment |
-8.2 | % | — | — | — | |||||||||||||
| Valuation allowance |
-30.7 | % | -34.1 | % | 28.8 | % | -24.4 | % | ||||||||||
|
|
|
|
|
|
|
|
|
|||||||||||
| Effective income tax rate |
-1.9 | % | -1.5 | % | 2.1 | % | 0.2 | % | ||||||||||
|
|
|
|
|
|
|
|
|
|||||||||||
The Company files income tax returns with the U.S., various U.S. states, and foreign jurisdictions. The most significant tax return the Company files is with the U.S. The Company’s tax returns are no longer subject to examination by the U.S. for fiscal years before 2014. The Company has various tax audits and appeals in process at any given time. It is not anticipated that any adjustments resulting from tax examinations or appeals would result in a material change to the Company’s financial position or results of operations.
As of April 25, 2015, April 26, 2014, and April 27, 2013, the Company’s liability for uncertain tax positions, net of federal tax benefits, was $503, $398, and $925, respectively, all of which would impact the effective tax rate if recognized. The Company does not expect any material changes in the amount of uncertain
84
SCHOOL SPECIALTY, INC.
NOTES TO CONSOLIDATED FINANCIAL STATEMENTS—(Continued)
FOR FISCAL 2015, THE FORTY-SIX WEEKS ENDED APRIL 26, 2014,
SIX WEEKS ENDED JUNE 11, 2013 AND FISCAL 2013
(In Thousands, Except Per Share Amounts)
tax positions within the next twelve months. The Company classifies accrued interest and penalties related to unrecognized tax benefits as income tax expense in the consolidated statements of operations. The amounts of accrued interest and penalties included in the liability for uncertain tax positions are not material.
The following table summarizes the activity related to the Company’s gross liability for uncertain tax positions:
| Balance at April 30, 2011 (Predecessor Company) |
$ | 688 | ||
| Increase related to current year tax provision |
21 | |||
| Expiration of statute of limitations for tax assessments |
(2 | ) | ||
| Adjustments to provision related to assessments |
(120 | ) | ||
|
|
|
|||
|
|
|
|||
| Balance at April 28, 2012 (Predecessor Company) |
$ | 587 | ||
|
|
|
|||
|
|
|
|||
| Increase related to current year tax provision |
133 | |||
| Adjustments to provision related to assessments |
205 | |||
|
|
|
|||
|
|
|
|||
| Balance at April 27, 2013 (Predecessor Company) |
$ | 925 | ||
|
|
|
|||
|
|
|
|||
| Increase related to current year tax provision |
30 | |||
| Adjustments to provision related to assessments |
(557 | ) | ||
|
|
|
|||
|
|
|
|||
| Balance at April 26, 2014 (Successor Company) |
$ | 398 | ||
|
|
|
|||
| Increase related to current year tax provision |
598 | |||
| Adjustments to provision related to assessments |
(493 | ) | ||
|
|
|
|||
|
|
|
|||
| Balance at April 25, 2015 (Successor Company) |
$ | 503 | ||
|
|
|
NOTE 12—OPERATING LEASE COMMITMENTS
The Company leases various types of warehouse and office facilities and equipment, under lease agreements which expire at various dates. Future minimum lease payments under operating leases for the Company’s fiscal years are as follows:
| 2016 |
$ | 6,639 | ||
| 2017 |
5,134 | |||
| 2018 |
3,402 | |||
| 2019 |
2,140 | |||
| 2020 |
1,431 | |||
| Thereafter |
1,258 | |||
|
|
|
|||
| Total minimum lease payments |
$ | 20,004 | ||
|
|
|
Rent expense for fiscal 2015, the forty-six weeks ended April 26, 2014, six weeks ended June 11, 2013, and fiscal 2013, was $7,423, $6,345, $827, and $9,164, respectively.
NOTE 13—EMPLOYEE BENEFIT PLANS
The Company sponsored the School Specialty, Inc. 401(k) Plan (the “401(k) Plan”) which allows employee contributions in accordance with Section 401(k) of the Internal Revenue Code. In January, 2015, the 401(k) Plan
85
SCHOOL SPECIALTY, INC.
NOTES TO CONSOLIDATED FINANCIAL STATEMENTS—(Continued)
FOR FISCAL 2015, THE FORTY-SIX WEEKS ENDED APRIL 26, 2014,
SIX WEEKS ENDED JUNE 11, 2013 AND FISCAL 2013
(In Thousands, Except Per Share Amounts)
assets were transferred into a 401(k) plan sponsored by the Company’s professional employment organization. This new 401(k) plan operates in a similar fashion to the previous plan. The Company has the discretion to match a portion of employee contributions and virtually all full-time employees are eligible to participate in the 401(k) Plan after 90 days of service. In fiscal 2015, the forty-six weeks ended April 26, 2014, the six weeks ended June 11, 2013 and fiscal 2013, the Company did not make any 401(k) match due to the economic conditions and the Company’s liquidity position.
NOTE 14—STOCKHOLDERS’ EQUITY
Share Repurchase Programs
The Company did not repurchase any shares of its outstanding common stock during the last three fiscal years. Restrictive covenants in the Company’ pre-bankruptcy credit facilities and bankruptcy-related debtor-in-possession credit facilities prevented the Company’s repurchase of additional common stock.
Earnings Per Share (“EPS”)
Basic EPS excludes dilution and is computed by dividing income (loss) available to common stockholders by the weighted average number of common shares outstanding for the period. Diluted EPS reflects the potential dilution that could occur if securities to issue common stock were exercised or otherwise issued. The following information presents the Company’s computations of basic and diluted EPS for the periods presented in the consolidated statements of operations:
| (Loss)/Income (Numerator) |
Shares (Denominator) |
Per Share Amount |
||||||||||
| Fiscal 2015 (Successor Company): |
||||||||||||
| Basic EPS |
$ | (33,532 | ) | 1,000 | $ | (33.53 | ) | |||||
|
|
|
|||||||||||
| Effect of dilutive non-vested stock options |
— | — | ||||||||||
|
|
|
|
|
|||||||||
| Basic and diluted EPS |
$ | (33,532 | ) | 1,000 | $ | (33.53 | ) | |||||
|
|
|
|
|
|
|
|||||||
| Forty-Six Weeks Ended April 26, 2014 (Successor Company): |
||||||||||||
| Basic EPS |
$ | (17,485 | ) | 1,000 | $ | (17.49 | ) | |||||
|
|
|
|||||||||||
| Effect of dilutive employee stock options |
— | — | ||||||||||
|
|
|
|
|
|||||||||
| Basic and diluted EPS |
$ | (17,485 | ) | 1,000 | $ | (17.49 | ) | |||||
|
|
|
|
|
|
|
|||||||
| Six Weeks Ended June 11, 2013 (Predecessor Company): |
||||||||||||
| Basic EPS |
$ | 76,068 | 18,922 | $ | 4.02 | |||||||
|
|
|
|||||||||||
| Effect of dilutive employee stock options |
— | — | ||||||||||
|
|
|
|
|
|||||||||
| Basic and diluted EPS |
$ | 76,068 | 18,922 | $ | 4.02 | |||||||
|
|
|
|
|
|
|
|||||||
| Fiscal 2013 (Predecessor Company): |
||||||||||||
| Basic EPS |
$ | (147,692 | ) | 18,922 | $ | (7.81 | ) | |||||
|
|
|
|||||||||||
| Effect of dilutive employee stock options |
— | — | ||||||||||
|
|
|
|
|
|||||||||
| Basic and diluted EPS |
$ | (147,692 | ) | 18,922 | $ | (7.81 | ) | |||||
|
|
|
|
|
|
|
|||||||
86
SCHOOL SPECIALTY, INC.
NOTES TO CONSOLIDATED FINANCIAL STATEMENTS—(Continued)
FOR FISCAL 2015, THE FORTY-SIX WEEKS ENDED APRIL 26, 2014,
SIX WEEKS ENDED JUNE 11, 2013 AND FISCAL 2013
(In Thousands, Except Per Share Amounts)
The Company had additional employee stock options outstanding of 73, 0, 0, and 2,570 for fiscal 2015, the forty-six weeks ended April 26, 2014, the six weeks ended June 11, 2013 and fiscal 2013, respectively, which were not included in the computation of diluted EPS because they were anti-dilutive.
NOTE 15—SHARE-BASED COMPENSATION EXPENSE
Employee Stock Plans
As of April 25, 2015, the Company had one share-based employee compensation plan; the School Specialty, Inc. 2014 Incentive Plan (the “2014 Plan”). The 2014 Plan was adopted by the Board of Directors on April 24, 2014 and approved on September 4, 2014 by the Company’s stockholders. On April 24, 2014, School Specialty, Inc.’s CEO was awarded 33 stock options under the 2014 Plan. Other members of management were awarded 65 stock options during fiscal 2015. September 4, 2014, the date on which the stockholders approved the 2014 plan, was considered the grant date, or measurement date, for those awards issued prior to this date. As such, those awards made prior to September 4, 2014 were not considered outstanding and no expense associated with those awards was recognized prior to that date. There were 68 stock options awarded prior to the measurement date.
The 33 stock options that were awarded to the Company’s CEO will vest as to one-fourth of the options on the first four anniversaries of the date of the award. The 65 options that were awarded to other members of management will vest as to one-half of the options on the second anniversary date of award and as to one-fourth of the options on each of the third and fourth anniversaries of the award date.
Prior to the Effective Date, the Predecessor Company had three share-based employee compensation plans under which awards were outstanding as of April 27, 2013: the School Specialty, Inc. 1998 Stock Incentive Plan (the “1998 Plan”), the School Specialty, Inc. 2002 Stock Incentive Plan (the “2002 Plan”), and the School Specialty, Inc. 2008 Equity Incentive Plan (the “2008 Plan”). All plans were approved by the Predecessor Company’s stockholders.
87
SCHOOL SPECIALTY, INC.
NOTES TO CONSOLIDATED FINANCIAL STATEMENTS—(Continued)
FOR FISCAL 2015, THE FORTY-SIX WEEKS ENDED APRIL 26, 2014,
SIX WEEKS ENDED JUNE 11, 2013 AND FISCAL 2013
(In Thousands, Except Per Share Amounts)
A summary of option transactions for fiscal 2013, the six weeks ended June 11, 2013, the forty-six weeks ended April 26, 2014, and fiscal 2015 were as follows:
| Options Outstanding | Options Exercisable | |||||||||||||||
| Options | Weighted- Average Exercise Price |
Options | Weighted- Average Exercise Price |
|||||||||||||
| Predecessor Company |
||||||||||||||||
| Balance at April 28, 2012 |
2,356 | $ | 19.18 | 1,009 | $ | 32.20 | ||||||||||
|
|
|
|||||||||||||||
| Granted |
463 | 2.85 | ||||||||||||||
| Canceled |
(269 | ) | 28.20 | |||||||||||||
|
|
|
|||||||||||||||
| Balance at April 27, 2013 |
2,550 | $ | 15.27 | 1,207 | $ | 24.76 | ||||||||||
|
|
|
|||||||||||||||
| Canceled |
(2,550 | ) | 15.27 | |||||||||||||
|
|
|
|||||||||||||||
| Balance at June 11, 2013 |
— | $ | — | — | $ | — | ||||||||||
|
|
|
|||||||||||||||
| Successor Company |
||||||||||||||||
| Granted |
— | — | ||||||||||||||
| Exercised |
— | — | ||||||||||||||
| Canceled |
— | — | ||||||||||||||
|
|
|
|||||||||||||||
| Balance at April 26, 2014 |
— | $ | — | — | $ | — | ||||||||||
|
|
|
|||||||||||||||
| Granted |
98 | 130.00 | ||||||||||||||
| Exercised |
— | — | ||||||||||||||
| Canceled |
(25 | ) | 130.00 | |||||||||||||
|
|
|
|||||||||||||||
| Balance at April 25, 2015 |
73 | $ | 130.00 | 8 | $ | 130.00 | ||||||||||
|
|
|
In fiscal 2015, fiscal 2014 and fiscal 2013 there were no time-based non-vested stock unit awards granted.
In fiscal 2015, fiscal 2014 and fiscal 2013 there were no shares of restricted stock awarded.
The following table presents the share-based compensation expense recognized for fiscal 2015, the forty-six weeks ended April 26, 2014, six weeks ended June 11, 2013 and fiscal 2013:
| For the Fiscal Years Ended | ||||||||||||||||||||||||||||||||||
| Successor Company | Predecessor Company | |||||||||||||||||||||||||||||||||
| April 25, 2015 | Forty-Six Weeks Ended April 26, 2014 |
Six Weeks Ended June 11, 2013 |
April 27, 2013 | |||||||||||||||||||||||||||||||
| Gross | Net of Tax | Gross | Net of Tax | Gross | Net of Tax | Gross | Net of Tax | |||||||||||||||||||||||||||
| Stock Options |
$ | 581 | $ | 581 | $ | — | $ | — | $ | 3,624 | $ | — | $ | 1,399 | $ | 856 | ||||||||||||||||||
| Director NSUs |
— | — | — | — | — | — | 141 | 86 | ||||||||||||||||||||||||||
| Management RSUs |
— | — | — | — | — | — | 355 | 218 | ||||||||||||||||||||||||||
|
|
|
|
|
|
|
|
|
|
|
|
|
|
|
|
|
|||||||||||||||||||
| Total stock-based compensation expense |
$ | 581 | $ | 581 | $ | — | $ | — | $ | 3,624 | $ | — | $ | 1,895 | $ | 1,160 | ||||||||||||||||||
|
|
|
|
|
|
|
|
|
|
|
|
|
|
|
|
|
|||||||||||||||||||
88
SCHOOL SPECIALTY, INC.
NOTES TO CONSOLIDATED FINANCIAL STATEMENTS—(Continued)
FOR FISCAL 2015, THE FORTY-SIX WEEKS ENDED APRIL 26, 2014,
SIX WEEKS ENDED JUNE 11, 2013 AND FISCAL 2013
(In Thousands, Except Per Share Amounts)
The stock-based compensation expense is reflected in selling, general and administrative (“SG&A”) expenses in the accompanying consolidated statements of operations, other than reorganization expense recognized in the six weeks ended June 11, 2013 for cancellation of equity awards. The income tax benefit recognized related to share-based compensation expense was $0, $0, $0, and $735 for fiscal 2015, the forty-six weeks ended April 26, 2014, six weeks ended June 11, 2013 and fiscal 2013, respectively. Other than recording the effect of cancelling the equity awards, the Company recognized share-based compensation expense ratably over the vesting period of each award along with cumulative adjustments for changes in the expected level of attainment for performance-based awards.
The total unrecognized share-based compensation expense as of April 25, 2015, April 28, 2014, June 11, 2013, and April 27, 2013 were as follows:
| April 25, 2015 |
April 26, 2014 |
June 11, 2013 |
April 27, 2013 (1) |
|||||||||||||||
| Stock Options, net of estimated forfeitures |
$ | 3,422 | $ | — | $ | — | $ | 2,328 | ||||||||||
| NSUs |
— | — | — | 225 | ||||||||||||||
| RSUs |
— | — | — | 1,071 | ||||||||||||||
| (1) | The Company would normally expect to recognize this expense over a weighted average period of approximately 2.1 years. However, in conjunction with the Debtors’ Reorganization Plan which became effective on June 11, 2013 all Predecessor Company shares, options, NSUs and restricted shares that were outstanding on the Effective Date were canceled. |
On May 28, 2014, the Board granted 6 stock appreciation rights (“SARs”) to each of the non-employee members of the Board under the 2014 Plan. Prior to the approval of the 2014 Plan at the Annual Meeting of Stockholders on September 4, 2014, the SARs were not considered outstanding, nor granted and therefore no expense was recognized prior to this date. Each SAR has a grant date value of $130 and will be settled in cash upon exercise. As such, the SARs are accounted for as liability awards. Since the Company’s stock trading price was less than each SARs exercise price as of the end of the fourth quarter of fiscal 2015, no expense was recorded for each SAR. The SARs will vest as to one-half of the SARs on the second anniversary of the date of grant and as to one-fourth of the SARs on each of the third and fourth anniversaries of the date of grant. Total SARs that remain outstanding as of April 25, 2015 are 11 as 6 SARs have been canceled due to the death of a non-employee Board member.
As discussed above, there were no options considered granted or outstanding for the forty-six weeks ended April 26, 2014 or the six weeks ended June 11, 2013. The weighted average fair value of options granted during fiscal 2015 and 2013, was $55.12 and $1.27, respectively. The fair value of options is estimated on the date of grant using the Black-Scholes single option pricing model with the following weighted average assumptions:
| Fiscal 2015 | Fiscal 2013 | |||||||
| Average-risk free interest rate |
1.95 | % | 0.93 | % | ||||
| Expected volatility |
48.00 | % | 48.31 | % | ||||
| Expected term |
6.3 years | 5.5 years | ||||||
| Fiscal 2015 | Fiscal 2013 | |||||||
| Total intrinsic value of stock options exercised |
$ | — | $ | — | ||||
| Cash received from stock option exercises |
— | — | ||||||
| Income tax deficiency from the exercise of stock options |
— | (91 | ) | |||||
89
SCHOOL SPECIALTY, INC.
NOTES TO CONSOLIDATED FINANCIAL STATEMENTS—(Continued)
FOR FISCAL 2015, THE FORTY-SIX WEEKS ENDED APRIL 26, 2014,
SIX WEEKS ENDED JUNE 11, 2013 AND FISCAL 2013
(In Thousands, Except Per Share Amounts)
NOTE 16—SEGMENT INFORMATION
The Company determines its operating segments based on the information utilized by the chief operating decision maker, the Company’s Chief Executive Officer, to allocate resources and assess performance. Based on this information, the Company has determined that it operates in two operating segments, Distribution and Curriculum, which also constitute its reportable segments. The Company operates principally in the United States, with limited operations in Canada. The Distribution segment offers products that include basic classroom supplies and office products, supplemental learning materials, physical education equipment, classroom technology, planning and student development, coordinated school health and furniture. The Curriculum segment is a PreK-12 curriculum-based publisher of proprietary and non-proprietary products in the categories of science and reading and literacy. The accounting policies of the segments are the same as those described in Summary of Significant Accounting Policies. Intercompany eliminations represent intercompany sales primarily from the Curriculum segment to the Distribution segment, and the resulting profit recognized on such intercompany sales.
While a significant majority of revenue and assets are derived from the Company’s U.S. operations, the Company had Canadian revenue of $22,600, $23,941, $1,873, and $27,914 for fiscal 2015, the forty-six weeks ended April 26, 2014, six weeks ended June 11, 2013, and fiscal 2013, respectively, and long-term assets of $49 and $142 as of April 25, 2015 and April 26, 2014, respectively. As of April 25, 2015 and April 26, 2014, these long-term assets are primarily Property, Plant and Equipment. The majority of the revenue is reflected in the Curriculum segment and all of the assets are in the Curriculum segment.
90
SCHOOL SPECIALTY, INC.
NOTES TO CONSOLIDATED FINANCIAL STATEMENTS—(Continued)
FOR FISCAL 2015, THE FORTY-SIX WEEKS ENDED APRIL 26, 2014,
SIX WEEKS ENDED JUNE 11, 2013 AND FISCAL 2013
(In Thousands, Except Per Share Amounts)
The following table presents segment information:
| Successor Company | Predecessor Company | |||||||||||||||||
| Fiscal Year Ended April 25, 2015 |
Forty-Six Weeks Ended April 26, 2014 |
Six Weeks Ended June 11, 2013 |
Fiscal Year Ended April 27, 2013 |
|||||||||||||||
| Revenues: |
||||||||||||||||||
| Distribution |
$ | 531,456 | $ | 493,359 | $ | 49,069 | $ | 583,705 | ||||||||||
| Curriculum |
90,412 | 78,686 | 9,628 | 91,293 | ||||||||||||||
| Corporate and intercompany eliminations |
— | — | — | — | ||||||||||||||
|
|
|
|
|
|
|
|
|
|||||||||||
| Total |
$ | 621,868 | $ | 572,045 | $ | 58,697 | $ | 674,998 | ||||||||||
|
|
|
|
|
|
|
|
|
|||||||||||
| Operating (loss) income and loss before taxes: |
||||||||||||||||||
| Distribution (1) (6) |
$ | 6,063 | $ | 18,922 | $ | (2,643 | ) | $ | (22,940 | ) | ||||||||
| Curriculum (1) |
(2,977 | ) | (1,590 | ) | (1,212 | ) | (18,927 | ) | ||||||||||
| Corporate and intercompany eliminations (2) |
(16,176 | ) | (14,828 | ) | — | (7,533 | ) | |||||||||||
|
|
|
|
|
|
|
|
|
|||||||||||
| Operating income (loss) |
(13,090 | ) | 2,504 | (3,855 | ) | (49,400 | ) | |||||||||||
| Interest expense and reorganization items, net |
19,825 | 19,731 | (81,564 | ) | 97,190 | |||||||||||||
|
|
|
|
|
|
|
|
|
|||||||||||
| Income (loss) before provision for income taxes |
$ | (32,915 | ) | $ | (17,227 | ) | $ | 77,709 | $ | (146,590 | ) | |||||||
|
|
|
|
|
|
|
|
|
|||||||||||
| Successor | Successor | |||||||||||||||||
| April 25, 2015 | April 26, 2014 | |||||||||||||||||
| Identifiable assets: |
||||||||||||||||||
| Distribution |
$ | 200,510 | $ | 214,723 | ||||||||||||||
| Curriculum |
94,538 | 103,622 | ||||||||||||||||
| Corporate assets (3) |
17,904 | 21,274 | ||||||||||||||||
|
|
|
|
|
|||||||||||||||
| Total |
$ | 312,952 | $ | 339,619 | ||||||||||||||
|
|
|
|
|
|||||||||||||||
| Successor Company |
Successor Company |
Predecessor Company | ||||||||||||||||
| Forty-Six Weeks Ended April 26, 2014 |
Forty-Six Weeks Ended April 26, 2014 |
Six Weeks Ended June 11, 2013 |
Fiscal
Year Ended April 27, 2013 |
|||||||||||||||
| Depreciation and amortization of intangible assets and development costs: |
||||||||||||||||||
| Distribution (5) |
$ | 21,025 | $ | 15,705 | $ | 2,080 | $ | 23,184 | ||||||||||
| Curriculum (5) |
15,231 | 9,477 | 1,821 | 14,920 | ||||||||||||||
| Corporate (4) |
— | — | — | 2,295 | ||||||||||||||
|
|
|
|
|
|
|
|
|
|||||||||||
| Total |
$ | 36,256 | $ | 25,182 | $ | 3,901 | $ | 40,399 | ||||||||||
|
|
|
|
|
|
|
|
|
|||||||||||
| Expenditures for property, plant and equipment, intangible and other assets and development costs: |
||||||||||||||||||
| Distribution |
$ | 9,921 | $ | 11,626 | $ | 256 | 6,141 | |||||||||||
| Curriculum |
7,460 | 6,290 | 450 | 7,422 | ||||||||||||||
| Corporate |
— | — | — | — | ||||||||||||||
|
|
|
|
|
|
|
|
|
|||||||||||
| Total |
$ | 17,381 | $ | 17,916 | $ | 706 | 13,563 | |||||||||||
|
|
|
|
|
|
|
|
|
|||||||||||
91
SCHOOL SPECIALTY, INC.
NOTES TO CONSOLIDATED FINANCIAL STATEMENTS—(Continued)
FOR FISCAL 2015, THE FORTY-SIX WEEKS ENDED APRIL 26, 2014,
SIX WEEKS ENDED JUNE 11, 2013 AND FISCAL 2013
(In Thousands, Except Per Share Amounts)
| (1) | In the third quarter of fiscal 2013, the Company recorded an impairment charge related to its goodwill and indefinite-lived intangible assets of $3,893 and $41,896 in its Distribution and Curriculum Segments, respectively. |
| (2) | Operating expenses in Corporate for fiscal 2015, the forty-six week period ended April 26, 2014 and for fiscal 2013 were $16,176, $14,828 and $7,533, respectively. The amount for the Successor represented restructuring and facility exit costs, costs incurred to implement process improvement actions and other bankruptcy-related costs. The amount for fiscal 2013 included professional expenses related to the period immediately prior to the Chapter 11 filing and expenses relate to lease rejections and facility closure. |
| (3) | Assets in Corporate include cash, restricted cash, capitalized debt issuance costs and investment in unconsolidated affiliate. |
| (4) | In fiscal 2013, the Company’s corporate segment recognized $2,295 of accelerated depreciation related to the closing of its Mt. Joy distribution center as part of the bankruptcy related lease rejection. |
| (5) | In fiscal 2015, the Company recorded accelerated amortization of certain product development assets in the amount of $2,310 for Distribution and $1,380 for Curriculum. |
| (6) | In fiscal 2015, the Company’s Distribution Segment recorded an impairment charge related to its amortizable intangibles assets of $2,713. |
NOTE 17—EARLY TERMINATION PAYMENT
During the fourth quarter of fiscal 2013, the Company placed $25,000 of cash into a restricted account. The Ad Hoc DIP Agreement required the funds to be placed in an escrow account as a deposit for an early termination fee payable to the prior term loan lender (“Bayside”) that was provided under the Term Loan Credit Agreement. The Bankruptcy Court ruled that the funds were owed, but the Official Committee of Unsecured Creditors contested the ruling and filed an appeal in the Federal District Court of Delaware. On the Effective Date, an additional $119, representing interest earned, was transferred into the restricted account. After the Effective Date, the Company deposited an additional $1,280 into the restricted account related to potential interest expense on the unpaid early termination fees for the pre-bankruptcy term loan with Bayside. In the second quarter of fiscal 2014, this escrow amount, including interest, was released to Bayside. On October 24, 2013, the Bankruptcy Court approved a stipulation which reflected the settlement of this matter. In connection with this settlement, the parties agreed that the amount of the early termination fee was $21,000. As a result, Bayside refunded to the Company $5,399 which represented the amount of restricted account funds that had been released to Bayside in excess of the $21,000 settlement. The $5,399 consisted of a reduction of the early termination fee of $4,054 and a recovery of interest expense previously paid in fiscal 2014 of $1,345.
During the first quarter of fiscal 2013, the Company transferred $2,708 of cash into a restricted account. The funds in the restricted account serve as collateral primarily for the Company’s workmen’s compensation insurance and other lease obligations, secured by letters of credit. During the third and fourth quarters of fiscal 2013 and the first and second quarters of fiscal 2014, $972, $434, $601 and $701, respectively, was transferred from the restricted cash account as the letters of credit secured by these amounts were canceled. The Company currently has no restrictions on its cash balance.
NOTE 18—CONDENSED COMBINED DEBTOR-IN-POSSESSION FINANCIAL INFORMATION
The financial statement below represent the condensed combined statement of operations, statement of comprehensive loss, statement of shareholders’ equity(deficit) and statement of cash flows of the Predecessor Company (the “Debtors”) for fiscal 2013.
92
SCHOOL SPECIALTY, INC.
NOTES TO CONSOLIDATED FINANCIAL STATEMENTS—(Continued)
FOR FISCAL 2015, THE FORTY-SIX WEEKS ENDED APRIL 26, 2014,
SIX WEEKS ENDED JUNE 11, 2013 AND FISCAL 2013
(In Thousands, Except Per Share Amounts)
Intercompany transactions among the Debtors have been eliminated in the condensed combined statement contained herein. Intercompany transactions among the Debtors and the Non-Filing Entities have not been eliminated in the Debtors’ condensed combined financial statements.
DEBTORS’ STATEMENT OF OPERATIONS
| For the Fiscal Year Ended April 27, 2013 |
||||
| Revenues |
$ | 662,043 | ||
| Cost of revenues |
410,069 | |||
|
|
|
|||
| Gross profit |
251,974 | |||
| Selling, general and administrative expenses |
256,930 | |||
| Impairment charge |
36,010 | |||
|
|
|
|||
| Operating loss |
(40,966 | ) | ||
| Other expense: |
||||
| Interest expense |
28,600 | |||
| Loss on early extinguishment of debt |
10,201 | |||
| Early termination of long-term indebtedness |
26,247 | |||
| Impairment of long-term asset |
1,414 | |||
| Impairment of investment in unconsolidated affiliate |
7,749 | |||
|
|
|
|||
| Loss before reorganization costs and provision for (benefit from) income taxes |
(115,177 | ) | ||
| Bankruptcy related reorganization costs |
22,979 | |||
|
|
|
|||
| Loss before provision for (benefit from) income taxes |
(138,156 | ) | ||
| Provision for (benefit from) income taxes |
(774 | ) | ||
|
|
|
|||
| Loss before losses from investment in unconsolidated affiliate |
(137,382 | ) | ||
|
|
|
|||
| Losses of unconsolidated affiliate |
(1,436 | ) | ||
| Net loss attributable to Debtor Entities |
$ | (138,818 | ) | |
|
|
|
|||
DEBTORS’ STATEMENT OF COMPREHENSIVE LOSS
| For the Fiscal Year Ended April 27, 2013 |
||||
| Net Loss Attributable to Debtor Entities |
$ | (138,818 | ) | |
| Other comprehensive income (loss), net of tax: |
||||
| Foreign currency translation adjustments |
— | |||
|
|
|
|||
| Total comprehensive loss, net of tax |
$ | (138,818 | ) | |
|
|
|
|||
93
SCHOOL SPECIALTY, INC.
NOTES TO CONSOLIDATED FINANCIAL STATEMENTS—(Continued)
FOR FISCAL 2015, THE FORTY-SIX WEEKS ENDED APRIL 26, 2014,
SIX WEEKS ENDED JUNE 11, 2013 AND FISCAL 2013
(In Thousands, Except Per Share Amounts)
DEBTORS’ STATEMENT OF SHAREHOLDERS’ EQUITY (DEFICIT)
| Common Stock | Capital Paid-in Excess of Par Value |
Treasury Stock, at Cost |
(Accumulated Deficit) / Retained Earnings |
Total Shareholders’ Equity (Deficit) |
||||||||||||||||||||
| Shares | Dollars | |||||||||||||||||||||||
| Balance at April 28, 2012 |
24,300 | $ | 24 | $ | 444,476 | $ | (186,637 | ) | $ | (179,693 | ) | $ | 78,170 | |||||||||||
|
|
|
|
|
|
|
|
|
|
|
|
|
|||||||||||||
| Issuance of common stock in conjunction with stock option exercises, net |
299 | — | — | — | — | — | ||||||||||||||||||
| Tax deficiency on option exercises |
— | — | (91 | ) | — | — | (91 | ) | ||||||||||||||||
| Share-based compensation expense |
— | — | 1,846 | — | — | 1,846 | ||||||||||||||||||
| Net loss |
— | — | — | — | (138,818 | ) | (138,818 | ) | ||||||||||||||||
|
|
|
|
|
|
|
|
|
|
|
|
|
|||||||||||||
| Balance at April 27, 2013 |
24,599 | $ | 24 | $ | 446,231 | $ | (186,637 | ) | $ | (318,511 | ) | $ | (58,893 | ) | ||||||||||
|
|
|
|
|
|
|
|
|
|
|
|
|
|||||||||||||
94
SCHOOL SPECIALTY, INC.
NOTES TO CONSOLIDATED FINANCIAL STATEMENTS—(Continued)
FOR FISCAL 2015, THE FORTY-SIX WEEKS ENDED APRIL 26, 2014,
SIX WEEKS ENDED JUNE 11, 2013 AND FISCAL 2013
(In Thousands, Except Per Share Amounts)
DEBTORS’ STATEMENT OF CASH FLOWS
| For Fiscal Year Ended April 27, 2013 |
||||
| Cash flows from operating activities: |
||||
| Net loss attributable to Debtor entities |
$ | (138,818 | ) | |
| Adjustments to reconcile net loss to net cash provided by (used in) operating activities: |
||||
| Depreciation and intangible asset amortization expense |
33,029 | |||
| Amortization of development costs |
7,179 | |||
| Losses of unconsolidated affiliate |
1,436 | |||
| Loss on early extinguishment of debt |
10,201 | |||
| Early termination of long-term indebtedness |
1,247 | |||
| Fees related to DIP financing |
9,855 | |||
| Amortization of debt fees and other |
2,019 | |||
| Share-based compensation expense |
1,846 | |||
| Impairment of goodwill and intangible assets |
36,010 | |||
| Impairment of investment in unconsolidated affiliate |
7,749 | |||
| Impairment of long-term asset |
1,414 | |||
| Deferred taxes |
5,193 | |||
| Non-cash convertible debt interest expense |
6,828 | |||
| Changes in current assets and liabilities (net of assets acquired and liabilities assumed in business combinations): |
||||
| Accounts receivable |
3,753 | |||
| Inventories |
8,024 | |||
| Deferred catalog costs |
2,813 | |||
| Prepaid expenses and other current assets |
(19,965 | ) | ||
| Accounts payable |
505 | |||
| Accrued liabilities |
12,334 | |||
| Accrued bankruptcy related reorganization costs |
6,188 | |||
|
|
|
|||
| Net cash used in operating activities |
(1,160 | ) | ||
|
|
|
|||
| Cash flows from investing activities: |
||||
| Additions to property, plant and equipment |
(4,702 | ) | ||
| Proceeds from note receivable |
3,000 | |||
| Change in restricted cash |
(26,302 | ) | ||
| Investment in product development costs |
(7,579 | ) | ||
| Investment in product line |
(1,250 | ) | ||
|
|
|
|||
| Net cash used in investing activities |
(36,833 | ) | ||
|
|
|
|||
| Cash flows from financing activities: |
||||
| Proceeds from bank borrowings |
1,029,131 | |||
| Repayment of debt and capital leases |
(1,110,809 | ) | ||
| DIP proceeds from bank borrowings |
307,636 | |||
| DIP repayment of debt and capital leases |
(149,850 | ) | ||
| Early termination of long-term indebtedness |
(1,247 | ) | ||
| Fees related to DIP financing |
(9,855 | ) | ||
| Payment of debt fees and other |
(10,404 | ) | ||
|
|
|
|||
| Net cash provided by financing activities |
54,602 | |||
|
|
|
|||
| Net increase in cash and cash equivalents |
16,609 | |||
| Cash and cash equivalents, beginning of period |
155 | |||
|
|
|
|||
| Cash and cash equivalents, end of period |
$ | 16,764 | ||
|
|
|
|||
95
SCHOOL SPECIALTY, INC.
NOTES TO CONSOLIDATED FINANCIAL STATEMENTS—(Continued)
FOR FISCAL 2015, THE FORTY-SIX WEEKS ENDED APRIL 26, 2014,
SIX WEEKS ENDED JUNE 11, 2013 AND FISCAL 2013
(In Thousands, Except Per Share Amounts)
The Debtors’ financial information for the six week period ended June 11, 2013 is not separately presented as non-debtor activity for this period was not material.
NOTE 19—RESTRUCTURING
In fiscal 2015 and 2014, the Company recorded restructuring costs associated with closure or disposal of distribution centers and severance related to headcount reductions. The following is a reconciliation of accrued restructuring costs for fiscal 2015, the forty-six weeks ended April 26, 2014, and the six weeks ended June 11, 2013.
| Distribution | Curriculum | Corporate | Total | |||||||||||||
| Accrued Restructuring at April 27, 2013 (Predecessor) |
$ | (21 | ) | $ | 149 | $ | 588 | $ | 716 | |||||||
|
|
|
|
|
|
|
|
|
|||||||||
| Amounts charged to expense |
21 | (15 | ) | (167 | ) | (161 | ) | |||||||||
| Payments |
— | — | — | — | ||||||||||||
|
|
|
|
|
|
|
|
|
|||||||||
| Accrued Restructuring Costs at June 11, 2013 (Predecessor) |
$ | — | $ | 134 | $ | 421 | $ | 555 | ||||||||
|
|
|
|
|
|
|
|
|
|||||||||
| Reclassification |
406 | — | (406 | ) | — | |||||||||||
| Amounts charged to expense |
123 | 459 | 3,628 | 4,210 | ||||||||||||
| Payments |
(529 | ) | (535 | ) | (3,508 | ) | (4,572 | ) | ||||||||
|
|
|
|
|
|
|
|
|
|||||||||
| Accrued Restructuring at April 26, 2014 (Successor) |
$ | — | $ | 58 | $ | 135 | $ | 193 | ||||||||
|
|
|
|
|
|
|
|
|
|||||||||
| Amounts charged to expense |
15 | — | 5,462 | 5,477 | ||||||||||||
| Payments |
(15 | ) | (58 | ) | (4,018 | ) | (4,091 | ) | ||||||||
|
|
|
|
|
|
|
|
|
|||||||||
| Accrued Restructuring at April 25, 2015 (Successor) |
$ | — | $ | — | $ | 1,579 | $ | 1,579 | ||||||||
|
|
|
|
|
|
|
|
|
|||||||||
NOTE 20—COMMITMENTS AND CONTINGENCIES
Various claims and proceedings arising in the normal course of business are pending against the Company. The results of these matters are not expected to have a material adverse effect on the Company’s consolidated financial position, results of operations or cash flows.
NOTE 21—QUARTERLY FINANCIAL DATA (UNAUDITED)
The following presents certain unaudited quarterly financial data for fiscal 2015 and fiscal 2014:
| Fiscal 2015 | ||||||||||||||||||||
| Successor Company | ||||||||||||||||||||
| First | Second | Third | Fourth | Total | ||||||||||||||||
| Revenues |
$ | 199,469 | $ | 238,670 | $ | 77,754 | $ | 105,975 | $ | 621,868 | ||||||||||
| Gross profit |
78,566 | 86,822 | 26,808 | 35,962 | 228,158 | |||||||||||||||
| Operating income (loss) |
16,491 | 17,000 | (26,292 | ) | (20,289 | ) | (13,090 | ) | ||||||||||||
| Net income (loss) |
11,014 | 11,923 | (30,651 | ) | (25,818 | ) | (33,532 | ) | ||||||||||||
| Basic earnings per share of common stock: |
||||||||||||||||||||
| Earnings/(loss) |
$ | 11.01 | $ | 11.92 | $ | (30.65 | ) | $ | (25.82 | ) | $ | (33.53 | ) | |||||||
|
|
|
|
|
|
|
|
|
|
|
|||||||||||
| Diluted earnings per share of common stock: |
||||||||||||||||||||
| Earnings/(loss) |
$ | 11.01 | $ | 11.92 | $ | (30.65 | ) | $ | (25.82 | ) | $ | (33.53 | ) | |||||||
|
|
|
|
|
|
|
|
|
|
|
|||||||||||
96
SCHOOL SPECIALTY, INC.
NOTES TO CONSOLIDATED FINANCIAL STATEMENTS—(Continued)
FOR FISCAL 2015, THE FORTY-SIX WEEKS ENDED APRIL 26, 2014,
SIX WEEKS ENDED JUNE 11, 2013 AND FISCAL 2013
(In Thousands, Except Per Share Amounts)
| Fiscal 2014 | ||||||||||||||||||||||||||
| Predecessor Company |
Successor Company | |||||||||||||||||||||||||
| 6 weeks | 7 weeks | Second | Third | Fourth | Total | |||||||||||||||||||||
| Revenues |
$ | 58,697 | $ | 143,499 | $ | 245,629 | $ | 74,664 | $ | 108,253 | $ | 572,045 | ||||||||||||||
| Gross profit |
23,618 | 59,758 | 93,205 | 26,448 | 42,789 | 222,200 | ||||||||||||||||||||
| Operating income (loss) |
(3,855 | ) | 21,296 | 19,243 | (24,653 | ) | (13,382 | ) | 2,504 | |||||||||||||||||
| Net income (loss) |
76,068 | 16,943 | 14,697 | (30,135 | ) | (18,990 | ) | (17,485 | ) | |||||||||||||||||
| Basic earnings per share of common stock: |
||||||||||||||||||||||||||
| Earnings/(loss) |
$ | 4.02 | $ | 16.94 | $ | 14.70 | $ | (30.14 | ) | $ | (18.99 | ) | $ | (17.49 | ) | |||||||||||
|
|
|
|
|
|
|
|
|
|
|
|
|
|||||||||||||||
| Diluted earnings per share of common stock: |
||||||||||||||||||||||||||
| Earnings/(loss) |
$ | 4.02 | $ | 16.94 | $ | 14.70 | $ | (30.14 | ) | $ | (18.99 | ) | $ | (17.49 | ) | |||||||||||
|
|
|
|
|
|
|
|
|
|
|
|
|
|||||||||||||||
The summation of quarterly net income (loss) per share may not equate to the calculation for the full fiscal year as quarterly calculations are performed on a discrete basis.
The Company’s business activity is subject to seasonal influences. Our historical revenues and profitability have been dramatically higher in the first two quarters of our fiscal year, primarily due to increased shipments to customers coinciding with the start of each school year. Quarterly results also may be materially affected by variations in our costs for the products sold, the mix of products sold and general economic conditions. Therefore, results for any quarter are not indicative of the results that we may achieve for any subsequent fiscal quarter or for a full fiscal year.
NOTE 22—SUBSEQUENT EVENTS
On April 29, 2015, the Company’s Board of Directors approved a change in the Company’s fiscal year end from the last Saturday in April to the last Saturday in December. The Company plans to report its financial results for the period of April 26, 2015 to December 26, 2015 on a transition report on Form 10-K and to thereafter file reports for the periods based on the new fiscal year. Prior to filing the transition report, the Company will file its quarterly reports on Form 10-Q for the quarters ending July 25, 2015 and October 24, 2015.
97
| Item 9. | Changes in and Disagreements with Accountants on Accounting and Financial Disclosure |
Not applicable
| Item 9A. | Controls and Procedures |
Evaluation of Disclosure Controls and Procedures
Based on an evaluation as of the end of the period covered by this annual report, the Company’s principal executive officer and principal financial officer have concluded that the Company’s disclosure controls and procedures (as defined in Rule 13a-15(e) under the Securities Exchange Act of 1934 (the “Exchange Act”)) were not effective for the purposes set forth in the definition of the Exchange Act rules, due to a material weakness in our internal control over financial reporting. Additional information regarding that material weakness is included below in Management’s Report on Internal Control over Financial Reporting. Notwithstanding the material weakness that existed as April 25, 2015, management has concluded that the consolidated financial statements included in this Annual Report on Form 10-K present fairly, in all material respects, the Company’s financial position, results of operations and cash flows in conformity with generally accepted accounting principles.
Management’s Report on Internal Control Over Financial Reporting
Management is responsible for establishing and maintaining adequate internal control over financial reporting. As such term is defined in Exchange Act Rule 13a-15(f), internal control over financial reporting is a process designed by, or under the supervision of, the principal executive and principal financial officers, or persons performing similar functions, and effected by the board of directors, management and other personnel, to provide reasonable assurance regarding the reliability of financial reporting and the preparation of financial statements for external purposes in accordance with accounting principles generally accepted in the United States. Internal control over financial reporting includes those policies and procedures that:
| (1) | pertain to the maintenance of records that, in reasonable detail, accurately and fairly reflect the transactions and dispositions of assets of the Company; |
| (2) | provide reasonable assurance that transactions are recorded as necessary to permit preparation of the financial statements in accordance with accounting principles generally accepted in the United States, and that receipts and expenditures of the Company are being made only in accordance with authorizations of management and the directors of the Company; and |
| (3) | provide reasonable assurance regarding prevention of unauthorized acquisition, use, or disposition of the Company’s assets that could have a material effect on the financial statements. |
Management conducted an evaluation of the effectiveness of the Company’s internal control over financial reporting based on the criteria in Internal Control—Integrated Framework (2013) issued by the Committee of Sponsoring Organizations of the Treadway Commission. Based on this evaluation under the criteria, management concluded that as of April 25, 2015, the Company’s internal control over financial reporting was not effective for the purposes set forth in the definition of the Exchange Act rules due to a material weakness in internal control over financial reporting as of April 25, 2015. A material weakness in internal control over financial reporting is a deficiency, or a combination of deficiencies, in internal control over financial reporting such that there is a reasonable possibility that a material misstatement of a company’s annual or interim financial statements will not be prevented or detected on a timely basis. Specifically, management determined the design of controls over non-routine accounting matters did not establish sufficient segregation of duties between analyzing non-routine accounting matters and performing sufficient detailed reviews of the analysis and accounting conclusions.
The Company’s internal control over financial reporting as of April 25, 2015 has been audited by Deloitte & Touche LLP, an independent registered public accounting firm, as stated in their report dated July 9, 2015 which is included herein.
Changes in Internal Controls
No change in our internal control over financial reporting occurred during our most recent fiscal quarter that materially affected, or is reasonably likely to materially effect, our internal control over financial reporting.
98
REPORT OF INDEPENDENT REGISTERED PUBLIC ACCOUNTING FIRM
To the Board of Directors and Stockholders of
School Specialty, Inc.
Greenville, Wisconsin
We have audited School Specialty, Inc. and subsidiaries’ (the “Company’s”) internal control over financial reporting as of April 25, 2015, based on criteria established in Internal Control — Integrated Framework (2013) issued by the Committee of Sponsoring Organizations of the Treadway Commission. The Company’s management is responsible for maintaining effective internal control over financial reporting and for its assessment of the effectiveness of internal control over financial reporting included in the accompanying Management’s Report on Internal Control Over Financial Reporting. Our responsibility is to express an opinion on the Company’s internal control over financial reporting based on our audit.
We conducted our audit in accordance with the standards of the Public Company Accounting Oversight Board (United States). Those standards require that we plan and perform the audit to obtain reasonable assurance about whether effective internal control over financial reporting was maintained in all material respects. Our audit included obtaining an understanding of internal control over financial reporting, assessing the risk that a material weakness exists, testing and evaluating the design and operating effectiveness of internal control based on that risk, and performing such other procedures as we considered necessary in the circumstances. We believe that our audit provides a reasonable basis for our opinion.
A company’s internal control over financial reporting is a process designed by, or under the supervision of, the company’s principal executive and principal financial officers, or persons performing similar functions, and effected by the company’s board of directors, management, and other personnel to provide reasonable assurance regarding the reliability of financial reporting and the preparation of financial statements for external purposes in accordance with generally accepted accounting principles. A company’s internal control over financial reporting includes those policies and procedures that (1) pertain to the maintenance of records that, in reasonable detail, accurately and fairly reflect the transactions and dispositions of the assets of the company; (2) provide reasonable assurance that transactions are recorded as necessary to permit preparation of financial statements in accordance with generally accepted accounting principles, and that receipts and expenditures of the company are being made only in accordance with authorizations of management and directors of the company; and (3) provide reasonable assurance regarding prevention or timely detection of unauthorized acquisition, use, or disposition of the company’s assets that could have a material effect on the financial statements.
Because of the inherent limitations of internal control over financial reporting, including the possibility of collusion or improper management override of controls, material misstatements due to error or fraud may not be prevented or detected on a timely basis. Also, projections of any evaluation of the effectiveness of the internal control over financial reporting to future periods are subject to the risk that the controls may become inadequate because of changes in conditions, or that the degree of compliance with the policies or procedures may deteriorate.
A material weakness is a deficiency, or a combination of deficiencies, in internal control over financial reporting, such that there is a reasonable possibility that a material misstatement of the company’s annual or interim financial statements will not be prevented or detected on a timely basis. A material weakness has been identified and included in management’s assessment, and relates to segregation of duties between analyzing non-routine accounting matters and performing detailed reviews of the analysis and accounting conclusions. This material weakness was considered in determining the nature, timing, and extent of audit tests applied in our audit of the consolidated financial statements and financial statement schedule as of and for the year ended April 25, 2015, of the Company and this report does not affect our report on such financial statements and financial statement schedule.
99
In our opinion, because of the effect of the material weakness identified above on the achievement of the objectives of the control criteria, the Company has not maintained effective internal control over financial reporting as of April 25, 2015, based on the criteria established in Internal Control — Integrated Framework (2013) issued by the Committee of Sponsoring Organizations of the Treadway Commission.
We have also audited, in accordance with the standards of the Public Company Accounting Oversight Board (United States), the consolidated financial statements and financial statement schedule as of and for the year ended April 25, 2015, of the Company and our report dated July 9, 2015 expressed an unqualified opinion on those financial statements and financial statement schedule.
/s/ Deloitte & Touche LLP
Milwaukee, Wisconsin
July 9, 2015
100
| Item 9B. | Other Information |
Not applicable
PART III
| Item 10. | Directors, Executive Officers and Corporate Governance |
| (a) | Executive Officers. Reference is made to “Executive Officers of the Registrant” in Part I hereof. |
| (b) | Directors. The information required by this Item is set forth in our Proxy Statement for the Annual Meeting of Stockholders to be held on September 28, 2015, under the caption “Proposal One: Election of Directors,” which information is incorporated by reference herein. |
| (c) | Section 16 Compliance. The information required by this Item is set forth in our Proxy Statement for the Annual Meeting of Stockholders to be held on September 28, 2015, under the caption “Section 16(a) Beneficial Ownership Reporting Compliance,” which information is incorporated by reference herein. |
| (d) | We have adopted a Code of Ethics that applies to our directors, officers and employees, including the principal executive officer, principal financial officer, principal accounting officer and controller. The Code of Ethics is posted on our internet website at www.schoolspecialty.com. We intend to satisfy the disclosure requirement under Item 406 of Regulation S-K by posting such information on our internet website. |
| (e) | There were no material changes in fiscal 2015 to the procedures by which the Company’s stockholders may recommend nominees to the Company’s Board of Directors. |
| Item 11. | Executive Compensation |
The information required by this Item is set forth in our Proxy Statement for the Annual Meeting of Stockholders to be held on September 28, 2015, under the captions “Executive Compensation Discussion and Analysis,” and which information is incorporated by reference herein.
| Item 12. | Security Ownership of Certain Beneficial Owners and Management and Related Stockholder Matters. |
The information required by this Item is set forth in our Proxy Statement for the Annual Meeting of Shareholders to be held on September 28, 2015, under the captions “Proposal Two: Approval of the 2014 Incentive Plan of School Specialty, Inc.—Equity Compensation Plan Information” and “Security Ownership of Management and Certain Beneficial Owners”, which information is incorporated by reference herein.
| Item 13. | Certain Relationships and Related Transactions, and Director Independence |
The information required by this Item is set forth in our Proxy Statement for the Annual Meeting of Stockholders to be held on September 28, 2015, under the captions “Related Party Transactions” and “Corporate Governance,” which information is incorporated by reference herein.
| Item 14. | Principal Accountant Fees and Services. |
The information required by this Item is set forth in our Proxy Statement for the Annual Meeting of Stockholders to be held on September 28, 2015, under the caption “Audit Committee Report,” which information is incorporated by reference herein.
101
PART IV
| Item 15. | Exhibits and Financial Statement Schedules |
| (a)(1) | Financial Statements (See Part II, Item 8). |
Consolidated Financial Statements
Report of Independent Registered Public Accounting Firm
Consolidated Balance Sheets as of April 25, 2015 and April 26, 2014
Consolidated Statements of Operations for fiscal 2015 (Successor), the forty-six weeks ended April 26, 2014 (Successor), the six weeks ended June 11, 2013 and fiscal 2013 (Predecessor)
Consolidated Statements of Comprehensive Income (Loss) for fiscal 2015, the forty-six weeks ended April 26, 2014 (Successor), the six weeks ended June 11, 2013 and fiscal 2013 (Predecessor)
Consolidated Statements of Stockholders’ Equity for fiscal 2015 (Successor),, the forty-six weeks ended April 26, 2014 (Successor), the six weeks ended June 11, 2013 and fiscal 2013
Consolidated Statements of Cash Flows for fiscal 2015 (Successor), the forty-six weeks ended April 26, 2014 (Successor), the six weeks ended June 11, 2013 and fiscal 2013 (Predecessor)
Notes to Consolidated Financial Statements
(a)(2) Financial Statement Schedule (See Exhibit 99.1).
Schedule for fiscal 2015, the forty-six weeks ended April 26, 2014, six weeks ended June 11, 2013 and fiscal 2013: Schedule II—Valuation and Qualifying Accounts.
(a)(3) Exhibits.
See (b) below
(b) Exhibits.
See the Exhibit Index, which is incorporated by reference herein
(c) Financial Statements Excluded from Annual Report to Stockholders.
Not applicable
102
SIGNATURES
Pursuant to the requirements of Section 13 or 15(d) of the Securities Exchange Act of 1934, the Registrant has caused this report to be signed on its behalf by the undersigned, thereunto duly authorized, on July 9, 2015.
| SCHOOL SPECIALTY, INC. | ||
| By: | /s/ Joseph M. Yorio | |
| Joseph M. Yorio | ||
| President and Chief Executive Officer | ||
| (Principal Executive Officer) | ||
Each person whose signature appears below hereby constitutes and appoints Joseph M. Yorio and Ryan M. Bohr, and each of them, as his or her true and lawful attorney-in-fact and agent, with full power of substitution, to sign on his behalf individually and in the capacity stated below and to perform any acts necessary to be done in order to file any and all amendments to this Annual Report on Form 10-K, and to file the same, with all exhibits thereto and all other documents in connection therewith and each of the undersigned does hereby ratify and confirm all that said attorney-in-fact and agent, or his substitutes, shall do or cause to be done by virtue thereof.
Pursuant to the requirements of the Securities Exchange Act of 1934, this report has been signed by the following persons on behalf of the registrant and in the capacities and on the dates indicated below.
| Name |
Title |
Date | ||
| /s/ Joseph M. Yorio Joseph M. Yorio |
President and Chief Executive Officer and a Director (Principal Executive Officer) | July 9, 2015 | ||
| /s/ Ryan M. Bohr Ryan M. Bohr |
Executive Vice President and Chief Financial Officer (Principal Financial Officer) | July 9, 2015 | ||
| /s/ Kevin L. Baehler Kevin L. Baehler |
Senior Vice President, Chief Accounting Officer (Principal Accounting Officer) | July 9, 2015 | ||
| /s/ James R. Henderson James R. Henderson |
Chairman of the Board | July 9, 2015 | ||
| /s/ Justin Lu Justin Lu |
Director | July 9, 2015 | ||
INDEX TO EXHIBITS
| Exhibit |
Document Description | |
| 3.1 | Amended and Restated Certificate of Incorporation of School Specialty, Inc., as filed on June 11, 2013, incorporated herein by reference to Exhibit 3.1 to Amendment No. 1 to the Registration Statement on Form 8-A of School Specialty, Inc. filed June 11, 2013. | |
| 3.2(a) | Bylaws of School Specialty, Inc., dated June 11, 2013, incorporated herein by reference to Exhibit 3.2 to Amendment No. 1 to the Registration Statement on Form 8-A of School Specialty, Inc. filed June 11, 2013. | |
| 3.2(b) | Amended and Restated Bylaws dated July 9, 2014, incorporated herein by reference to Exhibit 3.1(a) of School Specialty, Inc., Current Report on Form 8-K filed July 15, 2014. | |
| 10.1 | Offer letter by and between School Specialty, Inc. and Patrick T. Collins, dated August 6, 2012, incorporated herein by reference to Exhibit 10.33 of School Specialty, Inc.’s Annual Report on Form 10-K for the period ended April 27, 2013. | |
| 10.2 | Security and Pledge Agreement dated as of February 27, 2013 by and among School Specialty, Inc., U.S. Bank National Association, et al, incorporated herein by reference to Exhibit 10.35 of School Specialty, Inc.’s Annual Report on Form 10-K for the period ended April 27, 2013. | |
| 10.3 | Loan Agreement, dated June 11, 2013, by and among School Specialty, Inc. and certain of its subsidiaries, as borrowers, certain lenders party thereto, and Bank of America, N.A. as agent, incorporated herein by reference to Exhibit 10.39 of School Specialty, Inc.’s Annual Report on Form 10-K for the period ended April 27, 2013. | |
| 10.4 | Credit Agreement, dated June 11, 2013, by and among School Specialty, Inc. and certain of its subsidiaries, as borrowers, certain lenders party thereto, and Credit Suisse AG, as Administrative Agent and Collateral Agent, incorporated herein by reference to Exhibit 10.40 of School Specialty, Inc.’s Annual Report on Form 10-K for the period ended April 27, 2013. | |
| 10.5 | Guarantee and Collateral Agreement dated as of June 11, 2013, among School Specialty, Inc., the guarantors party thereto, and Bank of America, N.A., incorporated herein by reference to Exhibit 10.41 of School Specialty, Inc.’s Annual Report on Form 10-K for the period ended April 27, 2013. | |
| 10.6 | Guarantee and Collateral Agreement dated as of June 11, 2013, among School Specialty, Inc., the guarantors party thereto, and Credit Suisse AG, as Collateral Agent, incorporated herein by reference to Exhibit 10.42 of School Specialty, Inc.’s Annual Report on Form 10-K for the period ended April 27, 2013. | |
| 10.7* | Management Incentive Plan for Fiscal 2014, incorporated by reference to Exhibit 10.1 of School Specialty’s Current Report on Form 8-K dated October 28, 2013. | |
| 10.8* | Letter to Pat Collins dated September 18, 2013, incorporated by reference to Exhibit 10.2 of School Specialty’s Current Report on Form 8-K dated October 28, 2013. | |
| 10.9 | Stipulation Approving the Settlement of (I) the Creditors’ Committee’s Appeal of the Make-Whole Order, and (II) the Creditors’ Committee’s Adversary Proceeding, Approved October 24, 2013, incorporated by reference to Exhibit 10.1 of School Specialty, Inc.’s Current Report on Form 8-K filed October 31, 2013. | |
| 10.10* | Employment Agreement dated April 23, 2014 between Joseph M. Yorio and School Specialty, Inc., incorporated herein by reference to Exhibit 10.1 of School Specialty, Inc.’s Current Report on Form 8-K dated April 28, 2014. | |
| 10.11* | Stock Option Agreement dated April 24, 2014 between Joseph M. Yorio and School Specialty, Inc., incorporated herein by reference to Exhibit 10.2 of School Specialty, Inc.’s Current Report on Form 8-K dated April 28, 2014. | |
| Exhibit |
Document Description | |
| 10.12* | 2014 Incentive Plan, incorporated by reference to Exhibit 10.3 of School Specialty’s Current Report on Form 8-K dated April 28, 2014. | |
| 10.13* | Form of Executive Stock Option Agreement, incorporated by reference to Exhibit 10.1 of School Specialty’s Current Report on Form 8-K dated May 27, 2014. | |
| 10.14* | Form of Director Stock Appreciation Right Agreement, incorporated by reference to Exhibit 10.1 of School Specialty’s Current Report on Form 8-K dated May 29, 2014. | |
| 10.15 | Severance Agreement between School Specialty, Inc. and Patrick Collins, dated December 1, 2014, incorporated by reference to Exhibit 10.1 of School Specialty, Inc.’s Current Report on Form 8-K dated December 1, 2014. | |
| 10.16 | Severance Agreement between School Specialty, Inc. and Richard Holden, dated December 19, 2014 (incorporated by reference to Exhibit 10.1 of School Specialty, Inc.’s Current Report on Form 8-K dated December 19, 2014. | |
| 10.17 | First Amendment, Consent and Limited Waiver to Loan Agreement among School Specialty, Inc., and certain of its subsidiaries, Bank of America, N.A., SunTrust Bank and Bank of Montreal, as lenders, and Bank of America, N.A. as agent for the lender, incorporated by reference to Exhibit 10.1 of School Specialty, Inc.’s Current Report on Form 8-K dated October 31, 2014. | |
| 10.18 | Amendment No. 1 to the Credit Agreement, dated June 11, 2013, among School Specialty, Inc., the lenders party thereto, and Credit Suisse AG, as Administrative Agent and Collateral Agent for the lender, incorporated herein by reference to Exhibit 10.2 of School Specialty, Inc.’s Current Report on Form 8-K dated October 31, 2014. | |
| 10.19 | Employment Agreement between School Specialty, Inc. and Ryan Bohr, dated as of October 27, 2014, incorporated herein by reference to Exhibit 10.1 of School Specialty, Inc.’s Current Report on Form 8-K dated October 27, 2014. | |
| 10.20 | Stock Option Agreement by and between School Specialty, Inc. and Ryan Bohr, dated as of October 27, 2014, incorporated herein by reference to Exhibit 10.2 of School Specialty, Inc.’s Current Report on Form 8-K dated October 27, 2014. | |
| 10.21 | Management Incentive Plan for Fiscal 2015, incorporated herein by reference to Exhibit 10.3 of School Specialty, Inc.’s Current Report on Form 8-K dated October 27, 2014. | |
| 10.22 | Employment Agreement between School Specialty, Inc. and Edward J. Carr, Jr. dated January 19, 2015, incorporated herein by reference to Exhibit 10.8 of School Specialty, Inc.’s Quarterly Report on Form 10-Q dated October 27, 2014. | |
| 10.23 | Stock Option Agreement by and between School Specialty, Inc. and Edward J. Carr, Jr. dated January 19, 2015, incorporated herein by reference to Exhibit 10.9 of School Specialty, Inc.’s Quarterly Report on Form 10-Q dated October 27, 2014. | |
| 14.1 | School Specialty, Inc. Code of Business Conduct/Ethics dated February 17, 2004, incorporated herein by reference to Exhibit 14.1 of School Specialty, Inc.’s Annual Report on Form 10-K for the period ended April 24, 2004. | |
| 21.1 | Subsidiaries of School Specialty, Inc. | |
| 23.1 | Consent of Deloitte & Touche LLP | |
| 31.1 | Rule13a-14(a)/15d-14(a) Certification, by Chief Executive Officer. | |
| 31.2 | Rule13a-14(a)/15d-14(a) Certification, by Chief Financial Officer. | |
| 32.1 | Section 1350 Certification by Chief Executive Officer. | |
| 32.2 | Section 1350 Certification by Chief Financial Officer. | |
| Exhibit |
Document Description | |
| 99.1 | Schedule II—Valuation and Qualifying Accounts. | |
| 101 | The following materials from School Specialty, Inc.’s Annual Report on Form 10-K for the year ended April 25, 2015 are filed herewith, formatted in XBRL (Extensive Business Reporting Language): (i) the Consolidated Balance Sheets, (ii) the Consolidated Statement of Operations, (iii) the Consolidated Statement of Comprehensive Income (Loss), (iv) the Consolidated Statements of Stockholders’ Equity (Deficit), (v) the Consolidated Statement of Cash Flows, and (vi) Notes to Consolidated Financial Statements, tagged as blocks of text. | |
| * | Management contract or compensatory plan or arrangement. |