Attached files
| file | filename |
|---|---|
| 8-K - FORM 8-K - ONE Group Hospitality, Inc. | v415164_8k.htm |
| EX-99.1 - EXHIBIT 99.1 - ONE Group Hospitality, Inc. | v415164_ex99-1.htm |
Exhibit 99.2

INVESTOR PRESENTATION EXECUTIVE SUMMARY MAY 2015july

Confidential Information This presentation contains confidential, sensitive or proprietary information . By accepting this presentation, the recipient agrees to treat this presentation and the information contained herein or delivered in connection herewith in a confidential manner in accordance with the existing agreements between ONE Group Hospitality, Inc . (the “Company”) and the recipient governing, among other things, the treatment of confidential information provided by the Company to the recipient . In the event no such existing agreement exists, the recipient agrees to use reasonable precautions in accordance with its established procedures to keep this presentation and the information contained herein or delivered in connection herewith confidential . The financial and operational results of SBE Entertainment Group included in this presentation are preliminary and subject to the completion of financial closing procedures, final adjustments and other developments which may arise between now and the time the financial results for the periods described herein are finalized . Therefore, actual results may differ materially from these estimates . Actual results and final terms of the transaction will be set forth in the prospectus supplement relating to the offering, if applicable . Forward - Looking Statements In addition to historical information, this presentation contains statements relating to the Company’s future business and financial performance and future events or developments that may constitute “forward - looking statements” within the meaning of the “safe harbor” provisions of the United States Private Securities Litigation Reform Act of 1995 . These statements are based on current expectations and assumptions that are subject to certain risks and uncertainties . These statements include forward - looking statements with respect to the Company’s business and industry in general . Statements that include the words “expect,” “intend,” “plan,” “believe,” “project,” “forecast,” “estimate,” “may,” “should,” “anticipate” and similar statements of a future or forward - looking nature identify forward - looking statements for purposes of the federal securities laws or otherwise . A variety of factors, many of which are beyond the Company’s control, affect the Company’s operations, performance, business strategies and results and there can be no assurance that the Company’s actual results will not differ materially from those indicated in these statements . These factors include, but are not limited to, continued compliance with governmental regulation, the ability to manage growth, requirements or changes affecting the business in which the Company is engaged, general economic and business conditions and the Company’s ability to open new restaurants and food and beverage locations in current and additional markets . More detailed information about these factors may be found in the Company’s filings with the Securities and Exchange Commission, including its Annual Report on Form 10 - K/A for the year ended December 31 , 2014 . The statements made herein speak only as of the date of this presentation . The Company undertakes no obligation to update its forward - looking statements to reflect events or circumstances after the date of this presentation . Non - GAAP Financial Measures This presentation contains certain non - GAAP financial measures. A “non - GAAP financial measure” is defined as a numerical measure of a company’s financial performance that excludes or includes amounts so as to be different than the most directly comparable measure calculated and pre sented in accordance with GAAP in the statements of income, balance sheets or statements of cash flow of the Company. These measures are presented beca use management uses this information to monitor and evaluate financial results and trends and believes this information to also be useful for investor s. The Company has both wholly - owned and partially - owned subsidiaries. Total food and beverage sales at owned and managed units represents our total revenue from our owned operations as well as the sales reported to us by the owners of locations we manage, where we earn management and incentive fees. EBITDA is define d a s net income before interest expense, provision for income taxes and depreciation and amortization. Adjusted EBITDA represents net income before interest exp ense, provision for income taxes, depreciation and amortization, non - cash impairment loss, deferred rent, pre - opening expenses, non - recurring gains and los ses and losses from discontinued operations. Adjusted Net Income represents net income before loss from discontinued operations, non - recurring gain s, non - cash impairment losses, and non - recurring acceleration of depreciation. The disclosure of EBITDA, Adjusted EBITDA and Adjusted Net Income and other non - GAAP financial measures may not be comparable to similarly titled measures reported by other companies. EBITDA, Adjusted EBITDA and Adjusted Net Inco me should be considered in addition to, and not as a substitute, or superior to, net income, operating income, cash flows, revenue, or other measures of fi nancial performance prepared in accordance with GAAP. For a reconciliation of total food and beverage sales at owned and managed units, EBITDA, Adjusted EBIT DA and Adjusted Net Income to the most directly comparable financial measures presented in accordance with GAAP and a discussion of why we consider them us eful, see the Appendix to this presentation. Cautionary Statements 1

We are a global hospitality company that develops and operates upscale, high - energy restaurants and turn - key food & beverage services for hospitality venues including hotels , casinos and other high end locations Our clients and partners are leading entertainment and hospitality companies, including Disney, Starwood and Melia Hotels The ONE Group 2

Our Company Owned Restaurants Primary restaurant brand is STK ─ Launched in NYC in 2006 ─ Upscale, high - energy steakhouse concept ─ 11 locations in operation or under construction in the US and Europe Created an under brand, STK Rebel, utilizing same successful concept with a b roader menu priced to appeal to a wider market and to lunch business Other high - energy restaurant brands we utilize for our owned restaurant venues include Cucina Asellina, offering Italian cuisine and Bagatelle, a French bistro Hospitality Services Unique opportunity to leverage restaurant and hospitality expertise Manage F&B for hotels, casinos, hospitality venues Utilize company - branded restaurants or tailored concepts Target high margin management and incentive fee income with minimal capital expenditure Build long - term relationships with globally recognized hotel and casino brands Target opportunities generating a minimum of $ 10 million in food & beverage sales Seven (1) hospitality venues in operation or under construction Key Points Founded in 2004 and headquartered in New York City, with additional office in London Diverse portfolio of global restaurant brands that have strong presences in markets that amplify brand globally We also offer turn - key food and beverage services that can be scaled and implemented by us at a particular hospitality venue that are customized to suit our clients’ needs Our International Footprint ME Hotel – Miami Gansevoort – Park Ave, NY Hippodrome Casino – London ME Hotel – London Corporate & Regional Office STK Hospitality Services The Cosmopolitan – Las Vegas ME Hotel – Milan The W Hotel – Los Angeles Financial Snapshot Sales at owned and managed units: $132.2mm GAAP Revenue: $49.3mm ─ Owned unit revenue: $40.5mm ─ Management and incentive fees : $8.8mm EBITDA : $7.8mm STK Unit Economics: ─ $11.6mm AUV ─ 24% r estaurant l evel EBITDA margins ─ 50+% cash on cash returns (1) Six F&B hospitality programs are under managed deals while The W Hotel in Los Angeles is a leased deal. 3
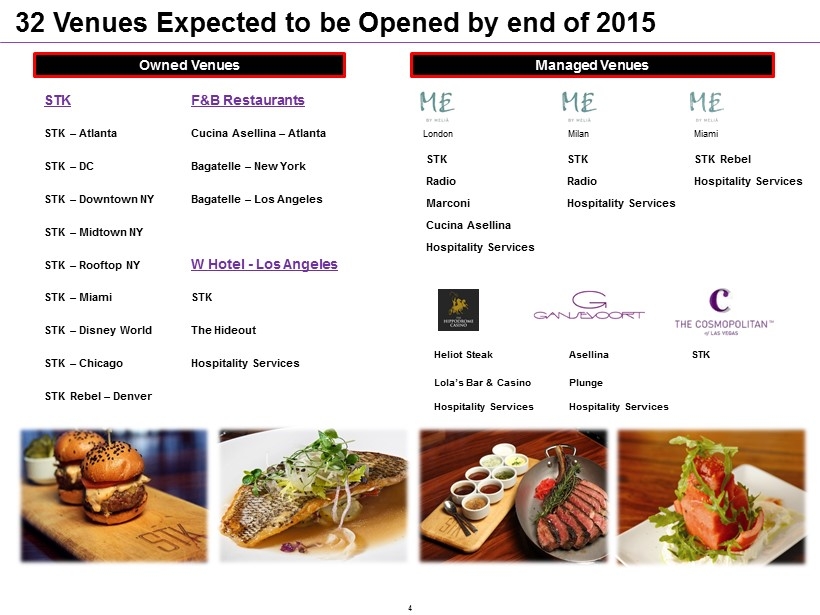
STK F &B Restaurants STK – Atlanta Cucina Asellina – Atlanta STK – DC Bagatelle – New York STK – Downtown NY Bagatelle – Los Angeles STK – Midtown NY STK – Rooftop NY W Hotel - Los Angeles STK – Miami STK STK – Disney World The Hideout STK – Chicago Hospitality Services STK Rebel – Denver 32 Venues Expected to be Opened by end of 2015 London Owned Venues Managed Venues Milan Heliot Steak Asellina STK Lola’s Bar & Casino Plunge Hospitality Services Hospitality Services Miami STK STK STK Rebel Radio Radio Hospitality Services Marconi Hospitality Services Cucina Asellina Hospitality Services 4

Transaction Overview The ONE Group Hospitality, Inc. (“TOG” or the “Company”) is in negotiations to acquire the Katsuya and Cleo restaurant assets from SBE Entertainment Group, the holding company of SLS Hotels, for a proposed cash purchase price of $75 million Katsuya and Cleo are upscale casual, full - service high - energy restaurant concepts with a focus on Sushi / Asian Fusion and Mediterranean cuisines, respectively - Complementary to TOG’s leading high energy steakhouse concept, STK The proposed acquisition will provide the Company with a meaningful increase in scale and geographic diversity, complementary restaurant brands to expand independently in major worldwide cities as well as the ability to offer an increased portfolio of internationally recognized brands to its hospitality partners We believe the transaction will enhance profitability by leveraging recent G&A investments and providing significant EPS accretion On a Pro Forma basis for the transaction for the year ending December 31, 2014, TOG would have generated ~$77.7* million in GAAP revenue (1) and ~$15.0* million in Adjusted EBITDA (2) The transaction will be financed with debt and equity capital, which we expect will be comprised of: ─ $50 million of common equity ─ $37 million 1 st Lien Term Loan Credit Facility ─ $10 million Revolving Credit Facility (undrawn at close) Pro Forma for the transaction, the Company’s total leverage will be ~3.0x on ~$15.0* million of 2014 Adjusted EBITDA (1) GAAP revenue comprised of owned net unit revenues, management and incentive fee r evenue and licensing fees. (2) Adjusted EBITDA, a non - GAAP measure, represents net income before interest expense, provision for income taxes, depreciation and amortization, non - cash impairment loss, deferred rent, pre - opening expenses, non - recurring gains and losses, stock based compensation and losses from discontinued operations. * Indicates all or portion of number is from SBE internal financials and is in the process of being audited . 5

Additional Avenues for Future Growth for Standalone & Hospitality Contracts Established High Volume & Profitable Brands Significantly Increases Venue Base with No Incremental Development Required Increases Footprint in Existing Cities and Provides Operational Economies of Scale Diversifies F&B Hospitality Offering Provides Additional Global Opportunities to Expand ONE Group Brands Ability to Leverage E xisting G&A and Enhance Profitability Complementary Leading Brands and Hospitality Concepts Katsuya / Cleo Acquisition Rationale 6

Internationally Recognized Restaurant Brands Established Globally Complementary Offerings High - Energy Restaurants High Quality High Volume High Margin 7

Key Points STK is a reinvention of the traditional steakhouse High - energy dining experience Restaurants built around the bar, featuring DJ played music High female to male customer mix Destination location where guests can utilize our restaurant in multiple ways ─ Main and private dining rooms, bars, lounges, rooftops Superior quality of a traditional steakhouse while featuring an innovative menu Designed for Primary Cities STK Rebel ─ STK under brand that maintains unique features, atmosphere and energy ─ Broader menu priced to appeal to a wider market ─ Open for lunch and dinner ─ Designed for Primary & Secondary cities STK: Differentiated Steakhouse with High - Energy & Great Atmosphere 8
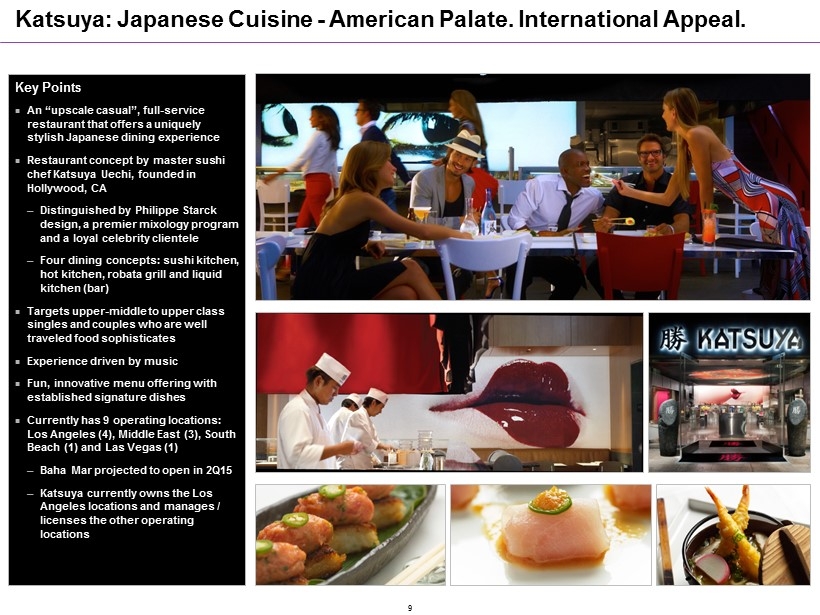
Katsuya: Japanese Cuisine - American Palate. International Appeal. Key Points An “upscale casual”, full - service restaurant that offers a uniquely stylish Japanese dining experience Restaurant concept by master sushi chef Katsuya Uechi , founded in Hollywood, CA ─ Distinguished by Philippe Starck design, a premier mixology program and a loyal celebrity clientele ─ Four dining concepts: sushi kitchen, hot kitchen, robata grill and liquid kitchen (bar) Targets upper - middle to upper class singles and couples who are well traveled food sophisticates Experience driven by music Fun , innovative menu offering with established signature dishes Currently has 9 operating locations: Los Angeles (4), Middle East (3), South Beach (1 ) and Las Vegas (1 ) ─ Baha Mar projected to open in 2Q15 ─ Katsuya currently owns the Los Angeles locations and manages / licenses the other operating locations 9

Cleo Overview: Energized Ambience, People and Food Key Points Cleo is an “upscale casual”, full - service restaurant that offers a uniquely stylish Mediterranean dining experience Created for stand alone and hotel operations Three meal a day dining concept Created by award winning Chef Danny Elmaleh Lively atmosphere, with its flagship location at the Redbury Hotel, one of the most coveted hotels in Hollywood Currently has 3 operating locations: South Beach, Hollywood and Las Vegas ─ Baha Mar projected to open in 2Q15 10

46 Venues Expected to be Opened by end of 2015 Note: Hospitality F&B refers to F&B restaurants, rooftops, pools, bars and hospitality F&B services. STK Katsuya F &B Restaurants STK – Atlanta Brentwood, LA Cucina Asellina – Atlanta STK – DC Downtown, LA Bagatelle – New York STK – Downtown NY Hollywood, LA Bagatelle – Los Angeles STK – Midtown NY Glendale, LA W Hotel - Los Angeles STK – Rooftop NY STK STK – Miami The Hideout STK – Disney World Hospitality Services STK – Chicago STK Rebel – Denver Owned Venues Managed / Licensed Venues STK Cucina Asellina STK STK Rebel Radio Hospitality Services Radio Hospitality Services Marconi Hospitality Services Heliot Steak Asellina STK Lola’s Bar & Casino Plunge Hospitality Services Hospitality Services Cleo Cleo ME - London ME - Milan ME - Miami Hippodrome Gansevoort Cosmopolitan Redbury - Hollywood Redbury - South Beach Cleo Cleo Katsuya SLS - Las Vegas SLS - South Beach Middle East (Arabella, Dubai, Kuwait) Katsuya Cleo Katsuya - Alshaya License SLS - Baha Mar 11

A Leading Hospitality Company – ONE Hospitality™ Note: Bagatelle, Gansevoort Park Rooftop, Marconi, Radio M, Asellina , Cucina Asellina , Cleo and Heliot are jointly owned and / or licensed brands. and / or licensed brands . Comprehensive Portfolio of Internationally Recognized Brands Growing List of Global Hospitality Clients 12

Alshaya Partnership With Leading Global Brands Headquartered in Kuwait with 125 year operating history Multinational retail franchise operator with 2,800+ stores Proven ability to activate brands globally with partnerships with over 70 consumer and retail brands across the Middle East, North Africa and Europe ─ Sectors of focus are: Fashion & Footwear, Food, Health & Beauty, Pharmacy, Optics, Home Furnishings and Leisure & Entertainment Alshaya’s reach and reputation provide a leading partner to further expand our brands internationally Significant International Footprint 13

Multiple Avenues for Future Growth Owned STK : Opportunity to open up to 50 STK restaurants globally Targeting 2 - 3 STK restaurants per year, short - term STK Rebel : Opportunity to open at least 100 STK Rebel restaurants globally Targeting 1 - 2 STK Rebel restaurants per year, short - term Katsuya : Ability to put Katsuya in any STK city Targeting 1 - 2 Katsuya restaurants per year, short - term Hospitality Hospitality Management Agreements : Opportunity for at least 50 hospitality management agreements globally, 2 - 3 per city Targeting 1 - 2 hospitality management agreements per year, short - term SLS Hotels to provide opportunities for inclusion of at least 10 ONE Group restaurant concepts in its hotels over the next 5 years Licensed Licensing Deals : Contracted with Alshaya in the Middle East for 10 years for multiple restaurants Currently three Katsuya restaurants operating in the Middle East Development Agreement to open 14 additional Middle East locations over the next 5 years Exploring additional licenses for other ONE Group brands in the Middle East ~$67* million Pro Forma Sales at Owned Units ~$106* million Pro Forma Sales at Managed Units ~$15* million Pro Forma Sales at Licensed Units Note: Sales at owned and managed units pro forma FYE 12/31/2014 and include sales at licensed units, as applicable. * Indicates all or portion of number is from SBE internal financials and is in the process of being audited. 14

Purchase of Katsuya / Cleo Pro Forma Capitalization Note: Sources and Uses and Pro Forma Capitalization subject to post - closing adjustments. (1) Economic share of management, incentive and other fees. * Indicates all or portion of number is from SBE internal financials and is in the process of being audited. ($Millions) Key Proposed Deal Terms Cash purchase price of $75 million ─ Additional 200,000 TOG warrants exercise price of $5.00 per share Acquiring 14 restaurants ( 12 operating, 2 under construction - fully funded) ─ 9 Katsuya restaurants operating (4 owned, 2 managed, 3 licensed ) ─ Alshaya Development Agreement to produce 14 more licensed Middle East locations over the next 5 years ─ 3 managed Cleo restaurants operating ─ Katsuya and Cleo restaurants in SLS Baha Mar, projected to open in 2Q 2015 SLS Hotels to provide opportunities for inclusion of at least 10 ONE Group restaurant concepts in its hotels over the next 5 years ─ TOG receives 2/3 of all fees for new restaurants in hotels Key Economic Terms for Managed Units (1) Existing ─ Katsuya : 100 % to TOG ─ Cleo: 2/3 to TOG Future ─ Katsuya : 100% to TOG ─ Cleo: 60% to TOG ─ Katsuya SLS Lux Brickell : 50% to TOG Katsuya Baha Mar economic terms yet to be agreed upon Pro Forma Sources and Uses * Sources Uses Equity Proceeds $50.0 Debt Proceeds 45.0 Total Sources $95.0 Uses Purchase of Katsuya / Cleo $75.0 Growth Capital 7.9 Repay Existing Debt 7.1 Fees and Expenses 5.0 Total Uses $95.0 3/31/2015 Pro Forma Cash and Cash Equivalents $4.5 $12.4 Debt Existing Term Loan 7.1 - New Revolving Credit Facility - - New Term Loan - 45.0 Total Debt $7.1 $45.0 LTM 12/31/14 Adjusted EBITDA $7.8 $15.0 Total Leverage 0.9x 3.0x 15

Ability to Leverage G&A and Enhance Profitability Growth (12) Public Company (4) ▪ Chief Operating Officer ▪ Director of SEC Reporting ▪ VP Restaurant Operations ▪ General Counsel ▪ Directors of Operations (4) ▪ Support Staff (2) ▪ Senior Managers (2) ▪ Operational Support Staff (4) Acquire highly profitable restaurant brands Ability to leverage existing infrastructure with minimal incremental G&A required Katsuya and Cleo profitability accrues to bottom line Recent G&A Investments TOG Pro Forma P&L Acquisition is Highly Margin & EPS Accretive * Indicates all or portion of number is from SBE internal financials and is in the process of being audited. FY 2014A FY 2016P STKS Katsuya / Cleo Pro Forma Adjusted EBITDA to TOG $7.8 $7.2 $15.0 % Margin 15.8% 25.5% 19.3% D&A (1.4) (1.4) (2.8) 0.0 0.0 0.0 Net Interest Expense (0.1) (2.7) (2.8) 0 0 0.0 Provision from Taxes (0.8) (0.9) (1.8) Adj. Net Income (Loss) from Continuing Ops 2.0 2.2 4.2 Less: NCI (0.5) (0.5) Adj. Net Income (Loss) to The ONE Group $1.5 $3.7 Diluted Shares Outstanding 24.9 10.0 34.9 EPS $0.06 $0.11 Accretion / (Dilution) $0.05 % Accretion / (Dilution) 76.0% * * 16

($Millions) GAAP Revenue Total Food & Beverage Sales at Owned & Managed Units (1) Note: Pro Forma numbers also include sales at licensed locations and licensing fees. (1) See Appendix for a reconciliation of Total Food & Beverage Sales at Owned and Managed Units. (2) STK same store sales refers to Total Food & Beverage Sales at owned and managed STK units that have been open 18 months as of th at date, a non - GAAP measure, which represents our total revenue from our owned STK operations as well as the sales reported to us by the owners of STK locations we manage, where we earn our re venue from management and incentive fees. (3) Katsuya same store sales refers to Total Food & Beverage Sales at owned units that have been open 18 months as of that date. * Indicates all or portion of number is from SBE internal financials and is in the process of being audited. STK SSS (2) (0.2%) 11.1% 10.8% (0.7%) 5.0% NA Katsuya SSS (3) (4.6%) (1.3%) 1.2% 4.0% 1.9% NA Management & Incentive Fee Revenue $41.5 $81.0 $107.2 $126.2 $132.2 $188.8 $0 $40 $80 $120 $160 $200 2010 2011 2012 2013 2014 Pro Forma $38.7 $46.1 $60.1 $43.9 $49.3 $77.7 $0 $10 $20 $30 $40 $50 $60 $70 $80 $90 2010 2011 2012 2013 2014 Pro Forma $0.2 $2.4 $3.7 $7.3 $8.8 $10.3 $0 $2 $4 $6 $8 $10 $12 2010 2011 2012 2013 2014 Pro Forma Strong Revenue Performance * * * 17

TOG Adjusted Net Income (1) TOG Adjusted EBITDA (1) (1) See Appendix for definition of Adjusted EBITDA and Adjusted Net Income and for reconciliation to GAAP Net Income (Loss). * Indicates all or portion of number is from SBE internal financials and is in the process of being audited. Adjusted EBITDA and Adjusted Net Income ($Millions) $3.3 $5.2 $6.7 $7.8 $7.8 $15.0 $0 $5 $10 $15 $20 2010 2011 2012 2013 2014 Pro Forma $0.5 $1.6 $6.1 $4.4 $1.5 $3.7 $0 $2 $4 $6 $8 $10 2010 2011 2012 2013 2014 Pro Forma * * 18

TARGETED STK Rebel Katsuya F&B Hospitality Owned Units Owned Units Owned Units Managed Units Revenue $9.0 mil $5.0 mil $7.2 mil -- EBITDA $2.0 mil $1.0 mil $1.8 mil -- Average Cash Investment $3.8 mil (2) $2.5 mil (2) $5.2 mil (3) <$500,000 ROI 53% 40% 35% -- Management Fees -- -- -- 5.0% to 6.5% Incentive Fees -- -- -- >15% Management & Incentive Fee Revenues -- -- -- >$500,000 Average Check $115 $55 $65 -- Square Feet 9,500 6,000 9,500 -- (1) Represents sales growth at owned units that have been open for 18 months (and excludes units closed for significant perio ds) . n (2) Excludes preopening expenses and net of tenant improvement allowances. N (3) Excludes preopening expenses. Comp Store Base (Owned Units) Same Store Sales Growth (1) 2% to 3% Food & Beverage Costs 26.0% to 26.5% Unit Operating Expense 57% to 58% Targeted Unit Economics STK KATSUYA Comp Store Base (Owned Units) Same Store Sales Growth (1) 0% to 1% Food & Beverage Costs 22.0% to 23.0% Unit Operating Expense 53% to 54% 19

20

APPENDIX 21

Average Unit Volume (AUV) (Data as of FYE 2014) Sources: Company filings, investor presentations and equity research. Notes: STK figures represent the average results from STK’s open for at least one year: STK – Downtown (including Rooftop), STK – LA, STK – Las Vegas, STK – Midtown and STK – Atlanta. 2014 STK Restaurant - Level EBITDA margin, a non - GAAP figure, excludes corporate expenses and deferred rent. Katsuya figures represent the average results for owned restaurants: Brentwood, Hollywood and Downtown. Does not include Katsuya Glendale because location is not indicative of typical Katsuya restaurant concept. Cleo figures represent Cleo Hollywood location, which was only location open for at least one year. Average Check 2014 Restaurant - Level EBITDA Margin $125 $110 $76 $68 $62 $60 $51 $0 $30 $60 $90 $120 $150 Unique Guest Experience Drives Strong Performance Sales per Square Foot $1,160 $1,070 $851 $770 $760 $567 $478 $0 $250 $500 $750 $1,000 $1,250 $14.9 $11.6 $7.5 $5.7 $5.1 $5.0 $4.3 $0 $3 $6 $9 $12 $15 $18 ($Millions) Average Sq. Ft. 10,000 9,700 7,500 9,000 9,000 28.4% 26.0% 24.1% 18.3% 17.4% 16.6% 15.1% 0% 5% 10% 15% 20% 25% 30% 17,500 4,700 22
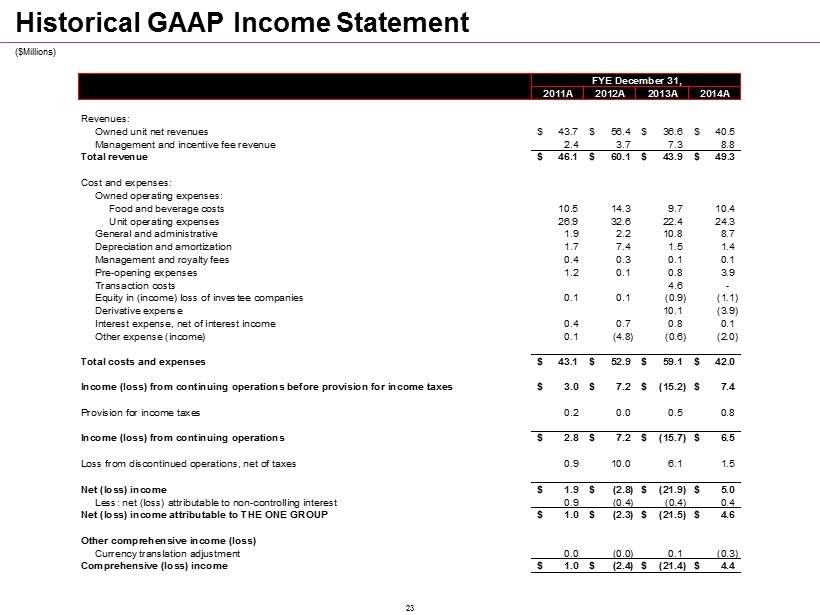
($ Millions ) Historical GAAP Income Statement FYE December 31, 2011A 2012A 2013A 2014A Revenues: Owned unit net revenues 43.7$ 56.4$ 36.6$ 40.5$ Management and incentive fee revenue 2.4 3.7 7.3 8.8 Total revenue 46.1$ 60.1$ 43.9$ 49.3$ Cost and expenses: Owned operating expenses: Food and beverage costs 10.5 14.3 9.7 10.4 Unit operating expenses 26.9 32.6 22.4 24.3 General and administrative 1.9 2.2 10.8 8.7 Depreciation and amortization 1.7 7.4 1.5 1.4 Management and royalty fees 0.4 0.3 0.1 0.1 Pre-opening expenses 1.2 0.1 0.8 3.9 Transaction costs 4.6 - Equity in (income) loss of investee companies 0.1 0.1 (0.9) (1.1) Derivative expense 10.1 (3.9) Interest expense, net of interest income 0.4 0.7 0.8 0.1 Other expense (income) 0.1 (4.8) (0.6) (2.0) Total costs and expenses 43.1$ 52.9$ 59.1$ 42.0$ Income (loss) from continuing operations before provision for income taxes 3.0$ 7.2$ (15.2)$ 7.4$ Provision for income taxes 0.2 0.0 0.5 0.8 Income (loss) from continuing operations 2.8$ 7.2$ (15.7)$ 6.5$ Loss from discontinued operations, net of taxes 0.9 10.0 6.1 1.5 Net (loss) income 1.9$ (2.8)$ (21.9)$ 5.0$ Less: net (loss) attributable to non-controlling interest 0.9 (0.4) (0.4) 0.4 Net (loss) income attributable to THE ONE GROUP 1.0$ (2.3)$ (21.5)$ 4.6$ Other comprehensive income (loss) Currency translation adjustment 0.0 (0.0) 0.1 (0.3) Comprehensive (loss) income 1.0$ (2.4)$ (21.4)$ 4.4$ 23
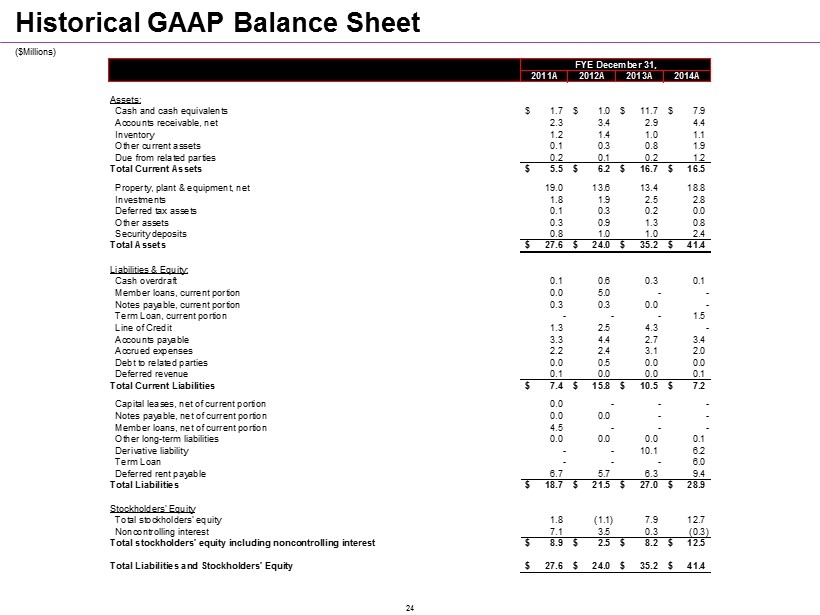
($ Millions ) Historical GAAP Balance Sheet FYE December 31, 2011A 2012A 2013A 2014A Assets: Cash and cash equivalents 1.7$ 1.0$ 11.7$ 7.9$ Accounts receivable, net 2.3 3.4 2.9 4.4 Inventory 1.2 1.4 1.0 1.1 Other current assets 0.1 0.3 0.8 1.9 Due from related parties 0.2 0.1 0.2 1.2 Total Current Assets 5.5$ 6.2$ 16.7$ 16.5$ Property, plant & equipment, net 19.0 13.6 13.4 18.8 Investments 1.8 1.9 2.5 2.8 Deferred tax assets 0.1 0.3 0.2 0.0 Other assets 0.3 0.9 1.3 0.8 Security deposits 0.8 1.0 1.0 2.4 Total Assets 27.6$ 24.0$ 35.2$ 41.4$ Liabilities & Equity: Cash overdraft 0.1 0.6 0.3 0.1 Member loans, current portion 0.0 5.0 - - Notes payable, current portion 0.3 0.3 0.0 - Term Loan, current portion - - - 1.5 Line of Credit 1.3 2.5 4.3 - Accounts payable 3.3 4.4 2.7 3.4 Accrued expenses 2.2 2.4 3.1 2.0 Debt to related parties 0.0 0.5 0.0 0.0 Deferred revenue 0.1 0.0 0.0 0.1 Total Current Liabilities 7.4$ 15.8$ 10.5$ 7.2$ Capital leases, net of current portion 0.0 - - - Notes payable, net of current portion 0.0 0.0 - - Member loans, net of current portion 4.5 - - - Other long-term liabilities 0.0 0.0 0.0 0.1 Derivative liability - - 10.1 6.2 Term Loan - - - 6.0 Deferred rent payable 6.7 5.7 6.3 9.4 Total Liabilities 18.7$ 21.5$ 27.0$ 28.9$ Stockholders' Equity Total stockholders' equity 1.8 (1.1) 7.9 12.7 Noncontrolling interest 7.1 3.5 0.3 (0.3) Total stockholders' equity including noncontrolling interest 8.9$ 2.5$ 8.2$ 12.5$ Total Liabilities and Stockholders' Equity 27.6$ 24.0$ 35.2$ 41.4$ 24
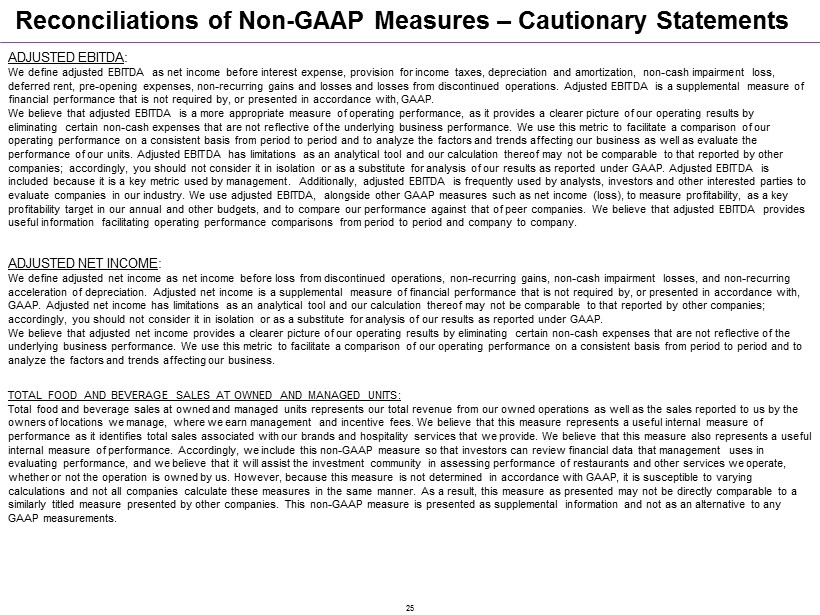
ADJUSTED EBITDA : We define adjusted EBITDA as net income before interest expense, provision for income taxes, depreciation and amortization, n on - cash impairment loss, deferred rent, pre - opening expenses, non - recurring gains and losses and losses from discontinued operations. Adjusted EBITDA is a supplemental measure of financial performance that is not required by, or presented in accordance with, GAAP. We believe that adjusted EBITDA is a more appropriate measure of operating performance, as it provides a clearer picture of o ur operating results by eliminating certain non - cash expenses that are not reflective of the underlying business performance. We use this metric to faci litate a comparison of our operating performance on a consistent basis from period to period and to analyze the factors and trends affecting our busines s a s well as evaluate the performance of our units. Adjusted EBITDA has limitations as an analytical tool and our calculation thereof may not be compar abl e to that reported by other companies; accordingly, you should not consider it in isolation or as a substitute for analysis of our results as reported un der GAAP. Adjusted EBITDA is included because it is a key metric used by management. Additionally, adjusted EBITDA is frequently used by analysts, investo rs and other interested parties to evaluate companies in our industry. We use adjusted EBITDA, alongside other GAAP measures such as net income (loss), to measu re profitability, as a key profitability target in our annual and other budgets, and to compare our performance against that of peer companies. We belie ve that adjusted EBITDA provides useful information facilitating operating performance comparisons from period to period and company to company. ADJUSTED NET INCOME : We define adjusted net income as net income before loss from discontinued operations, non - recurring gains, non - cash impairment l osses, and non - recurring acceleration of depreciation. Adjusted net income is a supplemental measure of financial performance that is not required by, or presented in accordance with, GAAP. Adjusted net income has limitations as an analytical tool and our calculation thereof may not be comparable to that rep ort ed by other companies; accordingly, you should not consider it in isolation or as a substitute for analysis of our results as reported under GAAP. We believe that adjusted net income provides a clearer picture of our operating results by eliminating certain non - cash expenses that are not reflective of the underlying business performance. We use this metric to facilitate a comparison of our operating performance on a consistent b asi s from period to period and to analyze the factors and trends affecting our business. TOTAL FOOD AND BEVERAGE SALES AT OWNED AND MANAGED UNITS: Total food and beverage sales at owned and managed units represents our total revenue from our owned operations as well as th e s ales reported to us by the owners of locations we manage, where we earn management and incentive fees. We believe that this measure represents a useful int ernal measure of performance as it identifies total sales associated with our brands and hospitality services that we provide. We believe that th is measure also represents a useful internal measure of performance. Accordingly, we include this non - GAAP measure so that investors can review financial data that management uses in evaluating performance, and we believe that it will assist the investment community in assessing performance of restaurants a nd other services we operate, whether or not the operation is owned by us. However, because this measure is not determined in accordance with GAAP, it is s usc eptible to varying calculations and not all companies calculate these measures in the same manner. As a result, this measure as presented may no t b e directly comparable to a similarly titled measure presented by other companies. This non - GAAP measure is presented as supplemental information and not as an alternative to any GAAP measurements. Reconciliations of Non - GAAP Measures – Cautionary Statements 25
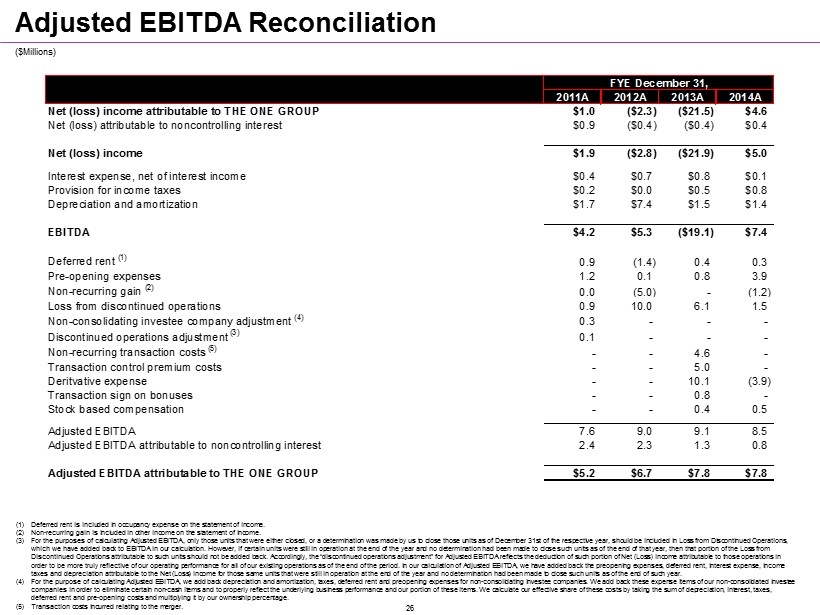
($ Millions ) (1) Deferred rent is included in occupancy expense on the statement of income. (2) Non - recurring gain is included in other income on the statement of income. (3) For the purposes of calculating Adjusted EBITDA, only those units that were either closed, or a determination was made by us to close those units as of December 31st of the respective year, should be included in Loss from Discontinued Operations, which we have added back to EBITDA in our calculation. However, if certain units were still in operation at the end of the year and no determination had been made to close such units as of the end of that year, then that portion of the Loss from Discontinued Operations attributable to such units should not be added back. Accordingly, the “discontinued operations adjustment” for Adjusted EBITDA reflects the deduction of such portion of Net (Loss) Income attributable to those operations in order to be more truly reflective of our operating performance for all of our existing operations as of the end of the period. In our calculation of Adjusted EBITDA, we have added back the preopening expenses, deferred rent, interest expense, income taxes and depreciation attributable to the Net ( Loss) Income for those same units that were still in operation at the end of the year and no determination had been made to close such units as of the end of such year . (4) For the purpose of calculating Adjusted EBITDA, we add back depreciation and amortization, taxes, deferred rent and preopening expenses for non - consolidating investee companies. We add back these expense items of our non - consolidated investee companies in order to eliminate certain non - cash items and to properly reflect the underlying business performance and our portion of these items. We calculate our effective share of these costs by taking the sum of depreciation, interest, taxes, deferred rent and pre - opening costs and multiplying it by our ownership percentage . (5) Transaction costs incurred relating to the merger. Adjusted EBITDA Reconciliation FYE December 31, 2011A 2012A 2013A 2014A Net (loss) income attributable to THE ONE GROUP $1.0 ($2.3) ($21.5) $4.6 Net (loss) attributable to noncontrolling interest $0.9 ($0.4) ($0.4) $0.4 Net (loss) income $1.9 ($2.8) ($21.9) $5.0 Interest expense, net of interest income $0.4 $0.7 $0.8 $0.1 Provision for income taxes $0.2 $0.0 $0.5 $0.8 Depreciation and amortization $1.7 $7.4 $1.5 $1.4 EBITDA $4.2 $5.3 ($19.1) $7.4 Deferred rent (1) 0.9 (1.4) 0.4 0.3 Pre-opening expenses 1.2 0.1 0.8 3.9 Non-recurring gain (2) 0.0 (5.0) - (1.2) Loss from discontinued operations 0.9 10.0 6.1 1.5 Non-consolidating investee company adjustment (4) 0.3 - - - Discontinued operations adjustment (3) 0.1 - - - Non-recurring transaction costs (5) - - 4.6 - Transaction control premium costs - - 5.0 - Deritvative expense - - 10.1 (3.9) Transaction sign on bonuses - - 0.8 - Stock based compensation - - 0.4 0.5 Adjusted EBITDA 7.6 9.0 9.1 8.5 Adjusted EBITDA attributable to noncontrolling interest 2.4 2.3 1.3 0.8 Adjusted EBITDA attributable to THE ONE GROUP $5.2 $6.7 $7.8 $7.8 26
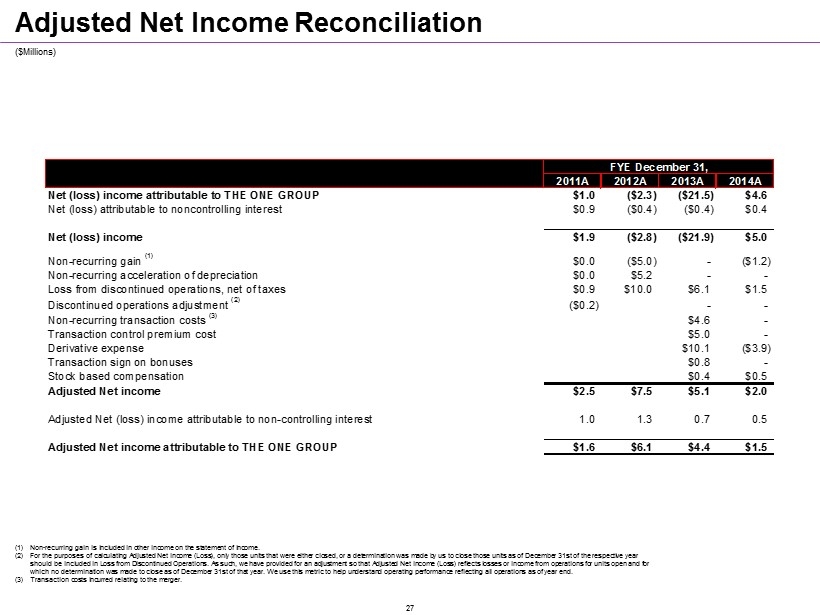
($ Millions ) (1) Non - recurring gain is included in other income on the statement of income. (2) For the purposes of calculating Adjusted Net Income (Loss), only those units that were either closed, or a determination was mad e by us to close those units as of December 31st of the respective year should be included in Loss from Discontinued Operations. As such, we have provided for an adjustment so that Adjusted Net Inc ome (Loss) reflects losses or income from operations for units open and for which no determination was made to close as of December 31st of that year. We use this metric to help understand operating performance reflecting all operations as of year end . (3) Transaction costs incurred relating to the merger. Adjusted Net Income Reconciliation FYE December 31, 2011A 2012A 2013A 2014A Net (loss) income attributable to THE ONE GROUP $1.0 ($2.3) ($21.5) $4.6 Net (loss) attributable to noncontrolling interest $0.9 ($0.4) ($0.4) $0.4 Net (loss) income $1.9 ($2.8) ($21.9) $5.0 Non-recurring gain (1) $0.0 ($5.0) - ($1.2) Non-recurring acceleration of depreciation $0.0 $5.2 - - Loss from discontinued operations, net of taxes $0.9 $10.0 $6.1 $1.5 Discontinued operations adjustment (2) ($0.2) - - Non-recurring transaction costs (3) $4.6 - Transaction control premium cost $5.0 - Derivative expense $10.1 ($3.9) Transaction sign on bonuses $0.8 - Stock based compensation $0.4 $0.5 Adjusted Net income $2.5 $7.5 $5.1 $2.0 Adjusted Net (loss) income attributable to non-controlling interest 1.0 1.3 0.7 0.5 Adjusted Net income attributable to THE ONE GROUP $1.6 $6.1 $4.4 $1.5 27
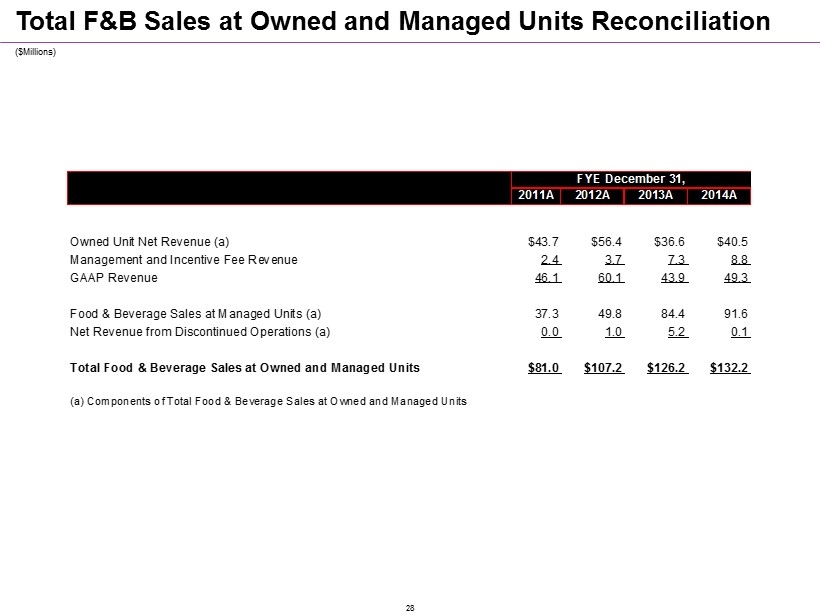
Total F&B Sales at Owned and Managed Units Reconciliation ($ Millions ) FYE December 31,2011A 2012A 2013A 2014A Owned Unit Net Revenue (a) $43.7 $56.4 $36.6 $40.5 Management and Incentive Fee Revenue 2.4 3.7 7.3 8.8 GAAP Revenue 46.1 60.1 43.9 49.3 Food & Beverage Sales at Managed Units (a) 37.3 49.8 84.4 91.6 Net Revenue from Discontinued Operations (a) 0.0 1.0 5.2 0.1 Total Food & Beverage Sales at Owned and Managed Units $81.0 $107.2 $126.2 $132.2 (a) Components of Total Food & Beverage Sales at Owned and Managed Units 28