Attached files
| file | filename |
|---|---|
| EX-10.8 - EX-10.8 - Blue Buffalo Pet Products, Inc. | d734898dex108.htm |
| EX-23.1 - EX-23.1 - Blue Buffalo Pet Products, Inc. | d734898dex231.htm |
| EX-10.4 - EX-10.4 - Blue Buffalo Pet Products, Inc. | d734898dex104.htm |
| EX-1.1 - EX-1.1 - Blue Buffalo Pet Products, Inc. | d734898dex11.htm |
| EX-10.9 - EX-10.9 - Blue Buffalo Pet Products, Inc. | d734898dex109.htm |
| EX-3.2 - EX-3.2 - Blue Buffalo Pet Products, Inc. | d734898dex32.htm |
| EX-5.1 - EX-5.1 - Blue Buffalo Pet Products, Inc. | d734898dex51.htm |
| EX-3.4 - EX-3.4 - Blue Buffalo Pet Products, Inc. | d734898dex34.htm |
| EX-10.3 - EX-10.3 - Blue Buffalo Pet Products, Inc. | d734898dex103.htm |
| EX-10.7 - EX-10.7 - Blue Buffalo Pet Products, Inc. | d734898dex107.htm |
| EX-10.10 - EX-10.10 - Blue Buffalo Pet Products, Inc. | d734898dex1010.htm |
Table of Contents
As filed with the Securities and Exchange Commission on July 8, 2015
Registration No. 333-204847
UNITED STATES
SECURITIES AND EXCHANGE COMMISSION
Washington, D.C. 20549
AMENDMENT NO. 2
TO
FORM S-1
REGISTRATION STATEMENT
UNDER
THE SECURITIES ACT OF 1933
BLUE BUFFALO PET PRODUCTS, INC.
(Exact Name of Registrant as Specified in Its Charter)
| Delaware | 2047 | 46-0552933 | ||
| (State or Other Jurisdiction of Incorporation or Organization) |
(Primary Standard Industrial Classification Code Number) | (I.R.S. Employer Identification Number) |
11 River Road
Wilton, CT 06897
(203) 762-9751
(Address, Including Zip Code, and Telephone Number, Including Area Code, of Registrant’s Principal Executive Offices)
Michael Nathenson
Chief Financial Officer
Blue Buffalo Pet Products, Inc.
11 River Road
Wilton, CT 06897
(203) 762-9751
(Name, Address, Including Zip Code, and Telephone Number, Including Area Code, of Agent For Service)
Copies to:
| Kenneth B. Wallach, Esq. Simpson Thacher & Bartlett LLP 425 Lexington Avenue New York, New York 10017 (212) 455-2000 |
Kirk A. Davenport II, Esq. Jason M. Licht, Esq. Latham & Watkins LLP 885 Third Avenue New York, New York 10022 (212) 906-1200 |
Approximate date of commencement of proposed sale to the public: As soon as practicable after the effective date of this Registration Statement.
If any of the securities being registered on this form are to be offered on a delayed or continuous basis pursuant to Rule 415 under the Securities Act of 1933, check the following box. ¨
If this form is filed to register additional securities for an offering pursuant to Rule 462(b) under the Securities Act, check the following box and list the Securities Act registration statement number of the earlier effective registration statement for the same offering. ¨
If this form is a post-effective amendment filed pursuant to Rule 462(c) under the Securities Act, check the following box and list the Securities Act registration statement number of the earlier effective registration statement for the same offering. ¨
If this form is a post-effective amendment filed pursuant to Rule 462(d) under the Securities Act, check the following box and list the Securities Act registration statement number of the earlier effective registration statement for the same offering. ¨
Indicate by check mark whether the registrant is a large accelerated filer, an accelerated filer, a non-accelerated filer, or a smaller reporting company. See the definitions of “large accelerated filer,” “accelerated filer” and “smaller reporting company” in Rule 12b-2 of the Exchange Act.
| ¨ | Large accelerated filer | ¨ | Accelerated filer | |||||
| x | Non-accelerated filer | (Do not check if a smaller reporting company) | ¨ | Smaller reporting company |
CALCULATION OF REGISTRATION FEE
|
| ||||||||
| Title of Each Class of Securities to be Registered |
Amount to be Registered(1) |
Proposed Maximum Offering Price per |
Proposed Maximum Aggregate Offering |
Amount of Registration Fee(3) | ||||
| Common Stock, $0.01 par value per share |
33,942,220 | $18.00 | $610,959,960 | $70,994 | ||||
|
| ||||||||
|
| ||||||||
| (1) | Includes 4,422,559 shares of common stock to be sold upon exercise of the underwriters’ over-allotment option to purchase additional shares. |
| (2) | Estimated solely for the purpose of calculating the registration fee pursuant to Rule 457(o) under the Securities Act of 1933, as amended. |
| (3) | The Registrant paid $58,100 of the registration fee, with respect to $500,000,000 of the proposed maximum aggregate offering price, in connection with the initial filing of this registration statement. |
The Registrant hereby amends this Registration Statement on such date or dates as may be necessary to delay its effective date until the Registrant shall file a further amendment which specifically states that this Registration Statement shall thereafter become effective in accordance with Section 8(a) of the Securities Act of 1933 or until the Registration Statement shall become effective on such date as the Commission, acting pursuant to said Section 8(a), may determine.
Table of Contents
Subject to completion, dated July 8, 2015 | Prospectus
Blue Buffalo Pet Products, Inc.
29,519,661 Shares
This is an initial public offering of common stock of Blue Buffalo Pet Products, Inc. The selling
stockholders are selling 29,483,727 shares of common stock and we will be issuing 35,934 shares
of common stock to certain non-management employees without cost to such employees. We will
not be selling any shares in this offering and will not receive any proceeds from the sale of shares by
the selling stockholders or from the issuance of shares to certain non-management employees. The
estimated initial public offering price is between $16.00 and $18.00 per share.
We have applied to have our common stock approved for listing on the NASDAQ Global Select Market
under the symbol “BUFF”.
We are an “emerging growth company” as defined by
the Jumpstart Our Business Startups Act of 2012
and, as such, we have elected to comply with certain reduced public company reporting requirements
for this prospectus and future filings.
Per Share Total
Initial public offering price $ $
Underwriting discounts and commissions (1). $ $
Proceeds to the selling stockholders, before expenses$ $
(1) Only payable with respect to the
shares to be sold by the selling stockholders. No underwriting discounts
or commissions are payable with respect to the shares to be issued to certain
non-management employees.
See “Underwriting” for additional information regarding underwriting compensation.
The selling stockholders have granted the underwriters a 30-day over-allotment option to purchase
up to an additional 4,422,559 shares of common stock.
Investing in our common stock involves a
high degree of risk. See “Risk Factors” beginning on page 18.
Neither the Securities and Exchange Commission nor any state securities commission has
approved
or disapproved of these securities or determined if this prospectus is truthful or complete. Any
representation to the contrary is a criminal offense.
The underwriters expect to deliver the
shares to purchasers on or about , 2015.
J.P. Morgan | Citigroup
Barclays |
Deutsche Bank Securities | Morgan Stanley
Wells Fargo Securities
LOYAL3
Securities
The date of this prospectus is , 2015
Love Them Like Family. Feed
Them Like Family.™
The information in this prospectus is not complete and may be changed. The selling stockholders may not sell these securities until the
registration statement filed with the Securities and
Exchange Commission is effective. This prospectus is not an offer to sell these securities, and it is not an
offer to buy these securities in any state where the offer or sale is not permitted.
Table of Contents
BLUE
OUR FOUNDER
Love them like family. Feed them like family.®
Table of Contents
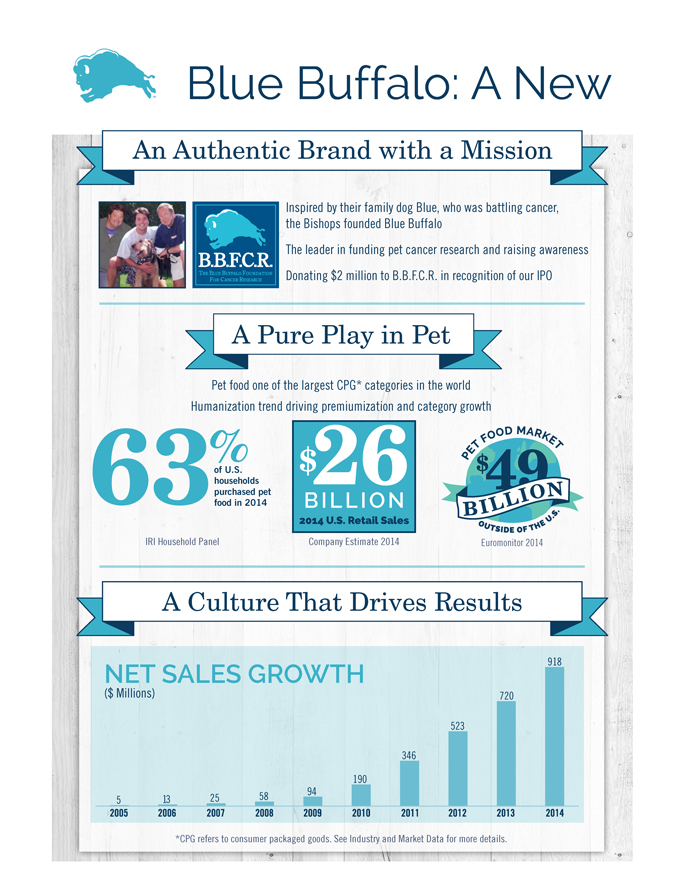
Blue Buffalo: A New
- -
A Culture That Drives Results
Inspired by their family dog Blue, who was battling cancer,
the Bishops founded Blue Buffalo
The leader in funding pet cancer research
and raising awareness
Donating $2 million to B.B.F.C.R. in recognition of our IPO
Euromonitor 2014
63%of U.S.
households
purchased pet
food in 2014
IRI Household Panel
*CPG refers to consumer packaged goods. See Industry and Market Data for more details.
A Pure
Play in Pet
Pet food one of the largest CPG* categories in the world
Humanization trend driving premiumization and category growth
5 13 25 58 94
190
346
523
720
918 NET SALES GROWTH
($ Millions)
$26 BILLION
2014 U.S. Retail Sales
Company Estimate 2014
An Authentic Brand with a Mission
Table of Contents
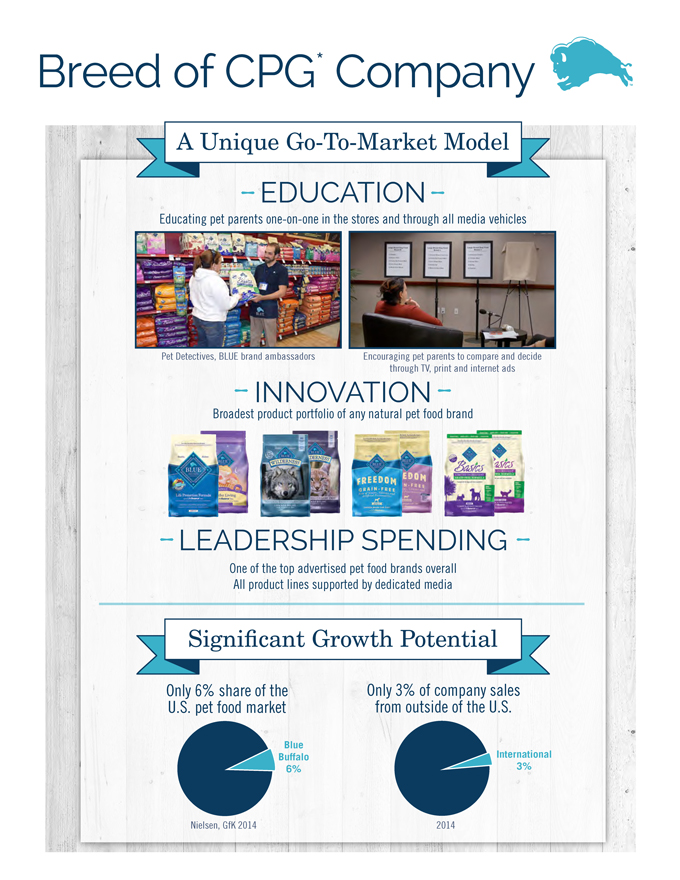
Breed of CPG* Company
EDUCATION
Educating pet parents one-on-one in the stores and through all media vehicles
INNOVATION
Broadest product portfolio of any natural pet food brand
LEADERSHIP SPENDING
One of the top advertised pet food brands overall
All product lines supported
by dedicated media
WOOF!
MEOW
WOOF!
MEOW
MEOW
WOOF!
MEOW
WOOF!
MEOW
WOOF!
MEOW
Pet Detectives, BLUE brand ambassadors Encouraging pet parents to compare and decide
through TV, print and internet ads
A Unique Go-To-Market Model
Nielsen, GfK 2014 2014
Blue
Buffalo
6%
International
3%
Only 6% share of the
U.S. pet food market
Only 3% of company sales
from outside of the U.S.
Significant Growth Potential
Table of Contents
| Page |
||||
| ii | ||||
| 1 | ||||
| 18 | ||||
| 39 | ||||
| 39 | ||||
| 40 | ||||
| 41 | ||||
| 42 | ||||
| 43 | ||||
| Management’s Discussion and Analysis of Financial Condition and Results of Operations |
47 | |||
| 63 | ||||
| 66 | ||||
| 98 | ||||
| 103 | ||||
| 113 | ||||
| 115 | ||||
| 120 | ||||
| 128 | ||||
| 131 | ||||
| Certain United States Federal Income and Estate Tax Consequences to Non-U.S. Holders |
133 | |||
| 136 | ||||
| 144 | ||||
| 144 | ||||
| 144 | ||||
| F-1 | ||||
You should rely only on the information contained in this prospectus or in any free writing prospectus we may authorize to be delivered or made available to you. Neither we, the selling stockholders nor the underwriters have authorized anyone to provide you with different information. The information in this prospectus is accurate only as of the date of this prospectus, regardless of the time of delivery of this prospectus, or any free writing prospectus, as the case may be, or any sale of shares of our common stock.
For investors outside the United States: the selling stockholders are offering to sell, and seeking offers to buy, shares of our common stock only in jurisdictions where offers and sales are permitted. Neither we, the selling stockholders nor the underwriters have done anything that would permit this offering or possession or distribution of this prospectus in any jurisdiction where action for that purpose is required, other than in the United States. Persons outside the United States who come into possession of this prospectus must inform themselves about, and observe any restrictions relating to, the offering of the shares of common stock and the distribution of this prospectus outside the United States.
Numerical figures included in this prospectus have been subject to rounding adjustments. Accordingly, numerical figures shown as totals in various tables may not be arithmetic aggregations of the figures that precede them.
i
Table of Contents
Certain of the market data and other statistical information contained in this prospectus (such as the size, growth and share of the pet food industry and its constituent market segments) are based on information from independent industry organizations and other third-party sources, including Euromonitor International, or Euromonitor, Nielsen, GfK, Information Resources Inc., or IRI, American Pet Products Association, Competitrack and other industry publications, surveys and forecasts. Some market data and statistical information contained in this prospectus are also based on management’s estimates and calculations, which are derived from our review and interpretation of the independent sources listed above, our internal research and our knowledge of the pet food industry. While we believe such information is reliable, we have not independently verified any third-party information and our internal data has not been verified by any independent source.
Our market size estimate of $26 billion for the U.S. pet food industry across all channels in 2014 is based on a combination of independent third-party data and our knowledge of the pet food industry. Our estimate is similar to Euromonitor’s $27 billion estimate of the U.S. pet food industry in 2014.
For the purposes of this prospectus:
| • | “AAFCO” refers to the Association of American Feed Control Officials, which is a voluntary, non-governmental membership association of local, state and federal agencies that are charged by law with the regulation of the sale and distribution of animal feed, including pet food; |
| • | “cold-formed” refers to the processing of our LifeSource Bits during which they are exposed to levels of heat that are lower than the heat levels that dry pet food, including the kibble we produce, typically are exposed to during processing. By reducing the amount of heat to which the LifeSource Bits are exposed, numerous heat-sensitive vitamins and antioxidants contained in the LifeSource Bits avoid the degradation that would be caused by exposure to higher temperatures; |
| • | “CPG” refers to consumer packaged goods in the packaged foods, beverages, household and personal care, pet care and tobacco industries; |
| • | “chicken by-product meal” or “poultry by-product meal” refers to the AAFCO definition for pet food ingredients that consist of “ground, rendered clean parts of the carcasses of slaughtered chicken and poultry, such as necks, feet, undeveloped eggs and intestines.” Chicken by-product meal and poultry by-product meal typically cost less than chicken meal, which is made from whole chicken meat and skin; |
| • | “major pet food company” refers to the top five U.S. pet food companies, which together had a 78% market share of branded pet food sales in Tracked Channels in 2014; |
| • | “meat meal” refers to whole meat turned into dry matter, which is used as an ingredient in pet food manufacturing; |
| • | “natural” refers to AAFCO’s ingredient definitions and labeling guidelines, which designates a pet food as natural if it contains only ingredients that are derived solely from plant, animal or mined sources, has not been subject to a chemically synthetic process and does not contain any chemically synthetic additives. A “natural” pet food under AAFCO, however, may contain synthetically derived vitamin, minerals or trace nutrients that are added to enhance nutrition if the label discloses these ingredients; |
| • | “pet food” refers to dry foods, wet foods and treats for dogs and cats only, and does not include rawhide, vitamins, supplements, cat litter or foods for other companion animals; |
ii
Table of Contents
| • | “retail sales” or “sales at retail” refers to the dollar value of sales at retail by our retail partners to consumers, and not to our sales to retailers or our revenues; |
| • | “Tracked Channels” refers to stores and other outlets within channels in which a third-party industry source collects and reports sales data on an ongoing basis with stock keeping unit, or SKU, level detail. In our industry, Tracked Channels include Food-Drug-Mass, or FDM, included in Nielsen’s xAOC data, as well as pet stores (including national pet superstores, regional pet store chains and neighborhood pet stores) and veterinary clinics, or Vet, included in data from GfK; |
| • | “Untracked Channels” refers to stores and other outlets within channels in which no third-party industry source collects and reports sales data on an ongoing basis with SKU level detail. In our industry, Untracked Channels include FDM retailers that do not participate in Nielsen tracking (e.g., Costco and Whole Foods), farm and feed stores, eCommerce retailers, hardware stores and military outlets; and |
| • | “whole meat” refers to flesh with or without accompanying skin and bones of animal proteins such as chicken, lamb or fish in fresh, frozen or slurry form. |
In addition, references in this prospectus to AAFCO definitions or guidelines refer to those found in the AAFCO 2015 Official Publication.
In this prospectus, references to “share” and “market share,” unless otherwise indicated, are to market share based on retail sales rather than volume sold. Our market share based on volume sold is typically lower than our market share based on retail sales as our products are priced at a premium to many of our competitors’ products. We calculate the percentage of dogs and cats eating our products based on our share of volume sold in Tracked Channels. Statements in this prospectus regarding our growth and share of the pet food industry and its constituent market segments are for the United States only, unless otherwise indicated, and are based on data from Tracked Channels for 2014.
Market Segments
There are no standard market segment definitions in the pet food industry. We segment pet foods into Wholesome Natural, Engineered, Private Label and Therapeutic market segments. This market segmentation is based on the ingredient profile of pet foods, with the exception of Private Label and Therapeutic pet foods, for the reasons discussed below. While others may segment the market in different ways, we believe this market segmentation is most helpful in understanding the industry and its market dynamics.
Our definition of the Wholesome Natural market segment incorporates the AAFCO definition of “natural,” but imposes further criteria based on the type of ingredients used to achieve nutritional targets. We believe this specific and ingredient-focused market segmentation reflects consumer preferences and how consumers make their purchase decisions, as evidenced by the disparity among the growth rates of the different market segments. While all BLUE products satisfy the criteria specified for the Wholesome Natural market segment described below, in order to account for variation in our competitors’ portfolios of products, a pet food brand or product line is categorized in a particular market segment if 90% or more of the products under such brand or product line as measured by retail sales (rather than by volume) satisfy the market segment criteria specified. We define the market segments as follows:
| • | Wholesome Natural brands achieve their nutritional targets using only natural ingredients (as defined by AAFCO), and may include added vitamins, minerals and other trace nutrients. All Wholesome Natural dry foods have whole meats and/or meat meals, with the type of animal protein clearly identified, as their principal ingredients. Wholesome Natural products (dry foods, wet foods and treats) do not include chicken or poultry by-product meals, which we believe pet parents do not |
iii
Table of Contents
| desire. Wholesome Natural products also do not rely on grain proteins, such as corn gluten meal, wheat gluten and soybean meal, as principal sources of protein, as grain proteins have a narrower array of amino acids compared to animal proteins. In addition, these products also do not use corn, wheat, soy or fractionated grains, such as brewer’s rice, as sources of starch. |
| • | Engineered brands achieve their nutritional targets without fulfilling all the requirements of the Wholesome Natural market segment. They typically do not contain whole meat or meat meal as their principal ingredients and/or they use lower cost proteins (such as chicken by-product meal, corn gluten meal or wheat gluten) and lower-cost starches (such as corn, wheat or fractionated grains). Engineered products may or may not include artificial ingredients or preservatives. |
| • | Private Label brands are owned by retailers. While the vast majority of Private Label products fall within the Engineered market segment, some Private Label products fall within the Wholesome Natural market segment based on their ingredients. However, consistent with retail industry practice, market data providers do not identify the specific Private Label SKUs. As a result, Private Label market segment sales are not categorized into either the Wholesome Natural or the Engineered market segment. |
| • | Therapeutic (Rx) brands are formulated to support treatment for certain medical conditions and are prescribed by veterinarians. Certain Therapeutic pet foods that claim to diagnose, cure, mitigate or prevent diseases are regulated by the U.S. Food and Drug Administration, or FDA, as animal drugs rather than as pet food, and are subject to FDA pre-market approval. In light of this regulatory process and the distinct Vet channel for the sale of Therapeutic pet foods, there is no Private Label participation in this market segment. |
iv
Table of Contents
This summary highlights selected information contained elsewhere in this prospectus. This summary does not contain all the information that you should consider before deciding to invest in our common stock. You should read the entire prospectus carefully, including “Risk Factors” and our consolidated financial statements and related notes included elsewhere in this prospectus, before making an investment decision. In this prospectus, the terms “Blue Buffalo,” “we,” “us,” “our” and the “Company” refer to Blue Buffalo Pet Products, Inc. and our consolidated subsidiaries and the term “BLUE” refers to the BLUE brand.
Blue Buffalo: A New Breed
We are the fastest growing major pet food company in the United States, selling dog and cat food made with whole meats, fruits and vegetables, and other high-quality, natural ingredients. BLUE is a billion dollar brand based on sales at retail and is the #1 brand in the Wholesome Natural market segment. We currently have approximately 6% share of the overall pet food industry and feed only 2-3% of the 164 million pets in the United States. With a proven new user acquisition strategy, we are committed to converting more pet parents into True Blue Believers and continuing to increase our share of the attractive $26 billion U.S. pet food market.
We were founded in 2002 by Bill Bishop and his two sons, Billy and Chris. As lifelong pet lovers, the Bishops’ interest in natural pet foods was inspired by their love for their family dog, Blue. As described in the “Letter from our Founder” beginning on page 63 of this prospectus, when Blue had a bout with cancer at a young age, the Bishop family became very concerned with the quality of his food. In the process of learning all they could about pet food ingredients, they discovered what they believed was a major disconnect between what pet parents wanted to feed their dogs and cats and what they were actually feeding them. The Bishops made it their mission to bring transparency to the pet food industry by educating pet parents to look beyond the pictures on the packaging and to focus on the actual ingredients in the food they were feeding their pets. Tapping into this unmet consumer demand, the Bishops started Blue Buffalo to develop and market pet foods made with the kind of ingredients they would want to feed their own furry family members.
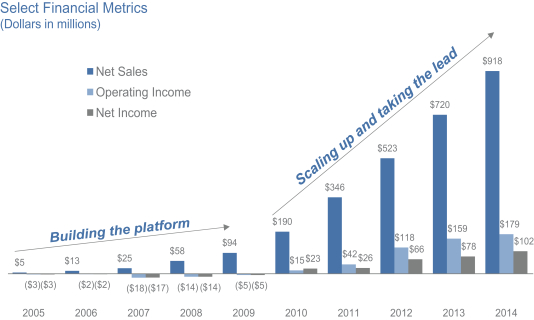
We believe we have built an exceptional company with a breakthrough brand and an innovative business model. Backed by our mission and belief in a large unmet consumer demand for pet food with high-quality, natural ingredients, we invested heavily in our brand well ahead of our scale. As a result of this investment strategy, we did not turn profitable until 2010. Our net sales have grown from $190 million in 2010 to $918 million in 2014, which represents a compound annual growth rate, or CAGR, of 48%. During this period, our operating income grew from $15 million to $179 million, which represents a CAGR of 86%, while our net income grew from $23 million to $102 million, which represents a CAGR of 45%. Given the size and scale we have reached, we expect our growth rates to moderate in the future. We believe that only a few public U.S. CPG companies have our combination of scale, significant growth and strong margins. The following chart illustrates our growth in net sales, operating income and net income from 2005 to 2014.
1
Table of Contents
The Industry Where We Operate: Large and Attractive
Industry Trends
Pet food is one of the largest CPG categories in the United States. We estimate the U.S. pet food industry had approximately $26 billion in retail sales in 2014. According to Euromonitor, the pet food industry had $49 billion in additional retail sales outside the United States in 2014, bringing the total size of the global pet food industry to over $75 billion.
U.S. pet food retail sales grew 62% between 2004 and 2014, which represents a CAGR of 5%, based on data from Euromonitor. The industry growth over this period has been fueled by the “humanization” of pets, as pets are increasingly regarded as family members. This humanization trend has led pet parents to increasingly evaluate pet foods in the same way they scrutinize their own food choices. As a result, a significant number of pet parents have demonstrated a willingness to pay a premium for pet food that they believe will enhance the well-being of their pets. The higher demand for natural food products and more specialized formulas has fueled premiumization in the industry, leading to the faster growth of products with higher revenue per pound.
The pet food industry has high penetration in the United States with 63% of households purchasing pet food in 2014. Virtually all pets in the United States are fed packaged pet foods. Pet food is also a highly branded industry with low rates of switching due, in part, to potential digestive issues that may occur when switching between different pet food brands. As a result, brands that build a strong relationship with a pet and its pet parents realize significant value over the lifetime of the pet, especially if the pet starts on the brand as a puppy or kitten.
We believe the Wholesome Natural and Therapeutic market segments are particularly on trend as pet parents increasingly treat their pets like family. With market shares of 17% and 7%, these two market segments have become significant parts of the U.S. pet food market, and continue to grow faster than the rest of the market.
Industry Channels
In 2014, specialty channels accounted for 45% of U.S. pet food sales, with the Food-Drug-Mass, or FDM, channel accounting for the other 55%. Specialty channels include a diverse set of retailers with over 20,000 stores (which includes national pet superstore chains, regional pet store chains, neighborhood pet stores, farm and feed stores, eCommerce retailers, military outlets and hardware stores) and 25,000 veterinary clinics. BLUE is sold across all types of specialty channel outlets, although our sales in the Vet channel, which represents 6% of U.S. pet food sales, are currently minimal. We have chosen to sell BLUE in the specialty channels as we believe these channels provide a better environment for us to interact with and educate pet parents, help position BLUE as a premium brand and grant consumers access to a broader range of our products. Pet food sales in specialty channels have grown faster than pet food sales in the FDM channel for the past 20 years as a result of the expansion of the channel and its pet-focused environment and superior product selection.
Starting in the second half of 2013, the largest pet food company in the United States initiated a significant increase in its promotional spending focused primarily on the FDM channel, which effectively reduced the average price per pound of pet food for its products. Other pet food companies responded by increasing their own promotional spending. This heightened promotional activity drove down the pet food category growth rate in 2013 and 2014. It also reduced traffic to the specialty channels as price gaps widened and consumers stocked up on pet food products. As a result, overall pet food sales growth rate in Tracked Channels decelerated from 5% in 2012 and 4% in 2013 to 1% in 2014. However, despite these FDM-focused promotional activities, specialty channels continued to grow faster than the FDM channel during this period, with a 3% growth rate compared to a decline of 0.3% for the FDM channel as measured in Tracked Channels. As of the first quarter of 2015, sales growth rates have been improving but are still not at historical growth rates. We believe Untracked Channels have continued to grow at significantly higher rates than the overall market, as well as specialty channels. Wholesome Natural and Therapeutic market segments also continued to outperform the overall market in 2014, growing at a rate of 14% and 5%, respectively.
2
Table of Contents
Doing Things the BLUE Way: Our Strategic Differentiation
The Landscape We Found
Pet food in 2002 was an established industry dominated by large CPG companies, offering a variety of brands made primarily with ingredients such as poultry by-product meals, corn, wheat and soy. Based on our conversations with many pet parents, we found that the vast majority of them did not read pet food labels and were often unaware of the ingredients they were feeding their pets, even though they were seeking natural foods and products for themselves and their families. A number of small natural pet food brands began to emerge in the neighborhood pet stores, led by entrepreneurs who often did not have the funding to build sizable businesses. In parallel, the pet food retail landscape had evolved significantly with the expansion of national pet superstores. These superstores carried a broad assortment of pet products and foods, anchored by Engineered brands but did not participate in the emerging Wholesome Natural market segment in a meaningful way.
The BLUE Disruption
We set out to challenge the status quo set by the incumbent brands. We were convinced that the Wholesome Natural market segment could become a large part of the industry due to a large unmet consumer demand for pet food with high-quality, natural ingredients. We have established our leadership position in the Wholesome Natural market segment through the strength and quality of our products, by broadly sharing our message to encourage pet parents to read ingredient labels and by pricing our products at a reasonable premium to Engineered brands. This approach was in contrast to our major competitors whose business models were tied to the mass production of Engineered brands.
We committed to creating wholesome pet food made with whole meats, fruits and vegetables and other high-quality, natural ingredients that we feel good about feeding our own furry family members and to educating fellow pet parents about pet nutrition. We further distinguished our products by creating a two-part dry food, consisting of kibble and our trademarked LifeSource Bits that are cold-formed to help preserve the potency of vitamins, minerals and antioxidants. LifeSource Bits are more expensive and complex to manufacture, but we believe they provide significant benefits and create a visual point of differentiation when we talk to pet parents. We also combined advanced quality control and supply chain capabilities generally consistent with the standards required for human food industries with our deep expertise in pet foods. We believe these competitive advantages, together with our investments in our brand, have distinguished us from our smaller competitors in the Wholesome Natural market segment.
We deploy our Pet Detectives, part-time pet-passionate team members, to help us fulfill our mission to educate fellow pet parents about pet nutrition. Pet Detectives interact with pet parents one-on-one as they shop for pet food in stores nationwide and in Canada. Our Pet Detective program serves as an educational marketing and sales platform as it is a resource for both pet parents already feeding their pets BLUE and pet parents currently feeding their pets other pet food brands. The Pet Detectives allow us to engage pet parents with our brand story, our mission and our shared love for pets in an authentic manner.
From the dynamics we saw in human foods, we knew that consumers were willing to pay a premium for natural products, and we were confident that pet parents would be open to paying a reasonable premium for our natural products for their furry family members. Our price premium compared to Engineered brands varies. For example, virtually all pet parents feeding their medium-sized dog an Engineered brand can switch to BLUE for anywhere from no extra cost to 70 cents more per day. For a cat, they can switch to BLUE for anywhere from no extra cost to 30 cents more per day. As we have grown, we have successfully switched pet parents from feeding their pets various brands across the full range of price points to feeding their pets BLUE, demonstrating our broad appeal and affordability to a large population of pet parents.
3
Table of Contents
We believe that our rapid creation of a brand with over a billion dollars of sales at retail is proof that our strategy is working.
Building Our Brand
We chose to build a master BLUE brand with a strong identity on top and different product lines underneath with distinct benefits and personalities, instead of following a brand portfolio approach like most of our major competitors. We engage pet parents with our brand story, mission and our shared love for pets. We want to build a relationship with our consumers by having them understand what we do and why we do it, rather than just sell them a product. With our transparent approach, we strive to educate them on pet nutrition and ingredients so they can make their own informed choices. Our mantra is “Love them like family. Feed them like family.” We carry this message across all our touch points with pet parents – from our advertising to the one-on-one conversations our Pet Detectives have with tens of thousands of pet parents at stores around the United States and Canada every week.
In order to reach a broad cross-section of consumers, we started out in national pet superstore chains with large stores around the country. As our brand has grown, we have continued to broaden our distribution within the specialty channels to include, among others, regional and neighborhood pet stores, farm and feed stores and online retailers. Today BLUE is sold at over 10,000 stores across the United States and Canada.
Since we started in national pet superstore chains, which have more shelf space dedicated to pet food than either the FDM channel or neighborhood pet stores, we were able to offer a broad portfolio of products at an early stage in our brand development. As our brand grew and our retail sales surpassed even well-known brands, we gained scale and now offer even more tailored product offerings. Today, we have the broadest portfolio of products of any natural pet food brand in the United States. Our goal remains to offer pet parents a no-compromise product solution for their needs. We believe this leads to higher levels of satisfaction, a higher share of their spending and increased brand loyalty.
We started with an ambitious vision to build our brand, and we followed a deliberate strategy, investing in brand communication at the level of the major brands when the Wholesome Natural market segment and the size of our business alone were too small to financially support that spending. Our results continue to reinforce our belief in our strategy and execution.
The Herd’s Thunder: Using BLUE’s Strengths
The pet food industry is highly competitive. Over the last decade, all of our major competitors and many independent companies have also entered or have attempted to benefit from the fast-growing Wholesome Natural market segment through new brand introductions, brand extensions and/or acquisitions. These attempts have included entries directly into the Wholesome Natural market segment, as well as launching brands and products that have some but not all of the Wholesome Natural market segment’s characteristics. We continue to enjoy leading growth and clear leadership of the Wholesome Natural market segment. We have also continued to widen our lead in the Wholesome Natural market segment as our market share increased from 23% in 2011 to 34% in 2014. As a result, in 2014 we had three to four times the share of the next largest Wholesome Natural brand.
Due to the strength of the BLUE brand and our innovative business model, BLUE has grown and continues to grow its sales well in excess of pet food industry growth. BLUE is no longer just the leader of the Wholesome Natural market segment, but is now one of the largest pet food brands overall in the $26 billion U.S. pet food industry.
We believe our market success is driven by the following competitive advantages we have built and continue to strengthen.
Marketing Engine and Strong Brand Equity
We believe we have an effective new user acquisition strategy: a powerful, authentic brand with significant, ongoing investment in proven marketing elements and a broad product portfolio with tailored specialty formulas.
4
Table of Contents
We believe we have a highly engaged consumer base of passionate pet parents, who connect with our authentic story of a pet food brand that is “by pet parents for pet parents.” Our goal is for the buffalo icon and the BLUE shield featured on our products to symbolize quality and project a certain attitude that pet parents feel good associating with. We actively support pet cancer awareness and research, promote animal welfare and engage our pet parents in these important causes with special events such as the Pet Cancer Awareness Month during May of every year. We believe our consumers are strong advocates of our brand and are major contributors to our success in the marketplace.
Our master brand strategy, combined with significant cumulative investments in highly effective marketing and brand-building of over $400 million since 2003, has resulted in what we believe to be one of the strongest brand equities in the pet food industry. We have a full-service in-house advertising and marketing agency which enables us to maintain the authenticity of our communications, whether through marketing or packaging, and allows us to build a cohesive brand. This integrated approach gives us a significant advantage in speed-to-market from product development to advertising, increases our marketing effectiveness and creates marketing efficiencies.
We are currently the #1 advertiser in the Wholesome Natural market segment by a wide margin and one of the top advertised brands in the industry overall. However, we still have a significant opportunity to expand our brand awareness compared to brands with much longer histories in the marketplace. We plan to continue to invest in advertising to increase our brand awareness and drive traffic to brick-and-mortar stores and eCommerce retailers where BLUE is sold.
Our commitment to pet nutrition education is reflected in our approach to marketing, which has a strong call-to-action for pet parents to examine the ingredients in their pet food. We achieve this through our integrated marketing strategy and Pet Detective program. We believe our Pet Detective program enhances the in-store shopping experiences of our retail partners and provides us with the benefits of direct-to-consumer marketing without creating a conflict with our retail partners. We believe our Pet Detective program is the largest of its kind run by any CPG company in the United States. More recently, as we focus on increasing our distribution in channels outside national pet superstores, we have been investing in sales and marketing capabilities and programs suited for these different channels such as in-store merchandising to differentiate our products in smaller footprint neighborhood stores and web marketing tools to increase our conversion of online traffic. We also continue to look for ways to strengthen our relationships with key influencers in the industry (e.g., veterinarians, store associates and trainers) to help generate more recommendations for BLUE.
Product Development Engine with the Broadest Portfolio
We have the broadest portfolio of products of any natural pet food brand in the United States. Our tailored product offerings enable our pet parents to satisfy their pet’s specific dietary, lifestyle and life-stage needs, offering them no-compromise product solutions. We believe this, in turn, leads to higher consumer satisfaction, brand loyalty and a lifetime relationship between us and pet parents and their pets.
We have built four major product lines under our master BLUE brand, each with a different nutritional philosophy and distinct personality. We continue to deepen each product line with new products, expand each product line’s shelf presence and support each product line with advertising:
| ¡ | BLUE Life Protection Formula – introduced in 2003, this is our original and largest product line with the broadest flavor, functional and breed-specific variety; |
| ¡ | BLUE Wilderness – introduced in 2007, this is our high-meat, high-protein, grain-free ancestral feeding line and our second largest product line; |
| ¡ | BLUE Basics – introduced in 2010, this is our line of limited ingredient diet products for pets with food sensitivities; and |
| ¡ | BLUE Freedom – introduced in 2012, this is our grain-free line that is a cousin of the original BLUE Life Protection Formula line. |
5
Table of Contents
We also develop and sell cat litter products that are made from walnut shells under our BLUE Naturally Fresh line, introduced in 2012.
Our product portfolio enjoys a strong base of existing products, combined with a strong track record of significant and incremental new product introductions. We believe we can bring new products to the market significantly faster than our major competitors as a result of our singular focus on the Wholesome Natural market segment and our integrated in-house marketing, research and development and product development capabilities. Our retail partners in the specialty channels also look to us to drive innovation and enable us to rapidly introduce new products into the marketplace.
Strong Organization: “The Herd”
Our company culture is an integral part of our strategy and one of our founding objectives is being a great place to work. We have a strong and dedicated team of employees we refer to as “the Herd,” where each one of us is a “Buff.” Our company culture is built on entrepreneurship, collaboration, a commitment to Blue Buffalo’s mission, a competitive spirit and a friendly, casual work environment. We believe our company culture is a key competitive advantage and a strong contributor to our success.
We have a strong and experienced management team, with our founders playing an active role in the business. We have a deep bench of senior leaders with strong business and operational experience across all business functions working closely as the Herd Leadership Team. Our Chief Executive Officer, Kurt Schmidt, and our Chief Financial Officer, Mike Nathenson, have decades of leadership experience in CPG companies in the United States and overseas. Our President, Chief Operating Officer and co-founder, Billy Bishop, has been leading marketing and operations since our founding in 2002. Billy provides us with the unique perspective of an entrepreneurial business builder.
Scaled Pure-Play in the Wholesome Natural Market Segment
We believe our scale allows us to compete effectively against both our larger and smaller competitors. Being one of the largest pet food companies in the United States and the #1 brand in the Wholesome Natural market segment provides us with significant scale advantages in our supply chain. In September 2014, we commenced manufacturing operations at our state-of-the-art Heartland manufacturing facility in Joplin, Missouri. Once our Heartland facility ramps up to capacity, which we anticipate will be by the third quarter of 2015, we believe our hybrid network of owned and contracted manufacturing facilities will provide us with enhanced margin opportunities and greater flexibility in our supply chain.
We focus on developing and marketing Wholesome Natural pet foods that we would want to feed our own furry family members. Our exclusive focus on pet products enables us to identify and react to trends early, develop Wholesome Natural products that meet the needs of pets and their pet parents and execute with speed and efficiency. We believe being a pure-play with this focus on pet products gives us a competitive advantage compared to most of our major competitors who are diversified CPG conglomerates. As the only Wholesome Natural pet food brand with a billion dollars of sales at retail, we possess operational and financial processes and tools that are difficult for smaller companies to implement. For example, we successfully implemented SAP, a tier 1 Enterprise Resource Planning system, in 2013 and went live on January 1, 2014. We are in the process of implementing internal controls over financial reporting required under Section 404 of the Sarbanes-Oxley Act of 2002, or the Sarbanes-Oxley Act, which is ahead of the required schedule for an “emerging growth company.”
Strong Position at Our Retailers
As a leader in advertising and brand-building in the pet food category, we continue to drive traffic to brick-and-mortar stores and eCommerce retailers where BLUE is sold. In addition to the regular traffic we help generate, we believe our products are attractive to retailers given the strong gross margins they deliver to retailers. We work with our retail partners to customize product assortment, starting with the highest sales velocity items that fit their customer base in order to optimize our retail partners’ economics. With our broad product portfolio, we see an opportunity to continue to increase our shelf space, especially outside of national pet superstores. These dynamics have made us a strong partner to our retailers, as we continue to increase the breadth and depth of our distribution.
6
Table of Contents
Future of Blue Buffalo: Bigger. Better. Bolder.
With the investments we have made in our brand, our people and our infrastructure, we believe we are well positioned to continue to deliver industry-leading growth that outpaces both the fast-growing Wholesome Natural market segment and the overall pet food industry.
We expect to continue to grow our volumes and increase our revenue per pound. We plan to grow our volumes by reaching and feeding more pets, and by feeding them more of our products. Our goal is to increase our revenue per pound by continuing to improve our product mix through our marketing and product development engines. We will also be focused on investing in new growth drivers, including entering the Vet channel and select international markets.
Reach and Feed More Pets
| ¡ | Converting more pet parents to BLUE. We currently feed less than 4% of the dogs and less than 2% of the cats in the United States. The combination of our focus on building our brand awareness, our commitment to educating pet parents and the breadth of our product portfolio that meets the diverse needs of pets and pet parents forms our powerful, proven new user acquisition strategy. We believe this successful strategy will continue to help us bring more pet parents into the BLUE family. |
| ¡ | Being available to more pet parents. Our share in specialty channels outside of national pet superstores is approximately one-third of our share in national pet superstores. We believe we have significant opportunity to grow the depth and breadth of our distribution in channels outside of national pet superstores that fit our brand positioning and target consumers such as the fast growing eCommerce and farm and feed store channels. We believe that increasing our presence in these channels will make BLUE available to a greater proportion of pet parents. Though a relatively new priority for us, in 2014 our sales outside national pet superstores grew at 1.3 times BLUE’s overall growth rate. |
| ¡ | Growing with our younger pets and younger pet parents. Our share of puppies and kittens is significantly higher than our share of older dogs and cats, which reflects the fact that BLUE is a younger brand with a shorter history in the market. We believe our share of puppies and kittens is a leading indicator of our future market share potential. We expect our total share, as well as our share of older pets to grow over time as we continue to bring future generations of puppies and kittens into our brand and as the current generation of puppies and kittens eating BLUE ages. BLUE also indexes higher among younger pet parents, who generationally tend to be more in tune with health and wellness trends and are more focused on ingredients. We believe that we can realize significant lifetime value from our relationship with this younger generation of pets and pet parents. |
Feed Pets More of Our Products
| ¡ | Cross-selling more of our products to our broad and growing base of users. Our market shares of wet foods and treats are each currently just over one-third of our market share in dry foods. Only a fraction of our dry foods users buy our wet foods and treats on a regular basis. We actively seek to encourage our user base to purchase our broadening and enhanced portfolio of wet foods and treats through our various marketing touch-points, from our Pet Detective program to cross-promotional activities. We also intend to leverage our core brand equity and relationship with pet parents to continue to extend our brand into adjacent categories. |
Increase Our Revenue per Pound
| ¡ | Enhancing our product mix. We plan on continuing to drive our marketing and product development engines to enhance our product mix. As a result, in 2014, our revenue per pound for our pet food products increased 3%, primarily due to improved product mix. We have a wide distribution and a large media budget. Therefore, we can increase our advertising and marketing for each of our major product lines and product types. We believe this will |
7
Table of Contents
| allow us to accelerate the growth of our newer product lines, as well as wet foods and treats, and cat foods overall where we have lower relative market share. We also intend to continue to expand our specialized product offerings. |
| • | We closely monitor the pet food industry and when we see a promising product or diet type, we pursue it aggressively. Our newer food lines, which include BLUE Wilderness, BLUE Basics and BLUE Freedom, have higher revenue per pound and are growing faster than our overall company average. |
| • | The revenue per pound of the more specialized products (e.g., breed-size specific and hairball management for cats) we introduce across our product lines and product types is typically higher than the average revenue per pound of existing products in our portfolio. |
| • | As we cross-sell more of our products to our user base and reach more cats where we have lower relative market share, our product mix will continue to shift towards wet foods and treats, as well as cat foods overall, which all have higher revenue per pound than our overall company average. |
Continue to Invest in New Growth Drivers
| ¡ | Funding growth initiatives with a long-term view. With strong top-line growth, we expect to have significant scale benefits and operating leverage in our business in the future. We also expect significant cost savings from in-sourcing a substantial portion of our manufacturing with our Heartland facility as well as other facilities we may build or acquire in the future. In the near term, we plan to use these increased efficiencies to fund our growth initiatives to reach and feed more pets. |
| ¡ | Growing in select international markets. In 2014, approximately 3% of our sales were from outside the United States. Expanding our business in the $49 billion non-U.S. pet food market is an important area of focus for us, as other established premium pet food brands generate a significant percentage of their sales from international markets. In 2014, we opened our first office in Canada, where we already have a sizable business with an operating margin on par with our business in the United States. We have also recently established operating subsidiaries in Mexico and Japan, where we expect to begin marketing our foods through local distribution by the end of 2015. We are determined to take a targeted approach to future international expansion, prioritizing sizeable markets with strong potential. |
| ¡ | Building a strong relationship with the veterinary community and entering the Therapeutic (Rx) market segment. Veterinarians are the most important influencers for pet food selection, with over one in five pet parents choosing their pet food brand based on a veterinarian recommendation. We have recently started building a dedicated national detailing force to introduce BLUE to the veterinary community and help generate recommendations for BLUE products. While this is a significant new investment initiative for us, we believe it can be an important part of our go-to-market strategy in the future. We plan to enter the Therapeutic market segment with differentiated natural Rx products and believe that we can be a new, disruptive player in this market segment. While we do not expect to generate significant revenues from Therapeutic products in the near term, we believe they will be synergistic for our relationship with the veterinarian community and provide an incremental avenue of future growth. |
The Path Forward: Staying True to BLUE
Evoking the Bishop family’s love for their dog “Blue” and the buffalo, an iconic image of the natural American frontier, the Blue Buffalo name is a constant reminder of our challenge and commitment to “stay true to BLUE” and preserve our passion and authenticity as we grow our business. We will remain committed and stay true to our founding objectives of making the healthiest pet food we can, being a great place to work and helping to find a cure for pet cancer. That is our promise to our loyal pet parents and to ourselves.
8
Table of Contents
Risk Factors
Investing in our stock involves a high degree of risk. You should carefully consider the risks described in “Risk Factors” before making a decision to invest in our common stock. If any of these risks actually occurs, our business, financial condition and results of operations would likely be materially adversely affected. In such case, the trading price of our common stock would likely decline and you may lose part or all of your investment. Below is a summary of some of the principal risks we face:
| • | We may not be able to successfully implement our growth strategy on a timely basis or at all. |
| • | The growth of our business depends on our ability to accurately predict consumer trends and demand and successfully introduce new products and product line extensions and improve existing products. |
| • | Any damage to our reputation or our brand may materially adversely affect our business, financial condition and results of operations. |
| • | Our growth and business are dependent on trends that may change or not continue, and our historical growth may not be indicative of our future growth. |
| • | There may be decreased spending on pets in a challenging economic climate. |
| • | Our business depends, in part, on the sufficiency and effectiveness of our marketing and trade promotion programs. |
| • | If we are unable to maintain or increase prices, our margins may decrease. |
| • | We are dependent on a relatively limited number of retailer customers for a significant portion of our sales. |
| • | We rely upon a limited number of contract manufacturers to provide a significant portion of our supply of products. |
| • | We are involved in litigation with Nestlé Purina PetCare Company and related class action lawsuits, including false advertising claims relating to the ingredients contained in our pet food. Regardless of whether we are successful in our defense of these claims or in our counter claims, this litigation may adversely affect our brand, reputation, business, financial condition and results of operations. |
| • | We will not be required to comply with certain provisions of the Sarbanes-Oxley Act for as long as we remain an “emerging growth company.” |
Implications of being an Emerging Growth Company
We qualify as an “emerging growth company” as defined in the Jumpstart Our Business Startups Act of 2012, or the JOBS Act. As a result, we are permitted to, and intend to, rely on exemptions from certain disclosure requirements that are applicable to other companies that are not emerging growth companies. Accordingly, we have included compensation information for only our three most highly compensated executive officers and have not included a compensation discussion and analysis of our executive compensation programs in this prospectus. In addition, for so long as we are an emerging growth company, we will not be required to:
| • | engage an independent registered public accounting firm to report on our internal controls over financial reporting pursuant to Section 404(b) of the Sarbanes-Oxley Act; |
| • | adopt new or revised financial accounting standards applicable to public companies until such standards are also applicable to private companies; |
9
Table of Contents
| • | comply with any requirement that may be adopted by the Public Company Accounting Oversight Board, or the PCAOB, regarding mandatory audit firm rotation or a supplement to the independent registered public accounting firm’s report providing additional information about the audit and the financial statements (i.e., an auditor discussion and analysis); |
| • | submit certain executive compensation matters to shareholder advisory votes, such as “say-on-pay,” “say-on-frequency” and “say-on-golden parachutes;” or |
| • | disclose certain executive compensation related items such as the correlation between executive compensation and performance and comparisons of the chief executive officer’s compensation to median employee compensation. |
We will remain an emerging growth company until the earliest to occur of:
| • | our reporting of $1.0 billion or more in annual gross revenue; |
| • | our issuance, in any three year period, of more than $1.0 billion in non-convertible debt; |
| • | our becoming a “large accelerated filer”; and |
| • | the end of fiscal 2020. |
The JOBS Act permits an emerging growth company such as us to take advantage of an extended transition period to comply with new or revised accounting standards applicable to public companies. We are choosing to “opt out” of this provision and, as a result, we will comply with new or revised accounting standards as required when they are adopted. This decision to opt out of the extended transition period under the JOBS Act is irrevocable.
Recent Developments
For the six months ended June 30, 2015, we estimate that our net sales will range from $500.8 million to $502.8 million, an increase of 12.8% at the mid-point of the estimated net sales range when compared with $444.9 million for the six months ended June 30, 2014. We estimate that our net income will be between $51.4 million and $52.7 million for the six months ended June 30, 2015, compared with net income of $53.1 million for the six months ended June 30, 2014. For the six months ended June 30, 2015, we estimate that our adjusted net income will be between $56.2 million and $57.4 million, compared with adjusted net income of $54.6 million for the six months ended June 30, 2014. We believe that the reasons for the changes in our net sales, net income and adjusted net income for the six months ended June 30, 2015 as compared to the six months ended June 30, 2014 are substantially consistent with the trends disclosed in “Management’s Discussion and Analysis of Financial Condition and Results of Operations.”
The table below provides a reconciliation of net income to adjusted net income for the six months ended June 30, 2014 and the six months ended June 30, 2015 (at the mid-point of the estimated net income range). Adjusted net income is not a measurement of financial performance under generally accepted accounting principles in the United States, or GAAP. See “—Summary Consolidated Financial Data” for a discussion of adjusted net income and its limitations.
| Six Months Ended June 30, |
||||||||
| 2014 | 2015(1) | |||||||
| Unaudited | ||||||||
| (dollars in thousands) |
||||||||
| Net income |
$ | 53,064 | $ | 52,065 | ||||
| Initial public offering preparation costs, net of tax of $454 and $810, respectively (2) |
726 | 1,325 | ||||||
| Litigation expenses, net of tax of $478 and $2,074, respectively (3) |
766 | 3,393 | ||||||
|
|
|
|
|
|||||
| Adjusted net income |
$ | 54,556 | $ | 56,783 | ||||
|
|
|
|
|
|||||
| (1) | Reflects the mid-point of the estimated net income range set forth above. |
10
Table of Contents
| (2) | Represents costs incurred in preparing for our initial public offering. |
| (3) | Represents costs primarily related to the litigation with Nestlé Purina PetCare Company. See “Business—Legal Proceedings.” |
We have presented ranges for net sales, net income and adjusted net income above, instead of specific numbers, as we are currently finalizing our financial closing procedures for the six months ended June 30, 2015 and therefore are not able to provide our actual results. The financial data for the six months ended June 30, 2015 presented above is preliminary, based upon our estimates and is subject to revision based upon our financial closing procedures and the completion of our financial statements. In particular, the ranges were determined based on our estimates of the potential aggregate adjustments that may be made to net sales, net income and adjusted net income as part of our financial closing procedures. Prior to the finalization of our financial closing procedures, we are currently unable to determine the nature of the adjustments to be made and, if such adjustments are made, the precise extent of those adjustments. Our actual results may be materially different from our estimates. In addition, these estimated results are not necessarily indicative of our results for the full fiscal year or any future period. The preliminary financial data has been prepared by, and is the responsibility of, management. KPMG LLP has not audited, reviewed, compiled or performed any procedures with respect to the accompanying preliminary financial data. Accordingly, KPMG LLP does not express an opinion or any other form of assurance with respect thereto.
Our Sponsor
Invus, L.P., or Invus or our Sponsor, has been our principal financial backer since its initial investment in 2006. Invus is a private investment firm based in New York. Invus benefits from an evergreen investment structure managing family capital with a long-term strategic perspective. Invus and its affiliates have been investing in companies who seek to transform their industries since 1985.
Our Corporate Information
We were originally formed as a limited liability company in August 2002 under the name The Blue Buffalo Company, LLC. In December 2006, we converted into a corporation under the name Blue Buffalo Company, Ltd. In July 2012, we undertook a corporate reorganization and exchanged the stock of Blue Buffalo Company, Ltd. for the stock of Blue Buffalo Pet Products, Inc., a newly formed Delaware corporation. As part of the corporate reorganization, Blue Buffalo Pet Products, Inc. established another Delaware corporation, Blue Pet Products, Inc., which then became the sole shareholder of Blue Buffalo Company, Ltd. Blue Buffalo Company, Ltd. remains our operating company.
Our principal offices are located 11 River Road, Suite 103, Wilton, Connecticut 06897. Our telephone number is (203) 762-9751. We maintain a website at www.bluebuffalo.com. The reference to our website is intended to be an inactive textual reference only. The information contained on, or that can be accessed through, our website is not part of this prospectus.
11
Table of Contents
THE OFFERING
| Common Stock offered by the Selling Stockholders |
29,483,727 shares (or 33,906,286 shares if the underwriters exercise their over-allotment option to purchase additional shares from the selling stockholders in full). |
| Common Stock issued by us to Non-Management Employees |
35,934 shares. See “LOYAL3 platform” below. |
| Common Stock to be Outstanding after this Offering |
196,034,108 shares. |
| Use of Proceeds |
We will not receive any proceeds from the sale of shares of our common stock in this offering by the selling stockholders or from the issuance of shares to certain non-management employees. However, we will pay certain expenses, other than underwriting discounts and commissions, associated with this offering. See “Use of Proceeds.” |
| Controlled Company |
Upon the closing of this offering, our Sponsor will own approximately 121.9 million shares, or 62.2%, of our outstanding common stock. As a result, we will be a “controlled company” within the meaning of the listing rules, and therefore will be exempt from certain of the corporate governance listing requirements, of the NASDAQ Global Select Market, or NASDAQ. |
| LOYAL3 platform |
At our request, the underwriters have reserved up to 5% of the shares of common stock offered by this prospectus to be offered to our employees, customers and partners and individual investors through the LOYAL3 platform. Any purchases of shares in this offering through the LOYAL3 platform will be at the initial public offering price. Up to 35,934 of the shares offered through the LOYAL3 platform will be allocated among certain non-management employees in amounts determined by us. Such employees will not be required to pay for these shares. See “Underwriting.” |
| Risk Factors |
Investing in shares of our common stock involves a high degree of risk. See “Risk Factors” beginning on page 18 of this prospectus for a discussion of factors you should carefully consider before investing in shares of our common stock. |
| NASDAQ trading symbol |
“BUFF.” |
In this prospectus, the number of shares of our common stock to be outstanding after this offering is based on 195,749,011 shares of our common stock outstanding as of June 30, 2015, and:
| • | excludes 4,411,139 shares of common stock issuable upon exercise of stock options outstanding as of June 30, 2015 under our 2012 Blue Buffalo Pet Products, Inc. Stock Purchase and Option Plan, or the 2012 Plan (excluding shares of common stock that will be issued to holders of such options for sale in this offering), at a weighted average exercise price of $5.89 per share; |
| • | excludes 8,400,000 shares of common stock reserved as of the closing date of this offering for future issuance under our 2015 Omnibus Incentive Plan, or the 2015 Plan; and |
| • | is adjusted to reflect the issuance of 249,163 shares of our common stock to holders of stock options under the 2012 Plan upon exercise thereof, which shares are to be sold in this offering. |
12
Table of Contents
Unless otherwise indicated, this prospectus reflects and assumes:
| • | the 4.2-for-1 stock split that we effectuated on July 7, 2015 and accounts for the adjustment of the exercise price of all outstanding stock options and the number of shares subject to such stock options; |
| • | the filing of our amended and restated certificate of incorporation and the adoption of our amended and restated bylaws, which will occur immediately prior to the effectiveness of the registration statement of which this prospectus forms a part; |
| • | no exercise by the underwriters of their over-allotment option to purchase additional shares of common stock; and |
| • | no exercise of outstanding options after June 30, 2015. |
13
Table of Contents
SUMMARY CONSOLIDATED FINANCIAL DATA
The following table presents summary consolidated financial data for the periods and at the dates indicated. The summary consolidated financial data as of December 31, 2013 and 2014 and for each of the three years in the period ended December 31, 2014 have been derived from our audited consolidated financial statements included elsewhere in this prospectus. The summary consolidated balance sheet data as of December 31, 2012 has been derived from our audited consolidated financial statements not included in this prospectus. The summary consolidated statement of income data for the three months ended March 31, 2014 and 2015 and the summary consolidated balance sheet data as of March 31, 2015 have been derived from our unaudited condensed consolidated financial statements included elsewhere in this prospectus. The summary consolidated balance sheet data as of March 31, 2014 has been derived from our unaudited consolidated financial statements not included in this prospectus. The unaudited condensed consolidated financial statements were prepared on a basis consistent with our audited consolidated financial statements and, in the opinion of management, reflect all adjustments, consisting only of normal and recurring adjustments, necessary for a fair statement of the financial information. The results for any interim period are not necessarily indicative of the results that may be expected for the full year. In addition, our historical results are not necessarily indicative of the results expected for any future periods.
You should read the following financial information together with the information under “Capitalization,” “Selected Consolidated Financial Data” and “Management’s Discussion and Analysis of Financial Condition and Results of Operations” and our consolidated financial statements and the related notes included elsewhere in this prospectus.
14
Table of Contents
| Fiscal Year Ended December 31, |
Three Months Ended March 31, |
|||||||||||||||||||
| 2012 | 2013 | 2014 | 2014 | 2015 | ||||||||||||||||
| (dollars in thousands, except share and per share amounts) | ||||||||||||||||||||
| Statements of Income Data: |
||||||||||||||||||||
| Net sales |
$ | 522,999 | $ | 719,509 | $ | 917,760 | $ | 226,247 | $ | 248,774 | ||||||||||
| Cost of sales |
311,050 | 421,897 | 550,893 | 129,912 | 149,240 | |||||||||||||||
|
|
|
|
|
|
|
|
|
|
|
|||||||||||
| Gross profit |
211,949 | 297,612 | 366,867 | 96,335 | 99,534 | |||||||||||||||
| Selling, general and administrative expenses |
93,539 | 138,986 | 187,864 | 42,722 | 47,399 | |||||||||||||||
|
|
|
|
|
|
|
|
|
|
|
|||||||||||
| Operating income |
118,410 | 158,626 | 179,003 | 53,613 | 52,135 | |||||||||||||||
| Interest expense |
10,209 | 20,640 | 13,887 | 3,221 | 3,734 | |||||||||||||||
| Loss on extinguishment of debt |
— | 15,918 | — | — | — | |||||||||||||||
| Interest income |
(152) | (125) | (173) | (25) | (51) | |||||||||||||||
|
|
|
|
|
|
|
|
|
|
|
|||||||||||
| Income before income taxes |
108,353 | 122,193 | 165,289 | 50,417 | 48,452 | |||||||||||||||
| Provision for income taxes |
42,853 | 43,957 | 63,358 | 19,264 | 18,406 | |||||||||||||||
|
|
|
|
|
|
|
|
|
|
|
|||||||||||
| Net income |
$ | 65,500 | $ | 78,236 | $ | 101,931 | $ | 31,153 | $ | 30,046 | ||||||||||
|
|
|
|
|
|
|
|
|
|
|
|||||||||||
| Basic net income per common share |
$ | 0.34 | $ | 0.40 | $ | 0.52 | $ | 0.16 | $ | 0.15 | ||||||||||
| Diluted net income per common share |
$ | 0.33 | $ | 0.40 | $ | 0.52 | $ | 0.16 | $ | 0.15 | ||||||||||
| Dividends declared and paid per common share |
$ | 2.05 | $ | — | $ | — | $ | — | $ | — | ||||||||||
| Basic weighted average shares |
195,298,147 | 195,619,943 | 195,735,309 | 195,720,894 | 195,745,670 | |||||||||||||||
| Diluted weighted average shares |
195,707,975 | 196,559,084 | 197,852,932 | 197,747,579 | 197,773,850 | |||||||||||||||
| Balance Sheet Data (end of period): |
||||||||||||||||||||
| Cash and cash equivalents |
$ | 45,770 | $ | 42,874 | $ | 95,788 | $ | 84,303 | $ | 149,044 | ||||||||||
| Working capital (1) |
88,141 | 116,704 | 207,939 | 142,472 | 235,397 | |||||||||||||||
| Property, plant, and equipment, net |
23,778 | 85,830 | 113,863 | 92,302 | 114,101 | |||||||||||||||
| Total assets |
160,518 | 254,797 | 387,172 | 303,531 | 423,021 | |||||||||||||||
| Total debt, including current maturities |
392,395 | 395,017 | 391,057 | 394,027 | 390,067 | |||||||||||||||
| Stockholders’ deficit |
(270,868) | (191,085) | (87,297) | (159,515) | (56,770) | |||||||||||||||
| Other Data: |
||||||||||||||||||||
| Adjusted net income (2) |
$ | 65,500 | $ | 88,930 | $ | 106,569 | $ | 31,348 | $ | 31,097 | ||||||||||
| Adjusted basic net income per common share (2) |
$ | 0.34 | $ | 0.45 | $ | 0.54 | $ | 0.16 | $ | 0.16 | ||||||||||
| Adjusted diluted net income per common share (2) |
$ | 0.33 | $ | 0.45 | $ | 0.54 | $ | 0.16 | $ | 0.16 | ||||||||||
| EBITDA (3) |
119,617 | 143,994 | 183,863 | 54,135 | 54,032 | |||||||||||||||
| Adjusted EBITDA (3) |
119,983 | 162,442 | 193,189 | 54,867 | 56,173 | |||||||||||||||
| Depreciation and amortization |
1,207 | 1,286 | 4,860 | 522 | 1,897 | |||||||||||||||
| Capital expenditures |
22,787 | 63,507 | 32,948 | 6,998 | 2,184 | |||||||||||||||
| (1) | Working capital is defined as current assets, including cash and cash equivalents, minus current liabilities. |
| (2) | Adjusted net income represents net income plus loss on extinguishment of debt and non-recurring and one-time items (comprising initial public offering preparation costs and litigation expenses), net of tax. We present adjusted net income because our management uses it as a supplemental measure in assessing our operating performance, and we believe that it is helpful to investors, securities analysts and other interested parties, in evaluating the performance of companies in our industry. We also believe adjusted net income is useful to management and |
15
Table of Contents
| investors, securities analysts and other interested parties as a measure of our comparative operating performance from period to period. Adjusted net income is not a measurement of financial performance under generally accepted accounting principles in the United States, or GAAP. It should not be considered an alternative to net income as a measure of our operating performance or any other measure of performance derived in accordance with GAAP. In addition, adjusted net income should not be construed as an inference that our future results will be unaffected by unusual or non-recurring items. Adjusted net income has limitations as an analytical tool, and you should not consider such measure either in isolation or as a substitute for analyzing our results as reported under GAAP. Our definition and calculation of adjusted net income is not necessarily comparable to other similarly titled measures used by other companies due to different methods of calculation. |
| Adjusted basic net income per common share is defined as adjusted net income divided by basic weighted average shares. Adjusted diluted net income per common share is defined as adjusted net income divided by diluted weighted average shares. |
The following table provides a reconciliation of net income to adjusted net income:
| Fiscal Year Ended December 31, |
Three Months Ended March 31, |
|||||||||||||||||||
| 2012 | 2013 | 2014 | 2014 | 2015 | ||||||||||||||||
| (dollars in thousands) |
||||||||||||||||||||
| Net income |
$ | 65,500 | $ | 78,236 | $ | 101,931 | $ | 31,153 | $ | 30,046 | ||||||||||
| Loss on extinguishment of debt, net of tax of $5,921 (2a) |
— | 9,997 | — | — | — | |||||||||||||||
| Initial public offering preparation costs, net of tax of $413, $1,109, $120 and $75, respectively (2b) |
— | 697 | 1,777 | 195 | 122 | |||||||||||||||
| Litigation expenses, net of tax of $1,760 and $570, respectively (2c) |
— | — | 2,861 | — | 929 | |||||||||||||||
|
|
|
|
|
|
|
|
|
|
|
|||||||||||
| Adjusted net income |
$ | 65,500 | $ | 88,930 | $ | 106,569 | $ | 31,348 | $ | 31,097 | ||||||||||
|
|
|
|
|
|
|
|
|
|
|
|||||||||||
| (2a) | Represents the loss on extinguishment of debt associated with the repricing of our senior secured credit facilities in December 2013. See Note 5 to our audited consolidated financial statements included elsewhere in this prospectus. |
| (2b) | Represents costs incurred in preparing for our initial public offering. |
| (2c) | Represents costs primarily related to the litigation with Nestlé Purina PetCare Company. See “Business—Legal Proceedings.” |
| (3) | EBITDA represents net income plus interest expense, less interest income and plus provision for income taxes and depreciation and amortization. Adjusted EBITDA represents EBITDA plus loss on extinguishment of debt, stock-based compensation and non-recurring and one-time items (comprising initial public offering preparation costs and litigation expenses). |
| We present EBITDA and Adjusted EBITDA because our management uses these as supplemental measures in assessing our operating performance, and we believe they are helpful to investors, securities analysts and other interested parties, in evaluating the performance of companies in our industry. We also believe EBITDA and Adjusted EBITDA are useful to management and investors, securities analysts and other interested parties as measures of our comparative operating performance from period to period. EBITDA and Adjusted EBITDA are not measurements of financial performance under GAAP. They should not be considered as alternatives to cash flow from operating activities, as measures of liquidity, or as alternatives to net income as a measure of our operating |
16
Table of Contents
| performance or any other measures of performance derived in accordance with GAAP. In addition, EBITDA and Adjusted EBITDA should not be construed as an inference that our future results will be unaffected by unusual or non-recurring items. EBITDA and Adjusted EBITDA have limitations as analytical tools, and you should not consider such measures either in isolation or as substitutes for analyzing our results as reported under GAAP. Our definitions and calculations of EBITDA and Adjusted EBITDA are not necessarily comparable to other similarly titled measures used by other companies due to different methods of calculation. |
The following table provides a reconciliation of net income to EBITDA and Adjusted EBITDA:
| Fiscal Year Ended December 31, |
Three Months Ended March 31, |
|||||||||||||||||||
| 2012 | 2013 | 2014 | 2014 | 2015 | ||||||||||||||||
| (dollars in thousands) |
||||||||||||||||||||
| Net income |
$ | 65,500 | $ | 78,236 | $ | 101,931 | $ | 31,153 | $ | 30,046 | ||||||||||
| Interest expense |
10,209 | 20,640 | 13,887 | 3,221 | 3,734 | |||||||||||||||
| Interest income |
(152 | ) | (125 | ) | (173 | ) | (25 | ) | (51 | ) | ||||||||||
| Provision for income taxes |
42,853 | 43,957 | 63,358 | 19,264 | 18,406 | |||||||||||||||
| Depreciation and amortization |
1,207 | 1,286 | 4,860 | 522 | 1,897 | |||||||||||||||
|
|
|
|
|
|
|
|
|
|
|
|||||||||||
| EBITDA |
$ | 119,617 | $ | 143,994 | $ | 183,863 | $ | 54,135 | $ | 54,032 | ||||||||||
| Loss on extinguishment of debt (3a) |
— | 15,918 | — | — | — | |||||||||||||||
| Initial public offering preparation costs (3b) |
— | 1,110 | 2,886 | 315 | 197 | |||||||||||||||
| Litigation expenses (3c) |
— | — | 4,621 | — | 1,499 | |||||||||||||||
| Stock-based compensation (3d) |
366 | 1,420 | 1,819 | 417 | 445 | |||||||||||||||
|
|
|
|
|
|
|
|
|
|
|
|||||||||||
| Adjusted EBITDA |
$ | 119,983 | $ | 162,442 | $ | 193,189 | $ | 54,867 | $ | 56,173 | ||||||||||
|
|
|
|
|
|
|
|
|
|
|
|||||||||||
| (3a) | Represents the loss on extinguishment of debt associated with the repricing of our senior secured credit facilities in December 2013. See Note 5 to our audited consolidated financial statements included elsewhere in this prospectus. |
| (3b) | Represents costs incurred in preparing for our initial public offering. |
| (3c) | Represents costs primarily related to the litigation with Nestlé Purina PetCare Company. See “Business—Legal Proceedings.” |
| (3d) | Represents non-cash, stock-based compensation expense. |
17
Table of Contents
Investing in our common stock involves a high degree of risk. You should carefully consider each of the following risk factors, as well as the other information in this prospectus, including our consolidated financial statements and the related notes, before deciding whether to invest in shares of our common stock. If any of the following risks actually occurs, our business, results of operations and financial condition may be materially adversely affected. In that event, the trading price of our common stock could decline and you could lose all or part of your investment.
Risks Related to Our Business and Industry
We may not be able to successfully implement our growth strategy on a timely basis or at all.
Our future success depends, in large part, on our ability to implement our growth strategy, including expanding distribution and improving placement of our products in the stores of our retail partners, attracting new consumers to our brand, introducing new products and product line extensions and expanding into new markets. Our ability to implement this growth strategy depends, among other things, on our ability to:
| • | enter into distribution and other strategic arrangements with retailers and other potential distributors of our products; |
| • | continue to effectively compete in specialty channels; |
| • | secure shelf space in the stores of our retail partners; |
| • | increase our brand recognition by effectively implementing our marketing strategy and advertising initiatives; |
| • | expand and maintain brand loyalty; |
| • | develop new products and product line extensions that appeal to consumers; |
| • | maintain and, to the extent necessary, improve our high standards for product quality, safety and integrity; |
| • | maintain sources for the required supply of quality raw ingredients to meet our growing demand; |
| • | successfully ramp up operations at our Heartland facility; and |
| • | identify and successfully enter and market our products in new geographic markets and market segments. |
We may not be able to successfully implement our growth strategy and may need to change our strategy. If we fail to implement our growth strategy or if we invest resources in a growth strategy that ultimately proves unsuccessful, our business, financial condition and results of operations may be materially adversely affected.
The growth of our business depends on our ability to accurately predict consumer trends and demand and successfully introduce new products and product line extensions and improve existing products.
Our growth depends, in part, on our ability to successfully introduce new products and product line extensions and improve and reposition our existing products to meet the requirements of pet parents and the dietary needs of their pets. This, in turn, depends on our ability to predict and respond to evolving consumer trends, demands and preferences. The development and introduction of innovative new products and product line
18
Table of Contents
extensions involve considerable costs. In addition, it may be difficult to establish new supplier relationships and determine appropriate product selection when developing a new product or product line extension. Any new product or product line extension may not generate sufficient customer interest and sales to become a profitable product or to cover the costs of its development and promotion and may reduce our operating income. In addition, any such unsuccessful effort may adversely affect our brand. If we are not able to anticipate, identify or develop and market products that respond to changes in requirements and preferences of pet parents and their pets or if our new product introductions or repositioned products fail to gain consumer acceptance, we may not grow our business as anticipated, our sales may decline and our business, financial condition and results of operations may be materially adversely affected.
Any damage to our reputation or our brand may materially adversely affect our business, financial condition and results of operations.
Maintaining our strong reputation with consumers, our retail partners and our suppliers is critical to our success. Our brand may suffer if our marketing plans or product initiatives are not successful. The importance of our brand may increase if competitors offer more products with formulations similar to ours. Further, our brand may be negatively impacted due to real or perceived quality issues or if consumers perceive us as being untruthful in our marketing and advertising, even if such perceptions are not accurate. Product contamination, the failure to maintain high standards for product quality, safety and integrity, including raw materials and ingredients obtained from suppliers, or allegations of product quality issues, mislabeling or contamination, even if untrue or caused by our third-party contract manufacturers or raw material suppliers, may reduce demand for our products or cause production and delivery disruptions. We maintain guidelines and procedures to ensure the quality, safety and integrity of our products. However, we may be unable to detect or prevent product and/or ingredient quality issues, mislabeling or contamination, particularly in instances of fraud or attempts to cover up or obscure deviations from our guidelines and procedures. For example, we recently discovered that a facility owned by a major supplier of ingredients to the pet food industry, including Blue Buffalo, for a period of time, had mislabeled as “chicken meal” or “turkey meal” ingredients that contained other poultry-based ingredients that were inappropriate for inclusion in “chicken meal” or “turkey meal” under industry standards, and it appears that this mislabeling was deliberate. If any of our products become unfit for consumption, cause injury or are mislabeled, we may have to engage in a product recall and/or be subject to liability. Damage to our reputation or our brand or loss of consumer confidence in our products for any of these or other reasons could result in decreased demand for our products and our business, financial condition and results of operations may be materially adversely affected.
Our growth and business are dependent on trends that may change or not continue, and our historical growth may not be indicative of our future growth.
The growth of the overall pet food industry depends primarily on the continuance of current trends in humanization of pets and premiumization of pet foods as well as on general economic conditions, the size of the pet population and average dog size. The growth of the Wholesome Natural market segment and our business, in particular, depends on the continuance of such humanization and premiumization trends and secular health and wellness trends. These trends may not continue or may change. In the event of a decline in the overall number or average size of pets, a change in the humanization, premiumization or health and wellness trends or during challenging economic times, we may be unable to persuade our customers and consumers to purchase our branded products instead of lower-priced products, and our business, financial condition and results of operations may be materially adversely affected and our growth rate may slow or stop. In addition, while we expect that our net sales will continue to increase, we believe that our growth rate will decline in the future as our scale increases.
There may be decreased spending on pets in a challenging economic climate.
The United States and other countries have experienced and continue to experience challenging economic conditions. Our business, financial condition and results of operations may be materially adversely
19
Table of Contents
affected by a challenging economic climate, including adverse changes in interest rates, volatile commodity markets and inflation, contraction in the availability of credit in the market and reductions in consumer spending. In addition, a slow-down in the general economy or a shift in consumer preferences for economic reasons or otherwise to regional, local or Private Label products or other less expensive products may result in reduced demand for our products which may affect our profitability. The keeping of pets and the purchase of pet-related products may constitute discretionary spending for some of our consumers and any material decline in the amount of consumer discretionary spending may reduce overall levels of pet ownership or spending on pets. As a result, a challenging economic climate may cause a decline in demand for our products which could be disproportionate as compared to competing pet food brands since our products command a price premium. In addition, we cannot predict how current or worsening economic conditions will affect our retail partners, suppliers and distributors. If economic conditions result in decreased spending on pets and have a negative impact on our retail partners, suppliers or distributors, our business, financial condition and results of operations may be materially adversely affected.
Our business depends, in part, on the sufficiency and effectiveness of our marketing and trade promotion programs.
Due to the highly competitive nature of our industry, we must effectively and efficiently promote and market our products through television, internet and print advertisements as well as trade promotions and incentives to sustain our competitive position in our market. Marketing investments may be costly. In addition, we may, from time to time, change our marketing strategies and spending, including the timing or nature of our trade promotions and incentives. We may also change our marketing strategies and spending in response to actions by our competitors and other pet food companies. For instance, starting in the second half of 2013, the largest pet food company in the United States initiated a significant increase in its promotional spending, which resulted in other pet food companies, including us, increasing their own promotional spending. The sufficiency and effectiveness of our marketing and trade promotions and incentives are important to our ability to retain and/or improve our market share and margins. If our marketing and trade promotions and incentives are not successful or if we fail to implement sufficient and effective marketing and trade promotions and incentives or adequately respond to changes in our competitors’ marketing strategies, our business, financial condition and results of operations may be adversely affected.
If we are unable to maintain or increase prices, our margins may decrease.
Our success depends in part upon our ability to persuade consumers to purchase our branded products, which generally command a price premium as compared to prices of Engineered and Private Label products. Some products in the Engineered market segment may be labeled as “natural” in accordance with the AAFCO regulatory definition even though they do not satisfy all the requirements of the Wholesome Natural market segment. These products are often priced lower than ours and even if we do not increase prices, consumers may choose to purchase such products instead of ours, based on the fact that such products cost less but yet are still labeled as “natural.”
We rely in part on price increases to offset cost increases and improve the profitability of our business. Our ability to maintain prices or effectively implement price increases may be affected by a number of factors, including competition, effectiveness of our marketing programs, the continuing strength of our brand, market demand and general economic conditions, including inflationary pressures. In particular, in response to increased promotional activity by other pet food companies, we have increased our promotional spending, which has resulted in a lower average price per pound for our products and has adversely impacted our gross margins. During challenging economic times, consumers may be less willing or able to pay a price premium for our branded products and may shift purchases to lower-priced or other value offerings, making it more difficult for us to maintain prices and/or effectively implement price increases. In addition, our retail partners and distributors may pressure us to rescind price increases that we have announced or already implemented, whether through a change in list price or increased promotional activity. If we are unable to maintain or increase prices for our
20
Table of Contents
products or must increase promotional activity, our margins may be adversely affected. Furthermore, price increases generally result in volume losses, as consumers purchase fewer units. If such losses are greater than expected or if we lose distribution due to a price increase, our business, financial condition and results of operations may be materially adversely affected.
If our products are alleged to cause injury or illness or fail to comply with governmental regulations, we may need to recall our products and may experience product liability claims.
Our products may be exposed to product recalls, including voluntary recalls or withdrawals, if they are alleged to pose a risk of injury or illness, or if they are alleged to have been mislabeled, misbranded or adulterated or to otherwise be in violation of governmental regulations. We may also voluntarily recall or withdraw products in order to protect our brand or reputation if we determine that they do not meet our standards, whether for palatability, appearance or otherwise. In 2010, we voluntarily issued a recall of certain of our products due to possible excess Vitamin D present in specific production runs caused by an error occurring at an ingredient supplier. This recall resulted in a reduction to net sales and the incurrence of incremental expenses in 2010. If there is any future product recall or withdrawal, it could result in substantial and unexpected expenditures, destruction of product inventory, damage to our reputation and lost sales due to the unavailability of the product for a period of time, and our business, financial condition and results of operations may be materially adversely affected.
We also may be subject to product liability claims if the consumption or use of our products is alleged to cause injury or illness. While we carry product liability insurance, our insurance may not be adequate to cover all liabilities that we may incur in connection with product liability claims. For example, punitive damages are generally not covered by insurance. If we are subject to substantial product liability claims in the future, we may not be able to continue to maintain our existing insurance, obtain comparable insurance at a reasonable cost, if at all, or secure additional coverage. This could result in future product liability claims being uninsured. If there is a product liability judgment against us or a settlement agreement related to a product liability claim, our business, financial condition and results of operations may be materially adversely affected.
We are dependent on a relatively limited number of retailer customers for a significant portion of our sales.
We sell our products to retail partners and distributors in specialty channels. Our two largest retail partners, PetSmart and Petco, accounted for 58% and 20% of our net sales for the year ended December 31, 2012, 53% and 22% of our net sales for the year ended December 31, 2013, 49% and 24% of our net sales for the year ended December 31, 2014 and 47% and 24% of our net sales for the three months ended March 31, 2015, respectively. If we were to lose any of our key customers, if any of our retail partners reduce the amount of their orders or if any of our key customers consolidate, reduce their store footprint and/or gain greater market power, our business, financial condition and results of operations may be materially adversely affected. In addition, we may be similarly adversely impacted if any of our key customers experience any operational difficulties or generate less traffic.
In addition, we do not enter into contracts with national pet superstores and certain other large retailers, and we do not have long-term contracts with our other customers. As a result, we rely on our consumers’ continuing demand for our products and our position in the market for all purchase orders. If our retail partners or distributor customers change their pricing and margin expectations, change their business strategies as a result of industry consolidation or otherwise, reduce the number of brands they carry or amount of shelf space they allocate to our products, or allocate greater shelf space to, or increase their advertising or promotional efforts for, Private Label or another brand’s products, our sales could decrease and our business, financial condition and results of operations may be materially adversely affected.
21
Table of Contents
We rely upon a limited number of contract manufacturers to provide a significant portion of our supply of products.
There is limited available manufacturing capacity that meets our quality standards. Our current plans to meet expected production needs rely in large part on the successful ramping up of operations at our Heartland facility in Joplin, Missouri. See “—Risks Related to Our Business and Industry—We may not successfully ramp up operations at our Heartland facility or our Heartland facility may not operate in accordance with our expectations.”
We have agreements with a network of contract manufacturers that require them to provide us with specific finished products. Most of our agreements with our contract manufacturers expire in 2015 and will thereafter be automatically renewed for consecutive one-year terms until notice of non-renewal is given. Upon expiration of our existing agreements with these contract manufacturers, we may not be able to renegotiate the terms of our agreements with these contract manufacturers on a commercially reasonable basis, or at all.
During the years ended December 31, 2012, 2013 and 2014 and the three months ended March 31, 2015, approximately 73%, 69%, 68% and 54% of our cost of sales, respectively, was derived from products purchased from the Company’s five largest contract manufacturers. We manufacture our canned wet foods at two different locations owned by a single contract manufacturer and certain of our treats and cat litter products are also manufactured by single-source contract manufacturers. The manufacture of our products may not be easily transferable to other sites in the event that any of our contract manufacturers experience breakdown, failure or substandard performance of equipment, disruption of supply or shortages of raw materials and other supplies, labor problems, power outages, adverse weather conditions and natural disasters or the need to comply with environmental and other directives of governmental agencies. From time to time, a contract manufacturer may experience financial difficulties, bankruptcy or other business disruptions, which could disrupt our supply of finished goods or require that we incur additional expense by providing financial accommodations to the contract manufacturer or taking other steps to seek to minimize or avoid supply disruption, such as establishing a new contract manufacturing arrangement with another provider.
The loss of any of these contract manufacturers or the failure for any reason of any of these contract manufacturers to fulfill their obligations under their agreements with us, including a failure to meet our quality controls and standards, may result in disruptions to our supply of finished goods. We may be unable to locate an additional or alternate contract manufacturing arrangement that meets our quality controls and standards in a timely manner or on commercially reasonable terms, if at all.
To the extent our retailer customers purchase products in excess of consumer consumption in any period, our sales in a subsequent period may be adversely affected as our customers seek to reduce their inventory levels.
From time to time, our retailer customers may purchase more product than they expect to sell to consumers during a particular time period. Our retailer customers may grow their inventory in anticipation of, or during, our promotional events, which typically provide for reduced prices during a specified time or other customer or consumer incentives. Our retailer customers may also grow inventory in anticipation of a price increase for our products, or otherwise over-order our products as a result of overestimating demand for our products. If a retailer customer increases its inventory during a particular reporting period as a result of a promotional event, anticipated price increase or otherwise, then sales during the subsequent reporting period may be adversely impacted as our customers seek to reduce their inventory to customary levels. This effect may be particularly pronounced when the promotional event, price increase or other event occurs near the end or beginning of a reporting period or when there are changes in the timing of a promotional event, price increase or similar event, as compared to the prior year. To the extent our retailer customers seek to reduce their usual or customary inventory levels or change their practices regarding purchases in excess of consumer consumption, our net sales and results of operations may be materially adversely affected in that period.
22
Table of Contents
We operate in a highly competitive industry and may lose market share or experience margin erosion if we are unable to compete effectively.
The pet food industry is highly competitive. We compete on the basis of product quality and palatability, brand awareness and loyalty, product variety and ingredients, interesting product names, product packaging and package design, shelf space, reputation, price and promotional efforts. We compete with a significant number of companies of varying sizes, including divisions or subsidiaries of larger companies who may have greater financial resources and larger customer bases than we have. As a result, these competitors may be able to identify and adapt to changes in consumer preferences more quickly than us due to their resources and scale. They may also be more successful in marketing and selling their products, better able to increase prices to reflect cost pressures and better able to increase their promotional activity, which may impact us and the entire pet food industry. Increased promotional activity may include increasing the size of packaging, which in turn has in the past reduced and may in the future reduce foot traffic at retailers and the number of opportunities we have to educate pet parents about the benefits of BLUE. While some of these larger companies have entered the Wholesome Natural market segment through new brand introductions, brand extensions and/or acquisitions, and have also launched brands and products that have some but not all of the Wholesome Natural market segment’s characteristics, they have not gained significant share within the Wholesome Natural market segment. However, we expect that they will continue to attempt to penetrate the Wholesome Natural market segment, whether by introducing or acquiring new Wholesome Natural brands, launching brand extensions or increasing the promotion of existing Wholesome Natural brands and pet food products, all of which will increase our direct competition. We also compete with other companies who focus solely on manufacturing Wholesome Natural pet foods that may be smaller, more innovative and/or able to bring products to market faster and move more quickly to exploit and serve niche markets. If these competitive pressures cause our products to lose market share or experience margin erosion, our business, financial conditions and results of operations may be materially adversely affected.
We may face issues with respect to raw materials and other supplies, including increased costs, disruptions of supply, shortages, contaminations, adulterations or mislabeling.
We and our contract manufacturers use various raw materials and other supplies in our business, including ingredients, packaging materials and fuel. The prices of our raw materials and other supplies are subject to fluctuations attributable to, among other things, changes in supply and demand of crops or other commodities, weather conditions, agricultural uncertainty or governmental incentives and controls.
We generally do not have long-term supply contracts with our ingredient suppliers. The length of the contracts is fixed for a period of time, typically up to a year or for a season and/or a crop year. In addition, some of our raw materials are sourced from a limited number of suppliers. We may not be able to renew or enter into new contracts with our existing suppliers following the expiration of such contracts on commercially reasonable terms, or at all. We purchase some of our raw materials in the open market, and although we aim to enter into fixed price and/or fixed quantity contracts for a pre-determined amount of our ingredients to reduce short term price volatility in certain commodities, these activities may not successfully reduce or stabilize the costs of our raw materials and supplies. If commodity prices increase or our procurement or future hedging activities are not effective, we may not be able to increase our prices to offset these increased costs. Moreover, our competitors may be better able than we are to implement productivity initiatives or effect price increases or to otherwise pass along cost increases to their customers.
Some of the raw materials we use are vulnerable to adverse weather conditions and natural disasters, such as floods, droughts, frosts, earthquakes and pestilences and may be impacted by climate change and other factors. Adverse weather conditions and natural disasters can reduce crop size and crop quality, which in turn could reduce supplies of raw materials, increase the prices of raw materials, increase costs of storing raw materials and interrupt or delay our production schedules if harvests are delayed. Our competitors may not be impacted by such weather conditions and natural disasters depending on the location of their suppliers and operations.
23
Table of Contents
If any of our raw materials or supplies are alleged or proven to include contaminants affecting the safety or quality of our products (including, for example, bacteria, mold or as a result of animal or human-related pandemics, such as outbreaks of bovine spongiform encephalopathy, foot-and-mouth disease, avian influenza, or any other disease), we may need to find alternate materials or supplies, delay production of our products, discard or otherwise dispose of our products, or engage in a product recall, all of which may have a materially adverse effect on our business, financial condition and results of operations.
We may be unable to detect or prevent the use of ingredients which do not meet our quality standards if our ingredient suppliers engage in fraud or attempt to cover up or obscure deviations from our guidelines and procedures. For example, we recently discovered that a facility owned by a major supplier of ingredients to the pet food industry, including Blue Buffalo, for a period of time, had mislabeled as “chicken meal” or “turkey meal” ingredients that contained other poultry-based ingredients that were inappropriate for inclusion in “chicken meal” or “turkey meal” under industry standards, and it appears that this mislabeling was deliberate. This supplier was one of our primary sources of chicken meal and turkey meal. Any such conduct by any of our suppliers may result in a loss of consumer confidence in our brand and products and a reduction in our sales if consumers perceive us as being untruthful in our marketing and advertising and may materially adversely affect our brand, reputation, business, financial condition and results of operations.
If our sources of raw materials and supplies are terminated or affected by adverse prices, weather conditions or quality concerns, we may not be able to identify alternate sources of raw materials or other supplies that meet our quality controls and standards to sustain our sales volumes or on commercially reasonable terms, or at all.
We are involved in litigation with Nestlé Purina PetCare Company and related class action lawsuits that include allegations of false advertising relating to the ingredients contained in our pet food. Regardless of whether we are successful in our defense of these claims or in our counter claims, this litigation may adversely affect our brand, reputation, business, financial condition and results of operations.
On May 6, 2014, Nestlé Purina PetCare Company, or Nestlé Purina, filed a lawsuit against us in the United States District Court for the Eastern District of Missouri, alleging that we have engaged in false advertising, commercial disparagement and unjust enrichment. Nestlé Purina asserts that, contrary to our advertising claims, certain BLUE products contain chicken or poultry by-product meals, artificial preservatives and/or corn and that certain products in the BLUE grain-free lines contain grains. Nestlé Purina also alleges that we have made false claims that our products (including LifeSource Bits) provide superior nutrition and health benefits compared to our competitors’ products. In addition, Nestlé Purina contends that we have been unjustly enriched as consumers have paid a premium for BLUE products in reliance on these alleged false and misleading statements, at the expense of our competitors. Nestlé Purina seeks an injunction prohibiting us from making these alleged false and misleading statements, as well as treble damages, restitution and disgorgement of our profits, among other things. In connection with the litigation, Nestlé Purina has also issued press releases and made other public announcements, including advertising and promotional communications through emails and internet and social media websites that make claims similar to those contained in their lawsuit. Nestlé Purina subsequently amended its complaint to seek a declaratory judgment that these statements by Nestlé Purina about us are true and do not constitute defamation. Nestlé Purina later amended its complaint a second time to supplement certain allegations and to add a claim regarding the advertising for one of our pet treats. In addition, a number of related consumer class action lawsuits have been filed making allegations similar to Nestlé Purina’s and seeking monetary damages and injunctive relief. Other than two consumer class actions, one of which was recently filed on June 22, 2015 in the Orangeburg County Court of Common Pleas in the State of South Carolina and the other on June 29, 2015 in the Orleans Parish District Court in the State of Louisiana, all of the related consumer class actions have been consolidated under a Multi-District Litigation file also pending in the United States District Court for the Eastern District of Missouri.
On May 14, 2014, we filed a lawsuit against Nestlé Purina in the United States District Court for the Eastern District of Missouri, alleging that Nestlé Purina has engaged in false advertising, unfair competition, unjust enrichment and defamation. We allege that the statements made by Nestlé Purina advertising the
24
Table of Contents
allegations of their lawsuit are false and misleading, and we deny that our product formulas contain chicken or poultry by-product meals, artificial preservatives or corn and we deny that any of our grain-free products contain grains. We also assert that Nestlé Purina’s statements falsely imply that our products are not made in the United States and are subject to quality control issues. We allege that Nestlé Purina’s conduct as described in this lawsuit is aimed at destroying the reputation and goodwill of the BLUE brand and may induce consumers to make purchasing decisions based on Nestlé Purina’s false and misleading representations about the composition and sourcing of BLUE products. Our complaint in this lawsuit seeks, among other things, a preliminary and permanent injunction prohibiting Nestlé Purina from disseminating such false information, as well as damages (including punitive damages), restitution and disgorgement of all profits attributable to their false and deceptive advertising. On June 4, 2014, this lawsuit was consolidated with the Nestlé Purina lawsuit. We have since amended our pleading to name as additional defendants the two advertising and public relations agencies that assisted Nestlé Purina with its advertising campaign.
In the course of pretrial discovery in the consolidated Nestlé Purina lawsuit, beginning in September 2014 documents and information were revealed that indicate that a facility owned by a major supplier of ingredients to the pet food industry, including Blue Buffalo, for a period of time, had mislabeled as “chicken meal” or “turkey meal” ingredients that contained other poultry-based ingredients that were inappropriate for inclusion in “chicken meal” or “turkey meal” under industry standards, and it appears that this mislabeling was deliberate. This conduct was undertaken by the supplier without our knowledge, and we have since ceased purchasing ingredients from this supplier. This supplier was one of our primary sources of chicken meal and turkey meal. As a result of the supplier’s conduct, our advertising claims of “no chicken or poultry by-product meals” were inaccurate as to products containing the mislabeled ingredients. Therefore, we may be exposed to false advertising liability to Nestlé Purina and others to the extent a claimant can prove they were injured by our actions. Such liability may be material. We have brought third-party indemnity and damages claims, with respect to the Nestlé Purina lawsuit, against the supplier that mislabeled the ingredients, as well as the broker for such mislabeled ingredients, and also have insurance coverage for some of the Nestlé Purina lawsuit claims. We also have brought damages and indemnity claims against such supplier and broker with respect to the class action lawsuits. However, we may not be able to fully recover from such supplier, broker or from our insurance the full amount of any damages we might incur in these matters.
We are vigorously defending ourselves against the Nestlé Purina and related class action lawsuits. However, Nestlé Purina’s allegations, whether made in their lawsuit or through press releases, social media or other public announcements, may result in a loss of consumer confidence in our brand and products and a reduction in our sales if consumers perceive us as being untruthful in our marketing and advertising and may materially adversely affect our brand, reputation, business, financial condition and results of operations, regardless of the outcome of the litigation and any damages we may recover from Nestlé Purina. In addition, if we do not prevail in our defense of these claims, we may be required to pay substantial damages and may not be able to fully recover those damages from either our insurance, the ingredient supplier, the ingredient broker or any other responsible parties. In addition, we may be enjoined from continuing certain marketing and advertising practices, which have been an important driver of the growth of our brand and business. If the relief sought in the Nestlé Purina lawsuit or any related lawsuit is granted, the impact on the Company could be material. We expect these legal proceedings will be costly and time consuming and will require a commitment of management and personnel resources that will be diverted from our normal business operations. In addition, during the course of this litigation, we anticipate announcements of the court’s decisions in connection with hearings, motions and other matters, as well as other interim developments related to the litigation. If securities analysts or investors regard these announcements as being unfavorable to us, the market price of our common stock may decline.
We may not successfully ramp up operations at our Heartland facility or our Heartland facility may not operate in accordance with our expectations.
In September 2014, we commenced manufacturing operations at our Heartland facility in Joplin, Missouri and expect to ramp up the facility to full production by the third quarter of 2015. Any substantial delay in bringing this facility up to full production on our current schedule may hinder our ability to produce all of the
25
Table of Contents
product needed to meet orders and/or to achieve our expected financial performance. Opening this facility has required, and bringing this facility up to full production will continue to require, additional capital expenditures and the efforts and attention of our management and other personnel, which has and will continue to divert resources from our existing business operations. Even if our Heartland facility is brought up to full production according to our current schedule, our Heartland facility may not provide us with all of the operational and financial benefits that we expect to receive.
Once our Heartland facility ramps up to full capacity, we expect it will provide us with in-house dry food manufacturing of up to 30 million pounds a month and account for 50-60% of our forecasted dry food production needs over the next several years. Our Heartland facility is located in an area susceptible to tornadoes and other adverse weather conditions, and the damage or destruction of such facility due to fire or natural disasters, including tornadoes, power failures or disruptions or equipment breakdown, failure or substandard performance could severely affect our ability to operate it. Our Heartland facility and the manufacturing equipment we use to produce our products would be difficult or costly to replace or repair and may require substantial lead-time to do so. For example, if we were unable to use our Heartland facility, the use of any new facility would need to be approved by various federal and local planning, zoning and health agencies, including the U.S. Department of Agriculture, the Missouri Department of Health and the Missouri Department of Agriculture, and registered with the FDA, in addition to passing our internal quality assurance requirements which may take up to 18 months and would result in significant production delays. We also may not be able to find suitable alternatives with contract manufacturers on a timely basis and at a reasonable cost. In addition, we may in the future experience plant shutdowns or periods of reduced production as a result of regulatory issues, equipment failure or delays in deliveries. Any such disruption or unanticipated event may cause significant interruptions or delays in our business and loss of inventory and/or data or render us unable to accept and fulfill customer orders in a timely manner, or at all. We have property and business disruption insurance coverage in place for our Heartland facility. However, such insurance coverage may not be sufficient to cover all of our potential losses and may not continue to be available to us on acceptable terms, or at all.
We may not be able to manage our manufacturing and supply chain effectively which may adversely affect our results of operations.
We must accurately forecast demand for our products in order to ensure we have adequate available manufacturing capacity. Our forecasts are based on multiple assumptions which may cause our estimates to be inaccurate and affect our ability to obtain adequate manufacturing capacity (whether our own manufacturing capacity or contract manufacturing capacity) in order to meet the demand for our products, which could prevent us from meeting increased customer or consumer demand and harm our brand and our business. However, if we overestimate our demand and overbuild our capacity, we may have significantly underutilized assets and may experience reduced margins. If we do not accurately align our manufacturing capabilities with demand, our business, financial condition and results of operations may be materially adversely affected.
In addition, we must continuously monitor our inventory and product mix against forecasted demand. If we underestimate demand, we risk having inadequate supplies. We also face the risk of having too much inventory on hand that may reach its expiration date and become unsaleable, and we may be forced to rely on markdowns or promotional sales to dispose of excess or slow-moving inventory. If we are unable to manage our supply chain effectively, our operating costs could increase and our profit margins could decrease.
We rely upon a number of third parties to manage or provide distribution centers for our products.
In addition to our Heartland warehouse which we operate, our distribution operations include the use of two third-party distribution centers as well as the use of third parties to manage such distribution centers. These third-party distribution centers may distribute our products as well as the products of other companies. Our distribution operations at these third-party distribution centers could be disrupted by a number of factors, including labor issues, failure to meet customer standards, bankruptcy or other financial issues affecting our
26
Table of Contents
third-party providers, or other issues affecting any such third party’s ability to service our customers effectively. If there is any disruption of these distribution centers, our business may be materially adversely affected.
If we continue to grow rapidly, we may not be able to manage our growth effectively.
Our net sales have grown from $523.0 million in 2012 to $719.5 million in 2013 and to $917.8 million in 2014. Our historical rapid growth has placed and, if continued, may continue to place significant demands on our management and our operational and financial resources. Our organizational structure may become more complex as we add additional staff, and we may require valuable resources to grow and continue to improve our operational, management and financial controls without undermining our strong corporate culture of entrepreneurship and collaboration that has been a strong contributor to our growth so far. If we are not able to manage our growth effectively, our business, financial condition and results of operations may be materially adversely affected.
Our market size estimate may prove to be inaccurate.
Data for pet food retail sales is collected for most, but not all channels, and as a result, it is difficult to estimate the size of the market and predict the rate at which the market for our products will grow, if at all. While our market size estimate, which is similar to Euromonitor’s market size estimate of the U.S. pet food industry, was made in good faith and is based on assumptions and estimates we believe to be reasonable, this estimate may not be accurate.
We may face difficulties as we expand into countries in which we have no prior operating experience.
We intend to continue to expand our global footprint by entering into new markets. As we expand our business into new countries we may encounter foreign economic, political, regulatory, personnel, technological, language barriers and other risks that increase our expenses or delay our ability to become profitable in such countries. These risks include:
| • | fluctuations in currency exchange rates; |
| • | the difficulty of enforcing agreements and collecting receivables through some foreign legal systems; |
| • | customers in some foreign countries potentially having longer payment cycles; |
| • | changes in local tax laws, tax rates in some countries that may exceed those of the United States or Canada and lower earnings due to withholding requirements or the imposition of tariffs, exchange controls or other restrictions; |
| • | seasonal reductions in business activity; |
| • | the credit risk of local customers and distributors; |
| • | general economic and political conditions; |
| • | unexpected changes in legal, regulatory or tax requirements; |
| • | differences in language, culture and trends in foreign countries with respect to pets and pet care; |
| • | the difficulties associated with managing a large global organization; |
| • | the risk that certain governments may adopt regulations or take other actions that would have a direct or indirect adverse impact on our business and market opportunities, including nationalization of private enterprise; |
27
Table of Contents
| • | non-compliance with applicable currency exchange control regulations, transfer pricing regulations or other similar regulations; |
| • | violations of the Foreign Corrupt Practices Act by acts of agents and other intermediaries whom we have limited or no ability to control; and |
| • | violations of regulations enforced by the U.S. Department of The Treasury’s Office of Foreign Asset Control. |
In addition, our expansion into new countries may require significant resources and the efforts and attention of our management and other personnel, which will divert resources from our existing business operations. As we expand our business globally, our success will depend, in large part, on our ability to anticipate and effectively manage these and other risks associated with our operations outside of the United States and Canada.
We may seek to grow our business through acquisitions of or investments in new or complementary businesses, facilities, technologies or products, or through strategic alliances, and the failure to manage acquisitions, investments or strategic alliances, or the failure to integrate them with our existing business, could have a material adverse effect on us.
From time to time we may consider opportunities to acquire or make investments in new or complementary businesses, facilities, technologies or products, or enter into strategic alliances, that may enhance our capabilities, expand our manufacturing network, complement our current products or expand the breadth of our markets. Potential and completed acquisitions and investments and other strategic alliances involve numerous risks, including:
| • | problems assimilating the purchased business, facilities, technologies or products; |
| • | issues maintaining uniform standards, procedures, controls and policies; |
| • | unanticipated costs associated with acquisitions, investments or strategic alliances; |
| • | diversion of management’s attention from our existing business; |
| • | adverse effects on existing business relationships with suppliers, contract manufacturers, retail partners and distribution customers; |
| • | risks associated with entering new markets in which we have limited or no experience; |
| • | potential loss of key employees of acquired businesses; and |
| • | increased legal and accounting compliance costs. |
We do not know if we will be able to identify acquisitions or strategic relationships we deem suitable, whether we will be able to successfully complete any such transactions on favorable terms or at all or whether we will be able to successfully integrate any acquired business, facilities, technologies or products into our business or retain any key personnel, suppliers or customers. Our ability to successfully grow through strategic transactions depends upon our ability to identify, negotiate, complete and integrate suitable target businesses, facilities, technologies and products and to obtain any necessary financing. These efforts could be expensive and time-consuming and may disrupt our ongoing business and prevent management from focusing on our operations. If we are unable to integrate any acquired businesses, facilities, technologies and products effectively, our business, results of operations and financial condition could be materially adversely affected.
28
Table of Contents
Our substantial indebtedness may have a material adverse effect on our business, financial condition and results of operations.
As of March 31, 2015, we had a total of $390.1 million of indebtedness, consisting of amounts outstanding under our term loan facilities, and a total availability of $40.0 million under our revolving credit facility. Our indebtedness could have significant consequences, including:
| • | requiring a substantial portion of our cash flows to be dedicated to debt service payments instead of funding growth, working capital, capital expenditures, investments or other cash requirements; |
| • | reducing our flexibility to adjust to changing business conditions or obtain additional financing; |
| • | exposing us to the risk of increased interest rates as certain of our borrowings, including borrowings under our term loan facilities are at variable rates; |
| • | making it more difficult for us to make payments on our indebtedness; |
| • | restricting us from making strategic acquisitions or causing us to make non-strategic divestitures; |
| • | subjecting us to restrictive covenants that may limit our flexibility in operating our business; and |
| • | limiting our ability to obtain additional financing for working capital, capital expenditures, debt service requirements and general corporate or other purposes. |
If our cash from operations is not sufficient to meet our current or future operating needs, expenditures and debt service obligations, our business, financial condition and results of operations may be materially adversely affected.
Our ability to generate cash to meet our operating needs, expenditures and debt service obligations will depend on our future performance and financial condition, which will be affected by financial, business, economic legislative, regulatory and other factors, including potential changes in costs, pricing, the success of product innovation and marketing, competitive pressure and consumer preferences. If our cash flow and capital resources are insufficient to fund our debt service obligations and other cash needs, we could face substantial liquidity problems and could be forced to reduce or delay investments and capital expenditures or to dispose of material assets or operations, seek additional debt or equity capital or restructure or refinance our indebtedness. Our revolving credit facility and our term loan facilities restrict our ability to take these actions and we may not be able to affect any such alternative measures on commercially reasonable terms or at all. If we cannot make scheduled payments on our debt, the lenders under our senior secured credit facilities can terminate their commitments to loan money, can declare all outstanding principal and interest to be due and payable and foreclose against the assets securing their borrowings and we could be forced into bankruptcy or liquidation. In addition, any downgrade of our debt ratings by any of the major rating agencies, which could result from our financial performance, acquisitions or other factors, would also negatively impact our access to additional debt financing (including leasing) or refinancing on favorable terms, or at all. Even if we are successful in taking any such alternative actions, such actions may not allow us to meet our scheduled debt service obligations and, as a result, our business, financial condition and results of operations may be materially adversely affected.
Failure to protect our intellectual property could harm our competitive position or require us to incur significant expenses to enforce our rights.
Our trademarks such as “Blue Buffalo,” “LifeSource Bits,” “Life Protection Formula,” “BLUE Basics,” “BLUE Freedom,” and “BLUE Wilderness” along with the BLUE shield logo, the Blue Buffalo figure logo and the tag line “Love them like family. Feed them like family.” are valuable assets that support our brand and consumers’ perception of our products. We rely on trademark, copyright, trade secret, patent and other
29
Table of Contents
intellectual property laws, as well as nondisclosure and confidentiality agreements and other methods, to protect our trademarks, trade names, proprietary information, technologies and processes. Our non-disclosure agreements and confidentiality agreements may not effectively prevent disclosure of our proprietary information, technologies and processes and may not provide an adequate remedy in the event of unauthorized disclosure of such information, which could harm our competitive position. In addition, effective patent, copyright, trademark and trade secret protection may be unavailable or limited for some of our trademarks and patents in some foreign countries. We may need to engage in litigation or similar activities to enforce our intellectual property rights, to protect our trade secrets or to determine the validity and scope of proprietary rights of others. Any such litigation could require us to expend significant resources and divert the efforts and attention of our management and other personnel from our business operations. If we fail to protect our intellectual property, our business, financial condition and results of operations may be materially adversely affected.
We may be subject to intellectual property infringement claims or other allegations, which could result in substantial damages and diversion of management’s efforts and attention.
We have obligations with respect to the non-use and non-disclosure of third-party intellectual property. The steps we take to prevent misappropriation, infringement or other violation of the intellectual property of others may not be successful. From time to time, third parties have asserted intellectual property infringement claims against us and our customers and may continue to do so in the future. While we believe that our products do not infringe in any material respect upon proprietary rights of other parties and/or that meritorious defenses would exist with respect to any assertions to the contrary, we may from time to time be found to infringe on the proprietary rights of others. For example, patent applications in the United States and some foreign countries are generally not publicly disclosed until the patent is issued or published and we may not be aware of currently filed patent applications that relate to our products or processes. If patents later issue on these applications, we may be found liable for subsequent infringement.
Any claims that our products or processes infringe these rights, regardless of their merit or resolution, could be costly and may divert the efforts and attention of our management and technical personnel. We may not prevail in such proceedings given the complex technical issues and inherent uncertainties in intellectual property litigation. If such proceedings result in an adverse outcome, we could, among other things, be required to:
| • | pay substantial damages (potentially treble damages in the United States); |
| • | cease the manufacture, use or sale of the infringing products; |
| • | discontinue the use of the infringing processes; |
| • | expend significant resources to develop non-infringing processes; and |
| • | enter into licensing arrangements from the third party claiming infringement, which may not be available on commercially reasonable terms, or may not be available at all. |
If any of the foregoing occurs, our ability to compete could be affected or our business, financial condition and results of operations may be materially adversely affected.
A failure of one or more key information technology systems, networks, or processes may materially adversely affect our ability to conduct our business.
The efficient operation of our business depends on our information technology systems. We rely on our information technology systems to effectively manage our sales and marketing, accounting and financial and legal and compliance functions, engineering and product development tasks, research and development data, communications, supply chain, order entry and fulfillment and other business processes. The failure of our
30
Table of Contents
information technology systems to perform as we anticipate could disrupt our business and could result in transaction errors, processing inefficiencies and the loss of sales and customers, causing our business and results of operations to suffer. In addition, our information technology systems may be vulnerable to damage or interruption from circumstances beyond our control, including fire, natural disasters, power outages, systems failures, security breaches, cyber-attacks and computer viruses. The failure of our information technology systems to perform as we anticipate or our failure to effectively implement new systems could disrupt our entire operation and could result in decreased sales, increased overhead costs, excess inventory and product shortages and a loss of important information. Further, to the extent that we may have customer information in our databases, any unauthorized disclosure of, or access to, such information could result in claims under data protection laws and regulations. If any of these risks materialize, our reputation and our ability to conduct our business may be materially adversely affected.
We are subject to extensive governmental regulation and we may incur material costs in order to comply with existing or future laws and regulation, and our failure to comply may result in enforcement, recalls and other adverse actions.
We are subject to a broad range of federal, state and local laws and regulations intended to protect public health, natural resources and the environment. See “Business—Government Regulation.” Our operations are subject to regulation by the Occupational Safety and Health Administration, the FDA, the Department of Agriculture, or USDA, and by various state, local and foreign authorities regarding the processing, packaging, storage, distribution, advertising, labeling and export of our products, including food safety standards.
The FDA classifies products as either food or drug depending on the claims made by the manufacturer regarding such products, and the FDA has recently focused attention on nutritional pet food products that it believes to carry therapeutic claims. These include claims such as “hairball control,” “improved digestibility” and “urinary tract health.” Products that provide nutrients in support of an animal’s daily nutrient needs but which are also labeled as being intended for use to diagnose, cure, mitigate, treat or prevent disease may meet the statutory definitions of both a food and a drug. We currently produce products, such as cat food with hairball management, that undergo FDA pre-market inspection. While we believe that we market our products in accordance with the applicable FDA regulatory requirements, the FDA may classify some of our products differently than we do, and may impose more stringent regulations which could lead to alleged regulatory violations, enforcement actions and product recalls. For example, a manufacturer of animal drugs must comply with the FDA’s Good Manufacturing Practices, or GMPs, for the manufacture of pharmaceutical products and is subject to FDA inspection to confirm its compliance. We intend to produce more products that we anticipate will be subject to FDA pre-market inspection, including new products we introduce to the Therapeutic market segment.
In 2011, the FDA Food Safety Modernization Act, or FSMA, became law. The FSMA included an amendment to the Federal Food, Drug, and Cosmetic Act, or FFDCA, which gives the FDA authority to mandate pet food recall. The FSMA also includes a number of other provisions designed to enhance food safety, including increased inspections by the FDA of domestic and foreign food facilities and increased review of food products imported into the United States. In addition to periodic government agency inspections affecting our operations generally, our operations, which produce meat and poultry products, are subject to mandatory continuous on-site inspections by the USDA. The FSMA also mandates that the FDA adopt preventative controls to be implemented by pet food facilities in order to minimize or prevent hazards to food safety. In October 2013, the FDA issued a proposed rule entitled “Current Good Manufacturing Practice and Hazard Analysis and Risk-Based Preventive Controls for Food for Animals.” An updated proposed rule was issued in September 2014. The proposed rule would establish GMPs in the manufacturing, processing, packing and holding of animal food. In addition, the proposed rule would require certain facilities to establish and implement hazard analysis and risk-based preventive controls for food for animals.
Complying with government regulation can be costly or may otherwise adversely affect our business. Our business is also affected by import and export controls and similar laws and regulations, both in the United States and elsewhere. Issues such as national security or health and safety, which may slow or otherwise
31
Table of Contents
restrict imports or exports, may adversely affect our business. Violations of or liability under any of these laws and regulations may result in administrative, civil or criminal penalties against us, revocation or modification of applicable permits, environmental investigations or remedial activities, voluntary or involuntary product recalls, warning or untitled letters or cease and desist orders against operations that are not in compliance, among other things. These laws and regulations may change in the future and we may incur (directly, or indirectly through our contract manufacturers) material costs to comply with current or future laws and regulations or in any required product recalls. In addition, we and our contract manufacturers are subject to additional regulatory requirements, including compliance with the environmental, health and safety laws and regulations administered by the U.S. Environmental Protection Agency, or the EPA, state environmental regulatory agencies (including the Missouri Department of Natural Resources) and the National Labor Relations Board. Such laws and regulations generally have become more stringent over time and may become more so in the future. Costs of compliance, and the impacts on us of any non-compliance, with any such laws and regulations could materially adversely affect our business, financial condition and results of operations.
There has been a recent trend in consumer class actions against food companies with respect to the use of the term “natural” in advertisements and on labels to describe human food products, and it is possible that there may be a similar trend in the future with respect to pet food products. There is no single U.S. government regulated definition of the term “natural” for use in the pet food industry. Currently, most states in the United States have adopted the AAFCO definitions and labeling guidelines relating to the term “natural” on pet food labels. Under the AAFCO’s ingredient definitions and labeling guidelines, a pet food is designated as “natural” if it contains only ingredients that are derived solely from plant, animal or mined sources, has not been subject to a chemically synthetic process and does not contain any chemically synthetic additives (other than synthetically derived vitamin, minerals or trace nutrients that are added to enhance nutrition that are disclosed on the label). Although we believe that our labels and advertisements that identify our products as “natural” comply with the applicable laws and regulations, we may still be subject to related claims and lawsuits, which could have a material adverse effect on our reputation, business and results of operations. In addition, the AAFCO definition of “natural” or the definition of “natural” as adopted by states in the United States may change in the future. In such event, we may need to change our product specifications and formulations in order to continue to be classified as “natural” under the updated definition, which may result in increased costs and could adversely affect our results of operations.
Certain groups and individuals have recently proposed laws and regulations at the state and federal levels, requiring disclosure of the presence of genetically modified organisms, or GMOs, on labels of pet food products. If any of these laws and regulations are adopted, we may incur material costs to comply with such laws and regulations and could be subject to liabilities if we fail to timely comply, which could materially adversely affect our reputation, business, financial condition and results of operations.
Adverse litigation judgments or settlements resulting from legal proceedings relating to our business operations could materially adversely affect our business, financial condition and results of operations.
From time to time, we are subject to allegations, and may be party to legal claims and regulatory proceedings, relating to our business operations. Such allegations, claims and proceedings may be brought by third parties, including our customers, employees, governmental or regulatory bodies or competitors. Defending against such claims and proceedings is costly and time consuming and may divert management’s attention and personnel resources from our normal business operations, and the outcome of many of these claims and proceedings cannot be predicted. If any of these claims or proceedings were to be determined adversely to us, a judgment, a fine or a settlement involving a payment of a material sum of money were to occur, or injunctive relief were issued against us, our business, financial condition and results of operations could be materially adversely affected.
32
Table of Contents
Our success depends on our ability to attract and retain key employees and the succession of senior management as well as team members within stores.
Our continued growth and success requires us to hire, retain and develop our leadership bench. If we are unable to attract and retain talented, highly qualified senior management and other key executives, as well as provide for the succession of senior management, our growth and results of operations may be adversely impacted.
Our success also depends on our ability to continue to attract, motivate and retain employees who understand and appreciate our culture and are able to represent our brand effectively, including our Pet Detectives who interact with consumers in stores. If we are unable to attract, train and retain new employees and new team members to act as Pet Detectives, this could delay or prevent the implementation of our business strategy and in turn, lead to fewer sales of our products. In addition, we have in the past been a defendant in a purported class action by former and current Pet Detectives, which alleged certain violations of wage and labor laws in California and Oregon, and we may be subject to other claims in the future.
Risks Related to this Offering and Ownership of our Common Stock
We are a “controlled company” within the meaning of NASDAQ rules and, as a result, qualify for exemptions from certain corporate governance requirements.
Our Sponsor will continue to control a majority of the voting power of our outstanding common stock after completion of this offering. Under NASDAQ rules a listed company of which more than 50% of the voting power for the election of directors is held by another person or group of persons acting together is a “controlled company” and such a company may elect not to comply with certain NASDAQ corporate governance requirements, including the requirement (1) that a majority of the Board of Directors consist of independent directors, (2) to have a compensation committee that is composed entirely of independent directors with a written charter addressing the committee’s purpose and responsibilities and (3) that our director nominations be made, or recommended to the full Board of Directors, by our independent directors or by a nominations committee that is composed entirely of independent directors and that we adopt a written charter or board resolution addressing the nominations process. We have elected to be treated as a “controlled company” following this offering. Accordingly, our stockholders may not have the same protections afforded to stockholders of companies that are subject to all of the NASDAQ corporate governance requirements.
Our Sponsor controls us and its interests may conflict with yours in the future.
Immediately following this offering, our Sponsor will beneficially own 62.2% of our common stock, or 60.5% if the underwriters exercise in full their over-allotment option to purchase additional shares from the selling stockholders. Our Sponsor will be able to control the election and removal of our directors and thereby determine our corporate and management policies, including potential mergers or acquisitions, payment of dividends, asset sales, amendment of our amended and restated certificate of incorporation or amended and restated bylaws and other significant corporate transactions for so long as our Sponsor and its affiliates retain significant ownership of us. This concentration of our ownership may delay or deter possible changes in control of the Company, which may reduce the value of an investment in our common stock. So long as our Sponsor continues to own a significant amount of our combined voting power, even if such amount is less than 50%, our Sponsor will continue to be able to strongly influence or effectively control our decisions and, so long as our Sponsor and its affiliates collectively own at least 5% of all outstanding shares of our stock entitled to vote generally in the election of directors, it will be able to appoint individuals to our Board of Directors under the amended and restated investor rights agreement we have entered into with the Sponsor. See “Certain Relationships and Related Party Transactions — Investor Rights Agreement.” The interests of our Sponsor may not coincide with the interests of other holders of our common stock.
33
Table of Contents
In the ordinary course of their business activities, our Sponsor and its affiliates may engage in activities where their interests conflict with our interests or those of our stockholders. Our amended and restated certificate of incorporation will provide that none of our Sponsor, any of its affiliates or any director who is not employed by us (including any non-employee director who serves as one of our officers in both his director and officer capacities) or his or her affiliates will have any duty to refrain from engaging, directly or indirectly, in the same business activities or similar business activities or lines of business in which we operate. Our Sponsor also may pursue acquisition opportunities that may be complementary to our business and, as a result, those acquisition opportunities may not be available to us. In addition, our Sponsor may have an interest in pursuing acquisitions, divestitures and other transactions that, in its judgment, could enhance its investment, even though such transactions might involve risks to you.
We will incur increased costs and become subject to additional regulations and requirements as a result of becoming a newly public company, and our management will be required to devote substantial time to new compliance matters, which could lower our profits or make it more difficult to run our business.
As a newly public company, we will incur significant legal, accounting and other expenses that we have not incurred as a private company, including costs associated with public company reporting requirements and costs of recruiting and retaining non-executive directors. We also have incurred and will incur costs associated with the Sarbanes-Oxley Act and related rules implemented by the Securities and Exchange Commission, or the SEC, and NASDAQ. The expenses incurred by public companies generally for reporting and corporate governance purposes have been increasing. We expect these rules and regulations to increase our legal and financial compliance costs and to make some activities more time-consuming and costly, although we are currently unable to estimate these costs with any degree of certainty. Our management will need to devote a substantial amount of time to ensure that we comply with all of these requirements. These laws and regulations also could make it more difficult or costly for us to obtain certain types of insurance, including director and officer liability insurance, and we may be forced to accept reduced policy limits and coverage or incur substantially higher costs to obtain the same or similar coverage. These laws and regulations could also make it more difficult for us to attract and retain qualified persons to serve on our Board of Directors, our board committees or as our executive officers. Furthermore, if we are unable to satisfy our obligations as a public company, we could be subject to delisting of our common stock, fines, sanctions and other regulatory action and potentially civil litigation.
There may not be an active trading market for shares of our common stock, which may cause shares of our common stock to trade at a discount from the initial offering price and make it difficult to sell the shares of common stock you purchase.
Prior to this offering, there has not been a public trading market for shares of our common stock. It is possible that after this offering an active trading market will not develop or continue or, if developed, that any market will be sustained which would make it difficult for you to sell your shares of common stock at an attractive price or at all. The initial public offering price per share of common stock will be determined by agreement among us and the representatives of the underwriters, and may not be indicative of the price at which shares of our common stock will trade in the public market after this offering. The market price of our common stock may decline below the initial offering price and you may not be able to sell your shares of our common stock at or above the price you paid in this offering, or at all.
The market price of shares of our common stock may be volatile, which could cause the value of your investment to decline.
Even if a trading market develops, the market price of our common stock may be highly volatile and could be subject to wide fluctuations. Securities markets worldwide experience significant price and volume fluctuations. This market volatility, as well as general economic, market or political conditions, could reduce the market price of shares of our common stock in spite of our operating performance. In addition, our results of operations could be
34
Table of Contents
below the expectations of public market analysts and investors due to a number of potential factors, including variations in our quarterly results of operations, additions or departures of key management personnel, failure to meet analysts’ earnings estimates, publication of research reports about our industry, litigation and government investigations, changes or proposed changes in laws or regulations or differing interpretations or enforcement thereof affecting our business, adverse market reaction to any indebtedness we may incur or securities we may issue in the future, changes in market valuations of similar companies or speculation in the press or investment community, announcements by our competitors of significant contracts, acquisitions, dispositions, strategic partnerships, joint ventures or capital commitments, adverse publicity about our industry in or individual scandals, and in response the market price of shares of our common stock could decrease significantly. You may be unable to resell your shares of common stock at or above the initial public offering price.
In the past few years, stock markets have experienced extreme price and volume fluctuations. In the past, following periods of volatility in the overall market and the market price of a company’s securities, securities class action litigation has often been instituted against these companies. This litigation, if instituted against us, could result in substantial costs and a diversion of our management’s attention and resources, or at all.
Because we have no current plans to pay cash dividends on our common stock, you may not receive any return on investment unless you sell your common stock for a price greater than that which you paid for it.
We have no current plans to pay cash dividends on our common stock. The declaration, amount and payment of any future dividends will be at the sole discretion of our Board of Directors. Our Board of Directors may take into account general and economic conditions, our financial condition and results of operations, our available cash and current and anticipated cash needs, capital requirements, contractual, legal, tax and regulatory restrictions and implications on the payment of dividends by us to our stockholders or by our subsidiaries to us, including restrictions under our senior secured credit facilities and other indebtedness we may incur, and such other factors as our Board of Directors may deem relevant.
Blue Buffalo Pet Products, Inc. is a holding company with no operations of its own and, as such, it depends on its subsidiaries for cash to fund all of its operations and expenses, including future dividend payments, if any.
Our operations are conducted almost entirely through our subsidiaries and our ability to generate cash to meet our debt service obligations or to make future dividend payments, if any, is highly dependent on the earnings and the receipt of funds from our subsidiaries via dividends or intercompany loans. We do not currently expect to declare or pay dividends on our common stock for the foreseeable future; however, to the extent that we determine in the future to pay dividends on our common stock, the credit agreement governing our revolving credit facility significantly restricts the ability of our subsidiaries to pay dividends or otherwise transfer assets to us. In addition, Delaware law may impose requirements that may restrict our ability to pay dividends to holders of our common stock.
You may be diluted by the future issuance of additional common stock in connection with our incentive plans, acquisitions or otherwise.
After this offering we will have approximately 1,304 million shares of common stock authorized but unissued. Our amended and restated certificate of incorporation to become effective immediately prior to the effectiveness of the registration statement of which this prospectus forms a part authorizes us to issue these shares of common stock and options relating to common stock for the consideration and on the terms and conditions established by our Board of Directors in its sole discretion, whether in connection with acquisitions or otherwise. We have reserved shares for issuance under the 2012 Plan and the 2015 Plan. See “Executive Compensation.” Any common stock that we issue, including under the 2012 Plan, the 2015 Plan or other equity incentive plans that we may adopt in the future, would dilute the percentage ownership held by the investors who purchase common stock in this offering.
35
Table of Contents
Future sales, or the perception of future sales, by us or our existing stockholders in the public market following this offering could cause the market price for our common stock to decline.
The sale of substantial amounts of shares of our common stock in the public market, or the perception that such sales could occur, including sales by our Sponsor, could harm the prevailing market price of shares of our common stock. These sales, or the possibility that these sales may occur, also might make it more difficult for us to sell equity securities in the future at a time and at a price that we deem appropriate. Upon completion of this offering we will have a total of 196,034,108 shares of our common stock outstanding. Of the outstanding shares, the 29,519,661 shares sold or issued in this offering (or 33,942,220 shares if the underwriters exercise their over-allotment option to purchase additional shares) will be freely tradable without restriction or further registration under the Securities Act of 1933, as amended, or Securities Act, except that any shares held by our affiliates, as that term is defined under Rule 144 of the Securities Act, may be sold only in compliance with the limitations described in “Shares Eligible for Future Sale.”
The remaining outstanding 166,514,447 shares of common stock held by our existing stockholders after this offering will be subject to certain restrictions on resale. We, our executive officers, directors and all our existing stockholders, including the selling stockholders, will sign lock-up agreements with the underwriters that will, subject to certain customary exceptions, restrict the sale of the shares of our common stock and certain other securities held by them for 180 days following the date of this prospectus. J.P. Morgan Securities LLC and Citigroup Global Markets Inc. may, in their sole discretion and at any time without notice, release all or any portion of the shares or securities subject to any such lock-up agreements. See “Underwriting” for a description of these lock-up agreements.
Upon the expiration of the lock-up agreements described above, all of such 166,514,447 shares (or 162,129,478 shares if the underwriters exercise their over-allotment option to purchase additional shares in full) will be eligible for resale in a public market, subject, in the case of shares held by our affiliates, to volume, manner of sale and other limitations under Rule 144. We expect that our Sponsor will be considered an affiliate 180 days after this offering based on their expected share ownership (consisting of 121,934,327 shares), as well as their board nomination rights. Certain other of our stockholders may also be considered affiliates at that time.
We intend to file one or more registration statements on Form S-8 under the Securities Act to register shares of our common stock or securities convertible into or exchangeable for shares of our common stock issued pursuant to the 2015 Plan. Any such Form S-8 registration statements will automatically become effective upon filing. Accordingly, shares registered under such registration statements will be available for sale in the open market. We expect that the initial registration statement on Form S-8 will cover 22,432,061 shares of our common stock.
As restrictions on resale end, the market price of our shares of common stock could drop significantly if the holders of these restricted shares sell them or are perceived by the market as intending to sell them. These factors could also make it more difficult for us to raise additional funds through future offerings of our shares of common stock or other securities.
Anti-takeover provisions in our organizational documents and Delaware law might discourage or delay acquisition attempts for us that you might consider favorable.
Our amended and restated certificate of incorporation and amended and restated bylaws to become effective immediately prior to the effectiveness of the registration statement of which this prospectus forms a part will contain provisions that may make the merger or acquisition of the Company more difficult without the approval of our Board of Directors. Among other things:
| • | although we do not have a stockholder rights plan, these provisions would allow us to authorize the issuance of undesignated preferred stock in connection with a stockholder rights plan or otherwise, the terms of which may be established and the shares of which may be issued without stockholder approval, and which may include super voting, special approval, dividend, or other rights or preferences superior to the rights of the holders of common stock; |
36
Table of Contents
| • | these provisions provide for a classified Board of Directors with staggered three-year terms; |
| • | these provisions require advance notice for nominations of directors by stockholders and for stockholders to include matters to be considered at our annual meetings; |
| • | these provisions prohibit stockholder action by written consent from and after the date on which our Sponsor, The Bishop Family Limited Partnership, or the Bishop Family Partnership, and their affiliates beneficially own, in the aggregate, less than 40% of our outstanding shares of common stock; |
| • | these provisions provide for the removal of directors only for cause and only upon affirmative vote of holders of at least 66 2/3% of the shares of common stock entitled to vote generally in the election of directors if our Sponsor, the Bishop Family Partnership and their affiliates beneficially own, in the aggregate, less than 40% of our outstanding shares of common stock; and |
| • | these provisions require the amendment of certain provisions only by the affirmative vote of at least 66 2/3% of the shares of common stock entitled to vote generally in the election of directors if our Sponsor, the Bishop Family Partnership and their affiliates beneficially own, in the aggregate, less than 40% of our outstanding shares of common stock. |
Further, as a Delaware corporation, we are also subject to provisions of Delaware law, which may impair a takeover attempt that our stockholders may find beneficial. These anti-takeover provisions and other provisions under Delaware law could discourage, delay or prevent a transaction involving a change in control of the Company, including actions that our stockholders may deem advantageous, or negatively affect the trading price of our common stock. These provisions could also discourage proxy contests and make it more difficult for you and other stockholders to elect directors of your choosing and to cause us to take other corporate actions you desire.
We are an “emerging growth company” and we cannot be certain if the reduced disclosure requirements applicable to “emerging growth companies” will make our common stock less attractive to investors.
We are an “emerging growth company,” as defined in the JOBS Act, and we may take advantage of certain exemptions and relief from various reporting requirements that are applicable to other public companies that are not “emerging growth companies.” In particular, while we are an “emerging growth company” (1) we will not be required to comply with the auditor attestation requirements of Section 404(b) of the Sarbanes-Oxley Act, (2) we will be exempt from any rules that may be adopted by the PCAOB requiring mandatory audit firm rotations or a supplement to the auditor’s report on financial statements, (3) we will be subject to reduced disclosure obligations regarding executive compensation in our periodic reports and proxy statements and (4) we will not be required to hold nonbinding advisory votes on executive compensation or stockholder approval of any golden parachute payments not previously approved. We currently intend to take advantage of the reduced disclosure requirements regarding executive compensation. If we remain an “emerging growth company” after fiscal 2015, we may take advantage of other exemptions, including the exemptions from the advisory vote requirements and executive compensation disclosures under the Dodd-Frank Wall Street Reform and Customer Protection Act, or the Dodd-Frank Act, and the exemption from the provisions of Section 404(b) of the Sarbanes-Oxley Act.
In addition, Section 107 of the JOBS Act provides that an emerging growth company can take advantage of the extended transition period provided in Section 7(a)(2)(B) of the Securities Act for complying with new or revised accounting standards, meaning that the company can delay the adoption of certain accounting standards until those standards would otherwise apply to private companies. We have irrevocably elected not to avail ourselves of this exemption from new or revised accounting standards and, therefore, will be subject to the same new or revised accounting standards as other public companies that are not emerging growth companies.
We may remain an “emerging growth company” until the fiscal year-end following the fifth anniversary of the completion of this initial public offering, though we may cease to be an “emerging growth company”
37
Table of Contents
earlier under certain circumstances, including (1) if we become a large accelerated filer, (2) if our gross revenue exceeds $1.0 billion in any fiscal year or (3) if we issue more than $1.0 billion in non-convertible notes in any three year period.
The exact implications of the JOBS Act are still subject to interpretations and guidance by the SEC and other regulatory agencies, and we cannot assure you that we will be able to take advantage of all of the benefits of the JOBS Act. In addition, investors may find our common stock less attractive if we rely on the exemptions and relief granted by the JOBS Act. If some investors find our common stock less attractive as a result, there may be a less active trading market for our common stock and our stock price may decline and/or become more volatile.
Our Board of Directors is authorized to issue and designate shares of our preferred stock in additional series without stockholder approval.
Our amended and restated certificate of incorporation authorizes our Board of Directors, without the approval of our stockholders, to issue 150 million shares of our preferred stock, subject to limitations prescribed by applicable law, rules and regulations and the provisions of our amended and restated certificate of incorporation, as shares of preferred stock in series, to establish from time to time the number of shares to be included in each such series and to fix the designation, powers, preferences and rights of the shares of each such series and the qualifications, limitations or restrictions thereof. The powers, preferences and rights of these additional series of preferred stock may be senior to or on parity with our common stock, which may reduce its value.
38
Table of Contents
SPECIAL NOTE REGARDING FORWARD-LOOKING STATEMENTS
This prospectus includes forward-looking statements that reflect our current views with respect to, among other things, our operations and financial performance. These forward-looking statements are included throughout this prospectus, including in the sections entitled “Prospectus Summary,” “Risk Factors,” “Management’s Discussion and Analysis of Financial Condition and Results of Operations” and “Business” and relate to matters such as our industry, business strategy, goals and expectations concerning our market position, future operations, margins, profitability, capital expenditures, liquidity and capital resources and other financial and operating information. We have used the words “anticipate,” “assume,” “believe,” “continue,” “could,” “estimate,” “expect,” “intend,” “may,” “plan,” “potential,” “predict,” “project,” “future,” “will,” “seek,” “foreseeable” and similar terms and phrases to identify forward-looking statements in this prospectus.
The forward-looking statements contained in this prospectus are based on management’s current expectations and are subject to uncertainty and changes in circumstances. We cannot assure you that future developments affecting us will be those that we have anticipated. Actual results may differ materially from these expectations due to changes in global, regional or local economic, business, competitive, market, regulatory and other factors, many of which are beyond our control. We believe that these factors include but are not limited to those described under “Risk Factors.” These factors should not be construed as exhaustive and should be read in conjunction with the other cautionary statements that are included in this prospectus. Should one or more of these risks or uncertainties materialize, or should any of our assumptions prove incorrect, our actual results may vary in material respects from those projected in these forward-looking statements.
Any forward-looking statement made by us in this prospectus speaks only as of the date of this prospectus. Factors or events that could cause our actual results to differ may emerge from time to time, and it is not possible for us to predict all of them. We may not actually achieve the plans, intentions or expectations disclosed in our forward-looking statements and you should not place undue reliance on our forward-looking statements. Our forward-looking statements do not reflect the potential impact of any future acquisitions, mergers, dispositions, joint ventures, investments or other strategic transactions we may make. We undertake no obligation to publicly update or review any forward-looking statement, whether as a result of new information, future developments or otherwise, except as may be required by any applicable securities laws.
TRADEMARKS, TRADE NAMES AND SERVICE MARKS
This prospectus includes our trademarks, trade names and service marks, such as “Blue Buffalo,” “LifeSource Bits,” “Life Protection Formula,” “BLUE Basics,” “BLUE Freedom,” and “BLUE Wilderness,” as well as the BLUE shield logo, the Blue Buffalo figure logo and the tag line “Love them like family. Feed them like family.” which are protected under applicable intellectual property laws and are our property. This prospectus also contains trademarks, trade names and service marks of other companies, which are the property of their respective owners. Solely for convenience, trademarks and trade names referred to in this prospectus may appear without the ®, TM or SM symbols, but such references are not intended to indicate, in any way, that we will not assert, to the fullest extent under applicable law, our rights or the right of the applicable licensor to these trademarks, trade names and service marks. We do not intend our use or display of other parties’ trademarks, trade names or service marks to imply, and such use or display should not be construed to imply, a relationship with, or endorsement or sponsorship of us by, these other parties.
39
Table of Contents
The selling stockholders are selling 33,906,286 shares of our common stock in this offering, which includes the 4,422,559 shares, if any, that may be sold in connection with the exercise of the underwriters’ over-allotment option. We will be issuing 35,934 shares of our common stock to certain non-management employees without cost to such employees. See “Principal and Selling Stockholders” and “Underwriting.” We will not receive any proceeds from the sale of shares of our common stock in this offering by the selling stockholders or from the issuance of shares to certain non-management employees. However, we will pay certain expenses, other than underwriting discounts and commissions, associated with this offering.
40
Table of Contents
During 2012, the Board of Directors approved the payment of two special dividends. On August 15, 2012, the Board of Directors declared a special dividend of $1.79 per share to shareholders of record on such date for a total of $350.0 million. In addition, on December 17, 2012, the Board of Directors declared an additional special dividend of $0.26 per share to shareholders of record on such date for a total of $50.0 million. The dividends were paid using proceeds from the $350.0 million term loan facility we entered into on August 8, 2012 and the subsequent $50.0 million incremental term loan facility entered into on December 6, 2012.
Although we have paid cash dividends on our capital stock in the past, we currently expect to retain all future earnings for use in the operation and expansion of our business and have no current plans to pay dividends. The declaration, amount and payment of any future dividends will be at the sole discretion of our Board of Directors. Our Board of Directors may take into account general and economic conditions, our financial condition and results of operations, our available cash and current and anticipated cash needs, capital requirements, contractual, legal, tax and regulatory restrictions and implications on the payment of dividends by us to our stockholders or by our subsidiaries to us, including restrictions under our senior secured credit facilities and other indebtedness we may incur, and such other factors as our Board of Directors may deem relevant. In addition, because we are a holding company and have no direct operations, we will only be able to pay dividends from funds we receive from our subsidiaries.
41
Table of Contents
The following table sets forth our cash and cash equivalents and capitalization as of March 31, 2015, on:
| • | an actual basis; and |
| • | an as adjusted basis to give effect to the following, as if each had occurred on March 31, 2015: (1) the issuance of 249,163 shares of our common stock to holders of stock options under the 2012 Plan upon exercise thereof, which shares are to be sold in this offering and (2) the issuance of 35,934 shares of common stock to certain non-management employees in connection with this offering based on an assumed price of $17.00 per share, which is the mid-point of the price range set forth on the cover page. |
You should read this table together with “Prospectus Summary—Summary Consolidated Financial Data,” “Selected Consolidated Financial Data,” “Management’s Discussion and Analysis of Financial Condition and Results of Operations,” “Underwriting” and our audited consolidated financial statements and unaudited condensed consolidated financial statements and the related notes included elsewhere in this prospectus.
| (in thousands) | As of March 31, 2015 |
|||||||
| Actual | As Adjusted | |||||||
| Cash and cash equivalents (1) |
$ | 149,044 | $ | 150,471 | ||||
|
|
|
|
|
|||||
| Long-term debt (including current maturities) |
||||||||
| Revolving credit facility (2) |
— | — | ||||||
| Term loan facilities |
390,067 |
|
390,067 |
| ||||
|
|
|
|
|
|||||
| Total long-term debt |
390,067 | 390,067 | ||||||
|
|
|
|
|
|||||
| Stockholders’ deficit: |
||||||||
| Common stock, $0.01 par value; authorized 207,060,000 shares, issued and outstanding 195,747,774 shares, actual; authorized 207,060,000 shares, issued and outstanding 196,032,871 shares, as adjusted |
1,957 | 1,960 | ||||||
| Additional paid-in capital |
58,164 | |
60,200 |
| ||||
| Accumulated deficit |
(116,891) | (117,270) | ||||||
|
|
|
|
|
|||||
| Total stockholders’ deficit |
(56,770) | (55,110) | ||||||
|
|
|
|
|
|||||
| Total capitalization |
$ | 482,341 | $ | 485,428 | ||||
|
|
|
|
|
|||||
| (1) | Does not reflect offering expenses, which we estimate to be approximately $6.6 million. |
| (2) | Our revolving credit facility consists of a $40.0 million revolving credit facility maturing on August 8, 2017. As of March 31, 2015, there were no outstanding borrowings under our revolving credit facility. |
42
Table of Contents
SELECTED CONSOLIDATED FINANCIAL DATA
The following table presents selected consolidated financial data for the periods and at the dates indicated. The selected consolidated financial data as of December 31, 2013 and 2014 and for each of the three years in the period ended December 31, 2014 have been derived from our audited consolidated financial statements included elsewhere in this prospectus. The selected consolidated balance sheet data as of December 31, 2010, 2011 and 2012 has been derived from our audited consolidated financial statements not included in this prospectus. The selected consolidated statement of income data for each of the two years in the period ended December 31, 2011 have been derived from our audited consolidated financial statements that do not appear in this prospectus (after giving effect to certain reclassifications to facilitate comparisons to subsequent years). The selected consolidated statement of income data for the three months ended March 31, 2014 and 2015 and the selected consolidated balance sheet data as of March 31, 2015 have been derived from our unaudited condensed consolidated financial statements included elsewhere in this prospectus. The selected consolidated balance sheet data as of March 31, 2014 has been derived from our unaudited condensed consolidated financial statements not included in this prospectus. The unaudited condensed consolidated financial statements were prepared on a basis consistent with our audited consolidated financial statements and, in the opinion of management, reflect all adjustments, consisting only of normal and recurring adjustments, necessary for a fair statement of the financial information. The results for any interim period are not necessarily indicative of the results that may be expected for the full year. In addition, our historical results are not necessarily indicative of the results expected for any future periods.
You should read the following financial information together with the information under “Capitalization” and “Management’s Discussion and Analysis of Financial Condition and Results of Operations” and our consolidated financial statements and the related notes included elsewhere in this prospectus.
43
Table of Contents
| Fiscal Year Ended December 31, | Three Months Ended March 31, |
|||||||||||||||||||||||||||
| 2010 | 2011 | 2012 | 2013 | 2014 | 2014 | 2015 | ||||||||||||||||||||||
| (dollars in thousands, except share and per share amounts) |
||||||||||||||||||||||||||||
| Statements of Income Data: |
||||||||||||||||||||||||||||
| Net sales |
$ | 190,011 | $ | 345,525 | $ | 522,999 | $ | 719,509 | $ | 917,760 | $ | 226,247 | $ | 248,774 | ||||||||||||||
| Operating income |
14,825 | 42,279 | 118,410 | 158,626 | 179,003 | 53,613 | 52,135 | |||||||||||||||||||||
| Interest expense |
— | 36 | 10,209 | 20,640 | 13,887 | 3,221 | 3,734 | |||||||||||||||||||||
| Loss on extinguishment of debt |
— | — | — | 15,918 | — | — | — | |||||||||||||||||||||
| Income before income taxes |
15,791 | 42,296 | 108,353 | 122,193 | 165,289 | 50,417 | 48,452 | |||||||||||||||||||||
| (Benefit from) provision for income taxes |
(7,496) | 16,489 | 42,853 | 43,957 | 63,358 | 19,264 | 18,406 | |||||||||||||||||||||
| Net income |
$ | 23,287 | $ | 25,807 | $ | 65,500 | $ | 78,236 | $ | 101,931 | $ | 31,153 | $ | 30,046 | ||||||||||||||
| Basic net income per common share |
$ | 0.12 | $ | 0.13 | $ | 0.34 | $ | 0.40 | $ | 0.52 | $ | 0.16 | $ | 0.15 | ||||||||||||||
| Diluted net income per common share |
$ | 0.12 | $ | 0.13 | $ | 0.33 | $ | 0.40 | $ | 0.52 | $ | 0.16 | $ | 0.15 | ||||||||||||||
| Dividends declared and paid per common share |
$ | — | $ | — | $ | 2.05 | $ | — | $ |
— |
|
$ | — | $ | — | |||||||||||||
| Basic weighted average shares |
189,413,406 | 194,539,627 | 195,298,147 | 195,619,943 | 195,735,309 | 195,720,894 | 195,745,670 | |||||||||||||||||||||
| Diluted weighted average shares |
192,137,454 | 195,076,707 | 195,707,975 | 196,559,084 | 197,852,932 | 197,747,579 | 197,773,850 | |||||||||||||||||||||
| Balance Sheet Data (end of period): |
||||||||||||||||||||||||||||
| Cash and cash equivalents |
$ | 7,217 | $ | 17,397 | $ | 45,770 | $ | 42,874 | $ | 95,788 | $ | 84,303 | $ | 149,044 | ||||||||||||||
| Working capital (1) |
31,160 | 61,065 | 88,141 | 116,704 | 207,939 | 142,472 | 235,397 | |||||||||||||||||||||
| Property, plant, and equipment, net |
2,823 | 2,197 | 23,778 | 85,830 | 113,863 | 92,302 | 114,101 | |||||||||||||||||||||
| Total assets |
54,545 | 92,990 | 160,518 | 254,797 | 387,172 | 303,531 | 423,021 | |||||||||||||||||||||
| Total debt, including current maturities |
— | — | 392,395 | 395,017 | 391,057 | 394,027 | 390,067 | |||||||||||||||||||||
| Stockholders’ equity (deficit) |
34,629 | 61,584 | (270,868) | (191,085) | (87,297) | (159,515 | ) | (56,770) | ||||||||||||||||||||
| Other Data: |
||||||||||||||||||||||||||||
| Adjusted net income (2) |
$ | 21,960 | $ | 25,807 | $ | 65,500 | $ | 88,930 | $ | 106,569 | $ | 31,348 | $ | 31,097 | ||||||||||||||
| Adjusted basic net income per common share (2) |
$ | 0.12 | $ | 0.13 | $ | 0.34 | $ | 0.45 | $ | 0.54 | $ | 0.16 | $ | 0.16 | ||||||||||||||
| Adjusted diluted net income per common share (2) |
$ | 0.11 | $ | 0.13 | $ | 0.33 | $ | 0.45 | $ | 0.54 | $ | 0.16 | $ | 0.16 | ||||||||||||||
| EBITDA (3) |
16,590 | 43,529 | 119,617 | 143,994 | 183,863 | 54,135 | 54,032 | |||||||||||||||||||||
| Adjusted EBITDA (3) |
16,022 | 43,997 | 119,983 | 162,442 | 193,189 | 54,867 | 56,173 | |||||||||||||||||||||
| Depreciation and amortization |
810 | 1,250 | 1,207 | 1,286 | 4,860 | 522 | 1,897 | |||||||||||||||||||||
| Capital expenditures |
1,615 | 980 | 22,787 | 63,507 | 32,948 | 6,998 | 2,184 | |||||||||||||||||||||
| (1) | Working capital is defined as current assets, including cash and cash equivalents, minus current liabilities. |
| (2) | Adjusted net income represents net income plus loss on extinguishment of debt and non-recurring and one-time items (comprising initial public offering preparation costs, gain on insurance settlement and litigation expenses), net of tax. We present adjusted net income because our management uses it as a supplemental measure in assessing our operating performance, and we believe that it is helpful to investors, securities analysts and other interested parties, in evaluating the performance of companies in |
44
Table of Contents
| our industry. We also believe adjusted net income is useful to management and investors, securities analysts and other interested parties as a measure of our comparative operating performance from period to period. Adjusted net income is not a measurement of financial performance under GAAP. It should not be considered an alternative to net income as a measure of our operating performance or any other measure of performance derived in accordance with GAAP. In addition, adjusted net income should not be construed as an inference that our future results will be unaffected by unusual or non-recurring items. Adjusted net income has limitations as an analytical tool, and you should not consider such measure either in isolation or as a substitute for analyzing our results as reported under GAAP. Our definition and calculation of adjusted net income is not necessarily comparable to other similarly titled measures used by other companies due to different methods of calculation. |
Adjusted basic net income per common share is defined as adjusted net income divided by basic weighted average shares. Adjusted diluted net income per common share is defined as adjusted net income divided by diluted weighted average shares.
The following table provides a reconciliation of net income to adjusted net income:
| Fiscal Year Ended December 31, |
Three Months Ended March 31, |
|||||||||||||||||||||||||||
| 2010 | 2011 | 2012 | 2013 | 2014 | 2014 | 2015 | ||||||||||||||||||||||
| (dollars in thousands) | ||||||||||||||||||||||||||||
| Net income |
$ 23,287 | $ 25,807 | $ 65,500 | $ 78,236 | $ 101,931 | $ 31,153 | $ 30,046 | |||||||||||||||||||||
| Loss on extinguishment of debt, net of tax of $5,921 (2a) |
— | — | — | 9,997 | — | — | — | |||||||||||||||||||||
| Initial public offering preparation costs, net of tax of $413, $1,109, $120 and $75, respectively (2b) |
— | — | — | 697 | 1,777 | 195 | 122 | |||||||||||||||||||||
| Litigation expenses, net of tax of $1,760 and $570, respectively (2c) |
— | — | — | — | 2,861 | — | 929 | |||||||||||||||||||||
| Gain on insurance settlement, net of tax benefit of $372 |
(1,327) | — | — | — | — | — | — | |||||||||||||||||||||
|
|
|
|
|
|
|
|
|
|
|
|
|
|
|
|||||||||||||||
| Adjusted net income |
$ 21,960 | $ 25,807 | $ 65,500 | $ 88,930 | $ 106,569 | $ 31,348 | $ 31,097 | |||||||||||||||||||||
|
|
|
|
|
|
|
|
|
|
|
|
|
|
|
|||||||||||||||
| (2a) | Represents the loss on extinguishment of debt associated with the repricing of our senior secured credit facilities in December 2013. See Note 5 to our audited consolidated financial statements included elsewhere in this prospectus. |
| (2b) | Represents costs incurred in preparing for our initial public offering. |
| (2c) | Represents costs primarily related to the litigation with Nestlé Purina. |
| (3) | EBITDA represents net income plus interest expense, less interest income and plus provision for income taxes and depreciation and amortization. Adjusted EBITDA represents EBITDA plus loss on extinguishment of debt, stock-based compensation and non-recurring and one-time items (comprising initial public offering preparation costs, gain on insurance settlement and litigation expenses). |
We present EBITDA and Adjusted EBITDA because our management uses these as supplemental measures in assessing our operating performance, and we believe they are helpful to investors, securities analysts and other interested parties, in evaluating the performance of companies in our industry. We also believe EBITDA and Adjusted EBITDA are useful to management and investors, securities analysts and other interested parties as measures of our comparative operating performance from period
45
Table of Contents
to period. EBITDA and Adjusted EBITDA are not measurements of financial performance under GAAP. They should not be considered as alternatives to cash flow from operating activities, as measures of liquidity, or as alternatives to net income as a measure of our operating performance or any other measures of performance derived in accordance with GAAP. In addition, EBITDA and Adjusted EBITDA should not be construed as an inference that our future results will be unaffected by unusual or non-recurring items. EBITDA and Adjusted EBITDA have limitations as analytical tools, and you should not consider such measures either in isolation or as substitutes for analyzing our results as reported under GAAP. Our definitions and calculations of EBITDA and Adjusted EBITDA are not necessarily comparable to other similarly titled measures used by other companies due to different methods of calculation.
The following table provides a reconciliation of net income to EBITDA and Adjusted EBITDA:
| Fiscal Year Ended December 31, |
Three Months Ended March 31, |
|||||||||||||||||||||||||||
| 2010 | 2011 | 2012 | 2013 | 2014 | 2014 | 2015 | ||||||||||||||||||||||
| (dollars in thousands) | ||||||||||||||||||||||||||||
| Net income |
$ | 23,287 | $ | 25,807 | $ 65,500 | $ 78,236 | $ 101,931 | $ 31,153 | $ 30,046 | |||||||||||||||||||
| Interest expense |
— | 36 | 10,209 | 20,640 | 13,887 | 3,221 | 3,734 | |||||||||||||||||||||
| Interest income |
(11) | (53 | ) | (152 | ) | (125 | ) | (173 | ) | (25 | ) | (51 | ) | |||||||||||||||
| Provision for (benefit from) income taxes |
(7,496) | 16,489 | 42,853 | 43,957 | 63,358 | 19,264 | 18,406 | |||||||||||||||||||||
| Depreciation and amortization |
810 | 1,250 | 1,207 | 1,286 | 4,860 | 522 | 1,897 | |||||||||||||||||||||
|
|
|
|
|
|
|
|
|
|
|
|
|
|
|
|||||||||||||||
| EBITDA |
$ | 16,590 | $ | 43,529 | $ 119,617 | $ 143,994 | $ 183,863 | $ 54,135 | $ 54,032 | |||||||||||||||||||
| Gain on insurance settlement |
(955) | — | — | — | — | — | — | |||||||||||||||||||||
| Loss on extinguishment of debt (3a) |
— | — | — | 15,918 | — | — | — | |||||||||||||||||||||
| Initial public offering preparation costs (3b) |
— | — | — | 1,110 | 2,886 | 315 | 197 | |||||||||||||||||||||
| Litigation expenses (3c) |
— | — | — | — | 4,621 | — | 1,499 | |||||||||||||||||||||
| Stock-based compensation (3d) |
387 | 468 | 366 | 1,420 | 1,819 | 417 | 445 | |||||||||||||||||||||
|
|
|
|
|
|
|
|
|
|
|
|
|
|
|
|||||||||||||||
| Adjusted EBITDA |
$ 16,022 | $ | 43,997 | $ | 119,983 | $ | 162,442 | $ | 193,189 | $ | 54,867 | $ | 56,173 | |||||||||||||||
|
|
|
|
|
|
|
|
|
|
|
|
|
|
|
|||||||||||||||
| (3a) | Represents the loss on extinguishment of debt associated with the repricing of our senior secured credit facilities in December 2013. See Note 5 to our audited consolidated financial statements included elsewhere in this prospectus. |
| (3b) | Represents costs incurred in preparing for our initial public offering. |
| (3c) | Represents costs primarily related to the litigation with Nestlé Purina. |
| (3d) | Represents non-cash, stock-based compensation expense. |
46
Table of Contents
MANAGEMENT’S DISCUSSION AND ANALYSIS
OF FINANCIAL CONDITION AND RESULTS OF OPERATIONS
The following discussion contains forward-looking statements that reflect our plans, estimates and beliefs. Such statements involve risks and uncertainties. Our actual results may differ materially from those discussed in the forward-looking statements as a result of various factors, including those set forth in “Risk Factors” and “Special Note Regarding Forward-Looking Statements.” The following discussion of our financial condition and results of operations should be read in conjunction with our consolidated financial statements and related notes included elsewhere in this prospectus, as well as the information presented under “Prospectus Summary—Summary Consolidated Financial Data” and “Selected Consolidated Financial Data.” All references to years, unless otherwise noted, refer to our fiscal years, which end on December 31.
Overview
We are the fastest growing major pet food company in the United States, selling dog and cat food made with whole meats, fruits and vegetables, and other high-quality, natural ingredients. BLUE is a billion dollar brand based on sales at retail and is the #1 brand in the Wholesome Natural market segment. We develop, produce, market and sell pet food under our four major product lines: BLUE Life Protection Formula, BLUE Wilderness, BLUE Basics and BLUE Freedom. Each line of pet food includes different product types for dogs and cats, such as dry food, wet food and treats. We also produce and sell cat litter products under the BLUE Naturally Fresh line. While we have only one reporting segment, for purposes of discussing our net sales we categorize our products as (1) Dry Foods or (2) Wet Foods, Treats and Other Products. Dry Foods contributed approximately 81% of our net sales for 2014 compared to 82% of our net sales for 2013, with the remaining 19% and 18% for 2014 and 2013, respectively, attributable to Wet Foods, Treats and Other Products.
We sell our products in the specialty channels, either directly to retailers or through distributors. The specialty channels include national pet superstore chains, regional pet store chains, neighborhood pet stores, veterinary clinics, farm and feed stores, eCommerce retailers, military outlets and hardware stores. BLUE is sold across all types of specialty retailers in the United States and Canada, although our sales in the Vet channel are currently minimal. Our products were first sold in national pet superstores and a significant majority of our net sales is still generated from national pet superstores, PetSmart and Petco, which are our top two customers. Over the last three years, we have continued to diversify our customer base, with 74% of our net sales generated from national pet superstores in 2014 as compared to 78% in 2012. We expect our net sales to accounts outside of national pet superstores to continue to grow faster as we make BLUE more widely available across different specialty channels.
Our products are manufactured in the United States through a hybrid network of owned and contracted manufacturing facilities and distributed from owned and contracted distribution centers. In September 2014, we commenced manufacturing operations at our Heartland facility in Joplin, Missouri. Once our Heartland facility ramps up to capacity, which we anticipate will be by the third quarter of 2015, we expect it will provide us with in-house dry food manufacturing of up to 30 million pounds a month and account for 50-60% of our forecasted dry food production needs over the next several years.
The primary market for our products is the United States, which represented approximately 96% of our net sales in 2012 and 97% of our net sales in each of 2013, 2014 and the three months ended March 31, 2015, with the remaining 4% and 3%, respectively, for each of those periods attributable primarily to our operations in Canada, where we also market and sell our products. As part of our international expansion plan, we opened our first office in Canada in 2014. We have also recently established operating subsidiaries in Mexico and Japan, where we expect to begin marketing our products through local distribution by the end of 2015.
We have recently started building a dedicated national detailing force to introduce BLUE to the veterinary community as part of our True Blue Veterinary program. This program is a significant new investment initiative for us and we believe it can be an important part of our go-to-market strategy in the future as it ramps up over the next several years.
47
Table of Contents
Over the past several years, we have invested significant time and resources analyzing this market segment and plan to enter into this market segment with differentiated natural therapeutic pet food products. While we do not expect to generate significant revenues from Therapeutic products in the near term, we believe these investments will be synergistic for our relationship with the veterinarian community and provide an incremental avenue of future growth.
Industry Trends
The U.S. pet food industry has been growing as a result of a number of factors, including:
| • | continued humanization of pets – more pet parents consider their pets to be a family member, driving demand for more premium and specialized pet foods; |
| • | strong secular health and wellness trends crossing over from human foods – there is increased focus on pets consuming high-quality, natural foods, as evidenced by the growth in the Wholesome Natural market segment; and |
| • | growth of the specialty channels – the specialty channels have been growing faster than the FDM channel as pet parents are attracted to the variety, premium assortment and tailored shopping experience offered by retailers in specialty channels. |
Nonetheless, the pet food industry faces a number of challenges and uncertainties including:
| • | the pet food industry’s continued ability to innovate and meet pet parents’ future needs; |
| • | increased promotional activity in the pet food industry; |
| • | a challenging economic climate, which may impact spending on pets; and |
| • | new or increased regulatory requirements and scrutiny, including increased oversight by the FDA and the implementation of the Food Safety Modernization Act. |
Components of our Results of Operations
Net Sales
We develop, produce, market and sell natural pet food and cat litter in the specialty channels in the United States and Canada. We rely on consumer demand for our products, financial performance of our products for retailers and our position in the marketplace, rather than entering into contracts with retailers to sell our products. We enter into agreements with various distributors to distribute our products to other stores in the specialty channel which typically stock a narrower range of our products given their smaller store footprints. We recognize revenues generally upon receipt of the product by the customer. See “—Critical Accounting Policies and Estimates—Revenue Recognition.” All sales are made on pre-agreed pricing terms, are not subject to contingencies and are, therefore, final.
We offer a variety of trade promotions and incentives to our customers and consumers, such as temporary price reductions, cooperative advertising programs, in-store displays and coupons. These trade promotions and incentives are accounted for as a reduction of our net sales. Our net sales are periodically influenced by the timing, extent and amount of such trade promotions and incentives.
In addition, the following trends have driven our growth in net sales over the past three years and we expect these trends to continue to drive our growth in net sales in the near future:
| • | our continued growth in net sales within national pet superstores as well as our increased availability to a greater proportion of pet parents as we have expanded our distribution to other retailers in the specialty channels; |
48
Table of Contents
| • | our continued investment in our highly-effective marketing and brand-building; and |
| • | our continued innovation, including the expansion of existing product lines, the introduction of new product types and the introduction of new product lines that are tailored to meet evolving consumer preferences and the needs of different pets. The revenue per pound of new products that we introduce across our product lines is typically higher than the average revenue per pound of existing products in our portfolio due to their more specialized and higher cost formulas. |
These factors have powered our growth at a faster rate than the overall pet food industry. Over the past three years, our net sales have increased at a CAGR of 38% as compared to the overall pet food sales as measured in Tracked Channels which has increased at a CAGR of 3%. While we expect these trends to continue to drive our growth for the near future, we believe that our growth rate will decline in the future as our scale increases.
However, our results of operations and business face the following challenges and uncertainties:
| • | our ability to introduce new product offerings that will gain broad market acceptance; |
| • | reduced traffic trends at national pet superstores; |
| • | lower overall pet food market growth during the last two years; |
| • | competitive threats from other pet foods companies; and |
| • | our ability to pass along increases in commodity costs to our customers and ultimately to consumers. |
Gross Profit
Gross profit is our net sales less cost of goods sold. Our cost of goods sold consists primarily of costs of ingredients and packaging materials, manufacturing costs and costs associated with our warehouses and distribution network, which are influenced by a number of factors including transportation costs and fuel charges. These components are subject to fluctuations in certain commodities and inflation. Gross margin measures our gross profit as a percentage of net sales.
We have a manufacturing network that includes an owned manufacturing facility where we manufacture finished goods, as well as third-party contract manufacturing facilities from whom we purchase finished products predominately on a cost-plus basis. We pay our contract manufacturers on a dollar-per-pound basis for dry foods and dollar-per-unit basis for wet foods and treats. Over the past three years, we have worked closely with our contract manufacturers to negotiate lower manufacturing costs through increased volume of purchases, contract consolidation and price negotiations. More recently, as a result of the introduction of more complex diets with smaller run sizes and a change in mix of our contract manufacturers, our improved productivity has been partially offset by higher manufacturing costs.
We contract and ensure availability directly with suppliers for most of the major ingredients in our dry foods, whether manufactured by us at our Heartland facility or by our contract manufacturers. The manufacturing facilities in our manufacturing network then purchase these ingredients from suppliers approved by us based on the terms we negotiated. This has allowed us to consolidate ingredient sourcing across our manufacturing network in order to negotiate favorable pricing and consistency on ingredients for dry foods, which make up the majority of our product portfolio. For wet foods and treats, our contract manufacturers negotiate directly with suppliers approved by us and purchase ingredients directly from these suppliers based on our specifications. We have entered into contracts relating to the physical purchase of the majority of our main ingredients, including our meats and meals, grains, fruit, vegetables, starches and fibers. These contracts are focused primarily on ensuring availability, quality and price predictability. Depending on the nature of the ingredients, some contracts
49
Table of Contents
are fixed in price while others have a variable component based on a pricing formula. The length of the contracts is fixed for a period of time, typically up to a year or for a season and/or a crop year. We have increased the percentage of ingredients contracted for our dry foods from approximately 30% of our forward twelve-month needs in 2009 to approximately 90% in 2014. In 2015, under our Commodity Price Risk Management Policy, we expect to contract approximately 90% of our ingredients. In addition, we may enter into fixed price and/or fixed quantity contracts for a pre-determined amount of our ingredients to reduce short-term price volatility in certain commodities. Although we do not currently engage in hedging activities, we expect to adopt certain hedging strategies in the future consistent with our Commodity Price Risk Management Policy. We believe these efforts will help ensure the availability and quality of our ingredients and help mitigate the impact of volatile and increasing commodity costs on our business.
We have also invested and plan to continue to invest in equipment to be used by certain of our contract manufacturers to increase volume capacity where needed, improve efficiency and improve product quality. With the opening of our Heartland facility, we now have a hybrid network of owned and contracted manufacturing facilities. Once our Heartland facility ramps up to capacity, which we anticipate will be by the third quarter of 2015, we believe this hybrid network will provide us with enhanced margin opportunities and greater flexibility in our supply chain. Until then, the start-up costs and operation of the Heartland facility below capacity will negatively impact our gross margin and gross profit. In the near term, these manufacturing efficiencies will give us an opportunity to reinvest in growth initiatives.
Over the past three years, despite volatility in commodity prices and start-up costs associated with our Heartland facility in 2014 and the first quarter of 2015, we have managed our gross margin through a combination of increased prices to offset commodity cost inflation, changes in our product mix, productivity improvements, purchasing efficiencies and cost reductions in our supply chain. Historically, we have been able to pass along commodity cost increases to our customers through annual or semi-annual price increases. Over an 18-month period between summer of 2011 and early 2013, we implemented three price increases while continuing to grow our sales volumes. When evaluating pricing, we consider many factors including cost of sales increases, competitive pricing strategy and the price-value equation to our consumers.
Selling, General and Administrative Expenses
Our selling, general and administrative expenses primarily consist of advertising and marketing expenses, salaries and other payroll-related expenses, stock-based compensation, legal and professional fees, consulting expenses, travel expenses, depreciation and research and development costs. Selling, general and administrative expenses as a percentage of net sales has increased from 17.9% in 2012 to 20.5% in 2014, primarily driven by increased investments in advertising to support new product releases and drive greater brand awareness and investment in our corporate infrastructure to support our large scale and growth, partially offset by headcount growing at a slower pace than net sales.
In the future, we expect our selling, general and administrative expenses to grow at a slower rate than our net sales growth as we leverage our past investments. In the near term, we intend to reinvest operating efficiencies to fund our growth initiatives, including international expansion and entry into the Vet channel. During 2015, we expect to incur approximately $20 million of incremental selling, general and administrative expenses to fund these initiatives. We also expect to incur compensation expenses with respect to (1) the issuance of shares (valued at the initial public offering price) by us in this offering to certain non-management employees without cost to such employees and (2) the payments by us to such employees in amounts estimated by us to be sufficient to pay the income and payroll taxes arising from the receipt of the shares and the associated taxes on such payments. In addition, we expect that after the consummation of this offering there will be an increase in our selling, general and administrative expenses of approximately $3 million each year as a result of the additional reporting and compliance costs associated with being a public reporting company. We also expect that we will continue to incur litigation expenses relating to the Nestlé Purina litigation and the related class action lawsuits for the foreseeable future.
50
Table of Contents
Net Income
Our net income for future periods will be affected by the various factors described above. In addition, our net income could be negatively impacted by the Nestlé Purina proceedings and the related class action lawsuits if we were to be required to record a liability for such proceedings or are found to be liable in such proceedings. See “Business—Legal Proceedings.”
Results of Operations
The following tables set forth our consolidated statements of income in dollars and as a percentage of net sales for the periods presented:
| Three Months Ended March 31, |
% of Net Sales | |||||||||||||||
| 2014 | 2015 | 2014 | 2015 | |||||||||||||
| (dollars in thousands, except for per share amounts and percentages) |
||||||||||||||||
| Net sales |
$ | 226,247 | $ | 248,774 | 100.0% | 100.0% | ||||||||||
| Cost of sales |
129,912 | 149,240 | 57.4% | 60.0% | ||||||||||||
|
|
|
|
|
|||||||||||||
| Gross profit |
96,335 | 99,534 | 42.6% | 40.0% | ||||||||||||
| Selling, general and administrative expenses |
42,722 | 47,399 | 18.9% | 19.1% | ||||||||||||
|
|
|
|
|
|||||||||||||
| Operating income |
53,613 | 52,135 | 23.7% | 21.0% | ||||||||||||
| Interest expense |
3,221 | 3,734 | 1.4% | 1.5% | ||||||||||||
| Interest income |
(25 | ) | (51 | ) | —% | —% | ||||||||||
|
|
|
|
|
|||||||||||||
| Income before income taxes |
50,417 | 48,452 | 22.3% | 19.5% | ||||||||||||
| Provision for income taxes |
19,264 | 18,406 | 8.5% | 7.4% | ||||||||||||
|
|
|
|
|
|||||||||||||
| Net income |
$ | 31,153 | $ | 30,046 | 13.8% | 12.1% | ||||||||||
|
|
|
|
|
|||||||||||||
| Basic net income per common share |
$ | 0.16 | $ | 0.15 | ||||||||||||
| Diluted net income per common share |
$ | 0.16 | $ | 0.15 | ||||||||||||
| Fiscal Year Ended December 31, | % of Net Sales | |||||||||||||||||||||||
| 2012 | 2013 | 2014 | 2012 | 2013 | 2014 | |||||||||||||||||||
| (dollars in thousands, except for per share amounts and percentages) |
||||||||||||||||||||||||
| Net sales |
$ | 522,999 | $ | 719,509 | $ | 917,760 | 100.0% | 100.0% | 100.0% | |||||||||||||||
| Cost of sales |
311,050 | 421,897 | 550,893 | 59.5% | 58.6% | 60.0% | ||||||||||||||||||
|
|
|
|
|
|
|
|||||||||||||||||||
| Gross profit |
211,949 | 297,612 | 366,867 | 40.5% | 41.4% | 40.0% | ||||||||||||||||||
| Selling, general and administrative expenses | 93,539 | 138,986 | 187,864 | 17.9% | 19.3% | 20.5% | ||||||||||||||||||
|
|
|
|
|
|
|
|||||||||||||||||||
| Operating income |
118,410 | 158,626 | 179,003 | 22.6% | 22.0% | 19.5% | ||||||||||||||||||
| Interest expense |
10,209 | 20,640 | 13,887 | 2.0% | 2.9% | 1.5% | ||||||||||||||||||
| Loss on debt extinguishment |
— | 15,918 | — | —% | 2.2% | —% | ||||||||||||||||||
| Interest income |
(152 | ) | (125 | ) | (173 | ) | —% | —% | —% | |||||||||||||||
|
|
|
|
|
|
|
|||||||||||||||||||
| Income before income taxes |
108,353 | 122,193 | 165,289 | 20.7% | 17.0% | 18.0% | ||||||||||||||||||
| Provision for income taxes |
42,853 | 43,957 | 63,358 | 8.2% | 6.1% | 6.9% | ||||||||||||||||||
|
|
|
|
|
|
|
|||||||||||||||||||
| Net income |
$ | 65,500 | $ | 78,236 | $ | 101,931 | 12.5% | 10.9% | 11.1% | |||||||||||||||
|
|
|
|
|
|
|
|||||||||||||||||||
| Basic net income per common share |
$ | 0.34 | $ | 0.40 | $ | 0.52 | ||||||||||||||||||
| Diluted net income per common share |
$ | 0.33 | $ | 0.40 | $ | 0.52 | ||||||||||||||||||
| Dividends declared and paid per common share |
$ | 2.05 | $ | — | $ | — | ||||||||||||||||||
51
Table of Contents
Three Months Ended March 31, 2015 Compared With Three Months Ended March 31, 2014
Net Sales
Net sales increased $22.5 million, or 10.0%, to $248.8 million for the three months ended March 31, 2015, compared to $226.2 million for the three months ended March 31, 2014. Volume growth accounted for 9 percentage points of the increase in net sales and favorable product mix contributed 2 percentage points, partially offset by a 1 percentage point impact from net pricing. In preparation for the systems cutover from our previous ERP system to SAP, we stopped shipping to customers in December 2013 for a partial week. These sales were recovered in the first quarter of 2014 when we resumed shipping to customers. As a result, we estimate that $13.1 million of sales were shifted from the fourth quarter of 2013 to the first quarter of 2014. Excluding this shift in shipments, our net sales growth for the three months ended March 31, 2015 would have been 6.8 percentage points higher, or 16.8%.
Net sales of Dry Foods increased $17.0 million, or 9.1%, to $204.2 million for the three months ended March 31, 2015, compared to $187.2 million for the three months ended March 31, 2014. Volume growth accounted for 9 percentage points of the increase in net sales of Dry Foods and favorable product mix contributed 1 percentage point, partially offset by a 1 percentage point impact from net pricing. The introduction of new products under each of our major product lines drove our growth in net sales of Dry Foods. The decrease in net pricing was primarily driven by higher levels of promotional activity.
Net sales of Wet Foods, Treats and Other Products increased $5.5 million, or 14.0%, to $44.6 million for the three months ended March 31, 2015, compared to $39.1 million for the three months ended March 31, 2014. Volume growth accounted for 8 percentage points of the increase in net sales of our Wet Foods, Treats and Other Products and favorable product mix contributed 7 percentage points, partially offset by a 1 percentage point impact from net pricing. The introduction of new wet foods across each of our major product lines was the primary driver of the growth of our net sales of Wet Foods, Treats and Other Products. The decrease in net pricing was primarily driven by higher levels of promotional activity.
Gross Profit
Gross profit increased $3.2 million, or 3.3%, to $99.5 million for the three months ended March 31, 2015, compared to $96.3 million for the three months ended March 31, 2014, driven primarily by increased volume. Gross margin decreased to 40.0% for the three months ended March 31, 2015, from 42.6% for the three months ended March 31, 2014 and was primarily impacted by incremental supply chain costs (1.1 percentage points gross margin decrease), Heartland start-up costs (0.7 percentage point gross margin decrease) and lower net price realization (0.7 percentage point gross margin decrease).
Selling, General, and Administrative Expenses
Selling, general, and administrative expenses were $47.4 million for the three months ended March 31, 2015, up $4.7 million, or 10.9%, from $42.7 million for the three months ended March 31, 2014. The increase reflects incremental salaries and payroll-related expenses to support the growth of our business.
Interest Expense, Net
Interest expense, net increased $0.5 million, or 15.2%, to $3.7 million for the three months ended March 31, 2015, compared to $3.2 million for the three months ended March 31, 2014. The increase was driven by capitalized interest of $0.8 million which reduced interest expense recorded during the three months ended March 31, 2014. Excluding capitalized interest, our effective interest rate quarter-over-quarter was 3.82% for the three months ended March 31, 2015 as compared to 4.07% for the three months ended March 31, 2014.
52
Table of Contents
Provision for Income Taxes
Provision for income taxes decreased $0.9 million, or 4.5%, to $18.4 million for the three months ended March 31, 2015, compared to $19.3 million for the three months ended March 31, 2014. Our effective tax rate was 38.0% for the three months ended March 31, 2015 as compared to 38.2% for the three months ended March 31, 2014. This decrease in our effective tax rate primarily reflects the benefit of domestic manufacturing deductions for the three months ended March 31, 2015.
Net Income
As a result of the factors above, net income decreased $1.1 million, or 3.6%, to $30.0 million for the three months ended March 31, 2015, compared to $31.2 million for the three months ended March 31, 2014.
Year ended December 31, 2014 Compared With Year ended December 31, 2013
Net Sales
Net sales increased $198.3 million, or 27.6%, to $917.8 million for the year ended December 31, 2014, compared to $719.5 million for the year ended December 31, 2013. Volume growth accounted for 25 percentage points of the increase in net sales and a favorable product mix contributed 3 percentage points. The introduction of new products under each of our major product lines drove our growth. In preparation for the systems cutover from our previous ERP system to SAP, we stopped shipping to customers in December 2013 for a partial week. These sales were recovered in the first quarter of 2014 when we resumed shipping to customers. As a result, we estimate that $13.1 million of sales were shifted from the fourth quarter of 2013 to the first quarter of 2014. Excluding this shift in shipments, our net sales growth for the year ended December 31, 2014 would have been 4.1 percentage points lower or 23.5%.
Net sales of Dry Foods increased $151.5 million, or 25.6%, to $743.0 million for the year ended December 31, 2014, compared to $591.5 million for the year ended December 31, 2013. Volume growth accounted for 25 percentage points of the increase in net sales of Dry Foods and favorable product mix contributed 1 percentage point. This volume growth was primarily driven by the introduction of new products under each of our major product lines.
Net Sales of Wet Foods, Treats and Other Products increased $46.8 million, or 36.5%, to $174.7 million for the year ended December 31, 2014, compared to $128.0 million for the year ended December 31, 2013. Volume growth accounted for 28 percentage points of the increase in net sales of our Wet Foods, Treats and Other Products and favorable product mix contributed 8 percentage points. The introduction of new wet foods across each of our major product lines was the primary driver of the growth of our net sales of Wet Foods, Treats and Other Products.
Gross Profit
Gross profit increased $69.3 million, or 23.3%, to $366.9 million for the year ended December 31, 2014, compared to $297.6 million for the year ended December 31, 2013, driven primarily by increased volume. Gross margin decreased to 40.0% for the year ended December 31, 2014, from 41.4% for the year ended December 31, 2013. Gross margin was primarily impacted by the start-up of our Heartland manufacturing facility (1.3 percentage points gross margin decrease).
Selling, General, and Administrative Expenses
Selling, general, and administrative expenses were $187.9 million for the year ended December 31, 2014, up $48.9 million, or 35.2%, from $139.0 million for the year ended December 31, 2013. The increase reflects:
53
Table of Contents
| • | $23.3 million of incremental advertising for the year ended December 31, 2014 as compared to the year ended December 31, 2013 and consistent with our strategy to continue to invest in our brands and product lines; and |
| • | $9.9 million of incremental professional fees primarily related to litigation expenses. |
Interest Expense
Interest expense decreased $6.8 million, or 32.7%, to $13.9 million for the year ended December 31, 2014, compared to $20.6 million for the year ended December 31, 2013. This decrease was due to a lower effective interest rate year-over-year, which was 4.03% for the year ended December 31, 2014 as compared to 5.27% for the year ended December 31, 2013, which primarily reflects the repricing of our term loan facility in December of 2013.
Interest Income
Interest income increased $48,000, or 38.4%, to $173,000 for the year ended December 31, 2014, compared to $125,000 for the year ended December 31, 2013. This increase was driven by higher year-over-year average cash on hand.
Provision for Income Taxes
Provision for income taxes increased $19.4 million, or 44.1%, to $63.4 million for the year ended December 31, 2014, compared to $44.0 million for the year ended December 31, 2013. Our effective tax rate was 38.3% for the year ended December 31, 2014 as compared to 36.0% for the year ended December 31, 2013. The increase in the effective rate is primarily attributed to prior year state refunds for the 2010, 2011, and 2012 tax years which benefited the tax provision in 2013 but did not recur in 2014.
Net Income
As a result of the factors above, net income increased $23.7 million, or 30.3%, to $101.9 million for the year ended December 31, 2014, compared to $78.2 million for the year ended December 31, 2013.
Year Ended December 31, 2013 Compared With Year Ended December 31, 2012
Net Sales
Net sales increased $196.5 million, or 37.6%, to $719.5 million for the year ended December 31, 2013, compared to $523.0 million for the year ended December 31, 2012. Volume growth accounted for 30 percentage points of the increase in net sales, favorable product mix contributed 6 percentage points and an increase in net prices contributed 1 percentage point. Strong performance by each of our major product lines accounted for over 75% of our sales growth. The introduction of new products primarily under our BLUE Wilderness and BLUE Life Protection Formula lines accounted for over 20% of our sales growth. In preparation for the systems cutover from our previous ERP system to SAP, we stopped shipping to customers in December 2013 for a partial week. These sales were recovered in the first quarter of 2014 when we resumed shipping to customers. As a result, we estimate that $13.1 million of sales were shifted from the fourth quarter of 2013 to the first quarter of 2014. Excluding this shift in shipments, our net sales growth for the year ended December 31, 2013 would have been 2.5 percentage points higher or 40.1%.
Net sales of Dry Foods increased $157.1 million, or 36.2%, to $591.5 million for the year ended December 31, 2013, compared to $434.4 million for the year ended December 31, 2012. Volume growth accounted for 32 percentage points of the increase in net sales of Dry Foods, an increase in prices to offset higher commodity costs contributed 2 percentage points and favorable product mix contributed 2 percentage points. This volume growth was primarily driven by strong performance across each of our major product lines.
54
Table of Contents
Net sales of Wet Foods, Treats and Other Products increased $39.4 million, or 44.5%, to $128.1 million for the year ended December 31, 2013, compared to $88.6 million for the year ended December 31, 2012. Favorable product mix contributed 25 percentage points of the increase in net sales of our Wet Foods, Treats and Other Products and volume growth accounted for 21 percentage points, partially offset by a decrease in prices of 1 percentage point. The introduction of new products under the BLUE Life Protection Formula and BLUE Wilderness lines and strong wet food performances were the primary drivers of the growth of our net sales of Wet Foods, Treats and Other Products. The decrease in prices was primarily due to a modification in our pricing strategy for certain wet cat foods and litter products in order to improve our competitive position.
Gross Profit
Gross profit increased $85.7 million, or 40.4%, to $297.6 million for the year ended December 31, 2013, compared to $211.9 million for the year ended December 31, 2012, driven by increased volume and favorable product mix. Gross margin increased to 41.4% for the year ended December 31, 2013, from 40.5% for the year ended December 31, 2012. Gross margin was primarily impacted by:
| • | favorable product mix driven by our BLUE Wilderness and BLUE Life Protection Formula lines as well as the introduction of new products across all of our major product lines (0.7 percentage point gross margin increase); |
| • | higher average selling prices year-over-year, partially offset by commodity cost increases (0.6 percentage point gross margin increase); and |
| • | increased provisions for inventory write-offs primarily due to our decision to discontinue our BLUE Longevity line (0.3 percentage point gross margin decline). |
Selling, General and Administrative Expenses
Selling, general and administrative expenses were $139.0 million for the year ended December 31, 2013, up $45.4 million, or 48.6%, from $93.5 million for the year ended December 31, 2012. The increase reflects:
| • | a $24.9 million increase in advertising expense for the year ended December 31, 2013 as compared to the year ended December 31, 2012, consistent with our strategy to continue to invest in our brand; and |
| • | a $9.0 million increase in salaries and other payroll-related expenses for the year ended December 31, 2013 as compared to the year ended December 31, 2012 to support the growth of our business. |
Interest Expense
Interest expense increased $10.4 million, or 102.2%, to $20.6 million for the year ended December 31, 2013, compared to $10.2 million for the year ended December 31, 2012. This increase was primarily driven by a full year of interest expense in 2013, as compared to only four months in 2012, and additional borrowings of $50.0 million in December 2012, partially offset by a lower effective interest rate year-over-year as a result of the repricing of our senior secured credit facilities. Our effective interest rate was 5.27% for the year ended December 31, 2013 as compared to 6.96% for the year ended December 31, 2012.
Loss on Debt Extinguishment
In connection with the repricing of the Company’s term loan facilities during the fourth quarter of 2013, the Company recorded a loss on debt extinguishment of $15.9 million, which consisted of non-cash unamortized debt issuance costs of $9.2 million, non-cash unamortized original issue discount of $5.7 million and new debt issuance costs of $1.0 million.
55
Table of Contents
Interest Income
Interest income decreased $27,000, or 17.8%, to $125,000 for the year ended December 31, 2013, compared to $152,000 for the year ended December 31, 2012. This decrease was due to a decline in the year-over-year interest rate.
Provision for Income Taxes
Provision for income taxes increased $1.1 million, or 2.6%, to $44.0 million for the year ended December 31, 2013, compared to $42.9 million for the year ended December 31, 2012. Our effective tax rate was 36.0% for the year ended December 31, 2013 as compared to 39.5% for the year ended December 31, 2012. The decrease in the effective rate is primarily attributable to lower state income taxes as a result of the Company changing its filing status from a sales and marketing company to a manufacturing company in the second half of 2013 and certain other state tax benefits recognized in 2013 for the 2010, 2011 and 2012 tax years.
Net Income
As a result of the factors above, net income increased $12.7 million, or 19.4%, to $78.2 million for the year ended December 31, 2013, compared to $65.5 million for the year ended December 31, 2012.
Financial Condition, Liquidity and Capital Resources
Overview
Historically, our primary source of liquidity has been cash flow from operations. In addition, we also have a $40.0 million revolving credit facility to provide us with an additional source of liquidity but have not had to draw on our revolving credit facility. As of March 31, 2015, our cash and cash equivalents were $149.0 million compared to cash and cash equivalents as of December 31, 2014 of $95.8 million. On August 8, 2012, we entered into a $350.0 million term loan facility and obtained an additional $50.0 million of term loans on December 6, 2012 through an incremental term loan facility. The aggregate gross proceeds of $400.0 million were used to pay dividends to our stockholders. As of March 31, 2015, we had outstanding indebtedness of $390.1 million under the term loan facilities. Pursuant to the terms of the term loan facilities, we are required to make quarterly payments of $1.0 million, with the remaining balance of $373.2 million due on August 8, 2019, the maturity date of the term loan facilities.
Our primary cash needs are for capital expenditures and working capital. Capital expenditures typically vary depending on the timing of infrastructure-related investments. We plan to make capital expenditures of approximately $33 million in fiscal 2015, which we expect to fund from cash generated from operations. We expect the majority of expenditures in fiscal 2015 will be used to fund strategic initiatives.
Our primary working capital requirements are for product and product-related costs, the payment of payroll, rent and distribution costs, advertising and marketing expenditures and the costs related to the development and commercialization of new products. Fluctuations in working capital are primarily driven by the timing of new product launches. As of March 31, 2015, we had working capital of $235.4 million, compared to $207.9 million as of December 31, 2014.
We believe that our operating cash flow and cash on hand will be adequate to meet our operating, investing and financing needs for the foreseeable future. If necessary, we can borrow funds under our revolving credit facility to finance our liquidity requirements, subject to customary borrowing conditions. To the extent additional funds are necessary to meet our long-term liquidity needs as we continue to execute our business strategy, we anticipate that they will be obtained through the incurrence of additional indebtedness, additional equity financings or a combination of these potential sources of funds. Our ability to meet our operating,
56
Table of Contents
investing and financing needs depend to a significant extent on our future financial performance, which will be subject in part to general economic, competitive, financial, regulatory and other factors that are beyond our control, including those described elsewhere in this prospectus under the heading “Risk Factors.” In addition to these general economic and industry factors, the principal factors in determining whether our cash flows will be sufficient to meet our liquidity requirements will be our ability to provide attractive products to our customers and consumers, increase prices to offset higher commodity costs, manage production and our supply chain and improve our productivity. Our liquidity could also be negatively impacted by the Nestlé Purina proceedings and the related class action lawsuits if they were to be determined adversely to us. See “Business—Legal Proceedings.” In the event that we need access to additional cash, we may not be able to access the credit markets on commercially acceptable terms or at all. We may need to refinance all or a portion of the principal amounts outstanding under our term loan facilities on or before August 8, 2019. We expect to continually assess our performance, the economic environment and market conditions to guide our decisions regarding our uses of cash, including capital expenditures.
Cash Flows
Cash Provided by Operating Activities
Net cash provided by operating activities was $56.4 million for the three months ended March 31, 2015, compared to $49.4 million for the three months ended March 31, 2014. The increase in operating cash flow primarily reflects favorable changes in working capital primarily driven by a decrease in accounts receivable partially offset by an increase in accounts payable.
Net cash provided by operating activities was $90.1 million for the year ended December 31, 2014, compared to $69.0 million for the year ended December 31, 2013. The increase in operating cash flow primarily reflects increased earnings partially offset by an increase in working capital needs to support our growth.
Net cash provided by operating activities was $69.0 million for the year ended December 31, 2013, compared to $64.4 million for the year ended December 31, 2012. The increase in operating cash flow primarily reflects increased earnings partially offset by an increase in working capital needs to support our growth.
The increase in net cash provided by operating activities of $21.1 million for the year ended December 31, 2014, as compared to the increase of $4.6 million for the year ended December 31, 2013 primarily reflects higher earnings growth for the year ended December 31, 2014 as compared to the year ended December 31, 2013 and the timing of inventory purchases related to new product introductions.
Cash Used in Investing Activities
Net cash used in investing activities was $2.2 million for the three months ended March 31, 2015, compared to $7.0 million for the three months ended March 31, 2014. The decrease in net cash used in investing activities was primarily driven by lower capital expenditures associated with the construction of our Heartland facility in the three months ended March 31, 2015 as compared to the same period in 2014.
Net cash used in investing activities was $33.3 million for the year ended December 31, 2014, compared to $63.3 million for the year ended December 31, 2013. The decrease in net cash used in investing activities was primarily driven by higher capital expenditures associated with the construction of our Heartland facility during the year ended December 31, 2013 as compared to the same period in 2014.
Net cash used in investing activities was $63.3 million for the year ended December 31, 2013 and $22.8 million for the year ended December 31, 2012. The increase in net cash used in investing activities year-over-year was primarily driven by capital expenditures associated with the construction of our Heartland facility.
57
Table of Contents
Cash Used in Financing Activities
Net cash used in financing activities was $1.0 million for the three months ended March 31, 2015 and 2014, consisting primarily of principal payments on our term loan facilities.
For the year ended December 31, 2014, net cash used in financing activities was $3.9 million, consisting primarily of quarterly principal payments on our term loan facilities.
For the year ended December 31, 2013, net cash used in financing activities was $8.6 million, consisting primarily of the payment of debt issuance costs related to the repricing of our term loan facilities and quarterly principal payments.
For the year ended December 31, 2012, net cash used in financing activities was $13.2 million, consisting primarily of the issuance of dividends and payment of debt issuance costs, partially offset by proceeds from the borrowings under our term loan facilities.
Description of Indebtedness
As of March 31, 2015, our senior secured credit facilities consisted of $390.1 million of outstanding term loans maturing on August 8, 2019 and an undrawn $40.0 million revolving credit facility (which includes borrowing capacity available for letters of credit and for short-term borrowings) maturing on August 8, 2017. Blue Buffalo Company, Ltd., a wholly-owned subsidiary of the Company, is the borrower under our senior secured credit facilities. As of March 31, 2015, the interest rate on the term loan facilities was 3.75%.
All obligations under our senior secured credit facilities are unconditionally guaranteed by Blue Pet Products, Inc., a wholly-owned subsidiary of the Company and the direct parent of the borrower, and, subject to certain exceptions, each of our material current and future U.S. wholly-owned restricted subsidiaries. All obligations under our senior secured credit facilities, and the guarantees of those obligations, are secured by substantially all of the following assets of the borrower and each guarantor, subject to certain exceptions:
| • | a pledge of 100% of the capital stock of the borrower and 100% of the equity interests directly held by the borrower and each guarantor in any wholly-owned material subsidiary of the borrower or any guarantor (which pledge, in the case of any non-U.S. subsidiary of a U.S. subsidiary, will not include more than 65% of the voting stock of such non-U.S. subsidiary), subject to certain exceptions; and |
| • | a security interest in, and mortgages on, substantially all tangible and intangible assets of the borrower and each guarantor, subject to certain exceptions. |
Our senior secured credit facilities contain a number of covenants that, among other things, restrict the ability of the borrower and its restricted subsidiaries to (subject to certain exceptions): incur additional indebtedness or issue preferred stock; create liens on assets; enter into sale and leaseback transactions; engage in mergers or consolidations; sell assets; pay dividends and distributions or repurchase our capital stock; make investments, loans or advances; repay subordinated indebtedness; make certain acquisitions; engage in certain transactions with affiliates; amend material agreements governing its subordinated indebtedness; and change its lines of business. The credit agreement covenants also restrict the ability of Blue Pet Products, Inc. to engage in certain mergers or consolidations. The credit agreement also contains certain customary affirmative covenants and events of default (including change of control). In addition, the credit agreement includes maintenance covenants that require compliance with certain secured leverage ratios. The availability of certain baskets and the ability to enter into certain transactions (including the ability of the borrower to pay dividends to the parent guarantor) may also be subject to compliance with such secured leverage ratios. See “Description of Certain Indebtedness.” The Company believes it was in compliance with its financial debt covenants in the credit agreement as of March 31, 2015.
58
Table of Contents
Contractual Obligations and Commitments
The following table summarizes our contractual obligations as of December 31, 2014:
| Payments Due by Period | ||||||||||||||||||||
| Total | Less Than One Year |
1-3 Years | 3-5 Years | More than Five Years |
||||||||||||||||
| (dollars in thousands) | ||||||||||||||||||||
| Long-term debt (1) |
$ | 391,057 | $ | 3,960 | $ | 7,920 | $ | 379,177 | $ | — | ||||||||||
| Interest on debt (2) |
66,247 | 14,655 | 28,862 | 22,730 | — | |||||||||||||||
| Operating lease obligations |
20,322 | 5,555 | 8,741 | 4,232 | 1,794 | |||||||||||||||
| Finished goods minimum purchase obligations (3) |
94,249 | 40,550 | 47,990 | 5,709 | — | |||||||||||||||
| Raw material purchase obligations |
268,515 | 255,557 | 12,958 | — | — | |||||||||||||||
|
|
|
|
|
|
|
|
|
|
|
|||||||||||
| Total contractual obligations |
$ | 840,390 | $ | 320,277 | $ | 106,471 | $ | 411,848 | $ | 1,794 | ||||||||||
|
|
|
|
|
|
|
|
|
|
|
|||||||||||
| (1) | Does not reflect any excess cash flow payments. |
| (2) | Reflects interest expense calculated using the current interest rate for the term loan facilities of 3.75%. |
| (3) | Reflects our estimate of the minimum co-manufacturer production commitments. |
Off-Balance Sheet Arrangements
During 2013, Heartland Pet Foods Manufacturing Inc., our wholly owned subsidiary, or Heartland, and Jasper County, Missouri, or Jasper, entered into an agreement pursuant to which Jasper agreed to issue up to an aggregate principal amount of $55 million of industrial revenue bonds to be purchased by Heartland. Jasper plans to use the proceeds from the industrial revenue bonds to purchase manufacturing equipment from Heartland, which will then be leased back to Heartland. As Heartland will become the owner of the equipment at the end of the lease term, the lease meets the requirements of a capital lease and the equipment is recorded as property, plant, and equipment on our balance sheet. The Company has the right and intends to set-off any obligation to make payments under the lease agreements with the proceeds due from the industrial revenue bonds. As of December 31, 2014 and 2013, Jasper had issued, and Heartland had purchased, $55.0 million and $16.6 million, respectively, of industrial revenue bonds and Jasper had purchased from, and leased back to, Heartland certain manufacturing equipment for a corresponding amount.
Critical Accounting Policies and Estimates
Our consolidated financial statements included elsewhere in this prospectus have been prepared in accordance with GAAP. The preparation of our financial statements requires us to make estimates and judgments that affect the reported amounts of assets, liabilities, revenues and expenses. We base our estimates on historical experience and on various other assumptions that we believe are reasonable under the circumstances. Actual results may differ from these estimates under different assumptions or conditions. While our significant accounting policies are more fully described in the notes to our consolidated financial statements included elsewhere in this prospectus, we believe that the following accounting policies and estimates are critical to our business operations and understanding of our financial results.
Revenue Recognition
We recognize revenues when persuasive evidence of an arrangement exists, the product has been shipped, when title passes, when all risks and rewards of ownership have transferred, the sales price is fixed or determinable, and collectability is reasonably assured. In most cases, revenue recognition does not occur until the product has reached the specified customer.
59
Table of Contents
In the normal course of business, we use trade promotions to support our business. Trade promotions, consisting primarily of temporary price reductions, consumer coupons, product placement fees, advertising allowances and other rebates are offered through various programs to customers and consumers. Sales are recorded net of trade promotion spending, which is recognized at the later of the date on which the Company recognizes the related revenue or the date on which the Company offers the incentive. Most of these arrangements have terms of approximately one year. Accruals for expected payouts under these programs are included in other current liabilities on the consolidated balance sheet.
We also maintain an allowance for doubtful accounts for estimated losses resulting from the inability of our customers to make payments and other actual and estimated deductions. If the financial condition of our customers were to deteriorate, resulting in an impairment of their ability to make payments, an additional allowance could be required. Past due balances are reviewed individually for collectability. Account balances are charged off against the allowance when we believe it is probable the receivable will not be recovered.
Inventories
We provide reserves for estimated obsolescence based on specific identification. If assumptions about future demand change or actual market conditions are less favorable than those projected by management, we may require additional reserves.
Loss Contingencies
We record accruals for various contingencies including legal exposures as they arise in the normal course of business. We determine whether to disclose and accrue for loss contingencies based on an assessment of whether the risk of loss is remote, reasonably possible, or probable. Our assessment is developed in consultation with our internal and external counsel and other advisors and is based on an analysis of possible outcomes under various strategies. Loss contingency assumptions involve judgments that are inherently subjective and can involve matters that are in litigation, which, by its nature is unpredictable. We believe that our assessment of the probability of loss contingencies is reasonable, but because of the subjectivity involved and the unpredictable nature of the subject matter at issue, our assessment may prove ultimately to be incorrect, which could materially impact our consolidated financial statements.
Accounting for Income Taxes
As part of the process of preparing our consolidated financial statements, we are required to estimate our actual current tax exposure (state, federal and foreign). We assess our income tax positions and record tax benefits for all years subject to examination based upon management’s evaluation of the facts, circumstances and information available at the reporting dates. We determine whether it is “more likely than not” that a tax position will be sustained upon the examination by the appropriate taxing authorities before any part of the benefit can be recorded in the financial statements. For those income tax positions where it is not “more likely than not” that a tax benefit will be sustained, no tax benefit has been recognized in the financial statements. Where applicable, associated interest and penalties are also recognized.
We also assess permanent and temporary differences resulting from differing bases and treatment of items for tax and accounting purposes, such as the carrying value of intangibles, deductibility of expenses, depreciation of property, plant and equipment, stock-based compensation expense and valuation of inventories. Temporary differences result in deferred tax assets and liabilities, which are included within our consolidated balance sheet. We must then assess the likelihood that our deferred tax assets will be recovered from future taxable income. Actual results could differ from this assessment if sufficient taxable income is not generated in future periods. To the extent we determine the need to establish a valuation allowance or increase such allowance in a period, we must include an expense within the tax provision in the accompanying consolidated statements of operations.
60
Table of Contents
Stock-based Compensation
We recognize stock-based compensation expense for our share-based payments based on the fair value of the awards at the grant date. The fair value of our stock option grants is determined using the Black-Scholes option pricing model. We will continue to use the Black-Scholes model for option pricing. Stock-based compensation expense is recognized on a straight-line basis over the vesting period of the stock-based award.
We use a third party valuation specialist to assist us in the estimation of the fair value of our common stock. We believe these valuations to be appropriate; however, the valuation of the equity of any private company involves various estimates and assumptions that may differ from actual values. If available, we base our common stock value on actual transactions or other transactions that are representative of stock value. The expected volatility assumption is based on the combination of the industry index for pet food wholesalers and the volatility of our largest customer. The risk-free interest rate for the expected term of the option is based on the U.S. Treasury implied yield at the date of grant. The weighted-average expected term is determined with reference to historical exercise and post-vesting cancellation experience and the vesting period and contractual term of the awards. The forfeitures rate is estimated based on historical experience and expected future activity. We have no current plans to pay dividends.
Estimating the fair value of our common stock is highly complex and subjective because our shares are not publicly traded. We will not need estimates of the fair value of our common stock to determine the fair value of new awards once our underlying shares begin trading publicly.
Recently Issued Accounting Pronouncements
We qualify as an emerging growth company pursuant to the provisions of the JOBS Act. Section 107 of the JOBS Act provides that an “emerging growth company” can take advantage of the extended transition period provided in Section 7(a)(2)(B) of the Securities Act for complying with new or revised accounting standards. We intend to “opt out” of the extended transition period with respect to new or revised accounting standards and, as a result, we will comply with any such new or revised accounting standards on the relevant dates on which adoption of such standards is required for non-emerging growth companies.
Quantitative and Qualitative Disclosure about Market Risk
We are exposed to certain market risks arising from transactions in the normal course of our business. Such risk is principally associated with interest rates and commodity price fluctuations. We currently do not enter into derivatives or other financial instruments for trading or speculative purposes.
Interest rate risk
We are exposed to changes in interest rates because the indebtedness incurred under our senior secured credit facilities is variable rate debt. Interest rate changes generally do not affect the market value of our senior secured credit facilities but do affect the amount of our interest payments and, therefore, our future earnings and cash flows. As of December 31, 2014, we had variable rate debt of approximately $390.1 million under our senior secured credit facilities. An increase of 1% would have increased our interest expense for the year ended December 31, 2014 by approximately $3.9 million.
Commodity price risk
We use raw materials that are subject to price volatility caused by supply conditions, weather, political and economic variables and other unpredictable factors. We purchase some of our raw materials in the open market. We manage our raw material exposures by entering into contracts for our dry food ingredients and through ongoing productivity initiatives. In 2015, under our Commodity Price Risk Management Policy, we expect to contract approximately 90% of our ingredients. In addition, we may enter into fixed price and/or fixed quantity contracts for a pre-determined amount of our ingredients to reduce short term price volatility in certain commodities. Although we do not currently engage in hedging activities, we expect to adopt certain hedging
61
Table of Contents
strategies in the future consistent with our Commodity Price Risk Management Policy. If commodity price changes result in unexpected increases in raw materials, we may not be able to increase our prices to offset these increased costs without suffering reduced volume, net sales and operating results.
Controls and Procedures
Internal control over financial reporting is a process designed to provide reasonable assurance regarding the reliability of financial reporting and the preparation of financial statements in accordance with GAAP. We are currently in the process of reviewing, documenting and testing our internal control over financial reporting.
We have not performed an evaluation of our internal control over financial reporting, as required by Section 404 of the Sarbanes-Oxley Act, nor have we engaged an independent registered public accounting firm to perform an audit of our internal control over financial reporting as of any balance sheet date or for any period reported in our financial statements. Our management is not presently required to perform an annual assessment of the effectiveness of our internal control over financial reporting. This requirement will first apply to our Annual Report on Form 10-K for the year ending December 31, 2016. For as long as we are an “emerging growth company,” our independent registered public accounting firm will not be required to attest to the effectiveness of our internal control over financial reporting. When we lose our status as an “emerging growth company” and reach an accelerated filer threshold, our independent registered public accounting firm will be required to attest to the effectiveness of our internal control over financial reporting.
62
Table of Contents
Love them like family. Feed them like family.
Now you can join our family too.
Dear Prospective Investors and New Family Members,
We’ve come a long way from our humble beginnings in the back of a barn, but have never forgotten our roots and why we started Blue Buffalo in the first place. We see this initial public offering, or IPO, as an opportunity to welcome new members to our growing family, so just like we tell our story to each new team member who joins the Buff, we think it’s only fitting for you to learn about our history and what we stand for.
The word “family” is at the center of just about everything related to Blue Buffalo. In fact, the simple act of treating pets, pet parents and employees like family has enabled our BLUE brand to become the #1 Wholesome Natural pet food and the #1 specialty channel brand in only ten years.
Looking back, it’s clear that the concept of treating pets like family was the driving force behind the establishment of Blue Buffalo. We (the Bishop family) always considered our dog Blue to be a family member, so when he had a bout with cancer, we got a lot more involved in his diet and took a hard look at pet food ingredients.
As concerned pet parents, my wife Jackie and I were disturbed to learn that many well-known brands contained things like chicken by-product meal, corn gluten meal and artificial flavors and colors. Not exactly ingredients that we wanted to feed our boy Blue. And since we were pretty certain that many other pet parents would share our feelings, we decided to develop a pet food that would provide a diet of high-quality, natural ingredients. We also decided to take the risk that we could build a business that people would actually care about by educating pet parents on what we believe is a major disconnect between the ingredients they are expecting to be in the dog and cat food they are buying and the ones that are actually in the bag.
So working with animal nutritionists and a great holistic veterinarian, we created a pet food that was made with only high-quality, natural ingredients plus the extra supplementation of our exclusive LifeSource Bits – a blend of antioxidants and nutrients that are cold-formed to preserve their potency. We called this two-part food our Life Protection Formula and decided to name our brand “BLUE” in honor of the family member who inspired its creation. And for those of you who might be wondering about the “Buffalo” in our name, think back to when buffalos freely roamed the Great Plains, that was a time when everything was pure, natural and healthy. Some Native American tribes even considered buffalos to be the protectors of animals, so you can see why we thought the buffalo would be a perfect symbol for the brand and the company we wanted to build.
Having been in the brand building business for many years, I knew that many great ideas never reach their full potential because the entrepreneurs behind them don’t have the financial support to get their story heard and to compete with well-established industry leaders. To get our message through, I knew we had to spend like the big companies and take the lead in educating pet parents about the differences in pet foods, so I was very excited when we met our financial partners, the folks at Invus, in 2006. They shared our vision, were long-term oriented and had the wherewithal to fund our mission.
So armed with the right ideas and the resources behind it, we took our message to the public. From day 1 our whole marketing approach has been built on transparency and has been about education. It’s simple, it’s straightforward, and it’s fact-based, just the way you’d address the subject with a family member. Take a moment to compare the ingredients in your brand with the ingredients in BLUE, and make your own decision on which one you want to feed your furry family members.
63
Table of Contents
Believing in what we do and doing it the right way is what Blue Buffalo is all about, so it’s no coincidence that we’ve been able to build a dedicated team of like-minded animal lovers as our company has grown. We refer to ourselves as “Herd members.” We enjoy working in an environment where dogs wander freely (our cats prefer to stay at home), and we are sharply focused on executing the company’s mission of educating pet parents and providing high-quality, natural food for their dogs and cats. We live by the famous saying that “who you ride the river with is just as important as where you’re going.” There are no “employees” at Blue Buffalo… everyone is a Herd member. Herd members are friends and Herd members are part of the Buff team. Our culture is summed up by our “N.A. Policy.”
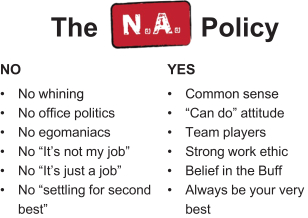
Unlike some of our mega corporation competitors, pet products is the only business we’re in. When we wake up every morning and come to work, dogs and cats are our single focus. And we do everything we can to be the best at what we do.
While we’re proud of what we do and the way we do it, there’s another side to Blue Buffalo that we’re just as proud of… our commitment to finding a cure for pet cancer. Through our Blue Buffalo Foundation for Cancer Research we’re sponsoring some critical studies at the top veterinary medical schools in the United States. The latest one, which we’re particularly excited about, is a study that may help advance treatments for a type of cancer that affects both dogs and children. I believe we’re now the #1 supporter of pet cancer awareness and research in the United States, which is a fitting tribute to the family member who inspired everything we do, our boy Blue.
In recognition of our IPO and our mission to help find a cure, working with our underwriters, Blue Buffalo will be donating $2 million to the Blue Buffalo Foundation for Cancer Research. That’s on top of $2.4 million we raised through our fund-raising efforts in 2014, a record fundraising year for our cause.
We also want to give an opportunity to the many loyal pet parents (and business associates), who discovered BLUE long before Wall Street did, to participate in our IPO. After all, they’re a big part of the Buff family. So we’ve partnered with LOYAL3 to allow them to buy shares at the same price as Wall Street, with no fees. You can learn more about this program in this prospectus.
And of course, we’re not forgetting about the Herd members who have brought us to where we are today. Treating Herd members as owners has always been an important part of how we’ve operated, so in recognition of our IPO, we will be gifting shares to every one of our Herd members (both part-timers and full-timers) who are not part of the management team. In addition, we will continue to have long-term incentive plans for our management team to make sure they continue to think and act like owners and serve our ever growing family in the best possible way. We have assembled a leadership team of True Blue Believers, and they have what it takes to make this happen.
64
Table of Contents
I sincerely believe Blue Buffalo is a very special company. We have a unique culture and a way of doing business that has made us successful and served pets, our passionate pet parents, Herd members and owners well to date. And with Invus we’ve had the good fortune of being able to work with a like-minded business partner who has enabled us to stay true to our mission.
We won’t stray from our path just because we’re going public. In fact, we hope becoming a public company will lead to greater visibility and to more pet parents hearing about us and our mission. We also want to be clear with our new public family members (i.e., shareholders) that we intend to stay true to who we are. We’ll focus on the long-term and not make short-sighted decisions. We will never cheapen our products to boost profits or cut back on the investments required to accomplish our mission and maintain the quality and safety standards that our pet parents trust us to deliver. We’ll also continue to invest in our business like the investments we’re making this year to enter into new markets, with a view towards the long-term growth of our company. In short, we will keep doing things the Blue Buffalo way.
We’re delighted that you’re considering an investment in Blue Buffalo. It’s the dawn of an exciting chapter for our family and we look forward to sharing the future with our new extended family.
Yours truly,

Bill Bishop
Founder and Chairman
65
Table of Contents
Overview
We are the fastest growing major pet food company in the United States, selling dog and cat food made with whole meats, fruits and vegetables, and other high-quality, natural ingredients. BLUE is a billion dollar brand based on sales at retail and is the #1 brand in the Wholesome Natural market segment. We currently have approximately 6 % share of the overall pet food industry and feed only 2-3% of the 164 million pets in the United States. With a proven new user acquisition strategy, we are committed to converting more pet parents into True Blue Believers and continuing to increase our share of the attractive $26 billion U.S. pet food market.
We believe we have built an exceptional company with a breakthrough brand and an innovative business model. Backed by our mission and belief in a large unmet consumer demand for pet food with high-quality, natural ingredients, we invested heavily in our brand well ahead of our scale. As a result of this investment strategy, we did not turn profitable until 2010. Our net sales have grown from $190 million in 2010 to $918 million in 2014, which represents a CAGR of 48%. During this period, our operating income grew from $15 million to $179 million, which represents a CAGR of 86%, while our net income grew from $23 million to $102 million, which represents a CAGR of 45%. Given the size and scale we have reached, we expect our growth rates to moderate in the future. We believe that only a few public U.S. CPG companies have our combination of scale, significant growth and strong margins. The following chart illustrates our growth in net sales, operating income and net income from 2005 to 2014.
Our Company History
We were founded in 2002 by Bill Bishop and his two sons, Billy and Chris. As lifelong pet lovers, the Bishops’ interest in natural pet foods was inspired by their love for their family dog, Blue. As described in the “Letter from our Founder” beginning on page 63 of this prospectus, when Blue had a bout with cancer at a young age, the Bishop family became very concerned with the quality of his food. In the process of learning all they could about pet food ingredients, they discovered what they believed was a major disconnect between what pet parents wanted to feed their dogs and cats and what they were actually feeding them. The Bishops made it their mission to bring transparency to the pet food industry by educating pet parents to look beyond the pictures on the
66
Table of Contents
packaging and to focus on the actual ingredients in the food they were feeding their pets. Tapping into this unmet consumer demand, the Bishops started Blue Buffalo to develop and market pet foods made with the kind of ingredients they would want to feed their own furry family members.
We set up our first offices in a barn in Wilton, Connecticut. Early in 2003, PetSmart agreed to sell our products in a 240 store test, and we started shipping to them in August of that year. Supported by our Pet Detectives, our brand started taking off in 2004, and in the summer of 2006, PetSmart started selling BLUE in all of its stores. Since then we have continued to add more retail partners to the Buff family as awareness of the BLUE brand increased.
Our business was initially funded by investments from the Bishop family and a small number of their friends. In 2006, when BLUE’s growth potential became clear, we decided to partner with Invus, a private investment firm based in New York City, who shared our long-term vision for the Company and possessed the deep financial resources required for us to realize our full potential. Starting in 2007, we set out on a course to achieve leadership in the Wholesome Natural market segment by investing in our people and brand building at a level that the scale of our business alone could not afford. We recruited seasoned executives from some of the largest and most successful companies in the United States and invested heavily in both advertising and in-store education. These strategic investments in our business required the Bishop family and Invus to continue to make significant equity investments to fund our business through 2009. We turned profitable in 2010, and the BLUE brand exceeded $1 billion in sales at retail in 2013. Today, BLUE is the leader in the Wholesome Natural market segment in the United States and one of the top pet food brands overall. We are proud to employ approximately 1,700 full-time and part-time Herd members in the United States.
Evoking the Bishop family’s love for their dog “Blue” and the buffalo, an iconic image of the natural American frontier, the Blue Buffalo name is a constant reminder of our challenge and commitment to “stay true to BLUE” and preserve our passion and authenticity as we grow our business. As part of our commitment to “stay true to BLUE,” we established and continue to support the Blue Buffalo Foundation for Cancer Research, which sponsors critical studies of pet cancer, health, treatment and nutrition at top veterinary medical schools across the United States. The most recent study the foundation has funded, and one which we are particularly excited about, is a study that may help advance treatments for a type of bone cancer that affects both dogs and children. We believe we are now the #1 supporter of pet cancer awareness and research in the United States, which is a fitting tribute to the family member who inspired everything we do, our boy Blue.
We will remain committed and stay true to our founding objectives of making the healthiest pet food we can, being a great place to work and helping to find a cure for pet cancer. That is our promise to our loyal pet parents and to ourselves.
Our Industry
Large and Attractive
Pet food is one of the largest CPG categories in the United States. We estimate the U.S. pet food industry had approximately $26 billion in retail sales in 2014. According to Euromonitor, the pet food industry had $49 billion in additional retail sales outside the United States in 2014, bringing the total size of the global pet food industry to over $75 billion.
U.S. pet food retail sales grew 62% between 2004 and 2014, which represents a CAGR of 5%, based on data from Euromonitor. The industry growth over this period has been fueled by the “humanization” of pets, as pets are increasingly regarded as family members. This humanization trend has led pet parents to increasingly evaluate pet foods in the same way they scrutinize their own food choices. As more pet parents seek better, more wholesome options for themselves, they also seek these types of options for their pets. As a result, a significant number of pet parents have demonstrated a willingness to pay a premium for pet food that they believe will enhance the well-being of their pets. The higher demand for natural food products and more specialized formulas
67
Table of Contents
for different life-stages, breed sizes, special needs and diet types has fueled premiumization in the industry, leading to the faster growth of products with higher revenue per pound. This premiumization trend has impacted all market segments and product types in the pet food industry.
The pet food industry has high penetration in the United States with 63% of households purchasing pet food in 2014. Virtually all pets in the United States are fed packaged pet foods. The continued growth of the industry through the worst economic recession in recent history is a testament to the underlying consumer demand and the strength of the consumer trends driving it. Pet food is also a highly branded industry with low rates of switching due, in part, to potential digestive issues that may occur when switching between different pet food brands. As a result, brands that build a strong relationship with a pet and its pet parents realize significant value over the lifetime of the pet, especially if the pet starts on the brand as a puppy or kitten.
The pet food market consists of dog food sales, which make up approximately 70% of the market, and cat food sales, which make up the rest. Food sales are further categorized as dry food, wet food and treats:
| • | Dry food is the primary food form for both dogs and cats, with the same formula typically purchased regularly. Approximately 20 years ago most pet parents fed their dogs and cats more wet foods than dry foods. Veterinarians now recommend dry food for healthy pets as the main meal, which is better for pets’ teeth, has better economic value and is more convenient to handle and store. |
| • | Wet food has higher penetration among cats as compared to dogs, as it helps to ensure that cats meet their required water intake. Most cat parents feed their cats a combination of dry and wet foods as main meals, while most dog parents feed their dogs wet foods as a treat or topper to provide variety. After a long period of decline in the volumes of wet dog foods and slower growth in volumes of wet cat foods as pet parents continued to switch from wet foods to dry foods, wet food volumes stabilized and in the last two years have started growing. We believe that the recent increase in the popularity of wet foods is tied to product innovation in the overall industry and increased focus from Wholesome Natural brands. |
| • | Treats are typically impulse purchases by pet parents made alongside staple, main meal dry and wet food purchases. Many treats have dental and training benefits and also serve as nutritional supplements. Dog and cat treats have been growing rapidly over the last decade driven by the humanization trend with pet parents indulging their pets more, including by purchasing treats as gifts. |
The following chart shows the sales of pet food in Tracked Channels for 2014 by species and product type:
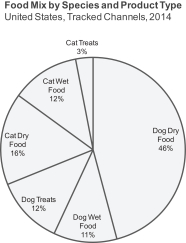
68
Table of Contents
Retail sales growth in the pet food industry has continued to outpace volume growth for each product type for both dogs and cats. Pet food volume has grown due to the increase in the overall number of pets but volume growth has been affected by the shift from wet foods to dry foods, as pets need to be fed fewer pounds per day of dry food compared to wet food. The humanization trend has led to the emergence and growth of the Wholesome Natural and Therapeutic market segments as pet parents increasingly treat their pets like family, as well as the introduction of pet foods more tailored to the needs of different pets across all market segments. This has, in turn, led to the continued premiumization of the industry, and the resulting increase in price per pound has been the primary driver of growth. The following charts show the CAGR of volume sold and retail sales from 2004 to 2014 by species and product type, according to data from Euromonitor. Beginning in the second half of 2013, increased promotional activity in the industry led to lower price per pound growth.
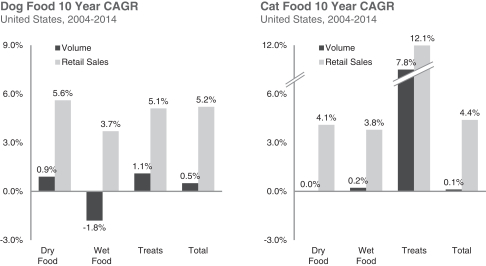
Examples of more tailored and value-added product offerings pet food companies have introduced across the different market segments include:
| • | Life-stage specific foods are formulated for changing nutritional requirements in different life-stages. For example, puppy dry dog formulas typically have higher levels of protein and include DHA, a nutrient to help promote cognitive development. |
| • | Breed size specific foods are formulated for specific nutritional needs of different breeds including kibbles of different shapes and sizes. For example, small and toy breed dog food formulas typically have higher levels of protein for higher energy levels, while large breed formulas include nutrients to help support joint health. Small and toy breed foods are also sold in smaller bags and cans, which typically carry a higher price per pound compared to a similar formula in larger packaging. This leads to higher prices per pound across product types, which offsets the lower volume of dog food consumed by smaller dogs. |
| • | Foods with functional benefits help with specific conditions such as urinary tract health and hairball management for cats. Some foods may also help with weight management, as obesity has also become an important issue for pets. In treats, dental bones promoting oral health is a sizable and fast-growing category. |
| • | Grain- and gluten-free foods contain no grains or glutens. These foods are a fast growing part of the market reflecting pet parent preferences for their pets and mirroring similar trends in human foods. |
69
Table of Contents
| • | Ancestral diet type foods are a subset of grain-free foods for pet parents looking for diets that more closely mimic the diets of wolves and lynxes, who are the ancestors of dogs and cats. In addition to being grain-free, they typically have higher meat content and higher overall protein levels. |
| • | Limited ingredient diets are for dogs and cats that have food sensitivities. In order to reduce the number of food sensitivity triggers, these foods are typically made with only one type of protein and/or proteins that are less common in pet foods. Many are also dairy-free and grain-free. |
| • | Human food inspired foods are wet foods or treats with recipes that are similar to familiar human food recipes such as stews, soufflés, meatballs and biscuits. These foods have been significant drivers of growth for wet foods and treats. |
Overall pet food retail sales have only modest seasonality with the fourth quarter, which is when pet parents purchase more treats for their pets as holiday gifts, being approximately 6% higher than in the summer months when pets typically eat less. As treats grow to become a larger part of our business and as our overall business grows, we expect our business to reflect a similar seasonality.
The cat litter market in the United States accounted for $2 billion in retail sales in 2014 and has grown at a CAGR of 4% from 2004 to 2014. It is currently dominated by synthetic, chemical-based litter solutions, though a number of alternative, plant-based litters have emerged in recent years. In 2012, we entered the cat litter market with a walnut-based cat litter product that does not contain any artificial or synthetic materials. We believe that efficacy in areas such as absorption and odor control, lack of dust, low tracking of litter and value will be important factors in the acceptance of alternative litter forms such as ours. In the future, we may selectively enter new categories that align with our mission and brand position.
Channels
In 2014, specialty channels accounted for 45% of U.S. pet food sales, with the FDM channel accounting for the other 55%. Specialty channels include a diverse set of retailers with over 20,000 stores (which includes national pet superstore chains (i.e., PetSmart and Petco), regional pet store chains (e.g., Pet Supplies Plus, Pet Supermarket, Petsense and Pet Valu), neighborhood pet stores, farm and feed stores (e.g., Tractor Supply Company and Mid-States), eCommerce retailers (e.g., Amazon, Chewy and Petflow, as well as websites of major retailers), military outlets and hardware stores) and 25,000 veterinary clinics. BLUE is sold across all types of specialty channel outlets, although our sales in the Vet channel, which represents 6% of U.S. pet food sales, are currently minimal. We have chosen to sell BLUE in the specialty channels as we believe these channels provide a better environment for us to interact with and educate pet parents, help position BLUE as a premium brand and dedicate more shelf space to pet food, which grants consumers access to a broader range of our products. Pet food sales in specialty channels have grown faster than pet food sales in the FDM channel for the past 20 years as a result of the expansion of the channel and its pet-focused environment and superior product selection.
70
Table of Contents
The following shows the type of specialty channels and the estimate of the number of stores in the different types of specialty channels through which pet foods were sold as of the end of 2014:
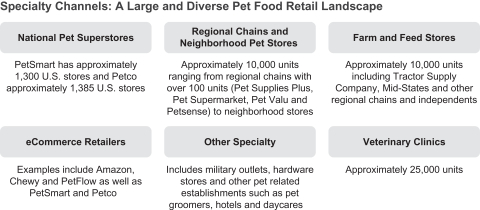
We estimate that Tracked Channels represent 86% of the total U.S. pet food market. Untracked Channels include FDM retailers that do not participate in Nielsen tracking (e.g., Costco and Whole Foods), farm and feed stores, eCommerce retailers, hardware stores and military outlets. We believe that Untracked Channels are growing faster than Tracked Channels and shifting some volume out of the Tracked Channels. We participate in Untracked Channels as well (outside of the FDM channel), where BLUE is growing rapidly.
Published estimates of the size of the eCommerce sales of pet foods in the United States vary significantly as it is an Untracked Channel. We estimate that in 2014 the eCommerce channel represented approximately 2% of pet food sales in the United States, which includes sales through stand-alone eCommerce retailers, as well as websites of brick-and-mortar retailers. We believe the eCommerce channel is growing rapidly with year-over-year growth rates in the teens as consumers increasingly shop for CPG online and as more eCommerce retailers offer free shipping on pet foods.
The following chart shows pet food retail sales in the United States in 2014 for both Tracked and Untracked Channels.
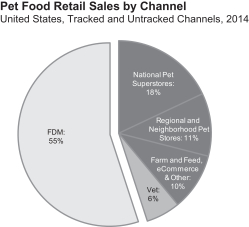
|
71
Table of Contents
Market Segments
There are no standard market segment definitions in the pet food industry. We segment pet foods into Wholesome Natural, Engineered, Private Label and Therapeutic market segments. This market segmentation is based on the ingredient profile of pet foods, with the exception of Private Label and Therapeutic pet foods, for the reasons discussed below. While others may segment the market in different ways, we believe this market segmentation is most helpful in understanding the industry and its market dynamics.
Our definition of the Wholesome Natural market segment incorporates the AAFCO definition of “natural,” but imposes further criteria based on the type of ingredients used to achieve nutritional targets. We believe this specific and ingredient-focused market segmentation reflects consumer preferences and how consumers make their purchase decisions, as evidenced by the disparity among the growth rates of the different market segments. While all BLUE products satisfy the criteria specified for the Wholesome Natural market segment described below, in order to account for variation in our competitors’ portfolios of products, a pet food brand or product line is categorized in a particular market segment if 90% or more of the products under such brand or product line as measured by retail sales (rather than by volume) satisfy the market segment criteria specified. We define the market segments as follows:
| • | Wholesome Natural brands achieve their nutritional targets using only natural ingredients (as defined by AAFCO), and may include added vitamins, minerals and other trace nutrients. All Wholesome Natural dry foods have whole meats and/or meat meals, with the type of animal protein clearly identified, as their principal ingredients. Wholesome Natural products (dry foods, wet foods and treats) do not include chicken or poultry by-product meals, which we believe pet parents do not desire. Wholesome Natural products also do not rely on grain proteins, such as corn gluten meal, wheat gluten and soybean meal, as principal sources of protein as grain proteins have a narrower array of amino acids compared to animal proteins. In addition, these products also do not use corn, wheat, soy or fractionated grains, such as brewer’s rice, as sources of starch. |
| • | Engineered brands achieve their nutritional targets without fulfilling all the requirements of the Wholesome Natural market segment. They typically do not contain whole meat or meat meal as their principal ingredients and/or they use lower cost proteins (such as chicken by-product meal, corn gluten meal or wheat gluten) and lower-cost starches (such as corn, wheat or fractionated grains). Engineered products may or may not include artificial ingredients or preservatives. |
| • | Private Label brands are owned by retailers. While the vast majority of Private Label products fall within the Engineered market segment, some Private Label products fall within the Wholesome Natural market segment based on their ingredients. However, consistent with retail industry practice, market data providers do not identify the specific Private Label SKUs. As a result, Private Label market segment sales are not categorized into either the Wholesome Natural or the Engineered market segment. |
| • | Therapeutic (Rx) brands are formulated to support treatment for certain medical conditions and are prescribed by veterinarians. Certain Therapeutic pet foods that claim to diagnose, cure, mitigate or prevent diseases are regulated by the FDA as animal drugs rather than as pet food, and are subject to FDA pre-market approval. In light of this regulatory process and the distinct Vet channel for the sale of Therapeutic pet foods, there is no Private Label participation in this market segment. |
We believe the Wholesome Natural and Therapeutic market segments are particularly on trend as pet parents increasingly treat their pets like family. With market shares of 17% and 7%, these two market segments have become significant parts of the U.S. pet food market, and continue to grow faster than the rest of the market.
72
Table of Contents
As a result of the highly branded nature of the pet food industry, the U.S. pet food market has had modest Private Label penetration, with approximately 10% share in 2014 across all channels. We estimate that Private Label share of pet foods in the specialty channels is approximately 3%. While we expect that Private Label penetration within the specialty channels will continue to grow, we believe that Private Label penetration is structurally lower in such channel than in the FDM channel. This is due to the specialty channels’ focus on offering well-known brands that are sold exclusively in the specialty channels.
We believe the Engineered market segment will continue to grow slower than the overall market and continue to lose share. We expect that the Wholesome Natural market segment will gain a majority of the volume shifting away from the Engineered market segment as a result of the continuing humanization trend.
The following chart shows the retail sales by dollars and pounds by market segment within Tracked Channels for each of the years between 2011 and 2014, as well as our market share of the Wholesome Natural market segment for the same periods.
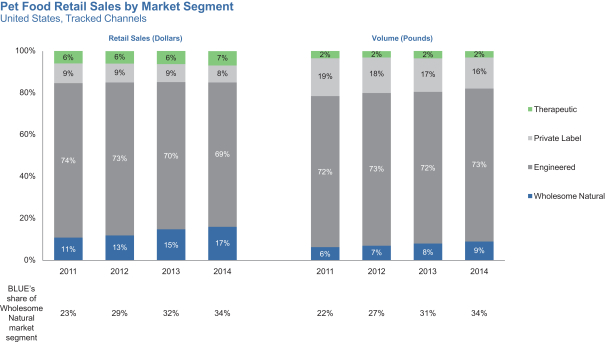
Competitive Landscape
The pet food industry is highly competitive. Our main competitors are large CPG companies with long histories and well recognized brands. Companies with major pet food businesses include Nestlé, Mars, J.M. Smucker (owner of recently acquired Big Heart Pet Brands, formerly known as Del Monte) and Colgate-Palmolive. In August 2014, Mars acquired Procter & Gamble’s pet food business in the United States, which increased Mars’ U.S. market share in Tracked Channels from 15% to 20% for 2014, on a pro forma basis. Together with Blue Buffalo, these five major pet food companies had an aggregate U.S. market share of approximately 78% in 2014. Private Label brands had an 8% market share in Tracked Channels in 2014. We compete on the basis of product quality and palatability, brand awareness and loyalty, product variety and ingredients, interesting product names, product packaging and package design, shelf space, reputation, price and promotional efforts.
73
Table of Contents
The following chart shows the retail sales of pet food within Tracked Channels by pet food company for the year ended December 31, 2014.
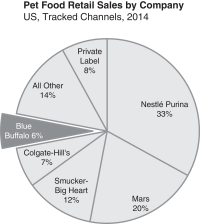
The pet food industry is highly fragmented at the brand level, with over 100 brands with retail sales exceeding $10 million in Tracked Channels. Our major competitors typically follow a brand portfolio approach with each brand often having distinct positioning by species and/or product type. Unlike most of our competitors, we have a master BLUE brand with a strong identity on the top and individual product lines underneath.
Over the last decade, all of our major competitors and many independent companies have also entered or have attempted to benefit from the fast-growing Wholesome Natural market segment through new brand introductions, brand extensions and/or acquisitions. These attempts have included entries directly into the Wholesome Natural market segment, as well as launching brands and products that have some but not all of the Wholesome Natural market segment’s characteristics. Most of the pet food brands we compete with in the Wholesome Natural market segment, such as the Wellness and Taste of the Wild brands, are not owned by major pet food companies but are instead owned by other pet food companies such as WellPet and Diamond Pet Foods, respectively. We continue to enjoy leading growth and clear leadership of the Wholesome Natural market segment. We have also continued to widen our lead in the Wholesome Natural market segment as our market share increased from 23% in 2011 to 34% in 2014. As a result, in 2014 we had three to four times the share of the next largest Wholesome Natural brand.
In 2014, the Therapeutic market segment had retail sales of approximately $1.5 billion in the United States and continued to grow at a significantly higher rate than the overall pet food market. We believe there are significant barriers-to-entry to the Therapeutic market segment as it requires significant research and development expertise and investment, the ability to reach veterinary clinics through a separate sales force and distribution network, as well as compliance with specific FDA regulatory requirements and processes. As a result, currently only three major pet food companies participate in the Therapeutic market segment in the United States. Over the past several years, we have invested significant time and resources analyzing this market segment and plan to enter this market segment with differentiated natural Therapeutic pet food products.
74
Table of Contents
The following chart shows the primary brands and product lines for the five major pet food companies as of December 31, 2014, categorized by market segment:
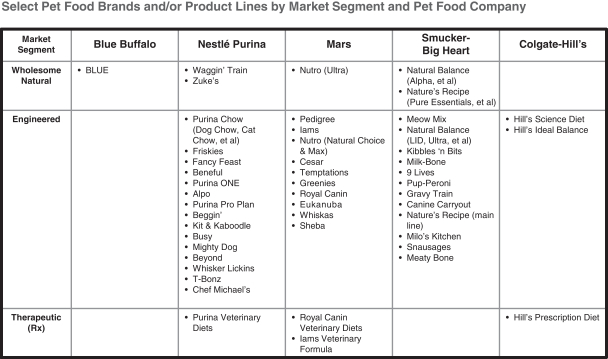
75
Table of Contents
The following chart shows the retail sales of pet food in Tracked Channels by brand and/or product line within each market segment for the year ended December 31, 2014. The width of bars on the horizontal axis represents the relative size of each market segment. The height of each brand and/or product line represents its share of retail sales within its market segment. The brands and/or product lines are presented in order of their share of the relevant market segment. No brand or product line included in “All Other” has more than a 1% share of its market segment.
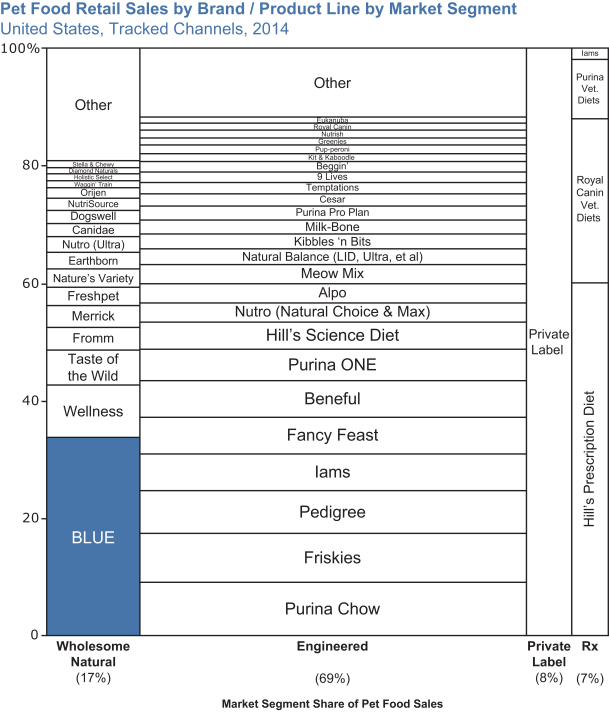
76
Table of Contents
Recent market growth trends
Starting in the second half of 2013, the largest pet food company in the United States initiated a significant increase in its promotional spending focused primarily on the FDM channel, which effectively reduced the average price per pound of pet food for its products. Other pet food companies responded by increasing their own promotional spending. Given the steady volumes consumed by pets, this heightened promotional activity drove down the pet food category growth rate in 2013 and 2014. It also reduced traffic to the specialty channels as price gaps widened and consumers stocked up on pet food products as a result of these increased promotional offers. As a result, overall pet food sales growth rate in Tracked Channels decelerated from 5% in 2012 and 4% in 2013 to 1% in 2014. However, despite these FDM-focused promotional activities, specialty channels continued to grow faster than the FDM channel during this period, with a 3% growth rate compared to a decline of 0.3% for the FDM channel as measured in Tracked Channels. As of the first quarter of 2015, sales growth rates have been improving but are still not at historical growth rates. We believe Untracked Channels have continued to grow at significantly higher rates than the overall market, as well as specialty channels. Wholesome Natural and Therapeutic market segments also continued to outperform the overall market in 2014, growing at a rate of 14% and 5%, respectively.
The following chart shows the year-over-year retail sales growth rate of pet food in Tracked Channels by channel for each of the years between 2011 and 2014 and for the first quarter of 2015.
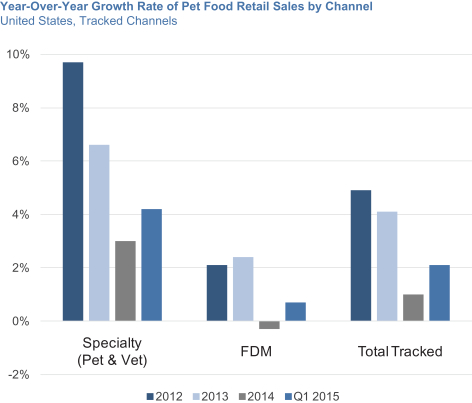
77
Table of Contents
Our Strategic Differentiation
The Landscape We Found
Pet food in 2002 was an established industry dominated by large CPG companies, offering a variety of brands made primarily with ingredients such as poultry by-product meals, corn, wheat and soy. Based on our conversations with many pet parents, we found that the vast majority of them did not read pet food labels and were often unaware of the ingredients they were feeding their pets, even though they were seeking natural foods and products for themselves and their families. A number of small natural pet food brands began to emerge in the neighborhood pet stores, led by entrepreneurs who often did not have the funding to build sizable businesses. In parallel, the pet food retail landscape had evolved significantly with the expansion of national pet superstores. These superstores carried a broad assortment of pet products and foods, anchored by Engineered brands but did not participate in the emerging Wholesome Natural market segment in a meaningful way.
The BLUE Disruption
We set out to challenge the status quo set by the incumbent brands. We were convinced that the Wholesome Natural market segment could become a large part of the industry due to a large unmet consumer demand for pet food with high-quality, natural ingredients. We have established our leadership position in the Wholesome Natural market segment through the strength and quality of our products, by broadly sharing our message to encourage pet parents to read ingredient labels and by pricing our products at a reasonable premium to Engineered brands. This approach was in contrast to our major competitors whose business models were tied to the mass production of Engineered brands.
We committed to creating wholesome pet food made with whole meats, fruits and vegetables and other high-quality, natural ingredients that we feel good about feeding our own furry family members and to educating fellow pet parents about pet nutrition. We further distinguished our products by creating a two-part dry food, consisting of kibble and our trademarked LifeSource Bits that are cold-formed to help preserve the potency of vitamins, minerals and antioxidants. LifeSource Bits are more expensive and complex to manufacture, but we believe they provide significant benefits and create a visual point of differentiation when we talk to pet parents. We also combined advanced quality control and supply chain capabilities generally consistent with the standards required for human food industries with our deep expertise in pet foods. We believe these competitive advantages, together with our investments in our brand, have distinguished us from our smaller competitors in the Wholesome Natural market segment.
We deploy our Pet Detectives, part-time pet-passionate team members, to help us fulfill our mission to educate fellow pet parents about pet nutrition. Pet Detectives interact with pet parents one-on-one as they shop for pet food in specialty stores nationwide and in Canada. Our Pet Detective program serves as an educational marketing and sales platform as it is a resource for both pet parents already feeding their pets BLUE and pet parents currently feeding their pets other pet food brands. The Pet Detectives allow us to engage pet parents with our brand story, our mission and our shared love for pets in an authentic manner.
From the dynamics we saw in human foods, we knew that consumers were willing to pay a premium for natural products, and we were confident that pet parents would be open to paying a reasonable premium for our natural products for their furry family members. Our price premium compared to Engineered brands varies. For example, virtually all pet parents feeding their medium-sized dog an Engineered brand can switch to BLUE for anywhere from no extra cost to 70 cents more per day. For a cat, they can switch to BLUE for anywhere from no extra cost to 30 cents more per day. As we have grown, we have successfully switched pet parents from feeding their pets various brands across the full range of price points to feeding their pets BLUE, demonstrating our broad appeal and affordability to a large population of pet parents.
We believe that our rapid creation of a brand with over a billion dollars of sales at retail is proof that our strategy is working.
78
Table of Contents
Building Our Brand
We chose to build a master BLUE brand with a strong identity on top and different product lines underneath with distinct benefits and personalities, instead of following a brand portfolio approach like most of our major competitors. We engage pet parents with our brand story, mission and our shared love for pets. We want to build a relationship with our consumers by having them understand what we do and why we do it, rather than just sell them a product. With our transparent approach, we strive to educate them on pet nutrition and ingredients so they can make their own informed choices. Our mantra is “Love them like family. Feed them like family.” We carry this message across all our touch points with pet parents – from our advertising to the one-on-one conversations our Pet Detectives have with tens of thousands of pet parents at stores around the United States and Canada every week.
In order to reach a broad cross-section of consumers, we started out in national pet superstore chains with large stores around the country. As our brand has grown, we have continued to broaden our distribution within the specialty channels to include, among others, regional and neighborhood pet stores, farm and feed stores and online retailers. Today BLUE is sold at over 10,000 stores across the United States and Canada.
Since we started in national pet superstore chains, which have more shelf space dedicated to pet food than either the FDM channel or neighborhood pet stores, we were able to offer a broad portfolio of products at an early stage in our brand development. As our brand grew and our retail sales surpassed even well-known brands, we gained scale and now offer even more tailored product offerings. Today, we have the broadest portfolio of products of any natural pet food brand in the United States. Our goal remains to offer pet parents a no-compromise product solution for their needs. We believe this leads to higher levels of satisfaction, a higher share of their spending and increased brand loyalty.
We started with an ambitious vision to build our brand, and we followed a deliberate strategy, investing in brand communication at the level of the major brands when the Wholesome Natural market segment and the size of our business alone were too small to financially support that spending. Our results continue to reinforce our belief in our strategy and execution.
Our Marketing Engine and Strong Brand Equity
We believe we have an effective new user acquisition strategy: a powerful, authentic brand with significant, ongoing investment in proven marketing elements and a broad product portfolio with tailored specialty formulas.
We believe we have a highly engaged consumer base of passionate pet parents, who connect with our authentic story of a pet food brand that is “by pet parents for pet parents.” Our goal is for the buffalo icon and the BLUE shield featured on our products to symbolize quality and project a certain attitude that pet parents feel good associating with. We actively support pet cancer awareness and research, promote animal welfare and engage our pet parents in these important causes with special events such as the Pet Cancer Awareness Month during May of every year. We believe our consumers are strong advocates of our brand and are major contributors to our success in the marketplace.
Our master brand strategy, combined with significant cumulative investments in highly effective marketing and brand-building of over $400 million since 2003, has resulted in what we believe to be one of the strongest brand equities in the pet food industry. We have a full-service in-house advertising and marketing agency which enables us to maintain the authenticity of our communications, whether through marketing or packaging, and allows us to build a cohesive brand. This integrated approach gives us a significant advantage in speed-to-market from product development to advertising, increases our marketing effectiveness and creates marketing efficiencies.
79
Table of Contents
We are currently the #1 advertiser in the Wholesome Natural market segment by a wide margin and one of the top advertised brands in the industry overall. However, we still have a significant opportunity to expand our brand awareness compared to brands with much longer histories in the marketplace. Based on our internal market research for BLUE, BLUE’s “familiar aware” metric (which is a metric used to measure, with respect to any given brand, the level and quality of awareness of pet parents who have at least some knowledge of such brand) is just over half the level of the pet food brand with historically the largest media spend. We plan to continue to invest in advertising to increase our brand awareness and drive traffic to brick-and-mortar stores and eCommerce retailers where BLUE is sold.
Our commitment to pet nutrition education is reflected in our approach to marketing, which has a strong call-to-action for pet parents to examine the ingredients in their pet food. We achieve this through our integrated marketing strategy and Pet Detective program. Our Pet Detectives interact meaningfully with tens of thousands of pet parents at stores around the United States and Canada every week as they shop for pet food, instead of just handing out coupons or samples. We believe our Pet Detective program enhances the in-store shopping experiences of our retail partners and provides us with the benefits of direct-to-consumer marketing without creating a conflict with our retail partners. We have a strong field management organization recruiting passionate pet parents to be Pet Detectives, training them and providing ongoing coaching and supervision. Our online reporting and training platforms help us keep in touch with them and supplement in-person training. We use a rigorous set of analytics to manage and optimize our Pet Detective program on a store-by-store level. We believe our Pet Detective program is the largest of its kind run by any CPG company in the United States. More recently, as we focus on increasing our distribution in channels outside national pet superstores, we have been investing in sales and marketing capabilities and programs suited for these different channels such as in-store merchandising to differentiate our products in smaller footprint neighborhood stores and web marketing tools to increase our conversion of online traffic. We also continue to look for ways to strengthen our relationships with key influencers in the industry (e.g., veterinarians, store associates and trainers) to help generate more recommendations for BLUE. Based on our research, a veterinarian recommendation is the top factor in pet food brand selection, with over one in five pet parents choosing their pet food brand based on a veterinarian recommendation. Until recently, we had no material communication or engagement program with this important group of influencers. After a successful pilot in 2014, we have recently launched our new True Blue Veterinary program. As part of this initiative, we have started building a dedicated national detailing force exclusively focused on the veterinarian community, which we will continue to expand on a regional basis in the next few years. Our Veterinary Clinic Specialists focus on educating the veterinary clinic staff on pet nutrition and the BLUE brand and products, which we believe will lead to more recommendations for BLUE in the future and help drive our growth.
Our Broad and Growing Consumer Base
We have a broad and growing consumer base which we believe is a testament to the success of our marketing engine and strong brand equity. Our overall market share has more than doubled since the beginning of 2011.
We believe our brand has broad appeal in all geographies and across a wide range of demographics in the United States. While we have an opportunity to grow our share more rapidly in certain geographies where BLUE historically has had more limited distribution, there is no significant concentration in any particular region. Our brand and our consumer value proposition resonate strongly across the United States, including the coasts and the middle of the country.
80
Table of Contents
The following chart shows our relative share of pet food sales by IRI’s standard geographic regions, where BLUE’s relative share of retail sales for each geographic region is indexed to BLUE’s overall share of U.S. pet food sales:
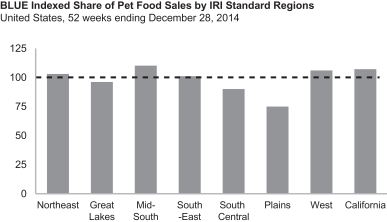
Given the strong brand loyalty in pet foods in general, regardless of the strength of the marketing message, there is a certain level of inertia that needs to be overcome in order to convince pet parents to switch brands, which varies by the age of the pet and the pet parent. BLUE indexes higher among younger pet parents who generationally tend to be more in tune with health and wellness trends and more focused on ingredients, and we see this as a leading indicator of our future market share potential. We believe older pet parents are more likely to have older dogs and cats and to have had previous dogs and cats whom they fed Engineered brands. While pet parents of pets of all ages switch brands, we believe the tendency to switch is typically lower for older pets compared to a puppy or kitten.
As the vast majority of sales of dry and wet pet foods in pet specialty stores are life-stage specific, we use our share of pet food sales by life-stage as an indicator of our share of dogs and cats by life-stage. Based on this analysis, our share of puppies and kittens is significantly higher than our share of older dogs and cats, reflecting the fact that BLUE is a younger brand with a shorter history and the strong brand loyalty in the pet food industry. We believe our higher share of puppies and kittens is also a leading indicator of our future market share potential. We believe that we can realize significant lifetime value from our relationship with this younger generation of pets, especially as our share of puppy- and kitten- specific pet foods, as well as our overall market share, has increased in each of the last three years.
81
Table of Contents
The chart below on the left shows our relative share of pet food sales by IRI’s standard household generation, where BLUE’s share of retail sales for each household generation is indexed to our overall share of U.S. pet food sales, while the chart below on the right shows our relative share of pet food sales in U.S. specialty stores by life-stage according to GfK, where BLUE’s share of retail sales for each life-stage is indexed to our overall share of U.S. specialty stores.
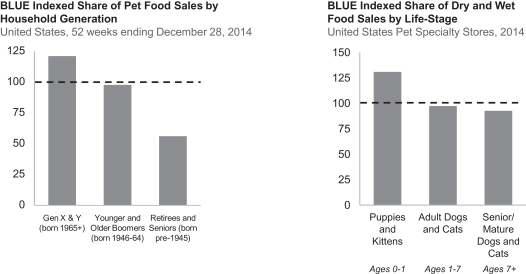
Our Product Development Engine with the Broadest Portfolio
We have the broadest portfolio of products of any natural pet food brand in the United States. Our tailored product offerings enable our pet parents to satisfy their pet’s specific dietary, lifestyle and life-stage needs, offering them no-compromise product solutions. We believe this, in turn, leads to higher consumer satisfaction, brand loyalty and a lifetime relationship between us and pet parents and their pets.
Our product portfolio enjoys a strong base of existing products, combined with a strong track record of significant and incremental new product introductions. For example, Adult Chicken & Brown Rice dry dog food formula under our BLUE Life Protection Formula line, which was first introduced in 2003, is still our best-selling formula. We constantly watch health and wellness trends for humans and pets and evaluate whether to adopt such trends for the BLUE product portfolio. We have a multi-year product development funnel we use to plan and manage our product development engine. Once a concept passes our screening criteria, we believe we can bring new products to the market significantly faster than our major competitors as a result of our singular focus on the Wholesome Natural market segment and our integrated in-house marketing, research and development and product development capabilities. Our retail partners in the specialty channels also look to us to drive innovation and enable us to rapidly introduce new products into the marketplace.
82
Table of Contents
We have a broad product portfolio across different product types, diet types, breed sizes for dogs, life-stages, flavors, product functions and textures and cuts for wet foods. The diagram below illustrates the possible range and variety of characteristics of pet foods, which provides us with the opportunity to further broaden our portfolio through continued innovation.
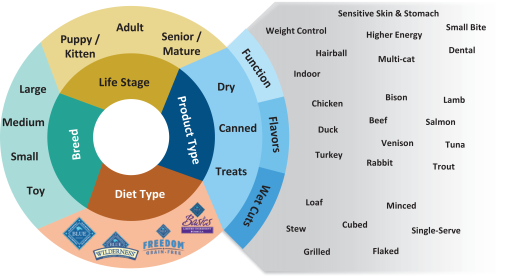
We have built four major product lines under our master BLUE brand, each with a different nutritional philosophy and distinct personality. We continue to deepen each product line with new products, expand each product line’s shelf presence and support each product line with advertising:
| ¡ | BLUE Life Protection Formula – introduced in 2003, this is our original and largest product line with the broadest flavor, functional and breed-specific variety. Products under this line may not refer to “BLUE Life Protection Formula” explicitly on their packaging as we group all food products that that are not specifically designated as BLUE Wilderness, BLUE Basics or BLUE Freedom under our BLUE Life Protection Formula line; |
| ¡ | BLUE Wilderness – introduced in 2007, this is our high-meat, high-protein, grain-free ancestral feeding line and our second largest product line; |
| ¡ | BLUE Basics – introduced in 2010, this is our line of limited ingredient diet products for pets with food sensitivities; and |
| ¡ | BLUE Freedom – introduced in 2012, this is our grain-free line that is a cousin of the original BLUE Life Protection Formula line. |
83
Table of Contents
The following table shows the different product types available under our product lines:
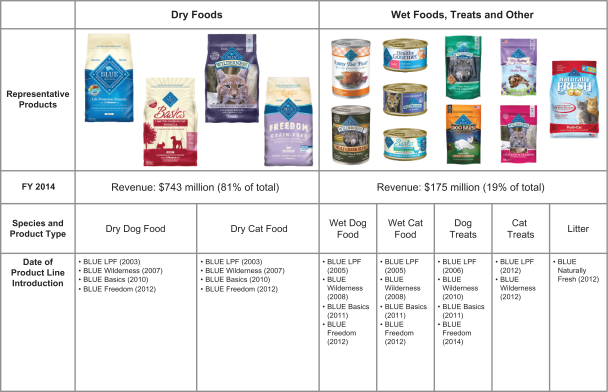
Note: BLUE LPF refers to BLUE Life Protection Formula.
We offer a range of natural products at different price points across our product portfolio. Price points vary between and within the product lines primarily based on the type of protein sources they use. Products that use less common proteins, which typically cost more, or that use specialized formulas (e.g., products that are breed-specific, grain-free or have limited ingredients) are significantly more expensive to produce. These products are sold at a higher price to offset the higher ingredient costs and typically have higher gross margins than otherwise similar products in our product portfolio.
84
Table of Contents
As illustrated on the chart below, the price per pound of BLUE products varies across our portfolio by product line, species and product type. Our newer product lines, cat foods and wet foods and treats have a higher price per pound than our BLUE Life Protection Formula line, dog foods and dry foods, respectively.
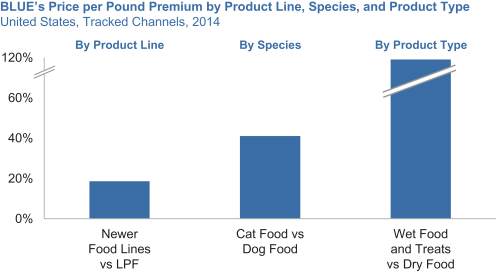
Our product mix continues to improve as our newer product lines, cat foods and wet foods and treats also have higher gross margins and are growing at a faster rate than our overall company.
We also develop and sell cat litter products under our BLUE Naturally Fresh line. We entered the cat litter market in 2012 and currently offer five different cat litter formulas, which are all made from walnut shells and do not contain any artificial or synthetic materials. Our share of cat litter sales in Tracked Channels was less than 1% in 2014 and is growing rapidly.
85
Table of Contents
The charts below show the retail sales of pet food and cat litter by product type, comparing BLUE to the overall pet food and cat litter markets within all Tracked Channels for 2014, as well as retail sales of BLUE products by product line within Tracked Channels for 2014. Relative to the overall pet food and cat litter market, we have a lower share in wet foods, treats and cat litter. We believe there is significant growth potential for BLUE across all product types, especially for product types where we have lower penetration, as evidenced by the fact that our sales of wet foods, treats and cat litter grew at a faster rate than our overall sales in 2014.
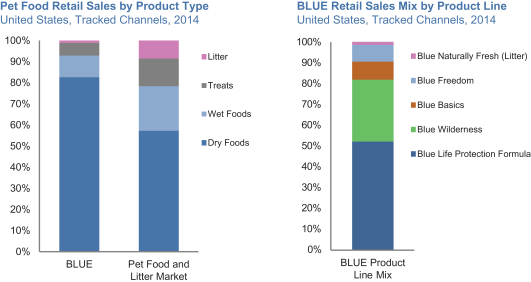
Our research and development and product development teams work together to develop natural products that we, as pet parents, would want to feed our pets. Our focus on natural ingredients is a core advantage as we continue to develop and build upon our expertise. The formulations and processes required for the manufacture of Wholesome Natural pet foods are often different from those of Engineered pet foods. For example, developing and managing the shelf life of products is more difficult when using only natural preservatives. In addition, wheat, which is a “natural” ingredient, is a low-cost but effective food binder that is commonly used in the pet food industry. Since we do not use wheat in any of our products, we have developed know-how and expertise in the use of ingredients other than wheat to act as food binders. Our research and development team, staffed with animal nutritionists with PhDs and food scientists, works on new technologies, formulations and testing. Our product development team provides consumer and market insight, as well as project management leadership. Working together with our in-house advertising and marketing agency, the two teams develop and launch new products and improve our existing products. We also work with external technical experts and suppliers to help us stay at the forefront of technological developments and advancements. In 2012, 2013, 2014 and the three months ended March 31, 2015, our total research and development expenses were $1.6 million, $4.6 million, $7.6 million and $2.2 million, respectively. These expenses include personnel costs, testing costs and expenses related to outside services.
Having built a scaled corporate infrastructure with a strong go-to-market engine, we believe we are well positioned to supplement our internal product development platform by incorporating new technologies or product forms through joint-ventures, licensing agreements and acquisitions. We will take a thoughtful approach to our business development efforts in this area and intend to be selective in pursuing incremental, synergistic opportunities aligned with our mission and strategy.
86
Table of Contents
Our Organization: “The Herd”
Our company culture is an integral part of our strategy and one of our founding objectives is being a great place to work. We have a strong and dedicated team of employees we refer to as “the Herd,” where each one of us is a “Buff.” Our company culture is built on entrepreneurship, collaboration, a commitment to Blue Buffalo’s mission, a competitive spirit and a friendly, casual work environment. As of March 31, 2015, we employed approximately 1,700 Buffs, including full-time and part-time Buffs, none of whom was represented by a labor union. We believe we have a good relationship with our team members and that our company culture is a key competitive advantage and a strong contributor to our success.
We have a strong and experienced management team, with our founders playing an active role in the business. We have a deep bench of senior leaders with strong business and operational experience from major CPG and public companies across all business functions working closely as the Herd Leadership Team. Our Chief Executive Officer, Kurt Schmidt, has decades of leadership experience in CPG companies in the United States and overseas at Kraft, Wrigley, Novartis and Nestlé, where he most recently led Nestlé’s $8 billion global Health & Wellness Division. Our President and Chief Operating Officer and co-founder, Billy Bishop, has been leading marketing and operations since our founding in 2002. Billy provides us with the unique perspective of an entrepreneurial business builder having helped build the SoBe beverage brand before starting our company. Our Chief Financial Officer, Mike Nathenson, has a deep financial and strategic background in CPG companies from his leadership experience at PepsiCo and Dean Foods, where he was most recently the Chief Financial Officer of the Dean Foods Dairy Group.
Our Operations: Scaled Pure-Play in the Wholesome Natural Market Segment
We believe our scale allows us to compete effectively against both our larger and smaller competitors. Being one of the largest pet food companies in the United States and the #1 brand in the Wholesome Natural market segment provides us with significant scale advantages in our supply chain. In September 2014, we commenced manufacturing operations at our Heartland facility. Once our Heartland facility ramps up to capacity, which we anticipate will be by the third quarter of 2015, we believe our hybrid network of owned and contracted manufacturing facilities will provide us with enhanced margin opportunities and greater flexibility in our supply chain.
We focus on developing and marketing Wholesome Natural pet foods that we would want to feed our own furry family members. Our exclusive focus on pet products enables us to identify and react to trends early, develop Wholesome Natural products that meet the needs of pets and their pet parents and execute with speed and efficiency. We believe being a pure-play with this focus on pet products gives us a competitive advantage compared to most of our major competitors who are diversified CPG conglomerates. As the only Wholesome Natural pet food brand with a billion dollars of sales at retail, we possess operational and financial processes and tools that are difficult for smaller companies to implement. For example, we successfully implemented SAP, a tier 1 ERP system, in 2013 and went live on January 1, 2014. We are in the process of implementing internal controls over financial reporting required under Section 404 of the Sarbanes-Oxley Act, which is ahead of the required schedule for an “emerging growth company.”
Our Manufacturing Network
Our products, including those sold in Canada, are currently manufactured at our Heartland facility and through a network of manufacturing facilities that are owned and operated by third-party contract manufacturers across the United States. We intend to manufacture our products for the Mexican and Japanese markets using our manufacturing network in the United States. We expect our state-of-the-art Heartland facility will provide us with in-house dry food manufacturing of up to 30 million pounds a month and account for 50-60% of our forecasted dry food production needs over the next several years once it ramps up to capacity. Consistent with
87
Table of Contents
our partnership approach, we have been keeping our contract manufacturers informed of our plans with respect to our Heartland facility. We have been working, and will continue to work, to optimize our manufacturing network to manage our manufacturing needs as we ramp up production at our Heartland facility.
Our dry products typically comprise the largest or one of the largest portions of our contract manufacturers’ product outputs for its customers. In one instance, one of the facilities of our contract manufacturer is wholly dedicated to producing our dry products. We generally try to match our products with the specific capabilities of different facilities and/or contract manufacturers in our network. For example, some facilities or contract manufacturers are better suited to shorter runs of specialty products, while others are better suited to longer runs of our higher volume products. We work closely with our contract manufacturing partners to continue to improve efficiencies, product quality and safety. Each contract manufacturer produces our products according to our specifications and in accordance with our robust BLUE Total Quality protocols. Each new contract manufacturer must undergo a rigorous process, which typically takes 6-9 months to complete, in order to qualify as a contract manufacturer of our products. Our team of pet food scientists and manufacturing engineers supervise the qualification of new production facilities and the commissioning of new products at existing facilities.
As one of the largest sellers in the United States of dry pet foods using whole meat as an ingredient, we believe we are one of the largest purchasers of contract-manufacturing capacity in the United States for such pet foods. The manufacturing process for BLUE dry pet foods is different than for other dry pet foods that do not contain whole meat and are either grain-based or include meat proteins only through dry meat meals. Manufacturing plants must be specifically equipped to handle whole meats (either fresh, slurry or frozen) rather than just dry ingredients. For example, separate refrigerated handling areas and equipment are required. The process for cooking the raw ingredients to produce the finished kibble also takes significantly longer for pet foods made with whole meats. This reduces the throughput of a plant and therefore increases the manufacturing cost.
Our business arrangements vary by contract manufacturing partner. With our largest, core contract manufacturers, we typically have multi-year contracts in place that guarantee an amount of monthly production capacity and annual or multi-year fixed tolling charges, while assuring the contract manufacturer a minimum order volume on a monthly or quarterly basis. This arrangement allows the contract manufacturer to achieve efficiencies in managing its facility, while assuring us of the capacity we need to meet our growing volume requirements. With contract manufacturers with whom we do not have multi-year contracts, we typically have commitments of capacity based on a rolling three months forecast. We work closely with each of our manufacturing partners and provide them with a rolling production forecast, which enables them to better capacity plan and sequence their production efficiently.
Ingredients and Packaging Purchasing
Our natural ingredients and packaging materials are sourced primarily from suppliers in the United States. Our procurement team is responsible for assuring ingredient supply and pricing to meet forecasted demand. We contract and ensure availability directly with suppliers for most of the major ingredients in our dry foods, whether manufactured by us at our Heartland facility or by our contract manufacturers. All supplier facilities then go through our rigorous quality qualification process based on our ingredient specifications before any ingredients are shipped. The manufacturing facilities in our manufacturing network then purchase these ingredients from suppliers approved by us on the terms we negotiated. This has allowed us to consolidate ingredient sourcing across our manufacturing network in order to negotiate favorable pricing and consistency on ingredients for dry foods, which make up the majority of our product portfolio. For wet foods and treats, our contract manufacturers negotiate directly with suppliers approved by us and purchase ingredients directly based on our specifications. We have detailed specifications for raw materials used in all of our products. In all cases, we purchase finished products from the contract manufacturers predominantly on a cost-plus basis. We pay our contract manufacturers on a dollar-per-pound basis for dry foods and dollar-per-unit basis for wet foods and treats. These arrangements allow us to control the cost structure of our products. At our Heartland facility, we are responsible for the direct procurement of all ingredients and packaging for products we manufacture in-house.
88
Table of Contents
Our ingredients typically account for more than half of our cost of sales and primarily include animal proteins, whole grains, vegetables and vitamin and mineral supplements. Animal proteins (such as chicken, lamb and fish), in the form of whole meats and meat meals, make up almost half of ingredient spending. We have increased the percentage of ingredients contracted for our dry foods from approximately 30% of our forward twelve-month needs in 2009 to approximately 90% in 2014. We enter into contracts relating to the physical purchase of the majority of our main ingredients, including our meats and meals, grains, fruit, vegetables, starches and fibers. These contracts are focused primarily on ensuring availability, quality and price predictability. Depending on the nature of the ingredients, some contracts are fixed in price while others have a variable component based on a pricing formula. For example, contracts for the purchase of poultry meals usually have a price adjustment component that follows fluctuations of soybean meal futures, but other terms, such as quantity, delivery and length of contract are fixed and negotiated with the particular suppliers. The length of the contracts is fixed for a period of time, typically up to a year or for a season and/or a crop year. These contracts often have minimum purchase requirements and are typically renewed annually. In 2015, under our Commodity Price Risk Management Policy, we expect to contract approximately 90% of our ingredients. In addition, we may enter into fixed price and/or fixed quantity contracts for a pre-determined amount of our ingredients to reduce short term price volatility in certain commodities. Although we do not currently engage in hedging activities, we expect to adopt certain hedging strategies in the future consistent with our Commodity Price Risk Management Policy. Historically, we have been able to pass along commodity cost increases to our customers in the form of increased prices. Over an 18-month period between the summer of 2011 and early 2013, we implemented three price increases while continuing to grow our volumes.
Packaging materials for wet products and treats are provided by our contract manufacturers and we pay for packaging as part of the unit price of the finished products. For our dry foods, our procurement team sources and purchases the packaging materials directly from suppliers. We then sell the packaging materials to our contract manufacturers as needed for production. The per unit amount paid by the contract manufacturer, plus an amount for allowable yield loss, is then charged back to us by the manufacturer as a component of the finished product charges. This arrangement puts the burden of excessive yield loss on our contract manufacturer and provides them with an incentive to reduce/eliminate packaging waste.
We believe that our supplier relationships and procurement planning will be able to support our potential capacity needs for the foreseeable future.
Quality Control
We believe that food safety and quality are paramount. We have developed, implemented and enforced a robust food safety and quality program.
We have established critical control points throughout the entire supply chain from ingredient sourcing to finished goods to ensure compliance with our quality program. All of our contract and owned manufacturing facilities are required to have a hazard analysis critical control points plan that identifies critical pathways for contaminants and mandates control measures that must be used to prevent, eliminate or reduce relevant food-borne hazards. This includes, among other things, proper kill steps, product flow, air balance control, proper cleaning of equipment and affirmative release of finished goods. We require our contract and owned manufacturing facilities to maintain third-party certifications and pass our own quality system and food safety audits and GMPs. The third party certifications provide an independent and external validation that a product and/or process complies with applicable food safety regulations and standards. In addition, our quality control team conducts both scheduled and unannounced audits of all aspects of our supply chain to ensure that ingredients, finished goods and manufacturing processes meet our strict food safety and quality requirements.
We ensure that all of our ingredients are rigorously tested prior to being approved for use in our products. Testing certifications, certificate of origin and certificate of analysis, which confirm that the ingredient meets our specifications as to quality and safety, must accompany or be on file for every shipment. In addition,
89
Table of Contents
our food safety and quality program includes strict guidelines for incoming ingredients, batching, processing, packaging and finished goods. As part of our focus on safety and quality, we have implemented FDA-approved batch and lot traceability controls across our manufacturing network, including at our Heartland facility, where such controls have been implemented into our SAP ERP system. These controls allow us to track and tie discreet, inbound raw material components through the manufacturing process to the ultimate finished product, allowing us to maintain and control all finished product lot details and quickly access process manufacturing details. However, despite our strict quality controls, it is possible that there may be from time to time, as there has been in the past, issues or concerns with respect to our products. See “Risk Factors—Risks Related to Our Business and Industry—We may face issues with respect to raw materials and other supplies, including increased costs, disruptions of supply, shortages, contaminations, adulterations or mislabeling” and “Risk Factors—Risks Related to Our Business and Industry—If our products are alleged to cause injury or illness or fail to comply with governmental regulations, we may need to recall our products and may experience product liability claims.” We do not produce any of our products in Asia, where the oversight of the ingredient sourcing/purchasing and manufacturing can be difficult to manage. Many of our competitors’ products, including some Wholesome Natural products, are produced in Asia.
Our food safety and quality program also requires that finished goods are tested to ensure proper nutrition and the absence of microbial contaminants such as salmonella. These tests are performed at independent third-party and our internal laboratories. We do not release our products to customers without first receiving test results from these independent third-party or internal laboratories.
Strong Position at Our Retailers and Distribution Partners
As a leader in advertising and brand-building in the pet food category, we continue to drive traffic to brick-and-mortar stores and eCommerce retailers where BLUE is sold. In addition to the regular traffic we help generate, we believe our products are attractive to retailers given the strong gross margins they deliver to retailers. We work with our retail partners to customize product assortment, starting with the highest sales velocity items that fit their customer base in order to optimize our retail partners’ economics. With our broad product portfolio, we see an opportunity to continue to increase our shelf space, especially outside of national pet superstores. These dynamics have made us a strong partner to our retailers, as we continue to increase the breadth and depth of our distribution.
Sales through the eCommerce channel represented approximately 4% of our U.S. retail sales in 2014 compared to approximately 2% of U.S. pet food sales overall. We intend to strengthen our partnerships with our brick-and-mortar retail partners on their eCommerce and internet marketing programs, as well as with online-only eCommerce retailers to continue to grow in this rapidly developing channel. As of mid-2014, we switched larger eCommerce accounts from distributors to direct Blue Buffalo accounts in order to strengthen and better manage our go-to-market approach in this channel. As the pet food brand with the highest online search volume in the United States and a higher share among younger consumers who typically have a higher affinity for online shopping, we believe BLUE is well-positioned for growth in the eCommerce channel.
We believe we have a differentiated, strategic and highly analytical approach to establishing and maintaining our relationship with our retail partners. We strive to understand their business needs and priorities and work with them to identify market opportunities and trends and develop customized solutions to efficiently execute an effective sales strategy. We have access to the consumer sell-through data of our products at a SKU-by-store level of our larger direct accounts and have visibility into their inventories, and we work closely with our retail partners to manage their inventories to optimize working capital and minimize out-of-stocks. We also have access to our distributors’ sales to their retail accounts as well as visibility into consumer sell-through for select retail accounts.
Sales and Distribution
We sell our products primarily in the United States and Canada. The vast majority of our sales are in the United States. In 2014, only 3% of our net sales were outside of the United States.
90
Table of Contents
BLUE products are sold in specialty channels, including national pet superstore chains, regional pet store chains, neighborhood pet stores, farm and feed stores, eCommerce retailers, military outlets and hardware stores. Our sales in the Vet channel are currently minimal. We sell our products directly to retailers in the specialty channels and through distributors that focus on the specialty channels. Whether we sell our products directly to retailers or through distributors primarily depends on the size of the account and whether the account has account-operated distribution centers for its own outlets. We review accounts on a regular basis and may re-designate them as a direct or distributor account depending on our cost-to-serve them, trends in their business and channel and changes in their distribution capabilities.
The majority of our products are sold directly to retailers. Our direct accounts include large national and regional chains with their own distribution capability, such as PetSmart, Petco, Tractor Supply Company and Pet Supermarket, as well as larger online retailers. In 2014, 73% of our net sales were generated from sales to national pet superstores, PetSmart and Petco. BLUE’s sales to national pet superstores grew 25% in 2014 compared to 2013, while our sales to all of our other accounts grew 35% for the same period.
Most of our retailers in the regional and neighborhood specialty channel and the farm and feed store channel are served through our distributors. We have multiple distributors in most of our geographic areas. These distributors specialize in, and typically carry a wide assortment, of pet products. We believe we are one of their largest and fastest growing brands. Our distributors provide mainly logistics services and limited in-field sales support, with sales and account acquisition being driven primarily by us and through in-bound interest directly from retailers. From time to time, we offer certain promotional incentives to distributors to help them build our business.
Our sales teams are organized by the type of retail accounts they sell to in order to optimize sales strategies and tools. Our National Accounts Team services large national chains, while our Regional Accounts Team services regional pet store chains, neighborhood pet stores, farm and feed stores and eCommerce retail accounts. Both teams share a sales operations team, which assists them with planning, fulfillment, sales and market analytics and pet parent relations. We also have a Regional Accounts field sales force, which works closely with distributor representatives to acquire new accounts and improve our position at our existing accounts. Having started selling BLUE products in national pet superstores, a substantial majority of our sales are to national accounts, although we believe regional retailers are increasingly seeking out BLUE products as our brand awareness grows. After having doubled our Regional Accounts field sales force in 2013, we believe we now have one of the largest sales forces dedicated to the regional and neighborhood pet and farm and feed channels.
Order Fulfillment and Logistics
All customer orders are processed by our Customer Service team based in our headquarters in Wilton, Connecticut. Orders are then assigned to our two distribution centers based in Bellevue, Nebraska and Monroe, Ohio or our Heartland warehouse.
Our Bellevue and Monroe distribution centers are operated by third-party logistics partners who are managed by our team members at each site. Our contract manufacturers ship our products directly to our distribution centers. We store and ready products for shipment for all of our retailers and distributors from these facilities. Our third-party logistics partners typically charge us for the shipment of our products on a handling fee basis and, in some cases, on a cost-plus basis. Our Heartland warehouse is operated by our own team members.
Our Growth Strategy
With the investments we have made in our brand, our people and our infrastructure, we believe we are well positioned to continue to deliver industry-leading growth that outpaces both the fast-growing Wholesome Natural market segment and the overall pet food industry.
We expect to continue to grow our volumes and increase our revenue per pound. We plan to grow our volumes by reaching and feeding more pets, and by feeding them more of our products. Our goal is to increase
91
Table of Contents
our revenue per pound by continuing to improve our product mix through our marketing and product development engines. We will also be focused on investing in new growth drivers including entering the Vet channel and select international markets.
Reach and Feed More Pets
| ¡ | Converting more pet parents to BLUE. We currently feed less than 4% of the dogs and less than 2% of the cats in the United States. The combination of our focus on building our brand awareness, our commitment to educating pet parents and the breadth of our product portfolio that meets the diverse needs of pets and pet parents forms our powerful, proven new user acquisition strategy. We believe this successful strategy will continue to help us bring more pet parents into the BLUE family. |
| ¡ | Being available to more pet parents. Our share in specialty channels outside of national pet superstores is approximately one-third of our share in national pet superstores. We believe we have significant opportunity to grow the depth and breadth of our distribution in channels outside of national pet superstores that fit our brand positioning and target consumers, such as the fast growing eCommerce and farm and feed store channels. We believe that increasing our presence in these channels will make BLUE available to a greater proportion of pet parents. Though a relatively new priority for us, in 2014 our sales outside national pet superstores grew at 1.3 times BLUE’s overall growth rate. |
| ¡ | Growing with our younger pets and younger pet parents. Our share of puppies and kittens is significantly higher than our share of older dogs and cats, which reflects the fact that BLUE is a younger brand with a shorter history in the market. We believe our share of puppies and kittens is a leading indicator of our future market share potential. We expect our total share, as well as our share of older pets to grow over time as we continue to bring future generations of puppies and kittens into our brand and as the current generation of puppies and kittens eating BLUE ages. BLUE also indexes higher among younger pet parents, who generationally tend to be more in tune with health and wellness trends and are more focused on ingredients. We believe that we can realize significant lifetime value from our relationship with this younger generation of pets and pet parents. |
Feed Pets More of Our Products
| ¡ | Cross-selling more of our products to our broad and growing base of users. Our market shares of wet foods and treats are each currently just over one-third of our market share in dry foods. Only a fraction of our dry foods users buy our wet foods and treats on a regular basis. We actively seek to encourage our user base to purchase our broadening and enhanced portfolio of wet foods and treats through our various marketing touch-points, from our Pet Detective program to cross-promotional activities. We also intend to leverage our core brand equity and relationship with pet parents to continue to extend our brand into adjacent categories. |
Increase Our Revenue per Pound
| ¡ | Enhancing our product mix. We plan on continuing to drive our marketing and product development engines to enhance our product mix. As a result, in 2014, our revenue per pound for our pet food products increased 3%, primarily due to improved product mix. We have a wide distribution and a large media budget. Therefore, we can increase our advertising and marketing for each of our major product lines and product types. We believe this will allow us to accelerate the growth of our newer product lines, as well as wet foods and treats, and cat foods overall where we have lower relative market share. We also intend to continue to expand our specialized product offerings. |
| • | We closely monitor the pet food industry and when we see a promising product or diet type, we pursue it aggressively. Our newer food lines, which include BLUE Wilderness, BLUE Basics and BLUE Freedom, have higher revenue per pound and are growing faster than our overall company average. |
92
Table of Contents
| • | The revenue per pound of the more specialized products (e.g., breed-size specific and hairball management for cats) we introduce across our product lines and product types is typically higher than the average revenue per pound of existing products in our portfolio. |
| • | As we cross-sell more of our products to our user base and reach more cats where we have lower relative market share, our product mix will continue to shift towards wet foods and treats, as well as cat foods overall, which all have higher revenue per pound than our overall company average. |
Continue to Invest in New Growth Drivers
| ¡ | Funding growth initiatives with a long-term view. With strong top-line growth, we expect to have significant scale benefits and operating leverage in our business in the future. We also expect significant cost savings from in-sourcing a substantial portion of our manufacturing with our Heartland facility as well as other facilities we may build or acquire in the future. In the near term, we plan to use these increased efficiencies to fund our growth initiatives to reach and feed more pets. |
| ¡ | Growing in select international markets. In 2014, approximately 3% of our sales were from outside the United States. Expanding our business in the $49 billion non-U.S. pet food market is an important area of focus for us, as other established premium pet food brands generate a significant percentage of their sales from international markets. In 2014, we opened our first office in Canada, where we already have a sizable business with an operating margin on par with our business in the United States. We have also recently established operating subsidiaries in Mexico and Japan, where we expect to begin marketing our foods through local distribution by the end of 2015. We are determined to take a targeted approach to future international expansion, prioritizing sizeable markets with strong potential. |
| ¡ | Building a strong relationship with the veterinary community and entering the Therapeutic (Rx) market segment. Veterinarians are the most important influencers for pet food selection, with over one in five pet parents choosing their pet food brand based on a veterinarian recommendation. We have recently started building a dedicated national detailing force to introduce BLUE to the veterinary community and help generate recommendations for BLUE products. While this is a significant new investment initiative for us, we believe it can be an important part of our go-to-market strategy in the future. We plan to enter the Therapeutic market segment with differentiated natural Rx products and believe that we can be a new, disruptive player in this market segment. While we do not expect to generate significant revenues from Therapeutic products in the near term, we believe they will be synergistic for our relationship with the veterinarian community and provide an incremental avenue of future growth. |
Our Key Properties
The following table sets forth the location, size, use and lease expiration date of our key properties as of March 31, 2015. The majority of our properties are leased. The leases expire at various times through 2021, subject to renewal options.
| Location |
Approximate Square Footage |
Principal Use | Owned or Leased | |||
| Joplin, Missouri |
200,000 | Manufacturing | Owned | |||
| 215,000 | Distribution/warehousing/office | Owned | ||||
| Monroe, Ohio |
390,000 | Distribution/warehousing | Leased; expires December 2018 | |||
| Wilton, Connecticut |
38,000 | Corporate headquarters | Leased; expires June 2021 | |||
| Phoenix, Arizona |
8,600 | Sales office | Leased; expires December 2018 |
93
Table of Contents
Our Trademarks and Other Intellectual Property
We believe that our intellectual property has substantial value and has contributed significantly to the success of our business. Our primary trademarks include “Blue Buffalo,” “LifeSource Bits,” “Life Protection Formula,” “BLUE Basics,” “BLUE Freedom,” “BLUE Wilderness,” the BLUE shield logo and the Blue Buffalo figure logo, all of which are registered with the U.S. Patent and Trademark Office. The Blue shield design logo is also registered or has a trademark registration pending in Canada, Mexico, Japan, Europe, Russia, China, Australia and approximately 26 other countries or registries. We also have numerous other trademark registrations and pending applications for product names and tag lines that are essential to our branding. Our trademarks are valuable assets that reinforce the distinctiveness of our brand and our consumers’ favorable perception of our products. The current registrations of these trademarks in the United States and foreign countries are effective for varying periods of time and may be renewed periodically, provided that we, as the registered owner, or our licensees where applicable, comply with all applicable renewal requirements including, where necessary, the continued use of the trademarks in connection with similar goods. In addition to trademark protection, we own numerous URL designations, including www.bluebuffalo.com and www.bluesbuddies.com. We also rely on and carefully protect unpatented proprietary expertise, recipes and formulations, continuing innovation and other trade secrets to develop and maintain our competitive position.
Government Regulation
Blue Buffalo, along with its contract manufacturers, distributors and ingredients and packaging suppliers, is subject to extensive regulation in the United States by federal, state and local government authorities including the FDA, the United States Department of Agriculture, U.S. Customs and Border Protection and the EPA, as well as state and local agencies, with respect to registrations, production processes, product attributes, packaging, labeling, storage and distribution. We believe that we are in material compliance with all regulations applicable to our business.
Pet Food-Related Regulation
The FDA’s Center for Veterinary Medicine, or CVM, regulates animal feed, including pet food, under the FFDCA and its implementing regulations. Although pet foods are not required to obtain premarket approval from the FDA, any substance that is added to or is expected to become a component of a pet food must be used in accordance with a food additive regulation, unless it is generally recognized as safe, or GRAS, under the conditions of its intended use. A food additive regulation may be obtained through the submission of a food additive petition to the FDA demonstrating that a food additive is safe for its intended use and has utility. Use of a food ingredient that is neither GRAS nor an approved food additive may cause a food to be adulterated, in which case the food may not be legally marketed in the United States.
The labeling of pet foods is regulated by both the FDA and some state regulatory authorities. FDA regulations require proper identification of the product, a net quantity statement, a statement of the name and place of business of the manufacturer or distributor, and proper listing of all the ingredients in order of predominance by weight. The FDA also considers certain specific claims on pet food labels to be medical claims and therefore subject to prior review and approval by the FDA. These include claims such as “hairball control,” “improved digestibility” and “urinary tract health.” In addition, the Food and Drug Administration Amendments Act of 2007 requires the FDA to establish ingredient standards and definitions for pet food, processing standards for pet food, and updated labeling standards for pet food that include nutritional and ingredient information. The FDA is currently working to implement these requirements.
The FDA has recently identified concerns regarding products that provide nutrients in support of an animal’s daily nutrient needs but which are also labeled as being intended for use to diagnose, cure, mitigate, treat or prevent disease, thereby meeting the statutory definitions of both a food and a drug. In the past, the FDA has generally exercised discretion with regard to enforcement of the regulatory requirements applicable to animal
94
Table of Contents
drugs in the context of dog and cat foods (1) that provided nutrients in support of the animal’s total required daily nutrient needs, (2) that were distributed only through licensed veterinarians and (3) with respect to which manufacturers restricted labeling claims. However, noting an increase in the number of dog and cat foods labeled as being intended for use in the diagnosis, cure, mitigation, treatment or prevention of disease, and noting that animal health may suffer when such products are not subject to pre-market FDA approval and are provided in the absence of a valid veterinarian-client-patient relationship, the FDA recently issued a list of specific factors it will consider in determining whether to initiate enforcement action against products that satisfy the definitions of both an animal food and an animal drug, but which do not comply with the regulatory requirements applicable to animal drugs. We currently produce products, such as cat food with hairball management, that undergo FDA pre-market inspection. While we believe that we market our products in accordance with the applicable FDA regulatory requirements, the FDA may classify some of our products differently than we do and may impose more stringent regulations applicable to animal drugs, such as requirements for pre-market approval and compliance with GMPs for the manufacturing of pharmaceutical products. We intend to produce more products that we anticipate will be subject to FDA pre-market inspection, including new products to the Therapeutic market segment.
Under Section 423 of the FFDCA, the FDA may require the recall of an animal feed product if there is a reasonable probability that the product is adulterated or misbranded and the use of or exposure to the product will cause serious adverse health consequences or death. In addition, pet food manufacturers may voluntarily recall or withdraw their products from the market. In 2010, we voluntarily issued a recall of certain of our products due to possible excess Vitamin D present in specific production runs caused by an error occurring at a supplier.
Most states also enforce their own labeling regulations, many of which are based on model definitions and guidelines developed by AAFCO. AAFCO is a voluntary, non-governmental membership association of local, state and federal agencies that are charged with regulation of the sale and distribution of animal feed, including pet foods. The degree of oversight of the implementation of these regulations varies by state, but typically includes a state review and approval of each product label as a condition of sale in that state.
Most states require that pet foods distributed in the state be registered or licensed with the appropriate state regulatory agency. In addition, most facilities that manufacture, process, pack, or hold foods, including pet foods, must register with the FDA and must renew their registration every two years. This includes most foreign, as well as domestic facilities. Registration must occur before the facility begins its pet food manufacturing, processing, packing, or holding operations.
In 2011, the FSMA was enacted. The FSMA mandates, among other things, that the FDA adopt preventative controls to be implemented by pet food facilities in order to minimize or prevent hazards to food safety. In October 2013, the FDA issued a proposed rule entitled “Current Good Manufacturing Practice and Hazard Analysis and Risk-Based Preventive Controls for Food for Animals.” An updated proposed rule was issued in September 2014. The proposed rule would establish GMPs in the manufacturing, processing, packing and holding of animal food. In addition, the proposed rule would require certain facilities to establish and implement hazard analysis and risk-based preventive controls for food for animals. Although these requirements are not yet in effect, we believe we are well-positioned for these changes.
We are also subject to the laws of Canada, Mexico and Japan, as well as provincial and local regulations, with regard to products exported to those jurisdictions. In Canada, we are subject to regulation and oversight by the Canadian Food Inspection Agency and other provincial and local agencies. In Mexico, we are subject to regulation and oversight by the Secretariat of Agriculture, Livestock, Rural Development, Fisheries and Food (SAGARPA), the National Service of Health, Food Safety and Quality (SENASICA) which is an administrative body of SAGARPA and other state and local agencies. In Japan, we are subject to regulation and oversight by the Ministry of Agriculture, Forestry and Fisheries, the Ministry of the Environment and other local agencies. As we enter into new foreign markets, we will be subject to similar laws and regulation, and oversight by foreign governmental and regulatory agencies, in those jurisdictions.
95
Table of Contents
Employee and Occupational Safety Regulation
We are subject to certain state and federal employee safety and employment practices regulations, including regulations issued pursuant to the U.S. Occupational Safety and Health Act, and regulations governing prohibited workplace discriminatory practices and conditions. These regulations require us to comply with certain manufacturing safety standards, including protecting our employees from accidents, providing our employees with a safe and non-hostile work environment and being an equal opportunity employer.
Environmental Regulation
As a result of our pet food manufacturing and packaging activities, we at our Heartland facility and we and our contract manufacturers at their facilities, are subject to federal, state and local environmental laws and regulations. These govern, among other things, air emissions, wastewater and stormwater discharges, and the treatment, handling and storage and disposal of materials and wastes.
Manufacturing Related Regulation
In addition, in connection with our operations at our Heartland manufacturing facility, we are subject to the jurisdiction of the U.S. Department of Agriculture and certain state and local agencies which may inspect the facility and regulate health and safety issues. Ownership of land in Joplin, Missouri and the operation of the Heartland facility also subject us to regulation by the Missouri Department of Natural Resources and local planning, zoning and health agencies. The facility must also be registered with the FDA.
Legal Proceedings
We are from time to time subject to, and are presently involved in, litigation and other proceedings. Other than the litigation and related class action lawsuits described below, we believe that there are no pending lawsuits or claims that, individually or in the aggregate, may have a material adverse effect on our business, financial condition or results of operations.
On May 6, 2014, Nestlé Purina filed a lawsuit against us in the United States District Court for the Eastern District of Missouri, alleging that we have engaged in false advertising, commercial disparagement and unjust enrichment. Nestlé Purina asserts that, contrary to our advertising claims, certain BLUE products contain chicken or poultry by-product meals, artificial preservatives and/or corn and that certain products in the BLUE grain-free lines contain grains. Nestlé Purina also alleges that we have made false claims that our products (including LifeSource Bits) provide superior nutrition and health benefits compared to our competitors’ products. In addition, Nestlé Purina contends that we have been unjustly enriched as consumers have paid a premium for BLUE products in reliance on these alleged false and misleading statements, at the expense of our competitors. Nestlé Purina seeks an injunction prohibiting us from making these alleged false and misleading statements, as well as treble damages, restitution and disgorgement of our profits, among other things. In connection with the litigation, Nestlé Purina has also issued press releases and made other public announcements, including advertising and promotional communications through emails and internet and social media websites that make claims similar to those contained in their lawsuit. Nestlé Purina subsequently amended its complaint to seek a declaratory judgment that these statements by Nestlé Purina about us are true and do not constitute defamation. Nestlé Purina later amended its complaint a second time to supplement certain allegations and to add a claim regarding the advertising for one of our pet treats. In addition, eleven related consumer class action lawsuits were filed on various dates from May 2014 to June 2015, making allegations similar to Nestlé Purina’s and seeking monetary damages and injunctive relief. Other than two consumer class actions, one of which was recently filed on June 22, 2015 in the Orangeburg County Court of Common Pleas in the State of South Carolina and the other on June 29, 2015 in the Orleans Parish District Court in the State of Louisiana, all of the related consumer class actions have been consolidated under a Multi-District Litigation file also pending in the United States District Court for the Eastern District of Missouri.
On May 14, 2014, we filed a lawsuit against Nestlé Purina in the United States District Court for the Eastern District of Missouri, alleging that Nestlé Purina has engaged in false advertising, unfair competition,
96
Table of Contents
unjust enrichment and defamation. We allege that the statements made by Nestlé Purina advertising the allegations of their lawsuit are false and misleading, and we deny that our product formulas contain chicken or poultry by-product meals, artificial preservatives or corn and we deny that any of our grain-free products contain grains. We also assert that Nestlé Purina’s statements falsely imply that our products are not made in the United States and are subject to quality control issues. We allege that Nestlé Purina’s conduct as described in this lawsuit is aimed at destroying the reputation and goodwill of the BLUE brand and may induce consumers to make purchasing decisions based on Nestlé Purina’s false and misleading representations about the composition and sourcing of BLUE products. Our complaint in this lawsuit seeks, among other things, a preliminary and permanent injunction prohibiting Nestlé Purina from disseminating such false information, as well as damages (including punitive damages), restitution and disgorgement of all profits attributable to their false and deceptive advertising. On June 4, 2014, this lawsuit was consolidated with the Nestlé Purina lawsuit. We have since amended our pleading to name as additional defendants the two advertising and public relations agencies that assisted Nestlé Purina with its advertising campaign.
In the course of pretrial discovery in the consolidated Nestlé Purina lawsuit, beginning in September 2014 documents and information were revealed that indicate that a facility owned by a major supplier of ingredients to the pet food industry, including Blue Buffalo, for a period of time, had mislabeled as “chicken meal” or “turkey meal” ingredients that contained other poultry-based ingredients that were inappropriate for inclusion in “chicken meal” or “turkey meal” under industry standards, and it appears that this mislabeling was deliberate. This conduct was undertaken by the supplier without our knowledge, and we have since ceased purchasing ingredients from this supplier. This supplier was one of our primary sources of chicken meal and turkey meal. As a result of the supplier’s conduct, our advertising claims of “no chicken or poultry by-product meals” were inaccurate as to products containing the mislabeled ingredients. Therefore, we may be exposed to false advertising liability to Nestlé Purina and others to the extent a claimant can prove they were injured by our actions. Such liability may be material. We have brought third-party indemnity and damages claims, with respect to the Nestlé Purina lawsuit, against the supplier that mislabeled the ingredients, as well as the broker for such mislabeled ingredients, and also have insurance coverage for some of the Nestlé Purina lawsuit claims. We also have brought damages and indemnity claims against such supplier and broker with respect to the class action lawsuits. However, we may not be able to fully recover from such supplier, broker or from our insurance the full amount of any damages we might incur in these matters.
We are vigorously defending ourselves against the Nestlé Purina and related class action lawsuits. The Nestlé Purina litigation and related class action lawsuits are still in their early stages and the final outcome is uncertain. See “Risk Factors—Risk Related to Our Business—We are involved in litigation with Nestlé Purina PetCare Company and related class action lawsuits that include allegations of false advertising relating to the ingredients contained in our pet food. Regardless of whether we are successful in our defense of these claims or in our counter claims, this litigation may adversely affect our brand, reputation, business, financial condition and results of operations.”
On October 15, 2014, we initiated a lawsuit against Nestlé Purina in state court in Connecticut. Nestlé Purina subsequently removed the case to the United States District Court for the District of Connecticut, and the Connecticut District Court then granted Nestlé Purina’s motion to transfer this matter to the same court where Nestlé Purina’s lawsuit against us is pending. Our complaint in this matter alleges that Nestlé Purina has intentionally engaged in false advertising, unfair trade practices and unjust enrichment in the promotion and advertisement of numerous of its products. In particular, our complaint alleges that Nestlé Purina is deceptively advertising that high-quality, wholesome ingredients are the main ingredients in certain of Nestlé Purina’s most popular pet food products, when in fact those ingredients either do not exist at all in the products or constitute only a tiny portion. In addition, our complaint alleges that Nestlé Purina is deceptively advertising certain of its products as healthy and nutritious when in fact Nestlé Purina knew that these products were unsafe and were responsible for illness and even death in many of the dogs that consumed them. Our complaint seeks an injunction prohibiting Nestlé Purina from continuing these false and misleading advertisements, as well as damages and disgorgement of profits, among other things. The matter is in the very early stages of discovery and pleadings.
97
Table of Contents
Executive Officers and Directors
Below is a list of our executive officers and directors and their respective ages and a brief account of the business experience of each of them as of June 30, 2015.
| Name |
Age | Position | ||
| Kurt Schmidt |
58 | Chief Executive Officer and Director | ||
| William Bishop, Jr. |
44 | President and Chief Operating Officer | ||
| Michael Nathenson |
51 | Executive Vice President, Chief Financial Officer and Treasurer | ||
| William Bishop |
76 | Chairman and Director | ||
| Raymond Debbane |
60 | Director | ||
| Philippe Amouyal |
57 | Director | ||
| Evren Bilimer |
37 | Director | ||
| Aflalo Guimaraes |
46 | Director | ||
| Michael A. Eck |
52 | Director | ||
| Frances Frei |
51 | Director | ||
| Amy Schulman |
54 | Director | ||
Executive Officers
Kurt Schmidt has served as Chief Executive Officer and a member of our Board of Directors since 2012. Kurt brings deep experience in consumer products with decades of leadership experience in the United States and overseas at Kraft, Wrigley, Novartis and Nestlé. At Nestle, Kurt was responsible for their $8 billion global Health & Wellness Division and he was a member of Nestlé’s Executive Committee. His responsibilities at Nestle included Nestle’s Maternal and Infant Nutrition (Gerber and Nestlé brands), Weight Management (Jenny Craig) and Sports Nutrition (Power Bar and Musashi) businesses. Kurt joined Nestlé in 2007 as part of its acquisition of Gerber Products from Novartis, where he was the President and Chief Executive Officer of Gerber from 2004 to 2007. Prior to Gerber, Kurt was the Head of Novartis Animal Health from 2002 to 2004. Kurt has a BS in Chemistry from the United States Naval Academy and an MBA from University of Chicago.
William (“Billy”) Bishop, Jr. has served as President since 2012 and has served as Chief Operating Officer since 2003. Billy co-founded the Blue Buffalo Company in 2002. He has been leading Marketing, Product Development and Operations since our founding. Billy was Vice President of Marketing at SoBe leading its ground breaking guerilla marketing strategy until its sale to Pepsi in 2001. Billy was also an Account Manager at Sierra Communications from 1993 to 1995. Billy has a BA in Sports Marketing from Ohio Wesleyan University.
Michael (“Mike”) Nathenson has served as our Executive Vice President, Chief Financial Officer and Treasurer since 2012. Mike brings a deep financial and strategic background in consumer products with significant leadership experience at PepsiCo and Dean Foods. Mike was with Dean Foods from 2009 to 2012, where he was most recently the Chief Financial Officer of the Dean Foods Dairy Group. At PepsiCo, Mike spent almost 14 years in a variety of operational finance roles including as the Chief Financial Officer of Frito Lay’s Australia subsidiary from 2000 to 2004. He then moved to the corporate side where he led PepsiCo’s FP&A group from 2004 to 2008 and was Senior Vice President of Investor Relations from 2008 to 2009. Mike has a BS in Chemical Engineering from Washington University and an MBA from Harvard Business School.
98
Table of Contents
Directors
William (“Bill”) Bishop has served as Chairman since 2012 and has served as a member of our Board of Directors since 2007. Bill was President and Chief Executive Officer of Blue Buffalo Company, Ltd. from 2007 to 2012. Bill founded the Blue Buffalo Company in 2002 with his sons Billy Bishop and Chris Bishop. Bill has had a long career in advertising and consumer products marketing having started in agency account management for clients like P&G and Unilever. Bill then moved to the corporate side and ran the refreshment beverage business for General Foods until moving back to the advertising side as Chief Executive Officer of a number of agencies including MCA, Ally & Gargano and Ryan Direct Marketing before founding Sierra Communications. Over his long career, Bill has created advertising and marketing programs for many leading brands including Tropicana, Perrier, Nabisco and American Express. In 1995, Bill co-founded SoBe Beverages driving the brand building and product development of SoBe as Chief Operating Officer of SoBe Beverages until its sale to Pepsi in 2001. Bill graduated from Ohio Wesleyan University with a BA in 1961. Bill was selected to serve as a director because of his unique familiarity with our business, structure, culture and history as a co-founder of our business and his significant executive management and leadership experience.
Raymond (“Ray”) Debbane has been a director since 2007. Ray served as Chairman from 2007 to 2012. Ray is the President and Chief Executive Officer of Invus, a global investment firm based in New York. Ray is the chairman of the board of directors of Weight Watchers and Lexicon Pharmaceuticals. He is the Chief Executive Officer of Artal Group S.A., or Artal, and also serves as chairman or director of a number of private Artal or Invus portfolio companies. Before co-founding Invus, Ray was a management consultant in the Paris office of The Boston Consulting Group, where he served a number of major European and international companies. He holds a BS in agricultural sciences and agricultural engineering from American University of Beirut, an MS in food science and technology from the University of California at Davis, and an MBA from Stanford University. Ray is the Chairman of Action Against Hunger USA and a Trustee Emeritus of Connecticut College. Ray was selected to serve as a director because of his experience as a management consultant and private equity investor and his extensive knowledge and understanding of corporate strategy, brand management, complex financial matters, and numerous and varied industries.
Philippe Amouyal has been a director since 2007. Philippe is a Managing Director of Invus. He joined Invus in 1999. Philippe is a director of Weight Watchers and Lexicon Pharmaceuticals and also serves on the boards of a number of private Artal or Invus portfolio companies. Prior to joining Invus, Philippe spent 15 years at The Boston Consulting Group in Paris and Boston, where he was a Vice President and Director and coordinated the global electronics and software practice from 1991 on. He holds an MS in engineering and a DEA in management from Ecole Centrale de Paris and was a Research Fellow at the Center for Policy Alternatives of the Massachusetts Institute of Technology. Philippe was selected to serve as a director because of his experience as a management consultant and private equity investor and his extensive knowledge and understanding of corporate strategy, information technology, research and development, and management operations and structures.
Evren Bilimer has been a director since 2012. Evren is a Managing Director of Invus. He joined Invus in 2002. Evren has served on the boards of a number of private Invus portfolio companies. Prior to joining Invus, Evren was a management consultant with McKinsey & Company in New York, where he worked with clients in a wide range of industries including the consumer sector and financial services. Evren graduated summa cum laude from Yale University double majoring in Electrical Engineering and Economics. Evren was selected to serve as a director because of his experience as a management consultant and private equity investor and his extensive knowledge and understanding of corporate strategy, corporate finance and accounting and the consumer sector.
Aflalo Guimaraes has been a director since 2007. Aflalo is a Managing Director of Invus. He joined Invus in 1998. Aflalo also serves on the board of Ceres Inc. as well as the boards of a number of private Invus portfolio companies. Prior to joining Invus, Aflalo worked at Marakon Associates where as a manager he led strategic consulting engagements for large multinational companies in a wide range of industries including
99
Table of Contents
financial services, retail and consumer products. Previously he worked at the Federal Reserve. He holds an MBA from the University of Pennsylvania’s The Wharton School and a BA in Economics and Political Science from Yale University. Aflalo was selected to serve as a director because of his experience as a management consultant and private equity investor and his extensive knowledge and understanding of corporate strategy, corporate finance and accounting and the consumer sector.
Michael (“Mike”) A. Eck has been a director since 2015. Mike was the Global Head of the Consumer and Retail Investment Banking Group at Morgan Stanley from 2008 to 2014 until his retirement. Prior to that, Mike worked at Citigroup from 1993 to 2008, where he was most recently the Global Head of the Consumer and Retail Investment Banking Group, and at Credit Suisse First Boston from 1987 to 1993. Mike is a senior advisory board member of Shopkick, a board member of USA Ultimate and the co-founder and co-chairman of the board of Steer for Student Athletes. He holds a BS in finance from University of Virginia and an MS in management from Northwestern University. Mike was selected to serve as a director because of his experience as an investment banker and his extensive knowledge and understanding of corporate strategy, corporate financing and accounting, capital investment and operations and the consumer sector.
Frances Frei has been a director since 2014. Frances is the UPS Foundation Professor of Service Management at Harvard Business School since July 2009, and has served as the Senior Associate Dean at Harvard Business School since July 2012. In addition, she was Chair of the MBA Required Curriculum at Harvard Business School and Course Head of the school’s innovative FIELD (Field Immersion Experience for Leadership Development) Method Course, which is Harvard Business School’s companion to the case method. Previously, she served at the Harvard Business School as Associate Professor from July 2003 to July 2009 and as Assistant Professor from July 1998 to July 2003. She holds a PhD in Operations and Information Management from the Wharton School at the University of Pennsylvania, an ME in Industrial Engineering from Pennsylvania State University and a BA in Mathematics from the University of Pennsylvania. Frances was previously a member of the Board of Directors of Advance Auto Parts, Inc. from 2009 until 2013, and currently serves as a member of the Board of Directors of Viewpost, LLC. Frances was selected to serve as a director because of her experience advising companies in operational excellence and her extensive knowledge and understanding of corporate strategy, organizational effectiveness and finance.
Amy Schulman has been a director since 2014. Amy is the Chief Executive Officer of Arsia Therapeutics, a Venture Partner in Polaris Partners, and a Senior Lecturer at Harvard Business School. Amy is a director of Alnylam Pharmaceuticals and Bind Therapeutics. Amy was previously the Executive Vice President and General Counsel of Pfizer from 2008 to 2013 and served as the Business Unit Lead for Pfizer’s Consumer Healthcare business from 2012 to 2013. Prior to Pfizer, Amy was a Partner at DLA Piper from 1998 to 2008. She received a JD from Yale Law School, and holds a BA from Wesleyan University. Amy also serves on the Board of Trustees of The Brookings Institution and Wesleyan University. Amy was selected to serve as a director because of her experience as a chief executive officer, general counsel and business leader, her extensive knowledge and understanding of corporate strategy and management operations and her financial expertise.
Composition of the Board of Directors after this Offering
Our business and affairs are managed under the direction of our Board of Directors. In connection with this offering, we will amend and restate our certificate of incorporation to provide for a classified Board of Directors, with three directors in Class I (expected to be Kurt Schmidt, Michael A. Eck and Frances Frei), three directors in Class II (expected to be Philippe Amouyal, Aflalo Guimaraes and Amy Schulman) and three directors in Class III (expected to be William W. Bishop, Raymond Debbane and Evren Bilimer). See “Description of Capital Stock.” In addition, we have entered into an amended and restated investor rights agreement with our Sponsor, the Bishop Family Partnership and certain stockholders. See “Certain Relationships and Related Party Transactions—Investor Rights Agreement.”
100
Table of Contents
Controlled Company Exemption
After the completion of this offering, our Sponsor who is a party to the amended and restated investor rights agreement will continue to beneficially own shares representing more than 50% of the voting power of our shares eligible to vote in the election of directors. As a result, we will be a “controlled company” as set forth in Rule 5615 of the NASDAQ Listing Rules. Under these corporate governance standards, a company of which more than 50% of the voting power is held by an individual, group or another company is a “controlled company” and may elect not to comply with certain corporate governance standards, including the requirements (1) that a majority of our Board of Directors consist of independent directors, (2) that our Board of Directors have a compensation committee that is comprised entirely of independent directors with a written charter addressing the committee’s purpose and responsibilities and (3) that our director nominations be made, or recommended to the full Board of Directors, by our independent directors or by a nominations committee that is composed entirely of independent directors and that we adopt a written charter or board resolution addressing the nominations process. For at least some period following this offering, we may utilize one or more of these exemptions. Accordingly, you may not have the same protections afforded to stockholders of companies that are subject to all of these corporate governance requirements. In the event that we cease to be a “controlled company” and our shares continue to be listed on NASDAQ, we will be required to comply with these provisions within the applicable transition periods.
Board Leadership Structure and the Board’s Role in Risk Oversight
Committees of the Board of Directors
After the completion of this offering, the standing committees of our Board of Directors will consist of an Audit Committee and a Compensation Committee. Our Board of Directors may also establish from time to time any other committees that it deems necessary or desirable.
Our chief executive officer and other executive officers will regularly report to the non-executive directors and the Audit and the Compensation Committees to ensure effective and efficient oversight of our activities and to assist in proper risk management and the ongoing evaluation of management controls. We believe that the leadership structure of our Board of Directors provides appropriate risk oversight of our activities given the controlling interests held by our Sponsor.
Audit Committee
Upon the completion of this offering, we expect to have an Audit Committee, consisting of Michael A. Eck, who will be serving as the Chair, and Amy Schulman and Frances Frei. Michael A. Eck, Amy Schulman and Frances Frei qualify as independent directors under NASDAQ corporate governance standards and the independence requirements of Rule 10A-3 of the Securities Exchange Act of 1934, as amended, or the Exchange Act. Our Board of Directors has determined that Michael A. Eck qualifies as an “audit committee financial expert” as such term is defined in Item 407(d)(5) of Regulation S-K.
The purpose of the Audit Committee will be to prepare the audit committee report required by the SEC to be included in our proxy statement and to assist our Board of Directors in overseeing (1) accounting, financial reporting and disclosure processes and adequacy of systems of disclosure and internal control established by management, (2) the quality and integrity of our financial statements, (3) our independent registered public accounting firm’s qualifications and independence, (4) the performance of our internal audit function and independent registered public accounting firm and (5) overall risk management profile.
Our Board of Directors will adopt a written charter for the Audit Committee, which will be available on our website upon the completion of this offering.
Compensation Committee
Upon the completion of this offering, we expect to have a Compensation Committee, consisting of Frances Frei, Philippe Amouyal and Evren Bilimer, who will serve as the Chair.
101
Table of Contents
The purpose of the Compensation Committee is to assist our Board of Directors in discharging its responsibilities relating to (1) setting our compensation program and compensation of our executive officers, directors and key personnel, (2) monitoring our incentive-compensation and equity-based compensation plans, (3) succession planning for our executive officers, directors and key personnel and (4) preparing the compensation committee report required to be included in our proxy statement under the rules and regulations of the SEC.
Our Board of Directors will adopt a written charter for the Compensation Committee, which will be available on our website upon the completion of this offering.
Compensation Committee Interlocks and Insider Participation
None of the members of our Compensation Committee has at any time been one of our executive officers or employees. None of our executive officers currently serves, or has served during the last completed fiscal year, on the compensation committee or board of directors of any other entity that has one or more executive officers serving as a member of our Board of Directors or Compensation Committee.
We are parties to certain transactions with our Sponsor and certain of our directors described in the section of this prospectus entitled “Certain Relationships and Related Party Transactions.”
Code of Ethics and Business Conduct
We will adopt a new Code of Ethics and Business Conduct that applies to all of our directors, officers and employees, including our principal executive officer and principal financial and accounting officer. Our Code of Ethics and Business Conduct will be available on our website upon the completion of this offering. Our Code of Ethics and Business Conduct is a “code of ethics,” as defined in Item 406(b) of Regulation S-K. We will make any legally required disclosures regarding amendments to, or waivers of, provisions of our code of ethics on our website.
102
Table of Contents
Overview
This compensation discussion provides an overview of our executive compensation program and compensation for our named executive officers, or NEOs, for fiscal 2014. Our NEOs for fiscal 2014 were Kurt Schmidt, our Chief Executive Officer and Director, Mike Nathenson, our Chief Financial Officer, and Billy Bishop, our President and Chief Operating Officer.
Compensation Philosophy and Objectives
The Company is committed to achieving long-term, sustainable growth and increasing shareholder value. The primary objectives of our executive compensation program are as follows:
| • | to attract, motivate and retain superior executive talent as the Company continues to execute its growth initiatives; |
| • | to encourage strong financial performance on an annual and long-term basis; and |
| • | to align the interests of our executive officers and stockholders by rewarding executive officers for behaviors which drive shareholder value creation. |
The Company’s compensation program for our NEOs is designed to support these objectives and encourage strong financial performance on an annual and long-term basis by linking a significant portion of our NEOs’ total compensation to Company performance in the form of incentive compensation and long-term equity compensation. The principal elements of the compensation structure for our NEOs are base salary, annual cash incentive compensation and long-term equity incentive compensation.
Summary Compensation Table
The following table sets forth information regarding compensation awarded to, earned by, or paid to our NEOs during the years ended December 31, 2014 and December 31, 2013.
| Name and principal position |
Year | Salary ($) | Non-equity incentive plan compensation ($) (1) |
All other compensation ($) (2) |
Total ($) | |||||||||||||||
| Kurt Schmidt |
2014 | 631,905 | 366,505 | 27,722 | 1,026,132 | |||||||||||||||
| Chief Executive Officer |
2013 | 609,000 | 913,500 | 24,732 | 1,547,232 | |||||||||||||||
| Mike Nathenson |
2014 | 318,270 | 123,071 | 26,642 | 467,983 | |||||||||||||||
| Chief Financial Officer |
2013 | 304,500 | 319,741 | 30,072 | 654,313 | |||||||||||||||
| Billy Bishop |
2014 | 269,088 | 104,052 | 18,724 | 391,864 | |||||||||||||||
| President and |
2013 | 253,750 | 266,451 | 13,620 | 533,821 | |||||||||||||||
| Chief Operating Officer |
||||||||||||||||||||
| (1) | Reflects amounts earned under the Company’s fiscal 2014 and 2013 annual incentive compensation plans, respectively. |
| (2) | Amounts reported for Kurt and Mike reflect Company-paid life insurance premiums, 401(k) Plan matching contributions and a car allowance. The amount reported for Mike also reflects reimbursement for relocation costs in fiscal 2013. The amount reported for Billy reflects Company-paid life insurance premiums and a car allowance. |
103
Table of Contents
Employment Agreements
We do not have formal employment agreements with any of our NEOs. However, we typically enter into offer letters with our executive officers. In connection with the commencement of their employment in 2012, we entered into offer letters with Kurt and Mike setting forth their initial compensation and benefits. In addition, under the terms of the their offer letters, Kurt and Mike are entitled to change of control benefits, which are described in detail below. See “—Potential Payments Upon a Change of Control.”
Base Salary
We provide base salary to our NEOs and other employees to compensate them for services rendered during the year. The base salaries of our NEOs are reviewed on an annual basis and adjustments are made to reflect performance-based factors, as well as competitive conditions. We do not apply specific formulas to determine increases. Generally, executive officers’ base salaries are adjusted during the first quarter of each year.
The 2014 base salaries were set by our Compensation Committee based on the recommendations of our CEO, other than with respect to his own salary, which was set by the Board of Directors upon the recommendations of the Compensation Committee.
Annual Cash Incentive Compensation
Fiscal 2014
Our annual cash incentive award is designed to reward our NEOs based on Company performance. Our Compensation Committee establishes a target award opportunity for each NEO on an annual basis, usually in the first quarter of each year. In March 2015, our Compensation Committee approved annual cash incentive awards payable under the fiscal 2014 annual incentive compensation plan.
Each NEO’s target annual bonus is typically expressed as a percentage of base salary. For fiscal 2014, the NEOs’ target bonus opportunities (as a percentage of each executive’s base salary) were as follows: Kurt, 100%, Mike, 66.7% and Billy, 66.7%. The NEOs’ maximum bonus opportunities (as a percentage of such executives’ target bonus opportunities) were as follows: Kurt, 150%, Mike, 200% and Billy, 200%.
For fiscal 2014, annual cash incentive awards were based on achievement of a combination of net sales and bank adjusted EBITDA goals (with bank adjusted EBITDA calculated as it is calculated pursuant to our credit agreement). The Compensation Committee has reserved the ability to adjust the actual bank adjusted EBITDA results to exclude the effects of extraordinary, unusual or infrequently occurring events. No such adjustments were made by the Compensation Committee with respect to fiscal 2014 results. The net sales component composed 50% of the total award opportunity, and the bank adjusted EBITDA component composed 50% of the total award opportunity.
The actual fiscal 2014 annual cash incentive awards for the NEOs were determined by multiplying their respective target annual bonus amounts by the sum of (1) the net sales component weighted achievement factor (50% multiplied by the net sales payout percentage) and (2) the bank adjusted EBITDA component weighted achievement factor (50% multiplied by the bank adjusted EBITDA component payout percentage). The financial performance component payout percentages were determined by calculating our achievement against the net sales and bank adjusted EBITDA targets based on the pre-established scales set forth in the following tables:
| Threshold | Target | Maximum | ||||
| Net Sales Performance Percentage of Target |
90% | 100% | 110% | |||
| Net Sales Payout Percentage |
0% | 100% | 200% |
104
Table of Contents
| Threshold | Target | Maximum | ||||
| Bank adjusted EBITDA Performance Percentage of Target |
85% | 100% | 115% | |||
| Bank adjusted EBITDA Payout Percentage |
0% | 100% | 200% |
For performance percentages between the specified threshold, target and maximum levels, the resulting payout percentage would have been adjusted on a linear basis.
The Company’s fiscal 2014 net sales performance as a percentage of target net sales performance was 98%, which resulted in a payout percentage of 80% and a weighted achievement factor of 40%. The Company’s fiscal 2014 bank adjusted EBITDA performance as a percentage of target bank adjusted EBITDA performance was 90.4%, which resulted in a payout percentage of 36% and a weighted achievement factor of 18%. This resulted in a combined achievement factor of 58%.
The following table illustrates the calculation of the annual cash incentive awards payable to each of our NEOs under the fiscal 2013 annual incentive compensation plan based on the financial performance results. These awards are also reported under the Non-Equity Incentive Plan Compensation column of the Summary Compensation Table.
| 2014 Salary |
Bonus Target Percentage |
Bonus Target Amount |
Combined Achievement Factor |
Actual Bonus Paid |
||||||||||
| Kurt Schmidt |
$631,905 | 100% | $631,905 | 58% | $ | 366,505 | ||||||||
| Mike Nathenson |
$318,270 | 66.7% | $212,286 | 58% | $ | 123,071 | ||||||||
| Billy Bishop |
$269,088 | 66.7% | $179,482 | 58% | $ | 104,052 | ||||||||
Long-term Cash Incentive Compensation
In 2015, the Compensation Committee approved a one-time long-term cash incentive program designed to reward our NEOs, along with other members of management, for long-term corporate performance based upon the Company’s adjusted net income growth in advance of what we anticipate will be an annual long-term equity incentive program beginning in 2016. Each NEO’s target long-term cash incentive award is expressed as a percentage of base salary as of January 1, 2015 and were as follows: Kurt, 250%, Mike, 125% and Billy, 125%.
The long-term cash incentive awards were granted on January 1, 2015 and will vest after 3 years in varying degrees based upon the Company’s adjusted net income compounded annual growth rate, or CAGR, at December 31, 2017 relative to our adjusted net income for fiscal 2014. Depending on the CAGR achieved, the amount of cash incentive compensation received at the end of the performance period will range from 0% of the target award for below threshold performance up to 150% of the target award for maximum performance.
Long-term Equity Incentive Compensation
We use equity awards to incentivize and reward our executive officers for long-term corporate performance based on the value of our common stock and, thereby, to align the interests of our executive officers with those of our stockholders.
We currently have a long-term equity incentive plan: the 2012 Stock Purchase and Option Plan of Blue Buffalo Pet Products, Inc., or the 2012 Plan, which is described below under the heading “—Equity Compensation and Stock Purchase Plans.” Pursuant to the 2012 Plan we have provided long-term equity compensation to Kurt and Mike in the form of incentive stock options.
105
Table of Contents
Options Granted in Previous Fiscal Years
There were no long-term equity incentive awards granted to our NEOs in fiscal 2014 and 2013. In fiscal 2012, in connection with the commencement of their employment with us, each of Kurt and Mike was granted incentive stock options that are subject solely to time-based vesting restrictions. The time-based vesting criteria will be satisfied in equal installments on the first five anniversaries of the grant date, subject to continued employment with us through the applicable vesting dates.
Any fully vested options will generally remain outstanding and exercisable for 90 days after termination of employment, although this period is generally extended to one year if the termination of employment is due to death, “permanent disability” or “retirement” (as such terms are defined in the incentive stock option agreement), and any fully vested options will immediately terminate if the named executive officer’s employment is terminated by us for “cause” (as defined in the incentive stock option agreement). Any vested options that are not exercised within the applicable post-termination exercise window will terminate.
In connection with the option grants, Kurt and Mike became parties to the investor rights agreement, which has been amended and restated. See “Certain Relationships and Related-Party Transactions—Investor Rights Agreement.” In addition, Kurt and Mike also executed standard confidentiality, non-competition and proprietary rights agreements with the Company. These agreements subject Kurt and Mike to restrictive covenants, including an indefinite covenant on confidentiality of information, and covenants related to non-competition, non-disparagement and non-solicitation of our employees, consultants and customers at all times during employment, and for one year after any termination of employment.
Outstanding Equity Awards at 2014 Fiscal Year-End
The following table sets forth information regarding outstanding option awards held by our NEOs under the 2012 Plan as of December 31, 2014.
| Option Awards | ||||||||||||||||||||
| Name |
Grant date | Number of securities underlying unexercised options (#) exercisable (1) |
Number of securities underlying unexercised options (#) unexercisable (1) |
Option exercise price ($ per share) |
Option expiration date |
|||||||||||||||
| Kurt Schmidt |
12/18/2012 | 1,204,954 | 1,807,428 | 5.60 | 12/18/2022 | |||||||||||||||
| Mike Nathenson |
12/18/2012 | 321,316 | 481,983 | 5.60 | 12/18/2022 | |||||||||||||||
| Billy Bishop |
— | — | — | — | — | |||||||||||||||
| (1) | Reflects options subject solely to time-based vesting restrictions. The time-vesting options granted to the NEOs vest in five equal installments on each anniversary of the respective grant dates. Billy does not hold any options. |
401(k) Plan
The Company has established a tax-qualified Section 401(k) retirement savings plan, or the 401(k) Plan, for employees, including our NEOs, who satisfy certain eligibility requirements. The 401(k) Plan permits employee contributions up to statutory limits, of which we provide matching contributions of up to 4% of the employee’s eligible compensation contributed to the 401(k) Plan, at a rate of 100% on the first 3% of the
106
Table of Contents
employee’s eligible compensation contributed to the 401(k) Plan and 50% on the next 2% of the employee’s eligible compensation contributed to the 401(k) Plan. Employees are 100% vested in matching Company contributions when such contributions are made. The Company may make non-elective contributions to employees. Employees become 20% vested in non-elective contributions per year of service up to 100% vested after five years of service.
Potential Payments Upon Change of Control
Kurt’s offer letter provides that, in the event of a change of control all his unvested options will become fully vested and exercisable. In addition, in the event of a change of control all of his account balances in the Company’s 401(k) plan, including any unvested balances from Company matches, will automatically and fully vest. The Company will also reimburse him for the actual cost of COBRA coverage for up to the maximum period of time permitted by law if his employment terminates following a change of control.
Mike’s offer letter provides that, solely in the event of his termination without “cause” or for “good reason” (as such terms are defined in Mike’s offer letter) in connection with or within 12 months of a change of control, subject to his signing a standard release of claims, all his unvested options will become fully vested and exercisable. In addition, all of his account balances in the Company’s 401(k) plan, including any unvested balances from Company matches, will automatically and fully vest and the Company will reimburse him for the actual cost of COBRA coverage for up to the maximum period of time permitted by law.
We currently have no formal change of control arrangements with Billy.
The Company expects to adopt a formal executive severance policy in connection with this offering.
Equity Compensation Plans and Stock Purchase Plans
The following description of each of our equity compensation plans is qualified by reference to the full text of those plans, which will be filed as exhibits to the registration statement of which this prospectus forms a part. Our equity compensation plans are designed to continue to give our company flexibility to make a wide variety of equity awards to reflect what the compensation committee believes at the time of such award will best motivate and reward our employees, directors, consultants and other service providers.
2012 Stock Purchase and Option Plan of Blue Buffalo Pet Products, Inc.
The purpose of the 2012 Plan is to align the interests of the officers, employees, directors, consultants and other key persons of Blue Buffalo with the interests of Blue Buffalo. The 2012 Plan is administered by the Compensation Committee of the Board of Directors of Blue Buffalo. The Compensation Committee has the authority to determine eligible participants in the 2012 Plan. Awards granted under the 2012 Plan may be in the form of stock options, stock appreciation rights, restricted stock awards, performance units, performance shares, or other awards not expressly provided for under the 2012 Plan. Stock options granted under the 2012 Plan may be either incentive stock options or nonqualified stock options. Stock option grants are made with exercise prices as determined by the Compensation Committee but shall not be less than the grant date fair market value in the case of incentive stock options. The Compensation Committee, in its sole discretion, may grant stock appreciation rights which allow the grantee to elect to receive upon the exercise of the option shares of stock with an aggregate fair market value equal to the excess of the fair market value of the shares of stock with respect to which the option is exercised over the aggregate exercise price of the option as determined on the exercise date. Restricted stock awards granted under the 2012 Plan are made with purchase prices as determined by the Compensation Committee and subject to conditions and restrictions as determined by the Compensation Committee on the grant date.
107
Table of Contents
2015 Omnibus Incentive Plan
In connection with this offering, our Board of Directors expects to adopt, and our stockholders expect to approve, our 2015 Omnibus Incentive Plan, or the 2015 Plan, prior to the completion of this offering.
Purpose. The purpose of our 2015 Plan is to provide a means through which to attract and retain key personnel and to provide a means whereby our directors, officers, employees, consultants and advisors can acquire and maintain an equity interest in us, or be paid incentive compensation, including incentive compensation measured by reference to the value of our common stock, thereby strengthening their commitment to our welfare and aligning their interests with those of our stockholders.
Administration. Our 2015 Plan will be administered by the Compensation Committee of our Board of Directors. The Compensation Committee is authorized to interpret, administer, reconcile any inconsistency in, correct any defect in and/or supply any omission in our 2015 Plan and any instrument or agreement relating to, or any award granted under, our 2015 Plan; establish, amend, suspend, or waive any rules and regulations and appoint such agents as the Compensation Committee deems appropriate for the proper administration of our 2015 Plan; and to make any other determination and take any other action that the Compensation Committee deems necessary or desirable for the administration of our 2015 Plan. Except to the extent prohibited by applicable law or the applicable rules and regulations of any securities exchange or inter-dealer quotation system on which our securities are listed or traded, the Compensation Committee may allocate all or any portion of its responsibilities and powers to any one or more of its members and may delegate all or any part of its responsibilities and powers to any person or persons selected by it in accordance with the terms of our 2015 Plan. Unless otherwise expressly provided in our 2015 Plan, all designations, determinations, interpretations, and other decisions under or with respect to our 2015 Plan or any award or any documents evidencing awards granted pursuant to our 2015 Plan are within the sole discretion of the Compensation Committee, may be made at any time and are final, conclusive and binding upon all persons or entities, including, without limitation, us, any participant, any holder or beneficiary of any award, and any of our stockholders.
Shares Subject to our 2015 Plan. Our 2015 Plan provides that the total number of shares of common stock that may be issued under our 2015 Plan is 8,400,000. Of this amount, the maximum number of shares for which incentive stock options may be granted is 8,400,000; the maximum number of shares for which options or stock appreciation rights may be granted to any individual participant during any single fiscal year is 2,100,000; the maximum number of shares for which performance compensation awards denominated in shares may be granted to any individual participant in respect of a single fiscal year is 2,100,000 (or if any such awards are settled in cash, the maximum amount may not exceed the fair market value of such shares on the last day of the performance period to which such award relates); the maximum number of shares of common stock granted during a single fiscal year to any non-employee director, taken together with any cash fees paid to such non-employee director during the fiscal year, shall not exceed $500,000 in total value; and the maximum amount that may be paid to any individual participant for a single fiscal year under a performance compensation award denominated in cash is $10,000,000. Except for substitute awards (as described below), in the event any award terminates, lapses, or is settled without the payment of the full number of shares subject to such award, including as a result of net settlement of the award or as a result of the award being settled in cash, the undelivered shares may be granted again under our 2015 Plan, unless the shares are surrendered after the termination of our 2015 Plan, and only if stockholder approval is not required under the then-applicable rules of the exchange on which the shares of common stock are listed. Awards may, in the sole discretion of the Compensation Committee, be granted in assumption of, or in substitution for, outstanding awards previously granted by an entity directly or indirectly acquired by us or with which we combine (referred to as “substitute awards”), and such substitute awards shall not be counted against the total number of shares that may be issued under our 2015 Plan, except that substitute awards intended to qualify as “incentive stock options” shall count against the limit on incentive stock options described above. No award may be granted under our 2015 Plan after the tenth anniversary of the effective date (as defined therein), but awards theretofore granted may extend beyond that date.
108
Table of Contents
Options. The Compensation Committee may grant non-qualified stock options and incentive stock options, under our 2015 Plan, with terms and conditions determined by the Compensation Committee that are not inconsistent with our 2015 Plan; provided, that all stock options granted under our 2015 Plan are required to have a per share exercise price that is not less than 100% of the fair market value of our common stock underlying such stock options on the date such stock options are granted (other than in the case of options that are substitute awards), and all stock options that are intended to qualify as incentive stock options must be granted pursuant to an award agreement expressly stating that the options are intended to qualify as an incentive stock options, and will be subject to the terms and conditions that comply with the rules as may be prescribed by Section 422 of the Code. The maximum term for stock options granted under our 2015 Plan will be ten years from the initial date of grant, or with respect to any stock options intended to qualify as incentive stock options, such shorter period as prescribed by Section 422 of the Code. However, if a non-qualified stock option would expire at a time when trading of shares of common stock is prohibited by our insider trading policy (or “blackout period” imposed by us), the term will automatically be extended to the 30th day following the end of such period. The purchase price for the shares as to which a stock option is exercised may be paid to us, to the extent permitted by law (i) in cash or its equivalent at the time the stock option is exercised; (ii) in shares having a fair market value equal to the aggregate exercise price for the shares being purchased and satisfying any requirements that may be imposed by the Compensation Committee; or (iii) by such other method as the Compensation Committee may permit in its sole discretion, including, without limitation, (A) in other property having a fair market value on the date of exercise equal to the purchase price, (B) if there is a public market for the shares at such time, through the delivery of irrevocable instructions to a broker to sell the shares being acquired upon the exercise of the stock option and to deliver to us the amount of the proceeds of such sale equal to the aggregate exercise price for the shares being purchased or (C) through a “net exercise” procedure effected by withholding the minimum number of shares needed to pay the exercise price and all applicable required withholding taxes. Any fractional shares of common stock will be settled in cash.
Stock Appreciation Rights. The Compensation Committee may grant stock appreciation rights, with terms and conditions determined by the Compensation Committee that are not inconsistent with our 2015 Plan. Generally, each stock appreciation right will entitle the participant upon exercise to an amount (in cash, shares or a combination of cash and shares, as determined by the Compensation Committee) equal to the product of (i) the excess of (A) the fair market value on the exercise date of one share of common stock, over (B) the strike price per share, times (ii) the number of shares of common stock covered by the stock appreciation right. The strike price per share of a stock appreciation right will be determined by the Compensation Committee at the time of grant but in no event may such amount be less than the fair market value of a share of common stock on the date the stock appreciation right is granted (other than in the case of stock appreciation rights granted in substitution of previously granted awards).
Restricted Shares and Restricted Stock Units. The Compensation Committee may grant restricted shares of our common stock or restricted stock units, representing the right to receive, upon the expiration of the applicable restricted period, one share of common stock for each restricted stock unit, or, in its sole discretion of the Compensation Committee, the cash value thereof (or any combination thereof). As to restricted shares of our common stock, subject to the other provisions of our 2015 Plan, the holder will generally have the rights and privileges of a stockholder as to such restricted shares of common stock, including, without limitation, the right to vote such restricted shares of common stock (except, that if the lapsing of restrictions with respect to such restricted shares of common stock is contingent on satisfaction of performance conditions other than or in addition to the passage of time, any dividends payable on such restricted shares of common stock will be retained, and delivered without interest to the holder of such shares when the restrictions on such shares lapse).
Other Stock-Based Awards. The Compensation Committee may issue unrestricted common stock, rights to receive grants of awards at a future date, or other awards denominated in shares of common stock (including, without limitation, performance shares or performance units), under our 2015 Plan, including performance-based awards, with terms and conditions determined by the Compensation Committee that are not inconsistent with our 2015 Plan.
109
Table of Contents
Performance Compensation Awards. The Compensation Committee may also designate any award as a “performance compensation award” intended to qualify as “performance-based compensation” under Section 162(m) of the Code. The Compensation Committee also has the authority to make an award of a cash bonus to any participant and designate such award as a performance compensation award under our 2015 Plan. The Compensation Committee has sole discretion to select the length of any applicable performance periods, the types of performance compensation awards to be issued, the applicable performance criteria and performance goals, and the kinds and/or levels of performance goals that are to apply. The performance criteria that will be used to establish the performance goals may be based on the attainment of specific levels of our performance (and/or one or more affiliates, divisions or operational and/or business units, product lines, brands, business segments, administrative departments, or any combination of the foregoing) and are limited to specific criteria enumerated in our 2015 Plan.
Effect of Certain Events on 2015 Plan and Awards. In the event of (a) any dividend (other than regular cash dividends) or other distribution (whether in the form of cash, shares of common stock, other securities or other property), recapitalization, stock split, reverse stock split, reorganization, merger, consolidation, split-up, split-off, spin-off, combination, repurchase or exchange of our shares of common stock or other securities, issuance of warrants or other rights to acquire our shares of common stock or other securities, or other similar corporate transaction or event (including, without limitation, a change in control, as defined in our 2015 Plan) that affects the shares of common stock, or (b) unusual or nonrecurring events (including, without limitation, a change in control) affecting us, any affiliate, or the financial statements of us or any affiliate, or changes in applicable rules, rulings, regulations or other requirements of any governmental body or securities exchange or inter-dealer quotation system, accounting principles or law, such that in either case an adjustment is determined by the Compensation Committee in its sole discretion to be necessary or appropriate, then the Compensation Committee must make any such adjustments in such manner as it may deem equitable, including, without limitation, any or all of: (i) adjusting any or all of (A) the share limits applicable under our 2015 Plan with respect to the number of awards which may be granted thereunder; (B) the number of our shares of common stock or other securities which may be issued in respect of awards or with respect to which awards may be granted under our 2015 Plan and (C) the terms of any outstanding award, including, without limitation, (1) the number of shares of common stock or other securities subject to outstanding awards or to which outstanding awards relate, (2) the exercise price or strike price with respect to any award or (3) any applicable performance measures; (ii) providing for a substitution or assumption of awards, accelerating the exercisability of, lapse of restrictions on, or termination of, awards or providing for a period of time for participants to exercise outstanding awards prior to the occurrence of such event; and (iii) cancelling any one or more outstanding awards and causing to be paid to the holders holding vested awards (including any awards that would vest as a result of the occurrence of such event but for such cancellation) the value of such awards, if any, as determined by the Compensation Committee (which if applicable may be based upon the price per share of common stock received or to be received by other holders of our stock in such event), including, without limitation, in the case of options and stock appreciation rights, a cash payment equal to the excess, if any, of the fair market value of the shares of common stock subject to the option or stock appreciation right over the aggregate exercise price or strike price thereof.
Nontransferability of Awards. An award will not be transferable or assignable by a participant otherwise than by will or by the laws of descent and distribution and any such purported assignment, alienation, pledge, attachment, sale, transfer or encumbrance will be void and unenforceable against us or any affiliate. However, the Compensation Committee may, in its sole discretion, permit awards (other than incentive stock options) to be transferred, including transfer to a participant’s family members, any trust established solely for the benefit of a participant or such participant’s family members, any partnership or limited liability company of which a participant, or such participant and such participant’s family members, are the sole member(s), and a beneficiary to whom donations are eligible to be treated as “charitable contributions” for tax purposes.
Amendment and Termination. Our Board of Directors may amend, alter, suspend, discontinue, or terminate our 2015 Plan or any portion thereof at any time; provided, that no such amendment, alteration, suspension, discontinuation or termination may be made without stockholder approval if (i) such approval is
110
Table of Contents
necessary to comply with any regulatory requirement applicable to our 2015 Plan or for changes in GAAP to new accounting standards; (ii) it would materially increase the number of securities which may be issued under our 2015 Plan (except for adjustments in connection with certain corporate events) or (iii) it would materially modify the requirements for participation in our 2015 Plan; provided, further, that any such amendment, alteration, suspension, discontinuance or termination that would materially and adversely affect the rights of any participant or any holder or beneficiary of any award shall not to that extent be effective without such individual’s consent.
The Compensation Committee may, to the extent consistent with the terms of any applicable award agreement, waive any conditions or rights under, amend any terms of, or alter, suspend, discontinue, cancel or terminate, any award granted or the associated award agreement, prospectively or retroactively, subject to the consent of the affected participant if any such waiver, amendment, alteration, suspension, discontinuance, cancellation or termination would materially and adversely affect the rights of any participant with respect to such award; provided that without stockholder approval, except as otherwise permitted in our 2015 Plan, (i) no amendment or modification may reduce the exercise price of any option or the strike price of any stock appreciation right; (ii) the Compensation Committee may not cancel any outstanding option or stock appreciation right and replace it with a new option or stock appreciation right (with a lower exercise price or strike price, as the case may be) or other award or cash payment that is greater than the value of the cancelled option or stock appreciation right and (iii) the Compensation Committee may not take any other action which is considered a “repricing” for purposes of the stockholder approval rules of any securities exchange or inter-dealer quotation system on which our securities are listed or quoted.
Dividends and Dividend Equivalents. The Compensation Committee in its sole discretion may provide part of an award with dividends or dividend equivalents, on such terms and conditions as may be determined by the Compensation Committee in its sole discretion; provided, that no dividends or dividend equivalents shall be payable in respect of outstanding (i) options or stock appreciation rights or (ii) unearned performance compensation awards or other unearned awards subject to performance conditions (other than or in addition to the passage of time) (although dividends or dividend equivalents may be accumulated in respect of unearned awards and paid within 15 days after such awards are earned and become payable or distributable).
Clawback/Forfeiture. An award agreement may provide that the Compensation Committee may in its sole discretion cancel such award if the participant, while employed by or providing services to us or any affiliate or after termination of such employment or service, violates a non-competition, non-solicitation or non-disclosure covenant or agreement or otherwise has engaged in or engages in other detrimental activity that is in conflict with or adverse to our interests or the interests of any affiliate, including fraud or conduct contributing to any financial restatements or irregularities, as determined by the Compensation Committee in its sole discretion. Without limiting the foregoing, all awards shall be subject to reduction, cancellation, forfeiture or recoupment to the extent necessary to comply with applicable law.
Director Compensation
For fiscal 2014, among our directors, we only provided compensation to our Chairman Bill Bishop, Frances Frei and Amy Schulman. All of our directors are reimbursed for their reasonable out-of-pocket expenses related to their service as a member of the Board of Directors or one of its committees.
For his service as Chairman of the Board of Directors in 2014, Bill received an annual retainer of $174,580, which was paid on a twice a month basis. As Chairman of the Board of Directors, Bill also participated in the Company’s fiscal 2014 annual incentive compensation plan. See “—Annual Cash Incentive Compensation.” For fiscal 2014, Bill’s target bonus opportunity as a percentage of his cash compensation was 75% and his maximum bonus opportunity as a percentage of target was 200%. Bill also received Company-paid life insurance premiums and a car allowance for fiscal 2014.
Frances Frei and Amy Schulman joined our Board of Directors in November 2014 and were paid the pro-rated portion of their $145,000 annual retainer.
111
Table of Contents
Director Compensation for Fiscal 2014
The following table sets forth information concerning the compensation of our directors (other than directors who are named executive officers) for fiscal 2014.
| Name | Fees earned or ($) |
Non-equity ($) (1) |
All other ($) (2) |
Total ($) | ||||
| Bill Bishop |
235,527 | 79,377 | 18,288 | 333,192 | ||||
| Philippe Amouyal |
— | — | — | — | ||||
| Evren Bilimer |
— | — | — | — | ||||
| Raymond Debbane |
— | — | — | — | ||||
| Michael Eck(3) |
— | — | — | — | ||||
| Frances Frei(4) |
18,931 | — | — | 18,931 | ||||
| Aflalo Guimaraes |
— | — | — | — | ||||
| Amy Schulman(4) |
18,931 | — | — | 18,931 |
| (1) | Reflects amounts earned under the Company’s fiscal 2014 annual incentive compensation plan. |
| (2) | Amount reported reflects Company-paid life insurance premiums and a car allowance. |
| (3) | Michael Eck joined our Board of Directors in February 2015 and therefore received no compensation for fiscal 2014. |
| (4) | Amount reported reflects pro-rated portion of their annual retainer. |
Director Compensation for Fiscal 2015
For fiscal 2015, our Chairman Bill Bishop will receive an annual retainer of $400,000 pro-rated up until our initial public offering. Michael Eck, Frances Frei and Amy Schulman will also receive an annual retainer of $145,000 up until our initial public offering. Concurrent with our initial public offering, Michael Eck, Frances Frei and Amy Schulman will receive a one-time fully-vested grant of our common stock with a three year holding restriction valued at approximately $85,000.
Subsequent to our initial public offering, our Chairman Bill Bishop will receive an annual retainer of $180,000, and each of our other directors will receive an annual retainer of $60,000 to be paid on a quarterly basis in arrears. In addition, as our Chairman, Bill will also receive an annual fully-vested grant of our common stock valued at approximately $220,000 and each of our other directors will receive a fully vested grant of our common stock valued at approximately $85,000, in each case, with a three year holding restriction. For fiscal 2015, the annual equity award will be pro-rated for the period from the expected consummation of the initial public offering to the annual shareholder meeting that is anticipated to occur in May 2016. Our Audit Committee Chairman and Audit Committee members will also receive an additional retainer of $15,000 and $7,500, respectively, to be paid on a quarterly basis in arrears. Our Compensation Committee Chairman and Compensation Committee members will also receive an additional retainer of $10,000 and $5,000, respectively, to be paid on a quarterly basis in arrears.
112
Table of Contents
CERTAIN RELATIONSHIPS AND RELATED PARTY TRANSACTIONS
Investor Rights Agreement
We entered into an investor rights agreement on July 10, 2012 with our Sponsor, the Bishop Family Partnership and certain stockholders, which was amended and restated on January 21, 2015. The amended and restated investor rights agreement contains agreements among the parties with respect to the election of directors, restrictions on the transfer of shares and tag-along rights and drag-along rights. The amended and restated investor rights agreement also provides that all stockholders party to the agreement are entitled to participate in certain offerings of the Company’s securities registered under the Securities Act which are initiated by our Sponsor, subject to certain exceptions. This agreement provides our Sponsor with “demand” registration rights. The amended and restated investor rights agreement also provides that we will pay certain expenses of these stockholders relating to such registrations and indemnify them against certain liabilities which may arise under the Securities Act.
The amended and restated investor rights agreement has been filed as an exhibit to the registration statement of which this prospectus forms a part.
Other Related Party Transactions
As of December 31, 2014 and March 31, 2015, Invus Partners, LLC, an affiliate of our Sponsor, held $20.1 million of the Company’s outstanding debt under our senior secured credit facilities. Several of the members of our Board of Directors are members of our Sponsor as well as managing directors and officers of the general partner of our Sponsor and managing directors and officers of an investment advisor to the Company’s majority shareholder.
In addition, Kunkemueller Enterprises LP, or Kunkemueller, which is owned in part by the wife of Aflalo Guimaraes, one of the members of our Board of Directors, held $1.5 million of the Company’s debt under our senior secured credit facilities, as of December 31, 2014 and March 31, 2015. See “Description of Certain Indebtedness.”
Both our Sponsor and Kunkemueller receive their respective pro rata share of interest payments made by us in respect of the outstanding debt under our senior secured credit facilities. For the year ended December 31, 2014 and the three months ended March 31, 2015, such pro rata share amounted to $804,821 and $189,341, respectively, in respect of our Sponsor, and $73,288 and $17,461, respectively, in respect of Kunkemueller.
Christopher (“Chris”) Bishop, our Senior Vice President of Advertising, is the brother of our President and Chief Operating Officer and the son of our Chairman and Director. Total cash payments made by the Company to Chris Bishop, including salary, bonus and a car allowance, for the years ended December 31, 2012, 2013 and 2014 and the three months ended March 31, 2015 were $309,500, $339,900, $260,168 and $50,740, respectively.
Procedures for Related-Party Transactions
Our Board of Directors recognizes the fact that transactions with related persons present a heightened risk of conflicts of interests and/or improper valuation (or the perception thereof). Prior to the completion of this offering, our Board of Directors will adopt a written policy on transactions with related persons that is in conformity with the requirements upon issuers having publicly-held common stock that is listed on NASDAQ.
Under the new policy a related party must promptly disclose to the General Counsel, or such other person designated by the Board of Directors, any related party transaction in which such related person had or
113
Table of Contents
will have a direct or indirect material interest and all material facts with respect thereto. The General Counsel, or such other person, will promptly communicate such information to the Board of Directors, as applicable.
Related party transactions where the amount involved is less than or equal to $120,000 and that involve executive officers of the Company (other than the Chief Financial Officer and the Chief Executive Officer) shall be reviewed and approved or ratified by the Chief Financial Officer. All other related party transactions, including any related party transaction where the amount involved exceeds $120,000 or that involves the Chief Executive Officer, the Chief Financial Officer or any member of the Board of Directors, shall be reviewed and approved or ratified by the disinterested members of the Board of Directors or any Committee of the Board of Directors, provided that, in each case, a majority of the members of the Board of Directors or any Committee of the Board Directors, as applicable, are disinterested. The Chief Financial Officer shall review all related party transactions that he or she approves with the Audit Committee annually. The Company will disclose to the Audit Committee any employment of a related party by a customer or vendor of the Company.
In addition, the related person transaction policy provides that the approving body, in connection with any approval or ratification of a related person transaction involving a non-employee director or director nominee, should consider whether such transaction would compromise the director or director nominee’s status as an “independent,” “outside,” or “non-employee” director, as applicable, under the rules and regulations of the SEC, NASDAQ and the Code.
114
Table of Contents
PRINCIPAL AND SELLING STOCKHOLDERS
The following table contains information about the beneficial ownership of our common stock as of June 30, 2015, (1) immediately prior to the consummation of this offering and after giving effect to the issuance of 249,163 shares of our common stock to holders of stock options under the 2012 Plan upon exercise thereof, which shares are to be sold in this offering and (2) as further adjusted to reflect (x) the issuance of 35,934 shares of our common stock to certain non-management employees in connection with this offering and (y) the sale of shares of our common stock offered by this prospectus by:
| • | each person, or group of persons, known to us who beneficially owns more than 5% of our capital stock; |
| • | each named executive officer; |
| • | each of our directors; |
| • | all directors and executive officers as a group; and |
| • | each person selling common stock in connection with this initial public offering. |
Unless otherwise indicated, our calculation of the percentage of beneficial ownership prior to the offering is based on 195,998,174 shares of common stock, which is comprised of 195,749,011 shares of common stock outstanding as of June 30, 2015, as adjusted to reflect the issuance of 249,163 shares of our common stock to holders of stock options under the 2012 Plan upon exercise thereof, which shares are to be sold in this offering.
Beneficial ownership and percentage ownership are determined in accordance with the rules and regulations of the SEC and include voting or investment power with respect to shares of stock. This information does not necessarily indicate beneficial ownership for any other purpose. In computing the number of shares beneficially owned by a person and the percentage ownership of that person, shares of common stock subject to restrictions, options or warrants held by that person that are currently exercisable or exercisable within 60 days of the date of this prospectus are deemed outstanding. Such shares, however, are not deemed outstanding for the purposes of computing the percentage ownership of any other person. Except as indicated in the footnotes to the following table or pursuant to applicable community property laws, we believe, based on information furnished to us, that each shareholder named in the table has sole voting and investment power with respect to the shares set forth opposite such shareholder’s name.
For further information regarding material transactions between us and certain of our shareholders, see “Certain Relationships and Related Party Transactions.”
115
Table of Contents
Unless otherwise indicated in the footnotes, the address of each beneficial owner named below is: c/o Blue Buffalo Pet Products, Inc., 11 River Road, Wilton, Connecticut 06897.
| Shares beneficially owned prior to the offering |
Shares beneficially owned after the offering |
|||||||||||||||||||||||
| Name of Beneficial Owner |
Excluding exercise of the underwriters’ over-allotment option to purchase additional shares |
Including exercise in full of the underwriters’ over-allotment option to purchase additional shares |
||||||||||||||||||||||
| Number | Percent | Number | Percent(1) | Number | Percent(2) | |||||||||||||||||||
| Greater than 5% Stockholders |
||||||||||||||||||||||||
| Invus, L.P.(3) |
143,452,150 | 73.19 | % | 121,934,327 | 62.20 | % | 118,673,750 | 60.53 | % | |||||||||||||||
| Christopher T. Bishop(4)(5)(12)(14) |
23,888,788 | 12.19 | % | 20,305,469 | 10.36 | % | 19,762,490 | 10.08 | % | |||||||||||||||
| The Bishop Family Limited Partnership(5) |
19,924,846 | 10.17 | % | 16,936,119 | 8.64 | % | 16,483,239 | 8.41 | % | |||||||||||||||
| Named Executive Officers and Directors: |
||||||||||||||||||||||||
| Kurt T. Schmidt(6) |
1,204,954 | 0.61 | % | 1,024,211 | 0.52 | % | 996,823 | 0.51 | % | |||||||||||||||
| William W. Bishop, Jr.(5)(7)(12) |
22,689,272 | 11.58 | % | 19,285,881 | 9.84 | % | 18,770,166 | 9.57 | % | |||||||||||||||
| Michael Nathenson(8) |
321,316 | 0.16 | % | 273,119 | 0.14 | % | 265,815 | 0.14 | % | |||||||||||||||
| William W. Bishop |
— | — | — | — | — | — | ||||||||||||||||||
| Raymond Debbane(9) |
— | — | — | — | — | — | ||||||||||||||||||
| Philippe Amouyal(9) |
— | — | — | — | — | — | ||||||||||||||||||
| Evren Bilimer(9) |
— | — | — | — | — | — | ||||||||||||||||||
| Aflalo Guimaraes(9) |
— | — | — | — | — | — | ||||||||||||||||||
| Michael A. Eck |
— | — | — | — | — | — | ||||||||||||||||||
| Frances Frei |
— | — | — | — | — | — | ||||||||||||||||||
| Amy Schulman |
— | — | — | — | — | — | ||||||||||||||||||
| All executive officers and directors as a group (11 persons) |
24,215,542 | 12.36 | % | 20,583,211 | 10.50 | % | 20,032,804 | 10.22 | % | |||||||||||||||
| Other Selling Stockholders |
||||||||||||||||||||||||
| Green Family Limited Partnership(10) |
6,452,409 | 3.29 | % | 5,484,548 | 2.80 | % | 5,337,888 | 2.72 | % | |||||||||||||||
| R&K Edwards Investments, LLC(11) |
6,452,409 | 3.29 | % | 5,484,548 | 2.80 | % | 5,337,888 | 2.72 | % | |||||||||||||||
| The Orca Trust(12) |
1,935,099 | * | 1,644,834 | * | 1,600,850 | * | ||||||||||||||||||
| Timothy B. Smith(13)(18)(29) |
1,518,971 | * | 1,291,126 | * | 1,256,599 | * | ||||||||||||||||||
| American Phoenix Trust(14) |
1,420,192 | * | 1,207,163 | * | 1,174,883 | * | ||||||||||||||||||
| Charles Huffman(15)(28) |
1,269,874 | * | 1,079,393 | * | 1,050,529 | * | ||||||||||||||||||
| John-Matthew Roth(16)(30) |
1,269,873 | * | 1,079,392 | * | 1,050,528 | * | ||||||||||||||||||
| David Petrie |
905,247 | * | 769,460 | * | 748,884 | * | ||||||||||||||||||
| Donovan 2014 Annuity Trust(17) |
819,827 | * | 696,853 | * | 678,218 | * | ||||||||||||||||||
| Donovan 2014 Trust(18) |
819,823 | * | 696,850 | * | 678,215 | * | ||||||||||||||||||
| Becker Trading Company, Inc.(19) |
677,052 | * | 575,496 | * | 575,496 | * | ||||||||||||||||||
| Evans 2003 Family Limited Partnership(20) |
677,052 | * | 575,494 | * | 560,104 | * | ||||||||||||||||||
| Richard MacLean(21) |
564,575 | * | 479,888 | * | 467,055 | * | ||||||||||||||||||
| Joyce Novotny |
489,573 | * | 416,137 | * | 405,009 | * | ||||||||||||||||||
| Anthony E. Bakker(22) |
467,250 | * | 397,162 | * | 386,541 | * | ||||||||||||||||||
| Jane A. Buckiewicz(23)(34) |
397,185 | * | 337,607 | * | 328,580 | * | ||||||||||||||||||
| Thomas K. Morton |
353,866 | * | 300,786 | * | 292,742 | * | ||||||||||||||||||
| Dennis J. Farrell(24) |
341,388 | * | 290,180 | * | 282,420 | * | ||||||||||||||||||
| David C. Hentges(25) |
340,825 | * | 289,703 | * | 289,703 | * | ||||||||||||||||||
| Elson R. Smith, Jr.(26) |
338,528 | * | 287,749 | * | 280,054 | * | ||||||||||||||||||
| Elson R. Smith III(27) |
338,524 | * | 287,746 | * | 287,746 | * | ||||||||||||||||||
| Huffman Family LLC(28) |
325,773 | * | 276,907 | * | 269,502 | * | ||||||||||||||||||
| Philip C. Cheevers |
323,731 | * | 281,731 | * | 281,731 | * | ||||||||||||||||||
| The Smith 2014 Exempt Trust(29) |
315,000 | * | 267,750 | * | 260,589 | * | ||||||||||||||||||
| Roth Family Investments LLC(30) |
295,839 | * | 251,463 | * | 244,739 | * | ||||||||||||||||||
| Steven B. Gold(31) |
286,822 | * | 243,799 | * | 237,280 | * | ||||||||||||||||||
| Jeremy Brittain |
285,520 | * | 242,692 | * | 236,202 | * | ||||||||||||||||||
| Nancy C. Cook Trust(32) |
270,820 | * | 230,197 | * | 224,042 | * | ||||||||||||||||||
| Nigel W. Cooper(33) |
270,820 | * | 230,197 | * | 224,042 | * | ||||||||||||||||||
| Buckiewicz 2014 Trust(34) |
263,201 | * | 223,721 | * | 217,739 | * | ||||||||||||||||||
| Gil Fronzaglia(35) |
245,935 | * | 209,045 | * | 203,455 | * | ||||||||||||||||||
| Steven M. Raleigh(36) |
231,415 | * | 196,703 | * | 191,445 | * | ||||||||||||||||||
| Other Selling Stockholders as a Group(37) |
1,889,744 | * | 1,612,873 | * | 1,578,817 | * | ||||||||||||||||||
| * | Less than 1% |
| (1) | Based on 196,034,108 shares of common stock that will be outstanding immediately after the completion of this offering, which includes (i) 195,749,011 shares of common stock outstanding on June 30, 2015, (ii) 249,163 shares of our common stock to be issued to holders of stock options under the 2012 Plan upon exercise thereof, which shares are to be sold in this offering and (iii) 35,934 shares of our common stock to certain non-management employees without cost to such employees. |
116
Table of Contents
| (2) | Based on 196,071,698 shares of common stock that will be outstanding immediately after the completion of this offering, which includes (i) 195,749,011 shares of common stock outstanding on June 30, 2015, (ii) 249,163 shares of our common stock to be issued to holders of stock options under the 2012 Plan upon exercise thereof, which shares are to be sold in this offering, (iii) 35,934 shares of our common stock to be issued to certain non-management employees without cost to such employees and (iv) 37,590 shares of our common stock to be issued to holders of stock options under the 2012 Plan upon exercise thereof, which shares are to be sold in this offering if the underwriters’ over-allotment to purchase additional shares is exercised in full. |
| (3) | Invus Advisors, L.L.C., or Invus Advisors, is the general partner of Invus, L.P. Artal International S.C.A. is the managing member of Invus Advisors. Artal International Management S.A. is the managing partner of Artal International S.C.A. Artal Group S.A. is the sole stockholder of Artal International Management S.A. Westend S.A. is the sole stockholder of Artal Group S.A. Stichting Administratiekantoor Westend, or the Stichting, is the sole stockholder of Westend S.A. Pascal Minne is the sole member of the board of the Stichting. Accordingly, each of Invus Advisors, Artal International S.C.A., Artal International Management S.A., Artal Group S.A., Westend S.A., the Stichting and Pascal Minne may be deemed to beneficially own the shares of common stock held of record by Invus, L.P. The address of Invus, L.P. and Invus Advisors is c/o The Invus Group, LLC, 750 Lexington Avenue, 30th Floor, New York, NY 10022. The address of Artal International S.C.A., Artal International Management S.A., Artal Group S.A. and Westend S.A. is 10-12 avenue Pasteur, L-2310, Luxembourg, Luxembourg. The address of the Stichting is De Boelelaan 7, NL-1083 HJ Amsterdam, The Netherlands. The address of Pascal Minne is Place Ste. Gudule, 19, B-1000, Bruxelles, Belgium. |
| (4) | Includes (i) 608,651 shares of common stock held by Christopher T. Bishop, (ii) 1,420,192 shares of common stock held by the American Phoenix Trust, (iii) 19,924,846 shares of common stock held by The Bishop Family Limited Partnership and (iv) 1,935,099 shares of common stock held by The Orca Trust. Christopher T. Bishop is the sole trustee of the American Phoenix Trust and has voting and investment power over the shares of common stock held by the American Phoenix Trust. Christopher T. Bishop is a primary beneficiary of The William W. Bishop Children’s Spray Trust, or the Bishop Trust, which is the general partner of The Bishop Family Limited Partnership, and, collectively with William W. Bishop, Jr., our President and Chief Operating Officer, has the ability to remove and replace the trustee of the Bishop Trust. As a result, Christopher T. Bishop may be deemed to possess beneficial ownership of the shares of common stock held by The Bishop Family Limited Partnership. Christopher T. Bishop disclaims beneficial ownership of the shares of common stock held by The Bishop Family Limited Partnership. Christopher T. Bishop is the protector of The Orca Trust and has the ability to remove the trustee. As a result, Christopher T. Bishop may be deemed to possess beneficial ownership of the shares of common stock held by The Orca Trust. Christopher T. Bishop disclaims beneficial ownership of the shares of common stock held by The Orca Trust. |
| (5) | Stephen Saft is the sole trustee of the Bishop Trust, which is the general partner of The Bishop Family Limited Partnership. Accordingly, Stephen Saft may be deemed to possess beneficial ownership of the shares of common stock held by The Bishop Family Limited Partnership. Stephen Saft disclaims beneficial ownership of the shares of common stock held by The Bishop Family Limited Partnership. William W. Bishop, Jr. and Christopher T. Bishop are the primary beneficiaries of the Bishop Trust and they collectively have the ability to remove and replace the trustee of the Bishop Trust. As a result, William W. Bishop, Jr. and Christopher T. Bishop may be deemed to possess beneficial ownership of the shares of common stock held by The Bishop Family Limited Partnership. William W. Bishop, Jr. and Christopher T. Bishop each disclaim beneficial ownership of the shares of common stock held by The Bishop Family Limited Partnership. |
| (6) | Includes 1,024,211 shares of common stock underlying stock options exercisable within 60 days of the date of this prospectus held by Kurt T. Schmidt. |
| (7) | Includes (i) 829,327 shares of common stock held by William W. Bishop, Jr., (ii) 19,924,846 shares of common stock held by The Bishop Family Limited Partnership and (iii) 1,935,099 shares of common stock held by The Orca Trust. William W. Bishop, Jr. is a primary beneficiary of the Bishop Trust, which is the general partner of The Bishop Family Limited Partnership, and, collectively with Christopher T. Bishop, has the ability to remove and replace the trustee of the Bishop Trust. As a result, William W. Bishop, Jr. may be deemed to possess beneficial ownership of the shares of common stock held by The Bishop Family Limited Partnership. William W. Bishop, Jr. disclaims beneficial ownership of the shares of common stock held by The Bishop Family Limited Partnership. William W. Bishop, Jr. is the sole trustee of The Orca Trust and has voting and investment power over the shares of common stock held by The Orca Trust. |
| (8) | Includes 273,119 shares of common stock underlying stock options exercisable within 60 days of the date of this prospectus held by Michael Nathenson. |
| (9) | Raymond Debbane, Philippe Amouyal, Evren Bilimer and Aflalo Guimaraes are each officers of Invus Advisors, but each disclaims beneficial ownership of the shares beneficially owned by Invus, L.P. The address for each of Raymond Debbane, Philippe Amouyal, Evren Bilimer and Aflalo Guimaraes is c/o The Invus Group, LLC, 750 Lexington Avenue, 30th Floor, New York, NY 10022. |
| (10) | Green Family LLC is the general partner of the Green Family Limited Partnership. Leonard Green is the sole member of Green Family LLC. Accordingly, Leonard Green may be deemed to beneficially own the shares of common stock held by the Green Family Limited Partnership. The address of the Green Family Limited Partnership, Green Family LLC and Leonard Green is 900 Rte. 9 North, Ste. 601, Woodbridge, NJ 07095. |
| (11) | Ronald L. Edwards is the sole manager of R&K Edwards Investments, LLC and has voting and investment power over the shares of common stock held by R&K Edwards Investments, LLC. The address of R&K Edwards Investments, LLC and Ronald L. Edwards is 536 Point Lane, Vero Beach, FL 32963. |
| (12) | William W. Bishop, Jr., is the sole trustee of The Orca Trust and has voting and investment power over the shares of common stock held by The Orca Trust. Christopher T. Bishop is the protector of The Orca Trust and has the ability to remove and replace the trustee. As a result, Christopher T. Bishop may be deemed to possess beneficial ownership of the shares of common stock held by The Orca Trust. Christopher T. Bishop disclaims beneficial ownership of the shares of common stock held by The Orca Trust. |
117
Table of Contents
| (13) | Includes (i) 226,648 shares of common stock held by Timothy B. Smith, (ii) 315,000 shares of common stock held by The Smith 2014 Exempt Trust, (iii) 157,500 shares of common stock held by The Cooper 2014 Exempt Trust and (iv) 819,823 shares of common stock held by the Donovan 2014 Trust. Timothy B. Smith, the settlor, has the ability to remove and replace the trustee of The Smith 2014 Exempt Trust and substitute trust assets and, as a result, may be deemed to possess beneficial ownership of the shares of common stock held by The Smith 2014 Exempt Trust. Timothy B. Smith is the sole trustee of The Cooper 2014 Exempt Trust and the Donovan 2014 Trust and has voting and investment power over the shares of common stock held by such trusts. As a result, Timothy B. Smith may be deemed to possess beneficial ownership of the shares of common stock held by The Cooper 2014 Exempt Trust and the Donovan 2014 Trust. Timothy B. Smith disclaims beneficial ownership of the shares of common stock held by The Cooper 2014 Exempt Trust and the Donovan 2014 Trust. The address of Timothy B. Smith is 2520 Raven Drive, Sullivan’s Island, SC 29482. |
| (14) | Christopher T. Bishop is the sole trustee of the American Phoenix Trust and has voting and investment power over the shares of common stock held by the American Phoenix Trust. |
| (15) | Includes (i) 944,101 shares of common stock held by Charles Huffman and (ii) 325,773 shares of common stock held by Huffman Family LLC. Charles Huffman is the sole manager of Huffman Family LLC and has voting and investment power over the shares of common stock held by Huffman Family LLC. |
| (16) | Includes (i) 974,034 shares of common stock held by John-Matthew Roth and (ii) 295,839 shares of common stock held by Roth Family Investments LLC. John-Matthew Roth is the managing member of Roth Family Investments LLC and has voting and investment power over the shares of common stock held by Roth Family Investments LLC. |
| (17) | Thomas C. Donovan is the sole trustee of the Donovan 2014 Annuity Trust and has voting and investment power over the shares of common stock held by the Donovan 2014 Annuity Trust. |
| (18) | Timothy B. Smith is the sole trustee of the Donovan 2014 Trust and has voting and investment power over the shares of common stock held by the Donovan 2014 Trust. As a result, Timothy B. Smith may be deemed to possess beneficial ownership of the shares of common stock held by the Donovan 2014 Trust. Timothy B. Smith disclaims beneficial ownership of the shares of common stock held by the Donovan 2014 Trust. Thomas C. Donovan is the grantor under the Donovan 2014 Trust and has the ability to appoint a protector of the Donovan 2014 Trust who has the ability to remove and replace the trustee. As a result, Thomas C. Donovan may be deemed to possess beneficial ownership of the shares of common stock held by the Donovan 2014 Trust. |
| (19) | R. William Becker is the sole shareholder of Becker Trading Company, Inc. and has voting and investment power over the shares of common stock held by Becker Trading Company, Inc. The address of Becker Trading Company, Inc. and R. William Becker is 582 Beachland Blvd., Suite 300, Vero Beach, FL 32963. |
| (20) | J.E. Evans, Jr. Revocable Trust and J.E. Evans, III, Revocable Trust are the general partners of the Evans 2003 Family Limited Partnership. J.E. Evans, Jr. is the trustee of the J.E. Evans, Jr. Revocable Trust and J.E. Evans, III is the trustee of the J.E. Evans, III, Revocable Trust. Accordingly, each of J.E. Evans, Jr. and J.E. Evans, III may be deemed to possess beneficial ownership of the shares of common stock held by the Evans 2003 Family Limited Partnership. The address of the Evans 2003 Family Limited Partnership, J.E. Evans, Jr. Revocable Trust, J.E. Evans, III, Revocable Trust, J.E. Evans, Jr. and J.E. Evans, III is 660 Beachland Blvd., Suite 301, Vero Beach, FL 32963. |
| (21) | Includes (i) 366,697 shares of common stock held by Richard MacLean and (ii) 197,878 shares of common stock held by R.E. MacLean, LLC. Richard MacLean is the sole manager of R.E. MacLean, LLC and has voting and investment power over the shares of common stock held by R.E. MacLean, LLC. |
| (22) | The address of Anthony E. Bakker is 5795 Selkirk Plantation Road, Wadmalaw Island, SC 29487. |
| (23) | Includes (i) 133,984 shares of common stock held by Jane A. Buckiewicz and (ii) 263,201 shares of common stock held by the Buckiewicz 2014 Trust. Jane A. Buckiewicz is the settlor under the Buckiewicz 2014 Trust and has the ability to appoint a protector of the trust who has the ability to remove and replace the trustee. As a result, Jane A. Buckiewicz may be deemed to possess beneficial ownership of the shares of common stock held by the Buckiewicz 2014 Trust. |
| (24) | The address of Dennis J. Farrell is 9812 SE Crape Myrtle Court, Hobe Sound, FL 33455. |
| (25) | The address of David C. Hentges is 6124 S.W. 38th Street, Topeka, KS 66610. |
| (26) | The address of Elson R. Smith III is 1320 Little Harbour Drive, Vero Beach, FL 32963. |
| (27) | The address of Elson R Smith, Jr. is 649 Lake Drive, Vero Beach, FL 32963. |
| (28) | Charles Huffman is the sole manager of Huffman Family LLC and has voting and investment power over the shares of common stock held by Huffman Family LLC. |
| (29) | Gary F. Thornhill is the sole trustee of The Smith 2014 Exempt Trust and has voting and investment power over the shares of common stock held by The Smith 2014 Exempt Trust. As a result, Gary F. Thornhill may be deemed to possess beneficial ownership of the shares of common stock held by The Smith 2014 Exempt Trust. Gary F. Thornhill disclaims beneficial ownership of the shares of common stock held by The Smith 2014 Exempt Trust. Timothy B. Smith, the settlor, has the ability to remove and replace the trustee of The Smith 2014 Exempt Trust and substitute trust assets and, as a result, may be deemed to possess beneficial ownership of the shares of common stock held by The Smith 2014 Exempt Trust. The address of The Smith 2014 Exempt Trust is c/o J.P. Wealth Management, Inc., 3401 Salterbeck Court, Suite 202, Mt. Pleasant, SC 29466 and the address of Timothy B. Smith is 2520 Raven Drive, Sullivan’s Island, SC 29482. |
| (30) | John-Matthew Roth is the managing member of Roth Family Investments LLC and has voting and investment power over the shares of common stock held by Roth Family Investments LLC. |
| (31) | The address of Steven B. Gold is 648 Bayview Drive, Longboat Key, FL 34228. |
| (32) | Nancy C. Cook is the sole trustee of the Nancy C. Cook Trust and has voting and investment power over the shares of common stock held by the Nancy C. Cook Trust. The address of the Nancy C. Cook Trust and Nancy C. Cook is 3213 Ocean Drive, Vero Beach, FL 32963. |
118
Table of Contents
| (33) | Includes (i) 113,320 shares of common stock held by Nigel W. Cooper and (ii) 157,500 shares of common stock held by The Cooper 2014 Exempt Trust. Nigel W. Cooper, the settlor, has the ability to remove and replace the trustee of The Cooper 2014 Exempt Trust and substitute trust assets and, as a result, may be deemed to possess beneficial ownership of the shares of common stock held by The Cooper 2014 Exempt Trust. The address of Nigel W. Cooper is 86 Murray Boulevard, Charleston, SC 29401. |
| (34) | Lynn Corrigan is the sole trustee of the Buckiewicz 2014 Trust and has voting and investment power over the shares of common stock held by the Buckiewicz 2014 Trust. As a result, Lynn Corrigan may be deemed to possess beneficial ownership of the shares of common stock held by the Buckiewicz 2014 Trust. Lynn Corrigan disclaims beneficial ownership of the shares of common stock held by the Buckiewicz 2014 Trust. Jane A. Buckiewicz is the settlor under the Buckiewicz 2014 Trust and has the ability to appoint a protector of the trust who has the ability to remove and replace the trustee. As a result, Jane A. Buckiewicz may be deemed to possess beneficial ownership of the shares of common stock held by the Buckiewicz 2014 Trust. |
| (35) | The address of Gil Fronzaglia is 504 Marine Street, Boulder, CO 80302. |
| (36) | Includes (i) 3,570 shares of common stock underlying stock options exercisable within 60 days of the date of this prospectus held by Steven M. Raleigh and (ii) 17,215 shares of common stock held by BisMo LLC. Steven M. Raleigh is the sole manager of BisMo LLC and has voting and investment power over the shares of common stock held by BisMo LLC. |
| (37) | Shares shown in the table include shares owned by the selling stockholders other than those named in the table that in the aggregate beneficially own less than 1% of our common stock as of June 30, 2015. |
119
Table of Contents
The following description summarizes the terms of our capital stock, our amended and restated certificate of incorporation and our amended and restated bylaws. As it is only a summary, it does not contain all the information that may be important to you. For a complete description, you should refer to our amended and restated certificate of incorporation and amended and restated bylaws, each of which will be in effect upon the consummation of this offering, the forms of which are filed as exhibits to the registration statement of which this prospectus is a part.
Our purpose is to engage in any lawful act or activity for which corporations may now or hereafter be organized under the General Corporation Law of the State of Delaware, or the DGCL. Upon the consummation of this offering, our authorized capital stock will consist of 1,500,000,000 shares of common stock, par value $0.01 per share, and 150,000,000 shares of preferred stock, par value $0.01 per share. As of June 30, 2015, there were 195,998,174 shares of common stock outstanding (including the issuance of 249,163 shares of our common stock to be issued to holders of stock options under the 2012 Plan upon exercise thereof, which shares are to be sold in this offering) held of record by approximately 110 stockholders. In addition, 4,411,139 shares of our common stock were issuable upon exercise of outstanding options granted under the 2012 Plan (excluding shares of common stock that will be issued to holders of such options for sale in this offering). No shares of preferred stock will be issued or outstanding immediately after the offering contemplated by this prospectus. Unless our Board of Directors determines otherwise, we will issue all shares of our capital stock in uncertificated form.
We, our executive officers, directors and all our existing stockholders, including the selling stockholders, will sign lock-up agreements with the underwriters that will, subject to certain customary exceptions, restrict the sale of the shares of our common stock and certain other securities held by them for 180 days following the date of this prospectus. J.P. Morgan Securities LLC and Citigroup Global Markets Inc. may, in their sole discretion and at any time without notice, release all or any portion of the shares or securities subject to any such lock-up agreements. See “Underwriting” for a description of these lock-up agreements.
Common Stock
Holders of our common stock are entitled to one vote for each share held of record on all matters on which stockholders are entitled to vote generally, including the election or removal of directors, subject to certain limitations. The holders of our common stock do not have cumulative voting rights in the election of directors. Upon our liquidation, dissolution or winding up and after payment in full of all amounts required to be paid to creditors and to the holders of preferred stock having liquidation preferences, if any, the holders of our common stock will be entitled to receive pro rata our remaining assets available for distribution. Holders of our common stock do not have preemptive, subscription, redemption or conversion rights. The common stock will not be subject to further calls or assessment by us. There will be no redemption or sinking fund provisions applicable to the common stock. All shares of our common stock that will be outstanding at the time of the completion of the offering will be fully paid and non-assessable. The rights, powers, preferences and privileges of holders of our common stock will be subject to those of the holders of any shares of our preferred stock we may authorize and issue in the future.
Listing
We have applied to have our common stock approved for listing on NASDAQ under the symbol “BUFF.”
Transfer Agent and Registrar
The transfer agent and registrar for our common stock is American Stock Transfer & Trust Company, LLC.
120
Table of Contents
Preferred Stock
Our amended and restated certificate of incorporation will authorize our Board of Directors to establish one or more series of preferred stock (including convertible preferred stock). Unless required by law or by NASDAQ, the authorized shares of preferred stock will be available for issuance without further action by you. Our Board of Directors will be able to determine, with respect to any series of preferred stock, the powers including preferences and relative participations, optional or other special rights, and the qualifications, limitations or restrictions thereof, of that series, including, without limitation:
| • | the designation of the series; |
| • | the number of shares of the series, which our Board of Directors may, except where otherwise provided in the preferred stock designation, increase (but not above the total number of authorized shares of the class) or decrease (but not below the number of shares then outstanding); |
| • | whether dividends, if any, will be cumulative or non-cumulative and the dividend rate of the series; |
| • | the dates at which dividends, if any, will be payable; |
| • | the redemption rights and price or prices, if any, for shares of the series; |
| • | the terms and amounts of any sinking fund provided for the purchase or redemption of shares of the series; |
| • | the amounts payable on shares of the series in the event of any voluntary or involuntary liquidation, dissolution or winding-up of the affairs of the Company; |
| • | whether the shares of the series will be convertible into shares of any other class or series, or any other security, of the Company or any other corporation and, if so, the specification of the other class or series or other security, the conversion price or prices or rate or rates, any rate adjustments, the date or dates as of which the shares will be convertible and all other terms and conditions upon which the conversion may be made; |
| • | restrictions on the issuance of shares of the same series or of any other class or series; and |
| • | the voting rights, if any, of the holders of the series. |
We will be able to issue a series of preferred stock that could, depending on the terms of the series, impede or discourage an acquisition attempt or other transaction that some, or a majority, of the holders of our common stock might believe to be in their best interests or in which the holders of our common stock might receive a premium for their common stock over the market price of the common stock. In addition, the issuance of preferred stock may adversely affect the rights of holders of our common stock by restricting dividends on the common stock, diluting the voting power of the common stock or subordinating the liquidation rights of the common stock. As a result of these or other factors, the issuance of preferred stock may have an adverse impact on the market price of our common stock.
Dividends
The DGCL permits a corporation to declare and pay dividends out of “surplus” or, if there is no “surplus,” out of its net profits for the fiscal year in which the dividend is declared and/or the preceding fiscal year. “Surplus” is defined as the excess of the net assets of the corporation over the amount determined to be the capital of the corporation by the Board of Directors. The capital of the corporation is typically calculated to be
121
Table of Contents
(and cannot be less than) the aggregate par value of all issued shares of capital stock. Net assets equal the fair value of the total assets minus total liabilities. The DGCL also provides that dividends may not be paid out of net profits if, after the payment of the dividend, remaining capital would be less than the capital represented by the outstanding stock of all classes having a preference upon the distribution of assets.
The declaration, amount and payment of any future dividends will be at the sole discretion of our Board of Directors. Our Board of Directors may take into account general and economic conditions, our financial condition and results of operations, our available cash and current and anticipated cash needs, capital requirements, contractual, legal, tax and regulatory restrictions and implications on the payment of dividends by us to our stockholders or by our subsidiaries to us, including restrictions under our senior secured credit facilities and other indebtedness we may incur, and such other factors as our Board of Directors may deem relevant. See “Description of certain indebtedness.” In addition, because we are a holding company and have no direct operations, we will only be able to pay dividends from funds we receive from our subsidiaries.
Although we have paid cash dividends on our capital stock in the past, we currently expect to retain all future earnings for use in the operation and expansion of our business and have no current plans to pay dividends.
Annual Stockholder Meetings
Our amended and restated bylaws will provide that annual stockholder meetings will be held at a date, time and place, if any, as exclusively selected by our Board of Directors. To the extent permitted under applicable law, we may conduct meetings by remote communications, including by webcast.
Anti-Takeover Effects of Certain Provisions of our Amended and Restated Certificate of Incorporation, Amended and Restated Bylaws and Delaware Law
Our amended and restated certificate of incorporation and amended and restated bylaws will contain and the DGCL contains provisions, which are summarized in the following paragraphs, that are intended to enhance the likelihood of continuity and stability in the composition of our Board of Directors. These provisions are intended to avoid costly takeover battles, reduce our vulnerability to a hostile change of control and enhance the ability of our Board of Directors to maximize stockholder value in connection with any unsolicited offer to acquire us. However, these provisions may have an anti-takeover effect and may delay, deter or prevent a merger or acquisition of the Company by means of a tender offer, a proxy contest or other takeover attempt that a stockholder might consider in its best interest, including those attempts that might result in a premium over the prevailing market price for the shares of common stock held by stockholders.
Authorized but Unissued Capital Stock
Delaware law does not require stockholder approval for any issuance of authorized shares. However, the listing requirements of NASDAQ, which would apply if and so long as our common stock remains listed on NASDAQ, require stockholder approval of certain issuances equal to or exceeding 20% of the then outstanding voting power or then outstanding number of shares of common stock. Additional shares that may be issued in the future may be used for a variety of corporate purposes, including future public offerings, to raise additional capital or to facilitate acquisitions.
Our Board of Directors may generally issue preferred shares on terms calculated to discourage, delay or prevent a change of control of the Company or the removal of our management. Moreover, our authorized but unissued shares of preferred stock will be available for future issuances without stockholder approval and could be utilized for a variety of corporate purposes, including future offerings to raise additional capital, to facilitate acquisitions and employee benefit plans.
One of the effects of the existence of unissued and unreserved common stock or preferred stock may be to enable our Board of Directors to issue shares to persons friendly to current management, which issuance could
122
Table of Contents
render more difficult or discourage an attempt to obtain control of the Company by means of a merger, tender offer, proxy contest or otherwise, and thereby protect the continuity of our management and possibly deprive our stockholders of opportunities to sell their shares of common stock at prices higher than prevailing market prices.
Classified Board of Directors
Our amended and restated certificate of incorporation will provide that our Board of Directors will be divided into three classes of directors, with the classes to be as nearly equal in number as possible, and with the directors serving three-year terms. As a result, approximately one-third of our Board of Directors will be elected each year. See “Management.” The classification of directors will have the effect of making it more difficult for stockholders to change the composition of our Board of Directors. Our amended and restated certificate of incorporation and amended and restated bylaws will provide that, subject to any rights of holders of preferred stock to elect additional directors under specified circumstances, the number of directors will be fixed from time to time exclusively pursuant to a resolution adopted by the Board of Directors.
Business Combinations
We have opted out of Section 203 of the DGCL; however, our amended and restated certificate of incorporation will contain similar provisions providing that we may not engage in certain “business combinations” with any “interested stockholder” for a three-year period following the time that the stockholder became an interested stockholder, unless:
| • | prior to such time, our Board of Directors approved either the business combination or the transaction which resulted in the stockholder becoming an interested stockholder; |
| • | upon consummation of the transaction that resulted in the stockholder becoming an interested stockholder, the interested stockholder owned at least 85% of our voting stock outstanding at the time the transaction commenced, excluding certain shares; or |
| • | at or subsequent to that time, the business combination is approved by our Board of Directors and by the affirmative vote at a meeting, and not by written consent, of holders of at least 66 2/3% of our outstanding voting stock that is not owned by the interested stockholder. |
Generally, a “business combination” includes a merger, asset or stock sale or other transaction resulting in a financial benefit to the interested stockholder. Subject to certain exceptions, an “interested stockholder” is a person who, together with that person’s affiliates and associates, owns, or within the previous three years owned, 15% or more of our outstanding voting stock. For purposes of this section only, “voting stock” has the meaning given to it in Section 203 of the DGCL.
Under certain circumstances, this provision will make it more difficult for a person who would be an “interested stockholder” to effect various business combinations with the Company for a three-year period. This provision may encourage companies interested in acquiring the Company to negotiate in advance with our Board of Directors because the stockholder approval requirement would be avoided if our Board of Directors approves either the business combination or the transaction which results in the stockholder becoming an interested stockholder. These provisions also may have the effect of preventing changes in our Board of Directors and may make it more difficult to accomplish transactions which stockholders may otherwise deem to be in their best interests.
Our amended and restated certificate of incorporation will provide that our Sponsor, the Bishop Family Partnership and their affiliates and any of their direct or indirect transferees and any group as to which such persons are a party, do not constitute “interested stockholders” for purposes of this provision.
123
Table of Contents
Removal of Directors; Vacancies
Under the DGCL, unless otherwise provided in our amended and restated certificate of incorporation, directors serving on a classified board may be removed by the stockholders only for cause. Our amended and restated certificate of incorporation will provide that directors may be removed with or without cause upon the affirmative vote of a majority in voting power of all outstanding shares of stock entitled to vote generally in the election of directors, voting together as a single class; provided, however, at any time when the Sponsor, the Bishop Family Partnership and their affiliates beneficially own, in the aggregate, less than 40% in voting power of the stock of the Company entitled to vote generally in the election of directors, directors may only be removed for cause, and only by the affirmative vote of holders of at least 66 2/3% in voting power of all the then-outstanding shares of stock of the Company entitled to vote thereon, voting together as a single class. In addition, our amended and restated certificate of incorporation will also provide that, subject to the rights granted to one or more series of preferred stock then outstanding or the rights granted under the amended and restated investor rights agreement, any vacancies on our Board of Directors will be filled by a majority of the directors then in office, although less than a quorum, by a sole remaining director or by the stockholders; provided, however, at any time when our Sponsor, the Bishop Family Partnership and their affiliates beneficially own, in the aggregate, less than 40% in voting power of the stock of the Company entitled to vote generally in the election of directors, any vacancy occurring in the Board of Directors may only be filled by a majority of the directors then in office, although less than a quorum, or by a sole remaining director (and not by the stockholders).
No Cumulative Voting
Under Delaware law, the right to vote cumulatively does not exist unless the certificate of incorporation specifically authorizes cumulative voting. Our amended and restated certificate of incorporation will not authorize cumulative voting. Therefore, stockholders holding a majority in voting power of the shares of our stock entitled to vote generally in the election of directors will be able to elect all our directors.
Special Stockholder Meetings
Our amended and restated certificate of incorporation will provide that special meetings of our stockholders may be called at any time only by or at the direction of the Board of Directors or the chairman of the Board of Directors; provided, however, at any time when our Sponsor, the Bishop Family Partnership and their affiliates beneficially own, in the aggregate, at least 40% in voting power of the stock of the Company entitled to vote generally in the election of directors, special meetings of our stockholders shall also be called by the Board of Directors or the chairman of the Board of Directors at the request of our Sponsor and its affiliates. Our amended and restated bylaws will prohibit the conduct of any business at a special meeting other than as specified in the notice for such meeting. These provisions may have the effect of deferring, delaying or discouraging hostile takeovers, or changes in control or management of the Company.
Requirements for Advance Notification of Director Nominations and Stockholder Proposals
Our amended and restated bylaws will establish advance notice procedures with respect to stockholder proposals and the nomination of candidates for election as directors, other than nominations made by or at the direction of the Board of Directors or a committee of the Board of Directors. In order for any matter to be “properly brought” before a meeting, a stockholder will have to comply with advance notice requirements and provide us with certain information. Generally, to be timely, a stockholder’s notice must be received at our principal executive offices not less than 90 days nor more than 120 days prior to the first anniversary date of the immediately preceding annual meeting of stockholders. Our amended and restated bylaws will also specify requirements as to the form and content of a stockholder’s notice. Our amended and restated bylaws will allow the chairman of the meeting at a meeting of the stockholders to adopt rules and regulations for the conduct of meetings which may have the effect of precluding the conduct of certain business at a meeting if the rules and regulations are not followed. These provisions will not apply to our Sponsor, the Bishop Family Partnership and their affiliates so long as the amended and restated investor rights agreement remains in effect. These provisions
124
Table of Contents
may also defer, delay or discourage a potential acquiror from conducting a solicitation of proxies to elect the acquiror’s own slate of directors or otherwise attempting to influence or obtain control of the Company.
Stockholder Action by Written Consent
Pursuant to Section 228 of the DGCL, any action required to be taken at any annual or special meeting of the stockholders may be taken without a meeting, without prior notice and without a vote if a consent or consents in writing, setting forth the action so taken, is or are signed by the holders of outstanding stock having not less than the minimum number of votes that would be necessary to authorize or take such action at a meeting at which all shares of our stock entitled to vote thereon were present and voted, unless our amended and restated certificate of incorporation provides otherwise. Our amended and restated certificate of incorporation will preclude stockholder action by written consent at any time when our Sponsor, the Bishop Family Partnership and their affiliates beneficially own, in the aggregate, less than 40% in voting power of the stock of the Company entitled to vote generally in the election of directors.
Supermajority Provisions
Our amended and restated certificate of incorporation and amended and restated bylaws will provide that the Board of Directors is expressly authorized to make, alter, amend, change, add to, rescind or repeal, in whole or in part, our bylaws without a stockholder vote in any matter not inconsistent with the laws of the State of Delaware and our amended and restated certificate of incorporation. For as long as our Sponsor, the Bishop Family Partnership and their affiliates beneficially own, in the aggregate, at least 40% in voting power of the stock of the Company entitled to vote generally in the election of directors, any amendment, alteration, rescission or repeal of our bylaws by our stockholders will require the affirmative vote of a majority in voting power of the outstanding shares of our stock present in person or represented by proxy at the meeting of stockholders and entitled to vote on such amendment, alteration, rescission or repeal. At any time when our Sponsor, the Bishop Family Partnership and their affiliates beneficially own, in the aggregate, less than 40% in voting power of all outstanding shares of the stock of the Company entitled to vote generally in the election of directors, any amendment, alteration, rescission or repeal of our bylaws by our stockholders will require the affirmative vote of the holders of at least 66 2/3% in voting power of all the then-outstanding shares of stock of the Company entitled to vote thereon, voting together as a single class.
The DGCL provides generally that the affirmative vote of a majority of the outstanding shares entitled to vote thereon, voting together as a single class, is required to amend a corporation’s certificate of incorporation, unless the certificate of incorporation requires a greater percentage.
Our amended and restated certificate of incorporation will provide that at any time when our Sponsor, the Bishop Family Partnership and their affiliates beneficially own, in the aggregate, less than 40% in voting power of the stock of the Company entitled to vote generally in the election of directors, the following provisions in our amended and restated certificate of incorporation may be amended, altered, repealed or rescinded only by the affirmative vote of the holders of at least 66 2/3% in voting power of all the then-outstanding shares of stock of the Company entitled to vote thereon, voting together as a single class:
| • | the provision requiring a 66 2/3% supermajority vote for stockholders to amend our amended and restated bylaws; |
| • | the provisions providing for a classified Board of Directors (the election and term of our directors); |
| • | the provisions regarding resignation and removal of directors; |
| • | the provisions regarding competition and corporate opportunities; |
| • | the provisions regarding entering into business combinations with interested stockholders; |
| • | the provisions regarding stockholder action by written consent; |
125
Table of Contents
| • | the provisions regarding calling special meetings of stockholders; |
| • | the provisions regarding filling vacancies on our Board of Directors and newly created directorships; |
| • | the provisions eliminating monetary damages for breaches of fiduciary duty by a director; and |
| • | the amendment provision requiring that the above provisions be amended only with a 66 2/3% supermajority vote. |
The combination of the classification of our Board of Directors, the lack of cumulative voting and the supermajority voting requirements will make it more difficult for our existing stockholders to replace our Board of Directors as well as for another party to obtain control of us by replacing our Board of Directors. Because our Board of Directors has the power to retain and discharge our officers, these provisions could also make it more difficult for existing stockholders or another party to effect a change in management.
These provisions may have the effect of deterring hostile takeovers or delaying or preventing changes in control of our management or the Company, such as a merger, reorganization or tender offer. These provisions are intended to enhance the likelihood of continued stability in the composition of our Board of Directors and its policies and to discourage certain types of transactions that may involve an actual or threatened acquisition of the Company. These provisions are designed to reduce our vulnerability to an unsolicited acquisition proposal. The provisions are also intended to discourage certain tactics that may be used in proxy fights. However, such provisions could have the effect of discouraging others from making tender offers for our shares and, as a consequence, they also may inhibit fluctuations in the market price of our shares that could result from actual or rumored takeover attempts. Such provisions may also have the effect of preventing changes in management.
Dissenters’ Rights of Appraisal and Payment
Under the DGCL, with certain exceptions, our stockholders will have appraisal rights in connection with a merger or consolidation of us. Pursuant to the DGCL, stockholders who properly request and perfect appraisal rights in connection with such merger or consolidation will have the right to receive payment of the fair value of their shares as determined by the Court of Chancery of the State of Delaware.
Stockholders’ Derivative Actions
Under the DGCL, any of our stockholders may bring an action in our name to procure a judgment in our favor, also known as a derivative action, provided that the stockholder bringing the action is a holder of our shares at the time of the transaction to which the action relates or such stockholder’s stock thereafter devolved by operation of law.
Exclusive Forum
Our amended and restated certificate of incorporation will provide that unless we consent to the selection of an alternative forum, the Court of Chancery of the State of Delaware shall, to the fullest extent permitted by law, be the sole and exclusive forum for any (1) derivative action or proceeding brought on behalf of the Company, (2) action asserting a claim of breach of a fiduciary duty owed by any director or officer of the Company to the Company or the Company’s stockholders, (3) action asserting a claim against the Company or any director or officer of the Company arising pursuant to any provision of the DGCL or our amended and restated certificate of incorporation or our amended and restated bylaws or (4) action asserting a claim against the Company or any director or officer of the Company governed by the internal affairs doctrine. Any person or entity purchasing or otherwise acquiring any interest in shares of capital stock of the Company shall be deemed to have notice of and consented to the forum provisions in our amended and restated certificate of incorporation. However, the enforceability of similar forum provisions in other companies’ certificates of incorporation has been challenged in legal proceedings, and it is possible that a court could find these types of provisions to be unenforceable.
126
Table of Contents
Conflicts of Interest
Delaware law permits corporations to adopt provisions renouncing any interest or expectancy in certain opportunities that are presented to the corporation or its officers, directors or stockholders. Our amended and restated certificate of incorporation will, to the maximum extent permitted from time to time by Delaware law, renounce any interest or expectancy that we have in, or right to be offered an opportunity to participate in, specified business opportunities that are from time to time presented to our officers, directors or stockholders or their respective affiliates, other than those officers, directors, stockholders or affiliates who are our or our subsidiaries’ employees. Our amended and restated certificate of incorporation will provide that, to the fullest extent permitted by law, none of our Sponsor or any of its affiliates or any director who is not employed by us (including any non-employee director who serves as one of our officers in both his director and officer capacities) or his or her affiliates will have any duty to refrain from (1) engaging in a corporate opportunity in the same or similar lines of business in which we or our affiliates now engage or propose to engage or (2) otherwise competing with us or our affiliates. In addition, to the fullest extent permitted by law, in the event that our Sponsor or any non-employee director acquires knowledge of a potential transaction or other business opportunity which may be a corporate opportunity for itself or himself or its or his affiliates or for us or our affiliates, such person will have no duty to communicate or offer such transaction or business opportunity to us or any of our affiliates and they may take any such opportunity for themselves or offer it to another person or entity. Our amended and restated certificate of incorporation will not renounce our interest in any business opportunity that is expressly offered to a non-employee director solely in his or her capacity as a director or officer of the Company. To the fullest extent permitted by law, no business opportunity will be deemed to be a potential corporate opportunity for us unless we would be permitted, to undertake the opportunity under our amended and restated certificate of incorporation, we have sufficient financial resources to undertake the opportunity and the opportunity would be in line with our business.
Limitations on Liability and Indemnification of Officers and Directors
The DGCL authorizes corporations to limit or eliminate the personal liability of directors to corporations and their stockholders for monetary damages for breaches of directors’ fiduciary duties, subject to certain exceptions. Our amended and restated certificate of incorporation will include a provision that eliminates the personal liability of directors for monetary damages for any breach of fiduciary duty as a director, except to the extent such exemption from liability or limitation thereof is not permitted under the DGCL. The effect of these provisions will be to eliminate the rights of us and our stockholders, through stockholders’ derivative suits on our behalf, to recover monetary damages from a director for breach of fiduciary duty as a director, including breaches resulting from grossly negligent behavior. However, exculpation will not apply to any director if the director has acted in bad faith, knowingly or intentionally violated the law, authorized illegal dividends or redemptions or derived an improper benefit from his or her actions as a director.
Our amended and restated bylaws will provide that we must indemnify and advance expenses to our directors and officers to the fullest extent authorized by the DGCL. We also will be expressly authorized to carry directors’ and officers’ liability insurance providing indemnification for our directors, officers and certain employees for some liabilities. We believe that these indemnification and advancement provisions and insurance will be useful to attract and retain qualified directors and officers.
The limitation of liability, indemnification and advancement provisions in our amended and restated certificate of incorporation and amended and restated bylaws may discourage stockholders from bringing a lawsuit against directors for breach of their fiduciary duty. These provisions also may have the effect of reducing the likelihood of derivative litigation against directors and officers, even though such an action, if successful, might otherwise benefit us and our stockholders. In addition, your investment may be adversely affected to the extent we pay the costs of settlement and damage awards against directors and officers pursuant to these indemnification provisions.
There is currently no pending material litigation or proceeding involving any of our directors, officers or employees for which indemnification is sought.
127
Table of Contents
DESCRIPTION OF CERTAIN INDEBTEDNESS
Senior Secured Credit Facilities
Overview
On August 8, 2012, Blue Buffalo Company, Ltd., our wholly-owned indirect subsidiary, entered into a senior secured credit agreement, or credit agreement, with Citibank, N.A. as the administrative agent, swingline lender and issuing bank, Citigroup Global Markets Inc. and Morgan Stanley Senior Funding, Inc. as joint lead arrangers and joint bookrunners, Morgan Stanley Senior Funding, Inc. as syndication agent, and the lenders from time to time party thereto, which provided us with our term loan facilities and our revolving credit facility. The proceeds from the term loan were used to fund a special dividend of $350.0 million to our shareholders. The credit agreement was amended on December 6, 2012, February 15, 2013 and December 9, 2013 to, among other things, provide additional term loan borrowings, allow for distribution of dividends of $50.0 million and to re-price our senior secured credit facilities.
As of March 31, 2015, our senior secured credit facilities provide, exclusive of any original issue discounts, senior secured financing of $440.0 million in the aggregate, consisting of (1) $400.0 million in aggregate principal amount of term loans maturing on August 8, 2019 and (2) a $40.0 million revolving credit facility (which includes borrowing capacity available for letters of credit and for short-term borrowings) maturing on August 8, 2017. As of March 31, 2015, there were no outstanding borrowings under the revolving credit facility and $390.1 million of outstanding term loans under the term loan facilities.
Interest Rate and Fees
Borrowings under the term loan facilities bear interest at a rate per annum equal to an applicable margin plus, at our option, either (1) a base rate determined by reference to the highest of (a) the Federal Funds rate plus 0.50%, (b) the prime rate of Citibank, N.A., (c) the LIBOR rate determined by reference to the cost of funds for U.S. dollar deposits for an interest period of one month adjusted for certain additional costs, plus 1.00% and (d) a floor of 2.00% or (2) a LIBOR rate determined by reference to the costs of funds for U.S. dollar deposits for the interest period relevant to such borrowing adjusted for certain additional costs, provided that LIBOR is not lower than 1.00%. The applicable margin for borrowings under the term loan facilities is 2.75% with respect to LIBOR borrowings and 1.75% with respect to base-rate borrowings. As of March 31, 2015, the interest rate applicable to borrowings under the term loan facilities was 3.75%.
Borrowings under the revolving credit facility bear interest at a rate per annum equal to an applicable margin based upon a leverage-based pricing grid, plus, at our option, either (1) a base rate determined by reference to the highest of (a) the Federal Funds rate plus 0.50%, (b) the prime rate of Citibank, N.A., (c) the LIBOR rate determined by reference to the cost of funds for U.S. dollar deposits for an interest period of one month adjusted for certain additional costs, plus 1.00% or (2) a LIBOR rate determined by reference to the costs of funds for U.S. dollar deposits for the interest period relevant to such borrowing adjusted for certain additional costs. The applicable margin for borrowings under the revolving credit facility is 3.25% with respect to LIBOR borrowings and 2.25% with respect to base-rate borrowings. As of March 31, 2015, the interest rate on the revolving credit facility was 4.25%.
Interest on borrowings under our senior secured credit facilities is payable (1) on the last day of any interest period with respect to LIBOR borrowing with an applicable interest period of three months or less, (2) every three months with respect to LIBOR borrowings with an interest period of greater than three months or (3) on the last business day of each March, June, September and December with respect to base rate borrowings. In addition, we are required to pay a commitment fee on any unutilized commitments under the revolving credit facility. The initial commitment fee rate is 0.50% per annum and varies based upon a leverage-based pricing grid. We are also required to pay customary letter of credit fees.
128
Table of Contents
Prepayments
The credit agreement requires us to prepay outstanding term loans, subject to certain exceptions, with:
| • | 50% (which percentage will be reduced to 25% and 0% if we attain certain leverage ratios) of our annual excess cash flow; |
| • | 100% of the net cash proceeds of all non-ordinary course asset sales or other dispositions of property by the borrower and its restricted subsidiaries (including insurance and condemnation proceeds, subject to de minimis thresholds), (1) if we do not reinvest those net cash proceeds in assets to be used in our business or to make certain other permitted investments, within 12 months of the receipt of such net cash proceeds or (2) if we commit to reinvest such net cash proceeds within 12 months of the receipt thereof, within 18 months of the receipt thereof; and |
| • | 100% of the net proceeds of any issuance or incurrence of debt by the borrower or any of its restricted subsidiaries, other than debt permitted under the credit agreement. |
The foregoing mandatory prepayments are used to reduce the installments of principal in such order as may be directed by us. For the year ended December 31, 2014, the Company was not required to make any mandatory prepayments.
We may voluntarily repay outstanding loans under our senior secured credit facilities at any time without premium or penalty, other than customary “breakage” costs with respect to LIBOR loans.
Amortization
We are required to make amortization installment payments on the loans under the term loan facilities in quarterly installments in aggregate annual amounts equal to 0.25% of the funded total principal amount, with the remaining outstanding amount to be payable on August 8, 2019, the maturity date for the term loan facilities. Principal amounts outstanding under the revolving credit facility will be due and payable in full on August 8, 2017, the maturity date for the revolving credit facility.
Guarantee and Security
All obligations under the credit agreement are unconditionally guaranteed by Blue Pet Products, Inc., our wholly-owned direct subsidiary of the Company and the direct parent of the borrower and, subject to certain exceptions, each of our material current and future domestic wholly-owned restricted subsidiaries. All obligations under our senior secured credit facilities, and the guarantees of those obligations, are secured by substantially all of the following assets of the borrower and each guarantor, subject to certain exceptions, including:
| • | a pledge of 100% of the capital stock of the borrower and 100% of the equity interests directly held by the borrower and each guarantor in any wholly-owned material subsidiary of the borrower or any guarantor (which pledge, in the case of any non-U.S. subsidiary of a U.S. subsidiary, will not include more than 65% of the voting stock of such non-U.S. subsidiary), subject to certain exceptions; and |
| • | a security interest in, and mortgages on, substantially all tangible and intangible assets of the borrower and each guarantor, subject to certain exceptions. |
129
Table of Contents
Certain Covenants and Events of Default
The credit agreement contains a number of covenants that, among other things, restrict the ability of the borrower and its restricted subsidiaries to (subject to certain exceptions):
| • | incur additional indebtedness or issue preferred stock; |
| • | create liens on assets; |
| • | enter into sale and leaseback transactions; |
| • | engage in mergers or consolidations; |
| • | sell assets; |
| • | pay dividends and distributions or repurchase our capital stock; |
| • | make investments, loans or advances; |
| • | repay subordinated indebtedness; |
| • | make certain acquisitions; |
| • | engage in certain transactions with affiliates; |
| • | amend material agreements governing its subordinated indebtedness; and |
| • | change its lines of business. |
The credit agreement covenants also restrict the ability of Blue Pet Products, Inc. to engage in certain mergers or consolidations. The credit agreement also contains certain customary affirmative covenants and events of default (including change of control). In addition, the credit agreement includes maintenance covenants that require compliance with certain secured leverage ratios. The availability of certain baskets and that ability to enter into certain transactions (including the ability of the borrower to pay dividends to the parent guarantor) may also be subject to compliance with such secured leverage ratios. The Company believes it was in compliance with the maintenance covenants in the credit agreement as of March 31, 2015.
130
Table of Contents
SHARES ELIGIBLE FOR FUTURE SALE
Prior to this offering, there has been no public market for shares of our common stock. We cannot predict the effect, if any, future sales of shares of common stock, or the availability for future sale of shares of common stock, will have on the market price of shares of our common stock prevailing from time to time. Future sales of substantial amounts of our common stock in the public market or the perception that such sales might occur may adversely affect market prices prevailing from time to time. Furthermore, there may be sales of substantial amounts of our common stock in the public market after the existing legal and contractual restrictions lapse. This may adversely affect the prevailing market price and our ability to raise equity capital in the future. See “Risk Factors—Risks Related to this Offering and Ownership of our Common Stock—Future sales, or the perception of future sales, by us or our existing stockholders in the public market following this offering could cause the market price of our common stock to decline.”
Upon completion of this offering, we will have a total of 196,034,108 shares of our common stock outstanding. Of the outstanding shares, the shares sold or issued in this offering will be freely tradable without restriction or further registration under the Securities Act, except that any shares held by our affiliates, as that term is defined under Rule 144 of the Securities Act, may be sold only in compliance with the limitations described below. The remaining outstanding 166,514,447 shares of common stock held by our existing stockholders after this offering will be deemed restricted securities under the meaning of Rule 144 and may be sold in the public market only if registered or if they qualify for an exemption from registration, including the exemptions pursuant to Rule 144 under the Securities Act, which we summarize below.
Lock-up Agreements
There are approximately 166,514,447 shares of common stock (including options) held by executive officers, directors and our existing stockholders, who are subject to lock-up agreements for a period of 180 days after the date of this prospectus, under which they have agreed not to sell or otherwise dispose of their shares of common stock, subject to certain exceptions. J.P. Morgan Securities LLC and Citigroup Global Markets Inc. may, in their sole discretion and at any time without notice, release all or any portion of the shares subject to any such lock-up agreements. See “Underwriting—Lock-up.”
Rule 144
In general, under Rule 144, as currently in effect, an affiliate who beneficially owns shares that were purchased from us, or any affiliate, at least six months previously, is entitled to sell, upon the expiration of the lock-up agreement described in “Underwriting,” within any three-month period beginning 180 days after the date of this prospectus, a number of shares that does not exceed the greater of 1% of our then-outstanding shares of common stock, which equals approximately 1,960,341 shares immediately after this offering, or the average reported weekly trading volume of our common stock on NASDAQ during the four calendar weeks preceding the filing of a notice of the sale on Form 144A.
Sales under Rule 144 by our affiliates or persons selling shares on behalf of our affiliates are also subject to certain manner of sale provisions, notice requirements and the availability of current public information about us. The sale of these shares, or the perception that sales will be made, may adversely affect the price of our common stock after this offering because a great supply of shares would be, or would be perceived to be, available for sale in the public market.
Following this offering, a person who is not deemed to be or have been an affiliate of ours at the time of, or at any time during the three months preceding, a sale and who has beneficially owned restricted securities within the meaning of Rule 144 for at least six months, may sell such shares subject only to the availability of current public information about us, and any such person who has beneficially owned restricted shares of our common stock for at least one year may sell such shares without restriction.
131
Table of Contents
We are unable to estimate the number of shares that will be sold under Rule 144 since this will depend on the market price for our common stock, the personal circumstances of the stockholder and other factors.
Rule 701
In general, under Rule 701, as currently in effect, any of our employees, directors, officers, consultants or advisors who purchase shares from us in connection with a compensatory stock or option plan or other written agreement before the effective date of this offering is entitled to resell such shares 90 days after the effective date of this offering in reliance on Rule 144.
Securities issued in reliance on Rule 701 are restricted securities and, subject to the contractual restrictions described above, beginning 90 days after the date of this prospectus, may be sold by persons other than “affiliates,” as defined in Rule 144, subject only to the manner of sale provisions of Rule 144 and by “affiliates” under Rule 144 without compliance with its one-year minimum holding period requirement.
Registration Statements on Form S-8
We intend to file one or more registration statements on Form S-8 under the Securities Act to register all shares of our common stock subject to outstanding stock options and the shares of stock subject to issuance under the 2015 Plan. Any such Form S-8 registration statement will automatically become effective upon filing. Accordingly shares registered under such registration statements will be available for sale in the open market. We expect that the initial registration statement on Form S-8 will cover 22,432,061 shares.
Investor Rights Agreement
For a description of rights some holders of common stock have to require us to register the shares of common stock they own, see “Certain Relationships and Related Party Transactions—Investor Rights Agreement.” Registration of these shares under the Securities Act would result in these shares becoming freely tradable without restriction under the Securities Act immediately upon effectiveness of the registration.
132
Table of Contents
CERTAIN UNITED STATES FEDERAL INCOME AND
ESTATE TAX CONSEQUENCES TO NON-U.S. HOLDERS
The following is a summary of certain United States federal income and estate tax consequences to a non-U.S. Holder (as defined below) of the purchase, ownership and disposition of our common stock as of the date hereof. Except where noted, this summary deals only with common stock that is held as capital asset.
A “non-U.S. Holder” means a person (other than a partnership) that is not for United States federal income tax purposes any of the following:
| • | an individual citizen or resident of the United States; |
| • | a corporation (or any other entity treated as a corporation for United States federal income tax purposes) created or organized in, or under the laws of, the United States, any state thereof or the District of Columbia; |
| • | an estate, the income of which is subject to United States federal income taxation regardless of its source; and |
| • | a trust, if it (1) is subject to the primary supervision of a court within the United States and one or more U.S. persons have the authority to control all substantial decisions of the trust or (2) has a valid election in effect under applicable United States Treasury regulations to be treated as a U.S. person. |
This summary is based upon provisions of the Internal Revenue Code of 1986, as amended, or Code, and regulations, rulings and judicial decisions as of the date hereof. Those authorities may be changed, perhaps retroactively, so as to result in United States federal income and estate tax consequences different from those summarized below. This summary does not address all aspects of United States federal income and estate taxes and does not deal with foreign, state, local or other tax considerations that may be relevant to non-U.S. Holders in light of their personal circumstances, including the impact of the alternative minimum tax and the Medicare contribution tax on net investment income. In addition, it does not represent a detailed description of the United States federal income consequences applicable to you if you are subject to special treatment under United States federal income tax laws (including if you are a United States expatriate, a “controlled foreign corporation”, a “passive foreign investment company” or a partnership or other pass-through entity for United States federal income tax purposes (and investors therein)). We cannot assure you that a change in law will not alter significantly the tax considerations that we describe in this summary.
If a partnership (or an entity or arrangement classified as a partnership for United States federal income tax purposes) holds our common stock, the tax treatment of a partner will generally depend upon the status of the partner and the activities of the partnership. If you are a partner of a partnership holding our common stock, you should consult your tax advisor.
IF YOU ARE CONSIDERING THE PURCHASE OF OUR COMMON STOCK, YOU SHOULD CONSULT YOUR OWN TAX ADVISORS CONCERNING THE PARTICULAR UNITED STATES FEDERAL AND ESTATE TAX CONSEQUENCES TO YOU OF THE OWNERSHIP OF OUR COMMON STOCK, AS WELL AS THE CONSEQUENCES TO YOU ARISING UNDER THE LAWS OF ANY OTHER TAXING JURISDICTION.
Dividends
As described in the section entitled “Dividend Policy,” we have no current plans to pay dividends. However, if we do make distributions of cash or property on our common stock (other than certain distributions of our common stock), such distributions will constitute dividends for United States federal income tax purposes to the extent paid from our current or accumulated earnings and profits, as determined under United States federal income tax principles. Amounts not treated as dividends for United States federal income tax purposes
133
Table of Contents
will constitute a return of capital and first be applied against and reduce a non-U.S. Holder’s adjusted tax basis in its common stock, but not below zero. Any excess will be treated as capital gain and will be treated as described below under “Gain on Disposition of Common Stock.”
Dividends paid to a non-U.S. Holder of our common stock generally will be subject to withholding of United States federal income tax at a 30% rate or such lower rate as may be specified by an applicable income tax treaty. However, dividends that are effectively connected with the conduct of a trade or business by the non-U.S. Holder within the United States (and, if required by an applicable income tax treaty, are attributable to a United States permanent establishment) are not subject to the withholding tax, provided certain certification and disclosure requirements are satisfied. Instead, such dividends are subject to United States federal income tax on a net income basis generally in the same manner as if the non-U.S. Holder were a United States person as defined under the Code. Any such effectively connected dividends received by a foreign corporation may be subject to an additional “branch profits tax” at a 30% rate or such lower rate as may be specified by an applicable income tax treaty.
A non-U.S. Holder of our common stock who wishes to claim the benefit of an applicable income tax treaty rate and avoid backup withholding, as discussed below, for dividends will be required (a) to complete the applicable Internal Revenue Service Form W-8 and certify under penalty of perjury that such holder is not a United States person as defined under the Code and is eligible for treaty benefits or (b) if our common stock is held through certain foreign intermediaries, to satisfy the relevant certification requirements of applicable United States Treasury regulations. Special certification and other requirements apply to certain non-U.S. Holders that are pass-through entities rather than corporations or individuals.
A non-U.S. Holder of our common stock eligible for a reduced rate of United States federal withholding tax pursuant to an income tax treaty may obtain a refund of any excess amounts withheld by timely filing an appropriate claim for a refund with the Internal Revenue Service.
Gain on Disposition of Common Stock
Any gain realized on the disposition of our common stock generally will not be subject to United States federal income tax unless:
| • | the gain is effectively connected with a trade or business of the non-U.S. Holder in the United States (and, if required by an applicable income tax treaty, is attributable to a United States permanent establishment of the non-U.S. Holder); |
| • | the non-U.S. Holder is an individual who is present in the United States for 183 days or more in the taxable year of that disposition, and certain other conditions are met; or |
| • | we are or have been a “United States real property holding corporation” for United States federal income tax purposes during a specific period. |
An individual non-U.S. Holder described in the first bullet point immediately above will be subject to tax on the net gain derived from the sale under regular graduated United States federal income tax rates. An individual non-U.S. Holder described in the second bullet point immediately above will be subject to a flat 30% tax on the gain derived from the sale, which may be offset by certain United States source capital losses, even though the individual is not considered a resident of the United States. If a non-U.S. Holder that is a foreign corporation falls under the first bullet point immediately above, it will be subject to tax on its net gain generally in the same manner as if it were a United States person as defined under the Code and, in addition, may be subject to the branch profits tax equal to 30% (or such lower rate as may be specified by an applicable income tax treaty) of its effectively connected earnings and profits, subject to adjustments.
We have not determined whether we are a “United States real property holding corporation” for United States federal income tax purposes. Even if we are or were to become a United States real property holding corporation, gain arising from the sale or other taxable disposition by a non-U.S. Holder of our common stock will not be subject to United States federal income tax if our common stock is treated as regularly traded on an
134
Table of Contents
established securities market, and such non-U.S. Holder owned, actually or constructively, 5% or less of our common stock throughout the shorter of the five-year period ending on the date of the sale or other taxable disposition or the non-U.S. Holder’s holding period.
U.S. Federal Estate Tax
Common stock held by an individual non-U.S. Holder at the time of death will be included in such holder’s gross estate for United States federal estate tax purposes, unless an applicable tax treaty provides otherwise.
Information Reporting and Backup Withholding Requirements
We must report annually to the Internal Revenue Service and to each non-U.S. Holder the amount of dividends paid to such holder and the tax withheld with respect to such dividends, regardless of whether withholding was required. Copies of the information returns reporting such dividends and withholding may also be made available to the tax authorities in the country in which the non-U.S. Holder resides under the provisions of an applicable income tax treaty.
A non-U.S. Holder will be subject to backup withholding for dividends paid to such holder unless such holder certifies under penalty of perjury that it is a non-U.S. Holder (and the payor does not have actual knowledge or reason to know that such holder is a United States person as defined under the Code), or such holder otherwise establishes an exemption.
Information reporting and, depending on the circumstances, backup withholding will apply to the proceeds of a sale of our common stock within the United States or conducted through certain United States-related financial intermediaries, unless the beneficial owner certifies under penalty of perjury that it is a non-U.S. Holder (and the payor does not have actual knowledge or reason to know that the beneficial owner is a United States person as defined under the Code), or such owner otherwise establishes an exemption.
Backup withholding is not an additional tax. Any amounts withheld under the backup withholding rules may be allowed as a refund or a credit against a non-U.S. Holder’s United States federal income tax liability provided the required information is timely furnished to the Internal Revenue Service.
Additional Withholding Requirements
A 30% United States federal withholding tax (under Sections 1471 to 1474 of the Code, commonly referred to as the Foreign Account Tax Compliance Act, or FATCA) may apply to any dividends and, beginning January 1, 2017, the gross proceeds from a disposition of our stock, in each case paid to (1) a “foreign financial institution” (as specifically defined in the Code), whether such foreign financial institution is the beneficial owner or an intermediary, unless such foreign financial institution agrees to verify, report and disclose its United States “account” holders (as specifically defined in the Code) and meets certain other specified requirements or (2) a non-financial foreign entity, regardless of whether such non-financial foreign entity is the beneficial owner or an intermediary, unless such entity provides certification that the beneficial owner of the payment does not have any substantial United States owners or provides the name, address and taxpayer identification number of each substantial United States owner and certain other specified requirements are met. In certain cases, the relevant foreign financial institution or non-financial foreign entity may qualify for an exemption from, or be deemed to be in compliance with, these rules. Foreign financial institutions located in jurisdictions that have an intergovernmental agreement with the United States governing FATCA may be subject to different rules. You should consult your own tax advisor regarding these requirements and whether they may be relevant to your ownership and disposition of our common stock.
The preceding discussion of United States federal income and estate tax considerations is for general information only. It is not tax advice. Each prospective investor should consult their own tax advisor regarding the particular United States federal, state, local and non-United States tax consequences of purchasing, holding and disposing of our common stock, including the consequences of any proposed change in applicable laws.
135
Table of Contents
The selling stockholders are offering 29,483,727 shares of common stock described in this prospectus through a number of underwriters. J.P. Morgan Securities LLC, Citigroup Global Markets Inc., Barclays Capital Inc., Deutsche Bank Securities Inc. and Morgan Stanley & Co. LLC are acting as joint book-running managers of the offering and J.P. Morgan Securities LLC and Citigroup Global Markets Inc. are acting as representatives of the underwriters. We and the selling stockholders have entered into an underwriting agreement with the underwriters. Subject to the terms and conditions of the underwriting agreement, the selling stockholders have agreed to sell to the underwriters, and each underwriter has severally agreed to purchase, at the public offering price less the underwriting discounts and commissions set forth on the cover page of this prospectus, the number of shares of common stock listed next to its name in the following table:
| Name |
Number of Shares |
|||
| J.P. Morgan Securities LLC |
||||
| Citigroup Global Markets Inc. |
||||
| Barclays Capital Inc. |
||||
| Deutsche Bank Securities Inc. |
||||
| Morgan Stanley & Co. LLC |
||||
| Wells Fargo Securities, LLC |
||||
| LOYAL3 Securities, Inc. |
||||
| BMO Capital Markets Corp. |
||||
|
|
|
|||
| Total |
29,483,727 | |||
The underwriters are committed to purchase all the common shares offered by the selling stockholders if they purchase any shares. The underwriting agreement also provides that if an underwriter defaults, the purchase commitments of non-defaulting underwriters may also be increased or the offering may be terminated.
The underwriters propose to offer the common shares being sold by the selling stockholders directly to the public at the initial public offering price set forth on the cover page of this prospectus and to certain dealers at that price less a concession not in excess of $ per share. Any such dealers may resell shares to certain other brokers or dealers at a discount of up to $ per share from the initial public offering price. After the initial public offering of the shares, the offering price and other selling terms may be changed by the underwriters.
We and the selling stockholders have agreed to indemnify the underwriters against certain liabilities, including liabilities under the Securities Act.
Option to Purchase Additional Shares
The underwriters have an option to buy up to 4,422,559 additional shares of common stock from the selling stockholders to cover sales of shares by the underwriters which exceed the number of shares specified in the table above. The underwriters have 30 days from the date of this prospectus to exercise this over-allotment option. Any shares purchased by the underwriters will be allocated among the selling stockholders on a pro rata basis based on the number of shares such selling stockholder has agreed to sell pursuant to the over-allotment option. If any shares are purchased with this over-allotment option, the underwriters will purchase shares in approximately the same proportion as shown in the table above. If any additional shares of common stock are purchased, the underwriters will offer the additional shares on the same terms as those on which the shares are being offered.
136
Table of Contents
Underwriting Discounts and Expenses
The underwriting fee is equal to the public offering price per share of common stock less the amount paid by the underwriters to the selling stockholders per share of common stock. The underwriting fee is $ per share of common stock sold by the selling stockholders. No underwriting fee will be paid with respect to the shares to be issued by us to certain non-management employees. See “—The LOYAL3 Platform” below. The following table shows the per share and total underwriting discounts and commissions to be paid to the underwriters assuming both no exercise and full exercise of the underwriters’ over-allotment option to purchase additional shares.
| Paid by the selling stockholders |
Without exercise of over-allotment option to purchase additional shares |
With full exercise of over- allotment option to purchase additional shares |
||||||
| Per Share |
$ | $ | ||||||
| Total |
$ | $ | ||||||
We estimate that the total expenses of this offering, including registration, filing and listing fees, printing fees and legal and accounting expenses, but excluding the underwriting discounts and commissions, will be approximately $6.6 million. We have agreed to reimburse the underwriters for certain expenses in an amount up to $90,000.
A prospectus in electronic format may be made available on the web sites maintained by one or more underwriters, or selling group members, if any, participating in the offering. The underwriters may agree to allocate a number of shares to underwriters and selling group members for sale to their online brokerage account holders. Internet distributions will be allocated by the representatives to underwriters and selling group members that may make Internet distributions on the same basis as other allocations.
Lock-up
We will agree that we will not, subject to certain exceptions, (1) offer, pledge, announce the intention to sell, sell, contract to sell, sell any option or contract to purchase, purchase any option or contract to sell, grant any option, right or warrant to purchase, or otherwise transfer or dispose of, directly or indirectly, or file with the SEC a registration statement under the Securities Act relating to, any shares of our common stock or securities convertible into or exchangeable or exercisable for any shares of our common stock, or publicly disclose the intention to make any offer, sale, pledge, disposition or filing, or (2) enter into any swap or other arrangement that transfers all or a portion of the economic consequences associated with the ownership of any shares of common stock or any such other securities (regardless of whether any of these transactions are to be settled by the delivery of shares of common stock or such other securities, in cash or otherwise), in each case without the prior written consent of J.P. Morgan Securities LLC and Citigroup Global Markets Inc. for a period of 180 days after the date of this prospectus, other than the shares of our common stock to be sold or issued hereunder and any shares of our common stock issued upon the exercise of options granted under our existing equity incentive plans.
Our executive officers, directors and all our existing stockholders, including the selling stockholders, will enter into lock-up agreements with the underwriters prior to the commencement of this offering pursuant to which each of these persons or entities, for a period of 180 days after the date of this prospectus, may not, without the prior written consent of J.P. Morgan Securities LLC and Citigroup Global Markets Inc., subject to certain exceptions, (1) offer, pledge, announce the intention to sell, sell, contract to sell, sell any option or contract to purchase, purchase any option or contract to sell, grant any option, right or warrant to purchase, or
137
Table of Contents
otherwise transfer or dispose of, directly or indirectly, any shares of our common stock or any securities convertible into or exercisable or exchangeable for our common stock (including, without limitation, common stock or such other securities which may be deemed to be beneficially owned by such directors, executive officers, managers and members in accordance with the rules and regulations of the SEC and securities which may be issued upon exercise of a stock option or warrant), (2) enter into any swap or other agreement that transfers, in whole or in part, any of the economic consequences of ownership of the common stock or such other securities, whether any such transaction described in clause (1) or (2) above is to be settled by delivery of common stock or such other securities, in cash or otherwise, or (3) make any demand for or exercise any right with respect to the registration of any shares of our common stock or any security convertible into or exercisable or exchangeable for our common stock, other than the shares sold or issued in this offering.
Listing
We have applied to have our common stock approved for listing on NASDAQ under the symbol “BUFF.”
Price Stabilization and Short Positions
In connection with this offering, the underwriters may engage in stabilizing transactions, which involves making bids for, purchasing and selling shares of common stock in the open market for the purpose of preventing or retarding a decline in the market price of the common stock while this offering is in progress. These stabilizing transactions may include making short sales of the common stock, which involves the sale by the underwriters of a greater number of shares of common stock than they are required to purchase in this offering, and purchasing shares of common stock on the open market to cover positions created by short sales. Short sales may be “covered” shorts, which are short positions in an amount not greater than the underwriters’ over-allotment option referred to above, or may be “naked” shorts, which are short positions in excess of that amount. The underwriters may close out any covered short position either by exercising their over-allotment option, in whole or in part, or by purchasing shares in the open market. In making this determination, the underwriters will consider, among other things, the price of shares available for purchase in the open market compared to the price at which the underwriters may purchase shares through the over-allotment option. A naked short position is more likely to be created if the underwriters are concerned that there may be downward pressure on the price of the common stock in the open market that may adversely affect investors who purchase in this offering. To the extent that the underwriters create a naked short position, they will purchase shares in the open market to cover the position.
The underwriters have advised us that, pursuant to Regulation M of the Securities Act, they may also engage in other activities that stabilize, maintain or otherwise affect the price of the common stock, including the imposition of penalty bids. This means that if the representatives of the underwriters purchase common stock in the open market in stabilizing transactions or to cover short sales, the representatives can require the underwriters that sold those shares as part of this offering to repay the underwriting discount received by them.
These activities may have the effect of raising or maintaining the market price of the common stock or preventing or retarding a decline in the market price of the common stock, and, as a result, the price of the common stock may be higher than the price that otherwise might exist in the open market. If the underwriters commence these activities, they may discontinue them at any time. The underwriters may carry out these transactions on NASDAQ, in the over-the-counter market or otherwise.
New Issue of Securities
Prior to this offering, there has been no public market for our common stock. The initial public offering price will be determined by negotiations between us and the representatives of the underwriters. In determining the initial public offering price, we and the representatives of the underwriters expect to consider a number of factors including:
| • | the information set forth in this prospectus and otherwise available to the representatives; |
138
Table of Contents
| • | our prospects and the history and prospects for the industry in which we compete; |
| • | an assessment of our management; |
| • | our prospects for future earnings; |
| • | the general condition of the securities markets at the time of this offering; |
| • | the recent market prices of, and demand for, publicly traded common stock of generally comparable companies; and |
| • | other factors deemed relevant by the underwriters and us. |
Neither we, the selling stockholders nor the underwriters can assure investors that an active trading market will develop for our common shares, or that the shares will trade in the public market at or above the initial public offering price.
Other than in the United States, no action has been taken by us or the underwriters that would permit a public offering of the securities offered by this prospectus in any jurisdiction where action for that purpose is required. The securities offered by this prospectus may not be offered or sold, directly or indirectly, nor may this prospectus or any other offering material or advertisements in connection with the offer and sale of any such securities be distributed or published in any jurisdiction, except under circumstances that will result in compliance with the applicable rules and regulations of that jurisdiction. Persons into whose possession this prospectus comes are advised to inform themselves about and to observe any restrictions relating to the offering and the distribution of this prospectus. This prospectus does not constitute an offer to sell or a solicitation of an offer to buy any securities offered by this prospectus in any jurisdiction in which such an offer or a solicitation is unlawful.
The underwriters have informed us that they do not expect to sell more than 5% of the common stock in the aggregate to accounts over which they exercise discretionary authority.
The LOYAL3 Platform
At our request, the underwriters have reserved up to 5% of the shares of common stock offered by this prospectus to be offered to certain non-management employees and our customers, partners and individual investors through the LOYAL3 platform. Any purchases of shares in this offering through the LOYAL3 platform will be at the initial public offering price, will be fee-free to investors and will be in dollar amounts that may include fractional shares. The LOYAL3 platform is designed to facilitate participation of individual purchasers in initial public offerings in amounts starting at $100. Individual investors in the United States who are interested in purchasing shares of common stock in this offering though the LOYAL3 platform may go to LOYAL3’s website for information about how to become a customer of LOYAL3, which is required to purchase shares of common stock through the LOYAL3 platform. Sales of our common stock by investors using the LOYAL3 platform will be completed through a batch or combined order process typically only once per day. The LOYAL3 platform and information on the LOYAL3 website do not form a part of this prospectus. The LOYAL3 platform is administered by LOYAL3 Securities, Inc., which is a U.S.-registered broker-dealer unaffiliated with the Company. LOYAL3 Securities, Inc. is acting as a co-manager for our offering.
Up to 35,934 of the shares offered through the LOYAL3 platform will be allocated among approximately 1,700 non-management employees in amounts determined by us. Such employees will not be required to pay for these shares, and we will make payments to such employees in amounts estimated by us to be sufficient to pay the income and payroll taxes arising from the receipt of the shares (valued at the initial public offering price) and the associated taxes on such payments. These shares will not be subject to lock-up agreements with the underwriters and may be resold in the public market immediately after this offering.
139
Table of Contents
Notice to Prospective Investors in the United Kingdom
This document is only being distributed to and is only directed at (1) persons who are outside the United Kingdom, (2) to investment professionals falling within Article 19(5) of the Financial Services and Markets Act 2000 (Financial Promotion) Order 2005, or Order, or (3) high net worth entities, and other persons to whom it may lawfully be communicated, falling with Article 49(2)(a) to (d) of the Order (all such persons together being referred to as “relevant persons”). The securities are only available to, and any invitation, offer or agreement to subscribe, purchase or otherwise acquire such securities will be engaged in only with, relevant persons. Any person who is not a relevant person should not act or rely on this document or any of its contents.
Notice to Prospective Investors in the European Economic Area
In relation to each Member State of the European Economic Area which has implemented the Prospectus Directive (each, a “Relevant Member State”), from and including the date on which the European Union Prospectus Directive (the “EU Prospectus Directive”) was implemented in that Relevant Member State (the “Relevant Implementation Date”) an offer of securities described in this prospectus may not be made to the public in that Relevant Member State prior to the publication of a prospectus in relation to the shares which has been approved by the competent authority in that Relevant Member State or, where appropriate, approved in another Relevant Member State and notified to the competent authority in that Relevant Member State, all in accordance with the EU Prospectus Directive, except that, with effect from and including the Relevant Implementation Date, an offer of securities described in this prospectus may be made to the public in that Relevant Member State at any time:
| • | to any legal entity which is a qualified investor as defined under the EU Prospectus Directive; |
| • | to fewer than 100 or, if the Relevant Member State has implemented the relevant provision of the 2010 PD Amending Directive, 150 natural or legal persons (other than qualified investors as defined in the EU Prospectus Directive); or |
| • | in any other circumstances falling within Article 3(2) of the EU Prospectus Directive, provided that no such offer of securities described in this prospectus shall result in a requirement for the publication by us of a prospectus pursuant to Article 3 of the EU Prospectus Directive. |
For the purposes of this provision, the expression an “offer of securities to the public” in relation to any securities in any Relevant Member State means the communication in any form and by any means of sufficient information on the terms of the offer and the securities to be offered so as to enable an investor to decide to purchase or subscribe for the securities, as the same may be varied in that Member State by any measure implementing the EU Prospectus Directive in that Member State. The expression “EU Prospectus Directive” means Directive 2003/71/EC (and any amendments thereto, including the 2010 PD Amending Directive, to the extent implemented in the Relevant Member State) and includes any relevant implementing measure in each Relevant Member State, and the expression “2010 PD Amending Directive” means Directive 2010/73/EU.
Notice to Prospective Investors in France
Neither this prospectus nor any other offering material relating to the shares described in this prospectus has been submitted to the clearance procedures of the Autorité des Marchés Financiers or of the competent authority of another member state of the European Economic Area and notified to the Autorité des Marchés Financiers. The shares have not been offered or sold and will not be offered or sold, directly or indirectly, to the public in France. Neither this prospectus nor any other offering material relating to the shares has been or will be:
| • | released, issued, distributed or caused to be released, issued or distributed to the public in France; or |
| • | used in connection with any offer for subscription or sale of the shares to the public in France. |
140
Table of Contents
Such offers, sales and distributions will be made in France only:
| • | to qualified investors (investisseurs qualifiés) and/or to a restricted circle of investors (cercle restreint d’investisseurs), in each case investing for their own account, all as defined in, and in accordance with, articles L.411-2, D.411-1, D.411-2, D.734-1, D.744-1, D.754-1 and D.764-1 of the French Code monétaire et financier; |
| • | to investment services providers authorized to engage in portfolio management on behalf of third parties; or |
| • | in a transaction that, in accordance with article L.411-2-II-1°-or-2°-or 3° of the French Code monétaire et financier and article 211-2 of the General Regulations (Règlement Général) of the Autorité des Marchés Financiers, does not constitute a public offer (appel public à l’épargne). |
The shares may be resold directly or indirectly, only in compliance with articles L.411-1, L.411-2, L.412-1 and L.621-8 through L.621-8-3 of the French Code monétaire et financier.
Notice to Prospective Investors in Hong Kong
The shares may not be offered or sold in Hong Kong by means of any document other than (i) in circumstances which do not constitute an offer to the public within the meaning of the Companies Ordinance (Cap. 32, Laws of Hong Kong), (ii) to “professional investors” within the meaning of the Securities and Futures Ordinance (Cap. 571, Laws of Hong Kong) and any rules made thereunder or (iii) in other circumstances which do not result in the document being a “prospectus” within the meaning of the Companies Ordinance (Cap. 32, Laws of Hong Kong) and no advertisement, invitation or document relating to the shares may be issued or may be in the possession of any person for the purpose of issue (in each case whether in Hong Kong or elsewhere), which is directed at, or the contents of which are likely to be accessed or read by, the public in Hong Kong (except if permitted to do so under the laws of Hong Kong) other than with respect to shares which are or are intended to be disposed of only to persons outside Hong Kong or only to “professional investors” within the meaning of the Securities and Futures Ordinance (Cap. 571, Laws of Hong Kong) and any rules made thereunder.
Notice to Prospective Investors in Japan
The shares offered in this prospectus have not been registered under the Securities and Exchange Law of Japan. Shares have not been offered or sold and will not be offered or sold, directly or indirectly, in Japan or to or for the account of any resident of Japan, except (i) pursuant to an exemption from the registration requirements of the Securities and Exchange Law and (ii) in compliance with any other applicable requirements of Japanese law.
Notice to Prospective Investors in Singapore
This prospectus has not been registered as a prospectus with the Monetary Authority of Singapore. Accordingly, this prospectus and any other document or material in connection with the offer or sale, or invitation for subscription or purchase, of the shares may not be circulated or distributed, nor may the shares be offered or sold, or be made the subject of an invitation for subscription or purchase, whether directly or indirectly, to persons in Singapore other than (i) to an institutional investor under Section 274 of the Securities and Futures Act, Chapter 289 of Singapore (the “SFA”), (ii) to a relevant person pursuant to Section 275(1), or any person pursuant to Section 275(1A), and in accordance with the conditions specified in Section 275 of the SFA or (iii) otherwise pursuant to, and in accordance with the conditions of, any other applicable provision of the SFA, in each case subject to compliance with conditions set forth in the SFA.
141
Table of Contents
Where the shares are subscribed or purchased under Section 275 of the SFA by a relevant person which is:
| • | a corporation (which is not an accredited investor (as defined in Section 4A of the SFA)) the sole business of which is to hold investments and the entire share capital of which is owned by one or more individuals, each of whom is an accredited investor; or |
| • | a trust (where the trustee is not an accredited investor) whose sole purpose is to hold investments and each beneficiary of the trust is an individual who is an accredited investor, |
shares, debentures and units of shares and debentures of that corporation or the beneficiaries’ rights and interest (howsoever described) in that trust shall not be transferred within six months after that corporation or that trust has acquired the shares pursuant to an offer made under Section 275 of the SFA except:
| • | to an institutional investor (for corporations, under Section 274 of the SFA) or to a relevant person defined in Section 275(2) of the SFA, or to any person pursuant to an offer that is made on terms that such shares, debentures and units of shares and debentures of that corporation or such rights and interest in that trust are acquired at a consideration of not less than S$200,000 (or its equivalent in a foreign currency) for each transaction, whether such amount is to be paid for in cash or by exchange of securities or other assets, and further for corporations, in accordance with the conditions specified in Section 275 of the SFA; |
| • | where no consideration is or will be given for the transfer; or |
| • | where the transfer is by operation of law. |
Notice to Prospective Investors in Australia
No prospectus or other disclosure document (as defined in the Corporations Act 2001 (Cth) of Australia (“Corporations Act”)) in relation to the common stock has been or will be lodged with the Australian Securities & Investments Commission (“ASIC”). This document has not been lodged with ASIC and is only directed to certain categories of exempt persons. Accordingly, if you receive this document in Australia:
(a) you confirm and warrant that you are either:
(i) a “sophisticated investor” under section 708(8)(a) or (b) of the Corporations Act;
(ii) a “sophisticated investor” under section 708(8)(c) or (d) of the Corporations Act and that you have provided an accountant’s certificate to us which complies with the requirements of section 708(8)(c)(i) or (ii) of the Corporations Act and related regulations before the offer has been made;
(iii) a person associated with the company under section 708(12) of the Corporations Act; or
(iv) a “professional investor” within the meaning of section 708(11)(a) or (b) of the Corporations Act, and to the extent that you are unable to confirm or warrant that you are an exempt sophisticated investor, associated person or professional investor under the Corporations Act any offer made to you under this document is void and incapable of acceptance; and
(b) you warrant and agree that you will not offer any of the common stock for resale in Australia within 12 months of that common stock being issued unless any such resale offer is exempt from the requirement to issue a disclosure document under section 708 of the Corporations Act.
142
Table of Contents
Other Relationships
Certain of the underwriters and their affiliates have provided in the past to us and our affiliates and may provide from time to time in the future certain commercial banking, financial advisory, investment banking and other services for us and such affiliates in the ordinary course of their business, for which they have received and may continue to receive customary fees and commissions. For instance, affiliates of certain of the underwriters are lenders, and in some cases agents or managers for the lenders under our senior secured credit facilities. In addition, from time to time, certain of the underwriters and their affiliates may effect transactions for their own account or the account of customers, and hold on behalf of themselves or their customers, long or short positions in our debt or equity securities or loans, and may do so in the future.
143
Table of Contents
The validity of the issuance of the shares of common stock offered hereby will be passed upon for Blue Buffalo Pet Products, Inc. by Simpson Thacher & Bartlett LLP, New York, New York. Certain legal matters relating to this offering will be passed upon for the underwriters by Latham & Watkins LLP, New York, New York.
The consolidated financial statements as of December 31, 2014 and 2013 and for each of the three years in the period ended December 31, 2014 included in this prospectus and registration statement have been audited by KPMG LLP, an independent registered public accounting firm, as set forth in their report thereon appearing elsewhere herein, and are included in reliance upon such report given on the authority of said firm as experts in accounting and auditing.
WHERE YOU CAN FIND ADDITIONAL INFORMATION
We have filed with the SEC a registration statement on Form S-1 under the Securities Act with respect to the shares of common stock offered by this prospectus. This prospectus does not contain all of the information set forth in the registration statement and its exhibits, certain portions of which are omitted as permitted by the rules and regulations of the SEC. For further information pertaining to us and our common stock, we refer you to the registration statement, including its exhibits and the financial statements, notes and schedules filed as a part of that registration statement. Statements contained in this prospectus regarding the contents of any contract or other document referred to in those documents are not necessarily complete, and in each instance we refer you to the copy of the contract or other document filed as an exhibit to the registration statement or other document. Each of these statements is qualified in all respects by this reference.
You may read and copy the registration statement and its exhibits and schedules at the SEC’s public reference room at 100 F Street, N.E., Washington, D.C. 20549. You also may obtain information on the operation of the public reference room by calling the commission at 1-800-SEC-0330. The SEC maintains a web site at www.sec.gov that contains reports, proxy and information statements and other information regarding registrants, such as Blue Buffalo Pet Products, Inc., that file electronically with the SEC.
As a result of this offering, we will become subject to the information and reporting requirements of the Securities Exchange Act of 1934 and, in accordance with this law, will file periodic reports, proxy statements and other information with the SEC. These periodic reports, proxy statements and other information will be available for inspection and copying at the SEC’s public reference facilities and the website of the SEC referred to above. We also maintain a website at www.bluebuffalo.com. Upon completion of this offering, you may access these materials free of charge as soon as reasonably practicable after they are electronically filed with, or furnished to, the SEC. Information contained on our website is not a part of this prospectus and the inclusion of our website address in this prospectus is an inactive textual reference only.
144
Table of Contents
INDEX TO CONSOLIDATED FINANCIAL STATEMENTS
| Page | ||
| Audited Consolidated Financial Statements of Blue Buffalo Pet Products, Inc. |
||
| F-2 | ||
| Consolidated Balance Sheets as of December 31, 2013 and 2014 |
F-3 | |
| F-4 | ||
| F-5 | ||
| F-6 | ||
| F-7 | ||
| Unaudited Condensed Consolidated Financial Statements of Blue Buffalo Pet Products, Inc. |
||
| Condensed Consolidated Balance Sheets as of December 31, 2014 and March 31, 2015 (unaudited) |
F-24 | |
| F-25 | ||
| F-26 | ||
| F-27 | ||
| Notes to Condensed Consolidated Financial Statements (unaudited) |
F-28 | |
F-1
Table of Contents
Report of Independent Registered Public Accounting Firm
The Board of Directors and Stockholders
Blue Buffalo Pet Products, Inc.:
We have audited the accompanying consolidated balance sheets of Blue Buffalo Pet Products, Inc. and subsidiaries, as of December 31, 2013 and 2014, and the related consolidated statements of income, changes in stockholders’ deficit, and cash flows for each of the years in the three-year period ended December 31, 2014. These consolidated financial statements are the responsibility of the Company’s management. Our responsibility is to express an opinion on these consolidated financial statements based on our audits.
We conducted our audits in accordance with the standards of the Public Company Accounting Oversight Board (United States). Those standards require that we plan and perform the audit to obtain reasonable assurance about whether the financial statements are free of material misstatement. An audit includes examining, on a test basis, evidence supporting the amounts and disclosures in the financial statements. An audit also includes assessing the accounting principles used and significant estimates made by management, as well as evaluating the overall financial statement presentation. We believe that our audits provide a reasonable basis for our opinion.
In our opinion, the consolidated financial statements referred to above present fairly, in all material respects, the financial position of Blue Buffalo Pet Products, Inc. and subsidiaries as of December 31, 2013 and 2014, and the results of their operations and their cash flows for each of the years in the three-year period ended December 31, 2014, in conformity with U.S. generally accepted accounting principles.
/s/ KPMG LLP
Stamford, Connecticut
March 11, 2015, except as to
Note 2, which is as of July 7, 2015
F-2
Table of Contents
Blue Buffalo Pet Products, Inc.
Consolidated Balance Sheets
(dollars in thousands, except for share data)
| December 31, 2013 |
December 31, 2014 |
|||||||
| ASSETS |
||||||||
| Current assets: |
||||||||
| Cash and cash equivalents |
$ | 42,874 | $ | 95,788 | ||||
| Receivables, net |
52,375 | 78,620 | ||||||
| Inventories |
67,874 | 88,620 | ||||||
| Prepaid expenses and other current assets |
1,475 | 3,351 | ||||||
| Deferred income taxes |
2,082 | 5,696 | ||||||
|
|
|
|
|
|||||
| Total current assets |
166,680 | 272,075 | ||||||
| Restricted cash |
123 | 473 | ||||||
| Property, plant, and equipment, net |
85,830 | 113,863 | ||||||
| Deferred income taxes |
1,322 | — | ||||||
| Deferred debt issuance costs, net |
439 | 317 | ||||||
| Other assets |
403 | 444 | ||||||
|
|
|
|
|
|||||
| Total assets |
$ | 254,797 | $ | 387,172 | ||||
|
|
|
|
|
|||||
| LIABILITIES AND STOCKHOLDERS’ DEFICIT |
||||||||
| Current liabilities: |
||||||||
| Current maturities of long-term debt |
$ | 3,960 | $ | 3,960 | ||||
| Accounts payable |
23,253 | 33,163 | ||||||
| Other current liabilities |
22,763 | 27,013 | ||||||
|
|
|
|
|
|||||
| Total current liabilities |
49,976 | 64,136 | ||||||
| Long-term debt |
391,057 | 387,097 | ||||||
| Deferred income taxes |
— | 17,128 | ||||||
| Other long-term liabilities |
4,849 | 6,108 | ||||||
|
|
|
|
|
|||||
| Total liabilities |
445,882 | 474,469 | ||||||
| Commitments and contingencies |
||||||||
| Stockholders’ deficit: |
||||||||
| Common stock, voting; $0.01 par value; 207,060,000 shares authorized; 195,720,894 and 195,743,154 shares issued and outstanding at December 31, 2013 and December 31, 2014, respectively |
1,957 | 1,957 | ||||||
| Additional paid-in capital |
55,826 | 57,683 | ||||||
| Accumulated deficit |
(248,868 | ) | (146,937 | ) | ||||
|
|
|
|
|
|||||
| Total stockholders’ deficit |
(191,085 | ) | (87,297 | ) | ||||
|
|
|
|
|
|||||
| Total liabilities and stockholders’ deficit |
$ | 254,797 | $ | 387,172 | ||||
|
|
|
|
|
|||||
The accompanying notes are an integral part of the consolidated financial statements.
F-3
Table of Contents
Blue Buffalo Pet Products, Inc.
Consolidated Statements of Income
(dollars in thousands, except for share data)
| Year Ended December 31, | ||||||||||||
| 2012 | 2013 | 2014 | ||||||||||
| Net sales |
$ | 522,999 | $ | 719,509 | $ | 917,760 | ||||||
| Cost of sales |
311,050 | 421,897 | 550,893 | |||||||||
|
|
|
|
|
|
|
|||||||
| Gross profit |
211,949 | 297,612 | 366,867 | |||||||||
| Selling, general, and administrative expenses |
93,539 | 138,986 | 187,864 | |||||||||
|
|
|
|
|
|
|
|||||||
| Operating income |
118,410 | 158,626 | 179,003 | |||||||||
| Interest expense |
10,209 | 20,640 | 13,887 | |||||||||
| Loss on extinguishment of debt |
— | 15,918 | — | |||||||||
| Interest income |
(152 | ) | (125 | ) | (173 | ) | ||||||
|
|
|
|
|
|
|
|||||||
| Income before income taxes |
108,353 | 122,193 | 165,289 | |||||||||
| Provision for income taxes |
42,853 | 43,957 | 63,358 | |||||||||
|
|
|
|
|
|
|
|||||||
| Net income |
$ | 65,500 | $ | 78,236 | $ | 101,931 | ||||||
|
|
|
|
|
|
|
|||||||
| Basic net income per common share |
$ | 0.34 | $ | 0.40 | $ | 0.52 | ||||||
| Diluted net income per common share |
$ | 0.33 | $ | 0.40 | $ | 0.52 | ||||||
| Dividends declared and paid per common share |
$ | 2.05 | $ | — | $ | — | ||||||
| Basic weighted average number of shares outstanding |
195,298,147 | 195,619,943 | 195,735,309 | |||||||||
| Diluted weighted average number of shares outstanding |
195,707,975 | 196,559,084 | 197,852,932 | |||||||||
The accompanying notes are an integral part of the consolidated financial statements.
F-4
Table of Contents
Blue Buffalo Pet Products, Inc.
Consolidated Statement of Changes in Stockholders’ Deficit
(dollars in thousands, except for share data)
| Common shares outstanding |
Common stock |
Additional paid-in capital |
Notes receivable |
(Accumulated deficit) retained earnings |
Total | |||||||||||||||||||
| Balance at December 31, 2011 |
$ | 195,127,220 | $ | 1,951 | $ | 53,782 | $ | (1,545 | ) | $ | 7,396 | $ | 61,584 | |||||||||||
| Exercise of stock options |
336,735 | 3 | 134 | — | — | 137 | ||||||||||||||||||
| Stock-based compensation expense |
— | — | 366 | — | — | 366 | ||||||||||||||||||
| Notes receivable (Note 7) |
— | — | — | 1,545 | — | 1,545 | ||||||||||||||||||
| Dividends declared |
— | — | — | — | (400,000 | ) | (400,000 | ) | ||||||||||||||||
| Net income |
— | — | — | — | 65,500 | 65,500 | ||||||||||||||||||
|
|
|
|
|
|
|
|
|
|
|
|
|
|||||||||||||
| Balance at December 31, 2012 |
195,463,955 | 1,954 | 54,282 | — | (327,104 | ) | (270,868 | ) | ||||||||||||||||
| Exercise of stock options |
256,939 | 3 | 124 | — | — | 127 | ||||||||||||||||||
| Stock-based compensation expense |
— | — | 1,420 | — | — | 1,420 | ||||||||||||||||||
| Net income |
— | — | — | — | 78,236 | 78,236 | ||||||||||||||||||
|
|
|
|
|
|
|
|
|
|
|
|
|
|||||||||||||
| Balance at December 31, 2013 |
195,720,894 | 1,957 | 55,826 | — | (248,868 | ) | (191,085 | ) | ||||||||||||||||
| Exercise of stock options |
22,260 | — | 37 | — | — | 37 | ||||||||||||||||||
| Stock-based compensation expense |
— | 1,820 | — | — | 1,820 | |||||||||||||||||||
| Net income |
— | — | — | — | 101,931 | 101,931 | ||||||||||||||||||
|
|
|
|
|
|
|
|
|
|
|
|
|
|||||||||||||
| Balance at December 31, 2014 |
$ | 195,743,154 | $ | 1,957 | $ | 57,683 | $ | — | $ | (146,937 | ) | $ | (87,297 | ) | ||||||||||
|
|
|
|
|
|
|
|
|
|
|
|
|
|||||||||||||
The accompanying notes are an integral part of the consolidated financial statements.
F-5
Table of Contents
Blue Buffalo Pet Products, Inc.
Consolidated Statements of Cash Flows
(dollars in thousands)
| Year Ended December 31, | ||||||||||||
| 2012 | 2013 | 2014 | ||||||||||
| Cash flows from operating activities: |
||||||||||||
| Net income |
$ | 65,500 | $ | 78,236 | $ | 101,931 | ||||||
| Adjustments to reconcile net income to net cash provided by operating activities: |
||||||||||||
| Depreciation and amortization |
1,207 | 1,286 | 4,860 | |||||||||
| Amortization of debt issuance costs and accretion of original issue discount |
740 | 2,511 | 122 | |||||||||
| Stock-based compensation |
366 | 1,420 | 1,820 | |||||||||
| Deferred compensation |
389 | (181 | ) | 115 | ||||||||
| Loss on extinguishment of debt |
— | 14,928 | — | |||||||||
| Loss on disposal of fixed assets |
— | 168 | 55 | |||||||||
| Deferred income taxes |
1,326 | (230 | ) | 14,835 | ||||||||
| Insurance settlement receivable |
2,275 | — | — | |||||||||
| Effect of changes in operating assets and liabilities: |
||||||||||||
| Receivables |
(12,223 | ) | (17,264 | ) | (26,245 | ) | ||||||
| Inventories |
(4,606 | ) | (23,062 | ) | (20,746 | ) | ||||||
| Prepaid expenses and other assets |
2,256 | (864 | ) | (1,917 | ) | |||||||
| Accounts payable |
4,328 | 2,612 | 9,910 | |||||||||
| Other liabilities |
2,799 | 9,442 | 5,395 | |||||||||
|
|
|
|
|
|
|
|||||||
| Net cash provided by operating activities |
64,357 | 69,002 | 90,135 | |||||||||
|
|
|
|
|
|
|
|||||||
| Cash flows from investing activities: |
||||||||||||
| Capital expenditures |
(22,787 | ) | (63,507 | ) | (32,948 | ) | ||||||
| Restricted cash |
— | 203 | (350 | ) | ||||||||
|
|
|
|
|
|
|
|||||||
| Net cash used in investing activities |
(22,787 | ) | (63,304 | ) | (33,298 | ) | ||||||
|
|
|
|
|
|
|
|||||||
| Cash flows from financing activities: |
||||||||||||
| Proceeds from issuance of debt |
393,000 | — | — | |||||||||
| Payment of debt issuance costs |
(6,879 | ) | (4,738 | ) | — | |||||||
| Principal payments on long-term debt |
(1,000 | ) | (3,983 | ) | (3,960 | ) | ||||||
| Dividends paid |
(398,389 | ) | — | — | ||||||||
| Proceeds from exercise of stock options |
71 | 127 | 37 | |||||||||
|
|
|
|
|
|
|
|||||||
| Net cash used in financing activities |
(13,197 | ) | (8,594 | ) | (3,923 | ) | ||||||
|
|
|
|
|
|
|
|||||||
| Net increase in cash and cash equivalents |
28,373 | (2,896 | ) | 52,914 | ||||||||
| Cash and cash equivalents at beginning of period |
17,397 | 45,770 | 42,874 | |||||||||
|
|
|
|
|
|
|
|||||||
| Cash and cash equivalents at end of period |
$ | 45,770 | $ | 42,874 | $ | 95,788 | ||||||
|
|
|
|
|
|
|
|||||||
The accompanying notes are an integral part of the consolidated financial statements.
F-6
Table of Contents
Blue Buffalo Pet Products, Inc.
Notes to Consolidated Financial Statements
Note 1 – The Company
Blue Buffalo Pet Products, Inc. (“BBPP”) and together with its subsidiaries, the “Company,” “we,” “us,” “its,” and “our”) conducts its business exclusively through its wholly-owned operating subsidiary, Blue Buffalo Company, Ltd. (“Blue”) (formerly The Blue Buffalo Company, LLC) and its subsidiaries. Blue was formed in August 2002 and is the parent company of three wholly-owned subsidiaries, Great Plains Leasing, LLC, Heartland Pet Foods Manufacturing, Inc. (“Heartland”), and Sierra Pet Products, LLC. Blue and its subsidiaries develop, produce, market, and sell pet food under the Blue Life Protection Formula, Blue Wilderness, Blue Basics, and Blue Freedom lines. Our products are produced domestically at our Heartland facility and through contract manufacturers for distribution to retailers in specialty channels throughout the United States of America and Canada.
In July 2012, Blue formed Heartland for the purpose of commencing internal manufacturing operations to eventually supplement its contract manufacturers. We recently commenced manufacturing operations at our Heartland facility in Joplin, Missouri in September 2014.
Also in July 2012, BBPP and Blue Pet Products, Inc. (“BPP”) were established through a series of stock exchanges and transfers. In connection therewith, the existing stockholders of Blue became the stockholders of BBPP with the same pro-rata ownership percentage previously held in Blue and whereby BBPP owns 100% of the common stock of BPP and BPP owns 100% of the common stock of Blue.
Note 2 – Basis of Presentation
Principles of Consolidation
The accompanying consolidated financial statements include the accounts of BBPP and its wholly-owned subsidiaries. All intercompany balances and transactions have been eliminated in consolidation.
Stock Split
On July 7, 2015, the Company effected a 4.2-for-1 stock split of all outstanding shares of the Company’s common stock. All share, option, and per share information presented in the accompanying consolidated financial statements have been adjusted to reflect the stock split on a retroactive basis for all periods presented and all share information is rounded down to the nearest whole share after reflecting the stock split.
Reclassifications
Certain prior period amounts have been reclassified to conform to the current period presentation.
Use of Estimates
The preparation of financial statements in conformity with accounting principles generally accepted in the United States of America requires management to make estimates and assumptions that affect the reported amounts of assets and liabilities and disclosure of contingent assets and liabilities, at the date of the financial statements, and the reported amounts of revenues and expenses during the reporting period. Actual results could differ from those estimates.
Cash and Cash Equivalents
Cash and cash equivalents include all cash balances and highly liquid investments purchased with original maturities of three months or less. Cash and cash equivalents consist of both interest and non-interest bearing accounts. At December 31, 2014, we had three accounts in excess of the federal deposit insurance limit.
F-7
Table of Contents
Blue Buffalo Pet Products, Inc.
Notes to Consolidated Financial Statements (Continued)
Restricted Cash
We are required to maintain a cash deposit with the lender of our standby letters of credit equal to the amount of the outstanding letters of credit. As of December 31, 2013 and 2014, the Company had outstanding irrevocable standby letters of credit in the amount of approximately $0.1 million and $0.5 million, respectively, issued by TD Bank. These letters of credit are being maintained as security for performance of certain of the Company’s operating lease obligations. The letters of credit are automatically renewed on an annual basis sixty days prior to expiration.
Receivables
Trade receivables consist of uncollateralized, non-interest bearing customer obligations due under normal trade terms. Other receivables consist primarily of reimbursable amounts due from co-manufacturers for packaging of $7.2 million and $4.4 million and income tax receivables of $7.9 million and $18.2 million at December 31, 2013 and 2014, respectively. We also maintain an allowance for doubtful accounts for estimated losses resulting from the inability of our customers to make payments and other actual and estimated deductions. If the financial condition of our customers were to deteriorate, resulting in an impairment of their ability to make payments, an additional allowance could be required. Past due balances are reviewed individually for collectability. As of December 31, 2013 and 2014, the allowance for doubtful accounts was immaterial.
Receivables consisted of the following at December 31:
| (dollars in thousands) | 2013 | 2014 | ||||||
| Trade receivables, net |
$ | 37,236 | $ | 54,647 | ||||
| Other receivables |
15,139 | 23,973 | ||||||
|
|
|
|
|
|||||
| Total |
$ | 52,375 | $ | 78,620 | ||||
|
|
|
|
|
|||||
We are exposed to concentration of credit risk by our customers. Approximately 80% and 72% of gross trade accounts receivable at December 31, 2013 and December 31, 2014, respectively, were from our two largest customers. In 2013 and 2014, two customers accounted for 10% or more of our consolidated net sales. Sales to these customers represented 58% and 20% of net sales for the year ended December 31, 2012, 53% and 22% of net sales for the year ended December 31, 2013, and 49% and 24% of net sales for the year ended December 31, 2014.
Inventories
Inventories, consisting principally of finished goods available for resale and packaging materials, are stated at the lower of cost or market value. We provide reserves for estimated obsolescence based on specific identification. If assumptions about future demand change or actual market conditions are less favorable than those projected by management, we may require additional reserves.
Property, Plant, and Equipment
Property, plant, and equipment are stated at cost, less accumulated depreciation and amortization. Depreciation and amortization are recognized on a straight-line basis over the estimated useful life of the assets as follows: computer equipment over 3 years, computer software over 5 years, furniture and fixtures over 5 years, machinery and equipment from 5 to 15 years, and buildings, building improvements and land improvements over 40 years. Computer software consists primarily of third-party software acquired and developed for internal use and is accounted for in accordance with accounting guidance on internal use software. Leasehold improvements and fixed assets purchased under capital leases are amortized over the lesser of the asset life or related lease term.
F-8
Table of Contents
Blue Buffalo Pet Products, Inc.
Notes to Consolidated Financial Statements (Continued)
When fixed assets are sold or otherwise disposed of, the accounts are relieved of the original cost of the assets and the related accumulated depreciation, and any resulting profit or loss is credited or charged to operations.
Long-lived assets are reviewed for impairment whenever events or changes in circumstances indicate that the carrying amount of such assets may not be recoverable. Long-lived assets are considered impaired if the estimated undiscounted future cash flows of the asset or asset group are less than the carrying amount. For impaired assets, we measure and recognize a loss equal to the difference between the carrying amount of the asset or asset group and its estimated fair value.
Deferred Debt Issuance Costs
Debt issuance costs are deferred and amortized to interest expense using the effective interest method. During the third quarter of 2012, in connection with our entering into and borrowing under the facility (see Note 5), we recorded approximately $5.7 million of debt issuance costs to be amortized over the weighted-average term of the credit facility (7 years). In addition, in connection with the amendment to the credit facility during the fourth quarter of 2012, we recorded an additional $1.2 million of debt issuance costs, which are being amortized over the remaining term of the term loan facility (6.7 years).
During the first quarter of 2013, the Company amended its credit facility and recorded approximately $4.7 million of additional deferred debt issuance costs, which are being amortized over the remaining life of the credit facility. In addition, the Company recorded $0.5 million related to bank and legal fees paid to third parties to execute the amendments, which is included in interest expense.
During the fourth quarter of 2013, the Company executed another amendment which resulted in extinguishment accounting and as a result, approximately $9.2 million of unamortized debt issuance costs were written off to interest expense (see Note 5).
Amortization expense for deferred debt issuance costs was approximately $1.6 million and $0.1 million for the years ended December 31, 2013 and 2014, respectively.
Segment Reporting
Operating segments are components of an enterprise for which separate financial information is available that is evaluated regularly by the chief operating decision maker in deciding how to allocate resources and in assessing performance. Utilizing these criteria, we manage our business on the basis of one reportable operating segment.
Net sales in the United States (“US”) for 2012, 2013, and 2014 were $502.0 million, $694.4 million, and $886.6 million, respectively. Net sales outside the US for 2012, 2013, and 2014, denominated in US dollars, were $21.0 million, $25.1 million, and $31.2 million, respectively. All of our long-lived assets are located in the United States.
Revenue Recognition
Revenue consists of sales to customers, net of returns, discounts, and trade promotions. Sales are recognized when persuasive evidence of an arrangement exists, the product has been shipped, when title passes, when all risks and rewards of ownership have transferred, the sales price is fixed or determinable, and collectability is reasonably assured. In certain cases, in which we retain the risk of loss during shipment, revenue recognition does not occur until the product has reached the specified customer.
Trade promotions, consisting primarily of temporary price reductions, consumer coupons, product placement fees, advertising allowances, and other rebates are offered through various programs to customers and consumers. Sales are recorded net of trade promotion spending, which is recognized at the later of the date on
F-9
Table of Contents
Blue Buffalo Pet Products, Inc.
Notes to Consolidated Financial Statements (Continued)
which the Company recognizes the related revenue or the date on which the Company offers the incentive. Most of these arrangements have terms of approximately one year. Accruals for expected payouts under these programs are included in other current liabilities on the accompanying consolidated balance sheets.
Shipping and Handling
Shipping and handling costs include related third-party labor, warehousing, and shipping costs, shipping supplies, and certain distribution overhead. Our shipping and handling costs are included within cost of sales in the accompanying consolidated statements of income.
Vendor Concentration
We are exposed to concentration of supplier risk with our vendors. While the Company purchases products from many different manufacturers and suppliers, approximately 73%, 69%, and 68% of the Company’s cost of sales in 2012, 2013, and 2014, respectively, were derived from products purchased from the Company’s five largest manufacturers.
Advertising
Advertising costs, including production costs of television, print, and other advertisements, are expensed as incurred, shown or distributed. Advertising costs are included in selling, general, and administrative expenses in the accompanying consolidated statements of income and approximated $32.9 million, $57.7 million, and $81.1 million for the years ended December 31, 2012, 2013, and 2014, respectively.
Research and Development
We engage in a variety of research and development activities principally to develop new products and improve the quality of existing products. Research and development costs are expensed as incurred. Research and development costs were $1.6 million, $4.6 million, and $7.6 million for the years ended December 31, 2012, 2013, and 2014, respectively, and are reported within selling, general and administrative expenses in the accompanying consolidated statements of income.
Stock-based Compensation
In accordance with the fair value recognition provisions of accounting guidance on share-based payments, we recognize stock-based compensation expense for our share-based payments based on the fair value of the awards at the grant date. The fair value of our stock option grants is determined using the Black-Scholes option pricing model. Stock-based compensation expense is recognized on a straight-line basis over the vesting period of the stock-based award. See Note 12 for further details.
Income Taxes
Income taxes are accounted for under the asset and liability method. Deferred tax assets and liabilities are recognized for the future tax consequences attributable to differences between the financial statement carrying amounts of existing assets and liabilities and their respective tax bases and operating loss and tax credit carryforwards. Deferred tax assets and liabilities are measured using enacted tax rates expected to apply to taxable income in the years in which those temporary differences are expected to be recovered or settled. The effect on deferred tax assets and liabilities of a change in tax rates is recognized in income in the period that includes the enactment date. Valuation allowances are recorded to reduce deferred tax assets when it is more likely than not that a tax benefit will not be realized.
F-10
Table of Contents
Blue Buffalo Pet Products, Inc.
Notes to Consolidated Financial Statements (Continued)
We recognize the tax benefit from an uncertain tax position only if it is more likely than not that the tax position will be sustained on examination by the taxing authorities. The tax position is measured as the largest amount of benefit that is greater than fifty percent likely of being realized upon ultimate settlement. Where applicable, interest and penalties related to unrecognized tax benefits are recognized within income tax expense, respectively.
Supplemental Cash Flow Information
Interest paid in cash approximated $9.5 million, $20.0 million, and $15.7 million for the years ended December 31, 2012, 2013, and 2014, respectively. Income taxes paid in cash approximated $40.3 million, $50.4 million, and $60.4 million for the years ended December 31, 2012, 2013, and 2014, respectively.
The Company has engaged in non-cash financing activities related to the issuance of notes to employees and the related settlement of those notes in 2012 (see Note 7 for further details).
Recently Adopted Accounting Pronouncements
In July 2013, the Financial Accounting Standards Board (“FASB”) issued ASU No. 2013-11, “Presentation of an Unrecognized Tax Benefit When a Net Operating Loss Carryforward, a Similar Tax Loss, or a Tax Credit Carryforward Exists,” which amends ASC 740, “Income Taxes.” The amendments provide guidance on the financial statement presentation of an unrecognized tax benefit as either a reduction of a deferred tax asset or as a liability, when a net operating loss carryforward, similar tax loss or a tax credit carryforward exists. The amendments are effective for fiscal years, and interim periods within those years, beginning after December 15, 2013 and may be applied on either a prospective or retrospective basis with early adoption permitted. As of December 31, 2013, the Company has adopted these provisions prospectively, which did not have a material impact on the Company’s consolidated financial statements.
In May 2014, the Financial Accounting Standards Board issued ASU 2014-09, Revenue Recognition, which provides for a single five-step model to be applied to all revenue contracts with customers. The standard also requires additional financial statement disclosures that will enable users to understand the nature, amount, timing and uncertainty of revenue and cash flows relating to customer contracts. Companies have an option to use either a retrospective approach or cumulative effect adjustment approach to implement the standard. There is no option for early adoption. The provisions of this guidance will be effective as of the beginning of our 2017 fiscal year. We are currently evaluating the impact of the guidance on our financial statements and have not yet selected a transition approach to implement the standard.
Note 3 – Inventories
Inventories consisted of the following at December 31:
| (dollars in thousands) | 2013 | 2014 | ||||||
| Finished goods |
$ | 65,629 | $ | 83,904 | ||||
| Work in process |
— | 90 | ||||||
| Raw materials |
— | 3,136 | ||||||
| Packaging and supplies |
2,245 | 1,490 | ||||||
|
|
|
|
|
|||||
| Total |
$ | 67,874 | $ | 88,620 | ||||
|
|
|
|
|
|||||
F-11
Table of Contents
Blue Buffalo Pet Products, Inc.
Notes to Consolidated Financial Statements (Continued)
Note 4 – Property, Plant, and Equipment
Property, plant, and equipment consisted of the following at December 31:
| (dollars in thousands) | 2013 | 2014 | ||||||
| Computer software |
$ | 440 | $ | 8,056 | ||||
| Computer equipment |
1,828 | 3,589 | ||||||
| Buildings |
— | 58,846 | ||||||
| Machinery and equipment |
2,381 | 44,702 | ||||||
| Furniture and fixtures |
1,306 | 1,429 | ||||||
| Leasehold improvements |
642 | 1,051 | ||||||
| Buildings improvements |
— | 86 | ||||||
| Land |
346 | 346 | ||||||
| Land improvements |
— | 784 | ||||||
| Construction in progress |
81,302 | 2,169 | ||||||
|
|
|
|
|
|||||
| 88,245 | 121,058 | |||||||
| Accumulated depreciation and amortization |
(2,415 | ) | (7,195 | ) | ||||
|
|
|
|
|
|||||
| Total |
$ | 85,830 | $ | 113,863 | ||||
|
|
|
|
|
|||||
Depreciation and amortization expense was approximately $1.2 million for the year ended December 31, 2012, approximately $1.3 million for the year ended December 31, 2013, and approximately $4.9 million for the year ended December 31, 2014.
During 2013, Heartland and Jasper County, Missouri (“Jasper”) entered into an agreement pursuant to which Jasper agreed to issue up to an aggregate principal amount of $55 million of industrial revenue bonds (“Bonds”) to be purchased by Heartland. Jasper is using the proceeds from the Bonds to purchase manufacturing equipment from Heartland, which will then be leased back to Heartland. As Heartland will become the owner of the equipment at the end of the lease term, the lease meets the requirements of a capital lease and the equipment is being recorded as property, plant, and equipment. The Company has the right and intends to set-off any obligation to make payments under the lease agreements with the proceeds due from the Bonds. As of December 31, 2013 and 2014, Jasper had issued, and Heartland had purchased, $16.6 million and $55.0 million, respectively, of industrial revenue bonds and Jasper had purchased from, and leased back to, Heartland certain manufacturing equipment for a corresponding amount.
Note 5 – Long-term Debt
Long-term debt consisted of the following at December 31:
| (dollars in thousands) | 2013 | 2014 | ||||||
| Term loan |
$ | 395,017 | $ | 391,057 | ||||
| Less current maturities |
(3,960 | ) | (3,960 | ) | ||||
|
|
|
|
|
|||||
| Total long-term debt |
$ | 391,057 | $ | 387,097 | ||||
|
|
|
|
|
|||||
On August 8, 2012, the Company entered into a $390 million credit facility (the “Facility”) with Citibank, N.A. as the administrative agent, Citigroup Global Markets Inc. and Morgan Stanley Senior Funding, Inc. as joint lead arrangers, and Morgan Stanley Senior Funding, Inc. as syndication agent, and other financial institutions. The Facility originally consisted of a $350 million term loan facility and a $40 million revolving credit facility
F-12
Table of Contents
Blue Buffalo Pet Products, Inc.
Notes to Consolidated Financial Statements (Continued)
($10 million sub-limit for letters of credit and a swing line sub-limit of $5 million). The Facility is secured by 100% of Blue’s assets and is guaranteed by its parent BPP. The term loan facility expires on August 8, 2019 and the revolving credit facility expires on August 8, 2017.
As of December 31, 2012, the term loan is presented net of the related unamortized original issue discount (“OID”), which was $7.0 million at issuance. Accretion of OID is included in interest expense and was approximately $0.9 million for the year ended December 31, 2013. In connection with the Facility, the Company recorded approximately $5.7 million of deferred debt issuance costs. Both the OID and deferred debt issuance costs are being amortized over the weighted-average term of the Facility (approximately 7 years) using the effective interest method. The proceeds from the term loan were used to fund a special dividend of $350 million to shareholders.
On December 6, 2012, the Company and its lenders amended the Facility to, among other things, provide additional term loan borrowings of $50 million and allow for the distribution of dividends of $50 million. The proceeds from the additional term loan borrowings were used to fund a special dividend of $50 million to shareholders. In connection with this amendment, the Company recorded $1.2 million of additional deferred debt issuance costs to be amortized over the remaining term of the term loan facility (approximately 6.7 years) using the effective interest method.
On February 15, 2013, the Company and its lenders entered into two amendments to re-price both the term loan and revolving credit facility (the “Amended Facility”). The term loan amendment reduced the applicable margin on the $399 million principal amount of term loan borrowings by 150 basis points and the interest rate floor by 25 basis points. The revolving credit facility amendment reduced the applicable margin on revolver borrowings by 150 basis points (there were no borrowings under this facility). In connection with the amendments, the Company incurred and recorded approximately $4.7 million of additional deferred debt issuance costs, which are being amortized over the remaining life of the Amended Facility. In addition, the Company recorded $0.5 million related to bank and legal fees paid to third parties to execute the amendments, which is included in interest expense for the year ended December 31, 2013.
On December 9, 2013, the Company and its lenders entered into an amendment to re-price the term loan. The term loan amendment reduced the applicable margin on the $396 million principal amount of term loan borrowings by 75 basis points. The revolving credit facility remained unchanged. In accordance with accounting guidance on debt modifications and extinguishments, the amended term loan was deemed substantially different and as such the modification has been treated as an extinguishment. In connection with the extinguishment, the Company recorded a loss on extinguishment of debt of $15.9 million, which consisted of unamortized debt issuance costs of $9.2 million, unamortized OID of $5.7 million, and new debt issuance costs of $1.0 million.
At December 31, 2013, we had $395.0 million of term loan borrowings (fair value of $399.9 million) at an effective interest rate of 5.27% and no outstanding borrowings under the revolving credit facility. At December 31, 2014, we had $391.0 million of term loan borrowings (fair value of $386.2 million) at an effective interest rate of 4.03% and no outstanding borrowings under the revolving credit facility. Principal payments on the term loan borrowings are due and payable in quarterly installments of approximately $1.0 million with the then expected remaining balance of $373.2 million due on August 8, 2019.
Term loan borrowings bear interest at a rate per annum equal to an applicable margin plus, at our option, either (i) a base rate determined by reference to the highest of (a) the Federal Funds rate plus 0.50%, (b) the prime rate of Citibank, N.A., (c) the LIBOR rate determined by reference to the cost of funds for U.S. dollar deposits for an interest period of one month adjusted for certain additional costs, plus 1.00% and (d) a floor of 2.00% or (ii) a LIBOR rate determined by reference to the costs of funds for U.S. dollar deposits for the interest period relevant
F-13
Table of Contents
Blue Buffalo Pet Products, Inc.
Notes to Consolidated Financial Statements (Continued)
to such borrowing adjusted for certain additional costs provided that LIBOR shall not be lower than 1.00%. The applicable margin for borrowings under the term loan is 2.75% with respect to LIBOR borrowings and 1.75% with respect to base-rate borrowings. At December 31, 2013 and December 31, 2014, the interest rate on the term loan was 4.00% and 3.75%, respectively.
Borrowings under the revolving credit facility bear interest at a rate per annum equal to an applicable margin based upon a leverage-based pricing grid, plus, at our option, either (i) a base rate determined by reference to the highest of (a) the Federal Funds rate plus 0.50%, (b) the prime rate of Citibank, N.A., (c) the LIBOR rate determined by reference to the cost of funds for U.S. dollar deposits for an interest period of one month adjusted for certain additional costs, plus 1.00% or (ii) a LIBOR rate determined by reference to the costs of funds for U.S. dollar deposits for the interest period relevant to such borrowing adjusted for certain additional costs. The applicable margin for borrowings under the revolving credit facility is 3.25% with respect to LIBOR borrowings and 2.25% with respect to base-rate borrowings. At December 31, 2013 and December 31, 2014, the interest rate on the credit facility was 4.25%.
Interest on term loan borrowings as well as any outstanding borrowings under the revolving credit facility is payable quarterly. In addition, we are required to pay a commitment fee on any unutilized commitments under the revolving credit facility. The initial commitment fee rate is 0.50% per annum and varies based upon a leverage-based pricing grid. During 2013, the Company incurred total interest expense of $22.9 million, of which $2.3 million was capitalized during the period related to the Heartland facility build out. During 2014, the Company incurred total interest expense of $15.9 million, of which $2.0 million was capitalized during the period related to the Heartland facility build out.
The Amended Facility contains both restrictive operating and financial covenants, including a secured leverage ratio (defined as, with certain adjustments, the ratio of (i) the Company’s indebtedness less unrestricted cash and cash equivalents up to $40 million to (ii) consolidated net income before interest, taxes, depreciation, and amortization) not to exceed (a) December 31, 2014 and March 31, 2015, 4.25:1.00, (b) June 30, 2015 and September 30, 2015, 4.00:1.00, and (c) if such periods ends on or after December 31, 2015, 3.75:1.00. The Amended Facility also sets forth mandatory and optional prepayment conditions, including an annual excess cash flow requirement, as defined, that may result in our use of cash to reduce our debt obligations (effective for the year ended December 31, 2013). For the years ended December 31, 2013 and 2014, the Company was not required to make an excess cash flow payment. As of December 31, 2014, the Company believes it was in compliance with its financial debt covenants.
Provisions in the Amended Facility currently restrict the ability of our operating subsidiary, Blue, from paying dividends to its ultimate parent company BBPP, unless Blue meets certain leverage ratio and minimum availability requirements under the Amended Facility.
Note 6 – Other Current Liabilities
Other current liabilities consisted of the following at December 31:
| (dollars in thousands) | 2013 | 2014 | ||||||
| Accrued bonuses |
$ | 9,555 | $ | 5,126 | ||||
| Trade promotions |
9,083 | 10,919 | ||||||
| Deferred compensation – current portion |
1,410 | 1,338 | ||||||
| Other current liabilities |
2,715 | 9,630 | ||||||
|
|
|
|
|
|||||
| Total |
$ | 22,763 | $ | 27,013 | ||||
|
|
|
|
|
|||||
F-14
Table of Contents
Blue Buffalo Pet Products, Inc.
Notes to Consolidated Financial Statements (Continued)
Note 7 – Notes Receivable
Historically, the Company issued loans to certain employees for the express purpose of providing the employees with the financial ability to exercise vested incentive stock options. Employees with incentive stock options were provided the opportunity to borrow from the Company an amount up to 80% of the total exercise price of options that they elected to exercise during the year. Accordingly, these transactions were recorded as an offset to stockholders’ equity.
The notes accrued interest at the Mid-Term Applicable Federal Rate published by the Internal Revenue Service (1.27% at December 31, 2011) through maturity in December 2015, at which time the total balance of principal and interest was due.
During 2010, the Company issued loans totaling approximately $0.7 million. During 2011, the Company issued loans totaling approximately $0.9 million. At December 31, 2011, the balance of the receivable was approximately $1.5 million.
During the first half of 2012, the Company issued additional loans totaling approximately $0.1 million. In connection with the special dividend paid to shareholders on August 15, 2012, all outstanding notes and accrued interest in the amount of $1.6 million were settled. See Note 11 for further details on the special dividends.
Note 8 – Income Taxes
The provision for (benefit from) income taxes consisted of the following:
| For the years ended | ||||||||||||
| (dollars in thousands) | December 31, 2012 |
December 31, 2013 |
December 31, 2014 |
|||||||||
| Current tax provision: |
||||||||||||
| Federal |
$ | 34,747 | $ | 40,127 | $ | 39,576 | ||||||
| State |
6,780 | 4,060 | 8,947 | |||||||||
|
|
|
|
|
|
|
|||||||
| Total current provision |
41,527 | 44,187 | 48,523 | |||||||||
|
|
|
|
|
|
|
|||||||
| Deferred tax provision: |
||||||||||||
| Federal |
1,216 | (520 | ) | 16,037 | ||||||||
| State |
110 | 290 | (1,202 | ) | ||||||||
|
|
|
|
|
|
|
|||||||
| Total deferred provision (benefit) |
1,326 | (230 | ) | 14,835 | ||||||||
|
|
|
|
|
|
|
|||||||
| Total provision |
$ | 42,853 | $ | 43,957 | $ | 63,358 | ||||||
|
|
|
|
|
|
|
|||||||
F-15
Table of Contents
Blue Buffalo Pet Products, Inc.
Notes to Consolidated Financial Statements (Continued)
A reconciliation of the federal statutory rate to our effective rate is as follows:
| For the years ended | ||||||||||||
| December 31, 2012 |
December 31, 2013 |
December 31, 2014 |
||||||||||
| Federal statutory income tax rate |
35.0 | % | 35.0 | % | 35.0 | % | ||||||
| State income taxes, net of federal income tax benefit |
4.2 | 2.2 | 2.1 | |||||||||
| Non-deductible expenses |
0.4 | 0.3 | 0.3 | |||||||||
| Unrecognized tax benefits |
— | (1.0 | ) | 1.3 | ||||||||
| Other |
(0.1 | ) | (0.5 | ) | (0.4 | ) | ||||||
|
|
|
|
|
|
|
|||||||
| Total |
39.5 | % | 36.0 | % | 38.3 | % | ||||||
|
|
|
|
|
|
|
|||||||
The Company and its subsidiaries file income tax returns in the United States and in states and various local jurisdictions where the Company has nexus. Additionally as a result of new business activities in Canada, Mexico and Japan, foreign tax filings will be required but are not expected to be material to the 2014 tax provision.
In the normal course of business, the Company is subject to examination by taxing authorities and as of December 31, 2014 and the date of this report, the Company’s 2011 income tax return was being audited by the Internal Revenue Service (“IRS”). During 2013, the IRS completed its audit of 2010 with an immaterial assessment. There are also various state tax examinations in progress primarily attributable to state nexus matters relating to prior year amended tax returns which have been considered in the Company’s position for uncertain tax benefits. In general, tax years 2011 through 2014 are subject to an examination for U.S. Federal and tax years 2010 through 2014 for some state and local taxing jurisdictions.
As of December 31, 2012, there were no liabilities for income taxes associated with uncertain tax positions. As of December 31, 2013 and 2014, the liability for income taxes associated with uncertain tax positions was $2.7 million and $4.8 million, respectively. The following is a reconciliation of the beginning and ending amount of unrecognized tax benefits (which excludes federal benefits of state taxes, interest, penalties, and the impact of state net operating loss carryforwards):
| (dollars in thousands) | ||||
| Balance at December 31, 2012 |
$ | — | ||
| Increases in uncertain tax benefits as a result of tax positions taken in the prior year |
2,924 | |||
| Increases in uncertain tax benefits as a result of tax positions taken in the current year |
1,959 | |||
|
|
|
|||
| Balance at December 31, 2013 |
4,883 | |||
| Increases in uncertain tax benefits as a result of tax positions taken in the prior year |
206 | |||
| Increases in uncertain tax benefits as a result of tax positions taken in the current year |
2,429 | |||
|
|
|
|||
| Balance at December 31, 2014 |
$ | 7,518 | ||
|
|
|
|||
The Company recognizes interest related to unrecognized tax benefits and penalties related to unrecognized tax benefits as a component of income tax expense. For the year ended December 31, 2013, the Company recorded
F-16
Table of Contents
Blue Buffalo Pet Products, Inc.
Notes to Consolidated Financial Statements (Continued)
approximately $0.1 million and $0.2 million in interest and penalties related to its unrecognized tax benefits, respectively. For the year ended December 31, 2014, the Company recorded approximately $0.3 million of both interest and penalties related to its unrecognized tax benefits.
Components of deferred tax assets and liabilities were as follows:
| (dollars in thousands) | December 31, 2013 |
December 31, 2014 |
||||||
| Deferred tax assets: |
||||||||
| Inventories |
$ | 1,734 | $ | 1,869 | ||||
| Accrued liabilities |
448 | 307 | ||||||
| Transaction costs |
— | 1,085 | ||||||
| Stock-based compensation |
464 | 1,024 | ||||||
| Capitalized debt |
— | 301 | ||||||
| Deferred compensation |
1,219 | 746 | ||||||
| Research and development |
172 | 41 | ||||||
| State net operating loss carryforwards |
111 | 2,072 | ||||||
| State tax credits |
— | 325 | ||||||
| Other |
24 | 322 | ||||||
|
|
|
|
|
|||||
| Total deferred tax assets |
4,172 | 8,092 | ||||||
|
|
|
|
|
|||||
| Deferred tax liabilities: |
||||||||
| Property, plant, and equipment |
(768 | ) | (18,176 | ) | ||||
| Bond premiums |
— | (1,348 | ) | |||||
|
|
|
|
|
|||||
| Total deferred tax liabilities |
(768 | ) | (19,524 | ) | ||||
|
|
|
|
|
|||||
| Net deferred tax (liabilities) assets |
$ | 3,404 | $ | (11,432 | ) | |||
|
|
|
|
|
|||||
Our state net operating loss carryforwards (“NOLs”) will begin to expire in 2032. The majority of the NOLs relate to our Heartland operations which we expect to use in the coming year.
Amounts recognized in the accompanying consolidated balance sheets are as follows:
| (dollars in thousands) | December 31, 2013 |
December 31, 2014 |
||||||
| Current deferred tax assets |
$ | 2,082 | $ | 5,696 | ||||
| Non-current deferred tax assets |
2,090 | 2,396 | ||||||
| Non-current deferred tax liabilities |
(768 | ) | (19,524 | ) | ||||
|
|
|
|
|
|||||
| Total net deferred tax assets (liabilities) |
$ | 3,404 | $ | (11,432 | ) | |||
|
|
|
|
|
|||||
As of December 31, 2013 and 2014, the Company had not provided for any valuation allowance on its deferred tax assets. In evaluating the Company’s ability to realize its deferred tax assets, management considers whether it is more likely than not that some or all of the deferred tax assets will not be realized. Management also considers the projected reversal of deferred tax liabilities and projected future taxable income in making this assessment. Based upon this assessment, management believes it is more likely than not that the Company will realize the benefits of these deductible differences.
F-17
Table of Contents
Blue Buffalo Pet Products, Inc.
Notes to Consolidated Financial Statements (Continued)
Note 9 – Fair Value Measurements
The Company’s financial instruments consist of cash and cash equivalents, accounts receivable, accounts payable, other current liabilities, deferred compensation, and debt, none of which are measured at fair value on a recurring basis. The carrying amounts of cash and cash equivalents, accounts receivable, accounts payable, and other current liabilities approximate their fair value due to the short-term nature of these financial instruments. The Company’s long-term financial liabilities consist of the long-term portion of deferred compensation and long-term debt. The long-term portion of deferred compensation is recorded at the present value of the liability (which approximates fair value) under the Growth Plan (defined in Note 10) and is included in other liabilities on the accompanying consolidated balance sheets. Long-term debt is recorded on the consolidated balance sheets at issuance price and adjusted for any applicable unamortized discounts or premiums.
The Company accounts for its fair value measurements in accordance with accounting guidance which defines fair value, establishes a framework for measuring fair value, and expands disclosures about fair value measurements. The fair value hierarchy for disclosure of fair value measurements is as follows:
Level 1 – Quoted prices in active markets for identical assets or liabilities
Level 2 – Quoted prices for similar assets and liabilities in active markets or inputs that are observable
Level 3 – Inputs that are unobservable (for example, cash flow modeling inputs based on assumptions)
At December 31, 2013 and December 31, 2014, we had approximately $45.7 million and $90.1 million, respectively, of cash invested in money market deposit accounts which were included in cash and cash equivalents on the accompanying consolidated balance sheets (Level 1).
The Company reports transfers in and out of Levels 1, 2, and 3, as applicable, using the fair value of the individual securities as of the beginning of the reporting period in which the transfer(s) occurred. There were no transfers in or out of Level 1, 2, or 3 during the years ended December 31, 2013 and 2014.
Assets that are measured at fair value on a nonrecurring basis relate primarily to our tangible fixed assets. For these assets, we do not periodically adjust carrying value to fair value, except in the event of impairment. Should we determine that an impairment has occurred, the carrying value would be reduced to fair value and the difference is recorded as an impairment loss in our consolidated statements of income.
As of December 31, 2013, the carrying value of the Company’s outstanding borrowings under the credit facility was approximately $395.0 million as compared to a fair value of $399.9 million (Level 2). As of December 31, 2014, the carrying value of the Company’s outstanding borrowings under the credit facility was approximately $391.0 million as compared to a fair value of $386.2 million (Level 2). The estimated fair value of the Company’s debt was based primarily on reported market values, recently completed market transactions and estimates based upon interest rates, maturities, and credit risk.
Note 10 – Employee Benefit Plans
The Company sponsors a defined contribution plan. This plan covers employees who are at least 18 years of age and have completed a 6-month time period of employment. Employees are eligible to participate in the plan on the first day of the plan year month coinciding with the date in which the employee satisfies the eligibility requirements. The plan provides for the option of employee contributions up to statutory limits, of which we match up to 4% of the employees contributions, at a rate of 100% on the first 3% and 50% on the next 2%. Company contributions to the plan totaled approximately $0.3 million, $0.4 million, and $0.8 million, for the years ended December 31, 2012, 2013, and 2014, respectively.
F-18
Table of Contents
Blue Buffalo Pet Products, Inc.
Notes to Consolidated Financial Statements (Continued)
In 2006, the Company adopted the Blue Buffalo Company, Ltd. Phantom Equity Plan (“Growth Plan”) under which selected employees were granted “growth units.” Growth units were valued at $1 at inception of the Growth Plan and had fluctuated in value in proportion to the Company’s revenue growth year-over-year. All growth unit grants were at the discretion of the Company’s Board of Directors and vested over a three year term from the date of grant. The vested units were payable in cash over a four year term upon termination of employment, subject to modification at the discretion of management. There were 100,000 units authorized under the Growth Plan.
In March 2012, the Board of Directors amended the Growth Plan to: (i) accelerate the vesting of all unvested units previously granted, (ii) freeze the value of the growth units and the Growth Plan, (iii) provide for full payment of the frozen value of the units to participants in the form of quarterly installments ending on June 30, 2016, and (iv) terminate the Growth Plan. As of December 31, 2013 and December 31, 2014, the remaining obligations under this plan were approximately $3.3 million and $2.0 million (approximates present value), respectively, and are included in other current and long-term liabilities on the accompanying consolidated balance sheets.
As of December 31, 2013 and 2014, there were 96,667 growth units outstanding, all of which were fully vested as of December 31, 2012. During 2013 and 2014, there were no new grants of growth units or forfeitures. The Company recorded a deferred compensation expense of $0.4 million for the year ended December 31, 2012, deferred compensation benefit of $0.2 million for the year ended December 31, 2013, and a deferred compensation expense of $0.1 million for the year ended December 31, 2014.
Note 11 – Stockholder’s Deficit
During 2012, in connection with the Company’s leveraged recapitalization and new credit facility (and subsequent amendment), the Board of Directors approved the payments of special dividends. On August 15, 2012, the Board of Directors declared a special dividend of $1.79 per share to shareholders of record on such date for a total of $350 million. In addition, on December 17, 2012, the Board of Directors declared an additional special dividend of $0.26 per share to shareholders of record on such date for a total of $50 million.
As of December 31, 2014, the total amount of Blue Buffalo Pet Products, Inc.’s authorized capital stock consisted of 207,060,000 shares of common stock, $0.01 par value per share. As of December 31, 2014, 195,743,154 shares of common stock were issued and outstanding.
Note 12 – Stock-Based Compensation
Under the Company’s 2012 Blue Buffalo Pet Products, Inc. Stock Purchase and Option Plan (the “Plan”), the Board of Directors is authorized to award incentive stock options (ISOs and non-qualified), stock appreciation rights (SARs), restricted stock, performance units, performance-based stock awards, dividend equivalent rights, and other stock-based grants. Participation in the Plan is limited to key employees, officers, and directors.
On March 4, 2013, the Plan was amended to increase the maximum number of shares of stock available under the Plan by 210,000 shares to 14,242,061 shares (the “Amended Plan”). As of December 31, 2014, there were 5,230,642 shares of common stock reserved under the Amended Plan. As of December 31, 2014, the maximum number of shares available for grant under the Amended Plan was 102,669.
Stock Options
The Company uses the Black-Scholes option-pricing model to determine the fair value of stock options on the date of grant. The fair value of stock options, which are subject to pro-rata vesting, is expensed on a straight-line basis over the vesting period of the stock options.
F-19
Table of Contents
Blue Buffalo Pet Products, Inc.
Notes to Consolidated Financial Statements (Continued)
The Company uses a third party valuation specialist to assist it in the estimation of the fair value of its common stock. The Company believes these valuations to be appropriate; however, the valuation of the equity of any private company involves various estimates and assumptions that may differ from actual values. If available, the Company bases its common stock value on actual transactions or other transactions that are representative of stock value. The expected volatility assumption is based on the combination of the industry index for pet food wholesalers and the volatility of the Company’s largest customer. The risk-free interest rate for the expected term of the option is based on the U.S. Treasury implied yield at the date of grant. The weighted-average expected term is determined with reference to historical exercise and post-vesting cancellation experience, and the vesting period and contractual term of the awards.
The following are the weighted-average assumptions used for grants issued under the Plan:
| For the years ended | ||||||||||||
| December 31, 2012 |
December 31, 2013 |
December 31, 2014 |
||||||||||
| Volatility |
30.64 | % | 30.88 | % | 32.84 | % | ||||||
| Risk-free interest rate |
1.13 | % | 1.52 | % | 2.16 | % | ||||||
| Expected term (years) |
6.5 | 6.5 | 6.5 | |||||||||
| Dividend yield |
— | — | — | |||||||||
| Grant-date fair value |
$ | 1.81 | $ | 2.14 | $ | 5.15 | ||||||
The following table summarizes stock-based award activity during the year and also presents stock options outstanding and exercisable as of December 31, 2014 (dollars in millions, except for per share data):
| Number of Shares |
Weighted Average Exercise Price Per Share |
Weighted Average Remaining Contractual Life |
Aggregate Intrinsic Value |
|||||||||||||
| Outstanding, December 31, 2013 |
4,640,979 | $ | 5.60 | 8.98 | ||||||||||||
| Granted |
155,400 | $ | 13.81 | 9.22 | ||||||||||||
| Exercised |
(22,260 | ) | $ | 1.68 | 7.17 | |||||||||||
| Forfeited |
(89,880 | ) | $ | 6.10 | 8.13 | |||||||||||
| Expired |
(12,600 | ) | $ | 5.60 | 7.96 | |||||||||||
|
|
|
|||||||||||||||
| Outstanding, December 31, 2014 |
4,671,639 | $ | 5.88 | 8.03 | $ | 48.9 | ||||||||||
|
|
|
|||||||||||||||
| Exercisable, December 31, 2014 |
1,685,871 | $ | 5.64 | 7.98 | $ | 18.0 | ||||||||||
During 2014, total granted stock options included 67,939 non-qualified and 87,461 ISO options. The intrinsic value of options exercised during 2012, 2013, and 2014 was $1.7 million, $3.4 million, and $0.3 million, respectively. There were no non-qualified options exercised in 2013 and 2014. The benefits of tax deductions in excess of the grant date fair value resulting from the exercise of non-qualified options was not material to the years ended December 31, 2013 and 2014.
F-20
Table of Contents
Blue Buffalo Pet Products, Inc.
Notes to Consolidated Financial Statements (Continued)
Unrecognized stock-based compensation expense related to outstanding unvested stock options is expected to be recognized in the Company’s statements of income as follows (by fiscal year):
| (dollars in thousands) | ||||
| 2015 |
$ | 1,745 | ||
| 2016 |
1,749 | |||
| 2017 |
1,688 | |||
| 2018 |
234 | |||
| 2019 |
32 | |||
|
|
|
|||
| Total |
$ | 5,448 | ||
|
|
|
|||
Note 13 – Earnings Per Share
The details of the computation of basic and diluted earnings per common share are as follows:
| Twelve months ended December 31, | ||||||||||||
| (dollars in thousands, except for share data) | 2012 | 2013 | 2014 | |||||||||
| Net income |
$ | 65,500 | $ | 78,236 | $ | 101,931 | ||||||
| Basic weighted average number of shares outstanding |
195,298,147 | 195,619,943 | 195,735,309 | |||||||||
| Dilutive effect of stock options |
409,828 | 939,141 | 2,117,623 | |||||||||
|
|
|
|
|
|
|
|||||||
| Diluted weighted average number of shares outstanding |
195,707,975 | 196,559,084 | 197,852,932 | |||||||||
|
|
|
|
|
|
|
|||||||
| Basic net income per common share |
$ | 0.34 | $ | 0.40 | $ | 0.52 | ||||||
| Diluted net income per common share |
$ | 0.33 | $ | 0.40 | $ | 0.52 | ||||||
| Dividends declared and paid per share |
$ | 2.05 | $ | — | $ | — | ||||||
| Anti-dilutive shares excluded from diluted earnings per share computation |
4,004,683 | 96,096 | — | |||||||||
Note 14 – Lease Commitments
The Company leases various facilities, vehicles, and equipment under operating leases with terms expiring at various times through 2021. Rent expense under operating leases was approximately $2.8 million, $4.3 million, and $5.0 million for the years ended December 31, 2012, 2013, and 2014, respectively.
Future minimum annual rental commitments under non-cancellable operating leases as of December 31, 2014 were as follows:
| (dollars in thousands) | Total non- cancellable leases |
|||
| Year |
||||
| 2015 |
$ | 5,555 | ||
| 2016 |
5,209 | |||
| 2017 |
3,532 | |||
| 2018 |
2,966 | |||
| Thereafter |
3,060 | |||
|
|
|
|||
| Total |
$ | 20,322 | ||
|
|
|
|||
F-21
Table of Contents
Blue Buffalo Pet Products, Inc.
Notes to Consolidated Financial Statements (Continued)
Note 15 – Commitments and Contingencies
Purchase Commitments
The company enters into contracts with a network of contract manufacturers that require them to provide us with specific finished products and provide for minimum production commitments. Most of our agreements with our contract manufacturers expire in 2015 or 2016 and will thereafter be automatically renewed for consecutive one-year terms until notice of non-renewal is given. The Company also enters into contracts for the purchase of several of its main ingredients. Such contracts call for minimum purchase requirements and typically cover one year or one crop season and are renewed annually.
The following table summarizes our future minimum purchase commitments as of December 31, 2014:
| (dollars in thousands) | Total | Less Than One Year |
1-3 Years | 3-5 Years | More than Five Years |
|||||||||||||||
| Finished goods minimum purchase obligations |
$ | 94,249 | $ | 40,550 | $ | 47,990 | $ | 5,709 | $ | — | ||||||||||
| Raw material purchase obligations |
268,515 | 255,557 | 12,958 | — | — | |||||||||||||||
|
|
|
|
|
|
|
|
|
|
|
|||||||||||
| Total contractual obligations |
$ | 362,764 | $ | 296,107 | $ | 60,948 | $ | 5,709 | $ | — | ||||||||||
|
|
|
|
|
|
|
|
|
|
|
|||||||||||
Litigation & Settlements
On May 6, 2014, Nestle Purina filed a lawsuit against us in the United States District Court for the Eastern District of Missouri. As amended, Nestle Purina’s complaint alleges that we have engaged in false advertising, commercial disparagement and unjust enrichment. Nestle Purina asserts that, contrary to our advertising and labeling claims, certain BLUE products contain chicken or poultry by-product meals, artificial preservatives and/or corn and that certain products in the BLUE grain-free line contain grains. Nestle Purina also alleges that we have made false claims that our products (including LifeSource Bits) provide superior nutrition and health benefits compared to our competitors’ products. In addition, Nestle Purina contends that we have been unjustly enriched as consumers have paid a premium for BLUE products in reliance on these alleged false and misleading statements, at the expense of our competitors. Nestle Purina seeks an injunction prohibiting us from making these alleged false and misleading statements, as well as treble damages, restitution and disgorgement of our profits, among other things. In addition, Nestle Purina has issued press releases and made other public announcements, including advertising and promotional communications through emails and internet and social media websites that make claims similar to those contained in their lawsuit. Nestle Purina seeks a declaratory judgment that these statements are true and do not constitute defamation. In addition, a number of related consumer class action lawsuits have been filed making allegations similar to Nestle Purina’s and seeking monetary damages and injunctive relief.
We believe Nestlé Purina’s claims and the related class action lawsuits are without merit and intend to vigorously defend ourselves. Although we have determined that a loss contingency with respect to the Nestlé Purina litigation and related class action lawsuits is reasonably possible, such litigation and lawsuits are still in their early stages and the final outcome is uncertain. In particular, we have determined that the reasonably possible loss or range of loss resulting from Nestlé Purina proceedings and each of the related class action claims cannot be reasonably estimated due to the following reasons: (1) the early stages of the proceedings, (2) the lack of specific damages sought by the plaintiffs, (3) the uncertainty as to plaintiffs’ support for their damages claim, (4) the uncertainty as to factual issues, (5) the uncertainty of number of plaintiffs in the related class action claims and (6) our claims against third party defendants and counterclaims against Nestlé Purina.
F-22
Table of Contents
Blue Buffalo Pet Products, Inc.
Notes to Consolidated Financial Statements (Continued)
In the normal course of business, the Company is subject to proceedings, lawsuits and other claims and assessments, which typically include consumer complaints and post-termination employment claims. The Company has assessed such contingent liabilities and believes the potential of these liabilities is not expected to have a material, if any, effect on the Company’s financial position, its results of operations or its cash flows.
Note 16 – Related Parties
Invus Partners, LLC held $20.4 million and $20.2 million of the Company’s outstanding debt under the Amended Facility on December 31, 2013 and 2014, respectively. Several of the members of the Company’s Board of Directors (“BOD”) are members of Invus Partners, LLC, as well as managing directors and officers of the general partner of the Company’s majority shareholder and managing directors and officers of an investment advisor to the Company’s majority shareholder.
In addition, Kunkemueller Enterprises LP, which is owned in part by the wife of one of the members of our BOD, held $1.5 million of the Company’s debt under the Amended Facility on December 31, 2013 and 2014.
Note 17 – Unaudited Quarterly Financial Data
The unaudited summarized financial data by quarter for the years ended December 31, 2013 and 2014 is presented in the table below:
| (dollars in thousands) | Quarter 1 | Quarter 2 | Quarter 3 | Quarter 4 | ||||||||||||
| 2013: |
||||||||||||||||
| Net sales |
$ | 163,821 | $ | 175,133 | $ | 184,797 | $ | 195,758 | ||||||||
| Gross profit |
69,337 | 73,490 | 76,727 | 78,058 | ||||||||||||
| Selling, general, and administrative expenses |
27,959 | 31,584 | 35,248 | 44,195 | ||||||||||||
| Operating income |
41,378 | 41,906 | 41,479 | 33,863 | ||||||||||||
| Net income |
21,254 | 22,440 | 22,626 | 11,916 | ||||||||||||
| Basic net income per common share |
$ | 0.11 | $ | 0.11 | $ | 0.12 | $ | 0.06 | ||||||||
| Diluted net income per common share |
$ | 0.11 | $ | 0.11 | $ | 0.12 | $ | 0.06 | ||||||||
| Dividends declared and paid per common share |
$ | — | $ | — | $ | — | $ | — | ||||||||
| Basic weighted average shares |
195,526,300 | 195,594,155 | 195,635,227 | 195,720,894 | ||||||||||||
| Diluted weighted average shares |
195,767,565 | 195,794,625 | 196,738,735 | 197,551,132 | ||||||||||||
| 2014: |
||||||||||||||||
| Net sales |
$ | 226,247 | $ | 218,654 | $ | 234,770 | $ | 238,089 | ||||||||
| Gross profit |
96,335 | 84,993 | 94,226 | 91,313 | ||||||||||||
| Selling, general, and administrative expenses |
42,722 | 46,100 | 45,419 | 53,623 | ||||||||||||
| Operating income |
53,613 | 38,893 | 48,807 | 37,690 | ||||||||||||
| Net income |
31,153 | 21,911 | 27,713 | 21,154 | ||||||||||||
| Basic net income per common share |
$ | 0.16 | $ | 0.11 | $ | 0.14 | $ | 0.11 | ||||||||
| Diluted net income per common share |
$ | 0.16 | $ | 0.11 | $ | 0.14 | $ | 0.11 | ||||||||
| Dividends declared and paid per common share |
$ | — | $ | — | $ | — | $ | — | ||||||||
| Basic weighted average shares |
195,720,894 | 195,733,692 | 195,743,154 | 195,743,154 | ||||||||||||
| Diluted weighted average shares |
197,747,579 | 197,827,833 | 197,884,029 | 197,853,482 | ||||||||||||
F-23
Table of Contents
Blue Buffalo Pet Products, Inc.
Unaudited Condensed Consolidated Balance Sheets
(dollars in thousands, except for share data)
| December 31, 2014 |
March 31, 2015 |
|||||||
| ASSETS |
||||||||
| Current assets: |
||||||||
| Cash and cash equivalents |
$ | 95,788 | $ | 149,044 | ||||
| Receivables, net |
78,620 | 68,773 | ||||||
| Inventories |
88,620 | 85,010 | ||||||
| Prepaid expenses and other current assets |
3,351 | 1,457 | ||||||
| Deferred income taxes |
5,696 | 3,436 | ||||||
|
|
|
|
|
|||||
| Total current assets |
272,075 | 307,720 | ||||||
| Restricted cash |
473 | 473 | ||||||
| Property, plant, and equipment, net |
113,863 | 114,101 | ||||||
| Deferred debt issuance costs, net |
317 | 287 | ||||||
| Other assets |
444 | 440 | ||||||
|
|
|
|
|
|||||
| Total assets |
$ | 387,172 | $ | 423,021 | ||||
|
|
|
|
|
|||||
| LIABILITIES AND STOCKHOLDERS’ DEFICIT |
||||||||
| Current liabilities: |
||||||||
| Current maturities of long-term debt |
$ | 3,960 | $ | 3,960 | ||||
| Accounts payable |
33,163 | 38,161 | ||||||
| Other current liabilities |
27,013 | 30,202 | ||||||
|
|
|
|
|
|||||
| Total current liabilities |
64,136 | 72,323 | ||||||
| Long-term debt |
387,097 | 386,107 | ||||||
| Deferred income taxes |
17,128 | 14,728 | ||||||
| Other long-term liabilities |
6,108 | 6,633 | ||||||
|
|
|
|
|
|||||
| Total liabilities |
474,469 | 479,791 | ||||||
| Commitments and contingencies |
||||||||
| Stockholders’ deficit: |
||||||||
| Common stock, voting; $0.01 par value; 207,060,000 shares authorized; 195,743,154 and 195,747,774 shares issued and outstanding at December 31, 2014 and March 31, 2015, respectively |
1,957 | 1,957 | ||||||
| Additional paid-in capital |
57,683 | 58,164 | ||||||
| Accumulated deficit |
(146,937 | ) | (116,891 | ) | ||||
|
|
|
|
|
|||||
| Total stockholders’ deficit |
(87,297 | ) | (56,770 | ) | ||||
|
|
|
|
|
|||||
| Total liabilities and stockholders’ deficit |
$ | 387,172 | $ | 423,021 | ||||
|
|
|
|
|
|||||
The accompanying notes are an integral part of the unaudited condensed consolidated financial statements.
F-24
Table of Contents
Blue Buffalo Pet Products, Inc.
Unaudited Condensed Consolidated Statements of Income
(dollars in thousands)
| Three Months Ended March 31, | ||||||||
| 2014 | 2015 | |||||||
| Net sales |
$ | 226,247 | $ | 248,774 | ||||
| Cost of sales |
129,912 | 149,240 | ||||||
|
|
|
|
|
|||||
| Gross profit |
96,335 | 99,534 | ||||||
| Selling, general, and administrative expenses |
42,722 | 47,399 | ||||||
|
|
|
|
|
|||||
| Operating income |
53,613 | 52,135 | ||||||
| Interest expense, net |
3,196 | 3,683 | ||||||
|
|
|
|
|
|||||
| Income before income taxes |
50,417 | 48,452 | ||||||
| Provision for income taxes |
19,264 | 18,406 | ||||||
|
|
|
|
|
|||||
| Net income |
$ | 31,153 | $ | 30,046 | ||||
|
|
|
|
|
|||||
| Basic net income per common share |
$ | 0.16 | $ | 0.15 | ||||
| Diluted net income per common share |
$ | 0.16 | $ | 0.15 | ||||
| Basic weighted average shares |
195,720,894 | 195,745,670 | ||||||
| Diluted weighted average shares |
197,747,579 | 197,773,850 | ||||||
The accompanying notes are an integral part of the unaudited condensed consolidated financial statements.
F-25
Table of Contents
Blue Buffalo Pet Products, Inc.
Unaudited Condensed Consolidated Statement of Changes in Stockholders’ Deficit
(dollars in thousands, except for share data)
| Common shares outstanding |
Common stock |
Additional paid-in capital |
(Accumulated deficit) retained earnings |
Total | ||||||||||||||||
| Balance at December 31, 2014 |
195,743,154 | $ | 1,957 | $ | 57,683 | $ | (146,937 | ) | $ | (87,297 | ) | |||||||||
| Exercise of stock options |
4,620 | — | 36 | — | 36 | |||||||||||||||
| Stock-based compensation expense |
— | — | 445 | — | 445 | |||||||||||||||
| Net income |
— | — | — | 30,046 | 30,046 | |||||||||||||||
|
|
|
|
|
|
|
|
|
|
|
|||||||||||
| Balance at March 31, 2015 |
195,747,774 | $ | 1,957 | $ | 58,164 | $ | (116,891 | ) | $ | (56,770 | ) | |||||||||
|
|
|
|
|
|
|
|
|
|
|
|||||||||||
The accompanying notes are an integral part of the unaudited condensed consolidated financial statements.
F-26
Table of Contents
Blue Buffalo Pet Products, Inc.
Unaudited Condensed Consolidated Statements of Cash Flows
(dollars in thousands)
| Three Months Ended March 31, | ||||||||
| 2014 | 2015 | |||||||
| Cash flows from operating activities: |
||||||||
| Net income |
$ | 31,153 | $ | 30,046 | ||||
| Adjustments to reconcile net income to net cash provided by operating activities: |
||||||||
| Depreciation and amortization |
522 | 1,897 | ||||||
| Amortization of debt issuance costs |
30 | 30 | ||||||
| Stock-based compensation |
417 | 445 | ||||||
| Deferred compensation |
32 | 19 | ||||||
| Loss on disposal of assets |
4 | 48 | ||||||
| Deferred income taxes |
849 | (140 | ) | |||||
| Effect of changes in operating assets and liabilities: |
||||||||
| Receivables |
(10,185 | ) | 9,847 | |||||
| Inventories |
7,577 | 3,610 | ||||||
| Prepaid expenses and other current assets |
895 | 1,899 | ||||||
| Accounts payable |
15,201 | 4,998 | ||||||
| Other liabilities |
2,922 | 3,695 | ||||||
|
|
|
|
|
|||||
| Net cash provided by operating activities |
49,417 | 56,394 | ||||||
|
|
|
|
|
|||||
| Cash flows from investing activities: |
||||||||
| Capital expenditures |
(6,998 | ) | (2,184 | ) | ||||
|
|
|
|
|
|||||
| Net cash used in investing activities |
(6,998 | ) | (2,184 | ) | ||||
|
|
|
|
|
|||||
| Cash flows from financing activities: |
||||||||
| Principal payments on long-term debt |
(990 | ) | (990 | ) | ||||
| Proceeds from exercise of stock options |
— | 36 | ||||||
|
|
|
|
|
|||||
| Net cash used in financing activities |
(990 | ) | (954 | ) | ||||
|
|
|
|
|
|||||
| Net increase in cash and cash equivalents |
41,429 | 53,256 | ||||||
| Cash and cash equivalents at beginning of period |
42,874 | 95,788 | ||||||
|
|
|
|
|
|||||
| Cash and cash equivalents at end of period |
$ | 84,303 | $ | 149,044 | ||||
|
|
|
|
|
|||||
The accompanying notes are an integral part of the unaudited condensed consolidated financial statements.
F-27
Table of Contents
Blue Buffalo Pet Products, Inc.
Notes to Unaudited Condensed Consolidated Financial Statements
Note 1 – The Company
Blue Buffalo Pet Products, Inc. (“BBPP”) and together with its subsidiaries, (the “Company,” “we,” “us,” “its,” and “our”) conducts its business exclusively through its wholly-owned operating subsidiary, Blue Buffalo Company, Ltd. (“Blue”) (formerly The Blue Buffalo Company, LLC) and its subsidiaries. Blue was formed in August 2002 and is the parent company of three wholly-owned subsidiaries, Great Plains Leasing, LLC, Heartland Pet Food Manufacturing, Inc. (“Heartland”), and Sierra Pet Products, LLC. Blue and its subsidiaries develop, produce, market, and sell pet food under the Blue Life Protection Formula, Blue Wilderness, Blue Basics, and Blue Freedom lines. Our products are produced domestically at our Heartland facility and through contract manufacturers for distribution to retailers in specialty channels throughout the United States of America and Canada.
In July 2012, Blue formed Heartland for the purpose of commencing internal manufacturing operations to eventually supplement its contract manufacturers. Manufacturing operations commenced at our Heartland facility in Joplin, Missouri in September 2014.
Note 2 – Basis of Presentation
The accompanying unaudited condensed consolidated financial statements include the accounts of BBPP and its wholly-owned subsidiaries. All intercompany balances and transactions have been eliminated in consolidation.
The unaudited condensed consolidated financial statements reflect all normal recurring adjustments which, in management’s opinion, are necessary for a fair statement of the results for interim periods. Results of operations for interim periods may not be representative of results to be expected for a full year. Certain prior year amounts have been reclassified to conform to the current period presentation.
On July 7, 2015, the Company effected a 4.2-for-1 stock split of all outstanding shares of the Company’s common stock. All share, option, and per share information presented in the accompanying unaudited condensed consolidated financial statements have been adjusted to reflect the stock split on a retroactive basis for all periods presented and all share information is rounded down to the nearest whole share after reflecting the stock split.
Certain information and footnote disclosure normally included in financial statements prepared in accordance with accounting principles generally accepted in the United States of America have been condensed or omitted. These unaudited condensed consolidated financial statements should be read in conjunction with the Company’s annual consolidated financial statements and related notes for the year ended December 31, 2014 included elsewhere in this prospectus.
Note 3 – Receivables
Receivables consisted of the following:
| (dollars in thousands) | December 31, 2014 |
March 31, 2015 |
||||||
| Trade receivables, net |
$ | 54,647 | $ | 62,330 | ||||
| Other receivables |
23,973 | 6,443 | ||||||
|
|
|
|
|
|||||
| Total |
$ | 78,620 | $ | 68,773 | ||||
|
|
|
|
|
|||||
Other receivables consist primarily of reimbursable amounts due from co-manufacturers for packaging of $4.4 million and $3.6 million income tax receivables of $18.2 million and $2.8 million at December 31, 2014 and March 31, 2015, respectively.
F-28
Table of Contents
Blue Buffalo Pet Products, Inc.
Notes to Unaudited Condensed Consolidated Financial Statements (Continued)
Note 4 – Inventories
Inventories consisted of the following:
| (dollars in thousands) | December 31, 2014 |
March 31, 2015 |
||||||
| Finished goods |
$ | 83,904 | $ | 80,355 | ||||
| Work in process |
90 | 245 | ||||||
| Raw materials |
3,136 | 2,964 | ||||||
| Packaging and supplies |
1,490 | 1,446 | ||||||
|
|
|
|
|
|||||
| Total |
$ | 88,620 | $ | 85,010 | ||||
|
|
|
|
|
|||||
Note 5 – Property, Plant, and Equipment
Property, plant, and equipment consisted of the following:
| (dollars in thousands) | December 31, 2014 |
March 31, 2015 |
||||||
| Computer software |
$ | 8,056 | $ | 9,224 | ||||
| Computer equipment |
3,589 | 3,195 | ||||||
| Buildings |
58,846 | 59,307 | ||||||
| Machinery and equipment |
44,702 | 45,971 | ||||||
| Furniture and fixtures |
1,429 | 1,429 | ||||||
| Leasehold improvements |
1,051 | 1,186 | ||||||
| Buildings improvements |
86 | 86 | ||||||
| Land |
346 | 346 | ||||||
| Land improvements |
784 | 439 | ||||||
| Construction in progress |
2,169 | 1,427 | ||||||
|
|
|
|
|
|||||
| 121,058 | 122,610 | |||||||
| Accumulated depreciation and amortization |
(7,195 | ) | (8,509 | ) | ||||
|
|
|
|
|
|||||
| Total |
$ | 113,863 | $ | 114,101 | ||||
|
|
|
|
|
|||||
Depreciation and amortization expense was approximately $0.5 million and $1.9 million for the three months ended March 31, 2014 and 2015, respectively.
Note 6 – Long-term Debt
Long-term debt consisted of the following:
| (dollars in thousands) | December 31, 2014 |
March 31, 2015 |
||||||
| Term loan |
$ | 391,057 | $ | 390,067 | ||||
| Less current maturities |
(3,960 | ) | (3,960 | ) | ||||
|
|
|
|
|
|||||
| Total long-term debt |
$ | 387,097 | $ | 386,107 | ||||
|
|
|
|
|
|||||
At December 31, 2014, we had $391.0 million of term loan borrowings (fair value of $386.2 million) at an effective interest rate of 4.03% and no outstanding borrowings under the revolving credit facility. At March 31, 2015, we had $390.1 million of term loan borrowings (fair value of $390.1 million) at an effective interest rate of
F-29
Table of Contents
Blue Buffalo Pet Products, Inc.
Notes to Unaudited Condensed Consolidated Financial Statements (Continued)
3.82% and no outstanding borrowings under the revolving credit facility. Principal payments on the term loan borrowings are due and payable in quarterly installments of approximately $1.0 million with the then expected remaining balance of $373.2 million due on August 8, 2019.
During the three-month periods ended March 31, 2014 and March 31, 2015, the Company recorded amortization expense for deferred debt issuance costs of approximately $30,000.
The Amended Facility contains and defines financial covenants, including a secured leverage ratio (defined as, with certain adjustments, the ratio of (i) the Company’s indebtedness less unrestricted cash and cash equivalents up to $40 million to (ii) consolidated net income before interest, taxes, depreciation, and amortization) not to exceed (a) December 31, 2014 and March 31, 2015, 4.25:1.00, (b) June 30, 2015 and September 30, 2015, 4.00:1.00, and (c) if such periods ends on or after December 31, 2015, 3.75:1.00. The Amended Facility also sets forth mandatory and optional prepayment conditions, including an annual excess cash flow requirement, as defined, that may result in our use of cash to reduce our debt obligations. For the year ended December 31, 2014, the Company was not required to make an excess cash flow payment. As of March 31, 2015, the Company believes it was in compliance with its financial debt covenants.
Note 7 – Fair Value Measurements
The Company’s financial instruments consist of cash and cash equivalents, accounts receivable, accounts payable, other current liabilities, deferred compensation, and debt, none of which are measured at fair value on a recurring basis. The carrying amounts of cash and cash equivalents, accounts receivable, accounts payable, and other current liabilities approximate their fair value due to the short-term nature of these financial instruments. The Company’s long-term financial liabilities consist of the long-term portion of deferred compensation and long-term debt. The long-term portion of deferred compensation is recorded at the present value of the liability (which approximates fair value) under the Blue Buffalo Company, Ltd. Phantom Equity Plan and is included in other liabilities on the accompanying unaudited condensed consolidated balance sheets. Long-term debt is recorded on the unaudited condensed consolidated balance sheets at issuance price and adjusted for any applicable unamortized discounts or premiums.
The Company accounts for its fair value measurements in accordance with accounting guidance which defines fair value, establishes a framework for measuring fair value, and expands disclosures about fair value measurements. The fair value hierarchy for disclosure of fair value measurements is as follows:
Level 1- Quoted prices in active markets for identical assets or liabilities
Level 2- Quoted prices for similar assets and liabilities in active markets or inputs that are observable
Level 3- Inputs that are unobservable (for example, cash flow modeling inputs based on assumptions)
At December 31, 2014 and March 31, 2015, we had approximately $90.1 million and $125.2 million, respectively, of cash invested in money market deposit accounts which were included in cash and cash equivalents on the accompanying unaudited condensed consolidated balance sheets (Level 1).
The Company reports transfers in and out of Levels 1, 2, and 3, as applicable, using the fair value of the individual securities as of the beginning of the reporting period in which the transfer(s) occurred. There were no transfers in or out of Level 1, 2, or 3 at the year ended December 31, 2014 and during the three months ended March 31, 2015.
F-30
Table of Contents
Blue Buffalo Pet Products, Inc.
Notes to Unaudited Condensed Consolidated Financial Statements (Continued)
Assets that are measured at fair value on a nonrecurring basis relate primarily to our tangible fixed assets. For these assets, we do not periodically adjust carrying value to fair value, except in the event of impairment. When we determine that an impairment has occurred, the carrying value is reduced to fair value and the difference is recorded as an impairment loss in our consolidated statements of income.
As of December 31, 2014, the carrying value of the Company’s outstanding borrowings under the Amended Facility was approximately $391.0 million as compared to a fair value of $386.2 million (Level 2). As of March 31, 2015, the carrying value and fair value (Level 2) of the Company’s outstanding borrowings under the Amended Facility was approximately $390.1 million. The estimated fair value of the Company’s debt was based primarily on reported market values, recently completed market transactions and estimates based upon interest rates, maturities, and credit risk.
Note 8 – Stock-Based Compensation
Under the Company’s 2012 Blue Buffalo Pet Products, Inc. Stock Purchase and Option Plan (the “Plan”), the Board of Directors is authorized to award incentive stock options (ISOs and non-qualified), stock appreciation rights (SARs), restricted stock, performance units, performance-based stock awards, dividend equivalent rights, and other stock-based grants. Participation in the Plan is limited to key employees, officers, and directors.
On March 4, 2013, the Plan was amended to increase the maximum number of shares of stock available under the Plan by 210,000 shares to 14,242,061 shares (the “Amended Plan”). As of March 31, 2015, there were 5,230,642 shares of common stock reserved under the Amended Plan. As of March 31, 2015, the maximum number of shares available for grant under the Amended Plan was 102,669.
Stock Options
The Company uses the Black-Scholes option-pricing model to determine the fair value of stock options on the date of grant. The fair value of stock options, which are subject to pro-rata vesting, is expensed on a straight-line basis over the vesting period of the stock options.
The Company uses a third party valuation specialist to assist it in the estimation of the fair value of its common stock. The Company believes these valuations to be appropriate; however, the valuation of the equity of any private company involves various estimates and assumptions that may differ from actual values. If available, the Company bases its common stock value on actual transactions or other transactions that are representative of stock value. The expected volatility assumption is based on the combination of the industry index for pet food wholesalers and the volatility of the Company’s largest customer. The risk-free interest rate for the expected term of the option is based on the U.S. Treasury implied yield at the date of grant. The weighted-average expected term is determined with reference to historical exercise and post-vesting cancellation experience, and the vesting period and contractual term of the awards.
F-31
Table of Contents
Blue Buffalo Pet Products, Inc.
Notes to Unaudited Condensed Consolidated Financial Statements (Continued)
The following table summarizes stock-based award activity during the year and also presents stock options outstanding and exercisable as of March 31, 2015 (dollars in millions, except for per share data):
| Number of Shares |
Weighted Average Exercise Price Per Share |
|||||||
| Outstanding, December 31, 2014 |
4,671,639 | $ | 5.88 | |||||
| Granted |
— | $ | — | |||||
| Exercised |
(4,620 | ) | $ | 7.84 | ||||
| Forfeited |
— | $ | — | |||||
| Expired |
(5,460 | ) | $ | 6.12 | ||||
|
|
|
|||||||
| Outstanding, March 31, 2015 |
4,661,559 | $ | 5.88 | |||||
|
|
|
|||||||
| Exercisable, March 31, 2015 |
1,778,271 | $ | 5.73 | |||||
During the three months ended March 31, 2015, there were no grants of ISO and non-qualified stock options. Stock-based compensation costs charged to operations (as a component of selling, general, and administrative expenses) during each of the three months ended March 31, 2014 and 2015 was approximately $0.4 million. During the three months ended March 31, 2014 and 2015 there were no non-qualified options exercised. The benefits of tax deductions in excess of the grant date fair value resulting from the exercise of non-qualified options was not material to three months ended March 31, 2014 and 2015.
Unrecognized stock-based compensation related to outstanding unvested stock options is expected to be recognized in the Company’s statements of income as follows (by fiscal year):
| (dollars in thousands) | ||||
| 2015 (period from April 1, to December 31, 2015) |
$ | 1,300 | ||
| 2016 |
1,749 | |||
| 2017 |
1,688 | |||
| 2018 |
234 | |||
| 2019 |
32 | |||
|
|
|
|||
| Total |
$ | 5,003 | ||
|
|
|
|||
Note 9 – Earnings Per Share
The details of the computation of basic and diluted earnings per common share are as follows:
| Three Months Ended March 31, | ||||||||
| (dollars in thousands, except for share data) | 2014 | 2015 | ||||||
| Net income |
$ | 31,153 | $ | 30,046 | ||||
| Basic weighted average number of shares outstanding |
195,720,894 | 195,745,670 | ||||||
| Dilutive effect of stock options |
2,026,685 | 2,028,180 | ||||||
|
|
|
|
|
|||||
| Diluted weighted average number of shares outstanding |
197,747,579 | 197,773,850 | ||||||
|
|
|
|
|
|||||
| Basic net income per common share |
$ | 0.16 | $ | 0.15 | ||||
| Diluted net income per common share |
$ | 0.16 | $ | 0.15 | ||||
| Anti-dilutive shares excluded from diluted earnings per share computation |
9,718 | — | ||||||
F-32
Table of Contents
Blue Buffalo Pet Products, Inc.
Notes to Unaudited Condensed Consolidated Financial Statements (Continued)
Note 10 – Related Parties
Invus Partners LLC holds $20.1 million of the Company’s outstanding debt under the Amended Facility. Several of the members of the Company’s Board of Directors (“BOD”) are members of Invus Partners LLC, as well as managing directors and officers of the general partner of our majority stockholder.
In addition, Kunkemueller Enterprises LP, which is owned in part by the wife of one of the members of our BOD, holds $1.5 million of our debt under the Amended Facility.
Note 11 – Legal Proceedings
On May 6, 2014, Nestle Purina filed a lawsuit against us in the United States District Court for the Eastern District of Missouri. As amended, Nestle Purina’s complaint alleges that we have engaged in false advertising, commercial disparagement and unjust enrichment. Nestle Purina asserts that, contrary to our advertising and labeling claims, certain BLUE products contain chicken or poultry by-product meals, artificial preservatives and/or corn and that certain products in the BLUE grain-free line contain grains. Nestle Purina also alleges that we have made false claims that our products (including LifeSource Bits) provide superior nutrition and health benefits compared to our competitors’ products. In addition, Nestle Purina contends that we have been unjustly enriched as consumers have paid a premium for BLUE products in reliance on these alleged false and misleading statements, at the expense of our competitors. Nestle Purina seeks an injunction prohibiting us from making these alleged false and misleading statements, as well as treble damages, restitution and disgorgement of our profits, among other things. In addition, Nestle Purina has issued press releases and made other public announcements, including advertising and promotional communications through emails and internet and social media websites that make claims similar to those contained in their lawsuit. Nestle Purina seeks a declaratory judgment that these statements are true and do not constitute defamation. In addition, a number of related consumer class action lawsuits have been filed making allegations similar to Nestle Purina’s and seeking monetary damages and injunctive relief.
We believe Nestlé Purina’s claims and the related class action lawsuits are without merit and intend to vigorously defend ourselves. Although we have determined that a loss contingency with respect to the Nestlé Purina litigation and related class action lawsuits is reasonably possible, such litigation and lawsuits are still in their early stages and the final outcome is uncertain. In particular, we have determined that the reasonably possible loss or range of loss resulting from Nestlé Purina proceedings and each of the related class action claims cannot be reasonably estimated due to the following reasons: (1) the early stages of the proceedings, (2) the lack of specific damages sought by the plaintiffs, (3) the uncertainty as to plaintiffs’ support for their damages claim, (4) the uncertainty as to factual issues, (5) the uncertainty of number of plaintiffs in the related class action claims and (6) our claims against third party defendants and counterclaims against Nestlé Purina.
In the normal course of business, the Company is subject to proceedings, lawsuits and other claims and assessments, which typically include consumer complaints and post-termination employment claims. The Company has assessed such contingent liabilities and believes the potential of these liabilities is not expected to have a material, if any, effect on the Company’s financial position, its results of operations or its cash flows.
F-33
Table of Contents

Love Them Like Family. Feed Them Like Family.™
Table of Contents
BLUE BUFFALO BLUE BUFFALO BLUE BUFFALO BLUE BUFFALO BLUE
Until , 2015 (25 days after the date of this prospectus), all dealers that buy, sell or trade shares of our
common stock, whether or not participating in this offering, may be required to deliver a prospectus. This delivery requirement is in addition to the obligation of dealers to deliver a prospectus when acting as underwriters and with respect to their
unsold allotments or subscriptions.
Table of Contents
PART II
INFORMATION NOT REQUIRED IN PROSPECTUS
ITEM 13. OTHER EXPENSES OF ISSUANCE AND DISTRIBUTION.
The following table sets forth the expenses payable by the Registrant expected to be incurred in connection with the issuance and distribution of the shares of common stock being registered hereby (other than underwriting discounts and commissions). All of such expenses are estimates, other than the filing and listing fees payable to the Securities and Exchange Commission, the Financial Industry Regulatory Authority, Inc. and NASDAQ listing fee.
| SEC Registration Fee |
$ | 70,994 | ||
| FINRA Filing Fee. |
92,144 | |||
| NASDAQ Listing Fee |
250,000 | |||
| Legal Fees |
4,100,000 | |||
| Printing Expenses |
400,000 | |||
| Accounting Expenses |
998,000 | |||
| Transfer Agent and Registrar’s Fees |
20,000 | |||
| Miscellaneous Expenses |
653,000 | |||
|
|
|
|||
| Total |
$ | 6,584,138 | ||
|
|
|
ITEM 14. INDEMNIFICATION OF DIRECTORS AND OFFICERS.
Section 102(b)(7) of the Delaware General Corporation Law, or DGCL, allows a corporation to provide in its certificate of incorporation that a director of the corporation will not be personally liable to the corporation or its stockholders for monetary damages for breach of fiduciary duty as a director, except where the director breached the duty of loyalty, failed to act in good faith, engaged in intentional misconduct or knowingly violated a law, authorized the payment of a dividend or approved a stock repurchase in violation of Delaware corporate law or obtained an improper personal benefit. Our amended and restated certificate of incorporation will provide for this limitation of liability.
Section 145 of the DGCL, or Section 145, provides, among other things, that a Delaware corporation may indemnify any person who was, is or is threatened to be made, party to any threatened, pending or completed action, suit or proceeding, whether civil, criminal, administrative or investigative (other than an action by or in the right of such corporation), by reason of the fact that such person is or was an officer, director, employee or agent of such corporation or is or was serving at the request of such corporation as a director, officer, employee or agent of another corporation or enterprise. The indemnity may include expenses (including attorneys’ fees), judgments, fines and amounts paid in settlement actually and reasonably incurred by such person in connection with such action, suit or proceeding, provided such person acted in good faith and in a manner he or she reasonably believed to be in or not opposed to the corporation’s best interests and, with respect to any criminal action or proceeding, had no reasonable cause to believe that his or her conduct was illegal. A Delaware corporation may indemnify any persons who were or are a party to any threatened, pending or completed action or suit by or in the right of the corporation by reason of the fact that such person is or was a director, officer, employee or agent of another corporation or enterprise. The indemnity may include expenses (including attorneys’ fees) actually and reasonably incurred by such person in connection with the defense or settlement of such action or suit, provided such person acted in good faith and in a manner he or she reasonably believed to be in or not opposed to the corporation’s best interests, provided further that no indemnification is permitted without judicial approval if the officer, director, employee or agent is adjudged to be liable to the
II-1
Table of Contents
corporation. Where an officer or director is successful on the merits or otherwise in the defense of any action referred to above, the corporation must indemnify him against the expenses which such officer or director has actually and reasonably incurred.
Section 145 further authorizes a corporation to purchase and maintain insurance on behalf of any person who is or was a director, officer, employee or agent of the corporation or is or was serving at the request of the corporation as a director, officer, employee or agent of another corporation or enterprise, against any liability asserted against him and incurred by him in any such capacity, or arising out of his or her status as such, whether or not the corporation would otherwise have the power to indemnify him or her under Section 145.
Our amended and restated bylaws will provide that we must indemnify our directors and officers to the fullest extent authorized by the DGCL and must also pay expenses incurred in defending any such proceeding in advance of its final disposition upon delivery of an undertaking, by or on behalf of an indemnified person, to repay all amounts so advanced if it should be determined ultimately that such person is not entitled to be indemnified under this section or otherwise. Notwithstanding the foregoing, we shall not be obligated to indemnify a director or officer in respect of a proceeding (or part thereof) instituted by such director or officer, unless such proceeding (or part thereof) has been authorized by the Board of Directors pursuant to the applicable procedure outlined in the amended and restated bylaws.
Section 174 of the DGCL provides, among other things, that a director, who willfully or negligently approves of an unlawful payment of dividends or an unlawful stock purchase or redemption, may be held jointly and severally liable for such actions. A director who was either absent when the unlawful actions were approved or dissented at the time may avoid liability by causing his or her dissent to such actions to be entered in the books containing the minutes of the meetings of the board of directors at the time such action occurred or immediately after such absent director receives notice of the unlawful acts.
The indemnification rights set forth above shall not be exclusive of any other right which an indemnified person may have or hereafter acquire under any statute, provision of our amended and restated certificate of incorporation, our amended and restated bylaws, agreement, vote of stockholders or disinterested directors or otherwise.
We expect to maintain standard policies of insurance that provide coverage (1) to our directors and officers against loss rising from claims made by reason of breach of duty or other wrongful act and (2) to us with respect to indemnification payments that we may make to such directors and officers.
The proposed form of Underwriting Agreement to be filed as Exhibit 1.1 to this Registration Statement provides for indemnification to us, our directors and officers and the selling stockholders by the underwriters, and to the underwriters by us and the selling stockholders, against certain liabilities.
ITEM 15. RECENT SALES OF UNREGISTERED SECURITIES.
The information presented in this Item 15 does not give effect to the 4.2-for-1 stock split that was effectuated on July 7, 2015.
Within the past three years, the Registrant has granted or issued the following securities of the Registrant which were not registered under the Securities Act:
On July 2012, we issued a total of 46,496,862 shares of common stock to Invus, L.P., The Bishop Family Limited Partnership, William W. Bishop, Christopher T. Bishop and the then-existing stockholders in exchange for their shares of Blue Buffalo Company Ltd. common stock.
The sale of the above securities were exempt from the registration requirements of the Securities Act as transactions by an issuer not involving a public offering in reliance on Section 4(a)(2) of the Securities Act. No sales involved underwriters, underwriting discounts or commissions or public offerings of securities of the Registrant.
II-2
Table of Contents
ITEM 16. EXHIBITS AND FINANCIAL STATEMENT SCHEDULES.
| (a) | Exhibit Index |
| 1.1 | Form of Underwriting Agreement | |
| 3.1** | Certificate of Incorporation of the Registrant | |
| 3.2 | Form of Amended and Restated Certificate of Incorporation of the Registrant | |
| 3.3** | Bylaws of the Registrant | |
| 3.4 | Form of Amended and Restated Bylaws of the Registrant | |
| 5.1 | Opinion of Simpson Thacher & Bartlett LLP | |
| 10.1** | Amended and Restated Investor Rights Agreement, dated January 21, 2015, by and among the Registrant, certain stockholders party thereto and Invus, L.P. | |
| 10.2** | Form of Director and Officer Indemnification Agreement | |
| 10.3† | Offer Letter, dated September 12, 2012, between Michael Nathenson and Blue Buffalo | |
| 10.4† | Offer Letter, dated October 1, 2012, between Kurt T. Schmidt and Blue Buffalo | |
| 10.5†** | Amended and Restated 2012 Stock Purchase and Option Plan of Blue Buffalo Pet Products, Inc. | |
| 10.6†** | Form of 2012 Stock Purchase and Option Plan of Blue Buffalo Pet Products, Inc. Incentive Stock Option Agreement | |
| 10.7† | Blue Buffalo Pet Products, Inc. 2015 Omnibus Incentive Plan | |
| 10.8† | Form of Option Agreement under the Blue Buffalo Pet Products, Inc. 2015 Omnibus Incentive Plan | |
| 10.9† | Form of Restricted Stock Unit Agreement under the Blue Buffalo Pet Products, Inc. 2015 Omnibus Incentive Plan | |
| 10.10† | Form of Restricted Stock Agreement under the Blue Buffalo Pet Products, Inc. 2015 Omnibus Incentive Plan | |
| 10.11†** | Form of Confidentiality, Intellectual Property Ownership and Non-Competition Agreement | |
| 10.12** | Credit Agreement dated August 8, 2012 among Blue Pet Products, Inc., Blue Buffalo Company, Ltd., the lenders party thereto and Citibank, N.A., as administrative agent, swingline lender and an issuing bank, Citigroup Global Markets Inc. and Morgan Stanley Senior Funding, Inc., as joint lead arrangers and joint bookrunners, and Morgan Stanley Senior Funding, Inc., as syndication agent | |
| 10.13** | Collateral Agreement dated August 8, 2012 among Blue Pet Products, Inc., Blue Buffalo Company, Ltd., the other grantors party thereto and Citibank, N.A., as administrative agent | |
| 10.14** | Guarantee Agreement dated August 8, 2012 among Blue Pet Products, Inc., the subsidiary guarantors identified therein and Citibank, N.A., as administrative agent | |
| 10.15** | Amendment Agreement No. 1 dated December 6, 2012 among Blue Pet Products, Inc., Blue Buffalo Company, Ltd., the other loan parties party thereto, the existing lenders, Citibank, N.A., as administrative agent, Citigroup Global Markets Inc. and Morgan Stanley Senior Funding, Inc., as joint lead arrangers and the initial Incremental Term B-1 Lenders | |
II-3
Table of Contents
| 10.16** | Amendment Agreement No. 2 dated February 15, 2013 among Blue Pet Products, Inc., Blue Buffalo Company, Ltd., the other loan parties party thereto, the existing lenders, Citibank, N.A., as administrative agent, and the initial Additional Term B-2 Lenders | |
| 10.17** | Amendment Agreement No. 3 dated February 15, 2013 among Blue Pet Products, Inc., Blue Buffalo Company, Ltd., the other loan parties party thereto, the revolving lenders and Citibank, N.A., as administrative agent | |
| 10.18** | Amendment Agreement No. 4 dated December 9, 2013 among Blue Pet Products, Inc., Blue Buffalo Company, Ltd., the other loan parties party thereto, the existing lenders and Citibank, N.A., as administrative agent | |
| 21.1** | List of Subsidiaries | |
| 23.1 | Consent of KPMG LLP | |
| 23.2 | Consent of Simpson Thacher & Bartlett LLP (included in exhibit 5.1) | |
| 24.1** | Power of Attorney | |
| * | To be filed by amendment. |
| ** | Previously filed. |
| † | Identifies exhibits that consist of a management contract or compensatory plan or arrangement. |
| (b) | Financial Statement Schedule |
All schedules are omitted because the required information is either not present, not present in material amounts or presented within our audited consolidated financial statements included elsewhere in this prospectus and are incorporated herein by reference.
ITEM 17. UNDERTAKINGS
| (1) | Insofar as indemnification for liabilities arising under the Securities Act of 1933 may be permitted to directors, officers and controlling persons of the registrant pursuant to the foregoing provisions, or otherwise, the registrant has been advised that in the opinion of the Securities and Exchange Commission such indemnification is against public policy as expressed in the Securities Act of 1933 and is, therefore, unenforceable. In the event that a claim for indemnification against such liabilities (other than the payment by the registrant of expenses incurred or paid by a director, officer or controlling person of the registrant in the successful defense of any action, suit or proceeding) is asserted by such director, officer or controlling person in connection with the securities being registered, the registrant will, unless in the opinion of its counsel the matter has been settled by controlling precedent, submit to a court of appropriate jurisdiction the question whether such indemnification by it is against public policy as expressed in the Securities Act of 1933 and will be governed by the final adjudication of such issue. |
| (2) | The undersigned Registrant hereby undertakes that: |
| (A) | For purposes of determining any liability under the Securities Act of 1933, the information omitted from the form of prospectus filed as part of this registration statement in reliance upon Rule 430A and contained in a form of prospectus filed by the registrant pursuant to Rule 424(b) (1) or (4) or 497(h) under the Securities Act of 1933 shall be deemed to be part of this registration statement as of the time it was declared effective. |
| (B) | For the purpose of determining any liability under the Securities Act of 1933, each post-effective amendment that contains a form of prospectus shall be deemed to be a new registration statement relating to the securities offered therein, and the offering of such securities at that time shall be deemed to be the initial bona fide offering thereof. |
| (3) | The undersigned Registrant hereby undertakes to provide to the underwriter at the closing specified in the underwriting agreements certificates in such denominations and registered in such names as required by the underwriter to permit prompt delivery to each purchaser. |
II-4
Table of Contents
SIGNATURES
Pursuant to the requirements of the Securities Act of 1933, as amended, the Registrant has duly caused this Registration Statement or amendment thereto to be signed on its behalf by the undersigned, thereunto duly authorized, in Wilton, State of Connecticut, on the 8th day of July, 2015.
| Blue Buffalo Pet Products, Inc. | ||||
| By: |
/s/ Kurt Schmidt | |||
| Name: | Kurt Schmidt | |||
| Title: | Chief Executive Officer | |||
Pursuant to the requirements of the Securities Act of 1933, as amended, this Registration Statement or amendment thereto has been signed by the following persons in the capacities indicated on the 8th day of July, 2015.
| Signature |
Title | |||
| * Kurt Schmidt |
Chief Executive Officer and Director (Principal Executive Officer) | |||
| * William W. Bishop, Jr. |
President and Chief Operating Officer | |||
| * Michael Nathenson |
Executive Vice President, Chief Financial Officer and Treasurer (Principal Finance and Accounting Officer) | |||
| * William Bishop |
Chairman and Director | |||
| * Raymond Debbane |
Director | |||
Table of Contents
| * Philippe Amouyal |
Director | |||
| * Evren Bilimer |
Director | |||
| * Aflalo Guimaraes |
Director | |||
| * Michael A. Eck |
Director | |||
| * Frances Frei |
Director | |||
| * Amy Schulman |
Director | |||
| *By: | /s/ Richard MacLean | |
| Name: Richard MacLean | ||
| Title: Attorney In Fact |