Attached files
| file | filename |
|---|---|
| EX-31.2 - EX-31.2 - ASTA FUNDING INC | d813736dex312.htm |
| EX-31.1 - EX-31.1 - ASTA FUNDING INC | d813736dex311.htm |
| EX-23.1 - EX-23.1 - ASTA FUNDING INC | d813736dex231.htm |
| EX-23.2 - EX-23.2 - ASTA FUNDING INC | d813736dex232.htm |
| EX-32.1 - EX-32.1 - ASTA FUNDING INC | d813736dex321.htm |
| EX-21.1 - EX-21.1 - ASTA FUNDING INC | d813736dex211.htm |
| EX-32.2 - EX-32.2 - ASTA FUNDING INC | d813736dex322.htm |
Table of Contents
UNITED STATES
SECURITIES AND EXCHANGE COMMISSION
Washington, D. C. 20549
Form 10-K
| þ | ANNUAL REPORT PURSUANT TO SECTION 13 OR 15(d) OF THE SECURITIES EXCHANGE ACT OF 1934 |
For the fiscal year ended September 30, 2014
OR
| ¨ | TRANSITION REPORT PURSUANT TO SECTION 13 OR 15(d) OF THE SECURITIES EXCHANGE ACT OF 1934 |
For the transition period from to
Commission file number: 001-35637
ASTA FUNDING, INC.
(Exact Name of Registrant Specified in its Charter)
| Delaware | 22-3388607 | |
| (State or other jurisdiction of incorporation or organization) |
(I.R.S. Employer Identification No.) | |
| 210 Sylvan Avenue, Englewood Cliffs, NJ |
07632 (Zip Code) | |
| (Address of principal executive offices) | ||
Issuer’s telephone number, including area code: (201) 567-5648
Securities registered pursuant to Section 12(b) of the Exchange Act:
| Title of each Class | Name of Exchange on Which Registered | |
| Common Stock, par value $.01 per share |
NASDAQ Global Select Market |
Securities registered pursuant to Section 12(g) of the Exchange Act: None
Indicate by check mark if the registrant is a well-known seasoned issuer, as defined in Rule 405 of the Securities Act Yes ¨ No þ
Indicate by check mark if the registrant is not required to file reports pursuant to Section 13 or Section 15(d) of the Act Yes ¨ No þ
¨ Indicate by check mark whether the registrant: (1) has filed all reports required to be filed by Section 13 or 15(d) of the Securities Exchange Act of 1934 during the preceding 12 months (or for such shorter period that the registrant was required to file such reports), and (2) has been subject to such filing requirements for the past 90 days. Yes ¨ No þ
Indicate by check mark whether the registrant has submitted electronically and posted on its corporate Web site, if any, every Interactive Data File required to be submitted and posted pursuant to Rule 405 of Regulation S-T during the preceding 12 months (or for such shorter period that the registrant was required to submit and post such files). Yes ¨ No þ
Indicate by check mark if disclosure of delinquent filers pursuant to Item 405 of Regulation S-K is not contained herein, and will not be contained, to the best of the registrant’s knowledge, in definitive proxy or information statements incorporated by reference in Part III of this Form 10-K or any amendment to this Form 10-K. þ
Indicate by check mark whether the registrant is a large accelerated filer, an accelerated filer, a non-accelerated filer, or a smaller reporting company. See the definitions of “large accelerated filer,” “accelerated filer” and “smaller reporting company” in Rule 12b-2 of the Exchange Act. (Check one):
| Large accelerated filer ¨ | Accelerated filer þ | Non-accelerated filer ¨ | Smaller reporting company ¨ | |||
| (Do not check if a smaller reporting company) | ||||||
Indicate by check mark whether the registrant is a shell company (as defined in Rule 12b-2 of the Act). Yes ¨ No þ
The aggregate market value of voting and nonvoting common equity held by non-affiliates of the registrant was approximately $72,888,000 as of the last business day of the registrant’s most recently completed second fiscal quarter.
As of June 25, 2015, the registrant had 13,060,839 shares of Common Stock issued and outstanding.
Table of Contents
FORM 10-K
1
Table of Contents
Caution Regarding Forward Looking Statements
This Annual Report on Form 10-K contains certain forward-looking statements within the meaning of the Private Securities Litigation Reform Act of 1995. All statements other than statements of historical facts included or incorporated by reference in this Annual Report on Form 10-K, including without limitation, statements regarding our future financial position, business strategy, budgets, projected revenues, projected costs and plans and objectives of management for future operations, are forward-looking statements. Forward-looking statements generally can be identified by the use of forward-looking terminology such as “may,” “will,” “expects,” “intends,” “plans,” “projects,” “estimates,” “anticipates,” or “believes” or the negative thereof or any variation there on or similar terminology or expressions.
We have based these forward-looking statements on our current expectations and projections about future events. These forward-looking statements are not guarantees and are subject to known and unknown risks, uncertainties and assumptions about us that may cause our actual results, levels of activity, performance or achievements to be materially different from any future results, levels of activity, performance or achievements expressed or implied by such forward-looking statements. Important factors which could materially affect our results and our future performance include, without limitation, our ability to purchase defaulted consumer receivables at appropriate prices, changes in government regulations that affect our ability to collect sufficient amounts on our defaulted consumer receivables, our ability to employ and retain qualified employees, changes in the credit or capital markets, changes in interest rates, deterioration in economic conditions, negative press regarding the debt collection industry which may have a negative impact on a debtor’s willingness to pay the debt we acquire, and statements of assumption underlying any of the foregoing, as well as other factors set forth under “Item 1A. Risk Factors” beginning on page 19 of this report and “Item 7—Management’s Discussions and Analysis of Financial Condition and Results of Operation” below.
All subsequent written and oral forward-looking statements attributable to us, or persons acting on our behalf, are expressly qualified in their entirety by the foregoing. Except as required by law, we assume no duty to update or revise any forward-looking statements.
2
Table of Contents
Part I
| Item 1. | Business. |
Overview
Asta Funding, Inc., together with its wholly owned significant operating subsidiaries Palisades Collection LLC, Palisades Acquisition XVI, LLC (“Palisades XVI”), VATIV Recovery Solutions LLC (“VATIV”), ASFI Pegasus Holdings, LLC (“APH”), Fund Pegasus, LLC (“Fund Pegasus”), GAR Disability Advocates, LLC (“GAR Disability Advocates”) and other subsidiaries, not all wholly owned (the “Company”, “we” or “us”), has been engaged in the business of purchasing, managing for its own account and servicing distressed consumer receivables, including charged off receivables, and semi-performing receivables since 1994, as well as more recent business segments discussed below. The primary charged-off receivables are accounts that have been written-off by the originators and may have been previously serviced by collection agencies. Semi-performing receivables are accounts where the debtor is currently making partial or irregular monthly payments, but the accounts may have been written-off by the originators. Distressed consumer receivables are the unpaid debts of individuals to banks, finance companies and other credit providers. A large portion of our distressed consumer receivables are MasterCard®, Visa® and other credit card accounts which were charged-off by the issuers or providers for non-payment. We acquire these and other consumer receivable portfolios at substantial discounts to their face values. The discounts are based on the characteristics (issuer, account size, debtor location and age of debt) of the underlying accounts of each portfolio. Litigation related receivables are semi-performing investments whereby the Company is assigned the revenue stream from the proceeds received. GAR Disability Advocates is a social security disability advocacy firm. GAR Disability Advocates assists claimants in obtaining long term disability benefits from the social security administration.
We own 80% of Pegasus Funding, LLC (“Pegasus”), which invests in funding personal injury claims and 80% of CBC Settlement Funding, LLC (“CBC”), which invests in structured settlements.
Pegasus provides funding for individuals in need of short term funds pending insurance settlements of their personal injury claims. The funds will be recouped when the underlying insurance settlements are paid. The long periods of time taken by insurance companies to settle and pay such claims resulting from lengthy litigation and the court process is fueling the demand for such funding.
CBC provides liquidity to consumers by purchasing certain deferred payment streams including, but not limited to, structured settlements and annuities. CBC generates business from direct marketing as well as through wholesale purchases from brokers or other third parties. CBC has its principal office in Conshohocken, Pennsylvania. CBC primarily warehouses the receivables it originates and periodically resells or securitizes those assets on a pooled basis. The structured settlement marketplace is regulated by federal and state law, requiring that each transaction is reviewed and approved by court order.
We operate principally in the United States in four reportable business segments.
Financial Information About Operating Segments
The Company operates through strategic business units that are aggregated into four reportable segments: Consumer receivables, personal injury claims, structured settlements and disability benefits. The four reportable segments consist of the following:
| • | Consumer receivables segment is engaged in the business of purchasing, managing for its own account and servicing distressed consumer receivables, including charged off and semi-performing receivables. The charged-off receivables are accounts that have been written-off by the originators and may have been previously serviced by collection agencies. Semi-performing receivables are accounts where the debtor is currently making partial or irregular monthly payments, but the accounts may have been written-off by the originators. Distressed consumer receivables are the unpaid debts of individuals to banks, finance companies and other credit providers. A large portion of our distressed consumer receivables are MasterCard®, Visa® and other credit card accounts which were charged-off by the issuers or providers for non-payment. These receivables were acquired at substantial discounts to their face values. The discounts are |
3
Table of Contents
| based on the characteristics (issuer, account size, debtor location and age of debt) of the underlying accounts of each portfolio. Litigation related receivables are semi-performing investments whereby the Company is assigned the revenue stream from the proceeds received. The business conducts its activities primarily under the name Palisades Collection, LLC. |
| • | Personal injury claims – Pegasus Funding, LLC , an 80% owned subsidiary, purchases interests in personal injury claims from claimants who are a party to personal injury litigation. Pegasus advances to each claimant funds on a non-recourse basis at an agreed upon interest rate, in anticipation of a future settlement. The interest in each claim purchased by Pegasus consists of the right to receive, from such claimant, part of the proceeds or recoveries which such claimant receives by reason of a settlement, judgment or award with respect to such claimant’s claim. |
| • | Structured settlements. On December 31, 2013 the Company purchased an 80% interest in CBC Settlement Funding, LLC. CBC purchases periodic structured settlements and annuity policies from individuals in exchange for a lump sum payment. |
| • | GAR Disability Advocates is social security disability advocacy group, which obtains and represents individuals in their claims for social security disability and supplemental security income benefits from the Social Security Administration. |
Three of the Company’s business lines accounted for 10% or more of consolidated net revenue during fiscal year 2014. In fiscal year 2013 two of the Company’s business lines accounted for 10% or more of consolidated net revenue. In fiscal 2012 there were two segments of the business, one of which accounted for less than 10% of the revenue. The following table summarizes the net revenues by percentage from the four lines of business for the fiscal years 2014, 2013 and 2012:
| Years Ended September 30, | ||||||||||||
| 2014 | 2013 (As Revised) |
2012 (As Revised) |
||||||||||
| Finance income (consumer receivables) |
61.7 | % | 83.1 | % | 96.1 | % | ||||||
| Personal injury claims |
22.1 | % | 16.9 | % | 3.9 | % | ||||||
| Structured settlements |
16.2 | % | — | % | — | % | ||||||
| GAR Disability Advocates |
— | % | — | % | — | % | ||||||
|
|
|
|
|
|
|
|||||||
| Total revenues |
100.0 | % | 100.0 | % | 100.0 | % | ||||||
|
|
|
|
|
|
|
|||||||
The Company has no segment information from international operations that needs to be reported.
Information about the results of each of the Company’s reportable segments for the last three fiscal years and total assets as of the end of the last three fiscal years, reconciled to the consolidated results, is set forth below. For additional information, refer to the information set forth under the caption “Segment Results from Continuing Operations” in “Management’s Discussion and Analysis of Financial Condition and Results of Operations,” below.
| (Dollars in millions) |
Fiscal Year |
Consumer Receivables |
Personal Injury Claims |
Structured Settlements |
GAR Disability Advocates |
Corporate | Total Company |
|||||||||||||||||||||
| Revenues |
2014 | $ | 19.8 | $ | 7.2 | $ | 5.2 | $ | — | $ | — | $ | 32.2 | |||||||||||||||
| 2013 | 31.8 | 6.4 | — | — | — | 38.2 | ||||||||||||||||||||||
| 2012 | 40.8 | 1.6 | — | — | — | 42.4 | ||||||||||||||||||||||
| Other income |
2014 | 26.1 | — | — | 0.4 | 1.4 | 27.9 | |||||||||||||||||||||
| 2013 | — | — | — | — | 1.6 | 1.6 | ||||||||||||||||||||||
| 2012 | — | — | — | — | 2.3 | 2.3 | ||||||||||||||||||||||
4
Table of Contents
| (Dollars in millions) |
Fiscal Year |
Consumer Receivables |
Personal Injury Claims |
Structured Settlements |
GAR Disability Advocates |
Corporate | Total Company |
|||||||||||||||||||||
| Income before income taxes |
2014 | $ | 18.9 | $ | 2.3 | $ | 0.4 | $ | (2.7 | ) | $ | (7.9 | ) | $ | 11.0 | |||||||||||||
| 2013 | 10.1 | 2.0 | — | (1.2 | ) | (7.6 | ) | 3.3 | ||||||||||||||||||||
| 2012 | 23.1 | 0.1 | — | — | (6.4 | ) | 16.8 | |||||||||||||||||||||
| — | ||||||||||||||||||||||||||||
| Total assets |
2014 | 30.5 | 34.0 | 38.5 | 1.0 | 113.1 | 217.1 | |||||||||||||||||||||
| 2013 | 65.4 | 36.8 | — | 0.2 | 109.1 | 211.5 | ||||||||||||||||||||||
| 2012 | 96.3 | 21.5 | — | — | 119.8 | 237.6 | ||||||||||||||||||||||
Principal Markets and Methods of Distribution
All of the Company’s lines of business are principally conducted in the United States, with some investments overseas.
Consumer receivables
Prior to purchasing a portfolio, we perform a qualitative and quantitative analysis of the underlying receivables and calculate the purchase price which is intended to offer us an adequate return on our investment after servicing expenses. After purchasing a portfolio, we actively monitor performance and review and adjust our collection and servicing strategies accordingly.
We purchase receivables from credit grantors and others through privately negotiated direct sales, brokered transactions and auctions in which sellers of receivables seek bids from several pre-qualified debt purchasers. We fund portfolios through a combination of internally generated cash flow and bank debt, if needed.
Our objective is to maximize our return on investment in acquired consumer receivable portfolios. As a result, before acquiring a portfolio, we analyze the portfolio to determine how to best maximize collections in a cost efficient manner and decide whether to use our internal servicing and collection department, third-party collection agencies, attorneys, or a combination of all three options.
When we outsource the servicing of receivables, our management typically determines the appropriate third-party collection agencies and attorneys based on the type of receivables purchased. Once a group of receivables is sent to third-party collection agencies and attorneys, our management actively monitors and reviews the third-party collection agencies’ and attorneys’ performance on an ongoing basis. Based on portfolio performance considerations, our management will either (i) move certain receivables from one third-party collection agency or attorney to another, or (ii) sell portions of the portfolio accounts. Our internal collection unit, which currently employs approximately five collection-related staff, including senior management, assists us in benchmarking our third-party collection agencies and attorneys, and provides us with greater flexibility for servicing a percentage of our consumer receivable portfolios in-house.
We are a Delaware corporation whose principal executive offices are located at 210 Sylvan Avenue, Englewood Cliffs, New Jersey 07632. We were incorporated in New Jersey on July 7, 1994 and were reincorporated in Delaware on October 12, 1995, as the result of a merger with a Delaware corporation. We were formed as an affiliate of Asta Group, Incorporated (the “Family Entity”), an entity owned by Arthur Stern, our Chairman Emeritus, Gary Stern, our Chairman, President and Chief Executive Officer, and other members of the Stern family, to purchase, at a small discount to face value, retail installment sales contracts secured by motor vehicles. We became a public company in November 1995. In 1999, we capitalized on our management’s almost 50 years of experience and expertise in acquiring and managing consumer receivable portfolios for the Family Entity. As a result, we ceased purchasing automobile contracts and, with the assistance and financial support of the Family Entity and a partner, purchased our first significant consumer receivable portfolio. Since then, the Family Entity ceased acquiring consumer receivable portfolios and, accordingly, does not compete with the Company.
5
Table of Contents
Personal injury claims
Pegasus conducts its business solely in the United States. Pegasus obtains its business from external brokers and internal sales professionals soliciting individuals with personal injury claims. Business is also obtained from the Pegasus web site and through attorneys.
Structured settlements
CBC purchases structured settlement and annuity policies through privately negotiated direct consumer purchases and brokered transactions across the United States. CBC funds the purchases primarily from cash and its line of credit.
Social security benefit advocacy
GAR Disability Advocates provides its disability advocacy services throughout the United States. It relies upon search engine optimization (“SEO”) to bring awareness to its intended market.
Industry Overview
Consumer receivables
The purchasing, servicing and collection of charged-off, semi-performing and performing consumer receivables is an industry that is driven by:
| • | increasing levels of consumer debt; |
| • | increasing defaults of the underlying receivables; and |
| • | increasing utilization of third-party providers to collect such receivables. |
Personal injury claims
The funding of personal claims is driven by the growth of the market for financing personal injury claims. Individuals with personal injury claims incur current cash obligations which will not be recouped until insurance settlements are paid. The demand for providing financing to individuals in need of short term funds pending insurance settlements of their personal injury claims is driven by the long periods of time taken by the insurance industry to settle and pay such claims, due to lengthy litigation and the court process.
Structured settlements
The investment in structured settlements is driven by the direct-to-consumer model. The structured settlement market became organized under the Model Act in 2001 and now 47 states abide by the guidelines. The underlying basis for a structured settlement transaction is a court order.
Social security benefit advocacy
The disability advocate industry is driven by the increasing number of disability applicants who find it difficult to obtain such benefits without the aid of third party assistance.
Strategy
Consumer receivables
Although we are in a challenging economic period and an enhanced regulatory environment, our primary objective remains to utilize our management’s experience and expertise by identifying, evaluating, pricing and acquiring consumer receivable portfolios and maximizing collections of such receivables in a cost efficient manner. Our strategies include:
| • | managing the collection and servicing of our consumer receivable portfolios, including outsourcing a majority of those activities to maintain low fixed overhead; |
6
Table of Contents
| • | selling accounts on an opportunistic basis, generally when our efforts have been exhausted through traditional collecting methods, or when we can capitalize on pricing during times when we feel the pricing environment is high; and |
| • | capitalizing on our strategic relationships to identify and acquire consumer receivable portfolios as pricing, financing and conditions permit. |
Because our purchases of new portfolios of consumer receivables have been reduced, we have experienced a corresponding reduction in finance income which we expect will continue in future quarters and future years, to the extent we have not replaced our receivables acquired for liquidation. Instead, we have focused on reducing our debt and being highly disciplined in our portfolio purchases. We continue to review potential portfolio acquisitions regularly and will buy at a price that we believe will yield our desired rate of return.
Personal injury claims
Pegasus intends to maintain its business through its attorneys, brokers and sales contacts.
Structured settlements
The success of CBC is tied to its ability to efficiently deploy marketing expenditures, negotiate the purchase of deferred cash flows at attractive yields and obtain asset based financing at competitive rates.
Social security benefit advocacy
GAR Disability Advocates intends to expand its business through the substantial use of the internet, by increasing consumer awareness of its existence on various government websites. It also intends to explore expansion into related business opportunities.
Consumer Receivables Business
Receivables Purchase Program
We have purchased in bulk receivable portfolios that include charged-off receivables, semi-performing receivables and performing receivables. These receivables consist primarily of MasterCard®, Visa® and private label credit card accounts, among other types of receivables.
In the past we have acquired, directly and indirectly, through the consumer receivable portfolios that we acquire, secured consumer asset portfolios, consisting primarily of receivables secured by automobiles.
We identify potential portfolio acquisitions on an ongoing basis through:
| • | our relationships with industry participants, financial institutions, collection agencies, investors and our financing sources; |
| • | brokers who specialize in the sale of consumer receivable portfolios; and |
| • | other sources. |
Historically, the purchase prices of the consumer receivable portfolios we have acquired have ranged from less than $100,000 to approximately $15,000,000; however, we acquired one group of portfolios in March 2007 for $300 million (the “Portfolio Purchase”). As a part of our strategy to acquire consumer receivable portfolios, we have, from time to time, entered into, participation and profit sharing agreements with our sources of financing and our third-party collection agencies and attorneys. These arrangements may take the form of a joint bid with one of our third-party collection agencies, collection attorneys, or financing sources that assist in the acquisition of a portfolio. This joint bid provides us with more favorable non-recourse financing terms or a discounted servicing commission. Current participation agreements include an approximate 50% sharing arrangement after we have recouped 100% of the cost of the portfolio purchase plus the cost of funds.
7
Table of Contents
We utilize our relationships with brokers, third-party collection agencies and attorneys, and sellers of portfolios to locate portfolios for purchase. Our senior management is responsible for:
| • | coordinating due diligence, including, in some cases, on-site visits to the seller’s office; |
| • | stratifying and analyzing the portfolio characteristics; |
| • | valuing the portfolio; |
| • | preparing bid proposals; |
| • | negotiating pricing and terms; |
| • | negotiating and executing a purchase contract; |
| • | closing the purchase; and |
| • | coordinating the receipt of account documentation for the acquired portfolios. |
The seller or broker typically supplies us with either a sample listing or the actual portfolio being sold, through an electronic form of media. We analyze each consumer receivable portfolio to determine if it meets our purchasing criteria. We may then prepare a bid or negotiate a purchase price. If a purchase is completed, management monitors the portfolio’s performance and uses this information in determining future buying criteria including pricing. An integral part of the acquisition process is the oversight by our Investment Committee. This committee, established in January 2008, must review and approve all investments above $1 million in value. Voting criteria are more stringent as the size of the investment increases. The current members of the investment committee are the the Chief Executive Officer, the Chief Financial Officer, the Senior Vice President, Vice President of Business Development/Support and the General Counsel and Chief Compliance Officer. As the Chairman Emeritus, Chief Executive Officer and Senior Vice President are related family members, at least one other officer must approve transactions.
After determining that an investment should yield an adequate return on our acquisition cost after servicing fees, including court costs, we use a variety of qualitative and quantitative factors to calculate the estimated cash flows. The following variables are analyzed and factored into our original estimates:
| • | the number of collection agencies previously attempting to collect the receivables in the portfolio; |
| • | the average balance of the receivables; |
| • | the age of the receivables (as older receivables might be more difficult to collect or might be less cost effective); |
| • | past history of performance of similar assets — as we purchase portfolios of similar assets, we believe we have built significant history on how these receivables will liquidate and cash flow; |
| • | number of months since charge-off; |
| • | payments made since charge-off; |
| • | the credit originator and their credit guidelines; |
| • | the locations of the customers as there are states with better regulatory environments, better collection histories, which are better suited to attempt to collect in and, ultimately we have better predictability of the liquidations and the expected cash flows, all of which factor into our cash flow analysis; |
| • | financial wherewithal of the seller; |
| • | jobs or property of the customers within portfolios — this is of particular importance. Customers with jobs or property are more likely to repay their obligation and, conversely, customers without jobs or property are less likely to repay their obligation; and |
| • | the ability to obtain customer statements from the original issuer. |
8
Table of Contents
We obtain and utilize, as appropriate, input including, but not limited to, monthly collection projections and liquidation rates from our third party collection agencies and attorneys, as further evidentiary matter, to assist us in developing collection strategies and in modeling the expected cash flows for a given portfolio.
Once a receivable portfolio has been identified for potential purchase, we prepare various analyses based on extracting customer level data from external sources, other than the issuer, to analyze the potential collectability of the portfolio. We also analyze the portfolio by comparing it to similar portfolios previously acquired by us. In addition, we perform qualitative analyses of other matters affecting the value of portfolios, including a review of the delinquency, charge off, placement and recovery policies of the originator as well as the collection authority granted by the originator to any third-party collection agencies, and, if possible, by reviewing their recovery efforts on the particular portfolio. After these evaluations are completed, members of our senior management discuss the findings, decide whether to make the purchase and finalize the price at which we are willing to purchase the portfolio.
Once a consumer receivable portfolio is identified the purchase is primarily directly from originators and other sellers including, from time to time, our third-party collection agencies and attorneys, through (i) privately negotiated direct sales, and (ii) through auction-type sales in which sellers of receivables seek bids from several pre-qualified debt purchasers. We also, from time to time, use the services of brokers for sourcing consumer receivable portfolios. We consider a variety of factors in determining whether potential seller may be a source of receivables, a variety of factors are considered. Sellers must demonstrate that they have:
| • | adequate internal controls to detect fraud; |
| • | the ability to provide post-sale support; and |
| • | the capacity to honor put-back and return warranty requests. |
Generally, our portfolio purchase agreements provide that we can return certain accounts to the seller within a specified time period. However, in some transactions, we may acquire a portfolio with few, if any, rights to return accounts to the seller.
After acquiring a portfolio, we conduct a detailed analysis to determine which accounts in the portfolio should be returned to the seller. Although the terms of each portfolio purchase agreement differ, examples of accounts that may be returned to the seller include:
| • | debts paid prior to the cutoff date; |
| • | debts in which the consumer filed bankruptcy prior to the cutoff date; |
| • | debts in which the consumer was deceased prior to cutoff date; and |
| • | fraudulent accounts. |
We have determined that all accounts returned to sellers for fiscal years 2014, 2013 and 2012 are immaterial. Our purchase agreements generally do not contain any provision for a limitation on the number of accounts that we may return to the seller.
We generally use third parties to determine bankrupt and deceased accounts, allowing us to focus our resources on portfolio collections. Under a typical portfolio purchase agreement, the seller refunds the portion of the purchase price attributable to the returned accounts or delivers replacement receivables to us. Occasionally, we will acquire a well-seasoned or older portfolio at a reduced price from a seller that is unable to meet all of our purchasing criteria. When we acquire such portfolios, the purchase price is further discounted beyond the typical discounts we receive on the portfolios we purchase.
VATIV, our wholly-owned subsidiary located in Houston, Texas, provides bankruptcy account servicing. VATIV provides us with internal experience and proprietary systems in support of servicing our own bankruptcy accounts, while also affording us the opportunity to enter new markets for acquisitions in the bankruptcy account field.
9
Table of Contents
Receivable Servicing
Our objective is to maximize our return on investment on acquired consumer receivable portfolios. As a result, before acquiring a portfolio, we analyze the portfolio to determine how to best maximize collections in a cost efficient manner and decide whether to use a third-party collection agency or an attorney.
Therefore, if we are successful in acquiring the portfolio, we can promptly process the receivables that were purchased and commence the collection process. Unlike collection agencies that typically have only a specified period of time to recover a receivable, as the portfolio owner, we have significantly more flexibility and can establish payment programs.
We presently outsource a significant amount of our receivable servicing to third-party collection agencies and attorneys. Our senior management typically determines the appropriate third-party collection agency and attorney based on the type of receivables purchased. Once a group of receivables is sent to a third-party collection agency or attorney, our management actively monitors and reviews the third-party collection agency’s and attorney’s performance on an ongoing basis. Our management receives detailed analyses, including collection activity and portfolio performance, from our internal servicing departments for the purpose of evaluating the results of the efforts of the third-party collection agencies and attorneys. Based on portfolio performance guidelines, our management will reassign certain receivables from one third-party collection agency or attorney to another if we believe such change will enhance collections.
At September 30, 2014, approximately 37% of our portfolio face value was serviced by five collection organizations. We have servicing agreements in place with these five collection organizations as well as all other third-party collection agencies and attorneys. These servicing agreements cover standard contingency fees and servicing of the accounts.
Litigation Funding Business
On December 28, 2011, the Company purchased an 80% interest in Pegasus. Pegasus Legal Funding (“PLF”) holds the other 20% interest. The Company is committed to loan up to $22.4 million per year to Pegasus for a term of five (5) years, all of which is secured by the assets of Pegasus. These loans will provide financing for the personal injury litigation claims and operating expenses of Pegasus.
Pegasus is actively managed by personal injury litigation funders who rely upon strict underwriting criteria to provide legal funding to personal injury plaintiffs prior to the settlement of their claims or their resolution in court. The Pegasus business model entails the outlay of non-recourse advances to a plaintiff with an agreed-upon fee structure to be repaid from the plaintiff’s recovery. Typically, such advances to a plaintiff approximate 10-20% of the anticipated recovery. These funds are generally used by the plaintiff for a variety of urgent necessities, ranging from surgical procedures to everyday living expenses.
Pegasus’s profits and losses will be distributed at 80% to the Company and 20% to PLF. These distributions will be made only after the repayment of the principal amount loaned, plus an amount equal to advances for overhead expenses. While the overall returns to the joint venture are currently estimated to be in excess of 20% per annum, The Company reserves the right to terminate the Pegasus Operating Agreement if returns to the Company for any rolling twelve (12) month period, after the first year of operations, do not exceed 15%. The Company has an invested value of approximately $32.4 million in personal injury cases as of September 30, 2014.
The success of Pegasus is tied to several issues — the ability to obtain cases directly or through brokers, as well as the ability to carefully assess the viability of each case in accordance with underwriting guidelines established by the management of Pegasus. See Risk Factor- We are subject to various risks in connection with our litigation funding business.
On May 18, 2012, we announced the formation of BP Case Management, LLC (“Balance Point”), a joint venture (the “Venture”) with California-based Balance Point Divorce Funding, LLC (“Balance Point
10
Table of Contents
Management”). The Venture provides non-recourse funding to a spouse in a matrimonial action where the marital assets exceed $2,000,000. Such funds can be used for legal fees, expert costs and necessary living expenses. The Venture receives an agreed percentage of the proceeds received by such spouse upon final resolution of the case. Balance Point’s profits and losses will be distributed 60% to us and 40% to Balance Point Management, after the return of our investment on a case by case basis and after a 15% preferred return to us. Our initial investment in the Venture consists of up to $15 million to fund divorce claims to be fulfilled in three tranches of $5 million. Each investment tranche is contingent upon a minimum 15% cash-on-cash return to us. At our option, there could be an additional $35 million investment in divorce claims in tranches of $10 million, $10 million, and $15 million, also with a 15% preferred return and such investments may even exceed a total of $50 million, at our sole option. Should the preferred return be less than 15% on any $5 million tranche, the 60%/40% profit and loss split would be adjusted to reflect our priority to a 15% preferred return. As September 30, 2014 we have invested $2.4 million in cases managed by this Venture.
In 2012, we provided a $1.0 million revolving line of credit to partially fund Balance Point Management’s operations with such loan bearing interest at the prevailing prime rate, with an initial term of twenty-four months. In September 2014 the agreement was revised to extend the term of the loan to August 2016, increase the credit line to $1.5 million and include a personal guarantee of the principal of Balance Point Management. The revolving line of credit is collateralized by Balance Point Management’s profits share in the Venture and other assets. At September 30, 2014, the balance on the revolving line of credit was approximately $1.5 million.
Structured Settlement Business
On December 31, 2013, the Company acquired 80% ownership of CBC and its affiliate, CBC Management Services, LLC for approximately $5.9 million. In addition, the Company will provide financing to CBC of up to $5 million.
CBC purchases periodic payments under structured settlements and annuity policies from individuals in exchange for a lump sum payment. The operating principals of CBC, William J. Skyrm, Esq. and James Goodman, have over 30 years combined experience in the structured settlement s industry and remain as the management of CBC.
CBC has a portfolio of structured settlements which is financed by approximately $32.3 million of debt, including a $22.0 million line of credit from an institutional source (approximately $2.4 million of the line was unused as of September 30, 2014) and notes issued by CBC to third party investors. At September 30, 2014 the Company has an invested value of $42.1 million in structured settlements.
Operations
Consumer Receivables
The Operations Servicing Division of consumer receivables consists of the Collection Department, which handles disputes and correspondence, and the Accounting and Finance Department.
Collection Department
The Collection Department is responsible for making contact with and receiving calls from consumers for the purpose of collecting upon the accounts contained in our consumer receivables portfolios. Collection efforts are specific to accounts that are not yet being serviced by our network of external agencies and attorneys. The Collection Department uses a friendly, customer service approach to collect receivables and utilizes collection software, a dialer and telephone system to accomplish this goal. Each collector is responsible for:
Initiating outbound collection calls and handling incoming calls from the consumer;
Identifying the debt and iterating the benefits of paying the obligation;
Working with the customer to develop acceptable means of satisfying the obligation; and
Offering (if necessary, and based upon the individual situation) an obligor a discount on the overall obligation.
11
Table of Contents
Additionally, the Collection Department utilizes a series of collection letters, late payment reminders and settlement offers that are sent out at specific intervals or at the request of a member of the Collection Department. If the Collection Department cannot contact the customer by either telephone or mail, the account is skip-traced through an automated process to obtain the most recent contact information for the customer. This process employs usage of data supplied by a variety of third party databases. Once new contact information is obtained, the account is referred back to the Collection Department and collection activity is once again initiated.
Other members of the Collection Department are responsible for:
Coordinating customer inquiries and assisting the collection agencies in their processes, if needed;
Handling the repurchase process of ineligible accounts received from a seller that may be included in a purchased portfolio;
Working with buyers during the transition period and post-sale process;
Handling any issues that may arise once a purchased receivable portfolio is sold; and
Reading incoming correspondence for accounts that are currently assigned to the Collection Department, ensuring the account is handled properly, taking the initial action required and forwarding to a collector and/or manager for follow up action.
Other responsibilities of the Collection Department include media requests, dispute resolution and correspondence activities.
Accounting and Finance Department
In addition to the customary accounting activities, the Accounting and Finance Department is responsible for:
Making daily deposits of customer payments;
Posting payments to customers accounts; and
Providing senior management with daily, weekly and monthly receivable activity and performance reports.
Accounting and finance employees assist collection department employees in handling customer disputes relating to payment and balance information and handling the repurchase requests from companies to whom we have sold receivables.
Additionally, the Accounting Department reviews the results of the collection of consumer receivable portfolios that are being serviced by third party collection agencies and attorneys. The Accounting and Finance Department also participates in the internal auditing of all business segments.
Personal Injury Claims
The operations structure of the personal injury claims unit of Pegasus Funding, LLC includes:
Sales — the sales group is responsible for business development and generating leads for possible funding of personal injury cases.
Underwriting — The underwriting group is responsible for analyzing the merits of the personal injury claims presented for possible funding.
Accounting — The accounting group is responsible for the reporting of all the financial operations of the personal injury claims unit.
Structured Settlements
The operations structure of the structured settlements unit of CBC Settlement, LLC includes:
Operations — Underwriting/Collections — The Operations Department is responsible for underwriting, processing and collecting structured settlement and annuity transactions.
12
Table of Contents
Marketing — The Marketing Group is responsible for researching various court records to secure information to follow up for possible structured settlement cases.
Sales — The Sales Group is responsible for the sales strategy and advertising campaigns of CBC.
Accounting — The accounting group is responsible for the reporting of all the financial operations of the structured settlement unit.
Social security benefit advocacy
GAR Disability Advocates consists of the following departments:
Intake — The Intake Department is responsible for client development, including screening leads and developing information on individual cases.
Case Management — The Case Management Department processes approved cases through the Social Security Disability process.
Consumer Receivables — Collections Represented by Account Sales
Certain collections represent account sales to other debt buyers to help maximize revenue and cash flows. We believe that our business model of not having a large number of collectors, coupled with a legal strategy which is focused on attempting to perfect liens and judgments against obligors, allows us the flexibility to sell accounts at prices that are attractive to us, and, just as important, sell the less desirable accounts within our collection portfolios. There are many factors that contribute to the decision as to which receivable to sell and which to service, including:
| • | the age of the receivable; |
| • | the status of the receivable — whether paying or non-paying; and |
| • | the selling price. |
Net collections represented by account sales for the fiscal years ended September 30, 2014, 2013 and 2012 were $0.1 million, $2.4 million and $0.1 million, respectively. Collections represented by account sales as a percentage of total collections for the fiscal years ended September 30, 2014, 2013 and 2012 was 0.3%, 4.5%, and 0.2%, respectively.
Marketing
Consumer receivables
Our consumer debt portfolio purchases were five portfolio purchases in fiscal year 2014; however, we have maintained our established relationships with brokers who market consumer receivable portfolios from banks, finance companies and other credit providers. In addition, we subscribe to national publications that list consumer receivable portfolios for sale. We also directly contact banks, finance companies or other credit providers to solicit consumer receivables for sale.
Personal injury claims
Pegasus does not invest in a formal marketing program at this time. It relies on external brokers, internal sales professionals and attorneys to maintain its market share.
Structured settlements
CBC purchases deferred cash flow receivables through retail and wholesale channels. CBC invests in direct to consumer marketing, including, but not limited to, on line, television and direct mail.
Social security benefit advocacy
GAR Disability Advocates utilizes search engine optimization (“SEO”) to bring more awareness to prospective clients.
13
Table of Contents
Competition
Consumer receivables
Our business of purchasing distressed consumer receivables is highly competitive and fragmented, and we expect that competition from new and existing companies will continue. We compete with:
| • | other purchasers of consumer receivables, including third-party collection companies; and |
| • | other financial services companies who purchase consumer receivables. |
Some of our competitors are larger and more established and may have substantially greater financial, technological, personnel and other resources than we have, including greater access to the credit and capital markets. We believe that no individual competitor or group of competitors has a dominant presence in the market.
We compete in the marketplace for consumer receivable portfolios based on many factors, including:
| • | purchase price; |
| • | representations, warranties and indemnities requested; |
| • | timeliness of purchase decisions; and |
| • | reputation. |
Our strategy is designed to capitalize on the market’s lack of a dominant industry player. We believe that our management’s experience and expertise in identifying, evaluating, pricing and acquiring consumer receivable portfolios and managing collections, coupled with our strategic alliances with third-party collection agencies and attorneys and our sources of financing, give us a competitive advantage. However, we cannot assure that we will be able to compete successfully against current or future competitors or that competition will not increase in the future.
The litigation funding business is highly competitive and fragmented, and we expect that competition from new and existing companies will continue. We compete in the litigation funding marketplace based on many factors, including:
cost of funds lent;
application Fee costs;
broker’s commissions and bonuses paid;
reputation; and
direct and on-line marketing.
Personal injury claims
We believe that the managements of Pegasus has the expertise and experience in identifying, evaluating, pricing and acquisition of litigating funding cases. However, we cannot assure that our litigation funding businesses will be able to compete against current or future competitors or that competition will not increase in the future.
Structured settlements
CBC competes with brokers and other direct purchasers of deferred consumer receivables. We compete in the marketplace for the purchase of structured settlement and annuity cash flows on many factors, including purchase price, reputation, effectiveness of marketing message and reach. We expect competition from new and existing companies to continue. Some of our competitors are larger and more established and may have substantially greater financial, technological, personnel and other resources than we have, including greater access to credit and capital markets. We believe that one of our competitors may account for 50% or more of the industry volume and that the remaining competitors are fragmented.
14
Table of Contents
Social security benefit advocacy
The social security benefit advocacy environment is competitive. We believe our GAR Disability Advocates management has the knowledge to compete in this environment. Nevertheless, we can offer no assurance that the business will remain competitive against current and future competitors.
Seasonality and Trends
Consumer receivables
Our management believes that our operations may, to some extent, be affected by high delinquency rates and by lower recoveries on consumer receivables acquired for liquidation during or shortly following certain holiday periods and during the summer months.
Personal injury claims
There are no discernable trends to indicate seasonality in the personal injury claims business.
Structured settlements
The purchase of deferred payment obligations is not significantly impacted by the time of year and consumer demand for advance funding remains reasonably constant.
Social security benefit advocacy
There is no indication that seasonality has any noticeable impact on GAR Disability Advocates.
Technology
Consumer receivables
We believe that a high degree of automation is necessary to enable us to grow and successfully compete with other finance companies. Accordingly, we continually look to upgrade our technology systems to support the servicing and recovery of consumer receivables acquired for liquidation. Our telecommunications and technology systems allow us to quickly and accurately process large amounts of data necessary to purchase and service consumer receivable portfolios. In addition, we rely on the information technology of our third-party collection agencies and attorneys and periodically review their systems to ensure that they can adequately service the consumer receivable portfolios outsourced to them.
Due to our desire to increase productivity through automation, we periodically review our systems for possible upgrades and enhancements. We installed a new collection system during fiscal year 2014.
Personal injury claims
Pegasus is dependent on its website to maintain and increase its business and, therefore, must remain current with technology.
Structured settlements
CBC recognizes that a high level of automation is required to continue to grow and compete within the industry. CBC has invested significantly in technology since its inception and particularly in its customer relationship management (“CRM”) system in order to maximize large quantities of information. This technology provides CBC management with the necessary tool to optimize its processes to improve its efficiency. CBC will continue to invest in technology.
Social security benefit advocacy
GAR Disability Advocates relies on substantial use of the internet and, therefore, endeavors to remain current technologically.
15
Table of Contents
Government Regulation
Consumer receivables
Our businesses are subject to extensive federal and state regulations. The relationship of a consumer and a creditor is extensively regulated by federal, state and local laws, rules, regulations and ordinances. These laws include, but are not limited to, the following federal statutes and regulations: the Federal Truth-In-Lending Act, the Fair Credit Billing Act (“FCBA”), the Equal Credit Opportunity Act and the Fair Credit Reporting Act (“FCRA”), as well as comparable statutes in states where consumers reside and/or where creditors are located. Among other things, the laws and regulations applicable to various creditors impose disclosure requirements regarding the advertisement, application, establishment and operation of credit card accounts or other types of credit programs. Federal law requires a creditor to disclose to consumers, among other things, the interest rates, fees, grace periods and balance calculation methods associated with their accounts. In addition, consumers are entitled to have payments and credits applied to their accounts promptly, to receive prescribed notices and to request that billing errors be resolved promptly. In addition, some laws prohibit certain discriminatory practices in connection with the extension of credit. Further, state laws may limit the interest rate and the fees that a creditor may impose on consumers. Failure by the creditors to comply with applicable laws could create claims and rights of offset by consumers that would reduce or eliminate their obligations, which could have a material adverse effect on our operations. Pursuant to agreements under which we purchase receivables, we are typically indemnified against losses resulting from the failure of the creditor to have complied with applicable laws relating to the receivables prior to our purchase of such receivables.
Certain laws, including the laws described above, may limit our ability to collect amounts owing with respect to the receivables regardless of any act or omission on our part. For example, under the FCBA, a credit card issuer may be subject to certain claims and defenses arising out of certain transactions in which a credit card is used if the consumer has made a good faith attempt to obtain satisfactory resolution of a problem relative to the transaction and, except in cases where there is a specified relationship between the person honoring the card and the credit card issuer, the amount of the initial transaction exceeds $50 and the place where the initial transaction occurred was in the same state as the consumer’s billing address or within 100 miles of that address. Accordingly, as a purchaser of defaulted receivables, we may purchase receivables subject to valid defenses on the part of the consumer. Other laws provide that, in certain instances, consumers cannot be held liable for, or their liability is limited to $50 with respect to, charges to the credit card credit account that were a result of an unauthorized use of the credit card account. No assurances can be given that certain of the receivables were not established as a result of unauthorized use of a credit card account, and, accordingly, the amount of such receivables may not be collectible by us.
Several federal, state and local laws, rules, regulations and ordinances, including, but not limited to, the Fair Debt Collection Practices Act (“FDCPA”) and the Federal Trade Commission Act and comparable state statutes, regulate consumer debt collection activity. Although, for a variety of reasons, we may not be specifically subject to the FDCPA or certain state statutes that govern third-party debt collectors, it is our policy to comply with applicable laws in our collection activities. Additionally, our third-party collection agencies and attorneys may be subject to these laws. To the extent that some or all of these laws apply to our collection activities or our third-party collection agencies’ and attorneys’ collection activities, failure to comply with such laws could have a material adverse effect on us.
In order to comply with the foregoing laws and regulations, we provide a comprehensive development training program for our new collection/dispute department representatives and on-going training for all collection/dispute department associates. All collection and dispute representatives are tested annually on their knowledge of the FDCPA and other applicable laws. Account representatives not achieving our minimum standards are required to complete a FDCPA review session and are then retested. In addition, annual supplemental instruction in the FDCPA and collection techniques is provided to all our account representatives.
On July 21, 2010, the Dodd-Frank Wall Street Reform and Protection Act, or the Dodd-Frank Act, was enacted. There are significant corporate governance and executive compensation-related provisions in the Dodd-Frank Act that require the SEC to adopt additional rules and regulations in areas such as corporate governance,
16
Table of Contents
“say on pay” and proxy access. Our efforts to comply with these requirements have resulted in, and are likely to continue to result in, an increase in expenses and a diversion of management’s time from other business activities. We are subject to changing rules and regulations of federal and state governments, the Public Company Accounting Oversight Board (“PCAOB”), the Financial Industry Regulatory Authority, Inc. (“FINRA”) and NASDAQ, all of which have issued a significant number of new and increasingly complex requirements and regulations over the course of the last several years and continue to develop additional regulations and requirements in response to laws enacted by Congress.
The enactment of the Dodd-Frank Act will subject us to substantial additional federal regulation, and we cannot predict the effect of such regulation on our business, results of operations, cash flows or financial condition. Through the Dodd-Frank Act, Congress established the Consumer Financial Protection Bureau (the “CFPB”), which has regulatory, supervisory and enforcement authority over entities involved in consumer financial markets. The CFPB has the authority to conduct periodic examinations of “larger participants” in each market, and we believe it is likely that we will be subject to an examination.
The CFPB published a final rule on October 24, 2012, that allows the agency to federally supervise the larger consumer debt collectors. The CFPB also released the field guide that examiners will use to ensure that companies and banks engaging in debt collection are following the law.
The consumer debt collection market covered by the rule includes three main types of debt collectors: first, firms that may buy defaulted debt and collect the proceeds for themselves; second, firms that may collect defaulted debt owned by another company in return for a fee; and third, debt collection attorneys that collect through litigation. A single company may be involved in any or all of these activities.
The CFPB’s supervisory authority over these entities began when the rule took effect on January 2, 2013. Under the rule, any firm that has more than $10 million in annual receipts from consumer debt collection activities will be subject to the CFPB’s supervisory authority. This authority will extend to about 175 debt collectors, which, according to the CFPB, account for over 60 percent of the industry’s annual receipts in the consumer debt collection market.
Pursuant to the CFPB’s supervisory authority, examiners will be assessing potential risks to consumers and whether debt collectors are complying with requirements of federal consumer financial law. Among other things, examiners will be evaluating whether debt collectors provide required disclosures; use accurate information; maintain a consumer complaint and dispute resolution process; and communicate with consumers in the manner required by law.
The CFPB’s general Supervision and Examination Manual, as well as its examination manual specific to the debt collection market, provide guidance on how the Bureau will be conducting its monitoring of debt collection activities. Examiners will evaluate the quality of the regulated entity’s compliance management systems, review practices to ensure they comply with federal consumer financial law, and identify risks to consumers throughout the debt collection process. The CFPB can seek relief that includes: rescission or reformation of contracts, restitution, disgorgement of profits, payment of damages, limits on activities and civil money penalties of up to $1 million per day for knowing violations.
As a company that engages in debt collection, we need to be prepared for the heavy oversight that the CFPB will bring. Preparing for a CFPB audit will cost time and money. Additionally, the CFPB has the power to bring an enforcement action or cause a required settlement. Another large concern is the amount of privileged and confidential information the CFPB could release, which can lead to private lawsuits — including class and mass actions — as well as other state and federal agency oversight.
The CFPB is expressly charged with prohibiting unfair, deceptive or abusive acts or practices. Through its broad powers to regulate and enforce federal consumer financial laws, the CFPB could place restrictions on our business, the businesses of our customers and the business of our affiliates, if the CFPB were to determine through rulemaking, supervisory or enforcement actions, for example, that particular acts or practices were unfair, deceptive or abusive to consumers.
The CFPB will thus exercise supervisory authority over us. At this time, it is not possible or practical to attempt to provide a comprehensive analysis of how these new laws and regulations may impact debt collectors.
17
Table of Contents
Additionally, the Dodd-Frank Act empowers state attorneys general (or the equivalent thereof) to bring civil actions in federal district court (or a state court that is located in that state and that has jurisdiction over the defendant), to enforce Title X of the Act or regulations issued by the CFPB thereunder. Therefore, we could also be the subject of investigations and enforcement actions by the Federal Trade Commission or by state agencies (e.g., state attorneys general) with powers to enforce CFPB regulations and the FCRA.
The Dodd-Frank Act authorized the CFPB to prescribe rules interpreting the FDCPA. On November 12, 2013, the CFPB signaled its intention to promulgate substantive rules under the FDCPA by publishing an Advance Notice of Proposed Rulemaking (ANPR) with regard to debt collection practices. The ANPR requested comments with regard to a wide array of issues relating to debt collection. The comment period closed on February 28, 2014. The CFPB is continuing to review the comments and has not yet issued a proposed rule.
The Company has and will continue to have a substantive compliance program and maintain procedures to ensure that the law is followed and that consumer complaints are dealt with in an appropriate fashion.
Additional laws or amendments to existing laws, may be enacted that could impose additional restrictions on the servicing and collection of receivables. Such new laws or amendments may adversely affect our ability to collect the receivables.
We currently hold a number of licenses issued under applicable consumer credit laws or other licensing statutes or regulations. Certain of our current licenses, and any licenses that we may be required to obtain in the future, may be subject to periodic renewal provisions and/or other requirements. Our inability to renew licenses or to take any other required action with respect to such licenses could have a material adverse effect upon our results of operation and financial condition.
Personal injury claims
Numerous states have recently introduced legislation with respect to the litigation funding business, which, up to now, has been largely unregulated. According to the National Conference of State Legislatures, 14 states had legislation pending regarding litigation financing transactions during the 2014 legislative session, and two states enacted legislation during calendar year 2014. While the legislation varies from state to state, these proposed laws generally would establish requirements for contracts relating to litigation funding, including setting maximum amounts of interest, fees and other charges that may be imposed.
Structured settlements
With respect to the structured settlement business, 48 states have enacted regulations commonly referred to as Structured Settlement Protection Acts (“SSPA’s”). The statutes generally require certain consumer disclosures as well as requiring that each transaction be filed in court and receive judicial approval. In addition to the state SSPAs, U.S. Code 5891, passed into law in 2002, imposes a 40% excise tax of 40% on any transactions not approved in compliance with the applicable SSPA.
Social security benefit advocacy
The liquidity of funds available to pay Social Security disability benefits could have a material impact on the GAR Disability Advocates business.
Employees
As of September 30, 2014, we had 80 full-time employees. We are not a party to any collective bargaining agreements.
Additional Information
Our web address is www.astafunding.com. Copies of our Form 10-Ks, 10-Qs, 8-Ks, proxy statements, amendments thereto, and other SEC reports are available on our website as soon as reasonably practical after filing electronically with the Securities and Exchange Commission . No part of our web site is incorporated by reference into this report.
18
Table of Contents
| Item 1A. | Risk Factors. |
Note Regarding Risk Factors
You should carefully consider the risk factors below in evaluating us. In addition to the following risks, there may also be risks that we do not yet know of or that we currently think are immaterial that may also impair our business operations. If any of the following risks occur, our business, results of operation or financial condition could be adversely affected, the trading price of our common stock could decline and stockholders might lose all or part of their investment. The risk factors presented below are those which we currently consider material. However, they are not the only risks facing our company. Additional risks not presently known to us, or which we currently consider immaterial, may also adversely affect us. There may be risks that a particular investor views differently from us, and our analysis might be wrong. If any of the risks that we face actually occur, our business, financial condition and operating results could be materially adversely affected and could differ materially from any possible results suggested by any forward-looking statements that we have made or might make. In such case, the trading price of our common stock could decline, and you could lose part or all of your investment. Except as required by law, we expressly disclaim any obligation to update or revise any forward-looking statements.
The enactment of the Dodd-Frank Wall Street Reform and Consumer Protection Act subjects us to substantial additional federal regulation, and we cannot predict the effect of such regulation on our business, results of operations, cash flows or financial condition.
On July 21, 2010, the Dodd-Frank Wall Street Reform and Protection Act, or the Dodd-Frank Act, was enacted. There are significant corporate governance and executive compensation-related provisions in the Dodd-Frank Act that require the SEC to adopt additional rules and regulations in these areas such as “say on pay” and proxy access. Our efforts to comply with these requirements have resulted in, and are likely to continue to result in, an increase in expenses and a diversion of management’s time from other business activities.
Given the uncertainty associated with the manner in which the provisions of the Dodd-Frank Act will be implemented by the various regulatory agencies and through regulations, the full extent of the impact such requirements will have on our operations is unclear. The changes resulting from the Dodd-Frank Act may impact the profitability of business activities, require changes to certain business practices, or otherwise adversely affect our business. In particular, the potential impact of the Dodd-Frank Act on our operations and activities, both currently and prospectively, include, among others:
| • | increased cost of operations due to greater regulatory oversight, supervision and compliance with consumer debt issuance and collection practices; and |
| • | the limitation on the ability to expand consumer product and service offerings due to anticipated stricter consumer protection laws and regulations. |
The Dodd-Frank Act establishes the CFPB, which has broad regulatory powers over debt collectors and virtually all other “covered persons” who have any connection to consumer financial products or services. The CFPB has exclusive rule-making authority with respect to all significant federal statutes that impact the collection industry, including the FDCPA, the FCRA, and others. This means, for example, that the CFPB has the ability to pass rules and regulations that interpret any of the provisions of the FDCPA, potentially impacting all facets of the collection channel. Federal agencies, including the CFPB, have been given significant discretion in drafting the rules and regulations that will implement the Dodd-Frank Act. Consequently, many of the details and much of the impact of the Dodd-Frank Act may not be known for some time. In addition, this legislation mandated multiple studies and reports for Congress, which could result in additional legislative or regulatory action.
The CFPB has the authority to conduct periodic examinations of “larger participants” in each market, and we believe it is likely that we will be subject to an examination.
We cannot predict the requirements of the regulations ultimately adopted under the Dodd-Frank Act, the effect such regulations will have on financial markets generally, or on our businesses specifically, the additional
19
Table of Contents
costs associated with compliance with such regulations, or any changes to our operations that may be necessary to comply with the Dodd-Frank Act, any of which could have a material adverse effect on our business, results of operations, cash flows or financial condition.
Government regulations may limit our ability to recover and enforce the collection of our receivables.
Federal, state and local laws, rules, regulations and ordinances may limit our ability to recover and enforce our rights with respect to the receivables acquired by us. These laws include, but are not limited to, the following federal statutes and regulations promulgated thereunder and comparable statutes in states where consumers reside and/or where creditors are located:
| • | The Fair Debt Collection Practices Act; |
| • | The Federal Trade Commission Act; |
| • | The Truth-In-Lending Act; |
| • | The Fair Credit Billing Act; |
| • | The Equal Credit Opportunity Act; |
| • | The Fair Credit Reporting Act; |
| • | The Financial Privacy Rule; |
| • | The Safeguards Rule; |
| • | Telephone Consumer Protection Act; |
| • | Health Insurance Portability and Accountability Act (“HIPAA”)/Health Information Technology for Economical and Clinical Health Act (“HITECH”); |
| • | U.S. Bankruptcy Code; and |
| • | Credit Card Accountability Responsibility and Disclosure Act of 2009. |
We may be precluded from collecting receivables we purchase where the creditor or other previous owner or third-party collection agency or attorney failed to comply with applicable law in originating or servicing such acquired receivables. Laws relating to the collection of consumer debt also directly apply to our business. Our failure to comply with any laws applicable to us, including state licensing laws, could limit our ability to recover on receivables and could subject us to fines and penalties, which could reduce our earnings and result in a default under our loan arrangements. In addition, our third-party collection agencies and attorneys may be subject to these and other laws and their failure to comply with such laws could also materially adversely affect our finance income and earnings.
Additional laws or amendments to existing laws may be enacted that could impose additional restrictions on the servicing and collection of receivables. Such new laws or amendments may adversely affect the ability to collect on our receivables, which could also adversely affect our finance income and earnings.
Because our receivables are generally originated and serviced pursuant to a variety of federal, state and/or local laws by a variety of entities and may involve consumers in all 50 states, the District of Columbia, Puerto Rico and South America, there can be no assurance that all originating and servicing entities have, at all times, been in substantial compliance with applicable law. Additionally, there can be no assurance that we or our third-party collection agencies and attorneys have been or will continue to be at all times in substantial compliance with applicable law. Failure to comply with applicable law could materially adversely affect our ability to collect our receivables and could subject us to increased costs, fines and penalties.
We are subject to changing rules and regulations of federal and state government as well as the stock exchange on which our common stock is listed. These entities, including PCAOB, the SEC and the NASDAQ Global Market, have issued a significant number of new and increasingly complex requirements and regulations over the course of the last several years and continue to develop additional regulations and requirements in response to laws enacted by Congress.
20
Table of Contents
We have identified a material weakness in our internal control over financial reporting, specifically related to our revenue recognition process, and our business and stock price could be adversely affected if we do not adequately address this weakness, or if we have other material weaknesses in our internal control over financial reporting.
Management identified a material weakness in our internal control over financial reporting related to the revenue recognition process in our consumer receivables portfolios, specifically related to the application of the interest method of accounting as promulgated by Accounting Standards Codification (“ASC”) 310-30, Receivables — Loans and Debt Securities Acquired with Deteriorated Quality. As a result of this material weakness, our Chief Executive Officer and Chief Financial Officer concluded that, as of the end of the period covered by this report, the Company’s disclosure controls and procedures were not effective. The existence of this material weakness could result in errors in our financial statements, and substantial costs and resources may be required to rectify any internal control deficiencies. If we cannot produce reliable financial reports, investors could lose confidence in our reported financial information, the market price of our stock could decline significantly, we may be unable to obtain additional financing to operate and expand our business, and our business and financial condition could be harmed.
We are subject to various risks in connection with our structured settlement funding business.
Risks of the structured settlement funding business include the potential regulation that could stem from the Dodd Frank Act, state regulation and/or any other change in statutory or case law which may limit or restrict the ability of our structured settlement business to: make investments; the effectiveness of our marketing programs; and our ability to continue to grow the volume of structured settlements. Our failure or inability to execute any element of our business strategy could materially adversely affect our business, financial position and results of operations.
We are subject to various risks in connection with our litigation funding business.
Risks of the litigation funding business include the potential regulation or limitation of interest rates and other fees advanced by our litigation funding subsidiaries under federal and/or state regulation, a change in statutory or case law which limits or restricts the ability of our litigation funding subsidiaries to charge or collect fees and interest at anticipated levels, claimants being unsuccessful in whole or in part in the personal injury claims or divorce settlement upon which our funds are provided, the continued services of the senior management of our litigation funding subsidiaries to source and analyze cases in accordance with the subsidiaries’ respective underwriting guidelines.
We are subject to various risks in connection with our structured settlement funding business.
Risks of the structured settlement funding business include the potential regulation that could stem from the Dodd Frank Act, state regulation and/or any other change in statutory or case law which may limit or restrict the ability of our structured settlement business to: make investments; the effectiveness of our marketing programs; and our ability to continue to grow the volume of structured settlements. Competition in the marketplace could drive up the purchase price of structured settlement and annuity receivables. Additionally, the fact that one company controls at least 50% of the marketplace means that other players, including us, may be negatively impacted by strategic decisions employed by this competitor. Our failure or inability to execute any element of our business strategy and/or increased competition in the marketplace could materially adversely affect our business, financial position and results of operations.
We are subject to various risks in connection to our disability advocacy business.
We have recently entered the disability advocacy business and are subject to all of the risks inherent in a new business. We are incurring substantial start-up costs and there can be no assurance this business segment will become profitable in the future. Risks of the disability advocacy business include the competition of other advocacy firms, statutory cut backs on the Federal Disability program and stricter guidelines in qualifying for disability benefits.
21
Table of Contents
We may not be able to purchase consumer receivable portfolios at favorable prices or on sufficiently favorable terms if at all.
Our success in this business segment depends upon the continued availability of consumer receivable portfolios that meet our purchasing criteria and our ability to identify and finance the purchases of such portfolios. The availability of consumer receivable portfolios at favorable prices and on terms acceptable to us, if at all, depends on a number of factors outside of our control, including:
| • | the growth in consumer debt; |
| • | the volume of consumer receivable portfolios available for sale; |
| • | availability of financing to fund purchases; |
| • | competitive factors affecting potential purchasers and sellers of consumer receivable portfolios; and |
| • | possible future changes in the bankruptcy laws, state laws and homestead acts which could make it more difficult for us to collect. |
Our future operating results will be negatively impacted as we have not replaced our defaulted consumer receivables at historic levels.
To operate profitably, we must continually acquire, or invest in a sufficient level of various types of receivables to generate continued revenue. Our investment in charged off consumer receivables during fiscal year 2014, 2013, and 2012 has slowed dramatically. As the economic environment deteriorated, we felt that pricing of portfolios had not fallen enough to offset the decline in ultimate collections. Accordingly, our investment in portfolios was $5.1 million in 2014, $3.4 million in 2013, and $2.5 million in 2012 compared to $8.0 million in 2010 and $19.6 million in 2009. In part, this led to our net cash collections in fiscal 2014 decreasing $13.9 million, or 25.8%, from $54.1 million in fiscal year 2013 to $40.2 million in fiscal year 2014. Furthermore, of those collections, $26.7 million for fiscal year 2014 and $33.2 million for fiscal year 2013 came from zero basis portfolios (whose carrying value has been reduced to zero). Our decreased level of buying new portfolios during fiscal years 2014, 2013, and 2012 will likely result in future reduced net cash collections in fiscal year 2015 and slow the growth of our future revenues and operating results in the consumer debt part of our business. Furthermore, we cannot predict how our ability to identify and invest in receivables, and evaluate the quality of those receivables, would be affected if there is a shift in consumer lending practices whether caused by changes in regulations or by a sustained economic downturn. In addition, effective October 1, 2013, we transferred the remaining $13.1 million of interest method portfolios to cost recovery. The cost recovery method of recognizing revenue could slow the revenue recognition rate as the cost recovery method precludes the recognition of revenue until the Company’s cost has been fully recovered.
Our inability to invest in sufficient quantities of receivables portfolios may necessitate workforce reductions, which may harm our business.
Because fixed costs, such as personnel costs, constitute a significant portion of our overhead, we may be required to reduce the number of employees if we do not continually invest in receivables. Reducing the number of employees can adversely affect our business and lead to:
| • | lower employee morale, higher employee attrition rates, and fewer experienced employees; |
| • | disruptions in our operations and loss of efficiency in collection functions; |
| • | excess costs associated with unused space in collection facilities; and |
| • | further reliance on our third party collection agencies and attorneys. |
There is no assurance that we will realize the full value of the deferred tax asset.
Although the carry forward period for income taxes is up to twenty years, such allowance period is outside a reasonable period to forecast full realization of the deferred tax asset. We continually monitor forecast information to ensure the valuation allowance is appropriate.
22
Table of Contents
We may not be able to collect sufficient amounts on our consumer receivable portfolios to recover the costs associated with the purchase of those portfolios and to fund our operations.
We acquire and collect on consumer receivable portfolios that contain charged-off, semi-performing, and performing receivables. In order to operate profitably over the long term, we must continually purchase and collect on a sufficient volume of receivables to generate revenue that exceeds our purchase costs. For accounts that are charged-off or semi-performing, the originators or interim owners of the receivables generally have:
| • | made numerous attempts to collect on these obligations, often using both their in-house collection staff and third-party collection agencies; and |
| • | subsequently deemed these obligations as uncollectible. |
These receivable portfolios are purchased at significant discounts to the amount the consumers owe. These receivables are difficult to collect and actual recoveries may be less than the amount expected. In addition, our collections may worsen in a weak economic cycle. We may not recover amounts in excess of our acquisition and servicing costs.
Our ability to recover the purchase costs on our portfolios and produce sufficient returns can be negatively impacted by the quality of the purchased receivables. In the normal course of our portfolio acquisitions, some receivables may be included in the portfolios that fail to conform to certain terms of the purchase agreements and we may seek to return these receivables to the seller for payment or replacement receivables. However, we cannot guarantee that any of such sellers will be able to meet their payment obligations to us. Accounts that we are unable to return to sellers may yield no return. If cash flows from operations are less than anticipated as a result of our inability to collect sufficient amounts on our receivables, our ability to satisfy our debt obligations, purchase new portfolios, and achieve future growth and profitability may be materially adversely affected.
We are subject to competition for the purchase of consumer receivable portfolios which could result in an increase in prices of such portfolios.
We compete with other purchasers of consumer receivable portfolios, with third-party collection agencies and with financial services companies that manage their own consumer receivable portfolios. We compete on the basis of price, reputation, industry experience and performance. Some of our competitors have greater capital, personnel and other resources than we have. The possible entry of new competitors, including competitors that historically have focused on the acquisition of different asset types, and the expected increase in competition from current market participants may reduce our access to consumer receivable portfolios. Aggressive pricing by our competitors has raised the price of consumer receivable portfolios above levels that we are willing to pay, which could reduce the number of consumer receivable portfolios suitable for us to purchase or if purchased by us, reduce the profits, if any, generated by such portfolios. If we are unable to purchase receivable portfolios at favorable prices or at all, our finance income and earnings could be materially reduced.
We depend upon third parties to service a significant portion of our consumer receivable portfolios. The loss of certain servicers could have an adverse effect on our financial position and results of operation.
Although we utilize our in-house collection staff to initiate the collection process to collect some of our receivables, we outsource a majority of our receivable servicing. As 37% of our portfolio face value is serviced by five organizations, we are dependent upon the efforts of these collection agencies and attorneys to service and collect our consumer receivables. Any failure by our third-party collection agencies and attorneys to adequately perform collection services for us or remit such collections to us could materially reduce our finance income and our profitability. In addition, our finance income and profitability could be materially adversely affected if we are not able to secure replacement third party collection agencies and attorneys and redirect payments from the customers to our new third party collection agencies and attorneys promptly in the event our agreements with our third-party collection agencies and attorneys are terminated, our third-party collection agencies and attorneys fail to adequately perform their obligations or if our relationships with such third-party collection agencies and attorneys adversely change.
23
Table of Contents
We may rely on third parties to locate, identify and evaluate consumer receivable portfolios available for purchase.
We may rely on third parties, including brokers and third-party collection agencies and attorneys, to identify consumer receivable portfolios and, in some instances, to assist us in our evaluation and purchase of these portfolios. As a result, if such third parties fail to identify receivable portfolios or if our relationships with such third parties are not maintained, our ability to identify and purchase additional receivable portfolios could be materially adversely affected. In addition, if we, or such parties, fail to correctly or adequately evaluate the value or collectability of these consumer receivable portfolios, we may pay too much for such portfolios and suffer an impairment, which would negatively impact our earnings.
We rely on our third party collectors to comply with all rules and regulations and maintain proper internal controls over their accounting and operations.
Because the receivables were originated and serviced pursuant to a variety of federal and/or state laws by a variety of entities and involved consumers in all 50 states, the District of Columbia, Panama and Puerto Rico there can be no assurance that all original servicing entities have, at all times, been in substantial compliance with applicable law. Additionally, there can be no assurance that we or our third-party collection agencies and attorneys have been or will continue to be at all times in substantial compliance with applicable law. The failure to comply with applicable law and not maintain proper controls in their accounting and operations could materially adversely affect our ability to collect our receivables and could subject us to increased costs, fines and penalties.
Our collections may decrease if bankruptcy filings increase.
During times of economic recession, the amount of defaulted consumer receivables generally increases, which contributes to an increase in the amount of personal bankruptcy filings. Under certain bankruptcy filings, a debtor’s assets are sold to repay credit originators, but since the defaulted consumer receivables we purchase are generally unsecured, we may not be able to collect on those receivables. Our collections may decline with an increase in bankruptcy filings. If our actual collection experience with respect to a defaulted consumer receivable portfolio is significantly lower than we projected when we purchased the portfolio, our earnings could be negatively affected.
The loss of any of our executive officers may adversely affect our operations and our ability to successfully acquire receivable portfolios.
Our executive officers are responsible for making substantially all management decisions, including determining which portfolios to purchase, the purchase price and other material terms of such portfolio acquisitions. These decisions are instrumental to the success of our business. Significant losses of the services of our executive officers or the inability to replace our officers with individuals who have experience in the industry or with the Company could disrupt our operations and adversely affect our ability to successfully acquire receivable portfolios.
The Stern family effectively controls the Company, substantially reducing the influence of our other stockholders.
Members of the Stern family own directly or indirectly, approximately 32% of our outstanding shares of common stock. As a result, the Stern family is able to significantly influence the actions that require stockholder approval, including:
| • | the election of our directors; and |
| • | the approval of mergers, sales of assets or other corporate transactions or matters submitted for stockholder approval. |
As a result, our other stockholders may have reduced influence over matters submitted for stockholder approval. In addition, the Stern family’s influence could preclude any unsolicited acquisition of us and, consequently, materially adversely affect the price of our common stock.
24
Table of Contents
An unfavorable government review of our tax returns could adversely affect our operating results.
Our tax filings are subject to review or audit by the Internal Revenue Service (“IRS”) and state and local taxing authorities. In April 2010, we received notification from the IRS that certain of our federal income tax returns would be audited. The years under audit are 2008 through 2012. This audit is currently in progress. The IRS examinations of our federal tax returns could result in significant proposed adjustments. We can provide no assurance that any final determination in an audit will not be materially different than the treatment reflected in our historical income tax provisions and accruals. An assessment of additional taxes as a result of an audit could adversely affect our income tax provision and net income in the period or periods for which that determination is made.
Negative press regarding the debt collection industry may have a negative impact on a customer’s willingness to pay the debt we acquire.
Consumers are exposed to information from a number of sources that may cause them to be more reluctant to pay their debts or to pursue legal actions against us. On-line, print and other media publish stories about the debt collection industry which cite specific examples of abusive collection practices. These stories can lead to the rapid dissemination of the story, adding to the level of exposure to negative publicity about our industry. Various Internet sites are maintained where consumers can list their concerns about the activities of debt collectors and seek guidance from other website posters on how to handle the situation. Advertisements by debt relief attorneys and credit counseling centers are becoming more common, adding to the negative attention given to our industry. As a result of this negative publicity, customers may be more reluctant to pay their debts or could pursue legal action against us regardless of whether those actions are warranted. These actions could impact our ability to collect on the receivables we acquire and affect our revenues and profitability.
Class action suits and other litigation could divert our management’s attention from operating our business and increase our expenses.
Originators, debt purchasers and third-party collection agencies and attorneys in the consumer credit industry are frequently subject to putative class action lawsuits and other litigation. Claims include failure to comply with applicable laws and regulations and improper or deceptive origination and servicing practices. Being a defendant in such class action lawsuits or other litigation could materially adversely affect our results of operations and financial condition.
We may seek to make acquisitions that prove unsuccessful or strain or divert our resources.
We may seek to grow through acquisitions of related businesses in the financial services sector. Such acquisitions present risks that could materially adversely affect our business and financial performance, including:
| • | the diversion of our management’s attention from our everyday business activities; |
| • | the assimilation of the operations and personnel of the acquired business; |
| • | the contingent and latent risks associated with the past operations of, and other unanticipated problems arising in, the acquired business; and |
| • | the need to expand management, administration and operational systems. |
If we make such acquisitions, we cannot predict whether:
| • | we will be able to successfully integrate the operations of any new businesses into our business; |
| • | we will realize any anticipated benefits of completed acquisitions; or |
| • | there will be substantial unanticipated costs associated with acquisitions. |
In addition, future acquisitions by us may result in:
| • | potentially dilutive issuances of our equity securities; |
25
Table of Contents
| • | the incurrence of additional debt; and |
| • | the recognition of significant charges for depreciation and impairment charges related to goodwill and other intangible assets. |
If our technology infrastructure is not operational, our operations could be disrupted and our ability to successfully operate the business could be compromised.
Our success depends, in part, on sophisticated telecommunications and computer systems. The temporary loss of our computer or telecommunications systems, through casualty, operating malfunction or service provider failure, could disrupt our operations. In addition, we must record and process significant amounts of data quickly and accurately to properly bid on prospective acquisitions of receivable portfolios and to access, maintain and expand the databases we use for our collection and monitoring activities. Any failure of our information systems and their backup systems would interrupt our operations. We may not have adequate backup arrangements for all of our operations and we may incur significant losses if an outage occurs. In addition, we rely on third-party collection agencies and attorneys who also may be adversely affected in the event of an outage in which the third-party collection agencies and attorneys do not have adequate backup arrangements. Any interruption in our operations or our third-party collection agencies’ and attorneys’ operations could have an adverse effect on our results of operations and financial condition. However, we are in the process of implementing a disaster recovery program which would mitigate this risk.
A cyber security incident could have a negative effect on our business as we outsource a significant amount of the collection accounts with personal information electronically.
A security breach could have a detrimental effect on our business as we maintain a significant amount of personal information in our electronic files. A breach of our system or a leak of the personal information we maintain could leave us vulnerable to, among other things, loss of information and potential litigation each of which could have a material adverse effect on our business.
Our organizational documents and Delaware law may make it harder for us to be acquired without the consent and cooperation of our board of directors and management.
Several provisions of our organizational documents and Delaware law may deter or prevent a takeover attempt, including a takeover attempt in which the potential purchaser offers to pay a per share price greater than the current market price of our common stock. Under the terms of our certificate of incorporation, our board of directors has the authority, without further action by the stockholders, to issue shares of preferred stock in one or more series and to fix the rights, preferences, privileges and restrictions thereof. The ability to issue shares of preferred stock could tend to discourage takeover or acquisition proposals not supported by our current board of directors. In addition, we are subject to Section 203 of the Delaware General Corporation Law, which restricts business combinations with some stockholders once the stockholder acquires 15% or more of our common stock.
We have adopted a stockholder rights plan which could make it more difficult for a third-party to acquire us.
We adopted a stockholder rights plan which is intended to protect us from efforts to obtain control of us that are inconsistent with our best interests and the interests of our stockholders. The rights will be exercisable ten days following the earlier of the public announcement that a stockholder has acquired 20% or more of our common stock without board approval or the announcement of a tender offer which results in the ownership of 20% or more of our common stock. If the rights become exercisable, all rights holders (other than the person triggering the rights) will be entitled to acquire our securities at a substantial discount. Because the rights may substantially dilute the stock ownership of a person or group attempting to take over the Company without the approval of our board of directors, the rights plan could make it more difficult for a third-party to acquire us or a significant percentage of our outstanding capital stock, without first negotiating with the board of directors.
26
Table of Contents
Future sales of our common stock by our affiliates or other stockholders may depress our stock price.
Sales of a substantial number of shares of our common stock in the public market could cause a decrease in the market price of our common stock. We had 13,060,839 shares of common stock issued and outstanding as of June 15, 2015. Of these shares, 4,196,806 are owned by our affiliates. In addition, options to purchase 1,403,259 shares of our common stock were outstanding as of September 30, 2014, of which 888,587 were exercisable. We may also issue additional shares in connection with our business and may grant additional stock options or restricted shares to our employees, officers, directors and consultants under our present or future equity compensation plans or we may issue warrants to third parties outside of such plans. As of September 30, 2014, there were 1,566,279 shares available for such purpose with such shares available under the 2012 Stock Option and Performance Award Plan. If a significant portion of these shares were sold in the public market, the market value of our common stock could be adversely affected.
We have the ability to issue preferred shares, warrants, convertible debt and other securities without stockholder approval which could dilute the relative ownership interest of current stockholders and adversely affect our share price.
Future sales of our equity-related securities in the public market, including sales of our common stock pursuant to our shelf-registration statement, could adversely affect the trading price of our common stock and our ability to raise funds in new stock offerings. Our common shares may be subordinate to classes of preferred shares issued in the future in the payment of dividends and other distributions made with respect to common shares, including distributions upon liquidation or dissolution. Our certificate of incorporation permits our board of directors to issue preferred shares without first obtaining stockholder approval. If we issued preferred shares, these additional securities may have dividend or liquidation preferences senior to our common shares. If we issue convertible preferred shares, a subsequent conversion may dilute the current common stockholders’ interest. We have similar abilities to issue convertible debt, warrants and other equity securities.
Climate change and related regulatory responses may adversely impact our business.
Climate change as a result of emissions of greenhouse gases is a significant topic of discussion and may generate federal and other regulatory responses in the near future, including the imposition of a so-called “cap and trade” system. It is impracticable to predict with any certainty the impact on our business of climate change or the regulatory responses to it, although we recognize that they could be significant. The most direct impact is likely to be an increase in energy costs, which would increase slightly our operating costs, primarily through increased utility and transportations costs. In addition, increased energy costs could impact consumers and their ability to incur and repay indebtedness. However, it is too soon for us to predict with any certainty the ultimate impact, either directionally or quantitatively, of climate change and related regulatory responses.
Our quarterly operating results may fluctuate and cause our stock price to decline.
Because of the nature of our business, our quarterly operating results may fluctuate, which may adversely affect the market price of our common stock. Our results may fluctuate as a result of any of the following:
| • | the timing and amount of collections on our consumer receivable portfolios; |
| • | our inability to identify and acquire additional consumer receivable portfolios; |
| • | a decline in the estimated future value of our consumer receivable portfolio recoveries; |
| • | increases in operating expenses associated with the growth of our operations; |
| • | general and economic market conditions; and |
| • | Prices we are willing to pay for consumer receivable portfolios. |
27
Table of Contents
| Item 1B. | Unresolved Staff Comments. |
The Company received several comment letters beginning on March 7, 2014 from the Securities and Exchange Commission Division of Corporation Finance (“SEC”), the last dated October 6, 2014, concerning its Annual Report on Form 10-K for the fiscal year ended September 30, 2013. Additionally, verbal communication with the SEC Staff addressed further comments with regard to the Company’s Form 10-K for the fiscal years ended September 30, 2013 and 2012 and for the first three quarters of fiscal year 2014. The SEC requested, among other things, information concerning the Company’s revenue recognition policy on consumer receivables acquired for liquidation and the Company’s application of Generally Accepted Accounting Principles in the United States thereon. We have revised the fiscal year 2013 and 2012 financial statements contained in this Report on Form 10-K for the fiscal year ended Fiscal Year 2014 and have restated the quarterly data for the first three quarters in fiscal year 2014 in Note T. The Company is in the process of finalizing its discussions with the SEC in order to resolve the Staff Comments. Please see Note A (2) of the Consolidated financial statements for the period ended September 30, 2014 for more information.
| Item 2. | Properties |
Our executive and administrative offices are located in Englewood Cliffs, New Jersey, where we lease approximately 14,700 square feet of general office space for approximately $21,000 per month, plus utilities. The lease expires on July 31, 2015, with a two-year renewal option.
Our office in Houston, Texas occupies approximately 2,600 square feet of general office space for approximately $3,800 per month. The lease expires on August 18, 2016.
Our New York City office occupies approximately 6,600 square feet for approximately $19,000 per month, including electricity. The lease expires in September 2017.
Our Conshohocken, Pennsylvania office occupies approximately 5,800 square feet for approximately $14,000 per month, plus utilities. The lease expires in January 2020.
We believe that our existing facilities are adequate for our current needs.
| Item 3. | Legal Proceedings. |
In the ordinary course of our business, we are involved in numerous legal proceedings. We regularly initiate collection lawsuits, using third party law firms, against consumers. Also, consumers occasionally initiate litigation against us, in which they allege that we have violated a federal or state law in the process of collecting on their account. We do not believe that these ordinary course matters are material to our business and financial condition. As of the date of this report, we were not involved in any material litigation in which we were a defendant.
| Item 4. | Mine Safety Disclosures. |
Not applicable.
28
Table of Contents
PART II
| Item 5. | Market for Registrant’s Common Equity, Related Stockholder Matters and Issuer Purchases of Equity Securities. |
Our common stock is quoted on the NASDAQ Global Select Market under the symbol “ASFI.” On December 2, 2014 there were 15 holders of record of our common stock. High and low sales prices of our common stock since October 1, 2012 as reported by NASDAQ are set forth below (such quotations reflect inter-dealer prices without retail markup, markdown, or commission, and may not necessarily represent actual transactions):
| High | Low | |||||||
| 2013 |
||||||||
| October 1, 2012 to December 31, 2012 |
$ | 10.49 | $ | 7.95 | ||||
| January 1, 2013 to March 31, 2013 |
9.82 | 9.16 | ||||||
| April 1, 2013 to June 30, 2013 |
9.68 | 8.27 | ||||||
| July 1, 2013 to September 30, 2013 |
9.11 | 8.33 | ||||||
| 2014 |
||||||||
| October 1, 2013 to December 31, 2013 |
$ | 8.85 | $ | 7.94 | ||||
| January 1, 2014 to March 31, 2014 |
8.59 | 7.99 | ||||||
| April 1, 2014 to June 30, 2014 |
8.77 | 8.03 | ||||||
| July 1, 2014 to September 30, 2014 |
8.51 | 8.11 | ||||||
Dividends
Future dividend payments will be at the discretion of our board of directors and will depend upon our financial condition, operating results, capital requirements and any other factors our board of directors deems relevant. In addition, our agreements with our lender may, from time to time, restrict our ability to pay dividends. Currently there are no restrictions in place. The Company did not declare any dividends for fiscal year 2014.
Share Repurchase Program
On March 9, 2012, we adopted a Rule 10b5-1 Plan in conjunction with our share repurchase program that authorized us to purchase up to $20.0 million of shares of our common stock. Under that program, which expired in March 2013, we purchased 885,000 shares at an aggregate cost of approximately $7.9 million. The Rule 10b5-1 Plan superseded the authorization to repurchase shares in June 2011, pursuant to which we repurchased approximately 59,000 shares at an aggregate cost of approximately $457,000. Additionally, in June 2012, we repurchased 1.0 million shares for $9.4 million in a privately negotiated transaction. We repurchased an aggregate of approximately 1.9 million shares at an aggregate cost of approximately $17.8 million. We did not repurchase any shares in fiscal year 2014.
29
Table of Contents
Performance Graph
Notwithstanding anything to the contrary set forth in any of our filings under the Securities Act of 1933, as amended, or the Securities Exchange Act of 1934, as amended, that might incorporate by reference this Form 10-K, in whole or in part, the following Performance Graph shall not be incorporated by reference into any such filings.
Comparison of 5 Year Cumulative Total Return
Assumes Initial Investment of $100
September 2014
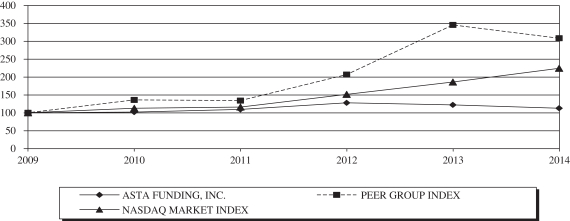
| 2009 | 2010 | 2011 | 2012 | 2013 | 2014 | |||||||||||||||||||
| ASTA FUNDING, INC. |
100.00 | 101.97 | 109.46 | 127.91 | 122.12 | 112.78 | ||||||||||||||||||
| NASDAQ MARKET INDEX |
100.00 | 112.61 | 115.94 | 151.34 | 185.80 | 224.09 | ||||||||||||||||||
| PEER GROUP INDEX |
||||||||||||||||||||||||
| PEER GROUP INDEX |
100.00 | 135.91 | 134.07 | 206.68 | 345.17 | 308.11 | ||||||||||||||||||
30
Table of Contents
| Item 6. | Selected Financial Data |
The following tables set forth a summary of our consolidated financial data as of and for the five fiscal years ended September 30, 2014. The selected financial data for the five fiscal years ended September 30, 2014, have been derived from our audited consolidated financial statements. The selected financial data presented below should be read in conjunction with our consolidated financial statements, related notes including Note A(2), other financial information included elsewhere in this report, including the information set forth in Item 7 “Management’s Discussion and Analysis of Financial Condition and Results of Operations”. Certain items in prior years’ information have been reclassified to conform to the current year’s presentation.
| Year Ended September 30, | ||||||||||||||||||||
| (In thousands, except per share data) | ||||||||||||||||||||
| 2014 | 2013(1) | 2012(1) | 2011(1) | 2010(1) | ||||||||||||||||
| (As Revised) | (As Revised) | (As Revised) | (As Revised) | |||||||||||||||||
| Income Statement Data: |
||||||||||||||||||||
| Finance income, net |
$ | 19,865 | $ | 31,762 | $ | 40,803 | $ | 44,056 | $ | 44,435 | ||||||||||
| Personal injury claims income |
7,134 | 6,438 | 1,647 | — | — | |||||||||||||||
| Unrealized gain on structured settlements |
2,840 | — | — | — | — | |||||||||||||||
| Interest income on structured settlements |
2,368 | — | — | — | — | |||||||||||||||
|
|
|
|
|
|
|
|
|
|
|
|||||||||||
| Total revenues |
32,207 | 38,200 | 42,450 | 44,056 | 44,435 | |||||||||||||||
| Forgiveness of non-recourse debt |
26,101 | — | — | — | — | |||||||||||||||
| Other income |
1,777 | 1,611 | 2,256 | 557 | 218 | |||||||||||||||
|
|
|
|
|
|
|
|
|
|
|
|||||||||||
| 60,085 | 39,811 | 44,706 | 44,613 | 44,653 | ||||||||||||||||
|
|
|
|
|
|
|
|
|
|
|
|||||||||||
| Costs and Expenses: |
||||||||||||||||||||
| General and administrative expenses |
28,192 | 24,212 | 23,640 | 21,807 | 23,211 | |||||||||||||||
| Interest expense |
1,260 | 1,300 | 2,539 | 3,016 | 4,368 | |||||||||||||||
| Impairments of consumer receivables acquired for liquidation |
19,591 | 10,990 | 1,771 | 2,066 | 13,424 | |||||||||||||||
|
|
|
|
|
|
|
|
|
|
|
|||||||||||
| 49,043 | 36,502 | 27,950 | 26,889 | 41,003 | ||||||||||||||||
|
|
|
|
|
|
|
|
|
|
|
|||||||||||
| Income before income tax |
11,042 | 3,309 | 16,756 | 17,724 | 3,650 | |||||||||||||||
| Income tax expense |
4,613 | 894 | 6,797 | 7,143 | 1,471 | |||||||||||||||
|
|
|
|
|
|
|
|
|
|
|
|||||||||||
| Net income |
6,429 | 2,415 | 9,959 | 10,581 | 2,179 | |||||||||||||||
| Less: net income attributable to non-controlling interests |
528 | 406 | 31 | — | — | |||||||||||||||
|
|
|
|
|
|
|
|
|
|
|
|||||||||||
| Net income attributable to Asta Funding, Inc. |
$ | 5,901 | $ | 2,009 | $ | 9,928 | $ | 10,581 | $ | 2,179 | ||||||||||
|
|
|
|
|
|
|
|
|
|
|
|||||||||||
| Basic net income per share |
$ | 0.45 | $ | 0.16 | $ | 0.71 | $ | 0.72 | $ | 0.15 | ||||||||||
|
|
|
|
|
|
|
|
|
|
|
|||||||||||
| Diluted net income per share |
$ | 0.45 | $ | 0.15 | $ | 0.69 | $ | 0.71 | $ | 0.15 | ||||||||||
|
|
|
|
|
|
|
|
|
|
|
|||||||||||
31
Table of Contents
| (In millions) | ||||||||||||||||||||
| 2014 | 2013(1) | 2012(1) | 2011(1) | 2010(1) | ||||||||||||||||
| Other Financial Data (Unaudited): |
||||||||||||||||||||
| For the Year ended September 30 |
||||||||||||||||||||
| Cash collections |
$ | 40.2 | $ | 51.7 | $ | 70.0 | $ | 81.2 | $ | 101.9 | ||||||||||
| Portfolio purchases, at cost |
5.1 | 3.3 | 2.5 | 7.5 | 8.0 | |||||||||||||||
| Portfolio purchases, at face |
478.9 | 53.5 | 6.0 | 19.5 | 269.1 | |||||||||||||||
| Return on average assets(1) |
4.7 | % | 1.2 | % | 4.2 | % | 4.1 | % | 1.1 | % | ||||||||||
| Return on average stockholders’ equity(2) |
5.7 | % | 1.6 | % | 5.9 | % | 6.3 | % | 2.0 | % | ||||||||||
| Dividends declared per share |
$ | 0.00 | $ | 0.08 | $ | 0.08 | $ | 0.08 | $ | 0.08 | ||||||||||
| At September 30, |
||||||||||||||||||||
| Total assets |
217.1 | 211.5 | 237.6 | 252.6 | 259.2 | |||||||||||||||
| Total debt |
35.8 | 38.2 | 64.6 | 75.1 | 94.9 | |||||||||||||||
| Total stockholders’ equity |
181.3 | 173.3 | 173.0 | 177.5 | 161.9 | |||||||||||||||
| Inception to date — September 30, |
||||||||||||||||||||
| Cumulative aggregate purchases, at face |
32,453.9 | 31,975.0 | 31,921.5 | 31,915.5 | 31,896.0 | |||||||||||||||
| (1) | Revised based upon the misapplication of the interest method in prior periods. See Note A2 to the Consolidated Financial Statements. |
| (2) | The return on average assets is computed by dividing net income by average total assets for the fiscal year. The return on average stockholders’ equity is computed by dividing net income by the average stockholders’ equity for the fiscal year. Both ratios have been computed using beginning and period-end balances. |
32
Table of Contents
| Item 7. | Management’s Discussion and Analysis of Financial Condition and Results of Operation. |
Caution Regarding Forward-Looking Statements
This Management’s Discussion and Analysis of Financial Condition and Results of Operations and other parts of this Annual Report on Form 10-K contain forward-looking statements that involve risks and uncertainties. All forward-looking statements included in this Annual Report on Form 10-K are based on information available to us on the date hereof, and except as required by law, we assume no obligation to update any such forward-looking statements. Our actual results may differ materially from those anticipated in these forward-looking statements as a result of a number of factors, including those set forth under the caption “Risk Factors” contained in this report and elsewhere herein. The following should be read in conjunction with our annual financial statements contained elsewhere in this report.
Overview
We are engaged in the businesses of acquiring, managing, servicing and recovering on portfolios of consumer receivables, and, through Pegasus, funding of personal injury claims, through CBC, investing in structured settlements and through GAR Disability Advocates, assisting claimants in the process of disability and social security claims.
Consumer Receivables
The consumer receivable portfolios generally consist of one or more of the following types of consumer receivables:
| • | charged-off receivables — accounts that have been written-off by the originators and may have been previously serviced by collection agencies; and |
| • | semi-performing receivables — accounts where the debtor is making partial or irregular monthly payments, but the accounts may have been written-off by the originators. |
We acquire these consumer receivable portfolios at a significant discount to the amount actually owed by the borrowers. We acquire these portfolios after a qualitative and quantitative analysis of the underlying receivables and calculate the purchase price so that our estimated cash flow offers us an adequate return on our investment after servicing expenses. After purchasing a portfolio, we actively monitor its performance and review and adjust our collection and servicing strategies accordingly.
We purchase receivables from credit grantors and others through privately negotiated direct sales, brokered transactions and auctions in which sellers of receivables seek bids from several pre-qualified debt purchasers. We pursue new acquisitions of consumer receivable portfolios on an ongoing basis through:
| • | our relationships with industry participants, financial institutions, collection agencies, investors and our financing sources; |
| • | brokers who specialize in the sale of consumer receivable portfolios; and |
| • | other sources. |
Litigation Funding Business
On December 28, 2011, the Company purchased an 80% interest in Pegasus. Pegasus Legal Funding (“PLF”) holds the other 20% interest. The Company is committed to loan up to $22.4 million per year to Pegasus for a term of five (5) years, all of which is secured by the assets of Pegasus. These loans will provide financing for the personal injury litigation claims and operating expenses of Pegasus.
The Pegasus business model entails the outlay of non-recourse advances to a plaintiff with an agreed-upon fee structure to be repaid from the plaintiff’s recovery. Typically, such advances to a plaintiff approximate 10-20% of the anticipated recovery. These funds are generally used by the plaintiff for a variety of urgent necessities, ranging from surgical procedures to everyday living expenses.
33
Table of Contents
Pegasus’s profits and losses will be distributed at 80% to the Company and 20% to PLF. These distributions will be made only after the repayment of Fund Pegasus’ principal amount loaned, plus an amount equal to advances for overhead expenses. While the overall returns to Pegasus are currently estimated to be in excess of 20% per annum, the Company reserves the right to terminate Pegasus if returns to the Company for any rolling twelve (12) month period, after the first year of operations, do not exceed 15%. As of September 30, 2014, the Company had a net invested balance of approximately $32.4 million in personal injury cases. During the fiscal year ended September 30, 2014, distributions of $5.4 million and $1.1 million were made to Asta Funding, Inc. (Fund Pegasus) and PLF, respectively.
On May 18, 2012, we announced the formation of BP Case Management, LLC (“Balance Point”), a joint venture (the “Venture”) with California-based Balance Point Divorce Funding, LLC (“Balance Point Management”). The Venture provides non-recourse funding to a spouse in a matrimonial action where the marital assets exceed $2,000,000. Such funds can be used for legal fees, expert costs and necessary living expenses. The Venture receives an agreed percentage of the proceeds received by such spouse upon final resolution of the case. Balance Point’s profits and losses will be distributed 60% to us and 40% to Balance Point Management, after the return of our investment on a case by case basis and after a 15% preferred return to us. Our initial investment in the Venture consists of up to $15 million to fund divorce claims to be fulfilled in three tranches of $5 million each. Each investment tranche is contingent upon a minimum 15% cash-on-cash return to us. At our option, there could be an additional $35 million investment in divorce claims in tranches of $10 million, $10 million, and $15 million, also with a 15% preferred return and such investments may even exceed a total of $50 million, at our sole option. Should the preferred return be less than 15% on any $5 million tranche, the 60%/40% profit and loss split would be adjusted to reflect our priority to a 15% preferred return. As of September 30, 2014, we have invested $2.4 million, net of reserve charges, in cases managed by this Venture.
We provided a $1.5 million revolving line of credit to partially fund Balance Point Management’s operations with such loan bearing interest at the prevailing prime rate, with an initial term of twenty-four months, which may be extended under certain circumstances for an additional 24 month period. The revolving line of credit is collateralized by Balance Point Management’s profits share in the Venture and other assets. At September 30, 2014, the balance on the revolving line of credit was approximately $1.5 million. The term of the loan was to end in May 2014 but has been extended. In September 2014, the agreement was revised to extend the term of the loan to August 2016, increase the credit line to $1.5 million and include a personal guarantee of the principal of BP Divorce Funding.
Structured Settlement Business
On December 31, 2013, the Company acquired 80% ownership of CBC and its affiliate, CBC Management Services, LLC for approximately $5.9 million. In addition, the Company will provide financing to CBC of up to $5 million.
CBC purchases periodic payments under structured settlements and annuity policies from individuals in exchange for a lump sum payment. The operating principals of CBC, William J. Skyrm, Esq. and James Goodman, have over 30 years combined experience in the structured settlements industry and remain as management of CBC.
CBC has a portfolio of structured settlements which is financed by approximately $32.3 million of debt, including a $22.0 million line of credit ($25.0 million effective March 2015) from an institutional source (approximately $2.4 million of the line was unused as of September 30, 2014) and notes issued by CBC to third party investors. On September 29, 2014, CBC entered into the eighth amendment, increasing the line from $20.0 million to $22.0 million. At September 30, 2014, the line of credit had an expiration date of February 28, 2015 and the Company had an invested value of $42.1 million in structured settlements.
Disability Advocacy Business
GAR Disability Advocates is a social security disability advocacy group, which obtains and represents individuals in their claims for social security disability and supplemental security income benefits from the Social Security Administration.
34
Table of Contents
Critical Accounting Policies
We may account for our investments in consumer receivable portfolios, using either:
| • | The interest method; or |
| • | The cost recovery method. |
As we believe our extensive liquidating experience in certain asset classes such as distressed credit card receivables, consumer loan receivables and mixed consumer receivables has matured, we use the interest method when we believe we can reasonably estimate the timing of the cash flows. In those situations where we diversify our acquisitions into other asset classes in which we do not possess the same expertise or history, or we cannot reasonably estimate the timing of the cash flows, we utilize the cost recovery method of accounting for those portfolios of receivables.
The Company accounts for certain of its investments in finance receivables using the interest method under the guidance of FASB Accounting Standards Codification (“ASC”), Receivables — Loans and Debt Securities Acquired with Deteriorated Credit Quality, (“ASC 310”). Under the guidance of ASC 310, static pools of accounts are established. These pools are aggregated based on certain common risk criteria. Each static pool is recorded at cost and is accounted for as a single unit for the recognition of income, principal payments and loss provision. Effective October 1, 2013, due to the substantial reduction of portfolios reported under the interest method, and the ability to reasonably estimate cash collections required to account for those portfolios under the interest method the Company concluded the cost recovery method is the appropriate accounting method under the circumstances.
Although the Company has switched to the cost recovery method on its current inventory of portfolios, the Company must still analyze a portfolio upon acquisition and once a static pool is established for a quarter, individual receivable accounts are not added to the pool (unless replaced by the seller) or removed from the pool (unless sold or returned to the seller).
Under the interest method, ASC 310 requires that the excess of the contractual cash flows over expected cash flows not be recognized as an adjustment of revenue or expense or on the balance sheet. ASC 310 initially freezes the internal rate of return, referred to as IRR, estimated when the accounts receivable are purchased, as the basis for subsequent impairment testing. Significant increases in actual or expected future cash flows may be recognized prospectively through an upward adjustment of the IRR over a portfolio’s remaining life. Any increase to the IRR then becomes the new benchmark for impairment testing. Rather than lowering the estimated IRR if the collection estimates are not received or projected to be received, the carrying value of a pool would be impaired, or written down to maintain the then current IRR. Under the interest method, income is recognized on the effective yield method based on the actual cash collected during a period and future estimated cash flows and timing of such collections and the portfolio’s cost. Material variations of cash flows estimates are recorded in the quarter such variations are determined, The estimated future cash flows are reevaluated quarterly.
The Company uses the cost recovery method when collections on a particular pool of accounts cannot be reasonably predicted. Under the cost recovery method, no income is recognized until the cost of the portfolio has been fully recovered. A pool can become fully amortized (zero carrying balance on the balance sheet) while still generating cash collections. In this case, all cash collections are recognized as revenue when received.
The Company’s extensive liquidating experience is in the field of distressed credit card receivables, telecommunication receivables, consumer loan receivables, retail installment contracts, consumer receivables, and auto deficiency receivables. The Company will analyze a portfolio to determine if the interest method is appropriate for accounting for asset acquisitions within these classes of receivables when it believes it can reasonably estimate the timing of the cash flows. In those situations where the Company diversifies its acquisitions into other asset classes and the Company does not possess the same expertise, or the Company cannot reasonably estimate the timing of the cash flows, the Company utilizes the cost recovery method of accounting for those portfolios of receivables. At September 30, 2014, all of the portfolios are accounted for on the cost recovery method, of which $19.3 million is concentrated in one portfolio, a $300 million portfolio purchase in March 2007 (the “Portfolio Purchase”).
35
Table of Contents
We may account for our investment in finance receivables using the interest method under the guidance of ASC 310. Static pools of accounts are established. These pools are aggregated based on certain common risk criteria. Each static pool is recorded at cost and is accounted for as a single unit for the recognition of income, principal payments and loss provision. We currently consider for aggregation portfolios of accounts, purchased within the same fiscal quarter, that generally have the following characteristics:
| • | same issuer/originator; |
| • | same underlying credit quality; |
| • | similar geographic distribution of the accounts; |
| • | similar age of the receivable; and |
| • | same type of asset class (credit cards, telecommunications, etc.). |
After determining that an investment will yield an adequate return on our acquisition cost after servicing fees, including court costs, which are expensed as incurred, we use a variety of qualitative and quantitative factors to determine the estimated cash flows. The following variables are analyzed and factored into our original estimates:
| • | the number of collection agencies previously attempting to collect the receivables in the portfolio; |
| • | the average balance of the receivables; |
| • | the age of the receivables (as older receivables might be more difficult to collect or might be less cost effective); |
| • | past history of performance of similar assets — as we purchase portfolios of similar assets, we believe we have built significant significant history on how these receivables will liquidate and cash flow; |
| • | number of months since charge-off; |
| • | payments made since charge-off; |
| • | the credit originator and their credit guidelines; |
| • | the locations of the customers as there are better states to attempt to collect in and ultimately we have better predictability of the liquidations and the expected cash flows; |
| • | financial wherewithal of the seller; |
| • | jobs or property of the customers found within portfolios-with our business model. Customers with jobs or property are more likely to repay their obligation and conversely, customers without jobs or property are less likely to repay their obligation; and |
| • | the ability to obtain customer statements from the original issuer. |
We will obtain and utilize as appropriate input including, but not limited to, monthly collection projections and liquidation rates, from our third party collection agencies and attorneys, as further evidentiary matter, to assist us in developing collection strategies and in modeling the expected cash flows for a given portfolio.
We acquire accounts that have experienced deterioration of credit quality between origination and the date of our acquisition of the accounts. The amount paid for a portfolio of accounts reflects our determination that it is probable we will be unable to collect all amounts due according to the portfolio of accounts’ contractual terms. We consider the expected payments and estimate the amount and timing of undiscounted expected principal, interest and other cash flows for each acquired portfolio coupled with expected cash flows from accounts available for sales. The excess of this amount over the cost of the portfolio, representing the excess of the account’s cash flows expected to be collected over the amount paid, is accreted into income recognized on finance receivables over the expected remaining life of the portfolio.
We believe we have significant experience in acquiring certain distressed consumer receivable portfolios at a significant discount to the amount actually owed by underlying customers. We acquire these portfolios only after both qualitative and quantitative analyses of the underlying receivables are performed and a calculated purchase price is paid so that we believe our estimated cash flow offers us an adequate return on our acquisition
36
Table of Contents
costs including servicing expenses. Additionally, when considering larger portfolio purchases of accounts, or portfolios from issuers from whom we have little or limited experience, we have the added benefit of soliciting our third party collection agencies and attorneys for their input on liquidation rates and at times incorporate such input into the price we offer for a given portfolio and the estimates we use for our expected cash flows.
We will use the cost recovery method when collections on a particular pool of accounts cannot be reasonably predicted. Under the cost recovery method, no finance income is recognized until the cost of the portfolio has been fully recovered. A pool can become fully amortized (zero carrying balance on the balance sheet) while still generating cash collections. In this case, all cash collections are recognized as finance income when received.
The Company accounts for its investments in personal injury claims at an agreed upon interest rate, in anticipation of a future settlement. The interest purchased by Pegasus in each claim will consist of the right to receive from such claimant part of the proceeds or recoveries which such claimant receives by reason of a settlement, judgment or reward with respect to such claimant’s claim. Open case revenue is estimated, recognized and accrued at a rate based on the expected realization and underwriting guidelines and facts and circumstances for each individual case. These personal injury claims are non-recourse. When a case is closed and the cash is received for the advance provided to a claimant, review is recognized based upon the contractually agreed upon interest rate, and, if applicable, adjusted for any changes due to a settled amount and fees charged to the claimant.
CBC purchases periodic payments under structured settlements and annuity policies from individuals in exchange for a lump sum payment. The Company elected to carry structured settlements at fair value. Unearned income on structured settlements is recognized as interest income using the effective interest method over the life of the related settlement. Changes in fair value are recorded in unrealized gain (loss) in structured settlements in our statements of income.
Results of Operations
The following discussion of our operations and financial condition should be read in conjunction with our financial statements and notes thereto included elsewhere in this report. In these discussions, most percentages and dollar amounts have been rounded to aid presentation. As a result, all such figures are approximations.
| Years Ended September 30, | ||||||||||||
| 2014 | 2013 (As Revised) |
2012 (As Revised) |
||||||||||
| Finance income, net |
61.7 | % | 83.1 | % | 96.1 | % | ||||||
| Personal injury claim income |
22.1 | % | 16.9 | % | 3.9 | % | ||||||
| Unrealized gain on structured settlements |
8.8 | % | — | % | — | % | ||||||
| Interest income on structured settlements |
7.4 | % | — | % | — | % | ||||||
|
|
|
|
|
|
|
|||||||
| Total revenues |
100.0 | % | 100.0 | % | 100.0 | % | ||||||
| Debt forgiveness |
81.0 | % | — | % | — | % | ||||||
| Other income |
5.5 | % | 4.2 | % | 5.3 | % | ||||||
|
|
|
|
|
|
|
|||||||
| 186.5 | % | 104.2 | % | 105.3 | % | |||||||
|
|
|
|
|
|
|
|||||||
| General and administrative expenses |
87.5 | % | 63.4 | % | 55.7 | % | ||||||
| Interest expense |
3.9 | % | 3.4 | % | 6.0 | % | ||||||
| Impairments of consumer receivables acquired for liquidation |
60.8 | % | 28.7 | % | 4.2 | % | ||||||
|
|
|
|
|
|
|
|||||||
| 152.2 | % | 95.5 | % | 65.9 | % | |||||||
|
|
|
|
|
|
|
|||||||
| Income before income taxes |
34.3 | % | 8.7 | % | 39.5 | % | ||||||
| Income tax expense |
14.3 | % | 2.3 | % | 16.0 | % | ||||||
|
|
|
|
|
|
|
|||||||
| Net income |
20.0 | % | 6.4 | % | 23.5 | % | ||||||
| Less: net income attributable to non-controlling interest |
1.6 | % | 1.1 | % | 0.1 | % | ||||||
|
|
|
|
|
|
|
|||||||
| Net income attributable to Asta Funding, Inc. |
18.4 | % | 5.3 | % | 23.4 | % | ||||||
|
|
|
|
|
|
|
|||||||
37
Table of Contents
Year Ended September 30, 2014 Compared to the Year Ended September 30, 2013 (Revised)
Finance income. For the fiscal year ended September 30, 2014 (“fiscal year 2014”), finance income from consumer receivables decreased $12.0 million, or 37.5%, to $19.8 million from $31.8 million for the fiscal year ended September 30, 2013 (“fiscal year 2013”). The decrease is primarily due to the lower level of portfolio purchases over the last four years, and the reduction of zero based income. Zero based income decreased $5.8 million, from $25.7 million in the year 2013 to $19.8 million in the year 2014. Effective October 1, 2013 the Company transferred the remaining $1.3 million of interest method portfolios to the cost recovery method. During fiscal year 2014, we acquired $478.9 million in face value of new portfolios at a cost of $5.1 million as compared to $53.5 million of face value portfolios at a cost of approximately $3.3 million, during fiscal year 2013. The portfolios purchased during fiscal year 2014 are accounted for on the cost recovery method.
Net collections decreased $14.0 million, or 25.8%, to $40.2 million for fiscal year 2014, from $54.1 million for fiscal year 2013. During fiscal year 2014, gross collections decreased 20.6% to $67.9 million from $85.5 million for fiscal year 2013, reflecting the lower level of purchases over the last three years. Commissions and fees associated with gross collections from our third party collection agencies and attorneys decreased $3.7 million, or 11.7% as compared to the same period in the prior year and averaged 40.9% of collections for fiscal year 2014 as compared to 36.7% in the same prior year period. The higher rate was the result of higher collections (of higher commissioned) out-of-statute paper coupled with increased asset search costs in the current fiscal year.
As we switched to the cost recovery method on the current inventory of portfolios, there were no accretable yield adjustments recorded during the fiscal year ended September 30, 2014. Accretable yield adjustments were $0.6 million in fiscal year 2013.
Personal injury claims income. Personal injury claims income increased $0.7 million or 10.8% to $7.1 million from the prior year level of $6.4 million, as investment in personal injury claims in fiscal years 2012 and 2013 translated into more closed cases in fiscal year 2014 than in the prior year (cases take an average of 18 months to mature).
Structured settlement income of $5.2 million, which includes $2.8 million of unrealized gains and $2.4 million of interest income is included in the Company’s results for the first time with no comparative results in the prior year.
Forgiveness of debt is the result of the Settlement Agreement with the Bank of Montreal (“BMO”), reached in August of fiscal year 2013. The Company made the final payment of the Remaining Amount in June 2014. The Company is entitled to 100% of the next $16.9 million of collections on the Portfolio Purchase, at which time collections will be split, with the Bank of Montreal on a 70%/ 30% distribution, with 70% being retained by the Company.
Other income. The following table summarizes other income for the years ended September 30, 2014 and 2013:
| 2014 | 2013 | |||||||
| Interest and dividend income |
$ | 1,315,000 | $ | 1,583,000 | ||||
| GAR Disability Advocates income(1) |
378,000 | 2,000 | ||||||
| Realized (losses) gains |
43,000 | (27,000 | ) | |||||
| Other |
41,000 | 53,000 | ||||||
|
|
|
|
|
|||||
| $ | 1,777,000 | $ | 1,611,000 | |||||
|
|
|
|
|
|||||
| (1) | GAR disability income reflects a full year of activity in fiscal year 2014 and only five months of income in fiscal year 2013. |
General and administrative expenses. For the year ended September 30, 2014, general and administrative expenses increased $4.0 million, or 16.4%, to $28.2 million from $24.2 million for the year ended September 30, 2013. The increase is due primarily to increased expenses related to the inclusion of CBC, $3.4 million, and the
38
Table of Contents
increased start-up expenses of GAR Disability Advocates, $1.9 million. CBC is included in the consolidated results of the Company for the first time in fiscal year 2014 and GAR Disability Advocates includes a full year of results during fiscal year 2014 as compared to approximately five months during fiscal year 2013. Offsetting these increases, costs associated with the collection business decreased 18.6% from fiscal year 2013.
Interest expense. For the fiscal year ended September 30, 2014, interest expense was essentially flat as compared to the fiscal year ended September 30, 2013. The interest expense incurred during fiscal year 2014 was primarily from CBC. Interest expense from the consumer receivables business was immaterial during fiscal year 2014, as the Company signed a Settlement Agreement with BMO in August 2013 with a minimal interest rate and the final payment made in June 2014. The interest expense in fiscal year 2013 was primarily related to the Receivables Financing Agreement (“Receivables Financing Agreement”) with BMO, which was in place when the Settlement Agreement was signed.
Impairments. We recorded impairments of $19.5 million during the year ended September 30, 2014, of which $14.1 million was recorded on the Great Seneca portfolio (“the Portfolio Purchase”) as projected collections continued to deteriorate. Approximately $4.8 million of the impairment was related to the medical receivable asset class. Impairments of $11.0 million were recorded for the year ended September 30, 2013, of which $10.1 million was recorded on the Portfolio Purchase.
Net income before taxes — Consumer Receivables. Net income before taxes increased $8.8 million, from $10.1 million for the fiscal year ended September 30, 2013 as compared to to $18.9 million for the fiscal year ended September 30, 2014, as the BMO debt forgiveness more than offset the negative impact of lower collections.
Net income before taxes — Personal Injury Claims. Net income before taxes increased slightly to $2.3 million in fiscal year 2014 from $2.0 million for the prior fiscal year, as increased revenues were partially offset by higher salary expenses.
Net income before taxes — Structured Settlements. Net income before taxes was $0.4 million in fiscal year 2014, with no corresponding data in the prior fiscal year.
Net loss before taxes — GAR Disability Advocates. Net loss before taxes was $2.7 million in the 2014 fiscal year compared to a net loss of $1.2 million in the same prior year period, reflecting increased start-up costs in the current fiscal year. Salaries increased by $0.8 million and marketing expense increased by $0.7 compared to the prior fiscal year.
Income tax expense. Income tax expense of $4.6 million recorded for fiscal year 2014 consists of a $4.1 million current income tax expense and a $0.5 million deferred income tax expense. Income tax expense was higher primarily due to higher pre-tax income, significantly influenced by the $26.1 million of debt forgiveness. In fiscal year 2013, income tax expense of $0.8 million consisted of a current income tax expense of $0.9 million and a deferred income tax benefit of $0.1 million.
Net income. For the year ended September 30, 2014, net income increased $ 4.0 million to $6.4 million from $2.4 million for the year ended September 30, 2013, primarily reflecting the forgiveness of debt of $26.1 million, offset by the impairments of $19.5 million and higher general and administrative expenses.
Income attributable to non-controlling interest. Income to non-controlling interests increased $122,000 from $406,000 for the year ended September 30, 2013 to $528,000 for the year ended September 30, 2014, due to the improvement in the results of the joint venture Pegasus and the inclusion of CBC for the first time ($70,000) with no comparative results from fiscal year 2013.
Net income attributable to Asta Funding, Inc. For the year ended September 30, 2014, net income attributable to Asta Funding, Inc. increased $3.9 million to $5.9 million from $2.0 million for the year ended September 30, 2013, primarily reflecting decreased total revenue, offset by the forgiveness of debt of $26.1 million, increased general and administrative expenses, increased impairments and income to non-controlling interests and higher income taxes. Net income per diluted share for the year ended September 30, 2014 increased to $0.45 per diluted share from $0.15 per diluted share for the year ended September 30, 2013.
39
Table of Contents
Year Ended September 30, 2013 Compared to the Year Ended September 30, 2012(Revised)
Finance income. For the year ended September 30, 2013, finance income decreased $9.0 million, or 22.1%, to $31.8 million from $40.8 million for the year ended September 30, 2012. The decrease is primarily due to the lower level of portfolio purchases over the last three years and, as a result, an increased percentage of our portfolio balances are in the later stages of their yield curves. During the fiscal year ended September 30, 2013, we acquired $53.5 million in face value of new portfolios at a cost of $3.3 million as compared to $6.0 million of face value portfolios at a cost of approximately $2.5 million, during the fiscal year ended September 30, 2012. Finance income recognized from fully amortized portfolios (zero basis revenue) was $25.7 million for the year ended September 30, 2013 as compared to $31.1 million for the year ended September 30, 2012.
Net collections decreased $15.9 million, or 22.7% to $54.1 million for the fiscal year ended September 30, 2013, from $70.0 million for the fiscal year ended September 30, 2012. During fiscal year 2013, gross collections decreased 21.2% to $85.5 million from $108.5 million for fiscal year 2012, reflecting the lower level of purchases, the age of our portfolios and the slowdown in the economy. Commissions and fees associated with gross collections from our third party collection agencies and attorneys decreased $7.1 million, or 18.3% as compared to the same period in the prior year and averaged 36.7% of collections for the fiscal year ended September 30, 2012 as compared to 35.5% in the same prior year period. The higher rate was the result of higher collections (of higher commissioned) out-of-statute paper coupled with increased asset search costs in the current fiscal year.
Further, as we have curtailed our purchases of new portfolios of consumer receivables in the last three fiscal years, finance income was negatively impacted and we expect will continue to be negatively impacted going forward since we have not been replacing our receivables acquired for liquidation. Instead, we focused on reducing our debt and being highly disciplined in our portfolio purchases. We continue to review potential portfolio acquisitions regularly and will purchase such portfolios when we believe the purchase will yield our desired rate of return, as we did with the purchase of a consumer debt portfolio during the fiscal year 2013. There were no accretable yield adjustments recorded during the fiscal years ended September 30, 2013 and 2012.
Personal injury claims income Personal injury claims injury increased $4.8 million from the prior year level of $1.6 million, as we had less than ten months of operating results in fiscal year 2013 and our investments in personal injury claims were greater in the current fiscal year.
Other income. The following table summarizes other income for the years ended September 30, 2013 and 2012:
| 2013 | 2012 | |||||||
| Interest and dividend income |
$ | 1,583,000 | $ | 1,614,000 | ||||
| GAR Disability Advocates income(1) |
2,000 | — | ||||||
| Realized (losses) gains |
(27,000 | ) | 339,000 | |||||
| Other |
53,000 | 303,000 | ||||||
|
|
|
|
|
|||||
| $ | 1,611,000 | $ | 2,256,000 | |||||
|
|
|
|
|
|||||
| (1) | GAR disability began operations in May 2013; hence, five months of income in fiscal year 2013 and none in fiscal year 2012. |
General and administrative expenses. For the year ended September 30, 2013, general and administrative expenses increased $0.6 million, or 2.4%, to $24.2 million from $23.6 million for the year ended September 30, 2012. The increase is due primarily to increased expenses related to Pegasus Funding, LLC (12 months in fiscal year 2013 compared to nine months in fiscal year 2012) and other corporate initiatives, offset by lower collection expenses of the consumer debt operations which include lower salary and benefit costs, resulting from a headcount reduction in January 2013, and other collection expenses. The costs associated with the collection business decreased 16.0% from fiscal year 2012.
40
Table of Contents
Interest expense. For the year ended September 30, 2013, interest expense decreased $1.2 million or 48.8% to $1.3 million from $2.5 million during the year ended September 30, 2012. The decrease was due primarily to the reduction in the balance of our Receivables Financing Agreement (“Receivables Financing Agreement”) with the Bank of Montreal (“BMO”) during the year ended September 30, 2013, as compared to the year ended September 30, 2012.
Impairments. We recorded impairments of $11.0 million during the year ended September 30, 2013, of which $10.1 million was recorded on the Great Seneca portfolio (“the Portfolio Purchase”). Impairments of $1.8 million for the year ended September 30, 2012, as collections on various portfolios were short of expectations.
Net income before taxes — Consumer Receivables. Net income before taxes decreased $13.0 million, from $23.1 million for the fiscal year ended September 30, 2012 to $10.1 million for the fiscal year ended September 30, 2013, the result of lower collections and increased impairments in the 2013 fiscal year.
Net income before taxes — Personal Injury Claims. Net income before taxes increased to $2.0 million in fiscal year 2013 from $0.1 million for the prior fiscal year, as increased revenues in fiscal year 2013, reflecting an increased number of closed cases from fiscal years 2013 and 2012 investments, far outweighed increased expenditures.
Net loss before taxes — GAR Disability Advocates. Net loss before taxes was $1.2 million in the 2013 fiscal year. As the business segment began in fiscal year 2013, there is no comparable data for the prior fiscal year.
Income tax expense. Income tax expense of $0.8 million recorded for fiscal year 2013 consists of a $0.9 million current income tax expense and a $0.1 million deferred income tax benefit . Income tax expense was lower primarily due to lower pre-tax income. In fiscal year 2012, income tax expense of $6.8 million consisted of a current income tax expense of $3.5 million and a deferred income tax expense of $3.3 million.
Net income. For the year ended September 30, 2013, net income decreased $7.6 million to $2.4 million from $10.0 million for the year ended September 30, 2012, primarily reflecting decreased total revenue, increased general and administrative expenses and impairments further offset by lower interest expense and income taxes.
Income attributable to non-controlling interest. Income to non-controlling interests increased to $0.4 million from $31 thousand due to the improvement in the results of the joint venture Pegasus Funding, LLC.
Net income attributable to Asta Funding, Inc. For the year ended September 30, 2013, net income attributable to Asta Funding, Inc. decreased $7.9 million to $2.0 million from $9.9 million for the year ended September 30, 2012, primarily reflecting decreased total revenue, increased general and administrative expenses, impairments and income to non-controlling interests partially offset by lower interest expense and income taxes. Net income per diluted share for the year ended September 30, 2013 decreased to $0.15 per diluted share down from $0.69 per diluted share for the year ended September 30, 2012.
Liquidity and Capital Resources
Our primary source of cash from operations is collections on the receivable portfolios we have acquired and the funds generated from the Pegasus and CBC business segments. Our primary uses of cash include repayments of debt, our purchases of consumer receivable portfolios, interest payments, costs involved in the collections of consumer receivables, taxes and dividends, if approved. In the past, we relied significantly upon our lenders to provide the funds necessary for the purchase of consumer receivables acquired for liquidation.
Receivables Financing Agreement
In March 2007, Palisades XVI borrowed approximately $227 million under the Receivables Financing Agreement, as amended in July 2007, December 2007, May 2008, February 2009, October 2010 and August 2013 from BMO, in order to finance the Portfolio Purchase which had a purchase price of $300 million. The original term of the agreement was three years. This term was extended by each of the Second, Third, Fourth, Fifth Amendments and the most recent agreement signed in August 2013, discussed below.
41
Table of Contents
Since the inception of the Receivables Financing Agreement amendments have been signed to revise various terms of the Receivables Financing Agreement. The Settlement Agreement and Omnibus Amendment (“Settlement Agreement”) was in effect on August 7, 2013, Palisades XVI, a 100% owned bankruptcy remote subsidiary, entered into a Settlement Agreement with BMO as an amendment to the Receivables Financing Agreement. In consideration for a $15 million prepayment funded by the Company, BMO has agreed to significantly reduce minimum monthly collection requirements and the interest rate. If and when BMO were to receive the next $15 million of collections from the Portfolio Purchase, (the “Remaining Amount”) less certain credits for payments made prior to the consummation of the Settlement Agreement, the Company would be entitled to recover from future net collections the $15 million prepayment that it funded. Thereafter, BMO would have the right to receive 30% of future net collections. Upon repayment of the Remaining Amount to BMO, the Company would be released from the remaining contractual obligation of the Receivables Financing Agreement and the Settlement Agreement.
On June 3, 2014, Palisades XVI finished paying the Remaining Amount. The final principal payment of $2.9 million included a voluntary prepayment of $1.9 million provided from funds of the Company. Accordingly, Palisades XVI will be entitled to receive $16.9 million of future collections from the Portfolio Purchase before BMO is entitled to receive any payments with respect to its Income Interest. The Company estimated the Income Interest to be between $0 and $1.4 million. However, the Company believes that no amount would be incurred because of the continued deterioration of the collections from the portfolio purchase.
With the payment of the Remaining Amount and upon completion of the documents granting the Palisades XVI Income Interest, including a written confirmation from BMO that the obligation has been paid in full, Palisades XVI has been released from further debt obligations from the RFA. We have recorded as other income, forgiveness of non-recourse debt, in the amount of approximately $26.1 million, pre-tax in the third quarter of fiscal year 2014.
Bank Hapoalim B.M. (“Bank Hapoalim”) Line of Credit
On May 2, 2014, the Company obtained a $20 million line of credit facility from Bank Hapoalim, pursuant to a Loan Agreement (the “Loan Agreement”) among the Company and its subsidiary, Palisades Collection, LLC, as borrowers, and Bank Hapoalim, as agent and lender. The Loan Agreement provides for a $20.0 million committed line of credit and an accordion feature providing an increase in the line of credit of up to $30 million, at the discretion of the lenders. The facility is for a term of three years at an interest rate of either LIBOR plus 275 basis points or prime, at the Company’s option. The Loan Agreement includes covenants that require the Company to maintain a minimum net worth of $150 million and pay an unused line fee. The facility is secured pursuant to a Security Agreement (“Security Agreement”) among the parties to the Loan Agreement. As of September 30, 2014, the Company had not used this facility.
Other Investments — Personal Injury Claims
On December 28, 2011, we formed a joint venture Pegasus Funding, LLC (“Pegasus”) with Pegasus Legal Funding, LLC (“PLF”). Pegasus purchases interests in personal injury claims from claimants who are a party to a personal injury litigation with the expectation of a settlement in the future. Pegasus advances to each claimant funds on a non-recourse basis at an agreed upon interest rate in anticipation of a future settlement. The interest purchased by Pegasus in each claim will consist of the right to receive from such claimant part of the proceeds or recoveries which such claimant receives by reason of a settlement, judgment or award with respect to such claimant’s claim. The profits from the joint venture are distributed based on the ownership percentage of the parties — Asta Funding, Inc. 80% and PLF, 20%.
Other Investments — Divorce Funding
On May 18, 2012, we formed BP Case Management, LLC (“BPCM”), a joint venture with California-based Balance Point Divorce Funding, LLC (“BP Divorce Funding”). BPCM provides non-recourse funding to a spouse in a matrimonial action. The Company provides a $1.5 million revolving line of credit to partially fund BP Divorce Funding’s operations, with such loan bearing interest at the prevailing prime rate, with an initial term
42
Table of Contents
of twenty-four months. The revolving line of credit is collateralized by BP Divorce Funding’s profit share in BPCM and other assets. The term of the loan was to end in May 2014, but has been extended until August 2016.
Other Investments — Structured Settlements
On December 31, 2013, the Company acquired 80% ownership of CBC and its affiliate, CBC Management Services, LLC for approximately $5.9 million. At the closing, the operating principals of CBC, William J. Skyrm, Esq. and James Goodman, were each issued a 10% interest in CBC. In addition, the Company has agreed to provide financing to CBC of up to $5 million. Through the transaction we acquired debt that totaled $23 million consisting of $9.6 million of a revolving line of credit with a financial institution and $13.8 million of non-recourse notes issued by CBC’s subsidiaries. As of September 30, 2014, the debt approximated $32.3 million. On September 29, 2014, CBC entered into an amendment whereby it increased its revolving line of credit from $20.0 million to $22.0 million and the maturity date remained at February 28, 2015. On March 1, 2015 CBC entered into the 9th amendment of the agreement with a new maturity date of March 1, 2017, increased the credit to $25.0 million and lowered the floor to 4.1%.
On November 26, 2014, CBC announced the completion of its fourth private placement, backed by structured settlement and fixed annuity payments. CBC issued, through its subsidiary, BBR IV, LLC, approximately $20.8 million of fixed rate asset-backed notes with a yield of 5.4%.
Cash Flow(Revised)
As of September 30, 2014, our cash and cash equivalents decreased $6.5 million to $28.7 million, from $35.2 million at September 30, 2013. Although our cash flow remains strong, we have diversified some of our cash flow into other investments.
Net cash used in operating activities was $2.1 million during the fiscal year ended September 30, 2014, as compared to $19.1 million provided by operating activities for the fiscal year ended September 30, 2013. The decrease is primarily due to lower net income, exclusive of non-cash items, primarily forgiveness of debt and unrealized structured settlement income and gains, which existed only in the 2014 fiscal year. Net cash used in investing activities was $1.0 million during the fiscal year ended September 30, 2014, as compared to net cash provided by investing activities of $42.7 million during the fiscal year ended September 30, 2013. The change in cash in investing activities is primarily due to the investing activity in other than cash and cash equivalents depository accounts and lower collections of consumer receivables acquired for liquidation during the year ended September 30, 2014 as compared to the same 2013 period. In fiscal year 2013 we liquidated our certificates of deposits. We increased our investment in available for sale securities and investment in CBC structured settlements in the current fiscal year only. This was partially offset by an increase in personal injury receipts during the year ended September 30, 2014 compared to the same prior year period. Net cash used in financing activities was $3.3 million during the fiscal year ended September 30, 2014, as compared to $28.9 million in the same 2013 period. The decrease in net cash used in financing activities was primarily due to a decrease in the pay down of the non-recourse debt partially offset by net borrowings of other CBC debt in the current fiscal year.
Our cash requirements have been and will continue to be significant and include external financing to operate various lines of business. Significant requirements include investment in personal injury claims, investments in structured settlements, costs involved in the collections of consumer receivables, repayment of CBC debt and investment in consumer receivable portfolios, and, until the third quarter of fiscal year 2014, repayments under our non-recourse debt facilities. In addition, if approved by the board of directors, dividends are financed though operations. Acquisitions recently have been financed through cash flows from operating activities. We believe we will be less dependent on a credit facility (with the exception of CBC) in the short-term, as our cash flow from operations will be sufficient to invest in personal injury claims, purchase portfolios and finance the early stages of the disability advocacy business. Structured settlements are financed through the use of a credit line, warehouse facility and private placement financing.
We believe our available cash resources and expected cash flows from operations will be sufficient to fund operations for the next twelve months. We do not expect to incur any material capital expenditures during the next twelve months.
43
Table of Contents
We are cognizant of the current market fundamentals in the debt purchase and company acquisition markets which, because of significant supply and tight capital availability, could result in increased buying opportunities. The outcome of any future transaction(s) is subject to market conditions. In addition, due to these opportunities, we continue to seek opportunities with banking organizations and others on a possible financing loan facility.
Share Repurchase Program
On March 9, 2012, we adopted a Rule 10b5-1 Plan in conjunction with our share repurchase program that authorized us to purchase up to $20.0 million of shares of our common stock. Under that program, which expired in March 2013, we purchased 885,000 shares at an aggregate cost of approximately $7.9 million. The Rule 10b5-1 Plan superseded the authorization to repurchase shares in June 2011, pursuant to which we repurchased approximately 59,000 shares at an aggregate cost of approximately $457,000. Additionally, in June 2012, we repurchased 1.0 million shares for $9.4 million in a privately negotiated transaction. We repurchased an aggregate of approximately 1.9 million shares at an aggregate cost of approximately $17.8 million.
Contractual Obligations
The following table summarizes our contractual obligations in future fiscal years:
Payments Due By Period
| Total | Less Than 1 Year |
1-3 Years | 3-5 Years | More Than 5 Years |
||||||||||||||||
| Long Term Debt Obligations |
$ | 12,712,000 | $ | 1,232,000 | $ | 2,370,000 | $ | 2,158,000 | $ | 6,952,000 | ||||||||||
| Operating Lease Obligations |
2,297,000 | 739,000 | 1,130,000 | 365,000 | 63,000 | |||||||||||||||
|
|
|
|
|
|
|
|
|
|
|
|||||||||||
| Total |
$ | 15,009,000 | $ | 1,971,000 | $ | 3,500,000 | $ | 2,523,000 | $ | 7,015,000 | ||||||||||
|
|
|
|
|
|
|
|
|
|
|
|||||||||||
Off-Balance Sheet Arrangements
As of September 30, 2014, we did not have any relationships with unconsolidated entities or financial partners, such as entities often referred to as structured finance or special purpose entities, established for the purpose of facilitating off-balance sheet arrangements or other contractually narrow or limited purposes. As such, we are not materially exposed to any financing, liquidity, market or credit risk that could arise if we had engaged in such relationships.
The following table shows the changes in finance receivables, including amounts paid to acquire new portfolios:
| Year Ended September 30, | ||||||||||||||||||||
| 2014 | 2013 (As Revised) |
2012 (As Revised) |
2011 (As Revised) |
2010 (As Revised) |
||||||||||||||||
| (In millions) | ||||||||||||||||||||
| Balance at beginning of period |
$ | 64.3 | $ | 94.2 | $ | 122.7 | $ | 154.5 | $ | 217.3 | ||||||||||
| Acquisitions of finance receivables, net of buybacks |
5.1 | 3.3 | 2.5 | 7.5 | 8.0 | |||||||||||||||
| Cash collections from customers applied to principal(1) |
(20.4 | ) | (22.2 | ) | (29.1 | ) | (37.0 | ) | (56.2 | ) | ||||||||||
| Cash collections represented by account sales applied to |
(0.1 | ) | — | (0.1 | ) | (0.2 | ) | (1.2 | ) | |||||||||||
| Impairments/Portfolio write down |
(19.5 | ) | (11.0 | ) | (1.8 | ) | (2.1 | ) | (13.4 | ) | ||||||||||
|
|
|
|
|
|
|
|
|
|
|
|||||||||||
| Balance at end of period |
$ | 29.4 | $ | 64.3 | $ | 94.2 | $ | 122.7 | $ | 154.5 | ||||||||||
|
|
|
|
|
|
|
|
|
|
|
|||||||||||
| (1) | Cash collections applied to principal consists of cash collections less income recognized on finance receivables plus amounts received by us from the sale of consumer receivable portfolios to third parties. |
44
Table of Contents
Supplementary Information on Consumer Receivables Portfolios:
Portfolio Purchases
| Year Ended September 30, | ||||||||||||
| 2014 | 2013 | 2012 | ||||||||||
| (In millions) | ||||||||||||
| Aggregate Purchase Price |
$ | 5.1 | $ | 3.3 | $ | 2.5 | ||||||
| Aggregate Portfolio Face Amount |
478.9 | 53.5 | 6.0 | |||||||||
The prices we pay for our consumer receivable portfolios are dependent on many criteria including the age of the portfolio, the number of third party collection agencies and attorneys that have been involved in the collection process and the geographical distribution of the portfolio. When we pay higher prices for portfolios which are performing or fresher, we believe it is not at the sacrifice of our expected returns. Price fluctuations for portfolio purchases from quarter to quarter or year to year are primarily indicative of the overall mix of the types of portfolios we are purchasing.
Schedule of Portfolios by Income Recognition Category
| September 30, 2013 |
September 30, 2012 | |||||||||||||||||||||||
| September 30, 2014 | (As Revised) | (As Revised) | ||||||||||||||||||||||
| Cost Recovery Portfolios(1) |
Interest Method Portfolios |
Cost Recovery Portfolios |
Interest Method Portfolios |
Cost Recovery Portfolios |
Interest Method Portfolios |
|||||||||||||||||||
| (In millions) | ||||||||||||||||||||||||
| Original Purchase Price |
$ | 1,254.6 | $ | — | $ | 539.3 | $ | 710.3 | $ | 537.8 | $ | 708.2 | ||||||||||||
| Cumulative Aggregate Managed Portfolios (at period end) |
32,437.3 | — | 15,102.4 | 16,855.9 | 15,049.0 | 16,855.9 | ||||||||||||||||||
| Receivable Carrying Value |
29.4 | — | 51.1 | 13.1 | 78.8 | 15.4 | ||||||||||||||||||
| Finance Income Earned |
19.5 | — | 4.5 | 27.3 | 3.5 | 37.3 | ||||||||||||||||||
| Total Cash Flows (for the respective period) |
40.2 | — | 25.2 | 28.8 | 24.9 | 45.0 | ||||||||||||||||||
The original purchase price reflects what we paid for the receivables from 1998 through the end of the respective period. The cumulative aggregate managed portfolio balance is the original aggregate amount owed by the borrowers at the end of the respective period. Additional differences between year to year period end balances may result from the transfer of portfolios between the interest method and the cost recovery method. We purchase consumer receivables at substantial discounts from the face amount. We record finance income on our receivables under either the cost recovery or interest method. The receivable carrying value represents the current basis in the receivables after collections and amortization of the original price.
| (1) | On October 1, 2013, all interest method portfolios were transferred to the cost recovery method. |
Collections Represented by Account Sales
| Year |
Collections Represented By account Sales |
Finance Income Recognized |
||||||
| 2014 |
$ | 114,000 | $ | 88,000 | ||||
| 2013 |
2,448,000 | 2,015,000 | ||||||
| 2012 |
117,000 | 32,000 | ||||||
45
Table of Contents
We do not anticipate collecting the majority of the purchased principal amounts. Accordingly, the difference between the carrying value of the portfolios and the gross receivables is not indicative of future finance income from these accounts acquired for liquidation. Since we purchased these accounts at significant discounts, we anticipate collecting only a portion of the face amounts.
For the year ended September 30, 2014, we recognized finance income of $19.9 million under the cost recovery method. As of October 1, 2013, all portfolios were transferred to the cost recovery method. During the year ended September 30, 2014, we purchased portfolios with an aggregate purchase price of $5.1 million with a face value (gross contracted amount) of $478.9 million.
Recent Accounting Pronouncements
In May 2014, the Financial Accounting Standards Board (the “FASB”) issued an update to ASC 606, “Revenue from Contracts with Customers,” that will supersede virtually all existing revenue guidance. Under this update, an entity is required to recognize revenue upon transfer of promised goods or services to customers, in an amount that reflects the entitled consideration received in exchange for those goods or services. The guidance also requires additional disclosure about the nature, amount, timing, and uncertainty of revenue and cash flows arising from the customer contracts. This update is effective for annual reporting periods beginning after December 15, 2016, including interim periods within that reporting period. Early application is not permitted. We are currently evaluating the impact this update will have on our consolidated financial statements as well as the expected adoption method.
In June 2014, the FASB issued ASU 2014-11, “Transfers and Servicing (Topic 860): Repurchase-to-Maturity Transactions, Repurchase Financings, and Disclosures.” The amendments in this ASU require two accounting changes. First, the amendments in this ASU change the accounting for repurchase-to maturity transactions to secured borrowing accounting. Second, for repurchase financing arrangements, the amendments require separate accounting for a transfer of a financial asset executed contemporaneously with a repurchase agreement with the same counterparty, which will result in secured borrowing accounting for the repurchase agreement. This ASU also includes new disclosure requirements. The accounting changes in this Update are effective for public business entities for the first interim or annual period beginning after December 15, 2014. An entity is required to present changes in accounting for transactions outstanding on the effective date as a cumulative-effect adjustment to retained earnings as of the beginning of the period of adoption. Earlier application for a public business entity is prohibited. The Company reviewed this ASU and determined that it did not have a material impact on its consolidated financial statements.
In February 2015, the FASB issued ASU 2015-02, “Consolidation (Topic 810): Amendments to the Consolidation Analysis,” which amends the consolidation requirements in ASC 810. This update is effective for public business entities for the first interim or annual period beginning after December 15, 2015. We are currently reviewing this ASU to determine if it will have an impact on our consolidated financial statements.
Inflation
We believe that inflation has not had a material impact on our results of operations for the years ended September 30, 2014, 2013 and 2012.
| Item 7A. | Quantitative and Qualitative Disclosures About Market Risk |
We are exposed to various types of market risk in the normal course of business, including the impact of interest rate changes and changes in corporate tax rates. At September 30, 2014, our Receivable Financing Agreement, which had been variable debt, had an outstanding balance of $0. The debt associated with our acquisition of CBC, had a balance of approximately $32.3 million, consisting of $19.6 million through a line of credit, at a rate of LIBOR plus 4%, with a floor of 4.75%, from a financial institution, and $13.0 million of notes at varying rates, from 7.125% to 8.75%, issued by CBC’s subsidiaries. At September 30, 2014, the LIBOR rate was 0.16%. Thus, a 25 basis point change in the LIBOR rate would have had no impact on the line of credit interest expense, as the resulting rate would still have been below the 4.75% floor. We do not currently invest in derivative financial or commodity instruments.
46
Table of Contents
| Item 8. | Financial Statements And Supplementary Data. |
The Financial Statements of the Company, the Notes thereto and the Reports of Independent Registered Public Accounting Firms thereon required by this item begin on page F-1 of this report located immediately preceding the signature page.
| Item 9. | Changes in and Disagreements With Accountants on Accounting and Financial Disclosure. |
None.
| Item 9A. | Controls and Procedures. |
Disclosure Controls and Procedures
We conducted an evaluation, under the supervision and with the participation of our management, including the Chief Executive Officer and Chief Financial Officer, of the effectiveness of our disclosure controls and procedures (as such term is defined in Rules 13a-15(e) and 15d-15(e) under the Securities Exchange Act of 1934, as amended (the “Exchange Act”)) as of September 30, 2014. There are inherent limitations to the effectiveness of any system of disclosure controls and procedures, including the possibility of human error and the circumvention or overriding of the controls and procedures. Accordingly, even effective disclosure controls and procedures can only provide reasonable assurance of achieving their control objectives. Based on their evaluation, the Chief Executive Officer and Chief Financial Officer concluded that our disclosure controls and procedures were not effective as of September 30, 2014 based on the material weakness discussed below.
Management’s Annual Report on Internal Control Over Financial Reporting
Our management is responsible for establishing and maintaining adequate internal control over financial reporting (as defined in Rule 13a-15(f) under the Exchange Act). Under the supervision and with the participation of our management, including its principal executive officer and principal financial officer, we conducted an assessment of the effectiveness of its internal control over financial reporting. In making this assessment, we used the criteria set forth by the Committee of Sponsoring Organizations of the Treadway Commission (“COSO”) in Internal Control — Integrated Framework, issued in 1992. Based on management’s assessment, and based on the criteria in 1992 COSO, we believe that we did not maintain effective internal control over financial reporting as of September 30, 2014 because of the material weakness described below.
Material Weakness
Management identified a material weakness in our internal control over financial reporting related to the revenue recognition process in our consumer receivables portfolios, specifically related to the application of the interest method of accounting as promulgated by Accounting Standards Codification (“ASC”) 310-30, Receivables — Loans and Debt Securities Acquired with Deteriorated Quality. During our review of portfolio cash flows, our controls did not include an analysis and review of the current cash flow variations within a quarter to determine whether there is an impairment or accretion.
Remediation Plan
As part of our commitment to strengthening our internal control over financial reporting, we have implemented various actions and will initiate other remedial actions under the oversight of the Audit Committee, including following the guidance set forth in ASC 310-30.
We believe we have implemented the necessary internal controls to remediate the material weakness relating to our revenue recognition process. We have implemented procedures to prepare and review an analysis of the variations between actual and estimated cash flows. We will continue to maintain and verify the effective operation of these controls, before concluding that we have remediated this material weakness in revenue recognition controls.
47
Table of Contents
We can give no assurance that the measures we take will remediate the material weakness that we identified or that any additional material weaknesses will not arise in the future. We will continue to monitor the effectiveness of these and other processes, procedures and controls and will make any further changes management determines appropriate.
Our independent registered public accounting firm, WeiserMazars LLP, audited our internal control over financial reporting as of September 30, 2014 and their report dated June 29, 2015 expresses an adverse opinion on our internal control over financial reporting and is included in this Item 9A.
Changes in Internal Controls over Financial Reporting
During fiscal year 2014, the Company implemented certain new internal control procedures with regard to the accounting for revenue recognition under the guidance of ASC 310-30. In addition, with the exception of the CBC acquisition, there have not been any changes in our internal controls over financial reporting (as defined in Exchange Act Rules 13a-15(f) and 15d-15(f)) that occurred during our fourth fiscal quarter that have materially affected, or are reasonably likely to materially affect, our internal control over financial reporting.
Note Regarding Acquisition
In making our assessment of the disclosure controls and procedures and of changes in internal control over financial reporting as of September 30, 2014, we have excluded the operations of CBC, which was acquired on December 31, 2013. We are currently assessing the control environment of this acquired business. CBC revenues comprised approximately 16% of our revenues for the year ended September 30, 2014, and approximately 18% of total assets as of September 30, 2014.
48
Table of Contents
REPORT OF INDEPENDENT REGISTERED PUBLIC ACCOUNTING FIRM
To the Board of Directors and Stockholders of
Asta Funding, Inc.
We have audited Asta Funding, Inc. and subsidiaries’ (the “Company”) internal control over financial reporting as of September 30, 2014, based on criteria established in Internal Control — Integrated Framework issued by the Committee of Sponsoring Organizations of the Treadway Commission (COSO) in 1992. The Company’s management is responsible for maintaining effective internal control over financial reporting and for its assessment of the effectiveness of internal control over financial reporting, included in the accompanying Management’s Annual Report on Internal Control over Financial Reporting. Our responsibility is to express an opinion on the Company’s internal control over financial reporting based on our audit.
As described in Management’s Report on Internal Control Over Financial Reporting, management excluded from its assessment the internal control over financial reporting at CBC Settlement Funding, LLC, which was acquired on December 31, 2013, whose financial statements constitute 18% of total assets and 16% of total revenue of the consolidated financial amounts of the Company as of and for the year ended September 30, 2014. Accordingly, our audit did not include the internal control over financial reporting at CBC Settlement Funding, LLC.
We conducted our audit in accordance with the standards of the Public Company Accounting Oversight Board (United States). Those standards require that we plan and perform the audit to obtain reasonable assurance about whether effective internal control over financial reporting was maintained in all material respects. Our audit included obtaining an understanding of internal control over financial reporting, assessing the risk that a material weakness exists, and testing and evaluating the design and operating effectiveness of internal control based on the assessed risk, and performing such other procedures as we considered necessary in the circumstances. We believe that our audit provides a reasonable basis for our opinion.
A company’s internal control over financial reporting is a process designed to provide reasonable assurance regarding the reliability of financial reporting and the preparation of financial statements for external purposes in accordance with generally accepted accounting principles. A company’s internal control over financial reporting includes those policies and procedures that (1) pertain to the maintenance of records that, in reasonable detail, accurately and fairly reflect the transactions and dispositions of the assets of the company; (2) provide reasonable assurance that transactions are recorded as necessary to permit preparation of financial statements in accordance with generally accepted accounting principles, and that receipts and expenditures of the company are being made only in accordance with authorizations of management and directors of the company; and (3) provide reasonable assurance regarding prevention or timely detection of unauthorized acquisition, use, or disposition of the company’s assets that could have a material effect on the financial statements.
Because of its inherent limitations, internal control over financial reporting may not prevent or detect misstatements. Also, projections of any evaluation of effectiveness to future periods are subject to the risk that controls may become inadequate because of changes in conditions, or that the degree of compliance with the policies or procedures may deteriorate.
A material weakness is a deficiency, or combination of deficiencies, in internal control over financial reporting, such that there is a reasonable possibility that a material misstatement of the Company’s annual or interim financial statements will not be prevented or detected on a timely basis. The following material weakness has been identified and included in management’s assessment. The Company has determined the effective yield for its distressed consumer receivable portfolios by analyzing actual cash flows versus the amount of cash flows expected to be collected over the life of the loan as opposed to performing this analysis using current cash flows variations (i.e. actual versus estimated cash flows within a particular quarter). This material weakness was considered in determining the nature, timing, and extent of audit tests applied in our audit of the 2014 consolidated financial statements, and this report does not affect our report dated June 29, 2015, on those consolidated financial statements.
49
Table of Contents
In our opinion, management’s assessment that the Company did not maintain effective internal control over financial reporting as of September 30, 2014, is fairly stated, in all material respects, based on criteria established in Internal Control — Integrated Framework issued by the Committee of Sponsoring Organizations of the Treadway Commission (COSO) issued in 1992. Also, in our opinion, because of the effect of the material weakness described above on the achievement of the objectives of the control criteria, the Company has not maintained effective internal control over financial reporting as of September 30, 2014, based on criteria established in Internal Control — Integrated Framework (1992) issued by the Committee of Sponsoring Organizations of the Treadway Commission (COSO).
We have also audited, in accordance with the standards of the Public Company Accounting Oversight Board (United States), the consolidated balance sheets of the Company as of September 30, 2014 and 2013, and the related consolidated statements of income, comprehensive income, stockholders’ equity, and cash flows for the years ended September 31, 2014 and 2013, and our report dated June 29, 2015, expressed an unqualified opinion on those consolidated financial statements.
/s/ WeiserMazars LLP
New York, New York
June 29, 2015
50
Table of Contents
| Item 9B. | Other Information. |
None.
PART III
| Item 10. | Directors, Executive Officers and Corporate Governance. |
| Name |
Age | Position | ||
| Arthur Stern | 94 | Director, Chairman Emeritus | ||
| Gary Stern | 62 | Chairman, President and Chief Executive Officer | ||
| Edward Celano(1)(2)(3) | 76 | Director | ||
| Harvey Leibowitz(1)(2)(3) | 81 | Director | ||
| Louis A. Piccolo | 63 | Director | ||
| David Slackman(1)(2) | 67 | Director | ||
| Robert J. Michel | 58 | Chief Financial Officer and Secretary | ||
| Seth Berman | 52 | General Counsel and Chief Compliance Officer | ||
| Ricky Stern | 30 | Senior Vice President and President of GAR Disability Advocates |
| (1) | Member of Audit Committee |
| (2) | Member of Compensation Committee |
| (3) | Member of Governance Committee |
The Business Experience and Qualifications of Each Director
We believe that our Board of Directors should be composed of individuals with sophistication and experience in many substantive areas that impact our business. We believe that experience, qualifications, or skills in the following areas are most important: experience in the distressed consumer credit industry; regulatory; accounting and finance; capital markets; strategic planning; human resources and development practices; and board practices of other corporations. These areas are in addition to the personal qualifications described in this section. We believe that all of our current Board members possess the professional and personal qualifications necessary for board service, and have highlighted particularly noteworthy attributes for each Board member in the individual biographies below. The principal occupation and business experience, for at least the past five years, of each current director is as follows:
Arthur Stern has been a director and has served as Chairman Emeritus since January 2009. Mr. Stern served as Chairman of the Board of Directors and Executive Vice President of the Company since our inception in July 1994 through January 2009. Since 1963, Mr. Arthur Stern has been President of Asta Group. In such capacities, he has obtained substantial experience in distressed consumer credit analysis and receivables collections. As a result of these and other professional experiences, Mr. Stern possesses particular knowledge and experience in distressed consumer credit and collections which strengthens the Board’s collective qualifications, skills, and experience.
Gary Stern has been a director and the President and Chief Executive Officer of the Company since our inception in July 1994. Mr. Stern assumed the role of Chairman in January 2009. Mr. Stern had been Vice President, Secretary, Treasurer and a director of Asta Group since 1980 and held other positions with Asta Group prior thereto. In such capacities, he has obtained substantial experience in distressed consumer credit analysis and receivables collections. As a result of these and other professional experiences, Mr. Stern possesses particular knowledge and experience in financial management and collections which strengthens the Board’s collective qualifications, skills, and experience.
51
Table of Contents
Edward Celano has been a director of the Company since September 1995. Mr. Celano has served as a consultant to Walters and Samuels, Incorporated since 2003. He was formerly a consultant with WeiserMazars LLP, from 2001 to 2003, and an Executive Vice President of Atlantic Bank from May 1996 to February 2001. Prior to May 1996, Mr. Celano was a Senior Vice President of NatWest Bank (now Bank of America) after having held different positions at the bank for over 20 years. As a result of these and other professional experiences, Mr. Celano possesses particular knowledge and experience in financial services and management which strengthens the Board’s collective qualifications, skills, and experience.
Harvey Leibowitz has been a director of the Company since January 2000. Mr. Leibowitz has served as a Senior Vice President of Sterling National Bank since June 1994. Prior to June 1994, Mr. Leibowitz was employed as a Senior Vice President and Vice President of several banks and financial institutions since 1963. As a result of these and other professional experiences, Mr. Leibowitz possesses particular knowledge and experience in financial services and management which strengthens the Board’s collective qualifications, skills, and experience.
Louis A. Piccolo has been a director of the Company since June 2004. Mr. Piccolo has served as President of A.L. Piccolo & Co., Inc., a business consulting firm specializing in management and financial consulting, since 1988. Mr. Piccolo was an Executive Vice President and Chief Financial Officer of Alfred Dunhill of London, Inc. from 1983 to 1988, and held the same positions at Debenham’s PLC, from 1981 to 1983. From 1977 to 1981, Mr. Piccolo was a senior accountant at KPMG Peat Marwick. As a result of these and other professional experiences, Mr. Piccolo possesses particular knowledge and experience in accounting and management which strengthens the Board’s collective qualifications, skills, and experience.
David Slackman has been a director of the Company since May 2002. Mr. Slackman has served as Managing Director at HT Capital Advisors LLC from August 2008 to present. Mr. Slackman served as President, Manhattan Market — New York of Commerce Bank from January 2001 through June 2008. Mr. Slackman was an Executive Vice President of Atlantic Bank of New York from 1994 to 2001 and a Senior Vice President of the Dime Savings Bank from 1986 to 1994. As a result of these and other professional experiences, Mr. Slackman possesses particular knowledge and experience in financial services and management which strengthens the Board’s collective qualifications, skills, and experience.
The following are the executive officers of the Company who are not directors of the Company.
Robert J. Michel, CPA, has served as our Chief Financial Officer since February 2009. Prior to this, from 2004 to 2009, Mr. Michel served as our Controller and the Director of Financial Reporting and Compliance. Prior to joining the Company, Mr. Michel was a partner at Laurence Rothblatt & Company LLP, a CPA firm located in Great Neck, New York.
Seth Berman, Esq., has served as our General Counsel since 2005 and was named Chief Compliance Officer in April 2013. From 1997 through 2004, Mr. Berman was an associate at Weil, Gotshal & Manges LLP.
Ricky Stern, has served as our Senior Vice President since 2014. Ricky Stern was named President of GAR Disability Advocates in January 2015.
There are no events or legal proceedings material to an evaluation of the ability or integrity of any director or executive officer, or any nominee therefor, of the Company. Moreover, no director or executive officer of the Company, nor any nominee, is a party adverse to the Company or has a material interest adverse to the Company in any legal proceeding.
Family Relationships
Arthur Stern is the father of Gary Stern. Ricky Stern is the son of Gary Stern and the grandson of Arthur Stern.
52
Table of Contents
| Item 11. | Executive Compensation. |
Compensation Discussion and Analysis
We seek to have compensation programs for our named executive officers that are intended to achieve a variety of goals, including, but not limited to:
| • | attracting and retaining talented and experienced executives in the competitive debt buying industry; |
| • | motivating and fairly rewarding executives whose knowledge, skills and performance are critical to our success; and |
| • | providing fair and competitive compensation. |
In determining executive compensation for fiscal year 2014 (ended on September 30, 2014), the Compensation Committee articulated as its central goal the continuation of its policy of having the compensation paid to the named executive officers reward them for Company-wide and individual performance and better link pay and performance. This policy is intended to assure that our compensation practices are competitive with those in the industry. Our chief executive officer, as he did for certain prior fiscal years, assisted the Compensation Committee in determining compensation for the other named executive officers.
For fiscal year 2014, the Compensation Committee engaged a professional compensation consultant, Adams Consulting Group, LLC (“Adams”) to provide benchmarking data (using, principally, relevant published survey analysis and proxy analysis), make suggestions, and assist it in the compensation process. Data for the salary surveys were selected based upon one or more of the following criteria: (i) industry group; (ii) geographic location; and (iii) company revenue. In addition, Adams conducted a competitive market analysis of comparable positions, for the named executive officers, by utilizing surveys from Towers Watson, Economic Research Institute, CompData, National Employer Associations of America and Kenexa, and for the directors, surveys from the 2012 Towers Watson General Industry Board of Directors Compensation Policies and Practices and the 2013 Director Compensation Report/Frederick W. Cook & Co. The proxy analysis included 16 public companies within the same industry and approximate revenue size as us. Adams focused on the base salary, annual bonus and long-term equity compensation of the chief executive officer (who also serves as our president), the chief financial officer (who also serves as our secretary), the senior vice president (who also serves as president of GAR Disability Advocates) and the general counsel (who also serves as our chief compliance officer), and on the annual retainers (as chairman and member) and equity compensation of the various committee members, as well as the separate annual retainer for each independent director. Adams memorialized its findings in an October 2014 report to the Compensation Committee (the “Adams Report”).
With respect to the named executive officers, the Adams Report recommended that the Compensation Committee consider recommending to the Board that it (i) adjust annual base salaries by 2.0% to 6.0%, depending upon individual performance and other relevant factors and (ii) increase annual cash bonuses, basing such bonuses on performance. However, the Adams Report also recommended that the Board retain the flexibility to offer extraordinary compensation to any or all of the named executive officers, in the form of cash or equity, to reflect, as applicable, individual or group accomplishments, changing business objectives or needs and retention issues.
With respect to the directors, the Adams Report recommended that the Compensation Committee consider recommending to the Board that it consider make an annual equity award to each Board member approximately equal to the annual retainer of $45,000.
On November 20, 2014 the Compensation Committee met to review the Adams Report and formulate its recommendations to the Board with respect to executive base salary and Board retainers, as applicable, for fiscal year 2015 (ending on September 30, 2015) and for cash bonus (named executive officers only) and equity or equity-based grants to be made in fiscal year 2015 but which relate to fiscal year 2014 performance. With respect to executive compensation for the named executive officers, the Compensation Committee determined, in pertinent part, that (i) the base salary for the chief executive officer should be determined at a subsequent meeting of the Board and (ii) annual bonuses and equity or equity-based compensation for the chief executive officer, chief financial officer, general counsel and senior vice president should be determined at a subsequent meeting of the Board.
53
Table of Contents
In addition, the Compensation Committee re-affirmed that the base salary for the senior vice president, who was being promoted to hold the position of President of GAR Disability Advocates, as well, should be increased from $200,000 to $280,000, an increase of approximately 40%. This increase was the second part of an increase in the base salary for the senior vice president decided earlier in fiscal year 2014 and planned to be effective as of the end of such fiscal year or soon thereafter.
With respect to director compensation, the Compensation Committee determined that it would recommend to the Board that annual retainers be kept at fiscal year 2013 (ending on September 30, 2013) levels and, consistent with the treatment of the executive officers, that any equity or equity-based awards be determined at a subsequent meeting of the Board.
Underlying the Compensation Committee’s determinations that the base salary of the chief executive officer, the annual bonuses of all of the executive officers and the equity or equity based awards of all of the executive officers and all of the directors should be determined at a subsequent meeting of the Board was its concern regarding the uncertain effects of two ongoing governmental reviews, by the SEC and the IRS, respectively, on the financial performance of the Company. In particular, the Compensation Committee took note of an inquiry by the Division of Corporate Finance of the SEC, described in detail in Item 1B of this Form 10-K, relating to the Company’s Annual Report on Form 10-K for the fiscal year ended September 30, 2013 and IRS audits with respect to the Company’s 2008 through 2013 federal income tax returns, described in detail in Item 1A of this Form 10-K.
The Board appears to have shared this concern, deciding not to meet to discuss the Compensation Committee’s determinations. As a result, the only change in compensation from fiscal year 2014 to fiscal year 2015 is the increase in the senior vice president’s base salary.
Elements of Executive Officer Compensation
Overview. Total compensation paid to our executive officers is divided among three principal components. Base salary is generally fixed and does not vary based on our financial and other performance. Other components, such as cash bonuses and stock options or other equity or equity-based awards, are variable and dependent upon our market performance. Historically, judgments about these elements have been made subjectively. In the case of stock options, the value is dependent upon our future stock price and, accordingly, such awards are intended to reward the named executive officers for favorable Company-wide performance.
Our Compensation Committee reviews total compensation to see if it falls in line with peer companies and may also look at overall market data. For the fiscal year ended September 30, 2014, the Compensation Committee determined that our compensation program was generally competitive with the members of our peer group. Our goal to promote pay for performance emphasizes the variable elements of overall compensation over fixed base salaries. In this regard, it is our policy to emphasize long-term equity awards over short-term cash bonuses, as the long-term awards are intended to align with goals such as total shareholder return. Each of the three elements of executive compensation has been determined by evaluating the recommendations set forth in the Adams Report, as well as our analysis of our financial performance, overall economic conditions and certain individual achievements, such as successful completion of assigned tasks.
Base Salary. We pay our executives a base salary, which we review and determine annually. We believe that a competitive base salary is a necessary element of any compensation program. Base salaries are established, in part, based on the executive’s individual position, responsibility, experience, skills, historic salary levels and the executive’s performance during the prior year. We are also seeking over a period of years to align base compensation levels comparable to our competitors and other companies similarly situated. We do not view base salaries as primarily serving our objective of paying for performance.
For fiscal year 2014, based on our financial performance, uncertain macroeconomic conditions, the recommendations contained in the report issued by Adams for fiscal year 2013 (the “Prior Year Adams Report”) and our evaluation thereof with respect to the relative performance of our named executive officers, we held the salary levels for the chief financial officer and the then senior vice president (Mary Curtin) constant, but increased the salary levels of the chief executive officer and the general counsel. We increased the chief executive officer’s
54
Table of Contents
salary by 3.9%, to $600,000 annually, and we increased the general counsel’s salary by 10%, to $275,000 annually. These increases took effect as of January 1, 2014.
For fiscal year 2015, based on our financial performance, uncertain macroeconomic conditions, the recommendations contained in the Adams Report and our evaluation thereof with respect to the relative performance of our named executive officers and the ongoing nature of the SEC and IRS reviews described above, we generally held the salary levels of the named executive officers constant. The sole exception was the senior vice president, whose salary was increased by 40%, to $280,000 annually. This increase was the second part of an increase in the base salary for the senior vice president decided earlier in fiscal year 2014 and planned to be effective as of the end of such fiscal year or soon thereafter. It actually took effect as of January 1, 2015. We believe that for fiscal year 2015, our salary levels are sufficient to retain our existing executive officers and hire new executive officers when and as required.
Cash Incentive Bonuses. Consistent with our emphasis on pay-for-performance incentive compensation programs, our executives are eligible to receive annual cash incentive bonuses primarily based upon their performance during the year.
For fiscal year 2013 service and performance, consistent with our emphasis on pay-for-performance incentive compensation programs, and based on our financial performance, uncertain macroeconomic conditions, the recommendations contained in the Prior Year Adams Report and our evaluation thereof with respect to the relative performance of our named executive officers, we awarded the chief executive officer a $100,000 cash bonus and the general counsel a $30,000 cash bonus. These bonuses were paid in fiscal year 2014.
For fiscal year 2014 service and performance, based on our financial performance, uncertain macroeconomic conditions, the recommendations contained in the Adams Report and our evaluation thereof with respect to the relative performance of our named executive officers and the ongoing nature of the SEC and IRS reviews described above, we did not award any cash bonuses.
We are contemplating the adoption of claw back policies with respect to performance-based bonuses and equity grants and any other incentive compensation with respect to which the Dodd-Frank Act requires such claw back policies. We anticipate adopting such claw back policies when applicable Securities and Exchange Commission rules under the Dodd-Frank Act are adopted.
Equity and Equity-Based Compensation. We believe that stock options and other forms of equity or equity-based compensation are an important long-term incentive for our executive officers and other employees and generally align officer interest with that of our stockholders. They are intended to further our emphasis on pay-for-performance.
For fiscal year 2013 service and performance we granted to our chief executive officer stock options to purchase under our 2012 Stock Option Performance and Award Plan (the “2012 Plan”) 50,000 shares of our common stock, having a grant date value of $325,905. In addition, we granted to each of our general counsel and senior vice president (Ricky Stern) stock options to purchase under our 2012 Plan 20,000 shares of our common stock, having a grant date value of $130,362. The awards to our chief executive officer, general counsel and senior vice president vested in three annual installments, the first being on December 12, 2014. For fiscal year 2014 service and performance, based on our financial performance, uncertain macroeconomic conditions, the recommendations contained in the Adams Report and our evaluation thereof with respect to the relative performance of our named executive officers and the ongoing nature of the SEC and IRS investigations described above, we did not award stock options or any other forms of equity or equity-based compensation.
We do not have any formal plan or obligation that requires us to grant equity or equity-based compensation to any executive officer on specified dates. In recent years, we have developed the practice of approving equity grants (and bonuses) at about the time our audit of the prior fiscal year is completed to reward executives for work in the completed year. However, we reserve the right to re-visit these matters during the year. The authority to make equity or equity-based grants to our executive officers rests with our full Board of Directors based upon recommendations made by the Compensation Committee. The Committee considers the input of our chief executive officer in setting the compensation of our other executive officers, including in the determination of appropriate levels of equity or equity-based grants.
55
Table of Contents
Severance and Change-in-Control Benefits. While we are currently not a party to any employment agreements, historically we have provided our executive officers with employment contracts. In January 2007, we entered into a three-year employment agreement with Gary Stern. Mr. Stern’s employment agreement expired on December 31, 2009. This agreement was not renewed and Mr. Stern is continuing in his current roles at the discretion of the Board of Directors until a new agreement is signed.
Share Retention
We did not have a share retention policy or guideline for executive officers until October 2009, when we adopted a guideline recommending that each officer retain $10,000 of equity in the Company (other than shares received through stock options and restricted stock grants).
Director Compensation
For fiscal year 2015, based on our financial performance, uncertain macroeconomic conditions, the recommendations contained in the report issued by Adams for such year and our evaluation thereof with respect to the relative performance of our named executive officers and the ongoing nature of the SEC and IRS investigations described above, we held retainers for directors, committee chair positions and committee member positions constant and did not award stock options or any other forms of equity or equity-based compensation.
Regulatory Considerations
We account for the equity compensation expense for our employees under the rules of FASB Accounting Standard Codification 718, “Compensation — Stock Compensation,” or ASC 718.
“Say-on-Pay” Advisory Vote
In determining compensation policies and decisions for fiscal year 2014 and, in the case of base salary, fiscal year 2015, the Compensation Committee did not take into account the most recent shareholder advisory vote with respect to executive compensation required under Dodd-Frank. Such vote, which occurred at the annual meeting of the Company’s shareholders on March 21, 2012, approved the executive compensation payable to the Company’s named executive officers as disclosed in the Company’s proxy statement filed with the SEC on February 17, 2012. The Compensation Committee was of the view that such a consideration was unnecessary, as the only change in compensation from fiscal year 2014 to fiscal year 2015 was an increase in Ricky Stern’s compensation to reflect his increased responsibilities. As required by its say on pay policy, however, the Company will be submitting its executive compensation determinations, as reflected in this Compensation Discussion & Analysis, to an advisory shareholder vote at its next annual meeting of shareholders.
THE COMPENSATION COMMITTEE REPORT
ON EXECUTIVE COMPENSATION
The Compensation Committee has reviewed and discussed the foregoing Compensation Discussion & Analysis with management. Based on this review and these discussions, the Compensation Committee recommended to the Board of Directors that the Compensation Discussion and Analysis be included in this report.
Submitted by the Compensation Committee:
David Slackman, Chairman
Harvey Leibowitz
Edward Celano
COMPENSATION COMMITTEE INTERLOCKS AND INSIDER PARTICIPATION
The Compensation Committee currently is composed of David Slackman, Harvey Leibowitz and Ed Celano, none of whom is an employee or a current or former officer of the Company. None of our executive officers serves as a member of the Compensation Committee, or any other committee serving an equivalent function, that has one or more executive officers who serve as members of our Board of Directors or our Compensation Committee.
56
Table of Contents
SUMMARY COMPENSATION TABLE
The following table contains information about compensation earned (bonus) or received (all other categories of compensation) by the named executive officers for the fiscal year ended September 30, 2014.
| Name and Principal Position |
Fiscal Year |
Salary ($) |
Bonus ($) |
Stock Awards ($) |
Option Awards ($)(1) |
All Other Compensation ($)(7) |
Total ($) |
|||||||||||||||||||||
| Gary Stern |
2014 | $ | 593,604 | $ | — | $ | — | $ | — | $ | 69,969 | $ | 663,573 | |||||||||||||||
| Chairman, President & CEO |
2013 | $ | 577,500 | $ | 100,000 | $ | — | $ | 325,905 | (2) | $ | 46,848 | $ | 1,050,253 | ||||||||||||||
| 2012 | $ | 577,500 | $ | 200,000 | $ | 979,212 | (3) | $ | — | $ | 58,967 | $ | 1,815,679 | |||||||||||||||
| Robert J. Michel |
2014 | $ | 275,000 | $ | — | $ | — | $ | — | $ | 30,354 | $ | 305,354 | |||||||||||||||
| Chief Financial Officer and Secretary |
2013 | $ | 275,000 | $ | — | $ | — | $ | — | $ | 30,604 | $ | 305,604 | |||||||||||||||
| 2012 | $ | 275,000 | $ | 30,000 | $ | — | $ | 212,715 | (4) | $ | 27,779 | $ | 545,494 | |||||||||||||||
| Ricky Stern |
2014 | $ | 176,923 | $ | — | $ | — | $ | — | $ | 4,919 | $ | 181,842 | |||||||||||||||
| Senior Vice President and President of GAR Disability Advocates(8) |
||||||||||||||||||||||||||||
| Seth Berman |
2014 | $ | 269,231 | $ | — | $ | — | $ | — | $ | 23,702 | $ | 292,933 | |||||||||||||||
| General Counsel & Chief |
2013 | $ | 250,000 | $ | 30,000 | $ | — | $ | 130,362 | (5) | $ | 22,769 | $ | 433,131 | ||||||||||||||
| Compliance Officer |
2012 | $ | 250,000 | $ | 30,000 | $ | — | $ | 170,172 | (6) | $ | 19,862 | $ | 470,034 | ||||||||||||||
| (1) | Represents the grant date fair value of the award, calculated in accordance with FASB Accounting Standard Codification 718, “Compensation — Stock Compensation,” or ASC 718. A summary of the assumptions made in the valuation of these awards is provided under Note A to our financial statements included in our Annual Report on Form 10-K for the year ended September 30, 2014, filed with herewith. |
| (2) | Includes an option to purchase 50,000 shares of common stock granted to Mr. Stern on December 12, 2013 but earned in the fiscal year ended September 30, 2013. The option has an exercise price of $8.49 per share and expires on December 2, 2023. The option vests fully in three equal annual installments on December 12, 2014, December 12, 2015 and December 12, 2016 |
| (3) | Includes a restricted stock award of 102,321 shares of common stock granted to Mr. Stern on December 18, 2012 but earned in the fiscal year ended September 30, 2012. The award had a grant day price of $9.57 per share and fully vests in three equal installments on December 18, 2013, December 18, 2014 and December 18, 2015. |
| (4) | Includes an option to purchase 25,000 shares of common stock granted to Mr. Michel on December 18, 2012 but earned in the fiscal year ended September 30, 2012. The option has an exercise price of $9.57 per share and expires on December 18, 2022. The option vests in three equal annual installments on December 18, 2013, December 18, 2014 and December 18, 2015. |
| (5) | Includes options to purchase 20,000 shares of Common Stock granted on December 11, 2013, but earned in the fiscal year ended September 30, 2013 with such grant effective on December 12, 2013, with an exercise price equal to the closing stock price on December 12, 2013. The awards had a grant day price of $8.49 per share and vest in three equal installments on December 12, 2014, December 12, 2015 and December 12, 2016. |
| (6) | Includes an option to purchase 20,000 shares of common stock granted to Mr. Berman and Ms. Curtin on December 18, 2012 but earned in the fiscal year ended September 30, 2012. The option has an exercise price of $9.57 per share and expires on December 18, 2022. The option vests in three equal annual installments on December 18, 2013, December 18, 2014 and December 18, 2015. |
| (7) | These amounts consist of: |
| • | matching Company contributions under our 401(k) plan; |
57
Table of Contents
| • | life insurance premiums; and |
| • | health insurance premiums paid by the Company in excess of non-executive contribution. |
The following table summarizes “All Other Compensation”:
| Name |
Year | 401(k) Company Match ($) |
Life Insurance Premium ($) |
Health Insurance Premiums ($) |
Total ($) | |||||||||||||||
| Gary Stern |
2014 | $ | 20,746 | $ | 37,156 | $ | 12,067 | $ | 69,969 | |||||||||||
| 2013 | $ | 12,293 | $ | 21,017 | $ | 13,538 | $ | 46,848 | ||||||||||||
| 2012 | $ | 10,000 | $ | 38,682 | $ | 10,285 | $ | 58,967 | ||||||||||||
| Robert J. Michel |
2014 | $ | 11,000 | $ | 7,287 | $ | 12,067 | $ | 30,354 | |||||||||||
| 2013 | $ | 9,576 | $ | 7,490 | $ | 13,538 | $ | 30,604 | ||||||||||||
| 2012 | $ | 9,800 | $ | 7,694 | $ | 10,285 | $ | 27,779 | ||||||||||||
| Ricky Stern |
2014 | $ | 1,684 | — | $ | 3,235 | $ | 4,919 | ||||||||||||
| Seth Berman |
2014 | $ | 11,635 | — | $ | 12,067 | $ | 23,702 | ||||||||||||
| 2013 | $ | 9,231 | — | $ | 13,538 | $ | 22,769 | |||||||||||||
| 2012 | $ | 9,577 | — | $ | 10,285 | $ | 19,862 | |||||||||||||
| (8) | Ricky Stern became Senior Vice President on March 24, 2014. Salary and benefits are for full fiscal year of 2014. |
GRANTS OF PLAN BASED AWARDS
The following table provides certain information with respect to stock options and restricted stock granted to our named executive officers during fiscal year 2014.
| Name |
Grant Date |
All Other Stock Awards: Number of Shares of Stocks or Units (#) |
All Other Option Awards: Number of Securities Underlying Options (#) |
Exercise or Base Price of Option Awards ($/Sh) |
Grant Date Fair Value of Stock and Option Awards ($) |
|||||||||||||||
| Gary Stern |
12/12/13 | — | 50,000 | (1) | $ | 8.49 | $ | 325,905 | ||||||||||||
| Ricky Stern |
12/12/13 | — | 20,000 | (1) | $ | 8.49 | $ | 130,362 | ||||||||||||
| Seth Berman |
12/12/13 | — | 20,000 | (1) | $ | 8.49 | $ | 130,362 | ||||||||||||
| (1) | This stock option award vest in three equal installments on December 12, 2014, December 12, 2015 and December 12, 2016. |
Narrative Disclosure to Summary Compensation Table and Grant of Plan Based Awards Table
Employment Agreements
In January 2007, we entered into an employment agreement (the “Employment Agreement”) with Gary Stern, our Chairman, President and Chief Executive Officer, which expired on December 31, 2009. This Employment Agreement was not renewed and Mr. Stern is continuing in his current roles at the discretion of the Board of Directors until a new agreement is signed. We are considering entering into a new employment agreement with Mr. Stern during fiscal year 2015.
We are not party to any employment agreements with any other named executive officers.
58
Table of Contents
Consulting Agreements
On December 12, 2011, we entered into a consulting agreement (the “Consulting Agreement”) with A.L. Piccolo & Co., Inc. (“A.L. Piccolo”), which is owned by Louis Piccolo, a director of the Company. The Consulting Agreement provides that A.L. Piccolo will provide consulting services to us, which includes analysis of proposed debt and equity transactions, due diligence and financial analysis and management consulting services (the “Services”). Under the Consulting Agreement, we will pay A.L. Piccolo an annual consulting fee of $150,000, payable in equal monthly installments, and a bonus of $25,000 for each new transaction that we close with A.L. Piccolo’s assistance, other than any transactions pending on the effective date of the Consulting Agreement. We may pay an additional bonus to A.L. Piccolo in the sole discretion of our Chief Executive Officer. In addition, during each year of the term of the Consulting Agreement, we will grant to A.L. Piccolo an option to purchase 30,000 shares of our Common Stock, which option will vest in three annual installments on the first, second, and third anniversaries of the grant date. The Consulting Agreement expired on December 12, 2013 . The parties are in current discussions on the future of the agreement. Additional information regarding the consulting relationship with A.L. Piccolo can be found in the section entitled “CERTAIN RELATIONSHIPS and RELATED PARTY TRANSACTIONS” below.
Incentive Compensation Plans
2012 Stock Option and Performance Award Plan
On February 7, 2012, the Board of Directors adopted the 2012 Plan. The 2012 Plan, which is administered by our Compensation Committee, was adopted by our stockholders on March 21, 2012. The purpose of the 2012 Plan is to provide for our success and enhance our value by linking participants’ personal interests with those of our stockholders and employees, by providing participants with an incentive for outstanding performance, and to motivate, attract and retain the services of participants upon whom our success depends. The 2012 Plan is flexible in that it provides for the grant of stock options (“Options”), stock appreciation rights (“SARs”), shares of restricted stock (“Restricted Stock”), restricted stock units (“RSUs”), performance shares and performance units (“Performance Shares” and “Performance Units”), and cash incentives (the “Cash Incentives”), singularly or in combination as determined by the Compensation Committee. The 2012 Plan authorizes the grant of awards relating to 2,000,000 shares of our Common Stock, with 1,566,279 available for awards as of September 30, 2014 and 1,551,279 available for awards as of December 31, 2014.
Equity Compensation Plan
On December 1, 2005, the Board of Directors adopted our Equity Compensation Plan (the “Equity Compensation Plan”), which was approved by our stockholders on March 1, 2006. The Equity Compensation Plan was adopted to supplement our existing 2002 Stock Option Plan. In addition to permitting the grant of stock options as are permitted under the 2002 Stock Option Plan, the Equity Compensation Plan provides us with flexibility with respect to equity awards by also providing for grants of stock awards (i.e. restricted or unrestricted), stock purchase rights and stock appreciation rights.
The general purpose of the Equity Compensation Plan is to provide an incentive to our employees, directors and consultants, including executive officers, employees and consultants of any subsidiaries, by enabling them to share in the future growth of our business. The Board of Directors believes that the granting of stock options and other equity awards promotes continuity of management and increases incentive and personal interest in our welfare by those who are primarily responsible for shaping and carrying out our long range plans and securing our growth and financial success.
On February 29, 2012, our board of directors adopted an amendment to the Equity Compensation Plan providing that, effective upon receiving stockholder approval of the 2012 Plan, no additional awards would be granted under the Equity Compensation Plan. On March 21, 2012, our stockholders approved the 2012 Plan.
59
Table of Contents
2002 Stock Option Plan
On March 5, 2002, our Board of Directors adopted the Asta Funding, Inc. 2002 Stock Option Plan (the “2002 Plan”), which was approved by our stockholders on May 1, 2002. The 2002 Plan was adopted in order to attract and retain qualified directors, officers and employees of, and consultants to, the Company.
The 2002 Plan authorizes the granting of incentive stock options (as defined in Section 422 of the Code) and non-qualified stock options to our eligible employees, including officers and directors of the Company (whether or not employees) and consultants of the Company.
On February 29, 2012, our board of directors adopted an amendment to the 2002 Plan providing that, effective upon receiving stockholder approval of the 2012 Plan, no additional awards would be granted under the Equity Compensation Plan. On March 21, 2012, our stockholders approved the 2012 Plan.
Options and Restricted Stock Awards
On December 11, 2013, we determined to grant the following options with such grants to be effective as of December 12, 2013 (at the December 12, 2013 closing stock price):
- Gary Stern was granted stock options to purchase of 50,000 shares of our common stock to reflect his fiscal year 2013 performance. The stock option grant vests in three annual installments beginning on the first anniversary of the award, on December 12, 2014. The options granted to Mr. Stern have an exercise price of $8.49 per share.
- Ricky Stern was granted stock options to purchase 20,000 shares of our common stock for his fiscal year 2013 performance. These options vest in three annual installments beginning on the first anniversary of the award, on December 12, 2014. The options granted to Ricky Stern have an exercise price of $8.49 per share.
- Seth Berman was granted stock options to purchase 20,000 shares of our common stock for his fiscal year 2013 performance. These options vest in three annual installments beginning on the first anniversary of the award, on December 12, 2014. The options granted to Mr. Berman have an exercise price of $8.49 per share.
Other stock awards and stock option grants are as follows:
On December 18, 2012 Mr. Stern was awarded 102,321 shares of restricted stock for his fiscal year 2012 performance. These restricted shares vest in equal installments on December 18, 2013, December 18, 2014 and December 18, 2015.
On December 18, 2012 Robert J. Michel was granted stock options to purchase 25,000 shares of our common stock for his fiscal year 2012 performance. These options vest in three annual installments on December 18, 2013, December 18, 2014 and December 18, 2015.
On December 18, 2012 Mr. Berman and Mary Curtin, our then senior vice president, were granted options to purchase 20,000 shares of our common stock for their 2012 performance. These options vest in three annual installments on December 18, 2013, December 18, 2014 and December 18, 2015.
On December 13, 2011, we granted to Mr. Stern (i) an option to purchase 150,000 shares of our common stock at an exercise price of $7.77 per share. The option has a term of 10 years and vests in three equal annual installments on December 13, 2014. In June 2013, 50,000 of these options were canceled.
On December 13, 2011, we granted to each of Messrs. Michel and Berman and Ms. Curtin options to purchase 30,000 shares of our common stock at an exercise price of $7.77 per share. The options have a term of 10 years and vests on December 13, 2014.
The foregoing awards issued to Messrs. Stern, and Berman in 2013 were issued under the 2012 Plan while earlier options were granted to Messrs. Stern and Berman were issued under our 2006 Equity Compensation Plan, and the awards issued to Mr. Michel and Ms. Curtin were issued under our 2002 Stock Option Plan. Each plan provides for certain benefits upon a change in control of the Company. For instance, under the 2012 Plan, upon the occurrence of a “corporate transaction event”, defined as the merger of the Company with or into
60
Table of Contents
another corporation, the sale of substantially all of our assets, the liquidation of the Company, or the acquisition by any person of our securities the result of which such person becomes the beneficial owner, directly or indirectly, of our securities representing greater than 50% of the combined voting power of our then outstanding securities, the Board may take any number of actions. For instance, under the 2012 Plan, upon the occurrence of a merger, consolidation, sale of substantially all of the assets of the Company or the acquisition of more than 50% of the Company’s voting securities, if the applicable transactions do not provide otherwise, option awards become exercisable and restricted stock awards fully vest immediately prior thereto.
Similarly, under the 2006 Equity Incentive Plan, upon the occurrence of a “corporate transaction event”, defined as the merger of the Company with or into another corporation, the sale of substantially all of our assets, the liquidation of the Company, or the acquisition by any person of our securities the result of which such person becomes the beneficial owner, directly or indirectly, of our securities representing greater than 50% of the combined voting power of our then outstanding securities, the Board may take any number of actions. These actions include providing for all options outstanding under the Plan to be assumed by the acquiring corporation or to become immediately vested and exercisable in full. The Board may also cancel any outstanding options, stock purchase rights and stock appreciation rights in effect prior to such corporate transaction event.
OUTSTANDING EQUITY AWARDS AT FISCAL YEAR-END
The following table provides information on exercisable and unexercisable options and unvested stock awards held by the named executive officers on September 30, 2014.
| Option Awards | Stock Awards | |||||||||||||||||||||||
| Name |
Number of Securities Underlying Unexercised Options (#) Exercisable |
Number of Securities Underlying Unexercised Options (#) Unexercisable |
Option Exercise Price ($) |
Option Expiration Date |
Number of Shares or Units of Stock That Have Not Vested (#) |
Market Value of Shares or Units of Stock That Have Not Vested ($)(1) |
||||||||||||||||||
| Gary Stern(2) |
150,000 | — | $ | 18.22 | 10/28/14 | 68,214 | (11) | $ | 560,037 | |||||||||||||||
| 60,000 | — | $ | 7.63 | 12/15/20 | — | — | ||||||||||||||||||
| 100,000 | (2) | $ | 7.77 | 12/13/21 | — | — | ||||||||||||||||||
| 50,000 | (3) | $ | 8.49 | 12/12/23 | — | — | ||||||||||||||||||
| Robert J. Michel |
30,000 | — | $ | 7.63 | 12/15/20 | — | — | |||||||||||||||||
| 30,000 | (4) | $ | 7.77 | 12/13/21 | — | — | ||||||||||||||||||
| 8,333 | 16,667 | (5) | $ | 9.57 | 12/18/22 | — | — | |||||||||||||||||
| Ricky Stern |
10,000 | — | $ | 8.36 | 12/22/21 | — | — | |||||||||||||||||
| 6,666 | 13,334 | (6) | $ | 9.57 | 12/18/22 | — | — | |||||||||||||||||
| — | 20,000 | (7) | $ | 8.49 | 12/12/23 | — | — | |||||||||||||||||
| Seth Berman |
5,500 | — | $ | 2.95 | 5/5/19 | — | — | |||||||||||||||||
| 100 | — | $ | 8.07 | 12/11/19 | — | — | ||||||||||||||||||
| 30,000 | — | $ | 7.63 | 12/15/20 | — | — | ||||||||||||||||||
| — | 30,000 | (8) | $ | 7.77 | 12/13/21 | — | — | |||||||||||||||||
| 6,666 | 13,334 | (9) | $ | 9.57 | 12/18/22 | — | — | |||||||||||||||||
| — | 20,000 | (10) | $ | 8.49 | 12/12/23 | — | — | |||||||||||||||||
| (1) | Based On $8.21 per share, the closing price of the common stock as reported by NASDAQ on September 30, 2014. |
| (2) | Represents the unvested portion of an option to purchase 100,000 shares of common stock granted on December 13, 2011, which fully vested on December 14, 2014. |
61
Table of Contents
| (3) | Represents the unvested portion of an option to purchase 50,000 shares of common stock granted on December 12, 2013, which vests in three equal installments on December 12, 2014, December 12, 2015 and December 12, 2016. |
| (4) | Represents the unvested portion of an option to purchase 30,000 shares of common stock granted on December 13, 2011, which fully vested on December 13, 2014. |
| (5) | Represents the unvested portion of an option to purchase 25,000 shares of common stock granted on December 18, 2012 which vest in three equal installments on December 18, 2013, December 18, 2014 and December 18, 2015. |
| (6) | Represents the unvested portion of an option to purchase 20,000 shares of common stock granted on December 18, 2012 which vest in three equal installments on December 18, 2013, December 18, 2014 and December 18, 2015. |
| (7) | Represents the unvested portion of an option to purchase 20,000 shares of common stock granted on December 12, 2013, which vest in three equal installments on December 12, 2014, December 12, 2015 and December 12, 2016. |
| (8) | Represents the unvested portion of an option to purchase 30,000 shares of common stock granted on December 13, 2011 which fully vested on December 13, 2014. |
| (9) | Represents the unvested portion of an option to purchase 20,000 shares of common stock granted on December 18, 2012 which vest in three equal installments on December 18, 2013, December 18, 2014 and December 18, 2015. |
| (10) | Represents the unvested portion of an option to purchase 20,000 shares of common stock granted on December 12, 2013 which vest in three equal installments on December 12, 2014, December 12, 2015 and December 12 2016. |
| (11) | Represents two thirds of Gary Stern’s 102,321 shares of restricted stock granted on December 18, 2012. |
STOCK OPTION EXERCISES AND VESTING OF RESTRICTED STOCK AWARDS
The following table provides information on stock option exercises and vesting of restricted stock awards of named executive officers during the fiscal year ended September 30, 2014.
OPTION EXERCISES AND STOCK VESTED
| Stock Options | Stock Awards | |||||||||||||||
| Name |
Number of Shares Acquired on Exercise (#) |
Value Realized on Exercise ($)(1) |
Number of Shares Acquired on Vesting (#) |
Value Realized on Vesting ($) |
||||||||||||
| Robert J. Michel |
10,000 | $ | 84,200 | — | $ | — | ||||||||||
| (1) | Represents the number of shares vested multiplied by the market value of the shares on the exercise date. |
DIRECTOR COMPENSATION
Mr. Gary Stern received no compensation for serving as a director, except that he, like all directors, is eligible to be reimbursed for any expenses incurred in attending Board and committee meetings. For fiscal year 2014, the total annual fees that a director, other than Mr. Gary Stern, could have received for serving on our Board of Directors and committees of the Board of Directors were set as follows:
| • | An annual fee of $150,000 per year for Chairman Emeritus; |
| • | An annual fee of $45,000 per year for each Independent Director; |
| • | An annual fee of $10,000 for Audit Committee Members; |
| • | An annual fee of $35,000 for the Chairman of the Audit Committee; |
| • | An annual fee of $15,000 for Chairman of the Compensation Committee; |
| • | An annual fee of $7,500 for Compensation Committee Members; |
62
Table of Contents
| • | An annual fee of $15,000 for Chairman of the Governance Committee; and |
| • | An annual fee of $7,500 for Governance Committee Members. |
The following table summarizes compensation paid to outside directors in fiscal 2014:
| Name |
Fees Earned or Paid in Cash ($) |
Option Awards ($)(1) |
Total ($) | |||||||||
| Herman Badillo |
$ | 64,375 | (2) | $ | — | $ | 64,375 | |||||
| Edward Celano |
$ | 75,625 | (3) | $ | — | $ | 75,625 | |||||
| Harvey Leibowitz |
$ | 95,000 | (4) | $ | — | $ | 95,000 | |||||
| David Slackman |
$ | 60,000 | (5) | $ | — | $ | 60,000 | |||||
| Louis Piccolo |
$ | 45,000 | (6) | $ | — | $ | 45,000 | |||||
| Arthur Stern |
$ | 162,500 | (7) | $ | — | $ | 162,500 | |||||
| (1) | No stock option awards were granted in fiscal year 2014. |
| (2) | Includes, in addition to $45,000 independent director retainer, $3,750 for being chairman of the Governance Committee (Mr. Badillo was chair of the Governance Committee for the first quarter of fiscal year 2014), $5,625 for being a member of the Governance Committee (Mr. Badillo was a member of the Governance Committee for quarters two through four of fiscal year 2014), and $10,000 for being a member of the Audit Committee. Mr. Badillo passed away on December 3, 2014. |
| (3) | Includes, in addition to $45,000 independent director retainer, $10,000 for being a member of the Audit Committee, $7,500 for being a member of the Compensation Committee, $1,875 for being a member of the Governance Committee, and $11,250 for being Chairman of the Governance Committee. (Mr. Celano became Chairman of the Governance Committee on January 1, 2014.) |
| (4) | Includes, in addition to $45,000 independent director retainer, $35,000 for being chairman of the Audit Committee, $7,500 for being a member of the Compensation Committee, $7,500 for being a member of the Governance Committee. |
| (5) | Includes, in addition to $45,000 independent director retainer, $15,000 for being chairman of the Compensation Committee. |
| (6) | Mr. Piccolo is not an independent director. |
| (7) | Mr. Arthur Stern became Chairman Emeritus in January 2009. |
63
Table of Contents
| Item 12. | Security Ownership of Certain Beneficial Owners and Management and Related Stockholder Matters. |
SECURITY OWNERSHIP OF MANAGEMENT AND CERTAIN BENEFICIAL OWNERS
The following table sets forth information as of June 15, 2015 with respect to beneficial ownership of our Common Stock by (i) each director and executive officer acting in the capacity as such June 15, 2015, including any person holding the position of CEO or CFO at any time during the fiscal year of 2014, (ii) each person known by us to own beneficially more than five percent of our outstanding Common Stock, and (iii) all directors and executive officers as a group. This table has been prepared based on 13,060,839 shares of Common Stock outstanding on June 15, 2015. Unless otherwise indicated, the address of each such person is c/o Asta Funding, Inc., 210 Sylvan Avenue, Englewood Cliffs, New Jersey 07632. All persons listed have sole voting and investment power with respect to their shares unless otherwise indicated.
| Name and Address of Beneficial Owner |
Amount and Nature of Beneficial Ownership |
Percentage(1) | ||||||
| Arthur Stern |
366,683 | (2) | 2.8 | % | ||||
| Gary Stern |
1,425,083 | (3) | 10.8 | % | ||||
| Ricky Stern |
329,362 | (4) | 2.5 | % | ||||
| Robert J. Michel |
79,747 | (5) | * | |||||
| Seth Berman |
85,599 | (6) | * | |||||
| Edward Celano |
83,000 | (7) | * | |||||
| 2115 Scotch Gamble Road Scotch Plains, NJ |
||||||||
| Harvey Leibowitz |
77,000 | (8) | * | |||||
| 211 West 56th Street, Suite 20C New York, NY 10019 |
||||||||
| David Slackman |
82,500 | (9) | * | |||||
| 100 Mozart Court Eastport, NY 11941 |
||||||||
| Louis A. Piccolo |
127,000 | (10) | * | |||||
| 350 West 50th Street New York, NY 10019 |
||||||||
| Asta Group, Incorporated |
842,000 | (11) | 6.4 | % | ||||
| Judith R. Feder |
1,565,000 | (12) | 12.0 | % | ||||
| 928 East 10th Street Brooklyn, NY 11230 |
||||||||
| Stern Family Investors LLC |
692,000 | (13) | 5.3 | % | ||||
| 928 East 10th Street Brooklyn, NY 11230 |
||||||||
| GMS Family Investors LLC |
862,000 | (14) | 6.6 | % | ||||
| 928 East 10th Street Brooklyn, NY 11230 |
||||||||
| Mangrove Partners |
967,770 | (15) | 7.4 | % | ||||
| 645 Madison Avenue, 14th Floor, New York, NY 10022 |
||||||||
| Tutuila Asset Management |
800,000 | (16) | 6.1 | % | ||||
| 130 Adelaide St. West, Toronto, Canada |
||||||||
| Dimentional Fund Advisors, LP |
751,143 | (17) | 5.8 | % | ||||
| Building One, 6300 Bee Cave Road, Austin, TX 78746 |
||||||||
| Jordan Capital AM, LLC |
1,238,439 | (18) | 9.5 | % | ||||
| 6001 River Road, Suite 100, Columbus, GA 31904 |
||||||||
| All executive officers and directors as a group (10 persons) |
2,655,972 | (19) | 19.3 | % | ||||
| * | Less than 1% |
64
Table of Contents
| (1) | Any shares of common stock that any person named above has the right to acquire within 60 days of June 15, 2015, are deemed to be outstanding for purposes of calculating the ownership percentage of such person, but are not deemed to be outstanding for purposes of calculating the beneficial ownership percentage of any other person not named in the table above. |
| (2) | Includes 35,000 shares of common stock issuable upon exercise of options, and 214,599 shares of common stock owned by Asta Group, Incorporated, which shares are attributable to Arthur Stern based on his percentage ownership of Asta Group. Excludes 349,460 shares owned by Stern Family Investors LLC which shares are attributable to Arthur Stern based on his percentage ownership of such LLC and 948 shares owned by GMS Family Investors LLC which shares are attributable to Arthur Stern based on his percentage ownership of such LLC. Arthur Stern does not have voting or investment power with respect to any of the shares held by either LLC and disclaims beneficial ownership of the shares owned by the LLCs. Excludes 2,500 shares of common stock issuable upon exercise of options that are not exercisable within 60 days of June 15, 2015. 70,000 stock options expired on November 3, 2013. |
| (3) | Includes 210,000 shares of common stock issuable upon exercise of options, and 285,607 shares of common stock owned by Asta Group, which shares are attributable to Gary Stern based on his percentage ownership of Asta Group. Excludes 684,945 shares owned by GMS Family Investors LLC which shares are attributable to Gary Stern based on his percentage ownership of such LLC. Gary Stern does not have voting or investment power with respect to any of the shares held by the LLC and disclaims beneficial ownership of the shares owned by the LLC. Excludes 33,334 shares of common stock issuable upon exercise of options that are not exercisable within 60 days of June 15, 2015 Also excludes 393,312 shares of common stock held by Mr. Stern’s children who are no longer minors and for which he disclaims beneficial ownership. 70,000 stock options expired November 3, 2013. |
| (4) | Includes 29,999 shares of common stock issuable upon exercise of options. Excludes 46,667 shares of common stock issuable upon exercise of options that are not exercisable within 60 days of June 15, 2015. Includes 30,220 shares of common stock owned by Asta Group, which shares are attributable to Ricky Stern based on his percentage ownership of Asta Group. |
| (5) | Includes 76,666 shares of common stock issuable upon exercise of options. Excludes 8,334 shares of common stock issuable upon exercise of options that are not exercisable within 60 days of June 15, 2015. |
| (6) | Includes 85,599 shares of common stock issuable upon exercise of options. Excludes 19,999 shares of common stock issuable upon exercise of options that are not exercisable within 60 days of June 15, 2015. |
| (7) | Includes 68,000 shares of common stock issuable upon exercise of options. Excludes 2,500 shares of common stock issuable upon exercise of options that are not exercisable within 60 days of June 15, 2015. 25,000 stock options expired October 28, 2014. |
| (8) | Includes 68,000 shares of common stock issuable upon exercise of options. Excludes 2,500 shares of common stock issuable upon exercise of options that are not exercisable within 60 days of June 15, 2015. 25,000 stock options expired October 28, 2014 |
| (9) | Includes 68,000 shares of common stock issuable upon exercise of options. Excludes 2,500 shares of common stock issuable upon exercise of options that are not exercisable within 60 days of June 15, 2015. 25,000 stock options expired October 28, 2014. |
| (10) | Includes 118,000 shares of common stock issuable upon exercise of options. Excludes 12,500 shares of common stock issuable upon exercise of options that are not exercisable within 60 days of June 15, 2015. 30,833 stock option expired by October 28, 2014. |
| (11) | Asta Group, Incorporated (“Asta Group”) is owned by Arthur Stern, our Chairman Emeritus and Director, Gary Stern, our Chairman, President and Chief Executive Officer, and other members of the Stern family. |
| (12) | Includes 11,000 shares of common stock owned directly, 692,000 shares owned by Stern Family Investors LLC and 862,000 shares owned by GMS Family Investors LLC. Ms. Feder is the manager of each LLC and as such has sole voting and investment power of such shares. |
| (13) | A limited liability company of which Judith R. Feder has sole voting and investment power. Barbara Marburger has a 24.75% beneficial interest in the LLC, the Ricky Stern 2012 GST Trust has a 12.375% |
65
Table of Contents
| beneficial interest in the LLC, the Emily Stern 2012 GST Trust has a 12.375% beneficial interest in the LLC, and a trust for the benefit of the descendants of Arthur Stern, of which Judith R. Feder is trustee, has a 49.5% beneficial interest in the LLC. Barbara Marburger is the sister of Gary Stern. Ricky Stern and Emily Stern are the children of Gary Stern. |
| (14) | A limited liability company of which Judith R. Feder has sole voting and investment power. Gary Stern has a 79.46% beneficial interest in the LLC, trusts for the benefit of the children of Gary Stern of which Judith R. Feder is the trustee have a combined 20.43% beneficial interest (10.215% each), and Arthur Stern has a .11% beneficial interest in the LLC. |
| (15) | Based on information set forth on Schedule 13G filed with the SEC on December 31, 2014, jointly by The Mangrove Partners Master Fund, Ltd.; The Mangrove Partners Fund, L.P.; The Mangrove Partners Master Fund (Cayman), Ltd.; Mangrove Partners and Mangrove Capital. Nathaniel August has the power to vote and dispose of these shares. |
| (16) | Based on information set forth on Schedule 13G filed with the SEC on October 30, 2014, by Tutuila Asset Management Inc. Mark Gardiner has the power to vote and dispose of these shares. |
| (17) | Based on information set forth on Schedule 13G filed with the SEC on December 31, 2014, by Dimentional Fund Advisors LP. Dimentional Fund Advisors, LP has the power to vote and dispose of these shares. |
| (18) | Based on information set forth on Schedule 13G filed with the SEC on May 19, 2015, jointly by Jordan Capital Partners, LP and Jodan Capital AM, LLC. Jordan Capital Partners, LP claims 587,465 shares. Jordan Capital Partners, LP has the power to vote and dispose of these shares. Jordan Capital AM, LLC claims 650,974 shares. Jordan Capital AM, LLC has the power to vote and dispose of these shares. |
| (19) | Includes 725,930 shares of Common Stock issuable upon exercise of options that are exercisable within 60 days of June 15, 2015. Excludes 104,168 shares of Common Stock issuable upon exercise of options that are not exercisable within 60 days of June 15, 2015. Excludes the shares owned in the aggregate by Stern Family Investors LLC and GMS Family Investors LLC. |
| Item 13. | Certain Relationships and Related Transactions, and Director Independence. |
On December 12, 2011, the Company and Piccolo Business Advisory (“Piccolo”), which is owned by Louis Piccolo, a director of the Company, entered into a Consulting Agreement, pursuant to which Piccolo provided consulting services which included, but was not limited to, analysis of proposed debt and equity transactions, due diligence and financial analysis and management consulting services (“Services”). The Consulting Agreement was for a period of two years, which ended on December 31, 2013 and Piccolo received compensation of $150,000 per annum payable monthly, a bonus of $25,000 per new transaction closed by the Company with Piccolo’s assistance (if any), and 30,000 options per year, with such options vesting in three equal annual installments on the first, second and third anniversaries of the first grant date. The Company paid Piccolo $25,000, $150,000, and $125,000 in the fiscal years ended September 30, 2014, 2013 and 2012, respectively. This agreement was not renewed, however, there are ongoing discussions for a new agreement.
| Item 14. | Principal Accounting Fees and Services. |
During fiscal year 2014 and 2013 WeiserMazars LLP provided the following services:
| 2014 | 2013 | |||||||
| Audit Fees: |
$ | 527,512 | $ | 358,677 | ||||
| Audit Related Fees: |
$ | — | $ | |||||
| Tax Fees: |
$ | — | $ | — | ||||
| All Other Fees: |
$ | — | $ | — | ||||
|
|
|
|
|
|||||
| Total Fees: |
$ | 527,512 | $ | 358,677 | ||||
|
|
|
|
|
|||||
66
Table of Contents
Part IV
| Item 15. | Exhibits, Financial Statement Schedules. |
(a) The following documents are filed as part of this report
| Exhibit |
||
| 3.1 | Certificate of Incorporation(1) | |
| 3.2 | Amendment to Certificate of Incorporation(2) | |
| 3.3 | Certificate of Designation of Series A Preferred Stock(3) | |
| 3.4 | Bylaws(4) | |
| 3.5 | Amendments to Article IX of the By-Laws of Asta Funding, Inc.(5) | |
| 4.1 | Rights Agreement, dated as of August 23, 2012, between Asta Funding, Inc. and American Stock Transfer & Trust Co., LLC(6) | |
| 10.1 | Asta Funding, Inc 1995 Stock Option Plan as Amended(1) | |
| 10.2 | Asta Funding, Inc. 2002 Stock Option Plan(2) | |
| 10.3 | Asta Funding, Inc. Equity Compensation Plan(7) | |
| 10.4 | Asta Funding, Inc. 2012 Stock Option and Performance Award Plan(8) | |
| 10.5 | Form of Intercreditor Agreement between Asta Funding and IDB as lending agent(9) | |
| 10.6 | Amended and Restated Management Agreement, dated as of January 16, 2009, between Palisades Collection, L.L.C., and [*](10) | |
| 10.7 | Amended and Restated Master Servicing Agreement, dated as of January 16, 2009, between Palisades Collection, L.L.C., and [*](11) | |
| 10.8 | First Amendment to Amended and Restated Master Servicing Agreement, dated as of September 16, 2007, by and among Palisades Collection, L.L.C., and [*], and [*](12) | |
| 10.9 | Indemnification agreement between Asta Funding and GMS Family Investors LLC. (13) | |
| 10.10 | Settlement Agreement and Omnibus Amendment among Asta Funding, Inc., Palisades Acquisition XVI and BMO Capital Markets dated August 7, 2013. (20) | |
| 10.11 | Lease agreement between the Company and ESL200 LLC dated August 2, 2010 (14) | |
| 10.12 | Revolving Credit Agreement, dated December 28, 2011, by and between Pegasus Funding, LLC and Fund Pegasus, LLC(15) | |
| 10.13 | Security Agreement, dated December 28, 2011, by and between Pegasus Funding, LLC and Fund Pegasus, LLC(16) | |
| 10.14 | Secured Revolving Credit Note, dated December 28, 2011, by Pegasus Funding, LLC in favor of Fund Pegasus, LLC(17) | |
| 10.15 | Operating Agreement of Pegasus Funding, LLC, dated December 28, 2011(18) | |
| 10.16 | Consulting Agreement, dated December 12, 2011, by and between the Company and A.L. Piccolo & Co., Inc.(39) | |
| 10.17 | Membership Interest Purchase Agreement by and among CBC Settlement, LLC, CBC Management Services Group, LLC, Asta Funding, Inc. and Other Parties Hereto (22) (24) | |
| 10.18 | Amended and Restated Operating Agreement of CBC Settlement Funding, LLC (23) (24) | |
| 21.1 | Subsidiaries of the Registrant* | |
| 23.1 | Consent of Independent Registered Public Accounting Firm* | |
| 31.1 | Certification of Registrant’s Chief Executive Officer, Gary Stern, pursuant to Section 302 of the Sarbanes-Oxley Act of 2002.* | |
| 31.2 | Certification of Registrant’s Chief Financial Officer, Robert J. Michel, pursuant to Section 302 of the Sarbanes-Oxley Act of 2002.* | |
| 32.1 | Certification of the Registrant’s Chief Executive Officer, Gary Stern, pursuant to Section 906 of the Sarbanes-Oxley Act of 2002.* | |
| 32.2 | Certification of the Registrant’s Chief Financial Officer, Robert J. Michel, pursuant to Section 906 of the Sarbanes-Oxley Act of 2002.* |
| * | Filed herewith |
67
Table of Contents
| (1) | Incorporated by reference to an Exhibit to Asta Funding’s Registration Statement on Form SB-2 (File No. 33-97212). |
| (2) | Incorporated by reference to an Exhibit to Asta Funding’s Quarterly Report on Form 10-QSB for the three months ended March 31, 2002 . |
| (3) | Incorporated by reference to Exhibit 3.1 to Asta Funding’s Current Report on Form 8-K filed August 24, 2012. |
| (4) | Incorporated by reference to Exhibit 3.1 to Asta Funding’s Annual Report on Form 10-KSB for the year ended September 30, 1998. |
| (5) | Incorporated by reference to Exhibit 3.2 to Asta Funding’s Current Report on Form 8-K filed August 24, 2012. |
| (6) | Incorporated by reference to Exhibit 4.1 to Asta Funding’s Current Report on Form 8-K filed August 24, 2012. |
| (7) | Incorporated by reference to Exhibit 10.1 to Asta Funding’s Current Report on Form 8-K filed March 3, 2006. |
| (8) | Incorporated by reference to Appendix A to Asta Funding’s Definitive Proxy Statement filed on February 17, 2012 for the March 21, 2012 Annual Meeting of Stockholders |
| (9) | Incorporated by reference to Exhibit 10.26 to Asta Funding’s Annual Report on Form 10-K for the year ended September 30, 2008 |
| (10) | Incorporated by reference to Exhibit 10.27 to Asta Funding’s Annual Report on Form 10-K for the year ended September 30, 2008. |
| (11) | Incorporated by reference to Exhibit 10.28 to Asta Funding’s Annual Report on Form 10-K for the year ended September 30, 2008. |
| (12) | Incorporated by reference to Exhibit 10.29 to Asta Funding’s Annual Report on Form 10-K for the year ended September 30, 2008. |
| (13) | Incorporated by reference to Exhibit 10.32 to Asta Funding’s Annual Report on Form 10-K for the year ended September 30, 2009. |
| (14) | Incorporated by reference to Exhibit 10.2 to Asta Funding’s Current Report on Form 8-K filed August 5, 2010. |
| (15) | Incorporated by reference to Exhibit 10.1 to Asta Funding’s Current Report on Form 8-K filed January 4, 2012. |
| (16) | Incorporated by reference to Exhibit 10.2 to Asta Funding’s Current Report on Form 8-K filed January 4, 2012. |
| (17) | Incorporated by reference to Exhibit 10.3 to Asta Funding’s Current Report on Form 8-K filed January 4, 2012. |
| (18) | Incorporated by reference to Exhibit 10.4 to Asta Funding’s Current Report on Form 8-K filed January 4, 2012. |
| (19) | Incorporated by reference to Exhibit 10.1 to Asta Funding’s Current Report on Form 8-K filed January 6, 2012. |
| (20) | Incorporated by reference to Exhibit 10.1 to Asta Funding’s Quarterly Report on Form 10-Q for the quarter ended December 31, 2011. |
| (21) | Incorporated by reference to Exhibit 10.1 to Asta Funding’s Current Report on Form 8-K filed August 9, 2012. |
| (22) | Incorporated by reference to Exhibit 10.1 to Asta Funding’s Current Report on Form 8-K filed January 7, 2014. |
| (23) | Incorporated by reference to Exhibit 10.2 to Asta Funding’s Current Report on Form 8-K filed January 7, 2014. |
| (24) | The schedules to Exhibits 10.17 and 10.18 have not been filed with this registration statement as they contain due diligence information which the Registrant does not believe is material to an investment decision. |
68
Table of Contents
ASTA FUNDING, INC. AND SUBSIDIARIES
| Page | ||||
| F-2 | ||||
| Consolidated Balance sheets as of September 30, 2014 and 2013 (revised) |
F-4 | |||
| F-5 | ||||
| F-6 | ||||
| F-7 | ||||
| F-8 | ||||
| F-9 | ||||
F-1
Table of Contents
REPORT OF INDEPENDENT REGISTERED PUBLIC ACCOUNTING FIRM
To the Board of Directors and Stockholders of
Asta Funding, Inc.
We have audited the accompanying consolidated balance sheets of Asta Funding, Inc. and subsidiaries (the “Company”) as of September 30, 2014 and 2013, and the related consolidated statements of income, comprehensive income, stockholders’ equity, and cash flows for the years ended September 30, 2014 and 2013. These consolidated financial statements are the responsibility of the Company’s management. Our responsibility is to express an opinion on these consolidated financial statements based on our audits.
We conducted our audits in accordance with the standards of the Public Company Accounting Oversight Board (United States). Those standards require that we plan and perform the audit to obtain reasonable assurance about whether the financial statements are free of material misstatement. An audit includes examining, on a test basis, evidence supporting the amounts and disclosures in the consolidated financial statements. An audit also includes assessing the accounting principles used and significant estimates made by management, as well as evaluating the overall consolidated financial statement presentation. We believe that our audits provide a reasonable basis for our opinion.
In our opinion, the consolidated financial statements referred to above present fairly, in all material respects, the consolidated financial position of the Company as of September 30, 2014 and 2013, and the consolidated results of their operations and their cash flows for the years ended September 30, 2014 and 2013 in conformity with U.S. generally accepted accounting principles.
As described in Note A2 — Revision of Prior Period Financial Statements, the Company has revised its consolidated financial statements for 2013.
We also have audited, in accordance with the standards of the Public Company Accounting Oversight Board (United States), the Company’s internal control over financial reporting as of September 30, 2014, based on criteria established in Internal Control — Integrated Framework issued by the Committee of Sponsoring Organizations of the Treadway Commission (COSO) in 1992 and our report dated June 29, 2015 expressed an adverse opinion on the effectiveness of the Company’s internal control over financial reporting.
| /s/ WeiserMazars LLP |
| New York, New York |
| June 29, 2015 |
F-2
Table of Contents
REPORT OF INDEPENDENT REGISTERED PUBLIC ACCOUNTING FIRM
Board of Directors and Shareholders
Asta Funding, Inc.
We have audited the accompanying consolidated statements of operations, stockholders’ equity, comprehensive income, land cash flows of Asta Funding, Inc. and subsidiaries (the “Company”) for the year ended September 30, 2012. These financial statements are the responsibility of the Company’s management. Our responsibility is to express an opinion on these financial statements based on our audit.
We conducted our audit in accordance with the standards of the Public Company Accounting Oversight Board (United States). Those standards require that we plan and perform the audit to obtain reasonable assurance about whether the financial statements are free of material misstatement. An audit also includes examining, on a test basis, evidence supporting the amounts and disclosures in the financial statements, assessing the accounting principles used and significant estimates made by management, as well as evaluating the overall financial statement presentation. We believe that our audits provide a reasonable basis for our opinion.
In our opinion, the consolidated financial statements referred to above present fairly, in all material respects, the results of operations and cash flows of Asta Funding, Inc. and subsidiaries for the year ended September 30, 2012 in conformity with accounting principles generally accepted in the United States of America.
/s/ GRANT THORNTON LLP
New York, New York
January 18, 2013 (except as to Note A [2], Revision of Prior Period Financial Statements, with respect to the impact on the year ended September 30, 2012, which is as of June 29, 2015)
F-3
Table of Contents
ASTA FUNDING, INC. AND SUBSIDIARIES
| September 30, | ||||||||
| 2014 | 2013 (As Revised)(1) |
|||||||
| ASSETS |
||||||||
| Cash and cash equivalents |
$ | 28,710,000 | $ | 35,179,000 | ||||
| Available-for-sale investments |
66,799,000 | 58,035,000 | ||||||
| Restricted cash |
— | 968,000 | ||||||
| Consumer receivables acquired for liquidation (at net realizable value) |
29,444,000 | 64,254,000 | ||||||
| Structured settlements |
42,079,000 | — | ||||||
| Investment in personal injury claims, net |
32,352,000 | 35,758,000 | ||||||
| Due from third party collection agencies and attorneys |
1,026,000 | 1,169,000 | ||||||
| Prepaid and income taxes receivable |
430,000 | 1,496,000 | ||||||
| Furniture and equipment (net of accumulated depreciation of $4,499,000 at September 30, 2014 and $4,136,000 at September 30, 2013) |
756,000 | 1,106,000 | ||||||
| Deferred income taxes |
6,786,000 | 7,772,000 | ||||||
| Goodwill |
2,770,000 | 1,410,000 | ||||||
| Other assets |
5,986,000 | 4,383,000 | ||||||
|
|
|
|
|
|||||
| Total assets |
$ | 217,138,000 | $ | 211,530,000 | ||||
|
|
|
|
|
|||||
| LIABILITIES AND STOCKHOLDERS’ EQUITY |
||||||||
| Non-recourse debt — Bank of Montreal |
$ | — | $ | 35,760,000 | ||||
| Other debt — CBC (includes non-recourse notes payable amounting to $12.7 million at September 30, 2014) |
32,295,000 | — | ||||||
| Other liabilities |
3,587,000 | 2,486,000 | ||||||
|
|
|
|
|
|||||
| Total liabilities |
35,882,000 | 38,246,000 | ||||||
|
|
|
|
|
|||||
| Commitments and contingencies |
||||||||
| STOCKHOLDERS’ EQUITY |
||||||||
| Preferred stock, $.01 par value; authorized 5,000,000; issued and outstanding — none |
— | — | ||||||
| Common stock, $.01 par value, authorized 30,000,000 shares; issued — 12,985,839 at September 30, 2014 and 14,917,977 at September 30, 2013; and outstanding — 12,985,839 at September 30, 2014 and 12,974,239 at September 30, 2013 |
130,000 | 149,000 | ||||||
| Additional paid-in capital |
63,102,000 | 79,104,000 | ||||||
| Retained earnings |
118,595,000 | 112,694,000 | ||||||
| Accumulated other comprehensive income (loss), net of income taxes |
142,000 | (674,000 | ) | |||||
| Treasury stock (at cost), 0 shares at September 30, 2014 and 1,943,738 shares at September 30, 2013 |
— | (17,805,000 | ) | |||||
| Non-controlling interests |
(713,000 | ) | (184,000 | ) | ||||
|
|
|
|
|
|||||
| Total stockholders’ equity |
181,256,000 | 173,284,000 | ||||||
|
|
|
|
|
|||||
| Total liabilities and stockholders’ equity |
$ | 217,138,000 | $ | 211,530,000 | ||||
|
|
|
|
|
|||||
| (1) | For a discussion on the adjustments, see Note A2, Revision of Prior Period Financial Statements |
See notes to accompanying consolidated financial statements
F-4
Table of Contents
ASTA FUNDING, INC. AND SUBSIDIARIES
Consolidated Statements of Income
| Year Ended September 30, | ||||||||||||
| 2014 | 2013 (As Revised)(1) |
2012 (As Revised)(1) |
||||||||||
| Revenues: |
||||||||||||
| Finance income, net |
$ | 19,865,000 | $ | 31,762,000 | $ | 40,803,000 | ||||||
| Personal injury claims income |
7,134,000 | 6,438,000 | 1,647,000 | |||||||||
| Unrealized gain on structured settlements |
2,840,000 | — | — | |||||||||
| Interest income on structured settlements |
2,368,000 | — | — | |||||||||
|
|
|
|
|
|
|
|||||||
| Total revenues |
32,207,000 | 38,200,000 | 42,450,000 | |||||||||
| Forgiveness of non-recourse debt |
26,101,000 | — | — | |||||||||
| Other income (includes ($143,000), ($252,000), and $339,000 during the years ended September 30, 2014, 2013 and 2012, respectively, of accumulated other comprehensive income reclassifications for unrealized net (losses) / gains on available for sale securities). |
1,777,000 | 1,611,000 | 2,256,000 | |||||||||
|
|
|
|
|
|
|
|||||||
| 60,085,000 | 39,811,000 | 44,706,000 | ||||||||||
|
|
|
|
|
|
|
|||||||
| Expenses: |
||||||||||||
| General and administrative expenses |
28,192,000 | 24,212,000 | 23,640,000 | |||||||||
| Interest expense |
1,260,000 | 1,300,000 | 2,539,000 | |||||||||
| Impairments of consumer receivables acquired for liquidation |
19,591,000 | 10,990,000 | 1,771,000 | |||||||||
|
|
|
|
|
|
|
|||||||
| 49,043,000 | 36,502,000 | 27,950,000 | ||||||||||
|
|
|
|
|
|
|
|||||||
| Income before income tax |
11,042,000 | 3,309,000 | 16,756,000 | |||||||||
| Income tax expense (includes tax benefit / taxes of $59,000, ($100,000) and $137,000 during the years ended September 30, 2014, 2013 and 2012, respectively, of accumulated other comprehensive income reclassifications for unrealized net (losses) / gains on available for sales securities) |
4,613,000 | 894,000 | 6,797,000 | |||||||||
|
|
|
|
|
|
|
|||||||
| Net income |
6,429,000 | 2,415,000 | 9,959,000 | |||||||||
| Less: net income attributable to non-controlling interests |
528,000 | 406,000 | 31,000 | |||||||||
|
|
|
|
|
|
|
|||||||
| Net income attributable to Asta Funding, Inc. |
$ | 5,901,000 | $ | 2,009,000 | $ | 9,928,000 | ||||||
|
|
|
|
|
|
|
|||||||
| Net income per share attributable to Asta Funding, Inc.: |
||||||||||||
| Basic |
$ | 0.45 | $ | 0.16 | $ | 0.71 | ||||||
| Diluted |
$ | 0.45 | $ | 0.15 | $ | 0.69 | ||||||
| Weighted average number of common shares outstanding: |
||||||||||||
| Basic |
12,981,076 | 12,952,150 | 14,077,650 | |||||||||
| Diluted |
13,205,933 | 13,216,051 | 14,321,381 | |||||||||
| (1) | For a discussion on the adjustments, see Note A2, Revision of Prior Period Financial Statements |
See notes to accompanying consolidated financial statements
F-5
Table of Contents
ASTA FUNDING, INC. AND SUBSIDIARIES
Consolidated Statements of Comprehensive Income
| Year Ended September 30, | ||||||||||||
| 2014 | 2013(1) | 2012(1) | ||||||||||
| Comprehensive income is as follows: |
||||||||||||
| Net income |
$ | 6,429,000 | $ | 2,415,000 | $ | 9,959,000 | ||||||
|
|
|
|
|
|
|
|||||||
| Net unrealized securities gain / (loss), net of tax (expense) / benefit of ($599,000), $705,000 and ($495,000), during the years ended September 30, 2014, 2013 and 2012, respectively. |
900,000 | (1,067,000 | ) | 733,000 | ||||||||
| Reclassification adjustments for securities sold, net of tax benefit / (expense) of $59,000, ($100,000) and $137,000, during years ended September 30, 2014, 2013 and 2012, respectively. |
(84,000 | ) | 152,000 | (202,000 | ) | |||||||
|
|
|
|
|
|
|
|||||||
| Other comprehensive income (loss) |
816,000 | (915,000 | ) | 531,000 | ||||||||
|
|
|
|
|
|
|
|||||||
| Total comprehensive income |
$ | 7,245,000 | $ | 1,500,000 | $ | 10,490,000 | ||||||
|
|
|
|
|
|
|
|||||||
| (1) | For a discussion on the adjustments, see Note A2, Revision of Prior Period Financial Statements |
See notes to accompanying consolidated financial statements
F-6
Table of Contents
ASTA FUNDING, INC. AND SUBSIDIARIES
Consolidated Statements of Stockholders’ Equity
For the years ended September 30, 2014, 2013 and 2012
| Common Stock | Additional Paid-in Capital |
Retained Earnings |
Accumulated Other Comprehensive Income (Loss) |
Treasury Stock(1) |
Non- Controlling Interests |
Total Stockholders’ Equity |
||||||||||||||||||||||||||
| Issued Shares |
Amount | |||||||||||||||||||||||||||||||
| Balance, September 30, 2011, as reported |
14,639,456 | $ | 146,000 | $ | 74,793,000 | $ | 98,377,000 | $ | (290,000 | ) | $ | (70,000 | ) | $ | — | $ | 172,956,000 | |||||||||||||||
| Cumulative impact of prior period revisions |
4,521,000 | 4,521,000 | ||||||||||||||||||||||||||||||
|
|
|
|
|
|
|
|
|
|
|
|
|
|
|
|
|
|||||||||||||||||
| Balance, September 30, 2011, as revised |
14,639,456 | 146,000 | 74,793,000 | 102,898,000 | (290,000 | ) | $ | (70,000 | ) | — | 177,477,000 | |||||||||||||||||||||
| Exercise of options |
139,500 | 2,000 | 608,000 | 610,000 | ||||||||||||||||||||||||||||
| Stock based compensation expense |
1,623,000 | 1,623,000 | ||||||||||||||||||||||||||||||
| Dividends |
(1,111,000 | ) | (1,111,000 | ) | ||||||||||||||||||||||||||||
| Purchase of treasury stock |
(16,156,000 | ) | (16,156,000 | ) | ||||||||||||||||||||||||||||
| Net income, as revised(2) |
9,928,000 | 31,000 | 9,959,000 | |||||||||||||||||||||||||||||
| Unrealized loss on marketable securities |
531,000 | 531,000 | ||||||||||||||||||||||||||||||
|
|
|
|
|
|
|
|
|
|
|
|
|
|
|
|
|
|||||||||||||||||
| Balance, September 30, 2012, as revised(2) |
14,778,956 | 148,000 | 77,024,000 | 111,715,000 | 241,000 | (16,226,000 | ) | 31,000 | 172,933,000 | |||||||||||||||||||||||
| Exercise of options |
36,700 | 125,000 | 125,000 | |||||||||||||||||||||||||||||
| Stock based compensation expense |
1,956,000 | 1,956,000 | ||||||||||||||||||||||||||||||
| Restricted stock |
102,321 | 1,000 | (1,000 | ) | — | |||||||||||||||||||||||||||
| Dividends |
(1,030,000 | ) | (1,030,000 | ) | ||||||||||||||||||||||||||||
| Purchase of treasury stock |
(1,579,000 | ) | (1,579,000 | ) | ||||||||||||||||||||||||||||
| Net income, as revised(2) |
2,009,000 | 406,000 | 2,415,000 | |||||||||||||||||||||||||||||
| Unrealized loss on marketable securities |
(915,000 | ) | (915,000 | ) | ||||||||||||||||||||||||||||
| Distributions to non-controlling interest |
(621,000 | ) | (621,000 | ) | ||||||||||||||||||||||||||||
|
|
|
|
|
|
|
|
|
|
|
|
|
|
|
|
|
|||||||||||||||||
| Balance, September 30, 2013, as revised(2) |
14,917,977 | 149,000 | 79,104,000 | 112,694,000 | (674,000 | ) | ($ | 17,805,000 | ) | (184,000 | ) | 173,284,000 | ||||||||||||||||||||
| Exercise of options |
11,600 | 40,000 | 40,000 | |||||||||||||||||||||||||||||
| Stock based compensation expense |
1,744,000 | 1,744,000 | ||||||||||||||||||||||||||||||
| Net income |
5,901,000 | 528,000 | 6,429,000 | |||||||||||||||||||||||||||||
| Unrealized gain on marketable securities |
816,000 | 816,000 | ||||||||||||||||||||||||||||||
| Retirement of treasury stock |
(1,943,738 | ) | (19,000 | ) | (17,786,000 | ) | 17,805,000 | — | ||||||||||||||||||||||||
| Distributions to non-controlling interest |
(1,057,000 | ) | (1,057,000 | ) | ||||||||||||||||||||||||||||
|
|
|
|
|
|
|
|
|
|
|
|
|
|
|
|
|
|||||||||||||||||
| Balance, September 30, 2014 |
12,985,839 | $ | 130,000 | $ | 63,102,000 | $ | 118,595,000 | $ | 142,000 | $ | — | $ | (713,000 | ) | $ | 181,256,000 | ||||||||||||||||
|
|
|
|
|
|
|
|
|
|
|
|
|
|
|
|
|
|||||||||||||||||
| (1) | Treasury shares are as follows: September 30, 2011, 8,900; Purchase of treasury stock, 1,763,138; September 30, 2012, 1,772,038. |
| September | 30, 2012, 1,772,038; Purchase of treasury stock, 171,700; September 30, 2013, 1,943,738. |
| September | 30, 2013, 1,943,738; Retirement of treasury stock, (1,943,738); September 30, 2014, 0. |
| (2) | For a discussion on the adjustments, see Note A2, Revision of Prior Period Financial Statements |
See notes to accompanying consolidated financial statements
F-7
Table of Contents
ASTA FUNDING, INC. AND SUBSIDIARIES
Consolidated Statements of Cash Flows
| Year Ended September 30, | ||||||||||||
| 2014 | 2013 (As Revised)(1) |
2012 (As Revised)(1) |
||||||||||
| Cash flows from operating activities: |
||||||||||||
| Net income |
$ | 6,429,000 | $ | 2,415,000 | $ | 9,959,000 | ||||||
| Adjustments to reconcile net income to net cash provided by operating activities: |
||||||||||||
| Depreciation and amortization |
363,000 | 440,000 | 380,000 | |||||||||
| Deferred income taxes |
446,000 | 57,000 | 3,318,000 | |||||||||
| Impairments of consumer receivables acquired for liquidation |
19,591,000 | 10,990,000 | 1,771,000 | |||||||||
| Stock based compensation |
1,744,000 | 1,956,000 | 1,623,000 | |||||||||
| Loss (gain) on sale of available-for-sale securities |
143,000 | 252,000 | (339,000 | ) | ||||||||
| Structured settlements — accrued interest |
(2,282,000 | ) | — | — | ||||||||
| Structured settlements — gains |
(2,840,000 | ) | — | — | ||||||||
| Forgiveness of non-recourse debt |
(26,101,000 | ) | — | — | ||||||||
| Changes in: |
||||||||||||
| Prepaid and income tax receivable |
1,066,000 | 561,000 | 1,281,000 | |||||||||
| Due from third party collection agencies and attorneys |
143,000 | 873,000 | 42,000 | |||||||||
| Other assets |
(1,592,000 | ) | (631,000 | ) | (190,000 | ) | ||||||
| Other liabilities |
745,000 | (434,000 | ) | (247,000 | ) | |||||||
|
|
|
|
|
|
|
|||||||
| Net cash (used in) provided by operating activities |
(2,145,000 | ) | 16,479,000 | 17,598,000 | ||||||||
|
|
|
|
|
|
|
|||||||
| Cash flows from investing activities: |
||||||||||||
| Purchase of consumer receivables acquired for liquidation |
(5,079,000 | ) | (3,340,000 | ) | (2,495,000 | ) | ||||||
| Principal collected on consumer receivables acquired for liquidation |
20,272,000 | 21,902,000 | 29,149,000 | |||||||||
| Principal collected on consume receivable accounts represented by account sales |
26,000 | 433,000 | 67,000 | |||||||||
| Purchase of available-for-sale securities |
(20,111,000 | ) | (34,171,000 | ) | (66,625,000 | ) | ||||||
| Proceeds from sales of available-for-sale securities |
12,560,000 | 33,076,000 | 22,656,000 | |||||||||
| Purchase of certificates of deposit |
— | — | (45,121,000 | ) | ||||||||
| Proceeds from maturities of certificates of deposit |
— | 42,682,000 | 11,499,000 | |||||||||
| Cash paid for acquisition (net of cash acquired) |
(5,588,000 | ) | — | — | ||||||||
| Investments in personal injury claims — advances |
(22,218,000 | ) | (30,963,000 | ) | (22,549,000 | ) | ||||||
| Investments in personal injury claims — receipts |
25,624,000 | 13,801,000 | 3,953,000 | |||||||||
| Investments in structured settlements — advances |
(9,808,000 | ) | — | — | ||||||||
| Investments in structured settlements — receipts |
3,287,000 | — | — | |||||||||
| Capital expenditures |
(13,000 | ) | (725,000 | ) | (638,000 | ) | ||||||
|
|
|
|
|
|
|
|||||||
| Net cash (used in) provided by investing activities |
(1,048,000 | ) | 42,695,000 | (70,104,000 | ) | |||||||
|
|
|
|
|
|
|
|||||||
| Cash flows from financing activities: |
||||||||||||
| Proceeds from exercise of stock options |
40,000 | 125,000 | 610,000 | |||||||||
| Purchase of treasury stock |
— | (1,579,000 | ) | (16,156,000 | ) | |||||||
| Change in restricted cash |
968,000 | 120,000 | (57,000 | ) | ||||||||
| Dividends paid |
— | (1,290,000 | ) | (1,144,000 | ) | |||||||
| Distributions to non-controlling interest |
(1,057,000 | ) | (621,000 | ) | — | |||||||
| Repayments of non-recourse debt — Bank of Montreal, net |
(9,659,000 | ) | (25,703,000 | ) | (10,141,000 | ) | ||||||
| Borrowings of other debt — CBC |
9,903,000 | — | — | |||||||||
| Repayments of other debt — CBC |
(3,471,000 | ) | — | — | ||||||||
|
|
|
|
|
|
|
|||||||
| Net cash used in financing activities |
(3,276,000 | ) | (28,948,000 | ) | (26,888,000 | ) | ||||||
|
|
|
|
|
|
|
|||||||
| Net (decrease) increase in cash and cash equivalents |
(6,469,000 | ) | 30,226,000 | (79,394,000 | ) | |||||||
| Cash and cash equivalents at beginning of year |
35,179,000 | 4,953,000 | 84,347,000 | |||||||||
|
|
|
|
|
|
|
|||||||
| Cash and cash equivalents at end of year |
$ | 28,710,000 | $ | 35,179,000 | $ | 4,953,000 | ||||||
|
|
|
|
|
|
|
|||||||
| Supplemental disclosure of cash flow information: |
||||||||||||
| Cash paid for: |
||||||||||||
| Interest |
$ | 1,004,000 | $ | 1,822,000 | $ | 2,570,000 | ||||||
|
|
|
|
|
|
|
|||||||
| Income taxes |
$ | 3,100,000 | $ | — | $ | 2,002,000 | ||||||
|
|
|
|
|
|
|
|||||||
| Supplemental disclosures of non-cash investing and financing activities: |
||||||||||||
| Structured settlements |
$ | 30,436,000 | — | — | ||||||||
| Other debt — CBC |
$ | 23,363,000 | — | — | ||||||||
| Retirement of treasury stock |
$ | 17,505,000 | — | — | ||||||||
| (1) | For a discussion on the adjustments, see Note A2, Revision of Prior Period Financial Statements |
See notes to accompanying consolidated financial statements
F-8
Table of Contents
ASTA FUNDING, INC. AND SUBSIDIARIES
Notes to Consolidated Financial Statements
September 30, 2014 and 2013
NOTE A — THE COMPANY AND ITS SIGNIFICANT ACCOUNTING POLICIES
[1] The Company:
Asta Funding, Inc., together with its wholly owned significant operating subsidiaries Palisades Collection LLC, Palisades Acquisition XVI, LLC (“Palisades XVI”), VATIV Recovery Solutions LLC (“VATIV”), ASFI Pegasus Holdings, LLC (“APH”), Fund Pegasus, LLC (“Fund Pegasus”), GAR Disability Advocates, LLC (“GAR Disability Advocates”) and other subsidiaries, not all wholly owned (collectively, the “Company”), has been engaged in the business of purchasing, managing for its own account and servicing distressed consumer receivables, including charged-off receivables, and semi-performing receivables, since 1994, as well as more recent business segments discussed below. The primary charged-off receivables are accounts that have been written-off by the originators and may have been previously serviced by collection agencies. Semi-performing receivables are accounts where the debtor is currently making partial or irregular monthly payments, but the accounts may have been written-off by the originators. Distressed consumer receivables are the unpaid debts of individuals to banks, finance companies and other credit providers. A large portion of the Company’s distressed consumer receivables are MasterCard®, Visa®, other credit card accounts, and telecommunication accounts which were charged-off by the issuers for non-payment. The Company acquires these portfolios at substantial discounts from their face values. The discounts are based on the characteristics (issuer, account size, debtor residence and age of debt) of the underlying accounts of each portfolio. Litigation related receivables are semi-performing investments whereby the Company is assigned the revenue stream from the proceeds received.
The Company owns 80% of Pegasus Funding, LLC (“Pegasus”), which invests in funding personal injury claims and 80% of CBC Settlement Funding, LLC (“CBC”), which invests in structured settlements (see Note D: Acquisition of CBC).
Pegasus provides funding for individuals in need of short term funds pending insurance settlements of their personal injury claims. The funds will be recouped when the underlying insurance settlements are paid. The long periods of time taken by insurance companies to settle and pay such claims resulting from lengthy litigation and the court process is fueling the demand for such funding.
CBC provides liquidity to consumers by purchasing certain deferred payment streams including, but not limited to, structured settlements and annuities. CBC generates business from direct marketing as well as through wholesale purchases from brokers or other third parties. CBC has its principal office in Conshohocken, Pennsylvania. CBC primarily warehouses the receivables it originates and periodically resells or securitizes those assets on a pooled basis. The structured settlement marketplace is regulated by federal and state law, requiring that each transaction is reviewed and approved by court order.
GAR Disability Advocates is a social security disability advocacy group, which obtains and represents individuals in their claims for social security disability and supplemental security income benefits from the Social Security Administration.
The consolidated financial statements are prepared in accordance with accounting principles generally accepted in the United States (“U.S. GAAP”) and industry practices.
[2] Revision of Prior Period Financial Statements:
Our previously reported results for the first three quarters in fiscal year 2014 reported finance income on the interest method in accordance with FASB Accounting Standards Codification (“ASC”) 310-30, Receivables – Loans and Debt Securities Acquired with Deteriorated Credit Quality. However, due to the Company’s inability to reasonably estimate the cash collections under the interest method, the Company was precluded from using the interest method and determined that the cost recovery method is the appropriate accounting method under the circumstances and has made adjustments to reflect the cost recovery method prospectively in the first interim period for the fiscal year ended September 30, 2014.
F-9
Table of Contents
ASTA FUNDING, INC. AND SUBSIDIARIES
Notes to Consolidated Financial Statements
September 30, 2014 and 2013
NOTE A — THE COMPANY AND ITS SIGNIFICANT ACCOUNTING POLICIES (CONTINUED)
[2] Revision of Prior Period Financial Statements (Continued):
We identified pre-tax errors in prior annual periods related to the application of the interest method for consumer receivables acquired for liquidation and accounted for under ASC 310-30. During those prior annual periods, the Company had determined the effective yield for its distressed consumer receivable portfolios by analyzing actual cash flows versus the amount of cash flows expected to be collected over the life of the loan as opposed to performing this analysis using the current cash flow variations (i.e., actual versus estimated cash flows within a particular quarter). As disclosed in the detail that follows, this misstatement resulted in an increase in finance receivables of approximately $6.4 million, with a decrease in deferred taxes of approximately $2.7 million and a resulting increase to retained earnings of approximately $3.7 million in this Form 10-K as of September 30, 2013. The effect on the fiscal year ended September 30, 2013 was a reduction of finance income of approximately $2.6 million with an associated tax benefit of approximately $0.3 million which resulted in net income attributable to Asta Funding, Inc. of $2.0 million or $0.15 per diluted share from $2.7 million or $0.21 per diluted share. The effect on the fiscal year ended September 30, 2012 was an increase of $0.2 million in finance income with an associated tax benefit of $0.1 million which resulted in net income attributable to Asta Funding, Inc. of $9.9 million or $0.69 per diluted share from $10.0 million or $0.70 per diluted share. The impact of the misstatements in the prior years’ financial statements was not material to any of those years, however, the cumulative effect of correcting all of the prior period misstatements in the current year would be material to our fiscal year 2014 consolidated financial statements. As such, consistent with the guidance in ASC Topic 250, we have accounted for these errors as a revision of prior period financial statements.
In evaluating whether the previously issued financial statements were materially misstated, the Company applied SEC Staff Accounting Bulletin (SAB) No. 108, Considering the Effects of Prior Year Misstatements when Quantifying Misstatements in Current Year Financial Statements. SAB No. 108 states that registrants must quantify the impact of correcting all misstatements, including both the carryover (iron curtain method) and reversing (rollover method) effects of prior-year misstatements on the current-year financial statements, and by evaluating the misstatement measured under each method in light of quantitative and qualitative factors.
Under SAB No. 108, prior-year misstatements which, if corrected in the current year would be material, must be corrected by adjusting prior year financial statements, even though such correction previously was and continues to be immaterial to the prior-year financial statements. Correcting prior-year financial statements for such “immaterial misstatements” does not require previously filed reports to be amended. In accordance with accounting guidance presented in ASC 250-10 (SEC Staff Accounting Bulletin No. 99, Materiality), the Company assessed the materiality of the misstatements and concluded that they were not material to any of the Company’s previously issued annual financial statements.
Due to the immaterial nature of the misstatement corrections, the cumulative adjustments required to correct the misstatements in the financial statements are reflected in the revised stockholders’ equity as an adjustment to the beginning balance of retained earnings. The cumulative effect of those adjustments increased previously reported retained earnings by approximately $4.5 million. These adjustments also cumulatively impacted the following balance sheet line items as of September 30, 2013:
F-10
Table of Contents
ASTA FUNDING, INC. AND SUBSIDIARIES
Notes to Consolidated Financial Statements
September 30, 2014 and 2013
NOTE A — THE COMPANY AND ITS SIGNIFICANT ACCOUNTING POLICIES (CONTINUED)
[2] Revision of Prior Period Financial Statements: (Continued)
Consolidated Balance Sheet
| September 30, 2013 | ||||||||||||
| As Reported | Adjustments | As Revised | ||||||||||
| ASSETS |
||||||||||||
| Cash and cash equivalents |
$ | 35,179,000 | $ | — | $ | 35,179,000 | ||||||
| Investments — available-for-sale |
58,035,000 | — | 58,035,000 | |||||||||
| Restricted cash |
968,000 | — | 968,000 | |||||||||
| Consumer receivables acquired for liquidation (at net realizable value) |
57,900,000 | 6,354,000 | 64,254,000 | |||||||||
| Other investments, net |
35,758,000 | — | 35,758,000 | |||||||||
| Due from third party collection agencies and attorneys |
1,169,000 | — | 1,169,000 | |||||||||
| Prepaid and income taxes receivable |
1,496,000 | — | 1,496,000 | |||||||||
| Furniture and equipment, net (net of accumulated depreciation of $4,136,000) |
1,106,000 | — | 1,106,000 | |||||||||
| Deferred income taxes |
10,443,000 | (2,671,000 | ) | 7,772,000 | ||||||||
| Goodwill |
1,410,000 | — | 1,410,000 | |||||||||
| Other assets |
4,383,000 | — | 4,383,000 | |||||||||
|
|
|
|
|
|
|
|||||||
| Total assets |
$ | 207,847,000 | $ | 3,683,000 | $ | 211,530,000 | ||||||
|
|
|
|
|
|
|
|||||||
| LIABILITIES AND STOCKHOLDERS’ EQUITY |
||||||||||||
| Liabilities |
||||||||||||
| Non-recourse debt |
$ | 35,760,000 | $ | — | $ | 35,760,000 | ||||||
| Other liabilities |
2,486,000 | — | 2,486,000 | |||||||||
|
|
|
|
|
|
|
|||||||
| Total liabilities |
38,246,000 | — | 38,246,000 | |||||||||
|
|
|
|
|
|
|
|||||||
| Commitments and contingencies |
||||||||||||
| STOCKHOLDERS’ EQUITY |
||||||||||||
| Preferred stock, $0.01 par value; authorized 5,000,000; issued and outstanding — none |
— | — | — | |||||||||
| Common stock, $.01 par value, authorized 30,000,000 shares; issued, 14,917,977, and outstanding, 12,974,239 |
149,000 | — | 149,000 | |||||||||
| Additional paid in capital |
79,104,000 | — | 79,104,000 | |||||||||
| Retained earnings |
109,011,000 | 3,683,000 | 112,694,000 | |||||||||
| Accumulated other comprehensive loss, net of income taxes |
(674,000 | ) | — | (674,000 | ) | |||||||
| Treasury stock (at cost), 1,943,738 shares |
(17,805,000 | ) | — | (17,805,000 | ) | |||||||
| Non-controlling interest |
(184,000 | ) | — | (184,000 | ) | |||||||
|
|
|
|
|
|
|
|||||||
| Total stockholders’ equity |
169,601,000 | 3,683,000 | 173,284,000 | |||||||||
|
|
|
|
|
|
|
|||||||
| Total liabilities and stockholders’ equity |
$ | 207,847,000 | $ | 3,683,000 | $ | 211,530,000 | ||||||
|
|
|
|
|
|
|
|||||||
F-11
Table of Contents
ASTA FUNDING, INC. AND SUBSIDIARIES
Notes to Consolidated Financial Statements
September 30, 2014 and 2013
NOTE A — THE COMPANY AND ITS SIGNIFICANT ACCOUNTING POLICIES (CONTINUED)
[2] Revision of Prior Period Financial Statements: (Continued)
Consolidated Statements of Income
| Year Ended September 30, 2013 | ||||||||||||
| As Reported | Adjustments | As Revised | ||||||||||
| Revenues: |
||||||||||||
| Finance income, net |
$ | 34,363,000 | $ | (2,601,000 | ) | $ | 31,762,000 | |||||
| Personal injury claims income |
6,438,000 | — | 6,438,000 | |||||||||
|
|
|
|
|
|
|
|||||||
| Total revenues |
40,801,000 | (2,601,000 | ) | 38,200,000 | ||||||||
| Other income (includes $252,000 accumulated other comprehensive income reclassifications for unrealized net loss on available for sale securities). |
1,611,000 | — | 1,611,000 | |||||||||
|
|
|
|
|
|
|
|||||||
| 42,412,000 | (2,601,000 | ) | 39,811,000 | |||||||||
|
|
|
|
|
|
|
|||||||
| Expenses: |
||||||||||||
| General and administrative expenses |
24,212,000 | — | 24,212,000 | |||||||||
| Interest expense |
1,300,000 | — | 1,300,000 | |||||||||
| Impairments of consumer receivables acquired for liquidation |
12,592,000 | (1,602,000 | ) | 10,990,000 | ||||||||
|
|
|
|
|
|
|
|||||||
| 38,104,000 | (1,602,000 | ) | 36,502,000 | |||||||||
|
|
|
|
|
|
|
|||||||
| Income before income tax |
4,308,000 | (999,000 | ) | 3,309,000 | ||||||||
| Income tax expense (includes tax benefit $100,000 of accumulated other comprehensive income reclassifications for unrealized net loss on available for sales securities) |
1,164,000 | (270,000 | ) | 894,000 | ||||||||
|
|
|
|
|
|
|
|||||||
| Net income |
3,144,000 | (729,000 | ) | 2,415,000 | ||||||||
| Less: net income attributable to non-controlling interests |
406,000 | — | 406,000 | |||||||||
|
|
|
|
|
|
|
|||||||
| Net income attributable to Asta Funding, Inc. |
$ | 2,738,000 | $ | (729,000 | ) | $ | 2,009,000 | |||||
|
|
|
|
|
|
|
|||||||
| Net income per share attributable to Asta Funding, Inc.: |
||||||||||||
| Basic |
$ | 0.21 | $ | (0.05 | ) | $ | 0.16 | |||||
| Diluted |
$ | 0.21 | $ | (0.06 | ) | $ | 0.15 | |||||
| Weighted average number of common shares outstanding: |
||||||||||||
| Basic |
12,952,150 | 12,952,150 | ||||||||||
| Diluted |
13,216,051 | — | 13,216,051 | |||||||||
F-12
Table of Contents
ASTA FUNDING, INC. AND SUBSIDIARIES
Notes to Consolidated Financial Statements
September 30, 2014 and 2013
NOTE A — THE COMPANY AND ITS SIGNIFICANT ACCOUNTING POLICIES (CONTINUED)
[2] Revision of Prior Period Financial Statements: (Continued)
Consolidated Statements of Income
| Year Ended September 30, 2012 | ||||||||||||
| As Reported | Adjustments | As Revised | ||||||||||
| Revenues: |
||||||||||||
| Finance income, net |
$ | 40,599,000 | $ | 204,000 | $ | 40,803,000 | ||||||
| Personal injury claims income |
1,647,000 | — | 1,647,000 | |||||||||
|
|
|
|
|
|
|
|||||||
| Total revenues |
42,246,000 | 204,000 | 42,450,000 | |||||||||
| Other income (includes $339,000 of accumulated other comprehensive income reclassifications for unrealized net gain on available for sale securities). |
2,256,000 | — | 2,256,000 | |||||||||
|
|
|
|
|
|
|
|||||||
| 44,502,000 | 204,000 | 44,706,000 | ||||||||||
|
|
|
|
|
|
|
|||||||
| Expenses: |
||||||||||||
| General and administrative expenses |
23,640,000 | — | 23,640,000 | |||||||||
| Interest expense |
2,539,000 | — | 2,539,000 | |||||||||
| Impairments of consumer receivables acquired for liquidation |
1,383,000 | 388,000 | 1,771,000 | |||||||||
|
|
|
|
|
|
|
|||||||
| 27,562,000 | 388,000 | 27,950,000 | ||||||||||
|
|
|
|
|
|
|
|||||||
| Income before income tax |
16,940,000 | (184,000 | ) | 16,756,000 | ||||||||
| Income tax expense (includes taxes $137,000 of accumulated other comprehensive income reclassifications for unrealized net gain on available for sales securities) |
6,872,000 | (75,000 | ) | 6,797,000 | ||||||||
|
|
|
|
|
|
|
|||||||
| Net income |
10,068,000 | (109,000 | ) | 9,959,000 | ||||||||
| Less: net income attributable to non-controlling interests |
31,000 | — | 31,000 | |||||||||
|
|
|
|
|
|
|
|||||||
| Net income attributable to Asta Funding, Inc. |
$ | 10,037,000 | $ | (109,000 | ) | $ | 9,928,000 | |||||
|
|
|
|
|
|
|
|||||||
| Net income per share attributable to Asta Funding, Inc.: |
||||||||||||
| Basic |
$ | 0.71 | $ | 0.00 | $ | 0.71 | ||||||
| Diluted |
$ | 0.70 | $ | (0.01 | ) | $ | 0.69 | |||||
| Weighted average number of common shares outstanding: |
||||||||||||
| Basic |
14,077,650 | — | 14,077,650 | |||||||||
| Diluted |
14,321,381 | — | 14,321,381 | |||||||||
F-13
Table of Contents
ASTA FUNDING, INC. AND SUBSIDIARIES
Notes to Consolidated Financial Statements
September 30, 2014 and 2013
NOTE A — THE COMPANY AND ITS SIGNIFICANT ACCOUNTING POLICIES (CONTINUED)
[2] Revision of Prior Period Financial Statements: (Continued)
Consolidated Statements of Cash Flows
| Year Ended September 30, 2013 | ||||||||||||
| As Reported | Adjustments | As Revised | ||||||||||
| Cash flows from operating activities: |
||||||||||||
| Net income |
$ | 3,144,000 | $ | (729,000 | ) | $ | 2,415,000 | |||||
| Adjustments to reconcile net income to net cash provided by operating activities: |
||||||||||||
| Depreciation and amortization |
440,000 | — | 440,000 | |||||||||
| Deferred income taxes |
326,000 | (269,000 | ) | 57,000 | ||||||||
| Impairments of consumer receivables acquired for liquidation |
12,592,000 | (1,602,000 | ) | 10,990,000 | ||||||||
| Stock based compensation |
1,956,000 | — | 1,956,000 | |||||||||
| Loss (gain) on sale of available-for-sale securities |
252,000 | — | 252,000 | |||||||||
| Changes in: |
— | |||||||||||
| Prepaid and income tax receivable |
561,000 | — | 561,000 | |||||||||
| Due from third party collection agencies and attorneys |
873,000 | — | 873,000 | |||||||||
| Other assets |
(631,000 | ) | — | (631,000 | ) | |||||||
| Other liabilities |
(434,000 | ) | — | (434,000 | ) | |||||||
|
|
|
|
|
|
|
|||||||
| Net cash provided by operating activities |
19,079,000 | (2,600,000 | ) | 16,479,000 | ||||||||
|
|
|
|
|
|
|
|||||||
| Cash flows from investing activities: |
||||||||||||
| Purchase of consumer receivables acquired for liquidation |
(3,340,000 | ) | — | (3,340,000 | ) | |||||||
| Principal collected on consumer receivables acquired for liquidation |
19,302,000 | 2,600,000 | 21,902,000 | |||||||||
| Principal collected on consume receivable accounts represented by account sales |
433,000 | — | 433,000 | |||||||||
| Purchase of available-for-sale securities |
(34,171,000 | ) | — | (34,171,000 | ) | |||||||
| Proceeds from sales of available-for-sale securities |
33,076,000 | — | 33,076,000 | |||||||||
| Proceeds from maturities of certificates of deposit |
42,682,000 | — | 42,682,000 | |||||||||
| Investments in personal injury claims — advances |
(30,963,000 | ) | — | (30,963,000 | ) | |||||||
| Investments in personal injury claims — receipts |
13,801,000 | — | 13,801,000 | |||||||||
| Capital expenditures |
(725,000 | ) | — | (725,000 | ) | |||||||
|
|
|
|
|
|
|
|||||||
| Net cash (used in) provided by investing activities |
40,095,000 | 2,600,000 | 42,695,000 | |||||||||
|
|
|
|
|
|
|
|||||||
| Cash flows from financing activities: |
||||||||||||
| Proceeds from exercise of stock options |
125,000 | — | 125,000 | |||||||||
| Purchase of treasury stock |
(1,579,000 | ) | — | (1,579,000 | ) | |||||||
| Change in restricted cash |
120,000 | — | 120,000 | |||||||||
| Dividends paid |
(1,290,000 | ) | — | (1,290,000 | ) | |||||||
| Distributions to non-controlling interest |
(621,000 | ) | — | (621,000 | ) | |||||||
| Repayments of non-recourse debt — Bank of Montreal, net |
(25,703,000 | ) | — | (25,703,000 | ) | |||||||
|
|
|
|
|
|
|
|||||||
| Net cash used in financing activities |
(28,948,000 | ) | — | (28,948,000 | ) | |||||||
|
|
|
|
|
|
|
|||||||
| Net increase in cash and cash equivalents |
30,226,000 | — | 30,226,000 | |||||||||
| Cash and cash equivalents at beginning of year |
4,953,000 | — | 4,953,000 | |||||||||
|
|
|
|
|
|
|
|||||||
| Cash and cash equivalents at end of year |
$ | 35,179,000 | $ | — | $ | 35,179,000 | ||||||
|
|
|
|
|
|
|
|||||||
| Supplemental disclosure of cash flow information: |
||||||||||||
| Cash paid for: |
||||||||||||
| Interest |
$ | 1,822,000 | $ | — | $ | 1,822,000 | ||||||
|
|
|
|
|
|
|
|||||||
F-14
Table of Contents
ASTA FUNDING, INC. AND SUBSIDIARIES
Notes to Consolidated Financial Statements
September 30, 2014 and 2013
NOTE A — THE COMPANY AND ITS SIGNIFICANT ACCOUNTING POLICIES (CONTINUED)
[2] Revision of Prior Period Financial Statements: (Continued)
Consolidated Statements of Cash Flows
| Year Ended September 30, 2012 | ||||||||||||
| As Reported | Adjustments | As Revised | ||||||||||
| Cash flows from operating activities: |
||||||||||||
| Net income |
$ | 10,068,000 | $ | (109,000 | ) | $ | 9,959,000 | |||||
| Adjustments to reconcile net income to net cash provided by operating activities: |
||||||||||||
| Depreciation and amortization |
380,000 | — | 380,000 | |||||||||
| Deferred income taxes |
3,393,000 | (75,000 | ) | 3,318,000 | ||||||||
| Impairments of consumer receivables acquired for liquidation |
1,383,000 | 388,000 | 1,771,000 | |||||||||
| Stock based compensation |
1,623,000 | — | 1,623,000 | |||||||||
| Loss (gain) on sale of available-for-sale securities |
(339,000 | ) | — | (339,000 | ) | |||||||
| Changes in: |
||||||||||||
| Prepaid and income tax receivable |
1,281,000 | — | 1,281,000 | |||||||||
| Due from third party collection agencies and attorneys |
42,000 | — | 42,000 | |||||||||
| Other assets |
(190,000 | ) | — | (190,000 | ) | |||||||
| Other liabilities |
(247,000 | ) | — | (247,000 | ) | |||||||
|
|
|
|
|
|
|
|||||||
| Net cash provided by operating activities |
17,394,000 | 204,000 | 17,598,000 | |||||||||
|
|
|
|
|
|
|
|||||||
| Cash flows from investing activities: |
||||||||||||
| Purchase of consumer receivables acquired for liquidation |
(2,495,000 | ) | — | (2,495,000 | ) | |||||||
| Principal collected on consumer receivables acquired for liquidation |
29,353,000 | (204,000 | ) | 29,149,000 | ||||||||
| Principal collected on consume receivable accounts represented by account sales |
67,000 | — | 67,000 | |||||||||
| Purchase of available-for-sale securities |
(66,625,000 | ) | — | (66,625,000 | ) | |||||||
| Proceeds from sales of available-for-sale securities |
22,656,000 | — | 22,656,000 | |||||||||
| Purchase of certificates of deposit |
(45,121,000 | ) | — | (45,121,000 | ) | |||||||
| Proceeds from maturities of certificates of deposit |
11,499,000 | — | 11,499,000 | |||||||||
| Investments in personal injury claims — advances |
(22,549,000 | ) | — | (22,549,000 | ) | |||||||
| Investments in personal injury claims — receipts |
3,953,000 | — | 3,953,000 | |||||||||
| Capital expenditures |
(638,000 | ) | — | (638,000 | ) | |||||||
|
|
|
|
|
|
|
|||||||
| Net cash (used in) provided by investing activities |
(69,900,000 | ) | (204,000 | ) | (70,104,000 | ) | ||||||
|
|
|
|
|
|
|
|||||||
| Cash flows from financing activities: |
||||||||||||
| Proceeds from exercise of stock options |
610,000 | — | 610,000 | |||||||||
| Purchase of treasury stock |
(16,156,000 | ) | — | (16,156,000 | ) | |||||||
| Change in restricted cash |
(57,000 | ) | — | (57,000 | ) | |||||||
| Dividends paid |
(1,144,000 | ) | — | (1,144,000 | ) | |||||||
| Repayments of non-recourse debt — Bank of Montreal, net |
(10,141,000 | ) | — | (10,141,000 | ) | |||||||
|
|
|
|
|
|
|
|||||||
| Net cash used in financing activities |
(26,888,000 | ) | — | (26,888,000 | ) | |||||||
|
|
|
|
|
|
|
|||||||
| Net (decrease) increase in cash and cash equivalents |
(79,394,000 | ) | — | (79,394,000 | ) | |||||||
| Cash and cash equivalents at beginning of year |
84,347,000 | — | 84,347,000 | |||||||||
|
|
|
|
|
|
|
|||||||
| Cash and cash equivalents at end of year |
$ | 4,953,000 | $ | — | $ | 4,953,000 | ||||||
|
|
|
|
|
|
|
|||||||
| Supplemental disclosure of cash flow information: |
||||||||||||
| Cash paid for: |
||||||||||||
| Interest |
$ | 2,570,000 | $ | — | $ | 2,570,000 | ||||||
|
|
|
|
|
|
|
|||||||
| Income taxes |
$ | 2,002,000 | $ | — | $ | 2,002,000 | ||||||
|
|
|
|
|
|
|
|||||||
F-15
Table of Contents
ASTA FUNDING, INC. AND SUBSIDIARIES
Notes to Consolidated Financial Statements
September 30, 2014 and 2013
NOTE A — THE COMPANY AND ITS SIGNIFICANT ACCOUNTING POLICIES (CONTINUED)
[3] Liquidity:
The Company’s cash requirements have been and will continue to be significant. In the past, we have depended upon external financing to acquire consumer receivables, fund operating expenses, interest and income taxes. If approved, the payment of dividends is also a significant use of cash. We have depended solely on operating cash flow to fund the acquisition of portfolios, pay operating expenses, dividends, and taxes.
Net collections decreased $13.9 million or 25.8% from $54.1 million in fiscal year 2013 to $40.2 million in fiscal year 2014. Although the Company’s collections decreased from the prior year, the Company believes its net cash collections over the next twelve months, coupled with its current liquid cash balances, will be sufficient to cover its operating expenses.
[4] Principles of consolidation:
The consolidated financial statements include the accounts of the Company and its wholly owned subsidiaries. All significant intercompany balances and transactions have been eliminated in consolidation.
Palisades XVI is a variable interest entity (“VIE”). Asta Funding, Inc. is considered the primary beneficiary because it has the power to direct the significant activities of the VIE via its ownership and service contract. Palisades XVI holds the Great Seneca portfolio of $19.3 million as of September 30, 2014. See Note I — Debt, Non-Recourse Debt — Bank of Montreal for additional details.
Blue Bell Receivables I, LLC, Blue Bells Receivables II, LLC and Blue Bell Receivables III, LLC (the “Blue Bell Entities”) are VIEs. CBC is considered the primary beneficiary because it has the power to direct the significant activities of the VIEs via its ownership and service contract. It also has the rights to receive benefits from the collections that exceed the payments to the note holders. The Blue Bell Entities held structured settlements of $19.6 million and non-recourse notes payable of $12.7 million as of September 30, 2014. On November 26, 2014, CBC announced the completion of its fourth private placement, BBR IV, LLC, backed by structured settlement and fixed annuity payments (see Note V — Subsequent Events).
[5] Concentration of Credit Risk — Cash:
The Company considers all highly liquid investments with a maturity of three months or less at the date of purchase to be cash equivalents.
Cash balances are maintained at various depository institutions and are insured by the Federal Deposit Insurance Corporation (“FDIC”). The Company had cash balances with eight banks that exceeded the balance insured by the FDIC by approximately $25.3 million at September 30, 2014. The Company does not believe it is exposed to any significant credit risk for cash.
[6] Available-for-Sale Investments:
Investments that the Company intends to hold for an indefinite period of time, but not necessarily to maturity, are classified as available-for-sale and are carried at fair value. Unrealized gains and losses on available-for-sale securities are determined using the specific-identification method.
Declines in the fair value of individual available-for-sale securities below their respective costs that are other than temporary will result in write-downs of the individual securities to their fair value. Factors affecting the determination of whether an other-than-temporary impairment has occurred include: a downgrading of the security by a rating agency, a significant deterioration in the financial condition of the issuer, or that management would not have the ability to hold a security for a period of time sufficient to allow for any anticipated recovery in fair value.
F-16
Table of Contents
ASTA FUNDING, INC. AND SUBSIDIARIES
Notes to Consolidated Financial Statements
September 30, 2014 and 2013
NOTE A — THE COMPANY AND ITS SIGNIFICANT ACCOUNTING POLICIES (CONTINUED)
[7] Income recognition, Impairments and Accretable yield adjustments:
Income Recognition
The Company accounts for its investment in consumer receivables acquired for liquidation using the interest method under the guidance of Financial Accounting Standards Board (“FASB”) Accounting Standards Codification (“ASC”) 310, Receivables — Loans and Debt Securities Acquired with Deteriorated Credit Quality, (“ASC 310”). In ASC 310 static pools of accounts are established. These pools are aggregated based on certain common risk criteria. Each static pool is recorded at cost and is accounted for as a single unit for the recognition of income, principal payments and loss provision.
Once a static pool is established for a quarter, individual receivable accounts are not added to the pool (unless replaced by the seller) or removed from the pool (unless sold or returned to the seller). ASC 310 requires that the excess of the contractual cash flows over expected cash flows not be recognized as an adjustment of revenue or expense or on the balance sheet. ASC 310 initially freezes the internal rate of return (“IRR”), estimated when the accounts receivable are purchased, as the basis for subsequent impairment testing. Significant increases in actual, or expected future cash flows are recognized prospectively through an upward adjustment of the IRR over a portfolio’s remaining life. Any increase to the IRR then becomes the new benchmark for impairment testing. Under ASC 310, rather than lowering the estimated IRR if the collection estimates are not received or projected to be received, the carrying value of a pool would be written down to maintain the then current IRR. The Company switched to the cost recovery method of accounting as of October 1, 2013. See Note A(2) for more information.
Finance income is recognized on cost recovery portfolios after the carrying value has been fully recovered through collections or amounts written down.
The Company accounts for its investments in personal injury claims at an agreed upon interest rate, in anticipation of a future settlement. The interest purchased by Pegasus in each claim will consist of the right to receive from such claimant part of the proceeds or recoveries which such claimant receives by reason of a settlement, judgment or reward with respect to such claimant’s claim. Open case revenue is estimated, recognized and accrued at a rate based on the expected realization and underwriting guidelines and facts and circumstances for each individual case. These personal injury claims are non-recourse. When a case is closed and the cash is received for the advance provided to a claimant, revenue is recognized based upon the contractually agreed upon interest rate, and, if applicable, adjusted for any changes due to a settled amount and fees charged to the claimant.
The funding of matrimonial actions is on a non-recourse basis. Revenue from matrimonial actions is recognized under the cost recovery method.
CBC purchases periodic payments under structured settlements and annuity policies from individuals in exchange for a lump sum payment. The Company elected to carry structured settlements at fair value. Unearned income on structured settlements is recognized as interest income using the effective interest method over the life of the related settlement. Changes in fair value are recorded in unrealized gain (loss) in structured settlements in our statements of income.
The Company recognizes revenue for GAR Disability Advocates when cases close and fees are collected.
Impairments and accretable yield adjustments
The Company accounts for its impairments in accordance with ASC 310, which provides guidance on how to account for differences between contractual and expected cash flows from an investor’s initial investment in loans or debt securities acquired in a transfer if those differences are attributable, at least in part, to credit quality.
F-17
Table of Contents
ASTA FUNDING, INC. AND SUBSIDIARIES
Notes to Consolidated Financial Statements
September 30, 2014 and 2013
NOTE A — THE COMPANY AND ITS SIGNIFICANT ACCOUNTING POLICIES (CONTINUED)
[7] Income recognition, Impairments and Accretable yield adjustments: (Continued)
Increases in expected cash flows are recognized prospectively through an adjustment of the internal rate of return while decreases in expected cash flows are recognized as impairments. Impairments of approximately $19.5 million were recorded in the fiscal year ended September 30, 2014. An impairment of approximately $11.0 million was recorded in the fiscal year ended September 30, 2013 and approximately $1.8 million was recorded in fiscal year 2012. Finance income is not recognized on cost recovery method portfolios until the cost of the portfolio is fully recovered. Collection projections are performed on both interest method and cost recovery method portfolios. With regard to the cost recovery portfolios, if collection projections indicate the carrying value will not be recovered, an impairment is required. As the Company switched to the cost recovery method on its current inventory of consumer receivable portfolios, there were no accretable yield adjustments recorded in the fiscal year ended September 30, 2014. Accretable adjustments were $0.6 million in fiscal year 2013 and not material in fiscal year 2012.
The recognition of income under ASC 310 is dependent on the Company having the ability to develop reasonable expectations of both the timing and amount of cash flows to be collected. In the event the Company cannot develop a reasonable expectation as to both the timing and amount of cash flows expected to be collected, ASC 310 permits the change to the cost recovery method. The Company will recognize income only after it has recovered its carrying value,
The Company’s analysis of the timing and amount of cash flows to be generated by its portfolio purchases and investments are based on the following attributes:
| • | the type of receivable, the location of the debtor and the number of collection agencies previously attempting to collect the receivables in the portfolio. The Company has found that there are better states to try to collect receivables and the Company factors in both better and worse states when establishing their initial cash flow expectations; |
| • | the average balance of the receivables influences our analysis in that lower average balance portfolios tend to be more collectible in the short-term and higher average balance portfolios are more appropriate for the Company’s lawsuit strategy and thus yield better results over the longer term. As the Company has significant experience with both types of balances, it can factor these variables into its initial expected cash flows; |
| • | the age of the receivables, the number of days since charge-off, any payments since charge-off, and the credit guidelines of the credit originator also represent factors taken into consideration in our estimation process. For example, older receivables might be more difficult and/or require more time and effort to collect; |
| • | past history and performance of similar assets acquired. As the Company purchases portfolios of like assets, it accumulates a significant historical data base on the tendencies of debtor repayments and factor this into its initial expected cash flows; |
| • | the Company’s ability to analyze accounts and resell accounts that meet its criteria; |
| • | jobs or property of the customers found within portfolios. With our business model, this is of particular importance. Customers with jobs or property are more likely to repay their obligation through the lawsuit strategy and, conversely, customers without jobs or property are less likely to repay their obligation. The Company believes that customers with jobs or property are more likely to repay because courts have mandated the debtor must pay the debt. Ultimately, the debtor with property will pay to clear title or |
F-18
Table of Contents
ASTA FUNDING, INC. AND SUBSIDIARIES
Notes to Consolidated Financial Statements
September 30, 2014 and 2013
NOTE A — THE COMPANY AND ITS SIGNIFICANT ACCOUNTING POLICIES (CONTINUED)
[7] Income recognition, Impairments and Accretable yield adjustments: (Continued)
| release a lien. The Company also believes that these customers generally might take longer to repay and that is factored into its initial expected cash flows; and |
| • | credit standards of the issuer. |
The Company acquires accounts that have experienced deterioration of credit quality between origination and the date of its acquisition of the accounts. The amount invested in a portfolio of accounts reflects our determination that it is probable we will be unable to collect all amounts due according to the portfolio of accounts’ contractual terms. The Company considers the expected payments and estimates the amount and timing of undiscounted expected principal, interest and other cash flows for each acquired portfolio coupled with expected cash flows from accounts available for sale. The excess of this amount over the cost of the portfolio, representing the excess of the accounts’ cash flows expected to be collected over the amount paid, is accreted into income recognized on finance receivables accounted for on the interest method over the expected remaining life of the portfolio.
The Company believes it has significant experience in acquiring certain distressed consumer receivable portfolios at a significant discount to the amount actually owed by underlying customers. The Company invests in these portfolios only after both qualitative and quantitative analyses of the underlying receivables are performed and a calculated purchase price is paid so that it believes its estimated cash flow offers an adequate return on acquisition costs after servicing expenses. Additionally, when considering larger portfolio purchases of accounts, or portfolios from issuers with whom the Company has limited experience, it has the added benefit of soliciting its third party collection agencies and attorneys for their input on liquidation rates and, at times, incorporates such input into the estimates it uses for its expected cash flows.
[8] Commissions and fees:
Commissions and fees are the contractual commissions earned by third party collection agencies and attorneys, and direct costs associated with the collection effort- generally court costs. The Company expects to continue to purchase portfolios and utilize third party collection agencies and attorney networks.
[9] Furniture, equipment and leasehold improvements:
Furniture and equipment is stated at cost. Depreciation is provided using the straight-line method over the estimated useful lives of the assets (5 to 7 years). Amortization on leasehold improvements is provided by the straight line-method of the remaining life of the respective lease. An accelerated depreciation method is used for tax purposes.
[10] Income taxes:
Deferred federal and state taxes arise from (i) recognition of finance income collected for tax purposes, but not yet recognized for financial reporting; (ii) provision for impairments/credit losses, all resulting in timing differences between financial accounting and tax reporting; iii) amortization of leasehold improvements resulting in timing differences between financial accounting and tax reporting; iv) stock based compensation; and v) partnership investments.
F-19
Table of Contents
ASTA FUNDING, INC. AND SUBSIDIARIES
Notes to Consolidated Financial Statements
September 30, 2014 and 2013
NOTE A — THE COMPANY AND ITS SIGNIFICANT ACCOUNTING POLICIES (CONTINUED)
[11] Net income per share:
Basic per share data is determined by dividing net income by the weighted average shares outstanding during the period. Diluted per share data is computed by dividing net income by the weighted average shares outstanding, assuming all dilutive potential common shares were issued. The assumed proceeds from the exercise of dilutive options are calculated using the treasury stock method based on the average market price for the period.
The following table presents the computation of basic and diluted per share data for the fiscal years ended September 30, 2014, 2013 and 2012:
| 2014 | 2013 (As Revised) |
2012 (As Revised ) |
||||||||||||||||||||||||||||||||||
| Net Income |
Weighted Average Shares |
Per Share Amount |
Net Income |
Weighted Average Shares |
Per Share Amount |
Net Income |
Weighted Average Shares |
Per Share Amount |
||||||||||||||||||||||||||||
| Basic |
$ | 5,901,000 | 12,981,076 | $ | 0.45 | $ | 2,009,000 | 12,952,150 | $ | 0.16 | $ | 9,928,000 | 14,077,650 | $ | 0.71 | |||||||||||||||||||||
|
|
|
|
|
|
|
|||||||||||||||||||||||||||||||
| Dilutive effect of stock options |
224,857 | 0.00 | 263,901 | (0.01 | ) | 243,731 | (0.02 | ) | ||||||||||||||||||||||||||||
|
|
|
|
|
|
|
|
|
|
|
|
|
|
|
|
|
|
|
|||||||||||||||||||
| Diluted |
$ | 5,901,000 | 13,205,933 | $ | 0.45 | $ | 2,009,000 | 13,216,051 | $ | 0.15 | $ | 9,928,000 | 14,321,381 | $ | 0.69 | |||||||||||||||||||||
|
|
|
|
|
|
|
|
|
|
|
|
|
|
|
|
|
|
|
|||||||||||||||||||
At September 30, 2014, 960,559 options at a weighted average exercise price of $12.12 were not included in the diluted earnings per share calculation as they were anti-dilutive. At September 30, 2013, 606,332 options at a weighted average exercise price of $8.01 were not included in the diluted earnings per share calculation as they were anti-dilutive. At September 30, 2012, 1,210,396 options at a weighted average exercise price of $12.23 were not included in the diluted earnings per share calculation as they were anti-dilutive.
[12] Use of estimates:
The preparation of financial statements in conformity with accounting principles generally accepted in the United States of America requires management to make estimates and assumptions that affect the reported amounts of assets and liabilities and disclosure of contingent assets and liabilities at the date of the financial statements and the reported amounts of revenues and expenses during the reporting period. With respect to income recognition the Company takes into consideration the relative credit quality of the underlying receivables constituting the portfolio acquired, the strategy involved to maximize the collections thereof, the time required to implement the collection strategy as well as other factors to estimate the anticipated cash flows. Actual results could differ from those estimates including management’s estimates of future cash flows and the resultant allocation of collections between principal and interest resulting therefrom. Downward revisions to estimated cash flows will result in impairments.
[13] Stock-based compensation:
The Company accounts for stock-based employee compensation under FASB ASC 718, Compensation — Stock Compensation, (“ASC 718”). ASC 718 requires that compensation expense associated with stock options and vesting of restricted stock awards be recognized in the statement of income.
[14] Impact of Recently Issued Accounting Standards:
In May 2014, the FASB issued an update to ASC 606, “Revenue from Contracts with Customers,” that will supersede virtually all existing revenue guidance. Under this update, an entity is required to recognize revenue upon transfer of promised goods or services to customers, in an amount that reflects the entitled consideration received in exchange for those goods or services. The guidance also requires additional disclosure about the
F-20
Table of Contents
ASTA FUNDING, INC. AND SUBSIDIARIES
Notes to Consolidated Financial Statements
September 30, 2014 and 2013
NOTE A — THE COMPANY AND ITS SIGNIFICANT ACCOUNTING POLICIES (CONTINUED)
[14] Impact of Recently Issued Accounting Standards (Continued):
nature, amount, timing, and uncertainty of revenue and cash flows arising from the customer contracts. This update is effective for annual reporting periods beginning after December 15, 2016, including interim periods within that reporting period. Early application is not permitted. We are currently evaluating the impact this update will have on our consolidated financial statements as well as the expected adoption method.
In June 2014, the FASB issued ASU 2014-11, “Transfers and Servicing (Topic 860): Repurchase-to-Maturity Transactions, Repurchase Financings, and Disclosures.” The amendments in this ASU require two accounting changes. First, the amendments in this ASU change the accounting for repurchase-to maturity transactions to secured borrowing accounting. Second, for repurchase financing arrangements, the amendments require separate accounting for a transfer of a financial asset executed contemporaneously with a repurchase agreement with the same counterparty, which will result in secured borrowing accounting for the repurchase agreement. This ASU also includes new disclosure requirements. The accounting changes in this Update are effective for public business entities for the first interim or annual period beginning after December 15, 2014. An entity is required to present changes in accounting for transactions outstanding on the effective date as a cumulative-effect adjustment to retained earnings as of the beginning of the period of adoption. Earlier application for a public business entity is prohibited. The Company reviewed this ASU and determined that it did not have a material impact on its consolidated financial statements.
In February 2015, the FASB issued ASU 2015-02, “Consolidation (Topic 810): Amendments to the Consolidation Analysis,” which amends the consolidation requirements in ASC 810. This update is effective for public business entities for the first interim or annual period beginning after December 15, 2015. We are currently reviewing this ASU to determine if it will have an impact on our consolidated financial statements.
[15] Reclassifications:
Certain items in the years ended September 30, 2013 and 2012 in the consolidated financial statements have been reclassified to conform to the current year’s presentation, primarily related to certain balance sheet and statement of income items.
NOTE B — AVAILABLE-FOR-SALE INVESTMENTS
Mutual funds investments classified as available-for-sale at September 30, 2014 and 2013 consist of the following:
| Amortized Cost |
Unrealized Gains |
Unrealized Losses |
Fair Value | |||||||||||||
| 2014 |
$ | 66,559,000 | $ | 411,000 | $ | (171,000 | ) | $ | 66,799,000 | |||||||
| 2013 |
$ | 59,151,000 | $ | 27,000 | $ | (1,143,000 | ) | $ | 58,035,000 | |||||||
The available-for-sale investments did not have any contractual maturities. The Company sold five investments during the year ended September 30, 2014, with an aggregate realized loss of $143,000. Additionally, the Company received $186,000 in capital gains distributions during fiscal year 2014. The Company sold four investments in fiscal year 2013, resulting in an aggregate realized loss of approximately $252,000. The realized gains and losses are all included as part of other income.
At September 30, 2014, there were six investments, four of which were in an unrealized loss position. Three of the four investments had unrealized losses existing for more than 12 months and one of the four for 12 months
F-21
Table of Contents
ASTA FUNDING, INC. AND SUBSIDIARIES
Notes to Consolidated Financial Statements
September 30, 2014 and 2013
NOTE B — AVAILABLE-FOR-SALE INVESTMENTS (CONTINUED)
or less. However, the Company was in an aggregate unrealized gain position, as the unrealized gain of the remaining two investments more than offset the unrealized loss of the four investments. At September 30, 2013, there were six investments, five of which were in an unrealized loss position. All of these securities were considered to be acceptable credit risks. Based on the evaluation of the available evidence at that time, including changes in market rates and credit rating information, management believed that any decline in fair value for these instruments would be temporary. In addition, management had the ability but did not believe it would be required to sell those investment securities for a period of time sufficient to allow for an anticipated recovery or maturity. Should the impairment of any of those securities become other than temporary, the cost basis of the investment will be reduced and the resulting loss recognized in net income in the period in which the other-than-temporary impairment were identified.
Unrealized holding gains and losses on available-for-sale securities are included in other comprehensive income within stockholders’ equity. Realized gains (losses) on available-for-sale securities are included in other income and, when applicable, are reported as a reclassification adjustment in other comprehensive income.
NOTE C — CONSUMER RECEIVABLES ACQUIRED FOR LIQUIDATION
Accounts acquired for liquidation are stated at their net estimated realizable value and consist primarily of defaulted consumer loans to individuals primarily throughout the United States.
The Company may account for its investments in consumer receivable portfolios, using either:
| • | the interest method; or |
| • | the cost recovery method. |
Prior to October 1, 2013 the Company accounted for certain of its investments in finance receivables using the interest method in accordance with the guidance of ASC 310-30. Under the guidance of ASC 310-30, static pools of accounts are established. These pools are aggregated based on certain common risk criteria. Each static pool is recorded at cost and is accounted for as a single unit for the recognition of income, principal payments and loss provision. Effective October 1, 2013, due to the substantial reduction of portfolios reported under the interest method, and the ability to reasonably estimate cash collections required to account for those portfolios under the interest method, the Company concluded the cost recovery method is the appropriate accounting method in the circumstances.
Although the Company has switched to the cost recovery method on its current inventory of portfolios, the Company must still analyze a portfolio upon acquisition and once a static pool is established for a quarter, individual receivable accounts are not added to the pool (unless replaced by the seller) or removed from the pool (unless sold or returned to the seller). Under the interest method , ASC 310-30 requires that the excess of the contractual cash flows over expected cash flows not be recognized as an adjustment of revenue or expense or on the balance sheet. ASC 310-30 initially freezes the internal rate of return, referred to as IRR, estimated when the accounts receivable are purchased, as the basis for subsequent impairment testing. Significant increases in actual or expected future cash flows may be recognized prospectively through an upward adjustment of the IRR over a portfolio’s remaining life. Any increase to the IRR then becomes the new benchmark for impairment testing. Rather than lowering the estimated IRR if the collection estimates are not received or projected to be received, the carrying value of a pool would be impaired, or written down to maintain the then current IRR. Under the interest method, income is recognized on the effective yield method based on the actual cash collected during a period and future estimated cash flows and timing of such collections and the portfolio’s cost. Material variations of cash flow estimates are recorded in the quarter such variations are determined. The estimated future cash flows are reevaluated quarterly.
F-22
Table of Contents
ASTA FUNDING, INC. AND SUBSIDIARIES
Notes to Consolidated Financial Statements
September 30, 2014 and 2013
NOTE C — CONSUMER RECEIVABLES ACQUIRED FOR LIQUIDATION (CONTINUED)
Once a static pool is established for a quarter, individual receivable accounts are not added to the pool (unless replaced by the seller) or removed from the pool (unless sold or returned to the seller). ASC 310 requires that the excess of the contractual cash flows over expected cash flows not be recognized as an adjustment of revenue or expense or on the balance sheet. ASC 310 initially freezes the internal rate of return, referred to as IRR, estimated when the accounts receivable are purchased, as the basis for subsequent impairment testing. Significant increases in actual or expected future cash flows may be recognized prospectively through an upward adjustment of the IRR over a portfolio’s remaining life. Any increase to the IRR then becomes the new benchmark for impairment testing. Rather than lowering the estimated IRR if the collection estimates are not received or projected to be received, the carrying value of a pool would be impaired, or written down to maintain the then current IRR. Under the interest method, income is recognized on the effective yield method based on the actual cash collected during a period and futureestimated cash flows and timing of such collections and the portfolio’s cost. Material variations of cash flow estimates are recorded in the quarter such variations are determined. The estimated future cash flows are reevaluated quarterly.
The Company uses the cost recovery method when collections on a particular pool of accounts cannot be reasonably predicted. Under the cost recovery method, no income is recognized until the cost of the portfolio has been fully recovered. A pool can become fully amortized (zero carrying balance on the balance sheet) while still generating cash collections. In this case, all cash collections are recognized as revenue when received.
The Company’s extensive liquidating experience is in the field of distressed credit card receivables, telecommunication receivables, consumer loan receivables, retail installment contracts, consumer receivables, and auto deficiency receivables.
The Company aggregates portfolios of receivables acquired sharing specific common characteristics which were acquired within a given quarter. The Company considers for aggregation portfolios of accounts, purchased within the same fiscal quarter, that generally meet the following characteristics:
| • | Same issuer/originator; |
| • | Same underlying credit quality; |
| • | similar geographic distribution of the accounts; |
| • | similar age of the receivable; and |
| • | Same type of asset class (credit cards, telecommunication, etc.). |
The Company uses a variety of qualitative and quantitative factors to estimate collections and the timing thereof. This analysis includes the following variables:
| • | the number of collection agencies previously attempting to collect the receivables in the portfolio; |
| • | the average balance of the receivables, as higher balances might be more difficult to collect while low balances might not be cost effective to collect; |
| • | the age of the receivables, as older receivables might be more difficult to collect or might be less cost effective. On the other hand, the passage of time, in certain circumstances, might result in higher collections due to changing life events of some individual customers; |
| • | past history of performance of similar assets; |
| • | time since charge-off; |
| • | payments made since charge-off; |
F-23
Table of Contents
ASTA FUNDING, INC. AND SUBSIDIARIES
Notes to Consolidated Financial Statements
September 30, 2014 and 2013
NOTE C — CONSUMER RECEIVABLES ACQUIRED FOR LIQUIDATION (CONTINUED)
| • | the credit originator and its credit guidelines; |
| • | the Company’s ability to analyze accounts and resell accounts that meet our criteria for resale; |
| • | the locations of the customers, as there are better states to attempt to collect in and ultimately the Company has better predictability of the liquidations and the expected cash flows. Conversely, there are also states where the liquidation rates are not as favorable and that is factored into our cash flow analysis; |
| • | jobs or property of the customers found within portfolios. In the Company’s business model, this is of particular importance. Customers with jobs or property are more likely to repay their obligation and conversely, customers without jobs or property are less likely to repay their obligation; and |
| • | the ability to obtain timely customer statements from the original issuer. |
The Company obtains and utilizes, as appropriate, input, including but not limited to monthly collection projections and liquidation rates, from third party collection agencies and attorneys, as further evidentiary matter, to assist in evaluating and developing collection strategies and in evaluating and modeling the expected cash flows for a given portfolio.
The following tables summarize the changes in the balance sheet account of consumer receivables acquired for liquidation during the following periods
| For the Year Ended September 30, 2014 | ||||||||||||
| Interest Method |
Cost Recovery Method |
Total | ||||||||||
| Balance, beginning of period |
$ | 8,071,000 | $ | 49,829,000 | $ | 57,900,000 | ||||||
| Balance transferred to cost recovery — prior period adjustment |
(1,304,000 | ) | 1,304,000 | — | ||||||||
| Adjustment for misapplication of the interest method to prior periods |
6,354,000 | — | 6,354,000 | |||||||||
|
|
|
|
|
|
|
|||||||
| Balance beginning of period, as restated |
13,121,000 | 51,133,000 | 64,254,000 | |||||||||
| Reclassification of interest method portfolios to cost recovery method |
(13,121,000 | ) | 13,121,000 | — | ||||||||
| Acquisition of receivable portfolios |
— | 5,078,000 | 5,078,000 | |||||||||
| Net cash collections from collection of consumer receivables acquired for liquidation |
— | (40,048,000 | ) | (40,048,000 | ) | |||||||
| Net cash collections represented by account sales of consumer receivables acquired for liquidation |
— | (114,000 | ) | (114,000 | ) | |||||||
| Impairment |
— | (19,591,000 | ) | (19,591,000 | ) | |||||||
| Finance income recognized |
— | 19,865,000 | 19,865,000 | |||||||||
|
|
|
|
|
|
|
|||||||
| Balance, end of period |
$ | — | $ | 29,444,000 | $ | 29,444,000 | ||||||
|
|
|
|
|
|
|
|||||||
| Finance income as a percentage of collections |
0 | % | 49.5 | % | 49.5 | % | ||||||
F-24
Table of Contents
ASTA FUNDING, INC. AND SUBSIDIARIES
Notes to Consolidated Financial Statements
September 30, 2014 and 2013
NOTE C — CONSUMER RECEIVABLES ACQUIRED FOR LIQUIDATION (CONTINUED)
| For the Year Ended September 30,
2013 (As Revised) |
||||||||||||
| Interest Method |
Cost Recovery Method |
Total | ||||||||||
| Balance, beginning of period |
$ | 12,326,000 | $ | 74,561,000 | $ | 86,887,000 | ||||||
| Balance transferred to cost recovery — prior period adjustment |
(2,692,000 | ) | 2,692,000 | — | ||||||||
| Adjustment for misapplication of the interest method to prior periods |
5,852,000 | 1,500,000 | 7,352,000 | |||||||||
|
|
|
|
|
|
|
|||||||
| Balance beginning of period, as revised |
15,486,000 | 78,753,000 | 94,239,000 | |||||||||
| Acquisition of receivable portfolios |
— | 3,340,000 | 3,340,000 | |||||||||
| Net cash collections from collection of consumer receivables acquired for liquidation |
(27,860,000 | ) | (23,790,000 | ) | (51,650,000 | ) | ||||||
| Net cash collections represented by account sales of consumer receivables acquired for liquidation |
(979,000 | ) | (1,468,000 | ) | (2,447,000 | ) | ||||||
| Impairment |
(840,000 | ) | (10,150,000 | ) | (10,990,000 | ) | ||||||
| Finance income recognized(1) |
27,314,000 | 4,448,000 | 31,762,000 | |||||||||
|
|
|
|
|
|
|
|||||||
| Balance, end of period |
$ | 13,121,000 | $ | 51,133,000 | $ | 64,254,000 | ||||||
|
|
|
|
|
|
|
|||||||
| Finance income as a percentage of collections |
94.7 | % | 17.6 | % | 58.7 | % | ||||||
| (1) | Includes $25.7 million derived from fully amortized portfolios. Finance income recognized from account sales amounted to $1.8 million. |
Accretable yield represents the amount of income the Company can expect to generate over the remaining amortizable life of its existing portfolios based on estimated future net cash flows as of September 30, 2014. The Company adjusts the accretable yield upward when it believes, based on available evidence, that portfolio collections will exceed amounts previously estimated. There were no accretable yield adjustments in fiscal years 2014 and 2013. As the Company transferred the then remaining $5.5 million of interest method portfolios to the cost recovery method, there is no remaining projected accretable finance income. The accretable yield schedules for the fiscal years ended September 30, 2014 and 2013 are as follows:
| Year Ended September 30, 2014 |
||||
| Balance at beginning of period, October 1, 2013 |
$ | 7,679,000 | ||
| Transfer to cost recovery |
(7,679,000 | ) | ||
|
|
|
|||
| Balance at end of period, September 30, 2014 |
$ | 0 | ||
|
|
|
|||
F-25
Table of Contents
ASTA FUNDING, INC. AND SUBSIDIARIES
Notes to Consolidated Financial Statements
September 30, 2014 and 2013
NOTE C — CONSUMER RECEIVABLES ACQUIRED FOR LIQUIDATION (CONTINUED)
| Year Ended September 30, 2013 |
||||
| Balance at beginning of period, October 1, 2012 |
$ | 13,508,000 | ||
| Income recognized on finance receivables, net |
(27,314,000 | ) | ||
| Reclassifications from non-accretable difference(1) |
21,485,000 | |||
|
|
|
|||
| Balance at end of period, September 30, 2013 |
$ | 7,679,000 | ||
|
|
|
|||
| (1) | Includes portfolios that became zero based during the period, removal of zero basis portfolios from the accretable yield calculation and, other immaterial impairments and accretions based on the extension of certain collection curves. |
During the year ended September 30, 2014, the Company purchased $478.9 million in face value receivables at a cost of $5.1 million. During the year ended September 30, 2013, the Company purchased $53.5 million in face value receivables at cost of $3.3 million.
The following table summarizes collections received by the Company’s third-party collection agencies and attorneys, less commissions and direct costs for the years ended September 30, 2014, 2013 and 2012, respectively.
| For the Years Ended September 30, | ||||||||||||
| 2014 | 2013 | 2012 | ||||||||||
| Gross collections(1) |
$ | 67,913,000 | $ | 85,512,000 | $ | 108,487,000 | ||||||
| Less: commissions and fees(2) |
27,751,000 | 31,415,000 | 38,468,000 | |||||||||
|
|
|
|
|
|
|
|||||||
| Net collections |
$ | 40,162,000 | $ | 54,097,000 | $ | 70,019,000 | ||||||
|
|
|
|
|
|
|
|||||||
| (1) | Gross collections include collections from third-party collection agencies and attorneys, collections from in-house efforts and collections represented by account sales. |
| (2) | Commissions and fees are the contractual commissions earned by third party collection agencies and attorneys, and direct costs associated with the collection effort, generally court costs. Includes a 3% fee charged by a servicer on gross collections in connection with the Portfolio Purchase. Such arrangement was consummated in December 2007. The fee is charged for asset location, skip tracing and ultimately suing debtors in connection with this portfolio purchase. |
Finance income recognized on net collections represented by account sales was $0.1 million, $1.8 million and $0.1 million for the fiscal years ended September 30, 2014, 2013 and 2012, respectively.
NOTE D — ACQUISITION OF CBC (AS REVISED)
On December 31, 2013, the Company acquired 80% ownership of CBC and its affiliate, CBC Management Services, LLC, for approximately $5.9 million. In addition, the Company will provide financing to CBC of up to $5 million. The 20% non-controlling interests are held by two of the original owners of CBC. The fair value of non-controlling interests at the acquisition date was determined to be immaterial. The non-controlling interests will not be entitled to any distributions from CBC until the Company receives distributions of $2,337,190. The non-controlling interests are entitled to two of the five seats of CBC’s Board of Managers and have the right to approve certain material transactions of CBC. The non-controlling interest owners are employed by CBC. If the
F-26
Table of Contents
ASTA FUNDING, INC. AND SUBSIDIARIES
Notes to Consolidated Financial Statements
September 30, 2014 and 2013
NOTE D — ACQUISITION OF CBC (AS REVISED) (CONTINUED)
employment is terminated, other than for cause, CBC could be required to purchase their membership interest in CBC. If the employment is terminated for any other reason, CBC has the right to purchase their non-controlling interests. The purchase price would be determined by a third party appraiser and is payable over a period of time. The fair value of the put right was determined to be $0 at December 31, 2013. No re-measurement is required at September 30, 2014 as it is not probable that the put option will become redeemable. The acquisition provides the Company with the opportunity to further diversify its portfolio.
CBC purchases periodic structured settlements and annuity policies from individuals in exchange for a lump sum payment. The Company accounted for this purchase in accordance with ASC Topic 805 “Business Combinations”. Under this guidance, an entity is required to recognize the assets acquired and liabilities assumed and the consideration given at their fair value on the acquisition date. The following table summarizes the fair value of the assets acquired and the liabilities assumed as of the December 31, 2013 acquisition date:
| Cash |
$ | 351,000 | ||
| Structured settlements |
30,436,000 | |||
| Other assets |
11,000 | |||
| Other liabilities |
(356,000 | ) | ||
| Other debt (see Note J: Other debt — CBC (including non-recourse notes payable amounting to $13.8 million) |
(25,863,000 | ) | ||
|
|
|
|||
| Total identifiable net assets acquired |
4,579,000 | |||
| Goodwill (see Note H: Goodwill) |
1,360,000 | |||
|
|
|
|||
| Purchase Price |
$ | 5,939,000 | ||
|
|
|
As the transaction was consummated on December 31, 2013, there were no actual operational results that were attributable to the Company in the first quarter of fiscal year 2014 and the comparable period of fiscal years 2013 and 2012. Total revenues, as reported, for the fiscal year ended September 30, 2014, were $32,207,000. On a pro forma basis, total revenues for the fiscal year ended September 30, 2014 would have been $33,842,000. Net income attributable to Asta Funding, Inc., as reported, for the fiscal year ended September 30, 2014, was $5,901,000. On a pro forma basis, net income attributable to Asta Funding, Inc. for the fiscal year ended September 30, 2014 would have been $5,943,000. Total revenues, as reported, for the fiscal years ended September 30, 2013 and 2012, were $38,200,000 and $42,450,000, respectively. On a pro forma basis, total revenues for the same prior year periods would have been $42,544,000 and $47,098,000, respectively. Net income attributable to Asta Funding, Inc., as reported, for the fiscal years ended September 30, 2013 and 2012 was $2,009,000 and $9,928,000, respectively. On a pro forma basis, net income attributable to Asta Funding, Inc. would have been $2,378,000 and $11,114,000, respectively, for the same prior year period. The Company, through CBC, earned $5.2 million in settlement income during the fiscal year ended September 30, 2014. The Company had a net invested balance of $42.1 million in structured settlements as of September 30, 2014. The results of CBC yielded income attributable to non-controlling interest of $70,000 for the nine month period ended September 30, 2014, the period in which CBC was part of the results of the Company.
NOTE E — STRUCTURED SETTLEMENTS
CBC purchases periodic payments under structured settlements and annuity policies from individuals in exchange for a lump sum payment. The Company elected to carry the structured settlements at fair value. Unearned income on structured settlements is recognized as interest income using the effective interest method over the life of the related structured settlement. Changes in fair value are recorded in unrealized gain (loss) on structured settlements in the Company’s statements of income.
F-27
Table of Contents
ASTA FUNDING, INC. AND SUBSIDIARIES
Notes to Consolidated Financial Statements
September 30, 2014 and 2013
NOTE E — STRUCTURED SETTLEMENTS (CONTINUED)
Structured settlements consist of the following as of September 30, 2014:
| Maturity value |
$ | 64,852,000 | ||
| Unearned income |
(22,773,000 | ) | ||
|
|
|
|||
| Net carrying value |
$ | 42,079,000 | ||
|
|
|
Encumbrances on structured settlements as of September 30, 2014 are:
| Notes payable secured by settlement receivables with principal and interest outstanding payable until June 2025(1) |
$ | 2,521,000 | ||
| Notes payable secured by settlement receivables with principal and interest outstanding payable until August 2026(1) |
5,363,000 | |||
| Notes payable secured by settlement receivables with principal and interest outstanding payable until April 2032(1) |
4,828,000 | |||
| $22,000,000 revolving line of credit(1) |
19,583,000 | |||
|
|
|
|||
| Encumbered structured settlements |
32,295,000 | |||
| Structured settlements not encumbered |
9,784,000 | |||
|
|
|
|||
| Total structured settlements |
$ | 42,079,000 | ||
|
|
|
| (1) | See Note J — Other Debt — CBC |
At September 30, 2014, the expected cash flows of structured settlements based on maturity value are as follows:
| September 30, 2015 |
$ | 4,703,000 | ||
| September 30, 2016 |
4,989,000 | |||
| September 30, 2017 |
4,688,000 | |||
| September 30, 2018 |
3,835,000 | |||
| September 30, 2019 |
3,956,000 | |||
| Thereafter |
42,681,000 | |||
|
|
|
|||
| Total |
$ | 64,852,000 | ||
|
|
|
NOTE F — OTHER INVESTMENTS
Personal Injury Claims
On December 28, 2011, the Company entered into a joint venture with Pegasus Legal Funding, LLC (“PLF”) in the operating subsidiary of Pegasus. Pegasus purchases interests in claims from claimants who are a party to personal injury litigation. Pegasus advances, to each claimant, funds, on a non-recourse basis at an agreed upon interest rate, in anticipation of a future settlement. The interest in each claim purchased by Pegasus consists of the right to receive, from such claimant, part of the proceeds or recoveries which such claimant receives by reason of a settlement, judgment or award with respect to such claimant’s claims. The Company, through Pegasus, earned $7.1 million in interest and fees during fiscal year 2014 compared to $6.4 million and $1.6 during fiscal years 2013 and 2012, respectively. The Company had a net invested balance in personal injury
F-28
Table of Contents
ASTA FUNDING, INC. AND SUBSIDIARIES
Notes to Consolidated Financial Statements
September 30, 2014 and 2013
NOTE F — OTHER INVESTMENTS (CONTINUED)
Personal Injury Claims (Continued)
claims of $32.4 million and $35.8 million on September 30, 2014 and 2013, respectively. The results of Pegasus yielded income attributable to non-controlling interest of $458,000 for the year-ended September 30, 2014 compared to $406,000 and $31,000 for the years ended September 30, 2013 and 2012, respectively. Pegasus records reserves for bad debts, which, at September 30, 2014, amounted to $2.5 million, as follows:
| Year Ended | ||||
| September 30, 2014 |
||||
| Balance at beginning of period |
$ | 2,248,000 | ||
| Provisions for losses |
1,707,000 | |||
| Write offs |
(1,481,000 | ) | ||
|
|
|
|||
| Balance at end of period |
$ | 2,474,000 | ||
|
|
|
|||
Matrimonial Claims
On May 18, 2012, the Company formed BP Case Management, LLC (“BPCM”), a joint venture with California-based Balance Point Divorce Funding, LLC (“BP Divorce Funding”). BPCM provides non-recourse funding to a spouse in a matrimonial action. The Company provided a $1.0 million revolving line of credit to partially fund BPCM’s operations, with such loan bearing interest at the prevailing prime rate, with an initial term of twenty-four months. In September 2014, the agreement was revised to extend the term of the loan to August 2016, increase the credit line to $1.5 million and include a personal guarantee of the principal of BP Divorce Funding. The loan balance at September 30, 2014 was approximately $1.5 million. The revolving line of credit is collateralized by BP Divorce Funding’s profits share in BPCM and other assets. As of September 30, 2014, the Company’s investment in cases through BPCM was approximately $2.4 million. The Company recognized no income during fiscal year 2014 compared to $34,000 and $165,000 during fiscal years 2013 and 2012, respectively.
NOTE G — FURNITURE AND EQUIPMENT
Furniture and equipment as of September 30, 2014 and 2013 consist of the following:
| 2014 | 2013 | |||||||
| Furniture |
$ | 323,000 | $ | 310,000 | ||||
| Equipment |
3,622,000 | 3,622,000 | ||||||
| Software |
1,211,000 | 1,211,000 | ||||||
| Leasehold improvements |
99,000 | 99,000 | ||||||
|
|
|
|
|
|||||
| 5,255,000 | 5,242,000 | |||||||
| Less accumulated depreciation |
4,499,000 | 4,136,000 | ||||||
|
|
|
|
|
|||||
| $ | 756,000 | $ | 1,106,000 | |||||
|
|
|
|
|
|||||
Depreciation expense for the years ended September 30, 2014, 2013 and 2012 aggregated $363,000, $440,000 and $380,000, respectively.
F-29
Table of Contents
ASTA FUNDING, INC. AND SUBSIDIARIES
Notes to Consolidated Financial Statements
September 30, 2014 and 2013
NOTE H — GOODWILL
Goodwill represents the excess of the purchase price of an acquired business over the fair value of amounts assigned to assets acquired and liabilities assumed. Goodwill is reviewed for impairment if events or circumstances indicate that impairment may be present. Any excess in carrying value over the estimated fair value is recorded as impairment loss and charged to results of operations in the period such determination is made. For each of the fiscal years ended September 30, 2014 and 2013, management has determined that there was no impairment loss required to be recognized in the carrying value of goodwill.
The goodwill balances at September 30, 2014 and 2013 are as follows:
| 2014 | 2013 | |||||||
| Balance at beginning of period |
$ | 1,410,000 | $ | 1,410,000 | ||||
| Goodwill from acquisition (see Note D: Acquisition of CBC) |
1,360,000 | — | ||||||
|
|
|
|
|
|||||
| Balance at end of period |
$ | 2,770,000 | $ | 1,410,000 | ||||
|
|
|
|
|
|||||
NOTE I — NON-RECOURSE DEBT
Non-Recourse Debt — Bank of Montreal (“BMO”)
In March 2007, Palisades XVI borrowed approximately $227 million under the Receivables Financing Agreement (“RFA”), as amended in July 2007, December 2007, May 2008, February 2009, October 2010 and August 2013 from BMO, in order to finance a $300 million portfolio purchase in March 2007 (the “Portfolio Purchase”). The original term of the agreement was three years. This term was extended by each of the Second, Third, Fourth and Fifth Amendments and the most recent agreement signed in August 2013.
On August 7, 2013, Palisades XVI, a 100% owned bankruptcy remote subsidiary, entered into a Settlement Agreement and Omnibus Amendment (the “Settlement Agreement”) with BMO as an amendment to the RFA. In consideration for a $15 million prepayment funded by the Company, BMO agreed to significantly reduce minimum monthly collection requirements and the interest rate. If and when BMO receives the next $15 million of collections from the Portfolio Purchase or from voluntary prepayments by Asta Funding, Inc., less certain credits for payments made prior to the consummation of the Settlement Agreement (the “Remaining Amount”), Palisades XVI and its affiliates would be automatically released from liability in connection with the RFA (subject to customary exceptions). A condition to the release was Palisade XVI’s agreement to grant BMO, as of the time of the payment of the Remaining Amount, the right to receive 30% of net collections from the Portfolio Purchase once Palisades XVI has received from future net collections, the sum of $15 million plus voluntary prepayments included in the payment of the Remaining Amount (the “Income Interest”). The Company estimated the Income Interest to be between $0 and $1.4 million. However, the Company believes that no amount would be incurred because of the continued deterioration of collections from the Portfolio Purchase.
On June 3, 2014, Palisades XVI paid the Remaining Amount. The final principal payment of $2,901,199 included a voluntary prepayment of $1,866,036 provided from funds of the Company. Accordingly, Palisades XVI will be entitled to receive $16.9 million of future collections from the Portfolio Purchase before BMO is entitled to receive any payments with respect to its Income Interest.
With the payment of the Remaining Amount and upon completion of the documents granting the Palisades XVI Income Interest, including a written confirmation from BMO that the obligation has been paid in full, Palisades XVI has been released from further debt obligations from the RFA. The Company has recorded as other income, forgiveness of non-recourse debt, in the amount of approximately $26.1 million, pre-tax in the third quarter of fiscal year 2014.
F-30
Table of Contents
ASTA FUNDING, INC. AND SUBSIDIARIES
Notes to Consolidated Financial Statements
September 30, 2014 and 2013
NOTE I — NON-RECOURSE DEBT (CONTINUED)
Bank Hapoalim B.M. (“Bank Hapoalim”) Line of Credit
On May 2, 2014, the Company obtained a $20 million line of credit facility from Bank Hapoalim, pursuant to a Loan Agreement (the “Loan Agreement”) among the Company and its subsidiary, Palisades Collection, LLC, as borrowers (“the Borrowers”), and Bank Hapoalim, as agent and lender. The Loan Agreement provides for a $20.0 million committed line of credit and an accordion feature providing an increase in the line of credit of up to $30 million, at the discretion of the lenders. The facility is for a term of three years at an interest rate of either LIBOR plus 275 basis points or prime, at the Company’s option. The Loan Agreement includes covenants that require the Company to maintain a minimum net worth of $150 million and pay an unused line fee. The facility is secured pursuant to a Security Agreement (“Security Agreement”) among the parties to the Loan Agreement, with property of the Borrowers serving as collateral. Through the period ended September 30, 2014, the Company did not use this facility.
NOTE J — OTHER DEBT — CBC
The Company assumed $25.9 million of debt related to the CBC acquisition (see Note D — Acquisition of CBC) on December 31, 2013. On the same date, the Company paid down $2.5 million of the debt. On March 27, 2014, CBC entered into the Sixth Amendment whereby it increased its revolving line of credit from $12.5 million to $15.0 million, the interest rate floor was reduced from 5.5% to 4.75% and the commitment was extended to February 28, 2015. The amendment also included changes in carrier concentration ratios and removal of the personal guarantees of the general managers and non-controlling interest partners. On July 15, 2014, CBC entered into the Seventh Amendment, extending the revolving line of credit to $20 million. On September 29, 2014, CBC entered into the Eighth Amendment, further extending the credit line to $22 million. The expiration date remains at February 28, 2015. As of September 30, 2014, the debt amounted to $32.3 million, which consists of a $19.6 million drawdown from a line of credit ($2.4 million available) from an institutional source and $12.7 million notes issued by entities 100%-owned and consolidated by CBC. These entities are bankruptcy-remote entities created to issue notes secured by structured settlements. On November 26, 2014, CBC announced completion of its fourth private placement. On March 11, 2015, CBC entered into the Ninth Amendment, extending the maturity date and the revolving line of credit maximum revolver amount (see Note V — Subsequent Events for additional information). The following table details the other debt at September 30, 2014:
| Interest Rate | Balance | |||||||
| Notes payable with varying monthly installments: |
||||||||
| Notes payable secured by settlement receivables with principal and interest outstanding payable until June 2025 |
8.75 | % | $ | 2,521,000 | ||||
| Notes payable secured by settlement receivables with principal and interest outstanding payable until August 2026 |
7.25 | % | 5,363,000 | |||||
| Notes payable secured by settlement receivables with principal and interest outstanding payable until April 2032 |
7.125 | % | 4,828,000 | |||||
|
|
|
|||||||
| Subtotal notes payable |
12,712,000 | |||||||
| $25,000,000 revolving line of credit expiring on March 1, 2017 |
4.75 | % | 19,583,000 | |||||
|
|
|
|||||||
| Total debt — CBC |
$ | 32,295,000 | ||||||
|
|
|
|||||||
F-31
Table of Contents
ASTA FUNDING, INC. AND SUBSIDIARIES
Notes to Consolidated Financial Statements
September 30, 2014 and 2013
NOTE K — OTHER LIABILITIES
Other liabilities as of September 30, 2014 and 2013 are as follows:
| 2014 | 2013 | |||||||
| Accounts payable and accrued expenses |
$ | 3,126,000 | $ | 2,274,000 | ||||
| Other |
461,000 | 212,000 | ||||||
|
|
|
|
|
|||||
| Total other liabilities |
$ | 3,587,000 | $ | 2,486,000 | ||||
|
|
|
|
|
|||||
NOTE L — INCOME TAXES
The components of the provision for income taxes for the years ended September 30, 2014, 2013 and 2012 are as follows:
| 2014 | 2013 (As Revised) |
2012 (As Revised) |
||||||||||
| Current: |
||||||||||||
| Federal |
$ | 4,148,000 | $ | 561,000 | $ | 3,437,000 | ||||||
| Federal true up |
18,000 | — | 42,000 | |||||||||
|
|
|
|
|
|
|
|||||||
| 4,166,000 | 561,000 | 3,479,000 | ||||||||||
|
|
|
|
|
|
|
|||||||
| Deferred: |
||||||||||||
| Federal |
(1,620,000 | ) | 212,000 | 1,738,000 | ||||||||
| State |
2,067,000 | 121,000 | 1,580,000 | |||||||||
|
|
|
|
|
|
|
|||||||
| 447,000 | 333,000 | 3,318,000 | ||||||||||
|
|
|
|
|
|
|
|||||||
| Provision for income taxes |
$ | 4,613,000 | $ | 894,000 | $ | 6,797,000 | ||||||
|
|
|
|
|
|
|
|||||||
The difference between the statutory federal income tax rate on the Company’s pre-tax income and the Company’s effective income tax rate is summarized for the years ended September 30, 2014, 2013 and 2012 as follows:
| 2013 | 2012 | |||||||||||
| 2014 | (As Revised) | (As Revised) | ||||||||||
| Statutory federal income tax rate |
34.0 | % | 34.0 | % | 34.0 | % | ||||||
| State income tax, net of federal benefit |
4.5 | 6.1 | 6.1 | |||||||||
| State tax rate change |
8.4 | — | — | |||||||||
| Permanent difference in municipal interest |
(3.3 | ) | (7.5 | ) | — | |||||||
| Permanent difference other |
0.2 | (0.7 | ) | — | ||||||||
| Federal prior year provision to return difference |
0.2 | (2.1 | ) | 0.2 | ||||||||
| Other |
(2.2 | ) | (2.8 | ) | 0.3 | |||||||
|
|
|
|
|
|
|
|||||||
| Effective income tax rate |
41.8 | % | 27.0 | % | 40.6 | % | ||||||
|
|
|
|
|
|
|
|||||||
F-32
Table of Contents
ASTA FUNDING, INC. AND SUBSIDIARIES
Notes to Consolidated Financial Statements
September 30, 2014 and 2013
NOTE L — INCOME TAXES (CONTINUED)
The Company recognized a net deferred tax asset of $6,786,000 and $7,772,000 as of September 30, 2014 and 2013, respectively. The components are as follows:
| September 30, | September 30, | |||||||
| 2014 | 2013 | |||||||
| Deferred and accrued revenue |
$ | 7,000 | $ | (414,000 | ) | |||
| Impairments/bad debt reserves/Prior period adjustments |
915,000 | 2,570,000 | ||||||
| State tax net operating loss carryforward |
9,958,000 | 9,524,000 | ||||||
| Stock based compensation |
2,814,000 | 2,133,000 | ||||||
| Unrealized gain on structured settlements |
(930,000 | ) | — | |||||
| Depreciation, amortization and other |
(249,000 | ) | (312,000 | ) | ||||
|
|
|
|
|
|||||
| Deferred income taxes |
12,515,000 | 13,501,000 | ||||||
| Deferred tax valuation allowance |
(5,729,000 | ) | (5,729,000 | ) | ||||
|
|
|
|
|
|||||
| Deferred income taxes |
$ | 6,786,000 | $ | 7,772,000 | ||||
|
|
|
|
|
|||||
The Company files consolidated Federal and state income tax returns. Substantially all of the Company’s subsidiaries are single member limited liability companies and, therefore, do not file separate tax returns. Majority and minority owned subsidiaries file separate partnership tax returns. The expiration date for state net operating loss (“NOL”) carryforwards (from September 30, 2009) is September 30, 2029. The New Jersey NOL carryforward balance as of September 30, 2014 is approximately $110.6 million. There are no federal NOL carryforwards.
The Company accounts for income taxes using the asset and liability method which requires the recognition of deferred tax assets and, if applicable, deferred tax liabilities, for the expected future tax consequences of temporary differences between the carrying amounts and the tax bases of assets and, if applicable, liabilities. Additionally, the Company would adjust deferred taxes to reflect estimated tax rate changes, if applicable. The Company conducts periodic evaluations to determine whether it is more likely than not that some or all of its deferred tax assets will not be realized. Among the factors considered in this evaluation are estimates of future earnings, the future reversal of temporary differences and the impact of tax planning strategies that we can implement if warranted. The Company is required to provide a valuation allowance for any portion of our deferred tax assets that, more likely than not, will not be realized at September 30, 2014. Based on this evaluation, the Company has a deferred tax asset valuation allowance of approximately $5.7 million as of September 30, 2014. The deferred tax valuation allowance remained the same as that reported on September 30, 2013. Although the carryforward period for state income tax purposes is up to twenty years, given the economic conditions, such economic environment could limit growth over a reasonable time period to realize the deferred tax asset. The Company determined the time period allowance for carryforward is outside a reasonable period to forecast full realization of the deferred tax asset, therefore recognized the deferred tax asset valuation allowance. The Company continually monitors forecast information to ensure the valuation allowance is at the appropriate value. As required by FASB ASC 740, Income Taxes, the Company recognizes the financial statement benefit of a tax position only after determining that the relevant tax authority would more likely than not sustain the position following an audit. For tax positions meeting the more-likely-than-not threshold, the amount recognized in the financial statements is the largest benefit that has a greater than 50 percent likelihood of being realized upon ultimate settlement with the relevant tax authority. Interest and penalties arising from uncertain tax positions will be presented as a component of income taxes. No amounts of interest or penalties were recognized in the Company’s consolidated financial statements for 2014 and 2013.
F-33
Table of Contents
ASTA FUNDING, INC. AND SUBSIDIARIES
Notes to Consolidated Financial Statements
September 30, 2014 and 2013
NOTE L — INCOME TAXES (CONTINUED)
The corporate federal income tax returns of the Company for 2008 through 2013 are subject to examination by the Internal Revenue Service (“IRS”) generally for three years after they are filed. The state income tax returns and other state filings of the Company are subject to examination by the state taxing authorities, for various periods, generally up to four years after they are filed.
In April 2010, the Company received notification from the IRS that the Company’s federal income tax returns would be audited. The current IRS audit period is 2008 through 2012. This audit is currently in progress. Additional tax liabilities, penalties and interest thereon when determined could have a material impact on the Company’s financial statements.
NOTE M — COMMITMENTS AND CONTINGENCIES
Leases
The Company leases its facilities in (i) Englewood Cliffs, New Jersey, (ii) Houston, Texas, (iii) New York, New York and (iv) Conshohocken, Pennsylvania. The leases are operating leases, and the Company incurred related rent expense in the amounts of $617,000, $554,000 and $413,000 during the years ended September 30, 2014, 2013 and 2012, respectively. The future minimum lease payments are as follows:
| Year Ending September 30, |
||||
| 2015 |
$ | 739,000 | ||
| 2016 |
705,000 | |||
| 2017 |
425,000 | |||
| 2018 |
180,000 | |||
| 2019 |
185,000 | |||
| Thereafter |
63,000 | |||
|
|
|
|||
| $ | 2,297,000 | |||
|
|
|
|||
Contingencies
In the ordinary course of its business, the Company is involved in numerous legal proceedings. The Company regularly initiates collection lawsuits, using its network of third party law firms, against consumers. Also, consumers occasionally initiate litigation against the Company, in which they allege that the Company has violated a federal or state law in the process of collecting their account. The Company does not believe that these matters are material to its business and financial condition. The Company is not involved in any material litigation in which it was a defendant.
The Company is fully cooperating with several state agencies in connection with subpoenas seeking information and/or documentation regarding business practices. The Company has not made any provision with respect to these matters in the financial statements because the Company does not believe that they are material to its business and financial condition.
F-34
Table of Contents
ASTA FUNDING, INC. AND SUBSIDIARIES
Notes to Consolidated Financial Statements
September 30, 2014 and 2013
NOTE N — CONCENTRATIONS
At September 30, 2014, approximately 37% of the Company’s portfolio face value was serviced by five collection organizations. The Company has servicing agreements in place with these five collection organizations, as well as all of the Company’s other third party collection agencies and attorneys that cover standard contingency fees and servicing of the accounts.
NOTE O — STOCK OPTION PLANS
2012 Stock Option and Performance Award Plan
On February 7, 2012, the Board of Directors adopted the Company’s 2012 Stock Option and Performance Award Plan (the “2012 Plan”), which was approved by the stockholders of the Company on March 21, 2012. The 2012 Plan replaces the Equity Compensation Plan (as defined below).
The 2012 Plan provides the Company with flexibility with respect to equity awards by also providing for grants of stock awards (i.e., restricted or unrestricted), stock purchase rights and stock appreciation rights, in addition to the granting of stock options.
The Company authorized 2,000,000 shares of Common Stock for issuance under the 2012 Plan. As of September 30, 2014, the Company has granted 371,700 options and 102,321 shares of restricted stock since inception of the 2012 Plan. Additionally, 40,300 options have been cancelled during that time period, leaving 1,566,279 shares available as of September 30, 2014. As of September 30, 2014, approximately 53 of the Company’s employees were eligible to participate in the 2012 Plan.
Equity Compensation Plan
On December 1, 2005, the board of directors adopted the Company’s Equity Compensation Plan (the “Equity Compensation Plan”), which was approved by the stockholders of the Company on March 1, 2006. The Equity Compensation Plan was adopted to supplement the Company’s 2002 Stock Option Plan (as defined below).
In addition to permitting the grant of stock options as are permitted under the 2002 Stock Option Plan, the Equity Compensation Plan allows the Company flexibility with respect to equity awards by also providing for grants of stock awards (i.e., restricted or unrestricted), stock purchase rights and stock appreciation rights.
The Company authorized 1,000,000 shares of Common Stock for issuance under the Equity Compensation Plan. As of March 21, 2012, no more awards could be issued under this plan.
2002 Stock Option Plan
On March 5, 2002, the board of directors adopted the Company’s 2002 Stock Option Plan (the “2002 Plan”), which was approved by the Company’s stockholders on May 1, 2002. The 2002 Plan was adopted in order to attract and retain qualified directors, officers and employees of, and consultants to, the Company.
The 2002 Plan authorizes the granting of incentive stock options (as defined in Section 422 of the Internal Revenue Code of 1986, as amended (“the “Code”)) and non-qualified stock options to eligible employees of the Company, including officers and directors of the Company (whether or not employees) and consultants of the Company.
The Company authorized 1,000,000 shares of Common Stock for issuance under the 2002 Plan. As of March 5, 2012, no more awards could be issued under this plan.
F-35
Table of Contents
ASTA FUNDING, INC. AND SUBSIDIARIES
Notes to Consolidated Financial Statements
September 30, 2014 and 2013
NOTE O — STOCK OPTION PLANS (CONTINUED)
Stock Based Compensation
The Company accounts for stock-based employee compensation under ASC 718, Compensation — Stock Compensation (“ASC 718”). ASC 718 requires that compensation expense associated with stock options and other stock based awards be recognized in the income statement rather than a disclosure in the notes to the Company’s consolidated financial statements.
In February 2014, the Compensation Committee of the Board of Directors of the Company (“Compensation Committee”) granted 5,000 stock options to a consultant of the Company. The exercise price of these was at the market price on that date. The options vested immediately. The weighted average assumptions used in the option pricing model were as follows:
| Risk-free interest rate |
0.06 | % | ||
| Expected term (years) |
5.9 | |||
| Expected volatility |
35.3 | % | ||
| Dividend yield |
0.00 | % |
In December 2013, the Compensation Committee of the Board of Directors of the Company (“Compensation Committee”) granted 156,700 stock options, of which 70,000 options were awarded to the Officers of the Company and the remaining 86,700 stock options were awarded to non-officer employees of the Company. The exercise price of these options, issued on December 12, 2013, was at the market price on that date. The options vest in three equal annual installments and accounted for as one graded vesting award. The weighted average assumptions used in the option pricing model were as follows:
| Risk-free interest rate |
0.08 | % | ||
| Expected term (years) |
6.5 | |||
| Expected volatility |
98.3 | % | ||
| Dividend yield |
0.00 | % |
In June 2013, through a previous action of the Compensation Committee of the board of directors of the Company (the “Compensation Committee”) authorizing the Chief Executive Officer of the Company the discretion to grant stock option awards to non-officer employees, the Chief Executive Officer awarded 50,000 stock options to non-officer employees. The exercise price of these options, issued on June 13, 2013, was at the market price on that date. The options vest in three equal installments, accounted for as one graded vesting award, starting on the first anniversary of the grant. The assumptions used in the option pricing model were as follows:
| Risk-free interest rate |
0.10 | % | ||
| Expected term (years) |
6.2 | |||
| Expected volatility |
99.7 | % | ||
| Dividend yield |
0.92 | % |
In December 2012, the Compensation Committee granted 160,000 stock options, of which 65,000 options were awarded to three officers of the Company and 20,000 options were awarded to an employee of the Company. The remaining 75,000 shares were issued to six non-employee directors of the Company. The exercise price of these options, issued on December 18, 2012, was at the market price on that date. The options vest in
F-36
Table of Contents
ASTA FUNDING, INC. AND SUBSIDIARIES
Notes to Consolidated Financial Statements
September 30, 2014 and 2013
NOTE O — STOCK OPTION PLANS (CONTINUED)
Stock Based Compensation (Continued)
three equal installments, accounted for as one graded vesting award, starting on the first anniversary of the grant. The assumptions used in the option pricing model were as follows:
| Risk-free interest rate |
0.16 | % | ||
| Expected term (years) |
6.0 | |||
| Expected volatility |
101.0 | % | ||
| Dividend yield |
1.67 | % |
In addition, the Company granted 102,321 restricted shares to the Chief Executive Officer of the Company. The shares vest in three equal installments, starting on the first anniversary of the grant.
In December 2011, the Compensation Committee granted 360,000 stock options, of which 150,000 options were awarded to the Chief Executive Officer, and 30,000 stock options were rewarded to both the Chief Financial Officer and the Senior Vice President. An aggregate of 60,000 shares were issued to five non-employee directors of the Company. The exercise price of these options, issued December 13, 2011, was at the market price on that date. The weighted average assumptions used in the option pricing model were as follows:
| Risk-free interest rate |
0.08 | % | ||
| Expected term (years) |
10.0 | |||
| Expected volatility |
103.9 | % | ||
| Dividend yield |
1.03 | % |
On December 22, 2011, the remaining 90,000 stock options were granted to selected non-officer employees of the Company. The exercise price of all stock options was at the market price on the date of the grant. The weighted average assumptions used in the option pricing model were as follows:
| Risk-free interest rate |
0.08 | % | ||
| Expected term (years) |
10.0 | |||
| Expected volatility |
95.7 | % | ||
| Dividend yield |
1.03 | % |
The following table summarizes stock option transactions under the plans:
| Year Ended September 30, | ||||||||||||||||||||||||
| 2014 | 2013 | 2012 | ||||||||||||||||||||||
| Shares | Weighted Average Exercise Price |
Shares | Weighted Average Exercise Price |
Shares | Weighted Average Exercise Price |
|||||||||||||||||||
| Outstanding options at the beginning of year |
1,622,771 | $ | 11.31 | 1,499,471 | $ | 11.27 | 1,294,271 | $ | 11.41 | |||||||||||||||
| Options granted |
161,700 | 8.48 | 210,000 | 9.36 | 360,000 | 7.87 | ||||||||||||||||||
| Options cancelled |
(369,612 | ) | 12.33 | (50,000 | ) | 7.77 | (15,300 | ) | 6.00 | |||||||||||||||
| Options exercised |
(11,600 | ) | 3.46 | (36,700 | ) | 3.41 | (139,500 | ) | 4.36 | |||||||||||||||
|
|
|
|
|
|
|
|||||||||||||||||||
| Outstanding options at the end of year |
1,403,259 | $ | 10.78 | 1,622,771 | $ | 11.31 | 1,499,471 | $ | 11.27 | |||||||||||||||
|
|
|
|
|
|
|
|||||||||||||||||||
| Exercisable options at the end of year |
888,587 | $ | 12.15 | 1,108,271 | $ | 12.62 | 1,000,904 | $ | 12.93 | |||||||||||||||
|
|
|
|
|
|
|
|||||||||||||||||||
F-37
Table of Contents
ASTA FUNDING, INC. AND SUBSIDIARIES
Notes to Consolidated Financial Statements
September 30, 2014 and 2013
NOTE O — STOCK OPTION PLANS (CONTINUED)
Stock Based Compensation (Continued)
The Company recognized $1,418,000 of compensation expense related to stock options, for fiscal year 2014. The Company recognized $1,683,000 and $1,538,000 of compensation expense related to stock options in the fiscal years ended September 30, 2013 and 2012, respectively. As of September 30, 2014, there was $1,466,000 of unrecognized compensation cost related to unvested stock options. The weighted average remaining period over which such costs are expected to be recognized is 1.6 years.
The intrinsic value of the outstanding and exercisable options as of September 30, 2014 was approximately $329,000 and $241,000, respectively. The intrinsic value of the options exercised during fiscal years 2014 and 2013 was approximately $57,000 and $213,000, respectively. The fair value of the options exercised during the fiscal years ended September 30, 2014 and 2013 was approximately $97,000 and $339,000, respectively. The proceeds from the exercise of stock options during the fiscal years ended September 30, 2014 and 2013 were approximately $40,000 and $125,000, respectively. The weighted average remaining contractual life of exercisable options as of September 30, 2014 is 3.8 years. The fair value of the stock options that vested during the 2014 and 2013 fiscal years was approximately $740,000 and $1,254,000, respectively. The fair value of options granted during the fiscal years ended September 30, 2014 and 2013 was approximately $1,372,000 and $1,966,000, respectively.
The following table summarizes information about the plans’ outstanding options as of September 30, 2014:
| Options Outstanding | Options Exercisable | |||||||||||||||||||
| Range of Exercise Price |
Number Outstanding |
Weighted Average Remaining Contractual Life (In Years) |
Weighted Average Exercise Price |
Number Exercisable |
Weighted Average Exercise Price |
|||||||||||||||
| $ 2.8751 - $ 5.7500 |
7,200 | 4.6 | $ | 2.95 | 7,200 | $ | 2.95 | |||||||||||||
| $ 5.7501 - $ 8.6250 |
869,900 | 6.9 | 7.94 | 471,900 | 7.79 | |||||||||||||||
| $ 8.6251 - $17.2500 |
175,000 | 8.3 | 9.40 | 58,328 | 9.39 | |||||||||||||||
| $17.2501 - $20.1250 |
336,159 | 0.1 | 18.22 | 336,159 | 18.22 | |||||||||||||||
| $25.8751 - $28.7500 |
15,000 | 2.2 | 28.75 | 15,000 | 28.75 | |||||||||||||||
|
|
|
|
|
|||||||||||||||||
| 1,403,259 | 5.4 | $ | 10.78 | 888,587 | $ | 12.15 | ||||||||||||||
|
|
|
|
|
|||||||||||||||||
The following table summarizes information about restricted stock transactions:
| Year Ended September 30, 2014 Shares |
Weighted Average Grant Date Fair Value |
Year Ended September 30, 2013 Shares |
Weighted Average Grant Date Fair Value |
|||||||||||||
| Unvested at the beginning of period |
102,321 | $ | 9.57 | 10,922 | $ | 7.63 | ||||||||||
| Awards granted |
— | 0.00 | 102,321 | 9.57 | ||||||||||||
| Vested |
(34,107 | ) | 9.57 | (10,922 | ) | 7.63 | ||||||||||
| Forfeited |
— | 0.00 | — | 0.00 | ||||||||||||
|
|
|
|
|
|||||||||||||
| Unvested at the end of period |
68,214 | $ | 9.57 | 102,321 | $ | 9.57 | ||||||||||
|
|
|
|
|
|||||||||||||
F-38
Table of Contents
ASTA FUNDING, INC. AND SUBSIDIARIES
Notes to Consolidated Financial Statements
September 30, 2014 and 2013
NOTE O — STOCK OPTION PLANS (CONTINUED)
Stock Based Compensation (Continued)
The Company recognized $326,000, $273,000 and $85,000 of compensation expense during the fiscal years ended September 30, 2014, 2013 and 2012, respectively, for restricted stock. As of September 30, 2014, there was a total of $397,000 of unrecognized compensation cost related to unvested restricted stock. The weighted average remaining period over which such costs are recognized is 1.2 years. There were no restricted stock awards granted during fiscal year 2014. The fair value of the restricted stock awards granted during the first quarter of fiscal year 2013 was approximately $979,000.The fair value of the restricted stock awards vested during the fiscal years ended September 30, 2014 and 2013 was approximately $326,000 and $83,000, respectively.
The Company recognized an aggregate total of $1,744,000, $1,956,000 and $1,623,000 in compensation expense for the fiscal years ended September 30, 2014, 2013 and 2012, respectively, for the stock options and restricted stock grants. As of September 30, 2014, there was a total of $1,843,000 of unrecognized compensation cost related to unvested stock options and restricted stock grants. The method used to calculate stock based compensation is the straight line pro-rated method.
NOTE P — STOCKHOLDERS’ EQUITY
In December 2012, the Board of Directors of the Company approved the payment of a special accelerated annual dividend of $0.08 per share to stockholders of record on December 24, 2012. The aggregate dividend of $1,030,000 was paid on December 28, 2012. No additional dividends were declared during fiscal year 2013.
During the year ended September 30, 2012, the Company declared quarterly cash dividends aggregating $1,111,000, which includes $0.02 per share, per quarter, of which $260,000 was accrued as of September 30, 2012 and paid November 1, 2012.
Dividends are at the discretion of the board of directors and will depend upon the Company’s financial condition, operating results, capital requirements and any other factors the board of directors deems relevant. In addition, agreements with the Company’s lenders may, from time to time, restrict the ability to pay dividends. As of September 30, 2014, there were no such restrictions. No dividends were declared for fiscal year 2014.
On March 9, 2012, the Company adopted a Rule 10b5-1 Plan in conjunction with its share repurchase program. The Board of Directors approved the purchase of up to $20 million of the Company’s common stock, which was effective through March 11, 2013. This share repurchase authorization superseded the authorization to repurchase shares in June 2011, pursuant to which the Company repurchased approximately 59,000 shares at an aggregate cost of approximately $457,000. The Company purchased approximately 885,000 shares at an aggregate cost of approximately $7.9 million under the Rule 10b5-1 Plan. Additionally, in June 2012, the Company repurchased 1.0 million shares of its common stock for $9.4 million in a privately negotiated transaction outside of the Rule 10b5-1 Plan. No shares were repurchased in fiscal year 2014.
NOTE Q — RETIREMENT PLAN
The Company maintains a 401(k) Retirement Plan covering all of its eligible employees. Matching contributions made by the employees to the plan are made at the discretion of the board of directors each plan year. Contributions for the years ended September 30, 2014, 2013 and 2012 were $119,000, $88,000 and $108,000, respectively.
F-39
Table of Contents
ASTA FUNDING, INC. AND SUBSIDIARIES
Notes to Consolidated Financial Statements
September 30, 2014 and 2013
NOTE R — FAIR VALUE OF FINANCIAL MEASUREMENTS AND DISCLOSURES
Disclosures about Fair Value of Financial Instruments
FASB ASC 825, Financial Instruments, (“ASC 825”), requires disclosure of fair value information about financial instruments, whether or not recognized on the balance sheet, for which it is practicable to estimate that value. Because there are a limited number of market participants for certain of the Company’s assets and liabilities, fair value estimates are based upon judgments regarding credit risk, investor expectation of economic conditions, normal cost of administration and other risk characteristics, including interest rate and prepayment risk. These estimates are subjective in nature and involve uncertainties and matters of judgment, which significantly affect the estimates.
The estimated fair value of the Company’s financial instruments is summarized as follows:
| September 30, 2014 | September 30, 2013 | |||||||||||||||
| Carrying Amount |
Fair Value |
Carrying Amount |
Fair Value |
|||||||||||||
| Financial assets |
||||||||||||||||
| Available-for-sale investments (Level 1) |
$ | 66,799,000 | $ | 66,799,000 | $ | 58,035,000 | $ | 58,035,000 | ||||||||
| Consumer receivables acquired for liquidation (Level 3) |
29,444,000 | 50,962,000 | 64,254,000 | 70,875,000 | ||||||||||||
| Structured settlements (Level 3) |
42,079,000 | 42,079,000 | — | — | ||||||||||||
| Financial liabilities |
||||||||||||||||
| Non-Recourse Debt (Level 3) |
— | — | 35,760,000 | 27,000,000 | ||||||||||||
| Other debt — CBC, revolving line of credit (Level 3) |
19,583,000 | 19,583,000 | — | — | ||||||||||||
| Other debt — CBC, non-recourse notes payable with varying installments (Level 3) |
12,712,000 | 12,712,000 | — | — | ||||||||||||
Disclosure of the estimated fair values of financial instruments often requires the use of estimates. The Company uses the following methods and assumptions to estimate the fair value of financial instruments:
Available-for-sale investments — The available-for-sale securities consist of mutual funds that are valued based on quoted prices in active markets.
Consumer receivables acquired for liquidation — The Company computed the fair value of the consumer receivables acquired for liquidation using its proprietary forecasting model. The Company’s forecasting model utilizes a discounted cash flow analysis. The Company’s cash flows are an estimate of collections for consumer receivables based on variables fully described in Note C: Consumer Receivables Acquired for Liquidation. These cash flows are discounted to determine the fair value.
Structured settlements — The Company determined the fair value based on the discounted forecasted future collections of the structured settlements.
Non-Recourse Debt — carries a variable rate. The fair value at September 30, 2013 was determined as a result of the forecasted future collections of the Portfolio Purchase.
Other debt CBC, revolving line of credit — The Company determined the fair value based on similar instruments in the market.
Other debt CBC, notes payable with varying installments — The fair value at September 30, 2014 was based on the discounted forecasted future collections of the structured settlements.
F-40
Table of Contents
ASTA FUNDING, INC. AND SUBSIDIARIES
Notes to Consolidated Financial Statements
September 30, 2014 and 2013
NOTE R — FAIR VALUE OF FINANCIAL MEASUREMENTS AND DISCLOSURES (CONTINUED)
Fair Value Hierarchy
The Company recorded its available-for-sale investments at estimated fair value on a recurring basis. The accompanying consolidated financial statements include estimated fair value information regarding its available-for-sale investments as of September 30, 2014, as required by FASB ASC 820, Fair Value Measurements and Disclosures (“ASC 820”). ASC 820 defines fair value as the price that would be received to sell an asset or paid to transfer a liability (an exit price) in an orderly transaction between market participants on the measurement date. ASC 820 also establishes a fair value hierarchy which requires an entity to maximize the use of observable inputs and minimize the use of unobservable inputs when measuring fair value. A financial instrument’s level within the fair value hierarchy is based on the lowest level of input significant to the fair value measurement.
Level 1 — Quoted prices (unadjusted) in active markets for identical assets or liabilities that the Company has the ability to assess at the measurement date.
Level 2 — Observable inputs other than Level 1 prices, such as quoted prices for similar assets or liabilities in active markets; quoted prices in markets that are not active for identical or similar assets or liabilities; or other inputs that are observable or can be corroborated by observable market data for substantially the full term of the asset or liability.
Level 3 — Unobservable inputs that are supported by little or no market activity and significant to the fair value of the assets or liabilities that are developed using the reporting entities’ estimates and assumptions, which reflect those that market participants would use.
The Company’s available-for-sale investments are classified as Level 1 financial instruments based on the classifications described above. The Company did not have any transfers into (out of) Level 1 investments during the fiscal year ended September 30, 2014. The Company had no Level 2 or Level 3 available-for-sale investments during the fiscal year ended September 30, 2014.
The following table sets forth the Company’s quantitative information about its Level 3 fair value measurements as of September 30, 2014:
| Fair Value | Valuation Technique |
Unobservable Input |
Rate | |||||||||||||
| Structured settlements at fair value |
$ | 42,079,000 | |
Discounted cash flow |
|
|
Discount rate |
|
5.5 | % | ||||||
The changes in structured settlements at fair value using significant unobservable inputs (Level 3) during the year ended September 30, 2014 were as follows:
| Balance at September 30, 2013 |
$ | 0 | ||
| Acquisition of CBC (see Note 5) |
30,436,000 | |||
| Total gains included in earnings |
2,840,000 | |||
| Purchases |
9,808,000 | |||
| Sales |
— | |||
| Interest accreted |
2,282,000 | |||
| Payments received |
(3,287,000 | ) | ||
|
|
|
|||
| Total |
$ | 42,079,000 | ||
|
|
|
|||
| The amount of total gains for the year included in earnings attributable to the change in unrealized gains (losses) relating to assets held at September 30, 2014 |
$ | 2,840,000 | ||
|
|
|
F-41
Table of Contents
ASTA FUNDING, INC. AND SUBSIDIARIES
Notes to Consolidated Financial Statements
September 30, 2014 and 2013
NOTE R — FAIR VALUE OF FINANCIAL MEASUREMENTS AND DISCLOSURES (CONTINUED)
Fair Value Hierarchy (Continued)
Realized and unrealized gains and losses included in earnings in the accompanying consolidated statements of income for the year ended September 30, 2014 are reported in the following revenue categories:
| Total gains (losses) included in earnings in fiscal year 2014 |
$ | 2,840,000 | ||
|
|
|
|||
| Change in unrealized gains (losses) relating to assets still held at September 30, 2014 |
$ | 2,840,000 | ||
|
|
|
NOTE S — RELATED PARTY TRANSACTIONS
On December 12, 2011, the Company and Piccolo Business Advisory (“Piccolo”), which is owned by Louis Piccolo, a director of the Company, entered into a Consulting Agreement, pursuant to which Piccolo provided consulting services which included, but was not limited to, analysis of proposed debt and equity transactions, due diligence and financial analysis and management consulting services (“Services”). The Consulting Agreement was for a period of two years, which ended on December 31, 2013 and Piccolo received compensation of $150,000 per annum payable monthly, a bonus of $25,000 per new transaction closed by the Company with Piccolo’s assistance (if any), and 30,000 options per year, with such options vesting in three equal annual installments on the first, second and third anniversaries of the first grant date. The Company paid Piccolo $25,000, $150,000, and $125,000 in the fiscal years ended September 30, 2014, 2013 and 2012, respectively. This agreement was not renewed, however, there are ongoing discussions for a new agreement.
NOTE T — SUMMARIZED QUARTERLY DATA (UNAUDITED)
| Quarter |
First Quarter |
Second Quarter |
Third Quarter |
Fourth Quarter |
Full Year |
|||||||||||||||
| 2014 (As Restated)(1) |
||||||||||||||||||||
| Total revenue |
$ | 7,427,000 | $ | 7,771,000 | $ | 8,259,000 | $ | 8,750,000 | $ | 32,207,000 | ||||||||||
| Income before income taxes |
2,194,000 | 126,000 | 7,680,000 | 1,042,000 | 11,042,000 | |||||||||||||||
| Net income attributable to Asta Funding, Inc. |
947,000 | 75,000 | 4,687,000 | 192,000 | 5,901,000 | |||||||||||||||
| Basic net income per share attributable to Asta Funding, Inc. |
$ | 0.07 | $ | 0.01 | $ | 0.36 | $ | 0.01 | $ | 0.45 | ||||||||||
| Diluted net income per share attributable to Asta Funding, Inc. |
$ | 0.07 | $ | 0.01 | $ | 0.35 | $ | 0.01 | $ | 0.45 | ||||||||||
| 2013 (As Revised) |
||||||||||||||||||||
| Total revenue |
$ | 9,672,000 | $ | 9,030,000 | $ | 11,259,000 | $ | 8,239,000 | $ | 38,200,000 | ||||||||||
| Income (loss) before income taxes |
4,224,000 | 2,725,000 | (5,612,000 | ) | 1,972,000 | 3,309,000 | ||||||||||||||
| Net income (loss) attributable to Asta Funding, Inc. |
2,488,000 | 1,599,000 | (3,369,000 | ) | 1,291,000 | 2,009,000 | ||||||||||||||
| Basic net income (loss) per share attributable to Asta Funding, Inc. |
$ | 0.19 | $ | 0.12 | $ | (0.26 | ) | $ | 0.10 | $ | 0.16 | |||||||||
| Diluted net income (loss) per share attributable to Asta Funding, Inc. |
$ | 0.19 | $ | 0.12 | $ | (0.26 | ) | $ | 0.10 | $ | 0.15 | |||||||||
| * | Due to rounding the sum of quarterly totals for earnings per share may not add to the yearly total. |
| (1) | The first three quarters of fiscal year 2014 have been restated. |
F-42
Table of Contents
ASTA FUNDING, INC. AND SUBSIDIARIES
Notes to Consolidated Financial Statements
September 30, 2014 and 2013
NOTE U — SEGMENT REPORTING
The Company operates through strategic business units that are aggregated into four reportable segments: Consumer receivables, Personal injury claims, structured settlements and disability advocacy. The four reportable segments consist of the following:
| • | Consumer receivables — segment is engaged in the business of purchasing, managing for its own account and servicing distressed consumer receivables, including charged off receivables, semi-performing receivables and performing receivables. The primary charged-off receivables are accounts that have been written-off by the originators and may have been previously serviced by collection agencies. Semi-performing receivables are accounts where the debtor is currently making partial or irregular monthly payments, but the accounts may have been written-off by the originators. Performing receivables are accounts where the debtor is making regular monthly payments that may or may not have been delinquent in the past. Distressed consumer receivables are the unpaid debts of individuals to banks, finance companies and other credit providers. A large portion of our distressed consumer receivables are MasterCard®, Visa® and other credit card accounts which were charged-off by the issuers or providers for non-payment. We acquire these and other consumer receivable portfolios at substantial discounts to their face values. The discounts are based on the characteristics (issuer, account size, debtor location and age of debt) of the underlying accounts of each portfolio. Litigation related receivables are semi-performing investments whereby the Company is assigned the revenue stream from the proceeds received. The business conducts its activities primarily under the name Palisades Collection, LLC. |
| • | Personal injury claims — Pegasus Funding, LLC , an 80% owned subsidiary, purchases interests in personal injury claims from claimants who are a party to personal injury litigation. Pegasus advances to each claimant funds on a non-recourse basis at an agreed upon interest rate, in anticipation of a future settlement. The interest in each claim purchased by Pegasus consists of the right to receive, from such claimant, part of the proceeds or recoveries which such claimant receives by reason of a settlement, judgment or award with respect to such claimant’s claim. |
| • | Structured settlements. On December 31, 2013, the Company purchased an 80% interest in CBC Settlement Funding, LLC. CBC purchases periodic structured settlements and annuity policies from individuals in exchange for a lump sum payment. |
| • | GAR Disability Advocates is a non-attorney advocacy group, which obtains and represents individuals nationwide in their claims for social security disability and supplemental security income benefits from the Social Security Administration. |
Certain non-allocated administrative costs, interest income, interest expense and various other non-operating income and expenses are reflected in Corporate. Corporate assets include cash and cash equivalents, available-for-sale securities, property and equipment, goodwill, deferred taxes and other assets.
F-43
Table of Contents
ASTA FUNDING, INC. AND SUBSIDIARIES
Notes to Consolidated Financial Statements
September 30, 2014 and 2013
NOTE U — SEGMENT REPORTING (CONTINUED)
| (Dollars in millions) |
Fiscal Year |
Consumer Receivables |
Personal Injury Claims |
Structured Settlements |
GAR Disability Advocates |
Corporate | Total Company |
|||||||||||||||||||||
| Revenues |
2014 | $ | 19.8 | $ | 7.2 | $ | 5.2 | $ | — | $ | — | $ | 32.2 | |||||||||||||||
| 2013 | 31.8 | 6.4 | — | — | — | 38.2 | ||||||||||||||||||||||
| 2012 | 40.8 | 1.6 | — | — | — | 42.4 | ||||||||||||||||||||||
| Other income |
2014 | 26.1 | — | — | 0.4 | 1.4 | 27.9 | |||||||||||||||||||||
| 2013 | — | — | — | — | 1.6 | 1.6 | ||||||||||||||||||||||
| 2012 | — | — | — | — | 2.3 | 2.3 | ||||||||||||||||||||||
| Income before income taxes |
2014 | 18.9 | 2.3 | 0.4 | (2.7 | ) | (7.9 | ) | 11.0 | |||||||||||||||||||
| 2013 | 10.1 | 2.0 | — | (1.2 | ) | (7.6 | ) | 3.3 | ||||||||||||||||||||
| 2012 | 23.1 | 0.1 | — | — | (6.4 | ) | 16.8 | |||||||||||||||||||||
| Total assets |
2014 | 30.5 | 34.0 | 38.5 | 1.0 | 113.1 | 217.1 | |||||||||||||||||||||
| 2013 | 65.4 | 36.8 | — | 0.2 | 109.1 | 211.5 | ||||||||||||||||||||||
| 2012 | 96.3 | 21.5 | — | — | 119.8 | 237.6 | ||||||||||||||||||||||
| Capital expenditures |
2014 | — | — | — | — | — | — | |||||||||||||||||||||
| 2013 | — | — | — | — | 0.7 | 0.7 | ||||||||||||||||||||||
| 2012 | — | — | — | — | 0.6 | 0.6 | ||||||||||||||||||||||
| Depreciation |
2014 | — | — | — | — | 0.4 | 0.4 | |||||||||||||||||||||
| 2013 | — | — | — | — | 0.4 | 0.4 | ||||||||||||||||||||||
| 2012 | — | — | — | — | 0.4 | 0.4 | ||||||||||||||||||||||
The Company does not have any intersegment revenue transaction.
NOTE V — SUBSEQUENT EVENTS
On October 9, 2014, the Company purchased $5.0 million of shares in the Topaz MP Fixed Income Fund, a specialized fund that will invest in portfolios of small non-performing consumer loans originated in Italy.
On November 26, 2014, CBC announced the completion of its fourth private placement, backed by structured settlement and fixed annuity payments. CBC issued, through its subsidiary, BBR IV, LLC, approximately $20.8 million of fixed rate asset-backed notes with a yield of 5.4% (see Note J — Other Debt — CBC).
On March 11, 2015, CBC entered into the Ninth Amendment. This amendment, effective March 1, 2015, extended the maturity date from February 28, 2015 to March 1, 2017. Additionally, the credit line was increased from $22.0 million to $25.0 million and the interest rate floor was decreased from 4.75% to 4.1%. Other terms and conditions are materially unchanged (see Note J — Other Debt — CBC).
F-44
Table of Contents
SIGNATURES
Pursuant to the requirements of Section 13 or 15(d) of the Exchange Act, the Registrant caused this report to be signed on its behalf by the undersigned, thereunto duly authorized.
| ASTA FUNDING, INC. | ||
| By: | /s/ Gary Stern | |
| Gary Stern | ||
| President and Chief Executive Officer | ||
| (Principal Executive Officer) | ||
Dated: June 29, 2015
Pursuant to the requirements of the Exchange Act, this report has been signed below by the following persons on behalf of the Registrant and in the capacities and on the dates indicated:
| Signature |
Title |
Date | ||
| /s/ Gary Stern Gary Stern |
Chairman of the Board, President, and Chief Executive Officer |
June 29, 2015 | ||
| /s/ Robert J. Michel Robert J. Michel |
Chief Financial Officer (Principal Financial Officer and Accounting Officer) |
June 29, 2015 | ||
| /s/ Arthur Stern Arthur Stern |
Chairman Emeritus and Director | June 29, 2015 | ||
| /s/ Edward Celano Edward Celano |
Director | June 29, 2015 | ||
| /s/ Harvey Leibowitz Harvey Leibowitz |
Director | June 29, 2015 | ||
| /s/ David Slackman David Slackman |
Director | June 29, 2105 | ||
| /s/ Louis A. Piccolo Louis A. Piccolo |
Director | June 29, 2015 | ||