Attached files
| file | filename |
|---|---|
| EX-31.2 - EX-31.2 - Bazaarvoice Inc | d929871dex312.htm |
| EX-31.1 - EX-31.1 - Bazaarvoice Inc | d929871dex311.htm |
| EX-23.1 - EX-23.1 - Bazaarvoice Inc | d929871dex231.htm |
| EX-32.1 - EX-32.1 - Bazaarvoice Inc | d929871dex321.htm |
| EX-32.2 - EX-32.2 - Bazaarvoice Inc | d929871dex322.htm |
| EX-10.27 - EX-10.27 - Bazaarvoice Inc | d929871dex1027.htm |
| EX-10.26 - EX-10.26 - Bazaarvoice Inc | d929871dex1026.htm |
Table of Contents
UNITED STATES
SECURITIES AND EXCHANGE COMMISSION
Washington, D.C. 20549
FORM 10-K
| x | ANNUAL REPORT PURSUANT TO SECTION 13 OR 15(d) OF THE SECURITIES EXCHANGE ACT OF 1934 |
For the fiscal year ended April 30, 2015
OR
| ¨ | TRANSITION REPORT PURSUANT TO SECTION 13 OR 15(d) OF THE SECURITIES EXCHANGE ACT OF 1934 |
Commission File Number 001-35433
Bazaarvoice, Inc.
(Exact name of registrant as specified in its charter)
| Delaware | 20-2908277 | |
| (State or other jurisdiction of incorporation or organization) |
(I.R.S. Employer Identification Number) |
3900 N. Capital of Texas Highway, Suite 300
Austin, Texas 78746-3211
(512) 551-6000
(Address, including zip code, and telephone number, including area code, of registrant’s principal executive offices)
Securities registered pursuant to Section 12(b) of the Act:
| Title of each class |
Name of each exchange on which registered | |
| Common Stock, par value $0.0001 per share | The NASDAQ Global Select Market LLC |
Securities registered pursuant to Section 12(g) of the Act:
None
Indicate by check mark if the registrant is a well-known seasoned issuer, as defined in Rule 405 of the Securities Act. Yes ¨ No x
Indicate by check mark if the registrant is not required to file reports pursuant to Section 13 or Section 15(d) of the Act. Yes ¨ No x
Indicate by check mark whether the registrant (1) has filed all reports required to be filed by Section 13 or 15(d) of the Securities Exchange Act of 1934 during the preceding 12 months (or for such shorter period that the registrant was required to file such reports), and (2) has been subject to such filing requirements for the past 90 days. Yes x No ¨
Indicate by check mark whether the registrant has submitted electronically and posted on its corporate Web site, if any, every Interactive Data File required to be submitted and posted pursuant to Rule 405 of Regulation S-T (§ 232.405 of this chapter) during the preceding 12 months (or for such shorter period that the registrant was required to submit and post such files). Yes x No ¨
Indicate by check mark if disclosure of delinquent filers pursuant to Item 405 of Regulation S-K (§ 229.405 of this chapter) is not contained herein, and will not be contained, to the best of registrant’s knowledge, in definitive proxy or information statements incorporated by reference in Part III of this Form 10-K or any amendment to this Form 10-K. x
Indicate by check mark whether the registrant is a large accelerated filer, an accelerated filer, a non-accelerated filer, or a smaller reporting company. See the definitions of “large accelerated filer,” “accelerated filer” and “smaller reporting company” in Rule 12b-2 of the Exchange Act.
| Large accelerated filer | ¨ | Accelerated filer | x | |||
| Non-accelerated filer | ¨ (Do not check if a smaller reporting company) | Smaller reporting company | ¨ |
Indicate by check mark whether the registrant is a shell company (as defined in Rule 12b-2 of the Act). Yes ¨ No x
Based on the closing price of the Registrant’s Common Stock on the last business day of the Registrant’s most recently completed second fiscal quarter, which was October 31, 2014, the aggregate market value of its shares (based on a closing price of $7.45 per share) held by non-affiliates was approximately $448 million. Shares of the Registrant’s Common Stock held by each executive officer and director and by each entity or person that controls, is controlled by, or is under common control of the Registrant were excluded in that such entities or persons may be deemed to be affiliates. This determination of affiliate status is not necessarily a conclusive determination for other purposes.
As of June 17, 2015, 80,230,018 shares of the registrant’s Common Stock were outstanding.
Documents incorporated by reference:
Certain portions, as expressly described in this Annual Report on Form 10-K, of the registrant’s Proxy Statement for the 2015 Annual Meeting of the Stockholders, to be filed within 120 days of April 30, 2015, are incorporated by reference into Part III, Items 10-14.
Table of Contents
1
Table of Contents
Special Note Regarding Forward Looking Statements
Forward-looking statements may be identified by the use of forward-looking words such as “anticipate,” “believe,” “may,” “will,” “continue,” “seek,” “estimate,” “intend,” “hope,” “predict,” “could,” “should,” “would,” “project,” “plan,” “expect” or the negative or plural of these words or similar expressions, although not all forward-looking statements contain these words. Statements that contain these words should be read carefully because they discuss our future expectations, contain projections of our future results of operations or of our financial position, or state other forward-looking information. These forward-looking statements include, but are not limited to, statements concerning the following:
| • | our ability to develop and launch new products; |
| • | our ability to retain clients and satisfy their obligations and needs and upsell to existing clients; |
| • | our ability to maintain pricing for our products and services; |
| • | our ability to attract new clients and launch without delays; |
| • | our ability to increase adoption of our platforms by our clients’ internal and external users; |
| • | our ability to protect our users’ information and adequately address security and privacy concerns; |
| • | our ability to maintain an adequate rate of growth; |
| • | our ability to effectively execute and adapt our business model in a dynamic market; |
| • | our future expenses; |
| • | our ability to expand our network; |
| • | our ability to integrate clients, employees and operations of acquired companies into our business; |
| • | our ability to earn revenue based on ads that are served on our network; |
| • | our ability to timely and effectively scale and adapt our existing technology and network infrastructure; |
| • | our plan to continue investing in long-term growth and research and development, enhancing our platforms and pursuing strategic acquisitions of complementary businesses and technologies to drive future growth; |
| • | our ability to increase engagement of our solutions by our clients, partners and professional organizations and launch those solutions without delay; |
| • | our anticipated trends of our operating metrics and financial and operating results; |
| • | the effects of increased competition and commoditization of products we offer, including pricing pressure, reduced profitability or loss of market share; |
| • | our ability to effectively manage our growth and control expenses as we see to achieve profitability; |
| • | our ability to successfully enter new markets and manage our international expansion; |
| • | our ability to maintain, protect and enhance our brand and intellectual property; |
| • | the attraction and retention of qualified employees and key personnel; |
| • | our expectations regarding the outcome of litigation proceedings; and |
| • | other risk factors included under “Risk Factors” in this Annual Report on Form 10-K. |
For a discussion of factors that could cause actual results to differ materially from our forward-looking statements, see the discussion on risk factors that appears in Part I, Item 1A: “Risk Factors” of this Annual Report on Form 10-K and other risks and uncertainties detailed in this and our other reports and filings with the Securities and Exchange Commission (“SEC”). The forward-looking statements in this Annual Report on
2
Table of Contents
Form 10-K represent our views as of the date of this Annual Report on Form 10-K. We anticipate that subsequent events and developments may cause our views to change. However, while we may elect to update these forward-looking statements at some point in the future, we have no current intention of doing so except to the extent required by applicable law. You should, therefore, not rely on these forward-looking statements as representing our views as of any date subsequent to the date of this Annual Report on Form 10-K.
3
Table of Contents
| Item 1. | Business |
Overview
We power a network that connects brands and retailers to the authentic voices of people where they shop. Bazaarvoice was founded on the premise that the collective voice of the marketplace is the most powerful marketing tool in the world because of its influence on purchasing decisions, both online and offline. Our technology platform collects, curates, and displays consumer-generated content including ratings and reviews, questions and answers, customer stories, and social posts, photos, and videos. This content is amplified across marketing channels, including category/product pages, search, brand sites, mobile applications, in-store displays, and paid and earned media, where it helps clients generate more revenue, market share, and brand affinity. We also help clients leverage insights derived from consumer-generated content to improve marketing effectiveness, increase success of new product launches, improve existing products and services, effectively scale customer support, decrease product returns, reach consumers when actively shopping via highly targeted audience marketing, and enable retailers to launch and manage on-site advertising solutions and site monetization strategies.
Word of mouth influences consumers’ decisions to purchase products and services. Consumers often trust and rely on what other consumers say about a brand, product, or service, particularly if they consider the content to be authentic and credible. Consumer interaction through the social web has significantly increased the volume and availability of online consumer-generated content about products and services, which is proven to have a significant and growing influence on both online and offline commerce. The rapid adoption of Internet-enabled mobile devices is further amplifying the impact of online consumer-generated content by making this content even easier, more convenient, and faster to generate and access. As a result, there has been a paradigm shift in marketing in response to this “connected economy” in which shared, collaborative relationships are networked between businesses, clients, and other influencers. Traditional methods are being disrupted and businesses are now seeking solutions that embrace online consumer-generated content to more effectively engage, influence, and tap into the collective power of consumers, who we believe are no longer seen as mere “buyers” but innovators, trendsetters, and advocates.
Our solutions, which are primarily provided via a Software as a Service (“SaaS”) platform, enable clients to:
| • | capture and display consumer-generated content, such as online ratings and reviews, about specific products and services; |
| • | channel consumer-generated content into all the places where it will influence a purchase both within and outside our network; and |
| • | use business insights so they can act on what consumers want. |
Our business model focuses on maximizing the lifetime value of a client relationship. We make significant investments in acquiring new clients and believe that we will be able to achieve a favorable return on these investments by growing our relationships over time and ensuring that we have a high level of client retention.
On June 12, 2012, we acquired PowerReviews, Inc. (“PowerReviews”), a provider of social commerce solutions, for a total cash and stock purchase price of $150.8 million. On January 8, 2014, the U.S. District Court for the Northern District of California, San Francisco Division (the “Court”) ruled, in connection with a complaint filed by the U.S. Department of Justice (the “DOJ”), that our acquisition of PowerReviews violated Section 7 of the Clayton Act, 15 U.S.C. Section 18. On April 24, 2014, we entered into a Joint Stipulation with the DOJ to resolve the DOJ’s claims in the antitrust action and, together with the DOJ, we submitted a proposed order to the Court (the “Order”). Under the terms of the Joint Stipulation and the Order, on June 4, 2014, we entered into a definitive agreement to divest all of the assets of PowerReviews, LLC, the successor to PowerReviews, to Wavetable Labs, LLC (“Wavetable”) for $30.0 million in cash, $4.5 million of which remains
4
Table of Contents
held in escrow as partial security for our indemnification obligations under the definitive agreement and is set to expire in July 2015. The terms of this transaction were approved by the DOJ on June 26, 2014, and the transaction was completed on July 2, 2014. Wavetable subsequently changed its name to PowerReviews. As a result of the foregoing, PowerReviews revenues, related expenses and loss on disposal, net of tax, are components of “loss from discontinued operations, net of tax” in the consolidated statement of operations for all periods presented. On the consolidated balance sheets, the assets and liabilities of the discontinued operations of PowerReviews have been presented as ‘Assets held for sale’ and ‘Liabilities held for sale,’ respectively, as of April 30, 2014. The statement of cash flows is reported on a combined basis without separately presenting cash flows from discontinued operations. The discussion of our results of operations is based upon the results from our continuing operations unless otherwise indicated.
We were incorporated in the State of Delaware in May 2005. Our principal executive offices are located at 3900 N. Capital of Texas Highway, Suite 300, Austin, Texas 78746-3211, and our telephone number is (512) 551-6000. Our corporate website address is www.bazaarvoice.com. We do not incorporate the information contained on, or accessible through, our website into this Annual Report on Form 10-K. We completed our initial public offering in February 2012 and our common stock is listed on the National Association of Securities Dealers Automated Quotations (“NASDAQ”) Global Select Market under the symbol “BV.” Unless the context requires otherwise, the words “Bazaarvoice,” “Company,” “we,” “us” and “our” refer to Bazaarvoice, Inc. and its wholly owned subsidiaries.
Our Platforms and Solutions
Bazaarvoice Conversations Platform
Our Conversations platform provides capabilities to capture, manage and display online consumer-generated content. Consumers interact with our solutions as they view or author consumer reviews, questions, photos, videos, long-format narratives and other forms of consumer-generated content. Content that is displayed by our Conversations platform is styled to match our clients’ brand, preserving important branding elements of our clients’ businesses.
Content collected and managed by our Conversations platform is used by our clients in a wide range of applications, including their online websites, mobile-optimized websites, mobile applications, social networks, in-store kiosks, physical in-store displays, printed flyers, email and other forms of online and offline media.
Key products and features of our Conversations platform include:
| • | Ratings & Reviews. Allows our clients to capture, manage and display consumer reviews about their products and services on their websites and mobile-optimized websites. |
| • | Questions & Answers. Allows our clients to facilitate question and answer conversations between consumers, or between consumers and brand representatives, on their websites. |
| • | Syndication. Enables brands to display review content from their brand websites on retail websites within our network. |
| • | Product Sampling. Allows brands and retailers to build their very own branded community to engage their advocates to gain content and momentum for new products, seasonal launches or across a portfolio. |
| • | Seller Ratings. Provides clients the ability to solicit and collect reviews about their company. Seller ratings are based on reviews about customers’ online experiences with the client’s company. Seller Reviews are collected by us on behalf of the client via e-mail solicitation. Once submitted, the Seller Reviews are displayed on our public-facing website as well as third-party sites and can also be syndicated to the clients’ website. |
5
Table of Contents
| • | Intelligence. Allows our clients to derive sophisticated market, consumer and product insights in a timely manner from the underlying data we collect on their behalf through our platform. Intelligence enables our clients to analyze structured and unstructured online word of mouth and to correlate this content with consumer profiles and demographic information. |
| • | Workbench Analytics. Provides basic analytics capabilities that allow our clients to generate reports highlighting simple ratings trends, text analysis and product and service issue identification. Workbench Analytics also allows clients to perform self-service administration. |
| • | Applications for Facebook. Enables consumers to read or write reviews, product questions, product answers or stories on our clients’ pages on social networking websites and easily share this content with the people they influence the most – their social network friends or followers. |
| • | Third-party Developer Application Programming Interface (“API”). Provides third-party developers with tools to build products or extend our platform on behalf of our clients, which enables us to expand the use of our platform by leveraging applications built by third-party developers. For example, some agencies use our developer APIs to develop applications for our clients’ brands that allow consumers to read reviews via touchscreen displays while shopping in stores or via their mobile devices while traveling. |
Bazaarvoice Connections Solutions
Our Conversations clients are connected through our SaaS platform to form a network. We offer network syndication and brand engagement solutions to facilitate the sharing of online word of mouth among our clients and to enable brands to directly interact with consumers on our retail clients’ websites.
| • | BrandAnswers. Enables brands to interact directly with consumers on retail websites within our network to answer questions and provide suggestions on alternative products that may better meet that consumer’s needs. Brands gain visibility into all questions and answers about their products on retail websites that participate in our distribution relationships. |
| • | Review Response: Enables brands to interact with consumers by responding to reviews posted on retail websites within our network. Brands strengthen their affinity with consumers by demonstrating that they are listening to and acting on consumer feedback gathered in the retail channel. |
Bazaarvoice Local
Helps clients gather and promote reviews of local service affiliates, drive customers to such local preferred service affiliates by improving search engine optimization capabilities and gain insight to the performance of such local service affiliates.
Bazaarvoice Curations
Bazaarvoice Curations pulls in content from across a wide variety of social platforms, including Instagram, Facebook and Twitter. Clients can then organize and display photos, videos, text and links that leverage social content throughout their site.
Bazaarvoice Media
Bazaarvoice Media sells advertising on behalf of retailers thereby helping brands and agencies market to shopper audiences. BV Media also provides capabilities that incorporate consumers’ authentic word of mouth in advertising campaigns, creating advertisements that are trusted, relevant and targeted.
| • | Shopper Media. Bazaarvoice Media has partnerships with major retail digital sites (desktop & mobile) to sell on their behalf, utilizing our relationships and knowledge of the intricacies of the retail environment to best represent them to the brand marketing channels. |
6
Table of Contents
| • | Brand Marketing Channels. Bazaarvoice sells to brand marketing departments, shopper marketing agencies and media agencies. We develop custom programs for brands to reach consumers while they are in the shopping environment. We also sell to non-retail brands, such as within the automotive and financial industries that wish to reach the engaged shopper. |
| • | Word of Mouth Advertisements. Provides brands with the ability to increase engagement with their advertising through the inclusion of authentic consumer sentiment. These “word of mouth” ad units can be used both on the Shopper Media network and throughout the web. |
| • | Mobile Advertising. Bazaarvoice’s advertising solution enables brands to reach consumers on their mobile devices. |
Our Growth Strategy
The following are key elements of our growth strategy:
Grow our global client base and further penetrate industry verticals.
We believe that our platforms provide significant value for retailers and brands of all sizes. As a result, we expect to continue to add new accounts globally and expand our network. Moreover, we plan to further penetrate our current industry verticals and expand into additional verticals. We believe companies in various verticals can benefit from utilizing our platform to better understand consumers.
Increase brand penetration and sell new solutions to our existing clients.
We believe that we have a significant opportunity to build on relationships with existing clients, including some of the leading companies in the world. Many of our clients sell products through numerous distinct brands. We have the opportunity to expand our relationship with these clients by deploying our solutions for some or all of their other brands.
Most of our clients use only a subset of the solutions available in our platforms. We believe that we have a significant opportunity to sell other solutions, including current and planned offerings from Bazaarvoice Media, to our existing clients as well as to new clients.
Increase the volume and variety of content across our network and help clients derive greater consumer insights.
We plan to continue to aggregate an increasing volume and variety of online consumer-generated content and other relevant data across our network. In turn, we expect that consumers will have access to a greater amount of relevant online consumer-generated content to inform their purchase decisions anywhere, including in store and mobile. We plan to enhance our clients’ ability to analyze the aggregated data by introducing new analytics capabilities to help our clients derive meaningful insights from consumer data across our network. We also intend to help our clients act on these unique shopping insights with highly targeted marketing solutions in the future.
Continue to make investments to improve client satisfaction.
We plan to continue to make investments into our worldwide client services in an effort to improve the quality of our client’s experience with our solutions and thus improve client retention. We believe that our ability to retain our active clients and expand their use of our solutions over time is an indicator of the long-term value of our client relationships.
7
Table of Contents
Continue to broaden our platform’s capabilities through innovation.
We view investments in research and development to be an integral part of our strategy. Our research and development efforts are principally focused on improving our software architecture to make our development efforts more efficient and cost-effective and adding new solutions to our platform to enhance our value proposition to existing and prospective clients. We are also developing new solutions that will enable us and our clients to more effectively leverage our network reach and the data we collect.
Pursue selective acquisitions and commercial relationships.
We may pursue selective acquisitions of complementary businesses and technologies that will enable us to acquire targeted product and technology capabilities. From time to time, we also may enter into commercial relationships with internet and social media businesses if we believe this will benefit our clients.
Our Clients
Beginning as of our fourth quarter of fiscal year 2014, we define an active client as an organization from which we are currently recognizing recurring revenue. We count organizations that are closely related as one active client, even if they have signed separate contractual agreements. We believe that our ability to increase our active client base is a leading indicator of our ability to grow revenue.
Due to the presentation of the PowerReviews business as discontinued operations, the number of active clients we disclose are from continuing operations only. As a result, our disclosure of active clients could include a common client for which we recognized recurring revenue who has organizations that have separate contractual agreements.
All periods prior to the fourth quarter of fiscal 2014 have been revised to conform to this definition of an active client from continuing operations.
As of April 30, 2015, we served 1,353 active clients from continuing operations, including clients in the retail, consumer products, travel and leisure, technology, telecommunications, financial services, healthcare and automotive industries. No single client represented more than 10.0% of our revenue for the year ended April 30, 2015.
We define a network client as an organization that does not have recurring revenue. We count organizations that are closely related as one network client, even if they have signed separate contractual agreements. We believe that our network client base in combination with our active client base is an indicator of the reach of our network. As of April 30, 2015, the number of network clients was over 3,800.
Sales and Marketing
We sell our solutions through our direct sales team located globally in the markets we serve. Our sales cycle can vary substantially from client to client but typically requires three to 12 months. In addition to focusing on new client sales, our sales directors are also focused on selling additional solutions to our existing clients.
Our marketing efforts are intended to build the corporate brand, support lead generation, provide sales support, and penetrate new markets. Our marketing efforts include:
| • | participation in, and sponsorship of, user conferences, trade shows, and industry events; |
| • | online marketing activities, including social advertising, search engine marketing, search engine optimization, webinars, email campaigns, our company website, and our Bazaarvoice Blog; |
| • | corporate communications activities including proactive and reactive media relations, analyst relations, social media, executive speaking engagements, customer reference program, and awards; |
8
Table of Contents
| • | informational resources development to educate prospective clients on the evolving nature of marketing and business, including white papers, client case studies, and in-person demonstrations; |
| • | sales resources development; and |
| • | industry partnership and business development programs. |
We also host an annual Bazaarvoice Summit for current and prospective clients, along with social strategists, to share insights into the industry and results from social initiatives. The event features a variety of speakers, including Bazaarvoice executives, clients, and industry thought leaders. The Bazaarvoice Summit also features training, solutions demonstrations, and best practice sharing with the goal to expand Bazaarvoice’s presence within existing accounts and sign new clients. In addition, we host a number of regional user groups.
Worldwide Client Services
Our Worldwide Client Services team is responsible for managing all client activity after clients purchase our solutions. With locations in the markets we serve, our team is divided into four broad functions:
| • | Client Onboarding – strategic consultants, implementation project managers, implementation engineers and user interface designers responsible for the solution design, implementation, and launch of Bazaarvoice solutions on clients’ websites; |
| • | Client Success – a team of client success professionals who provide consulting, account management, and support for program best practices and strategic success plans to drive tangible business results in a scalable manner. The Client Success team leads the renewals of our clients’ agreements with us; |
| • | Client Support – consists of support professionals who provide generalized client support for a variety of issues as well as the more traditional technical support services to diagnose and correct technical issues, deliver new production releases and respond to configuration change requests for our clients; and |
| • | User Generated Content Services – content moderators who review and moderate user generated review content across multiple languages and authenticity analysts who use internet forensics techniques to detect fraudulent reviews and validate authentic reviews. |
Our enterprise license agreements with our clients include software updates and specific levels of onboarding, and client retention/renewal services. However, under these license agreements, major functional updates or enhancements may, at our discretion, be considered new solutions that will be made available to our clients at an additional charge.
Research and Development
Our research and development team is responsible for the design, development, maintenance and operation of our technology solutions. Our research and development process emphasizes frequent, iterative and incremental development cycles, enabling us to incorporate client feedback while maintaining a high standard of quality. Within the research and development team, we have several highly aligned, independent sub-teams that focus on particular capabilities of our solutions. Each of these sub-teams includes product managers, designers, developers and quality assurance engineers responsible for the initial and ongoing development of their solution capability. In addition, the research and development team includes our production operations team, which is responsible for platform uptime.
We believe that continued investment in research and development is critical to the future success of our business. Historically, we have made substantial investments in research and development, and we plan to continue doing so in order to further differentiate ourselves from our competitors. In addition, we augment our full-time research and development staff with offshore third-party contractors located in Ukraine and India. Our research and development expenses were $37.7 million, $37.6 million and $32.2 million in fiscal years 2015, 2014 and 2013, respectively.
9
Table of Contents
Competition
The market for social commerce solutions is highly competitive. The competitive dynamics of our market are unpredictable because it is rapidly evolving, fragmented and subject to potential disruption by new technological innovations.
We believe the principal competitive factors in our market include the following:
| • | product breadth and functionality; |
| • | scope, quality and breadth of client base; |
| • | amount and quality of content; |
| • | service; |
| • | price; |
| • | reputation; and |
| • | operating model efficiency. |
We believe that we compete favorably on the factors described above. We compete primarily against traditional marketing and advertising programs. Many businesses remain hesitant to embrace social commerce solutions, such as ratings and reviews, driven by their reluctance to display negative reviews about their brands, products or services or about other brands displayed on their websites. Additionally, some businesses have developed, or may develop in the future, social commerce solutions internally. These businesses may consider their internal solutions adequate, even if our solutions are superior.
We have several direct and indirect competitors across the regions we serve that provide third-party social commerce solutions, including but not limited to companies such as PowerReviews (formerly named Wavetable), Olapic, Pluck, Reevoo, eKomi, Yotpo, Rating System and Gigya. As a result of our divestiture of the PowerReviews business and the court-ordered terms associated with that divestiture, our competition with PowerReviews has increased. Additionally, we face potential competition from participants in adjacent markets that may enter our markets by leveraging related technologies and partnering with other companies.
We may also face competition from companies entering our market, including large Internet companies like Amazon, Google and Facebook, which could expand their platforms or acquire one or more of our competitors. While these companies do not currently focus on our market, they have significantly greater financial resources and, in the case of Amazon and Google, a longer operating history. They may be able to devote greater resources to the development and improvement of their services than we can and, as a result, they may be able to respond more quickly to technological changes and clients’ changing needs. Because our market is changing rapidly, it is possible that new entrants, especially those with substantial resources, more efficient operating models, more rapid product development cycles or lower marketing costs, could introduce new solutions that disrupt the manner in which businesses use online consumer-generated content and engage with consumers online to address the needs of our clients and potential clients. Our business and operating results could be harmed if any such disruption occurs.
We cannot be certain that these competitors, both current and potential, will not offer or develop services that are considered superior to ours or that services other than ours will attain greater market acceptance.
Our Culture
We consider our people and our culture to be a key differentiator for Bazaarvoice. As such, we invest in our people to drive high performance throughout the organization. We focus on communicating to build engagement and alignment around our strategy; creating a unique and competitive culture; attracting and hiring top talent; developing key capabilities around sales, services, R&D and leadership; and rewarding and recognizing high performance.
10
Table of Contents
In particular, our culture gives us a competitive advantage in recruiting and retaining talent and is built upon the following fundamental beliefs:
| • | We believe in delighting our customers – we are passionate about making a difference for our clients – among which are some of the most influential customers on the planet |
| • | We believe in doing what matters – we have a mission that inspires and gives us purpose |
| • | We believe in our seven values – performance, passion, innovation, authenticity, respect, teamwork and generosity |
| • | We believe in the power of people coming together – we are stronger and smarter together |
Technology Infrastructure & Operations
We have invested extensively in developing our proprietary technology infrastructure to support the growth of our business. Our proprietary technology infrastructure includes a third-party data center, cloud computing and network management, a secure centralized source control management system and proprietary data analytics.
Maintaining the integrity and security of our technology infrastructure is critical to our ability to provide online consumer-generated content, and we have a dedicated security team that promotes industry best practices and drives compliance with data security standards. We use encryption technologies and certificates for secure transmission of personal information between consumers and our solutions.
Our technology infrastructure has the ability to handle sudden bursts of activity for users over a short period of time with high levels of performance and reliability. We operate at a scale that routinely delivers more than 600 million content impressions per day with peak activity of over 2 billion impressions per day.
Key elements of our technology infrastructure are described below.
| • | Scalable Infrastructure. Our physical network infrastructure utilizes multiple hosted and cloud data centers linked with a high speed virtual private network. We utilize commodity hardware together with cloud infrastructure, and our architecture is designed for high availability and fault tolerance while accommodating the demands of our service utilization. |
| • | Cloud Computing Innovation. We have developed our architecture to work effectively in a flexible cloud environment that has a high degree of automated elasticity together with high levels of availability. |
Intellectual Property
Our intellectual property includes our patent applications, registered and unregistered trademarks and registered domain names. We believe that our intellectual property is an essential asset of our business and that our technology infrastructure currently gives us a competitive advantage. We rely on a combination of trademark, copyright and trade secret laws in the United States and the European Union, as well as contractual provisions, to protect our proprietary technology and assets. We currently have trademarks registered in the United States for our name and certain of the words and phrases that we use in our business. We also rely on copyright laws to protect software relating to our websites and our proprietary technologies, although we have not yet registered for copyright protection. We have registered numerous Internet domain names related to our business in order to protect our proprietary interests. As of April 30, 2015, we had seven issued U.S. patents and 23 pending U.S. non-provisional patent applications. We also enter into confidentiality agreements with our employees and consultants and seek to control access to and distribution of our proprietary information in a commercially prudent manner.
The efforts we have taken to protect our intellectual property may not be sufficient or effective. Third-parties may infringe upon or misappropriate our proprietary rights. Despite our efforts, other parties may copy or otherwise obtain and use the content of our websites without authorization. We may be unable to prevent
11
Table of Contents
competitors from acquiring domain names or trademarks that are similar to, infringe upon or diminish the value of our domain names, trademarks, service marks and our other proprietary rights. Competitors may also independently develop technologies that are substantially equivalent or superior to the technologies we employ in our solutions. Failure to protect our proprietary rights adequately could significantly harm our competitive position and operating results.
In addition, we license third-party technologies that are incorporated into some elements of our solutions. Licenses of third-party technologies may not continue to be available to us at a commercially reasonable cost or at all.
Companies in the internet and technology industries, and other patent, copyright and trademark holders own large numbers of patents, copyrights, trademarks and trade secrets and frequently threaten or enter into litigation based on claims of infringement or other violations of intellectual property rights. We have received in the past, and may receive in the future, notices that claim we have misappropriated or misused other parties’ intellectual property rights. There may be intellectual property rights held by others, including issued or pending patents, copyrights and trademarks, that cover significant aspects of our technologies, content, branding or business methods. Any intellectual property claim against us, regardless of merit, could be time-consuming and expensive to settle or litigate and could divert our management’s attention and other resources. These claims also could subject us to significant liability for damages and could result in our having to stop using technology, content, branding or business methods found to be in violation of another party’s rights. We might be required or may opt to seek a license for rights to intellectual property held by others, which may not be available on commercially reasonable terms, or at all. Even if a license is available, we could be required to pay significant royalties, which would increase our operating expenses. We may also be required to develop alternative non-infringing technology, content, branding or business methods, which could require significant effort and expense and make us less competitive in the social commerce market. If we cannot license or develop technology, content, branding or business methods for any allegedly infringing aspect of our business, we may be unable to compete effectively.
Employees
As of April 30, 2015, we had 826 full-time employees. We consider our current relationship with our employees to be good. None of our employees are represented by a labor union or is a party to a collective bargaining agreement.
Information about Segment and Geographic Revenue
Information about segment and geographic revenue is set forth in Note 18 of the Notes to Consolidated Financial Statements under Item 8: “Financial Statements and Supplementary Data” of this Annual Report on Form 10-K.
Available Information
Our internet website address is www.bazaarvoice.com. In addition to the information about us and our subsidiaries contained in this Annual Report on Form 10-K, information about us can be found on our website including information on our corporate governance principles. Our website and information contained on or accessible through our website are not part of this Annual Report on Form 10-K.
Our annual reports on Form 10-K, quarterly reports on Form 10-Q, current reports on Form 8-K and amendments to those reports filed or furnished pursuant to Section 13(a) or 15(d) of the Securities Exchange Act of 1934, as amended, are available free of charge through our website as soon as reasonably practicable after they are electronically filed with or furnished to the SEC. The public may read and copy the materials we file with the SEC at the SEC’s Public Reference Room at 100 F Street, NE, Washington, DC 20549. The public may obtain information on the operation of the Public Reference Room by calling the SEC at 1-800-SEC-0330. Additionally the SEC maintains an internet site that contains reports, proxy and information statements and other information. The address of the SEC’s website is www.sec.gov.
12
Table of Contents
| Item 1A. | Risk Factors |
Our management team may not be able to execute our business plan. Changes to our management team may cause uncertainty regarding the future of our business and may adversely impact employee hiring and retention, our stock price, and our revenue, operating results, and financial condition.
Our management team has worked together at the Company for only a limited period of time and has a limited track record of executing our business plan as a team. In addition, we have recently filled a number of positions in our senior management. Accordingly, certain key personnel have only recently assumed the duties and responsibilities they are now performing, and it is difficult to predict whether our management team, individually and collectively, will be effective in operating our business. These changes may cause speculation and uncertainty regarding our future business strategy and direction and may cause or result in:
| • | disruption of our business or distraction of our employees and management; |
| • | difficulty in recruiting, hiring, motivating and retaining talented and skilled personnel; |
| • | stock price volatility; and |
| • | difficulty in negotiating, maintaining or consummating business or strategic relationships or transactions. |
If we are unable to mitigate these or other potential risks, our revenue, operating results and financial condition may be adversely impacted.
Our quarterly financial results are subject to fluctuations; as a result, we could fail to meet or exceed expectations of analysts or investors, which could cause our stock price to decline.
Our revenue, expenses, operating results and cash flows have fluctuated from quarter to quarter in the past and are likely to continue to do so in the future. These fluctuations are due to, or may in the future result from, many factors, some of which are outside of our control, including:
| • | our ability to sell additional solutions, including our media solutions, to existing clients and to add new clients, in multiple regions around the world, particularly in the United States and Europe, which has fluctuated and is likely to continue to fluctuate, due to the effectiveness of our sales execution, general economic conditions, increased competition, the timing of larger sales opportunities and other factors affecting our sales in each of these regions; |
| • | changes in our active client retention rates; |
| • | the timing and success of new solutions, product and service offerings and pricing policies by us or our competitors or any other changes in the competitive dynamics of our industry; |
| • | the amount, timing and effectiveness of our product development investments and related expenses and delays in generating revenue from these new solutions; |
| • | our ability to adjust our cost structure, particularly our personnel costs, in response to reductions in revenue; |
| • | our failure to achieve the growth rate that was anticipated by us in setting our operating and capital expense budgets; |
| • | the timing differences between when we incur sales commissions, implementation costs and other client acquisition costs associated with new solutions sales and when we generate revenue from these sales, particularly related to larger sales to new or existing clients; |
| • | our ability, and the ability of our clients, to timely and effectively implement our solutions; |
| • | increases in our hosting costs, which could result in advance payments to our hosting vendors, due to variations in demand for storage capacity and computing consumption without a corresponding increase in pricing to our existing clients; |
13
Table of Contents
| • | the timing, frequency and pattern of our billing mix; |
| • | the cyclical and discretionary nature of marketing and advertising spending, especially spending on social commerce solutions and targeted social commerce campaigns; |
| • | seasonal variations and unpredictability in our clients’ advertising budgets; |
| • | the amount and timing of operating expenses and capital expenditures related to the expansion of our operations and infrastructure and client acquisition; |
| • | the timing of expenses related to the development or acquisition of technologies or businesses and potential future charges for impairment of goodwill or intangible assets from acquired companies; |
| • | unforeseen litigation costs and related settlement costs, particularly those related to intellectual property infringement and our obligation to fulfill related client indemnification obligations and regulatory investigations or restructuring activities, including settlement costs and regulatory penalties assessed related to government enforcement actions; |
| • | our ability to accurately estimate state and local sales tax obligations and to collect such actual amounts from our clients; |
| • | our ability to accurately estimate payroll and related taxes for wages and equity transactions; |
| • | our ability to accurately estimate bonus and other incentive payments to key employees based on performance and market conditions; |
| • | changes in tax rules or impact of new accounting pronouncements; |
| • | changes in currency exchange rates and associated costs of hedging to manage foreign currency fluctuations; |
| • | the timing of stock awards to employees and related adverse financial impact of having to expense those stock awards over their vesting schedule; and |
| • | the adoption of new laws or regulations, or interpretations of existing laws or regulations, that restrict, or increase the costs of, providing social commerce solutions or using the Internet as a medium for communications and commerce. |
We offer our social commerce solutions primarily through subscription agreements and generally recognize revenue ratably over the related subscription period, while revenue from our media services is generally recognized in the month services are provided. As a result of both types of arrangements, revenue attributable to a contract signed in a particular quarter will not be fully and immediately recognized in the quarter in which the contract is signed. Because we incur most costs associated with generating client contracts at the time of sale, we may not recognize revenue in the same period in which we incur the related costs of sale. Timing differences of this nature could cause our margins and our operating income or losses to fluctuate significantly from quarter to quarter, and such fluctuations may be more pronounced in quarters in which we experience a change in the mix of new clients as a percentage of total clients.
Typically, a significant percentage of our bookings occur in the last few weeks of a quarter. Accordingly, a market disruption or other event outside of our control that occurred toward the end of a quarter could have a disproportionate impact on us and could cause us to substantially miss our forecasted results for that quarter.
Fluctuations in our quarterly operating results may lead analysts to change their long-term model for valuing our common stock, cause us to face short-term liquidity issues, impact our ability to retain or attract key personnel or cause other unanticipated issues, all of which could cause our stock price to decline. As a result of the potential variations in our quarterly revenue and operating results, we believe that quarter-to-quarter comparisons of our revenue and operating results may not be meaningful, and the results of any one quarter should not be relied upon as an indication of future performance.
14
Table of Contents
Our actual results may differ significantly from any guidance that we may issue in the future and the consensus expectations of research analysts.
From time to time, we may release earnings guidance or other forward-looking statements in our earnings releases, earnings conference calls or otherwise regarding our future performance that represent our management’s estimates as of the date of release. If given, this guidance will be based on forecasts prepared by our management. The principal reason that we may release guidance is to provide a basis for our management to discuss our business outlook with analysts and investors. Guidance is necessarily speculative in nature. The speculative nature of any guidance is further exacerbated by the rapidly evolving nature and uncertain size of the market for social commerce solutions, as well as the unpredictability of our ability to effectively launch new products, the market for advertising, and future general economic and financial conditions. As a result, some or all of the assumptions of any future guidance that we furnish may not materialize or may vary significantly from actual future results. Any failure to meet guidance or analysts’ expectations could have a material adverse effect on the trading price or volume of our stock.
We have a history of losses and we may not achieve or sustain profitability in the future.
We have incurred significant losses in each fiscal period since our inception in 2005. We experienced net losses of $33.2 million and $52.8 million from continuing operations during fiscal years 2015 and 2014, respectively. As of April 30, 2015, we had an accumulated deficit of $226.5 million which also includes losses from discontinued operations. The losses and accumulated deficit were due to the substantial investments we made to grow our business and acquire clients. Expenses associated with the integration of the clients, employees and operations of acquired companies into our business could further delay our profitability. We anticipate that our operating expenses will increase substantially in the foreseeable future as we continue to invest to grow our business and acquire clients, develop our platforms and develop new products and solutions. These efforts may prove more expensive and more difficult than we currently anticipate, and we may not succeed in increasing our revenue sufficiently to offset these higher expenses. Many of our efforts to generate revenue from our business are new and unproven, and any failure to increase our revenue or generate revenue from new products and solutions could prevent us from attaining or increasing profitability. Furthermore, to the extent we are successful in increasing our client base, we could also incur increased losses because costs associated with entering into client agreements are generally incurred up front, while revenue is generally recognized ratably over the term of the agreement. Additionally, we currently sell our products on a fixed price basis. However, many of the third-party costs associated with providing our products are subject to variable pricing. We cannot be certain that we will be able to attain or increase profitability on a client-by-client basis or on a quarterly or annual basis. If we are unable to effectively manage these risks and difficulties as we encounter them, our business, financial condition and results of operations may suffer.
The average sales price of our solutions may decrease, which may adversely affect our ability to achieve and maintain profitability.
The average sales price of our solutions may decline for a variety of reasons, including competitive pricing pressures, the commoditization of a product as more similar products become available in the market and the introduction of new solutions or pricing models. In addition, because the market for our social commerce solutions changes rapidly and because our business model is evolving, we may not be able to achieve and sustain a level of demand and market acceptance sufficient for us to continue to maintain the current average sales price for our solutions. Furthermore, the composition of our clients may change in a manner that makes it more difficult to maintain such prices. Any failure to maintain our prices could have an adverse effect on our business, results of operations and financial condition.
15
Table of Contents
Our business depends substantially on renewing agreements with existing clients and selling additional solutions to them. If our clients, especially our larger clients, do not renew their agreements, renew on less favorable terms or fail to purchase additional solutions, our revenue may decline and our operating results would likely be harmed.
In order for us to improve our operating results, it is important that our clients renew their agreements with us when the initial term expires and also purchase additional solutions from us. We offer most of our social commerce solutions primarily through subscription agreements and generally recognize revenue ratably over the related subscription period. Our clients have no renewal obligation after their initial term expires, and we cannot assure you that we will be able to renew agreements with our clients at the same or higher contract value or at all. Moreover, under specific circumstances, our clients may have the right to cancel their agreements with us before they expire, for example, in the event of an uncured breach by us, or our clients may seek to renegotiate the terms of their contract prior to its expiration. Additionally, pursuant to the terms contained in the Joint Stipulation with the DOJ, we have agreed that during the period beginning on the date we completed the sale of PowerReviews (July 2, 2014) and ending on the later of one year and the termination date of a client’s contract, we will allow existing Bazaarvoice clients as of July 2, 2014 to terminate their contract with us should they choose to use the ratings and reviews solution offered by PowerReviews. Similarly, our contracts with our media clients and covering certain of our social commerce solutions generally do not include long-term obligations requiring them to purchase our services and are often cancelable upon short or no notice and without penalty. Any decline in our client renewals or expansions would likely harm our future operating results, especially if we are unable to recognize sufficient revenue to offset related client acquisition costs prior to such termination or cancellation of our client agreements. If our clients, especially our larger clients, cancel their agreements, negotiate price concessions in their current agreements, do not renew their agreements, renew on less favorable terms to us or fail to purchase additional solutions, our revenue may decline, our ability to grow our revenue in the future could be adversely impacted and our operating results would likely be harmed.
Our active client retention rates may decline in the future due to a variety of factors, including:
| • | the availability, price, performance and functionality of our solutions and competing products and services; |
| • | our ability to demonstrate to clients the value of our solutions, particularly if we are unable to introduce planned solutions innovation; |
| • | poor performance or discontinuation of our clients’ brands; |
| • | changes in our clients’ marketing or advertising strategies which can be cyclical, reflecting overall economic conditions as well as budgeting and discretionary buying patterns; |
| • | our ability to provide quality customer service; |
| • | changes in key personnel at our clients; |
| • | reductions in our clients’ spending levels; |
| • | consolidation in our client base; |
| • | the development by our clients of internal solutions for their social commerce needs; and |
| • | the effects of economic downturns and global economic conditions. |
We incur most of our client acquisition costs at the time of sale. Depending upon the scope of the client’s needs, these costs can be significant. In certain cases, clients may have the right to terminate or cancel agreements with us if we fail to maintain service level requirements or we are otherwise in breach under the client agreements. If a client does not renew or cancels its agreement with us or we are otherwise required to provide price concessions to retain the client, we may not recognize sufficient revenue from that client prior to the termination or cancellation to offset the acquisition costs associated with that client. If the cost to acquire clients is greater than the revenue we generate over time from those clients, our business and operating results may be harmed.
16
Table of Contents
In addition, our costs associated with maintaining and increasing revenue from existing clients may be lower than costs associated with generating revenue from new clients. Therefore, the loss of recurring revenue or a reduction in the rate of revenue increase from our existing clients, even if offset by an increase in revenue from new clients, could have a material adverse effect on our operating results.
We have a limited operating history, which makes it difficult to evaluate our current business and future prospects and may increase the risk of your investment.
We began our operations in May 2005. Our limited operating history may make it difficult to evaluate our current business and our future prospects. We have encountered and will continue to encounter risks and difficulties frequently experienced by growing companies in rapidly developing and changing industries, including challenges in forecasting accuracy, determining appropriate investments of our limited resources, market acceptance of our existing and future solutions, managing client implementations and developing new solutions. Our current operating model may require changes in order for us to achieve profitability and scale our operations efficiently. For example, we may need to continue to enhance our software architecture to allow us to efficiently and cost effectively develop and implement new solutions, make our solutions easy to implement, ensure our marketing engine is designed to drive highly qualified leads cost effectively and implement changes in our sales model to improve the predictability of our sales and reduce our sales cycle. If we fail to implement these changes on a timely basis or are unable to implement them due to factors beyond our control, our business may suffer. You should consider our business and prospects in light of the risks and difficulties we face as a company in a rapidly developing and changing industry.
If we cannot efficiently implement our solutions for clients, we may be delayed in generating revenue.
In general, implementation of our solutions may require lengthy and significant work, and we do not control our clients’ implementation schedules. We generally incur sales and marketing expenses related to the commissions owed to our sales representatives and make upfront investments in technology and personnel to support the engagements before we begin recognizing revenue from client contracts. As a result, as we have experienced in the past, if our clients do not allocate internal resources necessary to meet their implementation responsibilities or if we face unanticipated implementation difficulties, the implementation may be delayed and/or cancelled. Further, in the past, our implementation capacity has at times constrained our ability to successfully and timely implement our solutions for our clients, particularly during periods of high demand. If the client implementation process is not executed successfully or if execution is delayed, whether due to our clients’ or our capacity constraints, we could incur significant costs prior to generating revenue and our clients may delay their payment to us, and our relationships with some of our clients may be adversely affected. In addition, competitors with more efficient operating models with lower implementation costs could penetrate our client relationships.
Because we recognize revenue for our solutions ratably over the term of our client agreements, decreases in the revenue recognizable under contracts for new active clients will not be fully and immediately reflected in our operating results.
We offer our social commerce solutions primarily through subscription agreements and generally recognize revenue ratably over the related subscription period, which is typically one year. As a result, some portion of the revenue we report in each quarter is revenue from contracts entered into during prior quarters. Consequently, a decline in the revenue recognizable under contracts for new active clients signed in any quarter or a decline in the growth rate of revenue recognizable under contracts signed in any quarter will not be fully and immediately reflected in the revenue of that quarter and would negatively affect our revenue in future quarters. In addition, we may be unable to adjust our cost structure rapidly, or at all, to take account of this reduced revenue.
Our sales cycle can be long and unpredictable and require considerable time and expense, which may cause our operating results to fluctuate.
The sales cycle for our solutions, from initial contact with a potential client to contract execution and implementation, varies widely by client and solution. Some of our clients undertake a significant evaluation
17
Table of Contents
process, which typically involves not only our solutions, but also those of our competitors, that has in the past resulted in a lengthy sales cycle, typically three to 12 months. We have no assurance that the substantial time and money spent on our sales efforts will produce any sales. If sales expected from a specific client for a particular quarter are not realized in that quarter or at all, our results could fall short of public expectations and our business, operating results and financial condition could be adversely affected.
If we do not continue to identify and qualify new clients, our ability to grow our revenue may be adversely effected.
We continue to focus our sales efforts on generating business from new clients. Our future success, particularly our ability to grow revenue, will depend largely upon the success of this effort. Our sales force and marketing team need to continue to generate new sales leads, and our growth prospects will be harmed if our efforts to expand, train and retain our sales force do not produce a corresponding significant increase in new clients. When we “qualify” a lead, that lead becomes part of our sales “pipeline.” If we do not continue to add potential new clients to our pipeline there could be a negative impact in our ability to grow our revenue in the future.
We derive a substantial portion of our revenue from a limited number of our solutions. If we are unable to maintain demand for these solutions or diversify our revenue sources by successfully developing and introducing new or enhanced solutions, we could lose existing clients or fail to attract new clients and our business could be harmed.
Ratings & Reviews was our first social commerce solution and still remains one of the core elements of our technology platform. Other solutions we have developed or acquired include Questions & Answers, Syndication, Product Sampling, Connections, Analytics, BV Local, Curations, and Media. Our future financial performance and revenue growth depend upon the successful development, implementation and client acceptance of new products, including products that allow us to utilize the data that we and our clients collect and manage through the use of our products, and the improvement and enhancement of our existing products. We continually seek to develop enhancements to our existing products, as well as new offerings to supplement our existing products. As a result, we are subject to the risks inherent in the development and integration of new products, including defects or undetected errors in our products or in the operation of our products, difficulties in installing or integrating our products on platforms used by our clients or other unanticipated performance, stability and compatibility problems. Any of these problems could result in material delays in the introduction or acceptance of our solutions, increased costs, decreased client satisfaction, breach of contract claims, harm to our industry reputation and reduced or delayed revenues. If we are unable to deliver new products or upgrades or other enhancements to our existing products on a timely and cost-effective basis, it could have a material adverse effect on our business, financial condition and results of operations.
We are currently investing significant amounts in research and development in connection with our efforts to leverage data that we and our clients collect and manage through the use of our solutions. Improving our architecture and developing and delivering new or upgraded solutions may require us to make substantial investments, and we have no assurance that such new solutions will generate sufficient revenue to offset their costs. If we are unable to efficiently develop, license or acquire such new or upgraded solutions on a timely and cost-effective basis, or if such solutions are not effectively brought to market, are not appropriately timed with market opportunity or do not achieve market acceptance, we could lose existing clients or fail to attract new clients, and our business and operating results could be materially adversely affected.
In addition, we must continuously modify and enhance our solutions to keep pace with rapid changes in the social web and Internet-related hardware, software communication, browser, database and social commerce technologies. If we are unable to respond in a timely and cost-effective manner to rapid technological developments, our solutions could become less marketable and less competitive or become obsolete, and our operating results could be negatively affected.
18
Table of Contents
If we are not able to successfully leverage data we and our clients collect and manage through our solutions and services, we may not be able to grow our revenue. Additionally, if we are not able to obtain the rights to utilize the data, or the costs to obtain such data are high, our results of operations could be adversely affected.
Our ability to optimize the placement and scheduling of advertisements for our media clients and to grow our revenue through analytics and other data solutions depends on our ability to successfully leverage data that we and our clients collect and manage through the use of our solutions and services. Our ability to successfully leverage such data, in turn, depends on our ability to collect and obtain rights to utilize such data in our solutions and services and to maintain and grow our network of clients. We currently employ cookies, which are small files of non-personalized information placed on an Internet user’s computer, on a limited basis with respect to our social commerce solutions and more broadly with respect to our media services. The cookies are used to collect information related to the user, such as the user’s Internet Protocol, or IP, address, demographic information and history of the user’s interactions with our clients and any advertisements we deliver. If we are unable to effectively utilize or introduce cookies more broadly, our ability to collect such data could be impaired.
Additionally, our ability to both collect and utilize data may be affected by a number of factors outside of our control, including increased government regulation of the collection of information concerning consumer behavior on the Internet and the increased use of technologies that allow website visitors to modify their settings to prevent or delete cookies and to sweep all cookies from their computers. Further, we currently do not own the data collected through the use of our solutions and services. If our clients decide not to allow us to collect the data or if we are not able to obtain sufficient rights to the data, we may not be able to utilize it in our solutions and services. Additionally, the costs to us related to obtaining sufficient rights to utilize this data could be high and such costs could affect our future operating results.
Finally, in order to obtain the critical mass of data necessary for our analytics and other data solutions to have value for our clients, we will need to maintain and grow our client base. Currently, a substantial amount of the data to which we have access is collected by a small number of our clients. Consequently, the loss of a single client could have a disproportionate impact on the data that is available to us. Any of these limitations on our ability to successfully leverage data could have a material adverse effect on our ability to increase our revenue through media services, analytics and other data solutions; could adversely affect our ability to grow our revenues and could harm our future operating results.
If we are unable to increase our penetration in our principal existing markets and expand into additional vertical markets, we will be unable to grow our business and increase revenue.
We currently market our solutions to a variety of industries, including the retail, consumer products, travel and leisure, technology, telecommunications, financial services, healthcare and automotive industries. We believe our future growth depends not only on increasing our penetration into the principal markets in which our solutions are currently used but also on identifying and expanding the number of industries, communities and markets that use or could use our solutions. Efforts to offer our solutions beyond our current markets may divert management resources from existing operations and require us to commit significant financial resources, either of which could significantly impair our operating results. In addition, some markets, such as financial services and healthcare, have unique and complex regulatory requirements that may make it more difficult or costly for us to develop, market, sell implement or continue to develop our solutions in those markets. Moreover, our solutions may not achieve market acceptance in new markets, and our efforts to expand beyond our existing markets may not generate additional revenue or be profitable. Our inability to further penetrate our existing markets or our inability to identify additional markets and achieve acceptance of our solutions in these additional markets could adversely affect our business, results of operations and financial condition.
Our client relationships and overall business will suffer if we encounter significant problems migrating clients to our next-generation technology platform, or if the new platform does not meet expectations.
In fiscal year 2013, we began implementation of Conversations, our next-generation social commerce technology platform, and we intend to migrate all of our clients to this new technology platform over time. We
19
Table of Contents
have limited experience migrating clients from one platform to another. Given the complexity and significance of this transition, including the amount of client data within our systems that will need to be accessed and migrated, our client relationships, our reputation and our overall business could be severely damaged if these migrations go poorly. To the extent we encounter difficulties in implementation and migration of Conversations, we may be required to incur additional costs, including research and development costs, to address issues identified during the process. In addition, we have incurred additional expenses as a result of the dual technology platforms we maintain (Conversation and our previous social commerce technology platform), and if we experience any delays or technical problems as a result of the migration to Conversations, we may incur such expenses for a much longer period of time than anticipated. Also, one of the anticipated benefits of Conversations is that client implementation times should be shortened, which should result in reduced costs and earlier revenue recognition. Delays in the launch of and migration to Conversations would result in corresponding delays in our ability to achieve these anticipated benefits and could result in client dissatisfaction. Similarly, even if the migrations go smoothly, our business operations and client relationships will be at high risk if the new platform does not meet our performance expectations, or those of our clients. All of this could harm our business in numerous ways including, without limitation, a loss of revenue, lost client contracts, and damage to our reputation.
The market in which we participate is fragmented, rapidly evolving and highly competitive, and we may be unable to compete successfully with our current or future competitors.
The market for social commerce solutions is highly competitive. The competitive dynamics of our market are unpredictable because it is rapidly evolving, fragmented and subject to potential disruption by new technological innovations.
We have several direct and indirect competitors across the regions we serve that provide third-party social commerce solutions, including but not limited to companies such as PowerReviews (formerly named Wavetable), Olapic, Pluck, Reevoo, eKomi, Yotpo, Rating System and Gigya. As a result of our divestiture of the PowerReviews business and the court-ordered terms associated with that divestiture, our competition with PowerReviews has increased. Additionally, we face potential competition from participants in adjacent markets that may enter our markets by leveraging related technologies and partnering with other companies.
We also compete with traditional marketing and advertising programs used by businesses that remain hesitant to embrace social commerce solutions. Additionally, some businesses have developed, or may develop in the future, social commerce solutions internally.
We may also face competition from companies entering our market, including large Internet companies like Amazon, Google and Facebook, which could expand their platforms or acquire one or more of our competitors. While these companies do not currently focus on our market, they have significantly greater financial resources and, in the case of Amazon and Google, a longer operating history. They may be able to devote greater resources to the development and improvement of their services than we can and, as a result, they may be able to respond more quickly to technological changes and clients’ changing needs. Because our market is changing rapidly, it is possible that new entrants, especially those with substantial resources, more efficient operating models, more rapid product development cycles or lower marketing costs, could introduce new solutions that disrupt the manner in which businesses use online consumer-generated content and engage with consumers online to address the needs of our clients and potential clients. Our business and operating results could be harmed if any such disruption occurs.
We believe we compete primarily on the basis of product breadth and functionality, scope, quality and breadth of client base, amount and quality of content, service, price, reputation and the efficiency of our operating model. Our competitors or potential competitors have adopted certain aspects of our business model, which has made it more difficult to differentiate our solutions. As market dynamics change, or as new and existing competitors introduce more competitive pricing models or new or disruptive technologies, or as clients develop internal solutions for their social commerce needs, we may be unable to renew our agreements with existing clients or attract new clients at the same price or based on the existing pricing model. As a result, we
20
Table of Contents
may be required to change our pricing model, offer price incentives or reduce our prices in response to competitive pressures, which could harm our revenue, profitability and operating results. Moreover, many software vendors could bundle competitive products or services or offer them at a low price as part of a larger product sale. In addition, some competitors may offer software that addresses one or a limited number of strategic social commerce functions at lower prices or with greater depth than our solutions. As a result, our competitors might be able to respond more quickly and effectively than we can to new or changing opportunities, technologies, standards or client requirements. For all of these reasons, we may not be able to compete successfully against our current and future competitors.
Unfavorable conditions in the market for social commerce solutions or downturns in the global economy or reductions in marketing spending could limit our ability to grow our business and negatively affect our operating results.
Our operating results may vary based on the impact on us or our clients of changes in the market for social commerce solutions or downturns in the global economy. In addition, the revenue growth and potential profitability of our business depends on marketing spending by companies in the markets we serve. To the extent that weak economic conditions cause our clients and potential clients to freeze or reduce their marketing budgets demand for our solutions may be negatively affected. Historically, economic downturns have resulted in overall reductions in marketing spending. If economic conditions deteriorate or do not materially improve, our clients and potential clients may elect to decrease their marketing budgets by deferring or reconsidering product purchases, which would limit our ability to grow our business and negatively affect our operating results.
Our growth depends in part on the success of our relationships with third parties for the delivery and development of, and implementation support for, our solutions and services.
We currently depend on, and intend to pursue additional relationships with, various third parties related to our media services and product development, including technology, service providers and social media platforms. Identifying, negotiating and documenting these relationships requires significant time and resources, as does integrating our solutions with third-party technologies. In some cases, we do not have formal written agreements with our development partners. Even when we have written agreements, they are typically non-exclusive and do not prohibit our development partners from working with our competitors or from offering competing services. Our competitors may be effective in providing incentives to third parties to favor their products or services.
Specifically, we outsource some of our product development, quality assurance and technology operations to two third-party contractors located in the Ukraine and India. We also rely on a third-party relationship to assist with client implementation support. We believe that supplementing our product development and implementation support activities with our outsourced third-party contractors enhances the efficiency and cost-effectiveness of these activities. If we experience problems with our third-party contractors, including if such contractors’ business operations are interrupted for any reason, or the costs charged by our contractors increases, we may not be able to develop new solutions or enhance existing solutions or meet our clients’ implementation support needs in an alternate manner that is equally or more efficient and cost-effective.
Our Curations product collects and curates consumer-generated images, video and social content from social media platforms such as Facebook, Instagram, Pinterest and Twitter. If these social medical companies change their technology or terms of use in ways that restrict or inhibit the way we can collect or use content, the success of this solution could be significantly impacted.
We use DoubleClick’s ad-serving platform to deliver and monitor ads for our media management services. There can be no assurance that DoubleClick, which is owned by Google, will continue providing these services, that our agreement with DoubleClick will be extended or renewed upon expiration on terms and conditions favorable to us or that we could identify another alternative vendor to take its place. Our agreement with
21
Table of Contents
DoubleClick also allows DoubleClick to terminate the agreement on the occurrence of certain events, including material breach of the agreement by us, and to suspend provision of the services if DoubleClick determines that our use of its service violates certain terms of the agreement.
We anticipate that we will continue to depend on these and other third-party relationships in order to grow our business. If we are unsuccessful in maintaining existing and establishing new relationships with third parties, our ability to efficiently develop and implement new solutions could be impaired, our ability to effectively renew agreements with existing customers could be impaired, and our competitive position or our operating results could suffer. Even if we are successful, these relationships may not result in increased revenue.
We currently rely on a small number of third-party service providers to host and deliver a significant portion of our solutions, and any interruptions or delays in services from these third parties could impair the delivery of our solutions and harm our business.
We host our solutions and serve our clients primarily from third-party data center facilities located in Texas, Virginia and Oregon. We also utilize third-party services that deploy data centers worldwide. We do not control the operation of any of the third- party data center facilities we use. These facilities may be subject to break-ins, computer viruses, denial-of-service attacks, sabotage, acts of vandalism and other misconduct. They are also vulnerable to damage or interruption from power loss, telecommunications failures, fires, floods, earthquakes, hurricanes, tornadoes and similar events. As a result, we may in the future experience website disruptions, outages and other performance problems. Despite our efforts, the occurrence of any of these events and a decision by our third-party service providers to close their data center facilities without adequate notice or other unanticipated problems could result in loss of data as well as a significant interruption in the offering of our solutions and harm to our reputation and brand.
Additionally, our third-party data center facility agreements are of limited durations, and our third-party data center facilities have no obligation to renew their agreements with us on commercially reasonable terms, or at all. If we are unable to renew our agreements with these facilities on commercially reasonable terms, we may experience delays in the provisioning of our solutions until an agreement with another data center facility can be arranged. This shift to alternate data centers could take more than 24 hours depending on the nature of the event, which could cause significant interruptions in service and adversely affect our business and reputation.
We also depend on third-party Internet-hosting providers and continuous and uninterrupted access to the Internet through third-party bandwidth providers to operate our business. If we lose the services of one or more of our Internet-hosting or bandwidth providers for any reason or if their services are disrupted, for example due to viruses, other attacks on their systems or due to natural disaster, we could experience disruption in our ability to offer our solutions or we could be required to retain the services of replacement providers, which could increase our operating costs and harm our business and reputation.
Any errors, defects, disruptions or other performance problems with our solutions could harm our reputation and may damage our clients’ businesses. Interruptions in our ability to offer our solutions would likely reduce our revenue, could cause our clients to cease using our solutions and could adversely affect our retention rates. In addition, some of our client agreements require us to issue credits for downtime in excess of certain targets, and in some instances give our clients the ability to terminate the agreements. Our business and results of operations would be harmed if our current and potential clients believe our solutions are unreliable.
Unfavorable changes in evolving government regulation and taxation of the Internet and online communications and social commerce solutions could harm our business and results of operations.
The future success of our business depends upon the continued use of the Internet as a primary medium for communications and commerce. As the use of the Internet continues to evolve, increasing regulation by federal, state or foreign governments becomes more likely. Federal, state or foreign government bodies or agencies have in the past adopted, and may in the future adopt, laws or regulations affecting data privacy, the solicitation,
22
Table of Contents
collection, processing or use of personal or consumer information, truth-in-advertising, consumer protection, the use of the Internet as a commercial medium and the market for social commerce solutions. There is also uncertainty as to how some existing laws governing issues such as sales taxes, libel and personal privacy apply to the Internet. In addition, government agencies or private organizations may begin to impose taxes, fees or other charges for accessing the Internet. Any new regulations, legislation or new interpretations of existing regulations or legislation restricting Internet commerce or communications could result in a decline in the use of the Internet as a medium for commerce and communications, diminish the viability of Internet solutions generally, and reduce the demand for our solutions. Additionally, if we are required to comply with new regulations, legislation or interpretations thereof, this compliance could cause us to incur additional expenses, make it more difficult to conduct our business or require us to alter our business model. Any of these outcomes could have a material adverse effect on our business, financial condition or results of operations.
Increased regulation and industry standards relating to data and Internet privacy issues may require us to incur significant expenses or may prevent us from providing our products and solutions to clients, thereby harming our business.
As part of our business, we collect and store personal information. We expect our collection and storage of personal information to increase, primarily in connection with our efforts to expand our media services, analytics, and other data solutions. The regulatory framework for privacy issues worldwide is currently in flux and is likely to remain so for the foreseeable future. Practices regarding the collection, use, storage, transmission and security of personal information by companies operating over the Internet have recently come under increased public scrutiny and as a result there are an increasing number of regulations and industry standards that affect our business.
Regulators, including the Federal Trade Commission (“FTC”), continue to more broadly define personal information to include IP addresses, machine identification, location data and other information. As a result of such broadened definition, our ability to use such personal information is increasingly restricted and may limit or inhibit our ability to operate or expand our business. For example, the U.S. government, including the White House, Congress, and the FTC are reviewing the need for greater regulation for the use, collection and disclosure of information concerning consumer behavior on the Internet, including regulation aimed at restricting certain targeted advertising practices. Proposed legislation could, if enacted, impose additional requirements and/or prohibit the use, collection, storage and disclosure of information concerning consumer behavior on the Internet and restrict or otherwise prohibit the use of certain technologies that track individuals’ activities on web pages or across the Internet. Such laws and regulations could restrict our ability to collect and use web browsing data and personal information, which may result in financial penalties, litigation, regulatory investigations, negative publicity, reduced growth opportunities and other significant liabilities. We will also face additional privacy issues as we continue to expand in international markets, as many nations and economic regions have privacy protections that are more stringent or otherwise at odds with those in the United States. For example, the European Union is in the process of proposing reforms to its existing data protection legal framework, which will result in a greater compliance burden for companies with users in Europe. Further, German companies often require even more stringent privacy controls than other markets within the EU, which may limit our ability to expand in that market. Complying with new EU privacy requirements, whether imposed by regulation or contract, will require additional expenditures and may require other significant liabilities. The Australian Privacy Principles (APP) that came into effect this year likewise increase the complexities of operating in that country. The complex web of privacy and data security requirements across the various countries or economic regions that we operate within may be inconsistently applied and conflict with other applicable requirements, our business practices, or our contractual commitments to customers.
We have incurred, and will continue to incur, expenses to comply with privacy and security standards and protocols imposed by law, regulation, industry standards or contractual obligations. Increased domestic or international regulation of data utilization and distribution practices, including self-regulation, could require us to modify our operations and incur significant expense, which could have an adverse effect on our business,
23
Table of Contents
financial condition and results of operations. Our business, including our ability to operate and expand internationally, could be adversely affected if legislation or regulations are adopted, interpreted, or implemented in a manner that is inconsistent with our current or planned business practices and that require changes to these practices, our solutions or our privacy policy.
Our use of open source and third-party technology could impose limitations on our ability to commercialize our solutions.
We use open source software in our solutions. Although we monitor our use of open source software closely, the terms of many open source licenses have not been interpreted by courts in or outside of the United States, and there is a risk that such licenses could be construed in a manner that imposes unanticipated conditions or restrictions on our ability to market our solutions. We also incorporate certain third-party technologies into our solutions and may desire to incorporate additional third-party technologies in the future. Licenses to new third-party technology may not be available to us on commercially reasonable terms, or at all. We could be required to seek licenses from third parties in order to continue offering our solutions, to re-engineer our technology or to discontinue offering our solutions in the event re-engineering cannot be accomplished on a timely basis, any of which could adversely affect our business, operating results and financial condition.
If Internet search engines’ methodologies are modified, our search engine optimization (“SEO”) capability could be harmed.
Capabilities that we provide our clients, including our SEO solution, depend in part on various Internet search engines, such as Google and Bing, to direct a significant amount of traffic to our clients’ websites. Our ability to influence the number of visitors directed to our clients’ websites through search engines is not entirely within our control. For example, search engines frequently revise their algorithms in an attempt to optimize their search result listings. In 2011, Google announced an algorithm change that affected nearly 12% of their U.S. query results. There cannot be any assurance as to whether these or any future changes that may be made by Google or any other search engines might impact our SEO capability in the long term. Changes in the methodologies used by search engines to display results could cause our clients’ websites to receive less favorable placements, which could reduce the number of users who click to visit our clients’ websites from these search engines. Some of our clients’ websites have experienced fluctuations in search result rankings and we anticipate similar fluctuations in the future. In addition, Internet search engines could decide that content on our clients’ websites enabled by our solutions, including online word of mouth, is unacceptable or violates their corporate policies. Any reduction in the number of users directed to our clients’ websites could negatively affect our ability to earn revenue through our SEO solution.
Our long-term success depends, in part, on our ability to maintain and expand our operations outside of the United States and, as a result, our business is susceptible to risks associated with international operations.
As our operations have expanded, we have established and currently maintain offices in the United States, the United Kingdom, France, Germany, the Netherlands, Sweden, Singapore and Australia. We have limited experience in operating in foreign jurisdictions and are making significant investments to build our international operations. Managing a global organization is difficult, time-consuming and expensive, and any international expansion efforts that we may undertake may not be successful. In addition, conducting international operations subjects us to risks, including the following:
| • | the cost and resources required to localize our solutions; |
| • | competition with companies that understand the local market better than we do or who have pre-existing relationships with potential clients in those markets; |
| • | legal uncertainty regarding the application of unique local laws to social commerce solutions or a lack of clear precedent of applicable law; |
24
Table of Contents
| • | lack of familiarity with and the burden of complying with a wide variety of other foreign laws, legal standards and foreign regulatory requirements, which are subject to unexpected changes; |
| • | difficulties in managing and staffing key leadership positions in international operations; |
| • | fluctuations in currency exchange rates; |
| • | potentially adverse tax consequences, including the complexities of foreign value added tax systems and restrictions on the repatriation of earnings; |
| • | developing and maintaining the appropriate tax structure; |
| • | increased financial accounting and reporting burdens and complexities and difficulties in implementing and maintaining adequate internal controls; |
| • | political, social and economic instability, terrorist attacks and security concerns in general; |
| • | reduced or varied protection for intellectual property rights in some countries; and |
| • | higher telecommunications and Internet service provider costs. |
Operating in international markets also requires significant management attention and financial resources. The investment and additional resources required to establish operations and manage growth in other countries may not produce desired levels of revenue or profitability.
We are exposed to fluctuations in currency exchange rates.
We face exposure to adverse movements in currency exchange rates, which may cause our revenue and operating results to differ materially from expectations. A decline in the U.S. dollar relative to foreign currencies would increase our non-U.S. revenue when translated into U.S. dollars. Conversely, if the U.S. dollar strengthens relative to foreign currencies, our revenue would be adversely affected. Our operating results could be negatively impacted depending on the amount of expense denominated in foreign currencies. As exchange rates vary, revenue, cost of revenue, operating expenses and other operating results, when translated, may differ materially from expectations. In addition, our revenue and operating results are subject to fluctuation if our mix of U.S. and foreign currency denominated transactions and expenses changes in the future. We currently enter into forward exchange contracts and as we continue to implement hedging strategies to mitigate foreign currency risk, these strategies might not eliminate our exposure to foreign exchange rate fluctuations and would involve costs and risks of their own, such as ongoing management time and expertise, external costs to implement the strategies and potential accounting implications.
If our security measures are breached or unauthorized access to consumer data is otherwise obtained, our solutions may be perceived as not being secure, clients may curtail or stop using our solutions, and we may incur significant liabilities.
Our operations involve the storage and transmission of confidential information, and security breaches could expose us to a risk of loss of this information, litigation, indemnity obligations to our clients and other liability. If our security measures are breached as a result of third-party action, employee error, malfeasance or otherwise, and someone obtains unauthorized access to client and consumer data, including personally identifiable information regarding consumers, our reputation will be damaged, our business may suffer and we could incur significant liability. Because techniques used to obtain unauthorized access or to sabotage systems change frequently and generally are not recognized until launched against a target, we may be unable to anticipate these techniques or to implement adequate preventative measures. Even in cases where commercially reasonable security measures are in place, employee errors or intentional acts may be able to circumvent protections meant to secure consumer data from external threats. If an actual or perceived breach of our security occurs, the market perception of the effectiveness of our security measures could be harmed and we could lose potential sales and existing clients.
25
Table of Contents
We may be subject to claims that we violated intellectual property rights of others, which are extremely costly to defend and could require us to pay significant damages and limit our ability to operate.
Companies in the Internet and technology industries, and other patent, copyright and trademark holders, own large numbers of patents, copyrights, trademarks and trade secrets and frequently enter into litigation based on claims of infringement or other violations of intellectual property rights. We have received in the past, and expect to receive in the future, notices that claim we or our clients using our solutions have misappropriated or misused other parties’ intellectual property rights. There may be intellectual property rights held by others, including issued or pending patents, copyrights and trademarks, that cover significant aspects of our technologies, content, branding or business methods. Any intellectual property claim against us or against our clients requiring us to indemnify our clients, regardless of merit, could be time-consuming and expensive to settle or litigate and could divert our management’s attention and other resources. These claims could subject us to significant liability for damages and could result in our having to stop using technology, content, branding or business methods found to be in violation of another party’s rights. In addition, some of our commercial agreements require us to indemnify the other party for third-party intellectual property infringement claims, which could increase the cost to us of an adverse ruling in such an action. We might be required or may opt to seek a license for rights to intellectual property held by others, which may not be available on commercially reasonable terms, or at all. Even if a license is available, we could be required to pay significant royalties, which would increase our operating expenses. We may also be required to develop alternative non-infringing technology, content, branding or business methods, which could require significant effort and expense and make us less competitive. If we cannot license or develop technology, content, branding or business methods for any allegedly infringing aspect of our business, we may be unable to compete effectively. Any of these results could harm our operating results.
If we do not adequately protect our intellectual property, our ability to compete could be impaired.
If we are unable to protect our intellectual property, our competitors could use our intellectual property to market products and services similar to ours and our ability to compete effectively would be impaired. To protect our intellectual property we rely on a combination of copyright, trademark, patent and trade secret laws, contractual provisions and technical measures. These protections may not be adequate to prevent our competitors from copying or reverse-engineering our technology and services to create similar offerings. The scope of patent protection, if any, we may obtain from our patent applications is difficult to predict and, if issued, our patents may be found invalid, unenforceable or of insufficient scope to prevent competitors from offering similar services. Our competitors may independently develop technologies that are substantially equivalent or superior to our technology. To protect our trade secrets and other proprietary information, we require employees, consultants, advisors, subcontractors and collaborators to enter into confidentiality agreements, and we maintain policies and procedures to limit access to our trade secrets and proprietary information. These agreements and the other actions we take may not provide meaningful protection for our trade secrets, know-how or other proprietary information from unauthorized use, misappropriation or disclosure. Existing copyright and patent laws may not provide adequate or meaningful protection in the event competitors independently develop technology, products or services similar to our solutions. Even if such laws provide protection, we may have insufficient resources to take the legal actions necessary to protect our interests.
Upon discovery of potential infringement of our intellectual property, we promptly take action we deem appropriate to protect our rights. Even if we do detect violations and decide to enforce our intellectual property rights, litigation may be necessary to enforce our rights, and any enforcement efforts we undertake could be time-consuming and expensive, could divert our management’s attention and may result in a court determining that our intellectual property rights are unenforceable. A failure to protect our intellectual property in a cost-effective and meaningful manner could have a material adverse effect on our ability to compete.
As of April 30, 2015, we had seven issued U.S. patents and 23 pending U.S. non-provisional patent applications. We cannot be certain that any additional patents will be issued with respect to our patent applications. Any current or future patents issued to us may be challenged, invalidated or circumvented, may not
26
Table of Contents
provide sufficiently broad protection or may not prove to be enforceable inactions against alleged infringers. Furthermore, effective patent, trademark, copyright and trade secret protection may not be available in every country in which our products are available over the Internet. In addition, the legal standards relating to the validity, enforceability and scope of protection of intellectual property rights are uncertain and still evolving.
We face potential liability and expenses for legal claims based on online word of mouth and other third-party content that is enabled and delivered by our solutions and services. If we are required to pay damages or expenses in connection with these legal claims, our operating results and business may be harmed.
Our solutions enable our clients to collect and display user-generated content, in the form of online word of mouth, on their websites and other third-party websites. We are also involved in the syndication and moderation of such content and the delivery of other forms of third-party content in connection with our media services. Consequently, in connection with the operation of our business, we face potential liability based on a variety of theories, including fraud, defamation, negligence, copyright or trademark infringement or other legal theories based on syndication or moderation of this information and under various laws, including the Lanham Act and the Copyright Act. In addition, it is also possible that consumers could make claims against us for losses incurred in reliance upon information enabled by our solutions, syndicated, moderated or delivered by us or displayed on our clients’ websites or social networks. These claims, whether brought in the United States or abroad, could divert management time and attention away from our business and result in significant costs to investigate and defend, regardless of the merit of these claims. If we become subject to these or similar types of claims and are not successful in our defense, we may be forced to pay substantial damages. There is no guarantee that we will avoid future liability and potential expenses for legal claims based on the content of the materials that our solutions and services enable. Should the content enabled by our solutions and services give rise to claims against us, we could be subject to substantial liability, which could have a negative impact on our business, revenue and financial condition.
Undetected errors or defects in our solutions could result in the loss of revenue, delayed market acceptance of our products or services or claims against us.
Our solutions are complex and frequently upgraded and may contain undetected errors, defects, failures or viruses, especially when first introduced or when new versions or enhancements are released. Our solutions and services may also be vulnerable to fraudulent acts by third-parties, including the posting of inauthentic reviews and click-through fraud, which occurs when an individual clicks on an ad displayed on a website or an automated system is used to create such clicks with the intent of generating the revenue share payment to the publisher rather than to view the underlying content. Despite testing, our solutions, or third-party products that we incorporate into our solutions, each may contain undetected errors, defects, viruses or vulnerabilities that could, among other things:
| • | require us to make extensive changes to our solutions, which would increase our expenses; |
| • | expose us to claims for damages; |
| • | require us to incur additional technical support costs; |
| • | cause negative client or consumer reactions that could reduce future sales; |
| • | generate negative publicity regarding us and our solutions; or |
| • | result in clients electing not to renew their subscriptions for our solutions. |
Any of these occurrences could have a material adverse effect upon our business, financial condition and results of operations.
27
Table of Contents
The unfavorable outcome of any pending or future litigation or administrative action and expenses incurred in connection with litigation could result in additional litigation, financial losses or harm to our business.
We have been in the past, and in the future may be, subject to legal actions in the ordinary course of our operations, both domestically and internationally. See Note 15, Commitments and Contingencies, to the Notes to Audited Consolidated Financial Statements of this Annual Report on Form 10-K for further description of these claim. There can be no assurances as to the favorable outcome of any litigation. An unfavorable outcome in any litigation matter against us could result in additional litigation. In addition it can be costly to defend litigation and these costs could negatively impact our financial results.
Our divestiture of the PowerReviews business could have an adverse effect on our business.
After the completion of our acquisition of PowerReviews, the DOJ filed a complaint against us with the U.S. District Court for the Northern District of California, San Francisco Division (the “Court”) alleging that our acquisition of PowerReviews violated Section 7 of the Clayton Act, 15 U.S.C. Section 18, and seeking the divestiture of assets sufficient to create a competing business that can replace the competitive significance of PowerReviews in the marketplace. After the Court ruled on January 8, 2014 that our acquisition of PowerReviews violated Section 7 of the Clayton Act, 15 U.S.C. Section 18, on April 24, 2014, we entered into a Joint Stipulation with the DOJ to resolve the DOJ’s claims in the antitrust action and, together with the DOJ, we submitted the Order to the Court. Under the terms of the Joint Stipulation and the Order, we were required to divest all of the assets of the PowerReviews business. On June 4, 2014, we entered into a definitive agreement to divest PowerReviews, LLC, the successor to PowerReviews, to Wavetable Labs, LLC (“Wavetable”) for $30.0 million in cash, $4.5 million of which remains in escrow as partial security for the Company’s indemnification obligations under the definitive agreement and is set to expire in July 2015. The terms of this transaction were approved by the DOJ on June 26, 2014, and the transaction was completed on July 2, 2014. Wavetable subsequently changed its name to PowerReviews. As a result of this divestiture, we expect to experience in the short term a decrease in our SaaS revenues and a negative impact on our adjusted EBITDA, our progress towards profitability and our progress towards positive operating cash flows. In addition, competition in the social commerce solutions market has become more intense as a result of this divestiture. We have ongoing obligations arising as a result of the terms of the Joint Stipulation with the DOJ, the Order and the divestiture agreement with PowerReviews. If we fail to comply with these obligations, our business could be adversely affected.
If we undertake business combinations and acquisitions, they may be difficult to integrate, disrupt our business, dilute stockholder value or divert management’s attention.
We may in the future support our growth through additional acquisitions of, or investments in, additional complementary businesses, services or technologies. Future acquisitions involve risks, such as:
| • | misjudgment with respect to the value, return on investment or strategic fit of any acquired operations or assets; |
| • | challenges associated with integrating acquired technologies, operations and cultures of acquired companies; |
| • | exposure to unforeseen liabilities; |
| • | diversion of management and other resources from day-to-day operations; |
| • | possible loss of key employees, clients, suppliers and partners; |
| • | higher than expected transaction costs; |
| • | potential loss of commercial relationships and clients based on their concerns regarding the acquired business or technologies; and |
| • | additional dilution to our existing stockholders if we use our common stock as consideration for such acquisitions. |
28
Table of Contents
As a result of these risks, we may not be able to achieve the expected benefits of any acquisition. If we are unsuccessful in completing or integrating acquisitions, we may be required to reevaluate our growth strategy and we may incur substantial expenses and devote significant management time and resources in seeking to complete and integrate the acquisitions.
Future business combinations could involve the acquisition of significant intangible assets. We may need to record write-downs from future impairments of identified intangible assets and goodwill. These accounting charges would reduce any future reported earnings or increase a reported loss. In addition, we could use substantial portions of our available cash to pay the purchase price for acquisitions. Subject to the provisions of our existing indebtedness, it is possible that we could incur additional debt or issue additional equity securities as consideration for these acquisitions, which could cause our stockholders to suffer significant dilution.
Our business depends on retaining and attracting qualified management and operating personnel.
Our success depends in large part on our ability to retain and attract high-quality management and operating personnel. We do not maintain key person life insurance policies on any of our employees. We may not be able to offset the impact on our business of the loss of the services of one or more of our executive officers or key employees. Our business also requires skilled technical and sales personnel, who are in high demand and are often subject to competing offers. As we expand into new vertical and geographic markets, we will require personnel with expertise in these new areas. Competition for qualified employees is intense in our industry and particularly in Austin, Texas, where most of our employees are based. We continue to experience increased employee turnover since our initial public offering and have incurred additional expenses as a result. An inability to retain, attract, relocate and motivate additional highly skilled employees required for the operation and planned expansion of our business could harm our operating results and impair our ability to grow. To retain and attract key personnel, we use various measures, including an equity incentive program and incentive bonuses for executive officers and other key employees. These measures may not be sufficient to retain and attract the personnel we require to operate our business effectively. A significant portion of the stock options held by our employees have exercise prices that are higher than the current market price for our common stock. As a result, such stock options may no longer provide additional incentive for our employees to remain employed by us and we may be required to issue additional equity grants to retain key employees. In addition, in making employment decisions, particularly in the software industry, job candidates often consider the value of the stock options they are to receive in connection with their employment. Significant volatility in the price of our stock may, therefore, adversely affect our ability to retain and attract key employees.
Our growth could strain our personnel, technology and infrastructure resources, and if we are unable to effectively manage our growth, our operating results may suffer.
Since our inception, we have experienced growth, which has increased the complexity of our operations. As our operations have expanded, we have grown from 640 full-time employees at April 30, 2012 to 826 full-time employees at April 30, 2015. We have increased the size of our client base from 782 active clients at April 30, 2012 to 1,353 active clients at April 30, 2015. The rapid growth and increasing complexity have demanded, and will continue to demand, substantial resources and attention from our management, most of whom have limited experience in managing a business of our size and complexity. We expect to continue to hire more employees in the future as we grow our business. To manage the expected growth of our operations and personnel and to support financial reporting requirements as a public company, we will need to continue to improve our operational, financial, technology and management controls and our reporting systems and procedures. Further, to accommodate our expected growth we must continually improve and maintain our technology, systems and network infrastructure. Our current and planned personnel, systems, procedures and controls may not be adequate to support our future operations. Our inability to expand our personnel and operations in an efficient manner could result in difficulty in acquiring new clients or retaining existing clients, declines in quality or client satisfaction, increases in expenses relative to our revenue and challenges in developing and introducing new solutions, any of which could adversely affect our operating results.
29
Table of Contents
If we are unable to maintain or expand our direct sales and marketing capabilities, we may not be able to generate anticipated revenue.
We rely primarily on our direct sales force to sell our solutions. Our solutions require a sophisticated sales force. We have worked to upgrade and expand our sales team in order to increase revenue from new and existing clients and to further penetrate our existing markets and expand into new markets. We are constantly evaluating our sales organization as part of our efforts to optimize our sales operations to grow our revenue. If we have not structured our sales organization properly or if we fail to make changes in a timely fashion, our ability to grow our revenue could be adversely effected.
Competition for qualified sales personnel is intense, and there can be no assurance that we will be able to retain our existing sales personnel or attract, integrate or retain sufficient highly qualified sales personnel, which could adversely affect our revenue growth. Many of the companies with which we compete for experienced personnel have greater resources than we have. If any of our sales representatives were to leave us and join one of our competitors, we may be unable to prevent such sales representatives from helping competitors to solicit business from our existing clients, which could adversely affect our revenue.
In addition, new sales hires require training and typically take several months to achieve productivity, if at all. For internal planning purposes, we assume that it will take significant time before a newly hired sales representative is fully trained and productive in selling our solutions. This amount of time may be longer for sales personnel focused on new geographies or new verticals. As a result, the cost of hiring and carrying new representatives cannot be offset by the revenue they produce for a significant period of time. Furthermore, because of the length of our sales training period, we often cannot determine if a sales representative will succeed until after he or she has been employed for several months or longer. If we experience high turnover in our sales force, or if we cannot reliably develop and grow a successful sales team, our revenue growth may be adversely affected.
Our sales force upgrade and expansion may not have the desired effect of expanding our business and generating anticipated revenue. If the growth of our sales and marketing team does not achieve the results we anticipated, then we may be forced to make changes to the organization. Should such changes be required, there can be no assurance that revenue and our ability to grow revenue would not be adversely affected.
If we are unable to maintain our corporate culture as we grow, we could lose the passion, performance, innovation, openness, teamwork, respect and generosity that we believe contribute to our success and our business may be harmed.
We believe that a critical contributor to our success has been our corporate culture. As we grow and change, we may find it difficult to maintain the values that are fundamental to our corporate culture. Any failure to preserve our culture could negatively affect our ability to recruit and retain personnel and otherwise adversely affect our future success. We may face pressure to change our culture as we grow, particularly if we experience difficulties in attracting competent personnel who are willing to embrace our culture.
Our revenue may be adversely affected if we are required to charge sales or other taxes in additional jurisdictions for our solutions.
We collect or have imposed upon us sales or other taxes related to the solutions we sell in certain states and other jurisdictions. Additional states, countries or other jurisdictions may seek to impose sales or other tax collection obligations on us in the future, or states or jurisdictions in which we already pay tax may increase the amount of taxes we are required to pay. A successful assertion by any state, country or other jurisdiction in which we do business that we should be collecting sales or other taxes on the sale of our products and services could, among other things, create significant administrative burdens for us, result in substantial tax liabilities for past sales, discourage clients from purchasing solutions from us or otherwise substantially harm our business and results of operations.
30
Table of Contents
We may not be able to utilize a significant portion of our net operating loss or research tax credit carry-forwards, which could adversely affect our operating results.
As of April 30, 2015, we had federal net operating loss carry-forwards of $191.9 million due to prior period losses, which expire beginning in 2026. We also have federal research tax credit carry-forwards of approximately $7.7 million that will begin to expire in 2026. As of April 30, 2015, we had state net operating loss carry-forwards of $110.2 million, which will begin expiring in 2016 if not utilized, and research and development credits of $2.6 million, of which a portion will begin expiring in 2034 and a portion will not expire. Realization of these net operating loss and research tax credit carry-forwards depends on many factors, including our future income. There is a risk that due to regulatory changes or unforeseen reasons our existing carry-forwards could expire or otherwise be unavailable to offset future income tax liabilities, which would adversely affect our operating results. In addition, under Section 382/383 of the Internal Revenue Code of 1986, as amended, or the Code, if a corporation undergoes an “ownership change,” the corporation’s ability to use its pre-change net operating loss carry-forwards and other pre-change tax attributes, such as research tax credits, to offset its post-change income may be limited. As a result, if we earn net taxable income, our ability to use our pre-change net operating loss carry-forwards or other pre-change tax attributes to offset U.S. federal and state taxable income may be subject to limitations.
We might require additional capital to support business growth, and this capital might not be available.
We intend to continue to make investments to support our business growth and may require additional funds to respond to business challenges, including the need to develop new solutions or enhance our existing solutions and platforms, enhance our operating infrastructure and acquire complementary businesses and technologies. Accordingly, we may need to engage in equity or debt financings to secure additional funds. If we raise additional funds through further issuances of equity or convertible debt securities, our existing stockholders could suffer significant dilution, and any new equity securities we issue could have rights, preferences and privileges superior to those of holders of our common stock, including shares of common stock sold in our initial public offering which was completed in February 2012, or our follow-on public offering, which was completed in July 2012. Any debt financing secured by us in the future would likely be senior to our common stock and could involve restrictive covenants relating to our capital raising activities and other financial and operational matters, which may make it more difficult for us to obtain additional capital and to pursue business opportunities, including potential acquisitions. In addition, we may not be able to obtain additional financing on terms favorable to us, if at all. If we are unable to obtain adequate financing or financing on terms satisfactory to us, when we require it, our ability to continue to support our business growth and to respond to business challenges could be significantly limited.
Our loan agreement contains operating and financial covenants that may restrict our business and financing activities and expose us to risks that could adversely affect our liquidity and financial condition.
On November 21, 2014, we entered into a secured revolving credit facility of up to $70.0 million (the “Credit Facility”), with a sublimit of $3.0 million for the incurrence of swingline loans and a sublimit of $15.0 million for the issuance of letters of credit pursuant to an Amended and Restated Credit Facility, among us, the financial institutions from time to time party thereto and Comerica Bank, as administrative agent, sole lead arranger and sole bookrunner. Advances made under the Credit Facility may be used for general corporate purposes and working capital purposes. Amounts repaid under the Credit Facility may be reborrowed. The Credit Facility matures on November 21, 2017 and is payable in full upon maturity. If we cannot obtain the funds to repay this loan or otherwise refinance it on terms favorable to us, or at all, our liquidity and general financial condition could be adversely effected. Any borrowings, letters of credit and credit card services pursuant to our loan agreement are secured by substantially all of our assets, including our intellectual property. Our loan agreement limits, among other things, our ability to:
| • | incur additional indebtedness or guarantee the obligations of other persons; |
31
Table of Contents
| • | make payments on additional indebtedness or make changes to certain agreements related to additional indebtedness; |
| • | enter into hedging arrangements; |
| • | create, incur or assume liens and other encumbrances; |
| • | make loans and investments, including acquisitions; |
| • | make capital expenditures; |
| • | sell, lease, license or otherwise dispose of assets; |
| • | store inventory and equipment with other persons; |
| • | pay dividends or make distributions on, or purchase or redeem, our capital stock; |
| • | consolidate or merge with or into other entities; |
| • | undergo a change in control; |
| • | engage in new or different lines of business; or |
| • | enter into transactions with affiliates. |
Our loan agreement also contains numerous affirmative covenants, including covenants regarding compliance with applicable laws and regulations, reporting, payment of taxes and other obligations, maintenance of insurance coverage, maintenance of bank and investment accounts with the financial institution and its affiliates, registration of intellectual property rights, and certain third-party consents and waivers. The operating and other restrictions and covenants in our loan agreement, and in any future financing arrangements that we may enter into, may restrict our ability to finance our operations, engage in certain business activities, expand or fully pursue our business strategies, or otherwise limit our discretion to manage our business. Our ability to comply with these restrictions and covenants may be affected by events beyond our control, and we may not be able to meet those restrictions and covenants.
Our loan agreement contains events of default, which include, among others, non-payment defaults, covenant defaults, material adverse change defaults, bankruptcy and insolvency defaults, material judgment and settlement defaults, cross-defaults to certain other material agreements and defaults related to inaccuracy of representations and warranties made by us. An event of default under our loan agreement or any future financing arrangements could result in the termination of commitments to extend further credit, cause any outstanding indebtedness under our loan agreement or under any future financing arrangements to become immediately due and payable and permit our lender to exercise remedies with respect to all of the collateral securing the loans. Accordingly, an event of default could have an adverse effect on our access to capital, liquidity and general financial condition.
Our stock price has been volatile and may be subject to volatility in the future.
The market price of our common stock has been volatile historically and could be subject to wide fluctuations in response to various factors, some of which are beyond our control. For example, fluctuations in the valuation of companies perceived by investors to be comparable to us or in valuation metrics, such as our price to earnings ratio, could impact our stock price. Additionally, the stock markets have experienced price and volume fluctuations that have affected and continue to affect the market prices of equity securities of many companies. These fluctuations often have been unrelated or disproportionate to the operating performance of those companies. These broad market and industry fluctuations and general economic, political and market conditions, such as recessions, changes in U.S. credit ratings, interest rate changes or international currency fluctuations, may negatively affect the market price of our common stock. In the past, many companies that have experienced volatility in the market price of their stock have been subject to securities class action litigation. We
32
Table of Contents
may be the target of this type of litigation in the future. Securities litigation against us, regardless of the merits or outcome, could result in substantial costs and divert our management’s attention from other business concerns, which could materially harm our business.
If securities analysts do not continue to publish research or publish negative research about our business, our stock price and trading volume could decline.
The trading market for our common stock depends in part on the research and reports that securities analysts publish about us or our business. If one or more of the analysts who cover us downgrade our stock or publish negative research about our business, our stock price would likely decline. If one or more of these analysts cease coverage of our stock or fail to publish reports on us regularly, we could lose visibility in the market for our stock and demand for our stock could decrease, which could cause our stock price or trading volume to decline.
Our stock price could decline due to the large number of outstanding shares of our common stock eligible for future sale.
The price of our common stock could decline if there are substantial sales of our common stock in the public stock market. We had an aggregate of 80,230,018 outstanding shares of common stock as of June 17, 2015. Shares beneficially owned by our affiliates and certain employees are subject to volume and other restrictions under Rules 144 or 701 of the Securities Act, as well as our insider trading policy and any applicable 10b5-1 trading plan. Certain of our employees, including many of our executive officers, have entered into 10b5-1 trading plans providing for sales of shares of our common stock from time to time.
The holders of certain shares of our common stock have rights, subject to some conditions, to require us to file registration statements covering their shares or to include their shares in registration statements that we may file for ourselves or other stockholders.
We have also registered the issuance of all shares of common stock that we have issued and may issue under our option plans. These shares can be freely sold in the public market upon issuance, subject to the satisfaction of applicable vesting provisions, Rule 144 volume limitations and manner of sale, notice and public information requirements applicable to our affiliates.
Also, in the future, we may issue securities in connection with investments and acquisitions. The amount of our common stock issued in connection with an investment or acquisition could constitute a material portion of our then outstanding stock. Due to these factors, sales of a substantial number of shares of our common stock in the public market could occur at any time. These sales, or the perception in the market that the holders of a large number of shares intend to sell shares, could reduce the market price of our common stock.
We do not anticipate paying any dividends on our common stock.
We do not anticipate paying any cash dividends on, or making repurchases of, our common stock in the foreseeable future. If we do not pay cash dividends, you could receive a return on your investment in our common stock only if the market price of our common stock has increased when you sell your shares. In addition, the terms of our loan and security agreement currently restrict our ability to pay dividends or purchase our stock.
Changes in accounting standards, the interpretation of accounting standards by applicable regulatory bodies, or the accounting principles governing our financial reporting could result in unexpected, and potentially adverse, impacts on our revenue, operating results and financial position.
Our consolidated financial statements are prepared in accordance with generally accepted accounting principles (“GAAP”) adopted by the Securities and Exchange Commission (“SEC”) for financial reporting in the United States. GAAP is subject to change by new and updated accounting pronouncements made by the
33
Table of Contents
Financial Accounting Standards Board, or other standard setting organizations recognized by the SEC. In addition, the SEC may change its interpretation of existing accounting standards, issue new or change rules and regulations for financial reporting in the United States. Any of these changes could have a significant impact on our previously reported financial statements, our revenue, operating results, and financial position this period, or in the future, and the comparability and consistency of our financial results with other periods.
The requirements of being a public company may strain our resources and divert management’s attention.
We are subject to the reporting requirements of the Securities Exchange Act of 1934, as amended (“Exchange Act”), the Dodd-Frank Wall Street Reform and Consumer Protection Act, the listing requirements of the NASDAQ Stock Market LLC and other applicable securities and rules and regulations. We have incurred and will continue to incur significant legal, accounting and other expenses from operating as a public company. The Sarbanes-Oxley Act of 2002 and the Dodd-Frank Act of 2010, as well as rules subsequently implemented by the SEC and The NASDAQ Stock Market LLC impose various requirements on public companies, including establishing effective internal controls and certain corporate governance practices. Our management and other personnel devote a substantial amount of time to these compliance initiatives, and additional laws and regulations may divert further management resources.
As a public company, we are also required, under Section 404 of the Sarbanes-Oxley Act (“Section 404”), to furnish a report by management on, among other things, the effectiveness of our internal control over financial reporting. This assessment requires disclosure of any material weaknesses identified by our management in our internal control over financial reporting. A material weakness is a deficiency or combination of deficiencies in internal control over financial reporting, such that there is a reasonable possibility that a material misstatement of a company’s annual and interim financial statements will not be prevented or detected on a timely basis. We are required to disclose changes made in our internal control and procedures on a quarterly basis. However, our independent registered public accounting firm is required to formally attest to the effectiveness of our internal control over financial reporting pursuant to Section 404 until the date we are no longer an “emerging growth company” as defined in the Jumpstart Our Business Startups Act of 2012 (“JOBS Act”). We will remain an emerging growth company until the earliest of (i) the last day of the fiscal year during which we have total annual gross revenues of $1 billion or more; (ii) April 30, 2017; (iii) the date on which we have, during the previous three-year period, issued more than $1 billion in non-convertible debt; and (iv) the date on which we are deemed to be a “large accelerated filer” under the Exchange Act.
We have consumed, and will continue to consume, management resources and incur significant expenses for section 404 compliance on an ongoing basis. During the evaluation and testing process, if we identify one or more material weaknesses in our internal control over financial reporting, we will be unable to assert that our internal controls are effective. If we are unable to conclude that our internal control over financial reporting is effective, we could lose investor confidence in the accuracy and completeness of our financial reports, which could cause the price of our common stock to decline.
In addition, changing laws, regulations and standards relating to corporate governance and public disclosure are creating uncertainty for public companies, increasing legal and financial compliance costs and making some activities more time consuming. These laws, regulations and standards are subject to varying interpretations, in many cases due to their lack of specificity, and, as a result, their application in practice may evolve over time as new guidance is provided by regulatory and governing bodies. This could result in continuing uncertainty regarding compliance matters and higher costs necessitated by ongoing revisions to disclosure and governance practices. We intend to invest resources to comply with evolving laws, regulations and standards, and this investment may result in increased general and administrative expenses and a diversion of management’s time and attention from revenue-generating activities to compliance activities. Greater expenditures may be necessary in the future with the advent of new laws, regulations and stock exchange listing requirements pertaining to public companies, particularly after we are no longer an emerging growth company. Moreover, if we are not able to comply with the requirements of new compliance initiatives in a timely manner, the market price of our stock
34
Table of Contents
could decline, and we could be subject to investigations and other actions by the SEC, The NASDAQ Stock Market LLC or other regulatory authorities, which would require additional financial and management resources. If our efforts to comply with new laws, regulations and standards differ from the activities intended by regulatory or governing bodies due to ambiguities related to practice, regulatory authorities may initiate legal proceedings against us and our business may be harmed.
We are an “emerging growth company,” and the reduced disclosure requirements applicable to “emerging growth companies” could make our common stock less attractive to investors. Additionally, if we cease to be an emerging growth company prior to April 30, 2017, we may not be able to meet all the regulatory requirements applicable to non-emerging growth companies.
We are an “emerging growth company,” as defined in the JOBS Act. For as long as we are an emerging growth company, we may take advantage of certain exemptions from various reporting requirements, including, but not limited to, not being required to comply with the auditor attestation requirements of Section 404(b) of the Sarbanes-Oxley Act, reduced disclosure obligations regarding executive compensation in our periodic reports and proxy statements and exemptions from the requirements of holding advisory “say-on-pay” votes on executive compensation and shareholder advisory votes on golden parachute compensation. We will remain an emerging growth company until the earliest of (i) the last day of the fiscal year during which we have total annual gross revenues of $1 billion or more; (ii) April 30, 2017; (iii) the date on which we have, during the previous three-year period, issued more than $1 billion in non-convertible debt; and (iv) the date on which we are deemed to be a “large accelerated filer” under the Exchange Act. We will be deemed a large accelerated filer on the last day of the fiscal year for which the market value of our common equity held by non-affiliates exceeds $700 million, measured on October 31. As of October 31, 2014, we did not meet this threshold. We cannot predict if investors will find our common stock less attractive to the extent we rely on the exemptions available to emerging growth companies. If some investors find our common stock less attractive as a result, there may be a less active trading market for our common stock and our stock price may be more volatile. Further, if we become a large accelerated filer prior to April 30, 2017, we may not be able to satisfy all the regulatory requirements.
In addition, Section 107 of the JOBS Act also provides that an emerging growth company can take advantage of the extended transition period provided in Section 7(a)(2)(B) of the Securities Act for complying with new or revised accounting standards. However, we have chosen to opt out of such extended transition period, and as a result, we will comply with new or revised accounting standards on the relevant dates on which adoption of such standards is required for non-emerging growth companies. Section 107 of the JOBS Act provides that our decision to opt out of the extended transition period for complying with new or revised accounting standards is irrevocable.
If construction of our new headquarters building is not completed on schedule or if we experience difficulties in moving to our new location, we risk increased costs and possible interruption of our business.
We entered into a long term lease for a new headquarters building that commenced construction in December 2014 and is anticipated to be completed in December 2015. We intend to move into the new building at the end of 2015. If the new headquarters facility is not completed by December 31, 2015, we do not expect our current landlord to further extend our current lease and therefore we could experience interruptions to our business while we secure a new headquarters facility. In addition, moving our headquarters is a complex, time-consuming, and expensive process that, without proper planning and effective and timely implementation, could significantly distract management from operating our business. Our inability to adequately address challenges that may arise during this transition could have an adverse effect on our business and results of operations.
35
Table of Contents
Our charter documents and Delaware law could prevent a takeover that stockholders consider favorable and could also reduce the market price of our stock.
Our current certificate of incorporation and bylaws contain provisions that could delay or prevent a change in control of our company. These provisions could also make it more difficult for stockholders to elect directors and take other corporate actions. These provisions include:
| • | a classified board of directors whose members serve staggered three-year terms; |
| • | not providing for cumulative voting in the election of directors; |
| • | authorizing our board of directors to issue, without stockholder approval, preferred stock with rights senior to those of our common stock; |
| • | prohibiting stockholder action by written consent; and |
| • | requiring advance notification of stockholder nominations and proposals. |
These and other provisions in our current certificate of incorporation and bylaws, and under Delaware law could discourage potential takeover attempts, reduce the price that investors might be willing to pay in the future for shares of our common stock and result in the market price of our common stock being lower than it would be without these provisions.
| Item 1B. | Unresolved Staff Comments |
None.
| Item 2. | Properties |
Our principal executive offices are located in Austin, Texas, where we lease approximately 120,878 square feet of office space under leases that expire on December 31, 2015. On November 13, 2014, we entered into a lease (the “Lease”), pursuant to which we will lease approximately 137,615 square feet of office space in Austin, Texas. This will serve as our new headquarters and will be used for general office purposes. The term of the Lease commences on January 1, 2016 unless otherwise modified (“Commencement Date”) and terminates approximately ten years and six months after the Commencement Date. As of April 30, 2015, we maintained additional offices in New York, San Francisco, Chicago, United Kingdom, Australia, France, Germany, Singapore, Japan, the Netherlands and Sweden. We employ multiple data centers located in Texas, Virginia, Oregon and Ireland under hosting agreements with Rackspace U.S., Inc. d/b/a Rackspace Hosting, and Amazon Web Services. We believe our current and planned office facilities and data center space will be adequate for our needs through fiscal year 2016.
| Item 3. | Legal Proceedings |
For a description of our legal proceedings, see Note 15, Commitments and Contingencies, to the Notes to the Audited Consolidated Financial Statements of this Annual Report on Form 10-K.
| Item 4. | Mine Safety Disclosures |
Not applicable.
36
Table of Contents
PART II
| Item 5. | Market for Registrant’s Common Equity, Related Stockholder Matters and Issuer Purchases of Equity Securities |
Stock Price and Dividends
Our common stock was listed on the NASDAQ Global Market under the symbol “BV” from February 24, 2012 to January 31, 2013. Starting February 1, 2013, our stock has been listed on the NASDAQ Global Select Market. Prior to February 24, 2012, there was no public trading market for our common stock. As of June 17, 2015, we had 80,230,018 shares of common stock, $0.0001 par value, outstanding and 414 holders of record of such common stock. The transfer agent and registrar for our common stock is American Stock Transfer & Trust Company.
The table below sets forth the high and low sales prices per share of our common stock as reported on the NASDAQ for the periods indicated:
| High | Low | |||||||
| Year ended April 30, 2015: |
||||||||
| Quarter ended July 31, 2014 |
$ | 8.21 | $ | 5.85 | ||||
| Quarter ended October 31, 2014 |
$ | 8.49 | $ | 6.66 | ||||
| Quarter ended January 31, 2015 |
$ | 8.75 | $ | 7.12 | ||||
| Quarter ended April 30, 2015 |
$ | 9.39 | $ | 5.34 | ||||
| Year ended April 30, 2014: |
||||||||
| Quarter ended July 31, 2013 |
$ | 10.99 | $ | 6.83 | ||||
| Quarter ended October 31, 2013 |
$ | 11.50 | $ | 8.74 | ||||
| Quarter ended January 31, 2014 |
$ | 9.54 | $ | 6.94 | ||||
| Quarter ended April 30, 2014 |
$ | 8.73 | $ | 6.45 | ||||
We have never declared or paid dividends on our common stock. We do not expect to pay dividends on our common stock for the foreseeable future. Instead, we anticipate that all of our earnings will be used for the operation and growth of our business. Any future determination to declare cash dividends would be subject to the discretion of our board of directors and would depend upon various factors, including our results of operations, financial condition and liquidity requirements, restrictions that may be imposed by applicable law and our contracts and other factors deemed relevant by our board of directors. In addition, the terms of the credit facility currently restrict our ability to pay dividends.
37
Table of Contents
Performance Graph
The following graph compares the cumulative total stockholder return from February 24, 2012, the date our common stock commenced trading on the NASDAQ, through April 30, 2015, for our common stock, the NASDAQ Composite Index and the NASDAQ Computer Index. The NASDAQ Computer Index is a market capitalization-weighted index that includes securities of 394 NASDAQ-listed companies classified according to the Industry Classification Benchmark as Technology, excluding Telecommunications Equipment. We have assumed that dividends have been reinvested. The graph below assumes that $100 was invested on February 24, 2012, in each of our common stock, the stocks comprising the NASDAQ Composite Index and the stocks comprising the NASDAQ Computer Index.
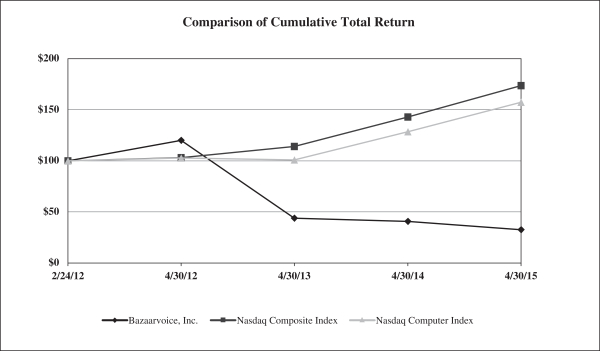
Use of Proceeds from Public Offering of Common Stock
On February 29, 2012, we completed our initial public offering of 10,906,941 shares of our common stock, of which 10,422,645 shares were offered by us and 484,296 shares were offered by selling stockholders, at a price of $12.00 per share. The aggregate offering price for shares sold in the offering was approximately $130.9 million. This offering was effected on February 23, 2012 pursuant to a registration statement on Form S-1 (File No. 333-176506), which the SEC declared effective on such date. Morgan Stanley & Co. LLC, Deutsche Bank Securities Inc. and Credit Suisse Securities (USA) LLC acted as representatives of the underwriters in the offering. The gross proceeds that we raised from the sale of our common stock in the offering was approximately $125.1 million, resulting in net proceeds from the sale of our common stock of approximately $112.8 million, after deducting underwriting discounts and commissions of approximately $8.8 million and other offering expenses of approximately $3.5 million. No payments were made by us to directors, officers or persons owning ten percent or more of our common stock or to their associates, or to our affiliates, other than payments in the ordinary course of business to officers for salaries, or as a result of sales of shares of common stock by selling stockholders in the offering.
On July 23, 2012, we completed a follow-on offering in which we sold 9,775,000 shares of our common stock, of which 3,625,000 shares were offered by us and 6,150,000 shares were offered by selling stockholders.
38
Table of Contents
The gross proceeds raised in the offering was approximately $55.8 million, resulting in net proceeds of approximately $51.9 million, after deducting underwriting discounts and commissions and other offering expenses.
Some of the proceeds from our initial public offering have been used for working capital and general corporate purposes. We initially invested our net proceeds from our initial public offering in U.S. government-guaranteed short-term investments. In connection with our acquisition of PowerReviews, we used approximately $31.1 million in cash in our first fiscal quarter of 2013. On November 5, 2012, we used approximately $26.9 million in cash in our purchase of Longboard Media. On December 1, 2012, we used approximately $4.2 million in cash to purchase customer contracts from Shopzilla, Inc. (“Shopzilla”). On April 15, 2014, we used approximately $9.3 million in cash in our purchase of FeedMagnet. We have broad discretion over the uses of the net proceeds. Pending other uses, we plan to invest the remaining net proceeds from our initial public offering in short-term, interest-bearing obligations investment-grade instruments, certificates of deposit or direct or guaranteed obligations of the U.S. government. There have been no material differences between the actual use of proceeds and intended use of proceeds as originally described in the final prospectus related to our initial public offering as filed with the SEC on February 24, 2012.
Securities Authorized for Issuance Under Equity Compensation Plans
See Item 12: “Security Ownership of Certain Beneficial Owners and Management and Related Stockholder Matters” of this Annual Report on Form 10-K for information regarding securities authorized for issuance under equity compensation plans.
Repurchases of Securities
None of our issued common stock has been reacquired since January 31, 2012.
Sale of Unregistered Securities
On March 10, 2015, we issued 50,000 unregistered shares of our common stock, which were held as treasury stock, to Bazaarvoice Foundation, a nonprofit organization, as a donation. The fair market value of these shares based on our closing stock price on March 10, 2015 was $314,000. This issuance of shares of our common stock was not registered under the Securities Act of 1933, as amended, or the Securities Act, or any state securities laws. With respect to such issuance, we relied on the exemption from the registration requirements of the Securities Act by virtue of Section 4(a)(2) thereof and the rules and regulations promulgated thereunder.
39
Table of Contents
| Item 6. | Selected Financial Data |
The following selected historical consolidated financial data below should be read in conjunction with Item 7: “Management’s Discussion and Analysis of Financial Condition and Results of Operations,” our consolidated financial statements and the related notes appearing in Item 8: “Financial Statements and Supplementary Data” of this Annual Report on Form 10-K to fully understand factors that may affect the comparability of the information presented below.
The consolidated statements of operations data for the years ended April 30, 2015, 2014 and 2013 and the selected consolidated balance sheet data as of April 30, 2015 and 2014 are derived from our audited consolidated financial statements appearing in Item 8: “Financial Statements and Supplementary Data” of this Annual Report on Form 10-K. The consolidated statements of operations for the years ended April 30, 2012 and 2011 and the selected consolidated balance sheet data as of April 30, 2013, 2012 and 2011 are derived from audited consolidated financial statements not included in this report. Our historical results are not necessarily indicative of the results to be expected in the future, and our interim results are not necessarily indicative of the results to be expected for the full fiscal year.
| Year Ended April 30, | ||||||||||||||||||||
| 2015 | 2014 | 2013 | 2012 | 2011 | ||||||||||||||||
| (in thousands, except net loss per share data) | ||||||||||||||||||||
| Consolidated Statements of Operations Data: |
||||||||||||||||||||
| Revenue |
$ | 191,181 | $ | 168,145 | $ | 146,812 | $ | 106,136 | $ | 64,482 | ||||||||||
| Cost of revenue (1) |
69,906 | 52,905 | 47,350 | 37,416 | 25,615 | |||||||||||||||
|
|
|
|
|
|
|
|
|
|
|
|||||||||||
| Gross profit |
121,275 | 115,240 | 99,462 | 68,720 | 38,867 | |||||||||||||||
|
|
|
|
|
|
|
|
|
|
|
|||||||||||
| Operating expenses: |
||||||||||||||||||||
| Sales and marketing (1) |
78,373 | 86,482 | 73,114 | 49,273 | 34,568 | |||||||||||||||
| Research and development (1) |
37,695 | 37,585 | 32,169 | 21,266 | 10,847 | |||||||||||||||
| General and administrative (1) |
30,507 | 26,370 | 30,990 | 20,896 | 13,156 | |||||||||||||||
| Acquisition-related and other |
4,046 | 16,184 | 10,487 | — | — | |||||||||||||||
| Amortization of acquired intangible assets |
1,237 | 1,135 | 549 | — | — | |||||||||||||||
|
|
|
|
|
|
|
|
|
|
|
|||||||||||
| Total operating expenses |
151,858 | 167,756 | 147,309 | 91,435 | 58,571 | |||||||||||||||
|
|
|
|
|
|
|
|
|
|
|
|||||||||||
| Operating loss |
(30,583 | ) | (52,516 | ) | (47,847 | ) | (22,715 | ) | (19,704 | ) | ||||||||||
|
|
|
|
|
|
|
|
|
|
|
|||||||||||
| Total other income (expense), net |
(2,527 | ) | (830 | ) | (828 | ) | (803 | ) | 208 | |||||||||||
|
|
|
|
|
|
|
|
|
|
|
|||||||||||
| Loss from continuing operations before income taxes |
(33,110 | ) | (53,346 | ) | (48,675 | ) | (23,518 | ) | (19,496 | ) | ||||||||||
| Income tax expense (benefit) |
54 | (500 | ) | (1,172 | ) | 811 | 561 | |||||||||||||
|
|
|
|
|
|
|
|
|
|
|
|||||||||||
| Net loss from continuing operations |
$ | (33,164 | ) | $ | (52,846 | ) | $ | (47,503 | ) | $ | (24,329 | ) | $ | (20,057 | ) | |||||
| Accretion of redeemable convertible preferred stock |
— | — | — | (38 | ) | (46 | ) | |||||||||||||
|
|
|
|
|
|
|
|
|
|
|
|||||||||||
| Net loss from continuing operations attributable to common stockholders |
(33,164 | ) | (52,846 | ) | (47,503 | ) | (24,367 | ) | (20,103 | ) | ||||||||||
| Loss from discontinued operations, net of tax |
(1,257 | ) | (10,320 | ) | (16,249 | ) | — | — | ||||||||||||
|
|
|
|
|
|
|
|
|
|
|
|||||||||||
| Net loss applicable to common stockholders |
$ | (34,421 | ) | $ | (63,166 | ) | $ | (63,752 | ) | $ | (24,367 | ) | $ | (20,103 | ) | |||||
|
|
|
|
|
|
|
|
|
|
|
|||||||||||
| Net loss per share applicable to common stockholders: |
||||||||||||||||||||
| Continuing Operations |
$ | (0.42 | ) | $ | (0.70 | ) | $ | (0.69 | ) | $ | (0.92 | ) | $ | (1.13 | ) | |||||
| Discontinued Operations |
(0.02 | ) | (0.14 | ) | (0.23 | ) | — | — | ||||||||||||
|
|
|
|
|
|
|
|
|
|
|
|||||||||||
| Basic and diluted loss per share: |
$ | (0.44 | ) | $ | (0.84 | ) | $ | (0.92 | ) | $ | (0.92 | ) | $ | (1.13 | ) | |||||
|
|
|
|
|
|
|
|
|
|
|
|||||||||||
| Basic and diluted weighted average number of shares outstanding |
78,645 | 75,564 | 69,336 | 26,403 | 17,790 | |||||||||||||||
|
|
|
|
|
|
|
|
|
|
|
|||||||||||
| Other Financial Data: |
||||||||||||||||||||
| Adjusted EBITDA from continuing operations (2) |
(8,680 | ) | (21,875 | ) | (21,862 | ) | (12,901 | ) | (13,317 | ) | ||||||||||
40
Table of Contents
| (1) | Includes stock-based expense as follows: |
| Cost of revenue |
$ | 1,517 | $ | 1,155 | $ | 677 | $ | 1,239 | $ | 978 | ||||||||||
| Sales and marketing |
3,923 | 4,496 | 3,033 | 1,881 | 1,122 | |||||||||||||||
| Research and development |
2,561 | 2,817 | 2,840 | 1,335 | 731 | |||||||||||||||
| General and administrative |
4,677 | 5,357 | 4,608 | 3,255 | 1,850 |
| (2) | We define Adjusted EBITDA from continuing operations (“Adjusted EBITDA”) as generally accepted accounting principles (“GAAP”) net loss from continuing operations adjusted for stock-based expense, contingent considerations related to acquisitions, adjusted depreciation and amortization (which excludes amortization of capitalized internal-use software development costs), integration and other costs related to acquisitions, other non-business costs and benefits, income tax expense and other (income) expense, net. Adjusted EBITDA is a financial measure that is not calculated in accordance with GAAP. |
Adjusted EBITDA should not be considered as an alternative to net loss, operating loss or any other measure of financial performance calculated and presented in accordance with GAAP. Our Adjusted EBITDA may not be comparable to similarly titled measures of other organizations because other organizations may not calculate Adjusted EBITDA in the same manner. We prepare Adjusted EBITDA to eliminate the impact of items that we do not consider indicative of our core operating performance. You are encouraged to evaluate these adjustments and the reasons we consider them appropriate.
We believe Adjusted EBITDA is useful to investors in evaluating our operating performance for the following reasons:
| • | Adjusted EBITDA is widely used by investors and securities analysts to measure a company’s operating performance without regard to items, such as stock-based expense, adjusted depreciation and amortization, acquisition costs, income tax expense and other income, net, that can vary substantially from company to company depending upon their financing, capital structures and the method by which assets were acquired; |
| • | Our management uses Adjusted EBITDA in conjunction with GAAP financial measures for planning purposes, including the preparation of our annual operating budget, as a measure of operating performance and the effectiveness of our business strategies and in communications with our board of directors concerning our financial performance; |
| • | Adjusted EBITDA provides consistency and comparability with our past financial performance, facilitates period-to-period comparisons of operations and also facilitates comparisons with other peer companies, many of which use similar non-GAAP financial measures to supplement their GAAP operating results; and |
| • | Our investor and analyst presentations include Adjusted EBITDA as a supplemental measure to evaluate our overall operating performance. |
We understand that although Adjusted EBITDA is frequently used by investors and securities analysts in their evaluations of companies, Adjusted EBITDA has limitations as an analytical tool, and you should not consider it in isolation or as a substitute for analysis of our results of operations as reported under GAAP. These limitations include:
| • | Adjusted depreciation and amortization are non-cash charges, and the assets being depreciated or amortized will often have to be replaced in the future; Adjusted EBITDA does not reflect any cash requirements for these replacements; |
| • | Adjusted EBITDA does not reflect changes in, or cash requirements for, our working capital needs or contractual commitments; |
| • | Adjusted EBITDA does not reflect cash requirements for income taxes and the cash impact of other income; and |
41
Table of Contents
| • | Other companies in our industry may calculate Adjusted EBITDA differently than we do, limiting its usefulness as a comparative measure. |
The following table presents a reconciliation of net loss from continuing operations, the most comparable GAAP measure, to Adjusted EBITDA from continuing operations for each of the periods indicated:
| Year Ended April 30, | ||||||||||||||||||||
| 2015 | 2014 | 2013 | 2012 | 2011 | ||||||||||||||||
| (in thousands) | ||||||||||||||||||||
| GAAP net loss from continuing operations |
$ | (33,164 | ) | $ | (52,846 | ) | $ | (47,503 | ) | $ | (24,329 | ) | $ | (20,057 | ) | |||||
| Stock-based expense |
12,678 | 13,825 | 11,158 | 7,710 | 4,681 | |||||||||||||||
| Contingent consideration related to acquisition (1) |
— | (3,860 | ) | (410 | ) | — | — | |||||||||||||
| Adjusted depreciation and amortization |
5,609 | 4,492 | 3,322 | 2,104 | 1,706 | |||||||||||||||
| Acquisition-related and other expense |
4,046 | 16,184 | 10,487 | — | — | |||||||||||||||
| Other stock-related expense (benefit) (2) |
(430 | ) | — | 1,428 | — | — | ||||||||||||||
| Income tax expense (benefit) |
54 | (500 | ) | (1,172 | ) | 811 | 561 | |||||||||||||
| Total other expense (income), net |
2,527 | 830 | 828 | 803 | (208 | ) | ||||||||||||||
|
|
|
|
|
|
|
|
|
|
|
|||||||||||
| Adjusted EBITDA from continuing operations |
$ | (8,680 | ) | $ | (21,875 | ) | $ | (21,862 | ) | $ | (12,901 | ) | $ | (13,317 | ) | |||||
|
|
|
|
|
|
|
|
|
|
|
|||||||||||
| (1) | Contingent consideration related to acquisition includes the following: |
| (a) Revaluation of contingent consideration General and administrative |
$ | — | $ | (3,270 | ) | $ | (1,000 | ) | $ | — | $ | — | ||||||||
| (b) Contingent consideration included in compensation expense General and administrative |
— | (295 | ) | 295 | — | — | ||||||||||||||
| Sales and marketing |
— | (295 | ) | 295 | — | — | ||||||||||||||
|
|
|
|
|
|
|
|
|
|
|
|||||||||||
| Contingent consideration related to acquisition |
$ | — | $ | (3,860 | ) | $ | (410 | ) | $ | — | $ | — | ||||||||
|
|
|
|
|
|
|
|
|
|
|
Revaluation of contingent consideration is the decrease in fair value of the liability-classified contingent consideration related to the acquisition of Longboard Media, Inc. Contingent consideration included in compensation expense relates to certain Longboard Media, Inc. employees whose right to receive such compensation is forfeited if they terminate their employment prior to the required service period. The contingent consideration was payable on Longboard Media’s achievement of certain performance goals for the period from January 1, 2013 to December 31, 2013. On October 31, 2013, we determined that the probability of the attainment of the underlying performance goals was remote and the resultant payout was estimated to be zero. As a result, the fair value of the liability-classified contingent consideration and the liability accrued for contingent consideration included in compensation expense were reduced to zero. On January 31, 2014, we concluded that the underlying performance goals were not met and the payout was zero. We exclude these items from its non-GAAP financial measures in order to facilitate the comparison of post-acquisition operating results.
| (2) | In fiscal year 2013, other stock-related expense represents an estimated liability of $1.4 million for taxes and related items in connection with our treatment of certain stock option grants. In fiscal year 2015, we recorded a benefit of $0.4 million due to a reduction in our estimated liability recorded in fiscal year 2013. |
42
Table of Contents
Since these estimated liabilities directly relate to stock option grants and as stock-based expenses are consistently excluded from our non-GAAP financial measures, we exclude these estimated liabilities.
| Year Ended April 30, | ||||||||||||||||||||
| 2015 | 2014 | 2013 | 2012 | 2011 | ||||||||||||||||
| (in thousands) | ||||||||||||||||||||
| Selected Consolidated Balance Sheet Data: |
||||||||||||||||||||
| Cash and cash equivalents |
$ | 54,041 | $ | 31,934 | $ | 25,045 | $ | 74,367 | $ | 15,050 | ||||||||||
| Short term investments |
52,730 | 40,700 | 70,290 | 50,834 | — | |||||||||||||||
| Total deferred revenue |
62,930 | 56,673 | 52,959 | 45,586 | 32,160 | |||||||||||||||
| Total current assets |
169,280 | 154,294 | 182,139 | 147,551 | 31,095 | |||||||||||||||
| Total current liabilities |
91,336 | 115,989 | 94,010 | 57,400 | 35,901 | |||||||||||||||
| Total assets |
342,961 | 327,270 | 341,943 | 156,867 | 37,972 | |||||||||||||||
| Total liabilities |
151,578 | 120,808 | 100,594 | 63,269 | 43,589 | |||||||||||||||
| Total non-current liabilities |
60,242 | 4,819 | 6,584 | 5,869 | 7,688 | |||||||||||||||
| Redeemable convertible preferred stock |
— | — | — | — | 23,633 | |||||||||||||||
| Total stockholders’ equity (deficit) |
191,383 | 206,462 | 241,349 | 93,598 | (29,250 | ) | ||||||||||||||
43
Table of Contents
| Item 7. | Management’s Discussion and Analysis of Financial Condition and Results of Operations |
You should read the following discussion of our financial condition and results of operations in conjunction with the consolidated financial statements and the notes thereto included elsewhere in this Annual Report on Form 10-K. The following discussion contains forward-looking statements that reflect our plans, estimates and beliefs. Our actual results could differ materially from those discussed in the forward-looking statements. Factors that could cause or contribute to these differences include those discussed below and elsewhere in this Annual Report on Form 10-K, particularly in Item 1A: “Risk Factors.”
This section and other parts of this Annual Report on Form 10-K contain forward-looking statements that involve risks and uncertainties. Forward-looking statements may be identified by the use of forward-looking words such as “anticipate,” “believe,” “may,” “will,” “continue,” “seek,” “estimate,” “intend,” “hope,” “predict,” “could,” “should,” “would,” “project,” “plan,” “expect” or the negative or plural of these words or similar expressions, although not all forward-looking statements contain these words. Forward-looking statements are not guarantees of future performance and our actual results may differ significantly from the results discussed in the forward-looking statements. Factors that might cause such differences include, but are not limited to, those discussed in the subsection entitled Item 1A: “Risk Factors” above, which are incorporated herein by reference. The following discussion should be read in conjunction with the consolidated financial statements and notes thereto included in Item 8: “Financial Statements and Supplementary Data” of this Annual Report on Form 10-K. All information presented herein is based on our fiscal calendar. Unless otherwise stated, references in this report to particular years or quarters refer to our fiscal years ended April 30 and the associated quarters of those fiscal years. We assume no obligation to revise or update any forward-looking statements for any reason, except as required by law.
Overview
We power a network that connects brands and retailers to the authentic voices of people where they shop. Bazaarvoice was founded on the premise that the collective voice of the marketplace is the most powerful marketing tool in the world because of its influence on purchasing decisions, both online and offline. Our technology platform collects, curates, and displays consumer-generated content including ratings and reviews, questions and answers, customer stories, and social posts, photos, and videos. This content is amplified across marketing channels, including category/product pages, search, brand sites, mobile applications, in-store displays, and paid and earned media, where it helps clients generate more revenue, market share, and brand affinity. We also help clients leverage insights derived from consumer-generated content to improve marketing effectiveness, increase success of new product launches, improve existing products and services, effectively scale customer support, decrease product returns, reach consumers when actively shopping via highly targeted audience marketing, and enable retailers to launch and manage on-site advertising solutions and site monetization strategies.
In February 2012 we completed our initial public offering, at which time we issued and sold a total of 10,422,645 shares of our common stock for which we received total cash proceeds of $112.8 million, net of issuance costs.
On July 23, 2012, we completed a follow-on offering in which we sold 9,775,000 shares of our common stock, of which 3,625,000 shares were offered by us and 6,150,000 shares were offered by selling stockholders. The gross proceeds raised in the offering was approximately $55.8 million, resulting in net proceeds of approximately $51.9 million, after deducting underwriting discounts and commissions of approximately $2.7 million and other offering expenses of approximately $1.2 million.
On June 12, 2012, we acquired PowerReviews, Inc. (“PowerReviews”), a provider of social commerce solutions, for a total cash and stock purchase price of $150.8 million. On January 8, 2014, the U.S. District Court for the Northern District of California, San Francisco Division (the “Court”) ruled, in connection with a complaint filed by the U.S. Department of Justice (the “DOJ”), that our acquisition of PowerReviews violated
44
Table of Contents
Section 7 of the Clayton Act, 15 U.S.C. Section 18. On April 24, 2014, we entered into a Joint Stipulation with the DOJ to resolve the DOJ’s claims in the antitrust action and, together with the DOJ, we submitted a proposed order to the Court (the “Order”). Under the terms of the Joint Stipulation and the Order, on June 4, 2014, we entered into a definitive agreement to divest all of the assets of PowerReviews, LLC, the successor to PowerReviews, to Wavetable Labs, LLC (“Wavetable”) for $30.0 million in cash, $4.5 million of which remains in escrow as partial security for our indemnification obligations under the definitive agreement and is set to expire in July 2015. The terms of this transaction were approved by the DOJ on June 26, 2014, and the transaction was completed on July 2, 2014. Wavetable subsequently changed its name to PowerReviews. As a result of the foregoing, PowerReviews revenues, related expenses and loss on disposal, net of tax, are components of “loss from discontinued operations, net of tax” in the consolidated statement of operations for all periods presented. On the consolidated balance sheets, the assets and liabilities of the discontinued operations of PowerReviews have been presented as ‘Assets held for sale’ and ‘Liabilities held for sale,’ respectively, as of April 30, 2014. The statement of cash flows is reported on a combined basis without separately presenting cash flows from discontinued operations. The discussion of our results of operations is based upon the results from our continuing operations unless otherwise indicated.
On November 5, 2012, we completed the acquisition of Longboard Media, a full service media management company that enables online retailers, shopping publishers and mobile commerce applications to launch and manage on-site advertising solutions and site monetization strategies. Through Longboard Media’s shopper media network, brand advertisers are able to target consumers throughout the online shopping experience, often immediately prior to the point of sale.
On December 1, 2012, we purchased the customer contracts operated in Europe by Shopzilla Inc. (“Shopzilla”) using the PowerReviews technology under a license agreement between Shopzilla and PowerReviews. Through this transaction we added 48 active clients. As these clients were supported by the PowerReviews platform, they were part of the PowerReviews divestiture (See Note 3 to the Notes to Audited Consolidated Financial Statements of this Annual Report on Form 10-K).
On April 15, 2014, we acquired FeedMagnet, a social media curation company that enables brands to collect, curate, and display consumer-generated images, video, and social content on their websites and other marketing priorities. FeedMagnet’s offerings complement our platform with a client-centric rich media solution that enables brands and retailers to create powerful visual commerce solutions.
On November 21, 2014, we entered into the Credit Facility with Comerica Bank which provides for a secured, revolving line of credit of up to $70.0 million and replaced the prior loan agreement. On November 21, 2014, we drew down $57.0 million of the unused balance of the Credit Facility, of which, $27.0 million was used to repay the outstanding balance on our existing loan agreement.
For the fiscal year ended April 30, 2015, through the continued enhancement and expansion of our social commerce platform, we achieved growth as compared to 2014 in both the number of active clients and the revenue we generate from our active clients over time. Our active client count as of April 30, 2015 was 1,353, which represents a 19.4% increase from April 30, 2014. Our revenue was $191.2 million in 2015, which represents a 13.7% increase from April 30, 2014.
For fiscal years 2015, 2014 and 2013, our net loss from continuing operations was $33.2 million, $52.8 million and $47.5 million, respectively, our Adjusted EBITDA from continuing operations was a loss of $8.7 million, $21.9 million and $21.9 million, respectively, and our cash flow used in operating activities was $16.0 million, $43.5 million and $21.8 million, respectively. For a reconciliation of net loss from continuing operations to Adjusted EBITDA from continuing operations, see footnote 2 under Item 6: “Selected Financial Data” of this Annual Report on Form 10-K.
As of April 30, 2015, we had 826 full-time employees compared to 799 full-time employees the same period last year.
45
Table of Contents
We plan to continue to invest for long-term growth. We expect to continue the enhancement of our platforms by developing new solutions, adding new features and functionality and expanding the potential applications of our existing solutions. We also plan to continue our investments in research and development and may pursue strategic acquisitions of complementary businesses and technologies that will enable us to continue to drive growth in the future. We expect our cost of acquiring clients to improve as we gain sales overhead efficiencies and leverage a larger, more experienced sales force.
Business Model
Our business model focuses on adding new clients and maximizing the lifetime value of such client relationships. We make significant investments in acquiring new clients and believe that we will be able to achieve a favorable return on these investments by growing our relationships over time and ensuring that we have a high level of client retention.
In connection with the acquisition of new clients, we incur and recognize significant upfront costs. These costs include sales and marketing costs associated with generating client agreements, such as sales commission expenses that are recognized fully in the period in which we execute a client contract. In addition, we incur implementation costs which are generally recognized in periods prior to recognizing revenue. However, we recognize revenue ratably over the entire term of those contracts, which commences when the client is able to begin using our solution. Although we expect each client to be profitable for us over the duration of our relationship, the costs we incur with respect to any client relationship may exceed revenue in earlier periods because we recognize those costs in advance of the recognition of revenue. As a result, an increase in the mix of new clients as a percentage of total clients will initially have a negative impact on our operating results. On the other hand, we expect that a decrease in the mix of new clients as a percentage of total clients will initially have a positive impact on our operating results. Additionally, some clients pay in advance of the recognition of revenue and, as a result, our cash flow from these clients may exceed the amount of revenue recognized for those clients in earlier periods of our relationship. As we depend on third-party Internet-hosting providers to operate our business, increased computing and storage consumption by some of our customers can increase our hosting costs and impact our gross margins.
We invoice clients on varying billing cycles, including annually, quarterly and monthly; therefore, our deferred revenue balance does not represent the total contract value of our non-cancelable subscription agreements. Deferred revenue primarily consists of billings or payments received in advance of revenue recognition from subscription services described above and is recognized as the revenue recognition criteria are met. Backlog represents future billings under our non-cancelable subscription agreements that have not been invoiced or paid and; accordingly, not recorded in deferred revenue. Until such time as these amounts are invoiced or paid, they are not recorded in revenues, deferred revenue or elsewhere in our consolidated financial statements.
Backlog was approximately $122.0 million and $102.0 million as of April 30, 2015 and April 30, 2014, respectively. Of the $122.0 million backlog as of April 30, 2015, $16.7 million is not expected to be filled in the next year. We expect that the amount of backlog relative to the total value of our contracts will change from year to year for several reasons, for example contract terms could change depending on the specific timing of customer renewals, renewals may occur in advance of the stated term, billing cycles of non-cancelable subscription agreements may vary or customer financial circumstances could change. Each of these could have a significant impact on disclosed unbilled deferred revenue and total contract value. Accordingly, we believe that backlog is not a reliable indicator of future revenues because of these fluctuations and we do not utilize backlog as a key management metric to evaluate the Company’s operating or financial performance and other business trends.
46
Table of Contents
Key Business Metrics
In addition to macroeconomic trends affecting the demand for our solutions, management regularly reviews a number of key financial and operating metrics to evaluate our business, determine the allocation of our resources, make decisions regarding corporate strategies and evaluate forward-looking projections and trends affecting our business. The following table summarizes our key business metrics for continuing operations:
| Year Ended April 30, | ||||||||||||
| 2015 | 2014 | 2013 | ||||||||||
| (in thousands, except number of clients and client retention rate) | ||||||||||||
| Revenue: |
||||||||||||
| SaaS |
$ | 182,125 | $ | 161,328 | $ | 144,096 | ||||||
| Media |
9,056 | 6,817 | 2,716 | |||||||||
|
|
|
|
|
|
|
|||||||
| Total revenue |
$ | 191,181 | $ | 168,145 | $ | 146,812 | ||||||
|
|
|
|
|
|
|
|||||||
| Cash flow used in operations (1) |
$ | (15,965 | ) | $ | (43,467 | ) | $ | (21,811 | ) | |||
| Number of active clients (period end) (2) |
1,353 | 1,133 | 885 | |||||||||
| SaaS revenue per active client (3) |
$ | 146.5 | $ | 150.5 | $ | 157.7 | ||||||
| Active client retention rate (4) |
80.0 | % | 86.6 | % | 76.6 | % | ||||||
| Total revenue per employee (5) |
$ | 238.8 | $ | 217.8 | $ | 193.8 | ||||||
| SaaS impressions served (in millions) (6) |
279,705 | 214,966 | 145,554 | |||||||||
| (1) | Cash flow used in operations include combined cash flows from continuing operations along with discontinued operations. |
| (2) | Beginning as of our fourth quarter of fiscal year 2014, we define an active client as an organization from which we are currently recognizing recurring revenue. We count organizations that are closely related as one client, even if they have signed separate contractual agreements. Due to the presentation of the PowerReviews business as discontinued operations, the number of active clients above are from continuing operations only. As a result, our disclosure of active clients could include a common client for which we recognized recurring revenue who has organizations that have separate contractual agreements. All periods prior to the fourth quarter of fiscal 2014 have been revised to conform to this definition of an active client from continuing operations. |
| (3) | Calculated based on the average number of active clients for the period on a quarterly basis from continuing operations. |
| (4) | Calculated based on active client retention over a 12 month period from continuing operations. |
| (5) | Calculated based on the average number of full-time employees for the period on a quarterly basis. For the purpose of this calculation, we have excluded content moderators and full-time employees attributable to discontinued operations of PowerReviews for fiscal years 2014 and 2013, respectively. |
| (6) | The number of SaaS impressions are exclusive of impressions served on either the PowerReviews enterprise platform or the Express platform. |
Revenue
SaaS revenue consists primarily of fees from the sale of subscriptions to our hosted social commerce solutions, and we generally recognize revenue ratably over the related subscription period. We regularly review our revenue and revenue growth rate to measure our success. We believe that trends in revenue are important to understanding the overall health of our marketplace, and we use these trends in order to formulate financial projections and make strategic business decisions.
Media revenue consists primarily of fees charged to advertisers when their advertisements are displayed on our publishers’ websites and is net of amounts due to such publishers.
47
Table of Contents
Cash Flow Used in Operations
Cash flow used in operations is the cash that we use through the normal course of business and is measured prior to the impact of investing or financing activities. Due to the fact that we incur a significant amount of upfront costs associated with the acquisition of new clients with revenue recognized over an extended period, we consider cash flows used in operations to be a key measure of our operating performance.
Number of Active Clients
Beginning as of our fourth quarter of fiscal year 2014, we define an active client as an organization from which we are currently recognizing recurring revenue, and we count organizations that are closely related as one active client, even if they have signed separate contractual agreements. We believe that our ability to increase our active client base is a leading indicator of our ability to grow revenue. All prior periods have been revised to conform to this definition of an active client.
SaaS Revenue per Active Client
SaaS revenue per active client is calculated as SaaS revenue recognized during the period divided by the average number of active clients for the period. Since some of our new clients are added at initial pricing that is lower than our average pricing, our SaaS revenue per client could decline in the future.
Active Client Retention Rate
Active client retention rate is calculated based on the number of active clients at period end that were also active clients at the start of the period divided by the number of active clients at the start of the period. We believe that our ability to retain our active clients and expand their use of our solutions over time is a leading indicator of the stability of our revenue base and the long-term value of our client relationships.
Total Revenue per Employee
Revenue per employee is calculated as revenue recognized during the period divided by the average number of full-time employees for the period, excluding content moderators and employees attributable to the discontinued operations of PowerReviews. We believe revenue per employee is a leading indicator of our productivity and operating leverage. The growth of our business is dependent on our ability to hire the talented people we require to effectively capitalize on our market opportunity and scale with growth while maintaining a high level of client service.
SaaS Impressions
We define an impression as a single instance of online word of mouth delivered to an end user’s web browser. We believe that in combination with our active client base, impressions delivered is an indicator of the reach our network.
Key Components of Our Consolidated Statements of Operations
Revenue
We generate revenue principally from fixed commitment subscription contracts under which we provide clients with various services, including access to our hosted software platforms. For agreements with multiple elements, we evaluate each element in the arrangement to determine whether it represents a separate unit of accounting and recognize the allocated revenue for each unit of accounting over the respective service period. We sell these services under contractual agreements for service terms that are generally one year in length. Clients typically commit to fixed rate fees for the service term. Any revenue that does not meet the revenue recognition criteria is recorded as deferred revenue on our balance sheet. We invoice clients on varying billing
48
Table of Contents
cycles, including annually, quarterly and monthly; therefore, our deferred revenue balance does not represent the total contract value of our non-cancelable subscription agreements. Fees payable under these agreements are due in full within 30 to 90 days of invoicing and are non-refundable regardless of the actual use of the services and contain no general rights of return. No single client accounted for more than 10% of our revenue for fiscal years 2015, 2014 and 2013.
To date our revenue growth has been driven by the sale of our core ratings and reviews solutions. We currently expect that our revenue growth rate during fiscal year 2016 will be lower than our recent growth rates. This is due to a combination of factors including sales execution, lower client retention rates, and an increase in competitive pricing pressure due in part to the unique environment resulting from the terms of the Joint Stipulation and Order entered in connection with the antitrust lawsuit brought against us by the DOJ.
Cost of Revenue
Cost of revenue consists primarily of personnel costs and related expenses associated with employees and contractors who provide our subscription services, our implementation team, our content moderation teams and other support services provided as part of the fixed commitment subscription contracts. Cost of revenue also includes professional fees, including third-party implementation support, travel-related expenses and an allocation of general overhead costs. We allocate general overhead expenses to all departments based on the number of employees in each department, which we consider to be a fair and representative means of allocation and, as such, general overhead expenses, including depreciation and facilities costs, are reflected in our cost of revenue. Personnel costs include salaries, benefits, bonuses and stock-based expense. We generally invest in increasing our capacity, particularly in the areas of implementation and support, ahead of the growth in revenue, which can result in lower margins in a given investment period.
Cost of revenue also includes hosting costs, the amortization of capitalized internal-use software development costs incurred in connection with our hosted software platforms and third-party service costs to support and retain our clients.
We intend to continue to invest additional resources in our client services teams and in the capacity of our hosting service infrastructure due to increases in the volume of impressions and, as we continue to invest in technology innovation through our research and development organization, we will likely see an increase in the amortization expense associated with capitalized internal-use software development. The level and timing of investment in these areas could affect our cost of revenue, both in terms of absolute dollars and as a percentage of revenue in the future.
Operating Expenses
We classify our operating expenses into five categories: sales and marketing; research and development; general and administrative; acquisition-related and other; and amortization of acquired intangible assets. In each category, our operating expenses consist primarily of personnel costs, program expenses, professional fees, travel-related expenses and an allocation of our general overhead expenses, as applicable.
Sales and marketing. Sales and marketing expenses consist primarily of personnel costs for our sales, marketing and business development employees and executives, including salaries, benefits, stock-based expense, bonuses and commissions earned by our sales personnel. In fiscal year 2014 and 2013, sales and marketing also included contingent consideration resulting from the acquisition of Longboard Media. Also included are non-personnel costs such as professional fees, an allocation of our general overhead expenses and the costs of our marketing and brand awareness programs. Our marketing programs include our Bazaarvoice Summits, regional user groups, corporate communications, public relations and other brand building and product marketing expenses. We expense sales commissions when a client contract is executed because we believe our obligation to pay a sales commission arises at that time. We plan to continue investing in sales and marketing by focusing our marketing efforts on direct sales support and pipeline generation, which we believe will enable us to
49
Table of Contents
add new clients and increase penetration within our existing client base. We expect that in the foreseeable future, sales and marketing expenses may decrease as a percentage of revenue due to sales and marketing productivity given that we have additional products and solutions to sell; however, sales and marketing will continue to be our largest operating cost.
Research and development. Research and development expenses consist primarily of personnel costs for our product development employees and executives, including salaries, benefits, stock-based expense and bonuses. Also included are non-personnel costs such as professional fees payable to third-party development resources and an allocation of our general overhead expenses. A substantial portion of our research and development efforts are focused on enhancing our software architecture and adding new features and functionality to our platforms to address social and business trends as they evolve. We are also incurring an increasing amount of expenses in connection with our efforts to leverage data that we and our clients collect and manage through the use of our solutions. We expect that in the future, research and development expenses will increase as we continue to innovate and invest in new products and solutions.
General and administrative. General and administrative expenses consist primarily of personnel costs, including salaries, benefits, stock-based expense and bonuses for our administrative, legal, human resources, finance, accounting and information technology employees and executives. In fiscal year 2014 and 2013, general and administrative expenses also included contingent consideration (included as compensation) and revaluation of contingent consideration related to the acquisition of Longboard Media. Also included are non-personnel costs, such as travel-related expenses, professional fees and other corporate expenses, along with an allocation of our general overhead expenses. We will continue to incur incremental costs to meet the increased compliance requirements associated with being a public company. Those costs include increases in our accounting and legal personnel, additional consulting, legal, audit and tax fees, insurance costs, board of directors’ compensation and the costs of achieving and maintaining compliance with Section 404 of the Sarbanes-Oxley Act. However, we expect our general and administrative expenses to as a percentage of revenue over time due to the economies of scale.
Acquisition-related and other. Acquisition-related and other expenses consist of ongoing costs to comply with our obligations resulting from the divestiture of the PowerReviews business and costs incurred related to the acquisition of FeedMagnet. Legal and advisory expenses related to the divestiture of PowerReviews have been included as a component of “loss from discontinued operations, net of tax.” Included in “acquisition-related and other expenses” for all prior periods presented are legal and advisory fees for the U.S. Department of Justice suit related to our acquisition of PowerReviews.
Amortization of acquired intangible assets. The amortization of acquired intangible assets represents amortization of acquired customer relationship intangible assets from FeedMagnet and Longboard Media. Due to the presentation of PowerReviews as discontinued operations, all intangible assets related to PowerReviews for periods prior to its divestiture are included in “assets held for sale” and the related amortization expenses of these intangible assets for prior reporting periods are included as a component of “loss from discontinued operations, net of tax.”
Other Income (Expense), Net
Other expense consists primarily of interest income, interest expense related to our revolving line of credit, foreign exchange gains and losses and the resulting gain or loss from foreign exchange contracts. Interest income represents interest received on our cash and short-term investments Foreign exchange gains and losses arise from revaluations of foreign currency denominated monetary assets and liabilities and are partially offset by the change in market value of our foreign exchange contracts.
Income Tax Expense (Benefit)
As a result of our current net operating loss position in the United States, income tax expense consists primarily of corporate income taxes resulting from profits generated in foreign jurisdictions by wholly-owned
50
Table of Contents
subsidiaries, along with state income taxes payable in the United States. We expect our income tax expense to increase in the future if we become profitable both in the United States and in foreign jurisdictions.
Results of Operations
The following tables set forth our results of operations for the specified periods. The period-to-period comparisons of results are not necessarily indicative of results for future periods.
| Year Ended April 30, | ||||||||||||
| 2015 | 2014 | 2013 | ||||||||||
| (in thousands) | ||||||||||||
| Revenue |
$ | 191,181 | $ | 168,145 | $ | 146,812 | ||||||
| Cost of revenue (1) |
69,906 | 52,905 | 47,350 | |||||||||
|
|
|
|
|
|
|
|||||||
| Gross profit |
121,275 | 115,240 | 99,462 | |||||||||
| Operating expenses: |
||||||||||||
| Sales and marketing (1) |
78,373 | 86,482 | 73,114 | |||||||||
| Research and development (1) |
37,695 | 37,585 | 32,169 | |||||||||
| General and administrative (1) |
30,507 | 26,370 | 30,990 | |||||||||
| Acquisition-related and other |
4,046 | 16,184 | 10,487 | |||||||||
| Amortization of acquired intangible assets |
1,237 | 1,135 | 549 | |||||||||
|
|
|
|
|
|
|
|||||||
| Total operating expenses |
151,858 | 167,756 | 147,309 | |||||||||
|
|
|
|
|
|
|
|||||||
| Operating loss |
(30,583 | ) | (52,516 | ) | (47,847 | ) | ||||||
|
|
|
|
|
|
|
|||||||
| Total other expense, net |
(2,527 | ) | (830 | ) | (828 | ) | ||||||
|
|
|
|
|
|
|
|||||||
| Loss from continuing operations before income taxes |
(33,110 | ) | (53,346 | ) | (48,675 | ) | ||||||
| Income tax expense (benefit) |
54 | (500 | ) | (1,172 | ) | |||||||
|
|
|
|
|
|
|
|||||||
| Net loss from continuing operations |
$ | (33,164 | ) | $ | (52,846 | ) | $ | (47,503 | ) | |||
|
|
|
|
|
|
|
|||||||
| Other Financial Data: |
||||||||||||
| Adjusted EBITDA from continuing operations (2) |
$ | (8,680 | ) | $ | (21,875 | ) | $ | (21,862 | ) | |||
|
|
|
|
|
|
|
|||||||
| (1) | Includes stock-based expense as follows: |
| Cost of revenue |
$ | 1,517 | $ | 1,155 | $ | 677 | ||||||
| Sales and marketing |
3,923 | 4,496 | 3,033 | |||||||||
| Research and development |
2,561 | 2,817 | 2,840 | |||||||||
| General and administrative |
4,677 | 5,357 | 4,608 |
| (2) | We define Adjusted EBITDA from continuing operations (“Adjusted EBITDA”) as generally accepted accounting principles (“GAAP”) net loss from continuing operations adjusted for stock-based expense, contingent considerations related to acquisitions, adjusted depreciation and amortization (which excludes amortization of capitalized internal-use software development costs), integration and other costs related to acquisitions, other non-business costs and benefits, income tax expense and other (income) expense, net. Adjusted EBITDA is a financial measure that is not calculated in accordance with GAAP. See Item 6: “Selected Financial Data” of this Annual Report on Form 10-K for a reconciliation of net loss from continuing operations to Adjusted EBITDA from continuing operations. |
51
Table of Contents
The following tables set forth our results of operations for the specified periods as a percentage of revenue. The period-to-period comparisons of results are not necessarily indicative of results for future periods.
| Year Ended April 30, | ||||||||||||
| 2015 | 2014 | 2013 | ||||||||||
| Revenue |
100.0 | % | 100.0 | % | 100.0 | % | ||||||
| Cost of revenue (1) |
36.6 | 31.5 | 32.3 | |||||||||
|
|
|
|
|
|
|
|||||||
| Gross profit |
63.4 | 68.5 | 67.7 | |||||||||
| Operating expenses: |
||||||||||||
| Sales and marketing (1) |
40.9 | 51.3 | 49.8 | |||||||||
| Research and development (1) |
19.7 | 22.4 | 21.9 | |||||||||
| General and administrative (1) |
16.0 | 15.7 | 21.1 | |||||||||
| Acquisition-related and other |
2.1 | 9.6 | 7.1 | |||||||||
| Amortization of acquired intangible assets |
0.7 | 0.7 | 0.4 | |||||||||
|
|
|
|
|
|
|
|||||||
| Total operating expenses |
79.4 | 99.7 | 100.3 | |||||||||
|
|
|
|
|
|
|
|||||||
| Operating loss |
(16.0 | ) | (31.2 | ) | (32.6 | ) | ||||||
|
|
|
|
|
|
|
|||||||
| Total other expense, net |
(1.3 | ) | (0.5 | ) | (0.6 | ) | ||||||
|
|
|
|
|
|
|
|||||||
| Loss from continuing operations before income taxes |
(17.3 | ) | (31.7 | ) | (33.2 | ) | ||||||
| Income tax expense (benefit) |
— | (0.3 | ) | (0.8 | ) | |||||||
|
|
|
|
|
|
|
|||||||
| Net loss from continuing operations |
(17.3 | )% | (31.4 | )% | (32.4 | )% | ||||||
|
|
|
|
|
|
|
|||||||
| Other Financial Data: |
||||||||||||
| Adjusted EBITDA from continuing operations (2) |
(4.5 | )% | (13.0 | )% | (14.9 | )% | ||||||
|
|
|
|
|
|
|
|||||||
| (1) | Includes stock-based expense as follows: |
| Cost of revenue |
0.8 | % | 0.7 | % | 0.5 | % | ||||||
| Sales and marketing |
2.1 | 2.7 | 2.1 | |||||||||
| Research and development |
1.3 | 1.7 | 1.9 | |||||||||
| General and administrative |
2.4 | 3.2 | 3.1 |
| (2) | We define Adjusted EBITDA from continuing operations (“Adjusted EBITDA”) as generally accepted accounting principles (“GAAP”) net loss from continuing operations adjusted for stock-based expense, contingent considerations related to acquisitions, adjusted depreciation and amortization (which excludes amortization of capitalized internal-use software development costs), integration and other costs related to acquisitions, other non-business costs and benefits, income tax expense and other (income) expense, net. Adjusted EBITDA is a financial measure that is not calculated in accordance with GAAP. See Item 6: “Selected Financial Data” of this Annual Report on Form 10-K for a reconciliation of net loss from continuing operations to Adjusted EBITDA from continuing operations. |
Comparison of Our Fiscal Years Ended April 30, 2015 and 2014
Revenue
| Year Ended April 30, | ||||||||||||
| 2015 | 2014 | % Change | ||||||||||
| (dollars in thousands) | ||||||||||||
| Revenue |
$ | 191,181 | $ | 168,145 | 13.7 | % | ||||||
|
|
|
|
|
|
|
|||||||
Our revenue increased by $23.0 million, or 13.7%, for fiscal year 2015 compared to fiscal year 2014. Included in this increase was an increase in SaaS revenue of $20.8 million and an increase in Media revenue of
52
Table of Contents
$2.2 million. Of the $20.8 million increase in SaaS revenue, $20.3 million was largely generated from new launches of 447 active clients utilizing our platform and solutions since the prior year period. The remaining $0.5 million increase was generated from existing clients due to increased subscriptions of our products and offerings net of clients not renewing, renewing at a lower rate, renegotiating during the contract term, and a one-time termination fee of $0.8 million from an existing client. For fiscal year 2015, net new active client additions were 220 and our active client retention rate was 80.0% compared to net new active client additions of 248 and active client retention rate of 86.6% for fiscal year 2014. For fiscal year 2015, our client retention rate was lower as we adjusted our client count in fiscal year 2015 by 23 clients which represents an adjustment to previous fiscal quarters due to Connections-only clients who converted to a “Freemium” model in fiscal year 2014 and clients from the Shopzilla asset purchase which were a part of the PowerReviews divestiture. Further, the reduction in the client count also included certain clients from our FeedMagnet acquisition whose contracts expired. The annual subscription fees for these 23 clients were not significant. Our client retention rates can be impacted due to a variety of reasons including, but not limited to, non-renewals and the cyclical and discretionary nature of marketing and advertising spending. SaaS revenue per active client (in thousands) was $146.5 for fiscal year 2015 compared to SaaS revenue per active client (in thousands) of $150.5 for fiscal year 2014.
Cost of Revenue and Gross Profit Percentage
| Year Ended April 30, | ||||||||||||
| 2015 | 2014 | % Change | ||||||||||
| (dollars in thousands) | ||||||||||||
| Cost of revenue |
$ | 69,906 | $ | 52,905 | 32.1 | % | ||||||
| Gross profit |
121,275 | 115,240 | 5.2 | |||||||||
| Gross profit percentage |
63.4 | % | 68.5 | % | ||||||||
Cost of revenue increased $17.0 million, or 32.1%, for fiscal year 2015 compared to fiscal year 2014. This increase was primarily due to an increase of $7.5 million in personnel-related expenses as a result of increased headcount of our client services, professional services, and implementation of new clients. Additional increases for fiscal year 2015 includes $6.2 million in costs associated with hosting services due to an increase in the volume of impressions, $0.6 million in professional fees due to increased use of third-party contractor resources and $2.7 million in travel and allocated overhead expenses. Our cost of revenue for fiscal year 2015 includes $0.7 million of amortization of developed technology acquired from FeedMagnet. Gross profit percentage decreased to 63.4% for fiscal year 2015 compared to 68.5% for fiscal year 2014 as we increased investment in retention by adding resources to our client services team and in professional services to grow our best practice consulting services.
Operating Expenses
| Year Ended April 30, | ||||||||||||||||||||
| 2015 | 2014 | |||||||||||||||||||
| Amount | % of Revenue |
Amount | % of Revenue |
% Change |
||||||||||||||||
| (dollars in thousands) | ||||||||||||||||||||
| Sales and marketing |
$ | 78,373 | 40.9 | % | $ | 86,482 | 51.3 | % | (9.4 | )% | ||||||||||
| Research and development |
37,695 | 19.7 | 37,585 | 22.4 | 0.3 | |||||||||||||||
| General and administrative |
30,507 | 16.0 | 26,370 | 15.7 | 15.7 | |||||||||||||||
| Acquisition-related and other |
4,046 | 2.1 | 16,184 | 9.6 | (75.0 | ) | ||||||||||||||
| Amortization of acquired intangible assets |
1,237 | 0.7 | 1,135 | 0.7 | 9.0 | |||||||||||||||
|
|
|
|
|
|||||||||||||||||
| Total operating expenses |
$ | 151,858 | 79.4 | % | $ | 167,756 | 99.7 | % | (9.5 | )% | ||||||||||
|
|
|
|
|
|||||||||||||||||
Sales and marketing. Sales and marketing expenses decreased by $8.0 million, or 9.4%, for fiscal year 2015 compared to fiscal year 2014. For fiscal year 2015, personnel-related expenses decreased by $4.6 million due to a
53
Table of Contents
decrease in headcount as we continue to leverage our more experienced sales force. The decrease in headcount also resulted in a $1.0 million decrease in travel expenses. Facilities and allocated overhead expenses decreased $0.7 million. Professional services decreased by $2.4 million due to decreased use of third-party contractor resources. These decreases were offset by a $0.4 million increase in marketing expenses as we hosted our annual marketing event “Bazaarvoice Summit” for current and prospective clients during fiscal year 2015, which we did not host in fiscal year 2014. A benefit of $0.3 million was realized during fiscal year 2014 due to the decrease in fair value of the liability for contingent consideration related to the acquisition of Longboard media as the payout was determined to be zero as of January 31, 2014.
Research and development. Research and development expenses stayed relatively constant at $37.7 million for fiscal year 2015. A decrease of $1.2 million in personnel-related expenses due to a decrease in headcount was offset by an increase of $0.7 million due to increased use of third-party contractor resources and a $0.6 million increase in allocated overhead expenses and facilities-related expenses for fiscal year 2015.
General and administrative. General and administrative expenses increased $4.1 million, or 15.7%, for fiscal year 2015 compared to fiscal year 2014. The increase was primarily due to personnel-related expenses which includes a benefit of $3.6 million realized during fiscal year 2014 from the decrease in fair value of the liability for contingent consideration related to the acquisition of Longboard Media as the payout was estimated to be zero as of January 31, 2014. This prior year benefit was partially offset by a benefit of $0.4 million realized in fiscal year 2015 representing a reduction in our estimated liability recorded in fiscal year 2013 in connection with our treatment of certain stock option grants. In fiscal year 2015, bad debt increased $1.4 million and depreciation and overhead increased $0.6 million. These increases were partially offset by a $1.1 million state sales tax benefit realized in fiscal 2015.
Acquisition-related and other. Acquisition-related and other expenses decreased $12.1 million, or 75.0%, for fiscal year 2015 compared to fiscal year 2014. This decrease was primarily the result of higher expenses in fiscal year 2014 due to the U.S Department of Justice lawsuit related to our acquisition of PowerReviews and the subsequent divestiture of PowerReviews in fiscal year 2015. We incurred $4.0 million for fiscal year 2015 primarily for the legal and other advisory costs incurred to comply with our ongoing obligations from the divestiture of the PowerReviews business and the shareholder derivative action filed in connection with the acquisition of PowerReviews.
Amortization of acquired intangibles. The amortization of acquired intangible assets represents amortization of acquired customer relationship intangible assets from FeedMagnet and Longboard Media. Due to the presentation of PowerReviews as discontinued operations as of April 30, 2014, the related amortization expense of the PowerReviews intangible assets for fiscal year 2014 is now included as a component of “loss from discontinued operations, net of tax.” Amortization from continuing operations is presented separately in the statement of operations and was $1.2 million for fiscal year 2015 and $1.1 million for fiscal year 2014. The $0.1 million increase in amortization expense for fiscal year 2015 was due to the amortization of FeedMagnet customer relationships which were acquired on April 15, 2014.
Other Income (Expense), Net
| Year Ended April 30, | ||||||||||||||||||||
| 2015 | 2014 | |||||||||||||||||||
| Amount | % of Revenue |
Amount | % of Revenue |
% Change |
||||||||||||||||
| (dollars in thousands) | ||||||||||||||||||||
| Interest income |
$ | 95 | — | % | $ | 143 | 0.1 | % | (33.6 | )% | ||||||||||
| Interest expense |
(1,451 | ) | (0.7 | ) | (190 | ) | (0.1 | ) | 663.7 | |||||||||||
| Other expense |
(1,171 | ) | (0.6 | ) | (783 | ) | (0.5 | ) | 49.6 | |||||||||||
|
|
|
|
|
|||||||||||||||||
| Total other expense, net |
$ | (2,527 | ) | (1.3 | )% | $ | (830 | ) | (0.5 | )% | 204.5 | % | ||||||||
|
|
|
|
|
|||||||||||||||||
54
Table of Contents
Total other expense, net, increased by $1.7 million in fiscal year 2015 compared to fiscal year 2014 due to an increase of $1.3 million of interest expense related primarily to our revolving line of credit for fiscal year 2015 and an increase of $0.4 million in other expense due to realized gains and losses on transactions in foreign currencies.
Income Tax Expense (Benefit)
| Year Ended April 30, | ||||||||||||||||||||
| 2015 | 2014 | |||||||||||||||||||
| Amount | % of Revenue |
Amount | % of Revenue |
% Change |
||||||||||||||||
| (dollars in thousands) | ||||||||||||||||||||
| Income tax expense (benefit) |
$ | 54 | — | % | $ | (500 | ) | (0.3 | )% | (110.8 | )% | |||||||||
Income tax expense increased by $0.5 million in fiscal year 2015 compared to fiscal year 2014 due to an estimated increase in foreign and state taxes payable. Further, fiscal year 2014 included a benefit of $0.4 million from the 2013 Texas state research and development tax credit, which was enacted in the first quarter of fiscal year 2014.
Comparison of Our Fiscal Years Ended April 30, 2014 and 2013
Revenue
| Year Ended April 30, | ||||||||||||
| 2014 | 2013 | % Change | ||||||||||
| (dollars in thousands) | ||||||||||||
| Revenue |
$ | 168,145 | $ | 146,812 | 14.5 | % | ||||||
|
|
|
|
|
|
|
|||||||
Our revenue increased by $21.3 million, or 14.5%, for fiscal year 2014 compared to fiscal year 2013. Included in this increase was an increase in SaaS revenue of $17.2 million and an increase in Media revenue of $4.1 million. Of the $17.2 million increase in SaaS revenue, $7.0 million was largely generated from new launches of 331 active clients utilizing our platform and solutions during the period as we continued to increase our market penetration. The remaining $10.2 million increase was generated from existing clients due to increased subscriptions of our products and offerings net of clients not renewing, renewing at a lower rate, and renegotiating during the contract term. For fiscal year 2014, net new active client additions were 248 and active client retention rate was 86.6% compared to net new active client additions of 103 and active client retention rate of 76.6% for fiscal year 2013. SaaS revenue per active client (in thousands) was $150.5 for fiscal year 2014 compared to SaaS revenue per active client (in thousands) of $157.7 for fiscal year 2013. In fiscal year 2013, approximately 90 clients who were subscribing to our Connection solutions only were converted to a ‘freemium’ model which resulted in a decline in our active client retention rate. As the revenue per client for these Connections only clients was low, this shift did not have a significant impact on SaaS revenue per client. Further, our client retention rates can be impacted due to a variety of reasons including, but not limited to, non-renewals, renewals at less favorable terms and the cyclical and discretionary nature of marketing and advertising spending.
Cost of Revenue and Gross Profit Percentage
| Year Ended April 30, | ||||||||||||
| 2014 | 2013 | % Change | ||||||||||
| (dollars in thousands) | ||||||||||||
| Cost of revenue |
$ | 52,905 | $ | 47,350 | 11.7 | % | ||||||
| Gross profit |
115,240 | 99,462 | 15.9 | |||||||||
| Gross profit percentage |
68.5 | % | 67.7 | % | ||||||||
55
Table of Contents
Cost of revenue increased $5.6 million, or 11.7%, for fiscal year 2014 compared to fiscal year 2013. This increase was primarily due to increases of $5.6 million in costs associated with hosting services and capitalized internal-use software development costs, $0.6 million in personnel-related expenses and $0.4 million of allocated overhead expenses. These increases were partially offset by a reduction of $1.0 million in travel related expense. Gross profit percentage increased to 68.5% in fiscal year 2014 compared to 67.7% in fiscal year 2013 largely due to the inclusion of a full fiscal year of our Media business revenues in fiscal year 2014.
Operating Expenses
| Year Ended April 30, | ||||||||||||||||||||
| 2014 | 2013 | |||||||||||||||||||
|
Amount |
% of Revenue |
Amount |
% of Revenue |
% Change |
||||||||||||||||
| (dollars in thousands) | ||||||||||||||||||||
| Sales and marketing |
$ | 86,482 | 51.3 | % | $ | 73,114 | 49.8 | % | 18.3 | % | ||||||||||
| Research and development |
37,585 | 22.4 | 32,169 | 21.9 | 16.8 | |||||||||||||||
| General and administrative |
26,370 | 15.7 | 30,990 | 21.1 | (14.9 | ) | ||||||||||||||
| Acquisition-related and other |
16,184 | 9.6 | 10,487 | 7.1 | 54.3 | |||||||||||||||
| Amortization of acquired intangible assets |
1,135 | 0.7 | 549 | 0.4 | 106.7 | |||||||||||||||
|
|
|
|
|
|||||||||||||||||
| Total operating expenses |
$ | 167,756 | 99.7 | % | $ | 147,309 | 100.3 | % | 13.9 | % | ||||||||||
|
|
|
|
|
|||||||||||||||||
Sales and marketing. Sales and marketing expenses increased $13.4 million, or 18.3%, for fiscal year 2014 compared to fiscal year 2013. This increase was primarily due to growth in our sales and marketing headcount compared to fiscal year 2013, resulting in an increase of $7.1 million for personnel-related expenses. Expansion of our sales and marketing efforts also resulted in increases of $2.3 million in professional fees, $1.9 million in allocated overhead expenses, $1.3 million in travel related expenses, $0.6 million in facility-related expenses and $0.5 million in depreciation and amortization. These increases were partially offset by a decrease of $0.3 million in marketing expenses.
Research and development. Research and development expenses increased $5.4 million, or 16.8%, for fiscal year 2014 compared to fiscal year 2013. This increase was primarily due to an increase in personnel-related expenses of $3.0 million as we continued to expand our research and development team. This expansion also resulted in increases of $1.9 million in professional fees due to increased use of third party contractor resources and $0.9 million in allocated overhead expenses. These increases were partially offset by a $0.4 million decrease in travel related expenses.
General and administrative. General and administrative expenses decreased $4.6 million, or 14.9%, for fiscal year 2014 compared to fiscal year 2013 largely due to the $2.3 million incremental decrease in fair value of the liability for contingent consideration related to the acquisition of Longboard Media. During fiscal year 2014, we concluded that the underlying performance goals were not met and the payout for the contingent consideration was reduced to zero. Personnel-related expenses decreased by $0.5 million. Other decreases include $0.8 million in professional fees as additional expenses were incurred in fiscal year 2013 which was our first fiscal year of being a publically traded company. Bad debt expenses decreased by $1.0 million due to improved collections in our fourth quarter of fiscal year 2014.
Acquisition-related and other. We incurred $16.2 and $10.5 million in acquisition-related expenses for legal and advisory fees for the U.S. Department of Justice suit related to our acquisition of PowerReviews in fiscal year 2014 and 2013, respectively, and legal and advisory expenses related to our acquisition of Longboard Media in fiscal year 2013. All other legal and advisory expenses related to our acquisition of PowerReviews are included as a component of “Loss from discontinued operations, net of tax.” We did not incur significant acquisition-related expense for our acquisition of FeedMagnet.
56
Table of Contents
Amortization of acquired intangibles. Amortization of acquired intangibles represents amortization of the customer relationships purchased in the FeedMagnet and Longboard Media acquisitions. This amortization is presented separately in the statement of operations and was $1.1 million and $0.5 million for fiscal years 2014 and 2013, respectively. The $0.6 million increase is primarily due to the inclusion of amortization of customer relationships purchased in the Longboard Media acquisition for the full fiscal year 2014.
Other Income (Expense), Net
| Year Ended April 30, | ||||||||||||||||||||
| 2014 | 2013 | |||||||||||||||||||
| Amount | % of Revenue |
Amount | % of Revenue |
% Change |
||||||||||||||||
| (dollars in thousands) | ||||||||||||||||||||
| Interest income |
$ | 143 | 0.1 | % | $ | 217 | 0.1 | % | (34.1 | )% | ||||||||||
| Interest expense |
(190 | ) | (0.1 | )% | (526 | ) | (0.4 | )% | (63.9 | )% | ||||||||||
| Other expense |
(783 | ) | (0.5 | ) | (519 | ) | (0.3 | ) | 50.9 | |||||||||||
|
|
|
|
|
|||||||||||||||||
| Total other expense, net |
$ | (830 | ) | (0.5 | )% | $ | (828 | ) | (0.6 | )% | 0.2 | % | ||||||||
|
|
|
|
|
|||||||||||||||||
Total other expense stayed relatively constant from fiscal year 2013 to fiscal year 2014. This is largely due to interest income from our investments which decreased by $0.1 million during fiscal year 2014 compared to fiscal year 2013, offset by an increase of $0.1 million of interest expense due to our draw down of $27.0 million of the unused balance of our revolving line of credit.
Income Tax Benefit
| Year Ended April 30, | ||||||||||||||||||||
| 2014 | 2013 | |||||||||||||||||||
| Amount | % of Revenue |
Amount | % of Revenue |
% Change |
||||||||||||||||
| (dollars in thousands) | ||||||||||||||||||||
| Income tax benefit |
$ | (500 | ) | (0.3 | )% | $ | (1,172 | ) | (0.8 | )% | (57.3 | )% | ||||||||
We recognized a net income tax benefit of $0.5 million for fiscal year 2014 compared to income tax benefit of $1.2 million for fiscal year 2013. Included in fiscal year 2014 is a $1.4 million tax benefit resulting from a reduction in the valuation allowance related to our acquisition of FeedMagnet. Also included in fiscal year 2014 is a benefit of $0.4 million related to a 2013 Texas state research and development credit which was enacted in the first quarter of fiscal year 2014. Included in fiscal year 2013 is a $2.5 million tax benefit from a reduction in the valuation allowance related to our acquisition of Longboard Media.
Liquidity and Capital Resources
Our principal source of liquidity at April 30, 2015 consisted of $106.8 million of cash and cash equivalents and short term investments. Cash and cash equivalents consist of cash, money market funds, certificates of deposit, municipal bonds, commercial paper and corporate bonds. Our short-term investments consist of certificates of deposit, municipal bonds, commercial paper, U.S. Treasury notes and bonds that are a guaranteed obligation of the U.S. Government, corporate notes and corporate bonds. As of April 30, 2015, the amount of cash and cash equivalents held by foreign subsidiaries was $4.0 million. If these funds are needed for our domestic operations, we would be required to accrue and pay U.S. taxes to repatriate these funds. However, our intent is to permanently reinvest these funds outside the U.S. and our current plans do not demonstrate a need to repatriate them to fund our domestic operations. We do not provide for federal income taxes on the undistributed earnings of our foreign subsidiaries.
57
Table of Contents
On February 21, 2014, we drew down $27.0 million of the unused balance of our previous revolving line of credit. The funds were largely used for general corporate purposes and for the acquisition of FeedMagnet in fiscal year 2014. On July 2, 2014, we completed the sale of PowerReviews for total consideration of $30.0 million consisting of $25.5 million in cash and $4.5 million which remains in escrow as a partial security for our indemnification obligations under the definitive agreement and is set to expire in July 2015. On November 21, 2014, we entered into a $70.0 million secured revolving credit facility pursuant to an Amended and Restated Credit Facility (the “Credit Facility”) dated as of November 21, 2014. The Credit Facility amended and restated the Company’s prior $30.0 million secured revolving credit facility. On November 21, 2014, we drew down $57.0 million of the unused balance of the Credit Facility, of which, $27.0 million was used to repay the amount drawn down in February 2014. Our principal needs for liquidity include funding our operating losses, working capital requirements, capital expenditures, repaying our outstanding revolving line of credit and acquisitions. We believe that our available resources are sufficient to fund our liquidity requirements for at least the next 12 months.
Further, we anticipate making significant investments in growth and initiatives designed to improve our operating efficiency for the foreseeable future, which may impact our ability to generate positive cash flow from operating activities in the near-term. Our future capital requirements will depend on many factors, including our rate of client and revenue growth, the expansion of our sales and marketing activities, capital expenditures for our new Austin facilities, the timing and extent of spending to support product development efforts, the timing of introductions of new features and enhancements to our social commerce platforms and future acquisitions of, or investments in, complementary businesses and technologies. The timing, frequency, and pattern of our billing mix can also impact our operating cash flows. To the extent that existing cash, cash equivalents and short-term investments along with future cash flow from operations are insufficient to fund our future activities, we may need to raise additional funds through public or private equity or debt financing. Additional funds may not be available on terms favorable to us or at all.
We typically invoice our new and existing SaaS business clients for our subscription services in a varying mix of frequencies such as; monthly, quarterly, semiannual and annual billings. Bookings and therefore billings for our SaaS business are typically higher in the second half of our fiscal year while billings for our media business increase significantly during the holiday season. These factors may result in an increase in our accounts receivable. Similarly, increases in new client launches lead to increased billings, which in turn also increases our accounts receivable. The operating cash flow benefit of increased billing activity generally occurs in the subsequent quarters when we collect from our clients.
Days sales outstanding (“DSO”) is calculated by dividing period end accounts receivable by average daily sales for the fiscal quarter. DSO was 91 days for the fourth quarter of fiscal year 2015 compared to 82 days for the fourth quarter of fiscal year 2014 and 64 days for the fourth quarter of fiscal year 2013. Accounts receivable increased due to the factors described above and the timing of our sales and cash collections.
Our DSO fluctuates from period to period and year over year, primarily due to the seasonal nature of our new bookings and related renewals, the seasonal nature of our media business, the frequency of our customer billings which vary throughout the fiscal year, and the timing of our cash collections. These trends result in changes in accounts receivable balances that are different than our revenue growth trends. Although period end accounts receivable fluctuates because of these factors, the average daily sales for the period do not because we recognize revenue ratably over the terms of our customer contracts. Accordingly, our average daily sales are not influenced by factors such as seasonality, billing frequency and billing timing.
The following table summarizes our cash flows for the periods indicated:
| Year Ended April 30, | ||||||||||||
| 2015 | 2014 | 2013 | ||||||||||
| (in thousands) | ||||||||||||
| Net cash used in operating activities |
$ | (15,965 | ) | $ | (43,467 | ) | $ | (21,811 | ) | |||
| Net cash provided by (used in) investing activities |
1,884 | 9,207 | (91,084 | ) | ||||||||
| Net cash provided by financing activities |
36,845 | 40,715 | 63,679 | |||||||||
58
Table of Contents
Net Cash Used in Operating Activities
Net cash used in operating activities is primarily influenced by the amount of cash we invest in personnel and infrastructure to support the anticipated growth of our business, the increase in the number of clients using our platform and the amount and timing of client payments.
For fiscal year 2015, operating activities used $16.0 million of cash after changes in our operating assets and liabilities, offsetting a net loss of $34.4 million. A decrease of $28.7 million in our net loss during fiscal year 2015, which had the impact of improving cash flows from operating activities, was primarily due to the $12.1 million decrease in our acquisition-related and other expenses which resulted from higher expenses in fiscal year 2014 attributable to the U.S. Department of Justice lawsuit related to our acquisition of PowerReviews and the subsequent divestiture of PowerReviews in fiscal year 2015. The net loss includes non-cash depreciation and amortization of $12.4 million, non-cash loss on disposal of discontinued operations, net of tax, of $1.5 million, non-cash stock-based expense of $12.8 million and non-cash bad debt and other non-cash expenses of $3.4 million. Accounts receivables, prepaid expenses and other current assets and other non-current assets increased $13.9 million. The $13.6 million increase in accounts receivables was primarily due to the increase in our SaaS customer billings driven by a higher mix of annual billings and the timing of cash collections. An increase of $6.3 million in deferred revenues was partially offset by a decrease of $4.1 million in accounts payable, accrued expenses and other current liabilities and other long-term liabilities; resulting in a net decrease of $11.7 million in operating assets and liabilities.
For fiscal year 2014, operating activities used $43.5 million of cash after changes in our operating assets and liabilities, offsetting a net loss of $63.2 million which included non-cash depreciation and amortization of $15.1 million, non-cash impairment of acquired intangible assets of $2.5 million, non-cash estimated loss on disposal of discontinued operations, net of tax, of $9.2 million, non-cash stock-based expense of $14.5 million, non-cash benefit related to the revaluation of contingent consideration of $3.3 million, non-cash bad debt expense of $1.9 million, non-cash benefit related to stock-based expense of $0.2 million and other non-cash expenses of $0.5 million. Accounts receivable increased by $12.1 million, primarily due to our increase in billings, and prepaid expenses and other current assets and other non-current assets also increased by $3.1 million. Accounts payable, accrued expenses and other current liabilities and other long-term liabilities decreased by $7.3 million and were partially offset by a $2.0 million increase in deferred revenues; resulting in a net decrease of cash of $20.5 million due to changes in operating assets and liabilities. Included in changes for accrued liabilities and accounts payable was $22.6 million which we spent on legal and advisory fees for the DOJ suit related to our acquisition of PowerReviews.
For fiscal year 2013, operating activities used $21.8 million of cash after changes in our operating assets and liabilities, offsetting a net loss of $63.8 million which included non-cash depreciation and amortization of $10.9 million, non-cash stock-based expense of $22.5 million, non-cash benefit related to the revaluation of contingent consideration of $1.0 million, non-cash bad debt expense of $2.9 million and a non-cash tax benefit related to stock options of $0.5 million. Accounts receivable, prepaid expenses and current other assets and other non-current assets increased $12.9 million, which partially offset an increase of $20.1 million in accounts payable, accrued expenses, deferred revenue and other liabilities; resulting in a net increase of cash of $7.2 million due to changes in operating assets and liabilities. Included in changes for accrued liabilities and accounts payable was $6.4 million which we spent on legal and advisory fees for the U.S. Department of Justice suit related to our acquisition of PowerReviews.
Net Cash Provided by (Used in) Investing Activities
Our primary investing activities have consisted of acquisitions, purchases of short-term investments and property and equipment, including technology hardware and software to support our growth as well as costs capitalized in connection with the development of our internal-use hosted software platform. Purchases of property and equipment may vary from period to period due to the timing of the expansion of our operations and
59
Table of Contents
the development cycles of our internal-use hosted software platform. We expect to continue to invest in short-term investments, property and equipment and developing our software platform for the foreseeable future.
For fiscal year 2015, investing activities provided $1.9 million, which included proceeds of $25.5 million from the sale of the PowerReveiws business and a $0.5 million decrease in restricted cash, offset by $12.1 million of purchases of short-term investments, net of sales and maturities of short-term investments, and $12.0 million in purchases of property, equipment and capitalized internal-use software development costs.
For fiscal year 2014, investing activities provided $9.2 million, which included proceeds of $29.5 million from the maturities and sales of short-term investments, net of purchases of short-term investments, offset by $10.7 million in purchases of property, equipment and capitalized internal-use software development costs and $9.6 million related to acquisitions, mainly FeedMagnet.
For fiscal year 2013, investing activities used $91.1 million, which included an outlay of $60.8 million, net of cash acquired, used in our acquisitions of PowerReviews, Longboard Media, and the purchase of customer contracts from Shopzilla. The remainder of our investing activities were related to the purchases, sales and maturities of short-term investments, purchases of property, plant and equipment and capitalized costs related to our internal-use software.
Net Cash Provided by Financing Activities
Our financing activities have consisted primarily of net proceeds from the issuance of common stock, proceeds from the exercises of options to purchase common stock and borrowings from our revolving line of credit.
For fiscal year 2015, financing activities provided $36.8 million primarily due to $30.0 million of net proceeds from our revolving line of credit partially offset by $0.7 million in deferred financing costs. We also had proceeds of $5.0 million from the exercise of option to purchase our common stick and contributions of $2.5 million to our Employee Stock Purchase Plan.
For fiscal year 2014, financing activities provided $40.7 million, which consisted primarily of proceeds of $13.5 million from the exercise of options to purchase shares of our common stock and proceeds of $27.0 million draw down of the unused balance of our revolving line of credit.
For fiscal year 2013, financing activities provided $63.7 million, which included $51.9 million of net proceeds from our follow-on offering in July 2012 and $11.2 million from the exercise of options to purchase shares of our common stock.
Contractual Obligations and Commitments
The contractual commitment amounts in the table below are associated with agreements that are enforceable and legally binding. Obligations under contracts that we can cancel without cause and without a material penalty are not included in the table below. Obligations arising from unrecognized tax benefits are not included in the contractual obligations because it is expected that the unrecognized benefits would result in an insignificant amount of cash payments as the Company has generated net operating losses.
60
Table of Contents
The following table summarizes our future minimum payments under non-cancelable operating leases, debt principal payment, and debt interest payments as of April 30, 2015:
| Payments due by Period | ||||||||||||||||||||
| Total | Less than 1 Year |
1-3 Years |
3-5 Years |
After 5 Years |
||||||||||||||||
| (in thousands) | ||||||||||||||||||||
| Operating lease obligations |
$ | 52,609 | $ | 4,831 | $ | 12,391 | $ | 9,447 | $ | 25,940 | ||||||||||
| Principal debt obligations |
57,000 | — | 57,000 | — | — | |||||||||||||||
| Interest on debt obligations (1) |
5,456 | 4,261 | 1,195 | — | — | |||||||||||||||
|
|
|
|
|
|
|
|
|
|
|
|||||||||||
| Total |
$ | 115,065 | $ | 9,092 | $ | 70,586 | $ | 9,447 | $ | 25,940 | ||||||||||
|
|
|
|
|
|
|
|
|
|
|
|||||||||||
| (1) | Future interest on debt obligations calculated using the interest rate effective as of the April 30, 2015. |
We do not have any material capital lease obligations and all of our property, equipment and software has been purchased with cash. We have no material purchase obligations outstanding with any vendors or third-parties.
We have non-cancelable operating lease obligations related to our office space, the largest of which is for our headquarters in Austin, Texas. On November 13, 2014, we entered into a new lease (the “Lease”), pursuant to which we will lease approximately 137,615 square feet of office space in Austin, Texas. This will serve as the new headquarters of the Company and will be used for general office purposes. The term of the Lease commences on January 1, 2016 unless otherwise modified and terminates approximately ten years and six months thereafter.
On November 21, 2014, we entered into an Amended and Restated Credit Facility (the “Credit Facility”) with Comerica Bank which provides for a secured, revolving line of credit of up to $70.0 million, with a sublimit of $3.0 million for the incurrence of swingline loans and a sublimit of $15.0 million for the issuance of letters of credit. The Credit Facility amended and restated a 2007 loan agreement and all letters of credits under the 2007 loan agreement were transferred to the Credit Facility, including $0.3 million in the form of letters of credit as a security deposit for the leased San Francisco office space. The revolving line of credit bears interest at the adjusted LIBOR rate plus 3.5%. On November 21, 2014, we drew down $57.0 million of the unused balance of the Credit Facility, of which, $27.0 million was used to repay the outstanding balance on the Loan Agreement. On December 4, 2014, we drew down $8.0 million in the form of a letter of credit as a security deposit for the lease for our new headquarters (See Note 15 to the Notes to Audited Consolidated Financial Statements of this Annual Report on Form 10-K). In January 2015, we transferred a $1.0 million Pledge and Security Agreement to be included as a form of a letter of credit under the Credit Facility, resulting in an unused balance of $3.7 million as of April 30, 2015. The Credit Facility expires on November 21, 2017 with all advances immediately due and payable. The Company was in compliance with all financial covenants contained in the Credit Facility as of April 30, 2015.
The Credit Facility contains certain restrictive covenants that limit our and our subsidiaries’ ability to, among other things, incur additional indebtedness or guarantee indebtedness of others; make payments on additional indebtedness or make changes to certain agreements related to additional indebtedness; enter into hedging arrangements; create liens on our assets; make loans and investments; make capital expenditures; dispose of assets; store inventory and equipment with others; pay dividends or make distributions on, or purchase or redeem, our capital stock; enter into mergers or consolidations with or into other entities; undergo a change of control; engage in different lines of business; or enter into transactions with affiliates. The Credit Facility also contains numerous affirmative covenants, including covenants regarding, among other things, compliance with applicable laws and regulations, reporting, payment of taxes and other obligations, maintenance of insurance coverage, maintenance of bank and investment accounts with the financial institution and its affiliates, registration of intellectual property rights, and obtaining certain third-party consents and waivers. As of April 30, 2015, we were in compliance with all financial covenants contained in the Credit Facility.
61
Table of Contents
On November 4, 2008, the Company entered into a Pledge and Security Agreement with Comerica for a standby letter of credit for credit card services from a separate financial institution which was amended on October 29, 2014 to increase the standby letter of credit by $0.5 million to $1.0 million. The Company pledged a security interest in its money market account, in which the balance must equal at least the credit extended. This letter of credit expires annually, and the pledged security interest is recorded as short-term restricted cash in the Company’s consolidated financial statements. In January 2015, the Company transferred the $1.0 million Pledge and Security Agreement to be included as a form of letter of credit under the Credit Facility, therefore the Pledge and Security Agreement obligations are no longer considered restricted cash.
Off-Balance Sheet Arrangements
We do not have any off-balance sheet arrangements that have or are reasonably likely to have a material current or future effect on our financial condition, changes in financial condition, revenues or expenses, results of operations, liquidity, capital expenditures or capital resources.
Critical Accounting Policies and Estimates
We prepare our consolidated financial statements in accordance with GAAP and include the accounts of Bazaarvoice, Inc. and our wholly owned subsidiaries. The preparation of these consolidated financial statements requires us to make estimates and assumptions that affect the reported amounts of assets, liabilities, revenue, costs, expenses and related disclosures. On an ongoing basis, we evaluate our estimates and assumptions. To the extent there are material differences between these estimates and our actual results, our consolidated financial statements will be affected.
Our significant accounting policies are described in Note 2 of the Notes to Consolidated Financial Statements under Item 8: “Financial Statements and Supplementary Data” of this Annual Report on Form 10-K, and we believe that the accounting policies discussed below involve the greatest degree of complexity and exercise of judgment by our management. The methods, estimates and judgments that we use in applying our accounting policies have a significant impact on our results of operations and, accordingly, we believe the policies described below are the most critical for understanding and evaluating our financial condition and results of operations.
Revenue Recognition
In general, we recognize revenue when (i) persuasive evidence of an arrangement exists, (ii) delivery has occurred or services have been rendered to the client, (iii) the fee is fixed or determinable and (iv) collectability is reasonably assured.
We generate revenue primarily from sales of the following services:
Software as a Service (“SaaS”)
We generate SaaS revenue from two sources: 1) various subscription products; and 2) professional services. Subscription revenue includes subscription fees from clients accessing our cloud-based social commerce platform and our application services pursuant to service agreements that are generally one year in length. Professional services consist of fees associated with providing expert services that educate and assist our clients on the best use of our solutions as well as assist in the implementation of our solutions. Professional services are not required for customers to utilize our solutions. The client does not have the right to take possession of the software supporting the application service at any time, nor do the arrangements contain general rights of return.
Multiple Deliverable Arrangements
Typically, revenue from new clients consists of agreements with multiple elements, comprised of subscription fees for our products and professional services. We evaluate each element in a multiple-element
62
Table of Contents
arrangement to determine whether it represents a separate unit of accounting. An element constitutes a separate unit of accounting when the delivered item has standalone value and delivery of the undelivered element is probable and within our control. Various subscription based products have standalone value because they are routinely sold separately by us. In determining whether professional services can be accounted for separately from subscription services, we considered the availability of the professional services from other vendors, the nature of our professional services and whether we sell our applications to new clients without professional services. The majority of our professional services contracts are offered on a time and material basis. When these services are not combined with subscription and support revenue in a multiple-element arrangement, services revenue is recognized as the services are rendered.
If the deliverables have standalone value upon delivery, we account for each deliverable separately and revenue is recognized for the respective deliverables over the respective service period. If one or more of the deliverables does not have standalone value upon delivery, the deliverables that do not have standalone value are generally combined with the final deliverable within the arrangement and treated as a single unit of accounting. Revenue for arrangements treated as a single unit of accounting is generally recognized over the period commencing upon delivery of the final deliverable and over the remaining term of the subscription contract.
We allocate revenue to each element in an arrangement based on a selling price hierarchy. The selling price for a deliverable is based on its vendor-specific objective evidence (“VSOE”), if available, third-party evidence (“TPE”), if VSOE is not available, or best estimated selling price (“BESP”), if neither VSOE nor TPE is available. Because we have been unable to establish VSOE or TPE for the elements of our arrangements, we allocate the arrangement fee to the separate units of accounting based on our best estimate of selling price. We determine our BESP price for our deliverables based on our overall pricing objectives, discounting practices, the size and volume of our transactions, the client demographic, our price lists, our go-to-market strategy, historical standalone sales and contract prices. The determination of BESP is made through consultation with and approval by management, taking into consideration the go-to-market strategy. As our go-to-market strategies evolve, we may modify our pricing practices in the future, which could result in changes in relative selling prices, including both VSOE and BESP.
Subscription revenue is recognized ratably over the term of the related agreement, commencing upon the later of the agreement start date or when all revenue recognition criteria have been met. Amounts that have been invoiced are recorded in accounts receivable and in deferred revenue or revenue, depending on whether the revenue recognition criteria have been met.
Media
Media revenue consists primarily of fees charged to advertisers when their advertisements are displayed on websites owned by various third-parties (“Publishers”). We have revenue sharing agreements with these Publishers. We receive a fee from the advertisers and pay the Publishers based on their contractual revenue-share. Media revenues earned from the advertisers are recognized on a net basis as we have determined that we are acting as an agent in these transactions.
Our agreements currently do not combine SaaS and Media services.
Deferred Revenue
Deferred revenue consists of billings or payments in advance of revenue recognition and is recognized as revenue recognition criteria are met. Deferred revenue that will be recognized during the succeeding 12 month period is recorded as current deferred revenue and the remaining portion is recorded as non-current deferred revenue.
Our deferred revenue increased to $62.9 million at April 30, 2015 compared to $56.7 million at April 30, 2014. We typically have a varying mix of monthly, quarterly, semiannual and annual billings from both new and existing clients, with average upfront billings of less than one year.
63
Table of Contents
Further, given our typical three to four month implementation cycle between the booking of new clients and the date new clients are launched, the value of any new bookings closed during a fiscal quarter does not represent the total contract value of our non-cancelable subscription agreements.
We sell our services under contractual agreements for service terms that are generally one year in length. We typically issue renewal invoices 30 days in advance of the renewal service period.
Stock-Based Expense
We record stock-based expense based upon the fair value for all stock options and restricted stock issued to all persons to the extent that such options or restricted stock vest. The fair value of each stock option is calculated by the Black-Scholes option pricing model. We recognize stock-based expense on a straight-line basis over the respective vesting period, net of estimated forfeitures. We recognize stock-based expense for shares issued pursuant to our Employee Stock Purchase Plan (“ESPP”) on a straight-line basis over the offering period of six months. We include an estimated effect of forfeitures in our compensation cost and update the estimated forfeiture rate through the final vesting date of the awards.
Inputs into the Black-Scholes option pricing model include:
| • | The estimated life for the stock options which is based on the “simplified method” allowed under SEC guidance. The estimated life for shares issued pursuant to our ESPP is one purchase period which is the six month offering period; |
| • | The risk-free interest rate is based on the rate for a U.S. government security with the same estimated life at the time of the option grant and the stock purchase rights; |
| • | Since we were a private entity prior to our initial public offering in February 2012 with little historical data regarding the volatility of the common stock price, we determine the expected volatility on the historical volatility of comparable companies from a representative industry peer group. The expected volatility of options granted is determined using an average of the historical volatility measures of this peer group. The volatility for our ESPP is based on the historical volatility of our common stock; and |
| • | We have never declared or paid any cash dividends and do not presently plan to pay cash dividends in the foreseeable future. Consequently, we have used an expected dividend yield of zero. |
We currently recognize an insignificant tax benefit resulting from stock-based costs expensed in the financial statements, however we provide a valuation allowance against the majority of deferred tax asset resulting from this type of temporary difference since we expect that we will not have sufficient future taxable income to realize such benefit.
Income Taxes
We use the liability method of accounting for income taxes. Under this method, deferred tax assets and liabilities are recognized for the expected future tax consequences of temporary differences between the carrying amounts and the tax bases of assets and liabilities. Deferred tax assets and liabilities are measured using enacted tax rates expected to apply to taxable income in the years in which those temporary differences are expected to be recovered or settled. The effect of a change in tax rates on deferred tax assets and liabilities will be recognized in the period that includes the enactment date. A valuation allowance is established against the deferred tax assets to reduce their carrying value to an amount that is more likely than not to be realized.
We follow specific and detailed guidelines in each tax jurisdiction regarding the recoverability of any tax assets recorded on the balance sheet and provide necessary valuation allowances as required. Future realization of deferred tax assets ultimately depends on the existence of sufficient taxable income of the appropriate character (for example, ordinary income or capital gain) within the carryback or carryforward periods available under the tax law. We regularly review our deferred tax assets for recoverability based on historical taxable income, projected future
64
Table of Contents
taxable income, the expected timing of the reversals of existing temporary differences and tax planning strategies. Our judgments regarding future profitability may change due to many factors, including future market conditions and our ability to successfully execute our business plans and/or tax planning strategies. Should there be a change in our ability to recover our deferred tax assets, our tax provision would increase or decrease in the period in which the assessment of our ability to recover our deferred tax assets changes.
We make an evaluation at the end of each reporting period as to whether or not some or all of the undistributed earnings of our foreign subsidiaries are permanently reinvested. Our provision for income taxes does not include provisions for U.S. income taxes and foreign withholding taxes associated with the repatriation of undistributed earnings of any of our foreign subsidiaries because we intend to invest our non-U.S. earnings permanently in foreign operations. If these earnings were distributed to the U.S. in the form of dividends or otherwise, or if the shares of the relevant foreign subsidiaries were sold or otherwise transferred, we would be subject to additional U.S. income taxes (subject to adjustment for foreign tax credits) and foreign withholding taxes.
Significant judgment is required in evaluating our uncertain tax positions. While we believe our tax return positions are sustainable, we recognize tax benefits from uncertain tax positions in the financial statements only when it is more likely than not that the positions will be sustained upon examination based on the technical merits and a consideration of the relevant taxing authority’s administrative practices and precedents. To the extent that the final tax outcome of these matters is different than the amounts recorded, such differences will impact the provision for income taxes in the period in which such determination is made. We believe we have provided adequate reserves for all uncertain tax positions.
Capitalized Internal-Use Software
We capitalize certain development costs incurred in connection with our internal-use software platform. These capitalized costs are related to the application service suite that we host, which is accessed by our clients on a subscription basis. Costs incurred in the preliminary stages of development are expensed as incurred. Once an application has reached the development stage, we capitalize direct internal and external costs until the software is substantially complete and ready for its intended use. We expense maintenance and training costs as they are incurred. We amortize capitalized internal-use software development costs on a straight-line basis over its estimated useful life, which is generally three years, into cost of revenue.
We exercise judgment in determining the point at which various projects may be capitalized, in assessing the ongoing value of the capitalized costs and in determining the estimated useful lives over which the costs are amortized. To the extent that we change the manner in which we develop and test new features and functionalities related to our platform, assess the ongoing value of capitalized assets or determine the estimated useful lives over which the costs are amortized, the amount of internal-use software development costs we capitalize and amortize could change in future periods.
Valuation of Goodwill and Intangible Assets
When we acquire businesses, we allocate the purchase price to the tangible assets and liabilities and identifiable intangible assets acquired. Any residual purchase price is recorded as goodwill. The allocation of the purchase price requires management to make significant estimates in determining the fair values of assets acquired and liabilities assumed, especially with respect to intangible assets. These estimates are based on information obtained from management of the acquired companies and historical experience. These estimates can include, but are not limited to:
| • | the time and expenses that would be necessary to recreate the asset; |
| • | the profit margin a market participant would receive; |
| • | cash flows that an asset is expected to generate in the future; and |
| • | discount rates |
65
Table of Contents
These estimates are inherently uncertain and unpredictable, and if different estimates were used the purchase price for the acquisition could be allocated to the acquired assets and liabilities differently from the allocation that we have made. In addition, unanticipated events and circumstances may occur which may affect the accuracy or validity of such estimates, and if such events occur we may be required to record a decrease in the amounts recorded for an acquired asset or an increase in the amounts recorded for assumed liabilities.
Recent Accounting Pronouncements
Intangibles – Goodwill and Other – Internal Use Software
In April 2015, the FASB issued accounting Standards Update 2015-05, “Intangible-Goodwill and Other-Internal Use Software (Subtopic 350-40): Customer’s Accounting for Fees Paid in a Cloud Computing Arrangement,” (“ASU 2015-05”) which provides guidance to customers with cloud computing arrangements that include a software license. If a cloud computing arrangement includes a software license, the customer is required to account for the software license element of the arrangement consistent with the acquisition of other software licenses. If a cloud computing arrangement does not include a software license, the customer should account for the arrangement as a service contract. ASU 2015-05 does not change the accounting for a customer’s accounting for service contracts. As a result of the ASU 2015-05, all software licenses within the scope of Subtopic 350-40 will be accounted for consistent with other licenses of intangible assets. The updated guidance will be effective for annual periods beginning after December 15, 2015 with early adoption permitted. The updated guidance will be effective for the fiscal year ending April 30, 2017 and we are currently evaluating the impact of this standards update on our consolidated financial statements.
Presentation of Financial Statements
In January 2015, the FASB issued Accounting Standards Updates 2015-1, “Simplifying Income Statement presentation by Eliminating the Concept of Extraordinary Items,” (“ASU 2015-1”) which eliminates the concept of extraordinary items and the uncertainty in determining whether an item is considered both unusual and infrequent. Presently, an event or transaction is presumed to be ordinary and usual activity unless evidence clearly supports its classification as an extraordinary item. If an event or transaction is determined to be an extraordinary, it must be segregated from the results of ordinary operations on the statement of operations, net of tax, after income from continuing operations, along with other financial statement disclosures. ASU 2015-1eliminates the concept of extraordinary items from presentation on the statement of operations; however, the presentation and disclosure guidance for items that are unusual in nature or occur infrequently will be retained and will be expanded to include items that are both unusual in nature and infrequently occurring. The updated guidance will be effective for annual periods beginning after December 15, 2015 with early adoption permitted. The updated guidance will be effective for the fiscal year ending April 30, 2017 and is not expected to have a material impact on our consolidated financial statements.
In August 2014, the FASB issued Accounting Standards Update 2014-15, “Presentation of Financial Statements – Going Concern (Subtopic 205-40), Disclosure of Uncertainties about an Entities Ability to Continue as a Going Concern,” (“ASU 2014-15”) which sets forth management’s responsibility to evaluate whether there is substantial doubt about an entity’s ability to continue as a going concern as well as required disclosures. ASU 2014-15 indicates that, when preparing financial statements for interim and annual financial statements, management should evaluate whether conditions or events, in the aggregate, raise substantial doubt about the entity’s ability to continue as a going concern for one year from the date the financial statements are issued or are available to be issued. The updated guidance will be effective for annual periods ending after December 15, 2016 with early adoption permitted. The updated guidance will be effective for the fiscal year ending April 30, 2017 and is not expected to have a material impact on our consolidated financial statements.
66
Table of Contents
Stock-based Expense
In June 2014, the FASB issued Accounting Standards Update 2014-12, “Accounting for share-based payments when the terms of an award provide that a performance target could be achieved after the requisite service period,” (“ASU 2014-12”) which requires performance-based awards with a performance target that affects vesting and that could be achieved after an employee completes the requisite service period to be accounted for as a performance condition. If performance targets are clearly defined and it is probable that the performance condition will be achieved, stock-based expense should be recognized over the remaining requisite service period. The updated guidance will be effective for annual periods beginning after December 15, 2015 with early adoption permitted. The updated guidance will be effective for the fiscal year ending April 30, 2017 and is not expected to have a material impact on our consolidated financial statements.
Revenue
In May 2014, the FASB issued Accounting Standards Update 2014-09, “Revenue from Contracts with Customers,” (“ASU 2014-09”) which provides updated, comprehensive revenue recognition guidance for contracts with customers, including a new principles-based five step framework that eliminates much of the industry-specific guidance in current accounting literature. Under ASU 2014-09, revenue recognition is based on a core principle that companies recognize revenue in an amount consistent with the consideration it expects to be entitled to in exchange for the transfer of goods or services. The standards update also requires enhanced disclosures regarding the nature, amount, timing and uncertainty of recognized revenue. The updated guidance will be effective for annual periods beginning after December 15, 2016 and may be applied on either a full or modified retrospective basis, with early adoption not permitted. The updated guidance will be effective for the fiscal year ending April 30, 2018. In April 2015, the FASB issued a proposal to defer the effective date by one year which, if approved, would make this standard effective for the fiscal year ending April 30, 2019. We are currently evaluating the impact of this standards update on our consolidated financial statements.
Discontinued Operations
In April 2014, the FASB issued Accounting Standards Update 2014-08, “Reporting of Discontinued Operations and Disclosures of Disposals of Components of an entity,” (“ASU 2014-08”) which changes the criteria for determining which disposals can be presented as discontinued operations and requires new disclosures for individually significant dispositions that do not quality as discontinued operations. ASU 2014-08 is effective prospectively for fiscal years and interim reporting periods within those years beginning after December 15, 2014, with early adoption permitted for transactions that have not been reported in financial statements previously issued or available for issuance. The standard will be effective for the fiscal year ending April 30, 2016 and is not expected to have a material impact on our consolidated financial statements.
| Item 7A. | Quantitative and Qualitative Disclosures about Market Risk |
We have operations both within the United States and internationally and we are exposed to market risks in the ordinary course of our business, including the effect of interest rate changes and foreign currency fluctuations. Information relating to quantitative and qualitative disclosures about these market risks is set forth below.
Interest Rate Sensitivity
We hold cash, cash equivalents and short term investments for working capital purposes. We do not have material exposure to market risk with respect to these investments. We do not use derivative financial instruments for speculative or trading purposes; however, we may adopt specific hedging strategies in the future. Any declines in interest rates will reduce future interest income.
67
Table of Contents
Foreign Currency Risk
Our results of operations and cash flows are subject to fluctuations because of changes in foreign currency exchange rates, particularly changes in exchange rates between the U.S. dollar and the Euro and British Pound, the currencies of countries where we currently have our most significant international operations. On a historical basis, invoicing has largely been denominated in U.S. dollars; however; we expect an increasing proportion of our future business to be conducted in currencies other than U.S. dollars. Our expenses are generally denominated in the currencies of the countries in which our operations are located, with our most significant operations at present located in the United States, the United Kingdom, Germany, France, Australia and Sweden.
We assess the market risk of changes in foreign currency exchange rates utilizing a sensitivity analysis that measures the potential impact on earnings, fair values and cash flows of a hypothetical 10% change in the value of the U.S. dollar on foreign currency denominated monetary assets and liabilities. The effect of an immediate 10% adverse change in exchange rates on foreign currency denominated monetary assets and liabilities, principally accounts receivable and intercompany balances, as of April 30, 2015, would be immaterial.
We have entered into forward exchange contracts to partially hedge our exposure to these foreign currencies. We did not enter into any derivative financial instruments for trading or speculative purposes. We may enter into additional forward exchange contracts to further contain our exposure to foreign currencies fluctuations. To date, we have hedged against some of the fluctuations in currency exchange rates, however fluctuations in exchange rates could materially impact our operating results in the future.
Inflation Risk
We do not believe that inflation has had a material effect on our business, financial condition or results of operations. If our costs were to become subject to significant inflationary pressures, we may not be able to fully offset such higher costs through price increases. Our inability or failure to do so could have a material effect on our business, financial condition and results of operations.
68
Table of Contents
| Item 8. | Financial Statements and Supplementary Data |
INDEX TO CONSOLIDATED FINANCIAL STATEMENTS
| 70 | ||||
| 71 | ||||
| 72 | ||||
| 73 | ||||
| 74 | ||||
| 75 | ||||
| 76 | ||||
| 106 |
69
Table of Contents
Report of Independent Registered Public Accounting Firm
To the Board of Directors and Stockholders of Bazaarvoice, Inc.:
In our opinion, the consolidated financial statements listed in the accompanying index present fairly, in all material respects, the financial position of Bazaarvoice, Inc. and its subsidiaries at April 30, 2015 and April 30, 2014, and the results of their operations and their cash flows for each of the three years in the period ended April 30, 2015 in conformity with accounting principles generally accepted in the United States of America. In addition, in our opinion, the financial statement schedule listed in the accompanying index presents fairly, in all material respects, the information set forth therein when read in conjunction with the related consolidated financial statements. These financial statements and financial statement schedule are the responsibility of the Company’s management. Our responsibility is to express an opinion on these financial statements and financial statement schedule based on our audits. We conducted our audits of these statements in accordance with the standards of the Public Company Accounting Oversight Board (United States). Those standards require that we plan and perform the audit to obtain reasonable assurance about whether the financial statements are free of material misstatement. An audit includes examining, on a test basis, evidence supporting the amounts and disclosures in the financial statements, assessing the accounting principles used and significant estimates made by management, and evaluating the overall financial statement presentation. We believe that our audits provide a reasonable basis for our opinion.
/s/ PricewaterhouseCoopers LLP
Austin, Texas
June 25, 2015
70
Table of Contents
CONSOLIDATED BALANCE SHEETS
(in thousands, except share amounts)
| April 30, | ||||||||
| 2015 | 2014 | |||||||
| Assets |
||||||||
| Current assets: |
||||||||
| Cash and cash equivalents |
$ | 54,041 | $ | 31,934 | ||||
| Restricted cash |
— | 604 | ||||||
| Short-term investments |
52,730 | 40,700 | ||||||
| Accounts receivable, net of allowance for doubtful accounts of $3,992 and $2,324 as of April 30, 2015 and 2014, respectively |
49,532 | 39,099 | ||||||
| Prepaid expenses and other current assets |
12,977 | 8,212 | ||||||
| Assets held for sale |
— | 33,745 | ||||||
|
|
|
|
|
|||||
| Total current assets |
169,280 | 154,294 | ||||||
| Property, equipment and capitalized internal-use software development costs, net |
19,054 | 17,005 | ||||||
| Goodwill |
139,155 | 139,155 | ||||||
| Acquired intangible assets, net |
11,498 | 13,388 | ||||||
| Other non-current assets |
3,974 | 3,428 | ||||||
|
|
|
|
|
|||||
| Total assets |
$ | 342,961 | $ | 327,270 | ||||
|
|
|
|
|
|||||
| Liabilities and stockholders’ equity |
||||||||
| Current liabilities: |
||||||||
| Accounts payable |
$ | 3,539 | $ | 3,346 | ||||
| Accrued expenses and other current liabilities |
27,397 | 27,071 | ||||||
| Revolving line of credit |
— | 27,000 | ||||||
| Deferred revenue |
60,400 | 54,951 | ||||||
| Liabilities held for sale |
— | 3,621 | ||||||
|
|
|
|
|
|||||
| Total current liabilities |
91,336 | 115,989 | ||||||
| Long-term liabilities |
||||||||
| Revolving line of credit |
57,000 | — | ||||||
| Deferred revenue less current portion |
2,530 | 1,722 | ||||||
| Deferred tax liability, long-term |
81 | 1,730 | ||||||
| Other liabilities, long-term |
631 | 1,367 | ||||||
|
|
|
|
|
|||||
| Total liabilities |
151,578 | 120,808 | ||||||
| Commitments and contingencies (Note 15) |
||||||||
| Stockholders’ equity: |
||||||||
| Common stock – $0.0001 par value; 150,000,000 shares authorized, 80,346,488 shares issued and 80,146,488 shares outstanding as of April 30, 2015; 150,000,000 shares authorized, 77,887,663 shares issued and 77,637,663 shares outstanding at April 30, 2014 |
8 | 8 | ||||||
| Treasury stock, at cost – 200,000 and 250,000 shares at April 30, 2015 and 2014, respectively |
— | — | ||||||
| Additional paid-in capital |
418,509 | 398,201 | ||||||
| Accumulated other comprehensive income (loss) |
(638 | ) | 328 | |||||
| Accumulated deficit |
(226,496 | ) | (192,075 | ) | ||||
|
|
|
|
|
|||||
| Total stockholders’ equity |
191,383 | 206,462 | ||||||
|
|
|
|
|
|||||
| Total liabilities and stockholders’ equity |
$ | 342,961 | $ | 327,270 | ||||
|
|
|
|
|
|||||
The accompanying notes are an integral part of these consolidated financial statements.
71
Table of Contents
CONSOLIDATED STATEMENTS OF OPERATIONS
(in thousands, except per share information)
| Year Ended April 30, | ||||||||||||
| 2015 | 2014 | 2013 | ||||||||||
| Revenue |
$ | 191,181 | $ | 168,145 | $ | 146,812 | ||||||
| Cost of revenue (1) |
69,906 | 52,905 | 47,350 | |||||||||
|
|
|
|
|
|
|
|||||||
| Gross profit |
121,275 | 115,240 | 99,462 | |||||||||
|
|
|
|
|
|
|
|||||||
| Operating expenses: |
||||||||||||
| Sales and marketing (1) |
78,373 | 86,482 | 73,114 | |||||||||
| Research and development (1) |
37,695 | 37,585 | 32,169 | |||||||||
| General and administrative (1) |
30,507 | 26,370 | 30,990 | |||||||||
| Acquisition-related and other |
4,046 | 16,184 | 10,487 | |||||||||
| Amortization of acquired intangible assets |
1,237 | 1,135 | 549 | |||||||||
|
|
|
|
|
|
|
|||||||
| Total operating expenses |
151,858 | 167,756 | 147,309 | |||||||||
|
|
|
|
|
|
|
|||||||
| Operating loss |
(30,583 | ) | (52,516 | ) | (47,847 | ) | ||||||
|
|
|
|
|
|
|
|||||||
| Other income (expense), net: |
||||||||||||
| Interest income |
95 | 143 | 217 | |||||||||
| Interest expense |
(1,451 | ) | (190 | ) | (526 | ) | ||||||
| Other expense |
(1,171 | ) | (783 | ) | (519 | ) | ||||||
|
|
|
|
|
|
|
|||||||
| Total other expense, net |
(2,527 | ) | (830 | ) | (828 | ) | ||||||
|
|
|
|
|
|
|
|||||||
| Loss from continuing operations before income taxes |
(33,110 | ) | (53,346 | ) | (48,675 | ) | ||||||
| Income tax expense (benefit) |
54 | (500 | ) | (1,172 | ) | |||||||
|
|
|
|
|
|
|
|||||||
| Net loss from continuing operations |
$ | (33,164 | ) | $ | (52,846 | ) | $ | (47,503 | ) | |||
| Loss from discontinued operations, net of tax |
(1,257 | ) | (10,320 | ) | (16,249 | ) | ||||||
|
|
|
|
|
|
|
|||||||
| Net loss applicable to common stockholders |
$ | (34,421 | ) | $ | (63,166 | ) | $ | (63,752 | ) | |||
|
|
|
|
|
|
|
|||||||
| Net loss per share applicable to common stockholders: |
||||||||||||
| Continuing operations |
$ | (0.42 | ) | $ | (0.70 | ) | $ | (0.69 | ) | |||
| Discontinued operations |
(0.02 | ) | (0.14 | ) | (0.23 | ) | ||||||
|
|
|
|
|
|
|
|||||||
| Basic and diluted loss per share: |
$ | (0.44 | ) | $ | (0.84 | ) | $ | (0.92 | ) | |||
|
|
|
|
|
|
|
|||||||
| Basic and diluted weighted average number of shares outstanding |
78,645 | 75,564 | 69,336 | |||||||||
|
|
|
|
|
|
|
|||||||
| (1) Includes stock-based expense as follows: |
||||||||||||
| Cost of revenue |
$ | 1,517 | $ | 1,155 | $ | 677 | ||||||
| Sales and marketing |
3,923 | 4,496 | 3,033 | |||||||||
| Research and development |
2,561 | 2,817 | 2,840 | |||||||||
| General and administrative |
4,677 | 5,357 | 4,608 | |||||||||
The accompanying notes are an integral part of these consolidated financial statements.
72
Table of Contents
CONSOLIDATED STATEMENTS OF COMPREHENSIVE LOSS
(in thousands)
| Year Ended April 30, | ||||||||||||
| 2015 | 2014 | 2013 | ||||||||||
| Net loss |
$ | (34,421 | ) | $ | (63,166 | ) | $ | (63,752 | ) | |||
| Other comprehensive gain (loss), net of tax: |
||||||||||||
| Foreign currency translation adjustment |
(934 | ) | 386 | (96 | ) | |||||||
| Unrealized gain (loss) on investments |
(32 | ) | 88 | (30 | ) | |||||||
|
|
|
|
|
|
|
|||||||
| Total other comprehensive gain (loss), net of tax |
(966 | ) | 474 | (126 | ) | |||||||
|
|
|
|
|
|
|
|||||||
| Comprehensive loss |
$ | (35,387 | ) | $ | (62,692 | ) | $ | (63,878 | ) | |||
|
|
|
|
|
|
|
|||||||
The accompanying notes are an integral part of these consolidated financial statements.
73
Table of Contents
CONSOLIDATED STATEMENTS OF STOCKHOLDERS’ EQUITY (DEFICIT)
(in thousands)
| Common Stock | Treasury Stock | |||||||||||||||||||||||||||||||
| Number of Shares |
Amount | Number of Shares |
Amount | Additional Paid-in Capital |
Accumulated Other Comprehensive Income (Loss) |
Accumulated Deficit |
Total Stockholders’ Equity (Deficit) |
|||||||||||||||||||||||||
| Balance at April 30, 2012 |
58,780 | $ | 6 | (250 | ) | $ | — | $ | 158,769 | $ | (20 | ) | $ | (65,157 | ) | $ | 93,598 | |||||||||||||||
| Issuance of stock to acquire PowerReviews |
6,381 | 1 | — | — | 119,694 | — | — | 119,695 | ||||||||||||||||||||||||
| Issuance of stock to acquire Longboard Media |
460 | — | — | — | 5,802 | — | — | 5,802 | ||||||||||||||||||||||||
| Issuance of common stock, net of issuance costs |
3,625 | — | — | — | 51,943 | — | — | 51,943 | ||||||||||||||||||||||||
| Excess tax benefit related to stock-based expense |
— | — | — | — | 510 | — | — | 510 | ||||||||||||||||||||||||
| Stock-based expense |
— | — | — | — | 22,453 | — | — | 22,453 | ||||||||||||||||||||||||
| Issuance of restricted stock awards |
50 | — | — | — | — | — | — | — | ||||||||||||||||||||||||
| Exercise of stock options and vested restricted stock units |
4,629 | — | — | — | 11,226 | — | — | 11,226 | ||||||||||||||||||||||||
| Change in foreign currency translation adjustment |
— | — | — | — | — | (96 | ) | — | (96 | ) | ||||||||||||||||||||||
| Change in unrealized loss on investments |
— | — | — | — | — | (30 | ) | — | (30 | ) | ||||||||||||||||||||||
| Net loss applicable to common stockholders |
— | — | — | — | — | — | (63,752 | ) | (63,752 | ) | ||||||||||||||||||||||
|
|
|
|
|
|
|
|
|
|
|
|
|
|
|
|
|
|||||||||||||||||
| Balance at April 30, 2013 |
73,925 | $ | 7 | (250 | ) | $ | — | $ | 370,397 | $ | (146 | ) | $ | (128,909 | ) | $ | 241,349 | |||||||||||||||
| Excess tax benefit related to stock-based expense |
— | — | — | — | 216 | — | — | 216 | ||||||||||||||||||||||||
| Stock-based expense |
— | — | — | — | 14,468 | — | — | 14,468 | ||||||||||||||||||||||||
| Issuance of restricted stock awards |
76 | — | — | — | — | — | — | — | ||||||||||||||||||||||||
| Exercise of stock options and vested restricted stock units |
3,563 | 1 | — | — | 10,854 | — | — | 10,855 | ||||||||||||||||||||||||
| Shares issued under employee stock plans |
324 | — | — | — | 2,266 | — | — | 2,266 | ||||||||||||||||||||||||
| Change in foreign currency translation adjustment |
— | — | — | — | — | 386 | — | 386 | ||||||||||||||||||||||||
| Change in unrealized gain on investments |
— | — | — | — | — | 88 | — | 88 | ||||||||||||||||||||||||
| Net loss applicable to common stockholders |
— | — | — | — | — | — | (63,166 | ) | (63,166 | ) | ||||||||||||||||||||||
|
|
|
|
|
|
|
|
|
|
|
|
|
|
|
|
|
|||||||||||||||||
| Balance at April 30, 2014 |
77,888 | $ | 8 | (250 | ) | $ | — | $ | 398,201 | $ | 328 | $ | (192,075 | ) | $ | 206,462 | ||||||||||||||||
| Issuance of common stock, net of issuance costs |
50 | |||||||||||||||||||||||||||||||
| Excess tax benefit related to stock-based expense |
— | — | — | — | 6 | — | — | 6 | ||||||||||||||||||||||||
| Stock-based expense |
— | — | — | — | 12,802 | — | — | 12,802 | ||||||||||||||||||||||||
| Issuance of restricted stock awards |
166 | — | — | — | — | — | — | — | ||||||||||||||||||||||||
| Exercise of stock options and vested restricted stock units |
1,851 | — | — | — | 5,008 | — | — | 5,008 | ||||||||||||||||||||||||
| Shares issued under employee stock plans |
441 | — | — | — | 2,492 | — | — | 2,492 | ||||||||||||||||||||||||
| Change in foreign currency translation adjustment |
— | — | — | — | — | (934 | ) | — | (934 | ) | ||||||||||||||||||||||
| Change in unrealized gain on investments |
— | — | — | — | — | (32 | ) | — | (32 | ) | ||||||||||||||||||||||
| Net loss applicable to common stockholders |
— | — | — | — | — | — | (34,421 | ) | (34,421 | ) | ||||||||||||||||||||||
|
|
|
|
|
|
|
|
|
|
|
|
|
|
|
|
|
|||||||||||||||||
| Balance at April 30, 2015 |
80,346 | $ | 8 | (200 | ) | $ | — | $ | 418,509 | $ | (638 | ) | $ | (226,496 | ) | $ | 191,383 | |||||||||||||||
|
|
|
|
|
|
|
|
|
|
|
|
|
|
|
|
|
|||||||||||||||||
The accompanying notes are an integral part of these consolidated financial statements.
74
Table of Contents
CONSOLIDATED STATEMENTS OF CASH FLOWS
(in thousands)
| Year Ended April, 30 | ||||||||||||
| 2015 | 2014 | 2013 | ||||||||||
| Operating activities: |
||||||||||||
| Net loss |
$ | (34,421 | ) | $ | (63,166 | ) | $ | (63,752 | ) | |||
| Adjustments to reconcile net loss to net cash provided by (used in) operating activities: |
||||||||||||
| Depreciation and amortization expense |
12,453 | 15,068 | 10,900 | |||||||||
| Impairment of acquired intangible assets |
— | 2,500 | — | |||||||||
| Loss on disposal of discontinued operations, net of tax |
1,537 | 9,192 | — | |||||||||
| Stock-based expense |
12,802 | 14,468 | 22,453 | |||||||||
| Revaluation of contingent consideration |
— | (3,270 | ) | (1,000 | ) | |||||||
| Bad debt expense |
3,155 | 1,902 | 2,859 | |||||||||
| Excess tax benefit related to stock-based expense |
(6 | ) | (216 | ) | (510 | ) | ||||||
| Amortization of deferred financing costs |
98 | — | — | |||||||||
| Other non-cash expense (benefit) |
151 | 480 | (5 | ) | ||||||||
| Changes in operating assets and liabilities: |
||||||||||||
| Accounts receivables |
(13,589 | ) | (12,081 | ) | (10,749 | ) | ||||||
| Prepaid expenses and other current assets |
(165 | ) | (1,551 | ) | (1,766 | ) | ||||||
| Other non-current assets |
(177 | ) | (1,603 | ) | (432 | ) | ||||||
| Accounts payable |
(297 | ) | (3,095 | ) | 974 | |||||||
| Accrued expenses and other current liabilities |
(1,165 | ) | (2,623 | ) | 13,283 | |||||||
| Deferred revenue |
6,258 | 2,040 | 8,633 | |||||||||
| Other liabilities, long-term |
(2,599 | ) | (1,512 | ) | (2,699 | ) | ||||||
|
|
|
|
|
|
|
|||||||
| Net cash used in operating activities |
(15,965 | ) | (43,467 | ) | (21,811 | ) | ||||||
| Investing activities: |
||||||||||||
| Acquisitions, net of cash acquired, and purchase of intangible asset |
— | (9,616 | ) | (60,750 | ) | |||||||
| Proceeds from sale of discontinued operations |
25,500 | — | — | |||||||||
| Purchases of property, equipment and capitalized internal-use software development costs |
(12,039 | ) | (10,661 | ) | (10,853 | ) | ||||||
| Decrease in restricted cash |
500 | — | — | |||||||||
| Purchases of short-term investments |
(82,770 | ) | (60,092 | ) | (90,828 | ) | ||||||
| Proceeds from maturities of short-term investments |
65,681 | 58,478 | 61,310 | |||||||||
| Proceeds from sale of short-term investments |
5,012 | 31,098 | 10,037 | |||||||||
|
|
|
|
|
|
|
|||||||
| Net cash provided by (used in) investing activities |
1,884 | 9,207 | (91,084 | ) | ||||||||
| Financing activities: |
||||||||||||
| Proceeds from follow-on stock offering, net of costs |
— | — | 51,943 | |||||||||
| Proceeds from employee stock compensation plans |
7,545 | 13,499 | 11,226 | |||||||||
| Proceeds from revolving line of credit |
57,000 | 27,000 | — | |||||||||
| Payments on revolving line of credit |
(27,000 | ) | — | — | ||||||||
| Deferred financing costs |
(706 | ) | — | — | ||||||||
| Excess tax benefit related to stock-based expense |
6 | 216 | 510 | |||||||||
|
|
|
|
|
|
|
|||||||
| Net cash provided by financing activities |
36,845 | 40,715 | 63,679 | |||||||||
| Effect of exchange rate fluctuations on cash and cash equivalents |
(657 | ) | 434 | (106 | ) | |||||||
|
|
|
|
|
|
|
|||||||
| Net change in cash and cash equivalents |
22,107 | 6,889 | (49,322 | ) | ||||||||
| Cash and cash equivalents at beginning of period |
31,934 | 25,045 | 74,367 | |||||||||
|
|
|
|
|
|
|
|||||||
| Cash and cash equivalents at end of period |
$ | 54,041 | $ | 31,934 | $ | 25,045 | ||||||
|
|
|
|
|
|
|
|||||||
| Supplemental disclosure of other cash flow information: |
||||||||||||
| Cash paid for income taxes, net of refunds |
$ | 902 | $ | 1,493 | $ | 440 | ||||||
| Cash paid for interest |
1,418 | 137 | — | |||||||||
| Supplemental disclosure of non-cash investing and financing activities: |
||||||||||||
| Purchase of fixed assets recorded in accounts payable |
282 | — | — | |||||||||
| Asset retirement obligation recorded in accrued expenses and other current liabilities and other liabilities, long-term |
$ | 532 | $ | — | $ | — | ||||||
| Purchase of intangible asset recorded in accrued expenses and other current liabilities |
— | — | 705 | |||||||||
| Issuance of stock for acquisition |
— | — | 125,497 | |||||||||
The accompanying notes are an integral part of these consolidated financial statements.
These Consolidated Statement of Cash Flows include combined cash flows from continuing operations along with discontinued operations.
75
Table of Contents
NOTES TO CONSOLIDATED FINANCIAL STATEMENTS
1. Organization and Nature of Operations
Bazaarvoice, Inc. (“Bazaarvoice” or the “Company”) powers a network that connects brands and retailers to the authentic voices of people where they shop. Bazaarvoice, which literally means “voice of the marketplace,” was founded on the premise that online word of mouth is critical to consumers and businesses because of its influence on purchasing decisions, both online and offline. The Company’s technology platform collects and displays ratings and reviews, questions and answers and stories from customers along with visual commerce capabilities that collectively amplify the voices of the consumers into the shopping experience – before, during and after a purchase. The Company helps clients leverage social data derived from online consumer-generated content to increase sales, acquire new customers, improve marketing effectiveness, enhance consumer engagement across channels, increase success of new product launches, improve existing products and services, effectively scale customer support, decrease product returns and enable retailers to launch and manage on-site advertising solutions and site monetization strategies.
2. Basis of Presentation and Summary of Significant Accounting Policies
Fiscal Year
The Company’s fiscal year end is April 30. References to fiscal year 2015, for example, refer to the fiscal year ending April 30, 2015.
Basis of Presentation
The consolidated financial statements were prepared in accordance with accounting principles generally accepted in the United States (“GAAP”).
Use of Estimates
The preparation of financial statements in conformity with GAAP requires management to make estimates and assumptions that affect the reported amounts of assets and liabilities and disclosure of contingent assets and liabilities as of the date of the financial statements and the reported amounts of revenue and expenses during the reporting period. On an ongoing basis, the Company evaluates its estimates, including those related to revenue recognition, allowance for doubtful accounts, income taxes, stock-based expense, accrued liabilities, useful lives of property and equipment and capitalized software development costs, among others. The Company bases its estimates on historical experience and on various other assumptions that are believed to be reasonable under the circumstances, the results of which form the basis for making judgments about the carrying values of assets and liabilities that are not readily apparent from other sources. Actual results could differ from the estimates made by management with respect to these items.
Principles of Consolidation
The accompanying consolidated financial statements include the accounts of the Company and the accounts of the Company’s wholly-owned subsidiaries. All intercompany balances and transactions have been eliminated upon consolidation.
Foreign Currency Translation
The U.S. dollar is the reporting currency for all periods presented. The functional currency of the Company’s foreign subsidiaries is generally the local currency. All assets and liabilities denominated in a foreign currency are translated into U.S. dollars at the exchange rate on the balance sheet date. Revenue and expenses are translated at the average rate during the period. Equity transactions are translated using historical exchange rates.
76
Table of Contents
Adjustments resulting from translating foreign currency financial statements into U.S. dollars are included in accumulated other comprehensive loss. Foreign currency transaction gains and losses are included in net loss for the period. The Company recognized net foreign currency gains (losses) of $(1.0) million, $0.4 million and $0.4 million for fiscal years 2015, 2014 and 2013, respectively.
Derivative Financial Instruments
As a result of the Company’s international operations, it is exposed to various market risks that may affect its consolidated results of operations, cash flows and financial position. These market risks include, but are not limited to, fluctuations in currency exchange rates. The Company’s primary foreign currency exposures are in Euros and British Pound Sterling. The Company faces exposure to adverse movements in currency exchange rates as the financial results of certain of its operations are translated from local currency into U.S. dollars upon consolidation. Additionally, foreign exchange rate fluctuations on transactions denominated in currencies other than the functional currency result in gains and losses that are reflected in income.
The Company may enter into derivative instruments to hedge certain net exposures of non-U.S. dollar-denominated assets and liabilities, even though it does not elect to apply hedge accounting or hedge accounting does not apply. Gains and losses resulting from a change in fair value of these derivatives are reflected in income in the period in which the change occurs and are recognized on the consolidated statement of operations in other income (expense). Cash flows from these contracts are classified within net cash used in operating activities on the consolidated statements of cash flows.
The Company does not use financial instruments for trading or speculative purposes. The Company recognizes all derivative instruments on the balance sheet at fair value, and its derivative instruments are generally short-term in duration.
Derivative contracts were not material as of April 30, 2015 and 2014. The Company is exposed to the risk that counterparties to derivative contracts may fail to meet their contractual obligations.
Fair Value of Financial Instruments
The carrying amounts of the Company’s financial instruments, including cash equivalents, accounts receivable, accounts payable and accrued liabilities, approximate their respective fair values, due to the short-term nature of the instruments.
The Company applies the authoritative guidance on fair value measurements for financial assets and liabilities. The guidance defines fair value and increases disclosures surrounding fair value calculations. The guidance establishes a three-tiered fair value hierarchy that prioritizes inputs to valuation techniques used in fair value calculations. The three levels of inputs are defined as follows:
| Level 1: | Unadjusted quoted prices for identical assets or liabilities in active markets accessible by the Company. | |
| Level 2: | Inputs that are observable in the marketplace other than those inputs classified as Level 1. | |
| Level 3: | Inputs that are unobservable in the marketplace which require the Company to develop its own assumptions. | |
The valuation techniques used to determine the fair value of our financial instruments having Level 2 inputs are valued using unadjusted, non-binding market consensus prices that are corroborated by observable market data, quoted market prices for similar instruments, or pricing models. Our procedures include controls to ensure that appropriate fair values are recorded by a review of the valuation methods and assumptions. The Company did not hold any cash equivalents, restricted cash or short-term investments categorized as Level 3 as of April 30, 2015 or 2014.
77
Table of Contents
Cash and Cash Equivalents
The Company considers all highly liquid investments acquired with an original maturity of three months or less at the date of purchase and readily convertible to known amounts of cash to be cash equivalents. Cash and cash equivalents are deposited with banks in demand deposit accounts. Cash equivalents are stated at cost, which approximates market value, because of the short maturity of these instruments.
Short-term Investments
Short-term investments which are classified as available-for-sale securities consist of certificates of deposit, municipal bonds, commercial paper, U.S. Treasury notes and bonds that are a guaranteed obligation of the U.S. Government, corporate notes and corporate bonds. The Company may or may not hold securities with stated maturities greater than one year until maturity. After consideration of its risks versus reward objectives, as well as its liquidity requirements, the Company may sell these securities prior to their stated maturities. As the Company views these securities as available to support current operations, it has classified all available-for-sale securities as short-term. Available-for-sale securities are carried at fair value with unrealized gains and losses reported as a component of accumulated other comprehensive income (loss) in stockholders’ equity. For the periods presented, realized and unrealized gains and losses on short-term investments were not material. An impairment charge is recorded in the consolidated statements of operations for declines in fair value below the cost of an individual investment that are deemed to be other-than-temporary. The Company assesses whether a decline in value is temporary based on the length of time that the fair market value has been below cost, the severity of the decline, as well as the intent and ability to hold, or plans to sell, the investment. There have been no impairment charges recognized related to short-term investments for the fiscal years ended April 30, 2015, 2014 or 2013.
Restricted Cash
In fiscal 2014, the Company’s restricted cash consisted of a standby letter of credit under its Pledge and Security Agreement for corporate credit card services, secured by its money market account (See Note 10).
Accounts Receivable
Accounts receivable represent trade receivables from clients for whom the Company has provided services and not yet received payment. The Company presents accounts receivable net of an allowance for doubtful accounts. The Company maintains an allowance for doubtful accounts for estimated losses resulting from the inability of clients to make required payments. In estimating this allowance, the Company considers factors such as: historical collection experience, a client’s current credit-worthiness, client concentrations, age of the receivable balance, both individually and in the aggregate and general economic conditions that may affect a client’s ability to pay. Any change in the assumptions used in analyzing a specific account receivable might result in an additional allowance for doubtful accounts being recognized in the period in which the change occurs.
The allowance for doubtful accounts was $4.0 million and $2.3 million at April 30, 2015 and 2014, respectively.
Property, Equipment and Capitalized Internal-Use Software Development Costs
Property and equipment is carried at cost less accumulated depreciation and amortization.
Depreciation and amortization is computed utilizing the straight-line method over the estimated useful lives of the related assets as follows:
| Computer equipment |
3 years | |
| Furniture and fixtures |
5 years | |
| Office equipment |
5 years | |
| Software |
3 years | |
| Leasehold improvements |
Shorter of estimated useful life or the lease term |
78
Table of Contents
When depreciable assets are sold or retired, the related cost and accumulated depreciation are removed from the accounts. Any gain or loss is included in other income (expense), net in the Company’s statement of operations. Major additions and betterments are capitalized. Maintenance and repairs which do not materially improve or extend the lives of the respective assets are charged to operating expenses as incurred.
The Company capitalizes certain development costs incurred in connection with its internal-use software. These capitalized costs are primarily related to its proprietary social commerce platform that is hosted by the Company and accessed by its clients on a subscription basis. Costs incurred in the preliminary stages of development are expensed as incurred. Once an application has reached the development stage, direct internal and external costs are capitalized until the software is substantially complete and ready for its intended use. Maintenance and training costs are expensed as incurred. Internal-use software development costs are amortized on a straight-line basis over its estimated useful life, generally three years, into cost of revenue.
Goodwill, Intangible Assets, Long-Lived Assets and Impairment Assessments
The Company evaluates and tests the recoverability of its goodwill for impairment at least annually during the fourth fiscal quarter or more often if and when circumstances indicate that goodwill may not be recoverable (See Note 7).
Intangible assets are amortized over their useful lives. Each period the Company evaluates the estimated remaining useful life of its intangible assets and whether events or changes in circumstances warrant a revision to the remaining period of amortization. The carrying amounts of these assets are periodically reviewed for impairment whenever events or changes in circumstances indicate that the carrying value of these assets may not be recoverable. Recoverability of these assets is measured by comparison of the carrying amount of each asset to the future undiscounted cash flows the asset is expected to generate. If the undiscounted cash flows used in the test for recoverability are less than the carrying amount of these assets then the Company will recognize an impairment charge to reduce the assets to fair value.
The Company evaluates the recoverability of its long-lived assets for possible impairment annually in the fourth fiscal quarter or more frequently if indicators that the carrying amount of such assets may not be recoverable. Recoverability of these assets is measured by comparison of the carrying amount of each asset to the future undiscounted cash flows the asset is expected to generate. If the undiscounted cash flows used in the test for recoverability are less than the carrying amount of these assets then the Company will recognize an impairment charge to reduce the assets to fair value (See Note 5).
Comprehensive Loss
Comprehensive loss is comprised of net loss, unrealized investment gains and losses and foreign currency translation adjustments, net of tax. The accumulated comprehensive gain (loss) as of April 30, 2015 and 2014 was primarily due to unrealized gains (losses) on short-term investments and foreign currency translation adjustments.
Concentrations of Credit Risk and Significant Clients
Financial instruments that potentially subject the Company to concentrations of credit risk consist of cash and cash equivalents and account receivables. The Company’s cash and cash equivalents are placed with high-credit-quality financial institutions and issuers, and at times may exceed federally insured limits. The Company has not experienced any loss relating to cash and cash equivalents in these accounts to date. The Company maintains an allowance for doubtful accounts receivable balances, performs periodic credit evaluations of its clients and generally does not require collateral of its clients.
No single client accounted for 10% or more of accounts receivable as of April 30, 2015 or April 30, 2014. No single client accounted for 10% or more of total revenue for the fiscal years ended April 30, 2015 or April 30, 2014.
79
Table of Contents
Revenue Recognition
In general, the Company recognizes revenue when (i) persuasive evidence of an arrangement exists, (ii) delivery has occurred or services have been rendered to the client, (iii) the fee is fixed or determinable and (iv) collectability is reasonably assured.
The Company generates revenue primarily from sales of the following services:
Software as a Service (“SaaS”)
The Company generates SaaS revenue from two sources: 1) various subscription products; and 2) professional services. Subscription revenue includes subscription fees from clients accessing the Company’s cloud-based social commerce platform and application services pursuant to service agreements that are generally one year in length. Professional services consist of fees associated with providing expert services that educate and assist clients on the best use of the Company’s solutions as well as assist in the implementation of the solutions. Professional services are not required for clients to utilize the Company’s solutions. The client does not have the right to take possession of the software supporting the application service at any time, nor do the arrangements contain general rights of return.
Multiple Deliverable Arrangements
Typically, revenue from new clients consist of agreements with multiple elements, comprised of subscription fees for the Company’s products and professional services. The Company evaluates each element in a multiple-element arrangement to determine whether it represents a separate unit of accounting. An element constitutes a separate unit of accounting when the delivered item has standalone value and delivery of the undelivered element is probable and within the Company’s control. Various subscription based products have standalone value because they are routinely sold separately by the Company. In determining whether professional services can be accounted for separately from subscription services, the Company considered the availability of the professional services from other vendors, the nature of the Company’s professional services and whether the Company sells its applications to new clients without professional services. The majority of the Company’s professional services contracts are offered on a time and material basis. When these services are not combined with subscription and support revenue in a multiple-element arrangement, services revenue is recognized as the services are rendered.
If the deliverables have standalone value upon delivery, the Company accounts for each deliverable separately and revenue is recognized for the respective deliverables over the respective service period. If one or more of the deliverables does not have standalone value upon delivery, the deliverables that do not have standalone value are generally combined with the final deliverable within the arrangement and treated as a single unit of accounting. Revenue for arrangements treated as a single unit of accounting is generally recognized over the period commencing upon delivery of the final deliverable and over the remaining term of the subscription contract.
The Company allocates revenue to each element in an arrangement based on a selling price hierarchy. The selling price for a deliverable is based on its vendor-specific objective evidence (“VSOE”), if available, third-party evidence (“TPE”), if VSOE is not available, or best estimated selling price (“BESP”), if neither VSOE nor TPE is available. Because the Company has been unable to establish VSOE or TPE for the elements of our arrangements, the Company allocates the arrangement fee to the separate units of accounting based on the Company’s best estimate of selling price. The Company determines BESP price for its deliverables based on the Company’s overall pricing objectives, discounting practices, the size and volume of the Company’s transactions, the client demographic, the Company’s price lists, the Company’s go-to-market strategy, historical standalone sales and contract prices. The determination of BESP is made through consultation with and approval by management, taking into consideration the go-to-market strategy. As the Company’s go-to-market strategies evolve, the Company may modify its pricing practices in the future, which could result in changes in relative selling prices, including both VSOE and BESP.
80
Table of Contents
Subscription revenue is recognized ratably over the term of the related agreement, commencing upon the later of the agreement start date or when all revenue recognition criteria have been met. Amounts that have been invoiced are recorded in accounts receivable and in deferred revenue or revenue, depending on whether the revenue recognition criteria have been met.
Media
Media revenue consists primarily of fees charged to advertisers when their advertisements are displayed on websites owned by various third-parties (“Publishers”). The Company has revenue sharing agreements with these Publishers. The Company receives a fee from the advertisers and pay the Publishers based on their contractual revenue-share. Media revenues earned from the advertisers are recognized on a net basis as the Company has determined that it is acting as an agent in these transactions.
The Company’s agreements currently do not combine SaaS and Media services.
Deferred Revenue
Deferred revenue consists of billings or payments received in advance of revenue recognition and is recognized as the revenue recognition criteria are met. The Company invoices clients in a variety of installments and, consequently, the deferred revenue balance does not represent the total contract value of its non-cancelable subscription agreements. Deferred revenue that will be recognized during the succeeding 12-month period is recorded as current deferred revenue and the remaining portion is recorded as non-current deferred revenue.
Cost of Revenue
Cost of revenue consists primarily of personnel costs and related expenses together with allocated overhead costs, including depreciation and facility and office related expenses, associated with employees and contractors who provide our subscription services. Cost of revenue also includes co-location and related telecommunications costs, fees paid to third-parties for resale arrangements, amortization of developed technology and amortization of capitalized internal-use software development costs incurred in connection with its application services.
Treasury Stock
Shares of common stock repurchased by the Company and held in treasury are recorded at cost as treasury stock and result in a reduction of stockholders’ equity.
Stock-Based Expense
The Company records stock-based expense based upon the fair value for all stock options and restricted stock issued to all persons to the extent that such options or restricted stock vest. The fair value of each stock option is calculated using the Black-Scholes option pricing model. The Company recognizes stock-based expense on a straight-line basis over the respective vesting period, net of estimated forfeitures. The Company includes an estimated effect of forfeitures in its compensation cost and updates the estimated forfeiture rate through the final vesting date of the awards.
The Company recognizes stock-based expense for shares issued pursuant to its Employee Stock Purchase Plan (“ESPP”) on a straight-line basis over the offering period of six months. Stock-based expense was $12.8 million, $14.5 million and $22.5 million for the years ended April 30, 2015, 2014 and 2013, respectively.
The Company currently recognizes an insignificant tax benefit resulting from compensation costs expensed in the financial statements, however the Company provides a valuation allowance against the majority of deferred tax asset resulting from this type of temporary difference since it expects that it will not have sufficient future taxable income to realize such benefit.
81
Table of Contents
Income Taxes
The Company uses the liability method of accounting for income taxes. Under this method, deferred tax assets and liabilities are recognized for the expected future tax consequences of temporary differences between the carrying amounts and the tax bases of assets and liabilities. Deferred tax assets and liabilities are measured using enacted tax rates expected to apply to taxable income in the years in which those temporary differences are expected to be recovered or settled. The effect of a change in tax rates on deferred tax assets and liabilities will be recognized in the period that includes the enactment date. A valuation allowance is established against the deferred tax assets to reduce their carrying value to an amount that is more likely than not to be realized.
Earnings Per Share
The Company computes basic earnings per share available to common stockholders by dividing net income available to common stockholders by the weighted average number of common shares outstanding during the reporting period. The Company computes diluted earnings per share similarly to basic earnings per share except that it reflects the potential dilution that could occur if dilutive securities or other obligations to issue common stock were exercised or converted into common stock. As the Company has only incurred losses to date, diluted earnings per share is the same as basic earnings per share.
Prior Period Financial Statements Presentation
The Statement of Comprehensive Loss included in the financial statements in the Annual Report on Form10-K filed for the fiscal year ended April 30, 2014 incorrectly excluded the loss from discontinued operations in Comprehensive Loss for the fiscal years ended April 30, 2014 and April 30, 2013. The Company has revised the Statement of Comprehensive Loss for those periods included in these financial statements. Management concluded these errors were not material to the previously issued financial statements.
Recent Accounting Pronouncements
Intangibles – Goodwill and Other – Internal Use Software
In April 2015, the FASB issued accounting Standards Update 2015-05, “Intangible-Goodwill and Other-Internal Use Software (Subtopic 350-40): Customer’s Accounting for Fees Paid in a Cloud Computing Arrangement,” (“ASU 2015-05”) which provides guidance to customers with cloud computing arrangements that include a software license. If a cloud computing arrangement includes a software license, the customer is required to account for the software license element of the arrangement consistent with the acquisition of other software licenses. If a cloud computing arrangement does not include a software license, the customer should account for the arrangement as a service contract. ASU 2015-05 does not change the accounting for a customer’s accounting for service contracts. As a result of the ASU 2015-05, all software licenses within the scope of Subtopic 350-40 will be accounted for consistent with other licenses of intangible assets. The updated guidance will be effective for annual periods beginning after December 15, 2015 with early adoption permitted. The updated guidance will be effective for the fiscal year ending April 30, 2017 and the Company is currently evaluating the impact of this standards update on the Company’s consolidated financial statements.
Presentation of Financial Statements
In January 2015, the FASB issued Accounting Standards Update 2015-1, “Simplifying Income Statement presentation by Eliminating the Concept of Extraordinary Items,” (“ASU 2015-1”) which eliminates the concept of extraordinary items and the uncertainty in determining whether an item is considered both unusual and infrequent. Presently, an event or transaction is presumed to be ordinary and usual activity unless evidence clearly supports its classification as an extraordinary item. If an event or transaction is determined to be an extraordinary, it must be segregated from the results of ordinary operations on the statement of operations, net of tax, after income from continuing operations, along with other financial statement disclosures. ASU 2015-1 eliminates the concept of extraordinary items from presentation on the statement of operations; however, the
82
Table of Contents
presentation and disclosure guidance for items that are unusual in nature or occur infrequently will be retained and will be expanded to include items that are both unusual in nature and infrequently occurring. The updated guidance will be effective for annual periods beginning after December 15, 2015 with early adoption permitted. The updated guidance will be effective for the fiscal year ending April 30, 2017 and is not expected to have a material impact on the Company’s consolidated financial statements.
In August 2014, the FASB issued Accounting Standards Update 2014-15, “Presentation of Financial Statements – Going Concern (Subtopic 205-40), Disclosure of Uncertainties about an Entities Ability to Continue as a Going Concern,” (“ASU 2014-15”) which sets forth management’s responsibility to evaluate whether there is substantial doubt about an entity’s ability to continue as a going concern as well as required disclosures. ASU 2014-15 indicates that, when preparing financial statements for interim and annual financial statements, management should evaluate whether conditions or events, in the aggregate, raise substantial doubt about the entity’s ability to continue as a going concern for one year from the date the financial statements are issued or are available to be issued. The updated guidance will be effective for annual periods ending after December 15, 2016 with early adoption permitted. The updated guidance will be effective for the fiscal year ending April 30, 2017 and is not expected to have a material impact on the Company’s consolidated financial statements.
Stock-based Expense
In June 2014, the FASB issued Accounting Standards Update 2014-12, “Accounting for share-based payments when the terms of an award provide that a performance target could be achieved after the requisite service period,” (“ASU 2014-12”) which requires performance-based awards with a performance target that affects vesting and that could be achieved after an employee completes the requisite service period to be accounted for as a performance condition. If performance targets are clearly defined and it is probable that the performance condition will be achieved, stock-based expense should be recognized over the remaining requisite service period. The updated guidance will be effective for annual periods beginning after December 15, 2015 with early adoption permitted. The updated guidance will be effective for the fiscal year ending April 30, 2017 and is not expected to have a material impact on the Company’s consolidated financial statements.
Revenue
In May 2014, the FASB issued Accounting Standards Update 2014-09, “Revenue from Contracts with Customers,” (“ASU 2014-09”) which provides updated, comprehensive revenue recognition guidance for contracts with customers, including a new principles-based five step framework that eliminates much of the industry-specific guidance in current accounting literature. Under ASU 2014-09, revenue recognition is based on a core principle that companies recognize revenue in an amount consistent with the consideration it expects to be entitled to in exchange for the transfer of goods or services. The standards update also requires enhanced disclosures regarding the nature, amount, timing and uncertainty of recognized revenue. The updated guidance will be effective for annual periods beginning after December 15, 2016 and may be applied on either a full or modified retrospective basis, with early adoption not permitted. The updated guidance will be effective for the fiscal year ending April 30, 2018. In April 2015, the FASB issued a proposal to defer the effective date by one year which, if approved, would make this standard effective for the fiscal year ending April 30, 2019. The Company is currently evaluating the impact of this standards update on the Company’s consolidated financial statements.
Discontinued Operations
In April 2014, the FASB issued Accounting Standards Update 2014-08, “Reporting of Discontinued Operations and Disclosures of Disposals of Components of an entity,” (“ASU 2014-08”) which changes the criteria for determining which disposals can be presented as discontinued operations and requires new disclosures for individually significant dispositions that do not quality as discontinued operations. ASU 2014-08 is effective prospectively for fiscal years and interim reporting periods within those years beginning after December 15,
83
Table of Contents
2014, with early adoption permitted for transactions that have not been reported in financial statements previously issued or available for issuance. The standard will be effective for the fiscal year ending April 30, 2016 and is not expected to have a material impact on the Company’s consolidated financial statements.
3. Discontinued Operations
On June 12, 2012, the Company acquired PowerReviews, Inc. (“PowerReviews”) for total consideration of $150.8 million (See Note 6). On January 8, 2014, the Northern District of California, San Francisco Division (the “Court”) ruled that the Company’s acquisition of PowerReviews violated section 7 of the Clayton Act, 15 U.S.C. Section 18. On April 24, 2014, the Company entered into a Joint Stipulation with the U.S. Department of Justice (the “DOJ”) to resolve the DOJ’s claims and, together with the DOJ, the Company submitted a proposed order to the Court. Under the terms of the Joint Stipulation and the proposed order, the Company was required to divest all of the net assets of the PowerReviews business. On June 4, 2014, the Company entered into a definitive agreement to divest the assets of PowerReviews, pursuant to a Joint Stipulation with the Court for $30.0 million in cash, $4.5 million of which remains in escrow as a partial security for the Company’s indemnification obligations under the definitive agreement and is set to expire in July 2015 (See Note 15). As a result, PowerReviews revenues, related expenses and loss on disposal, net of tax, are components of “loss from discontinued operations, net of tax” in the consolidated statements of operations. Any reduction in proceeds of the escrow related to the divestiture agreement would be recorded as an additional loss. As of April 30, 2014, on the consolidated balance sheets, the assets and liabilities of the discontinued operations of PowerReviews were presented as ‘Assets held for sale’ and ‘Liabilities held for sale,’ respectively. The statement of cash flows is reported on a combined basis without separately presenting cash flows from discontinued operations for all periods presented.
As of April 30, 2015, there were no ‘Assets held for sale’ as the divestiture of the PowerReviews business was completed on July 2, 2014. The $4.5 million held in escrow is recorded as a receivable in “Prepaid expenses and other current assets” on the consolidated balance sheet as of April 30, 2015. As of April 30, 2015, the Company had not received any claims for indemnification under the definitive agreement.
The Company incurred a total loss on the disposal of the PowerReviews business of $10.7 million, of which $9.2 million was recognized as an estimated loss on disposal of discontinued operations during fiscal year 2014. The additional $1.5 million loss recognized in fiscal year 2015 was primarily caused by a decrease of $0.5 million in estimated cash proceeds as of April 30, 2014 and incremental transaction costs of $0.4 million.
Summarized results from discontinued operations were as follows (in thousands):
| Year Ended April 30, | ||||||||||||
| 2015 | 2014 | 2013 | ||||||||||
| Revenues from discontinued operations |
$ | 2,535 | $ | 17,011 | $ | 13,484 | ||||||
| Income (loss) from discontinued operations before income taxes |
$ | 303 | $ | (1,106 | ) | $ | (16,224 | ) | ||||
| Income tax expense |
23 | 22 | 25 | |||||||||
|
|
|
|
|
|
|
|||||||
| Net income (loss) from discontinued operations |
280 | (1,128 | ) | (16,249 | ) | |||||||
| Loss on disposal of discontinued operations, net of tax |
(1,537 | ) | (9,192 | ) | — | |||||||
|
|
|
|
|
|
|
|||||||
| Loss from discontinued operations, net of tax |
$ | (1,257 | ) | $ | (10,320 | ) | $ | (16,249 | ) | |||
|
|
|
|
|
|
|
|||||||
84
Table of Contents
The carrying amounts of the major classes of assets and liabilities of discontinued operations were as follows (in thousands):
| July 2, | April 30, | |||||||
| 2014 | 2014 | |||||||
| ASSETS: |
||||||||
| Restricted cash |
$ | 104 | $ | — | ||||
| Accounts receivable, net |
1,097 | 1,036 | ||||||
| Prepaid expenses and other current assets |
48 | 49 | ||||||
|
|
|
|
|
|||||
| Total current assets |
1,249 | 1,085 | ||||||
| Property and equipment, net |
37 | 37 | ||||||
| Goodwill |
9,002 | 9,002 | ||||||
| Acquired intangible assets, net |
32,813 | 32,813 | ||||||
|
|
|
|
|
|||||
| Total assets |
$ | 43,101 | $ | 42,937 | ||||
|
|
|
|
|
|||||
| LIABILITIES: |
||||||||
| Accounts payable |
$ | 76 | $ | 221 | ||||
| Accrued expenses and other current liabilities |
823 | 895 | ||||||
| Deferred revenue |
2,230 | 2,505 | ||||||
|
|
|
|
|
|||||
| Total Liabilities |
$ | 3,129 | $ | 3,621 | ||||
|
|
|
|
|
|||||
The Company recorded a loss on the disposal of discontinued operations of $1.5 million, net of tax, in fiscal year 2015 which was calculated as follows (in thousands):
| Cash consideration |
$ | 30,000 | ||
| Less: |
||||
| Basis in net assets as of July 2, 2014 |
39,972 | |||
| Costs incurred directly attributable to the transaction |
1,039 | |||
|
|
|
|||
| Loss before income taxes |
(11,011 | ) | ||
| Income tax benefit |
(282 | ) | ||
|
|
|
|||
| Loss on disposal of discontinued operations, net of taxes |
(10,729 | ) | ||
| Loss on disposal of discontinued operations, net of taxes, previously recognized |
(9,192 | ) | ||
|
|
|
|||
| Loss on disposal of discontinued operations, net of tax, recognized in current period |
$ | (1,537 | ) | |
|
|
|
The Company recorded a loss on the disposal of discontinued operations of $9.2 million, net of tax, in fiscal year 2014 which was calculated as follows (in thousands):
| Estimated cash proceeds |
$ | 30,500 | ||
| Less: |
||||
| Basis in net assets sold as of April 30, 2014 |
39,316 | |||
| Estimated costs incurred directly attributable to the transaction |
658 | |||
|
|
|
|||
| Estimated loss before income taxes |
(9,474 | ) | ||
| Estimated income tax benefit |
(282 | ) | ||
|
|
|
|||
| Estimated loss on disposal of discontinued operations, net of taxes |
$ | (9,192 | ) | |
|
|
|
85
Table of Contents
The carrying amount of assets held for sale in the consolidated balances sheet as of April 30, 2014 was calculated as follows (in thousands):
| April 30, | ||||
| 2014 | ||||
| Total assets of discontinued operations |
$ | 42,937 | ||
| Estimated loss on disposal of discontinued operations, net of tax |
(9,192 | ) | ||
|
|
|
|||
| Assets held for sale |
$ | 33,745 | ||
|
|
|
|||
4. Fair Value of Financial Assets and Liabilities
The following table summarizes the Company’s cash and cash equivalents as of April 30, 2015 and 2014 (in thousands):
| April 30, | ||||||||
| 2015 | 2014 | |||||||
| Demand deposit accounts |
$ | 49,977 | $ | 24,721 | ||||
| Money market funds |
2,831 | 6,971 | ||||||
| Certificates of deposit |
— | 242 | ||||||
| Municipal bonds |
102 | — | ||||||
| Commercial paper |
875 | — | ||||||
| Corporate bonds |
256 | — | ||||||
|
|
|
|
|
|||||
| Total cash and cash equivalents |
$ | 54,041 | $ | 31,934 | ||||
|
|
|
|
|
|||||
The following table summarizes the Company’s short-term investments as of April 30, 2015 (in thousands):
| Cost | Gross Unrealized Gains |
Gross Unrealized Losses |
Fair Value | |||||||||||||
| Available-for-sale securities: |
||||||||||||||||
| Certificates of deposit |
$ | 4,000 | $ | 4 | $ | — | $ | 4,004 | ||||||||
| Municipal bonds |
4,564 | 17 | (16 | ) | 4,565 | |||||||||||
| Commercial paper |
6,269 | 4 | — | 6,273 | ||||||||||||
| U.S. Treasury notes |
23,820 | 1 | (12 | ) | 23,809 | |||||||||||
| U.S. Treasury bonds |
5,001 | — | (2 | ) | 4,999 | |||||||||||
| Corporate notes |
2,709 | 1 | (2 | ) | 2,708 | |||||||||||
| Corporate bonds |
6,395 | 3 | (26 | ) | 6,372 | |||||||||||
|
|
|
|
|
|
|
|
|
|||||||||
| Total short-term investments |
$ | 52,758 | $ | 30 | $ | (58 | ) | $ | 52,730 | |||||||
|
|
|
|
|
|
|
|
|
|||||||||
The following table summarizes the Company’s short-term investments as of April 30, 2014 (in thousands):
| Cost | Gross Unrealized Gains |
Gross Unrealized Losses |
Fair Value | |||||||||||||
| Available-for-sale securities: |
||||||||||||||||
| Certificates of deposit |
$ | 7,466 | $ | 17 | $ | (9 | ) | $ | 7,474 | |||||||
| U.S. Treasury notes |
33,226 | 2 | (2 | ) | 33,226 | |||||||||||
|
|
|
|
|
|
|
|
|
|||||||||
| Total short-term investments |
$ | 40,692 | $ | 19 | $ | (11 | ) | $ | 40,700 | |||||||
|
|
|
|
|
|
|
|
|
|||||||||
All short-term investments had original maturity dates of less than 12 months at April 30, 2015 and 2014. Realized gains and losses from the sale of short-term investments were not material for the years ended April 30, 2015, 2014, and 2013.
86
Table of Contents
The following table summarizes the fair value of the Company’s financial assets and liabilities that were measured on a recurring basis as of April 30, 2015 and 2014 (in thousands):
| Fair Value Measurements at April 30, | ||||||||||||||||||||||||||||||||
| 2015 | 2014 | |||||||||||||||||||||||||||||||
| Level 1 | Level 2 | Level 3 | Total | Level 1 | Level 2 | Level 3 | Total | |||||||||||||||||||||||||
| Assets: |
||||||||||||||||||||||||||||||||
| Cash equivalents: |
||||||||||||||||||||||||||||||||
| Money market funds |
$ | 2,831 | $ | — | $ | — | $ | 2,831 | $ | 6,971 | $ | — | $ | — | $ | 6,971 | ||||||||||||||||
| Certificates of deposit |
— | — | — | — | 242 | — | — | 242 | ||||||||||||||||||||||||
| Municipal bonds |
— | 102 | — | 102 | — | — | — | — | ||||||||||||||||||||||||
| Commercial paper |
— | 875 | — | 875 | — | — | — | — | ||||||||||||||||||||||||
| Corporate bonds |
— | 256 | — | 256 | — | — | — | — | ||||||||||||||||||||||||
|
|
|
|
|
|
|
|
|
|
|
|
|
|
|
|
|
|||||||||||||||||
| Total cash equivalents |
2,831 | 1,233 | — | 4,064 | 7,213 | — | — | 7,213 | ||||||||||||||||||||||||
|
|
|
|
|
|
|
|
|
|
|
|
|
|
|
|
|
|||||||||||||||||
| Restricted cash |
— | — | — | — | 604 | — | — | 604 | ||||||||||||||||||||||||
| Short-term investments: |
||||||||||||||||||||||||||||||||
| Certificates of deposit |
— | 4,004 | — | 4,004 | — | 7,474 | — | 7,474 | ||||||||||||||||||||||||
| Municipal bonds |
— | 4,565 | — | 4,565 | — | — | — | — | ||||||||||||||||||||||||
| Commercial paper |
— | 6,273 | — | 6,273 | — | — | — | — | ||||||||||||||||||||||||
| U.S. Treasury notes |
23,809 | — | — | 23,809 | 33,226 | — | — | 33,226 | ||||||||||||||||||||||||
| U.S. Treasury bonds |
4,999 | — | — | 4,999 | — | — | — | — | ||||||||||||||||||||||||
| Corporate notes |
— | 2,708 | — | 2,708 | — | — | — | — | ||||||||||||||||||||||||
| Corporate bonds |
— | 6,372 | — | 6,372 | — | — | — | — | ||||||||||||||||||||||||
|
|
|
|
|
|
|
|
|
|
|
|
|
|
|
|
|
|||||||||||||||||
| Total short-term investments |
28,808 | 23,922 | — | 52,730 | 33,226 | 7,474 | — | 40,700 | ||||||||||||||||||||||||
|
|
|
|
|
|
|
|
|
|
|
|
|
|
|
|
|
|||||||||||||||||
| Total assets |
$ | 31,639 | $ | 25,155 | $ | — | $ | 56,794 | $ | 41,043 | $ | 7,474 | $ | — | $ | 48,517 | ||||||||||||||||
|
|
|
|
|
|
|
|
|
|
|
|
|
|
|
|
|
|||||||||||||||||
The Company measures certain assets, including property and equipment, goodwill and intangible assets, at fair value on a non-recurring basis. These assets are recognized at fair value when they are deemed to be other-than-temporarily impaired. The Company evaluates transfers between levels at the end of the fiscal year and assumes that any identified transfers are deemed to have occurred at the end of the reporting year. There were no transfers between levels in any of the periods presented.
5. Property, Equipment and Capitalized Internal-Use Software Development Costs
Property and equipment, including capitalized internal-use software development costs, consisted of the following (in thousands):
| April 30, | ||||||||
| 2015 | 2014 | |||||||
| Computer equipment |
$ | 3,052 | $ | 3,380 | ||||
| Furniture and fixtures |
1,888 | 2,453 | ||||||
| Office equipment |
2,072 | 1,827 | ||||||
| Software |
962 | 1,407 | ||||||
| Capitalized internal-use software development costs |
29,628 | 20,245 | ||||||
| Leasehold improvements |
7,256 | 6,298 | ||||||
|
|
|
|
|
|||||
| 44,858 | 35,610 | |||||||
| Less: accumulated depreciation and amortization |
(25,804 | ) | (18,605 | ) | ||||
|
|
|
|
|
|||||
| $ | 19,054 | $ | 17,005 | |||||
|
|
|
|
|
|||||
87
Table of Contents
Depreciation and amortization relating to the Company’s property and equipment for the years ended April 30, 2015, 2014 and 2013 was $3.7 million, $3.3 million and $2.8 million, respectively. Amortization related to the Company’s capitalized internal-use software development costs for the years ended April 30, 2015, 2014 and 2013 was $6.8 million, $4.6 million and $2.5 million, respectively.
6. Business Combinations
Fiscal Year 2014
FeedMagnet
On April 15, 2014, the Company acquired FeedMagnet Inc. (“FeedMagnet”), a privately-owned social media curation company, for $9.3 million in cash. The Company accounted for the FeedMagnet acquisition using the acquisition method of accounting.
The Company allocated the purchase price to the assets acquired, including intangible assets, and liabilities assumed based on estimated fair values at the date of the acquisition. The Company estimated the value of tangible assets and liabilities based on purchase price and future intended use. The Company derived the value of intangible assets from the present value of estimated future benefits from the various intangible assets acquired.
The Company allocated the purchase price for FeedMagnet as follows (in thousands):
| Cash and cash equivalents |
$ | 383 | ||
| Accounts receivable |
695 | |||
| Prepaid expenses and other current assets |
19 | |||
| Intangible assets: |
||||
| Developed technology (3 year useful life) |
3,265 | |||
| Customer relationships (3 to 10 year useful life) |
535 | |||
|
|
|
|||
| Total identified intangibles |
3,800 | |||
| Goodwill |
6,324 | |||
|
|
|
|||
| Total assets acquired |
$ | 11,221 | ||
| Accounts payable |
(80 | ) | ||
| Accrued expenses and other current liabilities |
(187 | ) | ||
| Deferred revenue |
(234 | ) | ||
| Deferred tax liability |
(1,391 | ) | ||
|
|
|
|||
| Total liabilities assumed |
$ | (1,892 | ) | |
|
|
|
|||
| Net assets acquired |
$ | 9,329 | ||
|
|
|
The consideration paid was as follows (in thousands):
| Cash |
$ | 9,329 | ||
|
|
|
|||
| Total consideration |
$ | 9,329 | ||
|
|
|
Goodwill represents the excess of the purchase price over the aggregate fair value of the net identifiable assets acquired and is not deductible for tax purposes. Goodwill for FeedMagnet resulted primarily from the Company’s expectations that FeedMagnet’s solutions will enhance the Company’s product offerings. The Company integrated the FeedMagnet business into the Company’s operations; therefore, there are no separate revenue and earnings for FeedMagnet since the integration.
88
Table of Contents
Fiscal Year 2013
PowerReviews
On June 12, 2012, the Company acquired PowerReviews, a provider of social commerce solutions, for a total cash and stock purchase price of $150.8 million.
On January 8, 2014, the Court ruled that the Company’s acquisition of PowerReviews violated Section 7 of the Clayton Act, 15 U.S.C. Section 18. On April 24, 2014, the Company entered into a Joint Stipulation with the DOJ to resolve the DOJ’s claims in the antitrust action and, together with the DOJ, the Company submitted a proposed order to the Court. Under the terms of the Joint Stipulation and the proposed order, the Company was required to divest all of the net assets of the PowerReviews business. On June 4, 2014, the Company entered into a definitive agreement to divest the assets of PowerReviews, pursuant to a Joint Stipulation with the Court for $30.0 million in cash, $4.5 million of which remains in escrow as a partial security for the Company’s indemnification obligations under the definitive agreement and is set to expire in July 2015 (See Note 15). As a result, PowerReviews revenues, related expenses and loss on disposal, net of tax, are components of “loss from discontinued operations, net of tax” in the consolidated statements of operations. See Note 3 for further discussion of our discontinued operations.
Longboard Media, Inc.
On November 5, 2012, the Company acquired Longboard Media, Inc. (“Longboard Media”), a full service media management network for retailers, shopping publishers and advertisers for approximately $26.9 million in cash, 0.5 million shares of the Company’s common stock and future contingent consideration with an acquisition date fair value of $4.3 million. The contingent consideration was payable to Longboard Media’s achievement of certain performance goals for the period from January 1, 2013 to December 31, 2013. The estimated fair value of contingent consideration was determined using a weighted average probability of various outcomes of achieving the performance goals. Changes in the fair value of this contingent consideration were recorded in the statement of operations through December 31, 2013. At the date of acquisition, the Company estimated that an additional contingent consideration of approximately $2.0 million would be paid to certain identified key individuals conditional upon being employed with the Company through December 31, 2013.
As of April 30, 2013, the fair value of the contingent consideration included in the purchase consideration, which is recorded in accrued expenses and other current liabilities, was $3.3 million. On October 31, 2013, the Company determined that the probability of attaining the underlying performance goals had become remote; and, as a result, the fair value of the contingent consideration included in the purchase price and the resultant payout was estimated to be zero. On January 31, 2014, the Company concluded that the underlying performance goals were not met and the payout was zero. The decrease in fair value of $3.3 million was recorded as a benefit to general and administrative expense for the fiscal year ended April 30, 2014.
At April 30, 2013, the additional contingent consideration payable to the identified key individuals conditional upon being employed with the Company, was estimated to be $1.5 million and was being recorded over the period for which services were provided. As of October 31, 2013, the estimated payout was determined to be zero, so this additional contingent consideration was also reduced to zero. On January 31, 2014, the Company concluded that the payout was zero. As a result, $1.0 million was recorded as a benefit to general and administration expense and sales and marketing expense for the fiscal year ended April 30, 2014.
The Company did not have any liabilities related to contingent consideration as of April 30, 2015 or April 30, 2014.
89
Table of Contents
7. Goodwill
As of April 30, 2015 and April 30, 2014, the Company had goodwill in the amount of $139.2 million. The Company evaluates goodwill for impairment annually in the fourth fiscal quarter or more frequently if indicators of potential impairment arise. The Company did not recognize any goodwill impairment during fiscal year 2015 and fiscal year 2014.
The following table reflects the changes in goodwill for the fiscal years ended April 30, 2015 and April 30, 2014 (in thousands):
| Balance, as of April 30, 2013 |
$ | 132,831 | ||
| Goodwill related to FeedMagnet acquisition |
6,324 | |||
| Balance, as of April 30, 2014 |
$ | 139,155 | ||
|
|
|
|||
| Balance, as of April 30, 2015 |
$ | 139,155 | ||
|
|
|
8. Acquired Intangible Assets, net
The Company evaluates the recoverability of its long-lived assets for impairment annually in the fourth fiscal quarter or more frequently if indicators of potential impairment arise. The Company did not recognize any impairment of its acquired intangible assets during fiscal year 2015.
As a result of the divestiture of the PowerReviews business (See Note 3), the Company evaluated the recoverability of its long-lived assets resulting from the acquisition of PowerReviews. The Company performed the first step of impairment test by comparing the undiscounted cash flows to be generated by the asset group allocated to PowerReviews (inclusive of the value of the customer relationships and developed technology) to the carrying value of the asset group as of April 30, 2014. Undiscounted cash flows included the cash flows resulting from the continued operation of the asset group plus estimated probability weighted proceeds from a potential divestiture. The undiscounted cash flows of the assets did not exceed the carrying value of the asset group as of April 30, 2014. As a result, the Company incurred a $2.5 million impairment loss, $2.4 million of which was allocated to customer relationships and $0.1 million of which was allocated to developed technology. Due to the classification of the PowerReviews business as discontinued operations, the $2.5 million impairment loss is included in the loss from discontinued operations, net of tax, in the consolidated statements of operations for fiscal year ended April 30, 2014.
On December 1, 2012, the Company closed an agreement to purchase customer contracts operated in Europe by Shopzilla, Inc. (“Shopzilla”) using PowerReviews technology under a license agreement between Shopzilla and PowerReviews. The Company determined that the transaction did not constitute a business combination. The entire purchase price of $4.7 million was allocated to a customer relationship intangible asset as the intent of the purchase was to gain access to Shopzilla’s contractual customer relationships. Cash remitted on the date of purchase was $4.2 million, and $0.5 million of the purchase price was recorded as a holdback liability in accrued expenses and other current liabilities as of April 30, 2013. The hold back liability was paid in the third quarter of fiscal 2014. In January 2014 and March 2013, the Company purchased additional customer contracts from Shopzilla for $30 thousand and $0.2 million, respectively. The useful life of the acquired contractual customer relationships was determined to be ten years. As these clients are supported by the PowerReviews platform, they were part of the PowerReviews divestiture (See Note 3). As a result, the customer relationship intangible asset has been included in discontinued operations as a component of “Assets held for sale” as of April 30, 2014.
90
Table of Contents
Acquired intangible assets, net, as of April 30, 2015 and April 30, 2014 for continuing operations are as follows (in thousands):
| April 30, | ||||||||||||||||||||||||
| 2015 | 2014 | |||||||||||||||||||||||
| Gross Fair Value |
Accumulated Amortization |
Net Book Value |
Gross Fair Value |
Accumulated Amortization |
Net Book Value |
|||||||||||||||||||
| Customer relationships |
$ | 11,835 | $ | (2,921 | ) | $ | 8,914 | $ | 11,835 | $ | (1,684 | ) | $ | 10,151 | ||||||||||
| Developed technology |
3,265 | (681 | ) | 2,584 | 3,265 | (28 | ) | 3,237 | ||||||||||||||||
|
|
|
|
|
|
|
|
|
|
|
|
|
|||||||||||||
| Total |
$ | 15,100 | $ | (3,602 | ) | $ | 11,498 | $ | 15,100 | $ | (1,712 | ) | $ | 13,388 | ||||||||||
|
|
|
|
|
|
|
|
|
|
|
|
|
|||||||||||||
Acquired intangible assets, net, as of July 2, 2014 and April 30, 2014 for discontinued operations are as follows (in thousands):
| July 2, | April 30, | |||||||||||||||||||||||||||||||
| 2014 | 2014 | |||||||||||||||||||||||||||||||
| Gross Fair Value |
Accumulated Amortization |
Impairment | Net Book Value |
Gross Fair Value |
Accumulated Amortization |
Impairment | Net Book Value |
|||||||||||||||||||||||||
| Customer relationships |
$ | 39,966 | $ | (7,463 | ) | $ | (2,354 | ) | $ | 30,149 | $ | 39,966 | $ | (7,463 | ) | $ | (2,354 | ) | $ | 30,149 | ||||||||||||
| Developed technology |
5,400 | (3,390 | ) | (146 | ) | 1,864 | 5,400 | (3,390 | ) | (146 | ) | 1,864 | ||||||||||||||||||||
| Domain name (indefinite useful life) |
800 | — | — | 800 | 800 | — | — | 800 | ||||||||||||||||||||||||
|
|
|
|
|
|
|
|
|
|
|
|
|
|
|
|
|
|||||||||||||||||
| Total |
$ | 46,166 | $ | (10,853 | ) | $ | (2,500 | ) | $ | 32,813 | $ | 46,166 | $ | (10,853 | ) | $ | (2,500 | ) | $ | 32,813 | ||||||||||||
|
|
|
|
|
|
|
|
|
|
|
|
|
|
|
|
|
|||||||||||||||||
Because the sale of the PowerReviews business was completed on July 2, 2014, there were no acquired intangible assets, net, for discontinued operations as of April 30, 2015.
The amortization of customer relationships is recorded as amortization expense and the amortization for developed technology is recorded in cost of revenue. For the years ended April 30, 2015 and April 30, 2014, the Company incurred amortization expense of acquired intangible assets of $1.9 million and $1.1 million, respectively.
The following table presents our estimate of future amortization expense for definite-lived intangible assets (in thousands):
| Fiscal period: |
Amount | |||
| Fiscal year 2016 |
$ | 1,890 | ||
| Fiscal year 2017 |
1,890 | |||
| Fiscal year 2018 |
1,890 | |||
| Fiscal year 2019 |
1,856 | |||
| Fiscal year 2020 |
1,130 | |||
| Thereafter |
2,842 | |||
|
|
|
|||
| Total |
$ | 11,498 | ||
|
|
|
|||
91
Table of Contents
9. Accrued Expenses and Other Current Liabilities
Accrued liabilities, including other liabilities, consisted of the following (in thousands):
| April 30, | ||||||||
| 2015 | 2014 | |||||||
| Accrued compensation |
$ | 10,675 | $ | 11,834 | ||||
| Accrued taxes |
3,629 | 4,808 | ||||||
| Accrued revenue share |
4,940 | 3,050 | ||||||
| Accrued other liabilities |
8,153 | 7,379 | ||||||
|
|
|
|
|
|||||
| Total accrued expenses and other current liabilities |
$ | 27,397 | $ | 27,071 | ||||
|
|
|
|
|
|||||
In October 2009, the Company signed a lease agreement, which expires on December 31, 2015, in Austin, Texas to expand its corporate headquarters. In conjunction with the lease signing, the Company received $2.9 million of leasehold improvement incentives. In February 2012, the Company signed a lease for additional space at its current corporate headquarters and received $0.6 million of additional leasehold improvement incentives. The Company has also signed leases for office premises at various other locations and has received rent-free periods as lease incentives. These were recorded as a liability and are being amortized over the term of the lease as a reduction to rent expense. As of April 30, 2015, $0.8 million of the lease incentive liability was included within accrued rent and $0.3 million of lease incentive liability was included in other liabilities, long-term. As of April 30, 2014, $1.2 million of the lease incentive liability was included within accrued rent and $1.2 million of lease incentive liability was included in other liabilities, long-term.
On November 13, 2014, the Company entered into a lease (the “Lease”), pursuant to which the Company will lease approximately 137,615 square feet of office space in Austin, Texas. This will serve as the new headquarters of the Company and will be used for general office purposes. The term of the Lease commences on January 1, 2016 unless otherwise modified (“Commencement Date”) and terminates approximately ten years and six months after the Commencement Date. The Company has the option to extend the term of the Lease for up to two successive periods of five years each and the Company was required to obtain a stand by letter of credit of $8.0 million as a security deposit for the Lease. The expected lease payments for the original term are estimated to be approximately $0.3 million for fiscal year ended April 30, 2016, $3.8 million for fiscal year ended April 30, 2017, $3.8 million for fiscal year ended April 30, 2018, $3.9 million for fiscal year ended April 30, 2019, $4.0 million for the fiscal year ended April 30, 2020 and $25.9 million for the fiscal years ended April 30th thereafter. As of April 30, 2015, the Company has not recorded any leasehold improvement incentives related to the Lease.
10. Debt
Prior Credit Facility
On July 18, 2007, the Company entered into a loan and security agreement (“Loan Agreement”) with Comerica Bank which was amended from time to time. The Loan Agreement provided for a revolving line of credit with a borrowing capacity of up to the lesser of (a) $30.0 million or (b) 100% of eligible monthly service fees as defined in the Loan Agreement, inclusive of any amounts outstanding under the $2.7 million sublimit for corporate credit card and letter of credit services. The revolving line of credit was set to expire on January 31, 2015. The revolving line of credit bore interest at the prime base rate as defined in the Loan Agreement except during any period of time during which the line bore interest at the daily adjusting LIBOR rate plus 2.5%. Borrowings under the revolving line of credit were collateralized by substantially all assets of the Company and its U.S. subsidiaries. As of April 30, 2014, the Company had drawn down $1.6 million in the form of a letter of credit as security deposits for its leased corporate headquarters which expired on December 31, 2014. As per the provision of the lease, the Company is required to maintain this security deposit until December 31, 2015, then end of the contractual term of the lease. The Company is currently in the process of renewing this letter of credit. As of October 31, 2014, the Company had drawn down an additional $0.3 million in the form of letters of credit as security deposits for its leased San Francisco office space. On February 21, 2014, the Company drew down
92
Table of Contents
$27.0 million of its unused balance of the revolving line of credit which was repaid on November 21, 2014 upon execution of the Amended and Restated Credit Facility. The outstanding loan balance as of April 30, 2014, was subject to all terms and conditions described above in the Loan Agreement and its subsequent amendments. The unused balance of the revolving line of credit was $1.4 million as of April 30, 2014. The Company was in compliance with all financial covenants as of April 30, 2014.
Amended and Restated Credit Facility
On November 21, 2014, the Company entered into an Amended and Restated Credit Facility (the “Credit Facility”) with Comerica Bank which provides for a secured, revolving line of credit of up to $70.0 million, with a sublimit of $3.0 million for the incurrence of swingline loans and a sublimit of $15.0 million for the issuance of letters of credit. The Credit Facility amended and restated the Loan Agreement and all letters of credits under the Loan Agreement were transferred to the Credit Facility. Borrowings under the Credit Facility are collateralized by substantially all assets of the Company and of its U.S. subsidiaries. The revolving line of credit bears interest at the adjusted LIBOR rate plus 3.5%. On November 21, 2014, the Company drew down $57.0 million of the unused balance of the Credit Facility, of which, $27.0 million was used to repay the outstanding balance on the Loan Agreement. On December 4, 2014, the Company drew down $8.0 million in the form of a letter of credit as a security deposit for the lease for the Company’s new headquarters (See Note 15). In January 2015, the Company transferred a $1.0 million Pledge and Security Agreement to be included as a form of a letter of credit under the Credit Facility, resulting in an unused balance of $3.7 million as of April 30, 2015. The Credit Facility expires on November 21, 2017 with all advances immediately due and payable. The Company was in compliance with all financial covenants contained in the Credit Facility as of April 30, 2015.
The Company did not recognize a gain or loss on the extinguishment of the Loan Agreement. The Company incurred $0.7 million of fees in connection with the Amended and Restated Credit Facility which were capitalized and are being amortized to interest expense using the straight-line method, which approximates the effective interest method, over the life of the Credit Facility. For the fiscal year 2015, the Company incurred amortization expense on deferred financing costs of $0.1 million.
Pledge and Security Agreement
On November 4, 2008, the Company entered into a Pledge and Security Agreement with Comerica for a standby letter of credit for credit card services from a separate financial institution which was amended on October 29, 2014 to increase the standby letter of credit by $0.5 million to $1.0 million. The Company pledged a security interest in its money market account, in which the balance must equal at least the credit extended. This letter of credit expires annually, and the pledged security interest is recorded as short-term restricted cash in the Company’s consolidated financial statements. In January 2015, the Company transferred the $1.0 million Pledge and Security Agreement to be included as a form of letter of credit under the Credit Facility, therefore the Pledge and Security Agreement obligations are no longer considered restricted cash.
11. Common Stock
On February 29, 2012, the Company completed its initial public offering in which the Company sold 10,906,941 shares of its common stock, of which 10,422,645 shares were offered by the Company and 484,296 shares were offered by selling stockholders, at a price of $12 per share. The gross proceeds raised by the Company from the sale of our common stock in the offering was approximately $125.1 million, resulting in net proceeds from the sale of our common stock of approximately $112.8 million, after deducting underwriting discounts and commissions of approximately $8.8 million and other offering expenses of approximately $3.5 million.
On July 23, 2012, the Company completed a follow-on offering in which 9,775,000 shares of its common stock were sold, of which 3,625,000 shares were offered by the Company and 6,150,000 shares were offered by selling stockholders, at a price of $15.40 per share. The gross proceeds raised by the Company from the sale of
93
Table of Contents
its common stock in the offering was approximately $55.8 million, resulting in net proceeds to the Company from the sale of its common stock of approximately $51.9 million, after deducting underwriting discounts and commissions of approximately $2.7 million and other offering expenses of approximately $1.2 million.
12. Stockholders’ Equity
2005 Stock Plan
On June 14, 2005, the Company adopted the Bazaarvoice, Inc. 2005 Stock Plan (the “2005 Plan”). The 2005 Plan provided in part that incentive and non-qualified stock options, as defined by the Internal Revenue Code of 1986, as amended, to purchase shares of the Company’s common stock could be granted to employees, directors and consultants. Stock purchase rights could also be granted under the 2005 Plan. The Company’s ability to grant any future equity awards under the 2005 Plan was terminated in January 2012. As of April 30, 2015, options to purchase 1,718,468 shares of common stock were outstanding under the 2005 Plan. Accordingly, the Company has reserved 1,718,468 shares of common stock to permit the exercise of 2005 Plan options outstanding. The Company’s 2005 Plan will continue to govern the terms and conditions of outstanding equity awards that were granted under the 2005 Plan.
2012 Stock Plan
On January 17, 2012, the Company adopted the Bazaarvoice, Inc. 2012 Equity Incentive Plan (the “2012 Plan”). The 2012 Plan was adopted to replace the 2005 Plan and also gives the Company the ability to grant restricted stock and performance related stock. Under the 2012 Plan non-qualified and incentive stock options may be issued at an exercise price equal to at least 100% of the fair market value of the Company’s common stock at the option grant date. No portion of any stock option may be exercised after the expiration date. However, if an employee owns or is deemed to own more than 10% of the combined voting power of all classes of stock of the Company and a stock option is granted to such employee, the term of such stock option will be no more than five years from the date of grant or such shorter term as may be provided in the option agreement and the exercise price must be at least 110% of the fair market value on the date of grant. The maximum term of options issued under the 2012 Plan is ten years. Options granted to date generally vest over a four-year period with 25% vesting at the end of one year and the remaining vest monthly thereafter. The Company also grants restricted stock awards (“RSAs”) and restricted stock units (“RSUs”) which generally vest annually over a four-year period.
As of April 30, 2015, options to purchase 3,353,763 shares of common stock and 3,360,693 RSUs were outstanding under the 2012 Plan. As of April 30, 2015, a total of 6,787,141 shares of common stock were available for grant under the 2012 Plan. All equity awards granted following the Company’s initial public offering were granted under the 2012 Plan.
Employee Stock Purchase Plan (“ESPP”)
On January 17, 2012, the Company also adopted the Bazaarvoice, Inc. 2012 Employee Stock Purchase Plan. Under the Company’s ESPP, employees are granted the right to purchase shares of common stock at a price per share that is 85% of the lesser of the fair market value of the shares at (i) the first trading day of offering period or (ii) the last day of the offering period, subject to a plan limit on the number of shares that may be purchased in a purchase period. The offerings under the ESPP commenced, beginning with a six month offering period starting in March 2013. As of April 30, 2015, the Company has 2,471,524 shares of its common stock reserved for future issuance under this plan. As of April 30, 2015, $0.4 million has been held on behalf of employees for future purchases under the plan and is recorded in accrued expenses and other current liabilities. Employees purchased 441,144 shares of common stock at an average price of $5.65 in the fiscal year ended April 30, 2015.
94
Table of Contents
PowerReviews, Inc. 2005 Equity Incentive Plan
As part of the June 2012 acquisition of PowerReviews, the Company assumed certain outstanding stock options granted under the PowerReviews, Inc. 2005 Equity Incentive Plan (the “PowerReviews Plan”). Following the acquisition, the assumed options continue to be subject to the terms of the PowerReviews Plan and individual award agreements except (i) the assumed options became exercisable for shares of the Company’s common stock, (ii) the number of shares and exercise price of each option was be adjusted pursuant to an exchange ratio established in the acquisition and (iii) assumed options would not be exercisable prior to vesting. As of April 30, 2015, options to purchase 20,824 shares of common stock were outstanding under the PowerReviews Plan. Accordingly, the Company has reserved 20,824 shares of common stock to permit the exercise of PowerReviews Plan options outstanding. The Company has not granted any new awards under the PowerReviews Plan.
Stock-Based Expense
The Company estimates the fair value of options granted using the Black-Scholes option pricing model. Since the Company was a private entity prior to our initial public offering in February 2012 with little historical data regarding the volatility of the common stock price, the Company bases the expected volatility on the historical volatility of comparable companies from a representative industry peer group. The expected volatility of options granted is determined using an average of the historical volatility measures of this peer group. The volatility for ESPP is based on the historical volatility of the Company. As allowed under current guidance, the Company has elected to apply the “simplified method” in developing the estimate of expected life for “plain vanilla” stock options by using the midpoint between the graded vesting period and the contractual termination date as the Company does not have sufficient historical exercise data to provide a reasonable basis upon which to estimate the expected term. The Company has not paid and does not anticipate paying cash dividends on the common stock; therefore, the expected dividend yield was assumed to be zero. The risk-free interest rate is based on the rate for a U.S. government security with the same estimated life at the time of the option grant and the stock purchase rights. The Company’s stock-based expense was $12.8 million, $14.5 million and $22.5 million for the years ended April 30, 2015, 2014 and 2013, respectively.
The fair value of the Company’s options was estimated at the date of grant using a Black-Scholes option pricing model with the following assumptions:
| Year Ended April 30, | ||||||
| 2015 | 2014 | 2013 | ||||
| Expected volatility |
43% - 50% | 53% - 54% | 54% - 55% | |||
| Risk-free interest rate |
1.46% - 1.93% | 1.30% - 2.09% | 0.83% - 1.40% | |||
| Expected term (in years) |
6.00 | 6.00 - 6.25 | 5.94 - 6.25 | |||
| Dividend yield |
— | — | — | |||
The fair value of the Company’s ESPP was estimated at the date of grant using a Black-Scholes option pricing model with the following assumptions:
| Year Ended April 30, | ||||||
| 2015 | 2014 | 2013 | ||||
| Expected volatility |
36% - 57% | 36% - 43% | 36% - 37% | |||
| Risk-free interest rate |
0.05% - 0.11% | 0.05% - 0.11% | 0.10% - 0.11% | |||
| Expected term (in years) |
0.5 | 0.5 | 0.5 | |||
| Dividend yield |
— | — | — | |||
95
Table of Contents
Stock Option Activity
Stock option activity was as follows:
| Number of Options (in thousands) |
Weighted Average Exercise Price |
Weighted Average Remaining Contractual Term (in years) |
Aggregate Intrinsic Value (in thousands) |
|||||||||||||
| Balance as of April 30, 2013 |
10,829 | 6.83 | ||||||||||||||
| Options granted |
2,092 | 8.32 | ||||||||||||||
| Options exercised |
(3,360 | ) | 3.34 | |||||||||||||
| Options forfeited |
(2,470 | ) | 10.22 | |||||||||||||
|
|
|
|
|
|
|
|
|
|||||||||
| Balance as of April 30, 2014 |
7,091 | $ | 7.74 | 7.02 | $ | 6,264 | ||||||||||
|
|
|
|
|
|
|
|
|
|||||||||
| Options granted |
939 | 7.31 | ||||||||||||||
| Options exercised |
(1,246 | ) | 4.18 | |||||||||||||
| Options forfeited |
(1,691 | ) | 9.85 | |||||||||||||
|
|
|
|
|
|
|
|
|
|||||||||
| Balance as of April 30, 2015 |
5,093 | $ | 7.83 | 7.00 | $ | 1,590 | ||||||||||
|
|
|
|
|
|
|
|
|
|||||||||
| Options vested and expected to vest at April 30, 2015 |
4,977 | $ | 7.81 | 6.96 | $ | 1,590 | ||||||||||
|
|
|
|
|
|
|
|
|
|||||||||
| Options vested and exercisable as of April 30, 2015 |
2,891 | $ | 7.60 | 5.89 | $ | 1,587 | ||||||||||
|
|
|
|
|
|
|
|
|
|||||||||
The summary of stock options as of April 30, 2015 is as follows (number of options in thousands):
| Options Outstanding | Options Exercisable | |||||||||||||||||||
| Range of Exercise Prices |
Number of Options |
Weighted Average Exercise Price |
Weighted Average Remaining Contractual Term (in years) |
Number of Options |
Weighted Average Exercise Price |
|||||||||||||||
| $0.00 - $4.85 |
523 | $ | 2.69 | 3.50 | 522 | $ | 2.69 | |||||||||||||
| $4.86 - $5.75 |
538 | 5.14 | 5.19 | 387 | 4.91 | |||||||||||||||
| $6.28 - $6.58 |
536 | 6.47 | 7.08 | 383 | 6.44 | |||||||||||||||
| $7.08 - $7.36 |
560 | 7.22 | 8.75 | 147 | 7.19 | |||||||||||||||
| $7.39 - $7.50 |
596 | 7.42 | 8.19 | 270 | 7.41 | |||||||||||||||
| $7.53 - $8.10 |
585 | 7.63 | 9.08 | 27 | 8.10 | |||||||||||||||
| $8.58 - $9.46 |
362 | 8.90 | 6.73 | 265 | 8.80 | |||||||||||||||
| $9.51 - $9.51 |
550 | 9.51 | 8.10 | 264 | 9.51 | |||||||||||||||
| $9.52 - $12.00 |
515 | 11.59 | 6.02 | 378 | 11.62 | |||||||||||||||
| $13.95 - $18.67 |
328 | 14.89 | 6.23 | 248 | 14.94 | |||||||||||||||
|
|
|
|
|
|
|
|
|
|
|
|||||||||||
| $0.00 - $18.67 |
5,093 | $ | 7.83 | 7.00 | 2,891 | $ | 7.60 | |||||||||||||
|
|
|
|
|
|
|
|
|
|
|
|||||||||||
The weighted-average grant date fair value of options granted during the fiscal years ended April 30, 2015, 2014 and 2013 was $3.47, $4.32 and $5.75, respectively.
The aggregate intrinsic value of options exercised during the fiscal years ended April 30, 2015, 2014 and 2013 was $4.5 million, $18.6 million and $42.8 million, respectively. The aggregate fair value of options vested during the fiscal years ended April 30, 2015, 2014, and 2013 was $6.1 million, $9.7 million, and $29.6 million, respectively. As of April 30, 2015, total unrecognized stock-based expense, adjusted for estimated forfeitures, related to stock options was $8.3 million, which is expected to be recognized over the next 2.52 years.
96
Table of Contents
Restricted Stock Activity
Restricted stock activity was as follows (number of restricted shares in thousands):
| Number of Restricted Shares |
Weighted Average Grant Date Fair Value |
|||||||
| Unvested balance as of April 30, 2013 |
1,095 | $ | 10.63 | |||||
| Restricted shares granted |
2,629 | 8.30 | ||||||
| Restricted shares vested |
(321 | ) | 11.11 | |||||
| Restricted shares forfeited |
(426 | ) | 11.18 | |||||
|
|
|
|
|
|||||
| Unvested balance as of April 30, 2014 |
2,977 | $ | 8.44 | |||||
|
|
|
|
|
|||||
| Restricted shares granted |
2,305 | 7.66 | ||||||
| Restricted shares vested |
(715 | ) | 8.74 | |||||
| Restricted shares forfeited |
(1,079 | ) | 8.38 | |||||
|
|
|
|
|
|||||
| Unvested balance as of April 30, 2015 |
3,488 | $ | 7.88 | |||||
|
|
|
|
|
|||||
The aggregate fair value of restricted stock shares vested during the fiscal years ended April 30, 2015, 2014, and 2013 was $6.2 million, $3.6 million, and $1.0 million, respectively. As of April 30, 2015, total unrecognized stock-based expense adjusted for estimated forfeitures, related to restricted stock was $23.6 million, which is expected to be recognized over the next 3.04 years.
Other Stock-Related Expense (Benefit)
During an evaluation of its equity systems and implementation of additional internal controls to comply with the provisions of Section 404 of the Sarbanes-Oxley Act during year ended April 30, 2013, the Company identified certain non-qualified stock option grants that were improperly classified as incentive stock options in its financial systems. As a result of these classification differences, the Company recorded an estimated liability for $2.2 million for taxes, interest and related items in general and administrative expense. Of the $2.2 million estimated liability, $0.8 million of the liability is related to PowerReviews which, in fiscal year 2014, was classified as a discontinued operations (See Note 3). As such, the $0.8 million related to PowerReviews is included in “Loss from discontinued operations, net of tax” on the Consolidated Statements of Operations. These classification differences did not have a material impact on stock-based expenses for the years ended April 30, 2015, 2014 and 2013. The Company also determined that the estimated liability did not have a material impact on the financial statements for prior periods. During the year ended April 30, 2015, the Company recorded a benefit of $0.4 million due to a reduction in the estimated liability.
97
Table of Contents
13. Net Loss Per Share Applicable To Common Stockholders from Continuing Operations
The following table sets forth the computations of loss per share applicable to common stockholders for the years ended April 30, 2015, 2014 and 2013 (in thousands, except per share data):
| Year Ended April 30, | ||||||||||||
| 2015 | 2014 | 2013 | ||||||||||
| Net loss from continuing operations |
$ | (33,164 | ) | $ | (52,846 | ) | $ | (47,503 | ) | |||
| Net loss from discontinued operations, net of tax |
(1,257 | ) | (10,320 | ) | (16,249 | ) | ||||||
|
|
|
|
|
|
|
|||||||
| Net loss applicable to common stockholders |
$ | (34,421 | ) | $ | (63,166 | ) | $ | (63,752 | ) | |||
|
|
|
|
|
|
|
|||||||
| Basic and diluted loss per share |
||||||||||||
| Continuing operations |
$ | (0.42 | ) | $ | (0.70 | ) | $ | (0.69 | ) | |||
| Discontinued operations |
(0.02 | ) | (0.14 | ) | (0.23 | ) | ||||||
|
|
|
|
|
|
|
|||||||
| Basic and diluted loss per share: |
$ | (0.44 | ) | $ | (0.84 | ) | $ | (0.92 | ) | |||
| Basic and diluted weighted average number of shares outstanding |
78,645 | 75,564 | 69,336 | |||||||||
| Potentially dilutive securities (1): |
||||||||||||
| Outstanding stock options |
721 | 2,149 | 5,718 | |||||||||
| Restricted shares |
427 | 293 | 67 | |||||||||
| (1) | The impact of potentially dilutive securities on earnings per share is anti-dilutive in a period of net loss. |
14. Income Taxes
U.S. and international components of loss before income taxes were as follows (in thousands):
| Year Ended April 30, | ||||||||||||
| 2015 | 2014 | 2013 | ||||||||||
| U.S. |
$ | (35,174 | ) | $ | (55,508 | ) | $ | (50,538 | ) | |||
| International |
2,064 | 2,162 | 1,863 | |||||||||
|
|
|
|
|
|
|
|||||||
| Loss from continuing operations before income taxes |
$ | (33,110 | ) | $ | (53,346 | ) | $ | (48,675 | ) | |||
|
|
|
|
|
|
|
|||||||
Income tax expense (benefit) is composed of the following (in thousands):
| Year Ended April 30, | ||||||||||||
| 2015 | 2014 | 2013 | ||||||||||
| Current: |
||||||||||||
| Federal |
$ | (38 | ) | $ | — | $ | — | |||||
| State |
182 | 294 | 931 | |||||||||
| International |
951 | 567 | 518 | |||||||||
|
|
|
|
|
|
|
|||||||
| Total |
1,095 | 861 | 1,449 | |||||||||
| Deferred: |
||||||||||||
| Federal |
(12,491 | ) | (13,930 | ) | (11,190 | ) | ||||||
| State |
(2,308 | ) | (2,091 | ) | 9 | |||||||
| International |
44 | 203 | (90 | ) | ||||||||
|
|
|
|
|
|
|
|||||||
| Total |
(14,755 | ) | (15,818 | ) | (11,271 | ) | ||||||
| Change in valuation allowance |
13,714 | 14,457 | 8,650 | |||||||||
|
|
|
|
|
|
|
|||||||
| Provision for (benefit from) income taxes |
$ | 54 | $ | (500 | ) | $ | (1,172 | ) | ||||
|
|
|
|
|
|
|
|||||||
98
Table of Contents
The difference between the tax expense (benefit) derived by applying the Federal statutory income tax rate to net losses and the expense recognized in the financial statements is as follows (in thousands):
| Year Ended April 30, | ||||||||||||
| 2015 | 2014 | 2013 | ||||||||||
| U.S. federal taxes at statutory rate |
$ | (11,257 | ) | $ | (18,138 | ) | $ | (16,550 | ) | |||
| State tax provision |
(923 | ) | (1,510 | ) | 250 | |||||||
| Foreign tax rate differentials |
(206 | ) | (123 | ) | (185 | ) | ||||||
| Research and development credit |
(1,972 | ) | (1,201 | ) | (1,198 | ) | ||||||
| Stock options |
506 | 1,608 | 3,752 | |||||||||
| Nondeductible legal expenses |
200 | 5,796 | 3,956 | |||||||||
| Permanent differences and other |
(8 | ) | (1,389 | ) | 153 | |||||||
| Change in valuation allowance |
13,714 | 14,457 | 8,650 | |||||||||
|
|
|
|
|
|
|
|||||||
| Provision for (benefit from) income taxes |
$ | 54 | $ | (500 | ) | $ | (1,172 | ) | ||||
|
|
|
|
|
|
|
|||||||
As of April 30, 2015 and 2014, the Company had federal net operating loss carry-forwards of $191.9 million and $190.9 million and research and development credit carry-forwards of $7.7 million and $4.8 million, respectively, which will begin expiring in 2026 if not utilized. At April 30, 2015 the Company had $33.7 million of excess stock based compensation tax deductions that have not been used to reduce income taxes payable.
As of April 30, 2015 and 2014, the Company had state net operating loss carryforwards of $110.2 million and $83.5 million respectively, which began expiring in 2016 and research and development credits of $2.6 million and $1.4 million, respectively, of which a portion will begin expiring in 2034 and another portion which will not expire.
The components of the net deferred tax amounts recognized in the accompanying consolidated balance sheets are (in thousands):
| Year Ended April 30, | ||||||||
| 2015 | 2014 | |||||||
| Deferred tax asset: |
||||||||
| Bad debts |
$ | 1,493 | $ | 743 | ||||
| Other accruals |
1,317 | 2,165 | ||||||
| Charitable contributions |
352 | 274 | ||||||
| Stock options |
5,412 | 4,829 | ||||||
| State tax credit |
496 | 554 | ||||||
| Net operating losses |
58,822 | 58,536 | ||||||
| Research and development credit |
6,485 | 3,497 | ||||||
| Deferred rent |
273 | 671 | ||||||
| Deferred revenue |
1,816 | 1,175 | ||||||
|
|
|
|
|
|||||
| Total deferred tax asset |
76,466 | 72,444 | ||||||
| Less valuation allowance |
(66,448 | ) | (52,734 | ) | ||||
|
|
|
|
|
|||||
| Net deferred tax assets |
10,018 | 19,710 | ||||||
| Deferred tax liability: |
||||||||
| Amortization of intangible assets |
(4,300 | ) | (15,190 | ) | ||||
| Depreciation |
(4,374 | ) | (4,517 | ) | ||||
|
|
|
|
|
|||||
| Total deferred tax liability |
(8,674 | ) | (19,707 | ) | ||||
|
|
|
|
|
|||||
| Total net deferred tax assets |
$ | 1,344 | $ | 3 | ||||
|
|
|
|
|
|||||
99
Table of Contents
Deferred income taxes reflect the net tax effects of temporary differences between the carrying amounts of assets and liabilities for financial reporting purposes and the amounts used for income tax purposes. As of April 30, 2015 and 2014, the Company had net deferred tax assets of $10.0 million and $19.7 million, respectively.
Utilization of the net operating losses and tax credit carry-forwards may be subject to an annual limitation due to the “change in ownership” provision of the Internal Revenue Code. The annual limitation may result in the expiration of net operating loss and tax credit carry-forwards before utilization.
The Company has established a valuation allowance equal to the net deferred tax asset in the U.S. due to uncertainties regarding the realization of the deferred tax assets based on the Company’s lack of earning history. During the year ended April 30, 2014, the Company recorded a tax benefit of $1.4 million resulting from a reduction in the valuation allowance associated with the FeedMagnet acquisition. The valuation allowance increased by $13.7 million and $14.8 million during the years ended April 30, 2015 and 2014, respectively.
Deferred U.S. income taxes and foreign withholding taxes are not provided on the undistributed cumulative earnings of foreign subsidiaries because those earnings are considered to be permanently reinvested in those operations. The permanently reinvested undistributed earnings were $7.9 million, $5.1 million and $3.7 million as of April 30, 2015, 2014 and 2013 respectively. The tax impact resulting from a distribution of these earnings would be approximately $2.7 million, $1.7 million and $1.3 million for the years ended April 30, 2015, 2014 and 2013, respectively, based on the U.S. statutory rate of 34 percent. These amounts could be impacted due to different jurisdictional tax rates and foreign tax credits.
The Company recognizes interest and penalties related to unrecognized tax benefits as a component of income tax expense. During the years ended April 30, 2015 and 2014, the Company recognized immaterial amounts in interest and penalties, respectively. The Company had an immaterial amount accrued for the payment of interest and penalties as of April 30, 2015 and 2014. The Company does not anticipate a material change in unrecognized tax benefits in the next twelve months.
The aggregate changes in the balance of unrecognized tax benefits were as follows (in thousands):
| Year Ended April 30, | ||||||||||||
| 2015 | 2014 | 2013 | ||||||||||
| Unrecognized tax benefits as of May 1, |
$ | 2,157 | $ | 1,729 | $ | 539 | ||||||
| Tax positions taken in prior periods: |
||||||||||||
| Gross increases |
883 | — | 862 | |||||||||
| Gross decreases |
— | (14 | ) | — | ||||||||
| Tax positions taken in current period: |
||||||||||||
| Gross increases |
579 | 442 | 330 | |||||||||
| Gross decreases |
— | — | — | |||||||||
| Lapse of statute of limitations |
— | — | (2 | ) | ||||||||
|
|
|
|
|
|
|
|||||||
| Balance as of April 30, |
$ | 3,619 | $ | 2,157 | $ | 1,729 | ||||||
|
|
|
|
|
|
|
|||||||
As of April 30, 2015, the total amount of unrecognized tax benefits, if recognized, that would affect the effective tax rate is $3.2 million.
The Company is subject to taxation in the U.S., various state, and foreign jurisdictions. As of April 30, 2015, the Company’s fiscal years 2007 forward are subject to examination by the U.S. tax authorities and in material state jurisdictions, primarily Texas, due to loss carry-forwards, and fiscal years 2010 forward are subject to examination in material foreign jurisdictions, primarily the United Kingdom.
100
Table of Contents
15. Commitments and Contingencies
Aggregate Future Lease Commitments
The Company has non-cancelable operating leases for office space. The Company recognizes expense on a straight-line basis and records the difference between recognized rental expense and amounts payable under the lease as deferred rent. Rent expense for the years ended April 30, 2015, 2014 and 2013, was $4.1 million, $4.4 million and $3.8 million, respectively.
Amended and Restated Credit Facility
On November 21, 2014, the Company entered into an Amended and Restated Credit Facility (the “Credit Facility”) with Comerica Bank which provides for a secured, revolving line of credit of up to $70.0 million, with a sublimit of $3.0 million for the incurrence of swingline loans and a sublimit of $15.0 million for the issuance of letters of credit. The revolving line of credit bears interest at the adjusted LIBOR rate plus 3.5%. On November 21, 2014, the Company drew down $57.0 million of the unused balance of the Credit Facility. The Credit Facility expires on November 21, 2017 with all advances immediately due and payable (See Note 10).
Future minimum lease payments under non-cancelable operating leases, debt principal payment, and debt interest payments, by year and in the aggregate, as of April 30, 2015 consists of the following (in thousands):
| Total | Fiscal year ending April 30, | |||||||||||||||||||||||||||
| Contractual obligations |
2016 | 2017 | 2018 | 2019 | 2020 | Thereafter | ||||||||||||||||||||||
| Operating lease obligations |
$ | 52,609 | $ | 4,831 | $ | 6,310 | $ | 6,081 | $ | 4,789 | $ | 4,658 | $ | 25,940 | ||||||||||||||
| Principal debt obligations |
57,000 | — | 57,000 | — | — | — | — | |||||||||||||||||||||
| Interest on debt obligations (1) |
5,456 | 4,261 | 1,195 | — | — | — | — | |||||||||||||||||||||
|
|
|
|
|
|
|
|
|
|
|
|
|
|
|
|||||||||||||||
| Total |
$ | 115,065 | $ | 9,092 | $ | 64,505 | $ | 6,081 | $ | 4,789 | $ | 4,658 | $ | 25,940 | ||||||||||||||
|
|
|
|
|
|
|
|
|
|
|
|
|
|
|
|||||||||||||||
| (1) | Future interest on debt obligations calculated using the interest rate effective as of the April 30, 2015. |
Legal proceedings and other contingencies
The Company reviews the status of each matter and records a provision for a liability when it is considered both probable that a liability has been incurred and that the amount of the loss can be reasonably estimated. These provisions are reviewed quarterly and adjusted as additional information becomes available. If either or both of the criteria are not met, the Company assesses whether there is at least a reasonable possibility that a loss, or additional losses, may be incurred. If there is a reasonable possibility that a loss may be incurred, the Company discloses the estimate of the amount of loss or range of losses, discloses that the amount would not have a material effect on the Company’s consolidated financial statements (if applicable) or discloses that an estimate of the possible loss or range of loss cannot be made. Legal fees are recognized as incurred when the legal services are provided, and therefore are not recognized as a part of a loss contingency accrual.
On June 12, 2012, the Company acquired PowerReviews, Inc. (“PowerReviews”), a provider of social commerce solutions, for a total cash and stock purchase price of $150.8 million. On January 8, 2014, the U.S. District Court for the Northern District of California, San Francisco Division (the “Court”) ruled, in connection with a complaint filed by the U.S. Department of Justice (the “DOJ”), that the Company’s acquisition of PowerReviews violated Section 7 of the Clayton Act, 15 U.S.C. Section 18. On April 24, 2014, the Company entered into a Joint Stipulation with the DOJ to resolve the DOJ’s claims in the antitrust action and, together with the DOJ, the Company submitted a proposed order to the Court (the “Order”). Under the terms of the Joint Stipulation and the Order, on June 4, 2014, the Company entered into a definitive agreement to divest all of the assets of PowerReviews, LLC, the successor to PowerReviews, to Wavetable Labs, LLC (“Wavetable”) for $30.0 million in cash, $4.5 million of which remains in escrow as partial security for the Company’s indemnification
101
Table of Contents
obligations under the definitive agreement and is set to expire in July 2015. The terms of this transaction were approved by the DOJ on June 26, 2014, and the transaction was completed on July 2, 2014. Wavetable subsequently changed its name to PowerReviews. As a result of the foregoing, PowerReviews revenues, related expenses and loss on disposal, net of tax, are components of “loss from discontinued operations, net of tax” in the consolidated statement of operations for all periods presented. On the consolidated balance sheets, the assets and liabilities of the discontinued operations of PowerReviews have been presented as ‘Assets held for sale’ and ‘Liabilities held for sale,’ respectively, as of April 30, 2014. The statement of cash flows is reported on a combined basis without separately presenting cash flows from discontinued operations.
The Company realized a total loss on the disposal of PowerReviews of $10.7 million of which, $9.2 million was recognized as an estimated loss on disposal of discontinued operations during the fiscal year ended April 30, 2014. The Company recognized the incremental loss of $1.5 million in the current fiscal year (See Note 3).
On August 20, 2014, the Company was informed that the DOJ was investigating whether the Company retained any PowerReviews technology in violation of the Joint Stipulation and Order. This matter was resolved by an agreement between the Company and the DOJ to modify the Proposed Final Judgment through the addition of terms relating to the appointment of an antitrust compliance officer. These agreed modifications to the Proposed Final Judgment were filed with the Court on December 1, 2014 and the Final Judgment was entered by the Court on December 2, 2014.
On March 12, 2013, a purported shareholder derivative action was filed in the Texas State District Court for Travis County, Texas against certain of the Company’s officers and directors, former officers and directors, and against the Company as nominal defendant. The original petition alleged claims purportedly on behalf of the Company against the individual defendants for corporate waste, breaches of fiduciary duties and breaches of the Company’s corporate policies in connection with the acquisition of PowerReviews and certain of the Company’s officers’ and directors’ sales of shares of the Company’s stock. The original petition requested declaratory judgment, a disgorgement of $91.4 million in proceeds received from such sales of the Company’s stock, unspecified damages on behalf of the Company, reasonable attorneys’, accountants’ and experts’ fees, and equitable relief. After the court granted a motion filed by the Company and individual defendants that the plaintiff’s original petition failed to allege particularized facts sufficient to excuse plaintiff from making pre-suit demand on the Company’s Board of Directors, the plaintiff filed an amended petition November 22, 2013, which again asserted claims for corporate waste, breaches of fiduciary duties and breaches of the Company’s corporate policies in connection with the acquisition of PowerReviews and certain of the Company’s officers’ and directors’ sales of shares of the Company’s stock. The court stayed the lawsuit and its ruling on the Company’s motion for summary judgment to allow the parties to participate in mediation. On July 9, 2014, the parties attended mediation and agreed to preliminary settlement terms. On September 23, 2014, the court preliminarily approved the settlement agreement and directed the Company to notify its shareholders of the proposed settlement, a final hearing on November 24, 2014, and a motion for attorneys’ fees and expenses. On November 24, 2014, the court signed a Final Judgment approving the notice to shareholders and the proposed settlement and payments to plaintiff and plaintiff’s counsel, and dismissing all claims arising out of, relating to, or concerning the PowerReviews acquisition or divestiture, any reports, disclosures, or statements made by the current or former directors or officers of the Company in relation to the PowerReviews acquisition or divestiture, or any related matter that could have been asserted. The settlement did not have a material impact on the Company’s consolidated financial statements.
On February 6, 2015, the Company received a letter from one of the state sales tax agencies exempting certain enterprise service offerings from state sales tax. As of April 30, 2015, the Company estimates that its liability for taxable service offerings to this state and refunds to clients for taxes that had been collected will be approximately $1.8 million, a reduction in previous estimates resulting in a $1.1 million benefit realized in fiscal year 2015. As of April 30, 2015, the Company was also in the process of assessing the sales tax status of the Bazaarvoice enterprise service offering with other sales tax agencies in certain states in which it operates. For
102
Table of Contents
these states, the Company has accrued a liability of $0.5 million, representing the best estimate of sales tax obligations it believes is probable to be incurred.
On November 13, 2014, the Company entered into a lease (the “Lease”), pursuant to which the Company will lease approximately 137,615 square feet of office space in Austin, Texas. This will serve as the new headquarters of the Company and will be used for general office purposes. The term of the Lease commences on January 1, 2016 unless otherwise modified (“Commencement Date”) and terminates approximately ten years and six months after the Commencement Date. The Company has the option to extend the term of the Lease for up to two successive periods of five years each and the Company was required to obtain a stand by letter of credit of $8.0 million as a security deposit for the Lease. The expected lease payments for the original term are estimated to be approximately $0.3 million for the fiscal year ended April 30, 2016, $3.8 million for the fiscal year ended April 30, 2017, $3.8 million for the fiscal year ended April 30, 2018, $3.9 million for the fiscal year ended April 30, 2019, $4.0 million for the fiscal year ended April 30, 2020 and $25.9 million for the fiscal years ended April 30th thereafter.
16. Employee Benefit Plan
On April 7, 2006, the Company adopted a defined contribution retirement plan qualifying under Section 401(k) of the Internal Revenue Code of 1986. It is the sole discretion of the Company to match eligible employee contributions in the form of cash. The Company contributed $0.7 million and $0.9 million in matching contributions to the 401(k) plan in the fiscal year ended April 30, 2015 and 2014, respectively. The Company had not made contributions prior to fiscal year 2014.
17. Related Party Transaction
In October 2012, Bazaarvoice Foundation (the “Foundation”), a non-profit private charity, was chartered to build philanthropic programs that are focused on entrepreneurial education for youth. The Company holds two of the Foundation’s six board seats. The Company does not control the Foundation’s activities and accordingly, the Company does not consolidate the Foundation’s statement of activities with its financial results.
On March 10, 2015, the Company issued 50,000 unregistered shares of our common stock, which were held as treasury stock, to the Foundation as a donation. The fair market value of these shares based on the Company’s closing stock price on March 10, 2015 was $314,000. This issuance of shares of the common stock was not registered under the Securities Act of 1933, as amended, or the Securities Act, or any state securities laws. With respect to such issuance, the Company relied on the exemption from the registration requirements of the Securities Act by virtue of Section 4(a)(2) thereof and the rules and regulations promulgated thereunder.
18. Operating Segment and Geographic Information
The Company defines an operating segment as a component of its business where separate financial information is available and is evaluated regularly by the chief operating decision maker (“CODM”) in deciding how to allocate resources and in assessing performance. The Company’s CODM is the Chief Executive Officer.
The CODM reviews financial information including profit and loss information on a consolidated basis, accompanied by revenue information, for purposes of allocating resources and evaluating financial performance. The Company has one business activity, and there are no segment managers who are held accountable for operations, operating results or components below the consolidated unit level. Accordingly, the Company has determined that it has one operating segment, and therefore, one reportable segment. Revenue by geography is based on the billing address of the client.
103
Table of Contents
The following table presents the Company’s revenue from continuing operations by geographic region for the periods presented (in thousands):
| Year Ended April 30, | ||||||||||||
| 2015 | 2014 | 2013 | ||||||||||
| Revenue by geographic location for continuing operations: |
||||||||||||
| Americas (1) |
$ | 146,086 | $ | 127,766 | $ | 109,545 | ||||||
| EMEA (2) |
38,101 | 33,499 | 27,952 | |||||||||
| Other |
6,994 | 6,880 | 9,315 | |||||||||
|
|
|
|
|
|
|
|||||||
| Total revenues from continuing operations |
$ | 191,181 | $ | 168,145 | $ | 146,812 | ||||||
|
|
|
|
|
|
|
|||||||
| (1) | United States, Canada and Brazil |
| (2) | Europe, the Middle East and Africa |
The Company’s long-lived assets are principally in the United States as of April 30, 2015 and April 30, 2014. Included in Americas revenues are revenues from the United States of $133.7 million, $123.3 million and $105.1 million for fiscal year 2015, 2014 and 2013, respectively. Included in EMEA revenues are revenues from the United Kingdom of $22.9 million, $22.4 million and $18.4 million for fiscal year 2015, 2014 and 2013, respectively.
104
Table of Contents
19. Quarterly Financial Information (Unaudited)
The following tables set forth our unaudited quarterly consolidated statements of operations for continuing operations for each of the eight quarters ended April 30, 2015. The Company has prepared the quarterly data on a consistent basis with the audited consolidated financial statements included elsewhere in this report and, in the opinion of management, the financial information reflects all necessary adjustments, consisting only of normal recurring adjustments, necessary for a fair presentation of the results of operations for these periods. This information should be read in conjunction with the audited consolidated financial statements and related notes included elsewhere in this report. These quarterly operating results are not necessarily indicative of our operating results for any future period.
| Three Months Ended | ||||||||||||||||||||||||||||||||
| Apr 30, 2015 |
Jan 31, 2015 |
Oct 31, 2014 |
Jul 31, 2014 |
Apr 30, 2014 |
Jan 31, 2014 |
Oct 31, 2013 |
Jul 31, 2013 |
|||||||||||||||||||||||||
| Revenue |
$ | 48,317 | $ | 49,562 | $ | 47,325 | $ | 45,977 | $ | 43,078 | $ | 43,600 | $ | 41,148 | $ | 40,319 | ||||||||||||||||
| Cost of revenue |
18,148 | 17,988 | 17,414 | 16,356 | 14,522 | 13,758 | 12,508 | 12,117 | ||||||||||||||||||||||||
|
|
|
|
|
|
|
|
|
|
|
|
|
|
|
|
|
|||||||||||||||||
| Gross profit |
30,169 | 31,574 | 29,911 | 29,621 | 28,556 | 29,842 | 28,640 | 28,202 | ||||||||||||||||||||||||
| Operating expenses: |
||||||||||||||||||||||||||||||||
| Sales and marketing |
20,427 | 18,020 | 18,931 | 20,995 | 23,884 | 20,765 | 20,837 | 20,996 | ||||||||||||||||||||||||
| Research and development |
9,880 | 8,779 | 9,306 | 9,730 | 9,832 | 9,036 | 9,793 | 8,924 | ||||||||||||||||||||||||
| General and administrative |
7,582 | 6,932 | 8,100 | 7,893 | 6,521 | 7,674 | 3,639 | 8,536 | ||||||||||||||||||||||||
| Acquisition-related and other |
815 | 413 | 2,326 | 492 | 366 | 31 | 8,283 | 7,504 | ||||||||||||||||||||||||
| Amortization of acquired intangible assets |
309 | 309 | 310 | 309 | 288 | 282 | 283 | 282 | ||||||||||||||||||||||||
|
|
|
|
|
|
|
|
|
|
|
|
|
|
|
|
|
|||||||||||||||||
| Total operating expenses |
39,013 | 34,453 | 38,973 | 39,419 | 40,891 | 37,788 | 42,835 | 46,242 | ||||||||||||||||||||||||
|
|
|
|
|
|
|
|
|
|
|
|
|
|
|
|
|
|||||||||||||||||
| Operating loss |
(8,844 | ) | (2,879 | ) | (9,062 | ) | (9,798 | ) | (12,335 | ) | (7,946 | ) | (14,195 | ) | (18,040 | ) | ||||||||||||||||
| Total other income (expense), net |
(521 | ) | (920 | ) | (588 | ) | (498 | ) | (316 | ) | (268 | ) | (249 | ) | 3 | |||||||||||||||||
|
|
|
|
|
|
|
|
|
|
|
|
|
|
|
|
|
|||||||||||||||||
| Net loss before income taxes |
(9,365 | ) | (3,799 | ) | (9,650 | ) | (10,296 | ) | (12,651 | ) | (8,214 | ) | (14,444 | ) | (18,037 | ) | ||||||||||||||||
| Income tax expense (benefit) |
(540 | ) | 324 | 258 | 12 | (418 | ) | 179 | 130 | (391 | ) | |||||||||||||||||||||
|
|
|
|
|
|
|
|
|
|
|
|
|
|
|
|
|
|||||||||||||||||
| Net loss from continuing operations |
$ | (8,825 | ) | $ | (4,123 | ) | $ | (9,908 | ) | $ | (10,308 | ) | $ | (12,233 | ) | $ | (8,393 | ) | $ | (14,574 | ) | $ | (17,646 | ) | ||||||||
| Income (loss) from discontinued operations, net of tax |
— | — | — | (1,257 | ) | (11,448 | ) | 430 | 420 | 278 | ||||||||||||||||||||||
|
|
|
|
|
|
|
|
|
|
|
|
|
|
|
|
|
|||||||||||||||||
| Net loss applicable to common stockholders |
$ | (8,825 | ) | $ | (4,123 | ) | $ | (9,908 | ) | $ | (11,565 | ) | $ | (23,681 | ) | $ | (7,963 | ) | $ | (14,154 | ) | $ | (17,368 | ) | ||||||||
|
|
|
|
|
|
|
|
|
|
|
|
|
|
|
|
|
|||||||||||||||||
| Basic earnings (loss) per share: |
||||||||||||||||||||||||||||||||
| Continuing operations |
$ | (0.11 | ) | $ | (0.05 | ) | $ | (0.13 | ) | $ | (0.13 | ) | $ | (0.16 | ) | $ | (0.11 | ) | $ | (0.20 | ) | $ | (0.23 | ) | ||||||||
| Discontinued operations |
— | — | — | (0.02 | ) | (0.15 | ) | 0.01 | 0.01 | — | ||||||||||||||||||||||
|
|
|
|
|
|
|
|
|
|
|
|
|
|
|
|
|
|||||||||||||||||
| Basic loss per share: |
$ | (0.11 | ) | $ | (0.05 | ) | $ | (0.13 | ) | $ | (0.15 | ) | $ | (0.31 | ) | $ | (0.10 | ) | $ | (0.19 | ) | $ | (0.23 | ) | ||||||||
|
|
|
|
|
|
|
|
|
|
|
|
|
|
|
|
|
|||||||||||||||||
| Diluted earnings per share: |
||||||||||||||||||||||||||||||||
| Continuing operations |
$ | — | $ | — | $ | — | $ | — | $ | — | $ | — | $ | — | $ | — | ||||||||||||||||
| Discontinued operations |
— | — | — | — | — | 0.01 | 0.01 | — | ||||||||||||||||||||||||
|
|
|
|
|
|
|
|
|
|
|
|
|
|
|
|
|
|||||||||||||||||
| Diluted earnings per share: |
$ | — | $ | — | $ | — | $ | — | $ | — | $ | 0.01 | $ | 0.01 | $ | — | ||||||||||||||||
|
|
|
|
|
|
|
|
|
|
|
|
|
|
|
|
|
|||||||||||||||||
The sum of the quarterly earnings per share amounts may not equal the total for the year due to the effects of rounding.
105
Table of Contents
FINANCIAL STATEMENT SCHEDULE
SCHEDULE II – VALUATION AND QUALIFYING ACCOUNTS
| Beginning Balance |
Additions | Deductions | Ending Balance |
|||||||||||||
| Allowance for doubtful accounts, customer and other: |
||||||||||||||||
| Year Ended April 30, 2015 |
$ | 2,324 | 4,120 | (2,452 | ) | $ | 3,992 | |||||||||
| Year Ended April 30, 2014 |
$ | 2,371 | 2,626 | (2,673 | ) | $ | 2,324 | |||||||||
| Year Ended April 30, 2013 |
$ | 788 | 2,290 | (707 | ) | $ | 2,371 | |||||||||
| Valuation allowance for deferred tax assets: |
||||||||||||||||
| Year Ended April 30, 2015 |
$ | 52,734 | 13,714 | — | $ | 66,448 | ||||||||||
| Year Ended April 30, 2014 |
$ | 37,902 | 16,223 | (1,391 | ) | $ | 52,734 | |||||||||
| Year Ended April 30, 2013 |
$ | 19,854 | 20,588 | (2,540 | ) | $ | 37,902 | |||||||||
106
Table of Contents
| Item 9. | Changes in and Disagreements with Accountants on Accounting and Financial Disclosure |
None.
| Item 9A. | Controls and Procedures |
Disclosure Controls and Procedures
The Company maintains a set of disclosure controls and procedures (as defined in Rules 13a-15(e) and 15d-15(e) under the Securities Exchange Act of 1934, as amended, or the Exchange Act) designed to ensure that information required to be disclosed by a company in the reports that it files or submits under the Exchange Act is recorded, processed, summarized and reported, within the time periods specified in the SEC’s rules and forms. In accordance with Rule 13a-15(b) of the Exchange Act, as of the end of the period covered by this Annual Report on Form 10-K, an evaluation was carried out under the supervision and with the participation of the Company’s management, including its Chief Executive Officer and Chief Financial Officer, of the effectiveness of its disclosure controls and procedures. Based on that evaluation, the Company’s Chief Executive Officer and Chief Financial Officer concluded that the Company’s disclosure controls and procedures, as of the end of the period covered by this Annual Report on Form 10-K, were effective to provide reasonable assurance that information required to be disclosed by the Company in reports that it files or submits under the Exchange Act is recorded, processed, summarized and reported within the time periods specified in the SEC’s rules and forms and is accumulated and communicated to the Company’s management, including the Chief Executive Officer and the Chief Financial Officer, as appropriate, to allow timely decisions regarding required disclosure.
Management’s Report on Internal Control Over Financial Reporting and Attestation of the Registered Public Accounting Firm
Our management is responsible for establishing and maintaining adequate internal control over financial reporting (as defined in Rules 13a-15(f) and 15d-15(f) of the Exchange Act). Under the supervision and with the participation of our management, including our Chief Executive Officer and Chief Financial Officer, we conducted an evaluation of the effectiveness of our internal control over financial reporting as of April 30, 2015 based on the guidelines established in Internal Control – Integrated Framework (2013) issued by the Committee of Sponsoring Organizations of the Treadway Commission (COSO). Our internal control over financial reporting includes policies and procedures that provide reasonable assurance regarding the reliability of financial reporting and the preparation of financial statements for external reporting purposes in accordance with U.S. generally accepted accounting principles.
Based on that evaluation, management concluded that our internal control over financial reporting was effective as of April 30, 2015.
This Annual Report on Form 10-K does not include an attestation report of our independent registered public accounting firm as we are an “emerging growth company” as of April 30, 2015, as defined in the Jumpstart Our Business Startups Act of 2012.
Changes in Internal Control over Financial Reporting
There was no change in our internal control over financial reporting identified in connection with the evaluation required by Rule 13a-15(d) and 15d-15(d) of the Exchange Act that occurred during the fiscal year ended April 30, 2015 that has materially affected, or is reasonably likely to materially affect, our internal control over financial reporting.
| Item 9B. | Other Information |
None.
107
Table of Contents
PART III
| Item 10. | Directors, Executive Officers and Corporate Governance |
We have adopted a code of ethics that applies to the Company’s directors, officers and employees, including the Chief Executive Officer and the Chief Financial Officer and any other persons performing similar functions. The text of our code of ethics, “Code of Business Ethics and Conduct,” has been posted on our website at http://investors.bazaarvoice.com/governance.cfm. We will provide a copy of the code of ethics without charge upon request to Corporate Secretary, Bazaarvoice, Inc., 3900 N. Capital of Texas Highway, Suite 300, Austin, Texas 78746-3211.
Additional information required by this item is incorporated by reference from our definitive Proxy Statement for our 2015 Annual Meeting of Stockholders which will be filed with the Securities and Exchange Commission pursuant to Regulation 14A, not later than 120 days after the end of the 2015 fiscal year, all of which information is hereby incorporated by reference in and made part of, this Annual Report on Form 10-K.
| Item 11. | Executive Compensation |
The information required by this item is incorporated by reference from our definitive Proxy Statement for our 2015 Annual Meeting of Stockholders which will be filed with the Securities and Exchange Commission pursuant to Regulation 14A, not later than 120 days after the end of the 2015 fiscal year, all of which information is hereby incorporated by reference in and made part of, this Annual Report on Form 10-K.
| Item 12. | Security Ownership of Certain Beneficial Owners and Management and Related Stockholder Matters |
The information required by this item is incorporated by reference from our definitive Proxy Statement for our 2015 Annual Meeting of Stockholders which will be filed with the Securities and Exchange Commission pursuant to Regulation 14A, not later than 120 days after the end of the 2015 fiscal year, all of which information is hereby incorporated by reference in and made part of, this Annual Report on Form 10-K.
| Item 13. | Certain Relationships and Related Transactions and Director Independence |
The information required by this item is incorporated by reference from our definitive Proxy Statement for our 2015 Annual Meeting of Stockholders which will be filed with the Securities and Exchange Commission pursuant to Regulation 14A, not later than 120 days after the end of the 2015 fiscal year, all of which information is hereby incorporated by reference in and made part of, this Annual Report on Form 10-K.
| Item 14. | Principal Accountant Fees and Services |
The information required by this item is incorporated by reference from our definitive Proxy Statement for our 2015 Annual Meeting of Stockholders which will be filed with the Securities and Exchange Commission pursuant to Regulation 14A, not later than 120 days after the end of the 2015 fiscal year, all of which information is hereby incorporated by reference in and made part of, this Annual Report on Form 10-K.
108
Table of Contents
PART IV
| Item 15. | Exhibits and Financial Statement Schedules |
| (a) | The following documents are filed as part of this report: |
| 1. | Consolidated Financial Statements |
See Index to Consolidated Financial Statements at Item 8 herein.
Schedules not listed above have been omitted because the information required to be set forth therein is not applicable or is shown in the financial statements or notes herein.
| 2. | Exhibits |
See the Exhibit Index immediately following the signature page of this Annual Report on Form 10-K.
109
Table of Contents
Pursuant to the requirements of Section 13 or Section 15 (d) of the Securities Exchange Act of 1934, as amended, the Registrant has duly caused this report to be signed on its behalf by the undersigned, hereunto duly authorized.
| BAZAARVOICE, INC. (Registrant) | ||||
| Date: June 25, 2015 | By: | /s/ Gene Austin | ||
| Gene Austin | ||||
| Chief Executive Officer and President (Principal Executive Officer) | ||||
POWER OF ATTORNEY
KNOW ALL PERSONS BY THESE PRESENTS, that each person whose signature appears below constitutes and appoints Gene Austin and James R. Offerdahl, jointly and severally, as his or her true and lawful attorneys-in-fact and agents, with full power of substitution and resubstitution, for him or her and in his or her name, place and stead, in any and all capacities, to sign this Annual Report on Form 10-K of Bazaarvoice, Inc., and any or all amendments thereto, and to file the same, with all exhibits thereto, and other documents in connection therewith, with the Securities and Exchange Commission, granting unto said attorneys-in-fact and agents full power and authority to do and perform each and every act and thing requisite or necessary to be done in and about the premises hereby ratifying and confirming all that said attorneys-in-fact and agents, or his, her or their substitute or substitutes, may lawfully do or cause to be done by virtue hereof.
Pursuant to the requirements of the Securities Exchange Act of 1934, this report has been signed below by the following persons on behalf of the Registrant and in the capacities indicated and on the dates indicated:
| Signature |
Title |
Date | ||
| /s/ Gene Austin Gene Austin |
Chief Executive Officer (Principal Executive Officer) |
June 25, 2015 | ||
| /s/ James R. Offerdahl James R. Offerdahl |
Chief Financial Officer (Principal Financial Officer and Principal Accounting Officer) |
June 25, 2015 | ||
| /s/ Neeraj Agrawal Neeraj Agrawal |
Director |
June 25, 2015 | ||
| /s/ Sydney L. Carey Sydney L. Carey |
Director |
June 25, 2015 | ||
| /s/ Jeffrey Hawn Jeffrey Hawn |
Director |
June 25, 2015 | ||
| /s/ Mary T. McDowell Mary T. McDowell |
Director |
June 25, 2015 | ||
110
Table of Contents
| Signature |
Title |
Date | ||
| /s/ Thomas J. Meredith Thomas J. Meredith |
Director |
June 25, 2015 | ||
| /s/ Jared Kopf Jared Kopf |
Director |
June 25, 2015 | ||
| /s/ Christopher A. Pacitti Christopher A. Pacitti |
Director |
June 25, 2015 | ||
111
Table of Contents
| Incorporated by Reference | ||||||||||
| Exhibit Number |
Description |
Form |
File No. |
Exhibit |
Filing | |||||
| 2.1 | Agreement and Plan of Merger by and among the Registrant, PowerReviews, Inc., Peloton Acquisition Corp., Peloton Acquisition LLC, Shareholder Representative Services LLC, as representative of the stockholders of PowerReviews, Inc., and U.S. Bank National Association, as escrow agent dated May 24, 2012 | S-1 | 333-182382 | 2.1 | 6/27/2012 | |||||
| 3.1 | Amended and Restated Certificate of Incorporation of the Registrant | S-1 | 333-176506 | 3.2 | 8/26/11 | |||||
| 3.2 | Amended and Restated Bylaws of the Registrant | S-1 | 333-176506 | 3.4 | 8/26/11 | |||||
| 4.1 | Specimen Common Stock Certificate of the Registrant | S-1 | 333-176506 | 4.1 | 11/17/2011 | |||||
| 4.2 | Amended and Restated Investors’ Rights Agreement among the Registrant and certain stockholders, dated February 9, 2010 | S-1 | 333-176506 | 4.2 | 8/26/11 | |||||
| 4.3 | Amendment No. 1 to Amended and Restated Investors’ Rights Agreement among the Registrant and certain stockholders, dated February 9, 2010 | S-1 | 333-176506 | 4.2.1 | 2/9/12 | |||||
| 10.1+ | Form of Indemnification Agreement for directors and officers | S-1 | 333-176506 | 10.1 | 8/26/11 | |||||
| 10.2+ | 2005 Stock Plan, as amended | S-1 | 333-176506 | 10.2 | 2/9/12 | |||||
| 10.3+ | Form of Stock Option Agreement under 2005 Stock Plan | S-1 | 333-176506 | 10.3 | 8/26/11 | |||||
| 10.4+ | Form of Stock Option Agreement (Early Exercise) under 2005 Stock Plan | S-1 | 333-176506 | 10.4 | 8/26/11 | |||||
| 10.5+ | 2012 Equity Incentive Plan | S-1 | 333-176506 | 10.5 | 2/9/12 | |||||
| 10.6+ | Form of Stock Option Award Agreement under 2012 Equity Incentive Plan | S-1 | 333-176506 | 10.6 | 2/9/12 | |||||
| 10.7+ | Form of Restricted Stock Unit Award Agreement under 2012 Equity Incentive Plan | S-1 | 333-176506 | 10.7 | 2/9/12 | |||||
| 10.8+ | Form of Restricted Stock Purchase Agreement under 2012 Equity Incentive Plan | S-1 | 333-176506 | 10.7.1 | 2/9/12 | |||||
| 10.9+ | 2012 Employee Stock Purchase Plan | S-1 | 333-176506 | 10.8 | 2/9/12 | |||||
| 10.10+ | UK Sub-Plan to the 2012 Equity Incentive Plan | 10-Q | 001-35433 | 10.3 | 3/6/2015 | |||||
| 10.11+ | UK Sub-Plan to the 2012 Equity Incentive Plan Form of Stock Option Award Agreement | 10-Q | 001-35433 | 10.4 | 3/6/2015 | |||||
| 10.12+ | UK Sub-Plan to the 2012 Equity Incentive Plan Form of Restricted Stock Unit Award Agreement | 10-Q | 001-35433 | 10.5 | 3/6/2015 | |||||
| 10.13+ | 2012 Equity Incentive Plan Form of Restricted Stock Unit Award Agreement (Netherlands) | 10-Q | 001-35433 | 10.6 | 3/6/2015 | |||||
| 10.14+ | 2012 Equity Incentive Plan Form of Stock Option Award Agreement (Netherlands) | 10-Q | 001-35433 | 10.7 | 3/6/2015 | |||||
112
Table of Contents
| Incorporated by Reference | ||||||||||
| Exhibit Number |
Description |
Form |
File No. |
Exhibit |
Filing | |||||
| 10.15+ | 2012 Equity Incentive Plan Form of Restricted Stock Unit Award Agreement (Germany) | 10-Q | 001-35433 | 10.8 | 3/6/2015 | |||||
| 10.16+ | 2012 Equity Incentive Plan Form of Restricted Stock Unit Award Agreement (France) | 10-Q | 001-35433 | 10.9 | 3/6/2015 | |||||
| 10.17+ | 2012 Equity Incentive Plan Form of Stock Option Award Agreement for French Beneficiaries | 10-Q | 001-35433 | 10.10 | 3/6/2015 | |||||
| 10.18+ | French Sub-Plan to the 2012 Equity Incentive Plan | 10-Q | 001-35433 | 10.11 | 3/6/2015 | |||||
| 10.19+ | French Sub-Plan to the 2012 Equity Incentive Plan Form of Restricted Stock Unit Award Agreement | 10-Q | 001-35433 | 10.12 | 3/6/2015 | |||||
| 10.20+ | 2012 Equity Incentive Plan Form of Stock Option Award Agreement (Australia) | 10-Q | 001-35433 | 10.13 | 3/6/2015 | |||||
| 10.21+ | 2012 Equity Incentive Plan Form of Restricted Stock Unit Award Agreement (Australia) | 10-Q | 001-35433 | 10.14 | 3/6/2015 | |||||
| 10.22+ | 2012 Employee Stock Purchase Plan Form of Subscription Agreement for Non-U.S. Participants | 10-Q | 001-35433 | 10.15 | 3/6/2015 | |||||
| 10.23+ | 2012 Employee Stock Purchase Plan Form of Subscription Agreement (Australia) | 10-Q | 001-35433 | 10.16 | 3/6/2015 | |||||
| 10.24+ | Offer of Employment between the Registrant and Gene Austin, dated April 15, 2013 | 10-K | 001-35433 | 10.20 | 7/3/13 | |||||
| 10.25+ | Offer of Employment between the Registrant and Jim Offerdahl, dated January 23, 2013 | 10-Q | 001-35433 | 10.3 | 3/14/13 | |||||
| 10.26+* | Offer of Employment between the Registrant and Kin Gill, dated December 13, 2012 | |||||||||
| 10.27+* | Transfer Letter between the Registrant and Kin Gill dated December 18, 2014 | |||||||||
| 10.28+ | Offer of Employment between the Registrant and Ryan D. Robinson, dated April 2, 2012 | 10-K | 001-35433 | 10.16 | 6/11/12 | |||||
| 10.29+ | Offer of Employment between the Registrant and Stephen R. Collins, dated August 13, 2010 | S-1 | 333-176506 | 10.16 | 8/26/11 | |||||
| 10.30+ | Terms of Employment between the Registrant and Stephen Collins | 10-Q | 001-35433 | 10.4 | 3/14/13 | |||||
| 10.31+ | Offer of Employment between the Registrant and Kelly Connery, dated February 7, 2012 | 10-K | 001-35433 | 10.17 | 6/26/14 | |||||
| 10.32+ | Promotion Letter to Kelly Connery from Registrant, dated December 6, 2013 | 10-K | 001-35433 | 10.18 | 6/26/14 | |||||
| 10.33 | Office Lease Agreement between the Registrant and 3900 San Clemente, L.P., dated July 15, 2009 | S-1 | 333-176506 | 10.25 | 8/26/11 | |||||
| 10.34 | First Amendment to Lease Agreement between the Registrant and 3900 San Clemente, L.P., dated January 19, 2010 | S-1 | 333-176506 | 10.26 | 8/26/11 | |||||
| 10.35 | Second Amendment to Lease Agreement between the Registrant and 3900 San Clemente, L.P., dated February 8, 2010 | S-1 | 333-176506 | 10.27 | 8/26/11 | |||||
113
Table of Contents
| Incorporated by Reference | ||||||||||
| Exhibit Number |
Description |
Form |
File No. |
Exhibit |
Filing | |||||
| 10.36 | Third Amendment to Lease Agreement between the Registrant and 3900 San Clemente, L.P., dated March 30, 2010 | S-1 | 333-176506 | 10.28 | 8/26/11 | |||||
| 10.37 | Fourth Amendment to Lease Agreement between the Registrant and 3900 San Clemente, L.P., dated May 11, 2011 | S-1 | 333-176506 | 10.29 | 8/26/11 | |||||
| 10.38 | Fifth Amendment to Lease Agreement between the Registrant and 3900 San Clemente, L.P., dated February 27, 2012 | 10-K | 001-35433 | 10.23 | 6/11/2012 | |||||
| 10.39 | Sixth Amendment to Lease Agreement between the Registrant and 3900 San Clemente, L.P., dated January 31, 2014 | 10-K | 001-35433 | 10.25 | 6/26/2014 | |||||
| 10.40 | Lease by and between 10901 Stonelake, LTD., as Landlord, and Bazaarvoice, Inc., as Tenant, dated November 13, 2014 | 8-K | 001-35433 | 10.1 | 11/14/2014 | |||||
| 10.41 | Loan and Security Agreement between the Registrant and Comerica Bank, dated July 18, 2007 | S-1 | 333-176506 | 10.30 | 8/26/11 | |||||
| 10.42 | First Amendment to Loan and Security Agreement between the Registrant and Comerica Bank, dated November 30, 2008 | S-1 | 333-176506 | 10.31 | 8/26/11 | |||||
| 10.43 | Second Amendment to Loan and Security Agreement between the Registrant and Comerica Bank, dated July 20, 2009 | S-1 | 333-176506 | 10.32 | 8/26/11 | |||||
| 10.44 | Third Amendment to Loan and Security Agreement between the Registrant and Comerica Bank, dated January 22, 2010 | S-1 | 333-176506 | 10.33 | 8/26/11 | |||||
| 10.45 | Fourth Amendment to Loan and Security Agreement between the Registrant and Comerica Bank, dated September 27, 2010 | S-1 | 333-176506 | 10.34 | 8/26/11 | |||||
| 10.46 | Fifth Amendment to Loan and Security Agreement between the Registrant and Comerica Bank, dated January 31, 2012 | S-1 | 333-176506 | 10.34.1 | 2/9/12 | |||||
| 10.47 | Sixth Amendment to Loan and Security Agreement between the Registrant and Comerica Bank, dated June 19, 2012 | S-1 | 333-182382 | 10.33 | 6/27/12 | |||||
| 10.48 | Seventh Amendment to Loan and Security Agreement between the Registrant, PowerReviews, LLC, Longboard Media, Inc. and Comerica Bank, dated November 5, 2012 | 10-Q | 001-35433 | 10.1 | 3/14/13 | |||||
| 10.49 | Eighth Amendment to Loan and Security Agreement between the Registrant, PowerReviews, LLC, Longboard Media, Inc. and Comerica Bank, entered into as of June 6, 2013 and effective as of April 28, 2013 | 10-K | 001-35433 | 10.35 | 7/3/13 | |||||
114
Table of Contents
| Incorporated by Reference | ||||||||||
| Exhibit Number |
Description |
Form |
File No. |
Exhibit |
Filing | |||||
| 10.50 | Amended and Restated Credit Agreement, dated as of November 21, 2014, by and among the Company, the financial institutions from time to time party thereto and Comerica Bank as administrative agent, sole lead arranger and sole bookrunner | 8-K | 001-35433 | 10.1 | 11/24/14 | |||||
| 10.51 | Amended and Restated Security Agreement, dated as of November 21, 2014, by and between the Company and Comerica Bank, as administrative agent | 8-K | 001-35433 | 10.2 | 11/24/14 | |||||
| 10.52 | Syndication Services Agreement by and between the Registrant and Wavetable Labs, Inc. dated July 2, 2014 | 10-Q | 001-35433 | 10.1 | 9/4/2014 | |||||
| 10.53 | Transition Services Agreement by and between the Registrant and Wavetable Labs, Inc. dated July 2, 2014 | 10-Q | 001-35433 | 10.2 | 9/4/2014 | |||||
| 10.54 | First Amendment to Transition Services Agreement by and between the Registrant and PowerReviews, Inc. dated August 29, 2014 | 10-Q | 001-35433 | 10.3 | 9/4/2014 | |||||
| 23.1* | Consent of PricewaterhouseCoopers LLP, Independent Registered Public Accounting Firm | |||||||||
| 24.1 | Power of Attorney (contained on signature page hereto) | |||||||||
| 31.1* | Certification of Principal Executive Officer Required Under Rule 13a-14(a) and 15d-14(a) of the Securities Exchange Act of 1934, as amended | |||||||||
| 31.2* | Certification of Principal Financial Officer Required Under Rule 13a-14(a) and 15d-14(a) of the Securities Exchange Act of 1934, as amended | |||||||||
| 32.1* | Certification of Principal Executive Officer Required Under Rule 13a-14(b) of the Securities Exchange Act of 1934, as amended, and 18 U.S.C. §1350 | |||||||||
| 32.2* | Certification of Principal Financial Officer Required Under Rule 13a-14(b) of the Securities Exchange Act of 1934, as amended, and 18 U.S.C. §1350 | |||||||||
| 101.INS* | XBRL Instance Document | |||||||||
| 101.SCH* | XBRL Taxonomy Extension Schema Document | |||||||||
| 101.CAL* | XBRL Taxonomy Extension Calculation Linkbase Document | |||||||||
| 101.DEF* | XBRL Taxonomy Extension Definition Linkbase Document | |||||||||
| 101.LAB* | XBRL Taxonomy Extension Label Linkbase Document | |||||||||
115
Table of Contents
| Incorporated by Reference | ||||||||||
| Exhibit Number |
Description |
Form |
File No. |
Exhibit |
Filing | |||||
| 101.PRE* | XBRL Taxonomy Extension Presentation Linkbase Document | |||||||||
| + | Indicates a management contract or compensatory plan. |
| * | Filed herewith. |
116