Attached files
| file | filename |
|---|---|
| EX-23.1 - EX-23.1 - Babcock & Wilcox Enterprises, Inc. | d930316dex231.htm |
| EX-5.1 - EX-5.1 - Babcock & Wilcox Enterprises, Inc. | d930316dex51.htm |
Table of Contents
As filed with the Securities and Exchange Commission on June 25, 2015
Registration No. 333-204812
UNITED STATES
SECURITIES AND EXCHANGE COMMISSION
Washington, D.C. 20549
AMENDMENT NO. 1
TO
FORM S-1
REGISTRATION STATEMENT
UNDER
THE SECURITIES ACT OF 1933
Babcock & Wilcox Enterprises, Inc.
(Exact name of Registrant as specified in its charter)
| Delaware | 3433 | 47-2783641 | ||
| (State or other jurisdiction of incorporation or organization) |
(Primary Standard Industrial Classification Code Number) |
(I.R.S. employer identification number) |
The Harris Building
13024 Ballantyne Corporate Place
Suite 700
Charlotte, North Carolina 28277
(704) 625-4900
(Address, including zip code, and telephone number, including area code, of registrant’s principal executive offices)
E. James Ferland
Chairman and Chief Executive Officer
The Harris Building
13024 Ballantyne Corporate Place
Suite 700
Charlotte, North Carolina 28277
(704) 625-4900
(Name, address, including zip code, and telephone number, including area code, of agent for service)
Copies to:
Charles T. Haag
Jones Day
2727 North Harwood Street
Dallas, Texas 75201
(214) 969-5148
Fax: (214) 969-5100
Approximate date of commencement of proposed sale to the public: As soon as practicable after the effective date of this Registration Statement.
If any of the securities being registered on this Form are to be offered on a delayed or continuous basis pursuant to Rule 415 under the Securities Act of 1933, as amended (the “Securities Act”), check the following box. þ
If this Form is filed to register additional securities for an offering pursuant to Rule 462(b) under the Securities Act, please check the following box and list the Securities Act registration statement number of the earlier effective registration statement for the same offering. ¨
If this Form is a post-effective amendment filed pursuant to Rule 462(c) under the Securities Act, check the following box and list the Securities Act registration statement number of the earlier effective registration statement for the same offering. ¨
If this Form is a post-effective amendment filed pursuant to Rule 462(d) under the Securities Act, check the following box and list the Securities Act registration statement number of the earlier effective registration statement for the same offering. ¨
Indicate by check mark whether the registrant is a large accelerated filer, an accelerated filer, a non-accelerated filer or a smaller reporting company. See the definitions of “accelerated filer,” “large accelerated filer” and “smaller reporting company” in Rule 12b-2 of the Exchange Act.
| Large accelerated filer ¨ |
Accelerated filer ¨ |
Non-accelerated filer þ |
Smaller reporting company ¨ | |||
| (Do not check if a smaller reporting company) | ||||||
CALCULATION OF REGISTRATION FEE
|
| ||||||||
| Title of Each Class of Securities to be Registered |
Amount to be Registered |
Proposed Offering Price Per Unit |
Proposed Maximum Aggregate Offering Price |
Amount of Registration Fee | ||||
| Common Stock, par value $0.01 per share |
5,800,000 shares(1)(2) | $12.07(3) | $70,006,000(3) | $8,134.70(4) | ||||
|
| ||||||||
|
| ||||||||
| (1) | Represents the maximum number of shares of common stock, par value $0.01 per share, of Babcock & Wilcox Enterprises, Inc. issuable pursuant to the Babcock & Wilcox Enterprises, Inc. 2015 Long-Term Incentive Plan being registered hereon. |
| (2) | Pursuant to Rule 416 of the Securities Act of 1933, this Registration Statement also covers such additional shares of common stock as may become issuable pursuant to the anti-dilution provisions of the Babcock & Wilcox Enterprises, Inc. 2015 Long-Term Incentive Plan. |
| (3) | Estimated solely for purposes of calculating the registration fee and, pursuant to Rule 457(h) under the Securities Act, based upon the book value as of March 31, 2015 of the common stock, the latest practicable date. |
| (4) | The registration fee was previously paid. |
The registrant hereby amends this registration statement on such date or dates as may be necessary to delay its effective date until the registrant shall file a further amendment that specifically states that this registration statement shall thereafter become effective in accordance with Section 8(a) of the Securities Act of 1933, or until the registration statement shall become effective on such date as the Securities and Exchange Commission, acting pursuant to said Section 8(a), may determine.
Table of Contents
The information in this prospectus is not complete and may be changed. These securities may not be sold until the registration statement filed with the Securities and Exchange Commission is effective. This prospectus is not an offer to sell these securities and it is not soliciting an offer to buy these securities in any state where the offer or sale is not permitted.
Subject to Completion, dated June 25, 2015
Prospectus
Babcock & Wilcox Enterprises, Inc.

Babcock & Wilcox Enterprises, Inc.
2015 Long-Term Incentive Plan
Common Stock
(par value $0.01 per share)
The 5,800,000 shares of common stock covered by this prospectus may be acquired by participants in the Babcock & Wilcox Enterprises, Inc. 2015 Long-Term Incentive Plan, which we refer to as the 2015 Plan, upon the exercise of certain stock options to purchase shares of our common stock and upon vesting of stock appreciation rights, restricted stock, restricted stock units, performance shares and performance units (collectively, “awards”) issued pursuant to the 2015 Plan. Participants in the 2015 Plan who may acquire shares of common stock under this prospectus are former employees of Babcock & Wilcox Enterprises, Inc. and current directors and employees of The Babcock & Wilcox Company. All awards are subject to the terms of the 2015 Plan and the applicable award agreement. Any proceeds received by us from the exercise of stock options covered by the 2015 Plan will be used for general corporate purposes.
We are currently a subsidiary of The Babcock & Wilcox Company, which has determined to spin off our company through a distribution to its stockholders of 100% of the outstanding shares of our common stock.
There is no current trading market for our common stock. However, we expect that a limited market, commonly known as a “when-issued” trading market, for our common stock will begin prior to the distribution date relating to the spin-off on or about June 16, 2015 and will continue up to and including the distribution date, and we expect that “regular way” trading of our common stock will begin the first day of trading after the distribution date. We intend to list our common stock on the New York Stock Exchange under the symbol “BW.”
In reviewing this prospectus, you should carefully consider the matters described under the caption “Risk Factors ” beginning on page 10.
Neither the Securities and Exchange Commission nor any state securities commission has approved or disapproved these securities or determined if this prospectus is truthful or complete. Any representation to the contrary is a criminal offense.
The date of this prospectus is , 2015
Table of Contents
| Page |
| 1 | ||||
| 9 | ||||
| 10 | ||||
| 27 | ||||
| 29 | ||||
| 34 | ||||
| 35 | ||||
| 36 | ||||
| 37 | ||||
| MANAGEMENT’S DISCUSSION AND ANALYSIS OF FINANCIAL CONDITION AND RESULTS OF OPERATIONS |
39 | |||
| 61 | ||||
| 63 | ||||
| 74 | ||||
| 75 | ||||
| 81 | ||||
| 89 |
| SECURITY OWNERSHIP OF CERTAIN BENEFICIAL OWNERS AND MANAGEMENT |
128 | |||
| 130 | ||||
| 135 | ||||
| 135 | ||||
| 137 | ||||
| 139 | ||||
| 141 | ||||
| 141 | ||||
| 141 | ||||
| F-1 |
-i-
Table of Contents
Presentation of Information
Except as otherwise indicated or unless the context otherwise requires, the information included in this prospectus assumes the completion of all the transactions referred to in this prospectus in connection with the spin-off. Unless we otherwise state or the context otherwise indicates, all references in this prospectus to “New B&W,” “we, “our,” “ours,” or “us” mean Babcock & Wilcox Enterprises, Inc. and its subsidiaries as of the distribution date, and all references to the “Company” mean The Babcock & Wilcox Company and its subsidiaries for all periods prior to the spin-off and following the spin-off. In connection with the spin-off, the Company will change its name to BWX Technologies, Inc.
-ii-
Table of Contents
The following is a summary of some of the information contained in this prospectus. It does not contain all the details concerning us or the spin-off, including information that may be important to you. We urge you to read this entire document carefully, including the risk factors, the historical combined financial statements and the notes to those financial statements.
We describe in this prospectus the business to be held by us after the spin-off as if it were our business for all historical periods described. However, we are an entity that will not have independently conducted any operations before the spin-off. References in this document to our historical assets, liabilities, products, business or activities generally refer to the historical assets, liabilities, products, business or activities of the New B&W business as it was conducted as part of the Company before the spin-off and excludes the assets and liabilities of subsidiaries of Babcock & Wilcox Power Generation Group, Inc. (“PGG OpCo”) associated with the Company’s Nuclear Energy segment that will be transferred to the Company before the spin-off. The historical combined financial results as part of the Company contained in this prospectus may not be indicative of our financial results in the future as an independent company or reflect what our financial results would have been had we been an independent company during the periods presented.
Except as otherwise indicated or unless the context otherwise requires, the information included in this prospectus assumes the completion of the separation of New B&W from the Company and the related distribution of our common stock.
Our Company
We are currently a wholly owned subsidiary of the Company. The Company is a successor to a business founded in 1867, which was acquired by McDermott International, Inc. (“MII”) in 1978. In July 2010, MII spun-off the businesses that comprised its then Power Generation and Government Operations segments into the Company. Our assets and business will consist of those that the Company reports as its Power Generation segment in its financial statements combined with related captive insurance operations. Prior to the spin-off, PGG OpCo will transfer the assets and liabilities associated with the Company’s Nuclear Energy segment to the Company. Following the spin-off, we will be an independent, publicly traded company that operates the Company’s Power Generation business. The Company will not retain any ownership interest in us.
New B&W will be a leading technology-based provider of advanced fossil and renewable power generation equipment with a broad suite of boiler products and environmental systems. In addition, we will provide one of the most comprehensive platforms of aftermarket services to a large global installed base of power generation facilities. Finally, we will be a leading provider of technology and services in the growing market for industrial environmental systems. Across all our capabilities, we specialize in engineering, manufacturing, procurement, and erection of equipment and technology across a large and global customer base.
New B&W will operate in three reportable segments: Global Power, Global Services and Industrial Environmental. Through our Global Power segment, we engineer, manufacture, procure, construct and commission steam generating and environmental systems and other related equipment. Through our Global Services segment, we provide a comprehensive mix of aftermarket products and services to support peak efficiency and availability of steam generating and associated environmental and auxiliary equipment. Our global installed base represents more than 300,000 MW of equivalent steam-generating capacity in more than 800 facilities in over 90 countries. We also provide aftermarket services for installed units delivered by other original equipment suppliers. Through our Industrial Environmental segment, we design, engineer and manufacture products including oxidizers, solvent and distillation systems, wet and dry electrostatic precipitators, scrubbers and heat recovery systems. This segment is comprised of the operations of MEGTEC Holdings, Inc. and its subsidiaries (“MEGTEC”), which we acquired on June 20, 2014.
We participate in the ownership of a variety of entities with third parties, primarily through corporations, limited liability companies and partnerships, which we refer to as “joint ventures.” As of March 31, 2015, we employed approximately 6,000 people worldwide, not including approximately 2,500 joint venture employees.
-1-
Table of Contents
We have a number of competitive strengths that we believe position us for continued success in our markets. They include:
| • | Leading Market Position in the Global Power Generation Market: We are a proven leader and brand in the design, engineering, manufacture, supply, construction and maintenance of steam generating and environmental control systems for power generation providers worldwide. |
| • | Recurring Global Aftermarket Services Revenues in the Power Generation Market: We provide a comprehensive mix of aftermarket products, services and technical solutions to a large global installed base for our and our competitors’ power generation and industrial plants globally. |
| • | Established Platform in the Global Industrial Environmental Market: We are a leading provider of technology and services in the highly fragmented and growing market for industrial environmental systems. |
| • | Proven Track Record of Success and Innovation: We have served the global power generation industry for over 145 years and have a rich legacy of advanced technology development for the power generation and industrial markets. |
| • | Global, Diversified Client Base: We have a broad customer base, consisting of a wide range of utilities, independent power producers and industrial companies globally. |
| • | Demonstrated Success with Large and Complex Projects: We have demonstrated success in executing large delivered and erected projects, both at new power plants and as retrofits at existing facilities. |
| • | Experienced Management and Engineering Team: Our senior management team has broad power and industrial market experience and is supported by a strong operating management team, which possesses extensive operational and managerial experience. |
Our strategy as an independent company will focus on four important areas:
| • | Optimize Our Business to Align with the Market Opportunity: We will continue enhancing our operating model and asset base to optimize our approach to profitable organic growth and enhanced free cash flow across our range of global markets. |
| • | Pursue Growth Opportunities in the International Power Generation Market: We will continue to pursue growth opportunities in the international power generation market by expanding our marketing and operational presence in regions around the world where we expect continued demand growth and increased need for new plant aftermarket services for both fossil and renewable (waste to energy and biomass) power generation. |
| • | Continue Disciplined Acquisition Program with Successful Integration: Our management team has demonstrated its ability to identify business acquisition opportunities, consummate acquisitions and integrate acquired businesses effectively. |
| • | Maintain our Commitment to Safety: We value the health and safety of all employees and seek to provide a workplace that is free of accidents and injuries. |
In connection with the spin-off, we and the Company are entering into agreements, including a master separation agreement, a tax sharing agreement and an employee matters agreement, under which we and the Company will, among other things, indemnify each other against certain liabilities arising from our respective businesses. See “Relationship with the Company After the Spin-Off—Agreements Between the Company and Us.”
The address of our principal executive offices is The Harris Building, 13024 Ballantyne Corporate Place, Suite 700, Charlotte, NC 28277. Our main telephone number is (704) 625-4900.
-2-
Table of Contents
Summary of the Spin-Off
The following is a brief summary of the terms of the spin-off. Please see “The Spin-Off” for a more detailed description of the matters described below.
| Distributing company |
The Company. After the distribution, the Company will not retain any shares of our common stock. |
| Distributed company |
New B&W, which is currently a wholly owned subsidiary of the Company. Prior to the distribution, PGG OpCo will transfer the assets and liabilities associated with the Company’s Nuclear Energy segment to the Company. After the distribution, New B&W will be an independent, publicly traded company that operates the Company’s Power Generation business. |
| Distribution ratio |
Each holder of Company common stock will receive one share of our common stock for every two shares of Company common stock held on the record date. Approximately 53.7 million shares of our common stock will be distributed in the spin-off, based upon the number of shares of Company common stock outstanding on June 18, 2015. The shares of our common stock to be distributed by the Company, together with the replacement incentive awards granted in connection with the spin-off, will constitute all of the issued and outstanding shares of our common stock. For more information on the shares being distributed in the spin-off, see “Description of Capital Stock.” |
| Distribution procedures |
On or about the distribution date, the distribution agent identified below will distribute the shares of our common stock to be distributed by crediting those shares to book-entry accounts established by the transfer agent for persons who were stockholders of the Company as of 5:00 p.m., New York City time, on the record date. Shares of New B&W common stock will be issued only in book-entry form. No paper stock certificates will be issued. You will not be required to make any payment or surrender or exchange your shares of Company common stock or take any other action to receive your shares of our common stock. |
| Distribution agent, transfer agent |
Computershare Trust Company, N.A. |
and registrar for our shares of
common stock
| Record date |
5:00 p.m., New York City time, on June 18, 2015. |
| Distribution date |
June 30, 2015. |
| Assets and liabilities of the distributed company |
Before the distribution date, we and the Company will enter into a master separation agreement that will contain the key provisions relating to the separation of our business from the Company and the distribution of our shares of common stock. The master separation agreement will identify the assets to be transferred, liabilities to be assumed and contracts to be assigned either to us by the Company or by us to the Company in the spin-off and will describe when and how these transfers, assumptions and assignments will occur. See “Relationship with the Company After the Spin-Off—Agreements Between the Company and Us—Master Separation Agreement.” |
-3-
Table of Contents
| Relationship with the Company after the spin-off |
Before the distribution date, we and the Company will enter into agreements to define various continuing relationships between the Company and us in various contexts. In particular, we will enter into transition services agreements under which we and the Company will provide each other with transition services on an interim basis. We and the Company will also enter into an agreement providing for the sharing of taxes incurred before and after the distribution, various indemnification rights with respect to tax matters and restrictions to preserve the tax-free status of the distribution to the Company. See “Relationship with the Company After the Spin-Off—Agreements Between the Company and Us.” |
| Indemnities |
Under the terms of the tax sharing agreement we will enter into in connection with the spin-off, the Company and we will generally share responsibility for any taxes imposed on the Company and its subsidiaries or us or our subsidiaries in the event that certain transactions related to the spin-off were to fail to qualify for tax-free treatment. However, if these transactions were to fail to qualify for tax-free treatment because of actions or failures to act by us or by the Company, we or the Company, respectively, would be responsible for all such taxes. Please see “Relationship with the Company After the Spin-Off—Agreements Between the Company and Us—Tax Sharing Agreement.” Under the master separation agreement we will enter into in connection with the spin-off, we will also indemnify the Company and its remaining subsidiaries against various claims and liabilities relating to the past operation of our business. Please see “Relationship with the Company After the Spin-Off—Agreements Between the Company and Us—Master Separation Agreement.” |
| Conditions to the spin-off |
We expect that the spin-off will be completed on June 30, 2015, provided that the conditions set forth under the caption “The Spin-Off—Spin-Off Conditions and Termination” have been satisfied in the Company’s sole and absolute discretion. However, even if all of the conditions have been satisfied, the Company may amend, modify or abandon any and all terms of the distribution and the related transactions at any time prior to the distribution date. The Company is not aware of any circumstances under which the spin-off would be abandoned. |
| Reasons for the spin-off |
The Company’s board and management believe the benefits of the spin-off include: (1) the flexibility to allocate resources and deploy capital internally in a manner consistent with the strategic priorities of each business, (2) increased opportunities to pursue external growth strategies as independent companies, (3) the ability to attract an investor base suited to the particular operational and financial characteristics of each company, and (4) greater management focus on the distinct businesses of power generation and government and nuclear operations. For more information, see “The Spin-Off—Reasons for the Spin-Off.” |
| Stock exchange listing |
Currently there is no public market for our common stock. We intend to list our common stock on the New York Stock Exchange, or the NYSE, under the symbol “BW.” We anticipate that trading will commence on a “when-issued” basis shortly before the record date. “When-issued” trading refers to a transaction made conditionally because the security has been authorized but not yet issued. On the first trading day following the distribution date, “when-issued” trading in respect of our common stock will end and “regular way” trading will begin. “Regular way” trading refers to |
-4-
Table of Contents
| trading after a security has been issued and typically involves a transaction that settles on the third full business day following the date of the transaction. We cannot predict the trading prices for our common stock following the spin-off. In addition, following the spin-off, Company common stock will remain outstanding and will continue to trade on the NYSE. We also cannot predict the trading prices for Company common stock following the spin-off. |
| Risk factors |
You should review the risks relating to the spin-off, our industry and our business and ownership of our common stock described in “Risk Factors.” |
-5-
Table of Contents
SUMMARY HISTORICAL AND UNAUDITED PRO FORMA COMBINED FINANCIAL INFORMATION
The following table presents summary historical and unaudited pro forma combined financial information. We derived the historical condensed combined statements of operations for the three months ended March 31, 2015 and 2014, and the balance sheet information as of March 31, 2015, from our unaudited condensed combined financial statements included in this prospectus. We derived the statement of operations information for each of the years ended December 31, 2014, 2013 and 2012 and the balance sheet information as of December 31, 2014 and 2013 from the audited combined financial statements included in this prospectus. We derived the balance sheet information as of March 31, 2014 and December 31, 2012 from the unaudited combined financial statements not included in this prospectus.
The summary unaudited pro forma combined financial information for the three months ended March 31, 2015 and 2014 and for the years ended December 31, 2014, 2013 and 2012 has been prepared to reflect the transfer of the assets and liabilities associated with the Company’s Nuclear Energy segment to the Company. The unaudited pro forma combined statement of operations data presented for the three months ended March 31, 2015 and 2014 and for the years ended December 31, 2014, 2013 and 2012, assumes the transfer of the assets and liabilities associated with the Company’s Nuclear Energy segment to the Company occurred on January 1, 2012. The unaudited pro forma combined balance sheet data assumes the transfer of the assets and liabilities associated with the Company’s Nuclear Energy segment to the Company occurred on December 31, 2012. The assumptions used and pro forma adjustments derived from such assumptions are based on currently available information and we believe such assumptions are reasonable.
The unaudited pro forma combined financial information is not necessarily indicative of our results of operations or financial condition had the transfer of the assets and liabilities associated with the Company’s Nuclear Energy segment to the Company been completed on the dates assumed. They may not reflect the results of operations or financial condition that would have resulted had we been operating as an independent, publicly traded company during such periods.
You should read the summary historical and unaudited pro forma combined financial information in conjunction with the combined financial statements and the accompanying notes, the unaudited pro forma combined financial statements and the accompanying notes, “Selected Historical Combined Financial Information,” and “Management’s Discussion and Analysis of Financial Condition and Results of Operations,” included in this prospectus. The financial information presented below is not necessarily indicative of our future performance or what our financial position and results of operations would have been had we operated as an independent public company during the periods presented.
| Pro Forma Three Months Ended March 31, |
Three Months Ended March 31, |
|||||||||||||||
| 2015 | 2014 | 2015 | 2014 | |||||||||||||
| (in thousands, except per share data) | ||||||||||||||||
| Statement of Operations Information: |
||||||||||||||||
| Revenues |
$ | 397,155 | $ | 312,078 | $ | 419,842 | $ | 347,892 | ||||||||
| Costs and expenses |
376,366 | 308,602 | 398,692 | 339,681 | ||||||||||||
| Equity in income (loss) of investees |
(2,071 | ) | 2,366 | (2,071 | ) | 2,366 | ||||||||||
| Operating income (loss) |
18,718 | 5,842 | 19,079 | 10,577 | ||||||||||||
| Other income (expense) |
(295 | ) | 1,740 | (416 | ) | 1,832 | ||||||||||
| Income (loss) before provision for (benefit from) income taxes |
18,423 | 7,582 | 18,663 | 12,409 | ||||||||||||
| Provision for (benefit from) income taxes |
6,045 | (667 | ) | 5,921 | 1,204 | |||||||||||
| Net income attributable to The Power Generation Operations of The Babcock & Wilcox Company |
$ | 12,326 | $ | 8,133 | $ | 12,690 | $ | 11,089 | ||||||||
| Earnings Per Share Data: |
||||||||||||||||
| Basic |
$ | 0.23 | $ | 0.15 | ||||||||||||
| Diluted |
$ | 0.23 | $ | 0.15 | ||||||||||||
| Weighted average common stock outstanding (1): |
||||||||||||||||
| Basic |
53,388 | 55,220 | ||||||||||||||
| Diluted |
53,573 | 55,443 | ||||||||||||||
| Non-GAAP Data: |
||||||||||||||||
| Adjusted net income attributable to The Power Generation Operations of The Babcock & Wilcox Company (2) |
$ | 13,788 | $ | 9,059 | $ | 14,220 | $ | 12,015 | ||||||||
| Adjusted diluted earnings per common share (2) |
$ | 0.26 | $ | 0.16 | ||||||||||||
| Other Data: |
||||||||||||||||
| Depreciation and amortization |
$ | 11,505 | $ | 5,564 | $ | 13,075 | $ | 6,739 | ||||||||
| Capital expenditures |
5,915 | 2,675 | 6,221 | 3,202 | ||||||||||||
-6-
Table of Contents
| Pro Forma Three Months Ended March 31, |
Three Months Ended March 31, |
|||||||||||||||
| 2015 | 2014 | 2015 | 2014 | |||||||||||||
| (in thousands) | ||||||||||||||||
| Balance Sheet Information: |
||||||||||||||||
| Working capital |
$ | 357,124 | $ | 291,997 | $ | 355,692 | $ | 298,941 | ||||||||
| Total assets |
1,406,323 | 1,187,711 | 1,493,297 | 1,280,220 | ||||||||||||
| Notes payable and current maturities of long-term debt |
3,219 | 5,083 | 3,219 | 5,083 | ||||||||||||
| Long-term debt |
- | - | - | - | ||||||||||||
| Other Data: |
||||||||||||||||
| Backlog |
$ | 2,580,829 | $ | 1,982,373 | $ | 2,786,639 | $ | 2,114,850 | ||||||||
| Pro Forma Year Ended December 31, |
Year Ended December 31, |
|||||||||||||||||||||||
| 2014 | 2013 | 2012 | 2014 | 2013 | 2012 | |||||||||||||||||||
| (in thousands, except per share data) | ||||||||||||||||||||||||
| Statement of Operations Information: |
||||||||||||||||||||||||
| Revenues |
$ | 1,486,029 | $ | 1,767,650 | $ | 1,785,959 | $ | 1,589,719 | $ | 1,921,163 | $ | 2,039,100 | ||||||||||||
| Costs and expenses |
1,527,379 | 1,565,969 | 1,640,965 | 1,655,915 | 1,684,376 | 1,850,616 | ||||||||||||||||||
| Equity in income of investees |
8,681 | 18,387 | 17,402 | 8,681 | 18,387 | 17,402 | ||||||||||||||||||
| Operating income (loss) |
(32,669 | ) | 220,068 | 162,396 | (57,515 | ) | 255,174 | 205,886 | ||||||||||||||||
| Other income (expense) |
1,358 | 2,258 | (1,143 | ) | 1,823 | 1,847 | (669 | ) | ||||||||||||||||
| Income (loss) before provision for (benefit from) income taxes |
(31,311 | ) | 222,326 | 161,253 | (55,692 | ) | 257,021 | 205,217 | ||||||||||||||||
| Provision for (benefit from) income taxes |
(23,361 | ) | 74,544 | 54,179 | (29,528 | ) | 82,206 | 64,323 | ||||||||||||||||
| Net income (loss) attributable to The Power Generation Operations of The Babcock & Wilcox Company |
$ | (8,315 | ) | $ | 147,493 | $ | 106,933 | $ | (26,529 | ) | $ | 174,526 | $ | 140,753 | ||||||||||
| Earnings Per Share Data: |
||||||||||||||||||||||||
| Basic |
$ | (0.15 | ) | $ | 2.64 | $ | 1.81 | |||||||||||||||||
| Diluted |
$ | (0.15 | ) | $ | 2.62 | $ | 1.80 | |||||||||||||||||
| Weighted average common stock outstanding (1): |
||||||||||||||||||||||||
| Basic |
54,239 | 55,951 | 59,209 | |||||||||||||||||||||
| Diluted |
54,239 | 56,343 | 59,511 | |||||||||||||||||||||
| Non-GAAP Data: |
||||||||||||||||||||||||
| Adjusted net income attributable to The Power Generation Operations of The Babcock & Wilcox Company (2) |
$ | 68,492 | $ | 99,460 | $ | 113,470 | $ | 64,851 | $ | 116,620 | $ | 149,851 | ||||||||||||
| Adjusted diluted earnings per common share (2) |
$ | 1.26 | $ | 1.77 | $ | 1.91 | ||||||||||||||||||
| Other Data: |
||||||||||||||||||||||||
| Depreciation and amortization |
$ | 32,156 | $ | 25,420 | $ | 19,877 | $ | 36,454 | $ | 29,726 | $ | 23,857 | ||||||||||||
| Capital expenditures |
15,338 | 13,819 | 18,540 | 17,204 | 16,563 | 25,074 | ||||||||||||||||||
| Balance Sheet Information: |
||||||||||||||||||||||||
| Working capital |
$ | 364,572 | $ | 235,929 | $ | 116,525 | $ | 366,604 | $ | 231,275 | $ | 115,045 | ||||||||||||
| Total assets |
1,437,800 | 1,219,628 | 1,288,419 | 1,522,806 | 1,296,469 | 1,419,651 | ||||||||||||||||||
| Notes payable and current maturities of long-term debt |
3,215 | 4,671 | 4,062 | 3,215 | 4,671 | 4,062 | ||||||||||||||||||
| Long-term debt |
- | 225 | 430 | - | 225 | 430 | ||||||||||||||||||
| Other Data: |
||||||||||||||||||||||||
| Backlog |
$ | 2,246,668 | $ | 2,072,132 | $ | 2,483,046 | $ | 2,480,177 | $ | 2,173,350 | $ | 2,680,292 | ||||||||||||
(1) The pro forma basic weighted average shares outstanding were based on the basic weighted average of Company common shares outstanding for the three months ended March 31, 2015 and 2014 and the years ended December 31, 2014, 2013 and 2012 adjusted for an assumed distribution ratio of one share of New B&W’s common stock for every two Company common shares. The pro forma diluted weighted average shares outstanding were based on the number of shares utilized to calculate Company dilutive earnings per share for the three months ended March 31, 2015 and 2014 and the years ended December 31, 2014, 2013 and 2012 adjusted for the same distribution ratio. This calculation may not be indicative of the dilutive effect that will actually result from New B&W stock-based awards issued in connection with the adjustment of outstanding Company stock-based awards, which will not be determined until after the distribution date.
(2) Adjusted net income and adjusted diluted earnings per common share are defined as net income and diluted earnings per common share adjusted to exclude actuarial gains and losses on pension and post-retirement plans and special charges for restructuring activities. We present adjusted net income and adjusted diluted earnings per common share, which are not prepared in accordance with GAAP, because we believe they provide meaningful insight into operational performance. Additionally, we believe that when considered together with the GAAP results and the
-7-
Table of Contents
reconciliation to net income and diluted earnings per common share, these non-GAAP measures provide a more complete understanding of our business than could be obtained absent this disclosure. We use adjusted net income and adjusted diluted earnings per common share, together with financial measures prepared in accordance with GAAP, such as net income and diluted earnings per common share, to assess our historical and prospective operating performance and to enhance our understanding of our core operating performance. Additionally, we are presenting these measures because we believe they are useful in (a) helping investors facilitate comparisons of our operating results with prior periods and (b) assisting investors in understanding our ongoing operations and our operating performance. We are providing these non-GAAP measures to supplement the results provided in accordance with GAAP and they should not be considered superior to, or as substitutes for, the comparable GAAP results.
The following tables provide a reconciliation of net income and diluted earnings per share to adjusted net income and adjusted diluted earnings per common share:
| Pro Forma Three Months Ended March 31, |
Three Months Ended March 31, |
|||||||||||||||
| 2015 | 2014 | 2015 | 2014 | |||||||||||||
| (in thousands, except per share data) | ||||||||||||||||
| Net income attributable to The Power Generation Operations of The Babcock & Wilcox Company |
$ | 12,326 | $ | 8,133 | $ | 12,690 | $ | 11,089 | ||||||||
| Special charges for restructuring activities |
1,462 | 926 | 1,530 | 926 | ||||||||||||
|
|
|
|
|
|
|
|
|
|||||||||
| Adjusted net income attributable to The Power Generation Operations of The Babcock & Wilcox Company |
$ | 13,788 | $ | 9,059 | $ | 14,220 | $ | 12,015 | ||||||||
| Diluted earnings per common share |
$ | 0.23 | $ | 0.15 | ||||||||||||
| Special charges for restructuring activities |
$ | 0.03 | $ | 0.02 | ||||||||||||
| Adjusted diluted earnings per common share |
$ | 0.26 | $ | 0.16 | ||||||||||||
| Pro Forma Year Ended December 31, |
Year Ended December 31, |
|||||||||||||||||||||||
| 2014 | 2013 | 2012 | 2014 | 2013 | 2012 | |||||||||||||||||||
| (in thousands, except per share data) | ||||||||||||||||||||||||
| Net income attributable to The Power Generation Operations of The Babcock & Wilcox Company |
$ | (8,315 | ) | $ | 147,493 | $ | 106,933 | $ (26,529 | ) | $ | 174,526 | $ | 140,753 | |||||||||||
| Actuarial (gains) losses on our pension and post-retirement plans |
63,857 | (60,248 | ) | 6,537 | 71,121 | (76,064 | ) | 9,098 | ||||||||||||||||
| Special charges for restructuring activities |
12,950 | 12,215 | - | 20,259 | 18,158 | - | ||||||||||||||||||
| Adjusted net income attributable to The Power Generation Operations of The Babcock & Wilcox Company |
$ | 68,492 | $ | 99,460 | $ | 113,470 | $ | 64,851 | $ | 116,620 | $ | 149,851 | ||||||||||||
| Diluted earnings per common share |
$ | (0.15 | ) | $ | 2.62 | $ | 1.80 | |||||||||||||||||
| Actuarial (gains) losses on our pension and postretirement plans per common share |
1.18 | (1.07 | ) | 0.11 | ||||||||||||||||||||
| Special charges for restructuring activities per common share |
0.24 | 0.22 | - | |||||||||||||||||||||
| Adjusted diluted earnings per common share |
$ | 1.26 | $ | 1.77 | $ | 1.91 | ||||||||||||||||||
-8-
Table of Contents
| Securities Offered |
5,800,000 shares of common stock. This is the total number of shares authorized for issuance under the 2015 Plan. |
| Use of Proceeds |
We intend to use any proceeds received by us from the exercise of stock options covered by the 2015 Plan for general corporate purposes. |
| Listing |
There is no current trading market for our common stock. However, we expect that a limited market, commonly known as a “when-issued” trading market, for our common stock will begin prior to the distribution date on or about June 16, 2015, and we expect that “regular way” trading of our common stock will begin the first day of trading after the distribution date. We intend to list our common stock on the New York Stock Exchange under the symbol “BW.” |
-9-
Table of Contents
You should carefully consider each of the following risks and all of the other information contained in this prospectus. Some of these risks relate principally to our spin-off from the Company, while others relate principally to our business and the industry in which we operate or to the securities markets generally and ownership of our common stock.
If any of these risks develop into actual events, our business, financial condition, results of operations or cash flows could be materially adversely affected by any of these risks, and, as a result, the trading price of our common stock could decline.
Risks Relating to Our Industry and Our Business
We derive substantial revenues from electric power generating companies and other steam-using industries, with demand for our products and services depending on spending in these historically cyclical industries. Additionally, recent legislative and regulatory developments relating to clean air legislation are impacting plans for spending on coal-fired power plants within the United States and elsewhere.
The demand for power generation products and services depends primarily on the spending of electric power generating companies and other steam-using industries and expenditures by original equipment manufacturers. These expenditures are influenced by such factors as:
| • | prices for electricity, along with the cost of production and distribution; |
| • | prices for natural resources such as coal and natural gas; |
| • | demand for electricity and other end products of steam-generating facilities; |
| • | availability of other sources of electricity or other end products; |
| • | requirements of environmental legislation and regulations, including potential requirements applicable to carbon dioxide emissions; |
| • | impact of potential regional, state, national and/or global requirements to significantly limit or reduce greenhouse gas emissions in the future; |
| • | level of capacity utilization and associated operations and maintenance expenditures of power generating companies and other steam-using facilities; |
| • | requirements for maintenance and upkeep at operating power plants and other steam-using facilities to combat the accumulated effects of wear and tear; |
| • | ability of electric generating companies and other steam users to raise capital; and |
| • | relative prices of fuels used in boilers, compared to prices for fuels used in gas turbines and other alternative forms of generation. |
A material decline in spending by electric power generating companies and other steam-using industries over a sustained period of time could materially and adversely affect the demand for our power generation products and services and, therefore, our financial condition, results of operations and cash flows. Coal-fired power plants have been scrutinized by environmental groups and government regulators over the emissions of potentially harmful pollutants. The recent economic environment and uncertainty concerning new environmental legislation or replacement rules or regulations in the US and elsewhere has caused many of our major customers, principally electric utilities, to delay making substantial expenditures for new plants, as well as upgrades to existing power plants.
Demand for our products and services is vulnerable to economic downturns and industry conditions.
Demand for our products and services has been, and we expect that demand will continue to be, subject to significant fluctuations due to a variety of factors beyond our control, including economic and industry conditions. These factors include, but are not limited to: the cyclical nature of our industry, inflation, geopolitical
-10-
Table of Contents
issues, the availability and cost of credit, volatile oil and natural gas prices, low business and consumer confidence, high unemployment and energy conservation measures.
Unfavorable economic conditions may lead customers to delay, curtail or cancel proposed or existing projects, which may decrease the overall demand for our products and services and adversely affect our results of operations.
In addition, our customers may find it more difficult to raise capital in the future due to limitations on the availability of credit, increases in interest rates and other factors affecting the federal, municipal and corporate credit markets. Also, our customers may demand more favorable pricing terms and find it increasingly difficult to timely pay invoices for our products and services, which would impact our future cash flows and liquidity. Inflation or significant changes in interest rates could reduce the demand for our products and services. Any inability to timely collect our invoices may lead to an increase in our accounts receivable and potentially to increased write-offs of uncollectible invoices. If the economy weakens, or customer spending declines, then our backlog, revenues, net income and overall financial condition could deteriorate.
Our backlog is subject to unexpected adjustments and cancellations and may not be a reliable indicator of future revenues or earnings.
There can be no assurance that the revenues projected in our backlog will be realized or, if realized, will result in profits. Because of project cancellations or changes in project scope and schedule, we cannot predict with certainty when or if backlog will be performed. In addition, even where a project proceeds as scheduled, it is possible that contracted parties may default and fail to pay amounts owed to us or poor project performance could increase the cost associated with a project. Delays, suspensions, cancellations, payment defaults, scope changes and poor project execution could materially reduce or eliminate the revenues and profits that we actually realize from projects in backlog.
Reductions in our backlog due to cancellation or modification by a customer or for other reasons may adversely affect, potentially to a material extent, the revenues and earnings we actually receive from contracts included in our backlog. Many of the contracts in our backlog provide for cancellation fees in the event customers cancel projects. These cancellation fees usually provide for reimbursement of our out-of-pocket costs, revenues for work performed prior to cancellation and a varying percentage of the profits we would have realized had the contract been completed. However, we typically have no contractual right upon cancellation to the total revenues reflected in our backlog. Projects may remain in our backlog for extended periods of time. If we experience significant project terminations, suspensions or scope adjustments to contracts reflected in our backlog, our financial condition, results of operations and cash flows may be adversely impacted.
We are subject to risks associated with contractual pricing in our industry, including the risk that, if our actual costs exceed the costs we estimate on our fixed-price contracts, our profitability will decline, and we may suffer losses.
We are engaged in a highly competitive industry, and we have priced a number of our projects on a fixed-price basis. Our actual costs could exceed our projections. We attempt to cover the increased costs of anticipated changes in labor, material and service costs of long-term contracts, either through estimates of cost increases, which are reflected in the original contract price, or through price escalation clauses. Despite these attempts, however, the cost and gross profit we realize on a fixed-price contract could vary materially from the estimated amounts because of supplier, contractor and subcontractor performance, changes in job conditions, variations in labor and equipment productivity and increases in the cost of labor and raw materials, particularly steel, over the term of the contract. These variations and the risks generally inherent in our industry may result in actual revenues or costs being different from those we originally estimated and may result in reduced profitability or losses on projects. Some of these risks include:
| • | difficulties encountered on our large-scale projects related to the procurement of materials or due to schedule disruptions, equipment performance failures, unforeseen site conditions, rejection clauses in customer contracts or other factors that may result in additional costs to us, reductions in revenue, claims or disputes; |
| • | our inability to obtain compensation for additional work we perform or expenses we incur as a result of our customers providing deficient design or engineering information or equipment or materials; |
-11-
Table of Contents
| • | requirements to pay liquidated damages upon our failure to meet schedule or performance requirements of our contracts; and |
| • | difficulties in engaging third-party subcontractors, equipment manufacturers or materials suppliers or failures by third-party subcontractors, equipment manufacturers or materials suppliers to perform could result in project delays and cause us to incur additional costs. |
Changes in our effective tax rate and tax positions may vary.
We are subject to income taxes in the United States and numerous foreign jurisdictions. A change in tax laws, treaties or regulations, or their interpretation, in any country in which we operate could result in a higher tax rate on our earnings, which could have a material impact on our earnings and cash flows from operations. In addition, significant judgment is required in determining our worldwide provision for income taxes. In the ordinary course of our business, there are many transactions and calculations where the ultimate tax determination is uncertain, and we are regularly subject to audit by tax authorities. Although we believe that our tax estimates and tax positions are reasonable, they could be materially affected by many factors including the final outcome of tax audits and related litigation, the introduction of new tax accounting standards, legislation, regulations and related interpretations, our global mix of earnings, the realizability of deferred tax assets and changes in uncertain tax positions. A significant increase in our tax rate could have a material adverse effect on our profitability and liquidity.
Our business could be negatively impacted by security threats, including physical and cybersecurity threats, and other disruptions.
We face various security threats, including cyber threats, threats to the physical security of our facilities and infrastructure, and threats from terrorist acts, as well as the potential for business disruptions associated with these threats. Although we utilize a combination of tailored and industry standard security measures and technology to monitor and mitigate these threats, we cannot guarantee that these measures and technology will be sufficient to prevent security threats from materializing.
We have been, and will likely continue to be, subject to cyber-based attacks and other attempts to threaten our information technology systems, including attempts to gain unauthorized access to our proprietary information and attacks from computer hackers, viruses, malicious code and other security problems. From time to time, we experience system interruptions and delays; however, prior cyber-based attacks directed at us have not had a material adverse impact on our results of operations. Due to the evolving nature of these security threats, however, the impact of any future incident cannot be predicted.
The costs related to cyber or other security threats or disruptions may not be fully insured or indemnified by other means. Occurrence of any of these events could adversely affect our internal operations, the services we provide to customers, the value of our investment in research and development efforts and other intellectual property, our future financial results, our reputation or our stock price.
In addition, from time to time we may replace and/or upgrade current financial, human resources and other information technology systems. These activities subject us to inherent costs and risks associated with replacing and updating these systems, including potential disruption of our internal control structure, substantial capital expenditures, demands on management time and other risks of delays or difficulties in transitioning to new systems or of integrating new systems into our current systems. Our systems implementations and upgrades may not result in productivity improvements at the levels anticipated, or at all. In addition, the implementation of new technology systems may cause disruptions in our business operations. Such disruption and any other information technology system disruptions, and our ability to mitigate those disruptions, if not anticipated and appropriately mitigated, could have a material adverse effect on us.
We rely on intellectual property law and confidentiality agreements to protect our intellectual property. We also rely on intellectual property we license from third parties. Our failure to protect our intellectual property rights, or our inability to obtain or renew licenses to use intellectual property of third parties, could adversely affect our business.
Our success depends, in part, on our ability to protect our proprietary information and other intellectual property. Our intellectual property could be stolen, challenged, invalidated, circumvented or rendered unenforceable. In addition, effective intellectual property protection may be limited or unavailable in some foreign countries where we operate.
-12-
Table of Contents
Our failure to protect our intellectual property rights may result in the loss of valuable technologies or adversely affect our competitive business position. We rely significantly on proprietary technology, information, processes and know-how that are not subject to patent or copyright protection. We seek to protect this information through trade secret or confidentiality agreements with our employees, consultants, subcontractors or other parties, as well as through other security measures. These agreements and security measures may be inadequate to deter or prevent misappropriation of our confidential information. In the event of an infringement of our intellectual property rights, a breach of a confidentiality agreement or divulgence of proprietary information, we may not have adequate legal remedies to protect our intellectual property. Litigation to determine the scope of intellectual property rights, even if ultimately successful, could be costly and could divert management’s attention away from other aspects of our business. In addition, our trade secrets may otherwise become known or be independently developed by competitors.
In some instances, we have augmented our technology base by licensing the proprietary intellectual property of third parties. In the future, we may not be able to obtain necessary licenses on commercially reasonable terms, which could have a material adverse effect on our operations.
Our use of the percentage-of-completion method of accounting could result in volatility in our results of operations.
We generally recognize revenues and profits under our long-term contracts on a percentage-of-completion basis. Accordingly, we review contract price and cost estimates regularly as the work progresses and reflect adjustments proportionate to the percentage of completion in income in the period when we revise those estimates. To the extent these adjustments result in a reduction or an elimination of previously reported profits with respect to a project, we would recognize a charge against current earnings, which could be material. Our current estimates of our contract costs and the profitability of our long-term projects, although reasonably reliable when made, could change as a result of the uncertainties associated with these types of contracts, and if adjustments to overall contract costs are significant, the reductions or reversals of previously recorded revenue and profits could be material in future periods.
Maintaining adequate bonding and letter of credit capacity is necessary for us to successfully bid on and win various contracts.
In line with industry practice, we are often required to post standby letters of credit and surety bonds to support contractual obligations to customers as well as other obligations. These letters of credit and bonds generally indemnify customers should we fail to perform our obligations under the applicable contracts. If a letter of credit or bond is required for a particular project and we are unable to obtain it due to insufficient liquidity or other reasons, we will not be able to pursue that project. We utilize bonding facilities, but, as is typically the case, the issuance of bonds under each of those facilities is at the surety’s sole discretion. Moreover, due to events that affect the insurance and bonding and credit markets generally, bonding and letters of credit may be more difficult to obtain in the future or may only be available at significant additional cost. There can be no assurance that letters of credit or bonds will continue to be available to us on reasonable terms. Our inability to obtain adequate letters of credit and bonding and, as a result, to bid on new work could have a material adverse effect on our business, financial condition and results of operations. As of March 31, 2015, after giving effect to the distribution, we would have had $251.3 million in letters of credit and bank guarantees and $518.9 million in surety bonds outstanding.
Our credit facility could restrict our operations.
The terms of our credit agreement impose various restrictions and covenants on us that could have adverse consequences, including:
| • | limiting our flexibility in planning for, or reacting to, changes in our business or economic, regulatory and industry conditions; |
| • | limiting our ability to invest in joint ventures or acquire other companies; |
| • | limiting our ability to pay dividends to our stockholders; and |
| • | limiting our ability to borrow additional funds. |
-13-
Table of Contents
Our business strategy includes acquisitions to support our growth. Acquisitions of other businesses can create risks and uncertainties.
We intend to pursue growth through the acquisition of businesses or assets that we believe will enable us to strengthen our existing businesses and expand into adjacent industries and regions. We may be unable to continue this growth strategy if we cannot identify suitable businesses or assets, reach agreement on potential strategic acquisitions on acceptable terms or for other reasons. Moreover, business acquisitions involve risks, including:
| • | difficulties relating to the assimilation of personnel, services and systems of an acquired business and the assimilation of marketing and other operational capabilities; |
| • | challenges resulting from unanticipated changes in customer relationships after the acquisition; |
| • | additional financial and accounting challenges and complexities in areas such as tax planning, treasury management, financial reporting and internal controls; |
| • | assumption of liabilities of an acquired business, including liabilities that were unknown at the time the acquisition transaction was negotiated; |
| • | diversion of management’s attention from day-to-day operations; |
| • | failure to realize anticipated benefits, such as cost savings and revenue enhancements; |
| • | potentially substantial transaction costs associated with business combinations; and |
| • | potential impairment of goodwill or other intangible assets resulting from the overpayment for an acquisition. |
Acquisitions may be funded by the issuance of additional equity or debt financing, which may not be available on attractive terms. Our ability to secure such financing will depend in part on prevailing capital market conditions, as well as conditions in our business and operating results. Moreover, to the extent an acquisition transaction financed by non-equity consideration results in goodwill, it will reduce our tangible net worth, which might have an adverse effect on potential credit and bonding capacity.
Additionally, an acquisition may bring us into businesses we have not previously conducted and expose us to additional business risks that are different than those we have historically experienced.
Our business strategy also includes development and commercialization of new technologies to support our growth, which requires significant investment and involves various risks and uncertainties. These new technologies may not achieve desired commercial or financial results.
Our future growth will depend on our ability to continue to innovate by developing and commercializing new product and service offerings. Investments in new technologies involve varying degrees of uncertainties and risk. Commercial success depends on many factors, including the levels of innovation, the development costs and the availability of capital resources to fund those costs, the levels of competition from others developing similar or other competing technologies, our ability to obtain or maintain government permits or certifications, the effectiveness of production, distribution and marketing efforts, and the costs to customers to deploy and provide support for the new technologies. We may not achieve significant revenue from new product and service investments for a number of years, if at all. Moreover, new products and services may not be profitable, and, even if they are profitable, our operating margins from new products and services may not be as high as the margins we have experienced historically. In addition, new technologies may not be patentable and, as a result, we may face increased competition.
-14-
Table of Contents
Our operations are subject to operating risks, which could expose us to potentially significant professional liability, product liability, warranty and other claims. Our insurance coverage may be inadequate to cover all of our significant risks or our insurers may deny coverage of material losses we incur, which could adversely affect our profitability and overall financial condition.
We engineer, construct and perform services in large industrial facilities where accidents or system failures can have significant consequences. Risks inherent in our operations include:
| • | accidents resulting in injury or the loss of life or property; |
| • | environmental or toxic tort claims, including delayed manifestation claims for personal injury or loss of life; |
| • | pollution or other environmental mishaps; |
| • | adverse weather conditions; |
| • | mechanical failures; |
| • | property losses; |
| • | business interruption due to political action in foreign countries or other reasons; and |
| • | labor stoppages. |
Any accident or failure at a site where we have provided products or services could result in significant professional liability, product liability, warranty and other claims against us, regardless of whether our products or services caused the incident. We have been, and in the future we may be, named as defendants in lawsuits asserting large claims as a result of litigation arising from events such as those listed above.
We endeavor to identify and obtain in established markets insurance agreements to cover significant risks and liabilities. Insurance against some of the risks inherent in our operations is either unavailable or available only at rates or on terms that we consider uneconomical. Also, catastrophic events customarily result in decreased coverage limits, more limited coverage, additional exclusions in coverage, increased premium costs and increased deductibles and self-insured retentions. Risks that we have frequently found difficult to cost-effectively insure against include, but are not limited to, business interruption, property losses from wind, flood and earthquake events, war and confiscation or seizure of property in some areas of the world, pollution liability, liabilities related to occupational health exposures (including asbestos), professional liability/errors and omissions coverage, the failure, misuse or unavailability of our information systems, the failure of security measures designed to protect our information systems from security breaches, and liability related to risk of loss of our work in progress and customer-owned materials in our care, custody and control. Depending on competitive conditions and other factors, we endeavor to obtain contractual protection against uninsured risks from our customers. When obtained, such contractual indemnification protection may not be as broad as we desire or may not be supported by adequate insurance maintained by the customer. Such insurance or contractual indemnity protection may not be sufficient or effective under all circumstances or against all hazards to which we may be subject. A successful claim for which we are not insured or for which we are underinsured could have a material adverse effect on us. Additionally, disputes with insurance carriers over coverage may affect the timing of cash flows and, if litigation with the carrier becomes necessary, an outcome unfavorable to us may have a material adverse effect on our results of operations.
We are subject to government regulations that may adversely affect our future operations.
Many aspects of our operations and properties are affected by political developments and are subject to both domestic and foreign governmental regulations, including those relating to:
| • | constructing and manufacturing power generation products; |
| • | currency conversions and repatriation; |
| • | clean air and other environmental protection legislation; |
-15-
Table of Contents
| • | taxation of foreign earnings and earnings of expatriate personnel; |
| • | transactions in or with foreign countries or officials; and |
| • | use of local employees and suppliers. |
In addition, a substantial portion of the demand for our products and services is from electric power generating companies and other steam-using customers. The demand for power generation products and services can be influenced by governmental legislation setting requirements for utilities related to operations, emissions and environmental impacts. The legislative process is unpredictable and includes a platform that continuously seeks to increase the restrictions on power producers. Potential legislation limiting emissions from power plants, including carbon dioxide, could affect our markets and the demand for our products and services related to power generation.
We cannot determine the extent to which our future operations and earnings may be affected by new legislation, new regulations or changes in existing regulations.
Regulations related to “conflict minerals” may force us to incur additional expenses, may make our supply chain more complex and may result in damage to our reputation with customers.
On August 22, 2012, under the Dodd-Frank Wall Street Reform and Consumer Protection Act of 2010 (the “Dodd-Frank Act”), the SEC adopted new requirements for companies that use minerals and metals, known as conflict minerals, in their products, whether or not these products are manufactured by third parties. Under these requirements, companies that are subject to the rules conduct due diligence and disclose and report whether or not such minerals originate from the Democratic Republic of Congo and adjoining countries. The implementation of these new requirements could adversely affect the sourcing, availability and pricing of minerals used in the manufacture of components incorporated in our products. In addition, we will incur additional costs to comply with the disclosure requirements, including costs related to determining the source of any of the relevant minerals and metals used in our products. Since our supply chain is complex, we may not be able to sufficiently verify the origins for these minerals and metals used in our products through the diligence procedures that we implement, which may harm our reputation. In such event, we may also face difficulties in satisfying customers who require that the components of our products either may not originate from the Democratic Republic of Congo and adjoining countries or must be certified as conflict free.
Our business requires us to obtain, and to comply with, national, state and local government permits and approvals.
Our business is required to obtain, and to comply with, national, state and local government permits and approvals. Any of these permits or approvals may be subject to denial, revocation or modification under various circumstances. Failure to obtain or comply with the conditions of permits or approvals may adversely affect our operations by temporarily suspending our activities or curtailing our work and may subject us to penalties and other sanctions. Although existing licenses are routinely renewed by various regulators, renewal could be denied or jeopardized by various factors, including:
| • | failure to comply with environmental and safety laws and regulations or permit conditions; |
| • | local community, political or other opposition; |
| • | executive action; and |
| • | legislative action. |
In addition, if new environmental legislation or regulations are enacted or implemented, or existing laws or regulations are amended or are interpreted or enforced differently, we may be required to obtain additional operating permits or approvals. Our inability to obtain, and to comply with, the permits and approvals required for our business could have a material adverse effect on us.
-16-
Table of Contents
Our operations involve the handling, transportation and disposal of hazardous materials, and environmental laws and regulations and civil liability for contamination of the environment or related personal injuries may result in increases in our operating costs and capital expenditures and decreases in our earnings and cash flows.
Our operations involve the handling, transportation and disposal of hazardous materials. Failure to properly handle these materials could pose a health risk to humans or wildlife and could cause personal injury and property damage (including environmental contamination). If an accident were to occur, its severity could be significantly affected by the volume of the materials and the speed of corrective action taken by emergency response personnel, as well as other factors beyond our control, such as weather and wind conditions. Actions taken in response to an accident could result in significant costs.
Governmental requirements relating to the protection of the environment, including solid waste management, air quality, water quality and cleanup of contaminated sites, have had a substantial impact on our operations. These requirements are complex and subject to frequent change. In some cases, they can impose liability for the entire cost of cleanup on any responsible party without regard to negligence or fault and impose liability on us for the conduct of others or conditions others have caused, or for our acts that complied with all applicable requirements when we performed them. Our compliance with amended, new or more stringent requirements, stricter interpretations of existing requirements or the future discovery of contamination may require us to make material expenditures or subject us to liabilities that we currently do not anticipate. Such expenditures and liabilities may adversely affect our business, financial condition, results of operations and cash flows. In addition, some of our operations and the operations of predecessor owners of some of our properties have exposed us to civil claims by third parties for liability resulting from alleged contamination of the environment or personal injuries caused by releases of hazardous substances into the environment.
In our contracts, we seek to protect ourselves from liability associated with accidents, but there can be no assurance that such contractual limitations on liability will be effective in all cases or that our or our customers’ insurance will cover all the liabilities we have assumed under those contracts. The costs of defending against a claim arising out of a contamination incident or precautionary evacuation, and any damages awarded as a result of such a claim, could adversely affect our results of operations and financial condition.
We maintain insurance coverage as part of our overall risk management strategy and due to requirements to maintain specific coverage in our financing agreements and in many of our contracts. These policies do not protect us against all liabilities associated with accidents or for unrelated claims. In addition, comparable insurance may not continue to be available to us in the future at acceptable prices, or at all.
We conduct a portion of our operations through joint venture entities, over which we may have limited ability to influence.
We currently have equity interests in several significant joint ventures, which contributed $(2.1) million and $2.4 million to equity in income (loss) of investees for the quarter ended March 31, 2015 and 2014, respectively, and $8.7 million, $18.4 million and $17.4 million to equity in income of investees for the years ended December 31, 2014, 2013 and 2012, respectively, and may enter into additional joint venture arrangements in the future. Our influence over some of these entities may be limited. Even in those joint ventures over which we do exercise significant influence, we are often required to consider the interests of our joint venture partners in connection with major decisions concerning the operations of the joint ventures. In any case, differences in views among the joint venture participants may result in delayed decisions or disputes. We also cannot control the actions of our joint venture participants. We sometimes have joint and several liabilities with our joint venture partners under the applicable contracts for joint venture projects and we cannot be certain that our partners will be able to satisfy any potential liability that could arise. These factors could potentially harm the business and operations of a joint venture and, in turn, our business and operations.
Operating through joint ventures in which we are minority holders results in us having limited control over many decisions made with respect to business practices, projects and internal controls relating to projects. These joint ventures may not be subject to the same requirements regarding internal controls and internal control over financial reporting that we follow. As a result, internal control problems may arise with respect to the joint ventures that could adversely affect our ability to respond to requests or contractual obligations to customers or to meet the internal control requirements to which we are otherwise subject.
-17-
Table of Contents
In addition, our arrangements involving joint ventures may restrict us from gaining access to the cash flows or assets of these entities. In some cases, our joint ventures have governmentally imposed restrictions on their abilities to transfer funds to us.
If our co-venturers fail to perform their contractual obligations on a project or if we fail to coordinate effectively with our co-venturers, we could be exposed to legal liability, loss of reputation and reduced profit on the project.
We often perform projects jointly with third parties. For example, we enter into contracting consortia and other contractual arrangements to bid for and perform jointly on large projects. Success on these joint projects depends in part on whether our co-venturers fulfill their contractual obligations satisfactorily. If any one or more of these third parties fail to perform their contractual obligations satisfactorily, we may be required to make additional investments and provide added services in order to compensate for that failure. If we are unable to adequately address any such performance issues, then our customer may exercise its right to terminate a joint project, exposing us to legal liability, loss of reputation and reduced profit.
Our collaborative arrangements also involve risks that participating parties may disagree on business decisions and strategies. These disagreements could result in delays, additional costs and risks of litigation. Our inability to successfully maintain existing collaborative relationships or enter into new collaborative arrangements could have a material adverse effect on our results of operations.
We could be adversely affected by violations of the U.S. Foreign Corrupt Practices Act.
The U.S. Foreign Corrupt Practices Act (the “FCPA”) generally prohibits companies and their intermediaries from making improper payments to non-U.S. officials. Our training program and policies mandate compliance with the FCPA. We operate in some parts of the world that have experienced governmental corruption to some degree, and, in some circumstances, strict compliance with anti-bribery laws may conflict with local customs and practices. If we are found to be liable for violations of the FCPA (either due to our own acts or our inadvertence, or due to the acts or inadvertence of others, including employees of our joint ventures), we could suffer from civil and criminal penalties or other sanctions.
We may not be able to compete successfully against current and future competitors.
Some of our competitors or potential competitors have greater financial or other resources than we have and in some cases are government supported. Our operations may be adversely affected if our current competitors or new market entrants introduce new products or services with better features, performance, prices or other characteristics than those of our products and services. Furthermore, we operate in industries where capital investment is critical. We may not be able to obtain as much purchasing and borrowing leverage and access to capital for investment as other public companies, which may impair our ability to compete against competitors or potential competitors.
The loss of the services of one or more of our key personnel, or our failure to attract, assimilate and retain trained personnel in the future, could disrupt our operations and result in loss of revenues.
Our success depends on the continued active participation of our executive officers and key operating personnel. The unexpected loss of the services of any one of these persons could adversely affect our operations.
Our operations require the services of employees having the technical training and experience necessary to obtain the proper operational results. As such, our operations depend, to a considerable extent, on the continuing availability of such personnel. If we should suffer any material loss of personnel to competitors, retirement or other reasons, or be unable to employ additional or replacement personnel with the requisite level of training and experience to adequately operate our business, our operations could be adversely affected. While we believe our wage rates are competitive and our relationships with our employees are satisfactory, a significant increase in the wages paid by other employers could result in a reduction in our workforce, increases in wage rates, or both. Additionally, we have announced plans to freeze pension plan benefit accruals at the end of 2015 and to complete the spin-off by mid-summer 2015, which could also result in incremental turnover in our workforce. If any of these events occurred for a significant period of time, our financial condition, results of operations and cash flows could be adversely impacted.
-18-
Table of Contents
Negotiations with labor unions and possible work stoppages and other labor problems could divert management’s attention and disrupt operations. In addition, new collective bargaining agreements or amendments to agreements could increase our labor costs and operating expenses.
A significant number of our employees are members of labor unions. If we are unable to negotiate acceptable new contracts with our unions from time to time, we could experience strikes or other work stoppages by the affected employees. If any such strikes or other work stoppages were to occur, we could experience a significant disruption of operations. In addition, negotiations with unions could divert management attention. New union contracts could result in increased operating costs, as a result of higher wages or benefit expenses, for both union and nonunion employees. If nonunion employees were to unionize, we would experience higher ongoing labor costs.
Pension and medical expenses associated with our retirement benefit plans may fluctuate significantly depending on a number of factors, and we may be required to contribute cash to meet underfunded pension obligations.
A substantial portion of our current and retired employee population is covered by pension and postretirement benefit plans, the costs and funding requirements of which depend on our various assumptions, including estimates of rates of return on benefit-related assets, discount rates for future payment obligations, rates of future cost growth, mortality assumptions and trends for future costs. Variances from these estimates could have a material adverse effect on us. In addition, our policy to recognize these variances annually through mark to market accounting could result in volatility in our results of operations, which could be material. As of March 31, 2015, after giving effect to the distribution, our defined benefit pension and postretirement benefit plans would have been underfunded by approximately $283.8 million. We also participate in various multi-employer pension plans in the U.S. and Canada under union and industry agreements that generally provide defined benefits to employees covered by collective bargaining agreements. Absent an applicable exemption, a contributor to a U.S. multi-employer plan is liable, upon termination or withdrawal from a plan, for its proportionate share of the plan’s underfunded vested liability. Funding requirements for benefit obligations of these multi-employer pension plans are subject to certain regulatory requirements, and we may be required to make cash contributions which may be material to one or more of these plans to satisfy certain underfunded benefit obligations. See Note 7 to the audited combined financial statements included in this prospectus for additional information regarding our pension and postretirement benefit plan obligations.
Our international operations are subject to political, economic and other uncertainties not generally encountered in our domestic operations.
We derive a substantial portion of our revenues and equity in income of investees from international operations, and we intend to continue to expand our international operations and customer base as part of our growth strategy. After giving effect to the distribution, our revenues derived from operations located outside of the United States represented 21% and 20% for the quarter ended March 31, 2015 and 2014, respectively, and, 27%, 27% and 24% of total revenues for the years ended December 31, 2014, 2013 and 2012, respectively. Operating in international markets requires significant resources and management attention and subjects us to political, economic and regulatory risks that are not generally encountered in our U.S. operations. These include:
| • | risks of war, terrorism and civil unrest; |
| • | expropriation, confiscation or nationalization of our assets; |
| • | renegotiation or nullification of our existing contracts; |
| • | changing political conditions and changing laws and policies affecting trade and investment; |
| • | overlap of different tax structures; and |
| • | risk of changes in foreign currency exchange rates. |
Various foreign jurisdictions have laws limiting the right and ability of foreign subsidiaries and joint ventures to pay dividends and remit earnings to affiliated companies. Our international operations sometimes face the additional risks of fluctuating currency values, hard currency shortages and controls of foreign currency
-19-
Table of Contents
exchange. If we continue to expand our business globally, our success will depend, in part, on our ability to anticipate and effectively manage these and other risks. These and other factors may have a material impact on our international operations or its business as a whole.
Natural disasters or other events beyond our control could adversely impact our business.
Natural disasters, such as earthquakes, tsunamis, hurricanes, floods, tornados, or other events could adversely impact demand for or supply of our products. In addition, natural disasters could also cause disruption to our facilities, systems or projects, which could interrupt operational processes and performance on our contracts and adversely impact our ability to manufacture our products and provide services and support to our customers. We operate facilities in areas of the world that are exposed to natural disasters, such as, but not limited to, hurricanes, floods and tornados.
War, other armed conflicts or terrorist attacks could have a material adverse effect on our business.
War, terrorist attacks and unrest have caused and may continue to cause instability in the world’s financial and commercial markets and have significantly increased political and economic instability in some of the geographic areas in which we operate. Threats of war or other armed conflict may cause further disruption to financial and commercial markets. In addition, continued unrest could lead to acts of terrorism in the United States or elsewhere, and acts of terrorism could be directed against companies such as ours. Also, acts of terrorism and threats of armed conflicts in or around various areas in which we operate could limit or disrupt our markets and operations, including disruptions from evacuation of personnel, cancellation of contracts or the loss of personnel or assets. Armed conflicts, terrorism and their effects on us or our markets may significantly affect our business and results of operations in the future.
Risks Relating to the Spin-Off
We may be unable to achieve some or all of the benefits that we expect to achieve from our separation from the Company.
As an independent public company, we believe that we will be able to more effectively focus on our operations and growth strategies than we could as a segment of the Company. However, by separating from the Company there is a risk that our results of operations and cash flows may be susceptible to greater volatility due to fluctuations in our business levels and other factors that may adversely affect our operating and financial performance. In addition, as a segment of the Company, we have enjoyed benefits from the Company’s financial resources. As a result of the fact that the Company’s other operations will no longer be available to offset any volatility in our results of operations and cash flows and the Company’s financial and other resources will no longer be available to us, we may not be able to achieve some or all of the benefits that we expect to achieve as an independent public company. In addition, we expect to incur one-time transaction costs of approximately $6 million of primarily non-cash stock-based compensation costs after the spin-off (the Company is expected to bear substantially all of the approximately $80 million of estimated one-time transaction costs to effectuate the spin-off) and additional ongoing annual costs of approximately $14 to $16 million related to the transition to becoming an independent public company and replacing the services provided by the Company.
Our historical audited combined financial information is not necessarily indicative of our future financial condition, future results of operations or future cash flows nor does it reflect what our financial condition, results of operations or cash flows would have been as an independent public company during the periods presented.
The historical audited combined financial information we have included in this prospectus does not necessarily reflect what our financial condition, results of operations or cash flows would have been as an independent public company during the periods presented and is not necessarily indicative of our future financial condition, future results of operations or future cash flows. This is primarily a result of the following factors:
| • | the historical audited combined financial results reflect allocations of expenses for services historically provided by the Company, and those allocations may be different than the comparable expenses we would have incurred as an independent company; |
| • | our cost of debt and other capitalization may be different from that reflected in our historical audited combined financial statements; |
-20-
Table of Contents
| • | the historical audited combined financial information does not reflect the changes that will occur in our cost structure, management, financing arrangements and business operations as a result of our separation from the Company, including the costs related to being an independent company; and |
| • | the historical audited combined financial information does not reflect the effects of some of the liabilities that will be assumed by New B&W and does reflect the effects of some of the assets that will be transferred to, and liabilities that will be assumed by, the Company, including the assets and liabilities associated with the Company’s Nuclear Energy segment that are currently part of New B&W and will be transferred to the Company prior to the spin-off. |
Please refer to “Management’s Discussion and Analysis of Financial Condition and Results of Operations,” and the historical combined financial statements and the notes to those statements and the unaudited pro forma combined financial statements and the notes to those statements included in this prospectus.
We have no history operating as an independent public company, we may encounter difficulties in making the changes necessary to operate as an independent public company, and we may incur greater costs as an independent public company.
We have historically used the Company’s infrastructure to support our business functions, including the following functions:
| • | accounting and financial reporting; |
| • | information technology and communications; |
| • | legal; |
| • | human resources and employee benefits; |
| • | procurement and supply chain management; |
| • | tax administration; and |
| • | treasury and corporate finance. |
Following the spin-off, we will no longer have access to the Company’s infrastructure, and we will need to establish our own. We expect to incur costs in 2015 to establish the necessary infrastructure to enable us to establish these business functions. We currently pay the Company for these services on a cost-allocation basis. Following the spin-off, the Company will continue to provide some of these services to us on a transitional basis, pursuant to transition services agreements we will enter into with the Company. For more information regarding the transition services agreements, see “Relationship with the Company After the Spin-Off—Agreements Between the Company and Us—Transition Services Agreements.” At the end of this transition period, we will need to perform these functions ourselves or hire third parties to perform these functions on our behalf. The costs associated with performing or outsourcing these functions may exceed those charged by the Company when we were part of the Company or during the transition period. A significant increase in the costs of performing or outsourcing these functions could adversely affect our business, financial condition, results of operations and cash flows.
Our accounting and other management systems and resources may not be adequately prepared to meet the financial reporting and other requirements to which we will be subject following the spin-off and may strain our resources.
Our financial results are currently included within the consolidated results of the Company, and we believe that our reporting and control systems are appropriate for those of a subsidiary of a public company. However, prior to the spin-off, we were not directly subject to reporting and other requirements of the Securities Exchange Act of 1934, which we refer to as the Exchange Act. As a result of the spin-off, we will be directly subject to reporting and other obligations under the Exchange Act, including the requirements of Section 404 of the Sarbanes-Oxley Act of 2002. These reporting and other obligations will place significant demands on our management and administrative and operational resources, including accounting resources.
-21-
Table of Contents
To comply with these requirements, we anticipate that we will need to upgrade our systems, including information technology, implement additional financial and management controls, reporting systems and procedures and hire additional accounting and finance staff. We expect to incur additional annual expenses related to these steps, and those expenses may be significant. If we are unable to upgrade our financial and management controls, reporting systems, information technology and procedures in a timely and effective fashion, our ability to comply with our financial reporting requirements and other rules that apply to reporting companies under the Exchange Act could be impaired. Any failure to achieve and maintain effective internal controls could have an adverse effect on our business, financial condition, results of operations and cash flows.
We will be subject to continuing contingent liabilities of the Company following the spin-off.
After the spin-off, there will be several significant areas where the liabilities of the Company may become our obligations. For example, under the Code and the related rules and regulations, each corporation that was a member of the Company consolidated tax reporting group during any taxable period or portion of any taxable period ending on or before the completion of the spin-off is jointly and severally liable for the federal income tax liability of the entire consolidated tax reporting group for that taxable period. We will enter into a tax sharing agreement with the Company in connection with the spin-off that allocates the responsibility for prior period taxes of the Company consolidated tax reporting group between us and the Company and its subsidiaries. See “Relationship with the Company After the Spin-Off—Agreements Between the Company and Us—Tax Sharing Agreement.” However, if the Company were unable to pay, we could be required to pay the entire amount of such taxes. Other provisions of law establish similar liability for other matters, including laws governing tax-qualified pension plans as well as other contingent liabilities. The other contingent liabilities include personal injury claims or environmental liabilities related to the Company’s historical nuclear operations. For example, the Company has agreed to indemnify us for personal injury claims and environmental liabilities associated with radioactive materials related to the operation, remediation, and/or decommissioning of two former nuclear fuel processing facilities located in the Borough of Apollo and Parks Township. To the extent insurance providers and third party indemnitors do not cover those liabilities, and the Company was unable to pay, we could be required to pay for them. See “Business—Governmental Regulations and Environmental Matters” and “Business—Legal Proceedings.”
The spin-off could result in substantial tax liability.
The spin-off is conditioned on the Company’s receipt of an opinion of counsel, in form and substance satisfactory to the Company, substantially to the effect that, for U.S. federal income tax purposes, the spin-off will qualify under Section 355 of the Code and certain transactions related to the spin-off will qualify under Sections 355 and/or 368 of the Code. The opinion will rely on, among other things, various assumptions and representations as to factual matters made by the Company and us which, if inaccurate or incomplete in any material respect, would jeopardize the conclusions reached by such counsel in its opinion. The opinion will not be binding on the IRS or the courts, and there can be no assurance that the IRS or the courts will not challenge the conclusions stated in the opinion or that any such challenge would not prevail.
Neither we nor the Company are aware of any facts or circumstances that would cause the assumptions or representations that will be relied on in the opinion to be inaccurate or incomplete in any material respect. If, notwithstanding receipt of the opinion, the spin-off were determined not to qualify under Section 355 of the Code, each U.S. holder of Company common stock who receives shares of our common stock in the spin-off would generally be treated as receiving a taxable distribution of property in an amount equal to the fair market value of the shares of our common stock received. That distribution would be taxable to each such stockholder as a dividend to the extent of the Company’s current and accumulated earnings and profits. For each such stockholder, any amount that exceeded the Company’s earnings and profits would be treated first as a non-taxable return of capital to the extent of such stockholder’s tax basis in its shares of Company common stock with any remaining amount being taxed as a capital gain. In addition, if certain related preparatory transactions were to fail to qualify for tax-free treatment, they would be treated as taxable asset sales and/or distributions.
Under the terms of the tax sharing agreement we will enter into in connection with the spin-off, we and the Company will generally share responsibility for any taxes imposed on us or the Company and its subsidiaries in the event that the spin-off and/or certain related preparatory transactions were to fail to qualify for tax-free treatment. However, if the spin-off and/or certain related preparatory transactions were to fail to qualify for tax-free treatment because of actions or failures to act by us or the Company, we or the Company, respectively, would be
-22-
Table of Contents
responsible for all such taxes. If we are liable for taxes under the tax sharing agreement, that liability could have a material adverse effect on us. See “Relationship with the Company After the Spin-Off—Agreements Between the Company and Us—Tax Sharing Agreement.”
Potential liabilities associated with obligations under the tax sharing agreement cannot be precisely quantified at this time.
Under the terms of the tax sharing agreement we will enter into in connection with the spin-off, we will generally be responsible for all taxes attributable to us or any of our subsidiaries, whether accruing before, on or after the date of the spin-off. We and the Company will generally share responsibility for all taxes imposed on us or the Company and its subsidiaries in the event the spin-off and/or certain related preparatory transactions were to fail to qualify for tax-free treatment. However, if the spin-off and/or certain related preparatory transactions were to fail to qualify for tax-free treatment because of actions or failures to act by us or the Company, we or the Company, respectively would be responsible for all such taxes. Our liabilities under the tax sharing agreement could have a material adverse effect on us. At this time, we cannot precisely quantify the amount of liabilities we may have under the tax sharing agreement and there can be no assurances as to their final amounts. For a more detailed discussion, see “Relationship with the Company After the Spin-Off—Agreements Between the Company and Us—Tax Sharing Agreement.”
Under some circumstances, we could be liable for any resulting adverse tax consequences from engaging in significant strategic or capital raising transactions.
Even if the spin-off otherwise qualifies as a tax-free distribution under section 355 of the Code, the spin-off and certain related transactions may result in significant U.S. federal income tax liabilities to us under Section 355(e) and other applicable provisions of the Code if 50% or more of the Company’s stock or our stock (in each case, by vote or value) is treated as having been acquired, directly or indirectly, by one or more persons as part of a plan (or series of related transactions) that includes the spin-off. Any acquisitions of Company stock or our stock (or similar acquisitions), or any understanding, arrangement or substantial negotiations regarding such an acquisition of Company stock or our stock (or similar acquisitions), within two years before or after the spin-off are subject to special scrutiny. The process for determining whether an acquisition triggering those provisions has occurred is complex, inherently factual and subject to interpretation of the facts and circumstances of a particular case.
Under the terms of the tax sharing agreement we will enter into in connection with the spin-off, the Company will generally be liable for any such tax liabilities. However, we will be required to indemnify the Company against any such tax liabilities that result from actions taken or failures to act by us. See “Relationship with the Company After the Spin-Off—Agreements Between the Company and Us—Tax Sharing Agreement.” As a result of these rules and contractual provisions, we may be unable to engage in strategic or capital raising transactions that our stockholders might consider favorable, or to structure potential transactions in the manner most favorable to us, without certain adverse tax consequences.
Potential indemnification liabilities to the Company pursuant to the master separation agreement could materially adversely affect New B&W.
The master separation agreement with the Company will provide for, among other things, the principal corporate transactions required to effect the spin-off, certain conditions to the spin-off and provisions governing the relationship between New B&W and the Company with respect to and resulting from the spin-off. For a description of the master separation agreement, see “Relationship with the Company After the Spin-Off—Agreements Between the Company and Us—Master Separation Agreement.” Among other things, the master separation agreement provides for indemnification obligations designed to make New B&W financially responsible for substantially all liabilities that may exist relating to our business activities, whether incurred prior to or after the spin-off, as well as those obligations of the Company assumed by us pursuant to the master separation agreement. If we are required to indemnify the Company under the circumstances set forth in the master separation agreement, we may be subject to substantial liabilities.
In connection with our separation from the Company, the Company will indemnify us for certain liabilities. However, there can be no assurance that the indemnity will be sufficient to insure us against the full amount of such liabilities, or that the Company’s ability to satisfy its indemnification obligation will not be impaired in the future.
Pursuant to the master separation agreement, the Company will agree to indemnify us for certain liabilities. However, third parties could seek to hold us responsible for any of the liabilities that the Company will
-23-
Table of Contents
agree to retain, and there can be no assurance that the indemnity from the Company will be sufficient to protect us against the full amount of such liabilities, or that the Company will be able to fully satisfy its indemnification obligations. Moreover, even if we ultimately succeed in recovering from the Company any amounts for which we are held liable, we may be temporarily required to bear these losses.
The terms of our separation from the Company and the related agreements will be determined in the context of a related-party transaction, and thus may not be comparable to terms that would be obtained in a transaction between unaffiliated parties.
Transactions and agreements to be entered into with the Company on or before the closing of the spin-off present conflicts between our interests and those of the Company. These transactions and agreements include the following:
| • | agreements related to the separation of our business from the Company that will provide for, among other things, the assumption by us of liabilities related to our business or subsidiaries, the assumption by the Company of liabilities unrelated to our business, our respective rights, responsibilities and obligations with respect to taxes and tax benefits and the terms of our various interim and ongoing relationships, as described under “Relationship with the Company After the Spin-Off—Agreements Between the Company and Us”; and |
| • | administrative support services provided by the Company to us, as well as by us to the Company, and other transactions with the Company, as described under “Relationship with the Company After the Spin-Off—Agreements Between the Company and Us—Transition Services Agreements.” |
Because the terms of our separation from the Company and these agreements are being entered into in the context of a related-party transaction, these terms may not be comparable to terms that would be obtained in a transaction between unaffiliated parties. We may not be able to resolve potential conflicts, and even if we do, the resolutions may be less favorable than if we were dealing with an unaffiliated third party. See “Relationship with the Company After the Spin-Off—Agreements Between the Company and Us.”
Several members of our board and management may have conflicts of interest because of their ownership of shares of common stock of the Company.
Several members of our board and management own shares of common stock of the Company and/or options to purchase common stock of the Company because of their current or prior relationships with the Company. In addition, five of the current members of our board of directors were members of the Company’s board of directors. This share ownership by these five directors could create, or appear to create, potential conflicts of interest when our directors and executive officers are faced with decisions that could have different implications for New B&W and the Company. See “Management.”
Risks Relating to Ownership of Our Common Stock
Because there has not been any public market for our common stock, the market price and trading volume of our common stock may be volatile and you may not be able to resell your shares of our common stock at or above the initial market price of our common stock following the spin-off.
Prior to the spin-off, there will have been no trading market for our common stock. We cannot assure you that an active trading market will develop or be sustained for our common stock after the spin-off, nor can we predict the prices at which our common stock will trade after the spin-off. The market price of our common stock could fluctuate significantly due to a number of factors, many of which are beyond our control, including:
| • | fluctuations in our quarterly or annual earnings results or those of other companies in our industry; |
| • | failures of our operating results to meet the estimates of securities analysts or the expectations of our stockholders or changes by securities analysts in their estimates of our future earnings; |
| • | announcements by us or our customers, suppliers or competitors; |
-24-
Table of Contents
| • | the depth and liquidity of the market for New B&W common stock; |
| • | changes in laws or regulations that adversely affect our industry or us; |
| • | changes in accounting standards, policies, guidance, interpretations or principles; |
| • | general economic, industry and stock market conditions; |
| • | future sales of our common stock by our stockholders; |
| • | future issuances of our common stock by us; |
| • | our ability to pay dividends in the future; and |
| • | the other factors described in these “Risk Factors” and other parts of this prospectus. |
Substantial sales of our common stock could cause our stock price to decline and issuances by us may dilute your ownership in New B&W.
Any sales of substantial amounts of our common stock in the public market after the spin-off, or the perception that these sales might occur, could lower the market price of our common stock and impede our ability to raise capital through the issuance of equity securities. It is possible that some Company stockholders, including possibly some of the Company’s largest stockholders, will sell the shares of our common stock they receive in the spin-off for various reasons. For example, such investors may not believe that our business profile or level of market capitalization as an independent company fits their investment objectives. Further, if we were to issue additional equity securities to raise additional capital, your ownership interest in New B&W will be diluted and the value of your investment may be reduced.
A large number of shares of our common stock are or will be eligible for future sale, which may cause the market price for our common stock to decline.
Upon completion of the spin-off, we will have an aggregate of approximately 53.7 million shares of common stock outstanding. Virtually all of those shares will be freely tradable without restriction or registration under the Securities Act. We are unable to predict whether large amounts of our common stock will be sold in the open market following the spin-off. We are also unable to predict whether a sufficient number of buyers would be in the market at that time. Some Company stockholders may be required to sell the shares of common stock of us that they receive in the spin-off. In addition, it is possible that other Company stockholders will sell the shares of common stock of us that they receive in the spin-off for various reasons. For example, such stockholders may not believe that our business profile, level of market capitalization or capital distribution policies as an independent company fits their investment objectives. We can provide no assurance that there will be sufficient new buying interest to offset the potential sales of our common stock. In addition, index or other funds currently holding shares of Company common stock may be required to sell the shares of our common stock they receive in the spin-off. Accordingly, our common stock could experience a high level of volatility immediately following the spin-off and, as a result, the price of our shares of common stock could be adversely affected.
We have no plans to pay regular dividends on our common stock, so you may not receive funds without selling your shares of our common stock.
We have no current intent to pay a regular dividend. Our board of directors will determine the payment of future dividends on our common stock, if any, and the amount of any dividends in light of applicable law, contractual restrictions limiting our ability to pay dividends, our earnings and cash flows, our capital requirements, our financial condition, and other factors our board of directors deems relevant. Accordingly, you may have to sell some or all of your shares of our common stock in order to generate cash flow from your investment.
Provisions in our corporate documents and Delaware law could delay or prevent a change in control of New B&W, even if that change may be considered beneficial by some stockholders.
The existence of some provisions of our certificate of incorporation and bylaws and Delaware law could discourage, delay or prevent a change in control of New B&W that a stockholder may consider favorable.
-25-
Table of Contents
In addition, following the spin-off, we will be subject to Section 203 of the Delaware General Corporation Law, which may have an anti-takeover effect with respect to transactions not approved in advance by our board of directors, including discouraging takeover attempts that might result in a premium over the market price for shares of our common stock.
We believe these provisions protect our stockholders from coercive or otherwise unfair takeover tactics by requiring potential acquirors to negotiate with our board of directors and by providing our board of directors with more time to assess any acquisition proposal, and are not intended to make New B&W immune from takeovers. However, these provisions apply even if the offer may be considered beneficial by some stockholders and could delay or prevent an acquisition that our board of directors determines is not in the best interests of New B&W and our stockholders. See “Description of Capital Stock—Anti-Takeover Effects of Provisions of our Certificate of Incorporation and Bylaws.”
We may issue preferred stock that could dilute the voting power or reduce the value of our common stock.
Upon the spin-off, our certificate of incorporation could authorize us to issue, without the approval of our stockholders, one or more classes or series of preferred stock having such designation, powers, preferences and relative, participating, optional and other special rights, including preferences over our common stock respecting dividends and distributions, as our board of directors generally may determine. The terms of one or more classes or series of preferred stock could dilute the voting power or reduce the value of our common stock. For example, we could grant holders of preferred stock the right to elect some number of our directors in all events or on the happening of specified events or the right to veto specified transactions. Similarly, the repurchase or redemption rights or liquidation preferences we could assign to holders of preferred stock could affect the residual value of the common stock. See “Description of Capital Stock—Preferred Stock.”
-26-
Table of Contents
CAUTIONARY STATEMENT CONCERNING FORWARD-LOOKING INFORMATION
This prospectus includes forward-looking statements. You can identify our forward-looking statements by words such as “anticipate,” “believe,” “estimate,” “expect,” “forecast,” “goal,” “intend,” “plan,” “predict,” “project,” “seek,” “target,” “could,” “may,” “should” or “would” or other similar expressions that convey the uncertainty of future events or outcomes. When considering these forward-looking statements, you should keep in mind the risk factors and other cautionary statements contained in this prospectus.
These forward-looking statements include, but are not limited to, statements that relate to, or statements that are subject to risks, contingencies or uncertainties that relate to:
| • | the expected benefits of the spin-off; |
| • | our business strategy; |
| • | future levels of revenues (including our backlog and projected claims to the extent either may be viewed as an indicator of future revenues), operating margins, income from operations, net income or earnings per share; |
| • | anticipated levels of demand for our products and services; |
| • | future levels of research and development, capital, environmental or maintenance expenditures; |
| • | our beliefs regarding the timing and effects on our business of environmental and tax legislation, rules and regulations; |
| • | the success or timing of completion of ongoing or anticipated capital or maintenance projects; |
| • | expectations regarding the acquisition or divestiture of assets and businesses; |
| • | our ability to obtain appropriate insurance and indemnities; |
| • | the potential effects of judicial or other proceedings, including tax audits, on our business, financial condition, results of operations and cash flows; |
| • | the anticipated effects of actions of third parties such as competitors, or federal, foreign, state or local regulatory authorities, or plaintiffs in litigation; and |
| • | the effective date and expected impact of accounting pronouncements. |
We have based our forward-looking statements on our current expectations, estimates and projections about our industry and New B&W. We caution that these statements are not guarantees of future performance and you should not rely unduly on them, as they involve risks, uncertainties and assumptions that we cannot predict. In addition, we have based many of these forward-looking statements on assumptions about future events that may prove to be inaccurate. While our management considers these assumptions to be reasonable, they are inherently subject to significant business, economic, competitive, regulatory and other risks, contingencies and uncertainties, most of which are difficult to predict and many of which are beyond our control. Accordingly, our actual results may differ materially from the future performance that we have expressed or forecast in our forward-looking statements. Differences between actual results and any future performance suggested in our forward-looking statements could result from a variety of factors, including the following:
| • | the highly competitive nature of our businesses; |
| • | general economic and business conditions, including changes in interest rates and currency exchange rates; |
| • | general developments in the industries in which we are involved; |
| • | cancellations of and adjustments to backlog and the resulting impact from using backlog as an indicator of future earnings; |
-27-
Table of Contents
| • | our ability to perform projects on time and on budget, in accordance with the schedules and terms established by the applicable contracts with customers; |
| • | changes in our effective tax rate and tax positions; |
| • | our ability to maintain operational support for our information systems against service outages and data corruption, as well as protection against cyber-based network security breaches and theft of data; |
| • | our ability to protect our intellectual property and renew licenses to use intellectual property of third parties; |
| • | our use of the percentage-of-completion method of accounting; |
| • | our ability to obtain and maintain surety bonds, letters of credit and similar financing; |
| • | the risks associated with integrating businesses we acquire; |
| • | our ability to successfully manage research and development projects and costs, including our efforts to successfully develop and commercialize new technologies and products; |
| • | the operating risks normally incident to our lines of business, including professional liability, product liability, warranty and other claims against us; |
| • | changes in, or our failure or inability to comply with, laws and government regulations; |
| • | difficulties we may encounter in obtaining regulatory or other necessary permits or approvals; |
| • | changes in, and liabilities relating to, existing or future environmental regulatory matters; |
| • | our limited ability to influence and direct the operations of our joint ventures; |
| • | potential violations of the Foreign Corrupt Practices Act; |
| • | our ability to successfully compete with current and future competitors; |
| • | the loss of key personnel and the continued availability of qualified personnel; |
| • | our ability to negotiate and maintain good relationships with labor unions; |
| • | changes in pension and medical expenses associated with our retirement benefit programs; |
| • | social, political, competitive and economic situations in foreign countries where we do business or seek new business; |
| • | the possibilities of war, other armed conflicts or terrorist attacks; and |
| • | the other risks described in this prospectus. |
We believe the items we have outlined above are important factors that could cause estimates in our financial statements to differ materially from actual results and those expressed in the forward-looking statements made in this prospectus. We have discussed many of these factors in more detail elsewhere in this prospectus. These factors are not necessarily all the factors that could affect us. Unpredictable or unanticipated factors we have not discussed in this prospectus could also have material adverse effects on actual results of matters that are the subject of our forward-looking statements. Neither we nor the Company undertake any obligation to update the forward-looking statements included in this prospectus to reflect events or circumstances after the date of this prospectus, unless we are required by applicable securities laws and regulations to do so. We advise our security holders that they should (1) be aware that factors not referred to above could affect the accuracy of our forward-looking statements and (2) use caution and common sense when considering our forward-looking statements.
-28-
Table of Contents
General
On November 5, 2014, the Company announced that it was separating its Power Generation business from its Government and Nuclear Operations business, subject to, among other things, the conditions described below under “—Spin-Off Conditions and Termination.” The separation will be accomplished through the spin-off of all of the common stock of New B&W to stockholders of the Company.
New B&W is currently a wholly owned subsidiary of the Company. Prior to the distribution, PGG OpCo will transfer the assets and liabilities associated with the Company’s Nuclear Energy segment to the Company. The Company will then distribute on a pro rata basis 100% of our outstanding common stock to the Company’s stockholders on June 30, 2015, the distribution date. As a result of the spin-off, each holder of Company common stock as of 5:00 p.m., New York City time, on June 18, 2015, the record date, will be entitled to:
| • | receive one share of our common stock for every two shares of Company common stock owned by such holder; and |
| • | retain such holder’s shares of Company common stock. |
The actual number of shares to be distributed will be determined based on the number of shares of Company common stock outstanding as of the record date and will be reduced to the extent that cash payments are to be made in lieu of the issuance of fractional shares of New B&W. The exact number of shares of New B&W common stock to be distributed will be calculated on the record date. The Company’s board of directors, with input from its financial advisor, will consider the appropriate liquidity and trading levels for New B&W when determining the distribution ratio for the spin-off. The shares of New B&W common stock to be distributed by the Company will constitute all of the issued and outstanding shares of New B&W common stock immediately prior to the distribution.
Company stockholders will not be required to pay for shares of New B&W common stock received in the spin-off or to surrender or exchange shares of Company common stock in order to receive New B&W common stock or to take any other action in connection with the spin-off. No vote of Company stockholders will be required or sought in connection with the spin-off, and Company stockholders will have no appraisal rights in connection with the spin-off.
Background of the Spin-Off
The Company’s board of directors and senior management regularly review the Company’s prospects, business plan and strategic alternatives.
As part of this process, at a regularly scheduled meeting on August 4-5, 2014, the Company’s board of directors reviewed the Company’s prospects and potential strategic alternatives, and directed Company management, with the assistance of the Company’s financial and legal advisors, to more fully evaluate the Company’s strategic alternatives for consideration by the board at its annual strategic planning meeting scheduled for September 8-9, 2014.
At its September 8-9, 2014 strategic planning meeting, the Company’s board of directors, with the input of the Company’s financial and legal advisors, engaged in a wide-ranging review of the Company’s business plan and prospects, as well as strategic alternatives that were available to the Company, including continuing the Company’s current operations under its existing capital structure; acquisitions, joint ventures and other potential inorganic growth possibilities; the return of cash to stockholders, including through a potential recapitalization; the sale of one or both of the Company’s businesses; the spin-off of or split-off of one of its businesses and a business combination or other possible strategic transaction. It was the consensus of the Company’s board that the Company’s management, with the assistance of the Company’s financial and legal advisors, should continue to focus on the Company’s strategic alternatives for further consideration at a meeting of the board of the Company scheduled for September 27, 2014.
The Company’s board of directors met on September 27, 2014 to continue its consideration of the Company’s prospects and strategic alternatives. Representatives of the Company’s financial and legal advisors
-29-
Table of Contents
participated in the meeting. While no decision was made to pursue any particular option, following a thorough review of the strategic alternatives that the Company’s management, based in part on input from the Company’s financial and legal advisors, believed to be reasonably available, it was the consensus of the Company’s board that the Company should focus its analysis on the possible separation of the Company’s Power Generation and Government and Nuclear Operations businesses into two separate publicly traded companies to enhance stockholder value.
Company management, with assistance from the Company’s financial and legal advisors continued to evaluate the possible separation of the Company’s Power Generation and Government Nuclear Operations businesses into two separate publicly traded companies over the next five weeks, focusing on possible capital structures, management, the division of assets and liabilities and tax, legal, regulatory and other issues that would be involved in a separation of the Company’s businesses.
The Company’s board of directors met on October 31, 2014 to review the possible separation and the additional analyses undertaken by the Company’s management and the Company’s financial and legal advisors since the September 27th meeting. Following extensive discussion, the Company’s board authorized the Company’s management to pursue the possible separation, subject to various conditions, including the effectiveness of SEC registration, regulatory approval and final approval by the Company’s board.
Reasons for the Spin-Off
Factors Supporting the Spin-Off: In determining to pursue a spin-off, the Company’s board of directors and management concluded that the spin-off could be reasonably expected to increase stockholder value by improving the operating performance of the two businesses based on four key factors:
| • | increased flexibility to allocate resources and deploy capital internally in a manner consistent with the strategic priorities of each business; |
| • | increased opportunities to pursue external growth strategies as independent companies; |
| • | enhanced ability to attract an investor base suited to the particular operational and financial characteristics of each company; and |
| • | greater management focus on the distinct businesses of Power Generation and Government and Nuclear Operations. |
The Company’s board and management believe these benefits will provide both companies with the following:
| • | Improved positioning for each company to accelerate growth: Each company is expected to be better positioned to accelerate growth as a separate, publicly traded company as compared to the current consolidated company structure. New B&W believes that opportunities for growth will result from its ability to focus on and implement its distinct corporate strategy, take advantage of available market opportunities on a more timely basis, reinvest its cash flows within its business as its board of directors and management deem appropriate and develop stronger and broader relationships with its customers. |
As part of a consolidated company, each company’s growth initiatives had to be evaluated in terms of available funding, resources, prioritization and time permitted for review and approval as part of the consolidated company. The businesses of the Company and New B&W have typically operated autonomously as business segments of the Company. However, due to the different characteristics of the Company and New B&W businesses, neither company has had the ability to reinvest its cash flows in internal growth as may have been desirable for its business on a stand-alone basis. Finally, so long as the Company and New B&W were consolidated, part of the strategy of the Company was to maintain a balance between its businesses and not become overly concentrated in any particular business. However, this strategy adversely affected the ability of each company to pursue its own growth initiatives to their full potential.
-30-
Table of Contents
| • | More efficient allocation of capital: As discussed above, as part of the consolidated company, the Company’s board of directors had to evaluate the Company and New B&W together when determining the allocation of capital resources. In addition, the consolidated company maintained an appropriate level of liquidity for the operating characteristics of the combined business. As a result, the flexibility of each company to invest capital in its business in a time and manner as its separate strategy would dictate was necessarily affected. The Company believes that the separation of the Power Generation and Government and Nuclear Operations businesses will enable a more efficient allocation of capital by providing each separate company’s board of directors and management the ability to reinvest that company’s free cash flow, utilize its capital resources and access the capital markets, if needed, in a manner consistent with the needs of that specific company, rather than the needs of the consolidated company, and that this more efficient allocation of capital can be reasonably expected to provide the separated companies with greater flexibility to pursue their strategic initiatives. |
| • | Establishment of distinct publicly traded stock “currencies” to facilitate future acquisitions: As separate companies, the Company believes each company’s stock can also serve as a more attractive acquisition “currency” to potential acquisition targets than the existing Company common stock. In the case of an acquisition of a business in which part of the consideration is to be paid in stock, the Company believes that the existing investors in the acquisition target company would generally prefer to receive stock of another company in the same sector as the target, rather than stock of an integrated company that has exposure to other sectors that they may not prefer or as to which they may not have sufficient familiarity to remain as long-term investors. |
| • | Sharpened management focus and strategic vision and closer alignment of management incentives with stockholder value creation: The Company believes that each company has different business strategies and offers significantly different business opportunities for growth. The Company believes that the spin-off should therefore enable the management team of each company to improve its focus on its strategic priorities and make business and operational decisions that are in the best interest of its operations, taking into consideration the different challenges and opportunities and different financial profiles and capital needs pertinent to its business. As separate companies, each will be able to independently prioritize the allocation of resources and capital in support of its business strategies. As a consolidated company, our projects had to be evaluated together with other investment opportunities within the Company. As separate companies, each of the Company and New B&W will no longer have to compete for investment capital with the other, and each will be in a position to better pursue a growth strategy to optimize its own operations. The two businesses will also be better able to compete through quicker decision making, more efficient deployment of capital and corporate resources and enhanced responsiveness to market demands. |
| • | Finally, the Company believes that the separation of the two businesses through the spin-off will allow each company to provide incentive compensation to its key employees in the form of equity-based incentive compensation that is more closely aligned with the performance of each business. By separating the two companies, management of each company should be in an improved position to attract employees with the correct skill set, to motivate them appropriately and to retain them for the long-term. |
Risks and Considerations Relating to the Spin Off: In determining whether to approve the spin-off, the Company’s board of directors also considered various risks and other considerations involved, including:
| • | potential increased costs for each company to operate as a separate stand-alone public company, including, among others, the costs to create separate accounting, legal, senior management and tax teams and other duplicated costs that we estimate could range from $14 million to $16 million of annual incremental costs for New B&W to replace services previously provided by the Company as well as other stand-alone costs; |
| • | potential loss of joint purchasing power; |
| • | potential disruptions to management’s attention and to the business as a result of the spin-off; |
-31-
Table of Contents
| • | tax limitations placed on New B&W as a result of the spin-off; |
| • | risks of being unable to achieve the benefits expected to be achieved by the spin-off; |
| • | the risk that the spin-off might not be completed; |
| • | costs of the spin-off, including the loss of certain synergies associated with being part of a larger organization that cannot be quantified; |
| • | the risk that the trading price of a share of Company common stock after the spin-off plus the trading price of the one share of New B&W common stock distributed for every two shares of Company common stock will, in the aggregate, be less than the trading price of a share of Company common stock before the spin-off; and |
| • | potential for higher borrowing costs. |
See “Risk Factors – Risks Relating to the Spin-Off” for additional information.
The factors discussed above as supporting the decision of the Company’s board of directors were determined to outweigh the countervailing risks and other considerations. The foregoing discussion of the reasons for the determination of the board to approve the spin-off is not meant to be exhaustive, but addresses the material factors considered by board. In view of the wide variety of factors considered by the board in connection with its evaluation of the spin-off and the complexity of these matters, the board did not find it practicable to, and did not, quantify or otherwise assign relative weights to the specific factors considered in reaching its determination and recommendation. Rather, the board made its determination and recommendation based on the totality of the information presented to it, and the judgment of individual members of the board may have been influenced to a greater or lesser degree by different factors.
Results of the Spin-Off
After the spin-off, we will be an independent public company. Immediately following the spin-off, we expect that approximately 53.7 million shares of our common stock will be issued and outstanding, based on the distribution of one share of our common stock for every two shares of Company common stock outstanding and the number of shares of Company common stock outstanding on June 18, 2015. The actual number of shares of our common stock to be distributed will be determined based on the number of shares of Company common stock outstanding as of the record date. We also expect to have approximately 2,200 stockholders of record, based on the number of stockholders of record of Company common stock on June 18, 2015.
We and the Company will be parties to a number of agreements that will govern the spin-off and our future relationship. For a more detailed description of these agreements, please see “Relationship with the Company After the Spin-Off—Agreements Between the Company and Us.”
Manner of Effecting the Spin-Off
The general terms and conditions relating to the spin-off will be set forth in a master separation agreement between the Company and us. For a description of the terms of that agreement, see “Relationship with the Company After the Spin-Off—Agreements Between the Company and Us—Master Separation Agreement.” Under the master separation agreement, the spin-off will be completed on the distribution date. As a result of the spin-off, each Company stockholder will be entitled to receive one share of our common stock for every two shares of Company common stock owned on the record date.
Market for Our Common Stock
There is currently no public market for our common stock. A condition to the spin-off is the listing on the NYSE of our common stock. We intend to list our common stock on the NYSE under the symbol “BW.” We anticipate that trading of our common stock will commence on a “when-issued” basis shortly before the record date. When-issued trading refers to a sale or purchase made conditionally because the security has been authorized but not yet issued. On the first trading day following the distribution date, when-issued trading with
-32-
Table of Contents
respect to our common stock will end and “regular way” trading will begin. Regular way trading refers to trading after a security has been issued and typically involves a transaction that settles on the third full business day following the date of the transaction. Neither we nor the Company can assure you as to the trading price of our common stock after the spin-off or as to whether the trading price of a share of Company common stock after the spin-off plus the trading price of the one share of our common stock distributed for every two shares of Company common stock will not, in the aggregate, be less than the trading price of a share of Company common stock before the spin-off. The trading price of our common stock is likely to fluctuate significantly, particularly until an orderly market develops. See “Risk Factors—Risks Relating to Ownership of Our Common Stock.” In addition, we cannot predict any change that may occur in the trading price of the Company’s common stock as a result of the spin-off.
Spin-Off Conditions and Termination
We expect that the spin-off will be completed on June 30, 2015, provided that, among other things:
| • | the Company’s board of directors will not have withdrawn its authorization and approval regarding (1) any transfer of assets and assumption of liabilities contemplated by the master separation agreement and any related agreement and (2) the distribution; |
| • | the Company’s board of directors will have declared the distribution of all of our outstanding shares of common stock to Company stockholders as of the record date who did not transfer their right to receive shares of our common stock in connection with the spin-off; |
| • | the SEC has declared effective our registration statement on Form 10 under the Exchange Act, with no stop order in effect with respect to the Form 10, and the related information statement shall have been mailed to the Company’s stockholders; |
| • | the actions and filings necessary under securities and blue sky laws of the states of the United States and any comparable laws under any foreign jurisdictions have been taken and become effective; |
| • | no order, injunction, decree or regulation issued by any court or agency of competent jurisdiction or other legal restraint or prohibition preventing the consummation of the spin-off is in effect; |
| • | our common stock has been approved for listing on the New York Stock Exchange, subject to official notice of issuance; |
| • | regulatory review by the Nuclear Regulatory Commission has been completed; |
| • | the Company has received an opinion from its tax counsel regarding the tax treatment of the spin-off as of the distribution date; |
| • | each of the ancillary agreements related to the spin-off shall have been entered into before the spin-off and shall not have been materially breached by any party thereto; and |
| • | no other events or developments have occurred that, in the judgment of the board of directors of the Company, in its sole and absolute discretion, would result in the spin-off having a material adverse effect on the Company or its stockholders. |
We and the Company received written confirmation from the Nuclear Regulatory Commission on March 17, 2015 that the spin-off and related steps constitute neither a direct nor indirect transfer of control of any Nuclear Regulatory Commission License. Consequently, other than administrative matters relating to name change amendments, which do not involve any consent process by the Nuclear Regulatory Commission, the Nuclear Regulatory Commission regulatory review has been completed. The Company may waive one or more of these conditions in its sole and absolute discretion, and the determination by the Company regarding the satisfaction of these conditions will be conclusive. The fulfillment of these conditions will not create any obligation on the Company’s part to effect the distribution, and the Company has reserved the right to amend, modify or abandon any and all terms of the distribution and the related transactions at any time prior to the distribution date. The Company is not aware of any circumstances under which the spin-off would be abandoned.
-33-
Table of Contents
The following table sets forth capitalization (1) on a historical basis as of March 31, 2015, and (2) on a pro forma basis to reflect the transfer of the assets and liabilities associated with the Company’s Nuclear Energy segment to the Company. This table should be read in conjunction with “Selected Historical Combined Financial Information,” “Management’s Discussion and Analysis of Financial Condition and Results of Operations,” and the combined financial statements and corresponding notes and the unaudited pro forma combined financial statements and corresponding notes included elsewhere in this prospectus.
| March 31, 2015 (in thousands) |
||||||||
| Historical | Pro Forma | |||||||
| Long-term debt (including current portion) |
$ | 3,219 | $ | 3,219 | ||||
| Stockholders’ equity |
||||||||
| Preferred stock, $0.01 par value; 20,000,000 shares authorized pro forma; no shares issued and outstanding pro forma |
— | — | ||||||
| Common stock, $0.01 par value; 200,000,000 shares authorized pro forma; 53,470,120 shares issued and outstanding pro forma |
— | 535(1) | ||||||
| Capital in excess of par value |
— | 644,490(2) | ||||||
| Parent/stockholder equity |
672,432 | — | ||||||
|
|
|
|
|
|||||
| Total capitalization |
$ | 675,651 | $ | 648,744 | ||||
|
|
|
|
|
|||||
| (1) | Represents the expected distribution of approximately 53.5 million shares of our common stock to holders of Company common stock based on the number of shares of Company common stock outstanding on March 31, 2015. |
| (2) | Represents parent/stockholder equity excluding the Nuclear Energy segment. Prior to the distribution, the assets and liabilities associated with New B&W’s Nuclear Energy segment will be transferred to the Company. See the unaudited pro forma combined balance sheets and corresponding notes included elsewhere in this prospectus for additional information regarding the assumptions and estimates used in the pro forma adjustments. |
-34-
Table of Contents
We do not currently plan to pay a regular dividend on our common stock following the spin-off. The declaration of any future cash dividends and, if declared, the amount of any such dividends, will be subject to our financial condition, earnings, capital requirements, financial covenants and other contractual restrictions and to the discretion of our board of directors. Our board of directors may take into account such matters as general business conditions, industry practice, our financial condition and performance, our future prospects, our cash needs and capital investment plans, income tax consequences, applicable law and such other factors as our board of directors may deem relevant.
-35-
Table of Contents
Any proceeds received by us from the exercise of stock options covered by the 2015 Plan will be used for general corporate purposes. These proceeds represent the exercise prices for the stock options.
-36-
Table of Contents
SELECTED HISTORICAL COMBINED FINANCIAL INFORMATION
The following table presents selected historical combined financial information. We derived the historical condensed combined statements of operations for the three months ended March 31, 2015 and 2014, and the balance sheet information as of March 31, 2015, from our unaudited condensed combined financial statements included in this prospectus. We derived the statement of operations information for each of the years ended December 31, 2014, 2013 and 2012 and the balance sheet information as of December 31, 2014 and 2013 from the audited combined financial statements included in this prospectus and the balance sheet information as of March 31, 2014 and December 31, 2012 from the unaudited combined financial statements not included in this prospectus. We derived the statement of operations and balance sheet information for the years ended December 31, 2011 and 2010 from the unaudited combined financial statements not included in this prospectus. The selected historical combined financial information does not reflect the transfer of assets and liabilities associated with the Company’s Nuclear Energy segment to the Company in connection with the spin-off. See “Summary Historical and Unaudited Pro Forma Combined Financial Information.”
You should read the selected historical combined financial information in conjunction with the “Summary Historical and Unaudited Pro Forma Combined Financial Information,” the combined financial statements and the accompanying notes, the unaudited pro forma combined financial statements and the accompanying notes, and “Management’s Discussion and Analysis of Financial Condition and Results of Operations” included in this prospectus. The financial information may not be indicative of our future performance and does not necessarily reflect what our financial position and results of operations would have been had we operated as an independent public company during the periods presented.
| Three Months Ended March 31, |
Year Ended December 31, |
|||||||||||||||||||||||||||
| 2015 | 2014 | 2014 | 2013 | 2012 | 2011 | 2010 | ||||||||||||||||||||||
| Statement of Operations Information: |
(in thousands) | |||||||||||||||||||||||||||
| Revenues |
$ | 419,842 | $ | 347,892 | $ | 1,589,719 | $ | 1,921,163 | $ | 2,039,100 | $ | 1,785,274 | $ | 1,599,841 | ||||||||||||||
| Costs and expenses |
398,692 | 339,681 | 1,655,915 | 1,684,376 | 1,850,616 | 1,714,769 | 1,483,638 | |||||||||||||||||||||
| Equity in income of investees |
(2,071 | ) | 2,366 | 8,681 | 18,387 | 17,402 | 24,616 | 31,949 | ||||||||||||||||||||
| Operating income (loss) |
19,079 | 10,577 | (57,515) | 255,174 | 205,886 | 95,121 | 148,152 | |||||||||||||||||||||
| Other income (expense) |
(416 | ) | 1,832 | 1,823 | 1,847 | (669) | 414 | (20,667) | ||||||||||||||||||||
| Income (loss) before provision for (benefit from) income taxes |
18,663 | 12,409 | (55,692) | 257,021 | 205,217 | 95,535 | 127,485 | |||||||||||||||||||||
| Provision for (benefit from) income taxes |
5,921 | 1,204 | (29,528) | 82,206 | 64,323 | 36,577 | 44,414 | |||||||||||||||||||||
| Net income (loss) attributable to The Power Generation Operations of The Babcock & Wilcox Company |
$ | 12,690 | $ | 11,089 | $ | (26,529) | $ | 174,526 | $ | 140,753 | $ | 58,732 | $ | 82,894 | ||||||||||||||
| Non-GAAP Data: |
||||||||||||||||||||||||||||
| Adjusted net income attributable to The Power Generation Operations of The Babcock & Wilcox Company (1) |
$ | 14,220 | $ | 12,015 | $ | 64,851 | $ | 116,620 | $ | 149,851 | $ | 138,605 | $ | 125,282 | ||||||||||||||
| Other Data: |
||||||||||||||||||||||||||||
| Depreciation and amortization |
$ | 13,075 | $ | 6,739 | $ | 36,454 | $ | 29,726 | $ | 23,857 | $ | 21,115 | $ | 23,865 | ||||||||||||||
| Capital expenditures |
6,221 | 3,202 | 17,204 | 16,563 | 25,074 | 15,427 | 13,770 | |||||||||||||||||||||
| Balance Sheet Information: |
||||||||||||||||||||||||||||
| Working capital |
$ | 355,692 | $ | 298,841 | $ | 366,604 | $ | 231,275 | $ | 115,045 | $ | 397,678 | $ | 274,982 | ||||||||||||||
| Total assets |
1,493,297 | 1,280,220 | 1,522,806 | 1,296,469 | 1,419,651 | 1,656,990 | 1,449,754 | |||||||||||||||||||||
| Notes payable and current maturities of long-term debt |
3,219 | 5,083 | 3,215 | 4,671 | 4,062 | 4,653 | 4,791 | |||||||||||||||||||||
| Long-term debt |
- | - | - | 225 | 430 | 633 | 855 | |||||||||||||||||||||
| Other Data: |
||||||||||||||||||||||||||||
| Backlog |
$ | 2,786,639 | $ | 2,114,850 | $ | 2,480,177 | $ | 2,173,350 | $ | 2,680,292 | $ | 2,248,080 | $ | 1,925,200 | ||||||||||||||
-37-
Table of Contents
(1) Adjusted net income and adjusted diluted earnings per common share are defined as net income and diluted earnings per common share adjusted to exclude actuarial gains and losses on pension and post-retirement plans and special charges for restructuring activities. We present adjusted net income and adjusted diluted earnings per common share, which are not prepared in accordance with GAAP, because we believe they provide meaningful insight into operational performance. Additionally, we believe that when considered together with the GAAP results and the reconciliation to net income and diluted earnings per common share, these non-GAAP measures provide a more complete understanding of our business than could be obtained absent this disclosure. We use adjusted net income and adjusted diluted earnings per common share, together with financial measures prepared in accordance with GAAP, such as net income and diluted earnings per common share, to assess our historical and prospective operating performance and to enhance our understanding of our core operating performance. Additionally, we are presenting these measures because we believe they are useful in (a) helping investors facilitate comparisons of our operating results with prior periods and (b) assisting investors in understanding our ongoing operations and our operating performance. We are providing these non-GAAP measures to supplement the results provided in accordance with GAAP and they should not be considered superior to, or as substitutes for, the comparable GAAP results.
The following table provides a reconciliation of net income to adjusted net income:
| Three Months Ended March 31, |
Year Ended December 31, |
|||||||||||||||||||||||||||
| 2015 | 2014 | 2014 | 2013 | 2012 | 2011 | 2010 | ||||||||||||||||||||||
| (in thousands) | (in thousands) | |||||||||||||||||||||||||||
| Net income (loss) attributable to The Power Generation Operations of The Babcock & Wilcox Company |
$ | 12,690 | $ | 11,089 | $ | (26,529 | ) | $ | 174,526 | $ | 140,753 | $ | 58,732 | $ | 82,894 | |||||||||||||
| Actuarial (gains) losses on our pension and post-retirement plans |
- | - | 71,121 | (76,064) | 9,098 | 79,873 | 42,388 | |||||||||||||||||||||
| Special charges for restructuring activities |
1,530 | 926 | 20,259 | 18,158 | - | - | - | |||||||||||||||||||||
| Adjusted net income attributable to The Power Generation Operations of The Babcock & Wilcox Company |
$ | 14,220 | $ | 12,015 | $ | 64,851 | $ | 116,620 | $ | 149,851 | $ | 138,605 | $ | 125,282 | ||||||||||||||
-38-
Table of Contents
MANAGEMENT’S DISCUSSION AND ANALYSIS OF
FINANCIAL CONDITION AND RESULTS OF OPERATIONS
The following discussion and analysis of our financial condition and results of operations should be read in conjunction with “Selected Historical Combined Financial Information,” and the historical and pro forma financial statements and accompanying notes appearing in this prospectus. This discussion and analysis presents the results of operations of the primary operating subsidiary of our Power Generation business, Babcock & Wilcox Power Generation Group, Inc. (“PGG OpCo”), and its subsidiaries, combined with related captive insurance operations and the subsidiaries associated with the Company’s Nuclear Energy segment that will be transferred to the Company before the spin-off. This discussion and analysis contains forward-looking statements that involve risks and uncertainties. Actual results may differ materially from those anticipated in these forward-looking statements as a result of certain factors, including those set forth under “Risk Factors” and elsewhere in this prospectus. See “Cautionary Statement Concerning Forward-Looking Information.” Unless the context requires otherwise or we specifically indicate otherwise, when used in this Management’s Discussion and Analysis of Financial Condition and Results of Operations, the terms “New B&W,” “we,” “our,” “ours” and “us” refer to Babcock & Wilcox Enterprises, Inc. and its subsidiaries as of the distribution date.
Spin-off
On November 5, 2014, the Company announced that its board of directors approved a plan to separate its Power Generation business from the Company, creating a newly independent, publicly traded company. The spin-off is expected to be tax-free to both the Company and our stockholders. We expect the spin-off to be completed by mid-summer 2015, provided that the conditions set forth under the caption “The Spin-Off–Spin-Off Conditions and Termination” have been satisfied in the Company’s sole and absolute discretion.
We are currently a wholly owned subsidiary of the Company. Prior to the spin-off, PGG OpCo will transfer the assets and liabilities associated with the Company’s Nuclear Energy segment to the Company. In connection with the spin-off, the Company will transfer to us all the assets and generally all the liabilities relating to the Company’s Power Generation business. Company stockholders will not be required to pay for shares of our common stock received in the spin-off or to surrender or exchange shares of common stock of the Company in order to receive shares of our common stock or to take any other action in connection with the spin-off.
General
We are a leading technology-based provider of advanced fossil and renewable power generation equipment that includes a broad suite of boiler products and environmental systems and related services for power and industrial uses. We specialize in engineering, manufacturing, procurement, and erection of equipment and technology used in the power generation industry and various other industries, and the provision of related services. Our overall activity depends significantly on the capital expenditures and operations and maintenance expenditures of global electric power generating companies, other steam-using industries and industrial facilities with environmental compliance needs.
Our strategy is to continue to seek opportunities to optimize our profitability within all our markets through an operating model that is designed to be strategically efficient and cost competitive; to expand international offerings through increased marketing and operational presence in regions around the world where we expect continued demand growth and increased need for services; and to seek partnering arrangements and acquisitions to expand our market presence and capabilities. On June 20, 2014, we completed the acquisition of MEGTEC Holdings, Inc. (“MEGTEC”). MEGTEC designs, engineers, manufactures and services air pollution control systems and coating / drying equipment for a variety of industrial applications and is expected to complement our existing environmental products and solutions offerings. MEGTEC comprises our Industrial Environmental segment.
Following the spin-off, we will operate in three reportable segments: Global Power, Global Services and Industrial Environmental. The historical audited financial statements currently have a fourth segment, Nuclear Energy, which will be distributed to the Company before the spin-off.
Overview – Global Power
Our Global Power segment represents our worldwide new build boiler and environmental products businesses. Through this segment, we engineer, manufacture, procure, construct and commission steam
-39-
Table of Contents
generating and environmental systems and other related equipment. Our boilers are designed for utility and industrial applications, fired with fossil and renewable fuels and include advanced supercritical boilers, subcritical boilers, fluidized bed boilers, biomass-fired boilers, waste-to-energy boilers, chemical recovery boilers, industrial power boilers, package boilers, heat recovery steam generators, waste heat boilers and solar thermal power systems. Our environmental systems offer air pollution control products and related equipment for the treatment of nitrogen oxides, sulfur dioxide, fine particulate, mercury, acid gases and other hazardous air emissions and include wet and dry flue gas desulfurization systems, catalytic and non-catalytic nitrogen oxides reduction systems, low nitrogen oxides burners and overfire air systems, fabric filter baghouses, wet and dry electrostatic precipitators, mercury control systems and dry sorbent injection for acid gas mitigation. Our customers consist of a wide range of utilities, independent power producers and industrial companies globally. This segment’s activity is dependent on the capital expenditures and operations and maintenance expenditures of global electric power generating companies and other steam-using industries with environmental compliance needs.
We see opportunities for growth in revenues in this segment relating to a variety of factors including the following:
| • | emerging international markets needing state-of-the-art technology for fossil power generation and environmental systems; |
| • | a global need for renewable and carbon neutral power applications requiring steam generation and environmental control technologies to enable beneficial use of municipal waste and biomass; |
| • | industrial products such as heat recovery and steam generators, and natural gas and oil fired package boilers due to lower fuel prices; and |
| • | increasing environmental regulation. |
Globally, efforts to reduce the environmental impact of burning fossil fuels may create opportunities for us as existing generating capacity is replaced with cleaner technologies. We are actively researching, developing and deploying a range of products to serve this opportunity, including lower-carbon technologies that enable clean use of fossil fuels, such as ultra-supercritical boilers; carbon-neutral technologies, such as biomass-fueled boilers and gasifiers; gas-fired package boiler technologies; and select carbon dioxide capture technologies.
For the three months ended March 31, 2015, we generated revenues of $123.9 million in this segment. Revenues were approximately 12.3% higher than the $110.3 million generated for the three months ended March 31, 2014 as a result of higher new build steam generation systems revenues primarily related to recently awarded large boiler projects. For the year ended December 31, 2014, we generated revenues of $471.9 million in this segment. Revenues were substantially lower than the $712.5 million generated for the year ended December 31, 2013 as projects related to the previously enacted environmental rules and regulations neared completion. We expect the growth in backlog since December 31, 2014, which relates primarily to recent international coal boiler and renewable bookings, will provide revenue growth in this segment.
Overview – Global Services
Our Global Services segment provides a comprehensive mix of aftermarket products and services to support peak efficiency and availability of steam generating and associated environmental and auxiliary equipment for power generation. Our products and services include replacement parts, field technical services, retrofit and upgrade projects, fuel switching and repowering projects, construction and maintenance services, start-up and commissioning, training programs and plant operations and maintenance for our full complement of boiler, environmental and auxiliary equipment. We deliver these aftermarket products and services to a large installed base for our and our competitors’ power generation and industrial plants globally through our extensive network of regionally located service centers, technical support personnel, and global sourcing capabilities. Our customers consist of a wide range of utilities, independent power producers and industrial companies globally. This segment’s activity is dependent on the demand for electricity and ultimately the capacity utilization and associated operations and maintenance expenditures of power generating companies and other steam-using industries.
-40-
Table of Contents
We see opportunities for growth and margin expansion in this segment relating to a variety of factors including the following:
| • | repositioning our infrastructure to meet the substantial recurring aftermarket products and services opportunity with a strategically efficient and cost competitive operating model; |
| • | continued customer investment in their existing power plants, particularly in North America, to enhance utilization and operating efficiency levels, improve reliability and extend the useful life of their existing plants; |
| • | leveraging our relationship network of strategic partners, particularly in North America, to expand our market opportunity to supply aftermarket parts and services to installed units delivered by other original equipment suppliers; and |
| • | targeted repositioning of our global sales network in strategic countries to serve the aftermarket refurbishment and maintenance of existing facilities outside North America. |
For the three months ended March 31, 2015, we generated revenues of $232.2 million in this segment which is an increase of approximately 15.1% when compared to the same period in 2014. For the year ended December 31, 2014, we generated revenues of $908.7 million in this segment. We expect that our large installed base of power generation equipment will provide a solid foundation for a recurring revenue stream.
Overview – Industrial Environmental
Our Industrial Environmental segment provides environmental products and services to numerous industrial end markets through MEGTEC, which the Company acquired on June 20, 2014. Through this segment, we design, engineer and manufacture products including oxidizers, solvent and distillation systems, wet electrostatic precipitators, scrubbers and heat recovery systems. The segment also provides specialized industrial process systems, coating lines and equipment. Our suite of technologies for pollution abatement include systems that control volatile organic compounds and air toxics, particulate, nitrogen oxides and acid gas air emissions from industrial processes. We serve a diverse set of industrial end markets with a current emphasis on the chemical, pharmaceutical, energy storage, packaging, and automotive markets. This segment’s activity is dependent primarily on the capacity utilization of operating industrial plants and an increased emphasis on environmental emissions globally across a broad range of industries and markets.
We see opportunities for growth in revenues in this segment relating to a variety of factors. Our new equipment customers purchase equipment as part of major capacity expansions, to replace existing equipment, or in response to regulatory initiatives. Additionally, our significant installed base provides a consistent and recurring aftermarket stream of parts, retrofits and services. Economic recovery, particularly in the United States, as well as major investments in global chemical markets have strengthened demand for MEGTEC equipment, while tightening environmental regulations in China, India and developing countries are creating new opportunities. We foresee long-term trends toward increased environmental controls for industrial manufacturers around the world. Finally, we will continue to seek acquisitions to expand our market presence and technology offerings.
For the three months ended March 31, 2015, the MEGTEC acquisition, which was completed on June 20, 2014, generated revenues of $41.1 million in this segment. For the year ended December 31, 2014, the MEGTEC acquisition generated revenues of $105.4 million in this segment. We foresee long-term growth trends toward increased environmental controls for industrial manufacturers around the world which will benefit this segment.
Overview – Nuclear Energy
This segment will not be part of our continuing operations as we will transfer the assets and liabilities associated with this segment to the Company in connection with the spin-off. The Nuclear Energy segment supplies commercial nuclear steam generators and components to nuclear utility customers. This segment has supplied the nuclear industry with more than 1,300 large, heavy components worldwide. This segment is the only heavy nuclear component, N-Stamp certified manufacturer in North America. The Nuclear Energy segment
-41-
Table of Contents
fabricates pressure vessels, reactors, steam generators, heat exchangers and other auxiliary equipment. This segment also provides specialized engineering services that include structural component design, 3-D thermal-hydraulic engineering analysis, weld and robotic process development and metallurgy and materials engineering. In addition, this segment offers services for nuclear steam generators and balance of plant equipment, as well as nondestructive examination and tooling/repair solutions for other plant systems and components.
For the three months ended March 31, 2015, we generated revenues of $22.7 million in this segment. Revenues decreased from the $35.8 million generated during the three months ended March 31, 2014. The decrease primarily relates to the timing of maintenance outages in the Canadian nuclear market and lower volume in the nuclear equipment business. For the year ended December 31, 2014, we generated revenues of $103.7 million in this segment. Revenues decreased substantially from the $153.5 million and $253.1 million generated for the years ended December 31, 2013 and 2012, respectively. The 2014 decrease primarily relates to the completion of a replacement steam generator contract that contributed substantially to revenues in 2013 and 2012. We expect revenues for this segment in the near future to be largely driven by nuclear services outage and inspection projects.
Global Competitiveness Initiative and Other Restructuring Activities
Prior to contemplating the spin-off, the Company launched the Global Competitiveness Initiative (“GCI”) in the third quarter of 2012 to enhance competitiveness, better position the Company for growth, and improve profitability. A wide range of cost reduction activities were identified, including operational and functional efficiency improvements, organizational design changes and manufacturing optimization, many of which focused on New B&W. Savings from these initiatives have been phased in since 2012, and once fully executed, the Company expects annual savings to total at least $75 million, with approximately two thirds attributable to New B&W. The majority of the expected annual savings are from efficiency improvements that were completed in 2013 and 2014. The balance of the cost savings relates to manufacturing initiatives that are expected to be completed in 2015. In order to achieve these savings, we expect to incur total restructuring charges (cash and non-cash) of approximately $45 to $50 million. We incurred $0.0 million and $1.5 million of costs associated with GCI for the three months ended March 31, 2015 and 2014, respectively. We incurred $3.3 million and $26.3 million of costs associated with GCI for the years ended December 31, 2014 and 2013, respectively.
We are also targeting additional structural change initiatives that we expect, in conjunction with our GCI initiatives, to drive further margin improvement in our Global Power, Global Services and Nuclear Energy segments. We expect to incur total restructuring charges (cash and noncash), as well as produce annual savings once these additional initiatives are fully implemented, in the range of $35 million to $50 million. We incurred $2.4 million and $0.0 million of costs associated with these additional initiatives for the three months ended March 31, 2015 and 2014, respectively. We incurred $26.7 million of costs associated with these additional initiatives for the year ended December 31, 2014.
The cost savings from these programs are expected to make our offerings more cost-competitive through both direct and overhead cost reductions, allowing us to more aggressively pursue new business opportunities and other initiatives to increase stockholder value.
CRITICAL ACCOUNTING POLICIES AND ESTIMATES
The financial statements and accompanying notes are prepared in accordance with accounting principles generally accepted in the United States. Preparing financial statements requires management to make estimates and assumptions that affect the reported amounts of assets, liabilities, revenues and expenses. These estimates and assumptions are affected by management’s application of accounting policies. We believe the following are our most critical accounting policies that we apply in the preparation of our financial statements. These policies require our most difficult, subjective and complex judgments, often as a result of the need to make estimates of matters that are inherently uncertain.
Contracts and Revenue Recognition. We determine the appropriate accounting method for each of our long-term contracts before work on the project begins. We generally recognize contract revenues and related costs on a percentage-of-completion method for individual contracts or combinations of contracts based on a cost-to-cost method, as applicable to the product or activity involved. We recognize estimated contract revenue and resulting income based on costs incurred to date as a percentage of total estimated costs. Certain costs may be
-42-
Table of Contents
excluded from the cost-to-cost method of measuring progress, such as significant costs for materials and major third-party subcontractors, if it appears that such exclusion would result in a more meaningful measurement of actual contract progress and resulting periodic allocation of income. For all contracts, if a current estimate of total contract cost indicates a loss on a contract, the projected loss is recognized in full when determined. It is possible that current estimates could materially change for various reasons, including, but not limited to, fluctuations in forecasted labor productivity or steel and other raw material prices. We routinely review estimates related to our contracts, and revisions to profitability are reflected in the quarterly and annual earnings we report. In the three months ended March 31, 2015 and 2014, we recognized net changes in estimates related to long-term contracts accounted for on the percentage-of-completion basis, which increased operating income by approximately $4.1 million and $1.7 million, respectively. In the years ended December 31, 2014, 2013 and 2012, we recognized net favorable changes in estimate related to long-term contracts accounted for on the percentage-of-completion basis that increased operating income by approximately $36.4 million, $4.3 million and $64.0 million, respectively. The 2014, 2013 and 2012 amounts include contract losses totaling $11.6 million, $35.6 million and $16.9 million, respectively, for additional estimated costs to complete our Berlin Station project. Of these amounts, $0.0 million and $7.6 million were recognized in the first quarter of 2015 and 2014, respectively. This project is a 75 MW biomass boiler project in Berlin, New Hampshire that experienced schedule delays and related cost overruns. The customer certified that we achieved substantial completion on the project effective July 19, 2014. See Note 10 to the audited combined financial statements for legal proceedings associated with this matter. The 2012 amount also includes $13.8 million of project improvements on a new build capital project in our Global Power segment due to better than expected performance.
For parts orders and certain aftermarket services activities, we recognize revenues as goods are delivered and work is performed.
Although we continually strive to improve our ability to estimate our contract costs and profitability, adjustments to overall contract costs due to unforeseen events could be significant in future periods. We recognize claims for extra work or for changes in scope of work in contract revenues, to the extent of costs incurred, when we believe collection is probable and can be reasonably estimated. We recognize income from contract change orders or claims when formally agreed with the customer. We regularly assess the collectability of contract revenues and receivables from customers.
Property, Plant and Equipment. We carry our property, plant and equipment at depreciated cost, reduced by provisions to recognize economic impairment when we determine impairment has occurred. Property, plant and equipment amounts are reviewed for impairment whenever events or changes in circumstances indicate that the carrying amount of an asset, or asset group, may not be recoverable. An impairment loss would be recognized when the carrying amount of an asset exceeds the estimated undiscounted future cash flows expected to result from the use of the asset and its eventual disposition. The amount of the impairment loss to be recorded is calculated by the excess of the asset carrying value over its fair value. Fair value is generally determined using a discounted cash flow analysis. Our estimates of cash flow may differ from actual cash flow due to, among other things, technological changes, economic conditions or changes in operating performance. Any changes in such factors may negatively affect our business and result in future asset impairments.
We depreciate our property, plant and equipment using the straight-line method over estimated economic useful lives, which typically range from three to twelve years for machinery and equipment and up to forty years for buildings. We expense the costs of maintenance, repairs and renewals, which do not materially prolong the useful life of an asset, as we incur them.
Investments in Unconsolidated Affiliates. We use the equity method of accounting for affiliates in which our investment ownership ranges from 20% to 50%, unless significant economic or governance considerations indicate that we are unable to exert significant influence, in which case the cost method is used. The equity method is also used for affiliates in which our investment ownership is greater than 50% but we do not have a controlling interest. Currently, all of our material investments in affiliates that are not included in our combined results are recorded using the equity method. Affiliates in which our investment ownership is less than 20% and where we are unable to exert significant influence are carried at cost.
Self-Insurance. Prior to the spin-off, coverage has been provided from a wholly owned insurance subsidiary of the Company that provides employer’s liability, general and automotive liability and workers’ compensation insurance and, from time to time, builder’s risk insurance within certain limits to us. After the
-43-
Table of Contents
completion of the spin-off, we will obtain similar coverage from a wholly owned insurance subsidiary of New B&W. We may also have business reasons in the future to self-insure other risks that we cannot or do not wish to transfer to outside insurance companies. When estimating our self-insurance liabilities, we consider a number of factors, including historical claims experience and trend lines, projected growth patterns, inflation and exposure forecasts. The assumptions we make with respect to each of these factors represent our judgment as to the most probable cumulative impact of each factor on our future obligations. Our calculation of self-insurance liabilities requires us to apply judgment to estimate the ultimate cost to settle reported claims and claims incurred but not yet reported as of the balance sheet date. We engage the services of an actuarial firm to assist us in the calculation of our liabilities for self-insurance. While the actual outcome of insured claims could differ significantly from estimated amounts, these loss estimates and accruals recorded in our financial statements for claims have historically been reasonable in light of the actual amount of claims paid. Provisions for exposure to self-insurance claims and the related payments of claims have historically not had a material adverse impact on our combined financial position, results of operations and cash flows, and we do not expect these provisions to have a material impact on our self-insurance programs in the future.
Pension Plans and Postretirement Benefits. We utilize actuarial and other assumptions in calculating the cost and benefit obligations of our pension and postretirement benefits. The assumptions utilized in the determination of our benefit cost and obligations include assumptions regarding discount rates, expected returns on plan assets, mortality and health care cost trends. The assumptions utilized represent our best estimates based on historical experience and other factors.
Actual experience that differs from these assumptions or future changes in assumptions will affect our recognized benefit obligations and related costs. We immediately recognize net actuarial gains and losses into earnings in the fourth quarter of each year, or as interim remeasurements are required, as a component of net periodic benefit cost. Net actuarial gains and losses occur when actual experience differs from any of the various assumptions used to value our pension and postretirement benefit plans or when assumptions, which are revisited annually through our update of our actuarial valuations, change due to current market conditions or underlying demographic changes. The primary factors contributing to net actuarial gains and losses are changes in the discount rate used to value the obligations as of the measurement date each year, the difference between the actual return on plan assets and the expected return on plan assets and changes in health care cost trends. The effect of changes in the discount rate and expected rate of return on plan assets in combination with the actual return on plan assets can result in significant changes in our estimated pension and postretirement benefit cost and our combined financial condition. Additionally, in 2014, we adjusted our mortality assumption to reflect mortality improvements identified by the Society of Actuaries, adjusted for our experience. The impact of the change in this assumption caused a $46.9 million increase in our pension liability.
The following sensitivity analysis shows the impact of a 25 basis point change in the assumed discount rate, return on assets, and health care cost trend rate on our pension and postretirement benefit plan obligations and expense for the year ended December 31, 2014:
| .25% Increase | .25% Decrease | |||||||
| Pension Plans | (in millions) | |||||||
| Discount Rate: |
||||||||
| Effect on ongoing net periodic benefit cost (1) |
$ | 0.6 | $ | (0.6) | ||||
| Effect on project benefit obligation |
(43.6) | 46.0 | ||||||
| Return on Assets: |
||||||||
| Effect on ongoing net periodic benefit cost |
$ | (2.8) | $ | 2.8 | ||||
| Postretirement Plans |
||||||||
| Discount Rate: |
||||||||
| Effect on ongoing net periodic benefit cost (1) |
$ | - | $ | - | ||||
| Effect on project benefit obligation |
(0.4) | 0.4 | ||||||
| Health Care Cost Trend Rate: |
||||||||
| Effect on ongoing net periodic benefit cost |
$ | - | $ | - | ||||
| Effect on project benefit obligation |
- | - | ||||||
| (1) | Excludes effect of annual mark-to-market adjustment. |
Loss Contingencies. We estimate liabilities for loss contingencies when it is probable that a liability has been incurred and the amount of loss is reasonably estimable. We provide disclosure when there is a reasonable
-44-
Table of Contents
possibility that the ultimate loss will exceed the recorded provision or if such probable loss is not reasonably estimable. We are currently involved in some significant litigation. See Note 10 to the audited combined financial statements included in this prospectus for a discussion of this litigation. We have accrued our estimates of the probable losses associated with these matters. However, our losses are typically resolved over long periods of time and are often difficult to estimate due to the possibility of multiple actions by third parties. Therefore, it is possible that future earnings could be affected by changes in our estimates related to these matters.
Goodwill. Each year, we evaluate goodwill at each reporting unit to assess recoverability, and impairments, if any, are recognized in earnings. We perform a qualitative analysis when we believe that there is sufficient excess fair value over carrying value based on our most recent quantitative assessment, adjusted for relevant facts and circumstances that could affect fair value. Deterioration in macroeconomic, industry and market conditions, cost factors, overall financial performance, share price decline or entity and reporting unit specific events could cause us to believe a qualitative test is no longer appropriate.
When we determine that it is appropriate to test goodwill for impairment utilizing a quantitative test, the first step of the test compares the fair value of a reporting unit to its carrying amount, including goodwill. We utilize both the income and market valuation approaches to provide inputs into the estimate of the fair value of our reporting units, which would be considered by market participants.
Under the income valuation approach, we employ a discounted cash flow model to estimate the fair value of each reporting unit. This model requires the use of significant estimates and assumptions regarding future revenues, costs, margins, capital expenditures, changes in working capital, terminal year growth rate and cost of capital. Our cash flow models are based on our forecasted results for the applicable reporting units. Actual results could differ materially from our projections. Some assumptions, such as future revenues, costs and changes in working capital are company driven and could be affected by a loss of one or more significant contracts or customers; failure to control costs on certain contracts; or a decline in demand based on changing economic, industry or regulatory conditions. Changes in external market conditions may affect certain other assumptions, such as the cost of capital. Market conditions can be volatile and are outside of our control.
Under the market valuation approach, we employ the guideline publicly traded company method, which indicates the fair value of the equity of each reporting unit by comparing it to publicly traded companies in similar lines of business. After identifying and selecting guideline companies, we analyze their business and financial profiles for relative similarity. Factors such as size, growth, risk and profitability are analyzed and compared to each of our reporting units. Assumptions include the selection of our peer companies and use of market multiples, which could deteriorate or increase based on the profitability of our competitors and performance of their stock, which is often dependent on the performance of the stock market and general economy as a whole.
Adverse changes in these assumptions utilized within the first step of our impairment test could cause a reduction or elimination of excess fair value over carrying value, resulting in potential recognition of impairment. If the carrying amount of a reporting unit exceeds its fair value, the second step of the goodwill impairment test is performed to measure the amount of the impairment loss, if any. The second step compares the implied fair value of the reporting unit’s goodwill with the carrying amount of that goodwill.
We completed our annual review of goodwill for each of our reporting units for the year ended December 31, 2014, which indicated that we had no impairment of goodwill. The fair value of our reporting units was substantially in excess of carrying value.
Income Taxes. Income tax expense for federal, foreign, state and local income taxes is calculated on pre-tax income based on current tax law and includes the cumulative effect of any changes in tax rates from those used previously in determining deferred tax assets and liabilities. We are included in the U.S. federal and certain state tax returns filed by the Company. We compute the provision for such income taxes on a separate tax return basis as if we filed our own tax returns. We deem the amounts that we would have paid or received from the Internal Revenue Service and certain state jurisdictions had we not been a member of the Company’s consolidated tax group to be immediately settled with the Company. We record a valuation allowance to reduce our deferred tax assets to the amount that is more likely than not to be realized. We assess deferred taxes and the adequacy of the valuation allowance on a quarterly basis. In the ordinary course of business there is inherent uncertainty in quantifying our income tax positions. We assess our income tax positions and record tax benefits for all years subject to examination based upon management’s evaluation of the facts, circumstances, and information available at the reporting date. For those tax positions where it is more likely than not that a tax benefit will be
-45-
Table of Contents
sustained, we have recorded the largest amount of tax benefit with a greater than 50% likelihood of being realized upon ultimate settlement with a taxing authority that has full knowledge of all relevant information. For those income tax positions where it is not more likely than not that a tax benefit will be sustained, no tax benefit has been recognized in the financial statements. We record interest and penalties (net of any applicable tax benefit) related to income taxes as a component of provision for income taxes on our combined statements of operations.
Warranty. We accrue estimated expense included in cost of operations on our combined statements of operations to satisfy contractual warranty requirements when we recognize the associated revenue on the related contracts. In addition, we record specific provisions or reductions when we expect the actual warranty costs to significantly differ from the accrued estimates. Factors that impact our estimate of warranty costs include prior history of warranty claims and our estimates of future costs of materials and labor. Such changes could have a material effect on our combined financial condition, results of operations and cash flows.
Stock-Based Compensation. We account for stock-based compensation in accordance with FASB Topic Compensation – Stock Compensation. Under the fair value recognition provisions of this statement, the cost of employee services received in exchange for an award of equity instruments is measured at the grant date based on the fair value of the award. Stock-based compensation expense is recognized on a straight-line basis over the requisite service periods of the awards, which is generally equivalent to the vesting term. We use a Black-Scholes model to determine the fair value of certain share-based awards, such as stock options. For performance shares or units granted in the year ended December 31, 2014 that contain a Relative Total Shareholder Return vesting criteria, we utilize a Monte-Carlo simulation to determine the grant date fair value, which determines the probability of satisfying the market condition included in the award. The determination of the fair value of a share-based payment award using an option-pricing model requires the input of highly subjective assumptions, such as the expected life of the award and stock price volatility.
Business Combinations. We account for acquisitions in accordance with FASB Topic Business Combinations. This topic broadens the fair value measurements and recognition of assets acquired, liabilities assumed and interests transferred as a result of business combinations. It also provides disclosure requirements to assist users of the financial statements in evaluating the nature and financial effects of business combinations.
RESULTS OF OPERATIONS – THREE MONTHS ENDED MARCH 31, 2015 VS. THREE MONTHS ENDED MARCH 31, 2014
Selected financial highlights are presented in the table below:
| Three Months Ended March 31, |
||||||||||||
| 2015 | 2014 | $ change | ||||||||||
| Unaudited (In thousands) |
||||||||||||
| REVENUES: |
||||||||||||
| Global Power |
$ | 123,886 | $ | 110,292 | $ | 13,594 | ||||||
| Global Services |
232,174 | 201,786 | 30,388 | |||||||||
| Industrial Environmental |
41,095 | - | 41,095 | |||||||||
| Nuclear Energy |
22,687 | 35,814 | (13,127 | ) | ||||||||
|
|
||||||||||||
| $ | 419,842 | $ | 347,892 | $ | 71,950 | |||||||
|
|
||||||||||||
| Gross Profit: |
||||||||||||
| Global Power |
$ | 20,428 | $ | 15,247 | $ | 5,181 | ||||||
| Global Services |
53,287 | 41,604 | 11,683 | |||||||||
| Industrial Environmental |
9,681 | - | 9,681 | |||||||||
| Nuclear Energy |
4,377 | 9,155 | (4,778 | ) | ||||||||
|
|
||||||||||||
| $ | 87,773 | $ | 66,006 | $ | 21,767 | |||||||
|
|
||||||||||||
| Selling, General and Administrative |
(59,524 | ) | (52,215 | ) | (7,309 | ) | ||||||
| Research and Development |
(4,638 | ) | (4,102 | ) | (536 | ) | ||||||
| Losses on Asset Disposal and Impairments, net |
(15 | ) | - | (15 | ) | |||||||
| Equity in Income (Loss) of Investees |
(2,071 | ) | 2,366 | (4,437 | ) | |||||||
| Special Charges for Restructuring Activities |
(2,446 | ) | (1,478 | ) | (968 | ) | ||||||
|
|
||||||||||||
| Total Operating Income |
$ | 19,079 | $ | 10,577 | $ | 8,502 | ||||||
|
|
||||||||||||
-46-
Table of Contents
Combined Results of Operations
Combined revenues increased 20.7%, or $71.9 million, to $419.8 million in the three months ended March 31, 2015 compared to $347.9 million for the corresponding period in 2014 due primarily to increases in revenues in our Global Power and Global Services segments of $13.6 million and $30.4 million, respectively. The MEGTEC acquisition, which was completed on June 20, 2014, contributed $41.1 million of revenues for the three months ended March 31, 2015. These increases were partially offset by lower revenues in the Nuclear Energy segment of $13.1 million.
Combined operating income increased $8.5 million to $19.1 million in the three months ended March 31, 2015 from $10.6 million for the corresponding period in 2014. Operating income for the three months ended March 31, 2015 and 2014 includes special charges for restructuring activities totaling $2.4 million and $1.5 million, respectively. Excluding restructuring charges, operating income increased 78.6%, or $9.5 million for the quarter ended March 31, 2015 compared to the corresponding period of 2014. Gross profit in our Global Power and Global Services segments increased by $5.2 million and $11.7 million, respectively. The MEGTEC acquisition contributed $9.7 million of gross profit in the first quarter of 2015. These increases were partially offset by lower gross profit in our Nuclear Energy segment totaling $4.8 million, a $7.3 million increase in selling, general and administrative expenses and a $4.4 million decline in equity in income (loss) of investees for the 2015 period as compared to 2014.
Global Power
| Three months ended March 31, |
||||||||||||
| 2015 | 2014 | $ Change | ||||||||||
| Unaudited (in thousands) |
||||||||||||
| Revenues |
$ | 123,886 | $ | 110,292 | $ | 13,594 | ||||||
| Gross Profit |
20,428 | 15,247 | 5,181 | |||||||||
| % of Revenues |
16.5 | % | 13.8 | % | ||||||||
Revenues increased 12.3%, or $13.6 million, to $123.9 million in the three months ended March 31, 2015, compared to $110.3 million in 2014. This increase was due to higher new build steam generation systems revenues of $21.6 million primarily related to recently awarded large boiler projects. This increase was partially offset by a decline in new build environmental revenues of $8.0 million as projects related to the previously enacted environmental rules and regulations near completion and as uncertainties continue regarding the ultimate outcome of environmental regulations.
Gross profit increased $5.2 million to $20.4 million in the three months ended March 31, 2015 compared to $15.2 million in the corresponding 2014 period, primarily due to the net increase in revenues discussed above. In addition, the prior year period contained an additional loss provision recorded on the Berlin Station project of $7.6 million which had a favorable comparison impact on gross profit as a percentage of revenues of 6.9% for the three months ended March 31, 2015 when compared to the corresponding 2014 period. This increase was partially offset by a lower level of net project improvements as compared to the prior year period.
Global Services
| Three months ended March 31, |
||||||||||||
| 2015 | 2014 | $ Change | ||||||||||
| Unaudited (in thousands) |
||||||||||||
| Revenues |
$ | 232,174 | $ | 201,786 | $ | 30,388 | ||||||
| Gross Profit |
53,287 | 41,604 | 11,683 | |||||||||
| % of Revenues |
23.0 | % | 20.6 | % | ||||||||
Revenues increased 15.1%, or $30.4 million, to $232.2 million in the three months ended March 31, 2015, compared to $201.8 million in 2014. This increase was primarily attributable to increased activity in projects and construction services.
Gross profit increased $11.7 million to $53.3 million in the three months ended March 31, 2015 compared to $41.6 million in the corresponding period of 2014, primarily due to the increase in revenues discussed above. In addition, a higher level of net project improvements, along with cost savings from our margin improvement initiatives, was achieved as compared to the prior year period.
-47-
Table of Contents
Industrial Environmental
| Three months ended March 31, |
||||||||||||
| 2015 | 2014 | $ Change | ||||||||||
| Unaudited (in thousands) |
||||||||||||
| Revenues |
$ | 41,095 | $ | - | $ | 41,095 | ||||||
| Gross Profit |
9,681 | - | 9,681 | |||||||||
| % of Revenues |
23.6 | % | - | |||||||||
This segment contains the operating results of MEGTEC, which was acquired on June 20, 2014. Revenues and gross profit contributed by this segment totaled $41.1 million and $9.7 million for the three months ended March 31, 2015. This includes amortization of an intangible asset which had a $2.7 million unfavorable impact on gross profit for the quarter.
Nuclear Energy
| Three months ended March 31, |
||||||||||||
| 2015 | 2014 | $ Change | ||||||||||
| Unaudited (in thousands) |
||||||||||||
| Revenues |
$ | 22,687 | $ | 35,814 | $ | (13,127) | ||||||
| Gross Profit |
4,377 | 9,155 | (4,778) | |||||||||
| % of Revenues |
19.3 | % | 25.6 | % | ||||||||
Revenues decreased 36.7%, or $13.1 million, to $22.7 million in the three months ended March 31, 2015 compared to $35.8 million in the corresponding period of 2014, primarily due to the timing of maintenance outages in the Canadian nuclear market and lower volume our the nuclear equipment business which resulted in a $5.0 million decline in revenues when compared to the same period of 2014.
Gross profit decreased $4.8 million to $4.4 million in the three months ended March 31, 2015 compared to $9.2 million in the corresponding period of 2014, primarily attributable to the decline in revenues discussed above as well as contract improvements in our nuclear equipment business that were realized during the three months ended March 31, 2014.
The Nuclear Energy segment will not be part of our continuing operations as we will transfer the assets and liabilities associated with this segment to the Company in connection with the spin-off.
Selling, General and Administrative
Selling, general and administrative expenses incurred for the quarter ended March 31, 2015 were $59.5 million compared to $52.2 million in the corresponding period of 2014. Cost savings from restructuring initiatives were offset by an increase of $8.3 million in selling, general and administrative expenses associated with the MEGTEC business that was acquired on June 20, 2014. In connection with the spin-off transaction, certain of our employees were granted stock-based retention awards totaling approximately $5.0 million, which are expected to be expensed over the twelve months following the date of the spin-off. Consummation of the spin-off is a vesting criterion of these awards.
Research and Development
Research and development expenses relate to the development and improvement of new and existing products and equipment, as well as conceptual and engineering evaluation for translation into practical applications. These expenses were relatively unchanged at $4.6 million and $4.1 million for the quarters ended March 31, 2015 and 2014, respectively.
Equity in Income (Loss) of Investees
Equity in income (loss) of investees decreased to a loss of $2.1 million from income of $2.4 million for the quarters ended March 31, 2015 and 2014, respectively. This was due primarily to adverse market conditions in China and the near completion of a U.S. environmental project joint venture that generated more operating income in the first quarter of 2014 when compared to 2015. Equity in income (loss) of investees in the first quarter of 2014 also included income from our interest in Ebensburg Power Company, which we fully acquired in May 2014 and now consolidate into the Global Services segment.
-48-
Table of Contents
Special Charges for Restructuring Activities
Special charges for restructuring activities increased $1.0 million to $2.4 million in the three months ended March 31, 2015, as compared to $1.5 million for the corresponding period in 2014, primarily due to charges associated with our margin improvement program, offset by a decline in charges related to our GCI initiative as this initiative nears completion.
Provision for Income Taxes
| Three months ended March 31, | ||||||||||||
| 2015 | 2014 | $ Change | ||||||||||
| Unaudited (In thousands) |
||||||||||||
| Income before Provision for Income Taxes |
$ | 18,663 | $ | 12,409 | $ | 6,254 | ||||||
| Income Tax Provision |
5,921 | 1,204 | 4,717 | |||||||||
| Effective Tax Rate |
31.7 | % | 9.7 | % | ||||||||
We operate in numerous countries that have statutory tax rates below that of the United States federal statutory rate of 35%. The most significant of these foreign operations are located in Canada, Denmark and the United Kingdom with effective tax rates of approximately 26%, 25% and 22%, respectively. Income before provision for income taxes generated in the United States and foreign locations for the three months ended March 31, 2015 and 2014 is presented in the table below.
| Three months ended March 31, | ||||||||
| 2015 | 2014 | |||||||
| Unaudited (In thousands) |
||||||||
| U.S. |
$ | 13,277 | $ | 8,938 | ||||
| Other than U.S. |
5,386 | 3,471 | ||||||
|
|
||||||||
| Income before Provision for Income Taxes |
$ | 18,663 | $ | 12,409 | ||||
|
|
||||||||
For the three months ended March 31, 2015, our provision for income taxes increased $4.7 million to $5.9 million, while income before provision for income taxes increased $6.3 million to $18.7 million. Our effective tax rate for the three months ended March 31, 2015 was approximately 31.7% as compared to 9.7% for the three months ended March 31, 2014. The effective tax rate for the three months ended March 31, 2015 was lower than our statutory rate primarily due to the foreign rate differential. The effective tax rate for the three months ended March 31, 2014 was lower than our statutory rate primarily due to the receipt of a favorable ruling from the Internal Revenue Service that allowed us to amend prior year U.S. income tax returns to exclude distributions of several of our foreign joint ventures from domestic taxable income.
-49-
Table of Contents
RESULTS OF OPERATIONS – YEARS ENDED DECEMBER 31, 2014, 2013 and 2012
Selected financial highlights are presented in the table below:
| Year Ended December 31, |
||||||||||||
| 2014 | 2013 | 2012 | ||||||||||
| (In thousands) | ||||||||||||
| REVENUES: |
||||||||||||
| Global Power |
$ | 471,929 | $ | 712,461 | $ | 780,682 | ||||||
| Global Services |
908,682 | 1,055,189 | 1,005,277 | |||||||||
| Industrial Environmental |
105,418 | - | - | |||||||||
| Nuclear Energy |
103,690 | 153,513 | 253,141 | |||||||||
|
|
||||||||||||
| $ | 1,589,719 | $ | 1,921,163 | $ | 2,039,100 | |||||||
|
|
||||||||||||
| Gross Profit: |
||||||||||||
| Global Power |
$ | 94,647 | $ | 126,275 | $ | 177,670 | ||||||
| Global Services |
193,629 | 225,434 | 220,877 | |||||||||
| Industrial Environmental |
24,961 | - | - | |||||||||
| Nuclear Energy |
10,667 | 48,466 | 73,249 | |||||||||
|
|
||||||||||||
| $ | 323,904 | $ | 400,175 | $ | 471,796 | |||||||
|
|
||||||||||||
| Selling, General and Administrative |
(229,191) | (228,149) | (241,333) | |||||||||
| Research and Development |
(18,747) | (22,882) | (26,018) | |||||||||
| Losses (Gains) on Asset Disposal and |
(1,087) | (1,153) | (3,276) | |||||||||
| Equity in Income of Investees |
8,681 | 18,387 | 17,402 | |||||||||
| Special Charges for Restructuring Activities |
(30,025) | (26,346) | - | |||||||||
| Mark to Market Adjustment |
(111,050) | 115,142 | (12,685) | |||||||||
|
|
||||||||||||
| Total Operating Income (Loss) |
$ | (57,515) | $ | 255,174 | $ | 205,886 | ||||||
|
|
||||||||||||
Combined Results of Operations
Year Ended December 31, 2014 vs. 2013
Combined revenues decreased 17.3%, or $331.5 million, to $1,589.7 million in the year ended December 31, 2014 compared to $1,921.2 million for the corresponding period in 2013 due primarily to decreases in revenues from our Global Power, Global Services and Nuclear Energy segments of $240.6 million, $146.5 million and $49.8 million, respectively. The MEGTEC acquisition, which was completed on June 20, 2014, contributed $105.4 million of revenues for the year ended December 31, 2014.
Combined operating income decreased $312.7 million to a loss of $57.5 million in the year ended December 31, 2014 from $255.2 million for the corresponding period in 2013. Operating income includes actuarial gains and losses (“MTM charges”) related to our pension and postretirement plans, which reflected a fourth quarter non-cash gain (loss) of $(111.1) million and $115.1 million in 2014 and 2013, respectively. In addition, operating income for the years ended December 31, 2014 and 2013 includes special charges for restructuring activities totaling $30.0 million and $26.3 million, respectively. Excluding MTM charges and restructuring charges, operating income decreased $82.8 million for the year ended December 31, 2014 compared to 2013. Gross profit in our Global Power, Global Services and Nuclear Energy segments declined $31.7 million, $31.8 million and $37.8 million, respectively. This decrease was partially offset by increased gross profit due to the MEGTEC acquisition which contributed $25.0 million for the year ended December 31, 2014 and a $4.1 million decline in research and development expense for the 2014 period as compared to 2013.
Year Ended December 31, 2013 vs. 2012
Combined revenues decreased 5.8%, or $117.9 million, to $1,921.2 million in the year ended December 31, 2013 compared to $2,039.1 million for the corresponding period in 2012 due primarily to decreases in revenues from our Global Power and Nuclear Energy segments of $68.2 million and $99.6 million, respectively, partially offset by increased revenues in our Global Services segment totaling $49.9 million.
-50-
Table of Contents
Combined operating income increased $49.3 million to $255.2 million in the year ended December 31, 2013 from $205.9 million for the corresponding period in 2012. Operating income includes MTM charge which reflected a non-cash gain (loss) of $115.1 million and $(12.7) million in 2013 and 2012, respectively. In addition, operating income for the year ended December 31, 2013 includes special charges for restructuring activities totaling $26.3 million. Excluding MTM charges and restructuring charges, operating income decreased $52.2 million for the year ended December 31, 2013 compared to 2012. Gross profit in our Global Power and Nuclear Energy segments declined $51.4 million and $24.7 million, respectively. These decreases was partially offset by increased gross profit in our Global Services segment totaling $4.5 million and a $13.2 million decline in selling, general and administrative expenses for the 2013 period as compared to 2012.
Global Power
| Year Ended December 31, |
Year Ended December 31, |
|||||||||||||||||||||||||
| 2014 | 2013 | $ Change | 2013 | 2012 | $ Change | |||||||||||||||||||||
| Revenues |
$ | 471,929 | $ | 712,461 | $ | (240,532 | ) | $ | 712,461 | $ | 780,682 | $ | (68,221 | ) | ||||||||||||
| Gross Profit |
94,647 | 126,275 | (31,628 | ) | 126,275 | 177,670 | (51,395 | ) | ||||||||||||||||||
| % of Revenues |
20.1% | 17.7% | 17.7% | 22.8% | ||||||||||||||||||||||
Year Ended December 31, 2014 vs. 2013
Revenues decreased 33.8%, or $240.6 million, to $471.9 million in the year ended December 31, 2014, compared to $712.5 million in 2013. Our new build environmental activities contributed to $139.2 million of this decrease, which was principally driven by lower levels of engineering, procurement and construction activities as projects related to the previously enacted environmental rules and regulations near completion and uncertainties continue regarding the ultimate outcome of environmental regulations. Additionally, our new build steam generation activities contributed to a $101.4 million decline in revenues due to a lower level of activity on our Berlin Station project, as well as other renewable energy projects.
Gross profit decreased $31.7 million to $94.6 million in the year ended December 31, 2014 compared to $126.3 million in the corresponding 2013 period, primarily due to the decreased revenues discussed above. This decline was partially offset due to the recording of a lower loss provision of $11.6 million on the Berlin Station project as compared to the prior year period provision of $35.6 million which had a favorable impact on gross profit as a percentage of revenues of 2.5% for the year ended December 31, 2014 when compared to the corresponding 2013 period.
Year Ended December 31, 2013 vs. 2012
Revenues decreased 8.7%, or $68.2 million, to $712.5 million in the year ended December 31, 2013, compared to $780.7 million in 2012. Our new build steam generation activities contributed $43.8 million of this decrease, which was primarily due to a lower level of activity on renewable energy and industrial boiler projects. Additionally, our new build environmental activities contributed to $24.4 million of this decrease, which was primarily attributable to lower levels of engineering, procurement and construction activities as projects related to the previously enacted environmental rules and regulations near completion and uncertainties continued regarding the ultimate outcome of environmental regulations.
Gross profit decreased $51.4 million to $126.3 million in the year ended December 31, 2013 compared to $177.7 million in 2012, primarily due to the decreased revenues discussed above, as well as contract losses totaling $35.6 million recorded for additional estimated costs to complete the Berlin Station project that was experiencing unforeseen worksite conditions and fuel specification issues. These losses are in addition to $16.9 million of contract losses recorded for this project during the fourth quarter of 2012. The change in the Berlin Station project losses resulted in an unfavorable impact on gross profit as a percentage of revenues of 2.8% in the year ended December 31, 2013 when compared to 2012. Additionally, gross margins were lower as compared to the 2012 period due to more competitive profit margins, as well as a lower level of project improvements.
-51-
Table of Contents
Global Services
| Year Ended December 31, |
Year Ended December 31, |
|||||||||||||||||||||||||
| 2014 | 2013 | $ Change | 2013 | 2012 | $ Change | |||||||||||||||||||||
| Revenues |
$ | 908,682 | $ | 1,055,189 | $ | (146,507 | ) | $ | 1,055,189 | $ | 1,005,277 | $ | 49,912 | |||||||||||||
| Gross Profit |
193,629 | 225,434 | (31,805 | ) | 225,434 | 220,877 | 4,557 | |||||||||||||||||||
| % of Revenues |
21.3% | 21.4% | 21.4% | 22.0% | ||||||||||||||||||||||
Year Ended December 31, 2014 vs. 2013
Revenues decreased 13.9%, or $146.5 million, to $908.7 million in the year ended December 31, 2014, compared to $1,055.2 million in the corresponding 2013 period. This decrease was primarily attributable to lower service project revenues due mainly to a large boiler retrofit project that was completed in 2013 and a decrease in construction services environmental project revenues.
Gross profit decreased $31.8 million to $193.6 million in the year ended December 31, 2014 compared to $225.4 million in the corresponding 2013 period, primarily due to the decrease in revenues discussed above.
Year Ended December 31, 2013 vs. 2012
Revenues increased 5.0%, or $49.9 million, to $1,055.2 million in the year ended December 31, 2013, compared to $1,005.3 million in 2012. This increase was primarily attributable to increased construction activities on a boiler retrofit project and maintenance services, partially offset by decreased environmental retrofit activity.
Gross profit increased $4.5 million to $225.4 million in the year ended December 31, 2013 compared to $220.9 million in 2012, primarily due to the increased revenues discussed above, partially offset by more competitive gross margins. Additionally, the gross profit margin percentage was impacted by the relative mix of revenue activities with a larger amount of construction and maintenance services revenues.
Industrial Environmental
| Year Ended December 31, |
Year Ended December 31, |
|||||||||||||||||||||||||
| 2014 | 2013 | $ Change | 2013 | 2012 | $ Change | |||||||||||||||||||||
| Revenues |
$ | 105,418 | $ | - | $ | 105,418 | $ | - | $ | - | $ | - | ||||||||||||||
| Gross Profit |
24,961 | - | 24,961 | - | - | - | ||||||||||||||||||||
| % of Revenues |
23.7% | - | - | - | ||||||||||||||||||||||
Year Ended December 31, 2014 vs. 2013
The segment contains the operating results of MEGTEC which was acquired on June 20, 2014. Revenues and gross profit contributed by this segment totaled $105.4 million and $25.0 million for the year ended December 31, 2014, respectively.
Nuclear Energy
| Year Ended December 31, |
Year Ended December 31, |
|||||||||||||||||||||||||
| 2014 | 2013 | $ Change | 2013 | 2012 | $ Change | |||||||||||||||||||||
| Revenues |
$ | 103,690 | $ | 153,513 | $ | (49,823 | ) | $ | 153,513 | $ | 253,141 | $ | (99,628 | ) | ||||||||||||
| Gross Profit |
10,667 | 48,466 | (37,799 | ) | 48,466 | 73,249 | (24,783 | ) | ||||||||||||||||||
| % of Revenues |
10.3% | 31.6% | 31.6% | 28.9% | ||||||||||||||||||||||
Year Ended December 31, 2014 vs. 2013
Revenues decreased 32.4%, or $49.8 million, to $103.7 million in the year ended December 31, 2014 compared to $153.5 million in the corresponding period of 2013. This decrease is primarily attributable to a decrease in revenues from our nuclear equipment business totaling $42.1 million largely due to the completion of a replacement steam generator contract that was ongoing in the prior year period.
-52-
Table of Contents
Gross profit decreased $37.8 million to $10.7 million in the year ended December 31, 2014 compared to $48.5 million in the corresponding period of 2013, primarily attributable to a $15.3 million charge resulting from an adverse jury verdict in a lawsuit involving commercial nuclear contracts. The adverse jury verdict resulted in a negative impact on segment gross profit as a percentage of revenues of 14.8% in the year ended December 31, 2014. We also experienced lower gross profit from our nuclear equipment business related to the decrease in revenues noted above. In addition, during the year ended December 31, 2013, we recognized $7.1 million of warranty improvements associated with favorable warranty experience which had a favorable impact on gross profit as a percentage of revenues of 4.6% in the year ended December 31, 2013.
Year Ended December 31, 2013 vs. 2012
Revenues decreased 39.4%, or $99.6 million, to $153.5 million in the year ended December 31, 2013 compared to $253.1 million in the corresponding period of 2012. The decrease in revenues is primarily attributable to decreased activity in our nuclear services and nuclear equipment businesses associated with the completion of several large contracts that were ongoing in the prior period.
Gross profit decreased $24.7 million to $48.5 million in the year ended December 31, 2013 compared to $73.2 million in the corresponding period of 2012. This decrease is primarily attributable to the decline in revenues noted above. These decreases were partially offset by $7.1 million of favorable warranty experience compared to the corresponding period of 2012 which had a favorable impact on gross profit as a percentage of revenues of 4.6% in the year ended December 31, 2013.
Selling, General and Administrative
Selling, general and administrative expenses incurred for the year ended December 31, 2014 were $229.2 million and were relatively unchanged from the 2013 period which totaled $228.1 million. Cost savings from GCI restructuring initiatives were offset by $17.5 million of selling, general and administrative expenses associated with the MEGTEC business that was acquired on June 20, 2014. Selling, general and administrative expenses decreased $13.2 million to $228.1 million for the year ended December 31, 2013, as compared to $241.3 million for the corresponding period in 2012 due to the impact of GCI restructuring initiatives which reduced overhead expenses as compared to the prior year.
Research and Development
Research and development expenses relate to the development and improvement of new and existing products and equipment, as well as conceptual and engineering evaluation for translation into practical applications. These expenses were $18.7 million, $22.9 million and $26.0 million for the years ended December 31, 2014, 2013 and 2012, respectively.
Gain (Loss) on Asset Disposal and Impairment
We experienced losses on asset disposals and impairments, net totaling $1.1 million, $1.2 million and $3.3 million during the years ended December 31, 2014, 2013 and 2012, respectively, primarily as the result of impairment charges due to the cancellation of certain operations and maintenance services contracts.
Equity in Income of Investees
Equity in income of investees decreased $9.7 million to $8.7 million for the year ended December 31, 2014, as compared to $18.4 million for the corresponding period in 2013 primarily due to adverse market conditions in China and Australia, new facility costs in India and the near completion of a U.S. environmental project joint venture that generated more operating income in the corresponding period in 2013.
Equity in income of investees increased $1.0 million to $18.4 million for the year ended December 31, 2013, as compared to $17.4 million for the corresponding period in 2012 due primarily to income earned from a newly formed project joint venture to engineer, procure and construct an environmental control system.
Special Charges for Restructuring Activities
Special charges for restructuring activities increased $3.7 million to $30.0 million in the year ended December 31, 2014, as compared to $26.3 million in 2013, due to charges associated with our margin improvement program, offset by a decline in charges related to our GCI initiative as this initiative nears completion.
-53-
Table of Contents
Mark to Market Adjustment
We immediately recognize actuarial gains (losses) for our pension and postretirement plans into earnings as a component of net periodic benefit cost. The effect of this adjustment on operating income was $(111.1) million in 2014, as compared to $115.1 million in 2013, mainly related to a $46.9 million loss recognized on the adoption of a new mortality assumption and a decline in discount rates, offset by actual return on assets that exceeded expected return.
The effect of the mark to market adjustment on operating income was $115.1 million in 2013, as compared to $(12.7) million in 2012, mainly related to an increase in interest rates and actual return on assets that exceeded our expected return.
Provision for Income Taxes
| Year Ended December 31, |
Year Ended December 31, |
|||||||||||||||||||||||||
| 2014 | 2013 | $ Change | 2013 | 2012 | $ Change | |||||||||||||||||||||
| Income from Continuing Operations before Provision for Income Taxes | $ | (55,692) | $ | 257,021 | $ | (312,713) | $ | 257,021 | $ | 205,217 | $ | 51,804 | ||||||||||||||
| Income Tax Provision | (29,528) | 82,206 | (111,734) | 82,206 | 64,323 | 17,883 | ||||||||||||||||||||
| Effective Tax Rate |
53.0% | 32.0% | 32.0% | 31.3% | ||||||||||||||||||||||
We operate in numerous countries that have statutory tax rates below that of the United States federal statutory rate of 35%. The most significant of these foreign operations are located in Canada, Denmark and the United Kingdom with effective tax rates of approximately 26%, 25% and 22%, respectively. Income (loss) before provision for income taxes generated in the United States and foreign locations for the years ended December 31, 2014, 2013 and 2012 is presented in the table below.
| Year Ended December 31, | ||||||||||||
| 2014 | 2013 | 2012 | ||||||||||
| (In thousands) | ||||||||||||
| U.S. | $ | (64,084 | ) | $ | 135,967 | $ | 109,958 | |||||
| Other than U.S. | 8,392 | 121,054 | 95,259 | |||||||||
|
|
||||||||||||
| Income (loss) before provision for (benefit from) income taxes | $ | (55,692 | ) | $ | 257,021 | $ | 205,217 | |||||
|
|
||||||||||||
For the year ended December 31, 2014, our provision for income taxes decreased $111.7 million to $(29.5) million, while income before provision for income taxes decreased $312.7 million to $(55.7) million. Our effective tax rate increased 21.0% to 53.0% for 2014. The change in our effective tax rate is primarily related to the receipt of a favorable ruling from the Internal Revenue Service that enabled us to amend prior year U.S. income tax returns to exclude distributions of several of our foreign joint ventures from domestic taxable income resulting in an increase in the effective tax rate as the 2014 period was in a loss position. In addition, the significant decrease in income before provision for income taxes attributable to our mark to market pension adjustments had an effect on the overall jurisdictional mix of our pre-tax earnings in 2014 as compared to 2013.
For the year ended December 31, 2013, our provision for income taxes increased $17.9 million to $82.2 million, while income before provision for income taxes increased $51.8 million to $257.0 million. Our effective tax rate increased 0.7% to 32.0% for 2013. Differences in the components of our effective tax rate in 2013 as compared to 2012 were primarily attributable to an unfavorable mix of foreign earnings offset by the benefit of the American Taxpayer Relief Act of 2012, enacted on January 2, 2013 which retroactively extended the U.S. research and development tax credit for two years.
ADJUSTED NON-GAAP RESULTS OF OPERATIONS
In the results of operations discussion above, we have disclosed operating income changes excluding MTM charges and special charges for restructuring activities which have been recorded in accordance with generally accepted accounting principles. Additionally, elsewhere in this prospectus we present adjusted net income and adjusted diluted earnings per common share. Adjusted net income and adjusted diluted earnings per
-54-
Table of Contents
common share are defined as net income and diluted earnings per common share adjusted to exclude actuarial gains and losses on pension and postretirement plans and special charges for restructuring activities. We present these non-GAAP measures, which are not prepared in accordance with GAAP, because we believe they provide meaningful insight into operational performance and our segment operating performance. Additionally, we believe that when considered together with the GAAP results and the reconciliation to net income and diluted earnings per share, these non-GAAP measures provide a more complete understanding of our business than could be obtained absent this disclosure. We use these non-GAAP measures, together with financial measures prepared in accordance with GAAP, such as net income and diluted earnings per share, to assess our historical and prospective operating performance and to enhance our understanding of our core operating performance. Additionally, we are presenting these measures because we believe they are useful in (a) helping investors facilitate comparisons of our operating results with prior periods and (b) assisting investors in understanding our ongoing operations and our operating performance. We are providing these non-GAAP measures to supplement the results provided in accordance with GAAP and they should not be considered superior to, or as substitutes for, the comparable GAAP results.
EFFECTS OF INFLATION AND CHANGING PRICES
Our financial statements are prepared in accordance with generally accepted accounting principles in the United States, using historical U.S. dollar accounting (“historical cost”). Statements based on historical cost, however, do not adequately reflect the cumulative effect of increasing costs and changes in the purchasing power of the U.S. dollar, especially during times of significant and continued inflation.
In order to minimize the negative impact of inflation on our operations, we attempt to cover the increased cost of anticipated changes in labor, material and service costs, either through an estimate of those changes, which we reflect in the original price, or through price escalation clauses in our contracts. However, there can be no assurance we will be able to cover all changes in cost using this strategy.
LIQUIDITY AND CAPITAL RESOURCES
Pre-Spin-off Liquidity and Capital Resources
Historically, the Company has provided financing, cash management and other treasury services to us. Domestically, we participated in a centralized cash management program administered by the Company resulting in minor domestic cash balances in our combined balance sheets. Cash transferred to and from the Company has historically been assumed to be immediately settled. Upon completion of the spin-off, we will maintain separate cash management and financing functions from the Company for our operations.
Our unrestricted cash and investments at March 31, 2015 and December 31, 2014 totaled approximately $234.2 million and $221.3 million, respectively, which largely represents our international cash balances. Additionally, the Company had $825.2 million available for borrowings under its Credit Agreement (as defined below) as of March 31, 2015; however, as described below, we finalized the terms of a new credit facility that will be effective upon completion of the spin-off.
Company Credit Facility
On June 24, 2014, the Company entered into a Second Amended and Restated Credit Agreement (the “Credit Agreement”) with a syndicate of lenders and letter of credit issuers, and Bank of America, N.A., as administrative agent, which amended and restated the former credit agreement. The Credit Agreement provides for revolving credit borrowings and issuances of letters of credit in an aggregate amount of up to $1.0 billion and a term loan facility of up to $300 million. The Credit Agreement is scheduled to mature on June 24, 2019 but will expire upon completion of the spin-off when the new credit facility becomes effective. Capacity under the Credit Agreement is available to us for the issuance of letters of credit, working capital needs and other general corporate purposes. The Credit Agreement includes provisions that allow for additional financial institutions to become lenders, or for any existing lender to increase its commitment thereunder, subject to an aggregate maximum of $400 million for all incremental term loan, revolving credit borrowings and letter of credit commitments. Outstanding letters of credit issued under the Credit Agreement on our behalf totaled $115.7 million at March 31, 2015.
-55-
Table of Contents
The Credit Agreement is guaranteed by substantially all of the Company’s wholly owned domestic subsidiaries, including the wholly owned domestic subsidiaries of New B&W. Obligations under the Credit Agreement are secured by first-priority liens on certain assets owned by the Company and certain of the guarantors (including the wholly owned domestic subsidiaries of B&W PGG). If the corporate rating of the Company and its subsidiaries from Moody’s is Baa3 or better (with a stable outlook or better), the corporate family rating of the Company and its subsidiaries from S&P is BBB- or better (with a stable outlook or better), and other conditions are met, the liens securing obligations under the Credit Agreement will be released, subject to reinstatement upon the terms set forth in the Credit Agreement.
Post-Spin-off Liquidity and Capital Resources
Following the spin-off, our primary sources of liquidity will be cash on hand provided from operating activities, and amounts available under our new credit agreement that will replace our participation in the Credit Agreement. Terms of the new credit agreement are discussed below. Our cash flow from operating activities is primarily driven by our long-term contracts, which are generally structured to limit cash flow exposure by billing based on contract milestones in advance of incurring cash outflows. Particularly for larger contracts, this results in cash generation at the beginning of the contract and cash outflow at the end of the contract as the work is completed. The increase in backlog at December 31, 2014 from recent international coal boiler and renewable bookings generated cash flow from working capital as these new projects began and advance billings were received. The majority of our customers are well capitalized utilities and governments for which we have a history of minimal accounts receivable write offs. We do not currently have any significant concerns with our ability to bill and collect amounts from our customers associated with our long-term contracts. Further, contractual terms and conditions are consistent with industry standards and past practices.
We do not currently plan to pay a regular dividend on our common stock following the spin-off. The declaration of any future cash dividends and, if declared, the amount of any such dividends, will be subject to our financial condition, earnings, capital requirements, financial covenants and other contractual restrictions and to the discretion of our board of directors. Following the spin-off, we may seek to repurchase our outstanding shares of common stock. Such repurchases, if any, will depend on our financial condition, prevailing market conditions, our liquidity requirements, contractual restrictions and other factors.
We expect our current sources of cash to be sufficient to meet our liquidity needs for at least the next twelve months.
Post-Spin Credit Facility
On May 11, 2015, we entered into a new credit agreement in connection with the planned spin-off. The closing date of the new credit agreement and the initial funding thereunder are conditioned on the satisfaction of certain conditions; however, we expect that the new credit agreement will close immediately prior to the completion of the spin-off. The financial covenants, restrictive covenants and events of default described below are not applicable until the closing date thereof, except with respect to breaches of the representations and warranties.
The new credit agreement provides for a five-year, senior secured revolving credit facility in an aggregate amount of up to $600 million, the full amount of which will be available for the issuance of letters of credit. Obligations under the new credit agreement are scheduled to mature on the fifth anniversary of its closing date. The proceeds of loans under the new credit agreement will be available for working capital needs and other general corporate purposes.
The new credit agreement contains an accordion feature that will allow us, subject to the satisfaction of certain conditions, including the receipt of increased commitments from existing lenders or new commitments from new lenders, to increase the amount of the commitments under the revolving credit facility in an aggregate amount not to exceed the sum of (i) $200 million plus (ii) an unlimited amount, so long as for any commitment increase under this subclause (ii) our senior secured leverage ratio (assuming the full amount of any commitment increase under this subclause (ii) is drawn) is equal to or less than 2.0 to 1.0 after giving pro forma effect thereto.
The new credit agreement and our obligations under certain hedging agreements and cash management agreements with our lenders and their affiliates will be (i) guaranteed by substantially all of our wholly owned
-56-
Table of Contents
domestic subsidiaries, but excluding our captive insurance subsidiary, and (ii) secured by first-priority liens on certain assets owned by New B&W and the guarantors.
The new credit agreement requires interest payments on revolving loans on a periodic basis until maturity. We may prepay all loans under the new credit agreement at any time without premium or penalty (other than customary LIBOR breakage costs), subject to notice requirements. The new credit agreement requires us to make certain prepayments on any outstanding revolving loans under the new credit agreement after receipt of cash proceeds from certain asset sales or other events, subject to certain exceptions and a right to reinvest such proceeds in certain circumstances, but such prepayments will not require us to reduce the commitments under the new credit agreement.
Loans outstanding under the new credit agreement will bear interest at our option at either the LIBOR rate plus a margin ranging from 1.375% to 1.875% per year or the base rate (the highest of the Federal Funds rate plus 0.50%, the one month LIBOR rate plus 1.0%, or the administrative agent’s prime rate) plus a margin ranging from 0.375% to 0.875% per year. Starting on the closing date of the new credit agreement, a commitment fee will be charged on the unused portions of the revolving credit facility, and that fee varies between 0.250% and 0.350% per year. Additionally, a letter of credit fee of between 1.375% and 1.875% per year will be charged with respect to the amount of each financial letter of credit issued under the new credit agreement and a letter of credit fee of between 0.825% and 1.125% per year will be charged with respect to the amount of each performance letter of credit issued under the new credit agreement. The applicable margin for loans, the commitment fee and the letter of credit fees set forth above will vary quarterly based on our leverage ratio. Upon the closing of the new credit agreement, we will pay certain upfront fees to the lenders thereunder, and we will pay arrangement and other fees to the arrangers and agents of the new credit agreement.
The new credit agreement includes financial covenants that will be tested on a quarterly basis, based on the rolling four-quarter period that ends on the last day of each fiscal quarter. The maximum permitted leverage ratio is 3.00 to 1.00, which ratio may be increased to 3.25 to 1.00 for up to four consecutive fiscal quarters after a material acquisition. The minimum consolidated interest coverage ratio is 4.00 to 1.00. In addition, the new credit agreement contains various restrictive covenants, including with respect to debt, liens, investments, mergers, acquisitions, dividends, equity repurchases and asset sales.
The new credit agreement generally includes customary events of default for a secured credit facility. If an event of default relating to bankruptcy or other insolvency events with respect to New B&W occurs under the new credit agreement, all obligations under the new credit agreement will immediately become due and payable. If any other event of default exists under the new credit agreement, the lenders will be permitted to accelerate the maturity of the obligations outstanding under the new credit agreement. If any event of default occurs under the new credit agreement, the lenders will be permitted to terminate their commitments thereunder and exercise other rights and remedies, including the commencement of foreclosure or other actions against the collateral.
If any default occurs under the new credit agreement, or if we are unable to make any of the representations and warranties in the new credit agreement, we will be unable to borrow funds or have letters of credit issued under the new credit agreement.
Other Financing Arrangements
Prior to the spin-off, certain of our subsidiaries have credit arrangements with various commercial banks and other financial institutions for the issuance of letters of credit and bank guarantees in association with contracting activity. The aggregate value of all such letters of credit and bank guarantees as of March 31, 2015 was $143.3 million.
We have posted surety bonds to support contractual obligations to customers relating to certain projects. We utilize bonding facilities to support such obligations, but the issuance of bonds under those facilities is typically at the surety’s discretion. Although there can be no assurance that we will maintain our surety bonding capacity, we believe our current capacity is more than adequate to support our existing project requirements for the next twelve months. In addition, these bonds generally indemnify customers should we fail to perform our obligations under the applicable contracts. Certain of our subsidiaries, have jointly executed general agreements of indemnity in favor of surety underwriters relating to surety bonds those underwriters issue in support of some of our contracting activity. As of March 31, 2015, bonds issued and outstanding under these arrangements in support of contracts totaled approximately $519.0 million.
-57-
Table of Contents
Following the spin-off, we expect our subsidiaries to continue to enter into these types of credit and surety arrangements.
OTHER
Foreign Operations
Included in our total unrestricted cash and cash equivalents at March 31, 2015 and December 31, 2014 is approximately $209.7 million and $195.2 million or 92% and 89%, respectively, related to foreign operations and subsidiaries. In general, these resources are not available to fund our U.S. operations unless the funds are repatriated to the U.S., which would expose us to taxes we presently have not accrued in our results of operations. We presently have no plans to repatriate these funds to the U.S. in a taxable manner as the liquidity generated by our U.S. operations, along with other sources of cash, is sufficient to meet the cash requirements of our U.S. operations.
Cash, Cash Equivalents, Restricted Cash and Investments
March 31, 2015 compared to December 31, 2014
In aggregate, our cash and cash equivalents, restricted cash and cash equivalents and investments increased by approximately $9.8 million to $263.0 million at March 31, 2015 from $253.2 million at December 31, 2014, primarily due to cash generated by our international operations. At March 31, 2015, we had restricted cash and cash equivalents totaling $28.8 million, $4.7 million of which was held in restricted foreign cash accounts and $24.1 million of which was held to meet reinsurance reserve requirements of our captive insurer. At March 31, 2015, we had investments with a fair value of $7.4 million. Our investment portfolio consists primarily of investments in asset-backed securities and collateralized mortgage obligations and highly liquid money market instruments. See discussion above in “Pre-Spin-off Liquidity and Capital Resources” related to domestic cash pooling with the Company.
Our working capital decreased by approximately $10.9 million to $355.7 million at March 31, 2015 from $366.6 million at December 31, 2014, attributable primarily to a timing related decline in accounts payable and employee benefits and a decline in accounts receivable, partially offset by an increase in advance billings on contracts. Our long-term contracts are generally structured to limit cash flow risk by billing in advance of incurring cash outflows. Particularly for larger contracts, this results in cash generation at the beginning of the contract and cash outflow at the end of the contract as work is completed. The increase in backlog at March 31, 2015 from recent international coal boiler and renewable bookings has begun to generate cash from operating activities as these new projects begin and advance billings are received.
Three Months Ended March 31, 2015 compared to Three Months Ended March 31, 2014
Our net cash provided by operating activities increased approximately $113.4 million to $47.8 million for the three months ended March 31, 2015 compared to cash used in operating activities of $65.6 million in the three months ended March 31, 2014. Our cash flow from operating activities is primarily driven by our long term contracts, which are generally structured to limit cash flow exposure by billing based on contract milestones in advance of incurring cash outflows. Particularly for larger contracts, this results in cash generation at the beginning of the contract and cash outflow at the end of the contract as the work is completed. The increase in backlog at December 31, 2014 from recent international coal boiler and renewable bookings generated cash flow from working capital in the first quarter of 2015 as some of these new projects began and advance billings were received. In the corresponding period of 2014, our backlog was declining in connection with projects primarily related to previously enacted environmental rules and regulations, were nearing completion at a pace that exceeded new bookings.
Our net cash used in investing activities increased by $13.3 million to approximately $8.4 million in the three months ended March 31, 2015 compared to cash provided by investing activities of $4.9 million in the corresponding period of 2014. This increase in cash used in investing activities was primarily attributable to a decrease in sales of investments and a decrease in restricted cash and cash equivalents.
Our net cash used in financing activities increased $79.3 million to approximately $24.8 million in the quarter ended March 31, 2015 compared to cash provided by financing activities of $54.5 million in the quarter ended March 31, 2014. This increase in cash used in financing activities was primarily attributable to increased financing provided to the Company.
-58-
Table of Contents
December 31, 2014 compared to December 31, 2013
In aggregate, our cash and cash equivalents, restricted cash and cash equivalents and investments increased by approximately $20.7 million to $253.2 million at December 31, 2014 from $232.5 million at December 31, 2013, primarily due to cash generated by in our international operations. At December 31, 2014, we had restricted cash and cash equivalents totaling $31.8 million, $3.7 million of which was held in restricted foreign cash accounts and $28.1 million of which was held to meet reinsurance reserve requirements of our captive insurer. At December 31, 2014, we had investments with a fair value of $2.3 million. Our investment portfolio consists primarily of investments in asset-backed securities and collateralized mortgage obligations and highly liquid money market instruments. See discussion above in “Pre-Spin-off Liquidity and Capital Resources” related to domestic cash pooling with the Company.
Our working capital increased by approximately $135.3 million to $366.6 million at December 31, 2014 from $231.3 million at December 31, 2013, attributable primarily to the changes in net contracts in progress and advance billings on contracts associated with the decline in contract activity. Our long-term contracts are generally structured to limit cash flow risk by billing in advance of incurring cash outflows. Particularly for larger contracts, this results in cash generation at the beginning of the contract and cash outflow at the end of the contract as the work is completed. Our working capital increased, using cash, in 2014 and 2013 as our backlog projects related to previously enacted environmental rules and regulations, such as the Cross State Air Pollution Rule, neared completion at a pace that exceeded new bookings for the period. However, the increase in backlog at December 31, 2014 from recent international coal boiler and renewable bookings is expected to generate cash from operating activities as these new projects begin and advance billings are received.
Year Ended December 31, 2014 compared to Year Ended December 31, 2013
Our net cash used in operating activities was approximately $28.7 million for the year ended December 31, 2014 compared to cash used in operating activities of $7.3 million in the year ended December 31, 2013. This increase in cash used in operating activities was primarily attributable to reduced earnings and the timing of collection of accounts receivable, which is subject to project milestone billings.
Our net cash used in investing activities increased by $131.0 million to approximately $149.6 million in the year ended December 31, 2014 compared to $18.6 million in the year ended December 31, 2013. This increase in cash used in investing activities was primarily attributable to the acquisition of MEGTEC.
Our net cash flow provided by financing activities increased $164.1 million to approximately $211.7 million in the year ended December 31, 2014 compared to $47.6 million in the year ended December 31, 2013. This increase in cash provided by financing activities was primarily attributable to increased financing provided by the Company.
December 31, 2013 compared to December 31, 2012
In aggregate, our cash and cash equivalents, restricted cash and cash equivalents and investments increased by approximately $12.9 million to $232.5 million at December 31, 2013 from $219.6 million at December 31, 2012, primarily due to cash generated by our international operations.
Our working capital increased by approximately $116.3 million to $231.3 million at December 31, 2013 from $115.0 million at December 31, 2012, attributable primarily to the changes in net contracts in progress and advance billings on contracts.
Year Ended December 31, 2013 compared to Year Ended December 31, 2012
Our net cash used in operating activities was approximately $7.3 million in the year ended December 31, 2013 compared to cash provided by operating activities of $58.2 million in the year ended December 31, 2012. This decrease was primarily attributable to changes in net contracts in progress and advance billings due to timing of project billings, partially offset by lower pension contributions.
Our net cash used in investing activities decreased by $82.5 million to approximately $18.6 million in the year ended December 31, 2013 compared to $101.1 million in the year ended December 31, 2012. This decrease in net cash used in investing activities was primarily attributable to a decline in net purchases and sales of available-for-sale securities during the period due to the transfer of investments to the Company.
-59-
Table of Contents
Our net cash flow provided by financing activities increased by $230.4 million to $47.6 million in the year ended December 31, 2013 compared to $182.8 million of net cash flow used in financing activities in the year ended December 31, 2012. This increase in net cash provided by financing activities was primarily attributable to net transfer activity with the Company.
Off-Balance Sheet Arrangements
In the year ended December 31, 2014, we issued a letter of credit with a four year term totaling approximately $10 million in support of a bank loan borrowed by Thermax Babcock & Wilcox Energy Solutions Private Limited (“TBWES”). TBWES is an unconsolidated affiliate and the letter of credit can be drawn if TBWES defaults on the loan. The fair value of this guarantee is $1.7 million, which was measured at inception and recorded in other liabilities on our combined balance sheet, with an associated increase to our investments in unconsolidated affiliates.
CONTRACTUAL OBLIGATIONS
Our cash requirements as of December 31, 2014 under current contractual obligations were as follows:
| Total | Less than 1 Year |
1-3 Years |
3-5 Years |
After 5 Years |
||||||||||||||||
| (In thousands) | ||||||||||||||||||||
| Long-term debt principal(1) |
$ | 3,215 | $ | 3,215 | $ | — | $ | — | $ | — | ||||||||||
| Lease payments |
$ | 15,534 | $ | 5,522 | $ | 5,991 | $ | 2,800 | $ | 1,221 | ||||||||||
| (1) | Interest payments on these borrowings as of December 31, 2014 are not significant. |
We expect cash requirements totaling approximately $15.8 million for contributions to our pension plans in 2015. In addition, we anticipate cash requirements totaling approximately $5.3 million for contributions to our other postretirement benefit plans in 2015.
Our contingent commitments under letters of credit, bank guarantees and surety bonds outstanding at December 31, 2014 expire as follows:
|
Total |
Less than 1 Year |
1-3 Years |
3-5 Years | Thereafter | ||||||||||||
| (In thousands) | ||||||||||||||||
| $ 649,568 |
$ | 98,907 | $ | 459,345 | $ | 88,437 | $ | 2,879 | ||||||||
As of March 31, 2015, there were no material changes outside the ordinary course of business to our contractual debt obligations and commitment specified in the tables above.
-60-
Table of Contents
QUANTITATIVE AND QUALITATIVE DISCLOSURES ABOUT MARKET RISK
Our exposure to market risk from changes in interest rates relates primarily to our cash equivalents and our investment portfolio, which primarily consists of investments in U.S. Government obligations and highly liquid money market instruments denominated in U.S. dollars. We are averse to principal loss and seek to ensure the safety and preservation of our invested funds by limiting default risk, market risk and reinvestment risk. Our investments are classified as available-for-sale.
We have no material future earnings or cash flow exposures from changes in interest rates on our long-term debt obligations.
We have operations in many foreign locations, and, as a result, our financial results could be significantly affected by factors such as changes in foreign currency exchange (“FX”) rates or weak economic conditions in those foreign markets. In order to manage the risks associated with FX rate fluctuations, we attempt to hedge those risks with FX derivative instruments. Historically, we have hedged those risks with FX forward contracts. We do not enter into speculative derivative positions.
Interest Rate Sensitivity
The following tables provide information about our financial instruments that are sensitive to changes in interest rates. The tables present principal cash flows and related weighted-average interest rates by expected maturity dates.
| Principal Amount by Expected Maturity (In thousands) |
||||||||||||||||||||||||||||||||
| At December 31, 2014: | Fair Value at December 31, 2014 |
|||||||||||||||||||||||||||||||
| Years Ending December 31, | ||||||||||||||||||||||||||||||||
| 2015 | 2016 | 2017 | 2018 | 2019 | Thereafter | Total | ||||||||||||||||||||||||||
| Investments |
$ | 1,997 | — | — | — | — | $ | 308 | $ | 2,305 | $ | 2,263 | ||||||||||||||||||||
| Average Interest Rate |
0.2% | — | — | — | — | 2.6% | — | — | ||||||||||||||||||||||||
| Long-term Debt |
$ | 3,215 | — | — | — | — | — | $ | 3,215 | $ | 3,219 | |||||||||||||||||||||
| Average Interest Rate |
6.3% | — | — | — | — | — | — | — | ||||||||||||||||||||||||
| At December 31, 2013: | Fair Value at December 31, 2013 |
|||||||||||||||||||||||||||||||
| Years Ending December 31, | ||||||||||||||||||||||||||||||||
| 2014 | 2015 | 2016 | 2017 | 2018 | Thereafter | Total | ||||||||||||||||||||||||||
| Investments |
$ | 8,951 | $ | — | — | — | — | $ | 393 | $ | 9,344 | $ | 9,305 | |||||||||||||||||||
| Average Interest Rate |
0.2% | — | — | — | — | 2.3% | — | — | ||||||||||||||||||||||||
| Long-term Debt |
$ | 4,671 | $ | 225 | — | — | — | — | $ | 4,896 | $ | 4,917 | ||||||||||||||||||||
| Average Interest Rate |
6.3% | 0.5% | — | — | — | — | — | — | ||||||||||||||||||||||||
-61-
Table of Contents
Exchange Rate Sensitivity
The following table provides information about our FX forward contracts outstanding at December 31, 2014 and presents such information in U.S. dollar equivalents. The table presents notional amounts and related weighted-average FX rates by expected (contractual) maturity dates and constitutes a forward-looking statement. These notional amounts generally are used to calculate the contractual payments to be exchanged under the contract. The average contractual FX rates are expressed using market convention, which is dependent on the currencies being bought and sold under the forward contract.
| Forward Contracts to Purchase Foreign Currencies in U.S. Dollars (in thousands)
|
||||||||||||
| Foreign Currency | Year Ending December 31, 2015 |
Fair Value at December 31, 2014 |
Average Contractual Exchange Rate |
|||||||||
| British Pound Sterling |
$ | 3,835 | $ | (233) | 1.6452 | |||||||
| British Pound Sterling (selling Euros) |
$ | 2,788 | $ | 89 | 0.8131 | |||||||
| Canadian Dollars |
$ | 32,513 | $ | (2,655) | 1.0805 | |||||||
| Chinese Renminbi |
$ | 1,695 | $ | (28) | 6.2681 | |||||||
| Euros |
$ | 721 | $ | (30) | 1.2666 | |||||||
| Euros (selling British Pound Sterling) |
$ | 1,474 | $ | (21) | 0.7952 | |||||||
| Swedish Krona (selling Danish Krona) |
$ | 1,309 | $ | (62) | 1.2253 | |||||||
| U.S. Dollars (selling British Pound Sterling) |
$ | 276 | $ | 13 | 1.6240 | |||||||
| U.S. Dollars (selling Canadian Dollars) |
$ | 7,482 | $ | 541 | 1.0909 | |||||||
| U.S. Dollars (selling Danish Krona) |
$ | 6,557 | $ | 27 | 6.0999 | |||||||
| U.S. Dollars (selling Euro) |
$ | 511 | $ | 46 | 1.3272 | |||||||
| Foreign Currency | Year Ending December 31, 2016 |
Fair Value at December 31, 2014 |
Average Contractual Exchange Rate |
|||||||||
| Canadian Dollars |
$ | 15,085 | $ | (743 | ) | 1.1180 | ||||||
As of March 31, 2015. there were no material changes to our interest rate sensitivity and exchange rate sensitivity specified in the tables above.
-62-
Table of Contents
Overview
New B&W is currently a wholly owned subsidiary of the Company. The Company is a successor to a business founded in 1867, which was acquired by McDermott International, Inc. (“MII”) in 1978. In July 2010, MII spun-off the businesses that comprised its then Power Generation and Government Operations segments into the Company. New B&W’s assets and business will consist of those that the Company reports as its Power Generation segment in its financial statements combined with related captive insurance operations. Prior to the spin-off, PGG OpCo will transfer the assets and liabilities associated with the Company’s Nuclear Energy segment to the Company. Following the spin-off, New B&W will be an independent, publicly traded company that operates the Company’s Power Generation business. The Company will not retain any ownership interest in New B&W.
New B&W is a leading technology-based provider of advanced fossil and renewable power generation equipment that includes a broad suite of boiler products and environmental systems, and services for power and industrial uses. We specialize in engineering, manufacturing, procurement, and erection of equipment and technology used in the power generation industry and various other industries, and the provision of related services, including:
| • | high pressure equipment for energy conversion, such as boilers fueled by coal, oil, bitumen, natural gas, renewables including municipal solid waste and biomass fuels; |
| • | environmental control systems for both power generation and industrial applications to incinerate, filter, capture, recover and/or purify air, liquid and vapor-phase effluents from a variety of power generation and manufacturing processes; |
| • | aftermarket support for the global installed base of operating plants with a wide variety of products and technical services including replacement parts, retrofit and upgrade capabilities, field engineering, construction, inspection, operations and maintenance, condition assessment and other technical support; and |
| • | engineered-to-order services, products and systems for energy conversion worldwide and related auxiliary equipment, such as burners, pulverizers, soot blowers and ash and material handling systems; and |
| • | design and manufacture of ovens and dryers, specialized coating lines and material handling systems for energy storage, membranes, digital printing and other advanced manufacturing processes. |
New B&W will operate in three reportable segments: Global Power, Global Services and Industrial Environmental. Through our Global Power segment, we engineer, manufacture, procure, construct and commission boilers fueled by fossil fuels and renewables in addition to environmental systems and related auxiliary equipment primarily to steam generating customers globally. Through our Global Services segment, we provide aftermarket products and services to steam generating utilities worldwide and numerous industrial customers globally. We have supplied the boilers for approximately 35% of the coal-fired electric generating capacity in the United States. We also provide aftermarket services for global installed units delivered by other original equipment suppliers. Through our Industrial Environmental segment, we provide a range of environmental technology and services to numerous industrial end markets globally. We established the operations constituting this segment through our June 20, 2014 acquisition of MEGTEC.
Our overall activity depends significantly on the capital expenditures and operations and maintenance expenditures of global electric power generating companies, other steam-using industries and industrial facilities with environmental compliance needs. Several factors influence these expenditures, including:
| • | prices for electricity, along with the cost of production and distribution including the cost of fuel within the United States or internationally; |
| • | demand for electricity and other end products of steam-generating facilities; |
-63-
Table of Contents
| • | requirements for environmental improvements; |
| • | impact of potential U.S. and international requirements to significantly limit or reduce greenhouse gas emissions in the future; |
| • | environmental policies which include waste to energy or biomass as options to meet legislative requirements and clean energy portfolio standards; |
| • | level of capacity utilization at operating power plants, and other industrial uses of steam production; |
| • | requirements for maintenance and upkeep at operating power plants to combat the accumulated effects of usage; and |
| • | ability of electric power generating companies and other steam users to raise capital. |
Customer demand is heavily affected by the variations in our customers’ business cycles and by the overall economies and energy and environmental policies of the countries in which they operate.
Our Competitive Strengths
Leading Market Position in the Global Power Generation Market
We are a proven leader and brand in the design, engineering, manufacture, supply, construction and maintenance of steam generating and environmental control systems for power generation providers worldwide. We serve our markets and customers through a global, low cost footprint of engineering and manufacturing assets and joint ventures including our joint venture with Thermax Ltd in India and our joint venture with Beijing Jingcheng Machinery Electric Holding Company Ltd in China. As of March 31, 2015, our power generation systems and equipment have provided for more than 300,000 MW of steam generating capacity in more than 800 facilities in over 90 countries. In recognition of our capabilities, we have received numerous industry awards including the “2013 Plant of the Year” for American Electric Power’s John W. Turk, Jr. Ultra Super Critical Plant by Power Engineering magazine.
Recurring Global Aftermarket Services Business in Power Generation Market
We provide a comprehensive mix of aftermarket products, services and technical solutions to a large installed base for our and our competitors’ power generation and industrial plants globally. We deliver these products and services through our extensive network of regionally located service centers, technical support personnel, and global sourcing capabilities. Combined with our priority on delivering responsive and competitive customer service and solutions, this consistently results in capturing leading market share that generates stable and recurring revenues. In addition, the long term customer relationships that result from this recurring business position us favorably for new capital project opportunities and growth of our global aftermarket installed base.
Established Platform in the Global Industrial Environmental Market
We are a leading provider of technology and services in the highly fragmented and growing market for industrial environmental systems. We offer our industrial customer base a complete end-to-end solution of air pollution equipment, including engineering and project management services, procurement and fabrication, construction and installation, aftermarket support and parts and services. The products and services provide a range of sustainability-focused benefits, including air pollution abatement, carbon management, energy storage and recovery, and environmental compliance to prevent and/or treat waste and pollution.
Proven Track Record of Success and Innovation
We have served the global power generation industry for over 145 years and have a rich legacy of advanced technology development for the power generation and industrial markets. This technology leadership is supported by thousands of patents worldwide. We have invested in advanced technologies, through both research and development and our knowledge-centered technical professionals, to meet the challenge of growing power generation demand for energy sources that are lower pollutant emitting sources, or sources that have lower carbon footprints including: technologies for the development of higher efficiency coal-utilization systems to reduce emissions and technologies to enable a greater use of waste-to-energy and biomass fuels for power generation.
-64-
Table of Contents
Global, Diversified Client Base
We have a broad customer base, consisting of a wide range of utilities, independent power producers and industrial companies globally. Our customers represent some of the largest utility and industrial manufacturing companies worldwide. We believe we have the resources and capabilities to meet the needs of our customers as they upgrade and expand and to support our recurring service and maintenance business. The global diversity of our operations and customer base provides us with multiple growth opportunities in our core markets. As of March 31, 2015, we had a diversified customer base of more than 12,000 customers across the power generation and industrial markets.
Demonstrated Success with Large and Complex Projects
We have demonstrated success in executing large delivered and erected projects, both at new power plants and as retrofits at existing facilities. Since 2000, we have erected more than 142 major pieces of equipment at units with electric generating capacity exceeding 56,000 MW. For those customers who purchase our combined design build offering, we utilize proven project execution processes and provide single-point accountability for our scope throughout the execution of the project. Leveraging our engineer-to-construct design experience early in the life of a project optimizes constructability, resulting in lower costs and improved certainty of schedule. Our successful experience with modular fabrication and assembly can increase safety, improve quality, reduce field labor costs and shorten project span time.
Experienced Management and Engineering Team
Our senior management team has broad power and industrial market experience. Our senior management team is supported by a strong operating management team, which possesses extensive operational and managerial experience. Our workforce includes engineers, designers, and project managers whose significant specialized industry experience and technical expertise enables them to develop solutions that will best meet the needs of our customers. The experience and stability of our management, operating and engineering teams have been crucial to our growth, developing and maintaining customer relationships, and sustaining market share.
Our Business Strategies
Optimize Our Business to Align with the Market Opportunity
We plan to continue enhancing our operating model and asset base to optimize our approach to profitable organic growth and enhanced free cash flow across our range of global markets. In mature markets like North America, we see continued demand for refurbishment and maintenance of aging plants, which, in addition to the requirements of increasing environmental regulation, is being driven by the desire of power producers to reduce operating costs, enhance operating efficiency, improve reliability and extend the useful lives of their existing plants. Significant opportunity exists to serve this more mature market with an infrastructure designed to meet the substantial recurring aftermarket and targeted capital projects with a strategically efficient and cost competitive operating model.
Pursue Growth Opportunities in the International Power Generation Market
We will continue to pursue growth opportunities in the international power generation market by expanding our marketing and operational presence in regions around the world where we expect continued demand growth and increased need for aftermarket services for both fossil and renewable (waste to energy and biomass) power generation. We believe significant growth opportunities exist as a result of many factors, including economic growth, particularly in emerging economies, where we expect demand for new power generation capacity to continue to rise as economic development continues; and continued development of environmental regulation globally, which we expect to continue to drive demand for cleaner power generation technologies, as well as environmental systems and other devices that abate emissions from existing plants.
Continue Disciplined Acquisition Program with Successful Integration
Our management team has demonstrated its ability to identify business acquisition opportunities, consummate acquisitions and integrate acquired businesses effectively. We will continue to seek and execute additional strategic acquisitions that focus on expanding our existing capabilities as well as entering into new,
-65-
Table of Contents
adjacent markets. In June 2014, we purchased MEGTEC for $142.8 million, net of cash acquired, which expanded our product and services offerings in new industrial end markets. We plan to augment organic growth opportunities for MEGTEC’s current portfolio with acquisitions to expand our suite of technologies, with a focus on key abatement technologies, to establish additional channels to market and to extend our geographic footprint.
Maintain our Commitment to Safety
We value the health and safety of all employees and seek to provide a workplace that is free of accidents and injuries. Through our safety processes, we are dedicated to preventing accidents and their associated costs by averting, eliminating or mitigating unsafe acts and conditions, and by responding properly to emergency situations. A safe work environment benefits our employees, our customers and our business partners and is a key element to our future success.
Segment Description
After the spin-off, we will operate in three reportable segments. Currently, we have a fourth segment, our Nuclear Energy segment. This segment supplies commercial nuclear steam generators and components to nuclear utility customers. In connection with the spin-off, we will transfer the assets and liabilities associated with this segment to the Company. After the spin-off, our three segments will be as follows:
Global Power
Our Global Power segment represents our worldwide new build boiler and environmental products businesses that serve large steam generating and industrial customers. The segment provides a full suite of product and service offerings including engineering, procurement, manufacturing, construction and commissioning. Our boilers include utility boilers and industrial boilers fired with coal, oil and natural gas as well as renewables including biomass and municipal solid waste. Our boiler products include advanced supercritical boilers, subcritical boilers, fluidized bed boilers, biomass-fired boilers, waste-to-energy boilers, chemical recovery boilers, industrial power boilers, package boilers, heat recovery steam generators, waste heat boilers and solar thermal power systems.
Our environmental systems offerings include air pollution control products and related equipment for the treatment of nitrogen oxides, sulfur dioxide, fine particulate, mercury, acid gases and other hazardous air emissions, including carbon dioxide capture and sequestration technologies, wet and dry flue gas desulfurization systems, catalytic and non-catalytic nitrogen oxides reduction systems, low nitrogen oxides burners and overfire air systems, fabric filter baghouses, wet and dry electrostatic precipitators, mercury control systems and dry sorbent injection for acid gas mitigation.
We also receive license fees and royalty payments through licensing agreements on our proprietary technologies.
Global Services
Our Global Services segment provides a comprehensive mix of aftermarket products and services to support peak efficiency and availability of steam generating and associated environmental and auxiliary equipment, serving large steam generating utility and industrial customers globally. Our products and services include replacement parts, field technical services, retrofit and upgrade projects, fuel switching and repowering projects, construction and maintenance services, start-up and commissioning, training programs and plant operations and maintenance for our full complement of boiler, environmental and auxiliary equipment. Our auxiliary equipment includes boiler cleaning equipment and material handling equipment.
Industrial Environmental
Our Industrial Environmental segment represents our environmental products and services business serving numerous industrial end markets such as the chemical, pharmaceutical, energy storage, packaging, and automotive markets. The segment designs, engineers and manufactures products including oxidizers, solvent and distillation systems, wet and dry electrostatic precipitators, scrubbers and heat recovery systems. The segment also provides specialized industrial process systems and equipment.
-66-
Table of Contents
Acquisitions and Joint Ventures
We are currently exploring growth strategies across our segments through acquisitions to expand and complement our existing business. As we pursue these opportunities, we expect they would be funded by cash on hand and/or external financing including debt, equity or some combination thereof.
Acquisitions
In June 2014, we completed the acquisition of MEGTEC for $142.8 million, net of cash acquired. MEGTEC designs, engineers, manufactures and services air pollution control systems and coating / drying equipment for a variety of industrial applications and complements environmental products and solutions offerings.
In November 2011, we acquired Anlagenbau und Fördertechnik Arthur Loibl GmbH (“Loibl”), a German-based manufacturer of material handling equipment for $24.2 million. Loibl expands the products, services and global reach of our Allen-Sherman-Hoff business, which is one of the world’s leading suppliers of ash handling solutions for the power generation and other industries.
In April 2010, we acquired the assets of the electrostatic precipitator aftermarket and emissions monitoring business units of GE Energy, a division of General Electric Company, for approximately $21.4 million. This acquisition includes GE Energy’s electrostatic precipitator replacement parts and mechanical components product lines, performance-enhancing hardware, controls and software, remote diagnostics equipment and emissions monitoring products and services. These products and services are used by a wide variety of power generation and industrial customers to monitor and control particulates and other emissions from power plants, factories and other facilities.
In January 2010, we acquired the net assets of Gõtaverken Miljõ AB, a flue gas cleaning and energy recovery company based in Gothenburg, Sweden for approximately $8.6 million.
Joint Ventures
We participate in the ownership of a variety of entities with third parties, primarily through corporations, limited liability companies and partnerships, which we refer to as “joint ventures.” We enter into joint ventures primarily for specific market access and to enhance our manufacturing, design and global production operations as well as reduce operating and financial risk profiles. We generally account for our investments in joint ventures under the equity method of accounting. Our unconsolidated joint ventures are described below.
| • | Halley & Mellowes Pty. Ltd. (“HMA”). Diamond Power International, Inc., one of our wholly owned subsidiaries, owns an interest in this Australian company, which was formed in 1984. HMA manufactures, sells and services a wide range of capital plant equipment to a diverse range of industries. These include the mining, processing, materials handling, water management, power generation, and oil and gas industries. HMA offers complete service, from equipment selection to installation to commissioning and maintenance, with offices and service facilities located in and serving Australia, New Zealand, Indonesia and South Africa. |
| • | Babcock & Wilcox Beijing Company, Ltd. We own equal interests in this entity with Beijing Jingcheng Machinery Electric Holding Company, Ltd. Babcock & Wilcox Beijing Company, Ltd. was formed in 1986 and is located in Beijing, China. Its main activities are the design, manufacture, production and sale of various power plant and industrial boilers. This entity expands our markets internationally and provides additional capacity to our boiler products. |
| • | Thermax Babcock & Wilcox Energy Solutions Private Limited. In June 2010, one of our subsidiaries and Thermax Ltd., a boiler manufacturer based in India, formed a joint venture to build subcritical and highly efficient supercritical boilers and pulverizers for the Indian utility boiler market. We have licensed to the joint venture our technology for subcritical boilers 300 MW and larger, highly efficient supercritical boilers and coal pulverizers. In 2013, the joint venture finalized construction of a facility in India designed to produce parts for up to 3,000 MW of utility boiler capacity per year. |
-67-
Table of Contents
| • | BWM Ottumwa Environmental Partners. Through our subsidiary Babcock & Wilcox Construction Co., Inc., we formed BWM Ottumwa Environmental Partners, a joint venture with Burns & McDonnell Engineering Company, Inc., to engineer, procure, and construct environmental control systems for the Ottumwa Generating Station. This project is nearing completion. |
Backlog
Backlog represents the dollar amount of revenue we expect to recognize in the future from contracts awarded and in progress. Not all of our expected revenue from a contract award is recorded in backlog for a variety of reasons, including that some projects are awarded and completed within the same fiscal period.
Backlog is not a measure defined by generally accepted accounting principles. It is possible that our methodology for determining backlog may not be comparable to methods used by other companies. Backlog may not be indicative of future operating results, and projects in our backlog may be cancelled, modified or otherwise altered by customers.
We generally include expected revenue from contracts in our backlog when we receive written confirmation from our customers authorizing the performance of work and committing the customer to payment for work performed. Accordingly, we exclude from backlog orders or arrangements that have been awarded but that we have not been authorized to begin performance.
After giving effect to the distribution, our backlog at March 31, 2015 and December 31, 2014 and 2013 was as follows:
| March 31, 2015 |
December 31, 2014 |
December 31, 2013 |
||||||||||||||||||||||
| (Unaudited) | ||||||||||||||||||||||||
| (In millions) | ||||||||||||||||||||||||
| Global Power |
$ | 1,281 | 50 | % | $ | 946 | 42 | % | $ | 891 | 43% | |||||||||||||
| Global Services |
1,213 | 47 | % | 1,229 | 55 | % | 1,181 | 57% | ||||||||||||||||
| Industrial Environmental |
87 | 3 | % | 72 | 3 | % | - | -% | ||||||||||||||||
|
|
||||||||||||||||||||||||
| Total Backlog |
$ | 2,581 | 100 | % | $ | 2,247 | 100 | % | $ | 2,072 | 100% | |||||||||||||
|
|
||||||||||||||||||||||||
We do not include the value of our unconsolidated joint venture contracts in backlog. See Note 3 to the audited combined financial statements included in this prospectus for financial information on our equity method investments.
Of the March 31, 2015 backlog, we expect to recognize revenues as follows:
| 2015 |
2016 |
Thereafter |
Total |
|||||||||||||
| (Unaudited) | ||||||||||||||||
| (In approximate millions) | ||||||||||||||||
| Global Power |
$ | 422 | $ | 430 | $ | 429 | $ | 1,281 | ||||||||
| Global Services |
423 | 173 | 617 | 1,213 | ||||||||||||
| Industrial Environmental |
71 | 16 | - | 87 | ||||||||||||
|
|
||||||||||||||||
| Total Backlog |
$ | 916 | $ | 619 | $ | 1,046 | $ | 2,581 | ||||||||
|
|
||||||||||||||||
Competition
With more than 145 years of experience and having supplied more than 300,000 MW of equivalent steam-generating capacity in more than 800 facilities in over 90 countries and some of the world’s largest and most efficient steam-generating systems, we have a competitive advantage in our experience and technical capability to reliably convert a wide range of fuels to steam. Our strong, installed base in North America also yields competitive advantages in the Global Services segment, although this segment of the market is highly competitive and price sensitive. We compete with a number of domestic and foreign-based companies specializing in steam generating systems technology, equipment and services, including Alstom S.A., Doosan Babcock, Babcock Power, Inc., Foster Wheeler AG., and Hitachi, Ltd.; a variety of engineering and construction companies with
-68-
Table of Contents
respect to the installation of steam-generating systems; a number of additional companies in the markets for environmental control equipment and related specialized industrial equipment; and other suppliers of replacement parts, repair and alteration services and other services required to retrofit and maintain existing steam systems. The primary bases of competition are price, technical capabilities, quality, timeliness of performance, breadth of products and services and willingness to accept project risks.
Foreign Operations
Our Canadian operations serve the Canadian electric utility, industrial power and oil production markets. Our operations in Denmark provide comprehensive services to companies in the waste-to-energy sector of the power generation market, primarily in eastern and western Europe. Our joint ventures in China and India primarily serve the power generation needs of their local domestic and other utility markets. The functional currency of these entities is not the U.S. dollar, and as a result, we are subject to exchange rate fluctuations that impact our financial position, results of operations and cash flows. After giving effect to the distribution, our revenues and operating income (which excludes the MTM adjustment and special charges for restructuring activities that are accounted for at the combined level) derived from operations located outside of the United States, as well as the approximate percentages of our total combined revenues and operating income, respectively, for each of the last three years were as follows (dollars in thousands):
| Revenues | Operating Income | |||||||||||
| Amount | Percent of Total Combined |
Amount | Percent of Total Combined | |||||||||
| Quarter ended March 31, 2015 |
$ | 84,555 | 21 % | $ | 4,254 | 26 % | ||||||
| Quarter ended March 31, 2014 |
$ | 61,446 | 20 % | $ | (6,304 | ) | (86) % | |||||
| Year ended December 31, 2014 |
$ | 400,070 | 27 % | $ | 27,242 | 32 % | ||||||
| Year ended December 31, 2013 |
$ | 485,854 | 27 % | $ | 62,901 | 44 % | ||||||
| Year ended December 31, 2012 |
$ | 435,512 | 24 % | $ | 48,867 | 28 % | ||||||
Our revenues exclude revenues attributable to our joint ventures accounted for under the equity method of accounting, while our operating income includes results from joint ventures accounted for under the equity method.
For additional information on the geographic distribution of our revenues, see Note 16 to the audited combined financial statements included in this prospectus.
Raw Materials and Suppliers
Our operations use raw materials such as carbon and alloy steels in various forms and components and accessories for assembly, which are available from numerous sources. We generally purchase these raw materials and components as needed for individual contracts. We do not depend on a single source of supply for any significant raw materials.
Although shortages of some raw materials have existed from time to time, no serious shortage exists at the present time.
Employees
At March 31, 2015, we employed approximately 6,000 persons worldwide, not including 2,500 joint venture employees. We consider our relationships with our employees to be satisfactory.
Patents and Technology Licenses
We currently hold a large number of U.S. and foreign patents and have patent applications pending. We have acquired patents and technology licenses and granted technology licenses to others when we have considered it advantageous for us to do so. Although in the aggregate our patents and licenses are important to us, we do not regard any single patent or license or group of related patents or licenses as critical or essential to our business as a whole. In general, we depend on our technological capabilities and the application of know-how, rather than patents and licenses, in the conduct of our various businesses.
-69-
Table of Contents
Research and Development Activities
Our research and development activities are related to the development and improvement of new and existing products and equipment, as well as conceptual and engineering evaluation for translation into practical applications. We charge to research and development cost the costs of research and development unrelated to specific contracts as incurred. After giving effect to the distribution, research and development activities totaled $4.5 million and $4.0 million in the quarters ended March 31, 2015 and 2014, respectively, and $18.5 million, $21.0 million and $23.0 million in the years ended December 31, 2014, 2013 and 2012, respectively.
Hazard Risks and Insurance
Our operations present risks of injury to or death of people, loss of or damage to property and damage to the environment. We have created loss control systems to assist us in the identification and treatment of the hazard risks presented by our operations, and we endeavor to make sure these systems are effective.
As loss control measures will not always be successful, we seek to establish various means of funding losses and liability related to incidents or occurrences. We primarily seek to do this through contractual protections, including waivers of consequential damages, indemnities, caps on liability, liquidated damage provisions, and access to the insurance of other parties. We also procure insurance and/or establish funded or unfunded reserves and after the spin-off, will operate our own captive insurance company. However, none of these methods will eliminate all risks.
Depending on competitive conditions, the nature of the work, industry custom and other factors, we may not be successful in obtaining adequate contractual protection from our customers and other parties against losses and liabilities arising out of or related to the performance of our work. The scope of the protection may be limited, may be subject to conditions and may not be supported by adequate insurance or other means of financing. In addition, we sometimes have difficulty enforcing our contractual rights with others following a material loss.
Similarly, insurance for certain potential losses or liabilities may not be available or may only be available at a cost or on terms we consider not to be economical. Insurers frequently react to market losses by ceasing to write or severely limiting coverage for certain exposures. Risks that we have frequently found difficult to cost-effectively insure against include, but are not limited to, business interruption, property losses from wind, flood and earthquake events, war and confiscation or seizure of property in some areas of the world, pollution liability, liabilities related to occupational health exposures (including asbestos), liability related to our executives participating in the management of certain outside entities, professional liability/errors and omissions coverage, the failure, misuse or unavailability of our information systems, the failure of security measures designed to protect our information systems from security breaches and liability related to risk of loss of our work in progress and customer-owned materials in our care, custody and control. In cases where we place insurance, we are subject to the credit worthiness of the relevant insurer(s), the available limits of the coverage, our retention under the relevant policy, exclusions in the policy and gaps in coverage.
Upon completion of the spin-off, our wholly owned captive insurance subsidiary will provide workers’ compensation, employer’s liability, commercial general liability and automotive liability insurance to support our operations. We may also have business reasons in the future to have our insurance subsidiary accept other risks which we cannot or do not wish to transfer to outside insurance companies. These risks may be considerable in any given year or cumulatively. Our insurance subsidiary has not provided significant amounts of insurance to unrelated parties. Claims as a result of our operations could adversely impact the ability of our insurance subsidiary to respond to all claims presented.
Additionally, upon the February 22, 2006 effectiveness of the settlement relating to the Chapter 11 proceedings involving several of our subsidiaries, most of our subsidiaries contributed substantial insurance rights to the asbestos personal injury trust, including rights to (1) certain pre-1979 primary and excess insurance coverages and (2) certain of our 1979-1986 excess insurance coverage. These insurance rights provided coverage for, among other things, asbestos and other personal injury claims, subject to the terms and conditions of the policies. The contribution of these insurance rights was made in exchange for the agreement on the part of the representatives of the asbestos claimants, including the representative of future claimants, to the entry of a permanent injunction, pursuant to Section 524(g) of the U.S. Bankruptcy Code, to channel to the asbestos trust all asbestos-related claims against our subsidiaries and former subsidiaries arising out of, resulting from or attributable to their operations, and the implementation of related releases and indemnification provisions
-70-
Table of Contents
protecting those subsidiaries and their affiliates from future liability for such claims. Although we are not aware of any significant, unresolved claims against our subsidiaries and former subsidiaries that are not subject to the channeling injunction and that relate to the periods during which such excess insurance coverage related, with the contribution of these insurance rights to the asbestos personal injury trust, it is possible that we could have underinsured or uninsured exposure for non-derivative asbestos claims or other personal injury or other claims that would have been insured under these coverages had the insurance rights not been contributed to the asbestos personal injury trust.
Governmental Regulations and Environmental Matters
General
Many aspects of our operations and properties are affected by political developments and are subject to both domestic and foreign governmental regulations, including those relating to:
| • | constructing and equipping electric power and other steam-generating facilities; |
| • | workplace health and safety; |
| • | currency conversions and repatriation; |
| • | taxation of foreign earnings and earnings of expatriate personnel; and |
| • | protecting the environment. |
We are required by various governmental and quasi-governmental agencies to obtain certain permits, licenses and certificates with respect to our operations. The kinds of permits, licenses and certificates required in our operations depend upon a number of factors. We are not aware of any material noncompliance and believe our operations and certifications are currently in compliance with all relevant permits, licenses and certifications.
We cannot determine the extent to which new legislation, new regulations or changes in existing laws or regulations may affect our future operations.
Environmental
Our operations and properties are subject to a wide variety of increasingly complex and stringent foreign, federal, state and local environmental laws and regulations, including those governing discharges into the air and water, the handling and disposal of solid and hazardous wastes, the remediation of soil and groundwater contaminated by hazardous substances and the health and safety of employees. Sanctions for noncompliance may include revocation of permits, corrective action orders, administrative or civil penalties and criminal prosecution. Some environmental laws provide for strict, joint and several liability for remediation of spills and other releases of hazardous substances, as well as damage to natural resources. In addition, companies may be subject to claims alleging personal injury or property damage as a result of alleged exposure to hazardous substances. Such laws and regulations may also expose us to liability for the conduct of or conditions caused by others or for our acts that were in compliance with all applicable laws at the time such acts were performed.
These laws and regulations include the Comprehensive Environmental Response, Compensation, and Liability Act of 1980, as amended (“CERCLA”), the Clean Air Act, the Clean Water Act, the Resource Conservation and Recovery Act and similar laws that provide for responses to, and liability for, releases of hazardous substances into the environment. These laws and regulations also include similar foreign, state or local counterparts to these federal laws, which regulate air emissions, water discharges, hazardous substances and waste and require public disclosure related to the use of various hazardous substances. Our operations are also governed by laws and regulations relating to workplace safety and worker health, including the U.S. Occupational Safety and Health Act and regulations promulgated thereunder.
We cannot predict all of the environmental requirements or circumstances that will exist in the future but anticipate that environmental control and protection standards will become increasingly stringent and costly. Based on our experience to date, we do not currently anticipate any material adverse effect on our business or financial condition as a result of future compliance with existing environmental laws and regulations. However, future
-71-
Table of Contents
events, such as changes in existing laws and regulations or their interpretation, more vigorous enforcement policies of regulatory agencies or stricter or different interpretations of existing laws and regulations, may require additional expenditures by us, which may be material. Accordingly, we can provide no assurance that we will not incur significant environmental compliance costs in the future.
We have been identified as a potentially responsible party at various cleanup sites under CERCLA. CERCLA and other environmental laws can impose liability for the entire cost of cleanup on any of the potentially responsible parties, regardless of fault or the lawfulness of the original conduct. Generally, however, where there are multiple responsible parties, a final allocation of costs is made based on the amount and type of wastes disposed of by each party and the number of financially viable parties, although this may not be the case with respect to any particular site. We have not been determined to be a major contributor of wastes to any of these sites. On the basis of our relative contribution of waste to each site, we expect our share of the ultimate liability for the various sites will not have a material adverse effect on our combined financial condition, results of operations or cash flows in any given year.
The demand for power generation services and products can be influenced by state and federal governmental legislation setting requirements for utilities related to operations, emissions and environmental impacts. The legislative process is unpredictable and includes a platform that continuously seeks to increase the restrictions on power producers. Potential legislation limiting emissions from power plants, including carbon dioxide, could affect our markets and the demand for our products and services.
Properties
Following the spin-off, our properties will consist of the following:
| Business Segment and Location | Principal Use | Owned/Leased (Lease Expiration) | ||
| Global Power / Global Services |
||||
| Barberton, Ohio |
Manufacturing facility / administrative office | Owned(1) | ||
| West Point, Mississippi |
Manufacturing facility | Owned(1) | ||
| Lancaster, Ohio |
Manufacturing facility | Owned(1) | ||
| Copley, Ohio |
Warehouse / service center | Owned(1) | ||
| Esbjerg, Denmark |
Manufacturing facility | Owned | ||
| Dumbarton, Scotland |
Manufacturing facility | Owned | ||
| Straubing, Germany |
Manufacturing facility | Leased (2021) | ||
| Guadalupe, NL, Mexico |
Manufacturing facility | Leased (2024) | ||
| Melville, Saskatchewan, Canada |
Manufacturing facility | Owned | ||
| Jingshan, Hubei, China |
Manufacturing facility | Owned | ||
| Industrial Environmental |
||||
| De Pere, Wisconsin |
Manufacturing facility / administrative office | Owned(1) | ||
| Shanghai, China |
Manufacturing facility | Owned | ||
| Corporate |
||||
| Charlotte, North Carolina |
Administrative office | Leased (2019) | ||
| (1) | These properties are encumbered by liens under the Existing Credit Agreement. |
Legal Proceedings
PGG OpCo has been named as a defendant, along with Babcock & Wilcox Technical Services Group, Inc., formerly known as B&W Nuclear Environmental Services, Inc. (“TSG”) and Atlantic Richfield Company (“ARCO”), in 16 lawsuits filed the United States District Court for the Western District of Pennsylvania since January 2010, however, the most recently filed lawsuit was dismissed in March 2015. Excluding this recently dismissed lawsuit, the lawsuits presently involve a total of approximately 93 primary claimants, who have alleged, among other things, personal injuries and property damage as a result of alleged releases of radioactive material relating to the operation, remediation, and/or decommissioning of two former nuclear fuel processing facilities located in the Borough of Apollo and Parks Township, Pennsylvania (collectively, the “Apollo and Parks
-72-
Table of Contents
Litigation”). Those facilities previously were owned by Nuclear Materials and Equipment Company, a former subsidiary of ARCO (“NUMEC”), which was acquired by PGG OpCo. The plaintiffs in the Apollo and Parks Litigation seek compensatory and punitive damages. At the time of ARCO’s sale of NUMEC stock to PGG OpCo, PGG OpCo received an indemnity and hold harmless agreement from ARCO with respect to claims and liabilities arising prior to or as a result of conduct or events predating the acquisition. Moreover, in connection with the spin-off, the Company has agreed to indemnify and hold New B&W and its affiliates harmless with respect to claims and liabilities arising from the Apollo and Parks Litigation to the extent that such claims and liabilities are not covered by the ARCO indemnity or available insurance. Insurance coverage, the ARCO indemnity and/or the Company indemnity currently provide coverage for the claims alleged in the Apollo and Parks Litigation, although no assurance can be given that insurance and/or the indemnities will be available or sufficient in the event of liability, if any.
For information on our other legal proceedings, see Note 10 to the audited combined financial statements.
-73-
Table of Contents
CERTAIN RELATIONSHIPS AND RELATED TRANSACTIONS
In connection with the spin-off, we will enter into several agreements with the Company to define our ongoing relationship with the Company after the spin-off. These agreements, among other things, will allocate responsibility for obligations arising before and after the distribution date, including, among others, obligations relating to our employees, various transition services and taxes. For more information about those agreements and our historical relationship with the Company, see “Relationship with the Company After the Spin-Off.”
Related Person Transactions Policies and Procedures
We expect that our Audit and Finance Committee will adopt a policy, which will be made available on our website, that will require all employees (including our Named Executive Officers) who have, or whose immediate family members have, any direct or indirect financial or other participation in any business that competes with, supplies goods or services to, or is a customer of ours, to disclose to us and receive written approval from our Corporate Ethics and Compliance department prior to transacting such business. We refer to any such transaction as a related person transaction.
Our employees are expected to make reasoned and impartial decisions in the workplace. As a result, approval of certain business will be denied if we believe that the employee’s interest in such business could influence decisions relative to our business, or have the potential to adversely affect our business or the objective performance of the employee’s work.
Our Corporate Ethics and Compliance department will implement our Code of Business Conduct and related policies and the Audit and Finance Committee of our Board will be responsible for overseeing our Ethics and Compliance Program, including compliance with our Code of Business Conduct. Our Code of Business Conduct provides that all employees (including Named Executive Officers) must ensure that business decisions they make and actions they take on behalf of New B&W are not influenced by personal considerations or personal relationships and will require appropriate disclosures of potential conflicts of interest.
Additionally, our Governance Committee will be responsible for reviewing the professional occupations and associations of the members of our board of directors. Our Audit and Finance Committee will review transactions between New B&W and other companies with which the members of our board of directors are affiliated.
-74-
Table of Contents
RELATIONSHIP WITH THE COMPANY AFTER THE SPIN-OFF
Historical Relationship with the Company
We are currently a wholly owned subsidiary of the Company. We were incorporated in Delaware on January 13, 2015. In conjunction with the spin-off, the Company will transfer to us generally all the assets and generally all the liabilities relating to its Power Generation business, which the Company intends to separate from its Government and Nuclear Operations business. In the ordinary course of our business, we have received various services provided by the Company, including accounting, treasury, tax, legal, risk management, human resources, information technology and other services. Our historical financial statements include allocations by the Company of a portion of its overhead costs related to those services. These cost allocations have been determined on a basis that we and the Company consider to be reasonable reflections of the use of those services.
The Company’s Distribution of Our Stock
The Company will be our sole stockholder until completion of the spin-off. In the spin-off, the Company is distributing its entire equity interest in us to its stockholders in a transaction that is intended to be tax-free to the Company and its U.S. stockholders. The spin-off will be subject to a number of conditions, some of which are more fully described above under “The Spin-Off—Spin-Off Conditions and Termination.”
Agreements Between the Company and Us
In the discussion that follows, we have described the material provisions of agreements we have entered into or will enter into with the Company in connection with the spin-off. The description of those agreements is not complete and is qualified by reference to the terms of the agreements, the forms of which are included as exhibits to the registration statement of which this prospectus forms a part. We encourage you to read the full text of those agreements. Those agreements were developed under the oversight of the board of directors of the Company. Because the terms of our separation from the Company and these agreements are being entered into in the context of a related-party transaction, these terms may not be comparable to terms that would be obtained in a transaction between unaffiliated parties.
Master Separation Agreement
The master separation agreement between the Company and us governs the separation of our business from the Company, the subsequent distribution of our shares to Company stockholders and other matters related to the Company’s relationship with us.
The Separation. To effect the separation, the Company will effect a series of transactions that will cause us to own generally all of the assets of our business as described in this prospectus (which assets may include stock or other equity interests of Company subsidiaries). We will also succeed to, and intend to agree to perform and fulfill, the liabilities described below. In particular, the master separation agreement generally provides that, upon completion of the separation:
| • | we will directly or indirectly hold: |
| • | all of the assets owned by the Company or any of its subsidiaries which are reflected on our most recent pro forma combined balance sheet set forth in this prospectus, or subsequently-acquired or created assets that would have been reflected on a pro forma balance sheet dated as of the time of the spin-off, and |
| • | all other assets held by us, the Company, or any of our respective subsidiaries used primarily in or that primarily relate to our business on or prior to the distribution date, subject to certain exceptions; |
| • | we will be subject to: |
| • | all outstanding liabilities reflected on our most recent pro forma combined balance sheet set forth in this prospectus, or subsequently-incurred or accrued liabilities that would have been reflected on a pro forma balance sheet dated as of the time of the spin-off, |
-75-
Table of Contents
| • | liabilities we have assumed under the master separation agreement, including, generally, any liability arising primarily out of our assets or the operation of our business and a percentage of certain liabilities shared with the Company, and other ancillary agreements. |
The master separation agreement provides that assets or liabilities that cannot legally be transferred or assumed prior to the spin-off will be transferred or assumed as soon as practicable following receipt of all necessary consents of third parties and regulatory approvals. In any such case, the master separation agreement provides that the party retaining such assets or liabilities will hold the assets in trust for the use and benefit of, or retain the liabilities for the account of, the party entitled to the assets or liabilities (at the expense of that party), until the transfer or assumption can be completed. The party retaining the assets or liabilities will also take any action reasonably requested by the other party in order to place the other party in the same position as would have existed if the transfer or assumption had been completed.
Except as set forth in the master separation agreement, no party is making any representation or warranty as to the companies’ business, assets or liabilities transferred or assumed as a part of the separation and any assets that may be transferred will be transferred on an “as is, where is” basis. As a result, we and the Company each have agreed to bear the economic and legal risks that any conveyances of assets are insufficient to vest good and marketable title to such capital stock or assets, as the case may be, in the party who should have title under the master separation agreement. The master separation agreement also provides that the spin-off is subject to the conditions described under “The Spin-Off—Spin-Off Conditions and Termination.”
Surety Instruments and Guarantees. The master separation agreement requires that we and the Company use our commercially reasonable efforts to terminate (or have us or one of our subsidiaries substituted for the Company, or the Company or one of its subsidiaries substituted for us, as applicable, under) all existing guarantees by one party of obligations relating to the business of the other party. We also have agreed with the Company that we will use our commercially reasonable efforts and the Company will use its commercially reasonable efforts to replace surety instruments issued by third parties for the account of the Company or any of its subsidiaries or us but on behalf of the others’ business. In the event we or the Company are unable to terminate any such guarantees, or replace existing surety instruments, we or the Company will indemnify the other for any claims or losses pursuant to these instruments. If any such guarantees are not terminated within 24 months of the spin-off, we will or the Company will be required to pay a fee to the other of 0.225% of the amount of the guarantees. In addition, if we undergo a change of control, we may be required to provide the Company with indemnity bonds or letters of credit to enhance our indemnity obligations.
Insurance. The master separation agreement provides that, to the extent permitted by the terms of the applicable policy, we and our directors, officers and employees and the Company, its directors, officers and employees will continue to have (as successors-in-interest) all rights that we and they had immediately prior to the spin-off, with respect to events that occurred prior to the spin-off under any New B&W or Company insurance policy with a third-party carrier. Neither New B&W nor the Company will have any liability if any insurance policy is terminated, is not renewed or extended, or is insufficient or unavailable. In addition, the Company is required to use commercially reasonable efforts to maintain certain “tail coverage.”
Access to Information. Subject to applicable confidentiality provisions and other restrictions, we and the Company will each give each other any information in our possession that the requesting party reasonably needs (1) to comply with requirements imposed on the requesting party by a governmental authority, (2) for use in any proceeding or to satisfy audit, accounting, claims, regulatory, litigation or other similar requirements, (3) to comply with its obligations under the master separation agreement, other ancillary agreements or third party agreements or (4) for any other significant business need as mutually determined in good faith by the parties.
Indemnification and Release. In general, under the master separation agreement, we have agreed to indemnify the Company against certain liabilities to the extent relating to, arising out of or resulting from:
| • | our failure to discharge any of our liabilities; |
| • | our failure to perform any of our agreements with the Company; |
| • | the operation of our business, whether before or after the spin-off; |
| • | any untrue statement or alleged untrue statement of a material fact or material omission or alleged material omission in the registration statement of which this prospectus is a part, other than certain information relating to the Company; and |
-76-
Table of Contents
| • | a percentage of certain liabilities that are to be shared with the Company. |
In general, under the master separation agreement, the Company has agreed to indemnify us against certain liabilities from third-party claims to the extent relating to, arising out of or resulting from:
| • | the failure of the Company to discharge any liability of the Company; |
| • | the failure of the Company to perform any agreement of the Company with us; |
| • | any untrue statement or alleged untrue statement of a material fact or material omission or alleged material omission in the registration statement of which this prospectus is part, only for certain information relating to the Company; |
| • | the use by the Company of the New B&W name or similar name in any corporate name or in any of their respective business or operations; and |
| • | a percentage of certain liabilities that are to be shared with us. |
Under the master separation agreement, we generally release the Company and its successors and assigns, and the Company generally releases us and our successors and assigns, from any liabilities between us or our subsidiaries on the one hand, and the Company or its subsidiaries on the other hand, arising from acts or events occurring on or before the spin-off, including acts or events occurring in connection with the separation or distribution. This release will include the release of substantially all intercompany payables between the Company and us. The general release does not apply to obligations under the master separation agreement or any ancillary agreement, to specified ongoing contractual arrangements or to matters where the serving of such release would result in the release of any third parties.
Noncompetition. Under the master separation agreement, we generally agree not to engage in the Company’s core business for five years in certain territories. The Company also agrees not to engage in our core business for five years in certain territories.
Termination. The master separation agreement provides that it may be terminated at any time before the spin-off by the Company in its sole discretion.
Tax Sharing Agreement
We and the Company have entered into a tax sharing agreement that will govern the respective rights, responsibilities and obligations of the Company and its subsidiaries, and us with respect to taxes and tax benefits, the filing of tax returns, the control of audits and other tax matters. References in this summary description of the tax sharing agreement to the terms “tax” or “taxes” mean taxes as well as any interest, penalties, additions to tax or additional amounts in respect of such taxes.
Our results of U.S. operations and/or those of certain of our subsidiaries are currently reflected in the Company’s consolidated return for U.S. federal income tax purposes and/or certain consolidated, combined and unitary returns for state, local and foreign tax purposes. However, for periods (or portions thereof) beginning after the transaction in which we are separated from the Company and its subsidiaries (the “Separation Transaction”), we generally will not join with the Company and its subsidiaries in any federal, state, local or foreign consolidated, combined or unitary tax returns.
Under the tax sharing agreement, for any tax period (or portion thereof), we will generally be responsible for paying all U.S. federal, state, local and foreign income taxes that are imposed on us and our subsidiaries, and the Company will be responsible for paying all U.S. federal, state, local and foreign income taxes that are imposed on the Company and its subsidiaries.
We and the Company generally will not be required to reimburse one another for the use by one party or its affiliates of tax benefits attributable to the other party or its affiliates. However, we will have an obligation to reimburse the Company, and the Company will have an obligation to reimburse us, for:
-77-
Table of Contents
| • | tax benefits arising as a result of an audit or other required adjustment occurring after the date of the Separation Transaction that are attributable to one party or its affiliates and used by the other party or its affiliates during tax periods (or portions thereof) ending on or prior to the date of the Separation Transaction; and |
| • | tax benefits arising after the date of the Separation Transaction that are attributable to one party or its affiliates and that are carried back under applicable tax law and used by the other party or its affiliates during tax periods (or portions thereof) ending on or prior to the date of the Separation Transaction. |
Notwithstanding the tax sharing agreement, under U.S. Treasury Regulations, each member of a U.S. consolidated group is severally liable for the U.S. federal income tax liability of each other member of that consolidated group. Accordingly, with respect to periods in which we or our subsidiaries have been included in the Company’s U.S. consolidated group, we and our subsidiaries could be liable to the U.S. Government for any U.S. federal income tax liability incurred, but not discharged, by the Company or its subsidiaries. However, if any such liability were imposed, we would generally be entitled to be indemnified by the Company for tax liabilities attributable to it under the tax sharing agreement.
We or the Company will be responsible for preparing and filing all consolidated, combined and unitary tax returns that include us or our subsidiaries and the Company or its subsidiaries (regardless of when the tax period ends), in accordance with which of us is the taxpayer or tax filer of record. We will be responsible for preparing and filing all tax returns that include solely us or our subsidiaries, and the Company will be responsible for preparing and filing all tax returns that include solely the Company or its subsidiaries. The party that files a tax return will have the authority to respond to and appear in all tax proceedings, including tax audits, involving any taxes or any deemed adjustment to taxes reported on such tax return, although the other party will have certain rights to be consulted and/or to participate in proceedings that may affect its tax liability. The tax sharing agreement further provides for cooperation between us and the Company with respect to tax matters, the exchange of information and the retention of records that may affect the tax liabilities of the parties to the agreement.
To the extent permitted by applicable tax law, we and the Company will treat any payments made under the tax sharing agreement as a capital contribution or distribution (as applicable) immediately prior to the Separation Transaction, and accordingly, as not includible in the taxable income of the recipient.
In the event that the Separation Transaction and/or certain related transactions were to fail to qualify for tax-free treatment, we and the Company would generally share responsibility for all of the tax imposed on us or the Company resulting from such failure. However, if such failure resulted from actions or failures to act by us or our subsidiaries or the Company or its subsidiaries, we or the Company, respectively, would be responsible for such tax.
THIS SUMMARY IS QUALIFIED BY REFERENCE TO THE FULL TEXT OF THE TAX SHARING AGREEMENT, A FORM OF WHICH IS INCLUDED AS AN EXHIBIT TO THE REGISTRATION STATEMENT OF WHICH THIS PROSPECTUS IS A PART.
IP Matters Agreements
In connection with the spin-off, we will enter into agreements with the Company regarding (1) the post spin-off allocation of ownership of intellectual property between the Company on the one hand and us on the other hand and (2) the licensing of certain intellectual property, including know-how, patents, software and copyrights. All ownership transfers and licenses will be made on an “as is, where is” basis, consistent with the approach taken in the master separation agreement. With respect to allocating ownership of intellectual property, we will assign to the Company all of our right, title and interest in and to certain specified intellectual property and the Company will assign to us all of its right, title and interest in and to certain specified intellectual property. We will retain exclusive ownership of such intellectual property and all other intellectual property we own. We will retain all rights in our trademarks, provided that we agree to permit the Company to register trademarks associated with its new corporate name and to refrain from taking any actions to challenge those trademarks.
With respect to licenses of intellectual property, the Company will license to us, rights to utilize the intellectual property currently used in our business that we do not otherwise own and additional specified
-78-
Table of Contents
intellectual property rights. We will license to the Company rights to utilize the intellectual property currently used in the Company’s business that it does not otherwise own and additional specified intellectual property rights. We and the Company will also grant to one another licenses to utilize certain shared intellectual property assets, including shared historical materials. All of the foregoing licenses will be granted on a perpetual royalty-free basis and will be exclusive in favor of the Company in the field of the Company’s core business and in favor of us in the field of our core business, which will be specifically defined in the relevant agreements.
Employee Matters Agreement
We and the Company have entered into an employee matters agreement, which will provide that each of the Company and New B&W will have responsibility for its own employees and compensation plans. The agreement will contain provisions concerning benefit protection for Company employees, treatment of holders of Company stock options, restricted stock units, deferred stock units and performance shares, and cooperation between us and the Company in the sharing of employee information and maintenance of confidentiality.
Treatment of Retirement, Health and Welfare Plans. In general, our employees currently participate in various retirement, health and welfare, and other employee benefit plans. Following the spin-off, we anticipate that our employees will generally continue to participate in the same plans or will participate in similar plans and arrangements that we will establish and maintain. Pursuant to the employee matters agreement, effective as of June 1, 2015, we and the Company will each retain responsibility for our respective employees and benefit and compensation plans.
Treatment of Stock-Based Awards. The employee matters agreement will also provide for the adjustments and replacement awards to be made with respect to options to purchase shares of Company common stock, restricted stock units, deferred stock units and performance shares.
Transition Services Agreements
We and the Company have entered into transition services agreements under which we and the Company will provide and/or make available various administrative services and assets to each other, for specified periods beginning on the distribution date.
The services the Company expects to provide us include:
| • | tax services; |
| • | accounting services; |
| • | records management services; |
| • | human resources services; |
| • | utility services; |
| • | legal services; and |
| • | information technology services. |
The services we expect to provide to the Company include:
| • | tax services; |
| • | accounting services; |
| • | records management services; |
| • | human resources services; and |
-79-
Table of Contents
| • | information technology services. |
In consideration for such services, we and the Company will each pay fees to the other for the services provided, and those fees will generally be in amounts intended to allow the party providing services to recover all of its direct and indirect costs incurred in providing those services.
The personnel performing services under the transition services agreements will be employees and/or independent contractors of the party providing the service and will not be under the direction or control of the party to whom the service is being provided.
The transition services agreements will also contain customary mutual indemnification provisions.
Any extension or renewal of services under any transition services agreement beyond the period specified with respect to such service will be subject to the mutual agreement of the Company and us.
Insurance Agreements
We (or certain of our affiliates) will enter into the following insurance agreements to transfer liabilities for insurance obligations associated with our operations from the Company to us:
Assumption and Loss Allocation Agreement. On or before the distribution date, New B&W, the Company and ACE American Insurance Company will enter into an assumption and loss allocation agreement related to the deductible reimbursement obligations that the Company has with ACE under its casualty insurance programs. The agreement specifies that ACE will only look to us for reimbursement of losses from our operations and will only look to the Company for reimbursement of losses from the Company’s operations. The agreement also allocates and assigns certain collateral between us and the Company.
Reinsurance Novation and Assumption Agreement. On or before the distribution date, Dampkraft Insurance Company, our captive insurance subsidiary, Creole Insurance Company, the Company’s captive insurance subsidiary, and ACE will enter into a Reinsurance Novation and Assumption Agreement related to reinsurance agreements where Creole reinsured insurance policies written on behalf of the Company. The agreement specifies that ACE will only look to us for payment of reinsurance obligations arising from our operations and only look to the Company for payment of reinsurance obligations from the Company’s operations. The agreement also allocates and assigns certain collateral between us and the Company.
Captive Novation and Assumption Agreement. On or before the distribution date, New B&W, Dampkraft, the Company and Creole will enter into a captive novation and assumption agreement to address how Dampkraft and Creole will manage liabilities attributed to its respective parent company’s obligation to ACE and other insurers as applicable. The agreement transfers liabilities from Creole to Dampkraft based on actuarially determined loss reserves that are specific to our and the Company’s claims history. The agreement also transfers assets from Creole to Dampkraft based on historical premium contributions from us and the Company. The agreement aligns the obligations of Dampkraft and Creole in a manner parallel to the obligations of New B&W and the Company in the assumption and loss allocation agreement.
-80-
Table of Contents
Directors and Executive Officers
Under Delaware law, the business and affairs of New B&W will be managed under the direction of its board of directors. The New B&W certificate of incorporation and bylaws provide that the number of directors may be fixed by the board from time to time. As of the distribution date, the board of directors of New B&W will consist of the individuals listed below (with their ages as of December 31, 2014), except that Ms. Dubin and Ms. Pramaggiore will be appointed to the board of directors of New B&W on July 1, 2015. The present principal occupation or employment and five-year employment history of each individual (other than Mr. Ferland, our Chairman and Chief Executive Officer, whose employment history is included under the list of our executive officers below) follows the list below.
| Name | Age | |||
| E. James Ferland |
48 | |||
| Thomas A. Christopher |
70 | |||
| Cynthia S. Dubin |
53 | |||
| Brian K. Ferraioli |
59 | |||
| Stephen G. Hanks |
64 | |||
| Anne R. Pramaggiore |
56 | |||
| Larry L. Weyers |
70 | |||
Thomas A. Christopher
Following his retirement in 2009, Mr. Christopher has provided independent consultant services to various energy industry participants. He also teaches a graduate level course in management principles at the University of Pittsburgh. From January 2009 until his retirement in June 2009, Mr. Christopher served as the Vice Chairman of Areva NP Inc. (“Areva”), a commercial nuclear power engineering, fuel and nuclear services company. Previously, he served as Areva’s President and Chief Executive Officer from April 2000 to January 2009 and served on Areva’s global Executive Committee in France from January 2005 until December 2008. Prior to joining Areva in 2000, Mr. Christopher served as Vice President and General Manager of Siemens/Westinghouse Power Services Divisions since August 1998, Vice President and General Manager of Westinghouse Energy Services Divisions from January 1996 until August 1998, and Vice President and General Manager of Westinghouse Global Nuclear Service Divisions from July 1982 until December 1996. Mr. Christopher also spent six years with the U.S. Navy as an officer in the nuclear submarine force, holding the naval reactors engineer certification.
Mr. Christopher is currently a member of the board of directors of EPM Holdings Inc., a nuclear engineering company. He previously served on the Executive Committee of the Board of Directors for the Nuclear Energy Institute from 2004 to 2008.
Mr. Christopher brings an extensive and unique understanding of fossil power operations, the power market and power engineering to the New B&W board of directors. As an energy business executive, he is familiar with our key customers and their investment decision making process. He is also experienced in managing international operations for energy services companies throughout the world. Mr. Christopher’s management experience and technical background in the energy industry make him well qualified to serve on our board of directors.
Cynthia S. Dubin
Since November 21, 2011, Ms. Dubin has served as Finance Director of JKX Oil & Gas plc, a publicly-held oil and gas exploration, development and production company. Prior to joining JKX Oil & Gas plc, she co-founded and served as Chief Financial Officer of Canamens Energy Limited, an oil and gas exploration and production company focused on the Caspian, North Africa, Middle East and North Sea regions, from 2006 to 2011. Prior to joining Canamens Energy Limited, Ms. Dubin served as Vice President and Finance Director, Europe, Middle East and Africa Division for Edison Mission Energy, a U.S. owned electric power generator which developed, acquired, financed, owned and operated reliable and efficient power systems. Ms. Dubin started her career at The Bank of New York and Mitsubishi Bank advising on and lending to large energy projects.
-81-
Table of Contents
Ms. Dubin brings valuable finance and energy industry experience to the New B&W board as well as a unique understanding of the global and European energy markets. With more than 22 years of experience in the energy sector combined with her financial expertise and her international leadership experience, Ms. Dubin is a valuable addition to our board of directors.
Brian K. Ferraioli
Mr. Ferraioli has served as Executive Vice President and Chief Financial Officer of KBR, Inc., a global engineering, construction and services company supporting the energy, hydrocarbons, power, mineral, civil infrastructure, government services, industrial and commercial markets, since October 2013. Prior to joining KBR, Inc., he served as Executive Vice President and Chief Financial Officer of The Shaw Group, Inc., a former NYSE listed global provider of technology, engineering, procurement, construction, maintenance, fabrication, manufacturing, consulting, remediation, and facilities management services to a diverse client base that includes regulated electric utilities, independent and merchant power producers, government agencies, multinational and national oil companies, and industrial corporations. Mr. Ferraioli was with Shaw from July 2007 until February 2013 when the company was acquired by Chicago Bridge & Iron Company N.V. His earlier positions include Vice President and Controller for Foster Wheeler, AG, a global engineering and construction company and Vice President and Chief Financial Officer of Foster Wheeler USA and of Foster Wheeler Power Systems, Inc.
Mr. Ferraioli has over 35 years of experience in senior level finance and accounting roles in the engineering and construction industry. In addition, his extensive background with publicly traded companies from our peer group makes him a valuable addition to our board of directors.
Stephen G. Hanks
Mr. Hanks is the former President and CEO of Washington Group International, Inc. (“Washington Group”), a global integrated engineering, construction and management services company, which merged with URS Corporation. He also served on its Board of Directors. Mr. Hanks has been retired since January 2008 and serves as a member of the board of directors of Lincoln Electric Holdings, Inc. (since 2006) and McDermott International, Inc. (“McDermott”) (since 2009).
Mr. Hanks brings to the New B&W board of directors valuable operations, industry and legal experience from one of the companies in our peer group through his 30 year background with Washington Group and its predecessor, Morrison Knudsen Corporation. He also provides financial experience, having served as Chief Financial Officer of Morrison Knudsen Corporation, and public company board experience through his service on the boards of Lincoln Electric Holdings, Inc. and McDermott.
Anne R. Pramaggiore
Since February 24, 2012, Ms. Pramaggiore has served as President and Chief Executive Officer of Commonwealth Edison Company (“ComEd”), an electric utility company. Prior to her current position, she served as ComEd’s President and Chief Operating Officer from May 2009 through February 23, 2012. Ms. Pramaggiore joined ComEd in 1998 and previously served as its Executive Vice President, Customer Operations, Regulatory and External Affairs from September 2007 to May 2009, Senior Vice President, Regulatory and External Affairs from November 2005 to September 2007 and Vice President, Regulatory and External Affairs from October 2002 to November 2005. She also served as its Lead Counsel. Ms. Pramaggiore is also a member of the Board of Directors of Motorola Solutions, Inc., where she has served since January 2013. In addition, Ms. Pramaggiore serves as a board member on the Chicago Federal Reserve Board.
Ms. Pramaggiore is a licensed attorney and brings to the New B&W board of directors extensive experience in the utilities industry, as highlighted by her years of service at ComEd. Her experience as a current executive at another public company and her perspective on the technical, regulatory, operational and financial aspects of the industry make her well qualified to serve on our board of directors.
Larry L. Weyers
In March 2010, Mr. Weyers retired as Chairman of Integrys Energy Group, Inc. (previously WPS Resources Corporation), a holding company with operations providing products and services in regulated and
-82-
Table of Contents
nonregulated energy markets. Previously, he served as its Chairman, President and Chief Executive Officer from February 1998 to December 2008, having joined Wisconsin Public Service Corporation, a utility subsidiary of Integrys Energy Group, Inc., in 1985. From 1998 through 2007, Mr. Weyers used internal growth and acquisitions to increase revenues from $878 million to $10.3 billion, increase income from $53.7 million to $251.3 million, and increase market cap from $808 million to $3.9 billion. The average annual return to shareholders exceeded 10%.
Mr. Weyers has served on boards in banking, hospital administration, electric transmission, the paper industry and insurance. Throughout his career he has served on numerous not-for-profit boards. Since July 2010, he has served as Vice President and Lead Director of the board of directors of Green Bay Packers, Inc., on which he has served since 2003.
Mr. Weyers brings a wealth of experience in the power generation industry to the New B&W board of directors and possesses substantial corporate leadership and governance skills. Having served over 24 years with Integrys Energy Group, Inc., he has extensive knowledge of the utility industry and provides a valuable resource for our power generation operations.
The directors named above who serve as directors of the Company will resign from the Company’s board of directors upon completion of the spin-off.
The individuals listed below (with their ages as of December 31, 2014) are expected to be executive officers of New B&W as of the distribution date. The business address of each of the individuals listed below is c/o Babcock & Wilcox Enterprises, Inc., The Harris Building, 13024 Ballantyne Corporate Place, Suite 700, Charlotte, North Carolina 28277. The present principal occupation or employment and five-year employment history of each individual follows the list below. These individuals will resign from their respective positions with the Company upon completion of the spin-off. Mr. Data is expected to leave New B&W after the spin-off following a transition period.
| Name |
Age | Position | ||
| E. James Ferland |
48 | Chairman and Chief Executive Officer | ||
| Jenny L. Apker |
57 | Senior Vice President and Chief Financial Officer | ||
| Mark A. Carano |
45 | Senior Vice President, Corporate Development and Treasurer | ||
| J. Randall Data |
49 | Senior Advisor to the Chief Executive Officer | ||
| Elias Gedeon |
55 | Senior Vice President and Chief Business Development Officer | ||
| Peter J. Goumas |
51 | Senior Vice President, Operations | ||
| J. André Hall |
50 | Senior Vice President, General Counsel and Corporate Secretary | ||
| Daniel W. Hoehn |
36 | Vice President, Controller and Chief Accounting Officer | ||
| Mark S. Low |
58 | Senior Vice President, Global Services | ||
| Wendy S. Radtke |
46 | Senior Vice President and Chief Human Resource Officer | ||
| D. Paul Scavuzzo |
51 | Senior Vice President, Global Power | ||
| Kenneth Zak |
56 | Senior Vice President, Industrial Environmental |
E. James Ferland will serve as our Chairman and Chief Executive Officer following the spin-off. Prior to the spin-off, Mr. Ferland was the Company’s President and Chief Executive Officer since April 2012. Prior to joining the Company, Mr. Ferland served as President of the Americas division for Westinghouse Electric Company, LLC, a nuclear energy company and group company of Toshiba Corporation, from 2010 through March 2012. From 2007 to 2010, Mr. Ferland worked for PNM Resources, Inc., a holding company of utilities providing electricity and energy products and services, where he held positions as Senior Vice President of Utility Operations and Senior Vice President of Energy Resources. Previously, Mr. Ferland held various senior management and engineering positions at Westinghouse Electric Company, Louisiana Energy Services/URENCO, Duke Engineering and Services, Carolina Power & Light and General Dynamics. Mr. Ferland has also served on the board of directors of Actuant Corporation since August 2014.
Mr. Ferland is an experienced executive with a utility leadership background that includes both regulated and merchant operations. He has led organizations that generate power (coal, nuclear, gas, renewables), transmit power and trade power. He also has extensive supplier leadership experience in commercial nuclear power, manufacturing, engineering and field services. With more than 24 years of senior management and engineering experience in diversified industries, he brings valuable perspectives to all industries in which we operate.
-83-
Table of Contents
Jenny L. Apker will serve as our Chief Financial Officer following the spin-off. Prior to the spin-off, Ms. Apker served as the Company’s Vice President, Treasurer and Investor Relations since August 2012 and, prior to that time, served as the Company’s Vice President and Treasurer since joining the Company in June 2010. Previously, Ms. Apker served as Vice President and Treasurer with Dex One Corporation (formerly R.H. Donnelley Corporation), a marketing services company, from May 2003 until June 2010.
Mark A. Carano will serve as our Senior Vice President, Corporate Development and Treasurer following the spin-off. Prior to the spin-off, Mr. Carano served as Senior Vice President and Chief Corporate Development Officer of the Company since August 2013. Prior to joining the Company in June 2013, Mr. Carano served as a Managing Director in the Investment Banking Group of Bank of America Merrill Lynch since 2006. Mr. Carano also previously held positions with the Investment Banking Group of Deutsche Bank.
J. Randall Data has served as President and Chief Operating Officer of Babcock & Wilcox Power Generation Group, Inc. (“PGG OpCo”), New B&W’s principal operating subsidiary providing boilers, environmental equipment and related services to the power generation industry and other industries, since April 2012, and for a transition period following the spin-off will serve as a senior advisor to the Chief Executive Officer. Mr. Data previously served as Vice President and General Manager of PGG OpCo’s Fossil Power Division from November 2008 until April 2012.
Elias Gedeon will serve as our Senior Vice President and Chief Business Development Officer following the spin-off. Mr. Gedeon currently serves as the Company’s Senior Vice President and Chief Business Development Officer, a position he has held since joining the Company in May 2014. Mr. Gedeon has more than 30 years of experience in the power generation industry and has held various sales, operations and P&L leadership positions in the U.S. and overseas. He joined the Company from Alstom Power, Inc., a subsidiary of energy and transport manufacturer Alstom, where he served as Vice President, Global Sales and Marketing – Boiler Group since 2009 and previously as Vice President of Sales, Americas. Prior to joining Alstom, Mr. Gedeon served in sales and operations roles of increasing responsibility with Foster Wheeler Power Group, Inc., including Executive Vice President, Global Sales & Marketing.
Peter J. Goumas will serve as our Senior Vice President, Operations following the spin-off. From October 2013 to June 2015, Mr. Goumas served as our Vice President and General Manager of Operations. Previously, he served in a number of positions with the Company’s Babcock & Wilcox Nuclear Operations Group, Inc. (“B&W NOG”), including from August 2011 to September 2013 as Vice President, Programs, Contracts and Business Development, where he was responsible for all project management, procurement and contracting across the operations, as well as the business development and strategic planning activities. From May 2010 to July 2011, Mr. Goumas served as Vice President, Manufacturing and Business Development, responsible for B&W NOG’s business units in Barberton and Euclid, Ohio, and Mt. Vernon, Indiana.
J. André Hall will serve as our Senior Vice President, General Counsel and Corporate Secretary following the spin-off. Mr. Hall joined the Company in August 2013 and has served as Assistant General Counsel, Transactions and Compliance since that time. Prior to joining the Company, Mr. Hall served in various roles of increasing responsibility with Goodrich Corporation, an aerospace manufacturing company, most recently as Vice President of Business Conduct and Chief Ethics Officer from October 2009 until July 2012 when it was acquired by United Technologies Corporation. For the five years prior to becoming Chief Ethics Officer, Mr. Hall served as the segment general counsel for one of Goodrich Corporation’s multibillion dollar operating segments.
Daniel W. Hoehn will serve as our Vice President, Controller and Chief Accounting Officer following the spin-off. Mr. Hoehn joined the Company in March 2015 and is responsible for the Company’s accounting functions. Formerly, Mr. Hoehn was Vice President and Controller at Chiquita Brands International, Inc., responsible for financial reporting for Chiquita’s operations across three continents. From 2010 to 2013, he was Assistant Corporate Controller, after serving as Manager, Financial Reporting, from 2007 to 2010. Prior to joining Chiquita, Mr. Hoehn was a senior manager in the audit practice at KPMG, LLP.
Mark S. Low will serve as our Senior Vice President, Global Services segment following the spin-off. From 2013 to March 2015, Mr. Low was Vice President and General Manager of our Global Services Division. Previously, from 2012 to 2013, he was Vice President and General Manager of our Environmental Products and Services Division, responsible for all aspects of our environmental products and services business. From 2007 to 2012, he served as Vice President, Service Projects, in which he led all technical and commercial aspects of our service projects business including project management, forecasting, costing, cost forecasting, and warranty resolution.
-84-
Table of Contents
Wendy S. Radtke will serve as our Senior Vice President and Chief Human Resources Officer following the spin-off. Ms. Radtke joined the Company in April 2015 to lead the global Human Resources function. From 2012-2015, Ms. Radtke served as Vice President of Talent Management at The Goodyear Tire & Rubber Company, and from 2009 to 2012, she was Vice President, Asia Pacific Human Resources at Goodyear, located in Shanghai, China. Before joining Goodyear, Ms. Radtke spent eight years at Honeywell International where she held a variety of positions with increasing responsibility, including her last role as Vice President of Asia Pacific Human Resources for the Automation Control Solutions business located in Shanghai, China.
D. Paul Scavuzzo will serve as our Senior Vice President, Global Power segment following the spin-off. He is currently responsible for directing our new-boiler and environmental product lines in North America and internationally. Mr. Scavuzzo will also be responsible for our Denmark-based subsidiary, Babcock & Wilcox Volund A/S, our joint venture operations in China and India, as well as our research & development and licensing activities. From March 2012 to March 2015, Mr. Scavuzzo was Vice President and General Manager of our Global Power Division. Previously, from 2009 to 2012, he was Vice President, Steam Generating Systems, responsible for leading the utility and industrial boiler business segment.
Kenneth Zak will serve as our Senior Vice President, Industrial Environmental segment following the spin-off. Since December 2012, Mr. Zak has served as the Senior Vice President of Business Operations for MEGTEC. He is currently responsible for MEGTEC’s Environmental Solutions business worldwide as well as sales and business development activities for the Engineered Products business. Mr. Zak also led the integration team after the MEGTEC acquisition. Previously, from 2003 to 2012, Mr. Zak was Vice President of the Industrial & Environmental Products Group for MEGTEC, responsible for business teams in the Americas and Asia and drove strategy deployment activities and annual improvement priorities on a global basis. Mr. Zak also previously held business development and marketing positions at W. R. Grace & Co. and Owens-Corning Fiberglass.
Board of Directors
Our board of directors will consist of seven directors. The New York Stock Exchange requires that a majority of our board of directors qualify as “independent” according to the rules and regulations of the SEC and the New York Stock Exchange. We will comply with those requirements.
Committees of Our Board of Directors
The committees of our board of directors consist of an Audit and Finance Committee, a Governance Committee and a Compensation Committee.
Each of the Audit and Finance, Governance and Compensation Committees is comprised entirely of independent non-management directors. Our board of directors has adopted a written charter for each committee, which will be posted on our website prior to the distribution date. The members of the committees are identified in the following table.
| Board Committee | ||||||||||||
| Director | Audit and Finance |
Compensation | Governance | |||||||||
| E. James Ferland |
||||||||||||
| Thomas A. Christopher |
X | X | ||||||||||
| Cynthia S. Dubin(1) |
X | X | ||||||||||
| Brian K. Ferraioli |
X | X | ||||||||||
| Stephen G. Hanks |
X | X | ||||||||||
| Anne R. Pramaggiore(1) |
X | X | ||||||||||
| Larry L. Weyers |
X | X | ||||||||||
| (1) | Ms. Dublin and Ms. Pramaggiore will be appointed to their respective committees on July 1, 2015. |
Brian K. Ferraioli is the chairman of the Audit and Finance Committee; Larry L. Weyers is the chairman of the Compensation Committee; and Stephen G. Hanks is the chairman of the Governance Committee.
-85-
Table of Contents
Audit and Finance Committee. The Audit and Finance Committee’s role will be financial oversight. Our management will be responsible for preparing financial statements, and our independent registered public accounting firm will be responsible for auditing those financial statements. The Audit and Finance Committee will not be providing any expert or special assurance as to our financial statements or any professional certification as to the independent registered public accounting firm’s work.
The Audit and Finance Committee will be directly responsible for the appointment, compensation, retention and oversight of our independent registered public accounting firm. The committee, among other things, will also review and discuss our audited financial statements with management and the independent registered public accounting firm.
Our Audit and Finance Committee will also have primary oversight responsibility for our compliance and ethics program.
Our board has determined that each of Cynthia S. Dubin, Brian K. Ferraioli, Anne R. Pramaggiore and Larry L. Weyers qualifies as an “audit committee financial expert” within the definition established by the SEC.
Compensation Committee. The Compensation Committee will have overall responsibility for our officer compensation plans, policies and programs and will have the authority to engage and terminate any compensation consultant or other advisors to assist the committee in the discharge of its responsibilities. Please see the “Executive Compensation—Compensation Discussion and Analysis” for information about our executive officer compensation.
Governance Committee. The Governance Committee, in addition to other matters, will recommend to our board of directors: (1) the qualifications, term limits and nomination and election procedures relating to our directors; (2) nominees for election to our board of directors; and (3) compensation of non-management directors.
The Governance Committee has determined that a candidate for election to our board of directors must meet specific minimum qualifications. The Governance Committee considers each candidate’s:
| • | record of integrity and ethics in his/her personal and professional life; |
| • | record of professional accomplishment in his/her field; |
| • | preparedness to represent the best interests of our stockholders; |
| • | personal, financial or professional interest in any competitor of ours; and |
| • | preparedness to participate fully in board activities, including active membership on at least one board committee and attendance at, and active participation in, meetings of the board and the committee(s) of which he or she is a member, and lack of other personal or professional commitments that would, in the Governance Committee’s sole judgment, interfere with or limit his or her ability to do so. |
In addition, the Governance Committee also considers it desirable that candidates possess the following qualities or skills:
| • | each candidate should contribute positively to the collaborative culture among board members; and |
| • | each candidate should possess professional and personal experiences and expertise relevant to our businesses and industries. |
While New B&W will not have a specific policy addressing board diversity, the board recognizes the benefits of a diversified board and believes that any search for potential director candidates should consider diversity as to gender, ethnic background and personal and professional experiences.
-86-
Table of Contents
The Governance Committee will solicit ideas for possible candidates from a number of sources—including members of the board, our senior level executives and individuals personally known to the members of the board.
Any stockholder may nominate one or more persons for election as one of our directors at an annual meeting of stockholders if the stockholder complies with the notice, information and consent provisions contained in our bylaws.
The Governance Committee will consider candidates identified through the processes described above and will evaluate each of them, including incumbents, based on the same criteria. The Governance Committee will also take into account the contributions of incumbent directors as board members and the benefits to us arising from their experience on the board. Although the Governance Committee will consider candidates identified by stockholders, the Governance Committee has sole discretion whether to recommend those candidates to the board.
In conjunction with the Compensation Committee, the Governance Committee will oversee the annual evaluation of our Chief Executive Officer.
Director Compensation
Our nonemployee directors will receive compensation for their service on the board. Initially, the annual retainers and stock-based awards are identical to those for directors of the Company. The cash compensation for our nonemployee directors will consist of the following:
| • | an annual retainer of $90,000 paid in quarterly installments and prorated for partial terms. |
The chairs of board committees and the Lead Director will receive additional annual retainers as follows (pro-rated for partial terms):
| • | the chair of the Audit and Finance Committee: $20,000; |
| • | the chair of the Compensation Committee: $15,000; |
| • | the chair of the Governance Committee: $15,000; and |
| • | the Lead Director: $25,000. |
In addition, our non-management directors will receive annual stock-based awards with a value of $120,000, subject to future adjustments as the Governance Committee and our board of directors may approve.
Our non-management directors will also be reimbursed for any expenses associated with attending board or committee meetings.
Executive Compensation
Our executive compensation program is described in “Executive Compensation—Compensation Discussion and Analysis.”
Compensation Policies and Practices and Risk
The Company’s Compensation Committee has concluded that risks arising from the Company’s compensation policies and practices for the Company employees (including our employees) are not reasonably likely to have a materially adverse effect on the Company. In reaching this conclusion, the Company’s Compensation Committee considered the policies and practices in the following paragraph.
87
Table of Contents
The Company’s Compensation Committee regularly reviewed the design of the Company’s significant compensation programs with the assistance of its compensation consultant. We believe the Company’s compensation programs work to retain and to motivate the Company’s employees at appropriate levels of business risk, which risks are generally mitigated through some of the following features:
| • | Reasonable and Balanced Compensation Programs — Using the elements of total direct compensation, the Company’s Compensation Committee seeks to provide compensation opportunities for employees targeted at or near the median compensation of comparable positions in the Company’s market. As a result, we believe the total direct compensation of employees provides reasonable compensation opportunities with an appropriate mix of cash and equity, annual and longer-term incentives, and performance metrics. |
| • | Emphasis on Long-Term Incentive Over Annual Incentive Compensation — Long-term incentive compensation, to the extent awarded, typically makes up a larger percentage of an employee’s target total direct compensation than annual incentive compensation. Incentive compensation helps drive performance and align the interests of employees with those of stockholders. By tying a significant portion of total direct compensation to long-term incentives typically over a three-year period, the Company promotes longer-term perspectives regarding company performance. |
| • | Long-Term Incentive Compensation Subject to Forfeiture for Bad Acts — The Company’s Compensation Committee may terminate any outstanding stock award if the recipient (1) is convicted of a misdemeanor involving fraud, dishonesty or moral turpitude or a felony, or (2) engages in conduct that adversely affects or may reasonably be expected to adversely affect the business reputation or economic interests of the Company. |
| • | Most Annual and Long-Term Incentive Compensation Subject to Clawbacks — Since 2011, the Company’s incentive compensation awards have included provisions allowing the Company to recover excess amounts paid to individuals who knowingly engaged in a fraud resulting in a restatement. |
| • | Linear and Capped Incentive Compensation Payouts — The Company’s Compensation Committee establishes financial performance goals that are used to plot a linear payout formula for annual and long-term incentive compensation to avoid an over-emphasis on short-term decision making. The maximum payout for both the annual and long-term incentive compensation is capped at 200% percent of target. |
| • | Use of Multiple and Appropriate Performance Measures — The Company uses multiple performance measures to avoid having compensation opportunities overly weighted toward the performance result of a single measure. In general, the Company’s incentive programs are based on a mix of financial, safety and individual goals. Historically, the Company’s principal financial performance measures have been based on operating income, return on invested capital and earnings per share. In 2014 the Company also added relative total shareholder return as an additional performance measure for its performance restricted stock units. For information on how these performance restricted stock units will be treated in connection with the spin-off. The Company is in the process of evaluating performance measures for 2015. Operating income and return on invested capital maintain the focus on operational performance while earnings per share maintains a focus on longer-term metrics that help drive stockholder value. |
| • | Stock Ownership Guidelines — The Company’s executive officers and directors are subject to stock ownership guidelines, which help to promote longer-term perspectives and align the interests of our executive officers and directors with those of our stockholders. |
We expect that the New B&W Compensation Committee will establish similar policies and practices.
Compensation Committee Interlocks and Insider Participation
None of our executive officers have served as members of a compensation committee (or if no committee performs that function, the board of directors) of any other entity that has an executive officer serving as a member of our board of directors.
88
Table of Contents
Compensation Discussion and Analysis
The following Compensation Discussion and Analysis, or CD&A, provides information relevant to understanding the 2014 compensation of our executive officers identified in the Summary Compensation Table below under the caption “Compensation of Executive Officers,” whom we refer to as our Named Executives. The following discussion also contains statements regarding future individual and company performance targets and goals. These targets and goals are disclosed in the limited context of the Company’s compensation programs and should not be understood to be statements of management’s expectations or estimates of results or other guidance. We caution investors not to apply these statements to other contexts.
Executive Summary
New B&W is currently a wholly owned subsidiary of the Company. Following the spin-off, New B&W will own the subsidiaries that currently conduct the operations of the Company’s Power Generation business. Our executive compensation program has been designed by the Compensation Committee of the Company’s Board of Directors, which for purposes of this CD&A we will refer to as the Compensation Committee. Historically, including during 2014, the Company’s senior management, which included members of New B&W’s senior management, has supported the Compensation Committee in administering the compensation matters related to our Named Executives. Following the spin-off, our executive compensation program will be administered by the Compensation Committee of New B&W’s Board of Directors (the “New B&W Compensation Committee”). The responsibilities of the New B&W Compensation Committee are described in “Management–Committees of Our Board of Directors” on the preceding pages.
For purposes of this CD&A, we refer to the following persons as our Named Executives, with their expected titles with New B&W following the spin-off in parentheses:
| • | E. James Ferland, President and Chief Executive Officer of the Company (Chief Executive Officer of New B&W and Chairman of its Board of Directors) |
| • | Jenny L. Apker, Vice President, Treasurer and Investor Relations of the Company (Senior Vice President and Chief Financial Officer of New B&W) |
| • | Mark A. Carano, Senior Vice President and Chief Corporate Development Officer (Senior Vice President, Corporate Development and Treasurer of New B&W) |
| • | Elias Gedeon, Senior Vice President and Chief Business Development Officer of the Company (same position with New B&W) |
| • | J. Randall Data, Senior Advisor to the Chief Executive Officer (formerly President & Chief Operating Officer, Babcock & Wilcox Power Generation Group, Inc.) |
All 2014 executive compensation decisions for our Named Executives prior to the spin-off were or will be made or overseen by the Company’s Compensation Committee. Additionally, all 2014 executive compensation information reflects compensation earned at the Company for each of New B&W’s Named Executives based on their respective roles with the Company during 2014. Executive compensation decisions following the spin-off will be made by the New B&W Compensation Committee. We currently anticipate that, except as otherwise described in this CD&A, compensation programs for our Named Executives immediately following the distribution date will be similar to the programs currently utilized by the Company for its executive officers.
This CD&A provides detailed information and analysis regarding the compensation of our Named Executives as reported in the Summary Compensation Table and other tables located in the “Compensation of Executive Officers” section on the following pages. Following this summary, this CD&A is divided into three sections:
Section 1: Compensation Structure. In this section, we review the Company’s compensation philosophy, elements and processes.
Section 2: Compensation Analysis. In this section, we review the three elements of a Named Executive’s total direct compensation: annual base salary, annual incentive compensation and long-term incentive compensation.
-89-
Table of Contents
Section 3: Other Benefits and Practices. In this section, we review perquisites, post-employment arrangements and other compensation-related practices.
Highlights of 2014 Executive Compensation
The chart below shows the target total direct compensation of our Named Executives, relative to their primary benchmark (survey median) and, for Mr. Ferland, secondary benchmark (proxy median). No proxy data was identified for Ms. Apker and Messrs. Carano, Data and Gedeon with respect to their positions with the Company.
The 2014 compensation reported for each Named Executive is based on his or her position with the Company in 2014, and therefore does not reflect any promotional increases that he or she may receive upon appointment to his or her new position at New B&W.
2014 Target Total Direct Compensation Summary
|
| ||||||||||||||||
| Named Executive | Target Total Direct Compensation (TDC) |
2014 TDC Survey Median |
2014 TDC Proxy Median |
% Difference from Survey Median |
% Difference from Proxy Median | |||||||||||
| E. James Ferland |
$ | 6,087,500 | $ | 6,098,000 | $ | 7,086,000 | 0% | -14% | ||||||||
| Jenny L. Apker |
$ | 634,161 | $ | 497,000 | – | 28% | – | |||||||||
| Elias Gedeon |
$ | 900,000 | $ | 889,768 | – | 1% | – | |||||||||
| Mark A. Carano |
$ | 1,079,500 | $ | 1,074,000 | – | 1% | – | |||||||||
| J. Randall Data |
$ | 1,080,250 | $ | 1,237,000 | – | -13% | – | |||||||||
|
| ||||||||||||||||
|
| ||||||||||||||||
The following events and characteristics highlight the Company’s 2014 executive compensation program:
Strong Stockholder Support for Executive Compensation Program – Over 96% of the votes cast at the Company’s 2014 annual stockholders meeting on executive compensation were cast in favor of the Company’s executive compensation program. The Company applied the same compensation principles used in prior year compensation decisions to determine the amount and type of executive compensation for 2014.
Emphasis on Incentive- and Performance-Based Compensation – As a result of the Company’s compensation philosophy, there was an emphasis on annual and long-term incentive compensation when setting target total direct compensation. Annual incentive compensation was cash-based while long-term incentive compensation was stock-based issued in the form of performance restricted stock units (50%), stock options (25%) and time-vested restricted stock units (25%). 100% of the annual incentive compensation and 75% of the target value of long-term incentive compensation were performance-based. As a result, performance-based compensation represented approximately 67% of New B&W’s Chief Executive Officer’s target total direct compensation and 61% of New B&W’s other Named Executives’ average target total direct compensation in 2014. See “-Elements of Executive Compensation” for more information on the elements of total direct compensation.
Updates to the Company’s Custom Peer Group – For 2014 compensation purposes, the Compensation Committee approved changes to the custom peer group it used as a secondary benchmark for determining executive compensation. These changes included the removal of two companies, General Dynamics Corporation and Raytheon Company, that the Compensation Committee determined were no longer appropriate to include due to their relatively high revenues and/or market capitalization. See “–Proxy Data – Custom Peer Group” for more information on benchmarking and the Company’s custom peer group.
Reasonable Pay and Governance Practices
The Compensation Committee adheres and we expect New B&W’s Compensation Committee to adhere to the following practices and policies for Named Executive compensation:
| • | Use of multiple performance metrics for annual incentive compensation (see “–Annual Incentive Compensation”) and long-term incentive compensation (see “–Long Term Incentive Compensation”); |
-90-
Table of Contents
| • | Dividend equivalents attach to restricted stock units, but are subject to the applicable vesting conditions and do not attach to stock options; |
| • | No repricing of stock options without stockholder approval; |
| • | Limited perquisites and tax reimbursements (see “–Other Benefits and Post-Employment Compensation”); |
| • | No tax reimbursements on change in control benefits; |
| • | Clawback and forfeiture provisions in annual and long-term incentive compensation; |
| • | General prohibition from engaging in hedging transactions; and |
| • | Stock ownership guidelines (see “–Other Compensation Policies/Practices”). |
Section 1 – Compensation Structure
Philosophy and Objectives of Executive Compensation
The Compensation Committee seeks to provide reasonable and competitive compensation to executives through programs structured to:
| • | attract and retain well-qualified executives; |
| • | incent and reward short- and long-term financial and other company performance, as well as individual contributions; and |
| • | align the interests of executives with those of stockholders. |
The Compensation Committee also subscribes to a “pay-for-performance” philosophy when designing executive compensation. This means a substantial portion of an executive’s target compensation should be “at risk” and performance-based where the value of one or more elements of compensation is tied to the achievement of financial and/or other measures the Company considers important drivers in the creation of stockholder value. Stock options are granted with an exercise price equal to 100% of the fair market value of the Company’s common stock on the date of grant. As a result, an option’s value is based exclusively on improvements in stock price from the price on the date of grant. For that reason, the Company considers stock options to be performance-based.
Elements of Executive Compensation
To support the compensation philosophy and objectives, the Company’s executive compensation program consists of the key elements identified in the chart below.
| Element | Description / Characteristics | Primary Objective(s) | ||||
| Total Direct Compensation |
Base Salary |
• Annual fixed cash compensation |
• Attract and retain qualified talent | |||
| Annual Incentive |
• Annual variable cash compensation
• Based on a mix of company, safety and individual goals |
• Incent/reward short-term performance
• Promote retention and pay-for- performance | ||||
| Long-Term Incentive |
• Long-term (typically three years) variable stock-based compensation
• Mix of performance and time-vested awards |
• Incent/reward long-term performance
• Align interest of executive with stockholders
• Promote retention and pay-for- performance | ||||
| Other Benefits and Post-Employment Compensation | • Defined contribution and limited defined benefit plans
• Limited perquisites
• Change-in-control agreements and severance plan |
• Promote retention | ||||
-91-
Table of Contents
The Compensation Committee does not set a specific target allocation among the elements of total direct compensation; however, long-term incentive compensation typically represents the largest single element of target total direct compensation and performance-based compensation constitutes the bulk of a Named Executive’s target total direct compensation, as demonstrated in the chart below.
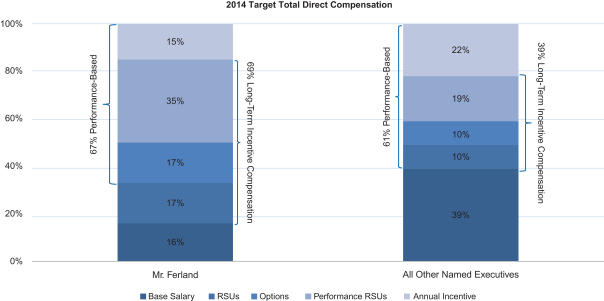
Determining Named Executive Compensation
Compensation Decisions. The Compensation Committee establishes the target total direct compensation of executives and administers other benefit programs. In connection with that process, it receives support from an outside compensation consultant and management.
Outside Consultant. The Compensation Committee engages Hay Group, Inc. (“Hay Group”) as its outside compensation consultant. Hay Group provides the Compensation Committee with information and advice on the design, structure and level of executive and director compensation and attends Compensation Committee meetings, including executive sessions. Hay Group works with management on various matters for which the Compensation Committee is responsible; however, the Compensation Committee, not management, directs and oversees the retention and activities of Hay Group.
Management. The Company’s Human Resources department, in consultation with the Compensation Committee chair and Hay Group, prepares information and materials for the Compensation Committee relevant to matters under consideration by the committee, including market data provided by Hay Group and recommendations of the Company’s Chief Executive Officer regarding compensation of the other executives. The Compensation Committee works directly with Hay Group on the Company’s Chief Executive Officer’s compensation. The Company’s Chief Executive Officer and senior Human Resources personnel attend committee meetings and, as requested by the Compensation Committee, participate in deliberations on executive compensation (except in respect to their own compensation). No member of the Company’s management attends executive sessions of the Compensation Committee, unless at the direction of the committee.
Stockholder Vote on Executive Compensation. Stockholders have the opportunity to cast an annual advisory vote on the compensation of the Company’s Named Executives. At the Company’s 2014 annual meeting of stockholders, over 96% of the votes cast at that meeting on the executive compensation proposal were voted in favor of the Company’s executive compensation. The Compensation Committee believes the result of that vote affirms stockholders’ support of the Company’s philosophy and approach to executive compensation. Accordingly, although target total direct compensation was set before the advisory vote was held, no changes were made to 2014 compensation as a result of the vote.
-92-
Table of Contents
Target Median Compensation. The Compensation Committee believes compensation is competitive at or near the median compensation paid for comparable positions. Accordingly, the Compensation Committee seeks to set target compensation for each element of total direct compensation at approximately +/-15% of the median compensation determined through benchmarking. In this CD&A, compensation within this +/-15% range is referred to as “median range”. The Compensation Committee may adjust target compensation, including setting it outside the median range, to account for a Named Executive’s performance, tenure, experience, internal equity and other factors or situations that are not typically captured by looking at standard market data and practices that the Compensation Committee may deem relevant to the appropriateness and/or competitiveness of the compensation of a Named Executive. The compensation actually earned by a Named Executive, however, may be outside the median range targeted, depending on the achievement of performance goals, fluctuations in the Company’s stock price and/or satisfaction of vesting conditions.
Benchmarking. To identify median compensation for use in setting annual base salary, target annual incentive and target long-term incentive compensation, the Compensation Committee engages in “benchmarking” – a practice of reviewing the compensation of comparable positions at other companies as a reference point for compensation decisions for our Named Executives. The specific performance measures and goals used in performance-based compensation are designed for the principal purpose of supporting goals and strategies specific to us and/or driving the creation of shareholder value, and, as a result, are not generally benchmarked.
During the Compensation Committee’s annual review of executive compensation, Hay Group provided the Compensation Committee with an analysis comparing prior year executive target compensation to compensation for comparable positions at the 25th, 50th (median) and 75th percentiles using Hay Group survey data and, as applicable, data from public company proxy statements.
Survey Data. Hay Group’s Industrial Executive Compensation Survey served as the Compensation Committee’s primary benchmark for executive compensation in 2014. This survey represented Hay Group’s proprietary annual compensation survey tracking 2013 executive compensation from over 300 general industry organizations. Hay Group adjusted the compensation of the applicable survey group to bring it current. They also adjusted the data using regression analysis based on revenues to account for the size of the Company’s operations relative to the organizations comprising the survey. The component companies comprising the 2013 Hay Group survey are determined by Hay Group without input from the Compensation Committee.
Proxy Data. As a supplement to the survey data, the Compensation Committee also reviewed the compensation of similarly situated executives from a custom peer group. The custom peer group used for 2014 executive compensation consisted of 16 companies with whom the Company competes for executive talent from the engineering and construction, aerospace and defense, heavy electrical equipment and industrial machinery industries. In 2013, the Compensation Committee approved changes to the Company’s custom peer group, including removing two companies with higher revenue and/or market capitalization relative to the Company and the other companies in the Company’s custom peer group. This updated custom peer group consisted of the companies listed at the end of this CD&A.
Compensation information from this group represented the actual, non-regressed 2012 compensation reported in 2013 publicly available Securities and Exchange Commission filings. This compensation information was generally higher than the compensation for comparable positions reported by the survey data. Additionally, with only 16 companies, the proxy data represented information from a limited sample size, particularly for executive positions other than chief executive officer and chief financial officer. Because the Company competes with the custom peer companies for executive talent, the Compensation Committee reviewed the applicable proxy data when setting target compensation for our Named Executives; however, the proxy data was not weighted in the determination of median compensation, except to the extent any of the Company’s custom peer companies were also a component company in Hay Group’s Industrial Executive Compensation Survey. Accordingly, unless otherwise indicated, references in this CD&A to “median” or “median range” are references to survey data.
Section 2 – Compensation Analysis
2014 Target Total Direct Compensation Overview
The chart below shows the 2014 target total direct compensation for each Named Executive. The 2014 target total direct compensation for each of our Named Executives was within the survey range applicable to the
-93-
Table of Contents
executive in their respective positions with the Company, except in the case of Ms. Apker. The Compensation Committee set Ms. Apker’s target total direct compensation outside the survey range to account for the value of her role within the Company’s senior management team, which was not otherwise reflected in the survey data.
In November 2014, the Company entered into retention agreements with certain of our senior executives, including Ms. Apker, and Messrs. Ferland, Carano and Gedeon to promote management focus on completing the proposed spin-off and continuity in the leadership of the Company and New B&W. In addition, the Company and New B&W entered into an employment agreement with Mr. Ferland in connection with his expected appointment as Chief Executive Officer of New B&W upon completion of the proposed spin-off and a severance agreement with Mr. Data in connection his expected departure from New B&W following the spin-off. Except as indicated, discussions on the following pages regarding the elements of 2014 total direct compensation do not reflect the compensation provided in these retention, employment and severance arrangements, which are discussed separately. See “–Spin-off Retention, Employment and Severance Arrangements” for more information on these arrangements.
The target total direct compensation reported for each Named Executive is based on their position with the Company in 2014, and therefore does not reflect any promotional increases that he or she may receive upon appointment to his or her position at New B&W.
2014 Target Total Direct Compensation
| Named Executive | Annual Base Salary |
Annual Incentive | Long-Term Incentive |
Target Total Direct Compensation |
||||||||||||
| E. James Ferland |
$ | 950,000 | $ | 937,500 | $ | 4,200,000 | $ | 6,087,500 | ||||||||
| Jenny L. Apker |
$ | 290,000 | $ | 129,161 | $ | 215,000 | $ | 634,161 | ||||||||
| Elias Gedeon(1) |
$ | 375,000 | $ | 225,000 | $ | 300,000 | $ | 900,000 | ||||||||
| Mark A. Carano |
$ | 410,000 | $ | 244,500 | $ | 425,000 | $ | 1,079,500 | ||||||||
| J. Randall Data |
$ | 365,000 | $ | 215,250 | $ | 500,000 | $ | 1,080,250 | ||||||||
(1) To aid in the comparison to our other Named Executives, Mr. Gedeon’s target total direct compensation excludes the value of a one-time sign-on bonus he received in connection with joining the Company in May 2014 and the Annual Incentive Amount reported for Mr. Gedeon is based on his full year base salary. His actual 2014 annual incentive pay-out was pro-rated from the date he commenced employment with the Company on May 1, 2014.
Annual Base Salary
In February 2014, the Compensation Committee approved the base salaries (other than for Mr. Gedeon) indicated in the table below, effective April 1, 2014. The Compensation Committee approved Mr. Gedeon’s base salary in May 2014 in connection with him commencing employment with the Company.
2014 Annual Base Salary
| Named Executive | 2013 Salary | 2014 Salary | Survey Median | % Variance from Median (Survey) |
Median (Proxy) | |||||||||||||||
| Mr. Ferland |
$ | 900,000 | $ | 950,000 | $ | 1,022,000 | -7 | % | $ | 1,050,000 | ||||||||||
| Ms. Apker |
$ | 278,100 | $ | 290,000 | $ | 251,000 | 16 | % | – | |||||||||||
| Mr. Gedeon |
N/A | $ | 375,000 | $ | 351,687 | 7 | % | – | ||||||||||||
| Mr. Carano |
$ | 400,000 | $ | 410,000 | $ | 395,000 | 4 | % | – | |||||||||||
| Mr. Data |
$ | 340,000 | $ | 365,000 | $ | 411,000 | -11 | % | – | |||||||||||
The base salaries for Ms. Apker and Messrs. Ferland, Carano, Gedeon and Data were set within or near the median range applicable to their respective positions.
-94-
Table of Contents
Annual Incentive Compensation
Overview and Design. The Company pays annual incentives to drive the achievement of key business results and to recognize individuals based on their contributions to those results. The Compensation Committee administers annual incentive compensation for our Named Executives through the Company’s Executive Incentive Compensation Plan (“EICP”). The EICP is a cash-based incentive plan that was previously approved by Company stockholders. The 2014 EICP design contained the following principal elements, which were unchanged from 2013:
| Performance Measure
|
Target
|
Payout
| ||||
|
|
Financial
• Operating Income
• Return on Invested Capital
|
70%
• 45%
• 25%
|
0-200% | |||
| Safety
|
10%
|
|||||
|
Individual
|
20%
|
|||||

The amount paid under the EICP for 2014 can be illustrated by the following formula:
Earnings from Salary x Target % x Total Payout % (0 – 200%)
Summary of EICP Payments. The total payout percentage represents the combined results of applicable financial, individual and safety performance. To prioritize financial results, however, financial performance determined the maximum amount each Named Executive could earn under the EICP in 2014. A Named Executive would earn less than the maximum amount if he or she did not meet applicable individual performance and safety goals. The following table indicates the maximum amount eligible to be earned by our Named Executives and the actual amounts paid under the EICP for 2014 after factoring in individual and safety results.
| Named Executive | 2014 Earnings from Salary |
x | Target Percentage |
x | Weighted Financial Performance Percentage |
= | Eligible Amount |
Actual Payout for 2014 Performance |
||||||||||||
| Mr. Ferland |
$937,500 | 100% | 133.64% | $ | 1,252,875 | $ | 1,090,031 | |||||||||||||
| Ms. Apker |
$287,025 | 45% | 133.64% | $ | 172,611 | $ | 162,252 | |||||||||||||
| Mr. Gedeon(1) |
$250,000 | 60% | 133.64% | $ | 200,460 | $ | 184,425 | |||||||||||||
| Mr. Carano |
$407,500 | 60% | 133.64% | $ | 326,750 | $ | 313,669 | |||||||||||||
| Mr. Data |
$358,750 | 60% | 108.21% | $ | 232,922 | $ | 214,281 | |||||||||||||
(1) Mr. Gedeon’s 2014 annual incentive pay-out was pro-rated from the date of his May 1, 2014 start date.
Analysis of Target Percentage. The Compensation Committee set the target percentages indicated in the table above in February 2014 (May 2014 in the case of Mr. Gedeon). The following table shows the 2014 target annual incentive compensation for each Named Executive based on the executive’s target percentage and projected 2014 earnings from salary, relative to his or her benchmark.
-95-
Table of Contents
2014 Target Annual Incentive Compensation
|
|
||||||||||||||
| Named Executive |
EICP Target(1) | Median (Survey) | % Variance from Median (Survey) |
Median (Proxy) | ||||||||||
| Mr. Ferland |
$ | 937,500 | $ | 1,070,000 | -12% | $ | 1,193,000 | |||||||
| Ms. Apker |
$ | 129,161 | $ | 112,000 | 15% | N/A | ||||||||
| Mr. Gedeon |
$ | 225,000 | $ | 186,394 | 21% | N/A | ||||||||
| Mr. Carano |
$ | 244,500 | $ | 227,000 | 8% | N/A | ||||||||
| Mr. Data |
$ | 215,250 | $ | 280,000 | -23% | N/A | ||||||||
(1) Each Named Executive’s EICP target compensation was based on his or her projected earnings from salary during 2014. Accordingly, changes in annual base salary during 2014 would cause the actual annual incentive compensation payout at target performance for those Named Executives to differ from the executive’s EICP target indicated above. Mr. Gedeon’s target EICP was based on his full-year base salary, although his actual pay-out was pro-rated from the date he commenced employment with the Company on May 1, 2014.
With the exception of Messrs. Gedeon and Data, 2014 target annual compensation of each Named Executive was within the median range of the applicable benchmark. With respect to Mr. Gedeon, the Compensation Committee set his initial 2014 EICP target percentage at the same percentage as most of the Company’s other Senior Vice Presidents for internal equity purposes. Mr. Data’s target percentage was set at the same level as the Company’s other group presidents for internal equity purposes.
Analysis of Financial Goals and Weighted Financial Performance Percentage. In February 2014, the Compensation Committee established threshold, target and maximum goals for each financial measure used in annual incentive compensation. The results of these financial goals were combined to determine the Weighted Financial Performance Percentage. For Ms. Apker and Messrs. Ferland, Carano and Gedeon, the 2014 EICP financial goals consisted of the following components and target weightings (the target weightings are expressed as a percentage of the 70% attributable to financial goals at target):
| • | consolidated operating income (45%); and |
| • | consolidated return on invested capital (25%). |
For Mr. Data, the 2014 EICP financial goals consisted of the following components and target weightings (expressed as a percentage of the 70% attributable to financial goals at target):
| • | consolidated operating income (25%); |
| • | applicable business unit operating income (20%); and |
| • | consolidated return on invested capital (25%). |
The Compensation Committee uses both operating income and return on invested capital as performance measures to help maintain a balanced focus on income statement and balance sheet performance. Operating income is a measure of profitability, which the Compensation Committee expects to be a primary driver of stock price while also promoting accountability of management decisions within the Company’s operations. Use of return on invested capital is intended to maximize the utilization of company assets.
The 2014 results attained for each financial performance measure applicable to our Named Executives are shown in the following tables:
Financial Performance Results for Ms. Apker and Messrs. Ferland, Carano and Gedeon
| Company Operating Income (139% x 45/70) |
89.36% | |||
| Company ROIC (124% x 25/70) |
44.29% | |||
| Weighted Financial Performance Percentage |
133.64% |
-96-
Table of Contents
Financial Performance Results for Mr. Data
| Company Operating Income (139% x 25/70) |
49.64% | |||
| Babcock & Wilcox Power Generation Group, Inc. Operating Income (50% x 20/70) |
14.28% | |||
| Company ROIC (124% x 25/70) |
44.29% | |||
| Weighted Financial Performance Percentage |
108.21% |
No annual incentive compensation is paid if financial performance is below threshold and to help mitigate risks associated with incentive compensation, the annual incentive payout is capped at 200% of target compensation. Additionally, regardless of the level of performance achieved, the Compensation Committee retains the right to decrease the amount of annual incentive compensation payable in its discretion.
The 2014 target consolidated operating income goal of $318 million was set based on internal projections for the year. The target goal was allocated among Company segments, including corporate and Power Generation ($140.2 million). Threshold and maximum goals were set at 80% and 120% of target operating income, respectively. Return on invested capital (“ROIC”) is a ratio measure of the Company’s net income in relation to its invested capital. The Compensation Committee set a target ROIC goal of 13% based on internal projections of Company management for 2014 financial performance. The Compensation Committee then set threshold and maximum goals at +/-2% increments from target ROIC. At the time the Compensation Committee established the 2014 financial goals, it designed the 2014 annual incentive plan to exclude from actual financial results the effect of certain pre-established items that it believed would not reflect operating performance, including (1) expenses associated with restructuring activity or asset acquisitions or dispositions, (2) pension accounting mark-to-market losses, (3) losses in respect of legal proceedings, (4) acquisition related amortization and (5) certain other unusual or non-recurring items.
For 2014 annual incentive compensation purposes our consolidated operating income was $343.1 million. In accordance with our 2014 EICP design, this amount included a net upward adjustment from our 2014 GAAP operating income result, largely to adjust for the effect of a mark-to-market pension accounting loss, as well as restructuring charges, acquisition and divestiture activity and other non-recurring or unusual items that had the potential to create a mis-alignment between our annual incentive program and long-term operating objectives, or otherwise may not have accurately reflected management’s 2014 operating performance. For 2014, we produced a return on invested capital of 13.5% after taking into consideration the adjustments discussed above.
The Company’s Power Generation segment produced GAAP operating income of $98.6 million, which was used in the calculation of Mr. Data’s annual incentive compensation for 2014.
Analysis of Safety Goals and Individual Performance. The Company’s annual incentive compensation program also included three safety related goals for 2014 (weighted 40%, 40% and 20%, respectively): Total Recordable Incident Rate (which measures the rate of recordable workplace injuries) (“TRIR”), Days Away, Restricted or Transferred (“DART”) and EHS Business Plans (which requires each operating entity to outline and define critical activities to be undertaken during the calendar year to continuously improve performance). The Compensation Committee selected DART as a new safety goal in 2014 to provide a more holistic picture of safety incidents than the previous safety goal, Lost Time Incident Rate, which tended to be limited to more severe incidents. The Compensation Committee also implemented a safety goal “circuit breaker” again in 2014, which capped each Named Executive’s safety goal at the target amount if TRIR met or exceeded the 2014 goal but did not improve on 2013 results. The 2014 safety goals for Ms. Apker and Messrs. Ferland, Carano and Gedeon related to consolidated results for the three safety measures for the Company. The 2014 safety goals for Mr. Data related to the results applicable to the Company’s Power Generation segment, which he oversees.
Each Named Executive’s target annual incentive award was weighted 20% on his or her individual performance in 2014. This performance component allows the Chief Executive Officer (or the Compensation Committee, in the case of Mr. Ferland) to differentiate incentive pay-outs among our Named Executives by exercising negative discretion on the target amount of each Named Executive’s individual performance component, based on the assessment of each Named Executive’s individual performance during 2014.
-97-
Table of Contents
Final 2014 Annual Incentive Payment. Based on the Weighted Financial Performance Percentage, Ms. Apker and Messrs. Ferland, Carano and Gedeon were eligible to earn 133.64% of their respective target EICP award and Mr. Data was eligible to earn 108.21% of his target EICP award, each subject to safety and individual performance. Safety performance represented 10% of a Named Executive’s target EICP and individual performance represented 20%. Based on the financial results attained by the Company in 2014, each Named Executive was eligible to earn the following percentages of target EICP for safety and individual performance.
|
| ||||||
| Named Executive |
Eligible Target EICP Award Percentage (a) |
Eligible Safety Percentage [(a) x 10%] |
Eligible Individual Percentage [(a) x 20%] | |||
| Mr. Ferland |
133.64% | 13.36% | 26.73% | |||
| Ms. Apker |
133.64% | 13.36% | 26.73% | |||
| Mr. Gedeon |
133.64% | 13.36% | 26.73% | |||
| Mr. Carano |
133.64% | 13.36% | 26.73% | |||
| Mr. Data |
108.21% | 10.82% | 21.64% | |||
The following chart depicts the level of attainment of each Named Executive’s applicable safety and individual goals in 2014 and the resulting percentage of overall target EICP earned after combining the safety and individual performance attained with each Named Executive’s weighted financial performance results. For Ms. Apker and Messrs. Ferland, Carano and Gedeon, the weighted financial performance result was 93.55% (70% x 133.64%) and for Mr. Data, the weighted financial performance result was 75.75% (70% x 108.21%).
|
Named Executive
|
% of Target Performance Attained |
% of Target EICP Earned
| ||||
| Safety | Individual | |||||
|
| ||||||
|
| ||||||
| Mr. Ferland |
2.67% | 20.05% | 116% | |||
| Ms. Apker |
2.67% | 29.40% | 126% | |||
| Mr. Gedeon |
2.67% | 26.73% | 123% | |||
| Mr. Carano |
2.67% | 32.07% | 128% | |||
| Mr. Data |
2.16% | 21.64% | 100% | |||
Long-Term Incentive Compensation
Analysis of 2014 Target Long-Term Incentive Awards. In determining the type and mix of stock granted to our Named Executives, the Compensation Committee seeks to maintain a strong correlation between pay and performance while promoting retention of key employees.
The Compensation Committee allocated 2014 long-term incentive compensation (other than the retention awards for our Named Executives discussed on the following pages) as follows:
| • | 50% performance restricted stock units of the Company; |
| • | 25% stock options of the Company; and |
| • | 25% time-vested restricted stock units of the Company. |
2014 performance restricted stock units vest between 0% and 200% of the amount of initial shares granted depending 40% on the level of cumulative diluted earnings per share, 40% on average return on invested capital and 20% on relative total shareholder return attained between January 1, 2014 and December 31, 2016 (the “Performance Period”). The Compensation Committee believes that over the long-term, there is a high degree of correlation between earnings per share and stock price. Accordingly, the Compensation Committee uses earnings per share in long-term stock-based compensation to more closely align Company goals with stockholder interests. In 2014 the Company also added relative total shareholder return as a performance metric to promote
-98-
Table of Contents
management focus on Company performance relative to peer companies in the industries in which the Company operates. This performance metric compares the Company’s total shareholder return over the Performance Period to that of the companies in the Company’s custom peer group. By using different performance measures than in the annual incentive compensation program, the Compensation Committee reduces the incentive to focus on a single metric at the expense of others, thereby helping to mitigate risk related to incentive compensation. Finally, like annual incentive compensation, including return on invested capital helps promote focus on asset utilization.
For each performance measure, results at the threshold, target and maximum goals produce vesting at 50%, 100% and 200%, respectively, of the initial performance restricted stock units granted. Vesting for performance results between threshold and target or target and maximum is determined by linear interpolation. No amount will vest with respect to any performance measure unless at least threshold results are attained. The Compensation Committee set target and maximum goals based on the sum of non-GAAP earnings per share estimates for each year of the Performance Period. To complement and leverage financial results that may be achieved under the annual incentive compensation element, the estimates were derived from the operating income target goal used in 2014 annual incentive compensation and assumed operating income growth rates of 10% and 15% for target and maximum goals, respectively. The threshold goal was set at 80% of the cumulative earnings per share target goal, consistent with the structure of annual incentive compensation. The Compensation Committee set threshold, target and maximum goals for average return on invested capital at 11.5%, 13.5% and 15.5%, which the Compensation Committee determined to be appropriate based on management’s projections of the Company’s financial results during the Performance Period. With respect to the relative total shareholder return performance metric, the Compensation Committee set threshold performance at the 25th percentile of the Company’s custom peer group, target performance at the 50th percentile, and maximum performance at 75th percentile of the Company’s custom peer group.
Stock options and restricted stock units of the Company generally vest ratably over three years, other than the equity awards to be granted pursuant to the retention agreements discussed on the following pages. For more information regarding the 2014 performance restricted stock units, restricted stock units and stock options, see the Grants of Plan-Based Awards table under “Compensation of Executive Officers” below and disclosures under “Compensation of Executive Officers – Estimated Future Payouts Under Equity Incentive Plan Awards.”
Value of 2014 Target Long-Term Incentive Compensation. The following table shows the 2014 target long-term incentive compensation for each Named Executive relative to his or her benchmark.
2014 Target Long-Term Incentive Compensation
|
|
||||||||||||||||
| Named Executive | Target Value(1) | Median (Survey) | % Median (Survey) | Median (Proxy) | ||||||||||||
| Mr. Ferland |
$ | 4,200,000 | $ | 4,006,000 | 5 | % | $ | 4,843,000 | ||||||||
| Ms. Apker |
$ | 215,000 | $ | 134,000 | 60 | % | N/A | |||||||||
| Mr. Gedeon |
$ | 300,000 | $ | 319,239 | -6 | % | N/A | |||||||||
| Mr. Carano |
$ | 425,000 | $ | 452,000 | -6 | % | N/A | |||||||||
| Mr. Data |
$ | 500,000 | $ | 546,000 | -8 | % | N/A | |||||||||
(1) The value of the target long-term incentive compensation represents the nominal value used to determine the number of shares, units or stock options granted as long-term compensation, rather than the grant date fair value computed for financial reporting purposes in accordance with Financial Accounting Standards Board Accounting Standards Codification Topic 718 (“FASB ASC 718”). For a discussion of the grant date fair values, see “Summary Compensation Table” in “Executive Compensation” below.
The Compensation Committee set Mr. Ferland’s target long-term incentive compensation at a value it determined appropriate relative to the median long-term incentive compensation applicable to him. The target compensation for each of Messrs. Ferland, Carano, Gedeon and Data aligned with the median range. The Compensation Committee set Ms. Apker’s target long-term incentive compensation in consideration of the value of her role within the Company’s senior management team, which was not otherwise reflected in the survey data for her position.
-99-
Table of Contents
Sizing Long-Term Incentive Compensation. When granting stock, the Compensation Committee targets a dollar value, rather than a number of shares, units or options. The number of restricted stock units, stock options and initial performance restricted stock units granted can be expressed through the following formula:
target value ($) / stock valuation ($)
The target value was set by the Compensation Committee as previously discussed. The stock valuation was determined by Hay Group based on the closing price of the Company’s common stock on the New York Stock Exchange on the date of grant. For restricted stock units and performance restricted stock units, Hay Group adjusted the closing price to reflect the conditions of the stock grants, such as the vesting conditions and transfer restrictions. For stock options, Hay Group used a Black-Scholes model to determine valuation. To ensure that restricted stock units and stock options vest in equal installments during the three-year vesting term, the number of shares calculated was rounded to the nearest multiple of three. The chart below summarizes the stock valuations used to grant long-term incentive awards to our Named Executives in 2014. The closing price of the Company’s stock was $32.69 on March 3, 2014.
| March 3, 2014 Awards |
Stock Valuation | |||
| Performance Restricted Stock Units |
$31.16 | |||
| Restricted Stock Units |
$30.71 | |||
| Stock Options |
$ 5.70 |
Because FASB ASC 718 does not calculate grant date fair values for financial reporting purposes using the same valuation, the target values of long-term incentive compensation may differ from the grant date fair values reported in the Summary Compensation Table and Grants of Plan Based Awards table.
Spin-off Retention, Employment and Severance Arrangements and Long-Term Incentive Plan
In connection with the proposed spin-off of New B&W, on November 5, 2014 the Company entered into retention agreements with Ms. Apker and Messrs. Ferland, Carano and Gedeon (the “retention agreements”) and a severance agreement with Mr. Data (the “Data severance agreement”) to promote leadership continuity through the spin-off and to retain management for New B&W who possess experience with New B&W’s business. The retention agreements entitle each of Ms. Apker and Messrs. Ferland, Carano and Gedeon to a one-time grant of either restricted B&W common stock or restricted stock units (the “retention stock award”) under the Company’s long term incentive plan on the date the Company sets the record date for the spin-off. Each retention stock award will vest one-third on the 30th day following the effective date of the restructuring transaction and two-thirds on the first anniversary of the effective date of a restructuring transaction (as defined in the agreements and which includes the proposed spin-off), so long as the applicable Named Executive remains continuously employed through the applicable vesting date. Mr. Ferland’s retention agreement also provides him with a one-time cash retention award equal to two times the sum of Mr. Ferland’s salary in effect on the date of his retention agreement plus his 2014 target bonus under the EICP, 50% of which would be paid on each of the second and third anniversaries of the effective date of a restructuring transaction, if Mr. Ferland remains continuously employed with New B&W at each such date.
The retention agreements and the Data severance agreement generally provide for certain severance benefits and payments if the applicable Named Executive’s employment is terminated prior to or after the effective date of a restructuring transaction by the Company without “cause” or by the Named Executive for “good reason,” (each as defined in the retention agreements and the severance agreement) prior to (a) the effective date of a restructuring transaction in the case of Mr. Ferland, and (b) the first anniversary of the effective date of a restructuring transaction for our other Named Executives. Under the retention agreements and Data severance agreement, if a “change in control” (as defined under the retention agreements, the Data severance agreement and Mr. Ferland’s change in control agreement, as applicable) occurs at a time when the retention or severance agreement, as applicable, is in effect, and the executive is a party to a change in control agreement with the Company (or any successor entity) (a “change in control agreement”), then the Named Executive will only be entitled to the change in control severance protections contained in his or her respective change in control agreement (in the case of Mr. Ferland, except as modified under his retention agreement as described below), and not also his or her retention agreement or severance agreement, as applicable.
-100-
Table of Contents
Mr. Ferland’s retention agreement modifies his previously executed change in control agreement as follows: (1) after November 5, 2014 but before the effective date of a restructuring transaction, the cash severance multiple that is applied to a base salary and target bonus formula under the change in control agreement is reduced from 2.99 times to 2.5 times; (2) upon the effective date of a restructuring transaction, this cash severance multiple is further reduced from 2.5 times to 1.0 times; but if the effective date of a restructuring transaction does not occur by January 1, 2016, Mr. Ferland’s change in control agreement will continue in effect without regard to these modifications.
On November 5, 2014 the Company and New B&W also entered into an employment agreement with Mr. Ferland in connection with his anticipated appointment as Chief Executive Officer of New B&W which will become effective on the date the spin-off becomes effective. The employment agreement generally provides for a one-year term commencing on the effective date of the restructuring transaction and automatically renews for successive one-year terms unless either party provides prior written notice of nonrenewal 90 days before the end of the then-current term.
For more information on the retention agreements and the Data severance agreement, see “Executive Compensation – Potential Payments Upon Termination or Change in Control” on the following pages.
Section 3: Other Benefits And Practices
Other Benefits and Post-Employment Compensation
Other Benefits and Perquisites
Subject to applicable eligibility rules, our Named Executives receive all of the benefits offered to other Company employees generally, including medical and other health and welfare benefits and participation in Company qualified defined contribution and defined benefit plans. Our Named Executives receive additional limited perquisites, which the Company provides to attract and retain key personnel.
The Company provides the following perquisites to our Named Executives: relocation and temporary housing assistance, annual physicals, tax and financial planning services, reimbursement of limited expenses in connection with a spouse accompanying them on business travel and other miscellaneous items. The Compensation Committee believes the personal benefits offered to our Named Executives are reasonable and appropriate. The Company also provides our Named Executives with limited tax assistance with respect to relocation and the reimbursement of limited spousal expenses discussed above. For relocation, the Company provides tax assistance to Named Executives on the same basis provided to other employees receiving relocation assistance.
For a description of the values and valuation methodology associated with perquisites provided in 2014, see the notes and narratives to the Summary Compensation Table under “Compensation of Executive Officers” below.
Retirement Benefits
Overview. The Company provides retirement benefits through a combination of (a) qualified and non-qualified defined benefit pension plans (the “Pension Plans”), (b) qualified and non-qualified defined contribution retirement plans (the “Thrift Plans”), and (c) a supplemental non-qualified defined contribution executive retirement plan. Due to the volatility, cost and complexity associated with defined benefit plans and evolving employee preferences, the Company has taken steps over the past several years to shift away from traditional defined benefit plans toward defined contribution plans.
The Company began transitioning to defined contribution plans in 2006 when the Company closed the Pension Plans to new and unvested salaried employees and froze benefit accruals for existing salaried participants with less than five years of credited service. In 2012, the Company announced that all benefit accruals for salaried employees still accruing benefits under the Pension Plans would be frozen. To provide a period of transition, those benefit accruals will be frozen effective December 31, 2015. In lieu of future defined benefit plan accruals under those plans, the Company provides additional cash contributions to eligible employees’ Thrift Plan account (the “Service-Based Thrift Contribution”), discussed below.
-101-
Table of Contents
Pension Plans. As a result of the recent changes in eligibility requirements, none of our Named Executives other than Mr. Data participate in the Pension Plans. Mr. Data participates in the qualified and non-qualified excess retirement plans for commercial operations. The excess plan covers a small group of highly compensated employees whose ultimate benefits under the qualified Pension Plans are reduced by Internal Revenue Code (“IRC”) limits on the amount of benefits which may be provided, and on the amount of compensation which may be taken into account in computing benefits. Benefits under the non-qualified excess plan in which our Named Executives participate are paid from the general assets of the Company. See the “Pension Benefits” table under “Compensation of Executive Officers” below for more information regarding the Pension Plans.
Thrift Plans. The Company maintains two primary defined contribution retirement plans: (a) a broad-based, qualified 401(k) plan (the “401(k) Plan”) and (b) a non-qualified restoration plan (the “Restoration Plan”). The 401(k) Plan consists of the following three principal components:
| • | Employee Contributions – Eligible employees may contribute from 1% to 25% of pay (subject to IRC limits). |
| • | Company Matching Contributions – The Company matches 50% of the first 6% of an eligible employee’s contributions. Company matching contributions are made in Company common stock. |
| • | Service-Based Thrift Contributions – Eligible employees receive a cash contribution to their 401(k) Plan account of an amount between 3% and 8% of the employee’s base pay plus overtime pay (excluding bonuses, other special or supplemental pay, severance pay reimbursement for expense or other additional pay in any other form) based on their length of service. |
All of our Named Executives participated in the 401(k) Plan in 2014 and Ms. Apker and Messrs. Ferland, Carano and Gedeon, who are not eligible to participate in the Pension Plans, received the Service-Based Thrift Contribution.
Effective January 1, 2012, the Compensation Committee established the Restoration Plan to (1) more closely align the Company’s executive retirement plans with general market practices as indicated by Hay Group benefit data, (2) ensure the competitiveness of retirement benefits for executives who are not eligible to participant in the Pension Plans, and (3) mirror the dual qualified and non-qualified plan design of the Pension Plans. The Restoration Plan seeks to restore benefits provided by the 401(k) Plan that are precluded by IRC limits on eligible compensation ($260,000 in 2014). The Restoration Plan contains the same principal components as the 401(k) Plan:
| • | Employee Contributions – Eligible employees may defer up to 25% of pay in excess of the IRC compensation limit. |
| • | Company Matching Contributions – The Company matches 50% of the first 6% of employees’ contributions. |
| • | Service-Based Thrift Contributions – Eligible employees receive a cash contribution to their Restoration Plan account of an amount between 3% and 8% of the employee’s eligible compensation in excess of the IRC limit based on their length of service. |
All of our Named Executives participated in the Restoration Plan in 2014. The Company’s obligations under the Restoration Plan are unfunded and plan benefits are payable from the general assets of the company.
Supplemental Plans. The Company also maintains a supplemental executive retirement plan (the “SERP”) through which the Company provides annual contributions to participants’ notional accounts. The SERP also provides participants with additional opportunities to defer the payment of certain compensation earned from the Company.
Under SERP eligibility guidelines adopted by the Compensation Committee in 2013, executives are generally eligible to make contributions to their SERP accounts when they become a “reporting person” for purposes of Section 16 of the Securities Exchange Act of 1934, as amended, or an executive with direct responsibility over operations. However, executives must have completed at least one year of service with the
-102-
Table of Contents
Company or one of the Company’s subsidiaries to be eligible for Company contributions to their SERP accounts. Based on these guidelines, Ms. Apker and Messrs. Ferland and Data were eligible for Company contributions to their SERP accounts in 2014. Mr. Carano and Mr. Gedeon have not yet met the requirements for eligibility for Company contributions under the guidelines.
See the “Nonqualified Deferred Compensation” table and accompanying narrative under “Compensation of Executive Officers” below for more information about the Restoration Plan and SERP.
Severance Arrangements
Babcock & Wilcox Severance Plan. The Company has traditionally maintained a broad-based severance plan to provide a measure of financial assistance to eligible employees who are involuntarily terminated in connection with a permanent reduction in force. In 2012, in consultation with Hay Group, the Compensation Committee approved the replacement of the Company’s broad-based plan with a new modified plan and approved a new executive severance plan. For our Named Executives, however, the severance benefits payable under our Named Executive’s retention agreements (or severance agreement in the case of Mr. Data) are in lieu of any benefits payable under the Company’s executive severance plan. See “Compensation of Executive Officers – Potential Payments Upon Termination or Change In Control” below for more information on the retention and severance agreements with our Named Executives.
Change-in-Control Agreements. The Compensation Committee has offered change-in-control agreements to executives, including Named Executives, since 2010 and in 2013 approved certain immaterial clarifying modifications to the Company’s change in control agreements. The Company believes change-in-control agreements protect stockholders’ interests by serving to:
| • | attract and retain top-quality executive management; |
| • | assure both present and future continuity of executive management in the event of a threatened or actual change in control; and |
| • | ensure the objective focus of executive management in the evaluation of any change-in-control opportunities. |
The Company’s change-in-control agreements contain what is commonly referred to as a “double trigger,” that is, they provide benefits only upon a qualified termination of the executive within one year following a change in control. Stock awards, however, are subject to separate agreements, which vest outstanding stock immediately on the occurrence of a change in control, regardless of whether there is a subsequent termination of employment. Additionally, the change-in-control agreements do not provide any tax gross-up on the benefits following a qualified termination. Instead, the change-in-control agreements contain a “modified cutback” provision, which acts to reduce the benefits payable to an executive to the extent necessary so that no excise tax would be imposed on the benefits paid, but only if doing so would result in the executive retaining a larger after-tax amount. The provision was included with the intent of benefiting the Company by seeking to preserve the tax deductibility of the benefits paid under the agreement, without compromising the objectives for which the agreement was approved.
See the “Potential Payments Upon Termination or Change in Control” tables under “Compensation of Executive Officers” below and the accompanying disclosures for more information regarding the change-in-control agreements with our Named Executives, events considered to be change-in-control events and other plans and arrangements that have different trigger mechanisms relating to a change in control.
Other Compensation Policies / Practices
Stock Ownership Guidelines. The Company maintains stock ownership guidelines for executives and non-management directors. These guidelines establish minimum stock ownership levels of two to five times annual base salary for executives, and five times annual base retainer for non-management directors. The ownership multiple applicable to our Named Executives are:
| • | Mr. Ferland – Five (5) |
| • | Ms. Apker – Two (2) |
| • | Other Named Executives – Three (3) |
-103-
Table of Contents
Directors and executives have five years to achieve their respective minimum ownership levels. The Governance Committee of the Company annually reviews the compliance with these guidelines and has discretion to waive or modify the stock ownership guidelines for directors and executives. No executive or director is authorized to sell any shares of Company common stock (other than to satisfy applicable tax obligations resulting from a transaction involving such stock or to cover the exercise price of stock options) unless they have met their respective guideline.
Timing of Stock Awards. To avoid timing stock awards ahead of the release of material nonpublic information, the Compensation Committee generally approves the annual stock option and other stock awards effective as of the third day following the filing of the Company’s annual report on Form 10-K or quarterly report on Form 10-Q with the Securities and Exchange Commission. The Company has followed this practice for all long-term incentive compensation grants to Named Executives since the Company’s spin-off from McDermott, subject to certain exceptions.
Hedging, Pledging and Short Sale Policies. The Company also maintains a policy that prohibits all directors, officers and employees from trading in puts, calls or other options on Company common stock and otherwise engaging in hedging transactions that are designed to hedge or offset any decrease in the market value of Company common stock. The directors, officers and employees are also prohibited from pledging Company securities and engaging in short sales of Company securities.
Clawbacks. Since 2011, incentive compensation awards include provisions allowing the Company to recover excess amounts paid to individuals who knowingly engaged in a fraud resulting in a restatement.
Proxy Data – Custom Peer Group
| AECOM Technology Corporation |
Hubbell Inc. |
Rockwell Collins, Inc. | ||
| Chicago Bridge & Iron Company |
Huntington Ingalls Industries |
Scana Corporation | ||
| Curtiss-Wright Corporation |
Jacobs Engineering Group, Inc. |
SPX Corporation | ||
| Fluor Corporation |
KBR, Inc. |
URS Corporation | ||
| Flowserve Corporation |
L-3 Communications Holdings Inc. |
|||
| Foster Wheeler AG |
MasTec, Inc. |
Compensation of Executive Officers
The following table summarizes the 2014 compensation of our Chief Executive Officer, Chief Financial Officer and three highest paid executive officers other than the CEO and CFO during 2014. We refer to these persons as our Named Executives and the principle positions given for each Named Executive are their expected titles at New B&W. All of the information included in these tables reflects compensation earned by the individuals for service with the Company. All references in the following tables to stock relate to awards of stock granted by the Company.
Such amounts do not necessarily reflect the compensation such persons will receive following the spin-off because historical compensation was determined by the Company and future compensation levels will be determined based on the compensation policies, programs and procedures to be established by the compensation committee of New B&W.
-104-
Table of Contents
Summary Compensation Table
|
|
||||||||||||||||||||||||||||||||
|
|
||||||||||||||||||||||||||||||||
| Name and Principal Position |
Year | Salary(1) | Bonus(2) | Stock Awards(3) |
Option Awards(3) |
Non-Equity Incentive Plan Compensation(4) |
Change in Pension Value and Nonqualified Deferred Compensation Earnings(5) |
All Other Compensation(6) |
Total | |||||||||||||||||||||||
|
|
||||||||||||||||||||||||||||||||
| E. James Ferland, Chief Executive Officer |
2014 | $937,500 | $ | — | $ | 3,320,748 | $ | 1,299,160 | $ | 1,090,031 | N/A | $ | 252,219 | $ | 6,899,658 | |||||||||||||||||
| Jenny L. Apker, Senior Vice President and Chief Financial Officer |
2014 | $287,025 | $ | — | $ | 169,923 | $ | 66,496 | $ | 162,252 | N/A | $ | 39,344 | $ | 725,040 | |||||||||||||||||
| Elias Gedeon, Senior Vice President & Chief Business Development Officer |
2014 | $250,000 | $ | 200,000 | $ | 237,184 | $ | 90,678 | $ | 184,425 | N/A | $ | 507,956 | $ | 1,470,243 | |||||||||||||||||
| Mark A. Carano, Senior Vice President, Corporate Development & Treasurer |
2014 | $407,500 | $ | — | $ | 335,955 | $ | 131,468 | $ | 313,669 | N/A | $ | 48,075 | $ | 1,236,667 | |||||||||||||||||
| J. Randall Data, Senior Advisor to the CEO (Former President and Chief Operating Officer) |
2014 | $358,750 | $ | — | $ | 395,320 | $ | 154,670 | $ | 214,281 | $ | 586,290 | $ | 78,887 | $ | 1,788,198 | ||||||||||||||||
|
|
||||||||||||||||||||||||||||||||
|
|
||||||||||||||||||||||||||||||||
| (1) | See “Salary” below for a discussion of the amounts reported in this column. |
| (2) | See “Bonus” below for a discussion of the amounts reported in this column. |
| (3) | See “Stock and Option Awards” below for a discussion of the amounts included in this column. |
| (4) | See “Non-Equity Incentive Plan Compensation” below for a discussion of the amounts included in this column. |
| (5) | See “Change in Pension Value and Nonqualified Deferred Compensation Earnings” below for a discussion of the amounts included in this column. |
| (6) | See “All Other Compensation” below for a discussion of the amounts included in this column. |
Salary. Amounts reported in the “Salary” column above include amounts that have been deferred under qualified and non-qualified deferred compensation plans. The 2014 salary paid to Mr. Gedeon represents the amount of salary paid from the date he commenced employment with the Company on May 1, 2014.
Bonus. The amount reported in the “Bonus” column for Mr. Gedeon represents a sign-on incentive bonus received in connection with commencing employment with the Company.
Stock and Option Awards. The amounts reported in the “Stock Awards” and “Option Awards” columns for each Named Executive represent the aggregate grant date fair value of all stock and option awards granted to the Named Executives in 2014 computed in accordance with Financial Accounting Standards Board Accounting Standards Codification (“FASB ASC”) Topic 718, excluding the effect of estimated forfeitures. For a discussion of the valuation assumptions used in determining the grant date fair values, see Note 9 to the combined financial statements included in this prospectus.
The amounts reported in the “Stock Awards” column include the grant date fair values of restricted stock units and performance restricted stock units awarded to our Named Executives in 2014. The values for performance restricted
-105-
Table of Contents
stock units are based on our Named Executives attaining target performance levels, which was determined to be the probable outcome at the time of grant. Assuming the maximum performance levels were probable, the grant date fair values of each Named Executive’s performance restricted stock units would be as follows: $3,965,127 for Mr. Ferland; $202,946 for Ms. Apker; $283,202 for Mr. Gedeon; $401,185 Mr. Carano and $472,031 for Mr. Data. See the “Grants of Plan-Based Awards” table for more information regarding the stock and option awards granted to the Named Executives in 2014.
Non-Equity Incentive Plan Compensation. The amounts reported in the “Non-Equity Incentive Plan Compensation” column are attributable to the annual incentive awards earned under the Company’s EICP. See the “Grants of Plan-Based Awards” table for more information regarding the annual incentive awards earned in 2014.
Change in Pension Value and Nonqualified Deferred Compensation Earnings. The amounts reported in the “Change in Pension Value and Nonqualified Deferred Compensation Earnings” column represent the changes in actuarial present values of the accumulated benefits under defined benefit plans, determined by comparing the prior completed fiscal year end amount to the covered fiscal year end amount. The discount rate applicable to the Pension Plans was 4.8%, 4.1% and 4.8% at December 31, 2013, 2012 and 2011, respectively. Reductions in the discount rate, among other factors, result in an increase in the present value of the pension benefits.
All Other Compensation. The amounts reported for 2014 in the “All Other Compensation” column are attributable to the following:
All Other Compensation
|
|
||||||||||||||||||||
|
|
||||||||||||||||||||
| Mr. Ferland | Ms. Apker | Mr. Gedeon | Mr. Carano | Mr. Data | ||||||||||||||||
|
|
||||||||||||||||||||
| SERP Contribution |
$ | 89,188 | $ | 20,656 | $ | — | $ | — | $ | 20,334 | ||||||||||
| Thrift Plan Contributions |
$ | 15,600 | $ | 14,299 | $ | 13,594 | $ | 15,413 | $ | 6,963 | ||||||||||
| Restoration Plan Contributions |
$ | 38,275 | $ | — | $ | — | $ | 7,825 | $ | 2,506 | ||||||||||
| Tax Reimbursements |
$ | 1,547 | $ | 652 | $ | 84,297 | $ | 688 | $ | — | ||||||||||
| Dividend Equivalents |
$ | 89,401 | $ | 3,737 | $ | 2,198 | $ | 6,259 | $ | 9,765 | ||||||||||
| Perquisites |
$ | 18,208 | $ | — | $ | 407,867 | $ | 17,890 | $ | 39,319 | ||||||||||
|
|
||||||||||||||||||||
|
|
||||||||||||||||||||
SERP Contribution. See the “Nonqualified Deferred Compensation” table for more information regarding these amounts and the SERP.
Thrift Plan Contributions and Restoration Plan Contributions. The amounts reported in these columns represent the total amount of matching and service-based contributions made to each Named Executive under the Company’s Thrift Plan and Restoration Plan, respectively. Under the Company’s Thrift Plan, the Company will match 50% of an employee’s contributions, up to 6%. Under the Company’s Restoration Plan, the Company will match 50% of the first 6% of an employee’s deferral contributions. For information regarding the Company’s Thrift Plan and Restoration Plan matching contributions and service-based contributions, see “Compensation Discussion and Analysis – Other Benefits and Practices – Retirement Benefits” above.
Tax Reimbursements. The tax reimbursements reported for Ms. Apker and Messrs. Ferland and Carano were provided for income imputed to each of them as a result of their spouse attending a company event. The tax reimbursement reported for Mr. Gedeon was provided for income imputed to him as a result of his relocation from Connecticut to North Carolina.
Dividend Equivalents. The amounts listed in this column for each Named Executive represent the value of dividend equivalents credited to their unvested restricted stock unit and performance restricted stock unit awards in 2014. The amounts reported for Messrs. Ferland, Carano and Data also includes the value of dividend equivalents credited to vested restricted stock units that they have elected to defer pursuant to the terms of the
-106-
Table of Contents
2010 Long Term Incentive Plan of The Babcock & Wilcox Company as amended and restated February 25, 2014 (the “2010 LTIP”). Each dividend equivalent is equal to $0.10 per share of common stock underlying the unvested or deferred restricted stock unit for dividends paid to shareholders of the Company during 2014. Dividend equivalents credited to unvested restricted stock units are subject to the same vesting period as the restricted stock units with respect to which the dividend equivalents are paid. Dividend equivalents credited to deferred restricted stock units are subject to the same deferral period as the restricted stock units with respect to which the dividend equivalents are paid.
Perquisites. Perquisites and other personal benefits received by a Named Executive are not included if their aggregate value does not exceed $10,000. The values of the perquisites and other personal benefits reported for our Named Executives in 2014 are as follows:
| • | The $18,208 reported for Mr. Ferland is primarily attributable to financial planning, as well as an annual physical and costs associated with his spouse accompanying him on Company business. |
| • | The $407,867 reported for Mr. Gedeon is attributable to an annual physical and $405,587 of costs associated with his relocation from Connecticut to North Carolina. |
| • | The $17,890 reported for Mr. Carano is primarily attributable to financial planning, as well as an annual physical and costs associated with his spouse accompanying him on Company business. |
| • | The $39,319 reported for Mr. Data is attributable to financial planning and $25,176 of costs associated with temporary housing while on special assignment at the Company’s headquarters in Charlotte, North Carolina. |
The Company calculates all perquisites and personal benefits based on the incremental cost the Company incurs to provide such benefits. Relocation expenses include costs paid to the employee and to third parties for the benefit of the employee, without regard to whether those costs are deductible to the employee. However, the Company excludes any payments by the Company to the third party that manages the relocation program, which would have been incurred without the employee’s relocation and therefore are not “incremental.” For annual physicals, the Company computes incremental cost based on the actual cost incurred by the Company for the physical. For financial planning services, the Company computes incremental cost based on the sum of (1) the actual cost incurred by the Company for the financial planning service for the applicable Named Executive and (2) a pro-rated portion of the fee paid to the third party firm that provides the financial planning services.
-107-
Table of Contents
Grants of Plan-Based Awards
The following table provides additional information on stock awards and equity and non-equity incentive plan awards made to our Named Executives during the year ended December 31, 2014.
|
|
||||||||||||||||||||||||||||||
|
|
||||||||||||||||||||||||||||||
|
Estimated Future Payouts Under |
Estimated Future Payouts Awards(2) |
All Other Stock Stock or Units(3) |
All Other Option Awards: Number of Securities Underlying Options(4) |
Exercise or Base Price of Option Awards |
Grant Date Fair Value of Stock and Option Awards(5) |
|||||||||||||||||||||||||
| Name | Grant Date | Committee Action Date |
Threshold | Target | Maximum | Threshold (#) |
Target (#) |
Maximum (#) |
||||||||||||||||||||||
|
|
||||||||||||||||||||||||||||||
| Mr. Ferland |
|
|||||||||||||||||||||||||||||
| 02/25/14 | 02/25/14 | $468,750 | $937,500 | $1,875,000 | ||||||||||||||||||||||||||
| 03/03/14 | 02/25/14 | 33,693 | 67,386 | 134,772 | $2,202,848 | |||||||||||||||||||||||||
| 03/03/14 | 02/25/14 | 34,197 | $1,117,900 | |||||||||||||||||||||||||||
| 03/03/14 | 02/25/14 | 184,278 | $32.69 | $1,299,160 | ||||||||||||||||||||||||||
| Ms. Apker |
|
|||||||||||||||||||||||||||||
| 02/25/14 | 02/25/14 | $64,581 | $129,161 | $258,323 | ||||||||||||||||||||||||||
| 03/03/14 | 02/25/14 | 1,725 | 3,449 | 6,898 | $112,748 | |||||||||||||||||||||||||
| 03/03/14 | 02/25/14 | 1,749 | $ 57,175 | |||||||||||||||||||||||||||
| 03/03/14 | 02/25/14 | 9,432 | $32.69 | $ 66,496 | ||||||||||||||||||||||||||
| Mr. Gedeon |
|
|||||||||||||||||||||||||||||
| 05/08/14 | 05/08/14 | $75,000 | $150,000 | $300,000 | ||||||||||||||||||||||||||
| 05/15/14 | 05/08/14 | 2,430 | 4,859 | 9,718 | $157,334 | |||||||||||||||||||||||||
| 05/15/14 | 05/08/14 | 2,466 | $ 79,849 | |||||||||||||||||||||||||||
| 05/15/14 | 05/08/14 | 13,290 | $32.38 | $ 90,678 | ||||||||||||||||||||||||||
| Mr. Carano |
|
|||||||||||||||||||||||||||||
| 02/25/14 | 02/25/14 | $122,250 | $244,500 | $489,000 | ||||||||||||||||||||||||||
| 03/03/14 | 02/25/14 | 3,409 | 6,818 | 13,636 | $222,880 | |||||||||||||||||||||||||
| 03/03/14 | 02/25/14 | 3,459 | $113,075 | |||||||||||||||||||||||||||
| 03/03/14 | 02/25/14 | 18,648 | $32.69 | $131,468 | ||||||||||||||||||||||||||
| Mr. Data |
|
|||||||||||||||||||||||||||||
| 02/25/14 | 02/25/14 | $107,625 | $215,250 | $430,500 | ||||||||||||||||||||||||||
| 03/03/14 | 02/25/14 | 4,011 | 8,022 | 16,044 | $262,239 | |||||||||||||||||||||||||
| 03/03/14 | 02/25/14 | 4,071 | $133,081 | |||||||||||||||||||||||||||
| 03/03/14 | 02/25/14 | 21,939 | $32.69 | $154,670 | ||||||||||||||||||||||||||
|
|
||||||||||||||||||||||||||||||
|
|
||||||||||||||||||||||||||||||
| (1) | Amounts shown represent the range of potential payouts under the Company’s annual incentive compensation plan. See “Estimated Future Payouts Under Non-Equity Incentive Plan Awards” below for a discussion of the amounts included in this column. The actual amounts paid to our Named Executives are included in the Non-Equity Incentive Plan Compensation column of the “Summary Compensation Table” above. |
| (2) | See “Estimated Future Payouts Under Equity Incentive Plan Awards” below for a discussion of the amounts included in this column. |
| (3) | Amounts shown represent shares of Company common stock underlying restricted stock units. See “All Other Stock Awards” below for a discussion of the amounts included in this column. |
| (4) | Amounts shown represent the number of shares of Company common stock underlying stock options. See “All Other Option Awards” below for a discussion of the amounts included in this column. |
| (5) | See “Grant Date Fair Value of Stock and Option Awards” below for a discussion of the amounts included in this column. |
-108-
Table of Contents
Estimated Future Payouts Under Non-Equity Incentive Plan Awards
The amounts shown in this column reflect the threshold, target and maximum pay opportunities for each Named Executive under the EICP for 2014. Generally, EICP payout depends on three principal factors: (1) the Company’s financial performance, (2) the Named Executive’s target percentage, and (3) the Named Executive’s earnings from base salary. For 2014, the target percentage for each Named Executive was as follows:
|
|
||||
|
|
||||
| Named Executive | Target Percentage (% of Salary) |
|||
|
|
||||
| Mr. Ferland |
100% | |||
| Ms. Apker |
45% | |||
| Mr. Gedeon |
60% | |||
| Mr. Carano |
60% | |||
| Mr. Data |
60% | |||
|
|
||||
|
|
||||
The amounts reflected in the “target” column of the “Grants of Plan Based Awards” table represent the value of the payout opportunity under the EICP at target financial performance levels. This amount was calculated by multiplying the Named Executive’s target percentage by the amount of base salary earned by each Named Executive in 2014.
The amounts shown in the “maximum” column represent the maximum payout opportunity in 2014, which for all Named Executives was 200% of the target amount. The amounts shown in the “threshold” column represent the minimum payout opportunity in 2014 assuming threshold financial performance, which for all Named Executives was 50% of the target amount. If threshold financial performance is not achieved, no amount is paid under EICP.
All threshold, target and maximum amounts reported in the table above assume that the Compensation Committee exercises no discretion over the annual incentive compensation award ultimately paid.
See “—Compensation Discussion and Analysis—Compensation Analysis—Annual Incentive Compensation” on the previous pages for more information about the 2014 EICP awards and performance goals.
Estimated Future Payouts Under Equity Incentive Plan Awards
The amounts shown reflect the threshold, target and maximum payout opportunities of performance restricted stock units granted in 2014 under the 2010 LTIP. Each grant represents a right to receive one share of Company common stock if performance targets are met. Upon vesting, the performance restricted stock units are converted into shares of Company common stock. The amount of performance restricted stock units that vest, if any, is determined based (1) 40% on the average annual return on invested capital during the three-year performance period, (2) 40% on the Company’s cumulative earnings per share during the same period, and (3) 20% on relative total shareholder return compared to the companies in the Company’s custom peer group. The amounts shown in the “target” column represent the number of performance shares that will vest, which is 100% of the amount granted, if the target levels of average annual return on invested capital, cumulative diluted earnings per share and relative total shareholder return are attained. The amounts shown in the “maximum” column represent the number of performance shares that will vest, which is 200% of the amount granted, if the maximum level of average annual return on invested capital, cumulative earnings per share and relative total shareholder return are attained. The amounts shown in the “threshold” column represent the minimum number of performance shares that will vest, which is 50% of the amount granted, if the threshold level of average annual return on invested capital, cumulative earnings per share and relative total shareholder return are attained. No amount of performance shares will vest if the levels of all three such performance metrics are less than the threshold performance level. See “—Compensation Discussion and Analysis—Compensation Analysis—Long-Term Incentive Compensation” above for more information regarding the 2014 performance shares.
-109-
Table of Contents
All Other Stock Awards
The amounts shown reflect 2014 grants of restricted stock units under the Company’s 2010 LTIP. Each restricted stock unit represents the right to receive one share of Company common stock and is generally scheduled to vest one-third each year. Upon vesting, the restricted stock units are converted into shares of Company common stock. The Company withholds a portion of these shares to satisfy the minimum statutory withholding tax for each Named Executive due on vesting. See “—Compensation Discussion and Analysis—Compensation Analysis—Long-Term Incentive Compensation” for more information regarding the 2014 restricted stock units.
All Other Option Awards
The amounts shown reflect 2014 grants of stock options under the Company’s 2010 LTIP. Each option represents the right to purchase one share of B&W common stock at the exercise price. Options generally expire seven years from the date of grant. The stock options are generally scheduled to vest and become exercisable one-third each year. See “—Compensation Discussion and Analysis—Compensation Analysis—Long-Term Incentive Compensation” above for more information regarding the 2014 stock options.
Grant Date Fair Value of Stock and Option Awards
The amounts included in the “Grant Date Fair Value of Stock and Option Awards” column for each Named Executive represent the full grant date fair values of the equity awards computed in accordance with FASB ASC Topic 718. Under FASB ASC Topic 718, the fair value of equity awards is determined using the closing price of the Company’s common stock on the date of grant for restricted stock units and performance restricted stock units, and an option-pricing model for stock options. A Black-Scholes option-pricing model was used for determining the grant date fair value of stock options granted to our Named Executives. The determination of the fair value of an award on the date of grant using an option-pricing model requires various assumptions, such as the expected life of the award and stock price volatility. For more information regarding the compensation expense related to the awards, and a discussion of valuation assumptions utilized in option pricing, see the information set forth under the heading “Company Stock Options” in Note 9, “Stock-Based Compensation,” to the combined financial statements included in this prospectus.
The amounts reported in the “Grant Date Fair Value of Stock and Option Awards” column for restricted stock unit and performance restricted stock unit awards do not factor in the value of dividend equivalents credited to each unvested restricted stock unit as a result of dividends on stock declared by the Company in 2014. For more information on the value of dividend equivalents credited to our Named Executives’ unvested restricted stock unit and performance restricted stock unit awards, See “All Other Compensation” under the “Summary Compensation Table”. The amounts reported in this column for performance restricted stock units reflect the grant date fair value of these awards based upon the probable outcome of the conditions of such awards.
-110-
Table of Contents
Outstanding Equity Awards at Fiscal Year-End
The following Outstanding Equity Awards at Fiscal Year-End table summarizes the equity awards the Company has made to our Named Executives that were outstanding as of December 31, 2014.
| Option Awards | Stock Awards | |||||||||||||||||||||||||||
| Name | Grant Date(1) |
Number of Exercisable |
Number of Securities Underlying Unexercised Options Unexercisable |
Equity Incentive Plan Awards: Number of Securities Underlying Unexercised Unearned Options |
Option Exercise |
Option Expiration Date |
Number of Shares or Units of Stock That Have Not Vested |
Market Value of Shares or |
Equity Incentive Plan Awards: Number of Unearned Shares, Units or Other Rights That Have Not Vested |
Equity Incentive Plan Awards: Market or Payout Value of Unearned Shares, Units or Other Rights That Have Not Vested(2) |
||||||||||||||||||
| Mr. Ferland |
||||||||||||||||||||||||||||
| Stock Options |
04/19/12 | 60,190 | 30,095 | (3) | — | $23.42 | 04/19/19 | |||||||||||||||||||||
| Stock Options |
04/19/12 | 24,288 | 48,576 | (4) | — | $23.42 | 04/19/19 | |||||||||||||||||||||
| Stock Options |
03/04/13 | 51,115 | 102,230 | (5) | — | $26.80 | 03/04/20 | |||||||||||||||||||||
| Stock Options |
03/03/14 | — | 184,278 | (6) | — | $32.69 | 03/03/21 | |||||||||||||||||||||
| RSU |
04/19/12 | 11,364(3) | $344,329 | |||||||||||||||||||||||||
| RSU |
04/19/12 | 37,660(4) | $1,141,098 | |||||||||||||||||||||||||
| RSU |
03/04/13 | 21,852(5) | $662,116 | |||||||||||||||||||||||||
| RSU |
03/03/14 | 34,197(6) | $1,036,169 | |||||||||||||||||||||||||
| Performance Shares |
04/19/12 | 36,595(7) | $1,108,829 | |||||||||||||||||||||||||
| Performance RSU |
03/04/13 | 33,079(8) | $1,002,294 | |||||||||||||||||||||||||
| Performance RSU |
03/03/14 | 33,693(9) | $1,020,898 | |||||||||||||||||||||||||
| Ms. Apker |
||||||||||||||||||||||||||||
| Stock Options |
08/12/10 | 6,255 | 0 | (10) | — | $22.39 | 08/12/17 | |||||||||||||||||||||
| Stock Options |
03/04/11 | 3,768 | 0 | (11) | — | $34.55 | 03/04/18 | |||||||||||||||||||||
| Stock Options |
03/05/12 | 2,766 | 1,383 | (3) | — | $26.59 | 03/05/19 | |||||||||||||||||||||
| Stock Options |
03/04/13 | 2,633 | 5,266 | (5) | — | $26.80 | 03/04/20 | |||||||||||||||||||||
| Stock Options |
03/03/14 | — | 9,432 | (6) | — | $32.69 | 03/03/21 | |||||||||||||||||||||
| RSU |
03/05/12 | 535(3) | $16,211 | |||||||||||||||||||||||||
| RSU |
03/04/13 | 1,126(5) | $34,118 | |||||||||||||||||||||||||
| RSU |
03/03/14 | 1,749(6) | $52,995 | |||||||||||||||||||||||||
| Performance Shares |
03/05/12 | 1,738(7) | $52,611 | |||||||||||||||||||||||||
| Performance RSU |
03/04/13 | 1,704(8) | $51,631 | |||||||||||||||||||||||||
| Performance RSU |
03/03/14 | 1,725(9) | $52,268 | |||||||||||||||||||||||||
| Mr. Gedeon |
||||||||||||||||||||||||||||
| Stock Options |
05/15/14 | — | 13,290 | (12) | — | $32.38 | 05/15/21 | |||||||||||||||||||||
| RSU |
05/15/14 | 2,466(12) | $74,720 | |||||||||||||||||||||||||
| Performance RSU |
05/15/14 | 2,430(9) | $73,629 | |||||||||||||||||||||||||
| Mr. Carano |
||||||||||||||||||||||||||||
| Stock Options |
06/12/13 | 7,427 | 14,854 | (13) | — | $29.80 | 06/12/20 | |||||||||||||||||||||
| Stock Options |
03/03/14 | — | 18,648 | (6) | — | $32.69 | 03/03/21 | |||||||||||||||||||||
| RSU |
06/12/13 | 6,352(13) | $192,466 | |||||||||||||||||||||||||
| RSU |
03/03/14 | 3,459(6) | $104,808 | |||||||||||||||||||||||||
| Performance RSU |
03/03/14 | 3,409(9) | $103,293 | |||||||||||||||||||||||||
| Mr. Data |
||||||||||||||||||||||||||||
| Stock Options |
03/04/10 | 8,696 | 0 | (14) | — | $24.55 | 03/04/17 | |||||||||||||||||||||
| Stock Options |
03/04/11 | 7,788 | 0 | (11) | — | $34.55 | 03/04/18 | |||||||||||||||||||||
| Stock Options |
03/05/12 | 6,902 | 3,451 | (3) | — | $26.59 | 03/05/19 | |||||||||||||||||||||
| Stock Options |
03/04/13 | 6,970 | 13,940 | (5) | — | $26.80 | 03/04/20 | |||||||||||||||||||||
| Stock Options |
03/03/14 | — | 21,939 | (6) | — | $32.69 | 03/03/21 | |||||||||||||||||||||
| RSU |
03/05/12 | 1,335(3) | $40,451 | |||||||||||||||||||||||||
| RSU |
03/04/13 | 2,980(5) | $90,294 | |||||||||||||||||||||||||
| RSU |
03/03/14 | 4,071(6) | $123,351 | |||||||||||||||||||||||||
| Performance Shares |
03/05/12 | 4,337(7) | $131,411 | |||||||||||||||||||||||||
| Performance RSU |
03/04/13 | 4,511(8) | $136,683 | |||||||||||||||||||||||||
| Performance RSU |
03/03/14 | 4,011(9) | $121,533 | |||||||||||||||||||||||||
|
|
||||||||||||||||||||||||||||
|
|
||||||||||||||||||||||||||||
| (1) | The dates presented in this column represent the date the awards were granted (a) by the Company’s former parent company, McDermott International, Inc., prior to July 2010 (the “McDermott 2010 Awards”) and (b) by the Company for all other awards. The McDermott 2010 Awards were converted to equity in the Company in connection with the Company’s spin-off from McDermott International Inc. in 2010 (the “McDermott spin-off”) with new grant dates of August 2, 2010 for stock options. However, when the McDermott 2010 Awards were converted to equity in the Company, they remained subject to the same general vesting schedule. Therefore, to assist in understanding the vesting dates associated with the McDermott 2010 Awards, we are presenting the original grant dates prior to the McDermott spin-off. |
| (2) | Market values in these columns are based on the closing price of Company common stock as of December 31, 2014 ($30.30), as reported on the New York Stock Exchange. |
| (3) | These stock options and restricted stock units vested on March 5, 2015. See “Vesting of Restricted Stock Units” below for a discussion of the vesting schedules for Company restricted stock units. |
-111-
Table of Contents
| (4) | One-half of these stock options and restricted stock units vested on March 5, 2015 and the remaining one-half will vest on March 5, 2016. |
| (5) | One-half of these stock options and restricted stock units vested on March 4, 2015 and the remaining one-half will vest on March 4, 2016. |
| (6) | One-third of these stock options and restricted stock units vested on March 3, 2015 and an additional one-third will vest on each of March 3, 2016 and 2017. |
| (7) | These performance shares represent the right to receive one share of Company common stock for each performance share that vests. The number and value of performance shares that vest depend upon the attainment of specified performance goals. The number and value of performance shares reported are based on achieving threshold performance levels. These performance shares were generally scheduled to vest 100% on March 5, 2015, however no shares vested as a result of the threshold performance levels not being achieved. |
| (8) | These performance shares represent the right to receive one share of Company common stock for each performance share that vests. The number and value of performance shares that vest depend upon the attainment of specified performance goals. The number and value of performance shares reported are based on achieving threshold performance levels. These performance shares are generally scheduled to vest 100% on March 4, 2016. |
| (9) | These performance shares represent the right to receive one share of Company common stock for each performance share that vests. The number and value of performance shares that vest depend upon the attainment of specified performance goals. The number and value of performance shares reported are based on achieving threshold performance levels. These performance shares are generally scheduled to vest 100% on March 3, 2017. |
| (10) | These stock options vested on August 12, 2013. |
| (11) | These stock options vested on March 4, 2014. |
| (12) | One-third of these stock options and restricted stock units vest on May 15, 2015 and an additional one-third will vest on each of May 15, 2016 and 2017. |
| (13) | One-half of these stock options and restricted stock units vest on June 12, 2015 and the remaining one-half will vest on June 12, 2016. |
| (14) | These stock options vested on March 4, 2013. |
Vesting of Restricted Stock Units
Except as noted below, restricted stock units generally vest one-third each year. In addition, the restricted stock units awarded in 2012 and 2013 are subject to an additional accelerated vesting schedule if the Named Executive is at least 60 years old and has at least 10 years of service with the Company prior to the third anniversary of the applicable grant date (“Retirement Eligibility”). The 2014 restricted stock unit awards do not contain such an accelerated vesting schedule. For all 2012 and 2013 restricted stock unit awards, the accelerated vesting schedule provides that (1) 25% of the then unvested restricted stock units will vest on the date the Named Executive attains Retirement Eligibility on or after the first anniversary of the grant date, and (2) 50% of the then unvested restricted stock units vest on the date the Named Executive attains Retirement Eligibility on or after the second anniversary of the grant date. None of our Named Executives have attained Retirement Eligibility as of December 31, 2014. As a result, the 2012 and 2013 restricted stock units for our Named Executives were not eligible for accelerated vesting. See “Potential Payments Upon Termination or Change In Control” for more information on potential payments upon retirement and other events.
-112-
Table of Contents
Option Exercises and Stock Vested
The following Option Exercises and Stock Vested table provides additional information about the value realized by our Named Executives on exercises of Company option awards and vesting of Company stock awards during the year ended December 31, 2014.
|
|
||||||||||||||||
|
|
||||||||||||||||
| Option Awards | Stock Awards | |||||||||||||||
| Name | Number of Shares Acquired on Exercise (#) |
Value on |
Number of Shares Acquired on Vesting (#) |
Value on Vesting |
||||||||||||
| Mr. Ferland |
— | — | 41,120 | $ | 1,358,913 | |||||||||||
| Ms. Apker |
— | — | 4,925 | $ | 162,266 | |||||||||||
| Mr. Gedeon |
— | — | — | — | ||||||||||||
| Mr. Carano |
— | — | 3,176 | $ | 102,235 | |||||||||||
| Mr. Data(1) |
15,854 | $ | 350,168 | 10,733 | $ | 353,651 | ||||||||||
|
|
||||||||||||||||
| (1) | $49,066 of the amount reported in the “Stock Awards – Value Realized on Vesting” column represents the realized value of 1,490 restricted stock units that Mr. Data has elected to defer pursuant to the terms of the Company’s 2010 LTIP. See the “Non-Qualified Deferred Compensation” table below for more information on the deferral of stock awards. |
Option Awards. Each stock option exercise reported in the “Option Exercises and Stock Vested” table was affected as a simultaneous exercise and sale. For all exercise and sales reported above, the value realized on exercise was calculated based on the difference between the exercise price of the stock option and the price at which the shares were sold.
Stock Awards. For each Named Executive, the amounts reported in the number of shares acquired on vesting column in the table above represent the aggregate number of shares of Company common stock acquired by the Named Executive in connection with restricted stock units awarded under the 2010 LTIP that vested in 2014. The amounts reported in the value realized on vesting column were calculated by multiplying the number of shares acquired on the date of vesting by the closing price of Company common stock on the date of vesting.
The number of shares acquired in connection with the vesting of restricted stock units includes shares withheld by the Company in the amounts and for the Named Executives reported below to satisfy the minimum statutory withholding tax due on vesting.
|
| ||
|
| ||
| Name | Shares Withheld on Vesting of Restricted Stock Units | |
| Mr. Ferland |
15,199 | |
| Ms. Apker |
1,722 | |
| Mr. Gedeon |
— | |
| Mr. Carano |
1,052 | |
| Mr. Data |
3,270 | |
|
| ||
-113-
Table of Contents
Pension Benefits
The following Pension Benefits table shows the present value of accumulated benefits payable to each of our Named Executives under the qualified and nonqualified pension plans.
|
| ||||||||||||
|
| ||||||||||||
| Name | Plan Name | Number of Years Credited Service |
Present Value of Accumulated Benefit |
Payments During 2014 | ||||||||
| Mr. Ferland |
N/A | N/A | N/A | N/A | ||||||||
| Ms. Apker |
N/A | N/A | N/A | N/A | ||||||||
| Mr. Gedeon |
N/A | N/A | N/A | N/A | ||||||||
| Mr. Carano |
N/A | N/A | N/A | N/A | ||||||||
| Mr. Data |
B&W Commercial Operations Qualified Retirement Plan B&W Commercial Operations Excess Plan |
|
26.917 26.917 |
|
$ $ |
1,503,809 725,317 |
|
— — | ||||
|
| ||||||||||||
|
| ||||||||||||
Overview of Qualified Plans. The Company maintains retirement plans that are funded by trusts and cover certain eligible regular full-time employees, described below in the section entitled “Participation and Eligibility.” Mr. Data participates in the Retirement Plan for Employees of Babcock & Wilcox Commercial Operations (the “Qualified Plan”) for the benefit of eligible employees of the Company and the Company’s Power Generation and Nuclear Energy segments.
Due to the date of employment of Ms. Apker and Messrs. Ferland, Gedeon, and Carano, they are not eligible to participate in the Company’s defined benefit plans. For more information on how the Company’s retirement plans will generally be treated in connection with the spin-off, see “Relationship with the Company Following the Spin-off–Employee Matters Agreement.”
Participation and Eligibility. Generally, salaried employees over the age of 21 years, who were hired before April 1, 2001, participate in the retirement plans.
| • | For salaried participants hired before April 1, 2001, benefit accruals will be frozen as of December 31, 2015. Beginning January 1, 2016, affected employees will receive a service-based cash contribution to their Thrift Plan account. |
| • | For salaried participants hired on or after April 1, 2001, benefit accruals were frozen as of March 31, 2006, subject to cost of living adjustments. Beginning January 1, 2016, the cost of living adjustments will be discontinued. Affected employees receive a service-based cash contribution to their Thrift Plan account. |
Benefits. For eligible Named Executives, benefits under the Qualified Plan are based on years of credited service and final average cash compensation (including bonuses).
The present value of accumulated benefits reflected in the Pension Benefit table above is based on a 4.0% discount rate at December 31, 2014 and the RP2014 mortality table projected with the MP2014 mortality improvement scale. The discount rate applicable to the pension plans at December 31, 2013 and December 31, 2012 was 4.8% and 4.1%, respectively. Reductions in the discount rate, among other factors, result in an increase in the present value of the pension benefits.
Retirement and Early Retirement. Under the Qualified Plan, normal retirement is age 65. The normal form of payment is a single-life annuity or a 50% joint and survivor annuity, depending on the employee’s marital status when payments are scheduled to begin. Early retirement eligibility and benefits under the Qualified Plan depends on the employee’s date of hire. Employees hired before April 1, 1998, including Mr. Data, are eligible for early retirement if the employee has completed at least 15 years of credited service and attained the age of 50. Early retirement benefits are based on the same formula as normal retirement, but the pension benefit is not reduced to reflect early commencement of payment if the sum of the employee’s age and years of service equals 75 or greater at the date benefits commence; otherwise the pension benefit is reduced by 4% times the difference between 75 and the participant’s age plus service.
-114-
Table of Contents
Overview of Nonqualified Plans. To the extent benefits payable under the Company’s qualified plans are limited by Section 415(b) or 401(a)(17) of the Internal Revenue Code, pension benefits will be paid directly by the Company’s applicable subsidiaries under the terms of unfunded excess benefit plans (the “Excess Plans”) maintained by them. Mr. Data participates in the Excess Plan for certain employees of Babcock & Wilcox Commercial Operations.
Nonqualified Deferred Compensation
The following Nonqualified Deferred Compensation table summarizes our Named Executives’ compensation under the nonqualified defined contribution plans.
|
|
||||||||||||||||||||||
|
|
||||||||||||||||||||||
| Name | Plan Name | Executive Contributions in 2014 |
Company Contributions in 2014 |
Aggregate Earnings in 2014 |
Aggregate Distributions |
Aggregate Balance at 12/31/14 |
||||||||||||||||
|
|
||||||||||||||||||||||
| Mr. Ferland |
SERP Restoration Plan |
$ |
— 38,275 |
|
$ $ |
89,188 38,275 |
|
$ $ |
7,435 11,093 |
|
|
— — |
|
$ $ |
96,623 222,632 |
| ||||||
| Ms. Apker |
SERP Restoration Plan |
|
— — |
|
$
|
20,656 — |
|
$ $ |
5,289 46 |
|
|
— — |
|
$ $ |
74,232 684 |
| ||||||
| Mr. Gedeon(1) |
SERP Restoration Plan |
|
— — |
|
|
N/A N/A |
|
|
N/A N/A |
|
|
— — |
|
|
N/A N/A |
| ||||||
| Mr. Carano(1) |
SERP Restoration Plan |
$ |
— 7,825 |
|
$ |
N/A 7,825 |
|
$ |
N/A 225 |
|
|
— — |
|
$ |
N/A 15,875 |
| ||||||
| Mr. Data |
SERP Restoration Plan |
$ |
— 5,013 |
|
$ $ |
20,334 2,506 |
|
$ $ |
4,057 1,248 |
|
|
— — |
|
$ $ |
96,134 25,752 |
| ||||||
|
|
||||||||||||||||||||||
|
|
||||||||||||||||||||||
| (1) | No information is provided for Messrs. Gedeon and Carano because neither executive deferred cash compensation or was eligible to receive Company contributions under the SERP for 2014. |
SERP. The Company’s SERP is an unfunded, nonqualified defined contribution plan through which the Company provides annual contributions to a participant’s notional account, which is referred to as a participant’s company account. Participants include officers selected by the Compensation Committee. Benefits under the SERP are based on the participating officer’s vested percentage in his or her notional account balance at the time of distribution. An officer generally vests in his or her company SERP account 20% for each year of participation in their respective company account, subject to accelerated vesting for death, disability, termination by the company without cause, retirement or on a change in control.
For 2014, participants could elect to defer the payment of certain compensation earned from the Company. Under the SERP, any amounts deferred by a participant are maintained in a notional account separate from the account into which the Company makes annual contributions. This separate account is referred to as a participant’s deferral account. Participants are 100% vested in their deferral accounts at all times.
Restoration Plan. The Company’s Restoration Plan is an unfunded, nonqualified defined contribution plan through which the Company provides annual contributions to each participant’s notional accounts, which are referred to as a participant’s company matching account and company service-based account. Participants include the Named Executives and other employees of the Company whose base salary exceeds certain compensation limits imposed by the Internal Revenue Code. Benefits under the Restoration Plan are based on a participant’s vested percentage in his or her notional account balance at the time of distribution. Each participant generally vests 100% in his or her company matching account and company service-based account upon completing three years of service with the Company, subject to accelerated vesting for death, disability, termination by the company without cause, retirement or on a change in control.
Participants in the Company’s Restoration Plan may elect to defer the payment of certain compensation earned from the Company or its subsidiaries that is in excess of limits imposed by the Internal Revenue Code. As with the Company’s SERP, any amounts deferred by a participant in the Restoration Plan are reflected in a notional deferral account that is separate from the participant’s company matching and service-based accounts. Participants are 100% vested in their deferral accounts at all times.
-115-
Table of Contents
Executive Contributions in 2014. Under the Company’s SERP, an officer selected by the Compensation Committee may elect to defer up to 50% of his or her annual salary and/or up to 100% of any bonus earned in any plan year and a member of the Board may elect to defer up to 100% of his or her retainers and fees earned in any plan year. Although participants were permitted to contribute all or a portion of their 2014 EICP bonuses to their SERP accounts, the amounts reported in this table as “Executive Contributions in 2014” do not include any contributions of any 2014 EICP awards because EICP awards earned in 2014 are not paid until 2015. Amounts reported in this column for each Named Executive are reported as “Salary” for each Named Executive in the Summary Compensation Table above.
All of our Named Executives other than Ms. Apker elected to contribute to their Restoration Plan deferral accounts in 2014. The Company’s Restoration Plan allows participants to defer a percentage of their base salary in excess of the Internal Revenue Code Section 401(a)(17) compensation limit, and receive company matching contributions with respect to those deferrals.
Company Contributions in 2014. The Company makes annual notional contributions to participating employees’ SERP company accounts equal to a percentage of the employee’s prior-year compensation, as determined by the Compensation Committee. Under the terms of the SERP, the contribution percentage may not be the same for all participants. Additionally, the Compensation Committee may approve a discretionary contribution to a participant’s account at any time.
For 2014, the contributions reported in the table above for the SERP reflect notional contributions made by the Company to each participating Named Executive’s company account. The Company’s 2014 contributions equaled 5% of the Named Executives’ base salaries and EICP awards paid in 2013. All 2014 contributions are included in the Summary Compensation Table above as “All Other Compensation.”
Under the Company’s Restoration Plan, the Company makes notional matching and serviced-based contributions to eligible participants’ company matching account and serviced-based account, respectively. Any Restoration Plan participants who have elected to make deferral contributions under the Restoration Plan are credited with a Company matching contribution equal to 50% of the first 6% of their deferral contribution. For each participant in the Restoration Plan who is not eligible to participate in the Company’s pension plans, the Company also makes a cash service-based contribution to the participant’s company service-based account. The amount of this service-based contribution is based on a percentage of the participant’s eligible compensation in excess of the Internal Revenue Code limit and ranges between 3% and 8%, depending on the participant’s years of service. This service-based contribution is made regardless of whether the participant has elected to make deferral contributions under the Company’s Restoration Plan. All 2014 company contributions are included in the “Summary Compensation Table” above as “All Other Compensation.”
Aggregate Earnings in 2014. The amounts reported in this column for the SERP and Restoration Plan represent hypothetical amounts of earnings or losses and dividends credited during 2014 on all accounts for each Named Executive under the Company’s SERP and Restoration Plan. Under these plans, each participant elects to have his or her notional accounts hypothetically invested in one or more of the investment funds designated by the Compensation Committee. Each participant’s notional accounts are credited and debited to reflect gains and losses on the hypothetical investments. These gains and losses are not reported as compensation in the Summary Compensation Table.
Aggregate Balance at December 31, 2014. The aggregate balance of a participating officer’s notional SERP account consists of contributions made by the Company to the officer’s company account, deferrals by the officer to his or her deferral account and hypothetical credited gains or losses on those accounts. The aggregate balance of a participating officer’s notional Restoration Plan Account consists of contributions made by the Company to the officer’s company matching account and company service-based account, deferrals by the officer to his or her deferral account, and hypothetical gains or losses on those accounts. The balances shown represent the accumulated account values (including gains and losses) for each Named Executive as of December 31, 2014. Ms. Apker was 60% vested in her SERP balance and Messrs. Ferland and Data were 20% and 80% vested, respectively, in their SERP balances as shown above. Ms. Apker and Mr. Data were each 100% vested in their Restoration Plan balance as shown above.
Deferred Stock Under 2010 LTIP. Under the terms of the 2010 LTIP, the Compensation Committee has the discretion to permit selected participants to defer all or a portion of their stock and option awards. Participants,
-116-
Table of Contents
including our Named Executives, were permitted to make deferral elections on their 2014 time and performance vested restricted stock unit awards. Messrs. Ferland, Data and Carano were the only Named Executives to make deferral elections on their 2014 awards.
Potential Payments Upon Termination or Change in Control
The following tables show potential payments to our Named Executives under existing contracts, agreements, plans or arrangements, whether written or unwritten, for various scenarios under which a payment would be due in the event of a change in control or termination of employment of our Named Executives, assuming a December 31, 2014 termination date. Where applicable, the amounts listed below use the closing price of the Company’s common stock of $30.30 (as reported on the NYSE) as of December 31, 2014. These tables do not reflect amounts that would be payable to the Named Executives pursuant to benefits or awards that are already vested.
Except as otherwise indicated, amounts reported in the below tables for stock options, restricted stock units and performance shares/RSUs represent the value of unvested and accelerated shares or units, as applicable, calculated by:
| • | for stock options: multiplying the number of accelerated options by the difference between the exercise price and $30.30 (the closing price of the Company’s common stock on December 31, 2014); and |
| • | for restricted stock units, performance shares and performance restricted stock units: multiplying the number of accelerated shares or units by $30.30 (the closing price of the Company’s common stock on December 31, 2014). |
Estimated Value of Benefits to Be Received Upon Involuntary Termination Without Cause
The following table shows the estimated value of payments and other benefits due the Named Executives assuming their involuntary termination without cause as of December 31, 2014. In the event of a Named Executive’s termination with cause, none of these payments and other benefits would be due.
| Mr. Ferland | Ms. Apker | Mr. Gedeon | Mr. Carano | Mr. Data | ||||||||||||||||
| Severance Payments |
$ | 4,750,000 | $ | 841,000 | $ | 1,200,000 | $ | 1,312,000 | $ | 1,168,000 | ||||||||||
| Cash Retention Award |
$ | 1,900,000 | — | — | — | — | ||||||||||||||
| Benefits Payment |
$ | 51,974 | $ | 38,016 | $ | 57,374 | $ | 51,444 | $ | 52,473 | ||||||||||
| EICP |
$ | 1,090,031 | $ | 162,252 | $ | 184,425 | $ | 313,669 | $ | 214,281 | ||||||||||
| Financial Planning |
$ | 6,048 | — | — | $ | 6,048 | $ | 6,048 | ||||||||||||
| Supplemental Executive Retirement Plan (SERP) |
$ | 77,299 | $ | 29,693 | — | — | $ | 19,827 | ||||||||||||
| Restoration Plan |
$ | 111,297 | — | — | $ | 7,937 | — | |||||||||||||
| Stock Options (unvested and accelerated) |
$ | 899,061 | $ | 23,562 | — | $ | 7,427 | $ | 61,593 | |||||||||||
| Restricted Stock Units (unvested and accelerated) |
$ | 3,183,712 | $ | 103,323 | $ | 74,720 | $ | 297,273 | $ | 254,096 | ||||||||||
| Performance Shares/RSUs (unvested and unforfeited) |
$ | 6,264,010 | $ | 313,090 | $ | 147,228 | $ | 206,585 | $ | 779,225 | ||||||||||
| Tax Reimbursements |
— | — | — | — | — | |||||||||||||||
| Total |
$ | 18,333,432 | $ | 1,510,936 | $ | 1,663,747 | $ | 2,202,383 | $ | 2,555,543 | ||||||||||
Severance Payment. The severance payments reported for each Named Executive represent a lump-sum cash payment equal to 2 times (2.5 times for Mr. Ferland) the sum of the Named Executive’s annual base salary and target bonus amount as in effect on the date of termination. This is the amount that would be payable
-117-
Table of Contents
pursuant to the Restructuring Transaction Retention Agreements that the Company entered into with each of Ms. Apker and Messrs. Ferland, Carano and Gedeon (the “retention agreements”), and the Restructuring Transaction Severance Agreement that the Company entered into with Mr. Data (the “Data severance agreement” and, collectively with the retention agreements, the “retention and severance agreements”) on or about November 5, 2014 in connection with the Company’s announcement of its plans to pursue the spin-off. The retention and severance agreements generally provide certain severance payments and benefits in the event that the Named Executive’s employment with the Company or one of its subsidiaries or a successor company is terminated prior to: (a) in the case of Mr. Ferland, the effective date of the proposed spin-off or certain other events described in the retention and severance agreements (each a “restructuring transaction”); and (b) for all other Named Executives, the first anniversary of the effective date of a restructuring transaction, either by the employer company for any reason other than “cause” or “disability” or by the Named Executive for “good reason” Under the retention and severance agreements, “cause” means:
| • | the willful and continued failure of the executive to perform substantially his or her duties (occasioned by reason other than physical or mental illness or disability) after a written demand for substantial performance is delivered to the participant by the compensation committee or the chief executive officer, which specifically identifies the manner in which the compensation committee or the chief executive officer believes that the participant has not substantially performed his or her duties, after which the participant will have 30 days to defend or remedy such failure to substantially perform his or her duties; |
| • | the willful engaging by a participant in illegal conduct or gross misconduct, which is materially and demonstrably injurious to the Company; or |
| • | the conviction of a participant with no further possibility of appeal, or plea of nolo contendere by the participant to, any felony or crime of falsehood. |
Except as set forth on the following pages, the severance payments and benefits payable to our Named Executives are in lieu of any severance payments or benefits payable under any other severance plan, benefit or program of the Company, including the Company’s Executive Severance Plan. Receipt of severance benefits under the retention and severance agreements is subject to the Named Executive executing a general release of claims and agreeing to certain non-compete, nondisclosure and other restrictive covenants.
Cash Retention Award. Mr. Ferland’s retention agreement provides a one-time cash retention award equal to two times the sum of Mr. Ferland’s salary in effect on the date of his retention agreement plus his 2014 target bonus under the EICP, 50% of which would be paid on each of the second and third anniversaries of a restructuring transaction if Mr. Ferland remains continuously employed with New B&W at each such date. If Mr. Ferland’s employment is terminated by the Company without cause (among other reasons) as of December 31, 2014, Mr. Ferland would become immediately vested in 50% of his cash retention award.
Benefits Payment. Upon a termination for any reason other than cause under the retention and severance agreements, each Named Executive would also be entitled to a lump-sum payment equal to three times the full annual cost of coverage (COBRA continuation coverage in the case of Mr. Data) for the medical, dental and/or vision benefits in effect for the applicable Named Executive and his or her qualified beneficiaries as of the date of termination. This payment is subject to the same conditions described above for severance payments under the retention and severance agreements. The amounts reported for all Named Executives other than Mr. Data were determined by multiplying the annual cost of 2014 medical, dental and/or vision benefits for the Named Executive and his or her qualified beneficiaries by three. For Mr. Data, the amount reported was determined by multiplying the annual cost of his 2014 medical, dental and/or vision benefits for him and his qualified beneficiaries by 102%, and then by three.
EICP. Upon a termination for any reason other than cause under the retention and severance agreements, each Named Executive would be entitled to the amount of his or her annual incentive award earned in 2014 under the EICP based on a December 31, 2014 termination date, contingent on the participant executing a general release of claims and restrictive covenants as described above.
Financial Planning. If the Named Executive is terminated for any reason other than cause and he or she participated in the Company’s financial planning services as of December 31, 2014, the retention and severance agreements provide financial planning benefits until June 30th of the year following the year in which the
-118-
Table of Contents
termination without cause occurred, so long as the services are not earlier terminated for all similarly situated employees. All Named Executives except for Ms. Apker and Mr. Gedeon participated in the financial planning benefit during 2014. The amounts reported in this column represent two times the most recent quarterly fee paid by the Company for the applicable Named Executive to receive such benefits.
SERP. Pursuant to the retention and severance agreements, a Named Executive’s company account in the SERP becomes fully vested on, among other events, the date of the executive’s termination for any reason other than cause. Ms. Apker was 60% vested in her company account as of December 31, 2014 and Messrs. Ferland and Data were 20% and 80% vested, respectively, in their respective company accounts as of the same date. Accordingly, 40%, 80% and 20%, respectively, of the amount in their company accounts would be subject to accelerated vesting upon their termination without cause. Messrs. Carano and Gedeon were not participants in the SERP during 2014.
Restoration Plan. The retention and severance agreements provide that a Named Executive’s company matching account and company service-based account become fully vested on, among other events, the date of the Named Executive’s termination for any reason other than cause. Ms. Apker and Mr. Data were each 100% vested in their Restoration Plan accounts as of December 31, 2014. Messrs. Ferland, Carano and Gedeon were 0% vested in their company matching accounts and company service-based accounts as of December 31, 2014. Accordingly, 100% of the amounts in their company matching accounts and company service-based accounts would be subject to accelerated vesting upon their termination without cause.
Equity Awards. The retention and severance agreements generally provide that all outstanding and unvested equity awards granted to our Named Executives prior to December 31, 2014 will become fully vested upon, among other events, termination for reasons other than cause, except that no such award that is subject to Internal Revenue Code Section 409A will be paid on a date earlier than is provided in the applicable award agreement to the extent necessary to avoid the imposition of tax penalties pursuant to Code Section 409A.
The stock option amounts reported for each Named Executive do not include the value of unvested and accelerated stock options granted during 2014. We omitted the 2014 stock option awards from the table above because the exercise price of our 2014 stock option awards exceeded the closing price of our common stock as of December 31, 2014, resulting in a net loss for those options.
Estimated Value of Benefits to Be Received Upon Voluntary Termination
No payments or other benefits would be due to our Named Executives assuming their voluntary termination as of December 31, 2014 (except for accrued but unpaid compensation) unless the Named Executives voluntarily terminated their employment for “good reason” as defined under their applicable retention and severance agreements. “Good reason” means:
| • | a material diminution in the duties or responsibilities of the Named Executive from those applicable immediately before the agreement date; but, in the case of all Named Executives other than Mr. Ferland, if the Named Executive has a position with either the Company or a successor company and, in either case, the employer is publicly traded, a material diminution in position, authority, duties or responsibilities will not have occurred if the Named Executive has a position, authority, duties and responsibilities substantially the same as those attendant to the Named Executive’s position with the Company immediately prior to the agreement date (notwithstanding that the business operations of the Company or such successor may be smaller or less complex); |
| • | a material reduction in Named Executive’s annual salary as in effect immediately before the agreement date or as the same may be increased from time to time thereafter; |
| • | the failure by the Company to continue in effect any compensation plan in which the Named Executive participates immediately before the agreement date which is material to the Named Executive’s total compensation, unless a comparable arrangement (embodied in an ongoing substitute or alternative plan) has been made with respect to such plan, or the failure by the Company to continue the Named Executive’s participation therein (or in such substitute or alternative plan) on a basis not materially less favorable than existed immediately before the agreement date, unless the action by the Company applies to all similarly situated employees; |
-119-
Table of Contents
| • | the failure by the Company to continue to provide the Named Executive with material benefits in the aggregate that are substantially similar to those enjoyed by the Named Executive under any of the Company’s (or its Affiliates’) pension, savings, life insurance, medical, health and accident, or disability plans in which the Named Executive was participating immediately before the agreement date if such benefits are material to Named Executive’s total compensation, the taking of any other action by the Company which would directly or indirectly materially reduce any of such benefits or deprive the Named Executive of any fringe benefit enjoyed by him or her at the time of the agreement date if such fringe benefit is material to the Named Executive’s total compensation, unless the action by the Company applies to all similarly situated employees; or |
| • | a change in the location of the Named Executive’s principal place of employment with the Company by more than 50 miles from the location where the Named Executive was principally employed as of the agreement date without the Named Executive’s consent. |
The following table shows the estimated value of payments and other benefits due the Named Executives assuming their termination of employment for good reason under the retention and severance agreements as of December 31, 2014.
| Mr. Ferland | Ms. Apker | Mr. Gedeon | Mr. Carano | Mr. Data | ||||||||||||||||
| Severance Payments |
$ | 4,750,000 | $ | 841,000 | $ | 1,200,000 | $ | 1,312,000 | $ | 1,168,000 | ||||||||||
| Cash Retention Award |
$ | 1,900,000 | — | — | — | — | ||||||||||||||
| Benefits Payment |
$ | 51,974 | $ | 38,016 | $ | 57,374 | $ | 51,444 | $ | 52,473 | ||||||||||
| EICP |
$ | 1,090,031 | $ | 162,252 | $ | 184,425 | $ | 313,669 | $ | 214,281 | ||||||||||
| Financial Planning |
$ | 6,048 | — | — | $ | 6,048 | $ | 6,048 | ||||||||||||
| Supplemental Executive Retirement Plan (SERP) |
$ | 77,299 | $ | 29,693 | — | — | $ | 19,827 | ||||||||||||
| Restoration Plan |
$ | 11,297 | — | — | $ | 7,937 | — | |||||||||||||
| Stock Options (unvested and accelerated) |
$ | 899,061 | $ | 23,562 | — | $ | 7,427 | $ | 61,593 | |||||||||||
| Restricted Stock Units (unvested and accelerated) |
$ | 3,183,712 | $ | 103,323 | $ | 74,720 | $ | 297,273 | $ | 254,096 | ||||||||||
| Performance Shares/RSUs (unvested and unforfeited) |
$ | 6,264,010 | $ | 313,090 | $ | 147,228 | $ | 206,585 | $ | 779,225 | ||||||||||
| Tax Reimbursements |
— | — | — | — | — | |||||||||||||||
| Total |
$ | 18,333,432 | $ | 1,510,936 | $ | 1,663,747 | $ | 2,202,383 | $ | 2,555,543 | ||||||||||
Severance Payment. The severance payments reported for each Named Executive represent a lump-sum cash payment equal to two times (2.5 times for Mr. Ferland) the sum of the Named Executive’s annual base salary and target bonus amount as in effect on the date of termination, which would have been payable pursuant to his or her applicable retention or severance agreement if he or she resigns for “good reason.”
Cash Retention Award. Mr. Ferland’s retention agreement provides for a one-time cash retention award equal to two times the sum of Mr. Ferland’s salary in effect on the date of his retention agreement plus his 2014 target bonus under the EICP, 50% of which would be paid on each of the second and third anniversaries of a restructuring transaction if Mr. Ferland remains continuously employed with New B&W at each such date. If Mr. Ferland terminates his employment for good reason as of December 31, 2014, Mr. Ferland will become immediately vested in 50% of his cash retention award.
Benefits Payment. Upon termination by the Named Executive for “good reason” under the retention and severance agreements, each Named Executive would also be entitled to a lump-sum payment equal to three times the full annual cost of coverage (COBRA continuation coverage in the case of Mr. Data) for the medical, dental and/or vision benefits in effect for the applicable Named Executive and his or her qualified beneficiaries as of the date of termination. This payment is subject to the same conditions described above for severance payments under the retention and severance agreements. The amounts reported for all Named Executives other than Mr. Data were determined by multiplying the annual cost of 2014 medical, dental and/or vision benefits for the Named Executive and his or her qualified beneficiaries by three. For Mr. Data, the amount reported was determined by multiplying the annual cost of his 2014 medical, dental and/or vision benefits for him and his qualified beneficiaries by 102%, and then by three.
-120-
Table of Contents
EICP. Upon a termination by a Named Executive for good reason under the retention and severance agreements, each Named Executive would be entitled to the amount of his or her annual incentive award earned in 2014 under the EICP based on a December 31, 2014 termination date, contingent on the participant executing a general release of claims and restrictive covenants as described above.
Financial Planning. If the Named Executive terminates his or her employment for good reason under his or her retention or severance agreement and he or she participated in the Company’s financial planning services as of December 31, 2014, he or she would be entitled to financial planning benefits until June 30th of the year following the year in which the termination for good reason occurred, so long as the services are not earlier terminated for all similarly situated employees. All Named Executives except for Ms. Apker and Mr. Gedeon participated in financial planning benefit during 2014. The amounts reported in this column represent two times the most recent quarterly fee paid by the Company for the applicable Named Executive to receive such benefits.
SERP. Pursuant to the retention and severance agreements, a Named Executive’s company account in the SERP becomes fully vested on, among other events, the date of the executive’s termination for good reason. Ms. Apker was 60% vested in her company account as of December 31, 2014 and Messrs. Ferland and Data were 20% and 80% vested, respectively, in their respective company accounts as of the same date. Accordingly, 40%, 80% and 20%, respectively, of the amount in their company accounts would be subject to accelerated vesting upon their termination for good reason. Messrs. Carano and Gedeon were not participants in the SERP during 2014.
Restoration Plan. The retention and severance agreements provide that a Named Executive’s company matching account and company service-based account become fully vested on, among other events, the date the Named Executive terminates his or her employment for good reason. Ms. Apker and Mr. Data were each 100% vested in their Restoration Plan accounts as of December 31, 2014. Messrs. Ferland, Carano and Gedeon were 0% vested in their company matching accounts and company service-based accounts as of December 31, 2014. Accordingly, 100% of the amounts in their company matching accounts and company service-based accounts would be subject to accelerated vesting upon their termination of employment for good reason.
Equity Awards. The retention and severance agreements generally provide that all outstanding and unvested equity awards granted to our Named Executives prior to December 31, 2014 will become fully vested upon, among other events, their termination of employment for good reason, except that no such award that is subject to Internal Revenue Code Section 409A will be paid on a date earlier than is provided in the applicable award agreement to the extent necessary to avoid the imposition of tax penalties pursuant to Code Section 409A.
The stock option amounts reported for each Named Executive do not include the value of unvested and accelerated stock options granted during 2014. We omitted the 2014 stock option awards from the table above because the exercise price of our 2014 stock option awards exceeded the closing price of our common stock as of December 31, 2014, resulting in a net loss for those options.
-121-
Table of Contents
Estimated Value of Benefits to Be Received Upon Termination Due to Death or Disability
The following table shows the value of payments and other benefits due to the Named Executives assuming the termination of their employment by reason of death or disability as of December 31, 2014.
| Mr. Ferland | Ms. Apker | Mr. Gedeon | Mr. Carano | Mr. Data | ||||||||||||||||
| Severance Payments(1) |
$ | 950,000 | $ | 290,000 | $ | 375,000 | $ | 820,000 | $ | 365,000 | ||||||||||
| Cash Retention Award |
$ | 3,800,000 | — | — | — | — | ||||||||||||||
| COBRA Payments(1) |
$ | 13,253 | $ | 9,694 | $ | 14,630 | $ | 13,118 | $ | 13,118 | ||||||||||
| Outplacement Services(1) |
$ | 6,750 | $ | 6,750 | $ | 6,750 | $ | 6,750 | $ | 6,750 | ||||||||||
| EICP |
— | — | — | — | — | |||||||||||||||
| Financial Planning |
$ | 14,143 | — | — | $ | 14,143 | $ | 14,143 | ||||||||||||
| Supplemental Executive Retirement Plan (SERP) |
$ | 77,299 | $ | 29,693 | — | — | $ | 19,827 | ||||||||||||
| Restoration Plan |
$ | 111,297 | — | — | $ | 7,937 | — | |||||||||||||
| Stock Options (unvested and accelerated) |
$ | 899,061 | $ | 23,512 | — | $ | 7,427 | $ | 61,593 | |||||||||||
| Restricted Stock Units (unvested and accelerated) |
$ | 3,183,712 | $ | 103,323 | $ | 74,720 | $ | 297,273 | $ | 254,096 | ||||||||||
| Performance Shares/RSUs (unvested and unforfeited) |
$ | 6,264,010 | $ | 313,090 | $ | 147,228 | $ | 206,585 | $ | 779,225 | ||||||||||
| Total |
$ | 15,319,525 | $ | 776,062 | $ | 618,328 | $ | 1,373,233 | $ | 1,513,752 | ||||||||||
| (1) | These benefits would not be payable in the event of a Named Executive’s death. |
Severance Payment. The severance payments reported for each Named Executive represent lump-sum cash payments equal to 52 weeks base salary as in effect on the date of termination. This is the amount that would have been payable under The Babcock & Wilcox Executive Severance Plan dated November 5, 2012 (the “Executive Severance Plan”). Through this plan, eligible employees are entitled to receive specified severance benefits, including the severance payment reported, in the event their employment is terminated due to a termination by the Company by reason of a Named Executive being unable to perform his or her duties due to their physical or mental illness or disability. The Executive Severance Plan generally provides for benefits in the event a Named Executive is terminated by the Company for reasons other than “cause.” “Cause” is defined to exclude instances where an eligible employee is unable to perform his or her duties by reason of his or her physical or mental illness or disability.
Cash Retention Award. Mr. Ferland’s retention agreement provides for a one-time cash retention award equal to two times the sum of Mr. Ferland’s salary in effect on the date of his retention agreement plus his 2014 target bonus under the EICP, 50% of which would be paid on each of the second and third anniversaries of a restructuring transaction if Mr. Ferland remains continuously employed with New B&W at each such date. Any unvested portion of the cash retention award is payable in full upon Mr. Ferland’s death or “disability” so long as he remains continuously employed by the Company through the date of death or last date of employment due to “disability.” Under the terms of Mr. Ferland’s retention agreement, “disability” means the circumstances that would qualify for long term disability under the Company’s long term disability plan. The disability plan defines “disability” to generally mean that, due to sickness, pregnancy or accidental injury, an employee is receiving “appropriate care” and “treatment from a doctor” (each as defined in the long term disability plan) on a continuing basis, and during the employee’s “elimination period” (as defined in the disability plan) and the next 24 month period, the employee is unable to earn more than 80% of his or her predisability earnings or indexed predisability earnings at his or her occupation for any employer in his or her local economy; or after the 24 month period, the employee is unable to earn more than 60% of his or her indexed predisability earnings from any employer in his or her local economy, and which provides the employee with substantially the same earning capacity as the employee’s former earning capacity prior to the start of his or her disability.
-122-
Table of Contents
COBRA Payments. Upon a termination by the Company for any reason other than cause under our Executive Severance Plan, each Named Executive would be entitled to a lump-sum payment equal to nine months of COBRA premiums for the medical, dental and/or vision benefits in effect for the Named Executive and his or her qualified beneficiaries as of the date of termination. The amounts reported were determined by multiplying the annual cost of 2014 medical, dental and/or vision benefits for the Named Executive and his or her qualified beneficiaries by 102%, and then multiplying the product by three-fourths. Our Executive Severance Plan also provides for extended availability of COBRA coverage from 18 to 24 months.
Outplacement Services. Each Named Executive would be entitled to 12 months of employer-paid outplacement services under our Executive Severance Plan following his or her termination by the Company for reasons other than cause. The amounts reported represent the per-person cost our company would incur to engage our third-party service provider for 12 months of executive outplacement services.
Financial Planning. Under the terms of the agreement with our financial planning service provider, each Named Executive is entitled to financial planning benefits for one year following his or her long-term disability, among other events, so long as the agreement has not been earlier terminated. The amounts reported in this column represent the amount the Company paid for financial planning services for the Named Executive to receive such benefits in 2014.
SERP. Under the terms of the SERP, an executive’s company account fully vests on, among other events, the executive’s death or disability. Ms. Apker was 60% vested in her company account as of December 31, 2014 and Messrs. Ferland and Data were 20% and 80% vested, respectively, in their respective company accounts as of the same date. Accordingly, 40%, 80% and 20%, respectively, of the amount in their company accounts would be subject to accelerated vesting upon their termination due to death or disability. Messrs. Carano and Gedeon were not participants in the SERP during 2014.
Restoration Plan. Under our Restoration Plan, an executive’s company matching account and company service-based account become fully vested on, among other events, the date of the executive’s death or disability. Ms. Apker and Mr. Data were each 100% vested in their Restoration Plan accounts as of December 31, 2014. Messrs. Ferland, Carano and Gedeon were 0% vested in their company matching accounts and company service-based accounts as of December 31, 2014. Accordingly, 100% of the amounts in their company matching accounts and company service-based accounts would be subject to accelerated vesting upon their termination of employment due to death or disability.
Equity Awards. Under the terms of the awards outstanding for each Named Executive as of December 31, 2014, all unvested stock awards become vested and all unvested option awards become vested and exercisable in the event the applicable Named Executive’s employment terminates by reason of his or her death or disability. Additionally, the retention agreements with Ms. Apker and Messrs. Ferland, Carano and Gedeon generally provide that the retention equity award granted pursuant to the terms of the retention agreement becomes fully vested upon, among other events, their termination of employment due to the Named Executive’s death or disability, so long as the Named Executive remained continuously employed by the Company through the date of death or the date of separation from service due to disability.
The stock option amounts reported for each Named Executive do not include the value of unvested and accelerated stock options granted during 2014. We omitted the 2014 stock option awards from the table above because the exercise price of our 2014 stock option awards exceeded the closing price of our common stock as of December 31, 2014, resulting in a net loss for those options.
-123-
Table of Contents
Estimated Value of Benefits to Be Received Upon Change in Control
The following table shows the estimated value of payments and other benefits due the Named Executives assuming a change in control and termination as of December 31, 2014.
| Mr. Ferland | Ms. Apker | Mr. Gedeon | Mr. Carano | Mr. Data | ||||||||||||||||
| Severance Payments |
$ | 4,750,000 | $ | 841,000 | $ | 1,200,000 | $ | 1,312,000 | $ | 1,168,000 | ||||||||||
| EICP |
$ | 950,000 | $ | 130,500 | $ | 151,027 | $ | 246,000 | $ | 219,000 | ||||||||||
| Financial Planning |
$ | 14,143 | — | — | $ | 14,143 | $ | 14,143 | ||||||||||||
| Supplemental Executive Retirement Plan (SERP) |
$ | 77,299 | $ | 29,093 | — | — | $ | 19,827 | ||||||||||||
| Restoration Plan |
$ | 111,297 | — | — | $ | 7,937 | — | |||||||||||||
| Benefits |
$ | 51,974 | $ | 38,016 | $ | 57,374 | $ | 51,444 | $ | 51,444 | ||||||||||
| Stock Options (unvested and accelerated) |
$ | 899,061 | $ | 23,562 | — | $ | 7,427 | $ | 61,593 | |||||||||||
| Restricted Stock Units (unvested and accelerated) |
$ | 3,183,712 | $ | 103,323 | $ | 74,720 | $ | 297,273 | $ | 254,096 | ||||||||||
| Performance Shares (unvested and accelerated) |
$ | 6,264,010 | $ | 313,090 | $ | 147,228 | $ | 206,585 | $ | 779,225 | ||||||||||
| Tax Reimbursements |
— | — | — | — | — | |||||||||||||||
| Total |
$ | 16,301,496 | $ | 1,478,584 | $ | 1,630,349 | $ | 2,142,809 | $ | 2,567,328 | ||||||||||
The Company has change in control agreements with various officers, including each of our Named Executives. With the exception of Mr. Ferland, the retention and severance agreements generally provide that in the event of a change in control (which generally means the same as it does under the Company’s change-in-control agreements), the Named Executive’s change-in-control agreement with the Company will control. This is also generally true for Mr. Ferland, except that his retention agreement modified his change-in-control agreement to reduce the multiplier of his severance payment based on salary from 2.99 to 2.5 prior to the effective date of a restructuring transaction, which had not occurred as of December 31, 2014.
Generally, under the Company’s change-in-control agreements, if a Named Executive is terminated within one year following a change in control either (1) by the company for any reason other than cause or death or disability; or (2) by the Named Executive for good reason, the Named Executive is entitled to receive:
| • | accelerated vesting in the executive’s SERP account; |
| • | accelerated vesting in any outstanding equity awards; |
| • | a cash severance payment; |
| • | a prorated target EICP payment; |
| • | payment of the prior year’s EICP payment, if unpaid at termination; and |
| • | a cash payment for health benefits coverage. |
In addition to these payments, the Named Executive would be entitled to various accrued benefits earned through the date of termination, such as earned but unpaid salary and earned but unused vacation and reimbursements.
Under the Company’s change in control agreements, a “change in control” will be deemed to have occurred on the occurrence of any of the following:
| • | Any person, other than an ERISA-regulated pension plan established by the Company or its affiliates makes an acquisition of outstanding voting stock and is, immediately thereafter, the beneficial owner of 30% or more of the then outstanding voting stock, unless such acquisition is made directly from |
-124-
Table of Contents
| the Company in a transaction approved by a majority of the incumbent directors; or any group is formed that is the beneficial owner of 30% or more of the outstanding voting stock (other than a group formation for the purpose of making an acquisition directly from the Company and approved (prior to such group formation) by a majority of the incumbent directors); |
| • | individuals who are incumbent directors cease for any reason to constitute a majority of the members of the board of directors; |
| • | consummation of a business combination unless, immediately following such business combination, (i) all or substantially all of the individuals and entities that were the beneficial owners of the outstanding voting stock immediately before such business combination beneficially own, directly or indirectly, more than 51% of the then outstanding shares of voting stock of the parent corporation resulting from such business combination in substantially the same relative proportions as their ownership, immediately before such business combination, of the outstanding voting stock, (ii) if the business combination involves the issuance or payment by the Company of consideration to another entity or its stockholders, the total fair market value of such consideration plus the principal amount of the consolidated long-term debt of the entity or business being acquired (in each case, determined as of the date of consummation of such business combination by a majority of the incumbent directors) does not exceed 50% of the sum of the fair market value of the outstanding voting stock plus the principal amount of the Company’s consolidated long-term debt (in each case, determined immediately before such consummation by a majority of the incumbent directors), (iii) no person (other than any corporation resulting from such business combination) beneficially owns, directly or indirectly, 30% or more of the then outstanding shares of voting stock of the parent corporation resulting from such business combination and (iv) a majority of the members of the board of directors of the parent corporation resulting from such business combination were incumbent directors of the Company immediately before consummation of such business combination; or |
| • | consummation of a major asset disposition unless, immediately following such major asset disposition, (i) individuals and entities that were beneficial owners of the outstanding voting stock immediately before such major asset disposition beneficially own, directly or indirectly, more than 70% of the then outstanding shares of voting stock (if it continues to exist) and of the entity that acquires the largest portion of such assets (or the entity, if any, that owns a majority of the outstanding voting stock of such acquiring entity) and (ii) a majority of the members of the board of directors (if it continues to exist) and of the entity that acquires the largest portion of such assets (or the entity, if any, that owns a majority of the outstanding voting stock of such acquiring entity) were incumbent directors of the Company immediately before consummation of such major asset disposition. |
Severance Payment. The severance payment made to each Named Executive, with the exception of Mr. Ferland, in connection with a change in control is a cash payment equal to two times the sum of (1) the executive’s annual base salary prior to termination and (2) the same annual base salary multiplied by the executive’s target annual incentive compensation percentage for the year in which the termination occurs. As modified by his retention agreement, the severance payment made to Mr. Ferland in connection with a change in control is a cash payment equal to two and a half times the sum of (1) his annual base salary prior to termination and (2) the same annual base salary multiplied by his target EICP percentage for the year in which the termination occurs. Assuming a termination as of December 31, 2014, the severance payment under a change in control would have been calculated based on the following:
| • | Mr. Ferland: $950,000 base salary and $950,000 target annual incentive compensation (100% of his annual base salary); |
| • | Ms. Apker: $290,000 base salary and $130,500 target annual incentive compensation (45% of her annual base salary); |
| • | Mr. Gedeon: $375,000 base salary and $225,000 target annual incentive compensation (60% of his annual base salary); and |
| • | Mr. Carano: $410,000 base salary and $246,000 target annual incentive compensation (60% of his annual base salary); and |
-125-
Table of Contents
| • | Mr. Data: $365,000 base salary and $219,000 target annual incentive compensation (60% of his annual base salary); and |
EICP Payment. Depending on the timing of the termination relative to the payment of an EICP award, the applicable executive could receive up to two EICP payments in connection with termination resulting from a change in control, as follows:
| • | If an EICP award for the year prior to termination is paid to other EICP participants after the date of the executive’s termination, the executive would be entitled to receive the actual amount of the award determined under the EICP for such prior year (without the exercise of any downward discretion). The 2013 EICP awards were paid before December 31, 2014. As a result, no payment would have been due to our Named Executives in this respect. |
| • | The executive would be entitled to a prorated target EICP payment equal to the product of the Named Executive’s annual base salary and EICP target percentage, with the product prorated based on the number of days the Named Executive was employed during the year in which the termination occurs. Based on a December 31, 2014 termination, each Named Executive other than Mr. Gedeon would have been entitled to an EICP payment equal to 100% of his or her 2014 target EICP, as in effect immediately prior to the date of termination. Based on a December 31, 2014 termination, Mr. Gedeon would have been entitled to an EICP payment equal to 67% of his 2014 target EICP. |
Financial Planning. Under the terms of the agreement with the Company’s financial planning service provider, each Named Executive is entitled to financial planning benefits for one year following a change in control, so long as the agreement has not been earlier terminated. The amounts reported in this column represent the fee that would be required to be paid for each such Named Executive to receive such benefits. “Change of control” is not defined under the agreement.
SERP. Under the terms of the Company’s SERP, an executive’s company account becomes fully vested on, among other events, the date a change in control occurs. Ms. Apker was 60% vested in her company account as of December 31, 2014 and Messrs. Ferland and Data were 20% and 80% vested, respectively, in their respective company accounts as of the same date. Accordingly, 40%, 80% and 20%, respectively, of the amount in their company accounts would be subject to accelerated vesting upon their termination for good reason. Messrs. Carano and Gedeon were not participants in the SERP during 2014. Under the SERP, a “change in control” occurs under the same circumstances described above with respect to the change-in-control agreements.
Restoration Plan. Under the Company’s Restoration Plan, an executive’s company matching account and company service-based account become fully vested on, among other events, the date a change in control occurs Ms. Apker and Mr. Data were each 100% vested in their Restoration Plan accounts as of December 31, 2014. Messrs. Ferland, Carano and Gedeon were 0% vested in their company matching accounts and company service-based accounts as of December 31, 2014. Accordingly, 100% of the amounts in their company matching accounts and company service-based accounts would be subject to accelerated vesting upon their termination of employment following a change of control. “Change in control” has a substantially similar meaning under the Company’s Restoration Plan as it does under the Company’s change in control agreements, except that a participant in the Company’s Restoration Plan is excluded from accelerated vesting if the participant is part of a purchasing group that consummates a transaction that qualifies as a change of control under the Restoration Plan.
Benefits. The amounts reported represent three times the full annual cost of coverage for medical, dental and vision benefits provided to the Named Executive and their covered dependents for the year ended December 31, 2014.
Tax Reimbursements. The agreements do not provide any tax reimbursement on the benefits. Instead, the agreements contain a “modified cutback” provision, which acts to reduce the benefits payable to a Named Executive to the extent necessary so that no excise tax would be imposed on the benefits paid, but only if doing so would result in the Named Executive retaining a larger after-tax amount.
Equity Awards. Under the terms of the awards outstanding, all unvested stock and option awards would become vested on a change in control, regardless of whether there is a subsequent termination of employment. Under the Company’s 2010 LTIP, a “change in control” occurs under the same circumstances described above
-126-
Table of Contents
with respect to the Company’s change-in-control agreements. See “Equity Awards” under the “Estimated Value of Benefits to Be Received Upon Termination Due to Death or Disability” table above for more information regarding the amounts reported for stock option awards, which information is also applicable to the “Estimated Value of Benefits to Be Received Upon Change in Control” table above.
The stock option amounts reported for each Named Executive do not include the value of unvested and accelerated stock options granted during 2014. We omitted the 2014 stock option awards from the table above because the exercise price of our 2014 stock option awards exceeded the closing price of our common stock as of December 31, 2014, resulting in a net loss for those options.
-127-
Table of Contents
SECURITY OWNERSHIP OF CERTAIN BENEFICIAL OWNERS AND MANAGEMENT
Before the spin-off, all of the outstanding shares of our common stock are and will be owned beneficially and of record by the Company. The following table sets forth information with respect to the expected beneficial ownership of our common stock immediately following completion of the spin-off by:
| • | each stockholder who is expected following the spin-off to beneficially own more than 5% of our common stock; |
| • | each executive officer named in the Summary Compensation Table; |
| • | each of our directors; and |
| • | all of our executive officers and directors as a group. |
We have based the percentage of class amounts set forth below on each indicated person’s beneficial ownership of Company common stock as of June 18, 2015, unless we indicate some other basis for the share amounts, and based on the distribution of one share of our common stock for every two shares of Company common stock outstanding. To the extent our directors and executive officers own unrestricted shares of Company common stock at the time of the spin-off, they will participate in the distribution of shares of common stock in the spin-off on the same terms as other holders of Company common stock. For purposes of this table, we have adjusted the number of options to purchase shares of New B&W common stock solely based on the distribution ratio and without making further adjustments based on the stock prices of the Company and New B&W following the spin-off. For additional information regarding the treatment of equity-based awards, see “The Spin-Off—Treatment of Stock-Based Awards.” Following the spin-off, we will have an aggregate of approximately 53.7 million shares of common stock outstanding, based on approximately 107.4 million shares of Company common stock outstanding on June 18, 2015. The number of shares beneficially owned by each stockholder, director or officer is determined according to the rules of the SEC and the information is not necessarily indicative of beneficial ownership for any other purpose. The mailing address for each of the directors and executive officers is The Harris Building, 13024 Ballantyne Corporate Place, Suite 700, Charlotte, NC 28277.
| Common Stock | ||||||||
| Number of Shares Beneficially Owned |
Percent of Class(1) |
|||||||
| Name of Beneficial Owner | ||||||||
| 5% Stockholders: | ||||||||
| Blue Harbour Group, LP(2) |
5,270,751 | 9.8 | % | |||||
| T. Rowe Price(3) |
3,386,868 | 6.3 | % | |||||
| The Vanguard Group(2) |
3,116,806 | 5.8 | % | |||||
| Janus Capital Management(5) |
2,849,259 | 5.3 | % | |||||
| FMR LLC(6) |
2,678,159 | 5.0 | % | |||||
| Executive Officers, Directors and Director Nominees: | ||||||||
| E. James Ferland(7) |
229,211 | * | ||||||
| Thomas A. Christopher |
1,960 | * | ||||||
| Cynthia S. Dubin |
— | * | ||||||
| Brian K. Ferraioli |
1,795 | * | ||||||
| Stephen G. Hanks. |
12,439 | * | ||||||
| Anne R. Pramaggiore |
7,041 | * | ||||||
| Larry L. Weyers |
10,834 | * | ||||||
| Jenny L. Apker(8) |
25,376 | * | ||||||
| Elias Gedeon(9) |
12,832 | * | ||||||
| Mark A. Carano(10) |
23,941 | * | ||||||
| J. Randall Data(11) |
38,805 | * | ||||||
| All Directors, Director Nominees and Officers as a group (18 persons)(12) |
415,496 | * | ||||||
| * | Represents less than 1.0 percent |
-128-
Table of Contents
| (1) | Based on the distribution of one share of our common stock for every two shares of Company common stock outstanding and the number of shares of Company common stock outstanding on May 30, 2015. |
| (2) | As reported on Schedule 13D/A of the Company filed with the SEC on February 2, 2015 in relation to its ownership of the Company’s shares. Blue Harbour Group, LP will beneficially own 5,270,751 shares of our common stock and will have shared voting and shared dispositive power with respect to 5,270,751 shares. Blue Harbour Holdings, LLC and Clifton S. Robbins will have beneficial ownership of 5,270,751 shares and will each have shared voting and dispositive power with respect to 5,270,751 shares. The reporting person’s address is 646 Steamboat Road, Greenwich, Connecticut 06830. |
| (3) | As reported on Schedule 13G/A of the Company filed with the SEC on April 10, 2015 in relation to its ownership of the Company’s shares. T. Rowe Price Associates, Inc. (“Price Associates”) will beneficially own 3,386,868 shares of our common stock and will have sole voting power with respect to 916,621 shares and sole dispositive power with respect to 3,386,868 shares. These securities will be owned by various individual and institutional investors, including T. Rowe Price Mid-Cap Growth Fund, Inc., for which Price Associates serves as an investment adviser. Price Associates expressly disclaims that it beneficially owns such securities. T. Rowe Price Mid-Cap Growth Fund will have sole voting power with respect to 2,000,000 shares. The reporting person’s address is 100 E. Pratt Street, Baltimore, Maryland 21202. |
| (4) | As reported on Schedule 13G/A of the Company filed with the SEC on February 10, 2015 in relation to its ownership of the Company’s shares. The Vanguard Group will beneficially own 3,116,806 shares of our common stock and will have sole voting power with respect to 35,733 shares, shared voting power with respect to no shares, sole dispositive power with respect to 3,085,483 shares and shared dispositive power with respect to 31,323 shares. Vanguard Fiduciary Trust Company will be the beneficial owner of 31,323 shares and Vanguard Investments Australia, Ltd. will be beneficial owner of 4,400 shares. The Schedule 13G/A reports that both beneficial owners are wholly owned subsidiaries of The Vanguard Group, Inc. The reporting person’s address is 100 Vanguard Blvd., Malvern, PA 19355. |
| (5) | As reported on a Schedule 13G/A of the Company filed with the SEC on February 18, 2015 in relation to its ownership of the Company’s shares. Janus Capital will beneficially own 2,849,259 shares of our common stock and will have shared voting and dispositive power with respect to 2,849,259 shares of our common stock. The reporting person’s address is 151 Detroit Street, Denver, Colorado 80206. |
| (6) | As reported on Schedule 13G of the Company filed with the SEC on February 13, 2015 in relation to its ownership of the Company’s shares. FMR LLC will beneficially own 2,678,159 shares of our common stock and will have sole voting power with respect to 956,606 shares, shared voting power with respect to no shares and sole dispositive power with respect to 2,678,159 shares. The reporting person’s address is 245 Summer Street, Boston, Massachusetts 02210. |
| (7) | Shares owned by Mr. Ferland include 151,258 shares of common stock that he may acquire on the exercise of stock options, 47,577 shares for which he has sole voting power but no dispositive power and 506 shares of common stock held in our Thrift Plan. |
| (8) | Shares owned by Ms. Apker include 11,291 shares of common stock that she may acquire on the exercise of stock options, 9,867 shares for which she has sole voting power but no dispositive power and 513 shares of common stock held in our Thrift Plan. |
| (9) | Shares owned by Mr. Gedeon include 2,215 shares of common stock that he may acquire on the exercise of stock options, 10,162 shares for which he has sole voting power but no dispositive power and 180 shares of common stock held in our Thrift Plan. |
| (10) | Shares owned by Mr. Carano include 6,821 shares of common stock that he may acquire on the exercise of stock options, 11,112 shares for which he has sole voting power but no dispositive power and 249 shares of common stock held in our Thrift Plan. |
| (11) | Shares owned by Mr. Data include 24,045 shares of common stock that he may acquire on the exercise of stock options and 860 shares of common stock held in our Thrift Plan. |
| (12) | Shares owned by all directors and officers as a group include 221,026 shares of common stock that may be acquired on the exercise of stock options, 94,005 shares for which the group has sole voting power but no dispositive power and 4,320 shares of common stock held in our Thrift Plan. |
-129-
Table of Contents
Introduction
In the discussion that follows, we have summarized selected provisions of our certificate of incorporation and bylaws relating to our capital stock. This summary is not complete. This discussion is qualified in its entirety by reference to our certificate of incorporation and bylaws. You should read the provisions of our certificate of incorporation and bylaws as currently in effect for provisions that may be important to you. We will file copies of those documents with the SEC, and they will be incorporated by reference as exhibits to the registration statement of which this prospectus forms a part. See “Where You Can Find More Information.”
Authorized Capital Stock
Our authorized capital stock consists of:
| • | 200,000,000 shares of common stock; and |
| • | 20,000,000 shares of preferred stock, issuable in series. |
Each authorized share of common stock has a par value of $0.01. The authorized shares of preferred stock have a par value of $0.01 per share. Immediately following the spin-off, we expect that approximately 53.7 million shares of our common stock will be outstanding, based on the distribution of one share of our common stock for every two shares of Company common stock outstanding and the number of shares of Company common stock outstanding as of the record date. The actual number of shares of our common stock to be distributed in the spin-off will be determined based on the actual number of shares of Company common stock outstanding as of the record date. Immediately following the spin-off, no shares of our preferred stock will be issued and outstanding.
Common Stock
Each share of our common stock entitles its holder to one vote in the election of each director and on all other matters voted on generally by our stockholders, other than any matter that (1) solely relates to the terms of any outstanding series of preferred stock or the number of shares of that series and (2) does not affect the number of authorized shares of preferred stock or the powers, privileges and rights pertaining to the common stock. No share of our common stock affords any cumulative voting rights. This means that the holders of a majority of the voting power of the shares voting for the election of directors can elect all directors to be elected if they choose to do so. Our board of directors may grant holders of preferred stock, in the resolutions creating the series of preferred stock, the right to vote on the election of directors or any questions affecting New B&W.
Holders of our common stock will be entitled to dividends in such amounts and at such times as our board of directors in its discretion may declare out of funds legally available for the payment of dividends. We currently intend to retain our entire available discretionary cash flow to finance the growth, development and expansion of our business and do not anticipate paying any cash dividends on the common stock in the foreseeable future. Any future dividends will be paid at the discretion of our board of directors after taking into account various factors, including:
| • | general business conditions; |
| • | industry practice; |
| • | our financial condition and performance; |
| • | our future prospects; |
| • | our cash needs and capital investment plans; |
| • | our obligations to holders of any preferred stock we may issue; |
-130-
Table of Contents
| • | income tax consequences; and |
| • | the restrictions Delaware and other applicable laws and our contractual arrangements then impose. |
If we liquidate or dissolve our business, the holders of our common stock will share ratably in all our assets that are available for distribution to our stockholders after our creditors are paid in full and the holders of all series of our outstanding preferred stock, if any, receive their liquidation preferences in full.
Our common stock has no preemptive rights and is not convertible or redeemable or entitled to the benefits of any sinking or repurchase fund. All shares of common stock to be distributed in connection with the spin-off will be fully paid and nonassessable.
We intend to list our common stock on the New York Stock Exchange under the symbol “BW.”
The transfer agent and registrar for our common stock is Computershare Trust Company, N.A.
Preferred Stock
At the direction of our board of directors, without any action by the holders of our common stock, we may issue one or more series of preferred stock from time to time. Our board of directors can determine the number of shares of each series of preferred stock, the designation, powers, preferences and relative, participating, optional or other special rights, and the qualifications, limitations or restrictions applicable to any of those rights, including dividend rights, voting rights, conversion or exchange rights, terms of redemption and liquidation preferences, of each series.
Undesignated preferred stock may enable our board of directors to render more difficult or to discourage an attempt to obtain control of New B&W by means of a tender offer, proxy contest, merger or otherwise, and thereby to protect the continuity of our management. The issuance of shares of preferred stock may adversely affect the rights of our common stockholders. For example, any preferred stock issued may rank senior to the common stock as to dividend rights, liquidation preference or both, may have full or limited voting rights and may be convertible into shares of common stock. As a result, the issuance of shares of preferred stock, or the issuance of rights to purchase shares of preferred stock, may discourage an unsolicited acquisition proposal or bids for our common stock or may otherwise adversely affect the market price of our common stock or any existing preferred stock.
Limitation on Directors’ Liability
Delaware law authorizes Delaware corporations to limit or eliminate the personal liability of their directors to them and their stockholders for monetary damages for breach of a director’s fiduciary duty of care. The duty of care requires that, when acting on behalf of the corporation, directors must exercise an informed business judgment based on all material information reasonably available to them. Absent the limitations Delaware law authorizes, directors of Delaware corporations are accountable to those corporations and their stockholders for monetary damages for conduct constituting gross negligence in the exercise of their duty of care. Delaware law enables Delaware corporations to limit available relief to equitable remedies such as injunction or rescission. Our certificate of incorporation limits the liability of our directors to us and our stockholders to the fullest extent Delaware law permits. Specifically, no director will be personally liable for monetary damages for any breach of the director’s fiduciary duty as a director, except for liability:
| • | for any breach of the director’s duty of loyalty to us or our stockholders; |
| • | for acts or omissions not in good faith or which involve intentional misconduct or a knowing violation of law; |
| • | for unlawful payments of dividends or unlawful stock repurchases or redemptions as provided in Section 174 of the General Corporation Law of the State of Delaware; and |
| • | for any transaction from which the director derived an improper personal benefit. |
This provision could have the effect of reducing the likelihood of derivative litigation against our directors and may discourage or deter our stockholders or management from bringing a lawsuit against our directors for
-131-
Table of Contents
breach of their duty of care, even though such an action, if successful, might otherwise have benefited us and our stockholders. Our bylaws provide indemnification to our officers and directors and other specified persons with respect to their conduct in various capacities. See “Indemnification of Directors and Officers.”
Statutory Business Combination Provision
As a Delaware corporation, we are subject to Section 203 of the General Corporation Law of the State of Delaware. In general, Section 203 prevents an “interested stockholder,” which is defined generally as a person owning 15% or more of a Delaware corporation’s outstanding voting stock or any affiliate or associate of that person, from engaging in a broad range of “business combinations” with the corporation for three years following the date that person became an interested stockholder unless:
| • | before that person became an interested stockholder, the board of directors of the corporation approved the transaction in which that person became an interested stockholder or approved the business combination; |
| • | on completion of the transaction that resulted in that person’s becoming an interested stockholder, that person owned at least 85% of the voting stock of the corporation outstanding at the time the transaction commenced, other than stock held by (1) directors who are also officers of the corporation or (2) any employee stock plan that does not provide employees with the right to determine confidentially whether shares held subject to the plan will be tendered in a tender or exchange offer; or |
| • | following the transaction in which that person became an interested stockholder, both the board of directors of the corporation and the holders of at least two-thirds of the outstanding voting stock of the corporation not owned by that person approve the business combination. |
Under Section 203, the restrictions described above also do not apply to specific business combinations proposed by an interested stockholder following the announcement or notification of designated extraordinary transactions involving the corporation and a person who had not been an interested stockholder during the previous three years or who became an interested stockholder with the approval of a majority of the corporation’s directors, if a majority of the directors who were directors prior to any person’s becoming an interested stockholder during the previous three years, or were recommended for election or elected to succeed those directors by a majority of those directors, approve or do not oppose that extraordinary transaction.
Anti-Takeover Effects of Provisions of our Certificate of Incorporation and Bylaws
Some of the provisions of our certificate of incorporation and bylaws discussed below may have the effect, either alone or in combination with Section 203 of the General Corporation Law of the State of Delaware, of making more difficult or discouraging a tender offer, proxy contest, merger or other takeover attempt that our board of directors opposes but that a stockholder might consider to be in its best interest.
Our certificate of incorporation will provide that our stockholders may act only at an annual or special meeting of stockholders and may not act by written consent. Our bylaws provide that only a majority of our board of directors or the chairman of our board of directors may call a special meeting of our board of directors or our stockholders.
Our certificate of incorporation will provide for a classified board of directors. Our board of directors will be divided into three classes, with the directors of each class as nearly equal in number as possible. At each annual meeting of our stockholders, the term of a different class of our directors will expire. As a result, our stockholders will elect approximately one-third of our board of directors each year. This system of electing and removing directors may discourage a third party from making a tender offer or otherwise attempting to obtain control of us, because it generally makes it more difficult for stockholders to replace a majority of the directors.
Our certificate of incorporation will provide that the number of directors will be fixed exclusively by, and may be increased or decreased exclusively by, our board of directors from time to time, but will not be less than three. Our certificate of incorporation will provide that directors may be removed only with cause or upon a board determination (as such terms are defined in our certificate of incorporation) and, in either case, by a vote of at least 80% of the voting power of our outstanding voting stock. A vacancy on our board of directors may be filled by a
-132-
Table of Contents
vote of a majority of the directors in office, and a director appointed to fill a vacancy serves for the remainder of the term of the class of directors in which the vacancy occurred. These provisions will prevent our stockholders from removing incumbent directors without cause and filling the resulting vacancies with their own nominees.
Our bylaws contain advance notice and other procedural requirements that apply to stockholder nominations of persons for election to our board of directors at any annual or special meeting of stockholders and to stockholder proposals that stockholders take any other action at any annual meeting. In the case of any annual meeting, a stockholder proposing to nominate a person for election to our board of directors or proposing that any other action be taken will have to give our Corporate Secretary written notice of the proposal not less than 90 days and not more than 120 days before the anniversary of the date of the immediately preceding annual meeting of stockholders. These stockholder proposal deadlines will be subject to exceptions if the pending annual meeting date is more than 30 days prior to or more than 30 days after the anniversary of the immediately preceding annual meeting. If the chairman of our board of directors or a majority of our board of directors calls a special meeting of stockholders for the election of directors, a stockholder proposing to nominate a person for that election will have to give our Corporate Secretary written notice of the proposal not earlier than 120 days prior to that special meeting and not later than the last to occur of (1) 90 days prior to that special meeting or (2) the 10th day following the day we publicly disclose the date of the special meeting. Our bylaws prescribe specific information that any such stockholder notice must contain. These advance notice provisions may have the effect of precluding a contest for the election of our directors or the consideration of stockholder proposals if the proper procedures are not followed, and of discouraging or deterring a third party from conducting a solicitation of proxies to elect its own slate of directors or to approve its own proposal, without regard to whether consideration of those nominees or proposals might be harmful or beneficial to us and our stockholders.
Our certificate of incorporation will provide that our stockholders may adopt, amend and repeal our bylaws at any regular or special meeting of stockholders by a vote of at least 80% of the voting power of our outstanding voting stock, provided the notice of intention to adopt, amend or repeal the bylaws has been included in the notice of that meeting. Our certificate of incorporation will also confer on our board of directors the power to adopt, amend or repeal our bylaws with the affirmative vote of a majority of the directors then in office.
As discussed above under “—Preferred Stock,” our certificate of incorporation will authorize our board of directors, without the approval of our stockholders, to provide for the issuance of all or any shares of our preferred stock in one or more series and to determine the designation, powers, preferences and relative, participating, optional or other special rights, and the qualifications, limitations or restrictions applicable to any of those rights, including dividend rights, voting rights, conversion or exchange rights, terms of redemption and liquidation preferences, of each series. The issuance of shares of our preferred stock or rights to purchase shares of our preferred stock could discourage an unsolicited acquisition proposal. In addition, under some circumstances, the issuance of preferred stock could adversely affect the voting power of our common stockholders.
In addition to the purposes described above, these provisions of our certificate of incorporation and bylaws could also be intended to increase the bargaining leverage of our board of directors, on behalf of our stockholders, in any future negotiations concerning a potential change of control of New B&W. Our board of directors has observed that certain tactics that bidders employ in making unsolicited bids for control of a corporation, including hostile tender offers and proxy contests, have become relatively common in modern takeover practice. Our board of directors considers those tactics to be disruptive and potentially contrary to the overall best interests of its stockholders. In particular, bidders may use these tactics in conjunction with an attempt to acquire a corporation at an unfairly low price. In some cases, a bidder will make an offer for less than all the outstanding capital stock of the target company, potentially leaving stockholders with the alternatives of partially liquidating their investment at a time that may be disadvantageous to them or retaining an investment in the target company under substantially different management with objectives that may not be the same as the new controlling stockholder. The concentration of control in New B&W that could result from such an offer could deprive our remaining stockholders of the benefits of listing on the New York Stock Exchange and public reporting under the Exchange Act.
While our board of directors does not intend to foreclose or discourage reasonable merger or acquisition proposals, it believes that value for our stockholders can be enhanced by encouraging would-be acquirers to forego hostile or coercive tender offers and negotiate terms that are fair to all stockholders with our board of directors. Our board of directors believes that the provisions described above will (1) discourage disruptive tactics
-133-
Table of Contents
and takeover attempts at unfair prices or on terms that do not provide all stockholders with the opportunity to sell their stock at a fair price and (2) encourage third parties who may seek to acquire control of New B&W to initiate such an acquisition through negotiations directly with our board of directors. Our board of directors also believes these provisions will help give it the time necessary to evaluate unsolicited offers, as well as appropriate alternatives, in a manner that assures fair treatment of our stockholders. Our board of directors recognizes that a takeover might in some circumstances be beneficial to some or all of our stockholders, but, nevertheless, believes that the benefits of seeking to protect its ability to negotiate with the proponent of an unfriendly or unsolicited proposal to take over or restructure New B&W outweigh the disadvantages of discouraging those proposals.
Sale of Unregistered Securities
On January 13, 2015, we issued 1,000 shares of our common stock to the Company in connection with our formation pursuant to Section 4(a)(2) of the Securities Act. We did not register the issuance of these shares under the Securities Act because such issuance did not constitute a public offering.
-134-
Table of Contents
In connection with the spin-off, current holders of Company equity awards under the Company’s equity compensation programs will receive “Adjusted Awards,” meaning they will have those awards adjusted into an award based on the Company’s common stock or an award based on our common stock, as applicable, as described below under “—Description of Award Adjustments.” The awards that are based on our common stock will be granted by us under the 2015 Plan, in accordance with the terms of the employee matters agreement that we will enter into with the Company in connection with the spin-off, and will be made in substitution of, or in connection with stock options, restricted shares, restricted stock units, deferred stock units and performance shares that were granted under a Company equity compensation program. The registration statement of which this prospectus forms a part covers awards that will be granted to individuals who, at the time of the spin-off, are no longer employed by New B&W and current directors and employees of the Company and their donees, pledgees, permitted transferees, assignees, successors and others who come to hold any such Adjusted Awards. The prospectus does not cover any Adjusted Awards that will be granted to any individual who, upon completion of the spin-off, will be employed by or serve on the board of directors of either the Company or New B&W, or any other awards that we may grant under the 2015 Plan in the future.
DESCRIPTION OF AWARD ADJUSTMENTS
The employee matters agreement will provide, among other things, the mechanics for the conversion and adjustment on the distribution date of equity awards granted under the Company’s equity compensation programs into adjusted Company awards and Adjusted Awards, as follows:
| • | Each outstanding option to purchase shares of Company common stock that is granted during 2015 prior to the distribution date to an officer or employee of the Company who will remain an officer or employee of the Company and will not become an officer or employee of New B&W in connection with the spin-off will be replaced with an adjusted option to purchase Company common stock. Each of those adjusted options will reflect adjustments that will be generally intended to preserve the intrinsic value of the original option and the ratio of the exercise price to the fair market value of the stock subject to the option by adjusting the number of shares purchasable and the exercise price, by reference to the volume-weighted-average trading price of the Company common stock trading “regular way” on the distribution date and the simple average of the volume-weighted-average trading price of the Company common stock on each of the first three trading days following the distribution date. The replacement options will generally be made subject to the same terms and conditions as the options being replaced. To the extent the options being replaced are vested, the replacement options will also be vested. |
| • | Each outstanding option to purchase shares of Company common stock that is granted during 2015 prior to the distribution date to a person who is or will become an officer or employee of New B&W in connection with the spin-off will be replaced with substitute options to purchase shares of New B&W common stock. Each of those substitute options will have terms that will be generally intended to preserve the intrinsic value of the original option and the ratio of the exercise price to the fair market value of the stock subject to the option by adjusting the number of shares purchasable and the exercise price, by reference to the volume-weighted-average trading price of the Company common stock trading “regular way” on the distribution date and the simple average of the volume-weighted-average trading price of the New B&W common stock on each of the first three trading days following the distribution date. The substitute options will generally be made subject to the same terms and conditions as the options being replaced. To the extent the options being replaced are vested, the substitute options will also be vested. |
| • | Each outstanding option to purchase shares of Company common stock that was granted prior to 2015 will be replaced with both an adjusted Company stock option and a substitute New B&W stock option. Both options, when combined, will have terms that will be generally intended to preserve the intrinsic value of the original option and the ratio of the exercise price to the fair market value of the stock subject to the option, by reference to the ratio of one share of New B&W common stock being distributed for every two shares of Company common stock in the spin-off, the volume-weighted-average trading price of the Company common stock trading “regular way” on the distribution date |
-135-
Table of Contents
| and the simple average of the volume-weighted-average trading price of the Company common stock and New B&W common stock on each of the first three trading days following the distribution date. Both the replacement and the substitute options will generally be made subject to the same terms and conditions as the original options. |
| • | Company restricted stock unit awards granted during 2015 prior to the distribution date to officers or employees of the Company who will remain officers or employees of the Company and will not become officers or employees of New B&W in connection with the spin-off will be replaced with adjusted Company awards, each of which will generally preserve the value of the original award. The adjusted awards will generally be made subject to the same terms and conditions as the awards being replaced. |
| • | Company restricted stock unit awards granted during 2015 prior to the distribution date to persons who are or will become officers or employees of New B&W in connection with the spin-off will be converted into substitute New B&W awards, each of which will generally preserve the value of the original award. The adjusted awards will generally be made subject to the same terms and conditions as the awards being replaced. |
| • | Outstanding Company restricted stock unit awards granted prior to 2015, any restricted stock unit awards granted to the Company’s directors prior to the distribution date that have been deferred by such directors, if any, and any Company restricted stock awards granted pursuant to retention agreements entered into with certain employees of the Company in contemplation of the spin-off, will be replaced with both (1) adjusted Company awards and (2) substitute New B&W awards, which will be determined by reference to the ratio of one share of New B&W common stock being distributed for every two shares of Company common stock in the spin-off and which, when combined, will generally preserve the value of the original award. The adjusted awards will generally be made subject to the same terms and conditions as the awards being replaced. |
| • | Outstanding Company performance share awards granted prior to 2015 will generally be converted into unvested rights to receive the value of deemed target performance in unrestricted shares of a combination of Company common stock and New B&W common stock, determined by reference to the ratio of one share of New B&W common stock being distributed for every two shares of Company common stock in the spin-off, in each case with the same vesting terms as the original awards. |
Any former employees of the Company or New B&W who hold outstanding stock options, restricted stock units, deferred stock units or performance shares that are unvested will have their stock options, restricted stock units, deferred stock units or performance shares similarly adjusted or replaced as a result of the spin-off.
In the case of adjusting Company options or granting substitute New B&W options, the conversion formula may result in fractional shares or fractional cents. Any fractional shares subject to adjusted Company options and substitute New B&W options will be disregarded, and the number of shares subject to such options will be rounded down to the next lower whole number of shares. The exercise price for such options will be rounded up to the next higher whole cent.
The mechanics for conversion and adjustment of the equity awards summarized above are more fully described in Article III of the employee matters agreement. The foregoing descriptions of the equity award adjustments are qualified in their entirety by the complete terms and conditions of the employee matters agreement incorporated by reference into the registration statement of which this prospectus is a part.
-136-
Table of Contents
We have adopted the 2015 Plan. The 2015 Plan will generally be administered by the Compensation Committee of our board of directors and will enable the Compensation Committee to provide equity and incentive compensation to our officers, other key employees and our non-employee directors. Pursuant to the 2015 Plan, we may grant stock options (including “incentive stock options” as defined in Section 422 of the Code), stock appreciation rights, restricted shares, restricted stock units, performance shares, performance units, cash incentive awards, and certain other awards based on or related to our common stock, subject to certain share and dollar limitations as described in the 2015 Plan. The 2015 Plan will permit us to grant both awards that are intended to qualify as “qualified performance-based compensation” under Section 162(m) of the Code and awards that are not intended to so qualify.
The 2015 Plan will permit the evidence of award with respect to any grant under the 2015 Plan to provide for accelerated vesting or exercise, including in the event of the grantee’s retirement, death or disability. Accelerated vesting or exercise in the event of a “change in control,” as defined in the 2015 Plan is also permitted under the 2015 Plan as long as such acceleration occurs in connection with a termination of employment without cause or the award is not assumed or converted into replacement awards as part of a transaction as described below and in the 2015 Plan. Further, it will require the Compensation Committee to make adjustments to outstanding awards in the event of certain corporate transactions or changes in the capital structure of New B&W.
The 2015 Plan authorizes the grant of “Adjusted Awards” to current holders of Company equity awards under the Company’s equity compensation plans. In connection with the distribution of shares of New B&W common stock to the Company’s stockholders, our Compensation Committee intends to authorize Adjusted Awards of New B&W stock options, stock appreciation rights, restricted shares, restricted stock units, and performance restricted stock units under the 2015 Plan to current holders of corresponding awards covering equity of the Company, as described above under “Description of Award Adjustments”.
Subject to adjustment as described in the 2015 Plan, total awards under the 2015 Plan will be limited to 7,000,000 shares of New B&W common stock. These shares may be shares of original issuance or treasury shares or a combination of the foregoing.
The 2015 Plan also provides that, subject to adjustment as described in the 2015 Plan:
| • | the aggregate number of common shares actually issued or transferred upon the exercise of incentive stock options will not exceed 1,200,000 shares of common stock; |
| • | no participant will be granted stock options or stock appreciation rights, in the aggregate, for more than 1,200,000 common shares during any calendar year; |
| • | no participant will be granted awards of restricted shares or restricted stock units that are intended to qualify as “qualified performance-based compensation” under Section 162(m) of the Code, in the aggregate, for more than 1,200,000 common shares during any calendar year; |
| • | no participant will be granted awards of performance shares that are intended to qualify as “qualified performance-based compensation” under Section 162(m) of the Code, in the aggregate, for more than 1,200,000 common shares during any calendar year; |
| • | no participant in any calendar year will receive an award of performance units or other awards payable in cash that are intended to qualify as “qualified performance-based compensation” under Section 162(m) of the Code, other than cash incentive awards, having an aggregate maximum value in excess of $6 million; and |
| • | no participant in any calendar year will receive a cash incentive award that is intended to qualify as “qualified performance-based compensation” under Section 162(m) of the Code having an aggregate maximum value in excess of $6 million. |
-137-
Table of Contents
Shares subject to awards under the 2015 Plan that are cancelled, forfeited, terminated or expire unexercised, or are settled in cash, in whole or in part, immediately become available for the granting of awards under the 2015 Plan to the extent of such cancellation, forfeiture, termination, expiration or cash settlement. In addition, the Compensation Committee may from time to time adopt and observe such procedures concerning the counting of shares against the 2015 Plan maximum as it may deem appropriate, provided that the 2015 Plan does not provide otherwise, the following shares will not be added to the aggregate number of shares available for awards under the 2015 Plan: (a) shares tendered or otherwise used in payment of the option price of a stock option, (b) shares withheld or otherwise used by New B&W to satisfy a tax withholding obligation, (c) shares subject to a stock appreciation right that are not actually issued in connection with its share settlement on exercise thereof, and (d) shares reacquired by New B&W on the open market or otherwise using cash proceeds from the exercise of stock options.
Shares of common stock issued or transferred pursuant to awards granted under the 2015 Plan in substitution for or in conversion of, or in connection with the assumption of, awards held by awardees of an entity engaging in a corporate acquisition or merger with us or any of our subsidiaries will not count against the share limits under the 2015 Plan. Additionally, shares available under certain plans that we or our subsidiaries may assume in connection with corporate transactions from another entity may be available for certain awards under the 2015 Plan, under circumstances further described in the 2015 Plan, but will not count against the share limits under the 2015 Plan.
The Compensation Committee generally will be able to amend the 2015 Plan, subject to shareholder approval in certain circumstances as described in the 2015 Plan.
138
Table of Contents
MATERIAL U.S. FEDERAL INCOME TAX CONSEQUENCES
We have described below the material U.S. federal income tax consequences of participating in the 2015 Plan by participants who either are U.S. citizens or residents. This description is based upon an analysis of the provisions of the Code currently in effect, and the regulations promulgated thereunder, all of which are subject to change. Awardees under the 2015 Plan also may be subject to state and local income taxes in the jurisdiction in which he or she works and/or resides, but we have not described such state and local income tax consequences of participating in the 2015 Plan, nor have we described the gift, estate inheritance, medicare or other social insurance tax consequences of participating in the 2015 Plan in this prospectus. The following description is only a summary. You should consult your personal tax advisor regarding the federal, state and local tax consequences to you of participating in the 2015 Plan.
Non-Qualified Stock Options
A participant will not recognize income upon the grant of a non-qualified stock option, including a New B&W non-qualified stock option granted as an Adjusted Award. In general, the participant will recognize ordinary income at the time of exercise equal to the excess of the fair market value of the underlying stock at the time of exercise over the exercise price. Upon a subsequent sale of the shares received upon exercise, any difference between the net proceeds on the sale and the fair market value of the shares on the date of exercise will be taxed as capital gain or loss (long- or short-term, depending on the holding period).
Incentive Stock Options
A participant will not recognize income upon the grant of an incentive stock option, including a New B&W incentive stock option granted as an Adjusted Award. In addition, a participant will not recognize income upon the exercise of an incentive stock option if he or she satisfies certain employment and holding period requirements. To satisfy the employment requirement, a participant must exercise the option not later than three months after he or she ceases to be an employee of New B&W (one year if he or she is disabled). To satisfy the holding period requirement, a participant must hold the optioned stock more than two years from the grant of the option and more than one year after the transfer of the stock to him or her. In the case of an Adjusted Award, the one-year and two-year holding period requirements are measured from the date on which the Company granted the underlying Company incentive stock option. If these requirements are satisfied, on the sale of such stock, the participant will be taxed on any gain, measured by the difference between the participant’s basis in such shares and the net proceeds of the sale, at long-term capital gains rates.
If shares of New B&W common stock acquired upon the timely exercise of an incentive stock option are sold, exchanged, or otherwise disposed of without satisfying the holding period requirement (a “disqualifying disposition”), the participant will, in the usual case, recognize ordinary income at the time of disposition equal to the excess of the fair market value of the common shares at the time of exercise over the exercise price. Any gain in excess of that amount will either be long-term or short-term capital gain depending on the holding period. Upon a disqualifying disposition that constitutes a sale or exchange with respect to which any loss (if sustained) would be recognized, the amount includible in ordinary income will be limited to the excess, if any, of the net amount realized on the sale or exchange over the participant’s basis in such shares. In general, such a disposition is a transaction with an unrelated third party that is not subject to the wash-sale provisions of the Code.
Individuals are subject to an alternative minimum tax based upon an expanded tax base to the extent such tax exceeds the regular tax liability. The alternative minimum tax is imposed on alternative minimum taxable income in excess of an exemption amount. Alternative minimum taxable income generally is the taxpayer’s taxable income, increased or decreased by certain adjustments and increased by certain preferences. Incentive stock options are generally treated for alternative minimum tax purposes in a manner similar to the regular tax treatment of non-qualified stock options. For example, upon the exercise of an incentive stock option, the amount of the spread will be included in alternative minimum taxable income, and the basis of the stock will equal its fair market value when the option is exercised. A tax credit may be available in a subsequent taxable year for some or all of any alternative minimum tax paid.
Options otherwise qualifying as incentive stock options will be treated as non-qualified stock options to the extent that the aggregate fair market value of stock with respect to which incentive stock options are
-139-
Table of Contents
exercisable for the first time by a participant during any calendar year (under all of our plans and any of our subsidiaries’ plans) exceeds $100,000. This rule is applied by taking the options into account in the order granted.
Appreciation Rights
A participant will not recognize income upon the grant of an appreciation right, including a New B&W appreciation right granted as an Adjusted Award. When the appreciation right is exercised, the participant will generally be required to include as taxable ordinary income in the year of exercise an amount equal to the amount of cash received and the fair market value of any unrestricted shares of New B&W common stock received on the exercise. The term “unrestricted shares of New B&W common stock” includes shares that are subject only to restrictions on transfer.
Restricted Shares
A participant will not recognize income upon the receipt of restricted shares, including New B&W restricted shares granted as an Adjusted Award, unless the participant makes an election under Section 83(b) of the Code, or a Section 83(b) Election, within 30 days after the transfer of the shares to him or her to have such shares taxed to him or her as ordinary income at their fair market value on the date of transfer less the amount, if any, paid by him or her. In the case of an Adjusted Award, the Section 83(b) Election must have been filed within 30 days after the initial grant of the underlying Company restricted shares.
If the participant makes a Section 83(b) Election, he or she will recognize ordinary income in the year of receipt in an amount equal to the excess of the fair market value of such shares (determined without regard to the restrictions imposed) at the time of transfer over any amount paid by the participant therefor. If a participant makes a Section 83(b) Election with respect to common shares that are subsequently forfeited, he or she will not be entitled to deduct any amount previously included in income by reason of such election. If a participant does not make a Section 83(b) Election, he or she will recognize ordinary income in the year or years in which the restrictions terminate, in an amount equal to the excess, if any, of the fair market value of such shares on the date the restrictions expire or are removed over any amount paid by the participant therefor. If a Section 83(b) Election has not been made, any unrestricted dividends received with respect to common shares subject to restrictions will be treated as additional compensation income and not as dividend income.
Restricted Stock Units (including Performance Restricted Stock Units)
No income generally will be recognized upon the award of restricted stock units, including New B&W restricted stock units granted as an Adjusted Award. The recipient of a deferred share award generally will recognize ordinary income in an amount equal to the aggregate amount of any cash received and the fair market value of unrestricted shares of New B&W common stock received on the date that such cash and shares are transferred to the recipient under the award (reduced by any amount paid by the recipient for such shares), and the capital gains/loss holding period for any shares will also commence on such date.
General Matters
Dividend equivalents, if any, awarded with respect to grants under the 2015 Plan and paid in cash or unrestricted shares of common stock will be taxed to a participant at ordinary income rates when received by the participant.
To the extent that a participant recognizes ordinary income in the circumstances described above, the participant’s employer, either New B&W or the Company, generally will be entitled to a corresponding deduction provided, among other things, that such deduction meets the test of reasonableness, is an ordinary and necessary business expense, is not disallowed by the $1 million limitation on certain executive compensation under Section 162(m) of the Code and is not an “excess parachute payment” within the meaning of Section 280G of the Code.
Compliance with Section 409A of the Code
To the extent applicable, it is intended that the 2015 Plan and any grants made under it comply with, or are exempt from, the provisions of Section 409A of the Code. Failure to comply with Section 409A of the Code may subject participants to potentially significant penalties, including current taxation at vesting and a 20 percent penalty tax.
140
Table of Contents
WHERE YOU CAN FIND MORE INFORMATION
We have filed with the SEC a registration statement on Form S-1 with respect to the common stock to be issued as contemplated by this prospectus. This prospectus is a part of that registration statement but does not contain all of the information set forth in the registration statement and the exhibits and schedules to the registration statement. For further information relating to us and the shares of our common stock, reference is made to the registration statement, including its exhibits and schedules. Statements made in this prospectus relating to any contract or other document are not necessarily complete and you should refer to the exhibits attached to or incorporated by reference into the registration statement for copies of the actual contract or document. You may review a copy of the registration statement, including its exhibits and schedules, at the SEC’s Public Reference Room, located at 100 F Street, NE, Washington, D.C. 20549 or on the SEC’s website at http://www.sec.gov. You may obtain a copy of the registration statement from the SEC’s Public Reference Room upon payment of prescribed fees. Please call the SEC at (800) SEC-0330 for further information on the operation of the Public Reference Room.
As a result of the spin-off, we will become subject to the information and reporting requirements of the Exchange Act and, in accordance with the Exchange Act, we will file periodic reports, proxy statements and other information with the SEC. Those periodic reports, proxy statements and other information will be available for inspection and copying at the SEC’s Public Reference Room and the SEC’s website at http://www.sec.gov.
We intend to furnish holders of our common stock with annual reports containing combined financial statements prepared in accordance with U.S. generally accepted accounting principles and audited and reported on, with an opinion expressed, by an independent registered public accounting firm.
We plan to make available free of charge on our website, our Annual Reports on Form 10-K, Quarterly Reports on Form 10-Q, Current Reports on Form 8-K and amendments to those reports as soon as reasonably practicable after we electronically file or furnish such materials to the SEC. All of these documents will be made available free of charge on our website, http://www.babcock.com. The information on our website is not, and will not be deemed to be, a part of this prospectus or incorporated into any other filings we make with the SEC.
No person is authorized to give any information or to make any representations with respect to the matters described in this prospectus other than those contained in this prospectus or in the documents incorporated by reference in this prospectus and, if given or made, such information or representation must not be relied upon as having been authorized by us or the Company. Neither the delivery of this prospectus nor consummation of the spin-off will, under any circumstances, create any implication that there has been no change in our affairs or those of the Company since the date of this prospectus, or that the information in this prospectus is correct as of any time after its date.
Jones Day has passed upon the validity of the shares of our common stock on behalf of New B&W.
The combined financial statements as of December 31, 2014 and 2013, and for each of the three years in the period ended December 31, 2014, included in this prospectus have been audited by Deloitte & Touche LLP, an independent registered public accounting firm, as stated in their report appearing herein and elsewhere in the registration statement (which report expresses an unqualified opinion and includes an explanatory paragraph relating to the preparation of the financial statements from the consolidated financial statements and accounting records of The Babcock & Wilcox Company, expense allocations for certain corporate functions historically provided by The Babcock & Wilcox Company, and related party transactions). Such combined financial statements have been so included in reliance upon the report of such firm given upon their authority as experts in accounting and auditing.
-141-
Table of Contents
INDEX TO COMBINED FINANCIAL STATEMENTS
F-1
Table of Contents
REPORT OF INDEPENDENT REGISTERED PUBLIC ACCOUNTING FIRM
To the Board of Directors and Stockholders of The Babcock & Wilcox Company:
Charlotte, North Carolina
We have audited the accompanying combined balance sheets of the Power Generation Operations of The Babcock & Wilcox Company (the “Company”) which consists of Babcock & Wilcox Power Generation Group, Inc. and the related captive insurance operations as of December 31, 2014 and 2013, and the related combined statements of operations, comprehensive income (loss), parent equity and cash flows for each of the three years in the period ended December 31, 2014. These combined financial statements are the responsibility of the Company’s management. Our responsibility is to express an opinion on these combined financial statements based on our audits.
We conducted our audits in accordance with the standards of the Public Company Accounting Oversight Board (United States). Those standards require that we plan and perform the audits to obtain reasonable assurance about whether the financial statements are free of material misstatement. The Company is not required to have, nor were we engaged to perform, an audit of its internal control over financial reporting. Our audits included consideration of internal control over financial reporting as a basis for designing audit procedures that are appropriate in the circumstances, but not for the purpose of expressing an opinion on the effectiveness of the Company’s internal control over financial reporting. Accordingly, we express no such opinion. An audit also includes examining, on a test basis, evidence supporting the amounts and disclosures in the financial statements, assessing the accounting principles used and significant estimates made by management, as well as evaluating the overall financial statement presentation. We believe that our audits provide a reasonable basis for our opinion.
In our opinion, such combined financial statements present fairly, in all material respects, the financial position of the Company as of December 31, 2014 and 2013 and the results of its operations and its cash flows for each of the three years in the period ended December 31, 2014, in conformity with accounting principles generally accepted in the United States of America.
As described in Note 1, the accompanying combined financial statements have been derived from the consolidated financial statements and accounting records of The Babcock & Wilcox Company. The combined financial statements also include expense allocations for certain corporate functions historically provided by The Babcock & Wilcox Company. These allocations may not be reflective of the actual expense that would have been incurred had the Company operated as a separate entity apart from The Babcock & Wilcox Company. Included in Note 8 to the combined financial statements is a summary of transactions with related parties.
/S/ DELOITTE & TOUCHE LLP
Charlotte, North Carolina
March 16, 2015 (April 17, 2015, as to Note 10 related to ARPA)
F-2
Table of Contents
THE POWER GENERATION OPERATIONS OF THE BABCOCK & WILCOX COMPANY
COMBINED BALANCE SHEETS
| December 31, | ||||||||
| 2014 |
2013 |
|||||||
| (In thousands) | ||||||||
| ASSETS | ||||||||
| Current Assets: |
||||||||
| Cash and cash equivalents |
$ 219,085 | $ 198,478 | ||||||
| Restricted cash and cash equivalents |
31,816 | 24,737 | ||||||
| Investments |
1,997 | 8,951 | ||||||
| Accounts receivable – trade, net |
279,497 | 247,638 | ||||||
| Accounts receivable – other |
37,558 | 31,959 | ||||||
| Contracts in progress |
130,704 | 86,078 | ||||||
| Inventories |
100,017 | 102,353 | ||||||
| Deferred income taxes |
36,649 | 30,813 | ||||||
| Other current assets |
17,371 | 18,745 | ||||||
| Total Current Assets |
854,694 | 749,752 | ||||||
| Property, Plant and Equipment |
422,047 | 440,366 | ||||||
| Less accumulated depreciation |
263,089 | 277,302 | ||||||
| Net Property, Plant and Equipment |
158,958 | 163,064 | ||||||
| Investments |
266 | 354 | ||||||
| Goodwill |
219,332 | 114,685 | ||||||
| Deferred Income Taxes |
117,485 | 89,026 | ||||||
| Investments in Unconsolidated Affiliates |
109,248 | 144,475 | ||||||
| Intangible Assets |
51,626 | 19,506 | ||||||
| Other Assets |
11,197 | 15,607 | ||||||
| TOTAL |
$ 1,522,806 | $ 1,296,469 | ||||||
See accompanying notes to combined financial statements.
F-3
Table of Contents
THE POWER GENERATION OPERATIONS OF THE BABCOCK & WILCOX COMPANY
COMBINED BALANCE SHEETS
| December 31, | ||||||||
|
2014 |
2013 |
|||||||
| (In thousands) | ||||||||
| LIABILITIES AND PARENT EQUITY | ||||||||
| Current Liabilities: |
||||||||
| Notes payable and current maturities of long-term debt |
$ 3,215 | $ 4,671 | ||||||
| Accounts payable |
168,560 | 167,421 | ||||||
| Accrued employee benefits |
47,359 | 52,912 | ||||||
| Advance billings on contracts |
153,573 | 210,755 | ||||||
| Accrued warranty expense |
43,204 | 45,544 | ||||||
| Accrued liabilities – other |
72,179 | 37,174 | ||||||
| Total Current Liabilities |
488,090 | 518,477 | ||||||
| Long-term Debt |
- | 225 | ||||||
| Accumulated Postretirement Benefit Obligation |
36,182 | 35,668 | ||||||
| Pension Liability |
260,846 | 169,226 | ||||||
| Other Liabilities |
44,000 | 40,988 | ||||||
| Commitments and Contingencies (Note 10) |
||||||||
| Parent Equity: |
||||||||
| Parent Equity |
692,661 | 530,961 | ||||||
| Noncontrolling interest |
1,027 | 924 | ||||||
| Total Parent Equity |
693,688 | 531,885 | ||||||
| TOTAL |
$ 1,522,806 | $ 1,296,469 | ||||||
See accompanying notes to combined financial statements.
F-4
Table of Contents
THE POWER GENERATION OPERATIONS OF THE BABCOCK & WILCOX COMPANY
COMBINED STATEMENTS OF OPERATIONS
| Year Ended December 31, | ||||||||||||
| 2014 |
2013 |
2012 |
||||||||||
| (In thousands) | ||||||||||||
| Revenues |
$ 1,589,719 | $ 1,921,163 | $ 2,039,100 | |||||||||
| Costs and Expenses: |
||||||||||||
| Cost of operations |
1,364,357 | 1,426,889 | 1,573,391 | |||||||||
| Research and development costs |
18,747 | 22,882 | 26,018 | |||||||||
| Losses (Gains) on asset disposals and impairments, net |
1,087 | 1,153 | 3,276 | |||||||||
| Selling, general and administrative expenses |
241,699 | 207,106 | 247,931 | |||||||||
| Special charges for restructuring activities |
30,025 | 26,346 | - | |||||||||
| Total Costs and Expenses |
1,655,915 | 1,684,376 | 1,850,616 | |||||||||
| Equity in Income of Investees |
8,681 | 18,387 | 17,402 | |||||||||
| Operating Income (Loss) |
(57,515 | ) | 255,174 | 205,886 | ||||||||
| Other Income (Expense): |
||||||||||||
| Interest income |
1,170 | 1,527 | 1,451 | |||||||||
| Interest expense |
(503 | ) | (471 | ) | (567) | |||||||
| Other – net |
1,156 | 791 | (1,553) | |||||||||
| Total Other Income (Expense): |
1,823 | 1,847 | (669) | |||||||||
| Income (Loss) before Provision for (Benefit from) Income Taxes |
(55,692 | ) | 257,021 | 205,217 | ||||||||
| Provision for (Benefit from) Income Taxes |
(29,528 | ) | 82,206 | 64,323 | ||||||||
| Net Income (Loss) |
$ (26,164 | ) | $ 174,815 | $ 140,894 | ||||||||
| Net Income Attributable to Noncontrolling Interest |
(365 | ) | (289 | ) | (141) | |||||||
| Net Income (Loss) Attributable to The Power Generation Operations of The Babcock & Wilcox Company |
$ (26,529 | ) | $ 174,526 | $ 140,753 | ||||||||
See accompanying notes to combined financial statements.
F-5
Table of Contents
THE POWER GENERATION OPERATIONS OF THE BABCOCK & WILCOX COMPANY
COMBINED STATEMENTS OF COMPREHENSIVE INCOME (LOSS)
| Year Ended December 31, | ||||||||||||
| 2014 |
2013 |
2012 |
||||||||||
| (In thousands) | ||||||||||||
| Net Income (Loss) |
$ (26,164) | $ 174,815 | $ 140,894 | |||||||||
| Other Comprehensive Income (Loss): |
||||||||||||
| Currency translation adjustments |
(26,895) | (2,528) | 4,288 | |||||||||
| Derivative financial instruments: |
||||||||||||
| Unrealized gains (losses) arising during the period, net of tax benefit (provision) of $824, $1,518 and $(622), respectively |
(2,360) | (4,418) | 1,409 | |||||||||
| Reclassification adjustment for (gains) losses included in net income, net of tax (benefit) provision of $(559), $(973) and $704, respectively |
1,610 | 2,942 | (2,023) | |||||||||
| Benefit obligations: |
||||||||||||
| Unrecognized losses arising during the period, net of tax benefit of $0, $0 and $159, respectively |
- | - | (267) | |||||||||
| Amortization of benefit plan costs, net of tax benefit of $(1,006), $(368) and $(576), respectively |
2,645 | 742 | 1,157 | |||||||||
| Investments: |
||||||||||||
| Unrealized gains arising during the period, net of tax (provision) benefit of $(3), $13 and $0, respectively |
6 | 59 | 58 | |||||||||
| Reclassification adjustment for gains included in net income, net of tax provision of $5, $0 and $0, respectively |
(8) | - | (17) | |||||||||
| Other Comprehensive Income (Loss) |
(25,002) | (3,203) | 4,605 | |||||||||
| Total Comprehensive Income (Loss) |
(51,166) | 171,612 | 145,499 | |||||||||
| Comprehensive Income Attributable to |
(328) | (255) | (152) | |||||||||
| Comprehensive Income (Loss) Attributable to |
$ (51,494) | $ 171,357 | $ 145,347 | |||||||||
|
|
||||||||||||
See accompanying notes to combined financial statements.
F-6
Table of Contents
THE POWER GENERATION OPERATIONS OF THE BABCOCK & WILCOX COMPANY
COMBINED STATEMENTS OF PARENT EQUITY
| Accumulated |
Parent |
Noncontrolling Interest |
Total Equity |
|||||||||||||
| (In thousands) |
||||||||||||||||
| Balance December 31, 2011 |
$ 33,909 | $ 467,535 | $ 737 | $ 502,181 | ||||||||||||
| Net income |
- | 140,753 | 141 | 140,894 | ||||||||||||
| Net transfers to parent |
- | (335,005 | ) | - | (335,005) | |||||||||||
| Defined benefit obligations |
890 | - | - | 890 | ||||||||||||
| Available-for-sale investments |
41 | - | - | 41 | ||||||||||||
| Currency translation adjustments |
4,277 | - | 11 | 4,288 | ||||||||||||
| Derivative financial instruments |
(614 | ) | - | - | (614) | |||||||||||
| Stock-based compensation |
- | 376 | - | 376 | ||||||||||||
| Distributions to noncontrolling interests |
- | - | (106 | ) | (106) | |||||||||||
| Balance December 31, 2012 |
$ 38,503 | $ 273,659 | $ 783 | $ 312,945 | ||||||||||||
| Net income |
- | 174,526 | 289 | 174,815 | ||||||||||||
| Net transfers from parent |
- | 47,281 | - | 47,281 | ||||||||||||
| Defined benefit obligations |
742 | - | - | 742 | ||||||||||||
| Available-for-sale investments |
59 | - | - | 59 | ||||||||||||
| Currency translation adjustments |
(2,494 | ) | - | (34 | ) | (2,528) | ||||||||||
| Derivative financial instruments |
(1,476 | ) | - | - | (1,476) | |||||||||||
| Stock-based compensation |
- | 161 | - | 161 | ||||||||||||
| Distributions to noncontrolling interests |
- | - | (114 | ) | (114) | |||||||||||
| Balance December 31, 2013 |
$ 35,334 | $ 495,627 | $ 924 | $ 531,885 | ||||||||||||
| Net income (loss) |
- | (26,529 | ) | 365 | (26,164) | |||||||||||
| Net transfers from parent |
- | 213,086 | - | 213,086 | ||||||||||||
| Defined benefit obligations |
2,645 | - | - | 2,645 | ||||||||||||
| Available-for-sale investments |
(2 | ) | - | - | (2) | |||||||||||
| Currency translation adjustments |
(26,858 | ) | - | (37 | ) | (26,895) | ||||||||||
| Derivative financial instruments |
(750 | ) | - | - | (750) | |||||||||||
| Stock-based compensation |
- | 108 | - | 108 | ||||||||||||
| Distributions to noncontrolling interests |
- | - | (225 | ) | (225) | |||||||||||
| Balance December 31, 2014 |
$ 10,369 | $ 682,292 | $ 1,027 | $ 693,688 | ||||||||||||
See accompanying notes to combined financial statements.
F-7
Table of Contents
THE POWER GENERATION OPERATIONS OF THE BABCOCK & WILCOX COMPANY
COMBINED STATEMENTS OF CASH FLOWS
| Year Ended December 31, | ||||||||||||
| 2014 |
2013 |
2012 |
||||||||||
| (In thousands) | ||||||||||||
| CASH FLOWS FROM OPERATING ACTIVITIES: |
||||||||||||
| Net Income (Loss) |
$ (26,164 | ) | $ 174,815 | $ 140,894 | ||||||||
| Non-cash items included in net income: |
||||||||||||
| Depreciation and amortization |
36,454 | 29,726 | 23,857 | |||||||||
| Income of equity method investees, net of dividends |
8,726 | 1,995 | (8,401) | |||||||||
| Losses (gains) on asset disposals and impairments |
8,304 | 1,153 | 3,276 | |||||||||
| Provision for (benefit from) deferred taxes |
(39,384 | ) | 43,061 | 45,774 | ||||||||
| Recognition of (gains) losses for pension and postretirement plans |
112,033 | (114,096 | ) | 14,378 | ||||||||
| Excess tax benefits from stock-based compensation |
(96 | ) | (172 | ) | (606) | |||||||
| Changes in assets and liabilities, net of effects from acquisitions: |
||||||||||||
| Accounts receivable |
(19,520 | ) | 33,767 | (24,803) | ||||||||
| Accounts payable |
(7,758 | ) | (16,381 | ) | 41,660 | |||||||
| Contracts in progress and advance billings on contracts |
(110,419 | ) | (106,395 | ) | (21,948) | |||||||
| Inventories |
2,959 | 11,264 | (10,697) | |||||||||
| Income taxes |
4,225 | 1,213 | (7,911) | |||||||||
| Accrued and other current liabilities |
19,933 | (30,253 | ) | (18,850) | ||||||||
| Pension liability, accrued postretirement benefit obligation and employee benefits |
(27,003 | ) | (43,680 | ) | (95,610) | |||||||
| Other, net |
9,038 | 6,662 | (22,818) | |||||||||
| NET CASH PROVIDED BY (USED IN) OPERATING ACTIVITIES |
(28,672 | ) | (7,321 | ) | 58,195 | |||||||
| CASH FLOWS FROM INVESTING ACTIVITIES: |
||||||||||||
| Decrease (increase) in restricted cash and cash equivalents |
(7,079 | ) | 13,199 | 14,951 | ||||||||
| Purchases of property, plant and equipment |
(17,204 | ) | (16,563 | ) | (25,074) | |||||||
| Acquisition of businesses, net of cash acquired |
(127,703 | ) | - | - | ||||||||
| Purchase of intangible assets |
(722 | ) | - | - | ||||||||
| Purchases of available-for-sale securities |
(5,532 | ) | (13,811 | ) | (266,232) | |||||||
| Sales and maturities of available-for-sale securities |
12,578 | 4,939 | 181,210 | |||||||||
| Proceeds from asset disposals |
993 | 535 | 170 | |||||||||
| Investment in equity method investees |
(4,900 | ) | (6,884 | ) | (6,172) | |||||||
| NET CASH USED IN INVESTING ACTIVITIES |
(149,569 | ) | (18,585 | ) | (101,147) | |||||||
| CASH FLOWS FROM FINANCING ACTIVITIES: |
||||||||||||
| Payment of short-term borrowing and long-term debt |
(4,539 | ) | (212 | ) | (4,644) | |||||||
| Borrowings under short-term arrangements |
2,967 | 484 | 3,815 | |||||||||
| Net transfers (to) from parent |
213,086 | 47,281 | (182,442) | |||||||||
| Excess tax benefits from stock-based compensation |
96 | 172 | 606 | |||||||||
| Other |
90 | (114 | ) | (106) | ||||||||
| NET CASH (USED IN) PROVIDED BY FINANCING ACTIVITIES |
211,700 | 47,611 | (182,771) | |||||||||
| EFFECTS OF EXCHANGE RATE CHANGES ON CASH |
(12,852 | ) | (4,495 | ) | 2,813 | |||||||
| NET (DECREASE) INCREASE IN CASH AND CASH EQUIVALENTS |
20,607 | 17,210 | (222,910) | |||||||||
| CASH AND CASH EQUIVALENTS AT BEGINNING OF PERIOD |
198,478 | 181,268 | 404,178 | |||||||||
| CASH AND CASH EQUIVALENTS AT END OF PERIOD |
$ 219,085 | $ 198,478 | $ 181,268 | |||||||||
| SUPPLEMENTAL DISCLOSURES OF CASH FLOW INFORMATION: |
||||||||||||
| Cash paid during the period for: |
||||||||||||
| Income taxes (net of refunds) |
$ 8,206 | $ 18,135 | $ 10,900 | |||||||||
| SCHEDULE OF NON-CASH INVESTING ACTIVITY: |
||||||||||||
| Accrued capital expenditures included in accounts payable |
$ 1,680 | $ 2,607 | $ 1,395 | |||||||||
| Transfer of investments to Parent |
$ - | $ - | $ 152,563 | |||||||||
See accompanying notes to combined financial statements.
F-8
Table of Contents
THE POWER GENERATION OPERATIONS OF THE BABCOCK & WILCOX COMPANY
NOTES TO COMBINED FINANCIAL STATEMENTS
NOTE 1 – BASIS OF PRESENTATION AND SIGNIFICANT ACCOUNTING POLICIES
On November 5, 2014, The Babcock & Wilcox Company (the “Company”) announced that its Board of Directors approved pursuing the separation of its Power Generation business from its Government and Nuclear Operations business into two independent, publicly traded companies to be effected through a tax-free spin-off transaction. These financial statements represent Babcock & Wilcox Power Generation Group, Inc. historical financial statements combined with related captive insurance operations which will be contributed by the Company in conjunction with the planned spin-off (“B&W PGG”). In addition to the assets and liabilities used in managing and operating the Power Generation segment of the Company, B&W PGG contains certain assets and liabilities of the Company’s Nuclear Energy segment that will be transferred to the Company before the spin-off.
We have presented the combined financial statements of B&W PGG in U.S. dollars in accordance with accounting principles generally accepted in the United States (“GAAP”). We use the equity method to account for investments in entities that we do not control, but over which we have the ability to exercise significant influence. We generally refer to these entities as “joint ventures.” We have eliminated all intercompany transactions and accounts. We present the notes to our combined financial statements on the basis of continuing operations, unless otherwise stated. We have evaluated subsequent events through March 16, 2015 and April 17, 2015 (the date of issuance of this report).
The combined results of operations, financial position and cash flows reflected in the accompanying combined financial statements may not be indicative of the future performance of the combined operations and do not necessarily reflect what the combined results of operations, financial position and cash flows would have been had B&W PGG operated as an independent public company during the periods presented, including changes in its operations and capitalization as a result of the separation and distribution from the Company.
Certain corporate and general and administrative expenses, including those related to executive management, tax, accounting, legal, information technology, treasury services, and certain employee benefits, have been allocated to reflect all costs of doing business related to these operations in the financial statements, including expenses incurred by related entities on our behalf. The majority of these allocations of management and support services costs are based on specific identification methods such as direct usage and level of effort. The remainder are allocated on the basis of a three-factor formula that considered proportional revenue generated, payroll and fixed assets. Management believes such allocations are reasonable. However, the associated expenses reflected in the accompanying combined statements of operations may not be indicative of the actual expenses that would have been incurred had B&W PGG been operating as an independent public company for the periods presented. Following the separation and distribution from the Company, we will perform these functions using internal resources or purchased services, certain of which may be provided by the Company during a transitional period pursuant to a transition services agreement. Refer to Note 8 for a detailed description of transactions with other affiliates of the Company.
In presenting the combined financial statements, management makes estimates and assumptions that affect the amounts reported and related disclosures. Estimates, by their nature, are based on judgment and available information. Accordingly, actual results could differ from those estimates.
Unless the context otherwise indicates, “we,” “us,” “our” and “B&W PGG” mean The Power Generation Operations of The Babcock & Wilcox Company.
Business Segments
We have four reportable segments: Global Power, Global Services, Industrial Environmental and Nuclear Energy. The Nuclear Energy segment will be transferred to the Company before the spin-off. For financial information about our segments, see Note 16 to our combined financial statements included in this report.
Our reportable segments are further described as follows:
| • | Our Global Power segment represents our worldwide new build boiler and environmental products operations. Through this segment, we engineer, manufacture, procure, construct and commission steam |
F-9
Table of Contents
| generating and environmental systems and other related equipment. Our boilers are designed for utility and industrial applications, fired with fossil and renewable fuels and include advanced supercritical boilers, subcritical boilers, fluidized bed boilers, biomass-fired boilers, waste-to-energy boilers, chemical recovery boilers, industrial power boilers, package boilers, heat recovery steam generators, waste heat boilers and solar thermal power systems. Our environmental systems offer air pollution control systems and related equipment for the treatment of nitrogen oxides, sulfur dioxide, fine particulate, mercury, acid gases and other hazardous air emissions and include wet and dry flue gas desulfurization systems, catalytic and non-catalytic nitrogen oxides reduction systems, low nitrogen oxides burners and overfire air systems, fabric filter baghouses, wet and dry electrostatic precipitators, mercury control systems and dry sorbent injection for acid gas mitigation. Our customers consist of a wide range of utilities, independent power producers and industrial companies globally. |
| • | Our Global Services segment provides a comprehensive mix of aftermarket products and services to support peak efficiency and availability of steam generating and associated environmental and auxiliary equipment for power generation. Our products and services include replacement parts, field technical services, retrofit and upgrade projects, fuel switching and repowering projects, construction and maintenance services, start-up and commissioning, training programs and plant operations and maintenance for our full complement of boiler, environmental and auxiliary equipment. We deliver these aftermarket products and services to a large installed base for our and our competitors’ power generation and industrial plants globally through our extensive network of regionally located service centers, technical support personnel, and global sourcing capabilities. Our customers consist of a wide range of utilities, independent power producers and industrial companies globally. |
| • | Our Industrial Environmental segment provides environmental products and services to numerous industrial end markets through MEGTEC Holdings, Inc. (“MEGTEC”), which we acquired on June 20, 2014. Through this segment, we design, engineer and manufacture products including oxidizers, solvent and distillation systems, wet and dry electrostatic precipitators, scrubbers and heat recovery systems. The segment also provides specialized industrial process systems, coating lines and equipment. Our suite of technologies for pollution abatement include systems that control volatile organic compounds and air toxics, particulate, nitrogen oxides and acid gas air emissions from industrial processes. We serve a diverse set of industrial end markets with a current emphasis on the chemical, pharmaceutical, energy storage, packaging and automotive markets. |
| • | Our Nuclear Energy segment supplies commercial nuclear steam generators and components to nuclear utility customers. This segment has supplied the nuclear industry with more than 1,300 large, heavy components worldwide. This segment is the only heavy nuclear component, N-Stamp certified manufacturer in North America. Our Nuclear Energy segment fabricates pressure vessels, reactors, steam generators, heat exchangers and other auxiliary equipment. This segment also provides specialized engineering services that include structural component design, 3-D thermal-hydraulic engineering analysis, weld and robotic process development and metallurgy and materials engineering. In addition, this segment offers services for nuclear steam generators and balance of plant equipment, as well as nondestructive examination and tooling/repair solutions for other plant systems and components. |
Use of Estimates
We use estimates and assumptions to prepare our financial statements in conformity with GAAP. Some of our more significant estimates include our estimate of costs to complete long-term construction contracts, estimates of costs to be incurred to satisfy contractual warranty requirements, estimates of the value of acquired intangible assets and estimates we make in selecting assumptions related to the valuations of our pension and postretirement plans, including the selection of our discount rates, mortality and expected rates of return on our pension plan assets. These estimates and assumptions affect the amounts we report in our financial statements and accompanying notes. Our actual results could differ from these estimates. Variances could result in a material effect on our financial condition and results of operations in future periods.
Investments
Our investments, primarily highly liquid money-market instruments and mortgage-backed securities, are classified as available-for-sale and are carried at fair value, with the unrealized gains and losses, net of tax,
F-10
Table of Contents
reported as a component of accumulated other comprehensive income. We classify investments available for current operations in the combined balance sheets as current assets, while we classify investments held for long-term purposes as noncurrent assets. We adjust the amortized cost of debt securities for amortization of premiums and accretion of discounts to maturity. That amortization is included in interest income. We include realized gains and losses on our investments in other – net in our combined statements of operations. The cost of securities sold is based on the specific identification method. We include interest on securities in interest income.
Foreign Currency Translation
We translate assets and liabilities of our foreign operations into U.S. dollars at current exchange rates, and we translate income statement items at average exchange rates for the periods presented. We record adjustments resulting from the translation of foreign currency financial statements as a component of accumulated other comprehensive income. We report foreign currency transaction gains and losses in income. We have included in other – net transaction gains (losses) of $1.9 million, $0.5 million and $(0.6) million for the years ended December 31, 2014, 2013 and 2012, respectively.
Contracts and Revenue Recognition
We generally recognize contract revenues and related costs on a percentage-of-completion method for individual contracts or combinations of contracts based on a cost-to-cost method, as applicable to the product or activity involved. We recognize estimated contract revenue and resulting income based on costs incurred to date as a percentage of total estimated costs. Certain costs may be excluded from the cost-to-cost method of measuring progress, such as significant costs for materials and major third-party subcontractors, if it appears that such exclusion would result in a more meaningful measurement of actual contract progress and resulting periodic allocation of income. We include revenues and related costs so recorded, plus accumulated contract costs that exceed amounts invoiced to customers under the terms of the contracts, in contracts in progress. We include in advance billings on contracts billings that exceed accumulated contract costs and revenues and costs recognized under the percentage-of-completion method. Most long-term contracts contain provisions for progress payments. Our unbilled receivables do not contain an allowance for credit losses as we expect to invoice customers and collect all amounts for unbilled revenues. We review contract price and cost estimates periodically as the work progresses and reflect adjustments proportionate to the percentage-of-completion in income in the period when those estimates are revised. For all contracts, if a current estimate of total contract cost indicates a loss on a contract, the projected loss is recognized in full when determined.
For parts orders and certain aftermarket services activities, we recognize revenues as goods are delivered and work is performed.
Variations from estimated contract performance could result in material adjustments to operating results for any fiscal quarter or year. We include claims for extra work or changes in scope of work to the extent of costs incurred in contract revenues when we believe collection is probable. At December 31, 2014 and 2013, we recognized accrued claims totaling $8.2 million.
In the year ended December 31, 2014, we recorded a contract loss totaling approximately $11.6 million for additional estimated costs to complete our Global Power segment’s Berlin Station project. These losses are in addition to contract losses recorded on this project of $35.6 million and $16.9 million in 2013 and 2012, respectively. We previously asserted that substantial completion had been achieved on this project in early 2014 and that any further delays to complete this project were the result of the customer’s failure to supply fuel complying with the contract specifications. The customer certified that we achieved substantial completion on the project effective July 19, 2014, following which we believe the customer has no further claims for liquidated damages associated with the delays. See Note 10 for legal proceedings associated with this matter. In addition, in the year ended December 31, 2012 we recognized $13.8 million of project improvements on a new build capital project in our Global Power segment due to better than expected performance.
F-11
Table of Contents
Components of our contracts in progress and advance billings on contracts included in our combined balance sheets are as follows:
| December 31, | ||||||||
| 2014 |
2013 |
|||||||
| (In thousands) | ||||||||
| Included in Contracts in Progress: |
||||||||
| Costs incurred less costs of revenue recognized |
$ | 35,126 | $ | 19,360 | ||||
| Revenues recognized less billings to customers |
95,578 | 66,718 | ||||||
|
|
||||||||
| Contracts In Progress |
$ | 130,704 | $ | 86,078 | ||||
| Included in Advance Billings on Contracts: |
||||||||
| Billings to customers less revenues recognized |
$ | 149,450 | $ | 201,254 | ||||
| Costs incurred less costs of revenue recognized |
4,123 | 9,501 | ||||||
|
|
||||||||
| Advance Billings on Contracts |
$ | 153,573 | $ | 210,755 | ||||
Retainages on contracts are as follows:
| December 31, | ||||||||
| 2014 |
2013 |
|||||||
| (In thousands) | ||||||||
| Retainages expected to be collected within one year |
$ | 19,978 | $ | 36,746 | ||||
| Retainages expected to be collected after one year |
7,360 | 11,387 | ||||||
|
|
||||||||
| Total retainages |
$ | 27,338 | $ | 48,133 | ||||
We have included retainages expected to be collected in 2015 in accounts receivable – trade, net. Retainages expected to be collected after one year are included in other assets. Of the long-term retainages at December 31, 2014, we anticipate collecting $1.2 million in 2016, $4.7 million in 2017 and $1.5 million in 2018.
Comprehensive Income
The components of accumulated other comprehensive income included in parent equity are as follows:
| December 31, | ||||||||
| 2014 |
2013 |
|||||||
| (In thousands) | ||||||||
| Currency translation adjustments |
$ | 11,551 | $ | 38,409 | ||||
| Net unrealized loss on available-for-sale investments |
(27 | ) | (25 | ) | ||||
| Net unrealized gain (loss) on derivative financial instruments |
(123 | ) | 627 | |||||
| Unrecognized prior service cost on benefit obligations |
(1,032 | ) | (3,677 | ) | ||||
|
|
||||||||
| Accumulated other comprehensive income |
$ | 10,369 | $ | 35,334 | ||||
F-12
Table of Contents
The amounts reclassified out of accumulated other comprehensive income by component and the affected combined statements of operations line items are as follows:
| Year ended December 31, | ||||||||||||||
| 2014 |
2013 |
2012 |
||||||||||||
| Accumulated Other Comprehensive Income Component Recognized |
(In thousands) | Line Item Presented | ||||||||||||
| Realized (losses) gains on derivative financial instruments |
$ | 620 | $ | (1,885 | ) | $ | (1,082 | ) | Revenues | |||||
| (2,793 | ) | (2,174 | ) | 3,833 | Cost of operations | |||||||||
| 4 | 144 | (24 | ) | Other-net | ||||||||||
|
|
|
|||||||||||||
| (2,169 | ) | (3,915 | ) | 2,727 | Total before tax | |||||||||
| 559 | 973 | (704 | ) | Provision for Income Taxes | ||||||||||
|
|
|
|||||||||||||
| $ | (1,610 | ) | $ | (2,942 | ) | $ | 2,023 | Net Income | ||||||
| Amortization of prior service cost on benefit obligations |
$ | (1,856 | ) | $ | (913 | ) | $ | (1,370 | ) | Cost of operations | ||||
| (1,795 | ) | (197 | ) | (363 | ) | Selling, general and administrative expenses | ||||||||
|
|
|
|||||||||||||
| (3,651 | ) | (1,110 | ) | (1,733 | ) | Total before tax | ||||||||
| 1,006 | 368 | 576 | Provision for Income Taxes | |||||||||||
|
|
|
|||||||||||||
| $ | (2,645 | ) | $ | (742 | ) | $ | (1,157 | ) | Net Income | |||||
| Realized gains on investments |
$ | 13 | $ | - | $ | 17 | Other-net | |||||||
| (5 | ) | - | - | Provision for Income Taxes | ||||||||||
|
|
|
|||||||||||||
| $ | 8 | $ | - | $ | 17 | Net Income | ||||||||
|
| ||||||||||||||
| Total reclassification for the period |
$ | (4,247 | ) | $ | (3,684 | ) | $ | 883 | ||||||
Warranty Expense
We accrue estimated expense included in cost of operations on our combined statements of operations to satisfy contractual warranty requirements when we recognize the associated revenue on the related contracts. In addition, we record specific provisions or reductions where we expect the actual warranty costs to significantly differ from the accrued estimates. Such changes could have a material effect on our combined financial condition, results of operations and cash flows.
The following summarizes the changes in the carrying amount of accrued warranty expense:
| Year Ended December 31, | ||||||||||||
| 2014 |
2013 |
2012 |
||||||||||
| (In thousands) | ||||||||||||
| Balance at beginning of period |
$ | 45,544 | $ | 72,601 | $ | 85,932 | ||||||
| Additions |
14,033 | 17,258 | 20,919 | |||||||||
| Acquisition of MEGTEC |
4,693 | - | - | |||||||||
| Expirations and other changes |
(4,981 | ) | (23,391 | ) | (23,340 | ) | ||||||
| Payments |
(14,787 | ) | (20,243 | ) | (11,394 | ) | ||||||
| Translation and other |
(1,298 | ) | (681 | ) | 484 | |||||||
|
|
||||||||||||
| Balance at end of period |
$ | 43,204 | $ | 45,544 | $ | 72,601 | ||||||
F-13
Table of Contents
Pension Plans and Postretirement Benefits
We sponsor various defined benefit pension and postretirement plans covering certain employees of our U.S. and international subsidiaries. We utilize actuarial valuations to calculate the cost and benefit obligations of our pension and postretirement benefits. The actuarial valuations utilize significant assumptions in the determination of our benefit cost and obligations, including assumptions regarding discount rates, expected returns on plan assets, mortality and health care cost trends. We determine our discount rate based on a review of published financial data and discussions with our actuary regarding rates of return on high-quality, fixed-income investments currently available and expected to be available during the period to maturity of our pension and postretirement plan obligations. The expected rate of return on plan assets assumption is based on capital market assumptions of the long-term expected returns for the investment mix of assets currently in the portfolio. The expected rate of return on plan assets is determined to be the weighted average of the nominal returns based on the weightings of the classes within the total asset portfolio. Expected health care cost trends represent expected annual rates of change in the cost of health care benefits and are estimated based on analysis of health care cost inflation. For the year ended December 31, 2014, we adjusted the mortality assumption for our domestic plans to reflect mortality improvements identified by the Society of Actuaries, adjusted for our experience.
The components of benefit cost related to service cost, interest cost, expected return on plan assets and prior service cost amortization are recorded on a quarterly basis based on actuarial assumptions. In the fourth quarter of each year or as interim remeasurements are required, we immediately recognize net actuarial gains and losses into earnings as a component of net periodic benefit cost. Recognized net actuarial gains and losses consist primarily of our reported actuarial gains and losses and the difference between the actual return on plan assets and the expected return on plan assets.
We recognize the funded status of each plan as either an asset or a liability in the combined balance sheets. The funded status is the difference between the fair value of plan assets and the present value of its benefit obligation, determined on a plan-by-plan basis. Our pension plan assets can include assets that are difficult to value. See Note 15 for a detailed description of our plan assets.
Research and Development
Our research and development activities are related to the development and improvement of new and existing products and equipment, as well as conceptual and engineering evaluation for translation into practical applications. We charge the costs of research and development unrelated to specific contracts as incurred. Research and development activities totaled $18.7 million, $22.9 million and $26.0 million in the years ended December 31, 2014, 2013 and 2012, respectively.
Income Taxes
Income tax expense for federal, foreign, state and local income taxes are calculated on pre-tax income based on current tax law and includes the cumulative effect of any changes in tax rates from those used previously in determining deferred tax assets and liabilities. We are included in the U.S. federal and certain state tax returns filed by the Company. We compute the provision for such income taxes on a separate tax return basis as if we filed our own tax returns. We deem the amounts that we would have paid or received from the Internal Revenue Service and certain state jurisdictions had we not been a member of the Company’s consolidated tax group to be immediately settled with the Company. We record a valuation allowance to reduce our deferred tax assets to the amount that is more likely than not to be realized. We assess deferred taxes and the adequacy of the valuation allowance on a quarterly basis. In the ordinary course of business there is inherent uncertainty in quantifying our income tax positions. We assess our income tax positions and record tax benefits for all years subject to examination based upon management’s evaluation of the facts, circumstances, and information available at the reporting date. For those tax positions where it is more likely than not that a tax benefit will be sustained, we have recorded the largest amount of tax benefit with a greater than 50% likelihood of being realized upon ultimate settlement with a taxing authority that has full knowledge of all relevant information. For those income tax positions where it is not more likely than not that a tax benefit will be sustained, no tax benefit has been recognized in the financial statements. We record interest and penalties (net of any applicable tax benefit) related to income taxes as a component of provision for income taxes on our combined statements of operations.
F-14
Table of Contents
Inventories
We carry our inventories at the lower of cost or market. We determine cost principally on the first-in, first-out basis, except for certain materials inventories for which we use the last-in, first-out (“LIFO”) method. We determined the cost of approximately 21% of our total inventories using the LIFO method at December 31, 2014 and 20% at December 31, 2013, and our total LIFO reserve at December 31, 2014 and 2013 was approximately $7.9 million and $7.7 million, respectively. Inventories are summarized below:
| December 31, | ||||||||
| 2014 |
2013 |
|||||||
| (In thousands) | ||||||||
| Raw Materials and Supplies |
$ | 72,910 | $ | 74,750 | ||||
| Work in Progress |
9,831 | 10,872 | ||||||
| Finished Goods |
17,276 | 16,731 | ||||||
|
|
||||||||
| Total Inventories |
$ | 100,017 | $ | 102,353 | ||||
Property, Plant and Equipment
We carry our property, plant and equipment at depreciated cost, less any impairment provisions.
We depreciate our property, plant and equipment using the straight-line method over estimated economic useful lives which typically range from three to twelve years for machinery and equipment and up to forty years for buildings. Our depreciation expense was $26.3 million, $25.2 million and $18.8 million for the years ended December 31, 2014, 2013 and 2012, respectively.
We expense the costs of maintenance, repairs and renewals that do not materially prolong the useful life of an asset as we incur them.
Property, plant and equipment is stated at cost and is set forth below:
| December 31, | ||||||||
| 2014 |
2013 | |||||||
| (In thousands) | ||||||||
| Land |
$ | 7,303 | $ | 3,977 | ||||
| Buildings |
131,365 | 138,407 | ||||||
| Machinery and equipment |
269,207 | 288,214 | ||||||
| Property under construction |
14,172 | 9,768 | ||||||
| 422,047 | 440,366 | |||||||
| Less accumulated depreciation |
263,089 | 277,302 | ||||||
| Net Property, Plant and Equipment |
$ | 158,958 | $ | 163,064 | ||||
Goodwill
Goodwill represents the excess of the cost of our acquired businesses over the fair value of the net assets acquired. We perform testing of goodwill for impairment annually. We may elect to perform a qualitative test when we believe that there is sufficient excess fair value over carrying value based on our most recent quantitative assessment, adjusted for relevant events and circumstances that could affect fair value during the current year. If we conclude based on this assessment that it is more likely than not that the reporting unit is not impaired, we do not perform a quantitative impairment test. In all other circumstances, we utilize a two-step quantitative impairment test to identify potential goodwill impairment and measure the amount of any goodwill impairment. The first step of the test compares the fair value of a reporting unit with its carrying amount, including goodwill. If the carrying amount of a reporting unit exceeds its fair value, the second step of the goodwill impairment test is performed to measure the amount of the impairment loss, if any. The second step compares the implied fair value of the reporting unit’s goodwill with the carrying amount of that goodwill.
F-15
Table of Contents
The following summarizes the changes in the carrying amount of goodwill:
| Global |
Global |
Industrial |
Nuclear Energy |
Total | ||||||||||||||||
| (In thousands) | ||||||||||||||||||||
| Balance at December 31, 2012 |
$ | 38,930 | $ | 64,772 | $ | - | $ | 10,055 | $ | 113,757 | ||||||||||
| Currency translation adjustments and other |
353 | 575 | - | - | 928 | |||||||||||||||
| Balance at December 31, 2013 |
$ | 39,283 | $ | 65,347 | $ | - | $ | 10,055 | $ | 114,685 | ||||||||||
| Acquisition of MEGTEC (Note 2) |
- | - | 108,800 | - | 108,800 | |||||||||||||||
| Currency translation adjustments and other |
(1,292 | ) | (2,861 | ) | - | - | (4,153 | ) | ||||||||||||
| Balance at December 31, 2014 |
$ | 37,991 | $ | 62,486 | $ | 108,800 | $ | 10,055 | $ | 219,332 | ||||||||||
Intangible Assets
Intangible assets are recognized at fair value when acquired. Intangible assets with definite lives are amortized to operating expense using the straight-line method over their estimated useful lives and tested for impairment when events or changes in circumstances indicate that its carrying amount may not be recoverable. Intangible assets with indefinite lives are not amortized and are subject to annual impairment testing. We test indefinite lived intangible assets for impairment by quantitatively determining the fair value of the indefinite lived intangible asset and comparing the fair value of the intangible assets to its carrying amount. If the carrying amount of the intangible assets exceeds its fair value, we recognize impairment for the amount of the difference. Our intangible assets are as follows:
| Year Ended December 31, | ||||||||||||
| 2014 |
2013 |
2012 |
||||||||||
| (In thousands) | ||||||||||||
| Amortized intangible assets: |
||||||||||||
| Gross cost: |
||||||||||||
| Customer relationships |
$ | 37,449 | $ | 15,293 | $ | 16,554 | ||||||
| Unpatented technology |
5,472 | 3,422 | 3,422 | |||||||||
| Patented technology |
2,521 | 2,521 | 2,521 | |||||||||
| Tradename |
10,657 | 4,285 | 4,285 | |||||||||
| Acquired backlog |
10,600 | - | 2,979 | |||||||||
| All other |
7,565 | 7,551 | 7,302 | |||||||||
| Total |
$ | 74,264 | $ | 33,072 | $ | 37,063 | ||||||
| Accumulated amortization: |
||||||||||||
| Customer relationships |
$ | (9,230 | ) | $ | (6,728 | ) | $ | (5,431 | ) | |||
| Unpatented technology |
(1,492 | ) | (1,685 | ) | (1,332 | ) | ||||||
| Patented technology |
(1,122 | ) | (806 | ) | (683 | ) | ||||||
| Tradename |
(2,439 | ) | (1,858 | ) | (1,488 | ) | ||||||
| Acquired backlog |
(5,300 | ) | - | (1,457 | ) | |||||||
| All other |
(4,360 | ) | (3,794 | ) | (3,855 | ) | ||||||
| Total |
$ | (23,943 | ) | $ | (14,871 | ) | $ | (14,246) | ||||
| Net amortized intangible assets |
$ | 50,321 | $ | 18,201 | $ | 22,817 | ||||||
| Unamortized intangible assets: |
||||||||||||
| Trademarks and trade names |
$ | 1,305 | $ | 1,305 | $ | 1,305 | ||||||
F-16
Table of Contents
The following summarizes the changes in the carrying amount of intangible assets:
| Year Ended December 31, | ||||||||||||
| 2014 |
2013 |
2012 |
||||||||||
| (In thousands) | ||||||||||||
| Balance at beginning of period |
$ | 19,506 | $ | 24,122 | $ | 33,511 | ||||||
| Business acquisitions and adjustments |
44,972 | - | (1,735) | |||||||||
| Amortization expense |
(10,160 | ) | (4,574 | ) | (5,044) | |||||||
| Impairment charge |
(1,730 | ) | (1,260 | ) | (3,216) | |||||||
| Currency translation adjustment and other |
(962 | ) | 1,218 | 606 | ||||||||
| Balance at end of period |
$ | 51,626 | $ | 19,506 | $ | 24,122 | ||||||
We recognized impairment charges totaling $1.7 million, $1.3 million and $3.2 million in the years ended December 31, 2014, 2013 and 2012, respectively, related to the cancellation of operations and maintenance services contracts and the sale of a subsidiary.
Estimated amortization expense for the next five fiscal years is as follows (in thousands):
| Year Ending December 31, |
Amount | |||
| 2015 |
$ | 11,741 | ||
| 2016 |
$ | 6,386 | ||
| 2017 |
$ | 6,293 | ||
| 2018 |
$ | 5,847 | ||
| 2019 |
$ | 5,699 | ||
Cash and Cash Equivalents and Restricted Cash
Our cash equivalents are highly liquid investments, with maturities of three months or less when we purchase them.
We record cash and cash equivalents as restricted when we are unable to freely use such cash and cash equivalents for our general operating purposes. At December 31, 2014, we had restricted cash and cash equivalents totaling $31.8 million, $3.7 million of which was held in restricted foreign cash accounts and $28.1 million of which was held to meet reinsurance reserve requirements of our captive insurer.
Derivative Financial Instruments
Our global operations give rise to exposure to market risks from changes in foreign currency exchange (“FX”) rates. We use derivative financial instruments, primarily FX forward contracts, to reduce the impact of changes in FX rates on our operating results. We use these instruments primarily to hedge our exposure associated with revenues or costs on our long-term contracts that are denominated in currencies other than our operating entities’ functional currencies. We do not hold or issue derivative financial instruments for trading or other speculative purposes.
We enter into derivative financial instruments primarily as hedges of certain firm purchase and sale commitments denominated in foreign currencies. We record these contracts at fair value on our combined balance sheets and defer the related gains and losses on these contracts in stockholders’ equity as a component of accumulated other comprehensive income until the hedged item is recognized in earnings. Any ineffective portion of a derivative’s change in fair value and any portion excluded from the assessment of effectiveness is immediately recognized in other – net on our combined statements of operations. The gain or loss on a derivative instrument not designated as a hedging instrument is also immediately recognized in earnings. Gains and losses on derivative financial instruments that require immediate recognition are included as a component of other – net in our combined statements of operations.
F-17
Table of Contents
Self-Insurance
We are self-insured primarily through a wholly owned insurance subsidiary of the Company that provides employer’s liability, general and automotive liability and workers’ compensation insurance and, from time to time, builder’s risk insurance (within certain limits) to our companies. Included in other liabilities on our combined balance sheets are reserves for self-insurance totaling $25.3 million and $29.3 million at December 31, 2014 and 2013, respectively. The reduction in 2014 was primarily attributable to a change in estimate based on historical loss experience recognized in cost of operations in our combined statements of operations.
Loss Contingencies
We estimate liabilities for loss contingencies when it is probable that a liability has been incurred and the amount of loss is reasonably estimable. We provide disclosure when there is a reasonable possibility that the ultimate loss will exceed the recorded provision or if such probable loss is not reasonably estimable. We are currently involved in some significant litigation, as discussed in Note 10. Our losses are typically resolved over long periods of time and are often difficult to assess and estimate due to, among other reasons, the possibility of multiple actions by third parties; the attribution of damages, if any, among multiple defendants; plaintiffs, in most cases involving personal injury claims, do not specify the amount of damages claimed; the discovery process may take multiple years to complete; during the litigation process, it is common to have multiple complex unresolved procedural and substantive issues; the potential availability of insurance and indemnity coverages; the wide-ranging outcomes reached in similar cases, including the variety of damages awarded; the likelihood of settlements for de minimus amounts prior to trial; the likelihood of success at trial; and the likelihood of success on appeal. Consequently, it is possible future earnings could be affected by changes in our assessments of the probability that a loss has been incurred in a material pending litigation against us and/or changes in our estimates related to such matters.
Stock-Based Compensation
We expense stock-based compensation in accordance with Financial Accounting Standards Board (“FASB”) Topic Compensation – Stock Compensation. Under this topic, the fair value of equity-classified awards, such as restricted stock, performance shares and stock options, is determined on the date of grant and is not remeasured. Grant date fair values for restricted stock, restricted stock units, performance shares and performance units are determined using the closing price of our common stock on the date of grant. Grant date fair values for stock options are determined using a Black-Scholes option-pricing model (“Black-Scholes”). For performance shares or units granted in the year ended December 31, 2014 that contain a Relative Total Shareholder Return vesting criteria, we utilize a Monte Carlo simulation to determine the grant date fair value, which determines the probability of satisfying the market condition included in the award. The determination of the fair value of a share-based payment award using an option-pricing model requires the input of significant assumptions, such as the expected life of the award and stock price volatility.
Under the provisions of this FASB topic, we recognize expense, net of an estimated forfeiture rate, for all share-based awards granted on a straight-line basis over the requisite service periods of the awards, which is generally equivalent to the vesting term. This topic requires compensation expense to be recognized, net of an estimate for forfeitures, such that compensation expense is recorded only for those awards expected to vest. We review the estimate for forfeitures periodically and record any adjustments deemed necessary for each reporting period. If our actual forfeiture rate is materially different from our estimate, the stock-based compensation expense could be significantly different from what we have recorded in the current period.
Additionally, this FASB topic amended FASB Topic Statement of Cash Flows to require excess tax benefits to be reported as a financing cash flow, rather than as a reduction of taxes paid. These excess tax benefits result from tax deductions in excess of the cumulative compensation expense recognized for options exercised and other equity-classified awards.
See Note 9 for a further discussion of stock-based compensation.
F-18
Table of Contents
New Accounting Standards
In May 2014, the FASB issued Revenue from Contracts with Customers, which supersedes the revenue recognition requirements in the Topic Revenue Recognition and most industry specific guidance. The core principle of this guidance is that an entity should recognize revenue to depict the transfer of promised goods or services to customers in an amount that reflects the consideration to which the entity expects to be entitled in exchange for those goods and services. This update is effective in 2017 and early adoption is not permitted. The update may be adopted either retrospectively to each prior period or as a cumulative-effect adjustment on the date of adoption. We are currently evaluating the impact of the adoption of this standard on our financial statements.
In August 2014, the FASB issued an update to the Topic Presentation of Financial Statements. This update requires an entity to evaluate whether there are conditions or events that raise substantial doubt about a company’s ability to continue as a going concern within one year from the date the financial statements are issued. If there is substantial doubt about an entity’s ability to continue as a going concern, certain disclosures are required. This update will be effective for us in 2017. We do not expect the adoption of this update to have a material impact on our financial statements.
NOTE 2 – BUSINESS ACQUISITIONS
MEGTEC Acquisition
On June 20, 2014, we acquired the outstanding stock of industrial processes solutions provider MEGTEC for $142.8 million, net of cash acquired. MEGTEC designs, engineers, manufactures and services air pollution control systems and coating/drying equipment for a variety of industrial applications and complements our environmental products and solutions offerings that serves utility markets.
The purchase price of the acquisition has been allocated among assets acquired and liabilities assumed at preliminary estimates of fair value based on information currently available with the excess purchase price recorded as goodwill. Our preliminary purchase price allocation, as follows, is subject to change upon receipt of additional information and completion of further analysis, including, but not limited to, finalization of long-lived and intangible asset valuations:
| MEGTEC | ||||
| (in thousands) |
||||
| Cash and cash equivalents |
$ | 14,232 | ||
| Accounts receivable |
23,054 | |||
| Inventories |
5,395 | |||
| Other current assets |
9,200 | |||
| Property, plant and equipment |
5,090 | |||
| Goodwill |
108,800 | |||
| Intangible assets |
44,250 | |||
| Total assets acquired |
$ | 210,021 | ||
| Accounts payable |
13,402 | |||
| Advance billings on contracts |
11,144 | |||
| Accrued liabilities – other |
18,089 | |||
| Pension liability |
5,041 | |||
| Deferred income taxes |
5,202 | |||
| Other liabilities |
130 | |||
| Total liabilities assumed |
$ | 53,008 | ||
| Net assets acquired |
$ | 157,013 | ||
| Cash and cash equivalents acquired |
14,232 | |||
| Net assets acquired, net of unrestricted cash acquired |
$ | 142,781 | ||
| Amount of tax deductible goodwill |
$ | 34,583 | ||
F-19
Table of Contents
The preliminary intangible assets included above consist of the following (dollar amounts in thousands):
| Amount | Amortization Period | |||||
| Customer relationships |
$ | 24,400 | 7 years | |||
| Backlog |
$ | 10,600 | 1 year | |||
| Trade names / trademarks |
$ | 6,000 | 15 years | |||
| Developed technology |
$ | 3,250 | 10 years | |||
Our combined financial statements for the year ended December 31, 2014 includes $105.4 million of revenues and $3.3 million of net income related to MEGTEC operations occurring from the acquisition date to December 31, 2014. Additionally, the following unaudited pro forma financial information presents our results of operations for the years ended December 31, 2014 and 2013 had the acquisition of MEGTEC occurred on January 1, 2013. The unaudited pro forma financial information below is not intended to represent or be indicative of our actual combined results had we completed the acquisition at January 1, 2013. This information is presented for comparative purposes only and should not be taken as representative of our future combined results of operations.
| Year Ended December 31, |
||||||||
| 2014 |
2013 |
|||||||
| Revenues |
$ | 1,670,051 | $ | 2,097,553 | ||||
| Net Income (Loss) Attributable to The Power Generation Operations of The Babcock & Wilcox Company |
$ | (19,442) | $ | 171,869 | ||||
The unaudited pro forma results include the following pre-tax adjustments to the historical results presented above:
| • | Increase (decrease) in amortization expense related to timing of amortization of the fair value of identifiable intangible assets acquired of approximately $(3.9) million and $12.6 million for the years ended December 31, 2014 and 2013, respectively. |
| • | Elimination of historical interest expense of approximately $0.9 million and $2.4 million for the years ended December 31, 2014 and 2013, respectively. |
| • | Elimination of $13.4 million in acquisition related costs recognized in the year ended December 31, 2014 that are not expected to be recurring. |
Ebensburg Acquisition
On May 21, 2014, we acquired the remaining outstanding interest in Ebensburg Power Company for a purchase price of $1.3 million. As part of the transaction, we acquired cash of $16.4 million and property, plant and equipment with a fair value of $16.1 million.
NOTE 3 – EQUITY METHOD INVESTMENTS
We have investments in entities that we account for using the equity method. The undistributed earnings of our equity method investees were $76.0 million and $98.3 million at December 31, 2014 and 2013, respectively.
F-20
Table of Contents
Summarized below is combined balance sheet and income statement information for investments accounted for under the equity method:
| December 31, | ||||||||
| 2014 |
2013 | |||||||
| (In thousands) | ||||||||
| Current assets |
$ | 528,950 | $ | 502,954 | ||||
| Noncurrent assets |
181,517 | 252,430 | ||||||
| Total Assets |
$ | 710,467 | $ | 755,384 | ||||
| Current liabilities |
$ | 403,484 | $ | 401,813 | ||||
| Noncurrent liabilities |
97,419 | 72,742 | ||||||
| Owners’ equity |
209,564 | 280,829 | ||||||
| Total Liabilities and Owners’ Equity |
$ | 710,467 | $ | 755,384 | ||||
| Year Ended December 31, | ||||||||||||
| 2014 |
2013 |
2012 | ||||||||||
| (In thousands) | ||||||||||||
| Revenues |
$ | 645,481 | $ | 592,755 | $ | 501,058 | ||||||
| Gross profit |
$ | 85,378 | $ | 97,226 | $ | 108,314 | ||||||
| Income before provision for income taxes |
$ | 22,909 | $ | 39,033 | $ | 42,625 | ||||||
| Provision for income taxes |
6,159 | 8,603 | 8,496 | |||||||||
| Net Income |
$ | 16,750 | $ | 30,430 | $ | 34,129 | ||||||
Our investment in equity method investees was $4.8 million more than our underlying equity in net assets of those investees based on stated ownership percentages at December 31, 2014. These differences were primarily related to the timing of distribution of dividends and various adjustments under GAAP.
The provision for income taxes is based on the tax laws and rates in the countries in which our investees operate. The taxation regimes vary not only by their nominal rates, but also by the allowability of deductions, credits and other benefits. For some of our U.S. investees, U.S. income taxes are the responsibility of the respective owners.
A reconciliation of net income per combined income statement information of our investees to equity in income of investees per our combined statements of operations follows:
| Year Ended December 31, | ||||||||||||
| 2014 |
2013 |
2012 | ||||||||||
| (In thousands) | ||||||||||||
| Equity income based on stated ownership percentages |
$ | 8,563 | $ | 15,280 | $ | 17,117 | ||||||
| All other adjustments due to amortization of basis differences, timing of GAAP adjustments and other adjustments |
118 | 3,107 | 285 | |||||||||
| Equity in income of investees |
$ | 8,681 | $ | 18,387 | $ | 17,402 | ||||||
Our transactions with unconsolidated affiliates were as follows:
| Year Ended December 31, | ||||||||||||
| 2014 |
2013 |
2012 |
||||||||||
| (In thousands) | ||||||||||||
| Sales to |
$ | 70,566 | $ | 70,793 | $ | 53,310 | ||||||
| Purchases from |
$ | 5,623 | $ | 4,646 | $ | 1,814 | ||||||
| Dividends received |
$ | 17,407 | $ | 20,382 | $ | 9,001 | ||||||
| Capital contributions, net of returns |
$ | 4,900 | $ | 6,884 | $ | 6,172 | ||||||
Our accounts receivable-other includes receivables from these unconsolidated affiliates of $7.0 million and $6.7 million at December 31, 2014 and 2013, respectively.
F-21
Table of Contents
NOTE 4 – SPECIAL CHARGES FOR RESTRUCTURING ACTIVITIES
Global Competitiveness Initiative
In the year ended December 31, 2013, the Company announced the Global Competitiveness Initiative (“GCI”) to enhance competitiveness, better position it for growth, and improve profitability. In conjunction with GCI, during the year ended December 31, 2014, we incurred $0.2 million of expenses related to employee termination benefits and $3.1 million of expenses related to facility consolidation. During the year ended December 31, 2013, we reduced our workforce and initiated other actions, resulting in $18.8 million of expenses related to employee termination benefits, $0.2 million of expenses related to consulting and GCI administrative costs, and $7.3 million of expenses related to facility consolidation.
Other Restructuring Actions
In the first quarter of 2014, we announced a margin improvement program aimed at structural changes in our operating model. In the year ended December 31, 2014, we incurred $26.7 million of expenses related to this project, including $12.8 million of expenses related to employee termination benefits, $3.1 million of expenses related to consulting and administrative costs and $10.8 million of expenses related to facility consolidation.
Restructuring Liabilities
An analysis of our restructuring liabilities for the years ended December 31, 2014 and 2013 follows:
| Year Ended December 31, | ||||||||
| 2014 |
2013 | |||||||
| (In thousands) | ||||||||
| Liability balance at the beginning of the period |
$ | 8,923 | $ | - | ||||
| Special charges for restructuring activities(1) |
19,911 | 22,897 | ||||||
| Payments |
(19,965 | ) | (13,974 | ) | ||||
| Translation and other |
(366 | ) | - | |||||
| Liability balance at the end of the period |
$ | 8,503 | $ | 8,923 | ||||
| (1) | Excludes non-cash charges related to fixed asset impairments and accelerated depreciation of $10.1 million and $3.4 million for the years ended December 31, 2014 and 2013, respectively, which did not impact the restructuring liability. |
At December 31, 2014, unpaid restructuring charges totaled $7.8 million for employee termination benefits and $0.7 million related to consulting and administrative costs.
NOTE 5 – INCOME TAXES
We are subject to U.S. federal income tax and income tax of multiple state and international jurisdictions. We are included in the U.S. federal and certain state tax returns filed by the Company. We compute the provision for such income taxes on a separate tax return basis as if we filed our own tax returns. We deem the amounts that we would have paid or received from the Internal Revenue Service and certain state jurisdictions had we not been a member of the Company’s consolidated tax group to be immediately settled with the Company. We provide for income taxes based on the tax laws and rates in the jurisdictions in which we conduct our operations. These jurisdictions may have regimes of taxation that vary with respect to nominal rates and with respect to the basis on which these rates are applied. This variation, along with the changes in our mix of income within these jurisdictions, can contribute to shifts in our effective tax rate from period to period.
The Statute of Limitations is closed for 2009 and prior U.S. federal income tax return years. We are currently under audit by various domestic and foreign taxing authorities. With few exceptions, we do not have any returns under examination for years prior to 2009.
F-22
Table of Contents
We apply the provisions of FASB Topic Income Taxes regarding the treatment of uncertain tax positions. A reconciliation of unrecognized tax benefits follows:
| Year Ended December 31, | ||||||||||||
| 2014 |
2013 |
2012 | ||||||||||
| (In thousands) | ||||||||||||
| Balance at beginning of period |
$ | 1,478 | $ | 1,492 | $ | 2,092 | ||||||
| Increases based on tax positions taken in the current year |
213 | - | 679 | |||||||||
| Increases based on tax positions taken in the prior years |
2,730 | 276 | 65 | |||||||||
| Decreases based on tax positions taken in the prior years |
(99 | ) | (290 | ) | - | |||||||
| Decreases due to settlements with tax authorities |
(350 | ) | - | (1,101 | ) | |||||||
| Decreases due to lapse of applicable statute of limitation |
- | - | (243 | ) | ||||||||
| Balance at end of period |
$ | 3,972 | $ | 1,478 | $ | 1,492 | ||||||
The $4.0 million balance of unrecognized tax benefits in other liabilities in our combined balance sheet at December 31, 2014 would reduce our effective tax rate if recognized.
We recognize interest and penalties related to unrecognized tax benefits in our provision for income taxes. During the year ended December 31, 2014, we recorded an increase in our accruals of $0.2 million, resulting in recorded liabilities of approximately $0.3 million for the payment of tax-related interest and penalties. At December 31, 2013 and 2012, our recorded liabilities for the payment of tax-related interest and penalties totaled approximately $0.1 million.
Deferred income taxes reflect the net tax effects of temporary differences between the financial and tax bases of assets and liabilities. Significant components of deferred tax assets and liabilities as of December 31, 2014 and 2013 were as follows:
| December 31, | ||||||||
| 2014 |
2013 | |||||||
| (In thousands) | ||||||||
| Deferred tax assets: |
||||||||
| Pension liability |
$ | 98,349 | $ | 59,190 | ||||
| Accrued warranty expense |
12,537 | 14,259 | ||||||
| Accrued vacation pay |
4,635 | 4,383 | ||||||
| Accrued liabilities for self-insurance (including postretirement health care benefits) |
17,979 | 17,535 | ||||||
| Accrued liabilities for executive and employee incentive compensation |
5,099 | 12,620 | ||||||
| Investments in joint ventures and affiliated companies |
7,472 | 4,667 | ||||||
| Long-term contracts |
6,622 | 10,521 | ||||||
| Foreign net operating loss carryforward |
13,931 | 12,539 | ||||||
| State tax net operating loss carryforward |
14,617 | 16,021 | ||||||
| Foreign tax credit carryforward |
2,959 | - | ||||||
| Other |
15,664 | 5,673 | ||||||
| Total deferred tax assets |
199,864 | 157,408 | ||||||
| Valuation allowance for deferred tax assets |
(9,216 | ) | (6,980 | ) | ||||
| Deferred tax assets |
190,648 | 150,428 | ||||||
| Deferred tax liabilities: |
||||||||
| Property, plant and equipment |
7,143 | 6,833 | ||||||
| Long-term contracts |
27,707 | 27,628 | ||||||
| Intangibles |
8,484 | 1,991 | ||||||
| Undistributed Foreign Earnings |
500 | 1,603 | ||||||
| Goodwill |
5,955 | 5,532 | ||||||
| Other |
3,345 | 3,146 | ||||||
| Total deferred tax liabilities |
53,134 | 46,733 | ||||||
| Net deferred tax assets |
$ | 137,514 | $ | 103,695 | ||||
F-23
Table of Contents
Income (loss) before provision for income taxes was as follows:
| Year Ended December 31, | ||||||||||||
| 2014 |
2013 |
2012 | ||||||||||
| (In thousands) | ||||||||||||
| U.S. |
$ | (64,084 | ) | $ | 135,967 | $ | 109,958 | |||||
| Other than U.S. |
8,392 | 121,054 | 95,259 | |||||||||
| Income (loss) before provision for (benefit from) income taxes |
$ | (55,692 | ) | $ | 257,021 | $ | 205,217 | |||||
The provision for income taxes consisted of:
| Year Ended December 31, | ||||||||||||
| 2014 |
2013 |
2012 |
||||||||||
| (In thousands) | ||||||||||||
| Current: |
||||||||||||
| U.S. – federal |
$ 1,834 | $ 21,956 | $ 5,913 | |||||||||
| U.S. – state and local |
1,544 | 3,053 | 1,344 | |||||||||
| Other than U.S. |
6,478 | 14,136 | 11,292 | |||||||||
| Total current |
9,856 | 39,145 | 18,549 | |||||||||
| Deferred: |
||||||||||||
| U.S. – Federal |
(32,910 | ) | 26,648 | 32,952 | ||||||||
| U.S. – State and local |
(572 | ) | 3,354 | 3,787 | ||||||||
| Other than U.S. |
(5,902 | ) | 13,059 | 9,035 | ||||||||
| Total deferred (benefit) provision |
(39,384 | ) | 43,061 | 45,774 | ||||||||
| Provision for (benefit from) income taxes |
$ (29,528 | ) | $ 82,206 | $ 64,323 | ||||||||
The following is a reconciliation of the U.S. statutory federal tax rate (35%) to the combined effective tax rate:
| Year Ended December 31, | ||||||||||||
| 2014 |
2013 |
2012 | ||||||||||
| U.S. federal statutory rate |
35.0 | % | 35.0 | % | 35.0 | % | ||||||
| State and local income taxes |
2.7 | 3.2 | 2.7 | |||||||||
| Foreign rate differential |
7.6 | (4.6 | ) | (5.6 | ) | |||||||
| Tax credits |
5.0 | (3.3 | ) | (3.4 | ) | |||||||
| Dividends and deemed dividends from affiliates |
3.8 | 2.7 | 2.7 | |||||||||
| Valuation allowances |
(4.0 | ) | (1.1 | ) | - | |||||||
| Uncertain tax positions |
(4.4 | ) | 0.1 | (0.5 | ) | |||||||
| Non-deductible expenses |
(1.6 | ) | 0.4 | 0.5 | ||||||||
| Manufacturing deduction |
7.6 | (0.3 | ) | (0.8 | ) | |||||||
| Other |
1.3 | (0.1 | ) | 0.7 | ||||||||
| Effective tax rate |
53.0 | % | 32.0 | % | 31.3 | % | ||||||
At December 31, 2014, we had a valuation allowance of $9.2 million for deferred tax assets, which we expect cannot be realized through carrybacks, future reversals of existing taxable temporary differences and our estimate of future taxable income. We believe that our remaining deferred tax assets are more likely than not realizable through carrybacks, future reversals of existing taxable temporary differences and our estimate of future taxable income. Any changes to our estimated valuation allowance could be material to our combined financial statements.
F-24
Table of Contents
The following is an analysis of our valuation allowance for deferred tax assets:
| Beginning Balance |
Charged to Costs and Expenses |
Charged to Other Accounts |
Deductions (Release of Allowance) |
Ending Balance |
||||||||||||||||
| (In thousands) | ||||||||||||||||||||
| Year Ended December 31, 2014 |
$ | (6,980 | ) | (2,236 | ) | - | - | $ | (9,216 | ) | ||||||||||
| Year Ended December 31, 2013 |
$ | (9,709 | ) | - | - | 2,729 | $ | (6,980 | ) | |||||||||||
| Year Ended December 31, 2012 |
$ | (9,744 | ) | - | - | 35 | $ | (9,709 | ) | |||||||||||
We have foreign net operating loss benefits of $11.1 million available to offset future taxable income in foreign jurisdictions. Of the foreign net operating loss benefits, $0.9 million is scheduled to expire in 2017 to 2033. The remaining net operating loss benefits have unlimited lives.
We have state net operating loss benefits of $14.6 million available to offset future taxable income in various states. Our state net operating loss carryforwards begin to expire in 2015. We are carrying a valuation allowance of $9.2 million against the deferred tax asset related to the state loss carryforwards.
We would be subject to withholding taxes if we were to distribute earnings from certain foreign subsidiaries. For the year ended December 31, 2014, the undistributed earnings of these subsidiaries were $347.1 million. Unrecognized deferred income tax liabilities, including withholding taxes, of approximately $44.1 million would be payable upon distribution of these earnings. We have provided tax of $0.6 million on earnings we intend to remit. All other earnings are considered permanently reinvested.
NOTE 6 – LONG-TERM DEBT AND NOTES PAYABLE
| December 31, | ||||||||
| 2014 |
2013 | |||||||
| (In thousands) | ||||||||
| Long-term debt consists of: |
||||||||
| Secured Debt: |
||||||||
| Various notes payable |
$ | - | $ | 444 | ||||
| Other |
- | 3 | ||||||
| - | 447 | |||||||
| Less: Amounts due within one year |
- | 222 | ||||||
| Long-term debt |
$ | - | $ | 225 | ||||
| Notes payable and current maturities of long-term debt consist of: |
||||||||
| Short-term lines of credit |
$ | 3,215 | $ | 4,449 | ||||
| Current maturities of long-term debt |
- | 222 | ||||||
| Total |
$ | 3,215 | $ | 4,671 | ||||
| Interest rate on short-term borrowing |
6.3 | % | 6.6 | % | ||||
Our short-term lines of credit represent borrowings by one of our subsidiaries. We have included this amount in notes payable and current maturities of long-term debt on our combined balance sheets. This facility is renewable annually and the interest rate associated with this line of credit was 6.3% per annum at December 31, 2014.
Credit Facility
On June 24, 2014, the Company entered into a Second Amended and Restated Credit Agreement (the “Credit Agreement”) with a syndicate of lenders and letter of credit issuers, and Bank of America, N.A., as administrative agent, which amended and restated the former credit agreement. The Credit Agreement provides for revolving credit borrowings and issuances of letters of credit in an aggregate amount of up to $1.0 billion and a term loan facility of up to $300 million. The Credit Agreement is scheduled to mature on June 24, 2019. The
F-25
Table of Contents
proceeds of the Credit Agreement are available to us for the issuance of letters of credit, working capital needs and other general corporate purposes. The Credit Agreement includes provisions that allow for additional financial institutions to become lenders, or for any existing lender to increase its commitment thereunder, subject to an aggregate maximum of $400 million for all incremental term loan, revolving credit borrowings and letter of credit commitments. Outstanding letters of credit issued under the Credit Agreement for us totaled $112.8 million at December 31, 2014.
The Credit Agreement is guaranteed by substantially all of the Company’s wholly owned domestic subsidiaries, including the wholly-owned domestic subsidiaries of B&W PGG. Obligations under the Credit Agreement are secured by first-priority liens on certain assets owned by the Company and certain of the guarantors (including the wholly-owned domestic subsidiaries of B&W PGG). If the corporate rating of the Company and its subsidiaries from Moody’s is Baa3 or better (with a stable outlook or better), the corporate family rating of the Company and its subsidiaries from Standard & Poor’s is BBB- or better (with a stable outlook or better), and other conditions are met, the liens securing obligations under the Credit Agreement will be released, subject to reinstatement upon the terms set forth in the Credit Agreement.
Other Arrangements
We have credit arrangements with various commercial banks and other financial institutions for the issuance of letters of credit and bank guarantees in association with contracting activity. The aggregate value of all such letters of credit and bank guarantees as of December 31, 2014 was $101.5 million.
The Company and certain of our subsidiaries have jointly executed general agreements of indemnity in favor of surety underwriters relating to surety bonds those underwriters issue in support of some of our contracting activity. As of December 31, 2014, bonds issued and outstanding under these arrangements in support of our contracts totaled approximately $435.3 million.
NOTE 7 – PENSION PLANS AND POSTRETIREMENT BENEFITS
We have historically provided defined benefit retirement benefits to domestic employees under the Retirement Plan for Employees of Babcock & Wilcox Commercial Operations (the “Company Plan”), a noncontributory plan. As of 2006, the Company Plan was closed to new salaried plan entrants. In October 2012, we notified employees that, effective December 31, 2015, benefit accruals for those salaried employees covered by, and continuing to accrue service and salary adjusted benefits under the Company Plan will cease. Furthermore, effective January 1, 2016, we will make service-based, cash contributions to a defined contribution plan for those employees impacted by the plan freeze.
Effective January 1, 2012, a defined contribution component was adopted applicable to Babcock & Wilcox Canada, Ltd. (the “Canadian Plans”). Any employee with less than two years of continuous service as of December 31, 2011 was required to enroll in the defined contribution component of the Canadian Plans as of January 1, 2012 or upon completion of the six months of continuous service, whichever is later. These and future employees will not be eligible to enroll in the defined benefit component of the Canadian Plans. Additionally, during the third quarter of 2014, benefit accruals under certain hourly Canadian pension plans were ceased with an effective date of January 1, 2015. This amendment to the Canada Plans is reflected as a curtailment in 2014.
We do not provide retirement benefits to certain non-resident alien employees of foreign subsidiaries. Retirement benefits for salaried employees who accrue benefits in a defined benefit plan are based on final average compensation and years of service, while benefits for hourly paid employees are based on a flat benefit rate and years of service. Our funding policy is to fund the plans as recommended by the respective plan actuaries and in accordance with the Employee Retirement Income Security Act of 1974, as amended, or other applicable law. Funding provisions under the Pension Protection Act accelerate funding requirements to ensure full funding of benefits accrued.
We make available other benefits which include postretirement health care and life insurance benefits to certain salaried and union retirees based on their union contracts, and on a limited basis, to future retirees.
F-26
Table of Contents
Obligations and Funded Status
| Pension Benefits Year Ended December 31, |
Other Benefits Year Ended December 31, | |||||||||||||||
| 2014 |
2013 |
2014 |
2013 | |||||||||||||
| (In thousands) | ||||||||||||||||
| Change in benefit obligation: |
||||||||||||||||
| Benefit obligation at beginning of period |
$ | 1,295,228 | $ | 1,419,185 | $ | 42,349 | $ | 50,782 | ||||||||
| Service cost |
18,630 | 23,597 | 244 | 284 | ||||||||||||
| Interest cost |
59,755 | 56,811 | 1,357 | 1,342 | ||||||||||||
| Plan participants’ contributions |
175 | 188 | 777 | 551 | ||||||||||||
| Curtailments |
772 | - | - | - | ||||||||||||
| Amendments |
(1,048 | ) | - | - | - | |||||||||||
| Settlements |
(23,339 | ) | (21,862 | ) | - | - | ||||||||||
| Acquisitions / transfers |
4,426 | 6,516 | - | - | ||||||||||||
| Actuarial loss (gain) |
178,196 | (103,277 | ) | 2,248 | (4,101 | ) | ||||||||||
| Foreign currency exchange rate changes |
(20,709 | ) | (17,465 | ) | (691 | ) | (655 | ) | ||||||||
| Benefits paid |
(74,952 | ) | (68,465 | ) | (4,894 | ) | (5,854 | ) | ||||||||
| Benefit obligation at end of period |
$ | 1,437,134 | $ | 1,295,228 | $ | 41,390 | $ | 42,349 | ||||||||
| Change in plan assets: |
||||||||||||||||
| Fair value of plan assets at beginning of period |
$ | 1,125,412 | $ | 1,092,124 | $ | - | $ | - | ||||||||
| Actual return on plan assets |
145,867 | 84,536 | - | - | ||||||||||||
| Plan participants’ contributions |
175 | 188 | 777 | 551 | ||||||||||||
| Contributions |
22,861 | 48,253 | 4,117 | 5,303 | ||||||||||||
| Settlements |
(23,339 | ) | (21,862 | ) | - | - | ||||||||||
| Transfers |
(178 | ) | 4,899 | - | - | |||||||||||
| Foreign currency exchange rate changes |
(19,183 | ) | (14,261 | ) | - | - | ||||||||||
| Benefits paid |
(74,952 | ) | (68,465 | ) | (4,894 | ) | (5,854 | ) | ||||||||
| Fair value of plan assets at the end of period |
1,176,663 | 1,125,412 | - | - | ||||||||||||
| Funded status |
$ | (260,471 | ) | $ | (169,816 | ) | $ | (41,390 | ) | $ | (42,349 | ) | ||||
| Amounts recognized in the balance sheet consist of: |
|
|||||||||||||||
| Accrued employee benefits |
$ | (1,450 | ) | $ | (1,277 | ) | $ | (5,208 | ) | $ | (6,681 | ) | ||||
| Accumulated postretirement benefit obligation |
- | - | (36,182 | ) | (35,668 | ) | ||||||||||
| Pension liability |
(260,704 | ) | (168,696 | ) | - | - | ||||||||||
| Prepaid pension |
1,683 | 157 | - | - | ||||||||||||
| Accrued benefit liability, net |
$ | (260,471 | ) | $ | (169,816 | ) | $ | (41,390 | ) | $ | (42,349 | ) | ||||
| Amount recognized in accumulated comprehensive income (before taxes): |
|
|||||||||||||||
| Prior service cost |
$ | 2,212 | $ | 5,803 | $ | 57 | $ | 117 | ||||||||
| Supplemental information: |
||||||||||||||||
| Plans with accumulated benefit obligation in excess of plan assets |
|
|||||||||||||||
| Projected benefit obligation |
$ | 1,317,199 | $ | 1,158,502 | $ | - | $ | - | ||||||||
| Accumulated benefit obligation |
$ | 1,309,270 | $ | 1,147,122 | $ | 41,390 | $ | 42,349 | ||||||||
| Fair value of plan assets |
$ | 1,055,044 | $ | 991,596 | $ | - | $ | - | ||||||||
| Plans with plan assets in excess of accumulated benefit obligation |
|
|||||||||||||||
| Projected benefit obligation |
$ | 119,935 | $ | 136,726 | $ | - | $ | - | ||||||||
| Accumulated benefit obligation |
$ | 117,503 | $ | 132,221 | $ | - | $ | - | ||||||||
| Fair value of plan assets |
$ | 121,619 | $ | 133,816 | $ | - | $ | - | ||||||||
F-27
Table of Contents
| Pension Benefits Year Ended December 31, |
Other Benefits Year Ended December 31, | |||||||||||||||||||||||
| 2014 |
2013 |
2012 |
2014 |
2013 |
2012 | |||||||||||||||||||
| (In thousands) | ||||||||||||||||||||||||
| Components of net periodic benefit cost: |
||||||||||||||||||||||||
| Service cost |
$ | 18,630 | $ | 23,597 | $ | 23,629 | $ | 244 | $ | 284 | $ | 332 | ||||||||||||
| Interest cost |
59,755 | 56,811 | 62,528 | 1,357 | 1,342 | 1,871 | ||||||||||||||||||
| Expected return on plan assets |
(74,266 | ) | (74,888 | ) | (69,014 | ) | - | - | - | |||||||||||||||
| Amortization of prior service cost |
872 | 1,036 | 1,657 | 60 | 74 | 76 | ||||||||||||||||||
| Recognized net actuarial loss (gain) |
108,854 | (111,105 | ) | 9,865 | 2,247 | (4,101 | ) | 2,780 | ||||||||||||||||
| Net periodic benefit cost (income) |
$ | 113,845 | $ | (104,549 | ) | $ | 28,665 | $ | 3,908 | $ | (2,401 | ) | $ | 5,059 | ||||||||||
Recognized net actuarial loss (gain) consists primarily of our reported actuarial loss (gain), curtailments, and the difference between the actual return on plan assets and the expected return on plan assets. Additionally, we adjusted our mortality assumption in the year ended December 31, 2014, resulting in a $46.9 million increase in our pension liability. As disclosed in Note 16, we have excluded the recognized net actuarial loss (gain) from our reportable segments and such amount has been reflected in Note 16 as the Mark to Market Adjustment in the reconciliation of reportable segment income to combined operating income. The recognized net actuarial loss (gain) and the affected combined statements of operations line items are as follows:
| Year Ended December 31, | ||||||||||||
| 2014 |
2013 |
2012 | ||||||||||
| (In thousands) | ||||||||||||
| Cost of operations |
$ | 98,542 | $ | (94,099) | $ | 6,087 | ||||||
| Selling, general and administrative expenses |
12,508 | (21,043) | 6,598 | |||||||||
| Other – net |
51 | (64) | (40 | ) | ||||||||
| Total |
$ | 111,101 | $ | (115,206) | $ | 12,645 | ||||||
Additional Information
In the current fiscal year, we have recognized expense (income) in other comprehensive income as components of net periodic benefit cost approximately $0.9 million and $0.1 million for our pension benefits and other benefits, respectively. In the next fiscal year, we expect to recognize expense (income) in other comprehensive income as components of net periodic benefit cost approximately $0.4 million and $0.1 million for our pension benefits and other benefits, respectively.
Assumptions
| Pension Benefits | Other Benefits | |||||||||||||||
| 2014 |
2013 |
2014 |
2013 |
|||||||||||||
| Weighted average assumptions used to determine net periodic benefit obligations at December 31: |
||||||||||||||||
| Discount rate |
3.96% | 4.79% | 3.45% | 3.63% | ||||||||||||
| Rate of compensation increase |
2.63% | 2.62% | - | - | ||||||||||||
| Weighted average assumptions used to determine net periodic benefit cost for the years ended December 31: |
||||||||||||||||
| Discount rate |
4.79% | 4.08% | 3.63% | 2.95% | ||||||||||||
| Expected return on plan assets |
6.82% | 6.92% | - | - | ||||||||||||
| Rate of compensation increase |
2.62% | 2.64% | - | - | ||||||||||||
The expected rate of return on plan assets assumption is based on the long-term expected returns for the investment mix of assets currently in the portfolio. In setting this rate, we use a building-block approach. Historic real return trends for the various asset classes in the plan’s portfolio are combined with anticipated future market conditions to estimate the real rate of return for each class. These rates are then adjusted for anticipated future
F-28
Table of Contents
inflation to determine estimated nominal rates of return for each class. The expected rate of return on plan assets is determined to be the weighted average of the nominal returns based on the weightings of the classes within the total asset portfolio. We are using an expected return on plan assets assumption of 7.2% for the majority of our existing pension plan assets (approximately 80% of our total pension assets at December 31, 2014). As of December 31, 2014, our existing other benefit plans are unfunded.
| 2014 |
2013 |
|||||||
| Assumed health-care cost trend rates at December 31 |
||||||||
| Health-care cost trend rate assumed for next year |
7.5% | 8.0% | ||||||
| Rates to which the cost trend rate is assumed to decline (ultimate trend rate) |
4.5% | 4.5% | ||||||
| Year that the rate reaches ultimate trend rate |
2021 | 2021 | ||||||
Assumed health-care cost trend rates have a significant effect on the amounts we report for our health-care plan. A one-percentage-point change in our assumed health-care cost trend rates would have the following effects:
| One-Percentage- Point Increase |
One-Percentage- Point Decrease |
|||||||
| (In thousands) | ||||||||
| Effect on total of service and interest cost |
$ | 66 | $ | (57) | ||||
| Effect on postretirement benefit obligation |
$ | 974 | $ | (916) | ||||
Investment Goals
General
The overall investment strategy of the pension trusts is to achieve long-term growth of principal, while avoiding excessive risk and to minimize the probability of loss of principal over the long term. The specific investment goals that have been set for the pension trusts in the aggregate are (1) to ensure that plan liabilities are met when due and (2) to achieve an investment return on trust assets consistent with a reasonable level of risk.
Allocations to each asset class for both domestic and foreign plans are reviewed periodically and rebalanced, if appropriate, to assure the continued relevance of the goals, objectives and strategies. The pension trusts for both our domestic and foreign plans employ a professional investment advisor and a number of professional investment managers whose individual benchmarks are, in the aggregate, consistent with the plan’s overall investment objectives. The goals of each investment manager are (1) to meet (in the case of passive accounts) or exceed (for actively managed accounts) the benchmark selected and agreed upon by the manager and the trust and (2) to display an overall level of risk in its portfolio that is consistent with the risk associated with the agreed upon benchmark.
The investment performance of total portfolios, as well as asset class components, is periodically measured against commonly accepted benchmarks, including the individual investment manager benchmarks. In evaluating investment manager performance, consideration is also given to personnel, strategy, research capabilities, organizational and business matters, adherence to discipline and other qualitative factors that may impact the ability to achieve desired investment results.
Domestic Plans
We sponsor the Retirement Plan for Employees of Babcock & Wilcox Commercial Operations domestic defined benefit plan. The assets of this plan are commingled for investment purposes with the Company’s other sponsored domestic defined benefit plans and held by the Trustee in The Babcock & Wilcox Company Master Trust (the “Master Trust”). For the years ended December 31, 2014 and 2013, the investment return on domestic plan assets of the Master Trust (net of deductions for management fees) was approximately 14% and 7%, respectively.
F-29
Table of Contents
The following is a summary of the asset allocations for the Master Trust at December 31, 2014 and 2013 by asset category:
| 2014 |
2013 | |||||||
| Asset Category: |
||||||||
| Fixed Income (excluding U. S. Government Securities) |
38% | 30% | ||||||
| Commingled and Mutual Funds |
33% | 36% | ||||||
| U.S. Government Securities |
15% | 18% | ||||||
| Equity Securities |
7% | 7% | ||||||
| Partnerships with Security Holdings |
5% | 6% | ||||||
| Real Estate |
1% | 1% | ||||||
| Other |
1% | 2% | ||||||
| Total |
100% | 100% | ||||||
The target allocation for 2015 for the domestic plans, by asset class, is as follows:
| Asset Class: |
||||
| Fixed Income |
55% | |||
| Equities |
45% |
Foreign Plans
We sponsor various plans through certain of our foreign subsidiaries. These plans are the Canadian Plans and the Diamond Power Specialty Limited Retirement Benefits Plan (the “Diamond UK Plan”).
The weighted average asset allocation of this plan at December 31, 2014 and 2013 by asset category was as follows:
| 2014 |
2013 | |||||||
| Asset Category: |
||||||||
| Equity Securities and Commingled Mutual Funds |
55% | 58% | ||||||
| Fixed Income |
43% | 39% | ||||||
| Other |
2% | 3% | ||||||
| Total |
100% | 100% | ||||||
The target allocation for 2015 for the foreign plans, by asset class, is as follows:
| Canadian Plans |
Diamond UK Plan |
|||||||
| Asset Class: |
||||||||
| U. S. Equity |
17% | 12% | ||||||
| Global Equity |
38% | 15% | ||||||
| Fixed Income |
45% | 73% | ||||||
F-30
Table of Contents
Fair Value
See Note 15 for a detailed description of fair value measurements and the hierarchy established for valuation inputs. The following is a summary of total investments for our plans measured at fair value at December 31, 2014:
| 12/31/14 |
Level 1 |
Level 2 |
Level 3 | |||||||||||||
| (In thousands) | ||||||||||||||||
| Pension and Other Benefits: |
||||||||||||||||
| Fixed Income |
$ | 454,743 | $ | - | $ | 454,743 | $ | - | ||||||||
| Equities |
63,109 | 63,109 | - | - | ||||||||||||
| Commingled and Mutual Funds |
438,054 | 4,665 | 433,389 | - | ||||||||||||
| U.S. Government Securities |
144,609 | 137,783 | 6,826 | - | ||||||||||||
| Partnerships with Security Holdings |
49,884 | - | - | 49,884 | ||||||||||||
| Real Estate |
2,177 | - | - | 2,177 | ||||||||||||
| Cash and Accrued Items |
24,087 | 19,295 | 4,792 | - | ||||||||||||
| Total Assets |
$ | 1,176,663 | $ | 224,852 | $ | 899,750 | $ | 52,061 | ||||||||
The following is a summary of total investments for our plans measured at fair value at December 31, 2013:
| 12/31/13 |
Level 1 |
Level 2 |
Level 3 |
|||||||||||||
| (In thousands) | ||||||||||||||||
| Pension and Other Benefits: |
||||||||||||||||
| Fixed Income |
$ | 360,807 | $ | - | $ | 360,807 | $ | - | ||||||||
| Equities |
65,695 | 65,695 | - | - | ||||||||||||
| Commingled and Mutual Funds |
456,535 | 4,221 | 452,314 | - | ||||||||||||
| U.S. Government Securities |
161,567 | 161,567 | - | - | ||||||||||||
| Partnerships with Security Holdings |
53,510 | - | - | 53,510 | ||||||||||||
| Real Estate |
2,847 | - | - | 2,847 | ||||||||||||
| Cash and Accrued Items |
24,451 | 16,373 | 8,078 | - | ||||||||||||
| Total Assets |
$ | 1,125,412 | $ | 247,856 | $ | 821,199 | $ | 56,357 | ||||||||
The following is a summary of the changes in the Plans’ Level 3 instruments measured on a recurring basis for the years ended December 31, 2014 and 2013:
| Year ended December 31, | ||||||||
| 2014 |
2013 | |||||||
| (In thousands) | ||||||||
| Balance at beginning of period |
$ | 56,357 | $ | 58,229 | ||||
| Issuances and acquisitions |
4,634 | 2,737 | ||||||
| Dispositions |
(16,629) | (13,837) | ||||||
| Realized gain |
11,210 | 8,279 | ||||||
| Unrealized gain |
(3,511) | 949 | ||||||
| Balance at end of period |
$ | 52,061 | $ | 56,357 | ||||
Our Level 3 instruments include assets with no market price but rather calculations of net asset values per share or its equivalent. When appropriate, we adjust these net asset values for contributions and distributions, if any, made during the period beginning on the latest net asset value valuation date and ending on our measurement date. We also consider available market data, relevant index returns, preliminary estimates from our investees and other data obtained through research and consultation with third party advisors in determining the fair value of our Level 3 instruments.
F-31
Table of Contents
Cash Flows
| Domestic Plans | Foreign Plans | |||||||||||||||
| Pension |
Other |
Pension |
Other Benefits |
|||||||||||||
| (In thousands) | ||||||||||||||||
| Expected employer contributions to trusts of defined benefit plans: |
||||||||||||||||
| 2015 |
$ | - | N/A | $ | 14,408 | N/A | ||||||||||
| Expected benefit payments: |
||||||||||||||||
| 2015 |
$ | 63,637 | $ | 4,774 | $ | 10,538 | $ | 513 | ||||||||
| 2016 |
65,936 | 4,348 | 10,832 | 501 | ||||||||||||
| 2017 |
68,002 | 4,053 | 11,144 | 519 | ||||||||||||
| 2018 |
69,751 | 3,768 | 11,536 | 544 | ||||||||||||
| 2019 |
71,070 | 3,465 | 11,909 | 545 | ||||||||||||
| 2020-2024 |
365,021 | 11,831 | 64,854 | 2,873 | ||||||||||||
Defined Contribution Plans
Our employees participate in the Babcock & Wilcox Company Supplemental Executive Retirement Plan (the “SERP Plan”), which is a defined contribution plan. We recorded expense related to the SERP Plan of approximately $0.1 million, $0.2 million and $0.2 million in the years ended December 31, 2014, 2013 and 2012, respectively.
Our employees also participate in The Babcock & Wilcox Company Thrift Plan (the “Thrift Plan”), which generally provides for matching employer contributions of 50% of participants’ contributions up to 6% of compensation. These matching employer contributions are typically made in shares of Company common stock. We also provide service-based cash contributions under the Thrift Plan to employees not accruing benefits under our defined benefit plans. Amounts charged to expense for employer contributions under the Thrift Plan totaled approximately $7.4 million, $7.5 million and $7.9 million in the years ended December 31, 2014, 2013 and 2012, respectively.
Effective January 1, 2012, a defined contribution component was added to those Canadian Plans previously offering defined benefits to salaried employees. As of January 1, 2012, we made cash, service-based contributions under this arrangement. The amount charged to expense for employer contributions was approximately $0.6 million, $0.6 million and $0.5 million in the years ended December 31, 2014, 2013 and 2012, respectively.
Multiemployer Plans
One of our domestic subsidiaries contributes to various multiemployer plans. The plans generally provide defined benefits to substantially all unionized workers in this subsidiary.
The following table summarizes our contributions to multiemployer plans for the years covered by this report:
| Pension Zone Status |
FIP/RP Status Pending/ Implemented |
Contributions | Surcharge Imposed |
Expiration Bargaining Agreement | ||||||||||||||||||||
| 2014 |
2013 |
2012 |
||||||||||||||||||||||
| Pension Fund | EIN/PIN | 2013 | 2012 | (in millions) | ||||||||||||||||||||
| Boilermaker-Blacksmith National |
48-6168020/ 001 |
Yellow | Yellow | Yes | $ 16.0 | $ 19.0 | $ 18.9 | No | Described Below | |||||||||||||||
| All Other |
4.6 | 11.9 | 5.3 | |||||||||||||||||||||
|
|
|
|||||||||||||||||||||||
| $ 20.6 | $ 30.9 | $ 24.2 | ||||||||||||||||||||||
|
|
|
|||||||||||||||||||||||
F-32
Table of Contents
The Boilermaker-Blacksmith National Pension Trust (the “Boilermaker Plan”) is, by plan, the only significant contribution of our total contributions to these funds. Our collective bargaining agreements with the Boilermaker Plan are under a National Maintenance Agreement platform which is evergreen in terms of expiration. However, the agreement allows for termination by either party with a 90-day written notice. Our contributions to the Boilermaker Plan constitute less than 5% of total contributions to the plan. All other contributions expense for all periods included in this report represents multiple amounts to various plans that, individually, are deemed to be insignificant.
NOTE 8 – RELATED PARTY TRANSACTIONS
We are a party to transactions with subsidiaries, divisions and controlled joint ventures of the Company and other Company subsidiaries in the normal course of operations. These transactions include the following:
| Year Ended December 31, | ||||||||||||
| 2014 |
2013 |
2012 |
||||||||||
| (In thousands) | ||||||||||||
| Sales |
$ | 5,586 | $ | 36,876 | $ | 6,974 | ||||||
| Corporate administrative expense |
$ | 73,329 | $ | 76,739 | $ | 77,837 | ||||||
Guarantees
As of December 31, 2014, the Company has outstanding performance guarantees for various projects executed by us. These projects are all in the normal course of business. These guarantees total $2,421.4 million and range in expiration dates from 2015 to 2040. The master separation agreement requires that we and the Company use our commercially reasonable efforts to terminate all existing guarantees by one party of obligations relating to the business of the other party, including financial, performance and other guarantee obligations.
Investments
In the year ended December 31, 2012, the Company implemented an amended policy of managing and pooling cash for its domestic subsidiaries. As a result of this policy, $152.6 million of investments previously held by us were transferred to the Company.
Net Transfers to Parent
Net transfers (to) from parent represents the change in the Company’s historical investment in us. It primarily includes the net effect of cost allocations from transactions with the Company, sales to the Company and net transfers of cash and assets to the Company, as follows:
| Year Ended December 31, | ||||||||||||
| 2014 |
2013 |
2012 |
||||||||||
| (In thousands) | ||||||||||||
| Sales to the Company |
$ (5,586 | ) | $ (36,876 | ) | $ (6,974 | ) | ||||||
| Corporate administrative expense |
73,329 | 76,739 | 77,837 | |||||||||
| Income tax allocation |
3,378 | 21,956 | 5,913 | |||||||||
| Acquisition of business, net of cash acquired |
127,704 | - | - | |||||||||
| Transfer of investments to the Company |
- | - | (152,563 | ) | ||||||||
| Cash pooling and general financing activities |
14,261 | (14,538 | ) | (259,218 | ) | |||||||
|
|
||||||||||||
| Net transfers (to) from Parent |
$ 213,086 | $ 47,281 | $ (335,005 | ) | ||||||||
|
|
||||||||||||
NOTE 9 – STOCK-BASED COMPENSATION
At December 31, 2014, certain of our officers and employees participated in benefits plans of the Company, which involve the issuance of Company common stock as described below.
2010 Long-Term Incentive Plan of The Babcock & Wilcox Company
The Company established the 2010 Long-Term Incentive Plan of The Babcock & Wilcox Company (the “Plan”) allowing members of the Board of Directors, executive officers, key employees and consultants eligibility to
F-33
Table of Contents
participate in the Plan. The Compensation Committee of the Company’s Board of Directors selects the participants for the Plan. The Plan provides for a number of forms of stock-based compensation, including incentive and non-qualified stock options, restricted stock, restricted stock units, performance shares and performance units, subject to satisfaction of specific performance goals. Options to purchase shares are granted at not less than 100% of the fair market value closing price on the date of grant, become exercisable at such time or times as determined when granted and expire not more than seven years after the date of grant.
In the event of a change in control of the Company, the terms of the awards under the Plan contain provisions that may cause restrictions to lapse and accelerate the exercisability of outstanding options.
The total stock-based compensation expense for the years ended December 31, 2014, 2013 and 2012 totaled $1.5 million, $2.6 million and $3.8 million, respectively, with associated tax benefit for the years ended December 31, 2014, 2013 and 2012 totaling $0.5 million, $1.0 million and $1.4 million, respectively.
At December 31, 2014, total unrecognized estimated compensation expense related to nonvested awards was $3.1 million, net of estimated tax benefits of $1.9 million. The total gross unrecognized estimated compensation expense of $5.0 million is expected to be recognized over a weighted-average period of 1.9 years.
Company Stock Options
The fair value of each option grant was estimated at the date of grant using Black-Scholes, with the following weighted-average assumptions:
| Year Ended December 31, |
||||||||||||
| 2014 |
2013 |
2012 |
||||||||||
| Risk-free interest rate |
0.97% | 0.56% | 0.65% | |||||||||
| Expected volatility |
.30 | .33 | .36 | |||||||||
| Expected life of the option in years |
3.76 | 3.93 | 3.98 | |||||||||
| Expected dividend yield |
1.22% | 1.19% | 0% | |||||||||
The risk-free interest rate is based on the implied yield on a U.S. Treasury zero-coupon issue with a remaining term equal to the expected life of the option. The expected volatility is based on implied volatility from publicly traded options on Company common stock, historical volatility of the price of Company common stock and other factors. The expected life of the option is based on observed historical patterns. The expected dividend yield is based on the projected annual dividend payment per share divided by the stock price at the date of grant. This amount was zero prior to 2013 because the Company did not expect to pay dividends at the grant dates for those stock options awarded.
The following table summarizes the stock option activity for the year ended December 31, 2014 (share data in thousands):
| Number of Shares |
Weighted- Average |
Weighted- Average Remaining Contractual Term |
Aggregate (in millions) |
|||||||||||||
| Outstanding at beginning of period |
401 | $ 26.39 | ||||||||||||||
| Transferred |
(8 | ) | 28.20 | |||||||||||||
| Granted |
206 | 32.66 | ||||||||||||||
| Exercised |
(73 | ) | 20.82 | |||||||||||||
| Cancelled/expired/forfeited |
(13 | ) | 30.91 | |||||||||||||
| Outstanding at end of period |
513 | $ 29.55 | 4.9 Years | $ 1.2 | ||||||||||||
| Exercisable at end of period |
198 | $ 28.05 | 3.4 Years | $ 0.8 | ||||||||||||
F-34
Table of Contents
The aggregate intrinsic value included in the table above represents the total pretax intrinsic value that would have been received by the option holders had all option holders exercised their options on December 31, 2014. The intrinsic value is calculated as the total number of option shares multiplied by the difference between the closing price of Company common stock on the last trading day of the period and the exercise price of the options. This amount changes based on the price of Company common stock.
The weighted-average fair value of the stock options granted in the years ended December 31, 2014, 2013 and 2012 was $7.03, $6.07 and $7.57, respectively.
During the years ended December 31, 2014, 2013 and 2012, the total intrinsic value of stock options exercised was $0.9 million, $1.0 million and $0.7 million, respectively. The actual tax benefits realized related to the stock options exercised during the year ended December 31, 2014 were $0.3 million.
Company Performance Shares
Nonvested performance shares as of December 31, 2014 and changes during the year ended December 31, 2014 were as follows (share data in thousands):
| Number of Shares |
Weighted- Average Grant Date Fair Value |
|||||||
| Nonvested at beginning of period |
164 | $ | 30.23 | |||||
| Adjustment to assumed vesting percentage |
(60 | ) | 29.42 | |||||
| Transferred |
(4 | ) | 28.80 | |||||
| Granted |
74 | 32.66 | ||||||
| Vested |
(57 | ) | 34.45 | |||||
| Cancelled/forfeited |
(6 | ) | 28.82 | |||||
| Nonvested at end of period |
111 | $ | 30.64 | |||||
For performance shares granted prior to 2014, the actual number of shares in which each participant vests is dependent upon achievement of certain Return on Invested Capital and Diluted Earnings Per Share targets over three-year performance periods. With respect to performance shares granted during 2014, the actual number of shares in which each participant vests is dependent upon those same targets as well as an additional Relative Total Shareholder Return target comparing B&W stock price performance to that of a custom peer group, over a three-year performance period. The number of shares in which participants can vest ranges from zero to 200% of the initial performance shares granted, to be determined upon completion of the three-year performance period. The nonvested shares at the end of the period in the table above assumes weighted-average vesting of 58%.
The actual tax benefits realized related to the performance shares vested during the year ended December 31, 2014 were $0.7 million.
Company Restricted Stock Units
Nonvested Company restricted stock units as of December 31, 2014 and changes during the year ended December 31, 2014 were as follows (share data in thousands):
| Number of Shares |
Weighted- Average Grant Date Fair Value |
|||||||
| Nonvested at beginning of period |
54 | $ | 27.43 | |||||
| Transferred |
(1 | ) | 27.77 | |||||
| Granted |
38 | 32.66 | ||||||
| Vested |
(25 | ) | 28.19 | |||||
| Cancelled/forfeited |
(2 | ) | 29.80 | |||||
| Nonvested at end of period |
64 | $ | 30.16 | |||||
The actual tax benefits realized related to the restricted stock units vested during the year ended December 31, 2014 were $0.3 million.
F-35
Table of Contents
NOTE 10 – COMMITMENTS AND CONTINGENCIES
Investigations and Litigation
Berlin Station
Our subsidiary, Babcock & Wilcox Construction Co., Inc. (“BWCC”), is currently in a dispute with a customer in connection with a 75MW biomass-energy power plant that BWCC designed and built in Berlin, New Hampshire. The dispute primarily concerns material claims by BWCC against its customer for contract changes relating to schedule delays, delay costs, extra work, withheld payments, improper draws on letters of credit and withheld contract-retention amounts. The customer has made nine partial draws totaling approximately $11.0 million under letters of credit that were outstanding in connection with the project. These draws correspond to a total of approximately $11.9 million in alleged liquidated damages for delay (“Delay LDs”) on the project.
Following the customer’s denial of BWCC’s change order request relating to schedule delays, delay costs and extra work incurred up to that time, on January 16, 2014, BWCC filed suit against the customer in the Court of Common Pleas, Summit County, Ohio, Case No. 2014 01 0208, seeking damages in excess of $37 million (the “Ohio suit”). On or about January 30, 2014, BWCC’s customer filed suit against BWCC in the Superior Court of Coos County, New Hampshire, Case No. 214-2014-CV-14 alleging breach of contract and seeking unspecified amounts (the “New Hampshire suit”), which was subsequently transferred to the New Hampshire business court. On June 26, 2014, the Ohio suit was dismissed on jurisdictional and forum non conveniens grounds. On August 29, 2014, BWCC filed its Answer, Affirmative Defenses and Counterclaim in the New Hampshire suit seeking recovery of damages incurred to date of at least $66 million in connection with all matters currently in dispute.
There is a risk that the customer will attempt to call all or part of the remaining $21.9 million of letters of credit during the pendency of this matter. We believe any such call would be wrongful and entitle us to return of the funds and other damages. We have made provisions in our financial statements as disclosed in Note 1 for Delay LDs called to date against the letters of credit and have not recorded offsetting claims revenue related to these calls in our financial statements.
We believe BWCC has sound legal and factual bases for its claims. BWCC intends to aggressively pursue recovery on its claims, including recovery of the wrongful calls against BWCC’s letters of credit. However, it is premature to predict the outcome of this matter. The litigation could be lengthy, and if BWCC’s customer were to prevail completely or substantially in this matter, the outcome could have a material adverse effect on our financial statements.
ARPA
On February 28, 2014, Arkansas River Power Authority (“ARPA”) filed suit against Babcock & Wilcox Power Generation Group, Inc. (“PGG OpCo”) in the United States District Court for the District of Colorado (Case No. 14-cv-00638-CMA-NYW) alleging breach of contract, negligence, fraud and other claims arising out of PGG OpCo’s delivery of a circulating fluidized bed (“CFB”) boiler and related equipment used in the Lamar Repowering Project pursuant to a 2005 contract.
In 2009, PGG OpCo informed ARPA that the boiler would require a selective non-catalytic reduction system in order to achieve contractual emissions guarantees, which PGG OpCo supplied in 2010. PGG OpCo recommended additional modifications in 2011 and 2012 to ensure the boiler would meet contractual emissions guarantees; however, ARPA has not installed all of the recommended modifications. ARPA has not announced whether it intends to complete and commission the Lamar plant.
On April 16, 2014, PGG OpCo filed an Answer asserting numerous defenses, including waiver, prevention of performance and failure to mitigate damages and Counterclaims alleging bad faith, breach of contract and unjust enrichment. ARPA filed an Answer to the Counterclaims on May 7, 2014. The District Court granted leave for ARPA to amend its Complaint, and ARPA’s First Amended Complaint was accepted on March 20, 2015. PGG OpCo filed its Answer to the First Amended Complaint on April 1, 2015. Discovery is ongoing and a trial date has not been set.
F-36
Table of Contents
We believe that ARPA has asserted damages theories that are highly speculative and without legal or economic support as a litigation tactic. We also believe most of the alleged damages are expressly waived and/or capped in enforceable provisions of the 2005 contract. We cannot estimate the possible loss at this time. However, in addition to establishing other relevant sub-caps and including an explicit waiver of a broad range of damages, including consequential damages, the 2005 contract provides an overall cap of liability at the original contract price of approximately $20.5 million. ARPA has alleged various theories of possible liability and damages that would lead to vastly different measures of damages, making it impracticable to estimate a range of possible outcomes; however, ARPA’s damage claims total approximately $170 million. PGG OpCo does not believe it is probable that ARPA will be successful in any of its claims. PGG OpCo believes it has strong defenses and intends to aggressively defend this matter and pursue its counterclaims. However, if ARPA were to prevail on all or any significant portion of its claims in this matter, the outcome could have a material adverse effect on our financial condition.
Other Litigation and Settlements
On December 17, 2014, an unfavorable jury verdict was delivered against The Babcock & Wilcox Company, Babcock & Wilcox Power Generation Group, Inc., Babcock & Wilcox Nuclear Energy, Inc. and Babcock & Wilcox Canada Ltd. (the “Company Parties”) in a case entitled AREVA NP, INC. f/k/a Framatome ANP, Inc. v. The Babcock & Wilcox Company, et. al. in the amount of approximately $16 million. The Company Parties strongly disagree with the verdict and believe the plaintiff’s claims are without merit. On March 5, 2015 the trial court denied a post-trial motion requesting that the verdict be set aside or a new trial granted. The Company Parties are now evaluating their additional remedies, including a possible appeal to the Supreme Court of Virginia.
The case was filed August 26, 2011 in the Circuit Court for the City of Lynchburg, Commonwealth of Virginia and alleged that the Company Parties owed royalties on certain commercial nuclear contracts performed by the Company and certain of its subsidiaries since 2004. As a result of the jury’s decision and notwithstanding the on-going evaluation of post-trial remedies, we have made provisions in our financial statements for $15 million of the jury award that relates to our Nuclear Energy segment.
Additionally, due to the nature of our business, we are, from time to time, involved in routine litigation or subject to disputes or claims related to our business activities, including, among other things:
| • | performance- or warranty-related matters under our customer and supplier contracts and other business arrangements; and |
| • | workers’ compensation claims, premises liability claims and other claims. |
Based upon our prior experience, we do not expect that any of these other litigation proceedings, disputes and claims will have a material adverse effect on our combined financial condition, results of operations or cash flows.
Operating Leases
Future minimum payments required under operating leases that have initial or remaining noncancellable lease terms in excess of one year at December 31, 2014 are as follows (in thousands):
| Fiscal Year Ending December 31, | Amount |
|||
| 2015 |
$ | 5,522 | ||
| 2016 |
$ | 3,387 | ||
| 2017 |
$ | 2,604 | ||
| 2018 |
$ | 1,600 | ||
| 2019 |
$ | 1,200 | ||
| Thereafter |
$ | 1,221 | ||
Total rental expense for the years ended December 31, 2014, 2013 and 2012 was $6.9 million, $6.3 million and $6.6 million, respectively. These expense amounts include contingent rentals and are net of sublease income, neither of which is material.
F-37
Table of Contents
NOTE 11 – RISKS AND UNCERTAINTIES
Percentage-of-Completion Accounting
As of December 31, 2014, in accordance with the percentage-of-completion method of accounting, we have provided for our estimated costs to complete all of our ongoing contracts. However, it is possible that current estimates could change due to unforeseen events, which could result in adjustments to overall contract costs. The risk on fixed-priced contracts is that revenue from the customer does not cover increases in our costs. It is possible that current estimates could materially change for various reasons, including, but not limited to, fluctuations in forecasted labor productivity or steel and other raw material prices. Increases in costs on our fixed-price contracts could have a material adverse impact on our combined financial condition, results of operations and cash flows. Alternatively, reductions in overall contract costs at completion could materially improve our combined financial condition, results of operations and cash flows.
Insurance
Upon the February 22, 2006 effectiveness of the settlement relating to the Chapter 11 proceedings involving several of our subsidiaries, most of our subsidiaries contributed substantial insurance rights to the asbestos personal injury trust, including rights to (1) certain pre-1979 primary and excess insurance coverages and (2) certain of our 1979-1986 excess insurance coverage. These insurance rights provided coverage for, among other things, asbestos and other personal injury claims, subject to the terms and conditions of the policies. The contribution of these insurance rights was made in exchange for the agreement on the part of the representatives of the asbestos claimants, including the representative of future claimants, to the entry of a permanent injunction, pursuant to Section 524(g) of the U.S. Bankruptcy Code, to channel to the asbestos trust all asbestos-related claims against our subsidiaries and former subsidiaries arising out of, resulting from or attributable to their operations, and the implementation of related releases and indemnification provisions protecting those subsidiaries and their affiliates from future liability for such claims. Although we are not aware of any significant, unresolved claims against our subsidiaries and former subsidiaries that are not subject to the channeling injunction and that relate to the periods during which such excess insurance coverage related, with the contribution of these insurance rights to the asbestos personal injury trust, it is possible that we could have underinsured or uninsured exposure for non-derivative asbestos claims or other personal injury or other claims that would have been insured under these coverages had the insurance rights not been contributed to the asbestos personal injury trust.
NOTE 12 – FINANCIAL INSTRUMENTS WITH CONCENTRATIONS OF CREDIT RISK
Our principal businesses are the construction and supply of fossil-fuel and nuclear steam generating equipment to the electric power generation industry. Our customers are principally the electric power generation industry (including government-owned utilities and independent power producers) and other process industries. These concentrations of customers may impact our overall exposure to credit risk, either positively or negatively, in that our customers may be similarly affected by changes in economic or other conditions. However, none of our customers individually make up more than 10% of our revenues in any given year. In addition, we and many of our customers operate worldwide and are therefore exposed to risks associated with the economic and political forces of various countries and geographic areas. See Note 16 for additional information about our operations in different geographic areas.
We believe that our provision for possible losses on uncollectible accounts receivable is adequate for our credit loss exposure. At December 31, 2014 and 2013, the allowance for possible losses that we deducted from accounts receivable – trade on the accompanying combined balance sheets was $6.3 million and $3.5 million, respectively.
F-38
Table of Contents
NOTE 13 – INVESTMENTS
The following is a summary of our available-for-sale securities at December 31, 2014:
| Amortized Cost |
Gross Unrealized Gains |
Gross Unrealized Losses |
Estimated Fair Value | |||||||||||||
| (In thousands) | ||||||||||||||||
| Commercial paper |
$ | 1,997 | $ | - | $ | - | $ | 1,997 | ||||||||
| Asset-backed securities and collateralized mortgage obligations |
308 | - | (42 | ) | 266 | |||||||||||
| Total |
$ | 2,305 | $ | - | $ | (42 | ) | $ | 2,263 | |||||||
The following is a summary of our available-for-sale securities at December 31, 2013:
| Amortized Cost |
Gross Unrealized Gains |
Gross Unrealized Losses |
Estimated Fair Value | |||||||||||||
| (In thousands) | ||||||||||||||||
| U.S. Government and agency securities |
$ | 2,498 | $ | - | $ | - | $ | 2,498 | ||||||||
| Commercial paper |
6,452 | 1 | - | 6,453 | ||||||||||||
| Asset-backed securities and collateralized mortgage obligations |
393 | 7 | (46 | ) | 354 | |||||||||||
| Total |
$ | 9,343 | $ | 8 | $ | (46 | ) | $ | 9,305 | |||||||
Proceeds, gross realized gains and gross realized losses on sales of available-for-sale securities were as follows:
| Proceeds |
Gross Realized Gains |
Gross Realized Losses |
||||||||||
| (In thousands) | ||||||||||||
| Year Ended December 31, 2014 |
$ | 12,578 | $ | 15 | $ | (2 | ) | |||||
| Year Ended December 31, 2013 |
$ | 4,939 | $ | - | $ | - | ||||||
| Year Ended December 31, 2012 |
$ | 181,210 | $ | 17 | $ | - | ||||||
NOTE 14 – DERIVATIVE FINANCIAL INSTRUMENTS
We have designated all of our FX forward contracts that qualify for hedge accounting as cash flow hedges. The hedged risk is the risk of changes in functional-currency-equivalent cash flows attributable to changes in FX spot rates of forecasted transactions related to long-term contracts. We exclude from our assessment of effectiveness the portion of the fair value of the FX forward contracts attributable to the difference between FX spot rates and FX forward rates. At December 31, 2014, we had deferred approximately $0.1 million of net losses on these derivative financial instruments in accumulated other comprehensive income. Assuming market conditions continue, we expect to recognize substantially all of this amount in the next twelve months.
At December 31, 2014, our derivative financial instruments consisted of FX forward contracts. The notional value of our FX forward contracts totaled $74.2 million at December 31, 2014, with maturities extending to December 2016. These instruments consist primarily of contracts to purchase or sell Canadian Dollars. We are exposed to credit-related losses in the event of nonperformance by counterparties to derivative financial instruments. We attempt to mitigate this risk by using major financial institutions with high credit ratings. The counterparties to all of our FX forward contracts are financial institutions included in our credit facility. Our hedge counterparties have the benefit of the same collateral arrangements and covenants as described under our credit facility.
F-39
Table of Contents
The following tables summarize our derivative financial instruments at December 31, 2014 and 2013:
| Asset and Liability Derivatives | ||||||||
| December 31, | ||||||||
| 2014 |
2013 |
|||||||
| (In thousands) | ||||||||
| Derivatives Designated as Hedges: |
||||||||
| Foreign Exchange Contracts: |
||||||||
| Location | ||||||||
| Accounts receivable-other |
$ | 541 | $ | 1,139 | ||||
| Other assets |
$ | - | $ | 94 | ||||
| Accounts payable |
$ | 2,744 | $ | 581 | ||||
| Other liabilities |
$ | 743 | $ | 603 | ||||
| Derivatives Not Designated as Hedges: |
||||||||
| Foreign Exchange Contracts: | ||||||||
| Location | ||||||||
| Accounts receivable-other |
$ | 176 | $ | 464 | ||||
| Other assets |
$ | - | $ | 50 | ||||
| Accounts payable |
$ | 284 | $ | 10 | ||||
The effects of derivatives on our financial statements are outlined below:
| December 31, | ||||||||
| 2014 |
2013 |
|||||||
| (In thousands) | ||||||||
| Derivatives Designated as Hedges: |
||||||||
| Cash Flow Hedges: |
||||||||
| Foreign Exchange Contracts: |
||||||||
| Amount of loss recognized in other |
$ | (3,184 | ) | $ | (5,936 | ) | ||
| Gain (loss) reclassified from accumulated other comprehensive income into earnings: effective portion |
||||||||
| Location | ||||||||
| Revenues |
$ | 620 | $ | (1,885 | ) | |||
| Cost of operations |
$ | (2,793 | ) | $ | (2,174 | ) | ||
| Other-net |
$ | 4 | $ | 144 | ||||
| Loss recognized in income: portion excluded from effectiveness testing |
||||||||
| Location | ||||||||
| Other-net |
$ | (104 | ) | $ | (349 | ) | ||
| Derivatives Not Designated as Hedges: |
||||||||
| Forward Contracts: |
||||||||
| Gain (loss) recognized in income |
||||||||
| Location | ||||||||
| Other-net |
$ | (184 | ) | $ | 96 | |||
NOTE 15 – FAIR VALUE MEASUREMENTS
FASB Topic Fair Value Measurements and Disclosures defines fair value as the price that would be received to sell an asset or paid to transfer a liability (an exit price) in an orderly transaction between market participants at the measurement date. This topic also sets forth the disclosure requirements regarding fair value and establishes a hierarchy for valuation inputs that emphasizes the use of observable inputs when measuring fair value. A financial instrument’s categorization within the fair value hierarchy is based upon the lowest level of input that is significant to the fair value measurement. The fair value hierarchy established by this topic is as follows:
| • | Level 1 – inputs are based upon quoted prices for identical instruments traded in active markets. |
| • | Level 2 – inputs are based upon quoted prices for similar instruments in active markets, quoted prices for similar or identical instruments in inactive markets and model-based valuation techniques for which all significant assumptions are observable in the market or can be corroborated by observable market data for substantially the full term of the assets and liabilities. |
F-40
Table of Contents
| • | Level 3 – inputs are generally unobservable and typically reflect management’s estimates of assumptions that market participants would use in pricing the asset or liability. The fair values are therefore determined using model-based techniques that include option pricing models, discounted cash flow models and similar valuation techniques. |
The following sections describe the valuation methodologies we use to measure the fair values of our available-for-sale securities, derivatives and other financial instruments.
Available-for-Sale-Securities
Investments primarily include money-market funds and mortgage-backed securities. In general, and where applicable, we principally use a composite of observable prices and quoted prices in active markets for identical assets or liabilities to determine fair value. This pricing methodology applies to our Level 1 and Level 2 investments. Based on our analysis of these investments, we believe that none of our available-for-sale securities were other than temporarily impaired at December 31, 2014.
Fair Value Measurements
The following is a summary of our available-for-sale securities measured at fair value at December 31, 2014:
| 12/31/14 |
Level 1 |
Level 2 |
Level 3 | |||||||||||||
| (In thousands) | ||||||||||||||||
| Commercial paper |
$ | 1,997 | $ | - | $ | 1,997 | $ | - | ||||||||
| Asset-backed securities and collateralized mortgage obligations |
266 | - | 266 | - | ||||||||||||
| Total |
$ | 2,263 | $ | - | $ | 2,263 | $ | - | ||||||||
The following is a summary of our available-for-sale securities measured at fair value at December 31, 2013:
| 12/31/13 |
Level 1 |
Level 2 |
Level 3 | |||||||||||||
| (In thousands) | ||||||||||||||||
| U.S. Government and agency securities |
$ | 2,498 | $ | 2,498 | $ | - | $ | - | ||||||||
| Commercial paper |
6,453 | - | 6,453 | - | ||||||||||||
| Asset-backed securities and collateralized mortgage obligations |
354 | - | 354 | - | ||||||||||||
| Total |
$ | 9,305 | $ | 2,498 | $ | 6,807 | $ | - | ||||||||
We estimate the fair value of investments based on quoted market prices. For investments for which there are no quoted market prices, we derive fair values from available yield curves for investments of similar quality and terms.
Derivatives
Level 2 derivative assets and liabilities currently consist of FX forward contracts. Where applicable, the value of these derivative assets and liabilities is computed by discounting the projected future cash flow amounts to present value using market-based observable inputs, including FX forward and spot rates, interest rates and counterparty performance risk adjustments. At December 31, 2014 and 2013, we had forward contracts outstanding to purchase or sell foreign currencies, primarily Canadian Dollars, with a total fair value of $(3.1) million and $0.6 million, respectively.
Other Financial Instruments
We used the following methods and assumptions in estimating our fair value disclosures for our other financial instruments, as follows:
Cash and cash equivalents and restricted cash and cash equivalents. The carrying amounts that we have reported in the accompanying combined balance sheets for cash and cash equivalents and restricted cash and cash equivalents approximate their fair values due to their highly liquid nature.
F-41
Table of Contents
Long- and short-term debt. We base the fair values of debt instruments on quoted market prices. Where quoted prices are not available, we base the fair values on the present value of future cash flows discounted at estimated borrowing rates for similar debt instruments or on estimated prices based on current yields for debt issues of similar quality and terms. The fair value of our debt instruments approximated their carrying value at December 31, 2014 and December 31, 2013.
Guarantee. In the year ended December 31, 2014, we issued a letter of credit with a four year term totaling approximately $10 million in support of a bank loan borrowed by Thermax Babcock & Wilcox Energy Solutions Private Limited (“TBWES”). TBWES is an unconsolidated affiliate and the letter of credit can be drawn if TBWES defaults on the loan. We recognized the fair value of this guarantee totaling $1.7 million in other liabilities on our combined balance sheet at December 31, 2014 with an associated increase to our investments in unconsolidated affiliates.
NOTE 16 – SEGMENT REPORTING
The operations of our segments are managed based on product offerings. Reportable segments operating performance is assessed based on gross profit, excluding special charges for restructuring activities and mark to market adjustments related to our pension and postretirement benefit plans. Segment results have been prepared utilizing the same accounting policies as the combined financial statements. Our reportable segments are Global Power, Global Services, Industrial Environmental and Nuclear Energy as described in Note 1.
1. Information about Operations:
| Year Ended December 31, | ||||||||||||
| 2014 |
2013 |
2012 | ||||||||||
| (In thousands) | ||||||||||||
| REVENUES: |
||||||||||||
| Global Power |
$ | 471,929 | $ | 712,461 | $ | 780,682 | ||||||
| Global Services |
908,682 | 1,055,189 | 1,005,277 | |||||||||
| Industrial Environmental |
105,418 | - | - | |||||||||
| Nuclear Energy |
103,690 | 153,513 | 253,141 | |||||||||
| $ | 1,589,719 | $ | 1,921,163 | $ | 2,039,100 | |||||||
| GROSS PROFIT: |
||||||||||||
| Global Power |
$ | 94,647 | $ | 126,275 | $ | 177,670 | ||||||
| Global Services |
193,629 | 225,434 | 220,877 | |||||||||
| Industrial Environmental |
24,961 | - | - | |||||||||
| Nuclear Energy |
10,667 | 48,466 | 73,249 | |||||||||
| $ | 323,904 | $ | 400,175 | $ | 471,796 | |||||||
| Selling, General and Administrative |
(229,191 | ) | (228,149 | ) | (241,333 | ) | ||||||
| Research and Development |
(18,747 | ) | (22,882 | ) | (26,018 | ) | ||||||
| Losses (Gains) on Asset Disposal and Impairments, net |
(1,087 | ) | (1,153 | ) | (3,276 | ) | ||||||
| Equity in Income of Investees |
8,681 | 18,387 | 17,402 | |||||||||
| Special Charges for Restructuring Activities |
(30,025 | ) | (26,346 | ) | - | |||||||
| Mark to Market Adjustment |
(111,050 | ) | 115,142 | (12,685 | ) | |||||||
| Total Operating Income (Loss) |
$ | (57,515 | ) | $ | 255,174 | $ | 205,886 | |||||
| Other Income (Expense): |
||||||||||||
| Interest income |
1,170 | 1,527 | 1,451 | |||||||||
| Interest expense |
(503 | ) | (471 | ) | (567 | ) | ||||||
| Other – net |
1,156 | 791 | (1,553 | ) | ||||||||
| Total Other Income (Expense) |
1,823 | 1,847 | (669 | ) | ||||||||
| Income before Provision for Income Taxes |
$ | (55,692 | ) | $ | 257,021 | $ | 205,217 | |||||
F-42
Table of Contents
2. Information about our Product and Service Lines:
| Year Ended December 31, | ||||||||||||
| 2014 |
2013 |
2012 |
||||||||||
| (In thousands) | ||||||||||||
| REVENUES: |
||||||||||||
| Global Power: |
||||||||||||
| New build environmental equipment |
$ | 171,175 | $ | 310,327 | $ | 334,692 | ||||||
| New build steam generation systems |
300,754 | 402,134 | 445,990 | |||||||||
| 471,929 | 712,461 | 780,682 | ||||||||||
| Global Services: |
||||||||||||
| Parts and technical services |
311,294 | 304,597 | 301,593 | |||||||||
| Projects |
286,094 | 406,196 | 369,092 | |||||||||
| Construction services |
242,295 | 279,997 | 265,894 | |||||||||
| Operations and maintenance |
68,999 | 64,399 | 68,698 | |||||||||
| 908,682 | 1,055,189 | 1,005,277 | ||||||||||
| Industrial Environmental: |
||||||||||||
| Environmental Solutions |
48,938 | - | - | |||||||||
| Engineered Equipment |
21,190 | - | - | |||||||||
| Aftermarket Services |
35,290 | - | - | |||||||||
| 105,418 | - | - | ||||||||||
| Nuclear Energy: |
||||||||||||
| Nuclear Services |
62,336 | 70,064 | 119,130 | |||||||||
| Nuclear Equipment |
41,354 | 83,449 | 134,011 | |||||||||
| 103,690 | 153,513 | 253,141 | ||||||||||
| $ | 1,589,719 | $ | 1,921,163 | $ | 2,039,100 | |||||||
3. Information about our Operations in Different Geographic Areas:
| Year Ended December 31, | ||||||||||||
| 2014 |
2013 |
2012 |
||||||||||
| (In thousands) | ||||||||||||
| REVENUES(1): |
||||||||||||
| United States |
$ | 976,039 | $ | 1,244,060 | $ | 1,364,434 | ||||||
| Canada |
193,504 | 313,807 | 288,201 | |||||||||
| Denmark |
65,436 | 56,336 | 18,504 | |||||||||
| United Kingdom |
61,972 | 20,042 | 6,653 | |||||||||
| China |
59,841 | 58,775 | 45,830 | |||||||||
| Sweden |
29,786 | 37,823 | 101,688 | |||||||||
| Dominican Republic |
27,399 | 473 | 687 | |||||||||
| Germany |
22,792 | 22,869 | 34,364 | |||||||||
| Chile |
15,686 | 9,240 | 11,582 | |||||||||
| Colombia |
8,037 | 44,622 | 1,163 | |||||||||
| Argentina |
3,100 | 5,737 | 23,529 | |||||||||
| All Other Countries |
126,127 | 107,379 | 142,465 | |||||||||
| $ | 1,589,719 | $ | 1,921,163 | $ | 2,039,100 | |||||||
| (1) | We allocate geographic revenues based on the location of the customer’s operations. |
F-43
Table of Contents
| NET PROPERTY, PLANT AND EQUIPMENT: |
||||||||||||
| United States |
$ | 88,611 | $ | 83,656 | $ | 89,524 | ||||||
| Canada |
27,480 | 38,738 | 45,402 | |||||||||
| China |
12,356 | 10,980 | 7,926 | |||||||||
| Mexico |
12,106 | 8,312 | 8,302 | |||||||||
| United Kingdom |
8,638 | 9,414 | 9,714 | |||||||||
| Denmark |
6,963 | 8,715 | 8,565 | |||||||||
| Germany |
1,536 | 2,060 | 2,284 | |||||||||
| All Other Countries |
1,268 | 1,189 | 1,381 | |||||||||
| $ | 158,958 | $ | 163,064 | $ | 173,098 | |||||||
F-44
Table of Contents
THE POWER GENERATION OPERATIONS OF THE BABCOCK & WILCOX COMPANY
CONDENSED COMBINED BALANCE SHEETS
| March 31, 2015 |
December 31, 2014 |
|||||||
| (Unaudited) (In thousands) |
||||||||
| ASSETS | ||||||||
| Current Assets: |
||||||||
| Cash and cash equivalents |
$ | 226,768 | $ | 219,085 | ||||
| Restricted cash and cash equivalents |
28,805 | 31,816 | ||||||
| Investments |
7,156 | 1,997 | ||||||
| Accounts receivable – trade, net |
246,575 | 279,497 | ||||||
| Accounts receivable – other |
43,582 | 37,558 | ||||||
| Contracts in progress |
133,745 | 130,704 | ||||||
| Inventories |
99,024 | 100,017 | ||||||
| Deferred income taxes |
37,924 | 36,649 | ||||||
| Other current assets |
17,466 | 17,371 | ||||||
| Total Current Assets |
841,045 | 854,694 | ||||||
| Property, Plant and Equipment |
413,707 | 422,047 | ||||||
| Less accumulated depreciation |
261,943 | 263,089 | ||||||
| Net Property, Plant and Equipment |
151,764 | 158,958 | ||||||
| Investments |
258 | 266 | ||||||
| Goodwill |
216,618 | 219,332 | ||||||
| Deferred Income Taxes |
117,478 | 117,485 | ||||||
| Investments in Unconsolidated Affiliates |
101,103 | 109,248 | ||||||
| Intangible Assets |
46,731 | 51,626 | ||||||
| Other Assets |
18,300 | 11,197 | ||||||
| TOTAL |
$ | 1,493,297 | $ | 1,522,806 | ||||
See accompanying notes to condensed combined financial statements.
F-45
Table of Contents
THE POWER GENERATION OPERATIONS OF THE BABCOCK & WILCOX COMPANY
CONDENSED COMBINED BALANCE SHEETS
| March 31, 2015 |
December 31, 2014 |
|||||||
| (Unaudited) (In thousands) |
||||||||
| LIABILITIES AND PARENT EQUITY | ||||||||
| Current Liabilities: |
||||||||
| Notes payable and current maturities of long-term debt |
$ | 3,219 | $ | 3,215 | ||||
| Accounts payable |
144,971 | 168,560 | ||||||
| Accrued employee benefits |
39,033 | 47,359 | ||||||
| Advance billings on contracts |
179,947 | 153,573 | ||||||
| Accrued warranty expense |
43,102 | 43,204 | ||||||
| Accrued liabilities – other |
75,081 | 72,179 | ||||||
| Total Current Liabilities |
485,353 | 488,090 | ||||||
| Accumulated Postretirement Benefit Obligation |
34,809 | 36,182 | ||||||
| Pension Liability |
255,781 | 260,846 | ||||||
| Other Liabilities |
44,922 | 44,000 | ||||||
| Commitments and Contingencies (Note 5) |
||||||||
| Parent Equity: |
||||||||
| Parent Equity |
671,336 | 692,661 | ||||||
| Noncontrolling interest |
1,096 | 1,027 | ||||||
| Total Parent Equity |
672,432 | 693,688 | ||||||
| TOTAL |
$ | 1,493,297 | $ | 1,522,806 | ||||
See accompanying notes to condensed combined financial statements.
F-46
Table of Contents
THE POWER GENERATION OPERATIONS OF THE BABCOCK & WILCOX COMPANY
CONDENSED COMBINED STATEMENTS OF OPERATIONS
| Three Months Ended March 31, | ||||||||
| 2015 |
2014 |
|||||||
| (Unaudited) (In thousands) |
||||||||
| Revenues |
$ | 419,842 | $ | 347,892 | ||||
| Costs and Expenses: |
||||||||
| Cost of operations |
332,069 | 281,886 | ||||||
| Research and development costs |
4,638 | 4,102 | ||||||
| Losses on asset disposals and impairments, net |
15 | - | ||||||
| Selling, general and administrative expenses |
59,524 | 52,215 | ||||||
| Special charges for restructuring activities |
2,446 | 1,478 | ||||||
| Total Costs and Expenses |
398,692 | 339,681 | ||||||
| Equity in Income (Loss) of Investees |
(2,071 | ) | 2,366 | |||||
| Operating Income |
19,079 | 10,577 | ||||||
| Other Income (Expense): |
||||||||
| Interest income |
156 | 637 | ||||||
| Interest expense |
(142 | ) | (122) | |||||
| Other – net |
(430 | ) | 1,317 | |||||
| Total Other Income (Expense): |
(416 | ) | 1,832 | |||||
| Income before Provision for Income Taxes |
18,663 | 12,409 | ||||||
| Provision for Income Taxes |
5,921 | 1,204 | ||||||
| Net Income |
$ | 12,742 | $ | 11,205 | ||||
| Net Income Attributable to Noncontrolling Interest |
(52 | ) | (116) | |||||
| Net Income Attributable to The Power Generation Operations of The Babcock & Wilcox Company |
$ | 12,690 | $ | 11,089 | ||||
See accompanying notes to condensed combined financial statements.
F-47
Table of Contents
THE POWER GENERATION OPERATIONS OF THE BABCOCK & WILCOX COMPANY
CONDENSED COMBINED STATEMENTS OF COMPREHENSIVE INCOME
| Three Months Ended March 31, | ||||||||
| 2015 |
2014 |
|||||||
| (Unaudited) (In thousands) |
||||||||
| Net Income |
$ | 12,742 | $ | 11,205 | ||||
| Other Comprehensive Income (Loss): |
||||||||
| Currency translation adjustments |
(10,923) | (6,611) | ||||||
| Derivative financial instruments: |
||||||||
| Unrealized losses arising during the period, net of tax benefit of $174 and $339, respectively |
(215) | (975) | ||||||
| Reclassification adjustment for losses included in net income, net of tax benefit of $(683) and $(221), respectively |
1,916 | 632 | ||||||
| Benefit obligations: |
||||||||
| Amortization of benefit plan costs, net of tax benefit of $(43) and $(88), respectively |
71 | 186 | ||||||
| Investments: |
||||||||
| Unrealized gains arising during the period, net of tax provision of $0 and $(4), respectively |
- | 8 | ||||||
| Reclassification adjustment for gains included in net income, net of tax provision of $0 and $5, respectively |
- | (10) | ||||||
| Other Comprehensive Income (Loss) |
(9,151) | (6,770) | ||||||
| Total Comprehensive Income |
3,591 | 4,435 | ||||||
| Comprehensive Income Attributable to |
(70) | (109) | ||||||
| Comprehensive Income Attributable to |
$ | 3,521 | $ | 4,326 | ||||
|
|
||||||||
See accompanying notes to condensed combined financial statements.
F-48
Table of Contents
THE POWER GENERATION OPERATIONS OF THE BABCOCK & WILCOX COMPANY
CONDENSED COMBINED STATEMENTS OF PARENT EQUITY
| Accumulated |
Parent Equity |
Noncontrolling Interest |
Total Parent Equity |
|||||||||||||
| (Unaudited) (In thousands) |
||||||||||||||||
| Balance December 31, 2014 |
$ | 10,369 | $ | 682,292 | $ | 1,027 | $ | 693,688 | ||||||||
| Net income |
- | 12,690 | 52 | 12,742 | ||||||||||||
| Net transfers to parent |
- | (24,855 | ) | - | (24,855) | |||||||||||
| Defined benefit obligations |
71 | - | - | 71 | ||||||||||||
| Available-for-sale investments |
- | - | - | - | ||||||||||||
| Currency translation adjustments |
(10,941 | ) | - | 18 | (10,923) | |||||||||||
| Derivative financial instruments |
1,701 | - | - | 1,701 | ||||||||||||
| Stock-based compensation |
- | 9 | - | 9 | ||||||||||||
| Distributions to noncontrolling interests |
- | - | (1 | ) | (1) | |||||||||||
| Balance March 31, 2015 |
$ | 1,200 | $ | 670,136 | $ | 1,096 | $ | 672,432 | ||||||||
| Balance December 31, 2013 |
$ | 35,334 | $ | 495,627 | $ | 924 | $ | 531,885 | ||||||||
| Net income |
- | 11,089 | 116 | 11,205 | ||||||||||||
| Net transfers from parent |
- | 54,117 | - | 54,117 | ||||||||||||
| Defined benefit obligations |
186 | - | - | 186 | ||||||||||||
| Available-for-sale investments |
(2 | ) | - | - | (2) | |||||||||||
| Currency translation adjustments |
(6,604 | ) | - | (7 | ) | (6,611) | ||||||||||
| Derivative financial instruments |
(343 | ) | - | - | (343) | |||||||||||
| Stock-based compensation |
- | 104 | - | 104 | ||||||||||||
| Balance March 31, 2014 |
$ | 28,571 | $ | 560,937 | $ | 1,033 | $ | 590,541 | ||||||||
See accompanying notes to condensed combined financial statements.
F-49
Table of Contents
THE POWER GENERATION OPERATIONS OF THE BABCOCK & WILCOX COMPANY
CONDENSED COMBINED STATEMENTS OF CASH FLOWS
| Three Months Ended March 31, | ||||||||
| 2015 |
2014 |
|||||||
| (Unaudited) (In thousands) |
||||||||
| CASH FLOWS FROM OPERATING ACTIVITIES: |
||||||||
| Net Income |
$ | 12,742 | $ | 11,205 | ||||
| Non-cash items included in net income: |
||||||||
| Depreciation and amortization |
13,075 | 6,739 | ||||||
| Income of equity method investees, net of dividends |
2,071 | (524) | ||||||
| Losses on asset disposals and impairments |
15 | - | ||||||
| Recognition of losses for pension and postretirement plans |
114 | 274 | ||||||
| Excess tax benefits from stock-based compensation |
(9 | ) | (53) | |||||
| Changes in assets and liabilities, net of effects from acquisitions: |
||||||||
| Accounts receivable |
25,417 | 24,356 | ||||||
| Accounts payable |
(19,726 | ) | (39,318) | |||||
| Contracts in progress and advance billings on contracts |
23,750 | (62,746) | ||||||
| Inventories |
(926 | ) | 919 | |||||
| Income taxes |
(2,125 | ) | 2,570 | |||||
| Accrued and other current liabilities |
7,399 | 3,515 | ||||||
| Pension liability, accrued postretirement benefit obligation and employee benefits |
(13,404 | ) | (12,668) | |||||
| Other, net |
(564 | ) | 129 | |||||
| NET CASH PROVIDED BY (USED IN) OPERATING ACTIVITIES |
47,829 | (65,602) | ||||||
| CASH FLOWS FROM INVESTING ACTIVITIES: |
||||||||
| Decrease in restricted cash and cash equivalents |
3,011 | 8,593 | ||||||
| Purchases of property, plant and equipment |
(6,221 | ) | (3,202) | |||||
| Purchases of available-for-sale securities |
(5,491 | ) | (2,454) | |||||
| Sales and maturities of available-for-sale securities |
341 | 6,168 | ||||||
| Proceeds from asset disposals |
- | 646 | ||||||
| Investment in equity method investees |
- | (4,899) | ||||||
| NET CASH PROVIDED BY (USED IN) INVESTING ACTIVITIES |
(8,360 | ) | 4,852 | |||||
| CASH FLOWS FROM FINANCING ACTIVITIES: |
||||||||
| Payment of short-term borrowing and long-term debt |
- | (441) | ||||||
| Borrowings under short-term arrangements |
- | 735 | ||||||
| Net transfers (to) from parent |
(24,855 | ) | 54,117 | |||||
| Excess tax benefits from stock-based compensation |
9 | 53 | ||||||
| Other |
(1 | ) | - | |||||
| NET CASH PROVIDED BY (USED IN) FINANCING ACTIVITIES |
(24,847 | ) | 54,464 | |||||
| EFFECTS OF EXCHANGE RATE CHANGES ON CASH |
(6,939 | ) | (4,542) | |||||
| NET INCREASE (DECREASE) IN CASH AND CASH EQUIVALENTS |
7,683 | (10,828) | ||||||
| CASH AND CASH EQUIVALENTS AT BEGINNING OF PERIOD |
219,085 | 198,478 | ||||||
| CASH AND CASH EQUIVALENTS AT END OF PERIOD |
$ | 226,768 | $ | 187,650 | ||||
| SUPPLEMENTAL DISCLOSURES OF CASH FLOW INFORMATION: |
||||||||
| Cash paid during the period for: |
||||||||
| Income taxes (net of refunds) |
$ | 1,199 | $ | 3,947 | ||||
| SCHEDULE OF NON-CASH INVESTING ACTIVITY: |
||||||||
| Accrued capital expenditures included in accounts payable |
$ | 767 | $ | 1,232 | ||||
See accompanying notes to condensed combined financial statements.
F-50
Table of Contents
THE POWER GENERATION OPERATIONS OF THE BABCOCK & WILCOX COMPANY
NOTES TO CONDENSED COMBINED FINANCIAL STATEMENTS
MARCH 31, 2015
(UNAUDITED)
NOTE 1 – BASIS OF PRESENTATION AND SIGNIFICANT ACCOUNTING POLICIES
On November 5, 2014, The Babcock & Wilcox Company (the “Company”) announced that its Board of Directors approved pursuing the separation of its Power Generation business from its Government and Nuclear Operations business into two independent, publicly traded companies to be effected through a tax-free spin-off transaction. These financial statements represent Babcock & Wilcox Power Generation Group, Inc. historical financial statements combined with related captive insurance operations which will be contributed by the Company in conjunction with the planned spin-off (“B&W PGG”). In addition to the assets and liabilities used in managing and operating the Power Generation segment of the Company, B&W PGG contains certain assets and liabilities of the Company’s Nuclear Energy segment that will be transferred to the Company before the spin-off.
We have presented the condensed combined financial statements of B&W PGG in U.S. dollars in accordance with the interim reporting requirements of Rule 10-01 of Regulation S-X and accounting principles generally accepted in the United States (“GAAP”). Certain financial information and disclosures normally included in our financial statements prepared annually have been condensed or omitted. Readers of these financial statements should, therefore, refer to the audited combined financial statements for the year ended December 31, 2014 included in this prospectus. We have included all adjustments, in the opinion of management, consisting only of normal recurring adjustments, necessary for a fair presentation.
We use the equity method to account for investments in entities that we do not control, but over which we have the ability to exercise significant influence. We generally refer to these entities as “joint ventures.” We have eliminated all intercompany transactions and accounts. We present the notes to our condensed combined financial statements on the basis of continuing operations, unless otherwise stated. We have evaluated subsequent events through May 20, 2015, the date of issuance of this report.
The condensed combined results of operations, financial position and cash flows reflected in the accompanying condensed combined financial statements may not be indicative of the future performance of the combined operations and do not necessarily reflect what the combined results of operations, financial position and cash flows would have been had B&W PGG operated as an independent public company during the periods presented, including changes in its operations and capitalization as a result of the separation and distribution from the Company.
Certain corporate and general and administrative expenses, including those related to executive management, tax, accounting, legal, information technology, treasury services, and certain employee benefits, have been allocated to reflect all costs of doing business related to these operations in the financial statements, including expenses incurred by related entities on our behalf. The majority of these allocations of management and support services costs are based on specific identification methods such as direct usage and level of effort. The remainder is allocated on the basis of a three-factor formula that considered proportional revenue generated, payroll and fixed assets. Management believes such allocations are reasonable. However, the associated expenses reflected in the accompanying condensed combined statements of operations may not be indicative of the actual expenses that would have been incurred had B&W PGG been operating as an independent public company for the periods presented. Following the separation and distribution from the Company, we will perform these functions using internal resources or purchased services, certain of which may be provided by the Company during a transitional period pursuant to a transition services agreement. Refer to Note 10 to our condensed combined financial statements for a detailed description of transactions with other affiliates of the Company.
In presenting the condensed combined financial statements, management makes estimates and assumptions that affect the amounts reported and related disclosures. Estimates, by their nature, are based on judgment and available information. Accordingly, actual results could differ from those estimates.
Unless the context otherwise indicates, “we,” “us” and “our” mean The Power Generation Operations of The Babcock & Wilcox Company.
F-51
Table of Contents
Business Segments
We have four reportable segments: Global Power, Global Services, Industrial Environmental and Nuclear Energy. The Nuclear Energy segment will be transferred to the Company before the spin-off. For financial information about our segments, see Note 9 to our condensed combined financial statements.
Our reportable segments are further described as follows:
| • | Our Global Power segment represents our worldwide new build boiler and environmental products operations. Through this segment, we engineer, manufacture, procure, construct and commission steam generating and environmental systems and other related equipment. Our boilers are designed for utility and industrial applications, fired with fossil and renewable fuels and include advanced supercritical boilers, subcritical boilers, fluidized bed boilers, biomass-fired boilers, waste-to-energy boilers, chemical recovery boilers, industrial power boilers, package boilers, heat recovery steam generators, waste heat boilers and solar thermal power systems. Our environmental systems offer air pollution control systems and related equipment for the treatment of nitrogen oxides, sulfur dioxide, fine particulate, mercury, acid gases and other hazardous air emissions and include wet and dry flue gas desulfurization systems, catalytic and non-catalytic nitrogen oxides reduction systems, low nitrogen oxides burners and overfire air systems, fabric filter baghouses, wet and dry electrostatic precipitators, mercury control systems and dry sorbent injection for acid gas mitigation. Our customers consist of a wide range of utilities, independent power producers and industrial companies globally. |
| • | Our Global Services segment provides a comprehensive mix of aftermarket products and services to support peak efficiency and availability of steam generating and associated environmental and auxiliary equipment for power generation. Our products and services include replacement parts, field technical services, retrofit and upgrade projects, fuel switching and repowering projects, construction and maintenance services, start-up and commissioning, training programs and plant operations and maintenance for our full complement of boiler, environmental and auxiliary equipment. We deliver these aftermarket products and services to a large installed base for our and our competitors’ power generation and industrial plants globally through our extensive network of regionally located service centers, technical support personnel, and global sourcing capabilities. Our customers consist of a wide range of utilities, independent power producers and industrial companies globally. |
| • | Our Industrial Environmental segment provides environmental products and services to numerous industrial end markets through MEGTEC Holdings, Inc. (“MEGTEC”), which we acquired on June 20, 2014. Through this segment, we design, engineer and manufacture products including oxidizers, solvent and distillation systems, wet and dry electrostatic precipitators, scrubbers and heat recovery systems. The segment also provides specialized industrial process systems, coating lines and equipment. Our suite of technologies for pollution abatement include systems that control volatile organic compounds and air toxics, particulate, nitrogen oxides and acid gas air emissions from industrial processes. We serve a diverse set of industrial end markets with a current emphasis on the chemical, pharmaceutical, energy storage, packaging and automotive markets. |
| • | Our Nuclear Energy segment supplies commercial nuclear steam generators and components to nuclear utility customers. This segment has supplied the nuclear industry with more than 1,300 large, heavy components worldwide. This segment is the only heavy nuclear component, N-Stamp certified manufacturer in North America. Our Nuclear Energy segment fabricates pressure vessels, reactors, steam generators, heat exchangers and other auxiliary equipment. This segment also provides specialized engineering services that include structural component design, 3-D thermal-hydraulic engineering analysis, weld and robotic process development and metallurgy and materials engineering. In addition, this segment offers services for nuclear steam generators and balance of plant equipment, as well as nondestructive examination and tooling/repair solutions for other plant systems and components. |
The condensed combined results of operations, financial position and cash flows for the three months ended March 31, 2015 are not necessarily indicative of the results that may be expected for the year ending December 31, 2015. For further information, refer to the audited combined financial statements for the year ended December 31, 2014 included in this prospectus.
F-52
Table of Contents
Contracts and Revenue Recognition
We generally recognize contract revenues and related costs on a percentage-of-completion method for individual contracts or combinations of contracts based on a cost-to-cost method, as applicable to the product or activity involved. We recognize estimated contract revenue and resulting income based on costs incurred to date as a percentage of total estimated costs. Certain costs may be excluded from the cost-to-cost method of measuring progress, such as significant costs for materials and major third-party subcontractors, if it appears that such exclusion would result in a more meaningful measurement of actual contract progress and resulting periodic allocation of income. We include revenues and related costs so recorded, plus accumulated contract costs that exceed amounts invoiced to customers under the terms of the contracts, in contracts in progress. We include in advance billings on contracts billings that exceed accumulated contract costs and revenues and costs recognized under the percentage-of-completion method. Most long-term contracts contain provisions for progress payments. Our unbilled receivables do not contain an allowance for credit losses as we expect to invoice customers and collect all amounts for unbilled revenues. We review contract price and cost estimates periodically as the work progresses and reflect adjustments proportionate to the percentage-of-completion in income in the period when those estimates are revised. For all contracts, if a current estimate of total contract cost indicates a loss on a contract, the projected loss is recognized in full when determined.
For parts orders and certain aftermarket services activities, we recognize revenues as goods are delivered and work is performed.
Variations from estimated contract performance could result in material adjustments to operating results for any fiscal quarter or year. We include claims for extra work or changes in scope of work to the extent of costs incurred in contract revenues when we believe collection is probable. At March 31, 2015 and December 31, 2014, we recognized accrued claims totaling $8.2 million.
In the three months ended March 31, 2014, we recorded a contract loss totaling approximately $7.6 million based on our estimated costs to complete our Global Power segment’s Berlin Station project. We previously asserted that substantial completion had been achieved on this project in early 2014 and that any further delays to complete this project were the result of the customer’s failure to supply fuel complying with the contract specifications. The customer certified that we achieved substantial completion on this project effective July 19, 2014, following which the customer has no further claims for liquidated damages associated with delays. See Note 5 to the condensed combined financial statements for legal proceedings associated with this matter.
Comprehensive Income
The components of accumulated other comprehensive income included in parent equity are as follows:
| March 31, 2015 |
December 31, 2014 |
|||||||
| (In thousands) | ||||||||
| Currency translation adjustments |
$ | 610 | $ | 11,551 | ||||
| Net unrealized loss on available-for-sale investments |
(27 | ) | (27 | ) | ||||
| Net unrealized gain (loss) on derivative financial instruments |
1,578 | (123 | ) | |||||
| Unrecognized prior service cost on benefit obligations |
(961 | ) | (1,032 | ) | ||||
|
|
||||||||
| Accumulated other comprehensive income |
$ | 1,200 | $ | 10,369 | ||||
F-53
Table of Contents
The amounts reclassified out of accumulated other comprehensive income by component and the affected condensed combined statements of operations line items are as follows:
| Three Months Ended March 31, |
||||||||||
| 2015 |
2014 |
|||||||||
| Accumulated Other Comprehensive Income Component Recognized |
(In thousands) | Line Item Presented | ||||||||
| Realized (losses) gains on derivative financial instruments |
$ | 694 | $ | 163 | Revenues | |||||
| (3,356 | ) | (1,026 | ) | Cost of operations | ||||||
| 63 | 10 | Other-net | ||||||||
|
|
|
|||||||||
| (2,599 | ) | (853 | ) | Total before tax | ||||||
| 683 | 221 | Provision for Income Taxes | ||||||||
|
|
|
|||||||||
| $ | (1,916) | $ | (632) | Net Income | ||||||
| Amortization of prior service cost on benefit obligations |
$ | (105 | ) | $ | (189 | ) | Cost of operations | |||
| (9 | ) | (85 | ) | Selling, general and administrative expenses | ||||||
|
|
|
|||||||||
| (114 | ) | (274 | ) | Total before tax | ||||||
| 43 | 88 | Provision for Income Taxes | ||||||||
|
|
|
|||||||||
| $ | (71 | ) | $ | (186 | ) | Net Income | ||||
| Realized gains on investments |
$ | - | $ | 15 | Other-net | |||||
| - | (5 | ) | Provision for Income Taxes | |||||||
|
|
|
|||||||||
| $ | - | $ | 10 | Net Income | ||||||
|
| ||||||||||
| Total reclassification for the period |
$ | (1,987 | ) | $ | (808 | ) | ||||
Inventories
The components of inventories are as follows:
| March 31, | December 31, | |||||||
| 2015 |
2014 |
|||||||
| (In thousands) | ||||||||
| Raw materials and supplies |
$ | 72,131 | $ | 72,910 | ||||
| Work in progress |
9,843 | 9,831 | ||||||
| Finished goods |
17,050 | 17,276 | ||||||
|
|
||||||||
| Total inventories |
$ | 99,024 | $ | 100,017 | ||||
Restricted Cash and Cash Equivalents
We record cash and cash equivalents as restricted when we are unable to freely use such cash and cash equivalents for our general operating purposes. At March 31, 2015, we had restricted cash and cash equivalents totaling $28.8 million, $4.7 million of which was held in restricted foreign cash accounts and $24.1 million of which was held to meet reinsurance reserve requirements of our captive insurer.
Warranty Expense
We accrue estimated expense included in cost of operations on our condensed combined statements of operations to satisfy contractual warranty requirements when we recognize the associated revenue on the related contracts. In addition, we record specific provisions or reductions where we expect the actual warranty costs to significantly differ from the accrued estimates. Such changes could have a material effect on our combined financial condition, results of operations and cash flows.
F-54
Table of Contents
The following summarizes the changes in the carrying amount of accrued warranty expense:
| Three Months Ended March 31, |
||||||||
| 2015 |
2014 |
|||||||
| (In thousands) | ||||||||
| Balance at beginning of period |
$ | 43,204 | $ | 45,544 | ||||
| Additions |
3,968 | 3,345 | ||||||
| Expirations and other changes |
495 | (3,718 | ) | |||||
| Payments |
(3,466 | ) | (1,540 | ) | ||||
| Translation and other |
(1,099 | ) | (225) | |||||
|
|
||||||||
| Balance at end of period |
$ | 43,102 | $ | 43,406 | ||||
Research and Development
Our research and development activities are related to the development and improvement of new and existing products and equipment, as well as conceptual and engineering evaluation for translation into practical applications. We charge the costs of research and development unrelated to specific contracts as incurred. Research and development activities totaled $4.6 million and $4.1 million in the three months ended March 31, 2015 and 2014, respectively.
Provision for Income Taxes
We are subject to U.S. federal income tax and income tax of multiple state and international jurisdictions. We are included in the U.S. federal and certain state tax returns filed by the Company. We compute the provision for such income taxes on a separate tax return basis as if we filed our own tax returns. We deem the amounts that we would have paid or received from the Internal Revenue Service and certain state jurisdictions had we not been a member of the Company’s consolidated tax group to be immediately settled with the Company. We provide for income taxes based on the enacted tax laws and rates in the jurisdictions in which we conduct our operations. These jurisdictions may have regimes of taxation that vary with respect to nominal rates and with respect to the basis on which these rates are applied. This variation, along with changes in our mix of income within these jurisdictions, can contribute to shifts in our effective tax rate from period to period.
Our effective tax rate for the three months ended March 31, 2015 was approximately 31.7% as compared to 9.7% for the three months ended March 31, 2014. The effective tax rate for the three months ended March 31, 2015 was lower than our statutory rate primarily due to foreign rate differential. The effective tax rate for the three months ended March 31, 2014 was lower than the effective tax rate for the three months ended March 31, 2015 primarily due to the receipt of a favorable ruling from the Internal Revenue Service that allowed us to amend prior year U.S. income tax returns to exclude distributions of several of our foreign joint ventures from domestic taxable income.
As of March 31, 2015, we have gross unrecognized tax benefits of $4.3 million that would reduce our effective tax rate if recognized.
NOTE 2 – ACQUISITIONS AND DISPOSITIONS
MEGTEC Acquisition
On June 20, 2014, we acquired the outstanding stock of industrial processes solutions provider MEGTEC for $142.8 million, net of cash acquired. MEGTEC designs, engineers, manufactures and services air pollution control systems and coating/drying equipment for a variety of industrial applications and complements our environmental products and solutions offerings that serves utility markets.
The purchase price of the acquisition has been allocated among assets acquired and liabilities assumed at preliminary estimates of fair value based on information currently available with the excess purchase price
F-55
Table of Contents
recorded as goodwill. Our preliminary purchase price allocation, as follows, is subject to change upon receipt of additional information and completion of further analysis, including, but not limited to, finalization of long-lived and intangible asset valuations:
| MEGTEC | ||||
| (In thousands) |
||||
| Cash and cash equivalents |
$ | 14,232 | ||
| Accounts receivable |
23,054 | |||
| Inventories |
5,395 | |||
| Other current assets |
6,325 | |||
| Property, plant and equipment |
5,090 | |||
| Goodwill |
108,800 | |||
| Intangible assets |
44,250 | |||
| Total assets acquired |
$ | 207,146 | ||
| Accounts payable |
13,402 | |||
| Advance billings on contracts |
11,144 | |||
| Other current liabilities |
18,089 | |||
| Pension liability |
5,041 | |||
| Deferred income taxes |
2,327 | |||
| Other liabilities |
130 | |||
| Total liabilities assumed |
$ | 50,133 | ||
| Net assets acquired |
$ | 157,013 | ||
| Cash and cash equivalents acquired |
14,232 | |||
| Net assets acquired, net of unrestricted cash acquired |
$ | 142,781 | ||
| Amount of tax deductible goodwill |
$ | 34,583 | ||
The preliminary intangible assets included above consist of the following (dollar amounts in thousands):
| Amount | Amortization Period | |||||
| Customer relationships |
$ | 24,400 | 7 years | |||
| Backlog |
$ | 10,600 | 1 year | |||
| Trade names / trademarks |
$ | 6,000 | 15 years | |||
| Developed technology |
$ | 3,250 | 10 years | |||
Our condensed combined financial statements for the three months ended March 31, 2015 includes $41.1 million of revenues and $0.2 million of net income from MEGTEC. Additionally, the following unaudited pro forma financial information presents our results of operations for the three months ended March 31, 2014 had the acquisition of MEGTEC occurred on January 1, 2013. The unaudited pro forma financial information below is not intended to represent or be indicative of our actual combined results had we completed the acquisition at January 1, 2013. This information is presented for comparative purposes only and should not be taken as representative of our future combined results of operations.
| Three Months Ended March 31, |
||||
| 2014 |
||||
| Revenues |
$ | 391,258 | ||
| Net Income Attributable to The Power Generation Operations of The Babcock & Wilcox Company |
$ | 12,417 | ||
The unaudited pro forma results include the following pre-tax adjustments to the historical results presented above:
| • | Additional amortization expense related to timing of amortization of the fair value of identifiable intangible assets acquired of approximately $0.5 million for the three months ended March 31, 2014. |
| • | Elimination of historical interest expense of approximately $0.3 million for the three months ended March 31, 2014. |
F-56
Table of Contents
NOTE 3 – SPECIAL CHARGES FOR RESTRUCTURING ACTIVITIES
Global Competitiveness Initiative
In the year ended December 31, 2013, the Company announced the Global Competitiveness Initiative (“GCI”) to enhance competitiveness, better position it for growth, and improve profitability. In conjunction with GCI, during the three months ended March 31, 2014, we incurred $0.2 million of expenses related to employee termination benefits and $1.3 million of expenses related to facility consolidation.
Other Restructuring Actions
In the three months ended March 31, 2015, we also incurred $2.4 million of expenses related to facility consolidation in conjunction with the margin improvement program that we announced in 2014.
An analysis of our restructuring liabilities for the three months ended March 31, 2015 and 2014 follows:
| Three Months Ended March 31, |
||||||||
| 2015 |
2014 | |||||||
| (In thousands) | ||||||||
| Liability balance at the beginning of the period |
$ | 8,503 | $ | 8,923 | ||||
| Special charges for restructuring activities(1) |
138 | 545 | ||||||
| Payments |
(4,162) | (4,288) | ||||||
| Translation and other |
(167) | (160) | ||||||
| Liability balance at the end of the period |
$ | 4,312 | $ | 5,020 | ||||
| (1) | Excludes non-cash charges related to fixed asset impairments and accelerated depreciation of $2.3 million and $0.9 million for the three months ended March 31, 2015 and 2014, respectively, which did not impact the restructuring liability. |
At March 31, 2015, unpaid restructuring charges totaled $4.2 million for employee termination benefits and $0.1 million for facility costs. At March 31, 2014, unpaid restructuring charges totaled $4.9 million for employee termination benefits and $0.1 million for facility costs.
NOTE 4 – PENSION PLANS AND POSTRETIREMENT BENEFITS
Components of net periodic benefit cost included in net income are as follows:
| Pension Benefits Three Months Ended |
Other Benefits Three Months Ended |
|||||||||||||||
| 2015 |
2014 |
2015 |
2014 |
|||||||||||||
| (In thousands) | ||||||||||||||||
| Service cost |
$ | 4,197 | $ | 4,923 | $ | 64 | $ | 61 | ||||||||
| Interest cost |
13,726 | 15,342 | 323 | 339 | ||||||||||||
| Expected return on plan assets |
(19,406 | ) | (18,702 | ) | - | - | ||||||||||
| Amortization of prior service cost |
107 | 259 | 7 | 15 | ||||||||||||
| Net periodic benefit cost |
$ | (1,376 | ) | $ | 1,822 | $ | 394 | $ | 415 | |||||||
We made contributions to our pension and postretirement benefit plans in the three months ended March 31, 2015 and 2014 totaling $5.6 million and $6.4 million, respectively.
NOTE 5 – COMMITMENTS AND CONTINGENCIES
Investigations and Litigation
Berlin Station
Our subsidiary, Babcock & Wilcox Construction Co., Inc. (“BWCC”), is currently in a dispute with a customer in connection with a 75MW biomass-energy power plant that BWCC designed and built in Berlin, New Hampshire. The dispute primarily concerns material claims by BWCC against its customer for contract changes
F-57
Table of Contents
relating to schedule delays, delay costs, extra work, withheld payments, improper draws on letters of credit, withheld contract-retention amounts, as well as fraud and misrepresentation. The customer has made nine partial draws totaling approximately $11.0 million under letters of credit that were outstanding in connection with the project. These draws correspond to a total of approximately $11.9 million in alleged liquidated damages for delay (“Delay LDs”) on the project.
Following the customer’s denial of BWCC’s change order request relating to schedule delays, delay costs and extra work incurred up to that time, on January 16, 2014, BWCC filed suit against the customer in the Court of Common Pleas, Summit County, Ohio, Case No. 2014 01 0208, seeking damages in excess of $37 million (the “Ohio suit”). On or about January 30, 2014, BWCC’s customer filed suit against BWCC in the Superior Court of Coos County, New Hampshire, Case No. 214-2014-CV-14 alleging breach of contract and seeking unspecified amounts (the “New Hampshire suit”) which was subsequently transferred to the New Hampshire business/commercial court division. On June 26, 2014, the Ohio suit was dismissed on jurisdictional and forum non conveniens grounds. On August 29, 2014, BWCC filed its Answer, Affirmative Defenses and Counterclaim in the New Hampshire suit seeking recovery of damages. Damages claimed and incurred to date are at least $70 million in connection with all matters currently in dispute.
Given the customer’s prior wrongful acts, there is a risk that the customer will attempt to call all or part of the remaining $21.9 million of letters of credit during the pendency of this matter. We believe any such call would be wrongful and entitle us to a return of the funds drawn and other damages. We have made provisions in our financial statements as disclosed in Note 1 for Delay LDs called to date against the letters of credit and have not recorded offsetting claims revenue related to these calls in our financial statements.
We believe BWCC has sound legal and factual bases for its claims. BWCC intends to aggressively pursue recovery on its claims, including recovery of the wrongful calls against BWCC’s letters of credit. However, it is premature to predict the outcome of this matter. The litigation could be lengthy, and if BWCC’s customer were to prevail completely or substantially in this matter, the outcome could have a material adverse effect on our financial statements.
ARPA
On February 28, 2014, Arkansas River Power Authority (“ARPA”) filed suit against Babcock & Wilcox Power Generation Group, Inc. (“PGG OpCo”) in the United States District Court for the District of Colorado (Case No. 14-cv-00638-CMA-NYW) alleging breach of contract, negligence, fraud and other claims arising out of PGG OpCo’s delivery of a circulating fluidized bed (“CFB”) boiler and related equipment used in the Lamar Repowering Project pursuant to a 2005 contract.
In 2009, PGG OpCo informed ARPA that the boiler would require a selective non-catalytic reduction system in order to achieve contractual emissions guarantees, which PGG OpCo supplied in 2010. PGG OpCo recommended additional modifications in 2011 and 2012 to ensure the boiler would meet contractual emissions guarantees; however, ARPA has not installed all of the recommended modifications. ARPA has not announced whether it intends to complete and commission the Lamar plant.
On April 16, 2014, PGG OpCo filed an Answer asserting numerous defenses, including waiver, prevention of performance and failure to mitigate damages and Counterclaims alleging bad faith, breach of contract and unjust enrichment. ARPA filed an Answer to the Counterclaims on May 7, 2014. The District Court granted leave for ARPA to amend its Complaint, and ARPA’s First Amended Complaint was accepted on March 20, 2015. PGG OpCo filed its Answer to the First Amended Complaint on April 1, 2015. Discovery is ongoing and a trial date has not been set.
We believe that ARPA has asserted damages theories that are highly speculative and without legal or economic support as a litigation tactic. We also believe most of the alleged damages are expressly waived and/or capped in enforceable provisions of the 2005 contract. We cannot estimate the possible loss at this time. However, in addition to establishing other relevant sub-caps and including an explicit waiver of a broad range of damages, including consequential damages, the 2005 contract provides an overall cap of liability at the original contract price of approximately $20.5 million. ARPA has alleged various theories of possible liability and damages that would lead to vastly different measures of damages, making it impracticable to estimate a range of possible outcomes; however, ARPA’s damage claims total approximately $170 million. PGG OpCo does not believe it is probable that
F-58
Table of Contents
ARPA will be successful in any of its claims. PGG OpCo believes it has strong defenses and intends to aggressively defend this matter and pursue its counterclaims. However, if ARPA were to prevail on all or any significant portion of its claims in this matter, the outcome could have a material adverse effect on our financial condition.
Other Litigation and Settlements
On December 17, 2014, an unfavorable jury verdict was delivered against The Babcock & Wilcox Company, Babcock & Wilcox Power Generation Group, Inc., Babcock & Wilcox Nuclear Energy, Inc. and Babcock & Wilcox Canada Ltd (the “Company Parties”) in a case entitled AREVA NP, INC. f/k/a Framatome ANP, Inc. v. The Babcock & Wilcox Company, et. al. in the amount of approximately $16 million. The Company Parties strongly disagree with the verdict and believe the plaintiff’s claims are without merit. The Company Parties have filed a post-trial motion requesting that the verdict be set aside or a new trial granted. On March 5, 2015, the trial court denied a post-trial motion requesting that the verdict be set aside or a new trial granted. The Company Parties have filed a notice of appeal with the Virginia Supreme Court.
The case was filed August 26, 2011 in the Circuit Court for the City of Lynchburg, Commonwealth of Virginia and alleged that the Company Parties to the suit owed royalties on certain commercial nuclear contracts performed by the Company and certain of its subsidiaries since 2004. As a result of the jury’s decision and notwithstanding our evaluation of post-trial remedies, we made provisions in our financial statements in the fourth quarter of 2014, recorded within the Nuclear Energy segment, for the full amount of the jury award.
NOTE 6 – DERIVATIVE FINANCIAL INSTRUMENTS
Our global operations give rise to exposure to market risks from changes in foreign currency exchange (“FX”) rates. We use derivative financial instruments, primarily FX forward contracts, to reduce the impact of changes in FX rates on our operating results. We use these instruments primarily to hedge our exposure associated with revenues or costs on our long-term contracts that are denominated in currencies other than our operating entities’ functional currencies. We do not hold or issue derivative financial instruments for trading or other speculative purposes.
We enter into derivative financial instruments primarily as hedges of certain firm purchase and sale commitments denominated in foreign currencies. We record these contracts at fair value on our condensed combined balance sheets. Depending on the hedge designation at the inception of the contract, the related gains and losses on these contracts are either deferred in stockholders’ equity as a component of accumulated other comprehensive income until the hedged item is recognized in earnings. Any ineffective portion of a derivative’s change in fair value and any portion excluded from the assessment of effectiveness are immediately recognized in other – net on our condensed combined statements of operations. The gain or loss on a derivative instrument not designated as a hedging instrument is also immediately recognized in earnings. Gains and losses on derivative financial instruments that require immediate recognition are included as a component of other– net in our condensed combined statements of operations.
We have designated all of our FX forward contracts that qualify for hedge accounting as cash flow hedges. The hedged risk is the risk of changes in functional-currency-equivalent cash flows attributable to changes in FX spot rates of forecasted transactions related to long-term contracts. We exclude from our assessment of effectiveness the portion of the fair value of the FX forward contracts attributable to the difference between FX spot rates and FX forward rates. At March 31, 2015, we had deferred approximately $1.6 million of net gains on these derivative financial instruments in accumulated other comprehensive income. Assuming market conditions continue, we expect to recognize substantially all of this amount in the next twelve months.
At March 31, 2015, our derivative financial instruments consisted of FX forward contracts. The notional value of our FX forward contracts totaled $170.2 million at March 31, 2015, with maturities extending to August 2017. These instruments consist primarily of contracts to purchase or sell Canadian Dollars, British Pounds Sterling or Euros. We are exposed to credit-related losses in the event of nonperformance by counterparties to derivative financial instruments. We attempt to mitigate this risk by using major financial institutions with high credit ratings. The counterparties to all of our FX forward contracts are financial institutions included in our credit facility. Our hedge counterparties have the benefit of the same collateral arrangements and covenants as described under the Company’s credit facility.
F-59
Table of Contents
The following tables summarize our derivative financial instruments at March 31, 2015 and December 31, 2014:
| Asset and Liability Derivatives | ||||||||
| March 31, | December 31, | |||||||
| 2015 |
2014 |
|||||||
| (In thousands) | ||||||||
| Derivatives Designated as Hedges: |
||||||||
| Foreign Exchange Contracts: |
||||||||
| Location | ||||||||
| Accounts receivable-other |
$ | 3,151 | $ | 541 | ||||
| Other assets |
$ | 1,555 | $ | - | ||||
| Accounts payable |
$ | 3,790 | $ | 2,744 | ||||
| Other liabilities |
$ | 1,768 | $ | 743 | ||||
| Derivatives Not Designated as Hedges: |
||||||||
| Foreign Exchange Contracts: | ||||||||
| Location | ||||||||
| Accounts receivable-other |
$ | 431 | $ | 176 | ||||
| Other assets |
$ | - | $ | - | ||||
| Accounts payable |
$ | 101 | $ | 284 | ||||
The effects of derivatives on our financial statements are outlined below:
| Three Months Ended March 31, |
||||||||
| 2015 |
2014 |
|||||||
| (In thousands) | ||||||||
| Derivatives Designated as Hedges: |
||||||||
| Cash Flow Hedges: |
||||||||
| Foreign Exchange Contracts: |
||||||||
| Amount of loss recognized in other comprehensive income |
$ | (389 | ) | $ | (1,314 | ) | ||
| Gain (loss) reclassified from accumulated other comprehensive income into earnings: effective portion |
||||||||
| Location | ||||||||
| Revenues |
$ | 694 | $ | 163 | ||||
| Cost of operations |
$ | (3,356 | ) | $ | (1,026 | ) | ||
| Other-net |
$ | 63 | $ | 10 | ||||
| Gain recognized in income: portion excluded from effectiveness testing |
||||||||
| Location | ||||||||
| Other-net |
$ | 1,028 | $ | 435 | ||||
| Derivatives Not Designated as Hedges: |
||||||||
| Forward Contracts: |
||||||||
| Gain recognized in income |
||||||||
| Location | ||||||||
| Other-net |
$ | 217 | $ | 67 | ||||
NOTE 7 – FAIR VALUE MEASUREMENTS
Investments
The following is a summary of our available-for-sale securities measured at fair value at March 31, 2015:
| 3/31/15 |
Level 1 |
Level 2 |
Level 3 | |||||||||||||
| (In thousands) | ||||||||||||||||
| Commercial paper |
$ | 5,907 | $ | - | $ | 5,907 | $ | - | ||||||||
| Certificates of deposit |
1,249 | - | 1,249 | - | ||||||||||||
| Asset-backed securities and collateralized mortgage obligations |
258 | - | 258 | - | ||||||||||||
| Total |
$ | 7,414 | $ | - | $ | 7,414 | $ | - | ||||||||
F-60
Table of Contents
The following is a summary of our available-for-sale securities measured at fair value at December 31, 2014:
| 12/31/14 |
Level 1 |
Level 2 |
Level 3 | |||||||||||||
| (In thousands) | ||||||||||||||||
| Commercial paper |
$ | 1,997 | $ | - | $ | 1,997 | $ | - | ||||||||
| Asset-backed securities and collateralized mortgage obligations |
266 | - | 266 | - | ||||||||||||
| Total |
$ | 2,263 | $ | - | $ | 2,263 | $ | - | ||||||||
We estimate the fair value of investments based on quoted market prices. For investments for which there are no quoted market prices, we derive fair values from available yield curves for investments of similar quality and terms.
Derivatives
Level 2 derivative assets and liabilities currently consist of FX forward contracts. Where applicable, the value of these derivative assets and liabilities is computed by discounting the projected future cash flow amounts to present value using market-based observable inputs, including FX forward and spot rates, interest rates and counterparty performance risk adjustments. At March 31, 2015 and December 31, 2014, we had forward contracts outstanding to purchase or sell foreign currencies, primarily Canadian Dollars, British Pound Sterling and Euros, with a total fair value of $(0.5) million and $(3.1) million, respectively.
Other Financial Instruments
We used the following methods and assumptions in estimating our fair value disclosures for our other financial instruments, as follows:
Cash and cash equivalents and restricted cash and cash equivalents. The carrying amounts that we have reported in the accompanying condensed combined balance sheets for cash and cash equivalents and restricted cash and cash equivalents approximate their fair values due to their highly liquid nature.
Long- and short-term debt. We base the fair values of debt instruments on quoted market prices. Where quoted prices are not available, we base the fair values on the present value of future cash flows discounted at estimated borrowing rates for similar debt instruments or on estimated prices based on current yields for debt issues of similar quality and terms. The fair value of our debt instruments approximated their carrying value at March 31, 2015 and December 31, 2014.
Guarantee. In the third quarter of 2014, B&W PGG issued a letter of credit with a four year term totaling approximately $10 million in support of a bank loan borrowed by Thermax Babcock & Wilcox Energy Solutions Private Limited (“TBWES”). TBWES is an unconsolidated affiliate and the letter of credit can be drawn if TBWES defaults on the loan. The fair value of this guarantee is $1.7 million, which was measured at inception and recorded in other liabilities on our combined balance sheet, with an associated increase to our investments in unconsolidated affiliates.
NOTE 8 – STOCK-BASED COMPENSATION
Total stock-based compensation expense for all of our plans recognized for the three months ended March 31, 2015 and 2014 totaled $0.8 million and $0.1 million, respectively, with associated tax benefit recognized for the three months ended March 31, 2015 and 2014 totaling $0.3 million and $0.0 million, respectively.
NOTE 9 – SEGMENT REPORTING
The operations of our segments are managed based on product offerings. Reportable segments operating performance is assessed based on gross profit, excluding special charges for restructuring activities and mark to
F-61
Table of Contents
market adjustments related to our pension and postretirement benefit plans. Segment results have been prepared utilizing the same accounting policies as the condensed combined financial statements. Our reportable segments are Global Power, Global Services, Industrial Environmental and Nuclear Energy as described in Note 1.
| Three Months Ended March 31, |
||||||||
| 2015 |
2014 |
|||||||
| (In thousands) | ||||||||
| REVENUES: |
||||||||
| Global Power |
$ | 123,886 | $ | 110,292 | ||||
| Global Services |
232,174 | 201,786 | ||||||
| Industrial Environmental |
41,095 | - | ||||||
| Nuclear Energy |
22,687 | 35,814 | ||||||
| $ | 419,842 | $ | 347,892 | |||||
| GROSS PROFIT: |
||||||||
| Global Power |
$ | 20,428 | $ | 15,247 | ||||
| Global Services |
53,287 | 41,604 | ||||||
| Industrial Environmental |
9,681 | - | ||||||
| Nuclear Energy |
4,377 | 9,155 | ||||||
| $ | 87,773 | $ | 66,006 | |||||
| Selling, General and Administrative Expenses |
(59,524 | ) | (52,215) | |||||
| Research and Development |
(4,638 | ) | (4,102) | |||||
| Losses on Asset Disposal and Impairments, net |
(15 | ) | - | |||||
| Equity in Income (Loss) of Investees |
(2,071 | ) | 2,366 | |||||
| Special Charges for Restructuring Activities |
(2,446 | ) | (1,478) | |||||
| Total Operating Income |
$ | 19,079 | $ | 10,577 | ||||
| Other Income (Expense): |
||||||||
| Interest income |
156 | 637 | ||||||
| Interest expense |
(142 | ) | (122) | |||||
| Other – net |
(430 | ) | 1,317 | |||||
| Total Other Income |
(416 | ) | 1,832 | |||||
| Income before Provision for Income Taxes |
$ | 18,663 | $ | 12,409 | ||||
NOTE 10 – RELATED PARTY TRANSACTIONS
We are a party to transactions with subsidiaries, divisions and controlled joint ventures of the Company and other Company subsidiaries in the normal course of operations. These transactions include the following:
| Three Months Ended March 31, |
||||||||
| 2015 |
2014 |
|||||||
| (In thousands) | ||||||||
| Sales |
$ | 625 | $ | 2,908 | ||||
| Corporate administrative expense |
$ | 18,011 | $ | 18,332 | ||||
Guarantees
As of March 31, 2015, the Company has outstanding performance guarantees for various projects executed by us. These projects are all in the normal course of business. These guarantees, based on original contract value, total $2,234.2 million and range in expiration dates from 2015 to 2040. The master separation agreement requires that we and the Company use our commercially reasonable efforts to terminate all existing guarantees by one party of obligations relating to the business of the other party, including financial performance and other guarantee obligations.
F-62
Table of Contents
Net transfers (to) from Parent
Net transfers (to) from parent represents the change in the Company’s historical investment in us. It primarily includes the net effect of cost allocations from transactions with the Company, sales to the Company and net transfers of cash and assets to the Company, as follows:
| Three Months Ended March 31, | ||||||||
| 2015 |
2014 |
|||||||
| (In thousands) | ||||||||
| Sales to the Company |
$ (625 | ) | $ (2,908 | ) | ||||
| Corporate administrative expense |
18,011 | 18,332 | ||||||
| Income tax allocation |
4,431 | (4,045 | ) | |||||
| Cash pooling and general financing activities |
(46,672 | ) | 42,738 | |||||
|
|
||||||||
| Net transfers (to) from Parent |
$ (24,855 | ) | $ 54,117 | |||||
|
|
||||||||
NOTE 11 – SUBSEQUENT EVENT
On May 11, 2015, we entered into a new credit agreement in connection with the planned spin-off. The closing date of the new credit agreement and the initial funding thereunder are conditioned on the satisfaction of certain conditions; however, we expect that the new credit agreement will close immediately prior to the completion of the spin-off. The financial covenants, restrictive covenants and events of default described below are not applicable until the closing date thereof, except with respect to breaches of the representations and warranties.
The new credit agreement provides for a five-year, senior secured revolving credit facility in an aggregate amount of up to $600 million, the full amount of which will be available for the issuance of letters of credit. Obligations under the new credit agreement are scheduled to mature on the fifth anniversary of its closing date. The proceeds of loans under the new credit agreement will be available for working capital needs and other general corporate purposes.
The new credit agreement contains an accordion feature that will allow us, subject to the satisfaction of certain conditions, including the receipt of increased commitments from existing lenders or new commitments from new lenders, to increase the amount of the commitments under the revolving credit facility in an aggregate amount not to exceed the sum of (i) $200 million plus (ii) an unlimited amount, so long as for any commitment increase under this subclause (ii) our senior secured leverage ratio (assuming the full amount of any commitment increase under this subclause (ii) is drawn) is equal to or less than 2.0 to 1.0 after giving pro forma effect thereto.
The new credit agreement and our obligations under certain hedging agreements and cash management agreements with our lenders and their affiliates will be (i) guaranteed by substantially all of our wholly owned domestic subsidiaries, but excluding our captive insurance subsidiary, and (ii) secured by first-priority liens on certain assets owned by New B&W and the guarantors.
The new credit agreement requires interest payments on revolving loans on a periodic basis until maturity. We may prepay all loans under the new credit agreement at any time without premium or penalty (other than customary LIBOR breakage costs), subject to notice requirements. The new credit agreement requires us to make certain prepayments on any outstanding revolving loans under the new credit agreement after receipt of cash proceeds from certain asset sales or other events, subject to certain exceptions and a right to reinvest such proceeds in certain circumstances, but such prepayments will not require us to reduce the commitments under the new credit agreement.
Loans outstanding under the new credit agreement will bear interest at our option at either the LIBOR rate plus a margin ranging from 1.375% to 1.875% per year or the base rate (the highest of the Federal Funds rate plus 0.50%, the one month LIBOR rate plus 1.0%, or the administrative agent’s prime rate) plus a margin ranging from 0.375% to 0.875% per year. Starting on the closing date of the new credit agreement, a commitment fee will be charged on the unused portions of the revolving credit facility, and that fee varies between 0.250% and 0.350% per year. Additionally, a letter of credit fee of between 1.375% and 1.875% per year will be charged with respect to the amount of each financial letter of credit issued under the new credit agreement and a letter of credit fee of
F-63
Table of Contents
between 0.825% and 1.125% per year will be charged with respect to the amount of each performance letter of credit issued under the new credit agreement. The applicable margin for loans, the commitment fee and the letter of credit fees set forth above will vary quarterly based on our leverage ratio. Upon the closing of the new credit agreement, we will pay certain upfront fees to the lenders thereunder, and we will pay arrangement and other fees to the arrangers and agents of the new credit agreement.
The new credit agreement includes financial covenants that will be tested on a quarterly basis, based on the rolling four-quarter period that ends on the last day of each fiscal quarter. The maximum permitted leverage ratio is 3.00 to 1.00, which ratio may be increased to 3.25 to 1.00 for up to four consecutive fiscal quarters after a material acquisition. The minimum consolidated interest coverage ratio is 4.00 to 1.00. In addition, the new credit agreement contains various restrictive covenants, including with respect to debt, liens, investments, mergers, acquisitions, dividends, equity repurchases and asset sales.
The new credit agreement generally includes customary events of default for a secured credit facility. If an event of default relating to bankruptcy or other insolvency events with respect to New B&W occurs under the new credit agreement, all obligations under the new credit agreement will immediately become due and payable. If any other event of default exists under the new credit agreement, the lenders will be permitted to accelerate the maturity of the obligations outstanding under the new credit agreement. If any event of default occurs under the new credit agreement, the lenders will be permitted to terminate their commitments thereunder and exercise other rights and remedies, including the commencement of foreclosure or other actions against the collateral.
If any default occurs under the new credit agreement, or if we are unable to make any of the representations and warranties in the new credit agreement, we will be unable to borrow funds or have letters of credit issued under the new credit agreement.
F-64
Table of Contents
THE POWER GENERATION OPERATIONS OF THE BABCOCK & WILCOX COMPANY
UNAUDITED PRO FORMA COMBINED FINANCIAL STATEMENTS
The following unaudited pro forma combined balance sheet as of March 31, 2015 and the unaudited pro forma combined statements of operations for the three months ended March 31, 2015 and 2014 and for the years ended December 31, 2014, 2013 and 2012 are based on a combined reporting entity comprised of the assets and liabilities used in managing and operating the Power Generation business combined with related captive insurance operations which will be contributed by the Company in conjunction with the planned spin-off. The summary unaudited pro forma combined financial information has been prepared to reflect the transfer of the assets and liabilities associated with the Company’s Nuclear Energy segment that are currently part of B&W PGG to the Company. See “Summary Historical and Unaudited Pro Forma Combined Financial Information.” These unaudited pro forma combined financial statements should be read in conjunction with “Management’s Discussion and Analysis of Financial Condition and Results of Operations” and the combined financial statements and the accompanying notes included in this prospectus.
The unaudited pro forma combined statements of operations for the three months ended March 31, 2015 and 2014 and for the years ended December 31, 2014, 2013 and 2012 reflect our results as if the separation and related transaction described above had occurred as of January 1, 2012. The unaudited pro forma combined balance sheet as of March 31, 2015 reflects our results as if the separation and related transactions described above had occurred as of such date.
The unaudited pro forma combined financial statements set forth below are based on available information and assumptions that we believe are factually supportable. The information has been prepared on a combined basis using historical results of operations and bases of assets and liabilities of B&W PGG and includes intercompany allocations of expenses. The costs to operate our business as an independent public entity may exceed the historical allocations of expenses related to areas that include, but are not limited to, litigation and other legal matters, compliance with the Sarbanes-Oxley Act and other corporate governance matters, insurance and claims management and the related cost of insurance, as well as general overall purchasing power. We estimate that B&W PGG will incur annual incremental costs that will range from $14 million to $16 million to replace services previously provided by the Company as well as other stand-alone costs, such as costs to create separate accounting, legal, senior management and tax teams. These amounts are in addition to the amounts currently included in the unaudited pro forma combined financial statements. Due to the scope and complexity of these activities, the amount and timing of these incremental costs could vary and, therefore, are not included in the unaudited pro forma combined financial statements. The unaudited pro forma combined financial statements do not reflect any pro forma adjustments related to the transition services agreements and other agreements that will be entered into in connection with the spin-off because the difference is immaterial between the estimated costs and the allocated costs to New B&W for those services included in New B&W’s historical financial statements. The unaudited pro forma combined financial statements also do not reflect any significant changes that may occur after the spin-off in our financing plans and cost structure, including expenditures related to our growth initiatives.
The unaudited pro forma financial statements are not necessarily indicative of our future performance or what our results of operations and financial position would have been if we had operated as an independent public company during the periods presented or if the transactions reflected in the pro forma adjustments had actually occurred as of the dates assumed.
F-65
Table of Contents
THE POWER GENERATION OPERATIONS OF THE BABCOCK & WILCOX COMPANY
UNAUDITED PRO FORMA CONDENSED COMBINED BALANCE SHEET
AS OF MARCH 31, 2015
| Pro Forma | B&W PGG | |||||||||||
| B&W PGG |
Adjustments(1) |
Pro Forma |
||||||||||
| (In thousands) | ||||||||||||
| ASSETS | ||||||||||||
| Current Assets: |
||||||||||||
| Cash and cash equivalents |
$ | 226,768 | (204 | ) | $ | 226,564 | ||||||
| Restricted cash and cash equivalents |
28,805 | - | 28,805 | |||||||||
| Investments |
7,156 | - | 7,156 | |||||||||
| Accounts receivable – trade, net |
246,575 | (5,890 | ) | 240,685 | ||||||||
| Accounts receivable – other |
43,582 | (1,354 | ) | 42,228 | ||||||||
| Contracts in progress |
133,745 | (30,820 | ) | 102,925 | ||||||||
| Inventories |
99,024 | (1,525 | ) | 97,499 | ||||||||
| Deferred income taxes |
37,924 | 1,596 | 39,520 | |||||||||
| Other current assets |
17,466 | (6,898 | ) | 10,568 | ||||||||
| Total Current Assets |
841,045 | (45,095 | ) | 795,950 | ||||||||
| Property, Plant and Equipment |
413,707 | (80,203 | ) | 333,504 | ||||||||
| Less accumulated depreciation |
261,943 | (58,924 | ) | 203,019 | ||||||||
| Net Property, Plant and Equipment |
151,764 | (21,279 | ) | 130,485 | ||||||||
| Investments |
258 | - | 258 | |||||||||
| Goodwill |
216,618 | (10,054 | ) | 206,564 | ||||||||
| Deferred Income Taxes |
117,478 | (5,938 | ) | 111,540 | ||||||||
| Investments in Unconsolidated Affiliates |
101,103 | - | 101,103 | |||||||||
| Intangible Assets |
46,731 | (910 | ) | 45,821 | ||||||||
| Other Assets |
18,300 | (3,698 | ) | 14,602 | ||||||||
| TOTAL |
$ | 1,493,297 | (86,974 | ) | $ | 1,406,323 | ||||||
| (1) | Reflects the transfer of the assets and liabilities associated with the Company’s Canadian Nuclear Energy segment that are currently part of B&W PGG to the Company. |
F-66
Table of Contents
THE POWER GENERATION OPERATIONS OF THE BABCOCK & WILCOX COMPANY
UNAUDITED CONDENSED COMBINED BALANCE SHEET
AS OF MARCH 31, 2015
| Pro Forma | B&W PGG | |||||||||||
| B&W PGG |
Adjustments(1) |
Pro Forma |
||||||||||
| (In thousands) | ||||||||||||
| LIABILITIES AND PARENT EQUITY | ||||||||||||
| Current Liabilities: |
||||||||||||
| Notes payable and current maturities of long-term debt |
$ | 3,219 | - | $ | 3,219 | |||||||
| Accounts payable |
144,971 | (9,102 | ) | 135,869 | ||||||||
| Accrued employee benefits |
39,033 | (5,303 | ) | 33,730 | ||||||||
| Advance billings on contracts |
179,947 | (5,293 | ) | 174,654 | ||||||||
| Accrued warranty expense |
43,102 | (5,077 | ) | 38,025 | ||||||||
| Accrued liabilities – other |
75,081 | (21,752 | ) | 53,329 | ||||||||
| Total Current Liabilities |
485,353 | (46,527 | ) | 438,826 | ||||||||
| Accumulated Postretirement Benefit Obligation |
34,809 | (7,212 | ) | 27,597 | ||||||||
| Pension Liability |
255,781 | (5,279 | ) | 250,502 | ||||||||
| Other Liabilities |
44,922 | (1,049 | ) | 43,873 | ||||||||
| Commitments and Contingencies (Note 5) |
||||||||||||
| Parent Equity: |
||||||||||||
| Parent Equity |
671,336 | (26,907 | ) | 644,429 | ||||||||
| Noncontrolling interest |
1,096 | - | 1,096 | |||||||||
| Total Parent Equity |
672,432 | (26,907 | ) | 645,525 | ||||||||
| TOTAL |
$ | 1,493,297 | (86,974 | ) | $ | 1,406,323 | ||||||
|
|
||||||||||||
|
|
||||||||||||
| (1) | Reflects the transfer of the assets and liabilities associated with the Company’s Canadian Nuclear Energy segment that are currently part of B&W PGG to the Company. |
F-67
Table of Contents
THE POWER GENERATION OPERATIONS OF THE BABCOCK & WILCOX COMPANY
UNAUDITED PRO FORMA CONDENSED COMBINED STATEMENTS OF OPERATIONS
FOR THE THREE MONTHS ENDED MARCH 31, 2015
| Pro Forma | B&W PGG | |||||||||||
| B&W PGG |
Adjustments(1) |
Pro Forma |
||||||||||
| (In thousands, except per share data) | ||||||||||||
| Revenues |
$ | 419,842 | $ | (22,687 | ) | $ | 397,155 | |||||
| Costs and Expenses: |
||||||||||||
| Cost of operations |
332,069 | (18,311 | ) | 313,758 | ||||||||
| Research and development costs |
4,638 | (120 | ) | 4,518 | ||||||||
| Losses (Gains) on asset disposals and impairments, net |
15 | 3 | 18 | |||||||||
| Selling, general and administrative expenses |
59,524 | (3,806 | ) | 55,718 | ||||||||
| Special charges for restructuring activities |
2,446 | (92 | ) | 2,354 | ||||||||
| Total Costs and Expenses |
398,692 | (22,326 | ) | 376,366 | ||||||||
| Equity in Income (Loss) of Investees |
(2,071 | ) | - | (2,071) | ||||||||
| Operating Income |
19,079 | (361 | ) | 18,718 | ||||||||
| Other Income (Expense): |
||||||||||||
| Interest income |
156 | - | 156 | |||||||||
| Interest expense |
(142 | ) | 2 | (140) | ||||||||
| Other – net |
(430 | ) | 119 | (311) | ||||||||
| Total Other Income (Expense): |
(416 | ) | 121 | (295) | ||||||||
| Income before Provision for Income Taxes |
18,663 | (240 | ) | 18,423 | ||||||||
| Provision for Income Taxes |
5,921 | 124 | 6,045 | |||||||||
| Net Income from Continuing Operations |
$ | 12,742 | $ | (364 | ) | $ | 12,378 | |||||
| Net Income Attributable to Noncontrolling Interest |
(52 | ) | - | (52) | ||||||||
| Net Income from Continuing Operations Attributable to The Power Generation Operations of The Babcock & Wilcox Company |
$ | 12,690 | $ | (364 | ) | $ | 12,326 | |||||
| Earnings per Common Share: |
||||||||||||
| Basic: | ||||||||||||
| Net Income Attributable to Power Generation Operations of The Babcock & Wilcox Company | $ | 0.23 | ||||||||||
| Diluted: | ||||||||||||
| Net Income Attributable to Power Generation Operations of The Babcock & Wilcox Company | $ | 0.23 | ||||||||||
| Shares used in the computation of earnings per share: |
||||||||||||
| Basic(2) |
53,388 | |||||||||||
| Diluted(3) |
53,573 | |||||||||||
| (1) | Reflects the transfer of the assets and liabilities associated with the Company’s Canadian Nuclear Energy segment that are currently part of B&W PGG to the Company. |
| (2) | The pro forma basic weighted average shares outstanding were based on the basic weighted average of Company common shares outstanding for the three months ended March 31, 2015 and 2014 and the years ended December 31, 2014, 2013 and 2012 adjusted for an assumed distribution ratio of one share of New B&W’s common stock for every two Company common shares. |
| (3) | The pro forma diluted weighted average shares outstanding were based on the number of shares utilized to calculate Company dilutive earnings per share for the three months ended March 31, 2015 and 2014 and the years ended December 31, 2014, 2013 and 2012 adjusted for the same distribution ratio. This calculation may not be indicative of the dilutive effect that will actually result from New B&W stock-based awards issued in connection with the adjustment of outstanding Company stock-based awards, which will not be determined until after the distribution date. |
F-68
Table of Contents
THE POWER GENERATION OPERATIONS OF THE BABCOCK & WILCOX COMPANY
UNAUDITED PRO FORMA CONDENSED COMBINED STATEMENTS OF OPERATIONS
FOR THE THREE MONTHS ENDED MARCH 31, 2014
| Pro Forma | B&W PGG | |||||||||||
| B&W PGG |
Adjustments(1) |
Pro Forma |
||||||||||
| (In thousands) | ||||||||||||
| Revenues |
$ | 347,892 | $ | (35,814 | ) | $ | 312,078 | |||||
| Costs and Expenses: |
||||||||||||
| Cost of operations |
281,886 | (26,659 | ) | 255,227 | ||||||||
| Research and development costs |
4,102 | (90 | ) | 4,012 | ||||||||
| Losses (Gains) on asset disposals and impairments, net |
- | - | - | |||||||||
| Selling, general and administrative expenses |
52,215 | (4,330 | ) | 47,885 | ||||||||
| Special charges for restructuring activities |
1,478 | - | 1,478 | |||||||||
| Total Costs and Expenses |
339,681 | (31,079 | ) | 308,602 | ||||||||
| Equity in Income of Investees |
2,366 | - | 2,366 | |||||||||
| Operating Income |
10,577 | (4,735 | ) | 5,842 | ||||||||
| Other Income (Expense): |
||||||||||||
| Interest income |
637 | (8 | ) | 629 | ||||||||
| Interest expense |
(122 | ) | 2 | (120) | ||||||||
| Other – net |
1,317 | (86 | ) | 1,231 | ||||||||
| Total Other Income (Expense): |
1,832 | (92 | ) | 1,740 | ||||||||
| Income before Provision for Income Taxes |
12,409 | (4,827 | ) | 7,582 | ||||||||
| Provision for Income Taxes |
1,204 | (1,871 | ) | (667) | ||||||||
| Net Income from Continuing Operations |
$ | 11,205 | $ | (2,956 | ) | $ | 8,249 | |||||
| Net Income Attributable to Noncontrolling Interest |
(116 | ) | - | (116) | ||||||||
| Net Income from Continuing Operations Attributable to The Power Generation Operations of The Babcock & Wilcox Company |
$ | 11,089 | $ | (2,956 | ) | $ | 8,133 | |||||
| Earnings per Common Share: |
||||||||||||
| Basic: |
||||||||||||
| Net Income Attributable to Power Generation Operations of The Babcock & Wilcox Company | $ | 0.15 | ||||||||||
| Diluted: |
||||||||||||
| Net Income Attributable to Power Generation Operations of The Babcock & Wilcox Company | $ | 0.15 | ||||||||||
| Shares used in the computation of earnings per share: |
||||||||||||
| Basic(2) |
55,220 | |||||||||||
| Diluted(3) |
55,443 | |||||||||||
| (1) | Reflects the transfer of the assets and liabilities associated with the Company’s Canadian Nuclear Energy segment that are currently part of B&W PGG to the Company. |
| (2) | The pro forma basic weighted average shares outstanding were based on the basic weighted average of Company common shares outstanding for the three months ended March 31, 2015 and 2014 and the years ended December 31, 2014, 2013 and 2012 adjusted for an assumed distribution ratio of one share of New B&W’s common stock for every two Company common shares. |
| (3) | The pro forma diluted weighted average shares outstanding were based on the number of shares utilized to calculate Company dilutive earnings per share for the three months ended March 31, 2015 and 2014 and the years ended December 31, 2014, 2013 and 2012 adjusted for the same distribution ratio. This calculation may not be indicative of the dilutive effect that will actually result from New B&W stock-based awards issued in connection with the adjustment of outstanding Company stock-based awards, which will not be determined until after the distribution date. |
F-69
Table of Contents
THE POWER GENERATION OPERATIONS OF THE BABCOCK & WILCOX COMPANY
UNAUDITED PRO FORMA COMBINED STATEMENT OF OPERATIONS
FOR THE YEAR ENDED DECEMBER 31, 2014
| Pro Forma | B&W PGG | |||||||||||
| B&W PGG |
Adjustments(1) |
Pro Forma |
||||||||||
| (In thousands, except per share data) | ||||||||||||
| Revenues |
$ | 1,589,719 | $ | (103,690 | ) | $ | 1,486,029 | |||||
| Costs and Expenses: |
||||||||||||
| Cost of operations |
1,364,357 | (97,360 | ) | 1,266,997 | ||||||||
| Research and development costs |
18,747 | (264 | ) | 18,483 | ||||||||
| Losses (Gains) on asset disposals and impairments, net |
1,087 | 665 | 1,752 | |||||||||
| Selling, general and administrative expenses |
241,699 | (21,735 | ) | 219,964 | ||||||||
| Special charges for restructuring activities |
30,025 | (9,842 | ) | 20,183 | ||||||||
| Total Costs and Expenses |
1,655,915 | (128,536 | ) | 1,527,379 | ||||||||
| Equity in Income of Investees |
8,681 | - | 8,681 | |||||||||
| Operating Income (Loss) |
(57,515 | ) | 24,846 | (32,669) | ||||||||
| Other Income (Expense): |
||||||||||||
| Interest income |
1,170 | (110 | ) | 1,060 | ||||||||
| Interest expense |
(503 | ) | 11 | (492) | ||||||||
| Other – net |
1,156 | (366 | ) | 790 | ||||||||
| Total Other Income (Expense): |
1,823 | (465 | ) | 1,358 | ||||||||
| Income (Loss) before Provision for (Benefit from) Income Taxes |
(55,692 | ) | 24,381 | (31,311) | ||||||||
| Provision for (Benefit from) Income Taxes |
(29,528 | ) | 6,167 | (23,361) | ||||||||
| Net Income (Loss) from Continuing Operations |
$ | (26,164 | ) | $ | 18,214 | $ | (7,950) | |||||
| Net Income Attributable to Noncontrolling Interest |
(365 | ) | - | (365) | ||||||||
| Net Income (Loss) from Continuing Operations Attributable to The Power Generation Operations of The Babcock & Wilcox Company |
$ | (26,529 | ) | $ | 18,214 | $ | (8,315) | |||||
| Earnings per Common Share: |
||||||||||||
| Basic: |
||||||||||||
| Net Income Attributable to the Power Generation |
||||||||||||
| Operations of The Babcock & Wilcox Company |
$ | (0.15 | ) | |||||||||
| Diluted: |
||||||||||||
| Net Income Attributable to the Power Generation |
||||||||||||
| Operations of The Babcock & Wilcox Company |
$ | (0.15 | ) | |||||||||
| Shares used in the computation of earnings per share: |
||||||||||||
| Basic(2) |
54,239 | |||||||||||
| Diluted(3)(4) |
54,239 | |||||||||||
| (1) | Reflects the transfer of the assets and liabilities associated with the Company’s Canadian Nuclear Energy segment that are currently part of B&W PGG to the Company. |
| (2) | The pro forma basic weighted average shares outstanding were based on the basic weighted average of Company common shares outstanding for the three months ended March 31, 2015 and 2014 and the years ended December 31, 2014, 2013 and 2012 adjusted for an assumed distribution ratio of one share of New B&W’s common stock for every two Company common shares. |
| (3) | The pro forma diluted weighted average shares outstanding were based on the number of shares utilized to calculate Company dilutive earnings per share for the three months ended March 31, 2015 and 2014 and the years ended December 31, 2014, 2013 and 2012 adjusted for the same distribution ratio. This calculation may not be indicative of the dilutive effect that will actually result from New B&W stock-based awards issued in connection with the adjustment of outstanding Company stock-based awards, which will not be determined until after the distribution date. |
| (4) | We recognized a net loss in the year ended December 31, 2014 and as a result excluded the effect of 141,915 shares as their effect would have been anti-dilutive. |
F-70
Table of Contents
THE POWER GENERATION OPERATIONS OF THE BABCOCK & WILCOX COMPANY
UNAUDITED PRO FORMA COMBINED STATEMENT OF OPERATIONS
FOR THE YEAR ENDED DECEMBER 31, 2013
| Pro Forma | B&W PGG | |||||||||||
| B&W PGG |
Adjustments(1) |
Pro Forma |
||||||||||
| (In thousands, except per share data) | ||||||||||||
| Revenues |
$ | 1,921,163 | $ | (153,513) | $ | 1,767,650 | ||||||
| Costs and Expenses: |
||||||||||||
| Cost of operations |
1,426,889 | (95,719 | ) | 1,331,170 | ||||||||
| Research and development costs |
22,882 | (1,839 | ) | 21,043 | ||||||||
| Losses (Gains) on asset disposals and impairments, net |
1,153 | 28 | 1,181 | |||||||||
| Selling, general and administrative expenses |
207,106 | (12,874 | ) | 194,232 | ||||||||
| Special charges for restructuring activities |
26,346 | (8,003 | ) | 18,343 | ||||||||
| Total Costs and Expenses |
1,684,376 | (118,407 | ) | 1,565,969 | ||||||||
| Equity in Income of Investees |
18,387 | - | 18,387 | |||||||||
| Operating Income |
255,174 | (35,106 | ) | 220,068 | ||||||||
| Other Income (Expense): |
||||||||||||
| Interest income |
1,527 | (251 | ) | 1,276 | ||||||||
| Interest expense |
(471 | ) | 9 | (462) | ||||||||
| Other – net |
791 | 653 | 1,444 | |||||||||
| Total Other Income (Expense): |
1,847 | 411 | 2,258 | |||||||||
| Income before Provision for Income Taxes |
257,021 | (34,695 | ) | 222,326 | ||||||||
| Provision for Income Taxes |
82,206 | (7,662 | ) | 74,544 | ||||||||
| Net Income from Continuing Operations |
$ | 174,815 | $ | (27,033 | ) | $ | 147,782 | |||||
| Net Income Attributable to Noncontrolling Interest |
(289 | ) | - | (289) | ||||||||
| Net Income from Continuing Operations Attributable to The Power Generation Operations of The Babcock & Wilcox Company |
$ | 174,526 | $ | (27,033 | ) | $ | 147,493 | |||||
| Earnings per Common Share: |
||||||||||||
| Basic: |
||||||||||||
| Net Income Attributable to the Power Generation |
||||||||||||
| Operations of The Babcock & Wilcox Company |
$ | 2.64 | ||||||||||
| Diluted: |
||||||||||||
| Net Income Attributable to the Power Generation |
||||||||||||
| Operations of The Babcock & Wilcox Company |
$ | 2.62 | ||||||||||
| Shares used in the computation of earnings per share: |
||||||||||||
| Basic(2) |
55,951 | |||||||||||
| Diluted(3) |
56,343 | |||||||||||
| (1) | Reflects the transfer of the assets and liabilities associated with the Company’s Canadian Nuclear Energy segment that are currently part of B&W PGG to the Company. |
| (2) | The pro forma basic weighted average shares outstanding were based on the basic weighted average of Company common shares outstanding for the three months ended March 31, 2015 and 2014 and the years ended December 31, 2014, 2013 and 2012 adjusted for an assumed distribution ratio of one share of New B&W’s common stock for every two Company common shares. |
| (3) | The pro forma diluted weighted average shares outstanding were based on the number of shares utilized to calculate Company dilutive earnings per share for the three months ended March 31, 2015 and 2014 and the years ended December 31, 2014, 2013 and 2012 adjusted for the same distribution ratio. This calculation may not be indicative of the dilutive effect that will actually result from New B&W stock-based awards issued in connection with the adjustment of outstanding Company stock-based awards, which will not be determined until after the distribution date. |
F-71
Table of Contents
THE POWER GENERATION OPERATIONS OF THE BABCOCK & WILCOX COMPANY
UNAUDITED PRO FORMA COMBINED STATEMENT OF OPERATIONS
FOR THE YEAR ENDED DECEMBER 31, 2012
| Pro Forma | B&W PGG | |||||||||||
| B&W PGG |
Adjustments(1) |
Pro Forma |
||||||||||
| (In thousands, except per share data) | ||||||||||||
| Revenues |
$ | 2,039,100 | $ | (253,141 | ) | $ | 1,785,959 | |||||
| Costs and Expenses: |
||||||||||||
| Cost of operations |
1,573,391 | (181,362 | ) | 1,392,029 | ||||||||
| Research and development costs |
26,018 | (3,066 | ) | 22,952 | ||||||||
| Losses (Gains) on asset disposals and impairments, net |
3,276 | - | 3,276 | |||||||||
| Selling, general and administrative expenses |
247,931 | (25,223 | ) | 222,708 | ||||||||
| Special charges for restructuring activities |
- | - | - | |||||||||
| Total Costs and Expenses |
1,850,616 | (209,651 | ) | 1,640,965 | ||||||||
| Equity in Income of Investees |
17,402 | - | 17,402 | |||||||||
| Operating Income |
205,886 | (43,490 | ) | 162,396 | ||||||||
| Other Income (Expense): |
||||||||||||
| Interest income |
1,451 | (37 | ) | 1,414 | ||||||||
| Interest expense |
(567 | ) | 4 | (563) | ||||||||
| Other – net |
(1,553 | ) | (441 | ) | (1,994) | |||||||
| Total Other Income (Expense): |
(669 | ) | (474 | ) | (1,143) | |||||||
| Income before Provision for Income Taxes |
205,217 | (43,964 | ) | 161,253 | ||||||||
| Provision for Income Taxes |
64,323 | (10,144 | ) | 54,179 | ||||||||
| Net Income from Continuing Operations |
$ | 140,894 | $ | (33,820 | ) | $ | 107,074 | |||||
| Net Income Attributable to Noncontrolling Interest |
(141 | ) | - | (141) | ||||||||
| Net Income from Continuing Operations Attributable to The Power Generation Operations of The Babcock & Wilcox Company |
$ | 140,753 | $ | (33,820 | ) | $ | 106,933 | |||||
| Earnings per Common Share: |
||||||||||||
| Basic: |
||||||||||||
| Net Income Attributable to the Power Generation |
||||||||||||
| Operations of The Babcock & Wilcox Company |
$ | 1.81 | ||||||||||
| Diluted: |
||||||||||||
| Net Income Attributable to the Power Generation |
||||||||||||
| Operations of The Babcock & Wilcox Company |
$ | 1.80 | ||||||||||
| Shares used in the computation of earnings per share: |
||||||||||||
| Basic(2) |
59,209 | |||||||||||
| Diluted(3) |
59,211 | |||||||||||
| (1) | Reflects the transfer of the assets and liabilities associated with the Company’s Canadian Nuclear Energy segment that are currently part of B&W PGG to the Company. |
| (2) | The pro forma basic weighted average shares outstanding were based on the basic weighted average of Company common shares outstanding for the three months ended March 31, 2015 and 2014 and the years ended December 31, 2014, 2013 and 2012 adjusted for an assumed distribution ratio of one share of New B&W’s common stock for every two Company common shares. |
| (3) | The pro forma diluted weighted average shares outstanding were based on the number of shares utilized to calculate Company dilutive earnings per share for the three months ended March 31, 2015 and 2014 and the years ended December 31, 2014, 2013 and 2012 adjusted for the same distribution ratio. This calculation may not be indicative of the dilutive effect that will actually result from New B&W stock-based awards issued in connection with the adjustment of outstanding Company stock-based awards, which will not be determined until after the distribution date. |
F-72
Table of Contents
Dealer Prospectus Delivery Obligation
Until , 2015 (25 days after the date of this prospectus), all dealers that effect transactions in these securities, whether or not participating in this offering, may be required to deliver a prospectus. This is in addition to each dealer’s obligation to deliver a prospectus when acting as underwriter and with respect to unsold allotments or subscriptions.
Table of Contents
PART II
INFORMATION NOT REQUIRED IN PROSPECTUS
ITEM 13. OTHER EXPENSES OF ISSUANCE AND DISTRIBUTION.
The following table sets forth the costs and expenses payable by the registrant in connection with the issuance of the securities being registered. All amounts are estimates except the Securities and Exchange Commission registration fee.
| Item |
Amount | |||
| Securities and Exchange Commission registration fee |
$ | 8,135 | ||
| Legal fees and expenses |
$ | 50,000 | ||
| Accounting fees and expenses |
$ | 18,500 | ||
| Printing expenses |
$ | 80,000 | ||
| Miscellaneous expenses |
$ | 8,365 | ||
|
|
|
|||
| Total |
$ | 165,000 | ||
ITEM 14. INDEMNIFICATION OF DIRECTORS AND OFFICERS.
Delaware Law
Section 145 of the General Corporation Law of the State of Delaware provides that a corporation may indemnify directors and officers as well as other employees and individuals against expenses including attorney’s fees, judgments, fines and amounts paid in settlement in connection with various actions, suits or proceedings, whether civil, criminal, administrative or investigative (other than an action by or in the right of the corporation, such as a derivative action), if they acted in good faith and in a manner they reasonably believed to be in or not opposed to the best interests of the corporation, and, with respect to any criminal action or proceeding, if they had no reasonable cause to believe their conduct was unlawful. A similar standard is applicable in the case of any actions by or in the right of the corporation, except that indemnification only extends to expenses, including attorneys’ fees, incurred in connection with the defense or settlement of such actions, and the statute requires court approval before there can be any indemnification where the person seeking indemnification has been found liable to the corporation. The statute provides that it is not exclusive of other indemnification that may be granted by a corporation’s certificate of incorporation, bylaws, agreement, a vote of stockholders or disinterested directors or otherwise.
Certificate of Incorporation and Bylaws
Our certificate of incorporation will provide that a director of the corporation shall not be personally liable to the corporation or its stockholders for monetary damages for breach of fiduciary duties as a director, except for liability (a) for any breach of that director’s duty of loyalty to us or our stockholders, (b) for acts or omissions not in good faith or which involve intentional misconduct or a knowing violation of law, (c) under Section 174 of the General Corporation Law of the State of Delaware, as the same exists or as the provision hereafter may be amended, supplemented or replaced, or (d) for any transactions from which that director derived an improper personal benefit.
Our bylaws provide that we will indemnify and hold harmless, to the fullest extent permitted by applicable law as it presently exists or may be amended, any person who was or is made or is threatened to be made a party or is otherwise involved in any action, suit or proceeding, whether civil, criminal, administrative or investigative, by reason of the fact that such person or a person for whom such person is the legal representative, is or was a director or officer of us or, while a director or officer of us, is or was serving at our request as a director, officer, employee or agent of another corporation or of a partnership, joint venture, limited liability company, trust or other enterprise, including service with respect to employee benefit plans, against all liability and losses suffered and expenses (including attorneys’ fees) incurred by such person in connection with such action, suit or proceeding. Our bylaws also provide that we will pay the expenses incurred by a director or officer in defending any such proceeding in advance of its final disposition, subject to such person providing us with specified undertakings. Notwithstanding the foregoing, our bylaws provide that we shall be required to indemnify or make advances to a person in connection with a proceeding (or part thereof) initiated by such person only if the proceeding (or part thereof) was authorized by our board of directors. These rights are not exclusive of any other right that any person
II-1
Table of Contents
may have or may acquire under any statute, provision of our certificate of incorporation, bylaws, agreement, vote of stockholders or disinterested directors or otherwise. No amendment, modification or repeal of those provisions will in any way adversely affect any right or protection under those provisions of any person in respect of any act or omission occurring prior to the time of such amendment, modification or repeal.
Our bylaws also permit us to secure and maintain insurance on behalf of any of our directors, officers, employees or agents and each person who is, or was, serving at our request as a director, officer, employee or agent of another corporation, partnership, joint venture, limited liability company, trust or other enterprise for any liability asserted against and incurred by such person in any such capacity. We intend to obtain directors’ and officers’ liability insurance providing coverage to our directors and officers.
Director and Officer Indemnification Agreements
We intend to enter into indemnification agreements with each of our directors and executive officers that will require us to indemnify such persons to the fullest extent permitted by Delaware law, from claims and losses arising from their service to us (other than certain claims brought by the indemnified party against us or any of our officers and directors). The agreements also are expected to provide each indemnified person with expense advancement to the extent the expenses arise from, or might reasonably be expected to arise from, an indemnifiable claim and are expected to contain additional terms meant to facilitate a determination of the indemnified person’s entitlement to such benefits. Section 145 of the Delaware General Corporation Law provides that a corporation may indemnify directors and officers as well as other employees and individuals against expenses including attorneys’ fees, judgments, fines and amounts paid in settlement in connection with various actions, suits or proceedings, whether civil, criminal, administrative or investigative (other than an action by or in the right of the corporation, such as a derivative action), if they acted in good faith and in a manner they reasonably believed to be in or not opposed to the best interests of the corporation, and, with respect to any criminal action or proceeding, if they had no reasonable cause to believe their conduct was unlawful. A similar standard is applicable in the case of any actions by or in the right of the corporation, except that indemnification only extends to expenses, including attorneys’ fees, incurred in connection with the defense or settlement of such actions, and the statute requires court approval before there can be any indemnification where the person seeking indemnification has been found liable to the corporation. The statute provides that it is not exclusive of other indemnification that may be granted by a corporation’s certificate of incorporation, bylaws, agreement, a vote of stockholders or disinterested directors or otherwise.
Our certificate of incorporation will provide that we will indemnify and hold harmless, to the fullest extent permitted by applicable law as it presently exists or may be amended, any person who was or is made or is threatened to be made a party or is otherwise involved in any action, suit or proceeding, whether civil, criminal, administrative or investigative, by reason of the fact that such person or a person for whom such person is the legal representative, is or was a director or officer of us or, while a director or officer of us, is or was serving at our request as a director, officer, employee or agent of another corporation or of a partnership, joint venture, limited liability company, trust or other enterprise, including service with respect to employee benefit plans, against all liability and losses suffered and expenses (including attorneys’ fees) incurred by such person in connection with such action, suit or proceeding. Our certificate of incorporation will also provide that we will pay the expenses incurred by a director or officer in defending any such proceeding in advance of its final disposition, subject to such person providing us with specified undertakings. Notwithstanding the foregoing, our certificate of incorporation will provide that we will be required to indemnify or make advances to a person in connection with a proceeding (or part thereof) initiated by such person only if the proceeding (or part thereof) was authorized by our board of directors. These rights are not exclusive of any other right that any person may have or may acquire under any statute, provision of our certificate of incorporation, bylaws, agreement, vote of stockholders or disinterested directors or otherwise. No amendment, modification or repeal of those provisions will in any way adversely affect any right or protection under those provisions of any person in respect of any act or omission occurring prior to the time of such amendment, modification or repeal.
Our certificate of incorporation will also permit us to secure and maintain insurance on behalf of any of our directors, officers, employees or agents and each person who is, or was, serving at our request as a director, officer, employee or agent of another corporation, partnership, joint venture, limited liability company, trust or other enterprise for any liability asserted against and incurred by such person in any such capacity. We intend to obtain directors’ and officers’ liability insurance providing coverage to our directors and officers.
II-2
Table of Contents
ITEM 15. RECENT SALES OF UNREGISTERED SECURITIES.
On January 13, 2015, we issued 1,000 shares to the Company in connection with our formation pursuant to Section 4(a)(2) of the Securities Act. We did not register the issuance of these shares under the Securities Act because such issuance did not constitute a public offering.
ITEM 16. EXHIBITS AND FINANCIAL STATEMENT SCHEDULES.
(a) Exhibits
See Exhibit Index.
(b) Financial Statement Schedules
INDEX TO COMBINED FINANCIAL STATEMENTS
II-3
Table of Contents
ITEM 17. UNDERTAKINGS.
The undersigned registrant hereby undertakes:
| (1) | To file, during any period in which offers or sales are being made, a post-effective amendment to this registration statement: |
| (i) | To include any prospectus required by section 10(a)(3) of the Securities Act of 1933; |
| (ii) | To reflect in the prospectus any facts or events arising after the effective date of the registration statement (or the most recent post-effective amendment thereof) which, individually or in the aggregate, represent a fundamental change in the information set forth in the registration statement. Notwithstanding the foregoing, any increase or decrease in volume of securities offered (if the total dollar value of securities offered would not exceed that which was registered) and any deviation from the low or high end of the estimated maximum offering range may be reflected in the form of prospectus filed with the Commission pursuant to Rule 424(b) if, in the aggregate, the changes in volume and price represent no more than 20% change in the maximum aggregate offering price set forth in the “Calculation of Registration Fee” table in the effective registration statement; |
| (iii) | To include any material information with respect to the plan of distribution not previously disclosed in the registration statement or any material change to such information in the registration statement. |
| (2) | That, for the purpose of determining any liability under the Securities Act of 1933, each such post-effective amendment shall be deemed to be a new registration statement relating to the securities offered therein, and the offering of such securities at that time shall be deemed to be the initial bona fide offering thereof. |
| (3) | To remove from registration by means of a post-effective amendment any of the securities being registered which remain unsold at the termination of the offering. |
| (6) | That, for the purpose of determining liability of the registrant under the Securities Act of 1933 to any purchaser in the initial distribution of the securities: |
The undersigned registrant undertakes that in a primary offering of securities of the undersigned registrant pursuant to this registration statement, regardless of the underwriting method used to sell the securities to the purchaser, if the securities are offered or sold to such purchaser by means of any of the following communications, the undersigned registrant will be a seller to the purchaser and will be considered to offer or sell such securities to such purchaser:
| (i) | Any preliminary prospectus or prospectus of the undersigned registrant relating to the offering required to be filed pursuant to Rule 424; |
| (ii) | Any free writing prospectus relating to the offering prepared by or on behalf of the undersigned registrant or used or referred to by the undersigned registrant; |
| (iii) | The portion of any other free writing prospectus relating to the offering containing material information about the undersigned registrant or its securities provided by or on behalf of the undersigned registrant; and |
| (iv) | Any other communication that is an offer in the offering made by the undersigned registrant to the purchaser. |
Insofar as indemnification for liabilities arising under the Securities Act of 1933 may be permitted to directors, officers and controlling persons of the registrant pursuant to the foregoing provisions, or otherwise, the registrant has been advised that in the opinion of the Securities and Exchange Commission such indemnification is against public policy as expressed in the Act and is, therefore, unenforceable. In the event that a claim for
II-4
Table of Contents
indemnification against such liabilities (other than the payment by the registrant of expenses incurred or paid by a director, officer or controlling person of the registrant in the successful defense of any action, suit or proceeding) is asserted by such director, officer or controlling person in connection with the securities being registered, the registrant will, unless in the opinion of its counsel the matter has been settled by controlling precedent, submit to a court of appropriate jurisdiction the question whether such indemnification by it is against public policy as expressed in the Act and will be governed by the final adjudication of such issue.
II-5
Table of Contents
SIGNATURES
Pursuant to the requirements of the Securities Act of 1933, the registrant has duly caused this registration statement to be signed on its behalf by the undersigned, thereunto duly authorized, in the City of Charlotte, State of North Carolina, on June 25, 2015.
| Babcock & Wilcox Enterprises, Inc. | ||||
| By: |
/s/ Jenny L. Apker | |||
| Name: |
Jenny L. Apker | |||
| Title: |
Senior Vice President and Chief Financial Officer | |||
Pursuant to the requirements of the Securities Act of 1933, this registration statement has been signed by the following persons in the capacities indicated on June 25, 2015.
| Signature |
Title | |
| * E. James Ferland |
Chairman and Chief Executive Officer (Principal Executive Officer) and Director | |
| * Jenny L. Apker |
Senior Vice President and Chief Financial Officer (Principal Financial Officer) | |
| * Daniel W. Hoehn |
Vice President, Controller and Chief Accounting Officer (Principal Accounting Officer) | |
| * Thomas A. Christopher |
Director | |
| * Brian K. Ferraioli |
Director | |
| * Stephen G. Hanks |
Director | |
| * Larry L. Weyers |
Director | |
| * | This Registration Statement has been signed on behalf of the above officers and directors by Jenny L. Apker, as attorney-in-fact pursuant to a power of attorney previously filed as Exhibit 24.1 to this registration statement. |
| DATED: June 25, 2015 |
By: | /s/ Jenny L. Apker | ||||
| Jenny L. Apker, Attorney-in-Fact |
Table of Contents
EXHIBIT INDEX
| Exhibit Number |
Description of Exhibits | |
| 2.1** | Form of Master Separation Agreement | |
| 3.1* | Form of Amended and Restated Certificate of Incorporation | |
| 3.2* | Form of Amended and Restated Bylaws | |
| 5.1 | Opinion of Jones Day | |
| 10.1** | Form of Tax Sharing Agreement | |
| 10.2* | Form of Employee Matters Agreement | |
| 10.3* | Form of Transition Services Agreement (The Babcock & Wilcox Company as service provider) | |
| 10.4* | Form of Transition Services Agreement (Babcock & Wilcox Enterprises, Inc. as service provider) | |
| 10.5* | Form of Assumption and Loss Allocation Agreement by and among ACE American Insurance Company and the Ace Affiliates (as defined therein), Babcock & Wilcox Enterprises, Inc. and The Babcock & Wilcox Company | |
| 10.6* | Form of Reinsurance Novation and Assumption Agreement by and among ACE American Insurance Company and the Ace Affiliates (as defined therein), Creole Insurance Company and Dampkraft Insurance Company | |
| 10.7* | Form of Novation and Assumption Agreement by and among The Babcock & Wilcox Company, Babcock & Wilcox Enterprises, Inc., Dampkraft Insurance Company and Creole Insurance Company | |
| 10.8* | Form of 2015 Long-Term Incentive Plan of Babcock & Wilcox Enterprises, Inc. | |
| 10.9* | Form of Babcock & Wilcox Enterprises, Inc. Executive Incentive Compensation Plan | |
| 10.10* | Form of Babcock & Wilcox Enterprises, Inc. Management Incentive Compensation Plan | |
| 10.11* | Form of Supplemental Executive Retirement Plan of Babcock & Wilcox Enterprises, Inc. | |
| 10.12* | Form of Babcock & Wilcox Enterprises, Inc. Defined Contribution Restoration Plan | |
| 10.13* | Form of Director and Officer Indemnification Agreement | |
| 10.14* | Employment Agreement among The Babcock & Wilcox Company, Babcock & Wilcox Power Generation Group, Inc. and E. James Ferland | |
| 10.15* | Form of Restructuring Transaction Retention Agreement between the Babcock & Wilcox Company and certain of our executive officers | |
| 10.16* | Restructuring Transaction Retention Agreement between The Babcock & Wilcox Company and E. James Ferland | |
| 10.17* | Restructuring Transaction Severance Agreement between The Babcock & Wilcox Company and J. Randall Data, dated November 5, 2014. | |
| 10.18** | Form of Change-in-Control Agreement | |
| 10.19** | Credit Agreement, dated as of May 11, 2015, among Babcock & Wilcox Enterprises, Inc. as the Borrower, Bank of America, N.A., as Administrative Agent, and the Other Lenders Party Thereto | |
| 10.20* | Form of Executive Severance Plan | |
| 10.21** | Form of Intellectual Property Agreement between Babcock & Wilcox Power Generation Group, Inc. and BWXT Foreign Holdings, LLC | |
| 10.22** | Form of Intellectual Property Agreement between Babcock & Wilcox Technology, Inc. and Babcock & Wilcox Investment Company | |
Table of Contents
| Exhibit Number |
Description of Exhibits | |
| 10.23** | Form of Intellectual Property Agreement between Babcock & Wilcox Canada Ltd. and B&W PGG Canada Corp. | |
| 10.24** | Form of Intellectual Property Agreement between Babcock & Wilcox mPower, Inc. and Babcock & Wilcox Power Generation Group, Inc. | |
| 10.25** | Form of Intellectual Property Agreement between The Babcock & Wilcox Company and Babcock & Wilcox Enterprises, Inc. (previously filed as Exhibit 10.26) | |
| 21.1** | List of Subsidiaries | |
| 23.1 | Consent of Independent Registered Public Accounting Firm | |
| 23.2 | Consent of Jones Day (included in Exhibit 5.1) | |
| 24.1*** | Powers of Attorney | |
| 99.1*** | Consent of Cynthia S. Dubin | |
| 99.2*** | Consent of Anne R. Pramaggiore | |
| * | Incorporated by reference from the corresponding exhibit filed as an exhibit to Amendment No. 2 to our Registration Statement on Form 10 (File No. 001-36876), filed May 6, 2015. |
| ** | Incorporated by reference from the corresponding exhibit filed as an exhibit to Amendment No. 3 to our Registration Statement on Form 10 (File No. 001-36876), filed May 21, 2015. |
| *** | Incorporated by reference from our Registration Statement on Form S-1 (File No. 333-204812), filed June 8, 2015. |