Attached files
| file | filename |
|---|---|
| 8-K - FORM 8-K - Chemours Co | d944143d8k.htm |
 The
Chemours Company Investor Presentation
June 2015 Exhibit 99.1 |
 Safe
Harbor 1
This presentation contains certain supplemental measures of performance that are not
required by, or presented in accordance with, generally accepted
accounting principles in the United States (“GAAP”). Such measures should not be considered as replacements of GAAP. Further information with respect to and reconciliations of such measures to the nearest GAAP measure can be found in the
appendix hereto. Historical results are presented on a carve-out basis from DuPont historical results, and are subject to certain adjustments and
assumptions as indicated in this presentation, and may not be an
indicator of future performance. The information in this document has been prepared to assist you in making your own evaluation of Chemours and does not purport
to be all-inclusive or to contain all of the information that you may consider
material or desirable in evaluating Chemours. You should perform your own
independent investigation and analysis to ensure that you have the information you consider material or desirable in making your informed decision.
Furthermore, information in this document and statements made in the related
presentation that are not historical facts are forward- looking
statements. These statements relate to our current expectations, estimates and projections and are not a guarantee of future performance and involve known and unknown risks, uncertainties and assumptions that are difficult to predict. Forward-looking
statements are based on assumptions as to future events that may not prove to be
accurate. Actual outcomes and results may differ materially from what is
expressed or forecasted in the forward-looking statements. Accordingly, no representation or warranty is made as to the accuracy or completeness of the accompanying financial information. We undertake no obligation to update or revise
any forward-looking statements, whether as a result of new information, future
events or otherwise. For a more detailed discussion of Chemours’
risks and uncertainties, see the “Risk Factors” contained in the Chemours’ registration statement on Form 10, as amended from time to time, filed with the Securities and Exchange Commission. Additional information for investors is available on the company’s website at investors.chemours.com
|
 Separation
Update Exchange / Ticker
NYSE: CC Key Dates When-issued trading date: June 19, 2015 Record date: June 23, 2015 Distribution date: July 1, 2015 Regular-way trading date: July 1, 2015 Tax Impact Tax-free distribution under Section 355 and Section 368(a)(1)(D) of the Internal Revenue Code of 1986 Private Letter ruling received from the IRS Distribution Ratio 1 share of CC for every 5 shares of DD; cash for fractional shares Corporate Credit Rating* Moody’s: Ba3 S&P: BB 2 *A rating is not a recommendation to buy, sell or hold securities and may be subject to revision or withdrawal at any time
|
 Today’s Presenters from Chemours
Mark Vergnano President & CEO Mr. Vergnano has been Executive Vice President at DuPont responsible for businesses in the Performance Chemicals segment since 2009 Prior to his current role, Mr. Vergnano held leadership positions at DuPont Nonwovens, DuPont Surfaces & Building Innovations and DuPont Safety & Protection
Mark Newman SVP & CFO Mr. Newman joined Chemours in November 2014 from SunCoke Energy where he was Senior Vice President and CFO He joined SunCoke’s leadership team in March 2011 to lead the IPO of SunCoke
from Sunoco and later led the formation of SunCoke Partners
Alisha Bellezza Director, Investor Relations Ms. Bellezza joined Chemours in May 2015 from FMC Corporation where she was the Director of Investor Relations While at FMC, she held a number of leadership positions in finance and strategy 3 |
 Why
Chemours? Undisputed
global leader in titanium dioxide (TiO 2 ) and fluoroproducts Proprietary products and brands to drive above-average growth Low cost position provides stability through the trough Global Market Leader with Premier Cost Position Titanium Technologies – Altamira expansion Fluoroproducts – Opteon ® adoption Chemical Solutions – Potential Cyanide expansion in Mexico Multiple Organic Growth Opportunities Streamline cost structure Reduce working capital Assess Chemical Solutions portfolio Lower capital expenditure post-Altamira expansion Near-Term Cost Reductions / Proactive Portfolio Management Utilize free cash flow to drive growth and reward shareholders with significant additional upside once TiO 2 cycle turns 4 |
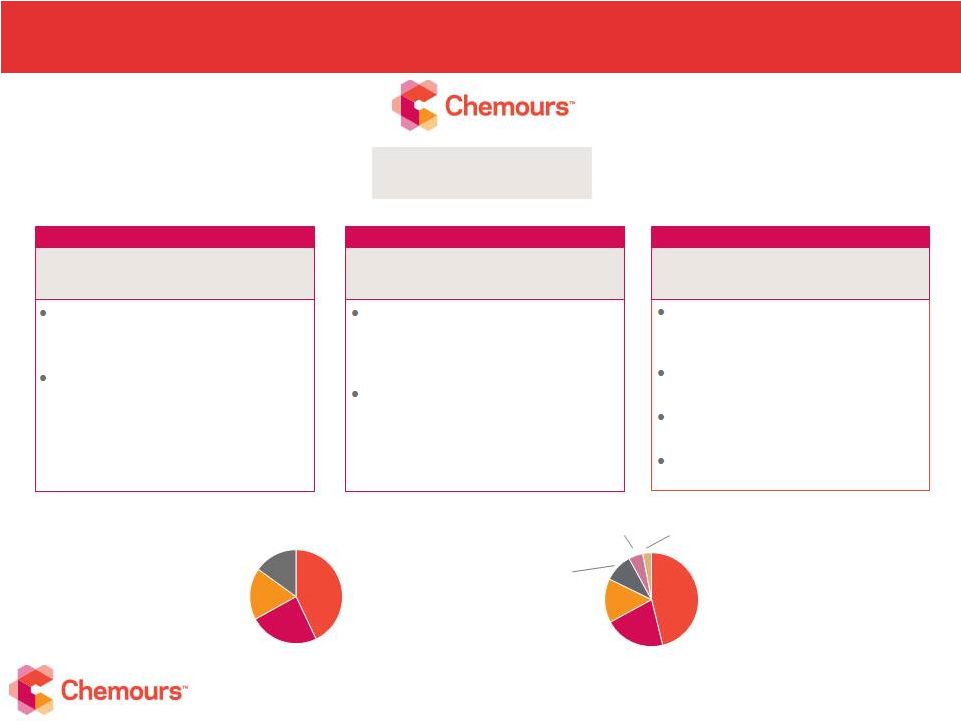 Chemicals used in gold production, oil
refining, agriculture, industrial
polymers and other industries
#1 producer in Americas sodium
cyanide #1 in US Northeast sulfuric acid regeneration #2 in US Gulf Coast sulfuric acid regeneration 2014 Sales: $6,432 2014 Adj. EBITDA: 895 % margin: 14% Titanium Technologies Sales: $2,937 Adj. EBITDA: 759 %
margin:
26% Fluoroproducts
Sales: $2,327 Adj. EBITDA: 330 %
margin:
14% Chemical Solutions Sales: $1,168 Adj. EBITDA: 29 % margin:
2% By Geography By Product Dollars in millions. Data represents full year 2014. Adjusted EBITDA includes
corporate and other charges which are not reflected in individual segment Adjusted EBITDA. Geographic and
product data reflect full year 2014 sales. 5
Titanium dioxide (TiO2) is a pigment
used to deliver whiteness, opacity,
brightness and protection from sunlight
#1 global producer of TiO2 by
capacity, sales and profitability
Products for high performance
applications across broad array of
industries, including refrigerants,
propellants and industrial resins
#1 global producer of both fluorochemicals and fluoropolymers North America 43% Asia Pacific 24% EMEA 18% Latin America 15% Titanium Dioxide Fluoropolymers 21% Fluorochemicals 15% Performance Chemicals & Intermediates 10% Cyanides 5% Sulfur Products 3% 46% The Chemours Company at a Glance |
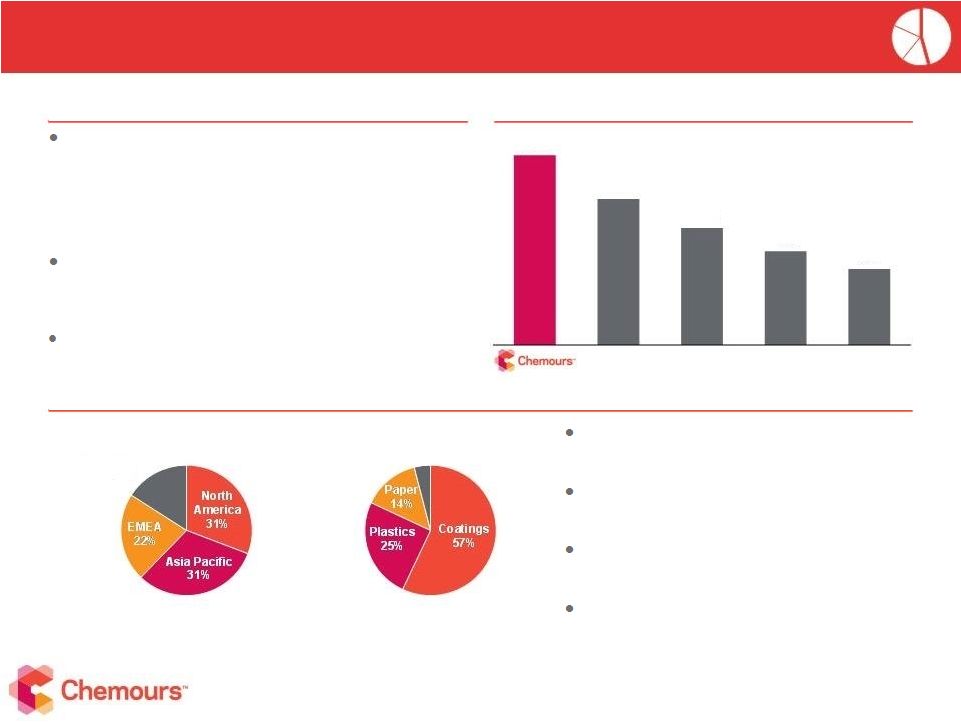 Global leader in TiO 2 with production capacity of 1.4 million metric tons (1) - 5 TiO2 plants with 8 production lines (1) - Packaging facility at Kallo, Belgium - Mineral sands mine at Starke, FL Industry-leading manufacturing cost position - Unique chloride technology - Feedstock flexibility Strong brand reputation - Ti-Pure® sold to ~850 customers globally Business Overview Titanium Technologies Business Overview Chemours is #1 in TiO 2 Globally (2) Coatings – architectural, industrial, automotive Plastics – rigid / flexible packaging, PVC pipe/windows Papers – laminate papers, coated paper/paperboard, sheet Specialty – rubber, leather, diesel particulate filters Geography (4) End Market (4) Source: Company filings and data. Titanium Technologies: TZMI (2014) (1) Pro forma for completion of Altamira expansion in mid-2016 (2) TiO2 market share statistics based on production per TZMI (3) Pro forma for Rockwood acquisition (Sachtleben) (4) Reflects full year 2014 segment net sales 6 (3) Other 4% Latin America 16% 18% 14% 11% 9% 7% Huntsman Cristal Kronos Tronox TT |
 Chemours Manufacturing Advantages Three largest TiO 2 facilities in the world (1) - Lower fixed cost per unit Proprietary technology and process - Flexibility to use variety of ore feedstocks enabling one of the lowest cost of production - 2 – 4x higher throughput versus peers Industry leading reliability and product quality consistency 7 World Class Assets with Industry-Leading TiO 2 Cost Structure Industry Cost Structure 2014 Production (kMT) (1) Altamira is pro forma for expansion which is scheduled to come online in mid-2016
(2) Source:Company filings: Chemours, Huntsman, and Tronox Adjusted EBITDA values include pro rata portion of corporate costs and eliminations; Average 2014 Adjusted EBITDA margin for
Huntsman (Pigments), Kronos and Tronox (Pigments) Source: TZMI EBITDA Margin versus Key TiO2 Competitors (2) ($ / metric ton) Contained TiO2 95% 50% Pricing arbitrage of ~$550/ton Chloride Slag Rutile Synthetic Rutile UGS Chloride Ilmenite Chinese /Other Producers Other Multinational Companies Global Industry Weighted Average Feedstock Prices % Margin Differential Source: TZMI Average Competitor Margin Scale Benefit / (Lower Fixed Cost Per Unit) Feedstock Flexibility / Purchasing High Value Offering Chemours TT 2014 Adjusted EBITDA Margin 11% 21% $0 $400 $800 $1,200 $1,600 $2,000 2012 2013 2014E TT |
 200,000
metric ton capacity expansion at Altamira, Mexico facility
Production scheduled to start up in mid-2016
Total capital spending of ~$600 million
~85% completed prior to spin date
Expansion Value Proposition
One of the lowest cost production lines globally
Adds low-cost capacity and provides incremental
fixed cost leverage Provides Chemours with the option to either increase production capacity or improve overall efficiency of production circuit When fully utilized, expected to deliver ~$200 million
EBITDA at today’s global price for
TiO2 and ores
At current volumes, Altamira can deliver ~$20 – $70
million of net EBITDA cost benefit, depending on ore price (1) Project Status Altamira Expansion Provides Meaningful Upside 8 Altamira Expansion Strengthens Chemours’ Optionality in Every Part of the Cycle
Capex spent prior to spin date
Altamira Expansion Capital Spending
(1) Assuming TiO2 demand does not exceed Chemours’ current supply capability Capex spent after spin date 2011 2012 2013 2014 2015E 2016E |
 TiO 2 Market Environment 9 Note: Non-U.S. sales are translated at average FX for the quarter (1) Average days of sales of TiO2 inventory for Chemours, Huntsman (Pigments), Kronos, and Tronox (Pigments) (2) Q4 2014E industry pricing statistic per management estimates based on trade data and discussions with independent consultants as of
3/25/15 (3)
Represent average price for the period
Global TiO 2 Capacity, Demand, Utilization Rate Source: TZMI Note: Capacity and utilization rate statistics based on TZMI’s effective capacity data
Producer Days of Sales of Inventory
Source: Company filings and equity research Global TiO 2 Price Global, High-quality TiO2 Price (US$ / metric ton) Average Quarterly Prices Commentary Capacity utilization rate improving Producer inventory levels have declined from peak Ore prices stabilizing Rutile Feedstock Price (US$ / metric ton) (2) Average Annual Prices $2500 $800 Source: TZMI Q1 2015 (February 2015) TT 94% 83% 82% 89% 86% 72% 79% 82% 2007 2008 2009 2010 2011 2012 2013 2014E Capacity Demand Utilization Rate (End of Year) 85 86 61 51 54 66 61 54 58 Q3'12 Q4'12 Q1'13 Q2'13 Q3'13 Q4'13 Q1'14 Q2'14 Q3'14 $0 $500 $1,000 $1,500 $2,000 $2,500 $3,000 $3,500 $4,000 2007 2008 2009 2010 2011 2012 2013 2014E Q1'14 Q2'14 Q3'14 Q4'14E (3) (3) (1) |
 Chemours is #1 in Fluoroproducts Globally (2) Supplies products for high performance applications across broad array of industries #1 in Fluoroproducts globally Fluorochemicals: #1 in refrigerants, #1 in propellants, #3 in foaming agents Fluoropolymers: #1 in industrial resins, #1 in fluoropolymer specialties Key Brands include Teflon ® , Freon ® , Opteon ® , Viton ® Business Overview Fluoroproducts Business Overview Geography (1) Product (1) Source: Company filings and data, Fluoroproducts: Company filings and Management estimates
(1)Reflects full year 2014 segment net sales
(2)Fluorochemicals and fluoropolymers market share statistics based on internal revenue estimates and company filings (3)Includes 100% contribution from the DuPont-Mitsui Fluorocarbon Company joint venture
10 (3) Fluoropolymers – mainly industrial resins and downstream products & coatings Fluorochemicals – mainly refrigerants, propellants, and foam expansion agent Key End Markets – AC, refrigeration, automotive, aerospace, consumer, wire & cable, electronics and telecommunications F-P F-C Fluoropolymers 57% Fluorochemicals 43% North America 45% Asia Pacific 23% Latin America 11% EMEA 21% |
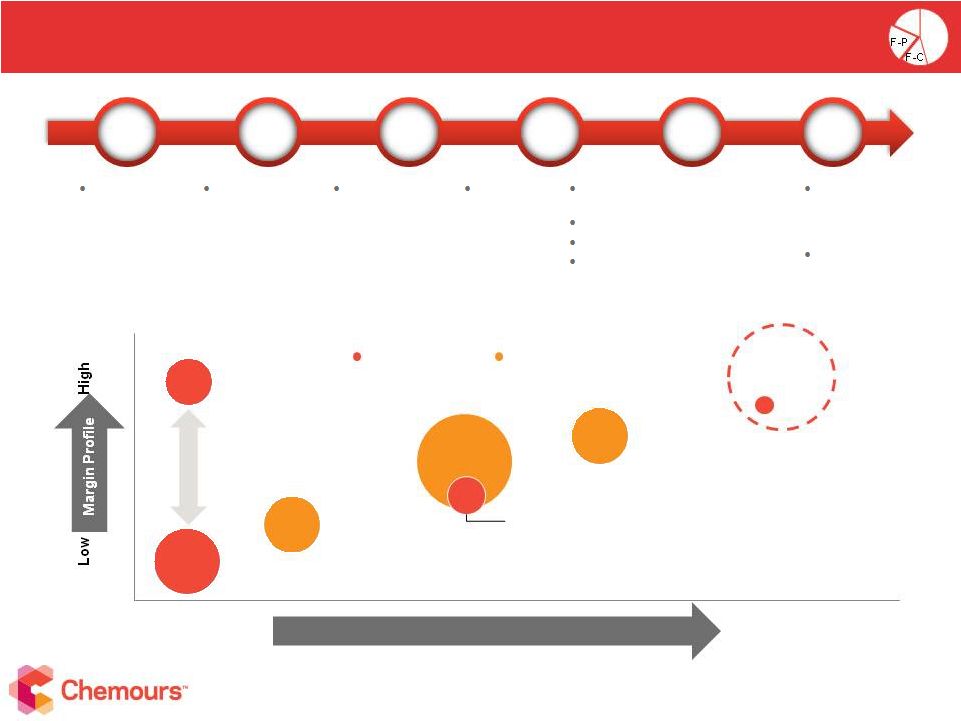 Today Established Technology Innovation and Margin Enhancement 11 Note: Bubble sizes reflect 2014 sales contribution (1) Reflects potential market opportunity per management estimates Opteon ® , Blends Margins range based on the regulatory cycle Teflon ® PTFE Patented / Proprietary Commodity Degree of Product Differentiation Base refrigerants Potential Market Opportunity (1) Fire extinguishants and propellants Base refrigerants Coatings, lubricants, and ion exchange materials 2010s 1930s 1970s 1987 1990s 2000 & Beyond DuPont identifies HFC as a CFC replacement 2011 – First commercial shipment Opteon ® refrigerant HFO 1336 foaming agent development DuPont commercializes non-ozone depleting HFC Montreal Protocol details phase out of CFC / HCFC over 35 year period DuPont commercializes Freon ® CFC and HCFC DuPont introduces ISCEON ® HFC blends as drop-in replacement for HCFC Ongoing transition from HCFC to HFC 2006 – EU bans HFC in cars as of 2012 2007 – DuPont & Honeywell jointly develop Opteon ® CFCs = Chlorofluorocarbons; HCFCs = Hydrochlorofluorocarbons; HFCs = Hydrofluorocarbons; HFOs = Hydrofluoro-Olefins
Fluorochemicals Fluoropolymers Melts & Viton ® |
 Chemical Solutions Portfolio
Diverse portfolio of industrial and specialty
businesses primarily operating in the Americas
Unmatched reputation for safety, reliability and
stewardship Leading market position and technological capabilities 13 production facilities located in North America and one located in the U.K. Overview Chemical Solutions Overview Source: Company filings and data (1) Reflects full year 2014 segment net sales 12 Cyanides – sodium cyanide, hydrogen cyanide, potassium cyanide Sulfur Products – non-fuming sulfuric acid, spent acid regeneration, sulfur derivatives Performance Chemicals and Intermediates – aniline, methylamines, reactive metals, clean and disinfect chemicals Market leadership Favorable end market dynamics Selective, high-return investment opportunities Individual businesses and niches with different profit / return profiles Actions required to enhance productivity and reduce cost Challenging economic fundamentals Cyanides Sulfur Products Aniline Clean & Disinfect Chemicals Methylamines Reactive Metals Geography (1) Product (1) North America 70% Latin America 17% Asia Pacific 8% EMEA 5% Performance Chemicals and Intermediates 53% Cyanides 27% Sulfur Products 20% |
 Titanium Technologies Altamira Expansion (~85% of capital spending completed prior to spin) Expected to start up mid-2016 Fluoroproducts Opteon® – Next-generation refrigerant Growth expected to accelerate through 2017 Potential Mexico Expansion Chemical Solutions – Cyanides Potential benefits in 2017 Incremental Adjusted EBITDA beginning 2016 Segment Project Comments Sensitivity: $50/ metric ton (i.e. ~2%) price increase corresponds to ~$50 million increase in segment Adjusted EBITDA Multiple Organic Growth Opportunities 13 |
 Attractive Margins Throughout the Cycle
Performance Chemicals Segment as Historically Reported
14 ($ in millions) Source: DuPont filings Note: Reflects Performance Chemicals segment Operating Earnings (unaudited) as historically reported, excluding significant items and depreciation of property, plant and equipment and amortization of intangible assets. Segment operating earnings exclude significant items in all periods, as previously reported; does not include adjustments for
carve-out. Adjusted EBITDA and Adjusted EBITDA margin exclude
corporate allocation (1) Performance Chemicals segment Operating Earnings as defined by DuPont + D&A (depreciation & amortization)
Generated substantial EBITDA (1) in industry downturn $949 $888 $1,521 $2,426 $2,118 $1,268 $1,179 2008 2009 2010 2011 2012 2013 2014 Performance Chemicals Operating Earnings + D&A Performance Chemicals Operating Earnings + D&A margin 15% 17% 23% 30% 28% 18% 18% |
 Expected Free Cash Flow Improvements
Capital Expenditures and % of Sales
Adjusted EBITDA and Margin
(1) Sales and Growth Historical Financial Performance ($ in millions) ($ in millions) (6%) (8%) (7%) 10% 6% 6% 4% 15 $20 – 70 million of cost benefits from Altamira expansion at current volumes (3) New product ramp in Fluoroproducts Chemical Solutions portfolio optimization Meaningful opportunity to reduce structural costs, including SG&A Normalized capital expenditures of ~$300-350 million expected post-Altamira expansion (1) Adjusted EBITDA includes corporate and other charges which are not reflected in individual segment Adjusted EBITDA
(2) Capex include $11 million of purchases of plant, property and equipment
included in accounts payable excluded from the Combined Statements of Cash Flows (3) Depending on ore price and assuming TiO2 demand does not exceed Chemours’ current supply capability Altamira Other ($ in millions) 14% 26% 14% 28% Expected Free Cash Flow Improvements $2,223 $1,883 $982 $895 $1,622 $1,454 $722 $759 $688 $539 $377 $330 $112 $116 $96 $29 ($199) ($226) ($213) ($223) 2011 2013 2014 Titanium Technologies Fluoroproducts Chemical Solutions Corporate & Other $3,674 $3,291 $3,019 $2,937 $2,834 $2,559 $2,379 $2,327 $1,464 $1,515 $1,461 $1,168 $7,972 $7,365 $6,859 $6,432 2011 2012 2013 2014 $354 $279 $388 $78 $159 $227 $355 $432 $438 $615 (2) 2011 2012 2013 2014 2012 |
 Q1 2015
Recent Developments Q1 2015 Recent Developments
16 1Q15 sales for Chemours down 13% versus 1Q14; 1Q15 EBITDA down 28% versus 1Q14 – Lower volume and prices combined with the negative currency impact, primarily in the Euro-USD rate
– Total demand for Fluorochemicals was up slightly versus the prior year o Strong demand for Chemours’ next generation refrigerant, Opteon ® on continued adoption by automotive OEMs In 2Q15, accelerated implementation of a restructuring plan to address continued weakness in the global
titanium dioxide market cycle and continued foreign currency impacts
– Expected to generate savings of $40 million in 2015 and approximately $80 million annually in subsequent years
LTM Q1’15 Financial Performance
Quarter Ended March 31,
($mm) FY 2014 2014 2015 Y-o-Y % Change LTM Ended March 31, 2015 Titanium Technologies $2,937 $709 $545 (23%) $2,773 Fluoroproducts 2,327 579 552 (5%) 2,300 Chemical Solutions 1,168 281 266 (5%) 1,153 Total Sales $6,432 $1,569 $1,363 (13%) $6,226 Total Adjusted EBITDA (1) $895 $202 $145 (28%) $838 Titanium Technologies $376 Fluoroproducts 133 Chemical Solutions 106 Total Capital Expenditures (2) $615 $131 $137 5% $621 (1) Adjusted EBITDA includes corporate and other charges which are not reflected in individual segment Adjusted EBITDA
(2) Capex include $11 million of purchases of plant, property and equipment
included in accounts payable excluded from the Combined Statements of Cash Flows |
 Liquidity Capitalization – Day 1 Chemours Capitalization ($ in millions) 17 Net Debt / LTM Adjusted EBITDA (4) at ~4.5x as at 3/31/15 5-year $1,000mm senior secured revolving credit facility (undrawn) Source: Management and Company filings (1) €360mm translated at Euro to USD exchange rate on May 12, 2015 (the debt issuance date)
(2) Except for a frozen non-qualified pension restoration plan and a U.S. OPEB plan sponsored by an
unconsolidated equity investment
(3) A rating is not a recommendation to buy, sell or hold securities and may be subject to revision or
withdrawal at any time (4) Based on LTM Adjusted EBITDA of $838 million Cash and Cash Equivalents $ 200 Term Loan $ 1,500 Senior Notes 8-Year USD $ 1,350 10-Year USD 750 8-Year Euro (1) 403 Total Senior Notes $ 2,503 Funded Debt $ 4,003 Net Debt 3,803 Credit Ratings S&P Moody's Corporate Credit Rating (3) BB Ba3 Other Liabilities No U.S. pension or OPEB plans (2) Minimal unfunded non-U.S. pension liability Other liabilities are well understood, well- managed and related to the Chemours business Future availability will depend on LTM EBITDA performance Covenants allow for maximum leverage of 5.75x net debt / LTM EBITDA – – |
 Significant Productivity
Improvements Portfolio Optimization Headcount Rationalization / Operational Cost Reductions Evaluate and Fix or Exit Unprofitable Businesses 2014 Capital Expenditure: $615 million Normalized Capital Expenditure: ~$300 – $350 million Reduced Capital Expenditure Additional annual cash flow generation to pay down debt and return capital to shareholders
Initiative Action Focus on Free Cash Flow Generation 18 |
 Disciplined Capital Deployment Strategy
(1) Other than certain open market stock repurchases, limited to 20% of the Chemours stock outstanding as of the spin date 19 • Repay debt to strengthen credit position • Select investments to reduce cost structure, enhance portfolio and drive • Fund strategic capital investments with free cash flow and portfolio actions organic growth • $100M dividend payable September 2015; ongoing dividend policy in sole discretion of Chemours Board • Tax sharing agreement precludes stock repurchases in first two years (1) De-lever Invest/Grow Return Cash to Shareholders |
 Why
Chemours? Undisputed global leader in titanium dioxide and
fluoroproducts Proprietary products and brands to drive above-average
growth Low cost position provides stability through the
trough Global Market
Leader with Premier Cost Position Titanium Technologies – Altamira expansion Fluoroproducts – Opteon ® adoption Chemical Solutions – Potential Cyanide expansion in Mexico Multiple Organic Growth Opportunities Streamline cost structure Reduce working capital Assess Chemical Solutions portfolio Lower capital expenditure post-Altamira expansion Near-Term Cost Reductions / Proactive Portfolio Management Utilize free cash flow to drive growth and reward shareholders with significant additional upside once TiO 2 cycle turns 20 |
 Appendix
|
 22 Reconciliation of Performance Chemicals Segment Operating Earnings Year Year Year Year Year Year Year 2008 2009 2010 2011 2012 2013 2014 Segment Pre-tax Operating Income (PTOI) (GAAP) (1) 619 555 1,254 2,162 1,826 941 913 Add: Significant Items - Pre-tax 56 54 (10) - 36 74 21 Segment Operating Earnings (Non-GAAP) 675 609 1,244 2,162 1,862 1,015 934 Add: Depreciation & Amortization (1) 274 279 277 264 256 253 245 Segment Adjusted EBITDA (Non-GAAP) 949 888 1,521 2,426 2,118 1,268 1,179 (1) Note: The data above provides a historical display of Selected Income Statement Data included in the Quarterly Earnings Release
financials of E.I. DuPont de Nemours and Company and Consolidated Subsidiaries. See
Quarterly Earnings Release financials for full details, including details
on "Significant Items". Prior periods reflect the reclassifications
of Viton ®
fluoroelastomers from Performance Materials to Performance Chemicals within the results of E.I. DuPont de Nemours and Company and Consolidated Subsidiaries. RECONCILIATION OF SEGMENT PRE-TAX OPERATING INCOME (PTOI) TO OPERATING EARNINGS AND SEGMENT ADJUSTED EBITDA RECONCILIATION OF NON-GAAP MEASURES (UNAUDITED) (dollars in millions) |
 Reconciliation of Adjusted EBITDA
23 RECONCILIATION OF ADJUSTED EBITDA TO CONSOLIDATED INCOME STATEMENTS Year Year Year 1Q15 2014 4Q14 3Q14 2Q14 1Q14 2013 2012 Income Before Income Taxes $58 $550 $120 $142 $156 $132 $576 $1,485 Add: Non-Operating Pension & OPEB Costs 7 22 4 5 8 5 114 127 Add: Exchange Losses / (Gains) 16 66 37 33 (5) 1 31 5 Add: Depreciation and Amortization 64 257 72 57 64 64 261 266 Adjusted EBITDA $145 $895 $233 $237 $223 $202 $982 $1,883 RECONCILIATION OF NON-GAAP MEASURES (UNAUDITED) (dollars in millions) |
 ©2015 The Chemours Company.
Chemours™ and the Chemours Logo are trademarks or registered trademarks of The Chemours Company |