Attached files
| file | filename |
|---|---|
| EX-99.1 - EX-99.1 - Bankrate, Inc. | rate-20150617ex991eb5eb1.htm |
| EX-99.2 - EX-99.2 - Bankrate, Inc. | rate-20150617xex992.htm |
| 8-K - 8-K - Bankrate, Inc. | rate-20150617x8k.htm |
 Bankrate, Inc. Bankrate, Inc. (NYSE:RATE) FY 2014 and Q1 2015 Earnings Call June 2015
 This document is not intended as a full business or financial review and should be viewed in the context of all of the information made available by us in our filings with the Securities and Exchange Commission (“SEC”). To the extent there is any discrepancy between this document and the content of our SEC filings, the SEC filings are the authoritative sources of information. Cautionary Statement Regarding Forward-Looking Information Certain matters included in this document may be “forward-looking statements” within the meaning of the Private Securities Litigation Reform Act of 1995. Those statements include statements regarding the intent, belief or current expectations of the Company and members of our management team. Such forward-looking statements include, without limitation, statements made with respect to future revenue, revenue growth, market acceptance of our products, our strategy and profitability. Investors and prospective investors are cautioned that any such forward-looking statements are not guarantees of future performance and involve risks and uncertainties, and that actual results may differ materially from those contemplated by such forward-looking statements. We derive many of our forward-looking statements from our operating budgets and forecasts, which are based upon many detailed assumptions. While we believe that our assumptions are reasonable, we caution that it is very difficult to predict the impact of known or unknown factors, and it is impossible for us to anticipate all factors that could affect our actual results. Important factors currently known to management that could cause actual results to differ materially from those in forward-looking statements include the following: the timing and outcome of, including potential expense associated with, the SEC and Department of Justice (“DOJ”) investigations including our ability to enter into a settlement with the SEC on terms consistent with those described in our Annual Report on Form 10-K for the year ended December 31, 2014 (“2014 10-K”) and our Quarterly Report on Form 10-Q for the quarter ended March 31, 2015 (“Q1 2015 10-Q”); the potential impact on our business and stock price of any announcements regarding the restatement detailed in our 2014 10-K, the SEC's investigation or the DOJ's investigation; the material weakness in our internal controls over financial reporting and our ability to rectify this issue completely and promptly; risks relating to the defense or litigation of lawsuits, including the putative securities class action lawsuit currently pending and described in our 2014 10-K and Q1 2015 10-Q, and regulatory proceedings; the timing and outcome of (including potential expense associated with), and the potential impact on our business and stock price of any announcements regarding, the Consumer Financial Protection Bureau investigation described in our 10-K and Q1 2015 10-Q; the willingness or interest of banks, lenders, brokers, credit card issuers, insurance carriers and agents, senior care providers and other advertisers in the business verticals in which we operate to advertise on our websites or mobile applications, or purchase our leads, clicks, calls and referrals; the rate of conversion of consumers’ visits to our websites or mobile applications into senior care referrals and the rate at which those referrals result in move-ins with our senior care customers; changes in application approval rates by our credit card issuer customers; increased competition and its effect on our website traffic, advertising rates, margins, and market share; our dependence on internet search engines to attract a significant portion of the visitors to our websites; our dependence on partners to attract a significant portion of the company’s revenue; shift of visitors from desktop to mobile and mobile app environments; the number of consumers seeking information about the financial and senior care products we have on our websites or mobile applications; interest rate volatility; technological changes; our ability to anticipate and manage cybersecurity risk and data security risk; the effects of any security breach or any cyberattack on our systems, websites or mobile applications; our ability to manage traffic on our websites or mobile applications, and service interruptions; our ability to maintain and develop our brands and content; the fluctuations of our results of operations from period to period; our indebtedness and the effect such indebtedness may have on our business; our need and our ability to incur additional debt or equity financing; our ability to integrate the operations and realize the expected benefits of businesses that we have acquired and may acquire in the future; the effect of unexpected liabilities we assume from our acquisitions; the effect of programmatic advertising platforms on display revenue; our ability to successfully execute on our strategies, including without limitation our insurance quality initiative, our mobile strategy and other initiatives, and the effectiveness of our strategies, including without limitation whether they result in increased revenue or profitability; our ability to attract and retain executive officers and personnel; any failure or refusal by our insurance providers to provide coverage under our insurance policies; our ability to protect our intellectual property; the effects of facing liability for content on our websites or mobile applications; our ability to establish and maintain distribution arrangements; our ability to maintain good working relationships with our customers and third-party providers and to continue to attract new customers; the effect of our expansion of operations in the United Kingdom and possible expansion to other international markets, in which we may have limited experience, and our ability to successfully execute on our business strategies in international markets; our ability to sell our operations in China in excess of its book value; the willingness of consumers to accept the Internet and our online network as a medium for obtaining financial product information; the strength of the U.S. economy in general and the financial services industry in particular; changes in monetary and fiscal policies of the U.S. government; changes in consumer spending and saving habits; review of our business and operations by regulatory authorities; changes in the legal and regulatory environment; changes in accounting principles, policies, practices or guidelines; risks relating to the ongoing reviews of our business and operations by regulatory authorities; and our ability to manage the risks involved in the foregoing. For more information about factors that could cause actual results to differ materially from our expectations, refer to our reports filed with the SEC, including the discussion without limitation under “Risk Factors” in our 2014 10-K along with any modifications or updates to those “Risk Factors” in our Quarterly Reports on Form 10-Q. These documents are available on the SEC’s website at www.sec.gov. Any factor described above or in our SEC reports could, by itself or together with one or more other factors, adversely affect our financial results and condition. We caution you that the foregoing list of important factors may not contain all of the material factors that are important to you. We undertake no obligation to update or revise forward-looking statements as a result of new information, future events or otherwise, except as otherwise required by law. Non-GAAP Measures To supplement Bankrate’s financial statements presented in accordance with generally accepted accounting principles (“GAAP”), Bankrate uses non-GAAP measures of certain components of financial performance, including EBITDA, Adjusted EBITDA and Adjusted EPS, which are adjusted from results based on GAAP to exclude certain expenses, gains and losses. These non-GAAP measures are provided to enhance investors’ overall understanding of Bankrate’s current financial performance and its prospects for the future. Specifically, Bankrate believes the non-GAAP results provide useful information to both management and investors by excluding certain expenses, gains and losses that may not be indicative of its core operating results. In addition, because Bankrate has historically reported certain non-GAAP results to investors, Bankrate believes the inclusion of non-GAAP measures provides consistency in its financial reporting. These measures should be considered in addition to results prepared in accordance with GAAP, but should not be considered a substitute for, or superior to, GAAP results. The non-GAAP measures included in this document have been reconciled to the nearest GAAP measure in the financial tables found in the “Supplemental Information” section of this document. FORWARD-LOOKING STATEMENTS
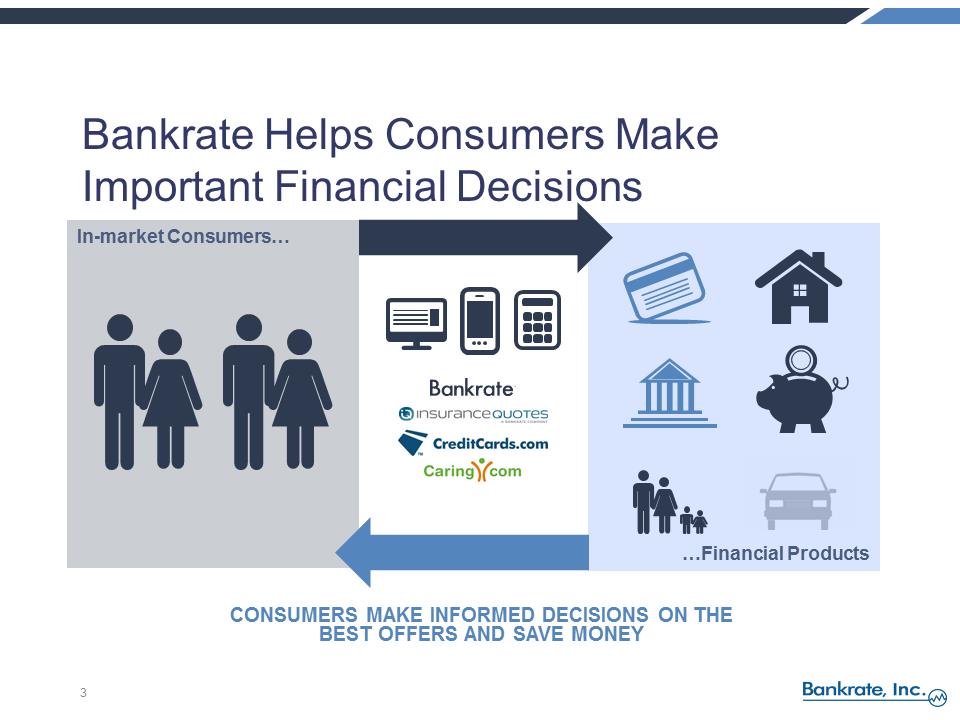 car.jpgBankrate Helps Consumers Make Important Financial Decisions 3 bankrate-logo-blue.epshttp://photos.prnewswire.com/prn/20090210/CCLOGOhttp://www.blindfiveyearold.com/wp-content/uploads/2010/06/Caring_Logo.gifhttps://www.insurancequotes.com/autocss/logos/insurancequotes_com_2-logo.png…Financial Products CONSUMERS MAKE INFORMED DECISIONS ON THE BEST OFFERS AND SAVE MONEY In-market Consumers…
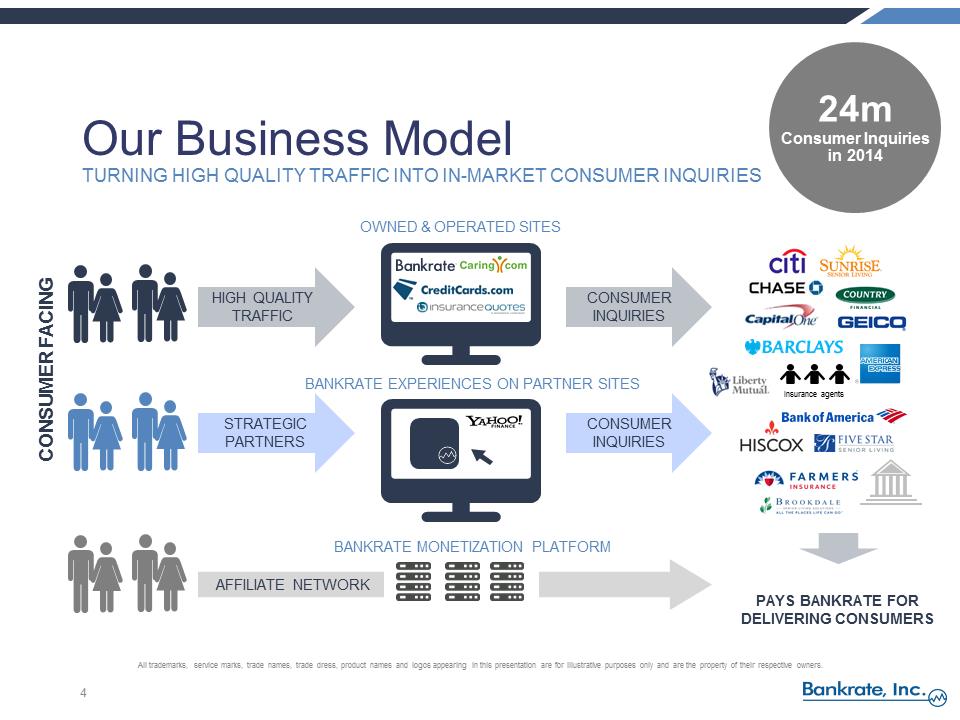 Our Business ModelTURNING HIGH QUALITY TRAFFIC INTO IN-MARKET CONSUMER INQUIRIES PAYS BANKRATE FOR DELIVERING CONSUMERS OWNED & OPERATED SITES bankrate-logo-blue.epshttp://photos.prnewswire.com/prn/20090210/CCLOGOhttp://www.blindfiveyearold.com/wp-content/uploads/2010/06/Caring_Logo.gifhttps://www.insurancequotes.com/autocss/logos/insurancequotes_com_2-logo.pngBANKRATE EXPERIENCES ON PARTNER SITES bankrate_cir-logo.jpg.aihttp://www.itpronw.com/wp-content/themes/itpro/library/images/servers-icon-large.pnghttp://www.itpronw.com/wp-content/themes/itpro/library/images/servers-icon-large.pnghttp://www.itpronw.com/wp-content/themes/itpro/library/images/servers-icon-large.pngAFFILIATE NETWORK STRATEGIC PARTNERS CONSUMER FACING BANKRATE MONETIZATION PLATFORM HIGH QUALITY TRAFFIC CONSUMER INQUIRIES CONSUMER INQUIRIES 24m Consumer Inquiries in 2014 Bank of America_3American Express_4http://s2.mbtcdn.com/news/wp-content/uploads/2011/02/citi-logo.pnghttp://4.bp.blogspot.com/_2tjJgU_EQE0/TQvIrAcqGzI/AAAAAAAAACg/gUS9xqY03wA/s1600/CapitalOne-logo.jpeghttp://upload.wikimedia.org/wikipedia/en/thumb/7/7e/Barclays_logo.svg/1280px-Barclays_logo.svg.pnghttps://encrypted-tbn3.gstatic.com/images?q=tbn:ANd9GcTYH7vQXAeOtXUiD7EAe-4PYrtnDYvnPNTN-0qyJySlPV9H6n7ohttps://encrypted-tbn3.gstatic.com/images?q=tbn:ANd9GcTYH7vQXAeOtXUiD7EAe-4PYrtnDYvnPNTN-0qyJySlPV9H6n7ohttps://encrypted-tbn3.gstatic.com/images?q=tbn:ANd9GcTYH7vQXAeOtXUiD7EAe-4PYrtnDYvnPNTN-0qyJySlPV9H6n7oInsurance agents http://www.sunriseseniorliving.com/images/us/logo-sunrise-senior-living.pnghttps://www.fivestarseniorliving.com/Libraries/FiveStar/Media/images/logo.png?width=226&height=52&ext=.pnghttp://www.multivu.com/players/English/64011-brookdale-senior-living-alzheimer-awareness/image/color-logo-fitted.pnghttps://upload.wikimedia.org/wikipedia/en/thumb/a/aa/CFLogo.svg/1280px-CFLogo.svg.pnghttps://upload.wikimedia.org/wikipedia/en/thumb/3/33/Hiscox_(logo).svg/170px-Hiscox_(logo).svg.pnghttp://www.turkishuschamber.org/images/stories/farmers-logo.pngAll trademarks, service marks, trade names, trade dress, product names and logos appearing in this presentation are for illustrative purposes only and are the property of their respective owners.
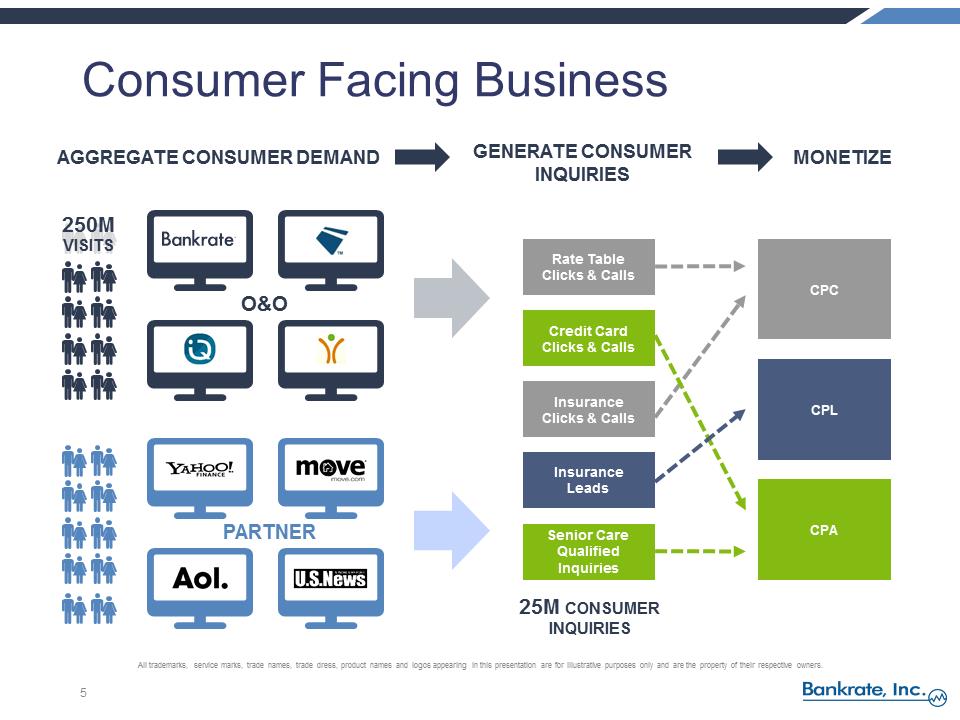 Consumer Facing Business Rate Table Clicks & Calls Credit Card Clicks & Calls Insurance Clicks & Calls Insurance Leads Senior Care Qualified Inquiries CPC CPL CPA AGGREGATE CONSUMER DEMAND GENERATE CONSUMER INQUIRIES MONETIZE bankrate-logo-blue.epshttp://photos.prnewswire.com/prn/20090210/CCLOGOhttps://encrypted-tbn2.gstatic.com/images?q=tbn:ANd9GcTw172J5_vtTZITSIbRm8xM1J3eU4mGvf5RxRWohDvyHKd1dws2Mghttps://www.caring.com/images/caring-logo-fb.pngO&O 250M VISITS 25M CONSUMER INQUIRIES Description: C:\Users\LINDSE~1.ERB\AppData\Local\Temp\SNAGHTML151dbe3.PNGPARTNER All trademarks, service marks, trade names, trade dress, product names and logos appearing in this presentation are for illustrative purposes only and are the property of their respective owners. http://about.gmu.edu/wp-content/uploads/2011/12/US_newslogo.png
 Financials
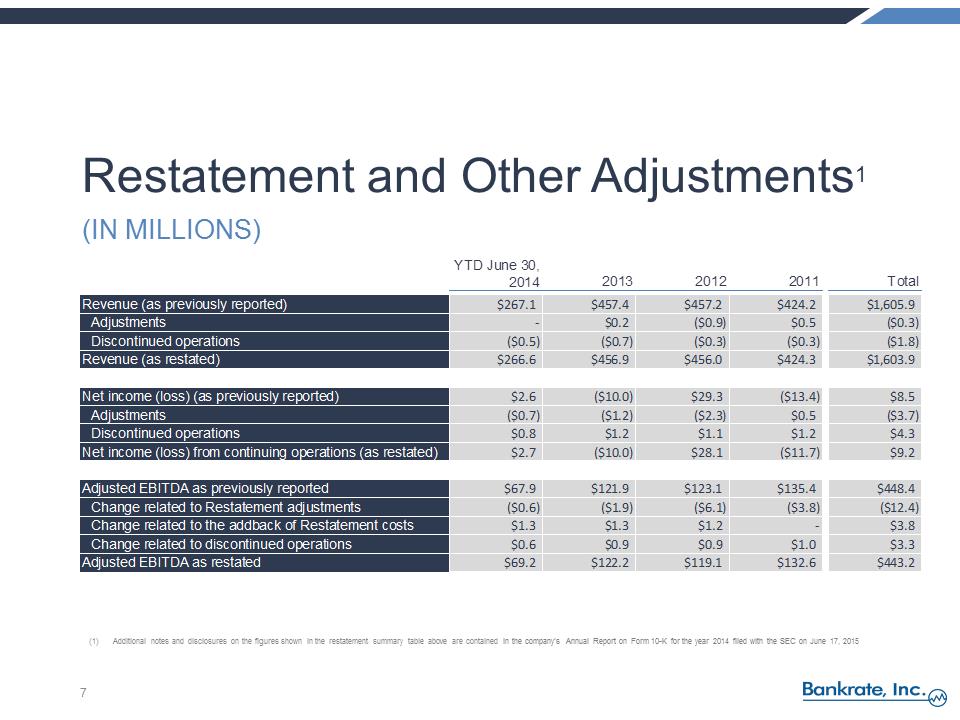 Restatement and Other Adjustments1 (IN MILLIONS) YTD June 30, 2014201320122011TotalRevenue (as previously reported)$267.1$457.4$457.2$424.2$1,605.9Adjustments -$0.2($0.9)$0.5($0.3)Discontinued operations($0.5)($0.7)($0.3)($0.3)($1.8)Revenue (as restated)$266.6$456.9$456.0$424.3$1,603.9Net income (loss) (as previously reported)$2.6($10.0)$29.3($13.4)$8.5Adjustments($0.7)($1.2)($2.3)$0.5($3.7)Discontinued operations$0.8$1.2$1.1$1.2$4.3Net income (loss) from continuing operations (as restated)$2.7($10.0)$28.1($11.7)$9.2Adjusted EBITDA as previously reported$67.9$121.9$123.1$135.4$448.4Change related to Restatement adjustments($0.6)($1.9)($6.1)($3.8)($12.4)Change related to the addback of Restatement costs$1.3$1.3$1.2 -$3.8Change related to discontinued operations$0.6$0.9$0.9$1.0$3.3Adjusted EBITDA as restated$69.2$122.2$119.1$132.6$443.2(1)Additional notes and disclosures on the figures shown in the restatement summary table above are contained in the company’s Annual Report on Form 10-K for the year 2014 filed with the SEC on June 17, 2015
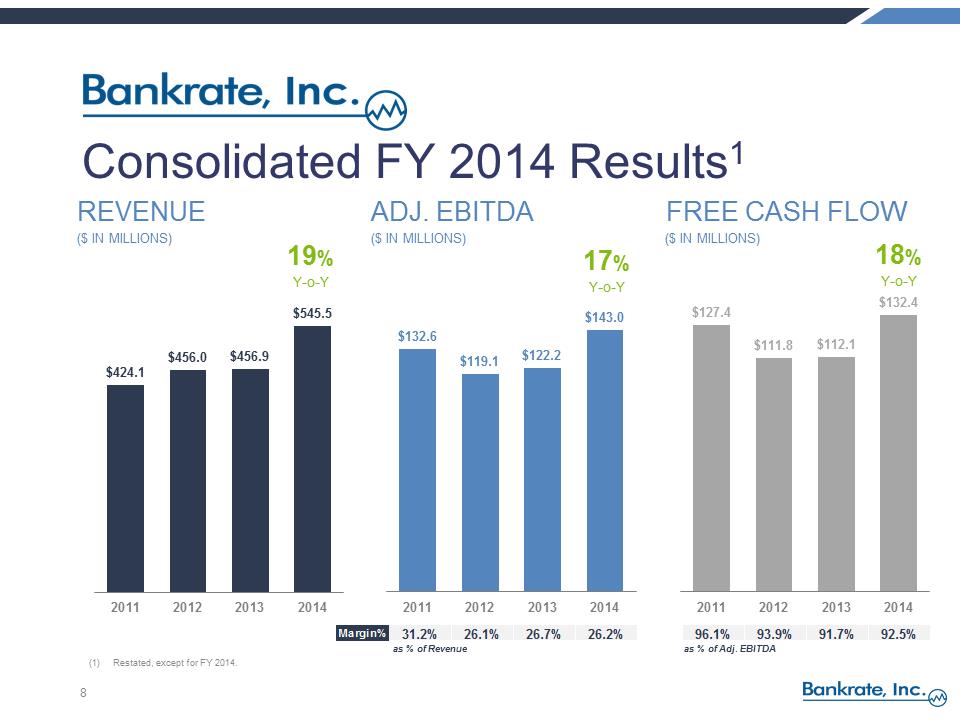 Consolidated FY 2014 Results1 REVENUE ADJ. EBITDA FREE CASH FLOW ($ IN MILLIONS) ($ IN MILLIONS) ($ IN MILLIONS) 8 (1)Restated, except for FY 2014. 19% Y-o-Y 17% Y-o-Y 18% Y-o-Y as % of Revenue as % of Adj. EBITDA $424.1 $456.0 $456.9 $545.5 2011201220132014$132.6 $119.1 $122.2 $143.0 2011201220132014$127.4 $111.8 $112.1 $132.4 2011201220132014 Margin%27.1%28.6%
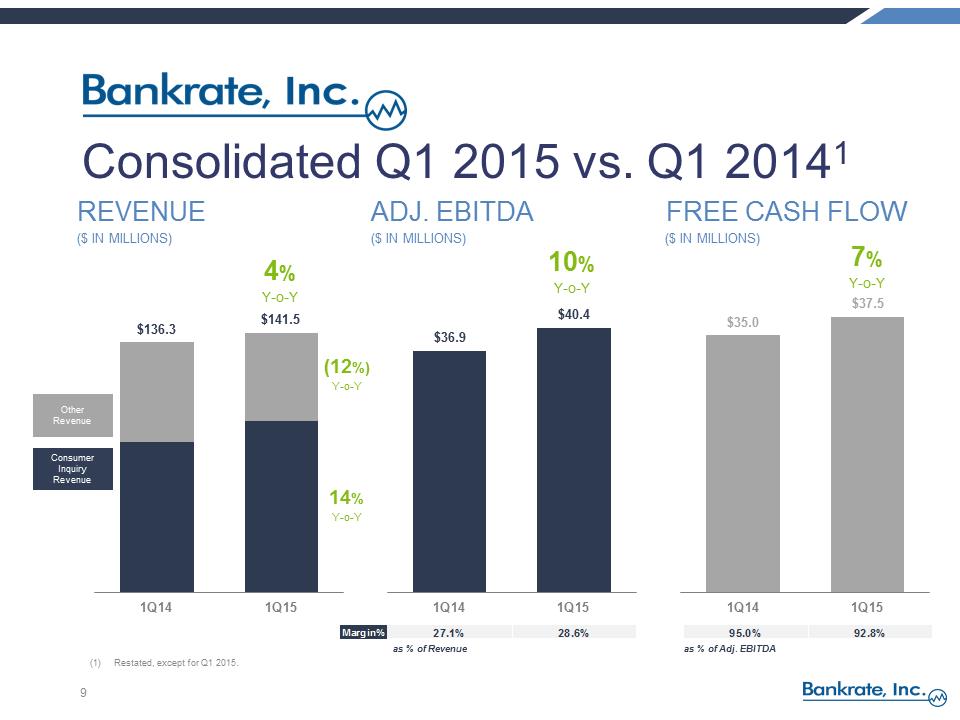 Consolidated Q1 2015 vs. Q1 20141 9 REVENUE ADJ. EBITDA FREE CASH FLOW ($ IN MILLIONS) ($ IN MILLIONS) ($ IN MILLIONS) $82 $93 $136.3 $141.5 1Q141Q154% Y-o-Y Consumer Inquiry Revenue Other Revenue 10% Y-o-Y 7% Y-o-Y (12%) Y-o-Y 14% Y-o-Y as % of Revenue as % of Adj. EBITDA $36.9 $40.4 1Q141Q1595.0%92.8% (1)Restated, except for Q1 2015. $35.0 $37.5 1Q141Q1543.6%40.8%39.0%31.8%40.6%37.7%35.5%37.1%37.5%
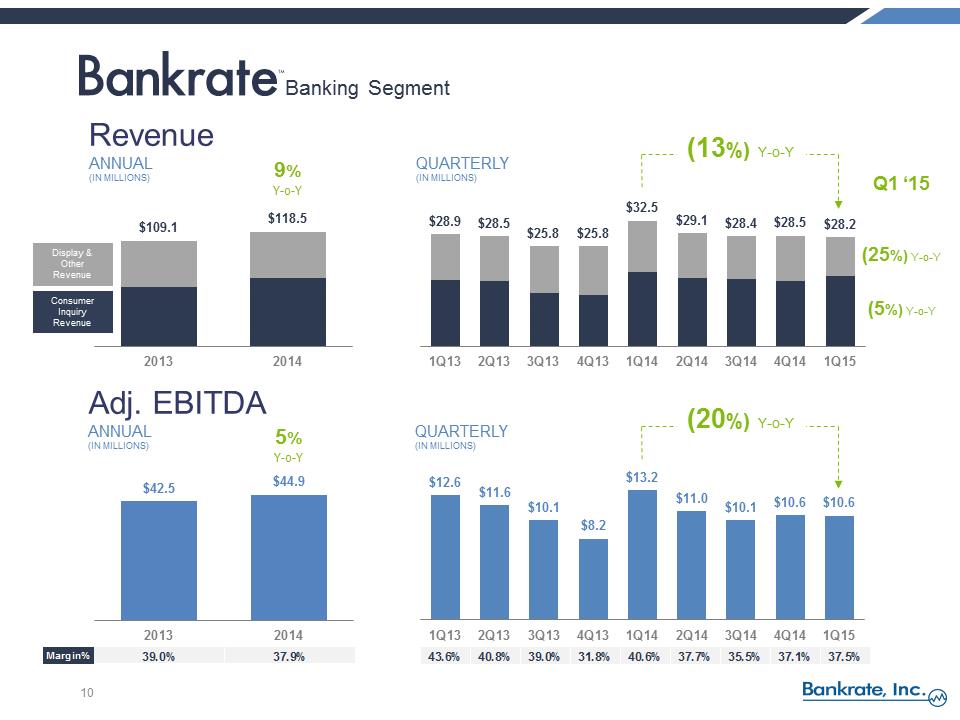 Revenue ANNUAL (IN MILLIONS) 10 QUARTERLY (IN MILLIONS) 9% Y-o-Y Adj. EBITDA ANNUAL (IN MILLIONS) QUARTERLY (IN MILLIONS) bankrate-logo-blue.eps(13%) Y-o-Y (20%) Y-o-Y 5% Y-o-Y (25%) Y-o-Y (5%) Y-o-Y $28.9 $28.5 $25.8 $25.8 $32.5 $29.1 $28.4 $28.5 $28.2 1Q132Q133Q134Q131Q142Q143Q144Q141Q15$109.1 $118.5 20132014Q1 ‘15 $42.5 $44.9 20132014Margin%39.0%37.9%$12.6 $11.6 $10.1 $8.2 $13.2 $11.0 $10.1 $10.6 $10.6 1Q132Q133Q134Q131Q142Q143Q144Q141Q15Consumer Inquiry Revenue Display & Other Revenue Banking Segment
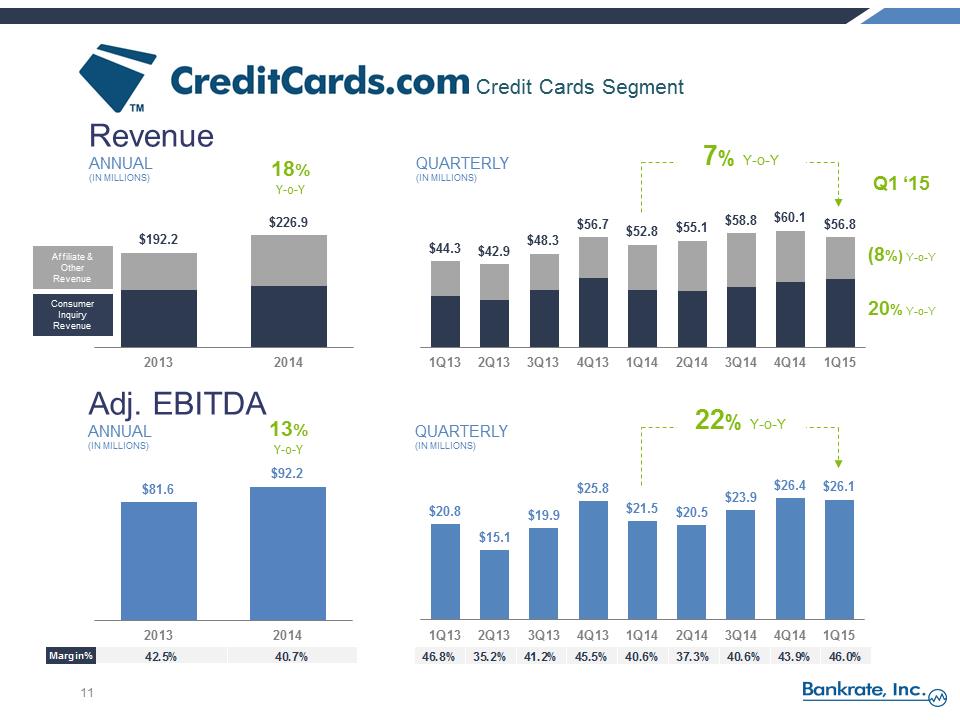 46.8%35.2%41.2%45.5%40.6%37.3%40.6%43.9%46.0%http://www.creditcards.com/downloads/cccom-blue.jpgRevenue ANNUAL (IN MILLIONS) 11 QUARTERLY (IN MILLIONS) 18% Y-o-Y Adj. EBITDA ANNUAL (IN MILLIONS) QUARTERLY (IN MILLIONS) 13% Y-o-Y 7% Y-o-Y 22% Y-o-Y (8%) Y-o-Y 20% Y-o-Y $44.3 $42.9 $48.3 $56.7 $52.8 $55.1 $58.8 $60.1 $56.8 1Q132Q133Q134Q131Q142Q143Q144Q141Q15Q1 ‘15 $192.2 $226.9 20132014Margin%42.5%40.7%$20.8 $15.1 $19.9 $25.8 $21.5 $20.5 $23.9 $26.4 $26.1 1Q132Q133Q134Q131Q142Q143Q144Q141Q15Consumer Inquiry Revenue Affiliate & Other Revenue $81.6 $92.2 20132014Credit Cards Segment
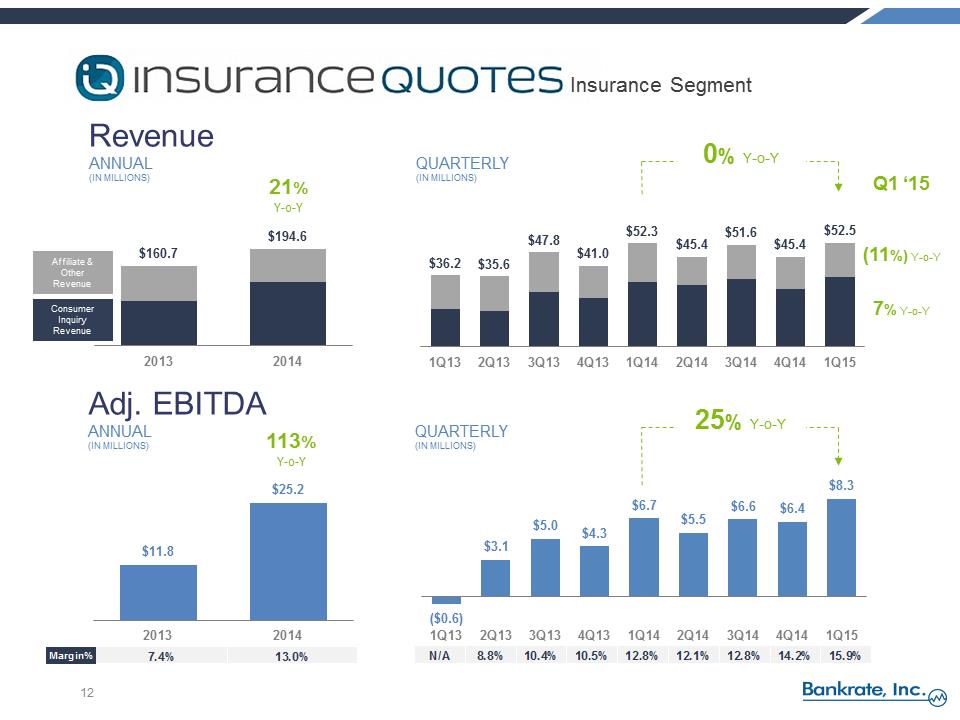 N/A8.8%10.4%10.5%12.8%12.1%12.8%14.2%15.9%Insurancequotes.com LogoRevenue ANNUAL (IN MILLIONS) 12 QUARTERLY (IN MILLIONS) 21% Y-o-Y Adj. EBITDA ANNUAL (IN MILLIONS) QUARTERLY (IN MILLIONS) 113% Y-o-Y 0% Y-o-Y 25% Y-o-Y (11%) Y-o-Y 7% Y-o-Y Q1 ‘15 $36.2 $35.6 $47.8 $41.0 $52.3 $45.4 $51.6 $45.4 $52.5 1Q132Q133Q134Q131Q142Q143Q144Q141Q15$11.8 $25.2 20132014Margin%7.4%13.0%Consumer Inquiry Revenue Affiliate & Other Revenue $160.7 $194.6 20132014($0.6) $3.1 $5.0 $4.3 $6.7 $5.5 $6.6 $6.4 $8.3 1Q132Q133Q134Q131Q142Q143Q144Q141Q15Insurance Segment
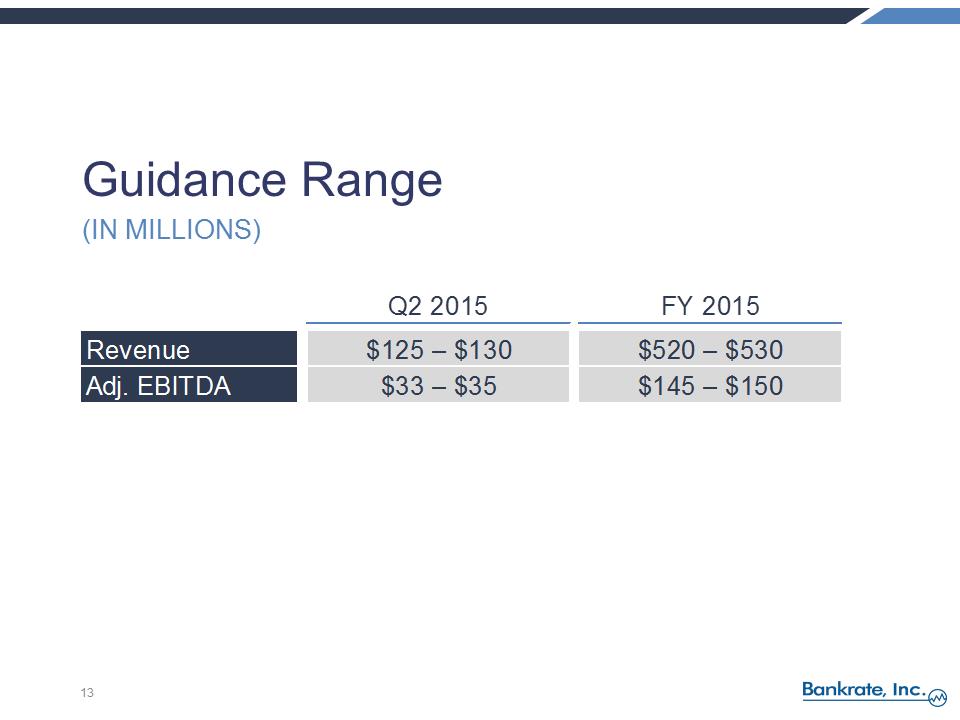 Q2 2015FY 2015Revenue$125 – $130$520 – $530Adj. EBITDA$33 – $35$145 – $150Guidance Range (IN MILLIONS) 13
 Supplemental Information Additional metrics and reconciliation of non-GAAP measures
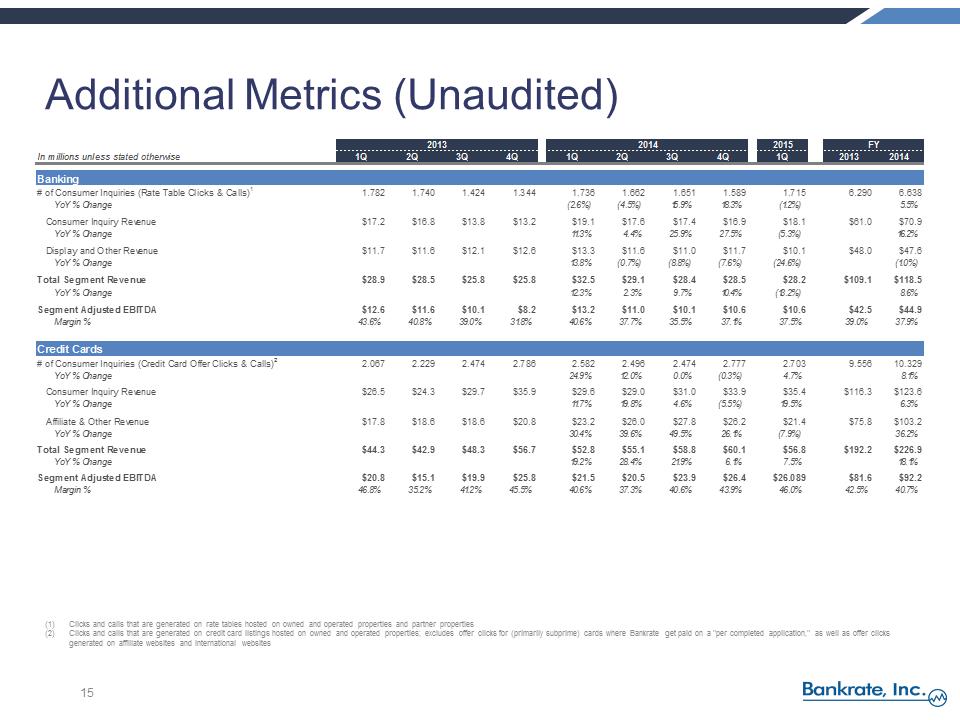 Additional Metrics (Unaudited) 201320142015FYIn millions unless stated otherwise1Q2Q3Q4Q1Q2Q3Q4Q1Q20132014Banking# of Consumer Inquiries (Rate Table Clicks & Calls)11.7821.7401.4241.3441.7361.6621.6511.5891.7156.2906.638YoY % Change(2.6%)(4.5%)15.9%18.3%(1.2%)5.5%Consumer Inquiry Revenue$17.2$16.8$13.8$13.2$19.1$17.6$17.4$16.9$18.1$61.0$70.9YoY % Change11.3%4.4%25.9%27.5%(5.3%)16.2%Display and Other Revenue$11.7$11.6$12.1$12.6$13.3$11.6$11.0$11.7$10.1$48.0$47.6YoY % Change13.8%(0.7%)(8.8%)(7.6%)(24.6%)(1.0%)Total Segment Revenue$28.9$28.5$25.8$25.8$32.5$29.1$28.4$28.5$28.2$109.1$118.5YoY % Change12.3%2.3%9.7%10.4%(13.2%)8.6%Segment Adjusted EBITDA$12.6$11.6$10.1$8.2$13.2$11.0$10.1$10.6$10.6$42.5$44.9Margin %43.6%40.8%39.0%31.8%40.6%37.7%35.5%37.1%37.5%39.0%37.9%Credit Cards# of Consumer Inquiries (Credit Card Offer Clicks & Calls)22.0672.2292.4742.7862.5822.4962.4742.7772.7039.55610.329YoY % Change24.9%12.0%0.0%(0.3%)4.7%8.1%Consumer Inquiry Revenue $26.5$24.3$29.7$35.9$29.6$29.0$31.0$33.9$35.4$116.3$123.6YoY % Change11.7%19.8%4.6%(5.5%)19.5%6.3%Affiliate & Other Revenue$17.8$18.6$18.6$20.8$23.2$26.0$27.8$26.2$21.4$75.8$103.2YoY % Change30.4%39.6%49.5%26.1%(7.9%)36.2%Total Segment Revenue$44.3$42.9$48.3$56.7$52.8$55.1$58.8$60.1$56.8$192.2$226.9YoY % Change19.2%28.4%21.9%6.1%7.5%18.1%Segment Adjusted EBITDA$20.8$15.1$19.9$25.8$21.5$20.5$23.9$26.4$26.089$81.6$92.2Margin %46.8%35.2%41.2%45.5%40.6%37.3%40.6%43.9%46.0%42.5%40.7%(1)Clicks and calls that are generated on rate tables hosted on owned and operated properties and partner properties (2)Clicks and calls that are generated on credit card listings hosted on owned and operated properties; excludes offer clicks for (primarily subprime) cards where Bankrate get paid on a "per completed application," as well as offer clicks generated on affiliate websites and international websites
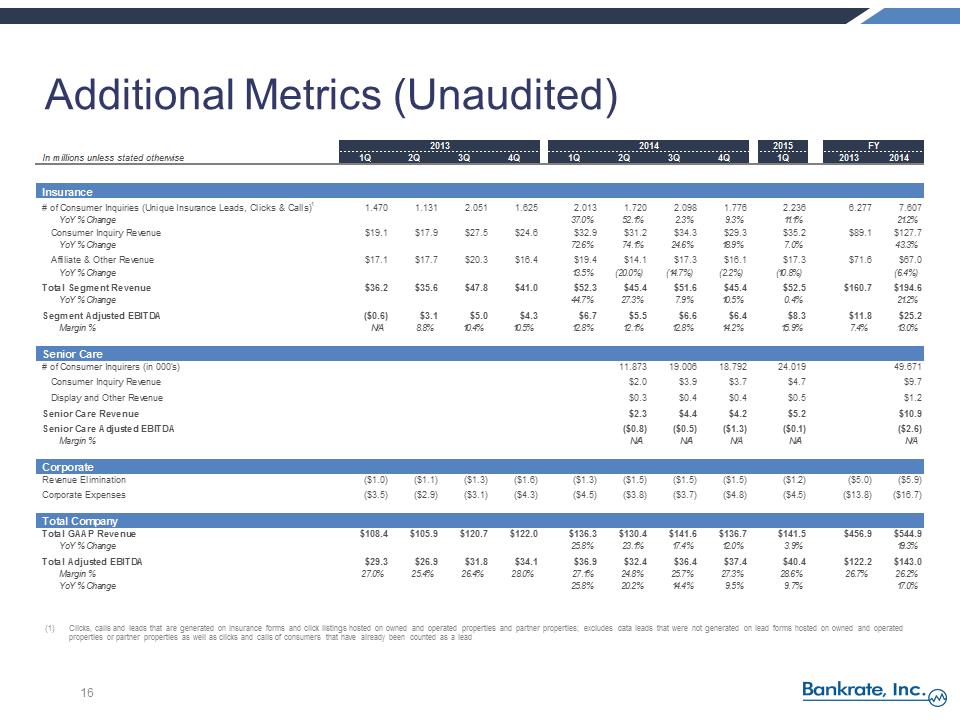 Additional Metrics (Unaudited) 16 201320142015FYIn millions unless stated otherwise1Q2Q3Q4Q1Q2Q3Q4Q1Q20132014Insurance# of Consumer Inquiries (Unique Insurance Leads, Clicks & Calls)11.4701.1312.0511.6252.0131.7202.0981.7762.2366.2777.607YoY % Change37.0%52.1%2.3%9.3%11.1%21.2%Consumer Inquiry Revenue$19.1$17.9$27.5$24.6$32.9$31.2$34.3$29.3$35.2$89.1$127.7YoY % Change72.6%74.1%24.6%18.9%7.0%43.3%Affiliate & Other Revenue$17.1$17.7$20.3$16.4$19.4$14.1$17.3$16.1$17.3$71.6$67.0YoY % Change13.5%(20.0%)(14.7%)(2.2%)(10.8%)(6.4%)Total Segment Revenue$36.2$35.6$47.8$41.0$52.3$45.4$51.6$45.4$52.5$160.7$194.6YoY % Change44.7%27.3%7.9%10.5%0.4%21.2%Segment Adjusted EBITDA($0.6)$3.1$5.0$4.3$6.7$5.5$6.6$6.4$8.3$11.8$25.2Margin %N/A8.8%10.4%10.5%12.8%12.1%12.8%14.2%15.9%7.4%13.0%Senior Care# of Consumer Inquirers (in 000's)11.87319.00618.79224.01949.671Consumer Inquiry Revenue$2.0$3.9$3.7$4.7$9.7Display and Other Revenue$0.3$0.4$0.4$0.5$1.2Senior Care Revenue$2.3$4.4$4.2$5.2$10.9Senior Care Adjusted EBITDA($0.8)($0.5)($1.3)($0.1)($2.6)Margin %N/AN/AN/AN/AN/ACorporate Revenue Elimination($1.0)($1.1)($1.3)($1.6)($1.3)($1.5)($1.5)($1.5)($1.2)($5.0)($5.9)Corporate Expenses($3.5)($2.9)($3.1)($4.3)($4.5)($3.8)($3.7)($4.8)($4.5)($13.8)($16.7)Total CompanyTotal GAAP Revenue$108.4$105.9$120.7$122.0$136.3$130.4$141.6$136.7$141.5$456.9$544.9YoY % Change25.8%23.1%17.4%12.0%3.9%19.3%Total Adjusted EBITDA$29.3$26.9$31.8$34.1$36.9$32.4$36.4$37.4$40.4$122.2$143.0Margin %27.0%25.4%26.4%28.0%27.1%24.8%25.7%27.3%28.6%26.7%26.2%YoY % Change25.8%20.2%14.4%9.5%9.7%17.0%(1)Clicks, calls and leads that are generated on insurance forms and click listings hosted on owned and operated properties and partner properties; excludes data leads that were not generated on lead forms hosted on owned and operated properties or partner properties as well as clicks and calls of consumers that have already been counted as a lead
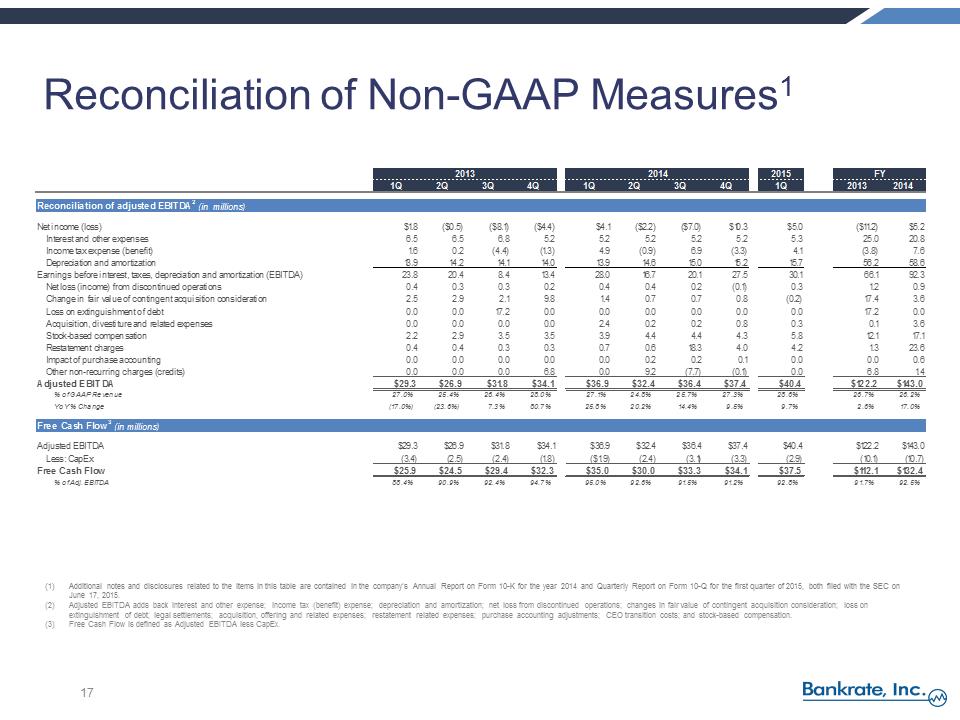 201320142015FY1Q2Q3Q4Q1Q2Q3Q4Q1Q20132014Reconciliation of adjusted EBITDA2 (in millions)Net income (loss) $1.8 ($0.5) ($8.1) ($4.4)$4.1 ($2.2) ($7.0)$10.3$5.0 ($11.2)$5.2Interest and other expenses6.56.56.85.25.25.25.25.25.325.020.8Income tax expense (benefit)1.60.2 (4.4) (1.3)4.9 (0.9)6.9 (3.3)4.1 (3.8)7.6Depreciation and amortization13.914.214.114.013.914.615.015.215.756.258.6Earnings before interest, taxes, depreciation and amortization (EBITDA)23.820.48.413.428.016.720.127.530.166.192.3Net loss (income) from discontinued operations0.40.30.30.20.40.40.2 (0.1)0.31.20.9Change in fair value of contingent acquisition consideration2.52.92.19.81.40.70.70.8 (0.2)17.43.6Loss on extinguishment of debt0.00.017.20.00.00.00.00.00.017.20.0Acquisition, divestiture and related expenses0.00.00.00.02.40.20.20.80.30.13.6Stock-based compensation2.22.93.53.53.94.44.44.35.812.117.1Restatement charges0.40.40.30.30.70.618.34.04.21.323.6Impact of purchase accounting0.00.00.00.00.00.20.20.10.00.00.6Other non-recurring charges (credits)0.00.00.06.80.09.2 (7.7) (0.1)0.06.81.4Adjusted EBITDA$29.3$26.9$31.8$34.1$36.9$32.4$36.4$37.4$40.4$122.2$143.0% of GAAP Revenue27.0%25.4%26.4%28.0%27.1%24.8%25.7%27.3%28.6%26.7%26.2%YoY % Change(17.0%)(23.6%)7.3%80.7%25.8%20.2%14.4%9.5%9.7%2.6%17.0%Free Cash Flow3 (in millions)Adjusted EBITDA$29.3$26.9$31.8$34.1$36.9$32.4$36.4$37.4$40.4$122.2$143.0Less: CapEx (3.4) (2.5) (2.4) (1.8) ($1.9) (2.4) (3.1) (3.3) (2.9) (10.1) (10.7)Free Cash Flow$25.9$24.5$29.4$32.3$35.0$30.0$33.3$34.1$37.5$112.1$132.4% of Adj. EBITDA88.4%90.9%92.4%94.7%95.0%92.6%91.5%91.2%92.8%91.7%92.5%Reconciliation of Non-GAAP Measures1 (1)Additional notes and disclosures related to the items in this table are contained in the company’s Annual Report on Form 10-K for the year 2014 and Quarterly Report on Form 10-Q for the first quarter of 2015, both filed with the SEC on June 17, 2015. (2)Adjusted EBITDA adds back interest and other expense; income tax (benefit) expense; depreciation and amortization; net loss from discontinued operations; changes in fair value of contingent acquisition consideration; loss on extinguishment of debt; legal settlements; acquisition, offering and related expenses; restatement related expenses; purchase accounting adjustments; CEO transition costs; and stock-based compensation. (3)Free Cash Flow is defined as Adjusted EBITDA less CapEx.
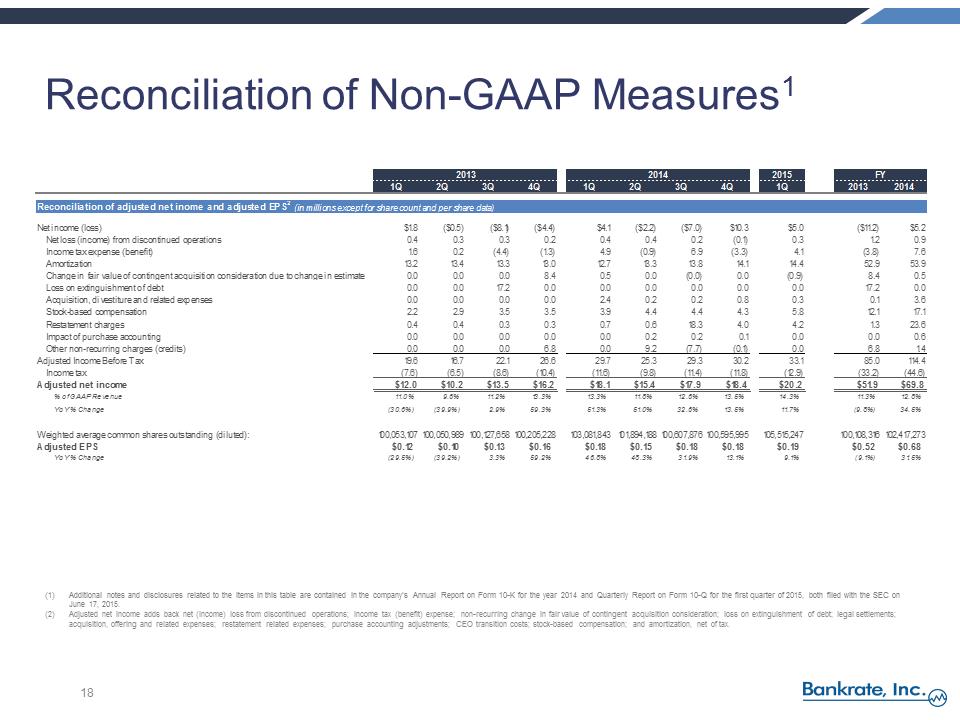 Reconciliation of Non-GAAP Measures1 18 (1)Additional notes and disclosures related to the items in this table are contained in the company’s Annual Report on Form 10-K for the year 2014 and Quarterly Report on Form 10-Q for the first quarter of 2015, both filed with the SEC on June 17, 2015. (2)Adjusted net income adds back net (income) loss from discontinued operations; income tax (benefit) expense; non-recurring change in fair value of contingent acquisition consideration; loss on extinguishment of debt; legal settlements; acquisition, offering and related expenses; restatement related expenses; purchase accounting adjustments; CEO transition costs; stock-based compensation; and amortization, net of tax. 201320142015FY1Q2Q3Q4Q1Q2Q3Q4Q1Q20132014Reconciliation of adjusted net inome and adjusted EPS2 (in millions except for share count and per share data)Net income (loss) $1.8 ($0.5) ($8.1) ($4.4)$4.1 ($2.2) ($7.0)$10.3$5.0 ($11.2)$5.2Net loss (income) from discontinued operations0.40.30.30.20.40.40.2 (0.1)0.31.20.9Income tax expense (benefit) 1.60.2 (4.4) (1.3)4.9 (0.9)6.9 (3.3)4.1 (3.8)7.6Amortization13.213.413.313.012.713.313.814.114.452.953.9Change in fair value of contingent acquisition consideration due to change in estimate0.00.00.08.40.50.0 (0.0)0.0 (0.9)8.40.5Loss on extinguishment of debt0.00.017.20.00.00.00.00.00.017.20.0Acquisition, divestiture and related expenses0.00.00.00.02.40.20.20.80.30.13.6Stock-based compensation 2.22.93.53.53.94.44.44.35.812.117.1Restatement charges 0.40.40.30.30.70.618.34.04.21.323.6Impact of purchase accounting0.00.00.00.00.00.20.20.10.00.00.6Other non-recurring charges (credits) 0.00.00.06.80.09.2 (7.7) (0.1)0.06.81.4Adjusted Income Before Tax19.616.722.126.629.725.329.330.233.185.0114.4Income tax (7.6) (6.5) (8.6) (10.4) (11.6) (9.8) (11.4) (11.8) (12.9) (33.2) (44.6)Adjusted net income$12.0$10.2$13.5$16.2$18.1$15.4$17.9$18.4$20.2$51.9$69.8% of GAAP Revenue11.0%9.6%11.2%13.3%13.3%11.8%12.6%13.5%14.3%11.3%12.8%YoY % Change(30.6%)(39.9%)2.9%59.3%51.3%51.0%32.6%13.5%11.7%(9.8%)34.5%Weighted average common shares outstanding (diluted):100,053,107100,050,989100,127,658100,205,228103,081,843101,894,188100,607,876100,595,995105,515,247100,108,316102,417,273Adjusted EPS$0.12$0.10$0.13$0.16$0.18$0.15$0.18$0.18$0.19$0.52$0.68YoY % Change(29.5%)(39.2%)3.3%59.2%46.8%48.3%31.9%13.1%9.1%(9.1%)31.5%