Attached files
| file | filename |
|---|---|
| 8-K/A - FORM 8-K/A - Tronox Holdings plc | s000940x1_8ka.htm |
| EX-23.1 - EXHIBIT 23.1 - Tronox Holdings plc | s000940x1_ex23-1.htm |
| EX-99.1 - EXHIBIT 99.1 - Tronox Holdings plc | s000940x1_ex99-1.htm |
| EX-99.3 - EXHIBIT 99.3 - Tronox Holdings plc | s000940x1_ex99-3.htm |
Exhibit 99.2
ALKALI CHEMICALS DIVISION (A DIVISION OF FMC CORPORATION)
Condensed Combined Financial Statements as of December 31, 2014 and 2013 and for the Years Ended December 31, 2014, 2013 and 2012.
| 1 |
TABLE OF CONTENTS
| 2 |
 |
To the Management of FMC Corporation:
Report on the Financial Statements
We have audited the accompanying combined financial statements of the Alkali Chemicals Division of FMC Corporation, which comprise the combined balance sheets as of December 31, 2014 and 2013, and the related combined statements of operations, cash flows, and changes in divisional equity for each of the years in the three-year period ended December 31, 2014, and the related notes to the combined financial statements.
Management’s Responsibility for the Financial Statements
Management is responsible for the preparation and fair presentation of these combined financial statements in accordance with U.S. generally accepted accounting principles; this includes the design, implementation, and maintenance of internal control relevant to the preparation and fair presentation of combined financial statements that are free from material misstatement, whether due to fraud or error.
Auditors’ Responsibility
Our responsibility is to express an opinion on these combined financial statements based on our audits. We conducted our audits in accordance with auditing standards generally accepted in the United States of America and in accordance with the auditing standards of the Public Company Accounting Oversight Board (United States). Those standards require that we plan and perform the audit to obtain reasonable assurance about whether the combined financial statements are free from material misstatement.
An audit involves performing procedures to obtain audit evidence about the amounts and disclosures in the combined financial statements. The procedures selected depend on the auditors’ judgment, including the assessment of the risks of material misstatement of the combined financial statements, whether due to fraud or error. In making those risk assessments, the auditor considers internal control relevant to the entity’s preparation and fair presentation of the combined financial statements in order to design audit procedures that are appropriate in the circumstances, but not for the purpose of expressing an opinion on the effectiveness of the entity’s internal control. Accordingly, we express no such opinion. An audit also includes evaluating the appropriateness of accounting policies used and the reasonableness of significant accounting estimates made by management, as well as evaluating the overall presentation of the combined financial statements.
We believe that the audit evidence we have obtained is sufficient and appropriate to provide a basis for our audit opinion.
Opinion
In our opinion, the combined financial statements referred to above present fairly, in all material respects, the financial position of the Alkali Chemicals Division of FMC Corporation as of December 31, 2014 and 2013, and the results of its operations and its cash flows for each of the years in the three-year period ended December 31, 2014 in accordance with U.S. generally accepted accounting principles.
/s/ KPMG llp
Philadelphia, Pennsylvania
February 26, 2015
| 3 |
Alkali Chemicals Division
(A Division of FMC Corporation)
Combined Statements of Operations
| Year Ended December 31, | ||||||||||||
| (in Millions) | 2014 | 2013 | 2012 | |||||||||
| Revenue | $ | 782.8 | $ | 751.3 | $ | 738.1 | ||||||
| Costs and Expenses | ||||||||||||
| Costs of sales | (619.6 | ) | (611.0 | ) | (565.1 | ) | ||||||
| Gross Margin | 163.2 | 140.3 | 173.0 | |||||||||
| Selling, general and administrative expenses | (37.5 | ) | (36.9 | ) | (38.3 | ) | ||||||
| Research and development expenses | (2.0 | ) | (2.1 | ) | (1.6 | ) | ||||||
| Restructuring (expense) income | (0.8 | ) | 2.6 | — | ||||||||
| Total costs and expenses | (659.9 | ) | (647.4 | ) | (605.0 | ) | ||||||
| Income from operations before equity in loss of affiliate, interest expense and income taxes | 122.9 | 103.9 | 133.1 | |||||||||
| Equity in loss of affiliate | (1.1 | ) | (1.7 | ) | (1.5 | ) | ||||||
| Interest expense | (4.8 | ) | (4.8 | ) | (4.8 | ) | ||||||
| Income from operations before income taxes | 117.0 | 97.4 | 126.8 | |||||||||
| Provision for income taxes | (24.2 | ) | (18.9 | ) | (27.4 | ) | ||||||
| Net income | 92.8 | 78.5 | 99.4 | |||||||||
| Less: Net income attributable to noncontrolling interests | (5.2 | ) | (7.6 | ) | (15.0 | ) | ||||||
| Net income attributable to division | $ | 87.6 | $ | 70.9 | $ | 84.4 | ||||||
The accompanying notes are an integral part of these combined financial statements.
| 4 |
Alkali Chemicals Division
(A Division of FMC Corporation)
Combined Balance Sheets
| December 31, | ||||||||
| (in Millions) | 2014 | 2013 | ||||||
| ASSETS | ||||||||
| Current Assets | ||||||||
| Cash and cash equivalents | $ | — | $ | — | ||||
| Trade receivables, net of allowance of $0.4 in 2014 and $0.1 in 2013 | 84.9 | 89.1 | ||||||
| Receivables from related parties and affiliates, net | 71.2 | 60.1 | ||||||
| Inventories | 26.5 | 23.3 | ||||||
| Prepaid and other current assets | 20.9 | 20.8 | ||||||
| Deferred income taxes | 0.6 | 0.4 | ||||||
| Total current assets | 204.1 | 193.7 | ||||||
| Equity method investment | 19.6 | 19.5 | ||||||
| Property, plant and equipment, net | 374.2 | 361.9 | ||||||
| Other assets | 3.4 | 4.2 | ||||||
| Total assets | $ | 601.3 | $ | 579.3 | ||||
| LIABILITIES AND DIVISIONAL EQUITY | ||||||||
| Current Liabilities | ||||||||
| Accounts payable, trade and other | $ | 58.3 | $ | 50.1 | ||||
| Accrued and other current liabilities | 32.5 | 27.3 | ||||||
| Accrued customer rebates | 1.6 | 2.3 | ||||||
| Total current liabilities | 92.4 | 79.7 | ||||||
| Long-term debt | 90.0 | 90.0 | ||||||
| Deferred income taxes | 36.1 | 31.5 | ||||||
| Other long-term liabilities | 1.3 | 1.3 | ||||||
| Commitments and contingent liabilities (Note 14) | ||||||||
| Divisional Equity | ||||||||
| Net investment of parent | 381.5 | 352.4 | ||||||
| Noncontrolling interests | — | 24.4 | ||||||
| Total divisional equity | 381.5 | 376.8 | ||||||
| Total liabilities and net divisional equity | $ | 601.3 | $ | 579.3 | ||||
The accompanying notes are an integral part of these combined financial statements.
| 5 |
Alkali Chemicals Division
(A Division of FMC Corporation)
Combined Statements of Cash Flows
| Year Ended December 31, | ||||||||||||
| (in Millions) | 2014 | 2013 | 2012 | |||||||||
| Cash provided by operating activities: | ||||||||||||
| Net income | $ | 92.8 | $ | 78.5 | $ | 99.4 | ||||||
| Adjustments from net income to cash provided (required) by operating activities: | ||||||||||||
| Depreciation and amortization | 37.7 | 39.2 | 38.3 | |||||||||
| Equity in loss of affiliates | 1.1 | 1.7 | 1.5 | |||||||||
| Restructuring expense (income) | 0.8 | (2.6 | ) | — | ||||||||
| Deferred income taxes | 4.4 | (0.4 | ) | 5.2 | ||||||||
| Share-based compensation | 1.1 | 1.0 | 1.3 | |||||||||
| Net (gain)/loss from disposals and impairment of property, plant and equipment | 0.5 | (0.2 | ) | 2.1 | ||||||||
| Changes in operating assets and liabilities: | ||||||||||||
| Trade receivables, net | 4.2 | (16.0 | ) | 1.8 | ||||||||
| Receivables from related parties and affiliates, net | (11.1 | ) | 7.9 | (15.1 | ) | |||||||
| Inventories | (3.2 | ) | 3.2 | (6.9 | ) | |||||||
| Prepaid and other assets | (0.1 | ) | (2.9 | ) | 3.0 | |||||||
| Accounts payable | 4.5 | (3.1 | ) | (4.3 | ) | |||||||
| Accrued and other liabilities | 4.2 | (2.2 | ) | (7.7 | ) | |||||||
| Accrued customer rebates | (0.7 | ) | 0.4 | (0.7 | ) | |||||||
| Cash provided by operating activities | 136.2 | 104.5 | 117.9 | |||||||||
| Cash required by investing activities: | ||||||||||||
| Capital expenditures | $ | (45.8 | ) | $ | (57.2 | ) | $ | (55.9 | ) | |||
| Proceeds from disposal of property, plant and equipment | — | 3.2 | 0.5 | |||||||||
| Investments in nonconsolidated affiliate | (1.2 | ) | (6.4 | ) | (13.8 | ) | ||||||
| Cash required by investing activities | (47.0 | ) | (60.4 | ) | (69.2 | ) | ||||||
| Cash required by financing activities: | ||||||||||||
| Acquisitions of noncontrolling interests (1) | (95.7 | ) | (80.0 | ) | — | |||||||
| Dividends paid to noncontrolling interests | (3.0 | ) | (9.9 | ) | (15.4 | ) | ||||||
| Net change in net investment of parent (2) | 9.5 | 45.8 | (33.3 | ) | ||||||||
| Cash required by financing activities | (89.2 | ) | (44.1 | ) | (48.7 | ) | ||||||
| Increase (decrease) in cash and cash equivalents | — | — | — | |||||||||
| Cash and cash equivalents, beginning of period | — | — | — | |||||||||
| Cash and cash equivalents, end of period | $ | — | $ | — | $ | — | ||||||
| (1) | See the Combined Statements of Changes in Divisional Equity for more information. |
| (2) | Net change in net investment of parent excludes non-cash transactions associated with share-based compensation totaling $1.1 million, $1.0 million and $1.3 million for the years ended December 31, 2014, 2013 and 2012, respectively. |
Accrued additions to property, plant and equipment, net at December 31, 2014, 2013 and 2012 were $11.8 million, $8.1 million and $14.5 million, respectively.
The accompanying notes are an integral part of these combined financial statements.
| 6 |
Alkali Chemicals Division
(A Division of FMC Corporation)
Combined Statements of Changes in Divisional Equity
| (in Millions) | Net Investment of Parent | Non-controlling | Total | |||||||||
| Balance, January 1, 2012 | $ | 237.5 | $ | 51.9 | $ | 289.4 | ||||||
| Net income | 84.4 | 15.0 | 99.4 | |||||||||
| Dividends declared and paid | — | (15.4 | ) | (15.4 | ) | |||||||
| Net change in net investment of parent | (32.0 | ) | — | (32.0 | ) | |||||||
| Balance, December 31, 2012 | $ | 289.9 | $ | 51.5 | $ | 341.4 | ||||||
| Net income | 70.9 | 7.6 | 78.5 | |||||||||
| Dividends declared and paid | — | (9.9 | ) | (9.9 | ) | |||||||
| Acquisition noncontrolling interest (1) | (55.2 | ) | (24.8 | ) | (80.0 | ) | ||||||
| Net change in net investment of parent | 46.8 | — | 46.8 | |||||||||
| Balance, December 31, 2013 | $ | 352.4 | $ | 24.4 | $ | 376.8 | ||||||
| Net income | 87.6 | 5.2 | 92.8 | |||||||||
| Dividends declared and paid | — | (3.0 | ) | (3.0 | ) | |||||||
| Acquisition noncontrolling interest (2) | (69.1 | ) | (26.6 | ) | (95.7 | ) | ||||||
| Net change in net investment of parent | 10.6 | — | 10.6 | |||||||||
| Balance, December 31, 2014 | $ | 381.5 | $ | — | $ | 381.5 | ||||||
| (1) | Represents the purchase of Nippon Sheet Glass’s (“NSG”) 6.25 percent equity in FMC Wyoming Corporation (“FMC WY”) for $80.0 million, which increased our ownership in FMC WY from 87.50 percent to 93.75 percent. |
| (2) | Represents the purchase of the remaining 6.25 percent equity in FMC WY for $95.7 million, which increased our ownership in FMC WY from 93.75 percent to 100 percent. |
The accompanying notes are an integral part of these combined financial statements.
| 7 |
Alkali Chemicals Division
(A Division of FMC Corporation)
Notes to Combined Financial Statements
Note 1: Description of the Business
The accompanying combined financial statements include the historical accounts of Alkali Chemicals Division (“Alkali”, “We”, “Us”, or “Our”) of FMC Corporation (the “Parent” or “FMC”), a publicly traded company incorporated in Delaware (United States). On September 8, 2014, FMC publicly announced a plan to divest of Alkali (the “Transaction”).
In preparation for the Transaction, effective January 1, 2015, FMC reorganized the legal entities comprising Alkali under a holding company named Alkali Holdings Corporation (“AHC”) and transferred certain liabilities and the employees of Alkali to AHC. Subsequently, certain assets of Alkali were also transferred to AHC. AHC, a wholly-owned subsidiary of FMC, was incorporated under Delaware law on October 21, 2014. AHC did not own the legal entities comprising Alkali during the periods presented in the accompanying combined financial statements.
The chart below shows the legal structure of Alkali subsequent to January 1, 2015:
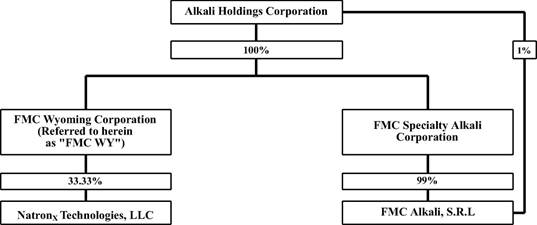
On February 3, 2015, FMC entered into a definitive agreement to sell AHC to a wholly owned subsidiary of Tronox Limited for $1.64 billion. The Transaction is expected to close in the first quarter of 2015. See Note 16 within these combined financial statements for additional information related to the sale of AHC.
Nature of Operations
Our operations include the mining of trona for the production of natural soda ash and its derivatives: sodium bicarbonate, sodium sesquicarbonate and caustic soda (collectively referred to as “alkali-products”). We provide our alkali-products to a variety of industries such as glass manufacturing, water treatment, pulp and paper, textiles, food and pharmaceutical and cosmetics. We also sell our alkali-products to various domestic and international customers and to the American Natural Soda Ash Corporation (“ANSAC”) which is our primary export customer. ANSAC is a third-party nonprofit corporation whose purpose is to promote export sales of U.S. produced soda ash in conformity with the Webb-Pomerene Act. All mining and processing activities take place in our facility located in the Green River Basin of Wyoming, United States. See Note 5 within these combined financial statements for additional information related to ANSAC.
Note 2: Basis of Presentation
The accompanying combined financial statements have been prepared in accordance with accounting principles generally accepted in the United States (“U.S. GAAP”). The accompanying combined financial statements include the net assets, liabilities, revenues and expenses of the entities that comprise Alkali, as carved out from the historical results of operations, cost basis of the assets and liabilities, costs incurred by and cash flows of FMC for these entities using both specific identification and the allocation methodologies described below.
As the separate legal entities that comprise Alkali were not historically held by a single legal entity, net investment of parent is shown in lieu of shareholders’ equity in these combined financial statements. With the exception of certain sales and receivables, intercompany balances and transactions between Alkali and FMC have been eliminated and included in net investment of parent. Intracompany balances and accounts within Alkali have been eliminated. Net investment of parent represents FMC’s interest in the recorded net assets of Alkali.
| 8 |
During the periods presented, Alkali functioned as part of the larger group of companies controlled by FMC, and accordingly, FMC performed certain corporate overhead functions for Alkali. Therefore, certain costs related to Alkali have been allocated from the Parent. These allocated costs are primarily related to certain governance and corporate functions such as legal, investor relations, communications and corporate facilities and administration. The costs associated with these services and support functions have been allocated to Alkali primarily based on a general shared services methodology, which was calculated based on a blend of personnel count, net property, plant and equipment, and cost of sales. The net costs allocated for these functions are included in selling, general and administrative expenses within the combined statements of operations.
In addition to allocated costs, balances related to industrial revenue bonds have been assigned and certain assets have been allocated to Alkali from FMC based on methodologies suited to the nature of the specific assets and liabilities.
We believe the assumptions and allocations are reasonable. The expense and cost allocations have been determined on a basis considered to be a reasonable reflection of the utilization of services provided to or the benefit received by Alkali during the periods relative to the total costs incurred by FMC. Additionally, the assets and liabilities assigned from FMC have been deemed attributable to, and reflective of the historical operations of, Alkali; however, the amounts recorded may not be representative of the amounts that would have been incurred had Alkali been an entity that operated independently of FMC. Consequently, these combined financial statements may not be indicative of Alkali’s future performance and do not necessarily reflect what its results of operations, financial position and cash flows would have been had Alkali operated as a separate entity apart from FMC during the periods presented. See Note 5 within these combined financial statements for more information.
Note 3: Summary of Significant Accounting Policies
Estimates and assumptions. In preparing the combined financial statements in conformity with U.S. GAAP we are required to make estimates and assumptions that affect the reported amounts of assets and liabilities and disclosures of contingent assets and liabilities at the date of the combined financial statements and the reported amounts of revenue and expenses during the reporting period. Actual results are likely to differ from those estimates, but we do not believe such differences will materially affect our financial position, results of operations, or cash flows.
Cash and cash equivalents. We consider investments in all liquid debt instruments with original maturities of three months or less to be cash equivalents. Historically we have participated in and relied upon FMC’s cash management systems to manage working capital and investing activities such as capital expenditures.
Trade receivables, net of allowance. Trade receivables consist of amounts owed to us from customer sales and are recorded when revenue is recognized. The allowance for trade receivables represents our best estimate of the probable losses associated with potential customer defaults. In developing our allowance for trade receivables, we utilize a two stage process which includes calculating a general formula to develop an allowance to appropriately address the uncertainty surrounding collection risk of our entire portfolio and specific allowances for customers where the risk of collection has been reasonably identified either due to liquidity constraints or disputes over contractual terms and conditions.
Our method of calculating the general formula consists of estimating the recoverability of trade receivables based on historical experience, current collection trends, and external business factors such as economic factors, including regional bankruptcy rates, and political factors. Our analysis of trade receivable collection risk is performed quarterly, and the allowance is adjusted accordingly. The allowance for trade receivables was $0.4 million at December 31, 2014 and $0.1 million at December 31, 2013, respectively. The provision to the allowance for trade receivables charged against operations was $0.7 million, $0.6 million, and zero for the years ended December 31, 2014, 2013, and 2012 respectively.
Inventories. Inventories are stated at the lower of cost or market value. Inventory costs include those costs directly attributable to products before sale, including all manufacturing overhead but excluding distribution costs. All inventories, excluding materials and supplies, are determined on a last-in, first-out (“LIFO”) basis and our remaining inventories are recorded on a first-in, first-out (“FIFO”) basis.
Prepaid and other current assets. Prepaid expenses and other current assets primarily consist of prepaid freight and transportation credits.
Equity method investment. Our investment of 33 1/3 percent in NatronX Technologies, LLC (“NatronX”) is accounted for using the equity method. Under the equity method, the original investment in NatronX was recorded at cost and is adjusted by our share of undistributed earnings and losses. The fair value of our investment in NatronX exceeds its carrying value at December 31, 2014 and 2013.
| 9 |
Property, plant and equipment. We record property, plant and equipment at cost. Depreciation is provided principally on the straight-line basis over the estimated useful lives of the assets (land improvements—20 years, mineral rights—40 years, buildings—20 to 40 years, mine and development costs— three to 15 years, and machinery and equipment—three to 15 years). Gains and losses are reflected in income upon sale or retirement of assets. Expenditures that extend the useful lives of property, plant and equipment or increase productivity are capitalized. Ordinary repairs and maintenance are expensed as incurred through operating expense.
Capitalized interest. Capitalized interest balances as of December 31, 2014 and 2013 of $18.6 million and $17.8 million, respectively, have been assigned to us by the Parent. These balances have been included with our machinery and equipment fixed assets within our property, plant and equipment, net balance on our combined balance sheets. These assigned balances were associated with the construction of certain long-lived assets, which were funded by the Parent, and have been capitalized as part of the cost of those assets. During the years ended December 31, 2014, 2013, and 2012 we capitalized interest costs of $2.2 million, $1.1 million, and $2.4 million, respectively. Capitalized interest is amortized over the assets’ estimated useful lives.
Impairments of long-lived assets. We review the recovery of the net book value of long-lived assets whenever events and circumstances indicate that the net book value of an asset may not be recoverable from the estimated undiscounted future cash flows expected to result from its use and eventual disposition. In cases where undiscounted expected future cash flows are less than the net book value, we recognize an impairment loss equal to an amount by which the net book value exceeds the fair value of the asset. Long-lived assets to be disposed of are reported at the lower of carrying amount or fair value less cost to sell. There were no impairments during 2014 and 2013. During the year ended December 31, 2012, we recorded a charge of $1.6 million to write down, to fair value, decommissioned mining equipment.
Asset retirement obligations. We record asset retirement obligations (“AROs”) at fair value from the time the original assets were placed into service. The associated AROs are capitalized as part of the carrying amount of related long-lived assets. In future periods, the liability is accreted to its present value and the capitalized cost is depreciated over the useful life of the related asset. We also adjust the liability for changes resulting from the passage of time and/or revisions to the timing or the amount of the original estimate. Upon retirement of the long-lived asset, we either settle the obligation for its recorded amount or incur a gain or loss.
Financial instruments. Our financial instruments are trade receivables, affiliate receivables, net and trade payables. These financial instruments are recorded at cost, which approximates fair value due to the short-term nature of the instruments. Alkali does not have any off-balance sheet financing arrangements.
Restructuring income and expense. We continually perform strategic reviews and assess the return on our business. This sometimes results in a plan to restructure the operations of our business. We record an accrual for severance and other exit costs under the provisions of the relevant accounting guidance. During the years ended December 31, 2014, 2013 and 2012 we recognized restructuring expense of $0.8 million, a gain of $2.6 million, and zero, respectively. The recognized gain during the year ended December 31, 2013 was due to the sale of a fully depreciated facility that was included in an earlier business restructuring. We expect no further material cash outflows regarding this transaction.
Revenue recognition. We recognize revenue when the earnings process is complete, which is generally upon transfer of title. This transfer typically occurs either upon shipment to the customer or upon receipt by the customer. In all cases, we apply the following criteria in recognizing revenue: persuasive evidence of an arrangement exists, delivery has occurred, the selling price is fixed or determinable and collection is reasonably assured. Rebates due to customers are accrued as a reduction of revenue in the same period that the related sales are recorded based on the contract terms.
We record amounts billed for shipping and handling fees as revenue. Costs incurred for shipping and handling are recorded as costs of sales on the combined statements of operations.
Research and development. Research and development costs are expensed as incurred.
Income and other taxes. For purposes of the combined financial statements, the income tax expense and deferred tax balances have been estimated as if we filed income tax returns on a basis separate from FMC. Allocations of current income taxes are payable to FMC in the period the related income taxes were recorded. Uncertain tax positions are accounted for in accordance with U.S. GAAP accounting guidance for uncertainty in income taxes.
We recognize deferred tax assets and deferred liabilities for deductible temporary differences as well as deferred tax assets for operating loss carry forwards, and tax credit carry forwards. Deferred tax assets are reduced by a valuation allowance if it is more likely than not that some portion, or all, of the deferred tax assets will not be realized.
Segment information. We operate as one reportable segment based on the commonalities among our products and services and the manner in which we review and evaluate operating performance. Segment disclosures and geographical information are included in Note 15 within these combined financial statements. Geographic segment revenue is based on the location of our customers.
| 10 |
Stock-based compensation. We do not currently sponsor any stock compensation plans. Instead, our eligible employees participated in the Parent’s sponsored stock-based compensation plans. Prior to the consummation of the Transaction, our employees will continue to participate in the Parent’s stock-based compensation plans and we will recognize stock-based compensation expense based on the awards granted to our employees. Stock-based compensation expense for the years ended December 31, 2014, 2013 and 2012 has been recognized for all share options and other equity-based arrangements. Share-based compensation cost is measured at the date of grant, based on the fair value of the award, and is recognized over the employee’s requisite service period.
Pension and other postretirement benefits. FMC provides a range of benefits, including pensions, postretirement and postemployment benefits to eligible current and former employees, of which certain of our employees participate. Expenses associated with our employees’ participation in these plans for the years ended December 31, 2014, 2013 and 2012 have been allocated to us and included within the combined statement of operations.
Note 4: Recently Issued and Adopted Accounting Pronouncements and Regulatory Items
New accounting guidance and regulatory items
In February 2015, the Financial Accounting Standards Board (“FASB”) issued ASU 2015-02, Consolidation: Amendments to the Consolidation Analysis. This new standard changes the consolidation evaluation for entities that are required to evaluate whether they should consolidate certain legal entities. We are required to adopt this standard in the first quarter of 2016. Early adoption is permitted. The standard permits the use of a modified retrospective approach by recording a cumulative-effect adjustment to equity as of the beginning of the fiscal year of adoption, or a reporting entity may also apply the amendments retrospectively. We are evaluating the effect that ASU 2015-02 will have on our consolidated financial statements. We have not yet completed the assessment to determine the effect of the standard on our ongoing financial reporting.
Revenue from Contracts with Customers
In May 2014, the Financial Accounting Standards Board (“FASB”) issued ASU 2014-09, Revenue from Contracts with Customers, which requires an entity to recognize the amount of revenue to which it expects to be entitled for the transfer of promised goods or services to customers. This new guidance will replace most existing revenue recognition guidance in U.S. GAAP when it becomes effective. We are required to adopt this standard on January 1, 2017. Early application is not permitted. The standard permits the use of either the retrospective or cumulative effect transition method. We are evaluating the effect that ASU 2014-09 will have on our combined financial statements and related disclosures. We have not yet selected a transition method nor have we determined the effect of the standard on our ongoing financial reporting.
Note 5: Agreements and Transactions with Related Parties and Affiliates
Shared Services and Corporate Costs
During the periods presented, we benefited from certain governance and corporate functions provided by Parent as discussed in Note 2. The combined statements of operations include allocations for such services of $16.2 million, $18.2 million and $17.1 million for the years ended December 31, 2014, 2013 and 2012, respectively. These allocations are included within selling, general and administrative expenses within the combined financial statements.
All of our accounts payable processing is handled by FMC and we are charged the costs of these services through our affiliate accounts. Trade payables represent accounts payable that have not been paid by FMC as of December 31, 2014 and 2013.
Cash Management, Financing and Financial Instruments
The structure of our Parent’s risk management strategy is managed on a FMC consolidated basis. Realized gains and losses associated with derivative contracts entered into on our behalf are allocated to us by our Parent. As of December 31, 2014, our Parent had entered into natural gas contacts through December 31, 2015 with a fair market value of approximately $4.3 million asset on our behalf. For the years ended December 31, 2014, 2013, and 2012 our Parent allocated approximately $1.3 million gain, zero, and $7.0 million loss, respectively, related to natural gas contracts. These amounts have been included within cost of sales in the accompanying combined financial statements. There were no foreign exchange contracts outstanding as of December 31, 2014 entered into by our Parent on our behalf. For the years ended December 31, 2014, 2013, and 2012 our Parent allocated losses of approximately $0.1 million, $0.2 million, and $0.5 million, respectively, related to foreign exchange contracts. These amounts are included within cost of sales or selling, general, and administrative depending on the nature of the contract.
FMC uses a centralized approach to cash management and financing of operations. Our cash was available for use and was regularly “swept” by FMC at its discretion. FMC also funds our operating and investing activities as needed. Transfers of cash both to and from FMC are included within net investment of parent on the combined balance sheets. Included as part of the centralized cash management services are risk management strategies, which minimize the exposure to our cash flow over time, caused by changes in commodity and currency exchange rates.
| 11 |
With the exception of $90.0 million of Sweetwater County, Wyoming industrial revenue bonds issued specifically for the use of Alkali, FMC has issued debt for general corporate purposes and acquisitions. In no instance is this debt guaranteed by, or will be assumed by Alkali. Additionally, none of this debt has been secured by the assets of Alkali. With the exception of the aforementioned $90.0 million industrial revenue bonds, none of FMC’s debt is directly attributable to us, and, therefore, no such amount has been assigned to and recognized in these combined financial statements.
Contractual Agreements of the Parent
We benefit from certain contractual agreements of FMC, or with other businesses of FMC, to utilize certain services and assets, such as railcars for the distribution of finished goods throughout the U.S. The contract prices associated with these services and assets may not be transferable to another party. The costs associated with these contractual agreements have been included within the combined financial statements.
Agreements and Transactions with Affiliates
We had a soda ash supply agreement with Nippon Sheet Glass Co. Ltd (“NSG”) and its approved affiliates, which was renewed on June 30, 2005 for the first of two successive automatic ten-year renewal periods. This soda ash agreement was terminated by NSG subsequent to FMC’s purchase of NSG's ownership in FMC WY in 2013.
We also have a soda ash supply agreement with FMC. Under this agreement, we have committed to supply soda ash to FMC and its approved affiliates. The agreement was renewed on June 30, 2005 for the first of two successive automatic ten-year renewal periods. FMC also has the ability to renew in ten-year increments thereafter. There were also other affiliate receivables from related parties and affiliates related to the transactions with FMC in the normal course of business exclusive of soda ash sales. Revenue from the sale of soda ash to FMC and its affiliates is provided in the table below. Sales to affiliates are at a market-based price, which is reset at least annually.
We hold a membership in ANSAC, which is responsible for promoting and increasing the use and sale of soda ash and other refined or processed sodium products produced. Certain sales and marketing costs incurred by ANSAC are charged directly to us. Selling, general and administrative expenses also include amounts charged to us by ANSAC principally consisting of salaries, benefits, office supplies, professional fees, travel, rent and certain other costs. These transactions do not necessarily represent arm's length transactions and may not represent all costs if we operated on a stand-alone basis. The total costs charged to us for the years ended December 31, 2014, 2013 and 2012 are as follows:
| Year Ended December 31, | ||||||||||||
| (in Millions) | 2014 | 2013 | 2012 | |||||||||
| FMC - shared services and corporate costs | $ | 16.2 | $ | 18.2 | $ | 17.1 | ||||||
| ANSAC | 3.3 | 2.8 | 2.0 | |||||||||
| Total related parties and affiliates selling, general and administrative expenses (1) | $ | 19.5 | $ | 21.0 | $ | 19.1 | ||||||
| (1) | Amounts included in selling, general and administrative expenses within the combined statements of operations. |
Net revenue from related parties and affiliates for the years ended December 31, 2014, 2013 and 2012 are as follows:
| Year Ended December 31, | ||||||||||||
| (in Millions) | 2014 | 2013 | 2012 | |||||||||
| FMC | $ | 3.8 | $ | 7.2 | $ | 5.8 | ||||||
| NatronX Technologies LLC | 1.6 | 4.3 | 5.2 | |||||||||
| Nippon Sheet Glass Co. Ltd (1) | — | 5.2 | 9.9 | |||||||||
| ANSAC | 260.0 | 210.9 | 227.5 | |||||||||
| Total related parties and affiliates net sales (2) | $ | 265.4 | $ | 227.6 | $ | 248.4 | ||||||
| (1) | During the first quarter of 2013, we purchased all of NSG’s shares in FMC WY. |
| (2) | Amounts included in revenue within our combined statements of operations. |
| 12 |
Net receivables from related parties and affiliates, net as of December 31, 2014 and 2013 are as follows:
| December 31, | ||||||||
| (in Millions) | 2014 | 2013 | ||||||
| FMC | $ | 2.5 | $ | 2.4 | ||||
| NatronX Technologies LLC | 1.0 | 0.8 | ||||||
| ANSAC (1) | 67.7 | 56.9 | ||||||
| Total receivables from related parties and affiliates, net | $ | 71.2 | $ | 60.1 | ||||
| (1) | Includes $0.3 million and $0.4 million of payables due to ANSAC as of December 31, 2014 and 2013, respectively. |
Note 6: Equity Method Investments
In 2011 we, in conjunction with Church & Dwight and TATA Chemicals (Soda Ash) Partners, formed NatronX. We hold a 33 1/3 percent ownership interest in NatronX. The joint venture engages in the manufacturing and marketing of sodium-based, dry absorbents for air pollution control in electric utility and industrial boiler operations. NatronX is currently in the process of completing a major plant construction project to build a beneficiated milled trona facility. The facility’s expected total cost is approximately $60 million and is projected to be completed by mid-2015.
We contributed $1.2 million, $6.4 million and $13.8 million during the years ended December 31, 2014, 2013 and 2012, respectively, to NatronX. During the years ended December 31, 2014, 2013 and 2012 we recognized $1.1 million, $1.7 million and $1.5 million in losses associated with NatronX. NatronX is still in its development stage and as a result since its formation has incurred losses associated with its start-up. Although NatronX is operating at a cumulative net loss, we performed an impairment analysis at December 31, 2014 and 2013 for which we have concluded that our investment in NatronX is still recoverable. As a result we do not believe that any impairment of our investment is deemed necessary. Our investment balance at December 31, 2014 and 2013 of $19.6 million and $19.5 million, respectively, is included within equity method investments in the combined balance sheets.
Note 7: Inventories
| December 31, | ||||||||
| (in Millions) | 2014 | 2013 | ||||||
| Finished goods | $ | 14.5 | $ | 13.9 | ||||
| Materials and supplies | 13.4 | 13.6 | ||||||
| Stockpiled ore | 10.3 | 6.9 | ||||||
| FIFO inventory | 38.2 | 34.4 | ||||||
| Less: Excess of FIFO cost over LIFO cost (1) | (11.7 | ) | (11.1 | ) | ||||
| Net inventories | $ | 26.5 | $ | 23.3 | ||||
| (1) | Inventories determined on a LIFO basis of accounting are finished goods and stockpiled ore. |
Note 8: Property, Plant and Equipment, Net
| December 31, | ||||||||
| (in Millions) | 2014 | 2013 | ||||||
| Land and land improvements | $ | 80.2 | $ | 74.2 | ||||
| Mineral rights | 31.4 | 31.4 | ||||||
| Buildings | 89.0 | 88.4 | ||||||
| Mine and development costs | 29.0 | 27.3 | ||||||
| Machinery and equipment | 825.7 | 801.2 | ||||||
| Total cost | $ | 1,055.3 | $ | 1,022.5 | ||||
| Accumulated depreciation (1) | (743.9 | ) | (725.5 | ) | ||||
| Construction in progress | 62.8 | 64.9 | ||||||
| Property, plant and equipment, net | $ | 374.2 | $ | 361.9 | ||||
| (1) | Depreciation expense was $ 36.8 million $38.0 million and $35.5 million for the years ended December 31, 2014, 2013 and 2012, respectively. |
| 13 |
Note 9: Asset Retirement Obligations
Our AROs primarily consist of our mine reclamation obligations. Our obligations under the mine reclamation obligation, among other things, is to return the surface of the mine in the Green River Basin in Wyoming back to its original state before mining operations began. As a result, we are required by the Wyoming Department of Environmental Quality (“WyDEQ”) to provide financial security associated with the cost to satisfy our obligations pertaining to our mining operations in the Green River Basin.
We provide this financial security via a “self-bond” the value of which at December 31, 2014 was approximately $73 million. The self-bond value is based on the amount we would need to pay the State of Wyoming for reclamation costs if we ceased mining operations currently. The amount of this self-bond is subject to change upon periodic re-evaluation by the Land Quality Division. Under the “self-bonding” program, we or our Parent are entitled to guarantee our obligation as long as either party meets the WyDEQ’s requirements for the financial strength and ability to pay. In 2013, our Parent, began to guarantee these obligations on our behalf to meet the WyDEQ’s financial strength requirements. During the years ended December 31, 2014 and 2013, we paid $0.8 million and $0.7 million to our Parent for this guarantee.
We have recognized the present value of our mine reclamation obligation as well as other AROs associated with our operations on our combined balance sheets. The balance of these AROs was $1.1 million at both December 31, 2014 and 2013. Accretion expense associated with our AROs was not considered material in the periods presented.
Note 10: Income Taxes
Taxable income and/or loss generated by us have been included in the consolidated federal income tax returns of FMC with all income tax payments made by the Parent to the taxing authorities. FMC has allocated income taxes to us in the accompanying combined financial statements as if we were held in a separate corporation which filed separate income tax returns. FMC believes the assumptions underlying the allocation of income taxes on a separate return basis are reasonable. However, the amounts allocated for income taxes in the accompanying combined financial statements are not necessarily indicative of the actual amount of income taxes that would have been recorded had we been held within a separate stand-alone entity.
The provision (benefit) for income taxes attributable to income consisted of:
| Year Ended December 31, | ||||||||||||
| (in Millions) | 2014 | 2013 | 2012 | |||||||||
| Current | $ | 19.8 | $ | 19.3 | $ | 22.2 | ||||||
| Deferred | 4.4 | (0.4 | ) | 5.2 | ||||||||
| Total | $ | 24.2 | $ | 18.9 | $ | 27.4 | ||||||
Total income tax provisions (benefits) were allocated as follows:
Significant components of the deferred income tax provision (benefit) attributable to income before income taxes are as follows:
| Year Ended December 31, | ||||||||||||
| (in Millions) | 2014 | 2013 | 2012 | |||||||||
| Deferred tax (exclusive of valuation allowance) | $ | (2.8 | ) | $ | (7.1 | ) | $ | 1.0 | ||||
| Net increase in the valuation allowance for deferred tax assets | 7.2 | 6.7 | 4.2 | |||||||||
| Deferred income tax provision | $ | 4.4 | $ | (0.4 | ) | $ | 5.2 | |||||
We have recognized that it is more likely than not that certain future tax benefits may not be realized through future taxable income. The valuation allowance increased $7.2 million and $6.7 million for the years ended December 31, 2014 and 2013, respectively. These increases were primarily due to U.S. federal alternative minimum tax credits generated during the year that are not expected to be recoverable.
| 14 |
Significant components of our deferred tax assets and liabilities were attributable to:
| December 31, | ||||||||
| (in Millions) | 2014 | 2013 | ||||||
| Alternative minimum, and other credit carryforwards | 68.3 | 61.1 | ||||||
| Deferred expenditures capitalized for tax | — | 1.0 | ||||||
| Other assets and reserves | 9.1 | 8.2 | ||||||
| Deferred tax assets | $ | 77.4 | $ | 70.3 | ||||
| Valuation allowance | (68.3 | ) | (61.1 | ) | ||||
| Deferred tax assets, net of valuation allowance | $ | 9.1 | $ | 9.2 | ||||
| Property, plant and equipment, net | (44.6 | ) | (40.3 | ) | ||||
| Deferred tax liabilities | $ | (44.6 | ) | $ | (40.3 | ) | ||
| Net deferred tax liabilities | $ | (35.5 | ) | $ | (31.1 | ) | ||
We evaluate our deferred income taxes each reporting period to determine if valuation allowances are required or should be adjusted. U.S. GAAP accounting guidance requires that companies assess whether valuation allowances should be established against their deferred tax assets based on all available evidence, both positive and negative, using a “more likely than not” standard. In assessing the need for a valuation allowance, appropriate consideration is given to all positive and negative evidence related to the realization of the deferred tax assets. This assessment considers, among other matters, the nature and severity of current and cumulative losses, forecasts of future profitability, the duration of statutory carryforward periods, and tax planning alternatives.
At December 31, 2014 , we had tax credit carryforwards primarily related to U.S. federal alternative minimum tax credits with an indefinite expiration period. These credits were allocated to Alkali based on its contribution to the FMC consolidated alternative minimum tax credit under a separate return methodology.
The effective income tax rate applicable to income from operations before income taxes was different from the statutory U.S. federal income tax rate due to the factors listed in the following table:
| Year Ended December 31, | ||||||||||||
| 2014 | 2013 | 2012 | ||||||||||
| Statutory U.S. tax rate | 35.0 | % | 35.0 | % | 35.0 | % | ||||||
| Net difference: | ||||||||||||
| Percentage depletion | (19.2 | ) | (21.4 | ) | (16.6 | ) | ||||||
| Manufacturer’s production deduction and miscellaneous tax credits | (1.0 | ) | (1.1 | ) | (1.3 | ) | ||||||
| Change in valuation allowance | 6.1 | 6.9 | 3.3 | |||||||||
| Other | (0.2 | ) | — | 1.2 | ||||||||
| Total difference | (14.3 | ) | (15.6 | ) | (13.4 | ) | ||||||
| Effective tax rate | 20.7 | % | 19.4 | % | 21.6 | % | ||||||
Uncertain Income Tax Positions
U.S. GAAP accounting guidance for uncertainty in income taxes prescribes a model for the recognition and measurement of a tax position taken or expected to be taken in a tax return, and provides guidance on derecognition, classification, interest and penalties, disclosure and transition.
Our financial results are included in our Parent's consolidated income tax returns in the U.S. federal jurisdiction. As of December 31, 2014, the U.S. federal income tax returns are open for examination and adjustment for the years 2011-2014. We recognize accrued interest and penalties related to unrecognized tax benefits as a component of income tax expense in the financial statements. The amount accrued for interest and penalties is not significant to the financial statements as of December 31, 2014.
The total amount of unrecognized tax benefits that, if recognized, would impact the effective tax rate was $1.2 million and $1.8 million as of December 31, 2014 and 2013, respectively. See the reconciliation of the total amounts of unrecognized tax benefits below.
We do not expect that our liability for gross unrecognized tax benefits will significantly change within the next 12 months.
| 15 |
A reconciliation of the beginning and ending amount of unrecognized tax benefits is as follows:
| (in Millions) | 2014 | 2013 | 2012 | |||||||||
| Balance at beginning of year | $ | 1.8 | $ | 1.5 | $ | 1.1 | ||||||
| Additions for positions of the current year | 0.3 | 0.3 | 0.3 | |||||||||
| Additions for positions of the prior year | — | — | 0.1 | |||||||||
| Reductions due to expiration of statutes of limitations | (0.9 | ) | — | — | ||||||||
| Balance at end of year | $ | 1.2 | $ | 1.8 | $ | 1.5 | ||||||
Note 11: Debt
Industrial revenue bonds
Industrial revenue bonds bearing fixed rate interest of 5.60 percent annually were issued in December 2005 with a 30 year maturity date and the ability of the Parent to call the bonds at face value beginning December 2015. Interest payments of $5.0 million for 2014, 2013 and 2012 have been paid by the Parent. The industrial revenue bonds are recorded at cost of $90.0 million as of December 31, 2014 and 2013. The fair market value of the bonds approximated $91.0 million at both December 31, 2014 and 2013.
Note 12: Pension and Other Postretirement Benefits
Our employees, who became employees of AHC on January 1, 2015 participate until consummation of the Transaction described in Note 1 and Note 16, in certain funded defined benefit pension and other domestic postretirement plans sponsored by FMC (the “Plans”), which include participants from FMC’s other businesses. In connection with the Transaction, the Plans are accounted for by us in accordance with multi-employer benefit plan U.S. GAAP accounting guidance. As a result, we did not record an asset or liability in the combined balance sheets to recognize the funded status of the Plans. Instead, we recorded net expense of $8.0 million, $7.2 million and $9.8 million for the years ended December 31, 2014, 2013, and 2012, respectively. This net expense represents an approximation of our portion of the Parent’s annual contribution to the Plans.
In addition to the pension and other postretirement benefits our employees take part in the FMC Corporation Savings and Investment Plan (the “Plan”). The Plan is a defined contribution plan, which covers substantially all of FMC’s U.S. employees (which includes our employees). For eligible Alkali employees participating in the plan, except for those covered by certain collective bargaining agreements, FMC makes matching contributions of 80% of the portion of those contributions up to five percent of the employee’s compensation. Additionally, effective July 1, 2007, all newly hired and rehired salaried and nonunion employees receive an annual employer contribution of five percent of the employee’s eligible compensation, since these employees are no longer eligible to participate in FMC’s defined benefit plan. We recorded net expense of $1.9 million, $1.8 million, and $1.5 million for the years ended December 31, 2014, 2013, and 2012, respectively, for our employees’ participation in the Plan.
Note 13: Share-based Compensation
Our eligible employees, who became employees of AHS on January 1, 2015 participate until consummation of the Transaction described in Note 1 and Note 16, in FMC’s Incentive Compensation and Stock Plan (the “ICS Plan”), which authorizes the grant of stock and stock-based awards. Awards available under the ICS Plan include options to purchase shares of common stock of FMC and restricted stock that vest over a period determined by FMC’s compensation committee.
Total stock-based compensation expense allocated to us is presented in the table below:
| Year Ended December 31, | ||||||||||||
| (in Millions) | 2014 | 2013 | 2012 | |||||||||
| Stock-based compensation expense (1) | $ | 1.1 | $ | 1.0 | $ | 1.3 | ||||||
| (1) | Amounts included in selling, general and administrative on the combined statement of operations. |
| 16 |
Note 14: Commitments and Contingencies
Commitments
We lease various types of manufacturing, data processing and rail transportation equipment. The gross rent expense under operating leases amounted to $16.0 million, $16.0 million and $15.4 million for the years ended December 31, 2014, 2013, and 2012, respectively. We receive rail credits for the use of leased rail transportation assets which are netted against rent expense. These credits amount to $26.3 million, $24.4 million and $24.9 million for the years ended December 31, 2014, 2013, and 2012, respectively.
Minimum future gross rentals under noncancelable leases are estimated to be payable as follows: $16.0 million in 2015, $11.8 million in 2016, $7.8 million in 2017, $5.4 million in 2018, $4.0 million in 2019 and $2.2 million thereafter. Minimum future rental credits for rail transportation assets under noncancelable leases which will offset the gross rentals above are as follows: $26.0 million in 2015, $26.2 million in 2016, $26.4 million in 2017, $26.5 million in 2018, $26.8 million in 2019 and zero thereafter. The majority of our future gross rentals and offsetting rental credits are obtained through contractual agreements with the Parent. See Note 5 within these combined financial statements for additional information.
See Note 9 within these combined financial statements for additional information on FMC’s guarantee associated with our mine reclamation obligations at the Green River Basin.
Contingencies
We have certain contingent liabilities arising in the ordinary course of business. Some of these contingencies are known but are so preliminary that the merits cannot be determined, or if more advanced, are not deemed material based on current knowledge; and some are unknown - for example, claims with respect to which we have no notice or claims which may arise in the future, resulting from products sold, guarantees or warranties made, or indemnities provided. Therefore, we are unable to develop a reasonable estimate of our potential exposure of loss for these contingencies, either individually or in the aggregate, at this time.
Based on information currently available and established reserves, we have no reason to believe that the ultimate resolution of known contingencies will have a material adverse effect on the combined financial position, liquidity or results of operations. However, there can be no assurance that the outcome of these contingencies will be favorable, and adverse results in certain of these contingencies could have a material adverse effect on the combined financial position, results of operations in any one reporting period, or liquidity.
Environmental
Portions of mining operations in the Green River Basin of Wyoming are powered by natural gas which is delivered to the site via pipelines. Condensate from a natural gas pipeline, that is no longer in service, was collected in a condensate tank and “blown- down” into an unlined condensate disposal pit, a practice that was widely accepted at the time. This condensate included contaminant traces of volatile organic compounds (“VOC”) that are characterized and monitored by the indicator parameter, benzene. As a result, site investigations have confirmed that these VOCs are present in the soils and groundwater which extends from the condensate disposal pit to a down-gradient area that is bounded by a groundwater cut-off wall and pump back system. Our Parent received notification from the WyDEQ requiring a Focused Feasibility Study (“FFS”) on the technologies that can be used to remedy the soils and groundwater in contaminated areas. The cost for the FFS had been accrued as of December 31, 2014 and approximated $0.2 million.
Until we have completed the FFS and developed a remediation plan approved by the WyDEQ we are unable to develop a reasonable estimate of our potential exposure of loss for this contingency at this time. Based on information currently available, we have no reason to believe that the ultimate resolution of our potential obligations for the benzene plume will have a material adverse effect on our financial position, liquidity or results of operations. However, there can be no assurance that the outcome will be favorable. Adverse results in the outcome of the FFS could have a material adverse effect on our financial position, results of operations in any one reporting period, or liquidity.
Take-or-Pay Arrangements
Our minimum commitments under our take-or-pay purchase obligations, primarily associated with the sourcing of coal used in the extraction of mined trona, total approximately $44.8 million expiring through 2026. Since the majority of the minimum obligations under these contracts are over the life of the contract as opposed to a year-by-year basis, we are unable to determine the periods in which these obligations could be payable under these contracts. However, we intend to fulfill the obligations associated with these contracts through purchases associated with the normal course of business.
| 17 |
Note 15: Segment Information
Our operations are similar in geography, nature of products we provide, and type of customers we serve. As we earn substantially all of our revenues through the sale of alkali-products derived from the mining of trona at a single location and the production of natural soda ash, we have concluded that we have one operating segment for reporting purposes. The revenues by geographic area for the years ended December 31, 2014, 2013 and 2012 are as follows:
| Year Ended December 31, | ||||||||||||
| (in Millions) | 2014 | 2013 | 2012 | |||||||||
| Domestic | $ | 456.1 | $ | 462.5 | $ | 442.7 | ||||||
| International | ||||||||||||
| ANSAC | 260.0 | 210.9 | 227.5 | |||||||||
| Other | 66.7 | 77.9 | 67.9 | |||||||||
| Total International | 326.7 | 288.8 | 295.4 | |||||||||
| Total | $ | 782.8 | $ | 751.3 | $ | 738.1 | ||||||
Our largest customer by sales is ANSAC. For the years ended December 31, 2014, 2013, and 2012, there were no other customers who individually accounted for 10 percent or more of total revenues.
Note 16: Subsequent Events
Sale of Alkali
On September 8, 2014, FMC announced its decision to pursue the sale of Alkali. On February 3, 2015, FMC signed a definitive agreement to sell AHC to a wholly owned subsidiary of Tronox Limited (“Tronox”) and the Transaction is expected to close in early 2015. In addition to the definitive agreement FMC entered into a customary transitional services agreement with Tronox to provide the orderly separation of the business and transition of various functions and processes. These services will be provided by FMC to Tronox for approximately 12 months after closing. These services would provide short-term assistances to Tronox, such as information technology services, while Tronox assumes operations of AHC.
Note 17: Supplemental Information
The following table presents details of prepaid and other current assets and accrued and other liabilities as presented on the combined balance sheets:
| Prepaid and other current assets | December 31, | ||||||||||
| (in Millions) | 2014 | 2013 | |||||||||
| Leased transportation asset credits | $ | 10.5 | $ | 10.7 | |||||||
| Prepaid freight and other prepaid and current assets | 10.4 | 10.1 | |||||||||
| Total | $ | 20.9 | $ | 20.8 | |||||||
| Accrued and other current liabilities | December 31, | ||||||||||
| (in Millions) | 2014 | 2013 | |||||||||
| Accrued payroll | $ | 16.3 | $ | 12.2 | |||||||
| Accrued property tax | 6.2 | 6.3 | |||||||||
| Accrued ore severance tax | 0.8 | 1.0 | |||||||||
| Accrued rail car repairs | 5.4 | 5.3 | |||||||||
| Other accrued and other current liabilities | 3.8 | 2.5 | |||||||||
| Total | $ | 32.5 | $ | 27.3 | |||||||
| 18 |