Attached files
| file | filename |
|---|---|
| EX-10.38 - EX-10.38 - Lantheus Holdings, Inc. | d819826dex1038.htm |
| EX-10.39 - EX-10.39 - Lantheus Holdings, Inc. | d819826dex1039.htm |
| EX-23.1 - EX-23.1 - Lantheus Holdings, Inc. | d819826dex231.htm |
| EX-10.37 - EX-10.37 - Lantheus Holdings, Inc. | d819826dex1037.htm |
Table of Contents
As filed with the Securities and Exchange Commission on June 16, 2015
Registration No. 333-196998
UNITED STATES
SECURITIES AND EXCHANGE COMMISSION
WASHINGTON, D.C. 20549
Amendment No. 9 to
FORM S-1
REGISTRATION STATEMENT UNDER THE
SECURITIES ACT OF 1933
Lantheus Holdings, Inc.
(Exact name of registrant as specified in its charter)
| Delaware | 2835 | 35-2318913 | ||
| (State or Other Jurisdiction of Incorporation or Organization) |
(Primary Standard Industrial Classification Code Number) |
(IRS Employer Identification No.) |
331 Treble Cove Road
North Billerica, Massachusetts 01862
(978) 671-8001
(Address, including zip code, and telephone number, including area code, of registrant’s principal executive offices)
Michael P. Duffy
Vice President, General Counsel and Secretary
331 Treble Cove Road, Building 600-2
North Billerica, Massachusetts 01862
(978) 671-8408
(Name, address, including zip code, and telephone number, including area code, of agent for service)
| Copies to:
| ||
| Heather L. Emmel, Esq. Weil, Gotshal & Manges LLP 767 Fifth Avenue New York, New York 10153 Telephone: (212) 310-8000 Facsimile: (212) 310-8007 |
Marc D. Jaffe, Esq. Ian D. Schuman, Esq. Latham & Watkins LLP 885 Third Avenue New York, New York 10022 Telephone: (212) 906-1200 Facsimile: (212) 751-4864 | |
Approximate date of commencement of proposed sale to the public: As soon as practicable after the effective date of this Registration Statement.
If any of the securities being registered on this Form are to be offered on a delayed or continuous basis pursuant to Rule 415 under the Securities Act of 1933, as amended, or the Securities Act, check the following box. ¨
If this Form is filed to register additional securities for an offering pursuant to Rule 462(b) under the Securities Act, please check the following box and list the Securities Act registration statement number of the earlier effective registration statement for the same offering. ¨
If this Form is a post-effective amendment filed pursuant to Rule 462(c) under the Securities Act, check the following box and list the Securities Act registration statement number of the earlier effective registration statement for the same offering. ¨
If this Form is a post-effective amendment filed pursuant to Rule 462(d) under the Securities Act, check the following box and list the Securities Act registration statement number of the earlier effective registration statement for the same offering. ¨
Indicate by check mark whether the registrant is a large accelerated filer, an accelerated filer, a non-accelerated filer or a smaller reporting company. See the definitions of “accelerated filer,” “large accelerated filer” and “smaller reporting company” in Rule 12b-2 of the Exchange Act.
| Large accelerated filer | ¨ | Accelerated filer | ¨ | Non-accelerated filer x | Smaller reporting company | ¨ | ||||||||
| (Do not check if a smaller reporting company) |
||||||||||||||
CALCULATION OF REGISTRATION FEE
|
| ||||||||
| Title of Each Class of Securities to be Registered |
Amount to be |
Proposed Offering Price |
Proposed Offering Price(2) |
Amount of Registration Fee(3) | ||||
| Common Stock, par value $0.01 per share |
9,078,946 | $10.50 | $95,328,933 | $10,022.15 | ||||
|
| ||||||||
|
| ||||||||
| (1) | Includes shares to be sold upon exercise of the underwriters’ option to purchase additional shares. See “Underwriting (Conflicts of Interest).” |
| (2) | This amount represents the proposed maximum aggregate offering price of the securities registered hereunder to be sold by the Registrant. These figures are estimated solely for the purpose of calculating the amount of the registration fee pursuant to Rule 457(a) under the Securities Act of 1933, as amended. |
| (3) | Previously paid. |
The Registrant hereby amends this Registration Statement on such date or dates as may be necessary to delay its effective date until the Registrant shall file a further amendment which specifically states that this Registration Statement shall thereafter become effective in accordance with Section 8(a) of the Securities Act or until the Registration Statement shall become effective on such date as the Commission acting pursuant to said Section 8(a), may determine.
Table of Contents
EXPLANATORY NOTE
Prior to the consummation of this offering, we will enter into a corporate reorganization, whereby our direct, wholly-owned subsidiary, Lantheus MI Intermediate, Inc. will merge with and into us. See “Prospectus Summary—Corporate Reorganization and Concurrent Refinancing Transaction” in the accompanying prospectus.
Table of Contents
The information in this preliminary prospectus is not complete and may be changed. We may not sell these securities until the registration statement filed with the Securities and Exchange Commission is effective. This preliminary prospectus is not an offer to sell these securities and it is not soliciting an offer to buy these securities in any state where the offer or sale is not permitted.
SUBJECT TO COMPLETION, DATED JUNE 16, 2015
PRELIMINARY PROSPECTUS

7,894,736 Shares
Lantheus Holdings, Inc.
Common Stock
$ per share
This is the initial public offering of our common stock. We are selling 7,894,736 shares of our common stock. We currently expect the initial public offering price to be between $8.50 and $10.50 per share of common stock. No public market currently exists for our common stock.
We have granted the underwriters an option to purchase up to 1,184,210 additional shares of common stock solely to cover over-allotments.
We have applied to list our common stock on The NASDAQ Global Market under the symbol “LNTH.”
We are an “emerging growth company” as defined under the federal securities laws and, as such, will be subject to reduced public company reporting requirements. See “Prospectus Summary—Implications of Being an Emerging Growth Company.”
Investing in our common stock involves a high degree of risk. See “Risk Factors” beginning on page 18.
Neither the Securities and Exchange Commission nor any state securities commission has approved or disapproved of these securities or determined if this prospectus is truthful or complete. Any representation to the contrary is a criminal offense.
| PER SHARE |
TOTAL | |||
| Public Offering Price |
$ | $ | ||
| Underwriting Discount(1) |
$ | $ | ||
| Proceeds to Lantheus Holdings, Inc. (before expenses) |
$ | $ |
| (1) | We refer you to “Underwriting (Conflicts of Interest)” beginning on page 173 of this prospectus for additional information regarding total underwriting compensation. |
The underwriters expect to deliver the shares to purchasers on or about , 2015 through the book-entry facilities of The Depository Trust Company.
| Credit Suisse | Jefferies | RBC Capital Markets | Wells Fargo Securities | |||
Baird
, 2015
Table of Contents
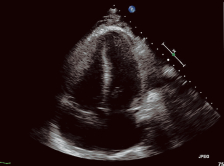
Image of Heart Without Using Contrast Agent
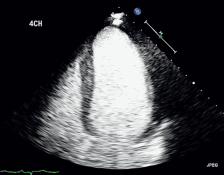
Image of Heart Using DEFINITY®
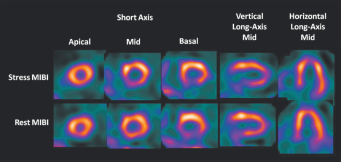
SPECT Image Showing Probable Coronary Artery Disease (CAD) in Patient Without CAD
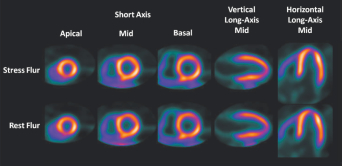
Flurpiridaz F 18 Image Confirming No CAD in Same Patient Without CAD
Table of Contents
| 1 | ||||
| 18 | ||||
| 49 | ||||
| 51 | ||||
| 52 | ||||
| 53 | ||||
| 55 | ||||
| 57 | ||||
| 58 | ||||
| MANAGEMENT’S DISCUSSION AND ANALYSIS OF FINANCIAL CONDITION AND RESULTS OF OPERATIONS |
60 | |||
| 97 | ||||
| 130 | ||||
| 137 | ||||
| 152 | ||||
| 156 | ||||
| 158 | ||||
| 163 | ||||
| 167 | ||||
| MATERIAL U.S. FEDERAL INCOME TAX CONSIDERATIONS TO NON-U.S. HOLDERS |
169 | |||
| 173 | ||||
| 178 | ||||
| 178 | ||||
| 178 | ||||
| F-1 |
You should rely only on the information contained in this prospectus. We and the underwriters have not authorized any other person to provide you with any additional information or different information. If anyone provides you with additional, different or inconsistent information, you should not rely on it. We and the underwriters are not making an offer to sell these securities in any jurisdiction where the offer or sale is not permitted. You should assume that the information appearing in this prospectus is only accurate as of the date on the front cover of this prospectus. Our business, financial condition, results of operations and prospects may have changed since that date.
TRADEMARKS
We own or have the rights to various trademarks, service marks and trade names, including, among others, the following: DEFINITY®, TechneLite®, Cardiolite®, Neurolite®, Ablavar®, Vialmix®, Quadramet® (United States only) and Lantheus Medical Imaging® referred to in this prospectus. Solely for convenience, we refer to trademarks, service marks and trade names in this prospectus without the TM, SM and ® symbols. Those references are not intended to indicate, in any way, that we will not assert, to the fullest extent permitted under applicable law, our rights to our trademarks, service marks and trade names. Each trademark, trade name or service mark of any other company appearing in this prospectus, such as Lumason®, Myoview®, Optison® and SonoVue® are, to our knowledge, owned by that other company.
MARKET AND INDUSTRY INFORMATION
Market data and industry information used throughout this prospectus is based on management’s knowledge of the industry and the good faith estimates of management. We also relied, to the extent available, upon management’s review of independent industry surveys and publications, including Global Industry Analysts, Inc. and Frost & Sullivan, and other publicly available information prepared by a number of sources, including American Heart Association. All of the market data and industry information used in this prospectus involves a number of assumptions and limitations, and you are cautioned not to give undue weight to these estimates. While we believe the estimated market position, market opportunity and market size information included in this prospectus is reliable, that information, which is derived in part from management’s estimates and beliefs, is inherently uncertain and imprecise. Projections, assumptions and estimates of our future performance and the
Table of Contents
future performance of the industry in which we operate are necessarily subject to a high degree of uncertainty and risk due to a variety of factors, including those described in “Risk Factors,” “Cautionary Note Regarding Forward-Looking Statements” and elsewhere in this prospectus. Those and other factors could cause results to differ materially from those expressed in our estimates and beliefs and in the estimates prepared by independent parties.
Table of Contents
This summary provides an overview of selected key information contained elsewhere in this prospectus and is qualified in its entirety by the more detailed information and consolidated financial statements included elsewhere in this prospectus. You should carefully review the entire prospectus, including the risk factors, the consolidated financial statements and the notes thereto, and the other documents to which this prospectus refers before making an investment decision. Unless the context requires otherwise: references to “Lantheus,” “the Company,” “our company,” “we,” “us” and “our” refer to Lantheus Holdings, Inc. and, as the context requires, its direct and indirect subsidiaries, after giving effect to the corporate reorganization (including the related 0.355872-for-1 reverse stock split) described below; references to “Lantheus Holdings” refer to Lantheus Holdings, Inc. (previously named Lantheus MI Holdings, Inc.), our predecessor; references to “Lantheus Intermediate” refer to Lantheus MI Intermediate, Inc.; and references to “LMI” refer to Lantheus Medical Imaging, Inc., our wholly-owned subsidiary.
Overview
We are a global leader in developing, manufacturing, selling and distributing innovative diagnostic medical imaging agents and products that assist clinicians in the diagnosis of cardiovascular and other diseases. Our agents are routinely used to diagnose coronary artery disease, congestive heart failure, stroke, peripheral vascular disease and other diseases. Clinicians use our imaging agents and products across a range of imaging modalities, including echocardiography, nuclear imaging and magnetic resonance imaging, or MRI. We believe that the resulting improved diagnostic information enables healthcare providers to better detect and characterize, or rule out, disease, potentially achieving improved patient outcomes, reducing patient risk and limiting overall costs for payers and the entire healthcare system.
Our commercial products are used by cardiologists, nuclear physicians, radiologists, internal medicine physicians, sonographers and technologists working in a variety of clinical settings. We sell our products to hospitals, clinics, group practices, integrated delivery networks, group purchasing organizations, radiopharmacies and, in certain circumstances, wholesalers. We sell our products globally and have operations in the United States, Puerto Rico, Canada and Australia and distribution relationships in Europe, Asia Pacific and Latin America.
For the three months ended March 31, 2015, we recorded revenues, net income and Adjusted EBITDA of $74.8 million, $0.4 million and $20.6 million, respectively. For the year ended December 31, 2014, we recorded revenues, net loss and Adjusted EBITDA of $301.6 million, $3.6 million and $70.8 million, respectively. Our products are sold in 30 countries and we generated approximately 19% and 22% of our revenues outside of the United States for three months ended March 31, 2015 and the year ended December 31, 2014, respectively. For an explanation of Adjusted EBITDA and a reconciliation of Adjusted EBITDA to net loss as calculated under generally accepted accounting principles, or GAAP, see footnote (3) of “—Summary Consolidated Financial and Other Data.”
Our portfolio of 10 commercial products is diversified across a range of imaging modalities. Our products include contrast agents and medical radiopharmaceuticals (including technetium generators).
| • | Contrast agents are typically non-radioactive compounds that are used in diagnostic procedures such as cardiac ultrasounds, or echocardiograms, x-ray imaging or MRIs that are used by physicians to improve the clarity of the diagnostic image. |
1
Table of Contents
| • | Radiopharmaceuticals are radioactive pharmaceuticals used by clinicians to perform nuclear imaging procedures. |
| • | In certain circumstances, a radioactive element, or radioisotope, is attached to a chemical compound to form the radiopharmaceutical. This act of attaching the radioisotope to the chemical compound is called radiolabeling, or labeling. |
| • | In other circumstances, a radioisotope can be used as a radiopharmaceutical without attaching any additional chemical compound. |
| • | Radioisotopes are most commonly manufactured in a nuclear research reactor, where a radioactive target is bombarded with subatomic particles, or on a cyclotron, which is a type of particle accelerator that also creates radioisotopes. |
| • | Two common forms of nuclear imaging procedures are single-photon emission computed tomography, or SPECT, which measures gamma rays emitted by a SPECT radiopharmaceutical, and positron emission tomography, or PET, which measures positrons emitted by a PET radiopharmaceutical. |
As an example of the procedures in which our products may be used, in the diagnosis of coronary artery disease, a typical diagnostic progression could include an electrocardiogram, followed by an echocardiogram (possibly using our agent DEFINITY), and then a nuclear myocardial perfusion imaging, or MPI, study using either SPECT or PET imaging (possibly using our technetium generator or one of our MPI agents). An MPI study assesses blood flow distribution to the heart. MPI is also used for diagnosing the presence of coronary artery disease. See “—Diagnostic Medical Imaging Agent Overview.”
Leading Products
Our leading commercial product is:
| • | DEFINITY—the leading ultrasound contrast imaging agent used by cardiologists and sonographers during echocardiography exams based on revenue and usage. DEFINITY is an injectable agent that is indicated in the United States for use in patients with suboptimal echocardiograms to assist in the visualization of the left ventricle, the main pumping chamber of the heart. The use of DEFINITY in echocardiography allows physicians to significantly improve their assessment of the function of the left ventricle. Since its launch in 2001, DEFINITY has been used to image more than five million patients in the United States alone. |
Of the total number of echocardiograms performed each year in the United States—over 30 million in 2014—based on medical literature, we estimate that approximately 20%, or approximately six million echocardiograms in 2014, produce suboptimal images. We believe that for the three months ended March 31, 2015, 4.4% of the total echocardiography procedures performed in the United States used a contrast agent, constituting an estimated 22% of all suboptimal echocardiograms performed. This compares to a contrast penetration rate of 3.5% for the three months ended March 31, 2014, or an estimated 17.7% of all suboptimal echocardiograms performed. Contrast penetration rates in echocardiography procedures have increased over the past seven years and we believe will continue to increase in the future as clinicians continue to adopt the use of contrast as an important tool to assist their clinical decision-making. Of the echocardiograms in which a contrast agent is used, we estimate that DEFINITY had an approximate 78% share of these procedures in the United States as of December 2014.
We believe that DEFINITY has this leading position because of its preferred product functionality and composition derived from a synthetic rather than a blood-based product. As a result, we believe DEFINITY will be a key driver of the future growth of our business, both in the United States and in international markets as we continue to grow contrast penetration through sales and marketing efforts focused on the appropriate use of contrast and maintain our leading position. DEFINITY currently has patent or other exclusivity protection until 2021 in the United States and until 2019 outside of the United States, and we have a next generation development program for this agent.
2
Table of Contents
Our leading commercial radiopharmaceutical products are:
| • | TechneLite—a self-contained system, or generator, of technetium (Tc99m), a radioisotope with a six hour half-life, used by radiopharmacists at radiopharmacies to prepare patient-specific radiolabeled imaging agents. Technetium results from the radioactive decay of Molybdenum-99, or Moly, itself a radioisotope with a 66-hour half-life produced in nuclear research reactors around the world from enriched uranium. Because of the short half-lives of Moly and technetium, radiopharmacies typically replace TechneLite generators on a weekly basis pursuant to standing orders made with us. In addition, the supply chain for Moly is global and, because of the 66-hour half-life, we utilize just-in-time inventory management. We believe that we have the most balanced and diversified supply chain in the industry, buying Moly from four out of the five major global Moly processors, which are supplied by seven of the eight major global Moly reactors. |
We are one of two principal technetium generator manufacturers in the United States and Canada. We are also the leading and most consistent U.S. manufacturer of low-enriched uranium, or LEU, technetium generators. Governments and policy-makers are encouraging the increased use of technetium generators made with Moly derived from LEU rather than highly-enriched uranium, or HEU, which may present greater proliferation and security risks. In the United States, nuclear imaging agent unit doses prepared with LEU technetium generators are reimbursed by Medicare in the hospital outpatient setting at a higher rate.
We believe that our substantial capital investments in our highly automated TechneLite production line and our extensive experience in complying with the stringent regulatory requirements for the handling of nuclear materials create significant and sustainable competitive advantages for us in generator manufacturing and distribution. We estimate that in 2014, we had an approximately 43% share of generator sales in the United States. Certain TechneLite generator components currently have U.S. patent protection until 2029.
| • | Xenon Xe 133 Gas is a radiopharmaceutical gas that is inhaled and used to assess pulmonary function and also to image cerebral blood flow. Our Xenon is manufactured by a third party as part of the Moly production process and packaged by us. We are currently the leading provider of Xenon in the United States. |
Other Commercial Products
In addition to the products listed above, our portfolio of commercial products also includes important imaging agents in specific market segments, which provide a stable base of recurring revenue.
| • | Cardiolite is an injectable, technetium-labeled imaging agent, also known by its generic name sestamibi, used with SPECT technology in MPI procedures that assess blood flow to the muscle of the heart. Launched in 1991, Cardiolite has the highest cumulative revenue of any branded radiopharmaceutical in history. |
| • | Neurolite is an injectable, technetium-labeled imaging agent used with SPECT technology to identify the area within the brain where blood flow has been blocked or reduced due to stroke. |
| • | Thallium Tl 201 is an injectable radiopharmaceutical imaging agent used in MPI studies to detect coronary artery disease and is manufactured by us using cyclotron-based technology. |
| • | Gallium Ga 67 is an injectable radiopharmaceutical imaging agent used to detect certain infections and cancerous tumors, especially lymphoma, and is manufactured by us using cyclotron technology. |
| • | Fludeoxyglucose F 18, or FDG, is an injectable, fluorine-18-labeled imaging agent used with PET technology to identify and characterize tumors in patients undergoing oncologic diagnostic procedures. Gludef is our branded version of FDG in the United States. |
3
Table of Contents
| • | Quadramet, our only therapeutic product, is an injectable radiopharmaceutical used to treat severe bone pain associated with certain kinds of cancer, and is manufactured by us. |
| • | Ablavar is an injectable, gadolinium-based contrast agent used with magnetic resonance angiography, or MRA, a type of MRI scan, to image the iliac arteries that start at the aorta and go through the pelvis into the legs, in order to diagnose narrowing or blockage of these arteries in known or suspected peripheral vascular disease. |
In the United States and Canada, we sell DEFINITY through our sales team of approximately 80 employees that call on healthcare providers in the echocardiography space, as well as group purchasing organizations and integrated delivery networks. Our radiopharmaceutical products are primarily distributed through commercial radiopharmacies, the majority of which are controlled by or associated with Cardinal Health, or Cardinal, United Pharmacy Partners, or UPPI, GE Healthcare and Triad Isotopes, Inc., or Triad.
In Canada, Puerto Rico and Australia, we own eight radiopharmacies and sell our radiopharmaceuticals, as well as others, directly to end users. In Europe, Asia Pacific and Latin America, we utilize distributor relationships to market, sell and distribute our products. We have entered into a partnership with Beijing Double-Crane Pharmaceutical Co., Ltd., or Double-Crane, to complete confirmatory clinical trials necessary for Chinese regulatory approval and to distribute DEFINITY in China. We believe that international markets, particularly China, represent significant growth opportunities for our products.
Our Agents in Development
We have established a portfolio of three internally-discovered imaging agents in clinical and preclinical development, each of which we believe could represent a large market opportunity and has the potential to significantly enhance current imaging modalities and fulfill unmet diagnostic medical imaging needs. We are currently seeking strategic partners to pursue the further development of each of these agents, which include:
| • | Flurpiridaz F 18—Myocardial Perfusion Imaging Agent. Flurpiridaz F 18 is a small molecule imaging agent radiolabeled with fluorine-18 and designed for use in PET MPI to assess blood flow to the muscle of the heart. We believe that in comparison to SPECT MPI, the current standard of care, PET MPI with flurpiridaz F 18 potentially provides higher image quality, increased diagnostic certainty, more accurate risk stratification and reduced patient radiation exposure. This agent could be particularly useful in difficult to image heart patients, including women and obese patients currently underserved by available diagnostic methods. In the first of two planned Phase 3 studies, PET MPI with flurpiridaz F 18 consistently showed a balanced performance in identifying disease (sensitivity) and ruling out disease (specificity), when compared to coronary angiography, the truth standard. Unlike flurpiridaz F 18, SPECT imaging results were skewed with low sensitivity and high specificity when compared to the truth standard. When the flurpiridaz F 18 results were compared to the SPECT results, flurpiridaz F 18 substantially outperformed SPECT in sensitivity, one of the study’s primary endpoints, but did not meet the study’s other primary endpoint, non-inferiority in specificity, implying a substantial and unexpected under-diagnosis of CAD with SPECT imaging in the trial. |
In subgroup analyses, the risk-benefit profile of flurpiridaz F 18 appeared to be favorable in women, obese patients and patients with multivessel disease. A significantly higher percentage of images were rated as either excellent or good with flurpiridaz F 18 as compared to SPECT, leading to a greater diagnostic certainty of interpretation. Importantly, radiation exposure associated with flurpiridaz F 18 was reduced to approximately 50% of SPECT. In addition, no drug-related serious adverse events were observed.
Based on these results, we have redesigned the protocol for our second Phase 3 trial, including different primary endpoints. On March 13, 2015, the FDA granted us a Special Protocol Assessment, or SPA, in connection with the new trial. We are now in active discussions with a number of prospective partners
4
Table of Contents
for the further development and commercialization of this promising agent. This compound currently has U.S. patent protection until 2028 before taking into account any potential regulatory extensions.
| • | 18F LMI 1195—Cardiac Neuronal Imaging Agent. 18F LMI 1195 is a small molecule imaging agent also radiolabeled with fluorine-18 and designed to assess cardiac sympathetic nerve function with PET imaging. We believe that PET imaging with 18F LMI 1195 could allow for better identification of patients at risk of heart failure progression and fatal arrhythmias, which would better inform pharmaceutical therapy or implantable device use. This compound has completed a Phase 1 study and currently has U.S. patent protection until 2030 before taking into account any potential regulatory extensions. |
| • | LMI 1174—Vascular Remodeling Imaging Agent. LMI 1174 is a gadolinium-based MRI agent designed to identify elastin in the arterial walls and atherosclerotic plaques. We believe that this agent could allow for the minimally-invasive assessment of plaque location, burden and composition and, accordingly, could be used to risk stratify patients for potential vascular events, including heart attack or stroke. This compound is in late-stage preclinical studies and currently has U.S. patent protection until 2031 before taking into account any potential regulatory extensions. |
Diagnostic Medical Imaging Agent Overview
Medical imaging is commonly employed as a critical aid in the diagnosis of numerous medical conditions, including heart disease and cancer. Selection of treatment options and monitoring of disease progression are also facilitated by the use of imaging procedures. Diagnostic medical imaging procedures often employ imaging agents to highlight specific tissues and organs, or physiological or pathological processes. Imaging agents can be used in a range of imaging modalities, including ultrasound, SPECT, PET, MRI, x-ray and computed tomography, or CT.
Echocardiography
Cardiac ultrasound, also known as echocardiography, is a non-invasive test that uses sound waves to create moving images of the heart. These images allow an assessment of the heart’s size, shape and function. For example, echocardiography can be used to detect areas of the heart that are not functioning properly due to poor blood supply, as seen in patients with coronary artery disease. Echocardiography is considered to be one of the safest, most reliable and cost-effective ways to diagnose certain cardiac abnormalities, and it is the most widely used technique for non-invasive imaging of the heart. Echocardiography may, however, yield images of limited diagnostic value in certain situations due to signal attenuation, such as in women and patients who are obese or have lung disease. It is estimated that suboptimal image quality occurs in approximately 20% of all patients undergoing echocardiography in the United States. Uninterpretable images may lead to misdiagnosis or the need for additional, often unnecessary and costly tests. Use of contrast agents in echocardiography increases sensitivity and specificity, particularly in hard to image patients, by improving the delineation of the edges of the heart wall. In 2014, according to a third party source, there were over 30 million echocardiography procedures performed in the United States.
Nuclear Imaging
Nuclear imaging uses small amounts of radioactive materials, called radiopharmaceuticals, taken by injection, inhalation or orally to diagnose and treat disease. Radiopharmaceutical imaging agents consist of a radioisotope (such as technetium), often paired with a molecular agent (such as Cardiolite and Neurolite) designed to localize in specific organs and tissues. Clinicians utilize specialized cameras, either SPECT or PET, designed to capture radiation emitted by the agent. Computers are then used to generate detailed images of the area of interest. The resulting images provide clinicians with important information on both the structure and function of the internal organ or tissue.
5
Table of Contents
Imaging Agents Market
We believe that the demand for imaging agents in developed and developing markets will continue to be driven by an aging and increasingly obese population, and bolstered by long-term initiatives focused on improving healthcare and the supporting infrastructure, with a particular emphasis on expanding access to rural areas and small towns and cities. According to a research report dated February 2012 released by Global Industry Analysts, Inc., or GIA, the worldwide diagnostic imaging market is projected to reach $18 billion by 2017, reflecting a compound annual growth rate of 7.2% over the period from 2013 through 2017.
Heart disease is a key driver of growth in the market for diagnostic medical imaging procedures and agents. Heart disease is currently the leading cause of death for both women and men in the United States and worldwide. According to the American Heart Association, or AHA, an estimated 83.6 million American adults, greater than one in three, have one or more types of heart disease. Heart disease refers to a number of disease states including coronary artery disease and structural defects of the heart. Coronary artery disease is the most common form of heart disease, with an estimated prevalence of approximately 6% in the United States. Many of our imaging agents and products are used in connection with diagnostic imaging for heart disease.
Our Competitive Strengths
We believe that our business model provides us with a strong platform to reach our strategic goal of providing cost-effective, clinically-beneficial diagnostic medical imaging agents and products that enable clinicians either to identify and characterize, or rule out, disease and consequently improve patient care. We believe our competitive strengths include:
| • | Leading Position Across a Range of Imaging Modalities. We are a global leader in the diagnostic medical imaging industry with over 50 years of experience in developing and bringing to market differentiated products critical to healthcare decision making, including contrast imaging agents, radiopharmaceutical imaging agents and other products. Our key brands include: DEFINITY, the leading echocardiology contrast imaging agent based on revenue and usage; and TechneLite, our technetium-based generator used by radiopharmacies to radiolabel technetium-based imaging agents, such as our own SPECT products Cardiolite and Neurolite, that are used in combination with nuclear imaging technologies. We also sell a broad portfolio of other commercial agents and products, diversified across a range of imaging modalities. |
| • | DEFINITY is a Uniquely-Positioned Growth Opportunity in the United States and Globally. We believe that DEFINITY will be a key driver of the future growth of our business, both in the United States and globally. We believe that for the three months ended March 31, 2015, 4.4% of the total echocardiography procedures performed in the United States used a contrast agent, constituting an estimated 22% of all suboptimal echocardiograms performed. This compares to a contrast penetration rate of 3.5% for the three months ended March 31, 2014, or an estimated 17.7% of all suboptimal echocardiograms performed. In echocardiography procedures in which a contrast agent is used, we estimate that DEFINITY had approximately 78% share of these procedures in the United States as of December 2014. We are actively pursuing international growth opportunities, such as our partnership with Double-Crane in China. If the regulatory and required clinical trial processes in China are both timely and successful, we currently estimate the commercialization of DEFINITY in China will begin in 2018. We are also pursuing additional product registrations internationally to maximize the global potential of DEFINITY. We believe our intellectual property for DEFINITY currently gives us patent or other market exclusivity protection in the United States until 2021 and outside of the United States until 2019, and we have an active next generation development program for this agent. |
| • | Significant Investment in Complex Manufacturing and Regulatory Capabilities. We believe that our expertise in the design, development and validation of complex manufacturing systems and processes that many of our radiopharmaceutical products require due to their limited half-lives, as well as our strong |
6
Table of Contents
| track record of on-time delivery and reputation as a high-quality, reliable provider, has enabled us to become a leader in the diagnostic medical imaging industry. We believe that our substantial capital investments in our highly automated generator production line, our cyclotrons and our extensive experience in complying with the stringent regulatory requirements for the handling of nuclear materials create significant and sustainable competitive advantages. |
| • | Diversified Supply Chain. We are establishing a strong and diversified supply chain for our key products. For DEFINITY, we have already successfully completed a technology transfer from Ben Venue Laboratories, or BVL, our former manufacturing partner, to Jubilant HollisterStier, or JHS. We are also now in the process of our technology transfer activities with Pharmalucence Inc., or Pharmalucence, an additional manufacturing partner for DEFINITY, and we currently target filing for FDA approval to manufacture DEFINITY at Pharmalucence in 2015. For TechneLite, we have a strong and reliable position in the technetium generator market because of our balanced and diversified Moly supply and our favorable access to Moly derived from LEU. We believe we have the most balanced and diversified Moly supply chain in the industry. We receive finished Moly from four of the five main processing sites in the world. These processing sites are, in turn, supplied by seven of the eight main Moly-producing reactors in the world. We are also the leading and most consistent manufacturer of LEU generators in North America. |
| • | Experienced Direct Sales Force and Established Global Distribution Network. In the United States and Canada, we sell DEFINITY through our sales team of approximately 80 employees, which we believe is the largest dedicated sales force in the industry serving the echocardiography market. The majority of our sales team has over a decade of experience selling diagnostic imaging agents. Our radiopharmaceuticals (including technetium generators) are primarily distributed in the United States through commercial radiopharmacies, the majority of which are controlled by or associated with Cardinal, UPPI, GE Healthcare and Triad. In Canada, Puerto Rico and Australia, we own radiopharmacies and sell radiopharmaceutical products directly to end users. In Europe, Asia Pacific and Latin America, we utilize distributor relationships to market, sell and distribute all of our products. |
| • | Experienced Management Team. Our senior management team has an average of more than 25 years of healthcare industry experience and consists of industry leaders with significant expertise in product development, operations and commercialization. We believe that the depth and experience of our management team demonstrates our expertise within the diagnostic medical imaging industry and our ability to operate successfully in a highly regulated environment. |
Our Business Strategy
Our objective is to enhance our position as a global leader in developing, manufacturing, selling and distributing innovative diagnostic medical imaging agents and products. The key elements of this strategy are to:
| • | continue to grow U.S. sales of our existing commercial products, which are diversified across a range of imaging modalities; |
| • | enhance the position of our portfolio of commercial products in international markets, obtaining additional regulatory approvals where necessary; |
| • | create strategic partnerships to further advance our agents in development to maximize their value in potentially large domestic and international markets; and |
| • | pursue select strategic transactions to further strengthen and diversify our portfolios of commercial products, improve our margins and leverage our core competencies. |
7
Table of Contents
Implications of Being an Emerging Growth Company
As a company with less than $1 billion in revenue during our last fiscal year, we qualify as an “emerging growth company,” as defined in the Jumpstart Our Business Startups Act of 2012, as amended, or the JOBS Act. An emerging growth company may take advantage of specified reduced reporting and other regulatory requirements for up to five years that are otherwise applicable generally to public companies. These provisions include, among other matters:
| • | exemption from the auditor attestation requirement on the effectiveness of our system of internal control over financial reporting; |
| • | exemption from compliance with any new requirements adopted by the Public Company Accounting Oversight Board requiring mandatory audit firm rotation or a supplement to the auditor’s report in which the auditor would be required to provide additional information about the audit and the financial statements of the issuer; |
| • | exemption from the requirement to seek non-binding advisory votes on executive compensation and golden parachute arrangements; and |
| • | reduced disclosure about executive compensation arrangements. |
We will remain an emerging growth company for five years unless, prior to that time, we have (i) more than $1 billion in annual revenue, (ii) have a market value for our common stock held by non-affiliates of more than $700 million as of the last day of our second fiscal quarter of the fiscal year when a determination is made that we are deemed to be a “large accelerated filer,” as defined in Rule 12b-2 promulgated under the Securities Exchange Act of 1934, as amended, or the Exchange Act, or (iii) issue more than $1 billion of non-convertible debt over a three-year period. We have availed ourselves of the reduced reporting obligations with respect to executive compensation disclosure in this prospectus, and expect to continue to avail ourselves of the reduced reporting obligations available to emerging growth companies in future filings.
In addition, Section 107 of the JOBS Act also provides that an emerging growth company can take advantage of the extended transition period provided in Section 7(a)(2)(B) of the Securities Act of 1933, or the Securities Act, for complying with new and revised accounting standards. An emerging growth company can, therefore, delay the adoption of certain accounting standards until those standards would otherwise apply to private companies. However, we are choosing to “opt out” of that extended transition period and, as a result, we plan to comply with new and revised accounting standards on the relevant dates on which adoption of those standards is required for non-emerging growth companies. Section 107 of the JOBS Act provides that our decision to opt out of the extended transition period for complying with new and revised accounting standards is irrevocable.
As a result of our decision to avail ourselves of certain provisions of the JOBS Act, the information that we provide may be different than what you may receive from other public companies in which you hold an equity interest. In addition, it is possible that some investors will find our common stock less attractive as a result of our elections, which may cause a less active trading market for our common stock and more volatility in our stock price.
8
Table of Contents
Risks Associated With Our Business
Our business is subject to numerous risks, as discussed more fully in the section entitled “Risk Factors” beginning on page 18 of this prospectus, which you should read in its entirety. In particular:
| • | the growth of our business is substantially dependent on increased market penetration for the appropriate use of DEFINITY in suboptimal echocardiograms; |
| • | we face continued pricing pressures from our competitors, large customers and group purchasing organizations; |
| • | in the United States, we are heavily dependent on a few large customers and group purchasing organization arrangements to generate a majority of our revenues for our medical imaging products and outside of the United States, we rely on distributors to generate a substantial portion of our revenue; |
| • | our dependence upon third parties for the manufacture and supply of a substantial portion of our products could prevent us from delivering our products to our customers in the required quantities, within the required timeframes, or at all, which could result in order cancellations and decreased revenues; |
| • | the global supply of Moly is fragile and not stable and our dependence on a limited number of third party suppliers for Moly could prevent us from delivering some of our products to our customers in the required quantities, within the required timeframe, or at all, which could result in order cancellations and decreased revenues; |
| • | our just-in-time manufacturing of radiopharmaceutical products relies on the timely receipt of radioactive raw materials and the timely shipment of finished goods, and any disruption of our supply or distribution networks could have a negative effect on our business; |
| • | we face potential supply and demand challenges for Xenon; |
| • | certain of our customers are highly dependent on payments from third party payors, including government sponsored programs, particularly Medicare, in the United States and other countries in which we operate, and reductions in third party coverage and reimbursement rates for our products could adversely affect our business and results of operations; |
| • | our history of net losses and ability to achieve sustained profitability; and |
| • | we have a substantial amount of indebtedness that may limit our financial and operating activities and adversely affect our ability to incur additional debt to fund future needs, and we may not be able to generate sufficient cash flow to meet our debt service requirements. |
Corporate Reorganization and Concurrent Refinancing Transaction
After the effectiveness of the registration statement of which this prospectus forms a part and prior to the consummation of this offering, we will effect a corporate reorganization, whereby our direct, wholly-owned subsidiary, Lantheus MI Intermediate, Inc. (the direct parent of LMI) will merge with and into us, and we will be the surviving entity of the merger, and each share of our common stock outstanding immediately prior to the merger (other than shares held in treasury) will be converted into the right to receive 0.355872 shares of our newly issued common stock, with any fractional shares rounded down (which equates to a 0.355872-for-1 reverse stock split), and shares held in treasury will be cancelled and retired. In addition, as part of our corporate reorganization, shares of our common stock underlying stock options outstanding immediately prior to the merger will be ratably adjusted, and certain unvested performance-vesting stock options will be amended (see “Executive and Director Compensation—Outstanding Incentive Awards and Anticipated Awards in Connection with this Offering”). The corporate reorganization will not affect our operations, which we will continue to conduct through our operating subsidiaries, including LMI.
9
Table of Contents
Concurrently with this offering, LMI expects to enter into a $365.0 million senior secured term loan facility, or the term facility. The net proceeds of the term facility, together with the net proceeds of this offering, will be used to refinance in full the aggregate principal amount of the 9.750% Senior Notes due 2017 and amounts outstanding under our revolving credit facility and pay related premiums, interest and expenses. We refer to these transactions collectively as the “2015 Refinancing.” The completion of the 2015 Refinancing is conditioned upon the completion of this offering.
The diagram below reflects a simplified overview of our organizational structure following the corporate reorganization and this offering (including the application of the net proceeds therefrom):
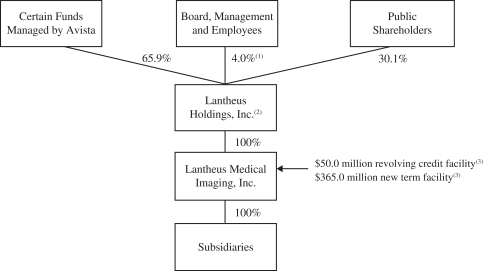
| (1) | Includes all restricted stock and options exercisable within 60 days held by LMI’s directors, management team and employees. Excluding such amounts, ownership is 0.3%. |
| (2) | Guarantor of LMI’s $50.0 million revolving credit facility and the $365.0 million new term facility. |
| (3) | For a description of our revolving credit facility and new term facility, see “Description of Material Indebtedness—Revolving Credit Facility” and “Description of Material Indebtedness—New Term Facility.” |
History and Principal Stockholder
Founded in 1956 as New England Nuclear Corporation, our medical imaging business was purchased by E. I. du Pont de Nemours and Company, or DuPont, in 1981. Bristol-Myers Squibb Company, or BMS, subsequently acquired our medical imaging business from DuPont as part of its acquisition of DuPont Pharmaceuticals in 2001. In January 2008, Avista Capital Partners, L.P., Avista Capital Partners (Offshore), L.P. and ACP-Lantern Co-Invest, LLC, or collectively Avista, formed Lantheus Holdings and its subsidiary, Lantheus Intermediate, and, through Lantheus Intermediate, acquired our medical imaging business from BMS, or the Acquisition, in an entity which is now known as LMI. After this offering, Avista is expected to collectively own approximately 65.9% of our outstanding common stock (based on the methodology described above).
Avista is a leading private equity firm with over $6 billion of assets under management and offices in New York, NY, Houston, TX and London, UK. Founded in 2005 as a spin-out from the former DLJ Merchant Banking Partners, or DLJMB, franchise, Avista makes controlling or influential minority investments primarily in growth-oriented healthcare, energy, communications and media, industrial and consumer businesses. Through its team of seasoned investment professionals and industry experts, Avista seeks to partner with exceptional management teams to invest in and add value to well-positioned businesses.
10
Table of Contents
Corporate Information
Lantheus is a Delaware corporation, which was incorporated in 2007 and is headquartered in North Billerica, Massachusetts. LMI, our wholly-owned principal operating subsidiary, was founded in 1956 and incorporated as a Delaware corporation in 1999. Our principal executive offices are located at 331 Treble Cove Road, North Billerica, Massachusetts 01862, and our telephone number at that address is (978) 671-8001. Our web site is located at www.lantheus.com. The information on our web site is not part of, and is not incorporated by reference into, this prospectus.
11
Table of Contents
THE OFFERING
| Common stock offered by us |
7,894,736 shares (9,078,946 shares, if the Underwriters exercise their option to purchase additional shares in full). |
| Common stock to be outstanding after this offering |
26,422,055 shares (27,606,265 shares, if the Underwriters exercise their option to purchase additional shares in full). |
| Option to purchase additional shares of common stock |
The underwriters may also purchase up to 1,184,210 additional shares of common stock from us, solely to cover over-allotments, at the public offering price, less the underwriting discount, within 30 days from the date of this prospectus. |
| Use of proceeds |
We estimate that the net proceeds to us from this offering, after deducting underwriting discounts and commissions and estimated expenses, will be approximately $68.1 million, assuming the shares are offered at $9.50 (the midpoint of the price range set forth on the cover of this prospectus). We intend to use these net proceeds from this offering, together with $356.4 million from our new term facility and cash on hand, to reduce our outstanding indebtedness and for working capital and other general corporate purposes. See “Use of Proceeds” for a more complete description of our intended use of the net proceeds from this offering. |
| Conflicts of Interest |
A portion of the net proceeds from this offering will be used to repay borrowings under our revolving credit facility. Because an affiliate of Wells Fargo Securities, LLC is a lender under our revolving credit facility and will receive 5% or more of the net proceeds of this offering, Wells Fargo Securities, LLC is deemed to have a “conflict of interest” under Rule 5121 of the Financial Industry Regulatory Authority, Inc., or FINRA. As a result, this offering will be conducted in accordance with FINRA Rule 5121. Pursuant to that rule, the appointment of a “qualified independent underwriter” is not required in connection with this offering as the members primarily responsible for managing the public offering do not have a conflict of interest, are not affiliates of any member that has a conflict of interest and meet the requirements of paragraph (f)(12)(E) of FINRA Rule 5121. |
| Dividend policy |
We do not anticipate paying any dividends on our common stock; however, we may change this policy in the future. See “Dividend Policy.” |
| Proposed NASDAQ symbol |
“LNTH.” |
| Risk factors |
Investing in our common stock involves a high degree of risk. You should carefully read this entire prospectus, including the more detailed information set forth under the caption “Risk Factors” and the historical consolidated financial statements, and the related notes thereto, included elsewhere in this prospectus, before investing in our common stock. |
12
Table of Contents
Unless otherwise indicated, the number of shares of common stock to be outstanding after this offering is based on 18,527,319 shares outstanding as of June 1, 2015 and excludes:
| • | 1,775,691 shares of our common stock issuable upon exercise of outstanding stock options as of June 1, 2015, with a weighted average exercise price of $12.52 per share; and |
| • | 2,190,320 shares of our common stock reserved for the future issuance of grants under our 2015 Equity Incentive Plan. |
In addition, except where otherwise stated, the information in this prospectus (excluding our consolidated financial statements and related notes included elsewhere in this prospectus):
| • | gives effect to our corporate reorganization, including the related 0.355872-for-1 reverse stock split (see “—Corporate Reorganization and Concurrent Refinancing Transaction”); |
| • | gives effect to our amended and restated certificate of incorporation and our amended and restated bylaws, which will be in effect prior to the consummation of this offering; and |
| • | assumes no exercise of the underwriters’ over-allotment option to purchase up to 1,184,210 additional shares from us. |
Unless otherwise indicated, this prospectus assumes an initial public offering price of $9.50 per share, the midpoint of the price range set forth on the cover of this prospectus.
13
Table of Contents
SUMMARY CONSOLIDATED FINANCIAL AND OTHER DATA
The following tables set forth our summary consolidated financial and other data for the periods ended and as of the dates indicated. The summary consolidated statements of operations data for each of the three fiscal years in the period ended December 31, 2014 and the summary consolidated balance sheet data as of December 31, 2014 have been derived from our audited consolidated financial statements. The summary consolidated balance sheet data as of March 31, 2015 and statements of operations data for the three months ended March 31, 2015 and 2014 have been derived from our unaudited consolidated financial statements and related notes included elsewhere in this prospectus. We have prepared the unaudited consolidated financial information set forth below on the same basis as our audited consolidated financial statements and have included all adjustments, consisting of only normal recurring adjustments, that we consider necessary for a fair presentation of our financial position and operating results for such periods. The results for any interim period are not necessarily indicative of the results that may be expected for a full year.
The summary consolidated financial data set forth below and elsewhere in this prospectus are not necessarily indicative of our future performance. You should read this information together with “Capitalization,” “Selected Consolidated Financial Data,” “Management’s Discussion and Analysis of Financial Condition and Results of Operations” and our consolidated financial statements and the related notes thereto included elsewhere in this prospectus.
| Three Months ended March 31, | Year ended December 31, | |||||||||||||||||||
| 2015 | 2014 | 2014 | 2013 | 2012 | ||||||||||||||||
| (dollars in thousands except share and per share data) | ||||||||||||||||||||
| Revenues |
$ | 74,823 | $ | 73,336 | $ | 301,600 | $ | 283,672 | $ | 288,105 | ||||||||||
|
|
|
|
|
|
|
|
|
|
|
|||||||||||
| Cost of goods sold |
39,054 | 43,275 | 176,081 | 206,311 | 211,049 | |||||||||||||||
| Loss on firm purchase commitment |
— | — | — | — | 1,859 | |||||||||||||||
|
|
|
|
|
|
|
|
|
|
|
|||||||||||
| Total cost of goods sold |
39,054 | 43,275 | 176,081 | 206,311 | 212,908 | |||||||||||||||
|
|
|
|
|
|
|
|
|
|
|
|||||||||||
| Gross profit |
35,769 | 30,061 | 125,519 | 77,361 | 75,197 | |||||||||||||||
|
|
|
|
|
|
|
|
|
|
|
|||||||||||
| Operating expenses |
||||||||||||||||||||
| Sales and marketing expenses |
9,072 | 9,498 | 35,116 | 35,227 | 37,437 | |||||||||||||||
| General and administrative expenses |
9,123 | 8,852 | 37,313 | 33,036 | 32,520 | |||||||||||||||
| Research and development expenses |
6,196 | 3,222 | 13,673 | 30,459 | 40,604 | |||||||||||||||
| Proceeds from manufacturer |
— | — | — | (8,876 | ) | (34,614 | ) | |||||||||||||
| Impairment on land |
— | — | — | 6,406 | — | |||||||||||||||
|
|
|
|
|
|
|
|
|
|
|
|||||||||||
| Total operating expenses |
24,391 | 21,572 | 86,102 | 96,252 | 75,947 | |||||||||||||||
|
|
|
|
|
|
|
|
|
|
|
|||||||||||
| Operating income (loss) |
11,378 | 8,489 | 39,417 | (18,891 | ) | (750 | ) | |||||||||||||
| Interest expense |
(10,630 | ) | (10,560 | ) | (42,288 | ) | (42,915 | ) | (42,014 | ) | ||||||||||
| Interest income |
7 | 8 | 27 | 104 | 252 | |||||||||||||||
| Other income (expense), net |
(383 | ) | (414 | ) | 478 | 1,161 | (44 | ) | ||||||||||||
|
|
|
|
|
|
|
|
|
|
|
|||||||||||
| Income (loss) before income taxes |
372 | (2,477 | ) | (2,366 | ) | (60,541 | ) | (42,556 | ) | |||||||||||
| Provision (benefit) for income taxes |
(3 | ) | (1,192 | ) | 1,195 | 1,014 | (555 | ) | ||||||||||||
|
|
|
|
|
|
|
|
|
|
|
|||||||||||
| Net income (loss) |
$ | 375 | $ | (1,285 | ) | $ | (3,561 | ) | $ | (61,555 | ) | $ | (42,001 | ) | ||||||
|
|
|
|
|
|
|
|
|
|
|
|||||||||||
14
Table of Contents
| Three Months ended March 31, | Year ended December 31, | |||||||||||||||||||
| 2015 | 2014 | 2014 | 2013 | 2012 | ||||||||||||||||
| (dollars in thousands except share and per share data) | ||||||||||||||||||||
| Net income (loss) per common share: |
||||||||||||||||||||
| Basic and diluted, historical |
$ | 0.01 | $ | (0.03 | ) | $ | (0.07 | ) | $ | (1.21 | ) | $ | (0.84 | ) | ||||||
| Basic and diluted, pro forma(1) (unaudited) |
$ | 0.02 | $ | (0.07 | ) | $ | (0.20 | ) | $ | (3.41 | ) | $ | (2.35 | ) | ||||||
| Common shares: |
||||||||||||||||||||
| Basic, historical |
50,807,503 | 50,803,484 | 50,806,512 | 50,670,274 | 50,250,957 | |||||||||||||||
| Diluted, historical |
51,716,327 | 50,803,484 | 50,806,512 | 50,670,274 | 50,250,957 | |||||||||||||||
| Basic, pro forma(1) (unaudited) |
18,080,944 | 18,079,537 | 18,080,615 | 18,032,131 | 17,882,908 | |||||||||||||||
| Diluted, pro forma(1) (unaudited) |
18,404,393 | 18,079,537 | 18,080,615 | 18,032,131 | 17,882,908 | |||||||||||||||
| Pro forma as adjusted net income (loss) per common share(2) (unaudited): |
||||||||||||||||||||
| Basic |
$ | 0.18 | $ | 0.12 | $ | 0.53 | ||||||||||||||
| Diluted |
$ | 0.18 | $ | 0.12 | $ | 0.52 | ||||||||||||||
| Pro forma as adjusted common shares(2) (unaudited): |
||||||||||||||||||||
| Basic |
25,975,680 | 25,974,273 | 25,975,351 | |||||||||||||||||
| Diluted |
26,299,129 | 26,363,883 | 26,337,384 | |||||||||||||||||
| Three Months ended March 31, | Year ended December 31, | |||||||||||||||||||
| 2015 | 2014 | 2014 | 2013 | 2012 | ||||||||||||||||
| (dollars in thousands) (unaudited) |
||||||||||||||||||||
| Other Financial Data: |
||||||||||||||||||||
| Adjusted EBITDA(3) |
$ | 20,587 | $ | 16,018 | $ | 70,755 | $ | 38,483 | $ | 21,598 | ||||||||||
| As of March 31, 2015 | ||||||||||||
| Actual | Pro forma(1) | Pro forma as adjusted(4) |
||||||||||
| (dollars in thousands) | ||||||||||||
| Consolidated Balance Sheet Data: |
||||||||||||
| Cash and cash equivalents |
$ | 30,743 | $ | 30,743 | $ | 22,726 | ||||||
| Total assets |
250,658 | 250,658 | 241,777 | |||||||||
| Total liabilities |
489,634 | 489,634 | 443,636 | |||||||||
| Revolving credit facility |
8,000 | 8,000 | — | |||||||||
| Current portion of long-term debt |
— | — | — | |||||||||
| Total long-term debt, net |
399,348 | 399,348 | 361,350 | |||||||||
| Total stockholders’ deficit |
(238,976 | ) | (238,976 | ) | (201,859 | ) | ||||||
| (1) | Pro forma information gives effect to our corporate reorganization, which will have no impact on our historical net income (loss) or balance sheet data, however, it will reduce the number of common shares and net income (loss) per common share due to the impact of a 0.355872-for-1 reverse stock split as described in “—Corporate Reorganization and Concurrent Refinancing Transaction.” |
| (2) | Pro forma as adjusted net income (loss) assumes $68.1 million of the net offering proceeds and $356.4 million of net proceeds from the 2015 Refinancing are used to redeem our Notes in full and pay down the outstanding amount of our revolving credit facility based on an assumed initial public offering price of $9.50 per share (the midpoint of the price range set forth on the cover of this prospectus) and assumes a reduction of interest expense of approximately $4.3 million, $4.3 million and $17.3 million for the three months ended March 31, 2015 and March 31, 2014 and the year ended December 31, 2014, respectively, related to such redemption and pay down, assuming that the offering, redemption, and the related |
15
Table of Contents
| application of net proceeds was completed on January 1, 2014. We also expect to pay a $9.8 million premium upon the redemption of the Notes. The redemption premium expense has not been included in pro forma as adjusted net income (loss) per share due to the expense being a nonrecurring charge. Pro forma as adjusted net income (loss) per common share and number of common shares gives effect to our corporate reorganization (including the related 0.355872-for-1 reverse stock split) prior to the consummation of this offering and the sale of 7,894,736 shares of our common stock in this offering at an assumed initial public offering price of $9.50 per share (the midpoint of the price range set forth on the cover of this prospectus). |
| (3) | Adjusted EBITDA is defined as EBITDA (GAAP net income (loss), plus interest expense, net, provision of income taxes, depreciation and amortization), further adjusted to exclude unusual items that management does not believe are indicative of its core operating performance. Adjusted EBITDA is used by management to measure operating performance and by investors to measure a company’s ability to service its debt and meet its other cash needs. Management believes that the inclusion of the adjustments to EBITDA applied in presenting Adjusted EBITDA is appropriate to provide additional information to investors about our performance across reporting periods on a consistent basis by excluding items that it does not believe are indicative of its core operating performance. See “Non-GAAP Financial Measures.” |
The following table provides a reconciliation of our net income (loss) to Adjusted EBITDA for the periods presented:
| Three Months ended March 31, | Year ended December 31, | |||||||||||||||||||
| 2015 | 2014 | 2014 | 2013(i) | 2012(i) | ||||||||||||||||
| (dollars in thousands) (unaudited) |
||||||||||||||||||||
| Net income (loss) |
$ | 375 | $ | (1,285 | ) | $ | (3,561 | ) | $ | (61,555 | ) | $ | (42,001 | ) | ||||||
| Interest expense, net |
10,623 | 10,552 | 42,261 | 42,811 | 41,762 | |||||||||||||||
| Provision for income taxes(a) |
1 | (1,017 | ) | 441 | (127 | ) | (901 | ) | ||||||||||||
| Depreciation and amortization |
7,584 | 4,516 | 19,024 | 25,783 | 27,955 | |||||||||||||||
|
|
|
|
|
|
|
|
|
|
|
|||||||||||
| EBITDA |
18,583 | 12,766 | 58,165 | 6,912 | 26,815 | |||||||||||||||
| Non-cash stock-based compensation |
277 | 284 | 1,031 | 578 | 1,240 | |||||||||||||||
| Legal fees(b) |
17 | 234 | 1,113 | 660 | 1,455 | |||||||||||||||
| Loss on firm purchase commitment(c) |
— | — | — | — | 1,859 | |||||||||||||||
| Asset write-off(d) |
180 | 420 | 1,257 | 28,349 | 13,095 | |||||||||||||||
| Severance and recruiting costs(e) |
97 | 85 | 818 | 5,239 | 1,761 | |||||||||||||||
| Sponsor fee and other(f) |
571 | 251 | 3,412 | 1,457 | 1,042 | |||||||||||||||
| New manufacturer costs(g) |
862 | 1,978 | 4,959 | 4,164 | 8,945 | |||||||||||||||
| Proceeds from manufacturer |
— | — | — | (8,876 | ) | (34,614 | ) | |||||||||||||
|
|
|
|
|
|
|
|
|
|
|
|||||||||||
| Adjusted EBITDA(h) |
$ | 20,587 | $ | 16,018 | $ | 70,755 | $ | 38,483 | $ | 21,598 | ||||||||||
|
|
|
|
|
|
|
|
|
|
|
|||||||||||
| (a) | Represents provision for income taxes, less tax indemnification associated with an agreement with BMS. |
| (b) | Represents legal services expenses incurred in connection with our business interruption claim associated with the NRU reactor shutdown in 2009 to 2010. |
| (c) | Represents a loss associated with a portion of the committed purchases of Ablavar that we do not believe we will be able to sell prior to expiration. |
| (d) | Represents non-cash losses incurred associated with the write-down of land, intangible assets, inventory and write-off of long-lived assets. The December 31, 2013 amount consists primarily of a $6.4 million write-down of land, a $15.4 million impairment charge on the Cardiolite trademark intangible asset, a $1.7 million impairment charge on a customer relationship intangible asset and a $1.6 million inventory write-down related to Ablavar. The December 31, 2012 amount consists primarily of a $10.6 million inventory write-down related to Ablavar. |
16
Table of Contents
| (e) | Represents primarily severance and recruitment costs related to employees, executives and directors. |
| (f) | Represents annual sponsor monitoring fee and related expenses, non-recurring professional fees and certain non-recurring charges relating to a customer relationship. |
| (g) | Represents internal and external costs associated with establishing new manufacturing sources for our commercial products and agents in development. |
| (h) | Does not include run-rate cost savings, operating expense reductions and other expense and cost-savings of $14.4 million and $2.9 million, which were realized for the years ended December 31, 2013 and 2012, respectively, primarily relating to our strategic shift from in-house R&D to an external partnering model of R&D. |
| (i) | Previously presented as excluding Proceeds from manufacturer as an Adjusted EBITDA reconciling item resulting in 2013 and 2012 Adjusted EBITDA of $47.4 million and $56.2 million, respectively. Presentation of 2013 and 2012 Adjusted EBITDA has been modified to allow better go-forward comparability by including Proceeds from manufacturer as an Adjusted EBITDA reconciling item, resulting in 2013 and 2012 Adjusted EBITDA of $38.5 million and $21.6 million, respectively. |
| (4) | Pro forma as adjusted information gives effect to our corporate reorganization, including the related 0.355872-for-1 reverse stock split (see “—Corporate Reorganization and Concurrent Refinancing Transaction”), the termination of our Advisory Services and Monitoring Agreement, dated as of January 8, 2008, which we will terminate prior to the consummation of this offering and pay a $6.5 million termination fee in connection therewith (see “Certain Relationships and Related Person Transactions—Advisory and Monitoring Services Agreement”), the receipt of net proceeds of $68.1 million from our capitalization to reflect the sale of 7,894,736 shares of our common stock in this offering by us at an assumed initial public offering price of $9.50 per share (the midpoint of the price range set forth on the cover of this prospectus) after deducting underwriting discounts and commissions and estimated offering expenses payable by us, the 2015 Refinancing and the application of $356.4 million of the net proceeds from that offering to reduce our indebtedness, including a $9.8 million redemption premium, as described under “Use of Proceeds.” |
17
Table of Contents
An investment in our common stock involves a high degree of risk. You should carefully consider the following risks, as well as the other information contained in this prospectus, before making an investment decision. If any of the following risks, as well as other risks and uncertainties that are not identified or that we currently think are immaterial, actually occur, our business, results of operations or financial condition could be materially and adversely affected. In such an event, the trading price of our common stock could decline and you could lose part or all of your investment.
Risks Relating to our Business and Industry
The growth of our business is substantially dependent on increased market penetration for the appropriate use of DEFINITY in suboptimal echocardiograms.
The growth of our business is substantially dependent on increased market penetration for the appropriate use of DEFINITY in suboptimal echocardiograms. Of the total number of echocardiograms performed each year in the United States—over 30 million in 2014—based on medical literature, we estimate that 20%, or approximately six million echocardiograms in 2014, produce suboptimal images. We estimate that DEFINITY had approximately 78% share of the market for contrast agents in echocardiography procedures in which a contrast agent is used in the United States as of December 2014. If we are not able to continue to grow DEFINITY sales through increased market penetration, we will not be able to grow the revenue and cash flow of the business or continue to fund our other growth initiatives at planned levels, which could have a negative effect on our prospects.
We face significant competition in our business and may not be able to compete effectively.
The market for diagnostic medical imaging agents is highly competitive and continually evolving. Our principal competitors in existing diagnostic modalities include large, global companies with substantial financial, manufacturing, sales and marketing and logistics resources that are more diversified than ours, such as GE Healthcare, Bracco Diagnostics Inc., or Bracco, Mallinckrodt, Bayer Schering Pharma AG, or Bayer, and DRAXIS Specialty Pharmaceuticals Inc. (an affiliate of JHS), or Draxis, as well as other competitors. We cannot anticipate their actions in the same or competing diagnostic modalities, such as significant price reductions on products that are comparable to our own, development or introduction of new products that are more cost-effective or have superior performance than our current products, the introduction of generic versions when our proprietary products lose their patent protection or the new entry into a generic market in which we are already a participant. In addition, distributors of our products could attempt to shift end-users to competing diagnostic modalities and products. Our current or future products could be rendered obsolete or uneconomical as a result of these activities. Our failure to compete effectively could cause us to lose market share to our competitors and have a material adverse effect on our business, results of operations, financial condition and cash flows.
In October 2014, Bracco received FDA approval in the United States for its echocardiography agent, Lumason (known as SonoVue outside of the U.S.), which is already approved for sale in Europe and certain Asian markets, including China, Japan and Korea. Bracco now has one of three FDA-approved echocardiography contrast agents in the United States, together with GE Healthcare’s Optison and our DEFINITY. Bracco formally launched Lumason in the United States on April 27, 2015. If Bracco successfully commercializes Lumason in the United States without otherwise increasing the overall usage of ultrasound contrast agents, our current and future sales volume could suffer, which would have a material adverse effect on our business, results of operations, financial condition and cash flows.
In the United States, we are heavily dependent on a few large customers and group purchasing organization arrangements to generate a majority of our revenues for our medical imaging products. Outside of the United States, we rely on distributors to generate a substantial portion of our revenue.
In the United States, we have historically relied on a limited number of radiopharmacy customers, primarily Cardinal, GE Healthcare, UPPI and Triad, to distribute our current largest volume nuclear imaging products and
18
Table of Contents
generate a majority of our revenues. Three customers accounted for approximately 38% of our revenues in the fiscal year ended December 31, 2014, with Cardinal, UPPI and GE Healthcare accounting for approximately 18%, 11% and 9%, respectively. Among the existing radiopharmacies in the United States, continued consolidations, divestitures and reorganizations may have a negative effect on our business, results of operations, financial condition or cash flows. We generally have distribution arrangements with our major radiopharmacy customers pursuant to multi-year contracts, each of which is subject to renewal. If these contracts are terminated prior to expiration of their term, or are not renewed, or are renewed on terms that are less favorable to us, then such an event could have a material adverse effect on our business, results of operations, financial condition and cash flows.
Our written supply agreements with Cardinal relating to TechneLite, Xenon, Neurolite, Cardiolite and certain other products expired in accordance with their terms on December 31, 2014. Following extended discussions with Cardinal that have not yet resulted in one or more new written supply agreements, we are currently accepting and fulfilling product orders from Cardinal on a purchase order basis at list price. We cannot predict the volumes or product mix Cardinal will continue to order and purchase, and such volumes and product mix may vary over time. In the absence of written supply agreements with Cardinal, unit sales volumes have decreased in early 2015 from levels experienced throughout 2014, but such sales have been at substantially higher prices. However, ultimate future levels of revenue and profit contribution associated with Cardinal cannot be predicted at this time because such amounts depend on future unit sales volumes, product mix and pricing to Cardinal. A significant decrease in the profit contribution from sales to Cardinal would have a material adverse effect on our business, results of operations, financial condition and cash flows.
For both our contrast agents and nuclear imaging agents, we continue to experience significant pricing pressures from our competitors, large customers and group purchasing organizations, and any significant, additional pricing pressures could lead to a reduction in revenue which could have a material adverse effect on our business, results of operations, financial condition and cash flows.
Outside of the United States, Canada, Australia and Puerto Rico, we have no radiopharmacies or sales force and, consequently, rely on third party distributors, either on a country-by-country basis or on a multicountry, regional basis, to market, sell and distribute our products. These distributors accounted for approximately 17%, 13% and 16% of non-U.S. revenues for the fiscal years ended December 31, 2014, 2013 and 2012, respectively. In certain circumstances, these distributors may also sell competing products to our own or products for competing diagnostic modalities and may have incentives to shift sales towards those competing products. As a result, we cannot assure you that our international distributors will increase or maintain our current levels of unit sales or increase or maintain our current unit pricing, which, in turn, could have a material adverse effect on our business, results of operations, financial condition and cash flows.
Our dependence upon third parties for the manufacture and supply of a substantial portion of our products could prevent us from delivering our products to our customers in the required quantities, within the required timeframes, or at all, which could result in order cancellations and decreased revenues.
We obtain a substantial portion of our products from third party manufacturers and suppliers. Historically, we relied on BVL in Bedford, Ohio as our sole manufacturer of DEFINITY, Neurolite and evacuation vials, an ancillary component for our TechneLite generators, and as one of two manufacturers of Cardiolite. Following extended operational and regulatory challenges at BVL, in March 2012 we entered into a settlement arrangement with BVL, resulting in an aggregate payment to us of $35.0 million, a broad mutual waiver and a covenant by us not to sue. Later in 2012 and in 2013, BVL continued to attempt to manufacture our products for us, and in October 2013 announced that it would cease to manufacture new batches of our products at its Bedford, Ohio facility. In November 2013, we entered into a second settlement arrangement with BVL, resulting in an additional aggregate payment to us of $8.9 million, a broad mutual waiver and a covenant by us not to sue.
Following extensive technology transfer activities, we now rely on JHS as our sole source manufacturer of DEFINITY, Neurolite and evacuation vials. We currently have additional ongoing technology transfer activities
19
Table of Contents
at JHS for our Cardiolite products and at Pharmalucence for DEFINITY, but we can give no assurances as to when that technology transfer will be completed and when we will actually receive supply of Cardiolite from JHS or DEFINITY from Pharmalucence. In the meantime, our DEFINITY, Neurolite, evacuation vial and Cardiolite product supply is currently manufactured by a single manufacturer. In addition, we currently have no manufacturer for Ablavar.
Based on our current estimates, we believe that we will have sufficient supply of DEFINITY, Neurolite and evacuation vials from JHS to meet expected demand, sufficient Cardiolite product supply from our current manufacturer to meet expected demand and sufficient Ablavar product supply to meet expected demand. However, we can give no assurances that JHS or our other manufacturing partners will be able to manufacture and distribute our products in a high quality and timely manner and in sufficient quantities to allow us to avoid product stock-outs and shortfalls. Currently, the regulatory authorities in certain countries have not yet approved JHS as a manufacturer of our products. Accordingly, until those regulatory approvals have been obtained, our international business, results of operations, financial condition and cash flows will continue to be adversely affected.
Our manufacturing agreement for Ablavar has terminated. We do not have any current plans to initiate technology transfer activities for Ablavar. If we do not engage in Ablavar technology transfer activities in the future with a new manufacturing partner for Ablavar, then our existing Ablavar inventory will expire in 2016 and we will have no further Ablavar inventory that we will be able to sell.
In addition to the products described above, for reasons of quality assurance or cost-effectiveness, we purchase certain components and raw materials from sole suppliers (including, for example, the lead casing for our TechneLite generators, the evacuation vials for our TechneLite generators manufactured by JHS, and the lipid blend material used in the processing of DEFINITY). Because we do not control the actual production of many of the products we sell and many of the raw materials and components that make up the products we sell, we may be subject to delays caused by interruption in production based on events and conditions outside of our control. At our North Billerica, Massachusetts facility, we manufacture TechneLite on a relatively new, highly automated production line, as well as Thallium and Gallium using our older cyclotron technology. As with all manufacturing facilities, equipment and infrastructure age and become subject to increasing maintenance and repair. If we or one of our manufacturing partners experiences an event, including a labor dispute, natural disaster, fire, power outage, machinery breakdown, security problem, failure to meet regulatory requirements, product quality issue, technology transfer issue or other issue, we may be unable to manufacture the relevant products at previous levels or on the forecasted schedule, if at all. Due to the stringent regulations and requirements of the governing regulatory authorities regarding the manufacture of our products, we may not be able to quickly restart manufacturing at a third party or our own facility or establish additional or replacement sources for certain products, components or materials.
In addition to our existing manufacturing relationships, we are also pursuing new manufacturing relationships to establish and secure additional or alternative suppliers for our commercial products. On November 12, 2013, we entered into a Manufacturing and Supply Agreement with Pharmalucence to manufacture and supply DEFINITY. We cannot assure you, however, that these supply diversification activities will be successful, or that before those alternate manufacturers or sources of product are fully functional and qualified, that we will be able to avoid or mitigate interim supply shortages. In addition, we cannot assure you that our existing manufacturers or suppliers or any new manufacturers or suppliers can adequately maintain either their financial health or regulatory compliance to allow continued production and supply. A reduction or interruption in manufacturing, or an inability to secure alternative sources of raw materials or components, could eventually have a material adverse effect on our business, results of operations, financial condition and cash flows.
20
Table of Contents
Challenges with product quality or product performance, including defects, caused by us or our suppliers could result in a decrease in customers and sales, unexpected expenses and loss of market share.
The manufacture of our products is highly exacting and complex and must meet stringent quality requirements, due in part to strict regulatory requirements, including the FDA’s current Good Manufacturing Practices, or cGMPs. Problems may be identified or arise during manufacturing quality review, packaging or shipment for a variety of reasons including equipment malfunction, failure to follow specific protocols and procedures, defective raw materials and environmental factors. Additionally, manufacturing flaws, component failures, design defects, off-label uses or inadequate disclosure of product-related information could result in an unsafe condition or the injury or death of a patient. Those events could lead to a recall of, or issuance of a safety alert relating to, our products. We also may undertake voluntarily to recall products or temporarily shutdown production lines based on internal safety and quality monitoring and testing data.
Quality, regulatory and recall challenges could cause us to incur significant costs, including costs to replace products, lost revenue, damage to customer relationships, time and expense spent investigating the cause and costs of any possible settlements or judgments related thereto and potentially cause similar losses with respect to other products. These challenges could also divert the attention of our management and employees from operational, commercial or other business efforts. If we deliver products with defects, or if there is a perception that our products or the processes related to our products contain errors or defects, we could incur additional recall and product liability costs, and our credibility and the market acceptance and sales of our products could be materially adversely affected. Due to the strong name recognition of our brands, an adverse event involving one of our products could result in reduced market acceptance and demand for all products within that brand, and could harm our reputation and our ability to market our products in the future. In some circumstances, adverse events arising from or associated with the design, manufacture or marketing of our products could result in the suspension or delay of regulatory reviews of our applications for new product approvals. These challenges could have a material adverse effect on our business, results of operations, financial condition and cash flows.
The global supply of Moly is fragile and not stable. Our dependence on a limited number of third party suppliers for Moly could prevent us from delivering some of our products to our customers in the required quantities, within the required timeframe, or at all, which could result in order cancellations and decreased revenues.
A critical ingredient of TechneLite, historically our largest product by annual revenues, is Moly. We currently purchase finished Moly from four of the five main processing sites in the world, namely ANSTO in Australia; Institute for Radioelements, or IRE, in Belgium; Nordion, formerly known as MDS Nordion, in Canada; and NTP Radioisotopes, or NTP, in South Africa. These processing sites are, in turn, supplied by seven of the eight main Moly-producing reactors in the world, namely, OPAL in Australia; BR2 in Belgium; OSIRIS in France; LVR-10 in the Czech Republic; HFR in The Netherlands; NRU in Canada; and SAFARI in South Africa.
Historically, our largest supplier of Moly has been Nordion, which has relied on the NRU reactor owned and operated by Atomic Energy of Canada Limited, or AECL, a Crown corporation of the Government of Canada, located in Chalk River, Ontario. This reactor was off-line from May 2009 until August 2010 due to a heavy water leak in the reactor vessel. The inability of the NRU reactor to produce Moly and of Nordion to finish Moly during the shutdown period had a detrimental effect on our business, results of operations and cash flows. As a result of the NRU reactor shutdown, we experienced business interruption losses. We estimate the quantity of those losses to be, in the aggregate, more than $70 million, including increases in the cost of obtaining limited amounts of Moly from alternate, more distant, suppliers and substantial decreases in revenue as a result of significantly curtailed manufacturing of TechneLite generators and our decreased ability to sell other Moly-based medical imaging products, including Cardiolite, in comparison to our forecasted results. The Government of Canada has stated that it intends to exit the medical isotope business when the NRU reactor’s current license transitions in October 2016 and thereafter provide only emergency back-up medical isotope supply through March 2018.
21
Table of Contents
As part of the conditions for the relicensing of the NRU reactor, the Canadian government has asked AECL to shut down the reactor for at least four weeks at least once a year for inspection and maintenance. The most recent shutdown period ran from April 13, 2015 until May 12, 2015, and we were able to source sufficient Moly to satisfy all of our standing-order customer demand for our TechneLite generators during this time period from our other suppliers. During this shutdown period, however, because Xenon is a by-product of the Moly production process and is currently captured only by NRU, we were not able to supply all of our standing-order customer demand for Xenon for an approximately two week period. There can be no assurance that in the future these off-line periods will last for the stated time or that the NRU will not experience other unscheduled shutdowns. Further prolonged scheduled or unscheduled shutdowns would limit the amount of Moly and Xenon available to us and limit the quantity of TechneLite that we could manufacture, sell and distribute and the amount of Xenon that we could sell and distribute, resulting in a further substantial negative effect on our business, results of operations, financial condition and cash flows.
In the face of the NRU reactor operating challenges and licensure issues, we entered into Moly supply agreements with NTP, ANSTO and IRE to augment our supply of Moly. ANSTO has under construction, in cooperation with NTP, a new Moly processing facility that ANSTO believes will expand its production capacity by approximately 2.5 times, with expanded commercial production planned to start in the latter part of 2016. In addition, IRE is currently in the process of expanding its production capability by up to 50% of its current capacity, and IRE expects this capacity expansion to be approved by its regulatory body by 2016. This new ANSTO and IRE production capacity is expected to replace the NRU’s current routine production. While we believe this additional Moly supply now gives us the most balanced and diversified Moly supply chain in the industry, a prolonged disruption of service from only one of our significant Moly suppliers could have a material adverse effect on our business, results of operations, financial condition and cash flows. We are also pursuing additional sources of Moly from potential new producers around the world to further augment our current supply. In November 2014, we announced entering into a new strategic agreement with SHINE for the future supply of Moly. Under the terms of the supply agreement, SHINE will provide Moly produced using its proprietary LEU-solution technology for use in our TechneLite generators once SHINE’s facility becomes operational and receives all necessary regulatory approvals, which SHINE currently estimates will occur in 2018. However, we cannot assure you that SHINE or any other possible additional sources of Moly will result in commercial quantities of Moly for our business, or that these new suppliers together with our current suppliers will be able to deliver a sufficient quantity of Moly to meet our needs.
Although our agreements with NTP, ANSTO and IRE run until December 31, 2017, our agreement with Nordion runs only until December 31, 2015 and can be terminated by Nordion upon the occurrence of certain events, including if we fail to purchase a minimum percentage of Moly or if Nordion incurs certain cost increases.
U.S., Canadian and international governments have encouraged the development of a number of alternative Moly production projects with existing reactors and technologies as well as new technologies. However, the Moly produced from these projects will likely not become available until after the NRU reactor‘s transition in 2016 from providing regular supply of medical isotopes to providing only emergency back-up supply of medical isotopes through March 2018. As a result, there is a limited amount of Moly available which could limit the quantity of TechneLite that we could manufacture, sell and distribute, resulting in a further substantial negative effect on our business, results of operations, financial condition and cash flows.
Most of the global suppliers of Moly rely on AREVA Group in France to fabricate uranium targets for research reactors from which Moly is produced. Absent a new supplier, a supply disruption relating to uranium targets could have a substantial negative effect on our business, results of operations, financial condition and cash flows.
22
Table of Contents
The instability of the global supply of Moly, including supply shortages, resulted in increases in the cost of Moly, which has negatively affected our margins, and more restrictive agreements with suppliers, which could further increase our costs.
With the general instability in the global supply of Moly, including supply shortages during 2009 and 2010, we have faced substantial increases in the cost of Moly in comparison to historical costs. We expect these cost increases to continue in the future as the Moly suppliers move closer to a full cost recovery business model. The Organization of Economic Cooperation and Development, or OECD, defines full cost recovery as the identification of all of the costs of production and recovering these costs from the market. While we are generally able to pass Moly cost increases on to our customers in our customer contracts, if we are not able to do so in the future, our margins may decline further with respect to our TechneLite generators, which could have a material adverse effect on our business, results of operations, financial condition and cash flows.
The Moly supply shortage caused by the 2009-10 NRU reactor shutdown has had a negative effect on the demand for some of our products, which will likely continue in the future.
The Moly supply shortage also had a negative effect on the use of other technetium generator-based diagnostic medical imaging agents, including our Cardiolite products. With less Moly, we manufactured fewer generators for radiopharmacies and hospitals to make up unit doses of Cardiolite products, resulting in decreased market share of Cardiolite products in favor of Thallium, an older medical isotope that does not require Moly, and other diagnostic modalities. With the return to service of the NRU reactor, we have seen increased sales of TechneLite. However, TechneLite unit volume has not returned to pre-shortage levels for, we believe, a number of reasons, including: (i) changing staffing and utilization practices in radiopharmacies, which have resulted in an increased number of unit-doses of technetium-based radiopharmaceuticals being made from available amounts of technetium; (ii) shifts to alternative diagnostic imaging modalities during the Moly supply shortage, which have not returned to technetium-based procedures; and (iii) decreased amounts of technetium being used in unit-doses of technetium-based radiopharmaceuticals due to growing concerns about patient radiation dose exposure. We do not know if the staffing and utilization practices in radiopharmacies, the mix between technetium and non-technetium-based diagnostic procedures and the increased concerns about radiation exposure, will allow technetium demand to ever return to pre-shortage levels.
Our just-in-time manufacturing of radiopharmaceutical products relies on the timely receipt of radioactive raw materials and the timely shipment of finished goods, and any disruption of our supply or distribution networks could have a negative effect on our business.
Because a number of our radiopharmaceutical products, including our TechneLite generators, rely on radioisotopes with limited half-lives, we must manufacture, finish and distribute these products on a just-in-time basis, because the underlying radioisotope is in a constant state of radio decay. For example, if we receive Moly in the morning of a manufacturing day for TechneLite generators, then we will generally ship finished generators to customers by the end of that same business day. Shipment of generators may be by next day delivery services or by either ground or air custom logistics. Any delay in us receiving radioisotopes from suppliers or being able to have finished products delivered to customers because of weather or other unforeseen transportation issues could have a negative effect on our business, results of operations, financial condition and cash flows.
We face potential supply and demand challenges for Xenon.
Currently, Nordion is our sole supplier, and we believe the principal supplier on a global basis, of Xenon, which is captured by the NRU reactor as a by-product of the Moly production process. In January 2015, we entered into a new strategic agreement with IRE for the future supply of Xenon. Under the terms of the agreement, IRE will provide bulk Xenon to us for processing and finishing once development work has been completed and all necessary regulatory approvals have been obtained. We currently estimate commercial production will occur in 2016. If we are not able to begin providing commercial quantities of Xenon prior to the
23
Table of Contents
NRU reactor’s transition in October 2016 from providing regular supply of medical isotopes to providing only emergency back-up supply of medical isotopes through March 2018, there may be a period of time during which we are not able to offer Xenon in our portfolio of commercial products, which would have a negative effect on our business, results of operations, financial condition and cash flows. For the year ended December 31, 2014, Xenon represented approximately 12% of our revenues.
Currently, we obtain Xenon from Nordion on a purchase order basis. If we are not able to pass along to our customers any change of terms from our supplier, there could be a negative effect on our business, results of operations, financial condition and cash flows.
Currently, we are the leading provider of packaged Xenon in the United States. If other providers obtained regulatory approval and began to sell packaged Xenon in the United States without otherwise increasing market penetration for the agent, or if there is an increase in the use of other imaging modalities in place of using packaged Xenon, our current sales volumes would decrease, which could have a negative effect on our business, results of operations, financial condition and cash flows.
Xenon is frequently administered as part of a ventilation scan to evaluate pulmonary function prior to a perfusion scan with microaggregated albumin, or MAA, a technetium-based radiopharmaceutical used to evaluate blood flow to the lungs. Currently, Draxis is the sole supplier of MAA on a global basis. In 2014, Draxis announced substantial price increases for MAA. The increased price of MAA, or difficulties in obtaining MAA, could decrease the frequency in which MAA is used for lung perfusion evaluation, in turn, decreasing the frequency that Xenon is used for pulmonary function evaluation, resulting in a negative effect on our business, results of operations, financial condition and cash flows.
We have a history of net losses and total stockholders’ deficits which may continue and which may negatively impact our ability to achieve or sustain profitability.
We have a history of net losses and cannot assure you that we will achieve or sustain profitability in the future. We incurred net loss for the years ended December 31, 2014, 2013 and 2012 of $3.6 million, $61.6 million and $42.0 million, respectively, and as of March 31, 2015, we had a total stockholders’ deficit of $239.0 million. We cannot assure you that we will be able to achieve or sustain profitability on a quarterly or annual basis in the future. If we cannot improve our profitability, the value of our enterprise may decline.
Generic competition has significantly eroded our market share of the MPI segment for Cardiolite products and will continue to do so.
We are currently aware of four separate, third party generic offerings of sestamibi, the first of which launched in September 2008. Cardiolite products accounted for approximately 6%, 9% and 12% of our revenues in the fiscal years ended December 31, 2014, 2013 and 2012, respectively. Included in Cardiolite is branded Cardiolite and generic sestamibi, some of which we produce and some of which we procure from third parties. With the advent of generic competition in September 2008, we have faced significant pricing and unit volume pressures on Cardiolite. To the extent generic competitors further reduce their prices, we may be forced to further reduce the price of our Cardiolite products as well as lose additional market share, which would have an adverse effect on our business, results of operations, financial condition and cash flows.
In addition, because several of the products we manufacture became less available due to recent supply challenges, certain of our customers may have begun to favor a generic offering or a competing agent or diagnostic modality. If we experience continued pricing and unit volume pressures or that product or modality shift is sustained, it could have a material adverse effect on our business, results of operation, financial condition and cash flows.
24
Table of Contents
Certain of our customers are highly dependent on payments from third party payors, including government sponsored programs, particularly Medicare, in the United States and other countries in which we operate, and reductions in third party coverage and reimbursement rates for our products (or services provided with our products) could adversely affect our business and results of operations.
A substantial portion of our revenue depends, in part, on the extent to which the costs of our products purchased by our customers are reimbursed by third party payors, including Medicare, Medicaid, other U.S. government sponsored programs, non-U.S. governmental payors and private payors. These third party payors exercise significant control over patient access and increasingly use their enhanced bargaining power to secure discounted rates and other requirements that may reduce demand for our products. Our potential customers’ ability to obtain appropriate reimbursement for products and services from these third party payors affects the selection of products they purchase and the prices they are willing to pay. For example, certain radiopharmaceuticals, when used for non-invasive imaging of the perfusion of the heart for the diagnosis and management of patients with known or suspected coronary artery disease, are currently subject to a Medicare National Coverage Determination (“NCD”). The NCD permits the coverage of such radiopharmaceuticals only when certain criteria are met. Our pipeline products, including flurpiridaz F 18, if approved, may become subject to this NCD or could be separately covered and reimbursed under existing procedure codes. If Medicare and other third party payors do not provide appropriate reimbursement for the costs of our products (or services provided using our products), deny the coverage of the products (or those services), or reduce current levels of reimbursement, healthcare professionals may not prescribe our products and providers and suppliers may not purchase our products. In addition, demand for new products may be limited unless we obtain favorable reimbursement policies (including coverage, coding and payment) from governmental and private third party payors at the time of the product’s introduction, which will depend, in part, on our ability to demonstrate that a new agent has a positive impact on clinical outcomes. Third party payors continually review their coverage policies for existing and new therapies and can deny coverage for treatments that include the use of our products or revise payment policies such that payments do not adequately cover the cost of our products. Even if third party payors make coverage and reimbursement available, that reimbursement may not be adequate or these payors’ reimbursement policies may have an adverse effect on our business, results of operations, financial condition and cash flows.
Over the past several years, Medicare has implemented numerous changes to payment policies for imaging procedures in both the hospital setting and non-hospital settings (which include physician offices and freestanding imaging facilities). Some of these changes have had a negative impact on utilization of imaging services. Examples of these changes include:
| • | limiting payments for imaging services in physician offices and free-standing imaging facility settings based upon rates paid to hospital outpatient departments; |
| • | reducing payments for certain imaging procedures when performed together with other imaging procedures in the same family of procedures on the same patient on the same day in the physician office and free-standing imaging facility setting; |
| • | making significant revisions to the methodology for determining the practice expense component of the Medicare payment applicable to the physician office and free-standing imaging facility setting which results in a reduction in payment; and |
| • | revising payment policies and reducing payment amounts for imaging procedures performed in the hospital outpatient setting. |
In the physician office and free-standing imaging facility setting, services provided using our products are reimbursed under the Medicare physician fee schedule and, in April 2015, new legislation changed the methodology for updating the fee schedule. The Medicare physician fee schedule is no longer subject to mandatory cuts under Medicare sustainable growth rate formula (which was intended to limit the increase in aggregate physician payments). Payments under the Medicare physician fee schedule are now subject to specific annual updates (0.5%) through 2019; no updates from 2020 to 2025; and, beginning in 2026, differential updates
25
Table of Contents
based on whether the physician participates in alternative payment models (with 0.75% updates for participants and 0.25% updates for non-participants). The legislation, beginning in 2019, also makes the fee schedule payments subject to adjustment based on physician performance under a consolidated measurement system (that measures performance with respect to quality, resource utilization, and clinical practice improvement activities). The impact of these changes cannot be determined at this time.
We believe that Medicare changes to payment policies for imaging procedures applicable to non-hospital settings will continue to result in certain physician practices ceasing to provide these services and a further shifting of where certain medical imaging procedures are performed, from the physician office and free-standing imaging facility settings to the hospital outpatient setting. Changes applicable to Medicare payment in the hospital outpatient setting could also influence the decisions by hospital outpatient physicians to perform procedures that involve our products. Within the hospital outpatient setting, CMS has revised its payment policy such that the use of many of our products is not separately payable by Medicare, although other products may be payable as an addition to the procedure. Specifically, since 2013, although Medicare generally does not provide separate payment to hospitals for the use of diagnostic radiopharmaceuticals administered in an outpatient setting, CMS has had a policy to make an additional payment to hospitals that utilize products with non-HEU, meaning the product is 95% derived from non-HEU sources. This payment policy continues in 2015, although CMS has indicated that the agency does not expect the separate payment to continue beyond 2017. Although some of our TechneLite generators are manufactured using non-HEU, not all of our TechneLite generators meet CMS’s definition of non-HEU, and therefore this payment is not be available for doses produced by the latter category of TechneLite generators used by our customers. This payment as well as other changes to the Medicare hospital outpatient prospective payment system payment rates could influence the decisions by hospital outpatient physicians to perform procedures that involve our products.
We also believe that all these changes and their resulting pressures may incrementally reduce the overall number of diagnostic medical imaging procedures performed. These changes overall could slow the acceptance and introduction of next-generation imaging equipment into the marketplace, which, in turn, could adversely impact the future market adoption of certain of our imaging agents already in the market or currently in clinical or preclinical development. We expect that there will continue to be proposals to reduce or limit Medicare and Medicaid payment for diagnostic services.
We also expect increased regulation and oversight of advanced diagnostic testing in which our products are used. Recent federal legislation requires CMS to develop appropriate use criteria, or AUC, that professionals must consult when ordering advanced diagnostic imaging services (which include MRI, CT, nuclear medicine (including PET) and other advanced diagnostic imaging services that the Secretary of the Department of Health and Human Services, or HHS, may specify). Beginning in 2017, payment will be made to the furnishing professional for an applicable advanced diagnostic imaging service only if the claim indicates that the ordering professional consulted a qualified clinical decision support mechanism, as identified by HHS, as to whether the ordered service adheres to the applicable AUC. To the extent that these types of changes have the effect of reducing the aggregate number of diagnostic medical imaging procedures performed in the United States, our business, results of operations, financial condition and cash flows would be adversely affected. See “Business—Regulatory Matters.”
Reforms to the United States healthcare system may adversely affect our business.
A significant portion of our patient volume is derived from U.S. government healthcare programs, principally Medicare, which are highly regulated and subject to frequent and substantial changes. For example, in March 2010, the President signed one of the most significant healthcare reform measures in decades, the Patient Protection and Affordable Care Act, as amended by the Health Care and Education Reconciliation Act, or, collectively, the Healthcare Reform Act. The Healthcare Reform Act substantially changed the way healthcare is financed by both governmental and private insurers. The law contains a number of provisions that affect coverage and reimbursement of drug products and medical imaging procedures in which our drug products are
26
Table of Contents
used and/or that could potentially reduce the aggregate number of diagnostic medical imaging procedures performed in the United States. See “Business—Regulatory Matters—Healthcare Reform Act and Related Laws.” More recently, the Medicare Access and CHIP Reauthorization Act of 2015 significantly revised the methodology for updating Medicare physician fee schedule. Congress continues to consider other healthcare reform legislation. There is no assurance that the Healthcare Reform Act, as currently enacted or as amended in the future, will not adversely affect our business and financial results, and we cannot predict how future federal or state legislative, judicial or administrative changes relating to healthcare reform will affect our business.
In addition, other legislative changes have been proposed and adopted since the Healthcare Reform Act was enacted. The Budget Control Act of 2011 includes provisions to reduce the federal deficit. The Budget Control Act, as amended, resulted in the imposition of 2% reductions in Medicare payments to providers which began in April, 2013 and will remain in effect through 2024 unless additional Congressional action is taken. Any significant spending reductions affecting Medicare, Medicaid or other publicly funded or subsidized health programs that may be implemented and/or any significant taxes or fees that may be imposed on us, as part of any broader deficit reduction effort or legislative replacement to the Budget Control Act, could have an adverse impact on our results of operations.
The full impact on our business of the Healthcare Reform Act and the other new legislation is uncertain. Nor is it clear whether other legislative changes will be adopted or how those changes would affect our industry generally or our ability to successfully commercialize our products or the development of new products.
The Healthcare Reform Act and other actions could potentially reduce the number of diagnostic medical imaging procedures performed or could reduce the amount of reimbursements paid for those procedures.
The implementation of the Healthcare Reform Act could potentially reduce the aggregate number of diagnostic medical imaging procedures performed in the United States. The Healthcare Reform Act amended the federal self-referral law to require that referring physicians inform patients that the patients may obtain certain services, including MRI, CT, PET and certain other diagnostic imaging services from a provider other than that physician, another physician in his or her group practice, or another individual under the direct supervision of the physician or another physician in the group practice. The referring physician must provide each patient with a written list of other suppliers which furnish those services in the area in which the patient resides. These new requirements could have the effect of shifting where certain diagnostic medical imaging procedures are performed. In addition, they could potentially reduce the overall number of diagnostic medical imaging procedures performed.
Although certain provisions of the Healthcare Reform Act may negatively affect payment rates for certain imaging services, the Healthcare Reform Act is projected to reduce the number of people without health insurance by approximately 23 million by 2016 (based on March 2015 estimates from the Congressional Budget Office), which may result in an increase in the demand for our services, but we cannot be assured of a proportional, or any, increase in the use of our products.
Further, we expect that there will continue to be proposals to reduce or limit Medicare and Medicaid payment for services. Rates paid by some private third party payors are based, in part, on established physician, clinic and hospital charges and are generally higher than Medicare payment rates. Reductions in the amount of reimbursement paid for diagnostic medical imaging procedures and changes in the mix of our patients between non-governmental payors and government sponsored healthcare programs and among different types of non-government payor sources, could have a material adverse effect on our business, results of operations, financial condition and cash flows.
Our business and industry are subject to complex and costly regulations. If government regulations are interpreted or enforced in a manner adverse to us or our business, we may be subject to enforcement actions, penalties, exclusion and other material limitations on our operations.
Both before and after the approval of our products and agents in development, we, our products, development agents, operations, facilities, suppliers, distributors, contract manufacturers, contract research
27
Table of Contents
organizations and contract testing laboratories are subject to extensive and, in certain circumstances, expanding regulation by federal, state and local government agencies in the United States as well as non-U.S. and transnational laws and regulations, with regulations differing from country to country. In the United States, the FDA regulates, among other things, the pre-clinical testing, clinical trials, manufacturing, safety, efficacy, potency, labeling, storage, record keeping, quality systems, advertising, promotion, sale, distribution, and import and export of drug products. We are required to register our business for permits and/or licenses with, and comply with the stringent requirements of the FDA, the U.S. Nuclear Regulatory Commission, or NRC, the HHS, Health Canada, the European Medicines Agency, or EMA, the U.K. Medicines and Healthcare Products Regulatory Agency, or MHRA, the Chinese Food and Drug Administration, or CFDA, state and provincial boards of pharmacy, state and provincial health departments and other federal, state and provincial agencies.
Under U.S. law, for example, we are required to report certain adverse events and production problems, if any, to the FDA. We also have similar adverse event and production reporting obligations outside of the United States. Additionally, we must comply with requirements concerning advertising and promotion for our products, including the prohibition on the promotion of our products for indications that have not been approved by the FDA or a so-called “off-label use.” If the FDA determines that our promotional materials constitute the unlawful promotion of an off-label use, it could request that we modify our promotional materials or subject us to regulatory or enforcement actions. Also, quality control and manufacturing procedures at our own facility and at third party suppliers must conform to cGMP regulations and other applicable law after approval, and the FDA periodically inspects manufacturing facilities to assess compliance with cGMPs and other applicable law, and, from time to time, makes those cGMPs more stringent. Accordingly, we and others with whom we work must expend time, money, and effort in all areas of regulatory compliance, including manufacturing, production and quality control. For example, we currently rely on JHS as our sole manufacturer of DEFINITY and Neurolite. In 2013, JHS received a warning letter from the FDA in connection with their manufacturing facility in Spokane, Washington where our products are manufactured. Although the issues underlying the warning letter were resolved as of June 2015 with the FDA upgrading JHS’s compliance status, if in the future these or other issues arise, then the FDA could take additional regulatory action which could limit or suspend the ability of JHS to manufacture our products or have any additional products approved at the Spokane facility for manufacture until the issues are resolved and remediated. Such a limitation or suspension could have a material adverse effect on our business, results of operations, financial condition and cash flows.
We are also subject to laws and regulations that govern financial and other arrangements between pharmaceutical manufacturers and healthcare providers, including federal and state anti-kickback statutes, federal and state false claims laws and regulations and other fraud and abuse laws and regulations. For example, in 2010, we entered into a Medicaid Drug Rebate Agreement with the federal government for some but not all of our products, which requires us to report certain price information to the federal government that could subject us to potential liability under the False Claims Act, civil monetary penalties or liability under other laws and regulations in connection with the covered products as well as the products not covered by the agreement. Determination of the rebate amount that we pay to state Medicaid programs for our products, as well as determination of payment amounts under Medicare and certain other third party payers, including government payers, depends upon information reported by us to the government. If we provide government authorities with inaccurate information about the products’ pricing, we could be terminated from the rebate program and potentially subject to other penalties. See “Business—Regulatory Matters—Healthcare Fraud and Abuse Laws.”
Failure to comply with other requirements and restrictions placed upon us or our third party manufacturers or suppliers by laws and regulations can result in fines, civil and criminal penalties, exclusion from federal healthcare programs and debarment. Possible consequences of those actions could include:
| • | substantial modifications to our business practices and operations; |
| • | significantly reduced demand for our products (if products become ineligible for reimbursement under federal and state healthcare programs); |
| • | a total or partial shutdown of production in one or more of the facilities where our products are produced while the alleged violation is being remediated; |
28
Table of Contents
| • | delays in or the inability to obtain future pre-market clearances or approvals; and |
| • | withdrawals or suspensions of our current products from the market. |
Regulations are subject to change as a result of legislative, administrative or judicial action, which may also increase our costs or reduce sales. Violation of any of these regulatory schemes, individually or collectively, could disrupt our business and have a material adverse effect on our business, results of operations, financial condition and cash flows.
Our marketing and sales practices may contain risks that could result in significant liability, require us to change our business practices and restrict our operations in the future.
We are subject to numerous domestic (federal, state and local) and foreign laws addressing fraud and abuse in the healthcare industry, including the False Claims Act and Federal Anti-Kickback Statute, the U.S. Foreign Corrupt Practices Act, or the FCPA, the U.K. Bribery Act, or the Bribery Act, FDA promotional restrictions, the federal disclosure (sunshine) law and state marketing and disclosure (sunshine) laws. Violations of these laws are punishable by criminal or civil sanctions, including substantial fines, imprisonment and exclusion from participation in healthcare programs such as Medicare and Medicaid as well as health programs outside the United States, and even alleged violations can result in the imposition of corporate integrity agreements that could severely restrict or limit our business practices. These laws and regulations are complex and subject to changing interpretation and application, which could restrict our sales or marketing practices. Even minor and inadvertent irregularities could potentially give rise to a charge that the law has been violated. Although we believe we maintain an appropriate compliance program, we cannot be certain that the program will adequately detect or prevent violations and/or the relevant regulatory authorities may disagree with our interpretation. Additionally, if there is a change in law, regulation or administrative or judicial interpretations, we may have to change one or more of our business practices to be in compliance with these laws. Required changes could be costly and time consuming.
The Healthcare Reform Act contains various provisions that further regulate sales and marketing practices. The Healthcare Reform Act imposes new requirements on certain device and drug manufacturers to report annually certain financial interactions with physicians and teaching hospitals as well as ownership and investment interests held by physicians or their immediate family members. The first report (submitted in two phases for the initial year) was submitted in 2014 (covering August 1, 2013 through December 31, 2013) and a second report submitted earlier in 2015. A manufacturer may be subject to civil monetary penalties of up to $150,000 aggregate per year for failures to report required information and up to $1 million aggregate per year for “knowing” failures to report.
The Healthcare Reform Act also separately requires manufacturers to submit information to the FDA on the identity and quantity of drug samples requested and distributed by a manufacturer during each year. The FDA exercised enforcement discretion in not enforcing compliance in the early years, but the FDA has now indicated that the agency expects the submission of data for 2014 by April 1, 2015. State laws may also require disclosure of pharmaceutical pricing information and marketing expenditures, compliance with the pharmaceutical industry’s voluntary compliance guidelines and the relevant compliance guidance promulgated by the federal government, and/or the tracking and reporting of gifts, compensation, and other remuneration to physicians and other healthcare providers. We believe we have developed appropriate protocols to implement these reporting requirements. Any irregularities or mistakes in our federal or state reporting, however, could result in a finding that we have been non-compliant with these requirements, which could subject us to the penalty provisions of applicable federal and state laws and regulations.
The Healthcare Reform Act also provides greater financial resources to be allocated to enforcement of the fraud and abuse laws; clarifies the intent requirements of the Federal Anti-Kickback Statute and the general criminal healthcare fraud statute, which may increase overall compliance costs for industry participants, including us. A person or entity does not need to have actual knowledge of the statutes or a specific intent to violate them. In addition, the Healthcare Reform Act revised the False Claims Act to provide that a claim arising
29
Table of Contents
from a violation of the Federal Anti-Kickback Statute constitutes a false or fraudulent claim for purposes of the False Claims Act. If our operations are found to be in violation of these laws or any other government regulations that apply to us, we may be subject to penalties, including, without limitation, civil and criminal penalties, damages, fines, imprisonment, the curtailment or restructuring of our operations, or exclusion from state and federal healthcare programs including Medicare and Medicaid, any of which could have a material adverse effect on our business, results of operations, financial condition and cash flows.
Ultrasound contrast agents may cause side effects which could limit our ability to sell DEFINITY.
DEFINITY is an ultrasound contrast agent based on perflutren lipid microspheres. In 2007, the FDA received reports of deaths and serious cardiopulmonary reactions following the administration of ultrasound micro-bubble contrast agents used in echocardiography. Four of the 11 reported deaths were caused by cardiac arrest occurring either during or within 30 minutes following the administration of the contrast agent; most of the serious but non-fatal reactions also occurred in this time frame. As a result, in October 2007, the FDA requested that we and GE Healthcare, which distributes Optison, a competitor to DEFINITY, add a boxed warning to these products emphasizing the risk for serious cardiopulmonary reactions and that the use of these products was contraindicated in certain patients. In a strong reaction by the cardiology community to the FDA’s new position, a letter was sent to the FDA, signed by 161 doctors, stating that the benefit of these ultrasound contrast agents outweighed the risks and urging that the boxed warning be removed. In May 2008, the FDA substantially modified the boxed warning. On May 2, 2011, the FDA held an advisory committee meeting to consider the status of ultrasound micro-bubble contrast agents and the boxed warning. In October 2011, we received FDA approval of further favorable modifications to the DEFINITY label, including: further relaxing the boxed warning; eliminating the sentence in the Indication and Use section “The safety and efficacy of DEFINITY with exercise stress or pharmacologic stress testing have not been established” (previously added in October 2007 in connection with the imposition of the box warning); and including summary data from the post-approval CaRES (Contrast echocardiography Registry for Safety Surveillance) safety registry and the post-approval pulmonary hypertension study. Bracco’s newly approved ultrasound contrast agent, Lumason, has substantially similar safety labeling as DEFINITY and Optison. If additional safety issues arise, this may result in unfavorable changes in labeling or result in restrictions on the approval of our product, including removal of the product from the market. Lingering safety concerns about DEFINITY among some healthcare providers or future unanticipated side effects or safety concerns associated with DEFINITY could limit expanded use of DEFINITY and have a material adverse effect on the unit sales of this product and our financial condition and results of operations.
Our business depends on our ability to successfully introduce new products and adapt to a changing technology and diagnostic landscape.
The healthcare industry is characterized by continuous technological development resulting in changing customer preferences and requirements. The success of new product development depends on many factors, including our ability to fund development of new agents, anticipate and satisfy customer needs, obtain regulatory approval on a timely basis based on performance of our agents in development versus their clinical study comparators, develop and manufacture products in a cost-effective and timely manner, maintain advantageous positions with respect to intellectual property and differentiate our products from our competitors. To compete successfully in the marketplace, we must make substantial investments in new product development whether internally or externally through licensing or acquisitions. Our failure to introduce new and innovative products in a timely manner could have an adverse long-term effect on our business, results of operations, financial condition and cash flows.
Even if we are able to develop, manufacture and obtain regulatory approvals for our new products, the success of these products would depend upon market acceptance and adequate reimbursement. Levels of market acceptance for our new products could be affected by a number of factors, including:
| • | the availability of alternative products from our competitors; |
| • | the price of our products relative to those of our competitors; |
| • | the timing of our market entry; |
30
Table of Contents
| • | our ability to market and distribute our products effectively; |
| • | market acceptance of our products; and |
| • | our ability to obtain adequate reimbursement. |
The field of diagnostic medical imaging is dynamic, with new products, including equipment and agents, continually being developed and existing products continually being refined. Our own diagnostic imaging agents compete not only with other similarly administered imaging agents but also with imaging agents employed in different and often competing diagnostic modalities. New imaging agents in a given diagnostic modality may be developed that provide benefits superior to the then-dominant agent in that modality, resulting in commercial displacement. Similarly, changing perceptions about comparative efficacy and safety including, among other things, comparative radiation exposure, as well as changing availability of supply may favor one agent over another or one modality over another. In addition, new or revised AUC developed by professional societies to assist physicians and other health care providers in making appropriate imaging decisions for specific clinical conditions, can and have reduced the frequency of and demand for certain imaging modalities and imaging agents. To the extent there is technological obsolescence in any of our products that we manufacture, resulting in lower unit sales or decreased unit sales prices, we will have increased unit overhead allocable to the remaining market share, which could have a material adverse effect on our business, results of operations, financial condition and cash flows.
The process of developing new drugs and obtaining regulatory approval is complex, time-consuming and costly, and the outcome is not certain.
We currently have three agents in development, two of which (flurpiridaz F 18 and 18F LMI 1195) are currently in clinical development, while a third (LMI 1174) is in pre-clinical development. To obtain regulatory approval for these agents, we must conduct extensive human tests, which are referred to as clinical trials, as well as meet other rigorous regulatory requirements, as further described in “Business—Regulatory Matters.” Satisfaction of all regulatory requirements typically takes many years and requires the expenditure of substantial resources. A number of other factors may cause significant delays in the completion of our clinical trials, including unexpected delays in the initiation of clinical sites, slower than projected enrollment, competition with ongoing clinical trials and scheduling conflicts with participating clinicians, regulatory requirements, limits on manufacturing capacity and failure of an agent to meet required standards for administration to humans. In addition, it may take longer than we project to achieve study endpoints and complete data analysis for a trial or we may decide to slow down the enrollment in a trial in order to conserve financial resources.
Our agents in development are also subject to the risks of failure inherent in drug development and testing. The results of preliminary studies do not necessarily predict clinical success, and larger and later stage clinical trials may not produce the same results as earlier stage trials. Sometimes, agents that have shown promising results in early clinical trials have subsequently suffered significant setbacks in later clinical trials. Agents in later stage clinical trials may fail to show desired safety and efficacy traits, despite having progressed through initial clinical testing. Further, the data collected from clinical trials of our agents in development may not be sufficient to support regulatory approval, or regulators could interpret the data differently and less favorably than we do. Further, the design of a clinical trial can determine whether its results will support approval of a product, and flaws in the design of a clinical trial may not become apparent until the clinical trial is well advanced. Clinical trials of potential products often reveal that it is not practical or feasible to continue development efforts. Regulatory authorities may require us or our partners to conduct additional clinical testing, in which case we would have to expend additional time and resources. The approval process may also be delayed by changes in government regulation, future legislation or administrative action or changes in regulatory policy that occur prior to or during regulatory review. The failure to provide clinical and preclinical data that are adequate to demonstrate to the satisfaction of the regulatory authorities that our agents in development are safe and effective for their proposed use will delay or preclude approval and will prevent us from marketing those products.
Moreover, principal investigators for our clinical trials may serve as scientific advisors or consultants to us from time to time and receive compensation in connection with such services. Under certain circumstances, we
31
Table of Contents
may be required to report some of these relationships to the FDA. The FDA may conclude that a financial relationship between us and a principal investigator has created a conflict of interest or otherwise affected interpretation of the study. FDA may therefore question the integrity of the data generated at the applicable clinical trial site and the utility of the clinical trial itself may be jeopardized. This could result in a delay in approval, or rejection, of our marketing applications by the FDA and may ultimately lead to the denial of marketing approval of one or more of our product candidates.
In our flurpiridaz F 18 Phase 3 program, in the fourth quarter of 2013 we announced preliminary results from the 301 trial, which is subject to an SPA with the FDA. Although flurpiridaz F 18 appeared to be well-tolerated from a safety perspective and outperformed SPECT in a highly statistically significant manner in the co-primary endpoint of sensitivity and in the secondary endpoints of image quality and diagnostic certainty, the agent did not meet its other co-primary endpoint of non-inferiority for identifying subjects without disease. SPA agreements are not binding on the FDA and we can give no assurances that the FDA will abide by the terms of our SPA agreement. We also cannot assure any particular outcome from regulatory review of the study or the agent, that any of the data generated in the 301 trial will be sufficient to support a New Drug Application, or NDA, approval, that a strategic partner will have to conduct only one additional clinical trial prior to filing an NDA, or that flurpiridaz F 18 will ever be approved as a PET MPI imaging agent by the FDA. See “Business—Regulatory Matters—Food and Drug Laws.”
We are not permitted to market our agents in development in the United States or other countries until we have received requisite regulatory approvals. For example, securing FDA approval for a new drug requires the submission of an NDA to the FDA for our agents in development. The NDA must include extensive nonclinical and clinical data and supporting information to establish the agent’s safety and effectiveness for each indication. The NDA must also include significant information regarding the chemistry, manufacturing and controls for the product. The FDA review process can take many years to complete, and approval is never guaranteed. If a product is approved, the FDA may limit the indications for which the product may be marketed, require extensive warnings on the product labeling, impose restricted distribution programs, require expedited reporting of certain adverse events, or require costly ongoing requirements for post-marketing clinical studies and surveillance or other risk management measures to monitor the safety or efficacy of the agent. Markets outside of the United States also have requirements for approval of agents with which we must comply prior to marketing. Obtaining regulatory approval for marketing of an agent in one country does not ensure we will be able to obtain regulatory approval in other countries, but a failure or delay in obtaining regulatory approval in one country may have a negative effect on the regulatory process in other countries. Also, any regulatory approval of any of our products or agents in development, once obtained, may be withdrawn. Approvals might not be granted on a timely basis, if at all.
Any failure or significant delay in completing clinical trials for our product candidates or in receiving regulatory approval for the sale of our product candidates may severely harm our future business and delay or prevent us from being able to generate revenue from product sales.
Even if our agents in development proceed successfully through clinical trials and receive regulatory approval, there is no guarantee that an approved product can be manufactured in commercial quantities at a reasonable cost or that such a product will be successfully marketed or distributed. The burden associated with the marketing and distributing of products like ours is substantial. For example, rather than being manufactured at our own facilities, flurpiridaz F 18 would require the creation of a complex, field-based network involving PET cyclotrons located at radiopharmacies where the agent would need to be manufactured and distributed rapidly to end-users, given the agent’s 110-minute half-life. In addition, in the case of flurpiridaz F 18, obtaining adequate reimbursement is critical, including not only coverage from Medicare, Medicaid, other government payors as well as private payors but also appropriate payment levels which adequately cover the substantially higher manufacturing and distribution costs associated with a PET MPI agent in comparison to, for example, sestamibi.
32
Table of Contents
We will not be able to further develop or commercialize our agents in development without successful strategic partners.
In March 2013, we began to implement a strategic shift in how we will fund our important R&D programs. We have reduced our internal R&D resources, while at the same time we are seeking to engage strategic partners to further develop and commercialize our important agents in development, including flurpiridaz F 18, 18F LMI 1195 and LMI 1174. However, different strategic partners may have different time horizons, risk profiles, return expectations and amounts of capital to deploy, and we may not be able to negotiate relationships with potential strategic partners on acceptable terms, or at all. If we are unable to establish or maintain these strategic partnerships, we will have to limit the size or scope of, or delay, our development programs.
In addition, our dependence on strategic partnerships is subject to a number of risks, including:
| • | the inability to control the amount or timing of resources that our partners may devote to developing the agents; |
| • | the possibility that we may be required to relinquish important rights, including economic, intellectual property, marketing and distribution rights; |
| • | the receipt of lower revenues than if we were to commercialize those agents ourselves; |
| • | our failure to receive future milestone payments or royalties if a partner fails to commercialize one of our agents successfully; |
| • | the possibility that a partner could separately move forward with competing agents developed either independently or in collaboration with others, including our competitors; |
| • | the possibility that our strategic partners may experience financial or operational difficulties; |
| • | business combinations or significant changes in a partner’s business strategy that may adversely affect that partner’s willingness or ability to complete its obligations under any arrangement with us; and |
| • | the possibility that our partners may operate in countries where their operations could be negatively impacted by changes in the local regulatory environment or by political unrest. |
Any of these factors either alone or taken together could have a material adverse effect on our future business, results of operations, financial condition and cash flows.
A heightened public or regulatory focus on the radiation risks of diagnostic imaging could have an adverse effect on our business.
We believe that there has been heightened public and regulatory focus on radiation exposure, including the concern that repeated doses of radiation used in diagnostic imaging procedures pose the potential risk of long-term cell damage, cancer and other diseases. For example, starting in January 2012, CMS required the accreditation of facilities providing the technical component of advanced imaging services, including CT, MRI, PET and nuclear medicine, in non-hospital freestanding settings. In August 2011, The Joint Commission (an independent, not-for-profit organization that accredits and certifies more than 20,500 healthcare organizations and programs in the United States) issued an alert on the radiation risks of diagnostic imaging and recommended specific actions for providing “the right test and the right dose through effective processes, safe technology and a culture of safety.” Revised accreditation standards issued by The Joint Commission for diagnostic imaging will take effect in July 2015.
Heightened regulatory focus on risks caused by the radiation exposure received by diagnostic imaging patients could lead to increased regulation of radiopharmaceutical manufacturers or healthcare providers who perform procedures that use our imaging agents, which could make the procedures more costly, reduce the number of providers who perform procedures and/or decrease the demand for our products. In addition, heightened public focus on or fear of radiation exposure could lead to decreased demand for our products by
33
Table of Contents
patients or by healthcare providers who order the procedures in which our agents are used. Although we believe that our diagnostic imaging agents when properly used do not expose patients and healthcare providers to unsafe levels of radiation, any of the foregoing risks could have an adverse effect on our business, results of operations, financial condition and cash flows.
In the ordinary course of business, we may be subject to product liability claims and lawsuits, including potential class actions, alleging that our products have resulted or could result in an unsafe condition or injury.
Any product liability claim brought against us, with or without merit, could be time consuming and costly to defend and could result in an increase of our insurance premiums. Although we have not had any such claims to date, claims that could be brought against us might not be covered by our insurance policies. Furthermore, although we currently have product liability insurance coverage with policy limits that we believe are customary for pharmaceutical companies in the diagnostic medical imaging industry and adequate to provide us with insurance coverage for foreseeable risks, even where the claim is covered by our insurance, our insurance coverage might be inadequate and we would have to pay the amount of any settlement or judgment that is in excess of our policy limits. We may not be able to obtain insurance on terms acceptable to us or at all, since insurance varies in cost and can be difficult to obtain. Our failure to maintain adequate insurance coverage or successfully defend against product liability claims could have a material adverse effect on our business, results of operations, financial condition and cash flows.
We use hazardous materials in our business and must comply with environmental laws and regulations, which can be expensive.
Our operations use hazardous materials and produce hazardous wastes, including radioactive, chemical and, in certain circumstances, biological materials and wastes. We are subject to a variety of federal, state and local laws and regulations as well as non-U.S. laws and regulations relating to the transport, use, handling, storage, exposure to and disposal of these materials and wastes. Environmental laws and regulations are complex, change frequently and have become more stringent over time. We are required to obtain, maintain and renew various environmental permits and nuclear licenses. Although we believe that our safety procedures for transporting, using, handling, storing and disposing of, and limiting exposure to, these materials and wastes comply in all material respects with the standards prescribed by applicable laws and regulations, the risk of accidental contamination or injury cannot be eliminated. We place a high priority in these safety procedures and seek to limit any inherent risks. We generally contract with third parties for the disposal of wastes generated by our operations. Prior to disposal, we store any low level radioactive waste at our facilities to decay until the materials are no longer considered radioactive. Although we believe we have complied in all material respects with all applicable environmental, health and safety laws and regulations, we cannot assure you that we have been or will be in compliance with all such laws at all times. If we violate these laws, we could be fined, criminally charged or otherwise sanctioned by regulators. We may be required to incur further costs to comply with current or future environmental and safety laws and regulations. In addition, in the event of accidental contamination or injury from these materials, we could be held liable for any damages that result and any such liability could exceed our resources.
While we have budgeted for current and future capital and operating expenditures to maintain compliance with these laws and regulations, we cannot assure you that our costs of complying with current or future environmental, health and safety laws and regulations will not exceed our estimates or adversely affect our results of operations and financial condition. Further, we cannot assure you that we will not be subject to additional environmental claims for personal injury, investigation or cleanup in the future based on our past, present or future business activities.
If we are unable to protect our intellectual property, our competitors could develop and market products with features similar to our products, and demand for our products may decline.
Our commercial success will depend in part on obtaining and maintaining patent protection and trade secret protection of our technologies and agents in development as well as successfully defending these patents and
34
Table of Contents
trade secrets against third party challenges, both in the United States and in foreign countries. We will only be able to protect our intellectual property from unauthorized use by third parties to the extent that we maintain the secrecy of our trade secrets and can enforce our valid patents and trademarks.
The patent positions of pharmaceutical and biotechnology companies can be highly uncertain and involve complex legal and factual questions for which important legal principles remain unresolved. In addition, changes in either the patent laws or in interpretations of patent laws in the United States or other countries may diminish the value of our intellectual property, and we may not receive the same degree of protection in every jurisdiction. Accordingly, we cannot predict the breadth of claims that may be allowed or enforced in our patents or in third party patents.
The degree of future protection for our proprietary rights is uncertain because legal means afford only limited protection and may not adequately protect our rights or permit us to gain or keep our competitive advantage. For example:
| • | we might not have been the first to make the inventions covered by each of our pending patent applications and issued patents, and we could lose our patent rights as a result; |
| • | we might not have been the first to file patent applications for these inventions or our patent applications may not have been timely filed, and we could lose our patent rights as a result; |
| • | others may independently develop similar or alternative technologies or duplicate any of our technologies; |
| • | it is possible that none of our pending patent applications will result in any further issued patents; |
| • | our issued patents may not provide a basis for commercially viable drugs, may not provide us with any protection from unauthorized use of our intellectual property by third parties, and may not provide us with any competitive advantages; |
| • | our patent applications or patents may be subject to interferences, oppositions, post-grant review, reexaminations or similar administrative proceedings; |
| • | while we generally apply for patents in those countries where we intend to make, have made, use or sell patented products, we may not be able to accurately predict all of the countries where patent protection will ultimately be desirable and may be precluded from doing so at a later date; |
| • | we may fail to seek patent protection in certain countries where the actual cost outweighs the perceived benefit at a certain time; |
| • | patents issued in foreign jurisdictions may have different scopes of coverage as our United States patents and so our products may not receive the same degree of protection in foreign countries as they would in the United States; |
| • | we may not develop additional proprietary technologies that are patentable; or |
| • | the patents of others may have an adverse effect on our business. |
Moreover, the issuance of a patent is not conclusive as to its validity or enforceability. A third party may challenge the validity or enforceability of a patent even after its issuance by the U.S. Patent and Trademark Office or the applicable foreign patent office. It is also uncertain how much protection, if any, will be afforded by our patents if we attempt to enforce them and they are challenged in court or in other proceedings, which may be brought in U.S. or non-U.S. jurisdictions to challenge the validity of a patent.
The defense and prosecution of intellectual property suits, interferences, oppositions and related legal and administrative proceedings are costly, time consuming to pursue and result in diversion of resources. The outcome of these proceedings is uncertain and could significantly harm our business. If we are not able to defend the patents of our technologies and products, then we will not be able to exclude competitors from marketing products that directly compete with our products, which could have a material adverse effect on our business, results of operations, financial condition and cash flows.
35
Table of Contents
We will also rely on trade secrets and other know-how and proprietary information to protect our technology, especially where we do not believe patent protection is appropriate or obtainable. However, trade secrets are difficult to protect. We use reasonable efforts to protect our trade secrets, but our employees, consultants, contractors, outside scientific partners and other advisors may unintentionally or willfully disclose our confidential information to competitors or other third parties. Enforcing a claim that a third party improperly obtained and is using our trade secrets is expensive and time consuming, and the outcome is unpredictable. In addition, courts outside the United States are sometimes less willing to protect trade secrets. Moreover, our competitors may independently develop equivalent knowledge, methods and know-how. We often rely on confidentiality agreements with our collaborators, employees, consultants and other third parties and invention assignment agreements with our employees to protect our trade secrets and other know-how and proprietary information concerning our business. These confidentiality agreements may not prevent unauthorized disclosure of trade secrets and other know-how and proprietary information, and there can be no guarantee that an employee or an outside party will not make an unauthorized disclosure of our trade secrets, other technical know-how or proprietary information, or that we can detect such an unauthorized disclosure. We may not have adequate remedies for any unauthorized disclosure. This might happen intentionally or inadvertently. It is possible that a competitor will make use of that information, and that our competitive position will be compromised, in spite of any legal action we might take against persons making those unauthorized disclosures, which could have a material adverse effect on our business, results of operations, financial condition and cash flows.
We rely on our trademarks, trade names and brand names to distinguish our products from the products of our competitors, and have registered or applied to register many of these trademarks, including DEFINITY, Cardiolite, TechneLite, Neurolite, Ablavar, Quadramet and Lantheus Medical Imaging. We cannot assure you that any pending trademark applications will be approved. Third parties may also oppose our trademark applications, or otherwise challenge our use of the trademarks. If our trademarks are successfully challenged, we could be forced to rebrand our products, which could result in loss of brand recognition, and could require us to devote resources to advertising and marketing new brands. Further, we cannot assure you that competitors will not infringe our trademarks, or that we will have adequate resources to enforce our trademarks.
We may be subject to claims that we have infringed, misappropriated or otherwise violated the patent or other intellectual property rights of a third party. The outcome of any of these claims is uncertain and any unfavorable result could adversely affect our business, financial condition and results of operations.
We may be subject to claims by third parties that we have infringed, misappropriated or otherwise violated their intellectual property rights. While we believe that the products that we currently manufacture using our proprietary technology do not infringe upon or otherwise violate proprietary rights of other parties or that meritorious defenses would exist with respect to any assertions to the contrary, we cannot assure you that we would not be found to infringe on or otherwise violate the proprietary rights of others.
We may be subject to litigation over infringement claims regarding the products we manufacture or distribute. This type of litigation can be costly and time consuming and could divert management’s attention and resources, generate significant expenses, damage payments (potentially including treble damages) or restrictions or prohibitions on our use of our technology, which could adversely affect our results of operations. In addition, if we are found to be infringing on proprietary rights of others, we may be required to develop non-infringing technology, obtain a license (which may not be available on reasonable terms, or at all), make substantial one-time or ongoing royalty payments, or cease making, using and/or selling the infringing products, any of which could have a material adverse effect on our business, results of operations, financial condition and cash flows.
We may be adversely affected by prevailing economic conditions and financial, business and other factors beyond our control.
Our ability to attract and retain customers, invest in and grow our business and meet our financial obligations depends on our operating and financial performance, which, in turn, is subject to numerous factors,
36
Table of Contents
including the prevailing economic conditions and financial, business and other factors beyond our control, such as the rate of unemployment, the number of uninsured persons in the United States and inflationary pressures. We cannot anticipate all the ways in which the current economic climate and financial market conditions could adversely impact our business.
We are exposed to risks associated with reduced profitability and the potential financial instability of our customers, many of which may be adversely affected by volatile conditions in the financial markets. For example, unemployment and underemployment, and the resultant loss of insurance, may decrease the demand for healthcare services and pharmaceuticals. If fewer patients are seeking medical care because they do not have insurance coverage, our customers may experience reductions in revenues, profitability and/or cash flow that could lead them to modify, delay or cancel orders for our products. If customers are not successful in generating sufficient revenue or are precluded from securing financing, they may not be able to pay, or may delay payment of, accounts receivable that are owed to us. This, in turn, could adversely affect our financial condition and liquidity. In addition, widespread and prolonged unemployment, either regionally or on a national basis, prior to the effectiveness of certain provisions of the Healthcare Reform Act, could result in a substantial number of people becoming uninsured or underinsured. In turn, this may lead to fewer individuals pursuing or being able to afford diagnostic medical imaging procedures. To the extent prevailing economic conditions result in fewer procedures being performed, our business, results of operations, financial condition and cash flows could be adversely affected.
Our business is subject to international economic, political and other risks that could negatively affect our results of operations or financial position.
For the three months ended March 31, 2015 and 2014, 19% and 23%, respectively, of our revenues were derived from countries outside of the United States. For the years ended December 31, 2014, 2013 and 2012, 22%, 25% and 27%, respectively, of our revenues were derived from countries outside the United States. We anticipate that revenue from non-U.S. operations will grow in the future. Accordingly, our business is subject to risks associated with doing business internationally, including:
| • | less stable political and economic environments and changes in a specific country’s or region’s political or economic conditions; |
| • | entering into or renewing commercial agreements with international governments or provincial authorities or entities directly or indirectly controlled by such governments or authorities, such as our Chinese partner Double-Crane; |
| • | international customers which are agencies or institutions of foreign governments; |
| • | local business practices which may be in conflict with the FCPA and Bribery Act; |
| • | currency fluctuations; |
| • | potential negative consequences from changes in tax laws affecting our ability to repatriate profits; |
| • | unfavorable labor regulations; |
| • | greater difficulties in relying on non-U.S. courts to enforce either local or U.S. laws, particularly with respect to intellectual property; |
| • | greater potential for intellectual property piracy; |
| • | greater difficulties in managing and staffing non-U.S. operations; |
| • | the need to ensure compliance with the numerous in-country and international regulatory and legal requirements applicable to our business in each of these jurisdictions and to maintain an effective compliance program to ensure compliance with these requirements; |
| • | changes in public attitudes about the perceived safety of nuclear facilities; |
37
Table of Contents
| • | changes in trade policies, regulatory requirements and other barriers; |
| • | civil unrest or other catastrophic events; and |
| • | longer payment cycles of non-U.S. customers and difficulty collecting receivables in non-U.S. jurisdictions. |
These factors are beyond our control. The realization of any of these or other risks associated with operating in non-U.S. countries could have a material adverse effect on our business, results of operations, financial condition and cash flows. As our international exposure increases and as we execute our strategy of international expansion, these risks may intensify.
We face currency and other risks associated with international sales.
We generate significant revenue from export sales, as well as from operations conducted outside the United States. During the three months ended March 31, 2015 and 2014, the net impact of foreign currency changes on transactions was a loss of $0.4 million and $0.2 million, respectively. During the years ended December 31, 2014, 2013 and 2012, the net impact of foreign currency changes on transactions was a loss of $279,000, $349,000 and $579,000, respectively. Operations outside the United States expose us to risks including fluctuations in currency values, trade restrictions, tariff and trade regulations, U.S. export controls, non-U.S. tax laws, shipping delays and economic and political instability. For example, violations of U.S. export controls, including those administered by the U.S. Treasury Department’s Office of Foreign Assets Control, could result in fines, other civil or criminal penalties and the suspension or loss of export privileges which could have a material adverse effect on our business, results of operations, financial conditions and cash flows.
The functional currency of each of our non-U.S. operations is generally the local currency, although one non-U.S. operation’s functional currency is the U.S. Dollar. Exchange rates between some of these currencies and U.S. Dollar have fluctuated significantly in recent years and may do so in the future. Historically, we have not used derivative financial instruments or other financial instruments to hedge those economic exposures. It is possible that fluctuations in exchange rates will have a negative effect on our results of operations.
Many of our customer relationships outside of the United States are, either directly or indirectly, with governmental entities, and we could be adversely affected by violations of the U.S. Foreign Corrupt Practices Act and similar worldwide anti-bribery laws outside the United States.
The FCPA, the Bribery Act and similar worldwide anti-bribery laws in non-U.S. jurisdictions generally prohibit companies and their intermediaries from making improper payments to non-U.S. officials for the purpose of obtaining or retaining business.
The FCPA prohibits us from providing anything of value to foreign officials for the purposes of obtaining or retaining business or securing any improper business advantage. It also requires us to keep books and records that accurately and fairly reflect our transactions. Because of the predominance of government-sponsored healthcare systems around the world, many of our customer relationships outside of the United States are, either directly or indirectly, with governmental entities and are therefore subject to the FCPA and similar anti-bribery laws in non-U.S. jurisdictions. In addition, the Bribery Act has been enacted, and its provisions extend beyond bribery of foreign public officials and are more onerous than the FCPA in a number of other respects, including jurisdiction, non-exemption of facilitation payments and penalties.
Our policies mandate compliance with these anti-bribery laws. We operate in many parts of the world that have experienced governmental corruption to some degree, and in certain circumstances strict compliance with anti-bribery laws may conflict with local customs and practices. Despite our training and compliance programs, our internal control policies and procedures may not always protect us from reckless or criminal acts committed by our employees or agents. Violations of these laws, or allegations of those violations, could disrupt our business and result in a material adverse effect on our results of operations, financial condition and cash flows.
38
Table of Contents
Our business depends on the continued effectiveness and availability of our information technology infrastructure, and failures of this infrastructure could harm our operations.
To remain competitive in our industry, we must employ information technologies to support manufacturing processes, quality processes, distribution, R&D and regulatory applications and that capture, manage and analyze the large streams of data generated in our clinical trials in compliance with applicable regulatory requirements. We rely extensively on technology, some of which is managed by third-party service providers, to allow the concurrent conduct of work sharing around the world. As with all information technology, our equipment and infrastructure age and become subject to increasing maintenance and repair and our systems generally are vulnerable to potential damage or interruptions from fires, natural disasters, power outages, blackouts, machinery breakdown, telecommunications failures and other unexpected events, as well as to break-ins, sabotage, increasingly sophisticated intentional acts of vandalism or cyber threats. As these threats continue to evolve, we may be required to expend additional resources to enhance our information security measures or to investigate and remediate any information security vulnerabilities. Given the extensive reliance of our business on technology, any substantial disruption or resulting loss of data that is not avoided or corrected by our backup measures could harm our business, operations and financial condition.
We may not be able to hire or retain the number of qualified personnel, particularly scientific, medical and sales personnel, required for our business, which would harm the development and sales of our products and limit our ability to grow.
Competition in our industry for highly skilled scientific, healthcare and sales personnel is intense. Although we have not had any material difficulty in the past in hiring or retaining qualified personnel other than from this intense competition, if we are unable to retain our existing personnel, or attract and train additional qualified personnel, either because of competition in our industry for these personnel or because of insufficient financial resources, then our growth may be limited and it could have a material adverse effect on our business.
If we lose the services of our key personnel, our business could be adversely affected.
Our success is substantially dependent upon the performance, contributions and expertise of our chief executive officer, executive leadership and senior management team. Jeffrey Bailey, our Chief Executive Officer and President, and other members of our executive leadership and senior management team play a significant role in generating new business and retaining existing customers. We have employment agreements with Mr. Bailey and a limited number of other individuals on our executive leadership team, although we cannot prevent them from terminating their employment with us. We do not maintain key person life insurance policies on any of our executive officers. While we have experienced both voluntary and involuntary turnover on our executive leadership team, to date we have been able to attract new, qualified individuals to lead our company and key functional areas. Our inability to retain our existing executive leadership and senior management team, maintain an appropriate internal succession program or attract and retain additional qualified personnel could have a material adverse effect on our business.
Our future growth may depend on our ability to identify and in-license or acquire additional products, and if we do not successfully do so, or otherwise fail to integrate any new products into our operations, we may have limited growth opportunities and it could materially adversely affect our relationships with customers and/or result in significant impairment charges.
We are continuing to seek to acquire or in-license products, businesses or technologies that we believe are a strategic fit with our business strategy. Future in-licenses or acquisitions, however, may entail numerous operational and financial risks, including:
| • | exposure to unknown liabilities; |
| • | disruption of our business, customer base and diversion of our management’s time and attention to develop acquired products or technologies; |
39
Table of Contents
| • | a reduction of our current financial resources; |
| • | difficulty or inability to secure financing to fund development activities for those acquired or in-licensed technologies; |
| • | incurrence of substantial debt or dilutive issuances of securities to pay for acquisitions; and |
| • | higher than expected acquisition and integration costs. |
We may not have sufficient resources to identify and execute the acquisition or in-licensing of third party products, businesses and technologies and integrate them into our current infrastructure. In particular, we may compete with larger pharmaceutical companies and other competitors in our efforts to establish new collaborations and in-licensing opportunities. These competitors likely will have access to greater financial resources than we do and may have greater expertise in identifying and evaluating new opportunities. Furthermore, there may be overlap between our products or customers and the companies which we acquire that may create conflicts in relationships or other commitments detrimental to the integrated businesses. Additionally, the time between our expenditures to in-license or acquire new products, technologies or businesses and the subsequent generation of revenues from those acquired products, technologies or businesses (or the timing of revenue recognition related to licensing agreements and/or strategic collaborations) could cause fluctuations in our financial performance from period to period. Finally, if we devote resources to potential acquisitions or in-licensing opportunities that are never completed, or if we fail to realize the anticipated benefits of those efforts, we could incur significant impairment charges or other adverse financial consequences.
U.S. credit markets may impact our ability to obtain financing or increase the cost of future financing, including, in the event we obtain financing with a variable interest rate, interest rate fluctuations based on macroeconomic conditions that are beyond our control.
During periods of volatility and disruption in the U.S., European, or global credit markets, obtaining additional or replacement financing may be more difficult and the cost of issuing new debt or replacing our revolving credit facility and/or term facility (collectively, our senior secured credit facilities) could be higher than under our current senior secured credit facilities. Higher cost of new debt may limit our ability to have cash on hand for working capital, capital expenditures and acquisitions on terms that are acceptable to us. Additionally, our senior secured credit facilities have a variable interest rate. By its nature, a variable interest rate will move up or down based on changes in the economy and other factors, all of which are beyond our control. If interest rates increase, our interest expense could increase, affecting earnings and reducing cash flows available for working capital, capital expenditures and acquisitions.
We have a substantial amount of indebtedness which may limit our financial and operating activities and may adversely affect our ability to incur additional debt to fund future needs.
As of March 31, 2015, we had approximately $408.0 million of total principal indebtedness consisting of $400.0 million of the Notes, which mature on May 15, 2017, and $8.0 million outstanding under our $50.0 million revolving credit facility. As of March 31, 2015, our aggregate Borrowing Base was approximately $45.8 million. In addition to the $8.1 million outstanding loan balance including interest, there is an $8.8 million unfunded Standby Letter of Credit, resulting in remaining availability under our revolving facility of $28.9 million at March 31, 2015. On a pro forma basis as of March 31, 2015, giving effect to the 2015 Refinancing and the sale of shares of our common stock in this offering by us at an assumed initial public offering price of $9.50 per share (the midpoint of the price range set forth on the cover of this prospectus) after deducting underwriting discounts and commissions and estimated offering expenses payable by us, and the application of the net proceeds from this offering, together with $356.4 million from our new term facility and cash on hand, to reduce our indebtedness as described in “Use of Proceeds,” we had approximately $365.0 million of total principal indebtedness consisting of $365.0 million of the seven-year new term facility. Our aggregate Borrowing Base was approximately $45.8 million, consisting of an $8.8 million unfunded Standby Letter of Credit, resulting in remaining availability under our revolving facility of $37.0 million. Our substantial indebtedness and any future indebtedness we incur could:
| • | require us to dedicate a substantial portion of cash flow from operations to the payment of interest on and principal of our indebtedness, thereby reducing the funds available for other purposes; |
40
Table of Contents
| • | make it more difficult for us to satisfy and comply with our obligations with respect to the Notes, namely the payment of interest and principal; |
| • | make it more difficult to refinance the outstanding Notes; |
| • | subject us to increased sensitivity to interest rate increases; |
| • | make us more vulnerable to economic downturns, adverse industry or company conditions or catastrophic external events; |
| • | limit our ability to withstand competitive pressures; |
| • | reduce our flexibility in planning for or responding to changing business, industry and economic conditions; and |
| • | place us at a competitive disadvantage to competitors that have relatively less debt than we have. |
In addition, our substantial level of indebtedness could limit our ability to obtain additional financing on acceptable terms, or at all, for working capital, capital expenditures and general corporate purposes. Our liquidity needs could vary significantly and may be affected by general economic conditions, industry trends, performance and many other factors not within our control.
We may not be able to generate sufficient cash flow to meet our debt service obligations.
Our ability to generate sufficient cash flow from operations to make scheduled payments on our debt obligations, which was $39.0 million of interest for the year ended December 31, 2014 based on our $400.0 million in total principal indebtedness as of December 31, 2014 related to the Notes, will depend on our future financial performance, which will be affected by a range of economic, competitive and business factors, many of which are outside of our control. If we do not generate sufficient cash flow from operations to satisfy our debt obligations, including interest payments and the payment of principal at maturity, our credit ratings could be downgraded, and we may have to undertake alternative financing plans, such as refinancing or restructuring our debt, selling assets, entering into additional corporate collaborations or licensing arrangements for one or more of our products or agents in development, reducing or delaying capital investments or seeking to raise additional capital. We cannot assure you that any refinancing would be possible, that any assets could be sold, licensed or partnered, or, if sold, licensed or partnered, of the timing of the transactions and the amount of proceeds realized from those transactions, that additional financing could be obtained on acceptable terms, if at all, or that additional financing would be permitted under the terms of our various debt instruments then in effect. Furthermore, our ability to refinance would depend upon the condition of the financial and credit markets. Our inability to generate sufficient cash flow to satisfy our debt obligations, or to refinance our obligations on commercially reasonable terms or on a timely basis, would have an adverse effect on our business, results of operations and financial condition.
Despite our substantial indebtedness, we may incur more debt, which could exacerbate the risks described above.
We and our subsidiaries may be able to incur substantial additional indebtedness in the future subject to the limitations contained in the agreements governing our debt, including the Indenture (as defined below) governing the Notes. Although these agreements restrict us and our restricted subsidiaries from incurring additional indebtedness, these restrictions are subject to important exceptions and qualifications. For example, we are generally permitted to incur certain indebtedness, including indebtedness arising in the ordinary course of business, indebtedness among restricted subsidiaries and us and indebtedness relating to hedging obligations. We are also permitted to incur indebtedness under the Indenture governing the Notes so long as we comply with an interest coverage ratio of 2.0 to 1.0, determined on a pro forma basis for the most recently completed four fiscal quarters. See “Management’s Discussion and Analysis of Financial Condition and Results of Operations—Liquidity and Capital Resources—External Sources of Liquidity.” If we or our subsidiaries incur additional debt, the risks that we and they now face as a result of our high leverage could intensify. In addition, the Indenture
41
Table of Contents
governing the Notes and the agreements governing our senior secured credit facilities will not prevent us from incurring obligations that do not constitute indebtedness under the agreements.
Our debt agreements contain restrictions that will limit our flexibility in operating our business.
The Indenture governing the Notes and the agreements governing our senior secured credit facilities contain various covenants that limit our ability to engage in specified types of transactions. These covenants limit our and our restricted subsidiaries’ ability to, among other things:
| • | incur additional debt; |
| • | pay dividends or make other distributions; |
| • | redeem stock; |
| • | issue stock of subsidiaries; |
| • | make certain investments; |
| • | create liens; |
| • | enter into transactions with affiliates; and |
| • | merge, consolidate or transfer all or substantially all of our assets. |
A breach of any of these covenants could result in a default under the Indenture governing the Notes and the agreements governing our senior secured credit facilities. We may also be unable to take advantage of business opportunities that arise because of the limitations imposed on us by the restrictive covenants under our indebtedness.
We may be limited in our ability to utilize, or may not be able to utilize, net operating loss carryforwards to reduce our future tax liability.
As of December 31, 2014, we had federal income tax loss carryforwards of $126.9 million, which will begin to expire in 2031 and will completely expire in 2034. We have had significant financial losses in previous years and as a result we currently maintain a full valuation allowance for our deferred tax assets including our federal and state tax loss carryforwards.
Risks Relating to Our Company and Ownership Structure
As a NASDAQ-listed public company, we will become subject to additional financial and other reporting and corporate governance requirements that may be difficult for us to satisfy.
As a publicly traded company, we will incur significant legal, accounting and other expenses, particularly after we are no longer an emerging growth company as defined under the JOBS Act. After this offering, we will be required to file with the SEC annual and quarterly information and other reports that are specified in Section 13 of the Exchange Act. In addition, the Sarbanes-Oxley Act of 2002, or the Sarbanes-Oxley Act, and the Dodd-Frank Wall Street Reform Act and Consumer Protection Act of 2010, or the Dodd-Frank Act, as well as rules subsequently implemented by the SEC, have imposed various requirements on public companies, including the establishment and maintenance of effective disclosure controls and procedures, internal controls and corporate governance practices.
The Sarbanes-Oxley Act requires, among other things, that we maintain effective internal controls for financial reporting and disclosure. In order to maintain and improve the effectiveness of our disclosure controls and procedures and internal controls over financial reporting to be compliant with the Sarbanes-Oxley Act, significant resources and management oversight will be required. As a result, our management’s attention might be diverted from other business concerns. We are also required to evaluate our internal controls systems in order to allow management to report on, and, once we are no longer an emerging growth company, our independent auditors to audit, our internal control over financial reporting. We are required to perform the system and process
42
Table of Contents
evaluation and testing (and any necessary remediation) required to comply with the management certification (and, once we are no longer an emerging growth company, auditor attestation) requirements of Section 404 of the Sarbanes-Oxley Act. We incur significant legal, accounting and other expenses in order to comply with these requirements and the other requirements of the Sarbanes-Oxley Act and the Dodd-Frank Act.
After this offering, we will also be required to ensure that we have the ability to prepare financial statements that are fully compliant with all SEC reporting requirements on a timely basis. We will also become subject to other reporting and corporate governance requirements, including the requirements of The NASDAQ Global Market, or NASDAQ, and certain additional provisions of the Sarbanes-Oxley Act and the regulations promulgated thereunder, which will impose significant compliance obligations upon us. As a NASDAQ-listed public company, we will be required to:
| • | prepare and distribute additional periodic public reports and other stockholder communications in compliance with our obligations under the federal securities laws and NASDAQ rules; |
| • | create or expand the roles and duties of our Board of Directors and committees of the Board of Directors; |
| • | supplement our internal accounting, auditing and tax functions, including hiring additional staff with expertise in accounting and financial reporting for a public company; |
| • | enhance our investor relations function; and |
| • | involve and retain to a greater degree outside counsel and accountants in the activities listed above. |
These changes will require a commitment of additional resources. We may not be successful in implementing these requirements and implementing them could adversely affect our business or operating results. In addition, if we fail to implement the requirements with respect to our internal accounting and audit functions, our ability to report our results of operations on a timely and accurate basis could be impaired and we could suffer adverse regulatory consequences or violate NASDAQ listing standards. There could also be a negative reaction in the financial markets due to a loss of investor confidence in us and the reliability of our financial statements, which could have a material adverse effect on our business, results of operations, financial condition and cash flows.
If we fail to maintain an effective internal control environment or to comply with the numerous legal and regulatory requirements imposed on public companies, we could make material errors in, and be required to restate, our financial statements. Any such restatement could result in a loss of public confidence in the reliability of our financial statements and sanctions imposed on us by the SEC, which could have a material adverse effect on our business, results of operations, financial condition and cash flows.
Our management team currently manages a private company and the transition to managing a public company will present new challenges.
Following the consummation of this offering, we will be subject to various additional regulatory requirements, including those of the SEC and NASDAQ. These requirements include record keeping, financial reporting and corporate governance rules and regulations. Certain members of our management team do not have experience managing a public company. Our internal infrastructure may not be adequate to support our increased reporting obligations, and we may be unable to hire, train or retain necessary staff and may be reliant on engaging outside consultants or professionals to overcome our lack of experience or employees. If our internal infrastructure is inadequate, we are unable to engage outside consultants or are otherwise unable to fulfill our public company obligations, it could have a material adverse effect on our business, financial condition, results of operations and cash flows.
43
Table of Contents
We have not been required to evaluate our internal control over financial reporting in a manner that meets the standards of publicly traded companies required by Section 404 of the Sarbanes-Oxley Act. In connection with the implementation of the necessary procedures and practices related to internal control over financial reporting, we may identify deficiencies that we may not be able to remediate in time to meet the deadline imposed by the Sarbanes-Oxley Act for compliance with the requirements of Section 404.
We have not been required to evaluate our internal control over financial reporting in a manner that meets the standards of publicly traded companies required by Section 404 of the Sarbanes-Oxley Act. Section 404 of the Sarbanes-Oxley Act requires annual management assessments of the effectiveness of our internal control over financial reporting, starting with the second annual report that we file with the SEC as a public company, and generally requires in the same report a report by our independent registered public accounting firm on the effectiveness of our internal control over financial reporting. However, under the JOBS Act, our independent registered public accounting firm will not be required to attest to the effectiveness of our internal control over financial reporting pursuant to Section 404 of the Sarbanes-Oxley Act until we are no longer an emerging growth company. We could be an emerging growth company for up to five years after becoming a public company. Once we are no longer an emerging growth company, our independent registered public accounting firm will be required to attest to the effectiveness of our internal control over financial reporting on an annual basis. The rules governing the standards that must be met for our management to assess our internal control over financial reporting are complex and require significant documentation, testing and possible remediation of our existing controls and the incurrence of significant additional expenditures.
In connection with the implementation of the necessary procedures and practices related to internal control over financial reporting, we may identify deficiencies that we may not be able to remediate in time to meet the deadline imposed by the Sarbanes-Oxley Act for compliance with the requirements of Section 404. In addition, we may encounter problems or delays in completing the implementation of any requested improvements and receiving a favorable attestation in connection with the attestation provided by our independent registered public accounting firm. We will be unable to issue securities in the public markets through the use of a shelf registration statement if we are not in compliance with Section 404. Furthermore, failure to achieve and maintain an effective internal control environment could limit our ability to report our financial results accurately and timely and have a material adverse effect on our business, results of operations, financial condition and cash flows.
We are an emerging growth company, and we cannot be certain if the reduced disclosure requirements applicable to emerging growth companies will make our common stock less attractive to investors.
As an emerging growth company, we may take advantage of certain exemptions from various reporting requirements that are applicable to other public companies that are not emerging growth companies including, but not limited to, not being required to obtain an assessment of the effectiveness of our internal controls over financial reporting from our independent registered public accounting firm pursuant to Section 404 of the Sarbanes-Oxley Act, reduced disclosure obligations regarding executive compensation in our periodic reports and proxy statements, and exemptions from the requirements of holding a nonbinding advisory vote on executive compensation and stockholder approval of any golden parachute payments not previously approved. We cannot predict if investors will find our common stock less attractive because we will rely on these exemptions. If some investors find our common stock less attractive as a result, there may be a less active trading market for our common stock and the market price of our common stock may be more volatile.
We are a “controlled company” within the meaning of NASDAQ rules and, as a result, we will qualify for, and intend to rely on, exemptions from certain corporate governance requirements. Our stockholders will not have the same protections afforded to stockholders of companies that are subject to those requirements.
After the consummation of this offering, Avista will collectively beneficially own approximately 67.3% of our outstanding common stock and will collectively beneficially own approximately 64.5% of our outstanding common stock if the underwriters’ over-allotment option to purchase additional shares is exercised in full. As a
44
Table of Contents
consequence, Avista will be able to exert a significant degree of influence or actual control over our management and affairs and will control matters requiring stockholder approval, including the election of directors, a merger, consolidation or sale of all or substantially all of our assets, and any other significant transaction. The interests of this stockholder may not always coincide with our interests or the interests of our other stockholders. For instance, this concentration of ownership may have the effect of delaying or preventing a change in control of us otherwise favored by our other stockholders and could depress our stock price.
Following this offering, Avista will continue to control a majority of the voting power of our outstanding common stock. As a result, we are a “controlled company” within the meaning of the corporate governance standards of NASDAQ. Under these rules, a company of which more than 50% of the voting power is held by an individual, group or another company is a “controlled company” and may elect not to comply with certain corporate governance requirements, including:
| • | the requirement that a majority of the Board of Directors consist of independent directors; |
| • | the requirement that we have a nominating/corporate governance committee that is composed entirely of independent directors; |
| • | the requirement that we have a compensation committee that is composed entirely of independent directors; and |
| • | the requirement for an annual performance evaluation of the nominating/corporate governance and compensation committees. |
Following this offering, we intend to utilize these exemptions. As a result, our nominating and corporate governance committee and compensation committee will not consist entirely of independent directors and those committees will not be subject to annual performance evaluations. Additionally, we only are required to have one independent audit committee member upon the listing of our common stock on NASDAQ, a majority of independent audit committee members within 90 days from the date of listing and all independent audit committee members within one year from the date of listing. Accordingly, you will not have the same protections afforded to stockholders of companies that are subject to all of the corporate governance requirements of NASDAQ.
Avista, however, is not subject to any contractual obligation to retain their controlling interest, except that they have agreed, subject to certain exceptions, not to sell or otherwise dispose of any shares of our common stock or other capital stock or other securities exercisable or convertible therefor for a period of at least 180 days after the date of this prospectus without the prior written consent of the representatives of the underwriters in this initial public offering. Except for this brief period, there can be no assurance as to the period of time during which Avista will maintain their ownership of our common stock following the offering. As a result, there can be no assurance as to the period of time during which we will be able to avail ourselves of the controlled company exemptions.
Anti-takeover provisions in our amended and restated certificate of incorporation and amended and restated by-laws could prohibit a change of control that our stockholders may favor and could negatively affect our stock price.
Upon the closing of this offering, provisions in our amended and restated certificate of incorporation and by-laws may make it more difficult and expensive for a third party to acquire control of us even if a change of control would be beneficial to the interests of our stockholders. These provisions could discourage potential takeover attempts and could adversely affect the market price of our common stock. These provisions may also prevent or frustrate attempts by our stockholders to replace or remove our management. For example, our amended and restated certificate of incorporation and by-laws:
| • | permit our Board of Directors to issue preferred stock with such terms as they determine, without stockholder approval; |
| • | provide that only one-third of the members of the Board are elected at each stockholders meeting and prohibit removal without cause; |
45
Table of Contents
| • | require advance notice for stockholder proposals and director nominations; and |
| • | contain limitations on convening stockholder meetings and stockholder action by written consent. |
These provisions make it more difficult for stockholders or potential acquirers to acquire us without negotiation and could discourage potential takeover attempts and could adversely affect the market price of our common stock. In addition, we have opted out of Section 203 of the Delaware General Corporation Law, or the DGCL. Our amended and restated certificate of incorporation will provide that we will not be governed by Section 203 until there occurs a transaction following the consummation of which Avista holds beneficial ownership of less than 5% of the voting power of our then-outstanding shares of common stock.
Conflicts of interest may arise because some of our directors are principals of our principal stockholder.
Upon the consummation of this offering, representatives of Avista will occupy two of the seats on our Board of Directors. Avista could invest in entities that directly or indirectly compete with us or companies in which Avista is currently invested may already compete with us. As a result of these relationships, when conflicts arise between the interests of Avista and the interests of our stockholders, these directors may not be disinterested. Neither Avista nor the representatives of Avista on our Board of Directors, by the terms of our amended and restated certificate of incorporation, are required to offer us any transaction opportunity of which they become aware, and any of them could take any such opportunity for themselves or offer it to other companies in which they have an investment, unless that opportunity is expressly offered to a person serving as our director solely in his or her capacity as our director.
Risks Relating to Our Common Stock and this Offering
There may not be an active, liquid trading market for our common stock.
Prior to this offering, there has been no public market for shares of our common stock. We cannot predict the extent to which investor interest in our company will lead to the development of a trading market on NASDAQ, or how liquid that market may become. If an active trading market does not develop, you may have difficulty selling any of our common stock that you purchase. The initial public offering price of shares of our common stock will be determined by negotiation between us and the underwriters and may not be indicative of prices that will prevail following the consummation of this offering. The market price of shares of our common stock may decline below the initial public offering price, and you may not be able to resell your shares of our common stock at or above the initial offering price.
Our stock price could fluctuate significantly, which could cause the value of your investment to decline, and you may not be able to resell your shares at or above the initial public offering price.
Securities markets worldwide have experienced, and may continue to experience, significant price and volume fluctuations. This market volatility, as well as general economic, market or political conditions, could reduce the market price of our common stock regardless of our operating performance. The trading price of our common stock is likely to be volatile and subject to wide price fluctuations in response to various factors, including:
| • | market conditions in the broader stock market; |
| • | actual or anticipated fluctuations in our quarterly financial and operating results; |
| • | introduction of new products or services by us or our competitors; |
| • | anticipated and reported clinical trial results; |
| • | issuance of new or changed securities analysts’ reports or recommendations; |
| • | investor perceptions of us and the specialty pharmaceutical industry; |
46
Table of Contents
| • | sales, or anticipated sales, of large blocks of our stock; |
| • | additions or departures of key personnel; |
| • | regulatory or political developments; |
| • | litigation and governmental investigations; and |
| • | changing economic conditions. |
These and other factors may cause the market price and demand for our common stock to fluctuate substantially, which may limit or prevent investors from readily selling their shares of common stock and may otherwise negatively affect the liquidity of our common stock. In addition, in the past, when the market price of a stock has been volatile, holders of that stock have sometimes instituted securities class action litigation against the company that issued the stock. If any of our stockholders brought a lawsuit against us, we could incur substantial costs defending the lawsuit. Such a lawsuit could also divert the time and attention of our management from our business, which could significantly harm our profitability and reputation.
Management may invest or spend our net proceeds from this offering in ways that may not yield an acceptable return to you.
Although we plan to use a portion of our net proceeds from this offering to reduce our outstanding indebtedness and to pay fees and expenses associated with the offering, we also may use a portion of the net proceeds for general corporate purposes. We will have broad discretion as to how we will spend those proceeds, and you will have no advance opportunity to evaluate our decisions and may not agree with the manner in which we spend those proceeds. We may not be successful investing the proceeds from this offering in either our operations or external investments.
If a substantial number of shares become available for sale and are sold in a short period of time, the market price of our common stock could decline.
Our directors, executive officers and certain of our significant stockholders will be subject to (i) the lock-up agreements described in “Underwriting (Conflicts of Interest),” (ii) the Rule 144 holding period requirements described in “Shares Eligible for Future Sale—Rule 144,” and (iii) the transfer restrictions in certain shareholders’ agreements, described in “Shares Eligible for Future Sale—Lock-Up Agreements.” After these restrictions have elapsed, additional shares, some of which will be subject to vesting, will be eligible for sale in the public market. If our existing stockholders sell substantial amounts of our common stock in the public market following this offering, the market price of our common stock could decrease significantly. The perception in the public market that our existing stockholders might sell shares of common stock could also depress the market price of our common stock. Upon the consummation of this offering, 10.6% of our common stock will be outstanding. In addition, we have reserved 4,412,386 shares of common stock for issuance under our equity compensation plans. See “Executive and Director Compensation—2015 Equity Incentive Plan.” Upon consummation of this offering, we expect to have 1,775,691 shares of common stock issuable upon exercise of outstanding options (940,594 of which will be fully vested). A decline in the price of shares of our common stock caused by the lapse of resale restrictions by our existing stockholders or the sale of common stock issued pursuant to our equity incentive plans might impede our ability to raise capital through the issuance of additional shares of our common stock or other equity securities.
If securities or industry analysts do not publish research or reports about our business, if they adversely change their recommendations regarding our stock or if our results of operations do not meet their expectations, our stock price and trading volume could decline.
The trading market for our common stock will be influenced by the research and reports that industry or securities analysts publish about us or our business. If one or more of these analysts cease coverage of our
47
Table of Contents
company or fail to publish reports on us regularly, we could lose visibility in the financial markets, which in turn could cause our stock price or trading volume to decline. Moreover, if one or more of the analysts who cover us downgrade our stock, or if our results of operations do not meet their expectations, our stock price could decline.
We do not anticipate paying any cash dividends for the foreseeable future.
We currently intend to retain our future earnings, if any, for the foreseeable future, to repay indebtedness and to fund the development and growth of our business. We do not intend to pay any dividends to holders of our common stock and the indenture governing the Notes and the agreements governing our senior secured credit facilities limit our ability to pay dividends. As a result, capital appreciation in the price of our common stock, if any, will be your only source of gain on an investment in our common stock. See “Dividend Policy.”
New investors in our common stock will experience immediate and substantial book value dilution after this offering.
The initial public offering price of our common stock will be substantially higher than the pro forma net tangible book value per share (which gives effect to the corporate reorganization, including the related 0.355872-for-1 reverse stock split) of the outstanding common stock immediately after the offering. Based on an assumed initial public offering price of $9.50 per share (the midpoint of the price range set forth on the cover of this prospectus) and our net tangible book value as of March 31, 2015, if you purchase our common stock in this offering, you will suffer immediate dilution in pro forma net tangible book value per share of approximately $19.18 per share. See “Dilution.”
48
Table of Contents
CAUTIONARY NOTE REGARDING FORWARD-LOOKING STATEMENTS
Some of the statements contained in this prospectus are forward-looking statements. These forward-looking statements, including, in particular, statements about our plans, strategies, prospects and industry estimates are subject to risks and uncertainties. These statements identify prospective information and include words such as “anticipates,” “intends,” “plans,” “seeks,” “believes,” “estimates,” “expects,” “should,” “could,” “predicts,” “targets,” “hopes” and similar expressions. Examples of forward-looking statements include, but are not limited to, statements we make regarding: (i) our outlook and expectations including, without limitation, in connection with continued market expansion and penetration for our commercial products, particularly DEFINITY in the face of increased competition; (ii) outlook and expectations related to products manufactured at JHS and Pharmalucence and global isotope supply; (iii) our outlook and expectations related to our intention to seek to engage strategic partners to assist in developing and potentially commercializing development candidates; and (iv) our liquidity, including our belief that our existing cash, cash equivalents, anticipated revenues and availability under our revolving credit facility are sufficient to fund our existing operating expenses, capital expenditures and liquidity requirements for at least the next twelve months. Forward-looking statements are based on our current expectations and assumptions regarding our business, the economy and other future conditions. Because forward-looking statements relate to the future, they are subject to inherent uncertainties, risks and changes in circumstances that are difficult to predict. Our actual results may differ materially from those contemplated by the forward-looking statements. They are neither statements of historical fact nor guarantees or assurances of future performance. The matters referred to in the forward-looking statements contained in this prospectus may not in fact occur. We caution you therefore against relying on any of these forward-looking statements. Important factors that could cause actual results to differ materially from those in the forward-looking statements include regional, national or global political, economic, business, competitive, market and regulatory conditions and the following:
| • | our ability to continue to increase segment penetration for DEFINITY in suboptimal echocardiograms and the increased segment competition from other echocardiography contrast agents, including Optison from GE Healthcare and the newly approved Lumason (known as SonoVue outside of the U.S.) from Bracco; |
| • | our dependence on key customers and group purchasing organization arrangements for our medical imaging products, and our ability to maintain and profitably renew our contracts and relationships with those key customers and group purchasing organizations, including our relationship with Cardinal; |
| • | our dependence upon third parties for the manufacture and supply of a substantial portion of our products; |
| • | risks associated with the technology transfer programs to secure production of our products at alternate contract manufacturer sites; |
| • | risks associated with the manufacturing and distribution of our products and the regulatory requirements related thereto; |
| • | the instability of the global Moly supply; |
| • | risks associated with supply and demand for Xenon; |
| • | our ability to compete effectively, including in connection with pricing pressures and new market entrants; |
| • | the dependence of certain of our customers upon third party healthcare payors and the uncertainty of third party coverage and reimbursement rates; |
| • | uncertainties regarding the impact of U.S. healthcare reform on our business, including related reimbursements for our current and potential future products; |
| • | our being subject to extensive government regulation and our potential inability to comply with those regulations; |
| • | potential liability associated with our marketing and sales practices; |
49
Table of Contents
| • | the occurrence of any side effects with our products; |
| • | our exposure to potential product liability claims and environmental liability; |
| • | risks associated with our lead agent in development, flurpiridaz F 18, including our ability to: |
| • | attract strategic partners to successfully complete the Phase 3 clinical program and possibly commercialize the agent; |
| • | obtain FDA approval; and |
| • | gain post-approval market acceptance and adequate reimbursement; |
| • | risks associated with being able to negotiate in a timely manner relationships with potential strategic partners to advance our other development programs on acceptable terms, or at all; |
| • | the extensive costs, time and uncertainty associated with new product development, including further product development relying on external development partners; |
| • | our inability to introduce new products and adapt to an evolving technology and diagnostic landscape; |
| • | our inability to protect our intellectual property and the risk of claims that we have infringed on the intellectual property of others; |
| • | risks associated with prevailing economic conditions and financial, business and other factors beyond our control; |
| • | risks associated with our international operations; |
| • | our inability to adequately protect our facilities, equipment and technology infrastructure; |
| • | our inability to hire or retain skilled employees and key personnel; |
| • | risks related to our outstanding indebtedness and our ability to satisfy those obligations; |
| • | costs and other risks associated with the Sarbanes-Oxley Act and the Dodd-Frank Act risks related to the ownership of our common stock; and |
| • | other factors that are described in “Risk Factors,” beginning on page 18 of this prospectus. |
Any forward-looking statement made by us in this prospectus speaks only as of the date on which it is made. Factors or events that could cause our actual results to differ may emerge from time to time, and it is not possible for us to predict all of them. We undertake no obligation to publicly update any forward-looking statement, whether as a result of new information, future developments or otherwise, except as may be required by law.
50
Table of Contents
We estimate that the net proceeds to us from our sale of 7,894,736 shares of our common stock in this offering will be $68.1 million, after deducting underwriting discounts and commissions and estimated expenses payable by us in connection with this offering. The underwriters also have the option to purchase up to an additional 1,184,210 shares of common stock. We estimate that the net proceeds, if the underwriters exercise their right to purchase the maximum of 1,184,210 additional shares of common stock from us, will be approximately $78.5 million, after deducting underwriting discounts and commissions and estimated expenses payable by us in connection with this offering. This assumes an initial public offering price of $9.50 per share (the midpoint of the price range set forth on the cover of this prospectus).
We expect to use net proceeds from this offering, together with net proceeds of $356.4 million from our new term facility and cash on hand, primarily for the following purposes:
| • | approximately $418.0 million to redeem in full our outstanding 9.750% Senior Notes due 2017, which includes a $9.8 million redemption premium; |
| • | $8.0 million to pay down the amounts outstanding under our revolving credit facility; and |
| • | the remainder, if any, for general corporate purposes. |
As of March 31, 2015, the amounts outstanding under our revolving credit facility accrued interest at 2.17% For further information on the Notes and our senior secured credit facilities, see “Description of Material Indebtedness.”
This expected use of net proceeds from this offering represents our current intentions based upon our present plans and business conditions. The amounts and timing of our actual expenditures depend on numerous factors, including the ongoing status of and results from our current development and commercialization activities, and any unforeseen cash needs. As a result, our management will retain broad discretion over the allocation of the net proceeds from this offering.
Assuming no exercise of the underwriters’ option to purchase additional shares, a $1.00 increase (decrease) in the assumed initial public offering price of $9.50 per share (the midpoint of the price range set forth on the cover page of this prospectus) would increase (decrease) the net proceeds to us from this offering by $7.3 million, assuming the number of shares offered by us, as set forth on the cover page of this prospectus, remains the same and after deducting underwriting discounts and commissions and estimated expenses payable by us.
51
Table of Contents
After this offering, we intend to retain all available funds and any future earnings to reduce debt and for general corporate purposes. However, in the future, subject to the factors described below and our future liquidity and capitalization, we may change this policy and choose to pay dividends. Our business is conducted through our principal operating subsidiary, LMI. Dividends from, and cash generated by, LMI will be our principal source of cash to repay indebtedness, fund operations and pay dividends. Accordingly, our ability to pay dividends to our stockholders is dependent on the earnings and distributions of funds from LMI. LMI’s ability to pay dividends to us and, therefore, our ability to pay dividends on our common stock, is currently restricted by the terms of the indenture governing the Notes and the agreements governing our senior secured credit facilities and may be further restricted by any future indebtedness we incur.
Any future determination to pay dividends will be at the discretion of our Board of Directors and will take into account:
| • | restrictions in the agreements governing our senior secured credit facilities and the instruments or agreements governing any future indebtedness we incur; |
| • | general economic and business conditions; |
| • | our financial condition, results of operations and cash flows; |
| • | our capital requirements; |
| • | the ability of LMI to pay dividends and make distributions to us; and |
| • | those other factors that our Board of Directors may deem relevant. |
See “Management’s Discussion and Analysis of Financial Condition and Results of Operations—Liquidity and Capital Resources.”
52
Table of Contents
The following table sets forth our cash and cash equivalents and our capitalization as of March 31, 2015:
| • | on an actual basis; |
| • | on a pro forma basis to give effect to our corporate reorganization (including the related 0.355872-for-1 reverse stock split) prior to the consummation of this offering; and |
| • | on a pro forma as adjusted basis to give effect to (1) our corporate reorganization (including the related 0.355872-for-1 reverse stock split), (2) payment of the termination of our Advisory Services and Monitoring Agreement, dated as of January 8, 2008, which we will terminate prior to the consummation of this offering (see “Certain Relationships and Related Person Transactions—Advisory and Monitoring Services Agreement”), (3) the 2015 Refinancing and (4) the sale of 7,894,736 shares of our common stock in this offering by us at an assumed initial public offering price of $9.50 per share (the midpoint of the price range set forth on the cover of this prospectus) after deducting underwriting discounts and commissions and estimated offering expenses payable by us, and the application of the net proceeds from this offering to reduce our indebtedness as described in “Use of Proceeds.” |
The following table should be read in conjunction with “Use of Proceeds,” “Selected Consolidated Financial Data,” “Management’s Discussion and Analysis of Financial Condition and Results of Operations,” “Description of Capital Stock,” and our financial statements and notes thereto included elsewhere in this prospectus.
| As of March 31, 2015 | ||||||||||||
| Actual | Pro forma(1) |
Pro forma as adjusted(2) |
||||||||||
| (dollars in thousands) | ||||||||||||
| Cash and cash equivalents |
$ | 30,743 | $ | 30,743 | $ | 22,726 | ||||||
|
|
|
|
|
|
|
|||||||
| Long-term debt, including current portion: |
||||||||||||
| Revolving credit facility(3) |
$ | 8,000 | $ | 8,000 | $ | — | ||||||
| New term facility(4) |
— | — | 361,350 | |||||||||
| Senior notes(5) |
399,348 | 399,348 | — | |||||||||
|
|
|
|
|
|
|
|||||||
| Total long-term debt, including current portion |
407,348 | 407,348 | 361,350 | |||||||||
|
|
|
|
|
|
|
|||||||
| Stockholders’ (deficit) equity: |
||||||||||||
| Common stock ($.001 par value, 60,000,000 shares authorized, 50,821,658 shares issued and 50,807,503 shares outstanding, on an actual basis; $.01 par value, 250,000,000 shares authorized, 18,080,944 shares issued and outstanding, on a pro forma basis; and $.01 par value, 250,000,000 shares authorized, 25,975,680 shares issued and outstanding, on a pro forma as adjusted basis) |
51 | 181 | 260 | |||||||||
| Treasury stock (14,155 shares, at cost, on an actual basis; zero shares, at cost, on a pro forma and pro forma as adjusted basis) |
(106 | ) | — | — | ||||||||
| Additional paid-in capital |
107,106 | 106,870 | 174,841 | |||||||||
| Accumulated deficit |
(344,039 | ) | (344,039 | ) | (374,972 | ) | ||||||
| Accumulated other comprehensive income |
(1,988 | ) | (1,988 | ) | (1,988 | ) | ||||||
|
|
|
|
|
|
|
|||||||
| Total stockholders’ (deficit) equity |
(238,976 | ) | (238,976 | ) | (201,859 | ) | ||||||
|
|
|
|
|
|
|
|||||||
| Total capitalization(6) |
$ | 168,372 | $ | 168,372 | $ | 159,491 | ||||||
|
|
|
|
|
|
|
|||||||
| (1) | Pro forma information gives effect to our corporate reorganization, including the related 0.355872-for-1 reverse stock split, described in “Prospectus Summary—Corporate Reorganization and Concurrent Refinancing Transaction,” which had no impact on our historical total capitalization. |
53
Table of Contents
| (2) | Pro forma as adjusted information gives effect to our corporate reorganization, including the related 0.355872-for-1 reverse stock split, described in “Prospectus Summary—Corporate Reorganization and Concurrent Refinancing Transaction,” our 2015 Refinancing, payment of the $6.5 million termination fee of our Advisory Services and Monitoring Agreement, the receipt of $68.1 million net proceeds from the sale of our common stock in this offering by us, after deducting underwriting discounts and commissions and estimated offering expenses, and the application of $432.5 million of the net proceeds from this offering, together with the net proceeds of the new term facility and cash on hand, to reduce our indebtedness, including a $9.8 million redemption premium, as described in “Use of Proceeds.” |
| (3) | The senior secured credit facilities as of March 31, 2015 provide for a $50.0 million revolving credit facility. As of March 31, 2015, the aggregate Borrowing Base on the credit facility was approximately $45.8 million, which was reduced by (i) an outstanding $8.8 million unfunded Standby Letter of Credit and (ii) an $8.1 million outstanding loan balance including interest, resulting in a net Borrowing Base availability of approximately $28.9 million. We will use a portion of the proceeds of this offering to pay down the outstanding amounts under our revolving credit facility. See “Use of Proceeds” and “Description of Material Indebtedness—Revolving Credit Facility.” |
| (4) | We expect to enter into a $365.0 million seven-year new term facility. The pro forma as adjusted information shows an amount that is net of $3.7 million original issue discount. See “Description of Material Indebtedness—New Term Facility.” |
| (5) | The senior notes consist of $400.0 million in aggregate principal amount of the Notes issued May 10, 2010 and March 16, 2011, net of approximately $3.8 million in consent solicitation fees and $2.3 million premium on debt, which will be amortized as an adjustment to interest expense over the remaining term of the debt. Interest is payable entirely in cash. We will use a portion of the proceeds of this offering and proceeds from the 2015 Refinancing to repay in full our Senior Notes. See “Use of Proceeds.” |
| (6) | Assuming the number of shares sold by us in the offering remains the same as set forth on the cover page of this prospectus, a $1.00 increase or decrease in the assumed public offering price would increase or decrease, as applicable, our total capitalization by approximately $7.3 million. |
54
Table of Contents
If you invest in our common stock in this offering, your ownership interest will be diluted to the extent of the difference between the initial public offering price per share and the pro forma as adjusted net tangible book value per share of common stock as of the consummation of this offering. Dilution results from the fact that the per share offering price of our common stock exceeds the pro forma net tangible book value per share purchased by new investors in this offering.
Our pro forma net tangible book value as of March 31, 2015 was $(289.4) million, or $(16.01) per share of common stock. Pro forma net tangible book value represents the amount of total tangible assets less total liabilities, and net tangible book value per share represents net tangible book value divided by the number of shares of common stock outstanding, in each case, after giving effect to our corporate reorganization (including the related 0.355872-for-1 reverse stock split) but before giving effect to this offering. The corporate reorganization had no impact on our historical net tangible book value as of March 31, 2015.
After giving effect to (i) the sale by us of 7,894,736 shares of common stock in this offering at an assumed public offering price of $9.50 per share (the midpoint of the price range set forth on the cover page of this prospectus), (ii) the application of the net proceeds of the offering and (iii) the concurrent completion of the 2015 Refinancing, our pro forma as adjusted net tangible book value as of March 31, 2015 would have been $(251.4) million, or $(9.68) per share. This represents an immediate increase in pro forma net tangible book value of $6.33 per share to existing stockholders and an immediate dilution in pro forma net tangible book value of $19.18 per share to new investors purchasing common stock in this offering. The following table illustrates this dilution on a per share basis:
| Assumed initial public offering price per share |
$ | 9.50 | ||||||
| Pro forma net tangible book value per share as of March 31, 2015 |
$ | (16.01 | ) | |||||
| Increase in pro forma net tangible book value per share attributable to the sale of shares in this offering |
6.33 | |||||||
|
|
|
|||||||
| Pro forma as adjusted net tangible book value per share after this offering |
(9.68 | ) | ||||||
|
|
|
|||||||
| Dilution in pro forma net tangible book value per share to new investors purchasing in this offering |
$ | 19.18 | ||||||
|
|
|
A $1.00 increase (decrease) in the assumed initial public offering price of $9.50 per share (the midpoint of the price range set forth on the cover page of this prospectus) would increase (decrease) our pro forma as adjusted net tangible book value after this offering by $7.3 million and increase (decrease) the dilution per share to new investors purchasing in this offering by $0.72 per share, assuming no other change to the number of shares of common stock offered by us as set forth on the cover page of this prospectus.
The following table summarizes the differences between the existing stockholders and new investors purchasing shares in this offering with respect to the number of shares purchased from us, the total consideration paid and the average price paid per share as of March 31, 2015, as adjusted to give effect to our sale of 7,894,736 shares in this offering at an assumed initial public offering price of $9.50 per share, which is the midpoint of the range set forth on the cover page of this prospectus, before deducting the estimated underwriting discounts and commissions and estimated offering expenses:
| Shares purchased | Total consideration | Average price per share |
||||||||||||||||||
| dollars in thousands | ||||||||||||||||||||
| Number | Percent | Amount | Percent | |||||||||||||||||
| Existing stockholders |
18,080,944 | 70 | % | $ | 100,682 | 57 | % | $ | 5.57 | |||||||||||
| New investors |
7,894,736 | 30 | % | 75,000 | 43 | % | 9.50 | |||||||||||||
|
|
|
|
|
|
|
|
|
|||||||||||||
| Total |
25,975,680 | 100 | % | 175,682 | 100 | % | 6.76 | |||||||||||||
55
Table of Contents
A $1.00 increase (decrease) in the assumed initial public offering price of $9.50 per share (the midpoint of the price range set forth on the cover page of this prospectus) would increase (decrease) the total consideration paid by new investors purchasing in this offering by $7.3 million and the total consideration paid by all stockholders by $7.3 million.
In addition, we may choose to raise additional capital based on market conditions or strategic considerations even if we believe we have sufficient funds for our current or future operating plans. To the extent that additional capital is raised through the sale of equity or convertible debt securities, the issuance of these securities could result in further dilution to our stockholders.
56
Table of Contents
Adjusted EBITDA and EBITDA as used in our equity incentive plans, collectively, our Non-GAAP Measures, as presented in this prospectus, are supplemental measures of our performance that are not required by, or presented in accordance with GAAP. They are not measurements of our financial performance under GAAP and should not be considered as alternatives to net income (loss) or any other performance measures derived in accordance with GAAP or as alternatives to cash flow from operating activities as measures of our liquidity.
Our presentation of our Non-GAAP Measures may not be comparable to similarly titled measures of other companies. We have included information concerning our Non-GAAP Measures in this prospectus because we believe that this information is used by certain investors as measures of a company’s historical performance.
Our Non-GAAP Measures have limitations as analytical tools, and you should not consider them in isolation, or as substitutes for analysis of our operating results or cash flows as reported under GAAP. Some of these limitations include:
| • | they do not reflect our cash expenditures, or future requirements, for capital expenditures or contractual commitments; |
| • | they do not reflect changes in, or cash requirements for, our working capital needs; |
| • | they do not reflect the significant interest expense or the cash requirements necessary to service interest or principal payments, on our debt; |
| • | although depreciation is a non-cash charge, the assets being depreciated will often have to be replaced in the future, and our Non-GAAP Measures do not reflect any cash requirements for those replacements; |
| • | they are not adjusted for all non-cash income or expense items that are reflected in our statements of cash flows; and |
| • | other companies in our industry may calculate these measures differently than we do, limiting their usefulness as comparative measures. |
Because of these limitations, our Non-GAAP Measures should not be considered as measures of discretionary cash available to us to invest in the growth of our business. We compensate for these limitations by relying primarily on our GAAP results and using our Non-GAAP Measures only for supplemental purposes.
Please see the consolidated financial statements included elsewhere in this prospectus for our GAAP results. Additionally, for a presentation of net income as calculated under GAAP and reconciliation to our calculation of Adjusted EBITDA, see “Prospectus Summary—Summary Consolidated Financial and Other Data” in this prospectus. For our definition of EBITDA as used in our equity incentive plans and a summary of the differences between such EBITDA definition and Adjusted EBITDA, see “Executive and Director Compensation—Elements of Compensation—Long-Term Equity Incentive Awards.”
57
Table of Contents
SELECTED CONSOLIDATED FINANCIAL DATA
The following selected consolidated financial data should be read in conjunction with, and are qualified by reference to, “Capitalization,” “Management’s Discussion and Analysis of Financial Condition and Results of Operations” and the consolidated financial statements and notes thereto included elsewhere in this prospectus. The summary consolidated statement of operations data for the years ended December 31, 2014, 2013 and 2012 and the summary consolidated balance sheet data as of December 31, 2014 and 2013 has been derived from, and is qualified by reference to, our audited consolidated financial statements included elsewhere in this prospectus and should be read in conjunction with those consolidated financial statements and notes thereto. The summary consolidated balance sheet data as of March 31, 2015 and statements of operations data for the three months ended March 31, 2015 and 2014 have been derived from our unaudited consolidated financial statements and related notes included elsewhere in this prospectus. Balance sheet data as of March 31, 2014 have been derived from our unaudited consolidated financial statements that are not included in this prospectus. We have prepared the unaudited consolidated financial information set forth below on the same basis as our audited consolidated financial statements and have included all adjustments, consisting of only normal recurring adjustments, that we consider necessary for a fair presentation of our financial position and operating results for such periods. The results for any interim period are not necessarily indicative of the results that may be expected for a full year. The results indicated below and elsewhere in this prospectus are not necessarily indicative of our future performance. You should read this information, together with “Capitalization,” “Management’s Discussion and Analysis of Financial Condition and Results of Operations” and the consolidated financial statements and related notes included elsewhere in this prospectus.
| Three Months ended March 31, |
Year ended December 31, | |||||||||||||||||||
| 2015 | 2014 | 2014 | 2013 | 2012 | ||||||||||||||||
| (dollars in thousands, except share and per share numbers) | ||||||||||||||||||||
| Statement of Comprehensive Income (Loss) Data: |
||||||||||||||||||||
| Revenues |
$ | 74,823 | $ | 73,336 | $ | 301,600 | $ | 283,672 | $ | 288,105 | ||||||||||
| Cost of goods sold |
39,054 | 43,275 | 176,081 | 206,311 | 211,049 | |||||||||||||||
| Loss on firm purchase commitment |
— | — | — | — | 1,859 | |||||||||||||||
| Sales and marketing expenses |
9,072 | 9,498 | 35,116 | 35,227 | 37,437 | |||||||||||||||
| General and administrative expenses |
9,123 | 8,852 | 37,313 | 33,036 | 32,520 | |||||||||||||||
| Research and development expenses |
6,196 | 3,222 | 13,673 | 30,459 | 40,604 | |||||||||||||||
| Proceeds from manufacturer |
— | — | — | (8,876 | ) | (34,614 | ) | |||||||||||||
| Impairment of land |
— | — | — | 6,406 | — | |||||||||||||||
|
|
|
|
|
|
|
|
|
|
|
|||||||||||
| Operating income (loss) |
24,391 | 8,489 | 39,417 | (18,891 | ) | (750 | ) | |||||||||||||
| Interest expense |
(10,630 | ) | (10,560 | ) | (42,288 | ) | (42,915 | ) | (42,014 | ) | ||||||||||
| Interest income |
7 | 8 | 27 | 104 | 252 | |||||||||||||||
| Other income (expense), net |
(383 | ) | (414 | ) | 478 | 1,161 | (44 | ) | ||||||||||||
|
|
|
|
|
|
|
|
|
|
|
|||||||||||
| Income (loss) before income taxes |
372 | (2,477 | ) | (2,366 | ) | (60,541 | ) | (42,556 | ) | |||||||||||
| Provision (benefit) for income taxes |
(3 | ) | (1,192 | ) | 1,195 | 1,014 | (555 | ) | ||||||||||||
|
|
|
|
|
|
|
|
|
|
|
|||||||||||
| Net income (loss) |
375 | (1,285 | ) | (3,561 | ) | (61,555 | ) | (42,001 | ) | |||||||||||
| Foreign currency translation, net of taxes |
(358 | ) | (271 | ) | (1,236 | ) | (1,729 | ) | 964 | |||||||||||
|
|
|
|
|
|
|
|
|
|
|
|||||||||||
| Total comprehensive income (loss) |
$ | 17 | $ | (1,556 | ) | $ | (4,797 | ) | $ | (63,284 | ) | $ | (41,037 | ) | ||||||
|
|
|
|
|
|
|
|
|
|
|
|||||||||||
| Net income (loss) per common share: |
||||||||||||||||||||
| Basic and diluted |
$ | 0.01 | $ | (0.03 | ) | $ | (0.07 | ) | $ | (1.21 | ) | $ | (0.84 | ) | ||||||
| Common shares: |
||||||||||||||||||||
| Basic |
50,807,503 | 50,803,484 | 50,806,512 | 50,670,274 | 50,250,957 | |||||||||||||||
| Diluted |
51,716,327 | 50,803,484 | 50,806,512 | 50,670,274 | 50,250,957 | |||||||||||||||
58
Table of Contents
| As of March 31, | As of December 31, | |||||||||||||||
| 2015 | 2014 | 2014 | 2013 | |||||||||||||
| (dollars in thousands) | ||||||||||||||||
| Balance Sheet Data: |
||||||||||||||||
| Cash and cash equivalents |
$ | 30,743 | $ | 17,010 | $ | 19,739 | $ | 18,578 | ||||||||
| Total assets |
250,658 | 260,960 | 249,570 | 261,311 | ||||||||||||
| Total liabilities |
489,634 | 497,736 | 488,840 | 496,828 | ||||||||||||
| Total long-term debt, net |
399,348 | 399,098 | 399,280 | 399,037 | ||||||||||||
| Total stockholders’ deficit |
(238,976 | ) | (236,776 | ) | (239,270 | ) | (235,517 | ) | ||||||||
59
Table of Contents
MANAGEMENT’S DISCUSSION AND ANALYSIS OF FINANCIAL CONDITION AND RESULTS OF OPERATIONS
The following discussion and analysis of our financial condition and results of operations should be read together with “Selected Consolidated Financial Data” and the consolidated financial statements and the related notes included elsewhere in this prospectus. This discussion contains forward-looking statements related to future events and our future financial performance that are based on current expectations and subject to risks and uncertainties. Our actual results may differ materially from those anticipated in these forward-looking statements as a result of many factors, including those set forth under “Risk Factors,” “Cautionary Note Regarding Forward-Looking Statements” and elsewhere in this prospectus.
Overview
We are a global leader in developing, manufacturing, selling and distributing innovative diagnostic medical imaging agents and products that assist clinicians in the diagnosis of cardiovascular and other diseases. Our agents are routinely used to diagnose coronary artery disease, congestive heart failure, stroke, peripheral vascular disease and other diseases. Clinicians use our imaging agents and products across a range of imaging modalities, including echocardiography, nuclear imaging and MRI. We believe that the resulting improved diagnostic information enables healthcare providers to better detect and characterize, or rule out, disease, potentially achieving improved patient outcomes, reducing patient risk and limiting overall costs for payers and the entire healthcare system.
Our commercial products are used by cardiologists, nuclear physicians, radiologists, internal medicine physicians, technologists and sonographers working in a variety of clinical settings. We sell our products to hospitals, clinics, group practices, integrated delivery networks, group purchasing organizations, radiopharmacies, and, in certain circumstances, wholesalers.
We sell our products globally and have operations in the United States, Puerto Rico, Canada and Australia and distribution relationships in Europe, Asia Pacific and Latin America.
Our Products
Our principal products include the following:
DEFINITY is an ultrasound contrast agent used in ultrasound exams of the heart, also known as echocardiography exams. DEFINITY contains perflutren-containing lipid microspheres and is indicated in the United States for use in patients with suboptimal echocardiograms to assist in imaging the left ventricular chamber and left endocardial border of the heart in ultrasound procedures. We launched DEFINITY in 2001, and its last patent in the United States will currently expire in 2021 and in numerous foreign jurisdictions in 2019. We also have an active next generation development program for this agent.
TechneLite is a technetium generator which provides the essential nuclear material used by radiopharmacies to radiolabel Cardiolite, Neurolite and other technetium-based radiopharmaceuticals used in nuclear medicine procedures. TechneLite uses Moly as its main active ingredient.
Xenon is a radiopharmaceutical gas that is inhaled and used to assess pulmonary function and also cerebral blood flow. Xenon is manufactured by a third party and packaged by us.
Cardiolite is a technetium-based radiopharmaceutical imaging agent used in MPI procedures to detect coronary artery disease with SPECT. Cardiolite was approved by the FDA in 1990, and its market exclusivity expired in July 2008.
60
Table of Contents
Sales of our contrast agent, DEFINITY, are made in the United States and Canada through our sales team of approximately 80 employees. In the United States, our nuclear imaging products, including TechneLite, Xenon, Cardiolite and Neurolite, are primarily distributed through commercial radiopharmacies, the majority of which are controlled by or associated with Cardinal, UPPI, GE Healthcare and Triad. A small portion of our nuclear imaging product sales in the United States are made through our direct sales force to hospitals and clinics that maintain their own in-house radiopharmaceutical capabilities. Outside the United States, we own four radiopharmacies in Canada and two radiopharmacies in each of Puerto Rico and Australia. In Europe, Asia Pacific and Latin America, we rely on third party distributors to market, sell and distribute our nuclear imaging and contrast agent products, either on a country-by-country basis or on a multicountry regional basis.
The following table sets forth our revenue derived from our principal products:
| Three Months Ended March 31, |
||||||||||||||||
| (dollars in thousands) |
2015 | % | 2014 | % | ||||||||||||
| DEFINITY |
$ | 25,666 | 34.3 | $ | 22,359 | 30.5 | ||||||||||
| TechneLite |
20,860 | 27.9 | 23,041 | 31.4 | ||||||||||||
| Xenon |
13,194 | 17.6 | 9,709 | 13.2 | ||||||||||||
| Other |
15,103 | 20.2 | 18,227 | 24.9 | ||||||||||||
|
|
|
|
|
|
|
|
|
|||||||||
| Revenues |
$ | 74,823 | 100.0 | $ | 73,336 | 100.0 | ||||||||||
|
|
|
|
|
|
|
|
|
|||||||||
| Year ended December 31, | ||||||||||||||||||||||||
| 2014 | 2013 | 2012 | ||||||||||||||||||||||
| $ | % | $ | % | $ | % | |||||||||||||||||||
| (dollars in thousands) | ||||||||||||||||||||||||
| DEFINITY |
$ | 95,760 | 31.8 | % | $ | 78,094 | 27.5 | % | $ | 51,431 | 17.9 | % | ||||||||||||
| TechneLite |
93,588 | 31.0 | 92,195 | 32.5 | 114,249 | 39.7 | ||||||||||||||||||
| Xenon |
36,549 | 12.1 | 32,125 | 11.3 | 30,075 | 10.4 | ||||||||||||||||||
| Cardiolite |
18,823 | 6.2 | 26,137 | 9.2 | 34,995 | 12.1 | ||||||||||||||||||
| Other |
56,880 | 18.9 | 55,121 | 19.5 | 57,355 | 19.9 | ||||||||||||||||||
|
|
|
|
|
|
|
|
|
|
|
|
|
|||||||||||||
| Revenues |
$ | 301,600 | 100.0 | % | $ | 283,672 | 100.0 | % | $ | 288,105 | 100.0 | % | ||||||||||||
|
|
|
|
|
|
|
|
|
|
|
|
|
|||||||||||||
Included in Cardiolite revenue are sales of branded Cardiolite and generic sestamibi, some of which we produce and some of which we procure from third parties.
Key Factors Affecting Our Results
Our business and financial performance have been, and continue to be, affected by the following:
Growth of DEFINITY
We believe the market opportunity for our contrast agent, DEFINITY, remains significant. DEFINITY is currently our fastest growing and highest margin commercial product. We believe that DEFINITY sales will continue to grow and that DEFINITY will constitute a greater share of our overall product mix. As a result of DEFINITY’s continued growth, we believe that our gross profit will increase, and our gross margin will continue to expand. As we better educate the physician and healthcare provider community about the benefits and risks of this product, we believe we will experience further penetration of suboptimal echocardiograms.
Prior to the supply issues with BVL in 2012, sales of DEFINITY continually increased year-over-year since June 2008, when the boxed warning on DEFINITY was modified. Unit sales of DEFINITY had decreased substantially in late 2007 and early 2008 as a result of an FDA request in October 2007 that we and GE Healthcare, which distributes Optison, a competitor to DEFINITY, add a boxed warning to their products to
61
Table of Contents
notify physicians and patients about potentially serious safety concerns or risks posed by the products. However, in May 2008, the FDA boxed warning was modified in response to the substantial advocacy efforts of prescribing physicians. In October 2011, we received FDA approval of further favorable modifications to the DEFINITY label, including: further relaxing the boxed warning; eliminating the sentence in the Indication and Use section “The safety and efficacy of DEFINITY with exercise stress or pharmacologic stress testing have not been established” (previously added in October 2007 in connection with the imposition of the box warning); and including summary data from the post-approval CaRES (Contrast echocardiography Registry for Safety Surveillance) safety registry and the post-approval pulmonary hypertension study. Bracco’s newly approved ultrasound contrast agent, Lumason, has substantially similar safety labeling as DEFINITY. The future growth of our DEFINITY sales will be dependent on our ability to continue to increase segment penetration for DEFINITY in suboptimal echocardiograms and, as discussed below in “—Inventory Supply,” on the ability of JHS, and, if approved Pharmalucence, to continue to manufacture and release DEFINITY on a timely and consistent basis. See “Risk Factors—The growth of our business is substantially dependent on increased market penetration for the appropriate use of DEFINITY in suboptimal echocardiograms.”
There are three echocardiography contrast agents approved by the FDA for sale in the U.S.—DEFINITY which as of December 2014 had an approximately 78% segment share, Optison, and Lumason approved by the FDA in October 2014. Lumason is known as SonoVue outside of the U.S. and is already approved for sale in Europe and certain Asian markets, including China, Japan and Korea. While we believe that additional promotion in the U.S. echocardiography segment will help raise awareness around the value that echocardiography contrast brings and potentially increase the overall contrast penetration rate, if Bracco successfully commercializes Lumason in the U.S. without otherwise increasing the overall usage of ultrasound contrast agents, our own growth expectations for DEFINITY revenue, gross profit and gross margin may have to be adjusted.
Inventory Supply
Our products consist of contrast imaging agents and radiopharmaceuticals (including technetium generators). We obtain a substantial portion of our imaging agents from third party suppliers. JHS is currently our sole source manufacturer of DEFINITY and Neurolite and we have ongoing technology transfer activities at JHS for our Cardiolite product supply. In the meantime, our Cardiolite product supply is manufactured by a single manufacturer. Until JHS is approved by certain foreign regulatory authorities to manufacture certain of our products, we will face continued limitations on where we can sell those products outside of the United States.
Historically, we relied on BVL in Bedford, Ohio as our sole manufacturer of DEFINITY, Neurolite and evacuation vials, an ancillary component for our TechneLite generators, and as one of two manufacturers of Cardiolite. Following extended operational and regulatory challenges at BVL, in March 2012 we entered into a settlement arrangement with BVL, resulting in an aggregate payment to us of $35.0 million, a broad mutual waiver and a covenant by us not to sue. Later in 2012 and in 2013, BVL continued to attempt to manufacture our products for us, and in October 2013 announced that it would cease to manufacture new batches of our products at its Bedford, Ohio facility. In November 2013, we entered into a second settlement arrangement with BVL, resulting in an additional aggregate payment to us of $8.9 million, a broad mutual waiver and a covenant by us not to sue.
In addition to JHS, we are also currently working to secure additional alternative suppliers for our key products as part of our ongoing supply chain diversification strategy. On November 12, 2013, we entered into a Manufacturing and Supply Agreement with Pharmalucence to manufacture and supply DEFINITY. We currently target filing for FDA approval to manufacture DEFINITY at Pharmalucence in 2015.
The radiopharmaceuticals are decaying radioisotopes with half-lives ranging from a few hours to several days. These products cannot be kept in inventory because of their limited useful lives and are subject to just-in-time manufacturing, processing and distribution, which takes place at our North Billerica, Massachusetts facility.
62
Table of Contents
Global Isotope Supply
Currently, our largest supplier of Moly and our only supplier of Xenon is Nordion, which relies on the NRU reactor in Chalk River, Ontario. For Moly, we currently have a supply agreement with Nordion that runs through December 31, 2015, subject to certain early termination provisions and supply agreements with NTP of South Africa, ANSTO of Australia, and IRE of Belgium, each running through December 31, 2017. For Xenon, we have a purchase order relationship with Nordion. The Canadian government requires the NRU reactor to shut down for at least four weeks at least once a year for inspection and maintenance. The 2015 shutdown period ran from April 13, 2015 until May 12, 2015, and we were able to source all of our standing order customer demand for Moly during this time period from our other suppliers. However, because Xenon is a by-product of the Moly production process and is currently captured only by NRU, for approximately two weeks during this shutdown period, we were not able to supply all of our standing order customer demand for Xenon. Because the month-long NRU shutdown was fully anticipated in our 2015 budgeting process, the shutdown will not have a material adverse effect on our 2015 results of operations, financial condition and cash flows.
We believe we are well-positioned with our current supply partners to have a secure supply of Moly, including low-enriched uranium, or LEU, Moly, when the NRU reactor transitions in October 2016 from providing regular supply of medical isotopes to providing only emergency back-up supply medical isotopes through March 2018. ANSTO has under construction, in cooperation with NTP, a new Moly processing facility that ANSTO believes will expand its production capacity by approximately 2.5 times, with expanded commercial production planned to start in the latter part of 2016. In addition, IRE is currently in the process of expanding its production capability by up to 50%, and IRE expects this capacity expansion to be approved by its regulatory body by 2016. The new ANSTO and IRE production capacity is expected to replace the NRU’s current routine production. In January 2015, we announced entering into a new strategic agreement with IRE for the future supply of Xenon. Under the terms of the agreement, IRE will provide bulk Xenon to us for processing and finishing once development work has been completed and all necessary regulatory approvals have been obtained. We currently estimate commercial production will occur in 2016. If we are not able to begin providing commercial quantities of Xenon prior to the NRU reactor’s supply transition in 2016, there may be a period of time during which we are not able to offer Xenon in our portfolio of commercial products. See “Risk Factors—We face potential supply and demand challenges for Xenon.”
Demand for TechneLite
Since the global Moly supply shortage in 2009 to 2010, we have experienced reduced demand for TechneLite generators from pre-shortage levels even though volume has increased in absolute terms from levels during the shortage following the return of our normal Moly supply in August 2010. However, we do not know if overall industry demand for technetium will ever return to pre-shortage levels. See “Risk Factors—The Moly supply shortage caused by the 2009-10 NRU reactor shutdown has had a negative effect on the demand for some of our products, which will likely continue in the future.”
Separate from the Moly supply shortage, we believe there has also been a decline in the MPI study market because of industry-wide cost containment initiatives that have resulted in a transition of where imaging procedures are performed, from free-standing imaging centers to the hospital setting. While the total number of patient studies has not returned to pre-shortage levels, the total MPI market has been essentially flat for the period 2011 through 2014.
In November 2014, CMS announced the 2015 final Medicare payment rules for hospital outpatient settings. Under the final rules, each technetium dose produced from a generator for a diagnostic procedure in a hospital outpatient setting is reimbursed by Medicare at a higher rate if that technetium dose is produced from a generator containing Moly sourced from at least 95 percent LEU. We currently understand that CMS expects to continue this incentive program for the foreseeable future. In January 2013, we began to offer a TechneLite generator which contains Moly sourced from at least 95 percent LEU and which satisfies the requirements for
63
Table of Contents
reimbursement under this incentive program. Although demand for LEU generators appears to be growing, we do not know when, or if, this incremental reimbursement for LEU Moly generators will result in a material increase in our generator sales.
Cardinal Supply Agreements
Our written supply agreements with Cardinal relating to TechneLite generators, Xenon, Neurolite, Cardiolite and certain other products expired in accordance with their terms on December 31, 2014. Following extended discussions with Cardinal that have not yet resulted in one or more new written supply agreements, we are currently accepting and fulfilling product orders from Cardinal on a purchase order basis at list price. We cannot predict the volumes or product mix Cardinal will continue to order and purchase, and such volumes and product mix may vary over time. In the absence of written supply agreements with Cardinal, in early 2015, our sales volumes with Cardinal began to transition from previous historical levels to new, lower levels, but at substantially higher prices. This gave us a revenue and margin benefit in the first quarter of 2015. Some of the volume that we previously sold to Cardinal has shifted to sales to other of our radiopharmacy customers. We currently anticipate the benefit we experienced in the first quarter of 2015 from this change in contractual status will moderate in future quarters for so long as we do not have written supply agreements with Cardinal. While future levels of revenue and profit contribution associated with Cardinal cannot be predicted at this time because such amounts depend on future unit sales volumes, product mix and pricing to Cardinal, we currently anticipate that overall quarterly levels for the remainder of 2015 will be lower than those experienced during the first quarter of 2015 and during the respective year-ago periods. We further anticipate this change in contractual status will continue to favorably impact our gross profit percentage versus respective year-ago periods, though not to the extent experienced during the first quarter of 2015. The future favorable impact to our gross profit percentage will depend on ultimate levels of unit volume and product mix ordered by this customer in future periods. See “Risk Factors—In the United States, we are heavily dependent on a few large customers and group purchasing organization arrangements to generate a majority of our revenues for our medical imaging products. Outside of the United States, we rely on distributors to generate a substantial portion of our revenues.”
Cardiolite Competitive Pressures
Cardiolite’s market exclusivity expired in July 2008. In September 2008, the first of several competing generic products to Cardiolite was launched. With continued pricing and unit volume pressures from generic competitors, we also sell our Cardiolite product in the form of a generic sestamibi at the same time as we continue to sell branded Cardiolite throughout the MPI segment. We believe this strategy of selling branded as well as generic sestamibi has slowed our market share loss by having multiple sestamibi offerings that are attractive in terms of brand, as well as price.
In addition to pressures due to generics, our Cardiolite products have also faced a volume decline in the MPI segment due to a change in professional society AUC, ongoing reimbursement pressures, the limited availability of Moly during the NRU reactor shutdown, the limited availability of Cardiolite products to us during the BVL outage, and the increase in use of other diagnostic modalities as a result of a shift to more available imaging agents and modalities. We believe the continuing effects from the BVL outage and continued generic competition will result in further market share and margin erosion for our Cardiolite products.
These factors have impacted the carrying value of our Cardiolite trademark intangible asset as further described in “Gross Profit.”
Research and Development Expenses
To remain a leader in the marketplace, we have historically made substantial investments in new product development. As a result, the positive contributions of those internally funded R&D programs have been a key factor in our historical results and success. In March 2013, we began to implement a strategic shift in how we will fund our important R&D programs. We have reduced our internal R&D resources while at the same time we
64
Table of Contents
are seeking to engage strategic partners to assist us in the further development and commercialization of our important agents in development, including flurpiridaz F 18, 18F LMI 1195 and LMI 1174. As a result of this shift, we are seeking strategic partners to assist us with the further development and possible commercialization of flurpiridaz F 18. For our other two important agents in development, 18F LMI 1195 and LMI 1174, we will also seek to engage strategic partners to assist us with the ongoing development activities relating to these agents.
Segments
We report our results of operations in two operating segments: United States and International. We generate a greater proportion of our revenue and net income in the United States segment, which consists of all regions of the United States with the exception of Puerto Rico. We expect our percentage of revenue and net income derived from our International segment to increase in future periods as we continue to expand globally.
Operating Results
Our results in the three months ended March 31, 2015 reflect the following:
| • | increased revenues and segment penetration for DEFINITY in the suboptimal echocardiogram segment as a result of our sales efforts and sustained availability of product supply; |
| • | increased revenues for Xenon, mainly the result of higher selling prices, offset in part by mix shift among certain sales channels; |
| • | increased depreciation associated with the scheduled decommissioning of certain long-lived assets; |
| • | decreased revenues from our TechneLite generators in absence of Cardinal agreements; and |
| • | lower international revenues across product lines because of unfavorable foreign exchange and competitive pressures. |
Results of Operations
| For the Three Months Ended March 31, |
||||||||
| (dollars in thousands) |
2015 | 2014 | ||||||
| Revenues |
$ | 74,823 | $ | 73,336 | ||||
| Cost of goods sold |
39,054 | 43,275 | ||||||
|
|
|
|
|
|||||
| Gross profit |
35,769 | 30,061 | ||||||
|
|
|
|
|
|||||
| Operating expenses |
||||||||
| Sales and marketing expenses |
9,072 | 9,498 | ||||||
| General and administrative expenses |
9,123 | 8,852 | ||||||
| Research and development expenses |
6,196 | 3,222 | ||||||
|
|
|
|
|
|||||
| Total operating expenses |
24,391 | 21,572 | ||||||
|
|
|
|
|
|||||
| Operating income |
11,378 | 8,489 | ||||||
| Interest expense, net |
(10,623 | ) | (10,552 | ) | ||||
| Other expense, net |
(383 | ) | (414 | ) | ||||
|
|
|
|
|
|||||
| Income (loss) before income taxes |
372 | (2,477 | ) | |||||
| Benefit for income taxes |
(3 | ) | (1,192 | ) | ||||
|
|
|
|
|
|||||
| Net income (loss) |
375 | (1,285 | ) | |||||
|
|
|
|
|
|||||
| Foreign currency translation |
(358 | ) | (271 | ) | ||||
|
|
|
|
|
|||||
| Total comprehensive income (loss) |
$ | 17 | $ | (1,556 | ) | |||
|
|
|
|
|
|||||
65
Table of Contents
Revenues
Revenues are summarized as follows:
| Three Months Ended March 31, |
||||||||
| (dollars in thousands) |
2015 | 2014 | ||||||
| United States |
||||||||
| DEFINITY |
$ | 25,182 | $ | 21,984 | ||||
| TechneLite |
18,173 | 20,100 | ||||||
| Xenon |
13,186 | 9,705 | ||||||
| Other |
4,126 | 5,022 | ||||||
|
|
|
|
|
|||||
| Total U.S. revenues |
$ | 60,667 | $ | 56,811 | ||||
|
|
|
|
|
|||||
| International |
||||||||
| DEFINITY |
$ | 484 | $ | 375 | ||||
| TechneLite |
2,687 | 2,941 | ||||||
| Xenon |
8 | 4 | ||||||
| Other |
10,977 | 13,205 | ||||||
|
|
|
|
|
|||||
| Total International revenues |
$ | 14,156 | $ | 16,525 | ||||
|
|
|
|
|
|||||
| Revenues |
$ | 74,823 | $ | 73,336 | ||||
|
|
|
|
|
|||||
Total revenues increased $1.5 million, or 2.0%, to $74.8 million in the three months ended March 31, 2015, as compared to $73.3 million in the three months ended March 31, 2014. U.S. segment revenue increased $3.9 million, or 6.8%, to $60.7 million in the same period, as compared to $56.8 million in the prior year. The U.S. segment increase is due to a $3.5 million increase in Xenon primarily as a result of higher selling prices and an increase of $3.2 million in DEFINITY as a result of higher unit volumes. Offsetting these increases was a decrease of $1.9 million in TechneLite primarily related to the effect of lower volumes partially offset by substantially higher pricing to Cardinal and a decrease in license revenue of approximately of $0.9 million over the prior quarter period as a result of a contract ending in December 2014 that had contained a license fee that was recognized on a straight-line basis over the term of the agreement.
The International segment revenues decreased $2.4 million, or 14.3%, to $14.2 million in the three months ended March 31, 2015, as compared to $16.5 million in the three months ended March 31, 2014. The decrease in the International segment over the prior year period is primarily due to $1.3 million unfavorable foreign exchange and $0.9 million in Cardiolite revenues as a result of competitive pressures.
Rebates and Allowances
Estimates for rebates and allowances represent our estimated obligations under contractual arrangements with third parties. Rebate accruals and allowances are recorded in the same period the related revenue is recognized, resulting in a reduction to revenue and the establishment of a liability which is included in accrued expenses. These rebates result from performance-based offers that are primarily based on attaining contractually specified sales volumes and growth, Medicaid rebate programs for certain products, administrative fees of group purchasing organizations, royalties and certain distributor related commissions. The calculation of the accrual for these rebates and allowances is based on an estimate of the third party’s buying patterns and the resulting applicable contractual rebate or commission rate(s) to be earned over a contractual period.
66
Table of Contents
An analysis of the amount of, and change in, reserves is summarized as follows:
| (dollars in thousands) |
Rebates | Allowances | Total | |||||||||
| Balance, as of January 1, 2014 |
$ | 1,739 | $ | 20 | $ | 1,759 | ||||||
| Current provisions relating to revenues in current year |
5,773 | 310 | 6,083 | |||||||||
| Adjustments relating to prior years’ estimate |
(18 | ) | — | (18 | ) | |||||||
| Payments/credits relating to revenues in current year |
(4,264 | ) | (284 | ) | (4,548 | ) | ||||||
| Payments/credits relating to revenues in prior years |
(1,066 | ) | (20 | ) | (1,086 | ) | ||||||
|
|
|
|
|
|
|
|||||||
| Balance, as of December 31, 2014 |
2,164 | 26 | 2,190 | |||||||||
| Current provisions relating to revenues in current year |
1,472 | 65 | 1,537 | |||||||||
| Adjustments relating to prior years’ estimate |
(36 | ) | (9 | ) | (45 | ) | ||||||
| Payments/credits relating to revenues in current year |
(461 | ) | (42 | ) | (503 | ) | ||||||
| Payments/credits relating to revenues in prior years |
(1,105 | ) | (17 | ) | (1,122 | ) | ||||||
|
|
|
|
|
|
|
|||||||
| Balance, as of March 31, 2015 |
$ | 2,034 | $ | 23 | $ | 2,057 | ||||||
|
|
|
|
|
|
|
|||||||
Accrued sales rebates were approximately $2.0 million and $2.2 million at March 31, 2015 and December 31, 2014, respectively. The $0.2 million decrease in accrued sales rebates is primarily due to expiration of a DEFINITY rebate program.
Costs of Goods Sold
Cost of goods sold consists of manufacturing, distribution, intangible asset amortization and other costs related to our commercial products. In addition, it includes the write-off of excess and obsolete inventory.
Cost of goods sold is summarized as follows:
| Three Months Ended March 31, |
||||||||
| (dollars in thousands) |
2015 | 2014 | ||||||
| United States |
$ | 26,862 | $ | 31,265 | ||||
| International |
12,192 | 12,010 | ||||||
|
|
|
|
|
|||||
| Total Cost of Goods Sold |
$ | 39,054 | $ | 43,275 | ||||
|
|
|
|
|
|||||
Total cost of goods sold decreased $4.2 million, or 9.8%, to $39.1 million in the three months ended March 31, 2015, as compared to $43.3 million in the three months ended March 31, 2014. U.S. segment cost of goods sold decreased approximately $4.4 million, or 14.1%, to $26.9 million in the three months ended March 31, 2015, as compared to $31.3 million in the prior year period. The decrease in the U.S. segment cost of goods sold was due to a decrease of $3.2 million in TechneLite cost of goods sold due to lower sales unit volumes. In addition, there was a $2.1 million decrease in Neurolite cost of goods sold primarily due to lower technology transfer costs in 2015 as JHS, our contract manufacturer for Neurolite, was granted FDA approval for the manufacture of Neurolite in January 2015 and therefore the Neurolite related technology transfer costs incurred in 2014 did not recur in 2015. Offsetting these decreases was a $1.5 million increase in DEFINITY cost of goods sold due to higher sales unit volumes and higher technology transfer costs.
For the three months ended March 31, 2015, the International segment cost of goods sold increased $0.2 million, or 1.5%, to $12.2 million, as compared to $12.0 million in the prior year period. Cost of goods sold in our International segment increased primarily due to a $1.3 million increase in manufacturing costs for certain products. Offsetting this increase was a favorable foreign exchange impact of $0.6 million and a $0.5 million decrease due to lower sales volume.
67
Table of Contents
Gross Profit
| Three Months Ended March 31, |
||||||||
| (dollars in thousands) |
2015 | 2014 | ||||||
| United States |
$ | 33,805 | $ | 25,546 | ||||
| International |
1,964 | 4,515 | ||||||
|
|
|
|
|
|||||
| Total Gross Profit |
$ | 35,769 | $ | 30,061 | ||||
|
|
|
|
|
|||||
Total gross profit increased $5.7 million, or 19.0%, to $35.8 million in the three months ended March 31, 2015, as compared to $30.1 million in the three months ended March 31, 2014. U.S. segment gross profit increased $8.3 million, or 32.3%, to $33.8 million, as compared to $25.5 million in the prior year period. Gross profit in the U.S. segment increased primarily due to a $2.9 million increase in Xenon due to higher selling prices, a $2.4 million increase in Neurolite gross profit due to higher selling prices and lower technology transfer costs, a $1.7 million increase in DEFINITY gross profit due to higher unit volumes and a $1.3 million increase in TechneLite gross profit primarily due to the combined effect of lower material costs associated with decreased volume and substantially higher selling prices.
For the three months ended March 31, 2015, the International segment gross profit decreased $2.6 million, or 56.5%, to $2.0 million, as compared to $4.5 million in the prior year period. Gross profit in our International segment decreased primarily due to a $1.3 million increase in manufacturing costs for certain products. This decrease is also driven by an unfavorable foreign exchange impact of $0.7 million and a $0.6 million decrease due to lower sales volume.
Sales and Marketing
| Three Months Ended March 31, |
||||||||
| (dollars in thousands) |
2015 | 2014 | ||||||
| United States |
$ | 8,068 | $ | 8,300 | ||||
| International |
1,004 | 1,198 | ||||||
|
|
|
|
|
|||||
| Total Sales and Marketing |
$ | 9,072 | $ | 9,498 | ||||
|
|
|
|
|
|||||
Sales and marketing expenses consist primarily of salaries and other related costs for personnel in field sales, marketing, business development and customer service functions. Other costs in sales and marketing expenses include the development and printing of advertising and promotional material, professional services, market research and sales meetings.
Total sales and marketing expenses decreased $0.4 million, or 4.5%, to $9.1 million in the three months ended March 31, 2015, as compared to $9.5 million in the three months ended March 31, 2014. In the U.S. segment, sales and marketing expense decreased $0.2 million, or 2.8%, to $8.1 million in the same period, as compared to $8.3 million in the prior year. The decrease was primarily due to the timing of sales force meetings and trainings.
For the three months ended March 31, 2015, sales and marketing expenses in the International segment decreased $0.2 million or 16.2%, to $1.0 million as compared to $1.2 million in the prior year period. This decrease was primarily due to lower headcount and a favorable foreign exchange impact.
68
Table of Contents
General and Administrative
| Three Months Ended March 31, |
||||||||
| (dollars in thousands) |
2015 | 2014 | ||||||
| United States |
$ | 8,740 | $ | 8,281 | ||||
| International |
383 | 571 | ||||||
|
|
|
|
|
|||||
| Total General and Administrative |
$ | 9,123 | $ | 8,852 | ||||
|
|
|
|
|
|||||
General and administrative expenses consist of salaries and other related costs for personnel in executive, finance, legal, information technology and human resource functions. Other costs included in general and administrative expenses are professional fees for information technology services, external legal fees, consulting and accounting services as well as bad debt expense, certain facility and insurance costs, including director and officer liability insurance.
Total general and administrative expenses general and administrative expenses increased $0.3 million, or 3.1%, to $9.1 million in the three months ended March 31, 2015, as compared to $8.9 million in the three months ended March 31, 2015. U.S. segment general and administrative expenses increased $0.5 million, or 5.5%, to $8.7 million, as compared to $8.3 million in the prior year period. The increase was primarily due to the write-off of deferred offering costs during the first quarter of 2015 and higher employee related expenses, offset in part by lower legal fees.
For the three months ended March 31, 2015, general and administrative expenses in the International segment decreased $0.2 million or 32.9%, to $0.4 million as compared to $0.6 million in the prior year period. This decrease was primarily due to lower headcount and a favorable foreign exchange impact.
Research and Development
| Three Months Ended March 31, |
||||||||
| (dollars in thousands) |
2015 | 2014 | ||||||
| United States |
$ | 6,015 | $ | 3,114 | ||||
| International |
181 | 108 | ||||||
|
|
|
|
|
|||||
| Total Research and Development |
$ | 6,196 | $ | 3,222 | ||||
|
|
|
|
|
|||||
Research and development expenses relate primarily to the development of new products to add to our portfolio and costs related to its medical affairs, medical information and regulatory functions. We do not allocate research and development expenses incurred in the United States to our International segment.
Total research and development expense increased $3.0 million, or 92.3%, to $6.2 million for the three months ended March 31, 2015, as compared to $3.2 million in the three months ended March 31, 2014. U.S. segment research and development expense increased approximately $2.9 million, or 93.2%, to $6.0 million, as compared to $3.1 million in the prior year period. Research and development expense increase in the U.S. segment was driven by an increase of $3.4 million of depreciation expense due to the scheduled decommissioning of certain long-lived assets associated with R&D operations, partially offset by decreases in external professional services.
For the three months ended March 31, 2015, research and development expenses in the International segment increased $0.1 million or 67.6%, to $0.2 million as compared to $0.1 million in the prior year period. The increase in research and development expenses for the International segment was primarily due to increased regulatory costs.
69
Table of Contents
Other Expense, Net
| Three Months Ended March 31, |
||||||||
| (dollars in thousands) |
2015 | 2014 | ||||||
| Interest expense |
$ | (10,630 | ) | $ | (10,560 | ) | ||
| Interest income |
7 | 8 | ||||||
| Other expense, net |
(383 | ) | (414 | ) | ||||
|
|
|
|
|
|||||
| Total other expense, net |
$ | (11,006 | ) | $ | (10,966 | ) | ||
|
|
|
|
|
|||||
Interest Expense
For the three months ended March 31, 2015, compared to the same period in 2014, interest expense increased by $0.1 million as a result of result of increased amortization related to deferred financing costs.
Interest Income
For the three months ended March 31, 2015, compared to the same period in 2014, interest income remained consistent.
Other Expense, net
For the three months ended March 31, 2015, compared to the same period in 2014, other expense remained consistent.
Benefit for Income Taxes
| Three Months Ended March 31, |
||||||||
| (dollars in thousands) |
2015 | 2014 | ||||||
| Benefit for income taxes |
$ | (3 | ) | $ | (1,192 | ) | ||
For the three months ended March 31, 2015 and 2014, our effective tax rate was (0.8)% and 48.1%, respectively. The $1.2 million decrease in tax benefit for the three months ended March 31, 2015, as compared to the same period in 2014, was impacted primarily by settlements of state tax audits. Considering our history of losses, we continue to maintain a valuation allowance against substantially all of our net deferred tax assets. Our benefit for income taxes results primarily from reversals of uncertain tax positions as statutes lapse or are settled during the year, offset by taxes due in certain foreign jurisdictions where we generate taxable income, as well as interest and penalties associated with uncertain tax positions. The following items had the most significant impact on the difference between our statutory U.S. federal income tax rate of 35% and our effective tax rate during the years ended:
March 31, 2015
| • | A $0.7 million decrease in our uncertain tax positions relating to a state tax settlement. |
| • | A $0.7 million increase in our uncertain tax positions relating to state tax nexus. |
March 31, 2014
| • | A $1.1 million decrease in our uncertain tax positions relating to a state tax settlement and state tax nexus and transfer pricing matters. |
70
Table of Contents
Years Ended December 31, 2014, 2013 and 2012
| Year ended December 31, |
2014 compared to 2013 |
2013 compared to 2012 |
||||||||||||||||||||||||||
| 2014 | 2013 | 2012 | Change $ | Change % | Change $ | Change % | ||||||||||||||||||||||
| (dollars in thousands) | ||||||||||||||||||||||||||||
| Revenues |
$ | 301,600 | $ | 283,672 | $ | 288,105 | $ | 17,928 | 6.3 | % | $ | (4,433 | ) | (1.5 | )% | |||||||||||||
|
|
|
|
|
|
|
|
|
|
|
|||||||||||||||||||
| Cost of goods sold |
176,081 | 206,311 | 211,049 | (30,230 | ) | (14.7 | ) | (4,738 | ) | (2.2 | ) | |||||||||||||||||
| Loss on firm purchase commitment |
— | — | 1,859 | — | — | (1,859 | ) | (100.0 | ) | |||||||||||||||||||
|
|
|
|
|
|
|
|
|
|
|
|||||||||||||||||||
| Total cost of goods sold |
176,081 | 206,311 | 212,908 | (30,230 | ) | (14.7 | ) | (6,597 | ) | (3.1 | ) | |||||||||||||||||
|
|
|
|
|
|
|
|
|
|
|
|||||||||||||||||||
| Gross profit |
125,519 | 77,361 | 75,197 | 48,158 | 62.3 | 2,164 | 2.9 | |||||||||||||||||||||
|
|
|
|
|
|
|
|
|
|
|
|||||||||||||||||||
| Operating expenses |
||||||||||||||||||||||||||||
| Sales and marketing expenses |
35,116 | 35,227 | 37,437 | (111 | ) | (0.3 | ) | (2,210 | ) | (5.9 | ) | |||||||||||||||||
| General and administrative expenses |
37,313 | 33,036 | 32,520 | 4,277 | 12.9 | 516 | 1.6 | |||||||||||||||||||||
| Research and development expenses |
13,673 | 30,459 | 40,604 | (16,786 | ) | (55.1 | ) | (10,145 | ) | (25.0 | ) | |||||||||||||||||
| Proceeds from manufacturer |
— | (8,876 | ) | (34,614 | ) | 8,876 | (100.0 | ) | 25,738 | (74.4 | ) | |||||||||||||||||
| Impairment on land |
— | 6,406 | — | (6,406 | ) | (100.0 | ) | 6,406 | 100.0 | |||||||||||||||||||
|
|
|
|
|
|
|
|
|
|
|
|||||||||||||||||||
| Total operating expenses |
86,102 | 96,252 | 75,947 | (10,150 | ) | (10.5 | ) | 20,305 | 26.7 | |||||||||||||||||||
|
|
|
|
|
|
|
|
|
|
|
|||||||||||||||||||
| Operating income (loss) |
39,417 | (18,891 | ) | (750 | ) | 58,308 | 308.7 | (18,141 | ) | 2,418.8 | ||||||||||||||||||
| Interest expense |
(42,288 | ) | (42,915 | ) | (42,014 | ) | 627 | (1.5 | ) | (901 | ) | 2.1 | ||||||||||||||||
| Interest income |
27 | 104 | 252 | (77 | ) | (74.0 | ) | (148 | ) | (58.7 | ) | |||||||||||||||||
| Other income (expense), net |
478 | 1,161 | (44 | ) | (683 | ) | (58.8 | ) | 1,205 | 2,738.6 | ||||||||||||||||||
|
|
|
|
|
|
|
|
|
|
|
|||||||||||||||||||
| Loss before income taxes |
(2,366 | ) | (60,541 | ) | (42,556 | ) | 58,175 | (96.1 | ) | (17,985 | ) | 42.3 | ||||||||||||||||
| Provision (benefit) for income taxes |
1,195 | 1,014 | (555 | ) | 181 | 17.9 | 1,569 | 282.7 | ||||||||||||||||||||
|
|
|
|
|
|
|
|
|
|
|
|||||||||||||||||||
| Net loss |
(3,561 | ) | (61,555 | ) | (42,001 | ) | 57,994 | (94.2 | ) | (19,554 | ) | 46.6 | ||||||||||||||||
|
|
|
|
|
|
|
|
|
|
|
|||||||||||||||||||
| Foreign currency translation |
(1,236 | ) | (1,729 | ) | 964 | 493 | (28.5 | ) | (2,693 | ) | (279.4 | ) | ||||||||||||||||
|
|
|
|
|
|
|
|
|
|
|
|||||||||||||||||||
| Total comprehensive loss |
$ | (4,797 | ) | $ | (63,284 | ) | $ | (41,037 | ) | $ | 58,487 | (92.4 | )% | $ | (22,247 | ) | 54.2 | % | ||||||||||
|
|
|
|
|
|
|
|
|
|
|
|||||||||||||||||||
The following have been included in our results as of and for the year ended December 31, 2014:
| • | increased revenues and segment penetration for DEFINITY in the suboptimal echocardiogram segment as a result of our sales efforts and sustained availability of product supply; |
| • | increased revenues for Xenon, mainly the result of higher selling prices, offset in part by mix shift among certain sales channels; |
| • | increased revenues resulting from the return of Neurolite product supply in the third quarter of 2013; |
| • | decreased revenues from our Cardiolite products resulting from continued generic competition; |
| • | the impact of certain cost savings actions taken in March 2013 as we finish implementing the strategic shift in how we fund our research and development, or R&D, programs; |
| • | lower material costs incurred for the production of TechneLite; |
| • | lower international revenues across product lines because of unfavorable foreign exchange and competitive pressures; and |
| • | the write-off of deferred offering costs. |
71
Table of Contents
Comparison of the Years Ended December 31, 2014, 2013, and 2012
Revenues
Revenues are summarized as follows:
| Year ended December 31, |
2014 compared to 2013 |
2013 compared to 2012 |
||||||||||||||||||||||||||
| 2014 | 2013 | 2012 | Change $ | Change % | Change $ | Change % | ||||||||||||||||||||||
| (dollars in thousands) | ||||||||||||||||||||||||||||
| United States |
||||||||||||||||||||||||||||
| DEFINITY |
$ | 93,848 | $ | 76,539 | $ | 50,377 | $ | 17,309 | 22.6 | % | $ | 26,162 | 51.9 | % | ||||||||||||||
| TechneLite |
82,321 | 80,609 | 101,049 | 1,712 | 2.1 | (20,440 | ) | (20.2 | ) | |||||||||||||||||||
| Xenon |
36,542 | 32,086 | 30,048 | 4,456 | 13.9 | 2,038 | 6.8 | |||||||||||||||||||||
| Cardiolite |
3,268 | 8,612 | 13,851 | (5,344 | ) | (62.1 | ) | (5,239 | ) | (37.8 | ) | |||||||||||||||||
| Other |
20,541 | 15,793 | 14,686 | 4,748 | 30.1 | 1,107 | 7.5 | |||||||||||||||||||||
|
|
|
|
|
|
|
|
|
|
|
|||||||||||||||||||
| Total U.S. revenues |
$ | 236,520 | $ | 213,639 | $ | 210,011 | $ | 22,881 | 10.7 | % | $ | 3,628 | 1.7 | % | ||||||||||||||
|
|
|
|
|
|
|
|
|
|
|
|||||||||||||||||||
| International |
||||||||||||||||||||||||||||
| DEFINITY |
$ | 1,912 | $ | 1,555 | $ | 1,054 | $ | 357 | 23.0 | % | $ | 501 | 47.5 | % | ||||||||||||||
| TechneLite |
11,267 | 11,586 | 13,200 | (319 | ) | (2.8 | ) | (1,614 | ) | (12.2 | ) | |||||||||||||||||
| Xenon |
7 | 39 | 27 | (32 | ) | (82.1 | ) | 12 | 44.4 | |||||||||||||||||||
| Cardiolite |
15,555 | 17,525 | 21,144 | (1,970 | ) | (11.2 | ) | (3,619 | ) | (17.1 | ) | |||||||||||||||||
| Other |
36,339 | 39,328 | 42,669 | (2,989 | ) | (7.6 | ) | (3,341 | ) | (7.8 | ) | |||||||||||||||||
|
|
|
|
|
|
|
|
|
|
|
|||||||||||||||||||
| Total International revenues |
$ | 65,080 | $ | 70,033 | $ | 78,094 | $ | (4,953 | ) | (7.1 | ) | $ | (8,061 | ) | (10.3 | ) | ||||||||||||
|
|
|
|
|
|
|
|
|
|
|
|||||||||||||||||||
| Revenues |
$ | 301,600 | $ | 283,672 | $ | 288,105 | $ | 17,928 | 6.3 | % | $ | (4,433 | ) | (1.5 | )% | |||||||||||||
|
|
|
|
|
|
|
|
|
|
|
|||||||||||||||||||
2014 v. 2013
Total revenues increased $17.9 million, or 6.3%, to $301.6 million in the year ended December 31, 2014, as compared to $283.7 million in the year ended December 31, 2013. U.S. segment revenue increased $22.9 million, or 10.7%, to $236.5 million in the same period, as compared to $213.6 million in the prior year. The U.S. segment increase is primarily due to a $17.3 million increase in DEFINITY as a result of higher unit volumes, a $6.8 million increase in Neurolite as the product returned to market in September 2013, a $4.5 million increase in Xenon primarily due to higher selling prices, a $1.9 million increase in Thallium driven by higher unit volumes with significant customer and $1.7 million TechneLite increase as a result of higher unit volumes. Offsetting these increases was a decrease in Cardiolite revenues of $5.3 million over the prior year period as a result of a contract with a significant customer that reduced unit pricing and volume commitments and a $3.4 million decrease in Quadramet revenues due to lower unit volume as a result of increased competitive pressures since we transitioned to being the direct manufacturer at the end of 2013.
International segment revenues decreased $5.0 million, or 7.1%, to $65.1 million in the year ended December 31, 2014, as compared to $70.0 million in the year ended December 31, 2013. The decrease in the International segment revenue during the year ended December 31, 2014, as compared to the prior year period, is primarily due to $3.5 million unfavorable foreign exchange, combined with a $2.3 million decrease in third party product revenues and a $1.1 million decrease in Cardiolite revenues as a result of competitive pressures in our international markets. Offsetting these decreases were a $1.0 million increase in Neurolite revenues driven by the return of finished product to the market, $0.4 million increase in TechneLite revenues primarily in the Latin America market and $0.5 million increase in DEFINITY revenues as a result of sales volume growth in certain international markets.
72
Table of Contents
2013 v. 2012
Revenues decreased $4.4 million, or 1.5%, to $283.7 million in the year ended December 31, 2013, as compared to $288.1 million in the year ended December 31, 2012. U.S. segment revenue increased $3.6 million, or 1.7%, to $213.6 million in the same period, as compared to $210.0 million in the prior year. The increase of $3.6 million in U.S. segment revenue during the year ended December 31, 2013, as compared to the prior year period is primarily driven by a $26.2 million increase in DEFINITY revenue given product supply shortages that impacted the prior year period. Offsetting this increase was a decrease in TechneLite revenues of $20.4 million over the prior year period as a result of: (i) a contract that took effect at the beginning of 2013 with a significant customer that reduced unit pricing, resulting in lower revenues of $16.9 million as compared to the prior year period; (ii) a decline in a significant customer’s market share which lowered its share of product purchases from us and decreased revenues by $5.7 million; and (iii) loss of a customer resulting in lower revenue of $1.3 million. Offsetting these decreases in TechneLite revenues was a higher share volume with a group of customers resulting in a $3.3 million increase in sales over the prior year period. Additionally, Cardiolite revenues were $5.2 million lower than the prior year period as a result of a contract with a significant customer that reduced unit pricing and volume commitments.
The International segment revenues decreased $8.1 million, or 10.3%, to $70.0 million in the year ended December 31, 2013, as compared to $78.1 million in the year ended December 31, 2012. The decrease of $8.1 million in the International segment revenue during the year ended December 31, 2013, as compared to the prior year period, is due in part to a $3.3 million decrease in other revenue. This decrease is the result of a new contract with an existing customer, which altered the timing of shipments and reflected a lower selling price, as well as an unfavorable foreign exchange impact in the amount $1.9 million for the year ended December 31, 2013 versus the prior year. In addition, Cardiolite sales decreased by $3.6 million mainly due to competitive pressures in international markets, as well as $0.7 million in unfavorable foreign exchange. TechneLite sales decreased by $1.6 million due to reduced selling prices in Canada, lower sales volume in the Latin America and Asia Pacific markets as well as $0.3 million in unfavorable foreign exchange. Overall, total unfavorable foreign exchange totaled $2.9 million when compared to the prior period.
Rebates and Allowances
Estimates for rebates and allowances represent our estimated obligations under contractual arrangements with third parties. Rebate accruals and allowances are recorded in the same period the related revenue is recognized, resulting in a reduction to revenue and the establishment of a liability which is included in accrued expenses. These rebates result from performance-based offers that are primarily based on attaining contractually specified sales volumes and growth, Medicaid rebate programs for certain products, administrative fees of group purchasing organizations, royalties and certain distributor related commissions. The calculation of the accrual for these rebates and allowances is based on an estimate of the third party’s buying patterns and the resulting applicable contractual rebate or commission rate(s) to be earned over a contractual period.
73
Table of Contents
An analysis of the amount of, and change in, reserves is summarized as follows:
| Rebates | Allowances | Total | ||||||||||
| (dollars in thousands) | ||||||||||||
| Balance, as of January 1, 2012 |
$ | 1,356 | $ | 33 | $ | 1,389 | ||||||
| Current provisions relating to revenues in current year |
3,224 | 291 | 3,515 | |||||||||
| Adjustments relating to prior years’ estimate |
(145 | ) | — | (145 | ) | |||||||
| Payments/credits relating to revenues in current year |
(2,232 | ) | (223 | ) | (2,455 | ) | ||||||
| Payments/credits relating to revenues in prior years |
(661 | ) | (35 | ) | (696 | ) | ||||||
|
|
|
|
|
|
|
|||||||
| Balance, as of December 31, 2012 |
1,542 | 66 | 1,608 | |||||||||
| Current provisions relating to revenues in current year |
4,696 | 243 | 4,939 | |||||||||
| Adjustments relating to prior years’ estimate |
(21 | ) | — | (21 | ) | |||||||
| Payments/credits relating to revenues in current year |
(3,438 | ) | (220 | ) | (3,658 | ) | ||||||
| Payments/credits relating to revenues in prior years |
(1,040 | ) | (69 | ) | (1,109 | ) | ||||||
|
|
|
|
|
|
|
|||||||
| Balance, as of December 31, 2013 |
1,739 | 20 | 1,759 | |||||||||
| Current provisions relating to revenues in current year |
5.773 | 310 | 6,083 | |||||||||
| Adjustments relating to prior years’ estimate |
(18 | ) | — | (18 | ) | |||||||
| Payments/credits relating to revenues in current year |
(4,264 | ) | (284 | ) | (4,548 | ) | ||||||
| Payments/credits relating to revenues in prior years |
(1,066 | ) | (20 | ) | (1,086 | ) | ||||||
|
|
|
|
|
|
|
|||||||
| Balance, as of December 31, 2014 |
$ | 2,164 | $ | 26 | $ | 2,190 | ||||||
|
|
|
|
|
|
|
|||||||
Sales rebates accrued were approximately $2.2 million and $1.7 million at December 31, 2014 and 2013, respectively. The $0.5 million increase in accrued sales rebates is primarily associated with a new rebate program associated with the Quadramet product as well as royalties incurred associated with the net revenues generated by Quadramet. In addition, accrued sales rebates increased due to the timing of certain rebates.
Cost of Goods Sold
Cost of goods sold consists of manufacturing, distribution, intangible asset amortization and other costs related to our commercial products. In addition, it includes the write-off of excess and obsolete inventory.
Cost of goods sold is summarized as follows:
| Year ended December 31, |
2014 compared to 2013 |
2013 compared to 2012 |
||||||||||||||||||||||||||
| 2014 | 2013 | 2012 | Change $ |
Change % |
Change $ |
Change % |
||||||||||||||||||||||
| (dollars in thousands) | ||||||||||||||||||||||||||||
| United States |
$ | 127,237 | $ | 149,018 | $ | 156,098 | $ | (21,781 | ) | (14.6 | )% | $ | (7,080 | ) | (4.5 | )% | ||||||||||||
| International |
48,844 | 57,293 | 56,810 | (8,449 | ) | (14.7 | ) | 483 | 0.9 | |||||||||||||||||||
|
|
|
|
|
|
|
|
|
|
|
|||||||||||||||||||
| Total Cost of Goods Sold |
$ | 176,081 | $ | 206,311 | $ | 212,908 | $ | (30,230 | ) | (14.7 | )% | $ | (6,597 | ) | (3.1 | )% | ||||||||||||
|
|
|
|
|
|
|
|
|
|
|
|||||||||||||||||||
2014 v. 2013
Total cost of goods sold decreased $30.2 million, or 14.7%, to $176.1 million in the year ended December 31, 2014, as compared to $206.3 million in the year ended December 31, 2013. U.S. segment cost of goods sold decreased approximately $21.8 million, or 14.6%, to $127.2 million in same period, as compared to $149.0 million in the prior year period. The decrease in the U.S. segment cost of goods sold for the year ended December 31, 2014 over the prior year period is primarily due to a $22.0 million decrease in Cardiolite cost of goods as a result of a $15.4 million write-down in the Cardiolite trademark intangible asset in the fourth quarter of 2013 and lower amortization expense in 2014 as compared to 2013 as a result of the impairment. In addition, there was a $2.8 million decrease in TechneLite cost of goods sold primarily due to lower material costs for
74
Table of Contents
2014. We also incurred $2.1 million of lower write-off expense as compared to the prior year related to the Ablavar product line. Offsetting these decreases was a $5.9 million increase in DEFINITY and Thallium cost of goods sold due to higher sales unit volumes and higher DEFINITY technology transfer costs.
For the year ended December 31, 2014, the International segment cost of goods sold decreased $8.5 million, or 14.7%, to $48.8 million, as compared to $57.3 million in the prior year period. The decrease in the International segment cost of goods sold during the year ended December 31, 2014, as compared to the prior year period, is primarily due to a $4.5 million decrease as a result of reduced costs associated with operating efficiencies as well as lower cost of goods sold for certain products. We also incurred an impairment charge of $1.7 million in the prior year relating to customer relationship intangible assets in Europe, lower amortization expense in the current year and incurred a favorable foreign exchange impact of $1.7 million in the current year.
2013 v. 2012
Total cost of goods sold decreased $6.6 million, or 3.1%, to $206.3 million in the year ended December 31, 2013, as compared to $212.9 million in the year ended December 31, 2012. U.S. segment cost of goods sold decreased approximately $7.1 million, or 4.5%, to $149.0 million in same period, as compared to $156.1 million in the prior year period. The decrease in the U.S. segment cost of goods sold for the year ended December 31, 2013 over the prior year period is primarily due to $10.9 million of lower write-off expense as compared to the prior year related to the Ablavar product line. We also incurred lower cost of goods sold of $9.3 million for TechneLite over the prior period primarily due to lower material cost and lower unit volumes. Technology transfer costs decreased by $4.0 million related to JHS becoming an approved manufacturing site for DEFINITY by the FDA in the first quarter of 2013. Lower sales volume of Cardiolite contributed to lower cost of goods sold by $2.6 million. Offsetting these decreases was an increase in DEFINITY cost of goods sold of approximately $4.7 million primarily driven by an increase in units sold, an impairment charge of $15.4 million related to the Cardiolite trademark intangible asset and an increase of $2.1 million related to Neurolite technology transfer.
For the year ended December 31, 2013, the International segment cost of goods sold increased $0.5 million, or 0.9%, to $57.3 million, as compared to $56.8 million in the prior year period. The increase in the International segment was primarily due to an impairment charge on customer relationship intangible assets in Europe totaling $1.7 million, which was partially offset by favorable foreign exchange impact of $1.0 million, lower volume and lower cost of goods sold for certain products.
Gross Profit
| Year ended December 31, |
2014 compared to 2013 |
2013 compared to 2012 |
||||||||||||||||||||||||||
| 2014 | 2013 | 2012 | Change $ |
Change % |
Change $ |
Change % |
||||||||||||||||||||||
| (dollars in thousands) | ||||||||||||||||||||||||||||
| United States |
$ | 109,283 | $ | 64,621 | $ | 53,913 | $ | 44,662 | 69.1 | % | $ | 10,708 | 19.9 | % | ||||||||||||||
| International |
16,236 | 12,740 | 21,284 | 3,496 | 27.4 | (8,544 | ) | (40.1 | ) | |||||||||||||||||||
|
|
|
|
|
|
|
|
|
|
|
|||||||||||||||||||
| Total Gross Profit |
$ | 125,519 | $ | 77,361 | $ | 75,197 | $ | 48,158 | 62.3 | % | $ | 2,164 | 2.9 | % | ||||||||||||||
|
|
|
|
|
|
|
|
|
|
|
|||||||||||||||||||
2014 v. 2013
Total gross profit increased $48.2 million, or 62.3%, to $125.5 million, or 41.6% of revenues in the year ended December 31, 2014, as compared to $77.4 million or 27.3% of revenues in the year ended December 31, 2013. U.S. segment gross profit increased $44.7 million, or 69.1%, to $109.3 million, as compared to $64.6 million in the prior year period. The increase in the U.S. segment gross profit for the year ended December 31, 2014 over the prior year period is primarily due to a $16.6 million increase in Cardiolite gross profit due to a write-down in the Cardiolite trademark intangible asset in the fourth quarter of 2013 and a $25.1 million aggregate increase in DEFINITY, TechneLite and Neurolite gross profit due to higher unit volumes and
75
Table of Contents
lower material costs for TechneLite. In addition, Xenon gross profit increased by $4.1 million due to higher selling price. Offsetting these increases was a $3.8 million decrease in Quadramet gross profit due to less unit volume since we transitioned as the direct manufacturer at the end of 2013.
For the year ended December 31, 2014, the International segment gross profit increased $3.5 million, or 27.4%, to $16.2 million, as compared to $12.7 million in the prior year period. The increase in the International segment gross profit during the year ended December 31, 2014, as compared to the prior year period is primarily due to a $1.7 million impairment charge on customer relationship intangible assets in the prior year and lower amortization as compared to the prior year. The increase is also driven by reduced costs associated with increased operating efficiencies, the return of Neurolite finished product to the market and lower volume of more expensive substitute products sold in the current period as a result of the return of supply. These increases were partially offset by an unfavorable foreign exchange impact of $1.8 million.
2013 v. 2012
Total gross profit increased $2.2 million, or 2.9%, to $77.4 million in the year ended December 31, 2013, as compared to $75.2 million in the year ended December 31, 2012. U.S. segment gross profit increased $10.7 million, or 19.9%, to $64.6 million, as compared to $53.9 million in the prior year period. The increase in the U.S. segment gross profit for the year ended December 31, 2013 over the prior year period is primarily due to an ongoing shift in mix among products, specifically a higher DEFINITY gross profit of approximately $25.3 million primarily due to an increase in sales volume and $4.0 million due to lower technology transfer cost related to JHS becoming an approved manufacturing site for DEFINITY by the FDA. In addition, gross profit improved due to a $10.9 million decrease in write-offs related to Ablavar. Offsetting these increases was a decrease in TechneLite gross margin of approximately $11.1 million over the prior period driven primarily by lower selling price and lower gross profit on Cardiolite due to an impairment charge of $15.4 million related to the Cardiolite trademark intangible asset and lower selling prices.
For the year ended December 31, 2013, the International segment gross profit decreased $8.5 million, or 40.1%, to $12.7 million, as compared to $21.3 million in the prior year period. Gross profit in our International segment decreased due to a new contract with an existing customer, which altered the timing of shipments and reflected a lower selling price, unfavorable changes in foreign exchange rates, lower sales due to competitive pressures in all markets and a $1.7 million impairment charge on customer relationship intangible assets.
Sales and Marketing
| Year ended December 31, |
2014 compared to 2013 |
2013 compared to 2012 |
||||||||||||||||||||||||||
| 2014 | 2013 | 2012 | Change $ |
Change % |
Change $ |
Change % |
||||||||||||||||||||||
| (dollars in thousands) | ||||||||||||||||||||||||||||
| United States |
$ | 30,815 | $ | 31,024 | $ | 33,638 | $ | (209 | ) | (0.7 | )% | $ | (2,614 | ) | (7.8 | )% | ||||||||||||
| International |
4,301 | 4,203 | 3,799 | 98 | 2.3 | 404 | 10.6 | |||||||||||||||||||||
|
|
|
|
|
|
|
|
|
|
|
|||||||||||||||||||
| Total Sales and Marketing |
$ | 35,116 | $ | 35,227 | $ | 37,437 | $ | (111 | ) | (0.3 | )% | $ | (2,210 | ) | (5.9 | )% | ||||||||||||
|
|
|
|
|
|
|
|
|
|
|
|||||||||||||||||||
Sales and marketing expenses consist primarily of salaries and other related costs for personnel in field sales, marketing, business development and customer service functions. Other costs in sales and marketing expenses include the development and printing of advertising and promotional material, professional services, market research and sales meetings.
2014 v. 2013
Total sales and marketing expenses decreased $0.1 million, or 0.3%, to $35.1 million in the year ended December 31, 2014, as compared to $35.2 million in the year ended December 31, 2013. In the U.S. segment,
76
Table of Contents
sales and marketing expense decreased $0.2 million, or 0.7%, to $30.8 million in the same period, as compared to $31.0 million in the prior year. The decrease in the U.S. segment sales and marketing expenses for the year ended December 31, 2014 over the prior year period is primarily due to decreases in headcount and employee related expenses. Offsetting these decreases are increases in support of DEFINITY including marketing, research and travel expenses. As a percentage of total U.S. revenues, sales and marketing expenses in the U.S. segment were 13.0%, 14.5% and 16.0% for the years ended December 31, 2014, 2013 and 2012, respectively.
For the year ended December 31, 2014, the International segment sales and marketing expense increased $0.1 million or 2.3%, to $4.3 million as compared to $4.2 million in the prior year period. The increase in the International segment sales and marketing expenses for the year ended December 31, 2014 over the prior year period is primarily due to increased external advertising and marketing expenses and external professional services which were offset by a favorable foreign exchange impact. As a percentage of total International revenues, sales and marketing expenses in the International segment were 6.6%, 6.0% and 4.9% for the years ended December 31, 2014, 2013 and 2012, respectively.
2013 v. 2012
Total sales and marketing expenses decreased $2.2 million, or 5.9%, to $35.2 million in the year ended December 31, 2013, as compared to $37.4 million in the year ended December 31, 2012. In the U.S. segment, sales and marketing expense decreased $2.6 million, or 7.8%, to $31.0 million in the same period, as compared to $33.6 million in the prior year. The decrease in the U.S. segment was primarily due to lower headcount and employee related expenses, including contractors, due to a reduction in workforce and reduced marketing expenses related to Ablavar. Offsetting the decreases were increases in variable compensation and marketing expenses related to DEFINITY. As a percentage of total U.S. revenues, sales and marketing expenses in the U.S. segment were 14.5% and16.0% for the years ended December 31, 2013 and 2012, respectively.
For the year ended December 31, 2013, the International segment sales and marketing expense increased $0.4 million or 10.6%, to $4.2 million as compared to $3.8 million in the prior year period due to increased headcount and higher variable compensation. Offsetting the increases was a decrease in professional services. As a percentage of total International revenues, sales and marketing expenses in the International segment were 6.0% and 4.9% for the years ended December 31, 2013 and 2012, respectively.
General and Administrative
| Year ended December 31, |
2014 compared to 2013 |
2013 compared to 2012 |
||||||||||||||||||||||||||
| 2014 | 2013 | 2012 | Change $ |
Change % |
Change $ |
Change % |
||||||||||||||||||||||
| (dollars in thousands) | ||||||||||||||||||||||||||||
| United States |
$ | 35,001 | $ | 30,742 | $ | 30,192 | $ | 4,259 | 13.9 | % | $ | 550 | 1.8 | % | ||||||||||||||
| International |
2,312 | 2,294 | 2,328 | 18 | 0.8 | (34 | ) | (1.5 | ) | |||||||||||||||||||
|
|
|
|
|
|
|
|
|
|
|
|||||||||||||||||||
| Total General and Administrative |
$ | 37,313 | $ | 33,036 | $ | 32,520 | $ | 4,277 | 12.9 | % | $ | 516 | 1.6 | % | ||||||||||||||
|
|
|
|
|
|
|
|
|
|
|
|||||||||||||||||||
General and administrative expenses consist of salaries and other related costs for personnel in executive, finance, legal, information technology and human resource functions. Other costs included in general and administrative expenses are professional fees for information technology services, external legal fees, consulting and accounting services as well as bad debt expense, certain facility and insurance costs, including director and officer liability insurance.
2014 v. 2013
Total general and administrative expenses increased approximately $4.3 million, or 12.9%, to $37.3 million in the year ended December 31, 2014, as compared to $33.0 million in the year ended December 31, 2013. In the
77
Table of Contents
U.S. segment, general and administrative expenses increased $4.3 million, or 13.9%, to $35.0 million, as compared to $30.7 million in the prior year period. The increase was primarily due to the write-off of deferred offering costs during the third quarter of 2014 and employee related expenses. Offsetting these increases were non-recurrence of severance expense related to the reduction in force in the first quarter of 2013, decrease in depreciation expense and cost savings achieved through the renegotiation of certain information technology related contracts.
For the year ended December 31, 2014, general and administrative expenses in the International segment remained relatively consistent as compared to the prior year period.
2013 v. 2012
Total general and administrative expenses increased approximately $0.5 million, or 1.6%, to $33.0 million in the year ended December 31, 2013, as compared to $32.5 million in the year ended December 31, 2012. In the U.S. segment, general and administrative expenses increased $0.5 million, or 1.8%, to $30.7 million, as compared to $30.2 million in the prior year period. The increase was primarily due to additional variable compensation in the current period and severance expense from a reduction in workforce in the first quarter of 2013. Offsetting these increases were cost savings over the prior period through the renegotiation of certain information technology related contracts as support provided by certain vendors was reduced and reduced legal expense. In addition, compensation for performance-based awards was lower in the current period due to adjustments made based on the probability of achievement.
For the year ended December 31, 2013, general and administrative expenses in the International segment was consistent with the prior year period at $2.3 million as lower salaries and employee related expenses, which were driven by lower headcount, were offset by increased bad debt expense and increased recruiting fees.
Research and Development
| Year ended December 31, |
2014 compared to 2013 |
2013 compared to 2012 |
||||||||||||||||||||||||||
| 2014 | 2013 | 2012 | Change $ |
Change % |
Change $ |
Change % |
||||||||||||||||||||||
| (dollars in thousands) | ||||||||||||||||||||||||||||
| United States |
$ | 13,252 | $ | 30,138 | $ | 40,457 | $ | (16,886 | ) | (56.0 | )% | $ | (10,319 | ) | (25.5 | )% | ||||||||||||
| International |
421 | 321 | 147 | 100 | 31.2 | 174 | 118.4 | |||||||||||||||||||||
|
|
|
|
|
|
|
|
|
|
|
|||||||||||||||||||
| Total Research and Development |
$ | 13,673 | $ | 30,459 | $ | 40,604 | $ | (16,786 | ) | (55.1 | )% | $ | (10,145 | ) | (25.0 | )% | ||||||||||||
|
|
|
|
|
|
|
|
|
|
|
|||||||||||||||||||
Research and development expenses relate primarily to the development of new products to add to our portfolio and costs related to its medical affairs, medical information and regulatory functions. We do not allocate research and development expenses incurred in the United States to our International segment.
2014 v. 2013
Total research and development expense decreased $16.8 million, or 55.1%, to $13.7 million for the year ended December 31, 2014, as compared to $30.5 million in the year ended December 31, 2013. In the U.S. segment, research and development expense decreased approximately $16.9 million, or 56.0%, to $13.3 million, as compared to $30.1 million in the prior year period. The decrease in the U.S. segment research and development expenses is primarily due to a decline in external expense associated with Phase 3 clinical trial for flurpiridaz F 18 as we completed patient enrollment during the third quarter of 2013. In addition, there were decreases in employee related costs as a result of the reduction in workforce from a strategic shift to use fewer internal resources and lower external expense as we expect to seek one or more strategic partners to assist in the
78
Table of Contents
future development and commercialization of our agents in development. Offsetting this decrease was a $0.9 million increase in depreciation expense as we announced in November 2014 our plans to decommission certain long-lived assets associated with our research and development operations in the United States. We expect the decommissioning to begin in the second half of 2015. As a result, we revised our estimates of the remaining useful lives of the affected long-lived assets to seven months, which increased depreciation expense by $1.2 million which is included in research and development expenses. Future decommissioning costs are expected to impact our general and administrative expenses through 2015.
For the year ended December 31, 2014, the International segment research and development expenses increased approximately $0.1 million, or 31.2%, to $0.4 million, as compared to $0.3 million in the prior year period. The increase in research and development expenses for the International segment was primarily due to depreciation expense since we shifted the primary utilization of certain assets to support research and development functions.
2013 v. 2012
Total research and development expense decreased $10.1 million, or 25.0%, to $30.5 million for the year ended December 31, 2013, as compared to $40.6 million in the year ended December 31, 2012. In the U.S. segment, research and development expense decreased approximately $10.3 million, or 25.5%, to $30.1 million, as compared to $40.4 million in the prior year period. The decrease in the U.S. segment research and development expenses for the year ended December 31, 2013 over the prior year period is driven by a decline in external expense associated with the Phase 3 clinical trial for flurpiridaz F 18, as we completed patient enrollment during the third quarter of 2013. There were decreases in employee related costs as a result of the reduction in workforce from a strategic shift to use fewer internal resources and lower external expense as we expect to seek one or more strategic partners to assist in the future development and commercialization of our agents in development. Offsetting these decreases, in part, was an increase in severance expense and variable compensation.
For the year ended December 31, 2013, the International segment research and development expenses increased approximately $0.2 million, or 118.4%, to $0.3 million, as compared to $0.1 million in the prior year period. The increase in research and development expenses for the International segment was primarily due to depreciation expense since we shifted the primary utilization of certain assets to support research and development functions.
Impairment of Land
During the third quarter of 2013, we committed to a plan to sell certain of our excess land, which had a carrying value of $7.5 million. This event qualified for held for sale accounting and the excess land was written down to its fair value, less costs to sell. The fair value was estimated utilizing Level 3 inputs and using a market approach, based on available data for transactions in the region as well as the asking price of comparable properties in our principal market. This resulted in a loss of $6.4 million, which is included within operating income (loss) as impairment of land in the accompanying consolidated statement of comprehensive loss. During the fourth quarter of 2013, we sold the excess land for net proceeds of $1.1 million.
Proceeds from Manufacturer
For the year ended December 31, 2013, as compared to the same period in 2012, proceeds from manufacturer decreased by $25.7 million as a result of the receipt of the $35 million from BVL in 2012 to compensate us for business losses compared to proceeds of $8.9 million from BVL under a further 2013 settlement.
During the fourth quarter of 2013, BVL and LMI entered into a Settlement and Release Agreement. Pursuant to the Settlement and Release Agreement, BVL and LMI agreed to a broad mutual waiver and release
79
Table of Contents
for all matters that occurred prior to the date of the Settlement Agreement, a covenant not to sue and settlement payments to us in the aggregate amount of $8.9 million. In addition, the Settlement and Release Agreement provided that the Manufacturing and Service Contract terminate as of November 15, 2013, subject to BVL’s obligations to use commercially reasonable efforts to finalize specific batches of DEFINITY, Cardiolite product and saline manufactured and not yet released by the BVL quality function for commercial distribution.
Other Income (Expense), Net
| Year ended December 31, |
2014 compared to 2013 |
2013 compared to 2012 |
||||||||||||||||||||||||||
| 2014 | 2013 | 2012 | Change $ |
Change % |
Change $ |
Change % |
||||||||||||||||||||||
| (dollars in thousands) | ||||||||||||||||||||||||||||
| Interest expense |
$ | (42,288 | ) | $ | (42,915 | ) | $ | (42,014 | ) | $ | 627 | (1.5 | )% | $ | (901 | ) | 2.1 | % | ||||||||||
| Interest income |
27 | 104 | 252 | (77 | ) | (74.0 | ) | (148 | ) | (58.7 | ) | |||||||||||||||||
| Other income (expense), net |
478 | 1,161 | (44 | ) | (683 | ) | (58.8 | ) | 1,205 | 2,738.6 | ||||||||||||||||||
|
|
|
|
|
|
|
|
|
|
|
|||||||||||||||||||
| Total Other Expense, net |
$ | (41,783 | ) | $ | (41,650 | ) | $ | (41,806 | ) | $ | (133 | ) | 0.3 | % | $ | 156 | (0.4 | )% | ||||||||||
|
|
|
|
|
|
|
|
|
|
|
|||||||||||||||||||
Interest Expense
For the year ended December 31, 2014 compared to the same period in 2013, interest expense decreased by 1.5% to $42.3 million from $42.9 million, as a result of decreased amortization related to deferred financing costs.
For the year ended December 31, 2013 compared to the same period in 2012, interest expense increased by 2.1% to $42.9 million from $42.0 million, as a result of increased amortization related to the capitalization of additional deferred financing costs in connection with our new line of credit and the write off of the existing unamortized deferred financing costs related to our old facility.
Interest Income
For the year ended December 31, 2014, as compared to the same period in 2013, interest income decreased by 74.0% to $27,000 from $104,000, primarily as a result of the change in balances in interest bearing accounts.
For the year ended December 31, 2013, as compared to the same period in 2012, interest income decreased by 58.7% to $104,000 from $252,000, primarily as a result of the change in balances in interest bearing accounts.
Other Income (Expense), net
For the year ended December 31, 2014, as compared to the same period in 2013, other income (expense), net decreased by $0.7 million from $1.2 million primarily due to a net $1.2 million settlement indemnified by BMS during 2014.
For the year ended December 31, 2013, as compared to the same period in 2012, other income (expense), net increased by $1.2 million from $(44,000) primarily due to a $0.8 million increase as a result of the closing of the statute of limitations relating to a federal research credit matter in 2012, which decreased the tax indemnification assets in the prior year. In addition, we received $0.4 million in consideration from the extinguishment of our membership interests in a mutual insurance company.
Provision (Benefit) for Income Taxes
| Year ended December 31, |
2014 compared to 2013 |
2013 compared to 2012 |
||||||||||||||||||||||||||
| 2014 | 2013 | 2012 | Change $ | Change % | Change $ | Change % | ||||||||||||||||||||||
| (dollars in thousands) | ||||||||||||||||||||||||||||
| Provision (benefit) for income taxes |
$ | 1,195 | $ | 1,014 | $ | (555 | ) | $ | 181 | 17.9 | % | $ | 1,569 | 282.7 | % | |||||||||||||
80
Table of Contents
For the year ended December 31, 2014 compared to the same period in 2013, provision for income taxes increased by 17.9% to $1.2 million from $1.0 million.
We have generated domestic pre-tax losses for the past three years and continue to be in cumulative loss position. This loss history demonstrates negative evidence concerning our ability to utilize our gross deferred tax assets. In order to overcome the presumption of recording a valuation allowance against our net deferred tax assets, we must have sufficient positive evidence that we can generate sufficient taxable income to utilize these deferred tax assets within the carryover or forecast period. Although we have no history of expiring net operating losses or other tax attributes, based on the cumulative domestic loss incurred over the three-year period ended December 31, 2014, management has determined that all of the net U.S. deferred tax assets are not more-likely-than-not recoverable. As a result of this analysis, we maintained a valuation allowance against substantially all of our net deferred tax assets in 2014.
Considering our history of losses, our provision (benefit) for income taxes results primarily from taxes due in certain foreign jurisdictions where we generate taxable income, as well as interest and penalties associated with uncertain tax positions, offset by reversals of those positions as statutes lapse or are settled during the year. Provision (benefit) for income taxes increased in 2014 due to changes in taxable income in certain foreign jurisdictions and settlements and lapse of statute of limitations of uncertain tax positions in the current year.
For the year ended December 31, 2013, as compared to the same period in 2012, provision (benefit) for income taxes increased by 282.7% to $1.0 million from $(0.6) million due primarily to lower credits associated with settlements and lapse of statute of limitations of uncertain tax positions in the current year.
Our effective tax rates for the years ended December 31, 2014, 2013, and 2012 were, (50.5)%, (1.7)%, and 1.3%, respectively. Our tax rate is affected by recurring items, such as tax rates in foreign jurisdictions, which we expect to be fairly consistent in the near term, as well as non-recurring items such as the settlement of state audits. The following items had the most significant impact on the difference between our statutory U.S. federal income tax rate of 35% and our effective tax rate during the years ended:
December 31, 2014
| • | A $0.8 million increase attributable to prior year uncertain tax positions for a closed tax year. |
| • | A $0.4 million increase for taxes in foreign jurisdictions. |
December 31, 2013
| • | A $25.6 million increase to our valuation allowance against net domestic deferred tax assets. |
| • | A $1.5 million reduction relating primarily to prior year uncertain tax positions for a closed tax year. |
| • | A $1.8 million reduction primarily relating to a state income tax benefit related to state NOL’s. |
December 31, 2012
| • | A $20.2 million increase to our valuation allowance against net domestic deferred tax assets. |
| • | A $2.3 million reduction relating to prior year uncertain tax positions for a closed tax year. |
| • | A $1.8 million reduction relating to a state income tax benefit consisting of $1.1 million related to state NOL’s, $0.3 million related to research credits, and $0.4 million to other changes to state deferred taxes. |
81
Table of Contents
Liquidity and Capital Resources
Cash Flows
The following table provides information regarding our cash flows:
| Three Months ended March 31, |
% Change | Year ended December 31, | % Change | |||||||||||||||||||||||||||||
| 2015 | 2014 | 2015 Compared to 2014 |
2014 | 2013 | 2012 | 2014 Compared to 2013 |
2013 Compared to 2012 |
|||||||||||||||||||||||||
| (dollars in thousands) | ||||||||||||||||||||||||||||||||
| Cash provided by (used in): |
||||||||||||||||||||||||||||||||
| Operating activities |
$ | 15,157 | $ | (60 | ) | 25,361.7 | % | $ | 11,590 | $ | (15,572 | ) | $ | (372 | ) | 174.4 | % | (4,622.1 | )% | |||||||||||||
| Investing activities |
(3,498 | ) | (1,462 | ) | (139.3 | )% | (7,682 | ) | (3,483 | ) | (8,145 | ) | 120.6 | % | (57.2 | )% | ||||||||||||||||
| Financing activities |
(459 | ) | (5 | ) | (9,080.0 | )% | (2,297 | ) | 5,612 | (5,114 | ) | (140.9 | )% | 209.7 | % | |||||||||||||||||
Net Cash Provided by (Used in) Operating Activities
Cash provided by operating activities is primarily driven by our earnings and changes in working capital. The increase in cash provided by operating activities for the three months ended March 31, 2015 as compared to 2014 was primarily driven by an increase in net income, adjusted for non-cash items, primarily, depreciation and amortization and an increase in cash flows from accounts receivable due to the improved timing of collections with significant customers.
The increase in cash provided by operating activities for the year ended December 31, 2014 as compared to 2013 was primarily driven by a decrease in net loss and cash flow increase for inventory purchases primarily due to timing of the receipt of inventory. The improvement was partially offset by cash flow decreases in accounts receivable primarily due to increased revenues.
The decrease in cash provided by operating activities for the year ended December 31, 2013 as compared to 2012 was primarily driven by the receipt of $35.0 million from the BVL settlement in 2012 as compared to the receipt of $8.9 million from the BVL settlement in 2013. Offsetting this was an increase in gross profit and fewer expenditures related to research and development in 2013.
Net Cash Used in Investing Activities
Our primary uses of cash in investing activities are for the purchase of property and equipment. The increase in net cash used in investing activities in the three months ended March 31, 2015 as compared to 2014 primarily reflects increased spending on the purchase of property and equipment. Net cash used in investing activities in 2014, 2013 and 2012 reflected the purchase of property and equipment for $8.1 million, $5.0 million and $7.9 million, respectively.
Net Cash (Used in) Provided by Financing Activities
The increase in net cash used in financing activities in the three months ended March 31, 2015 as compared to 2014 was primarily driven by payments for offering costs.
Net cash used in financing activities during 2014 was due to payments made to our parent. Net cash provided by financing activities during 2013 was associated with an $8.0 million draw against our outstanding line of credit. On March 21, 2011, we issued $150.0 million of our Notes and paid associated financing costs. Net cash used in 2012 primarily represented the results of these activities.
Our primary source of cash flows from financing activities is draws against our outstanding line of credit. Going forward, we expect our primary source of cash flows from financing activities to be similar draws against
82
Table of Contents
our line of credit, issuances of securities or other financing arrangements into which we may enter. Our primary historical uses of cash in financing activities are principal payments on our term loan and line of credit as well as dividends to Holdings, our parent. See “—External Sources of Liquidity.”
External Sources of Liquidity
On May 10, 2010, we issued $250.0 million in aggregate principal amount of 9.750% Senior Notes due in 2017, or the Restricted Notes, at face value, net of issuance costs of $10.1 million, under the indenture, dated as of May 10, 2010. On February 2, 2011, we consummated an exchange offer where we exchanged $250.0 million aggregate principal amount of our Restricted Notes for an equal principal amount of 9.750% Senior Notes due 2017, or the Exchange Notes, that were registered under the Securities Act, with substantially identical terms in all respects.
On March 21, 2011, we issued an additional $150.0 million in aggregate principal amount of New Restricted Notes, net of issuance costs of $4.9 million, under the indenture, dated as of May 10, 2010, as supplemented by the First Supplemental Indenture, dated as of March 14, 2011, and the Second Supplemental Indenture, dated as of March 21, 2011, or together, the Indenture. The net proceeds were used to repurchase all of the remaining Series A Preferred Stock at the accreted value of approximately $44.0 million and to issue an approximate $106.0 million dividend to our common security holders. On May 10, 2011, we consummated an exchange offer where we exchanged $150.0 million aggregate principal amount of New Restricted Notes for an equal principal amount of 9.750% Senior Notes due 2017, or the New Exchange Notes, registered under the Securities Act, with substantially identical terms in all respects.
The Exchange Notes and the New Exchange Notes, or together, the Notes, mature on May 15, 2017. Interest on the Notes accrues at a rate of 9.750% per year and is payable semiannually in arrears on May 15 and November 15 commencing on November 15, 2010 for the Notes issued on May 10, 2010 and May 15, 2011 for the Notes issued on March 21, 2011.
In connection with the Restricted Notes issuance, we entered into a revolving facility, or the Old Facility, for total borrowings up to $42.5 million. During 2012, we entered into an unfunded Standby Letter of Credit for up to $8.8 million to support a surety bond related to a statutory decommissioning obligation we have in connection with our Billerica facility. The letter of credit decreased the borrowing availability under the Old Facility by $8.8 million.
On July 3, 2013, we entered into an amended and restated asset-based revolving credit facility, or our revolving credit facility, in an aggregate principal amount not to exceed $42.5 million. On June 24, 2014, we entered into an amendment of our revolving credit facility, which, among other things, increased the revolving credit commitments under our revolving credit facility to $50.0 million; provided that, subsequent to the amendment, borrowings in excess of $42.5 million thereunder are subject to certification of compliance with (x) the debt and lien covenants under the indenture for the Notes and (y) an additional $3.0 million of secured debt capacity under the indenture for the Notes.
Subsequent to the amendment, the revolving loans under our revolving credit facility bear interest, with pricing based from time to time at our election at (i) LIBOR plus a spread of 2.00% or (ii) the Reference Rate (as defined in our revolving credit facility) plus a spread of 1.00%. Our revolving credit facility also includes an unused line fee, which, subsequent to the amendment, is set at 0.375%. Our revolving credit facility expires on the earlier of (i) July 3, 2018 or (ii) if the outstanding Notes are not refinanced in full, the date that is 91 days before the maturity thereof, at which time all outstanding borrowings are due and payable.
As of March 31, 2015, we had an unfunded Standby Letter of Credit for up to $8.8 million. The unfunded Standby Letter of Credit requires annual fees, payable quarterly, which, subsequent to the amendment, is set at LIBOR plus a spread of 2.00% and expires on February 5, 2016, which will automatically renew for a one year period at each anniversary date, unless we elect not to renew in writing within 60 days prior to such expiration.
83
Table of Contents
In addition, our revolving credit facility contains cash dominion provisions which allow the lender to sweep our accounts during the period (x) certain specified events of default are continuing under our revolving credit facility or (y) excess availability under our revolving credit facility falls below (i) the greater of $5.0 million or 15% of the then-current borrowing base for a period of more than five consecutive Business Days or (ii) $3.5 million. During a covenant trigger period, we are required to comply with a consolidated fixed charge coverage ratio of not less than 1:00:1:00 under our revolving credit facility. The fixed charge coverage ratio is calculated on a consolidated basis for Lantheus Intermediate and its subsidiaries for a trailing four-fiscal quarter period basis, as (i) EBITDA (as defined in the agreement) minus capital expenditures minus certain restricted payments divided by (ii) interest plus taxes paid or payable in cash plus certain restricted payments made in cash plus scheduled principal payments paid or payable in cash.
Concurrently with this offering, LMI expects to enter into a senior secured term loan facility (collectively with our revolving facility, the senior secured credit facilities). The net proceeds of the term facility, together with the net proceeds of this offering, will be used to refinance in full the aggregate principal amount of the Notes and amounts outstanding under our revolving credit facility and pay related premiums, interest and expenses.
Our senior secured credit facilities will be secured by a pledge of substantially all of the assets of LMI, together with the assets of Lantheus Intermediate (or, upon consummation of the corporate reorganization, our assets) and assets of Lantheus MI Real Estate, LLC, or Lantheus Real Estate (collectively the Collateral), including each such entity’s accounts receivable, inventory and machinery and equipment (collectively, the ABL Priority Collateral), and is guaranteed by each of Lantheus Intermediate (or, upon consummation of the corporate reorganization, our assets) and Lantheus Real Estate. Our revolving credit facility has a first priority lien on the ABL Priority Collateral and will have a lien junior to our new term facility on the rest of the Collateral. Our new term facility will have a lien junior to our revolving credit facility on the ABL Priority Collateral and will have a first priority lien on the rest of the Collateral. Borrowing capacity under our revolving credit facility is determined by reference to a borrowing base, or the Borrowing Base, which is based on (i) a percentage of certain eligible accounts receivable, inventory and machinery and equipment minus (ii) any reserves. As of March 31, 2015, the aggregate Borrowing Base was approximately $45.8 million, which was reduced by (i) an outstanding $8.8 million unfunded Standby Letter of Credit and (ii) an $8.1 million outstanding loan balance including interest, resulting in a net borrowing base availability of approximately $28.9 million.
Our senior secured credit facilities will contain affirmative and negative covenants, as well as restrictions on the ability of Lantheus Intermediate, us and our subsidiaries to: (i) incur additional indebtedness or issue preferred stock; (ii) repay subordinated indebtedness prior to its stated maturity; (iii) pay dividends on, repurchase or make distributions in respect of capital stock or make other restricted payments; (iv) make certain investments; (v) sell certain assets; (vi) create liens; (vii) consolidate, merge, sell or otherwise dispose of all or substantially all of our assets; and (viii) enter into certain transactions with our affiliates. Our senior secured credit facilities also contain customary default provisions.
On December 27, 2012, we entered into a second amendment to a license and supply agreement with one of our customers, which extended the term from December 31, 2012 to December 31, 2014 and established new pricing and purchase requirements over the extended term. The second amendment also provided for the supply of TechneLite generators containing Moly sourced from LEU targets. The agreement included a $3.0 million upfront payment by our customer to us and during 2013, we received an additional $4.0 million, of which $3.6 million is included in deferred revenue as a current liability at December 31, 2013. During 2012, we received the $3.0 million upfront payment, of which $1.5 million was included in deferred revenue as a current liability and $1.5 million was included in other long-term liabilities at December 31, 2012. We have recognized the upfront payment as revenue on a straight-line basis over the term of the two year agreement.
Our ability to fund our future capital needs will be affected by our ability to continue to generate cash from operations and may be affected by our ability to access the capital markets, money markets, or other sources of funding, as well as the capacity and terms of our financing arrangements.
84
Table of Contents
We may from time to time repurchase or otherwise retire our debt and take other steps to reduce our debt or otherwise improve our balance sheet. These actions may include open market repurchases of any notes outstanding, prepayments of our term loans or other retirements or refinancing of outstanding debt, privately negotiated transactions or otherwise. The amount of debt that may be repurchased or otherwise retired, if any, would be decided at the sole discretion of our Board of Directors and will depend on market conditions, trading levels of our debt from time to time, our cash position and other considerations.
Funding Requirements
Our future capital requirements will depend on many factors, including:
| • | our ability to have product manufactured and released from JHS and other manufacturing sites in a timely manner in the future; |
| • | the pricing environment and the level of product sales of our currently marketed products, particularly DEFINITY, and any additional products that we may market in the future; |
| • | revenue mix shifts and associated volume and selling price changes that could result from contractual status changes with key customers; |
| • | the costs of further commercialization of our existing products, particularly in international markets, including product marketing, sales and distribution and whether we obtain local partners to help share such commercialization costs; |
| • | the costs of investing in our facilities, equipment and technology infrastructure; |
| • | the costs and timing of establishing manufacturing and supply arrangements for commercial supplies of our products; |
| • | the extent to which we acquire or invest in products, businesses and technologies; |
| • | the extent to which we choose to establish collaboration, co- promotion, distribution or other similar arrangements for our marketed products; |
| • | the legal costs relating to maintaining, expanding and enforcing our intellectual property portfolio, pursuing insurance or other claims and defending against product liability, regulatory compliance or other claims; and |
| • | the cost of interest on any additional borrowings which we may incur under our financing arrangements. |
Until we successfully become dual sourced for our principal products, we are vulnerable to future supply shortages. Disruption in the financial performance could also occur if we experience significant adverse changes in customer mix, broad economic downturns, adverse industry or company conditions or catastrophic external events. If we experience one or more of these events in the future, we may be required to implement additional expense reductions, such as a delay or elimination of discretionary spending in all functional areas, as well as scaling back select operating and strategic initiatives. See “Risk Factors—We may not be able to generate sufficient cash flow to meet our debt service obligations.”
If our capital resources become insufficient to meet our future capital requirements, we would need to finance our cash needs through public or private equity offerings, asset securitizations, debt financings, sale-leasebacks or other financing or strategic alternatives, to the extent such transactions are permissible under the covenants of our senior secured credit facilities. Additional equity or debt financing, or other transactions, may not be available on acceptable terms, if at all. If any of these transactions require an amendment or waiver under the covenants in our senior secured facilities, which could result in additional expenses associated with obtaining the amendment or waiver, we will seek to obtain such a waiver to remain in compliance with the covenants of our senior secured facilities. However, we cannot be assured that such an amendment or waiver would be granted, or that additional capital will be available on acceptable terms, if at all.
85
Table of Contents
At March 31, 2015, our only current committed external source of funds is our borrowing availability under our revolving credit facility. We had $30.7 million of cash and cash equivalents at March 31, 2015. Availability under our revolving credit facility is calculated by reference to the Borrowing Base. If we are not successful in achieving our forecasted results, our accounts receivable and inventory could be negatively affected, reducing the Borrowing Base and limiting our borrowing availability.
Based on our current operating plans, we believe that our existing cash and cash equivalents, results of operations and availability under our revolving credit facility will be sufficient to continue to fund our liquidity requirements for at least the next twelve months.
Quarterly Results of Operations
The following tables set forth selected unaudited quarterly consolidated statements of operations data for each of the four quarters for the period ended March 31, 2015. The unaudited quarterly statement of operations data have been prepared on the same basis as our audited consolidated financial statements and, in the opinion of our management, reflect all adjustments, consisting of normal recurring adjustments, necessary for a fair presentation of this data. The summary consolidated financial data set forth below and elsewhere in this prospectus are not necessarily indicative of our future performance. The following quarterly financial data should be read in conjunction with our audited consolidated financial statements and the related notes thereto included elsewhere in this prospectus.
| Three Months ended | ||||||||||||||||
| June 30, | September 30, | December 31, | March 31, | |||||||||||||
| 2014 | 2015 | |||||||||||||||
| (unaudited) | ||||||||||||||||
| (in thousands) | ||||||||||||||||
| Statement of Comprehensive Loss Data: |
||||||||||||||||
| Revenues(1) |
$ | 75,613 | $ | 75,682 | $ | 76,969 | $ | 74,823 | ||||||||
| Cost of goods sold |
44,554 | 44,044 | 44,208 | 39,054 | ||||||||||||
| Sales and marketing expenses |
9,402 | 8,327 | 7,889 | 9,072 | ||||||||||||
| General and administrative expenses |
8,990 | 11,041 | 8,430 | 9,123 | ||||||||||||
| Research and development expenses |
2,687 | 3,049 | 4,715 | 6,196 | ||||||||||||
|
|
|
|
|
|
|
|
|
|||||||||
| Operating income |
9,980 | 9,221 | 11,727 | 11,378 | ||||||||||||
| Interest expense |
(10,572 | ) | (10,592 | ) | (10,564 | ) | (10,623 | ) | ||||||||
| Interest income |
5 | 7 | 7 | — | ||||||||||||
| Other income (expense), net |
(175 | ) | 441 | 626 | (383 | ) | ||||||||||
|
|
|
|
|
|
|
|
|
|||||||||
| Income (loss) before income taxes |
(762 | ) | (923 | ) | 1,796 | 372 | ||||||||||
| Provision (benefit) for income taxes |
874 | (56 | ) | 1,569 | (3 | ) | ||||||||||
|
|
|
|
|
|
|
|
|
|||||||||
| Net income (loss) |
$ | (1,636 | ) | $ | (867 | ) | $ | 227 | $ | 375 | ||||||
|
|
|
|
|
|
|
|
|
|||||||||
| Statement of Cash Flows Data: |
||||||||||||||||
| Net cash flows provided by (used in): |
||||||||||||||||
| Operating activities |
$ | (4,988 | ) | $ | 20,513 | $ | (3,875 | ) | $ | 15,157 | ||||||
| Investing activities |
(1,791 | ) | (1,595 | ) | (2,834 | ) | (3,498 | ) | ||||||||
| Financing activities |
5,399 | (7,330 | ) | (361 | ) | (459 | ) | |||||||||
| Other Financial Data: |
||||||||||||||||
| EBITDA(2) |
$ | 14,235 | $ | 13,741 | $ | 17,423 | $ | 18,583 | ||||||||
| Adjusted EBITDA(2) |
16,317 | 19,057 | 19,363 | 20,587 | ||||||||||||
| Capital expenditures |
1,998 | 1,823 | 2,834 | 3,498 | ||||||||||||
86
Table of Contents
| (1) | The following table provides detail of revenues: |
| Three Months ended | ||||||||||||||||
| June 30, | September 30, | December 31, | March 31, | |||||||||||||
| 2014 | 2015 | |||||||||||||||
| (unaudited) | ||||||||||||||||
| (in thousands) | ||||||||||||||||
| DEFINITY |
$ | 23,516 | $ | 24,261 | $ | 25,624 | $ | 25,666 | ||||||||
| TechneLite |
23,525 | 23,612 | 23,410 | 20,860 | ||||||||||||
| Xenon |
8,899 | 8,916 | 9,025 | 13,194 | ||||||||||||
| Other |
19,673 | 18,893 | 18,910 | 15,103 | ||||||||||||
|
|
|
|
|
|
|
|
|
|||||||||
| Revenues |
$ | 75,613 | $ | 75,682 | $ | 76,969 | $ | 74,823 | ||||||||
| (2) | Adjusted EBITDA is defined as EBITDA (GAAP net income (loss), plus interest expense, net, provision of income taxes, depreciation and amortization), further adjusted to exclude unusual items that management does not believe are indicative of its core operating performance. Adjusted EBITDA is used by management to measure operating performance and by investors to measure a company’s ability to service its debt and meet its other cash needs. Management believes that the inclusion of the adjustments to EBITDA applied in presenting Adjusted EBITDA are appropriate to provide additional information to investors about our performance across reporting periods on a consistent basis by excluding items that it does not believe are indicative of its core operating performance. See “Non-GAAP Financial Measures.” |
The following table provides a reconciliation of our net income (loss) to Adjusted EBITDA for the periods presented:
| Three Months ended | ||||||||||||||||
| June 30, | September 30, | December 31, | March 31, | |||||||||||||
| 2014 | 2015 | |||||||||||||||
| (unaudited) (in thousands) |
||||||||||||||||
| Net income (loss) |
$ | (1,636 | ) | $ | (867 | ) | $ | 227 | $ | 375 | ||||||
| Interest expense, net |
10,567 | 10,585 | 10,557 | 10,623 | ||||||||||||
| Provision for income taxes(a) |
896 | (415 | ) | 977 | 1 | |||||||||||
| Depreciation and amortization |
4,408 | 4,438 | 5,662 | 7,584 | ||||||||||||
|
|
|
|
|
|
|
|
|
|||||||||
| EBITDA |
14,235 | 13,741 | 17,423 | 18,583 | ||||||||||||
| Non-cash stock-based compensation |
251 | 247 | 249 | 277 | ||||||||||||
| Legal fees(b) |
231 | 462 | 186 | 17 | ||||||||||||
| Asset write-off(c) |
91 | 639 | 107 | 180 | ||||||||||||
| Severance and recruiting costs(d) |
216 | 211 | 306 | 97 | ||||||||||||
| Sponsor fee and other(e) |
258 | 2,582 | 321 | 571 | ||||||||||||
| New manufacturer costs(f) |
1,035 | 1,175 | 771 | 862 | ||||||||||||
|
|
|
|
|
|
|
|
|
|||||||||
| Adjusted EBITDA |
$ | 16,317 | $ | 19,057 | $ | 19,363 | $ | 20,587 | ||||||||
|
|
|
|
|
|
|
|
|
|||||||||
| (a) | Represents provision for income taxes, less tax indemnification associated with an agreement with BMS. |
| (b) | Represents legal services expenses incurred in connection with our business interruption claim associated with the NRU reactor shutdown in 2009 to 2010. |
| (c) | Represents non-cash losses incurred associated with the write-down of land, intangible assets, inventory and write-off of long-lived assets. |
| (d) | Represents primarily severance and recruitment costs related to employees, executives and directors. |
| (e) | Represents annual sponsor monitoring fee and related expenses and non-recurring professional fees. |
| (f) | Represents internal and external costs associated with establishing new manufacturing sources for our commercial products and agents in development. |
87
Table of Contents
Contractual Obligations
Contractual obligations represent future cash commitments and liabilities under agreements with third parties and exclude contingent contractual liabilities for which we cannot reasonably predict future payment, including contingencies related to potential future development, financing, certain suppliers, contingent royalty payments and/or scientific, regulatory, or commercial milestone payments under development agreements. The following table summarizes our contractual obligations as of December 31, 2014:
| Payments Due by Period | ||||||||||||||||||||
| Total | Less than 1 Year |
1 - 3 Years |
3 - 5 Years |
More than 5 Years |
||||||||||||||||
| (dollars in thousands) | ||||||||||||||||||||
| Debt obligations (principal) |
$ | 400,000 | $ | — | $ | 400,000 | $ | — | $ | — | ||||||||||
| Interest on debt obligations |
97,500 | 39,000 | 58,500 | — | — | |||||||||||||||
| Operating leases(1) |
3,864 | 854 | 1,023 | 797 | 1,190 | |||||||||||||||
| Asset retirement obligation |
7,435 | — | — | — | 7,435 | |||||||||||||||
| Other long-term liabilities(2) |
33,136 | — | — | — | 33,136 | |||||||||||||||
|
|
|
|
|
|
|
|
|
|
|
|||||||||||
| Total contractual obligations |
$ | 541,935 | $ | 39,854 | $ | 459,523 | $ | 797 | $ | 41,761 | ||||||||||
|
|
|
|
|
|
|
|
|
|
|
|||||||||||
The following table summarizes our contractual obligations as of December 31, 2014 on a pro forma basis to give effect to the 2015 Refinancing:
| Payments Due by Period | ||||||||||||||||||||
| Total | Less than 1 Year |
1 - 3 Years |
3 - 5 Years |
More than 5 Years |
||||||||||||||||
| (dollars in thousands) | ||||||||||||||||||||
| Debt obligations (principal) |
$ | 365,000 | $ | — | $ | — | $ | — | $ | 365,000 | ||||||||||
| Interest on debt obligations |
153,300 | 21,900 | 43,800 | 43,800 | 43,800 | |||||||||||||||
| Operating leases(1) |
3,864 | 854 | 1,023 | 797 | 1,190 | |||||||||||||||
| Asset retirement obligation |
7,435 | — | — | — | 7,435 | |||||||||||||||
| Other long-term liabilities(2) |
33,136 | — | — | — | 33,136 | |||||||||||||||
|
|
|
|
|
|
|
|
|
|
|
|||||||||||
| Total contractual obligations |
$ | 562,735 | $ | 22,754 | $ | 44,823 | $ | 44,597 | $ | 450,561 | ||||||||||
|
|
|
|
|
|
|
|
|
|
|
|||||||||||
| (1) | Operating leases include minimum payments under leases for our facilities and certain equipment. |
| (2) | Due to the uncertainty related to the timing of the reversal of uncertain tax positions, the liability is not subject to fixed payment terms and the amount and timing of payments, if any, which we will make related to this liability are not known. |
Off-Balance Sheet Arrangements
We are required to provide the NRC and Massachusetts Department of Public Health financial assurance demonstrating our ability to fund the decommissioning of our North Billerica, Massachusetts production facility upon closure, though we do not intend to close the facility. We have provided this financial assurance in the form of a $28.2 million surety bond and an $8.8 million letter of credit.
Since inception, we have not engaged in any other off-balance sheet arrangements, including structured finance, special purpose entities or variable interest entities.
Effects of Inflation
We do not believe that inflation has had a significant impact on our revenues or results of operations since inception. We expect our cost of product sales and other operating expenses will change in the future in line with
88
Table of Contents
periodic inflationary changes in price levels. Because we intend to retain and continue to use our property and equipment, we believe that the incremental inflation related to the replacement costs of those items will not materially affect our operations. However, the rate of inflation affects our expenses, such as those for employee compensation and contract services, which could increase our level of expenses and the rate at which we use our resources. While we generally believe that we will be able to offset the effect of price-level changes by adjusting our product prices and implementing operating efficiencies, any material unfavorable changes in price levels could have a material adverse affect on our financial condition, results of operations and cash flows.
Recent Accounting Standards
We have elected to “opt out” of the extended transition period for complying with new and revised accounting standards pursuant to Section 107 of the JOBS Act, and the election is irrevocable. See “Prospectus Summary—Implications of Being an Emerging Growth Company.”
In July 2013, the Financial Accounting Standards Board, or the FASB, issued Accounting Standards Update, or ASU, No. 2013-11, “Presentation of an Unrecognized Tax Benefit When a Net Operating Loss Carryforward, a Similar Tax Loss, or a Tax Credit Carryforward Exists,” or ASU 2013-11. The amendments in ASU 2013-11 provide guidance on the financial statement presentation of unrecognized tax benefits when a net operating loss carryforward, a similar tax loss, or a tax credit carryforward exists. ASU 2013-11 is effective for fiscal years, and interim periods within those years, beginning after December 15, 2013. The amendments did not have a material impact on our financial position, results of operations or cash flows.
In April 2014, the FASB issued ASU No. 2014-08, “Presentation of Financial Statements (Topic 205) and Property, Plant, and Equipment (Topic 360): Reporting Discontinued Operations and Disclosures of Disposals of Components of an Entity,” or ASU 2014-08. The amendments in ASU 2014-08 change the criteria for reporting discontinued operations while enhancing disclosures in this area. The new guidance requires expanded disclosures about discontinued operations that will provide financial statement users with more information about the assets, liabilities, income and expenses of discontinued operations. The new guidance also requires disclosure of the pre-tax income attributable to a disposal of a significant part of an organization that does not qualify for discontinued operations reporting. The amendments in the ASU are effective in the first quarter of 2015 for public organizations with calendar year ends. Early adoption is permitted. We do not anticipate that this ASU will have a material impact to our financial position, results of operations or cash flows.
In May 2014, the FASB issued ASU No. 2014-09, “Revenue from Contracts with Customers (Topic 606)” or ASU 2014-09. ASU 2014-09 supersedes nearly all existing revenue recognition guidance under U.S. GAAP. The core principle of ASU 2014-09 is to recognize revenues when promised goods or services are transferred to customers in an amount that reflects the consideration that is expected to be received for those goods or services. ASU 2014-09 defines a five step process to achieve this core principle and, in doing so, it is possible more judgment and estimates may be required within the revenue recognition process than required under existing U.S. GAAP including identifying performance obligations in the contract, estimating the amount of variable consideration to include in the transaction price and allocating the transaction price to each separate performance obligation. The amendments in ASU No. 2014-09 are effective for annual reporting periods beginning after December 15, 2016, including interim periods within that reporting period. Early application is not permitted. We are currently evaluating the impact this ASU will have on our financial position, results of operations and cash flows.
In June 2014, the FASB issued ASU No. 2014-12, “Compensation—Stock Compensation (Topic 718)” or ASU 2014-12. ASU 2014-12 requires that a performance target that affects vesting and could be achieved after the requisite service period be treated as a performance condition. The amendments in ASU No. 2014-12 are effective for annual reporting periods beginning after December 15, 2015, including interim periods within that reporting period. We do not anticipate this ASU will have a material impact to our financial position, results of operations or cash flows.
89
Table of Contents
In August 2014, the FASB issued ASU No. 2014-15, “Presentation of Financial Statements-Going Concern (Subtopic 205-4): Disclosure of Uncertainties about an Entity’s Ability to Continue as a Going Concern” or ASU 2014-15. ASU 2014-15 to provide guidance on management’s responsibility in evaluating whether there is substantial doubt about a company’s ability to continue as a going concern and to provide related footnote disclosures. The amendments in ASU 2014-15 are effective for annual reporting periods ending after December 15, 2016. Early adoption is permitted. We do not anticipate this ASU will have a material impact to our financial position, results of operations or cash flows.
In April 2015, the Financial Accounting Standards Board, or the FASB, issued ASU No. 2015-03, “Interest—Imputation of Interest (Topic 835): Simplifying the Presentation of Debt Issuance Costs,” or ASU 2015-03. The amendments in ASU 2015-03 require that debt issuance costs related to a recognized debt liability be presented in the balance sheet as a direct deduction from the carrying amount of that debt liability, consistent with debt discounts. ASU 2015-03 requires retrospective adoption and will be effective for fiscal years beginning after December 15, 2015. Early adoption is permitted. We are evaluating the impact of ASU 2015-03 on the Company’s consolidated financial statements.
Critical Accounting Policies and Estimates
The discussion and analysis of our financial condition and results of operations are based on our consolidated financial statements, which have been prepared in accordance with GAAP. These financial statements require us to make estimates and judgments that affect our reported assets and liabilities, revenues and expenses, and other financial information. Actual results may differ materially from these estimates under different assumptions and conditions. In addition, our reported financial condition and results of operations could vary due to a change in the application of a particular accounting standard.
We believe the following represent our critical accounting policies and estimates used in the preparation of our financial statements.
Revenue Recognition
Our revenue is generated from the sales of our diagnostic imaging agents to wholesalers, distributors, and radiopharmacies and directly to hospitals and clinics. We recognize revenue when evidence of an arrangement exists, title has passed, substantially all the risks and rewards of ownership have transferred to the customer, the selling price is fixed and determinable and collectability is reasonably assured. For transactions for which revenue recognition criteria have not yet been met, the respective amounts are recorded as deferred revenue until that point in time when criteria are met and revenue can be recognized. Revenue is recognized net of reserves, which consist of allowances for returns and sales rebates. The estimates of these allowances are based on historical sales volumes and mix and require assumptions and judgments to be made in order to make those estimates. In the event that the sales mix is different from our estimates, we may be required to pay higher or lower returns and sales rebates than we previously estimated. Any changes to these estimates are recorded in the current period. In 2014, 2013 and 2012, these changes in estimates were not material to our results.
Revenue arrangements with multiple elements are divided into separate units of accounting if certain criteria are met, including whether the delivered element has stand-alone value to the customer. The arrangement’s consideration is then allocated to each separate unit of accounting based on the relative selling price of each deliverable. The estimated selling price of each deliverable is determined using the following hierarchy of values: (i) vendor-specific objective evidence of fair value; (ii) third party evidence of selling price; and (iii) best estimate of selling price. The best estimate of selling price reflects our best estimate of what the selling price would be if the deliverable was regularly sold by us on a stand-alone basis. The consideration allocated to each unit of accounting is then recognized as the related goods or services are delivered, limited to the consideration that is not contingent upon future deliverables. Supply or service transactions may involve the charge of a nonrefundable initial fee with subsequent periodic payments for future products or services. The up-front fees,
90
Table of Contents
even if nonrefundable, are earned (and revenue is recognized) as the products and/or services are delivered and performed over the term of the arrangement.
Inventory
Inventories include material, direct labor and related manufacturing overhead, and are stated at the lower of cost or market determined on a first-in, first-out basis. We record inventory when we take title to the product. Any commitment for product ordered but not yet received is included as purchase commitments in our contractual obligations table. We assess the recoverability of inventory to determine whether adjustments for impairment are required. Inventory that is in excess of future requirements is written down to its estimated net realizable value-based upon estimates of forecasted demand for our products. The estimates of demand require assumptions to be made of future operating performance and customer demand. If actual demand is less than what has been forecasted by management, additional inventory write downs may be required.
Inventory costs associated with product that has not yet received regulatory approval are capitalized if we believe there is probable future commercial use of the product and future economic benefit of the asset. If future commercial use of the product is not probable, then inventory costs associated with that product are expensed during the period the costs are incurred. For the year ended December 31, 2014, the Company expensed $1.9 million of such product costs in cost of goods sold relating to Neurolite that was manufactured by JHS. At December 31, 2014 and 2013, the Company had no capitalized inventories associated with product that did not have regulatory approval.
Goodwill, Intangibles and Long-Lived Assets
Goodwill is not amortized, but is instead tested for impairment at least annually and whenever events or circumstances indicate that it is more likely than not that it may be impaired. We have elected to perform the annual test of goodwill impairment as of October 31 of each year.
In performing tests for goodwill impairment, we are first permitted to perform a qualitative assessment about the likelihood of the carrying value of a reporting unit exceeding its fair value. If we determine that it is more likely than not that the fair value of a reporting unit is less than its carrying amount based on the qualitative assessment, we are required to perform the two-step goodwill impairment test described below to identify the potential goodwill impairment and measure the amount of the goodwill impairment loss, if any, to be recognized for that reporting unit. However, if we conclude otherwise based on the qualitative assessment, the two-step goodwill impairment test is not required. The option to perform the qualitative assessment is not an accounting policy election and can be utilized at our discretion. Further, the qualitative assessment need not be applied to all reporting units in a given goodwill impairment test. For an individual reporting unit, if we elect not to perform the qualitative assessment, or if the qualitative assessment indicates that it is more likely than not that the fair value of a reporting unit is less than its carrying amount, then we must perform the two-step goodwill impairment test for the reporting unit. If the implied fair value of goodwill is less than the carrying value, then an impairment charge would be recorded.
In performing the annual goodwill impairment test, we bypassed the option to perform a qualitative assessment and proceeded directly to performing the first step of the two-step goodwill impairment test. We completed our required annual impairment test for goodwill in the fourth quarter of 2014, 2013 and 2012 and determined that at each of those periods the carrying amount of goodwill was not impaired. In each year, our fair value was substantially in excess of our carrying value.
During the first quarter of 2013, the strategic shift in how we intend to fund our R&D programs significantly altered the expected future costs and revenues associated with our agents in development. Accordingly, this action was deemed to be a triggering event for an evaluation of the recoverability of our goodwill as of March 31, 2013. We performed an interim impairment test and determined that there was no impairment of goodwill as of March 31, 2013.
91
Table of Contents
We calculate the fair value of our reporting units using the income approach, which utilizes discounted forecasted future cash flows and the market approach which utilizes fair value multiples of comparable publicly traded companies. The discounted cash flows are based on our most recent long-term financial projections and are discounted using a risk adjusted rate of return, which is determined using estimates of market participant risk-adjusted weighted average costs of capital and reflects the risks associated with achieving future cash flows. The market approach is calculated using the guideline company method, where we use market multiples derived from stock prices of companies engaged in the same or similar lines of business. There is not a quoted market price for our reporting units or the company as a whole, therefore, a combination of the two methods is utilized to derive the fair value of the business. We evaluate and weigh the results of these approaches as well as ensure we understand the basis of the results of these two methodologies. We believe the use of these two methodologies ensures a consistent and supportable method of determining our fair value that is consistent with the objective of measuring fair value. If the fair value were to decline, then we may be required to incur material charges relating to the impairment of those assets.
We test intangible and long-lived assets for recoverability whenever events or changes in circumstances suggest that the carrying value of an asset or group of assets may not be recoverable. We measure the recoverability of assets to be held and used by comparing the carrying amount of the asset to future undiscounted net cash flows expected to be generated by the asset. If those assets are considered to be impaired, the impairment equals the amount by which the carrying amount of the assets exceeds the fair value of the assets. Any impairments are recorded as permanent reductions in the carrying amount of the assets. Long-lived assets, other than goodwill and other intangible assets, that are held for sale are recorded at the lower of the carrying value or the fair market value less the estimated cost to sell.
In the first quarter of 2012, we reviewed the estimated useful life of our Cardiolite trademark as a result of a triggering event. Utilizing the most recent forecasted revenue data, we revised the estimate of the remaining useful life of the Cardiolite trademark to five years. We continue to monitor the recoverability of our branded Cardiolite trademark intangible asset due to the ongoing generic competition based on actual results and existing estimates of future undiscounted cash flows associated with the branded Cardiolite product. As of December 31, 2013, we conducted, using our revised sales forecast, an impairment analysis and concluded that the estimate of future undiscounted cash flows associated with the Cardiolite trademark intangible did not exceed the carrying amount of the asset totaling $19.2 million and therefore, the asset has been written down to its fair value. Fair value was calculated by utilizing Level 3 inputs in the relief from royalty method, an income-based approach. As a result of this analysis, we recorded an impairment charge of $15.4 million to adjust the carrying value to its fair value of $3.8 million. This expense was recorded within cost of goods sold in the accompanying consolidated statement of comprehensive loss in the fourth quarter of 2013.
In the third quarter of 2013, we were in negotiations with a new distributor for the sale of certain products within certain international markets. This agreement was signed in October 2013 and as a result we did not renew the agreements with our former distributors in these international markets. We determined the customer relationship intangible related to these former distributors was no longer recoverable and recorded an impairment charge of $1.0 million in the third quarter of 2013. In the fourth quarter of 2013, we updated our strategic plan to reflect the non- renewal of these agreements and the uncertainty in the timing of product availability in this region. As a result, we reviewed the recoverability of certain of our customer relationship intangible assets in the International segment that were impacted by our revised strategic plan. We conducted an impairment analysis and concluded that the estimate of future undiscounted cash flows associated with the customer relationship intangible asset did not exceed the carrying amount of the asset and therefore, the asset would need to be written down to its fair value. In order to calculate the fair value of the acquired customer relationship intangible assets, we utilized Level 3 inputs to estimate the future discounted cash flows associated with remaining customers and as a result of this analysis, recorded an impairment charge of $0.7 million in the fourth quarter of 2013. These impairment charges were recorded within cost of goods sold in the accompanying consolidated statement of comprehensive loss.
92
Table of Contents
During the third quarter of 2013, we committed to a plan to sell certain of our excess land in the U.S. segment, which had a carrying value of $7.5 million. This event qualified for held for sale accounting and the excess land was written down to its fair value, less estimated costs to sell. The fair value was estimated utilizing Level 3 inputs and using a market approach, based on available data for transactions in the region, discussions with real estate brokers and the asking price of comparable properties in its principal market. This resulted in a loss of $6.4 million, which is included within operating loss as impairment of land in the accompanying consolidated statement of comprehensive loss. During the fourth quarter of 2013, we sold the excess land for net proceeds of $1.1 million.
Fixed assets dedicated to R&D activities, which were impacted by the March 2013 R&D strategic shift, have a carrying value of $4.5 million as of December 31, 2014. We believe these fixed assets will be utilized for either internally funded ongoing R&D activities or R&D activities funded by a strategic partner. If we are not successful in finding a strategic partner, and there are no alternative uses for those fixed assets, they could be subject to impairment in the future.
We also tested certain long-lived assets utilized in the manufacturing of certain products in the United States for recoverability as of December 31, 2013 due to a change in our contract to manufacture Quadramet. The analysis indicated that there was no impairment as of December 31, 2013. We also evaluated the remaining useful lives of long-lived assets that were tested for recoverability at December 31, 2013 and determined no revisions were required to the remaining periods of depreciation.
In the fourth quarter of 2014, we reviewed certain long-lived and intangible assets, associated with U.S. operations, for recoverability as a result of the expiration of an agreement with a customer. The analysis indicated that there was no impairment as of December 31, 2014. We also evaluated the remaining useful lives of the long-lived and intangible assets that were tested for recoverability at December 31, 2014 and determined no revisions were required to the remaining periods of depreciation and amortization.
Intangible assets, consisting of patents, trademarks and customer relationships related to our products are amortized in a method equivalent to the estimated utilization of the economic benefit of the asset. Trademarks and patents are amortized on a straight-line basis, and customer relationships are amortized on an accelerated basis.
Accounting for Stock-Based Compensation
Prior to the consummation of this offering, our employees were eligible to receive awards from our Old Equity Plans (as defined below). Following the consummation of this offering, employees are eligible to receive awards from our 2015 Equity Plan. Our stock-based compensation cost is measured at the grant date based on the fair value of the award and is recognized as expense over the requisite service period, which generally represents the vesting period, and includes an estimate of the awards that will be forfeited. We use the Black Scholes valuation model for estimating the fair value on the date of grant of stock options. The fair value of stock option awards is affected by our valuation assumptions, including the estimated fair value of our common stock, the volatility of equity comparables, the expected term of the options, the risk-free interest rate, expected dividends and other objective and subjective variables.
Each award is approved by our Board of Directors (or its compensation committee) at a per share exercise price not less than the per share fair value determined by the Board of Directors (or its compensation committee) in effect as of that award date. Historically for all periods prior to this initial public offering, our Board of Directors (or its compensation committee) has determined the fair value of the common stock underlying our stock options with assistance from management and based upon information available at the time of grant. Given the absence of a public trading market for our common stock, estimating the fair value of our common stock has required complex and subjective judgments assumptions, including:
| • | quarterly valuations of our common stock based on our actual operational and financial performance, current business conditions and cash flow projections; and |
93
Table of Contents
| • | the trading and exit multiples of companies that we consider peers based on a number of factors, including similarity to us with respect to industry, products and business model. |
We considered a combination of valuation methodologies, including discounted cash flows, comparable trading multiples and comparable transactions. Any material change to the assumptions used in estimating the fair value of the options could have a material impact on our results of operations. When a contingent cash settlement of vested options becomes probable, we reclassify the vested awards to a liability and account for any incremental compensation cost in the period in which the settlement becomes probable.
For valuations after the consummation of this offering, our Board of Directors (or its compensation committee) will generally determine the fair value of each share of underlying common stock based on the closing price of our common stock as reported on the date of grant.
Income Taxes
The provision for income taxes has been determined using the asset and liability approach of accounting for income taxes. The provision for income taxes represents income taxes paid or payable for the current year plus the change in deferred taxes during the year. Deferred taxes result from differences between the financial and tax bases of our assets and liabilities. Deferred tax assets and liabilities are measured using the currently enacted tax rates that apply to taxable income in effect for the years in which those tax attributes are expected to be recovered or paid, and are adjusted for changes in tax rates and tax laws when changes are enacted.
Valuation allowances are recorded to reduce deferred tax assets when it is more likely than not that a tax benefit will not be realized. The assessment of whether or not a valuation allowance is required involves the weighing of both positive and negative evidence concerning both historical and prospective information with greater weight given to evidence that is objectively verifiable. A history of recent losses is negative evidence that is difficult to overcome with positive evidence. In evaluating prospective information there are four sources of taxable income: reversals of taxable temporary differences, items that can be carried back to prior tax years (such as net operating losses), pre-tax income and tax planning strategies. Any tax planning strategies that are considered must be prudent and feasible, and would only be undertaken in order to avoid losing an operating loss carryforward. Adjustments to the deferred tax valuation allowances are made in the period when those assessments are made.
We account for uncertain tax positions using a recognition threshold and measurement attribute for the financial statement recognition and measurement of a tax position taken or expected to be taken in a tax return. Differences between tax positions taken in a tax return and amounts recognized in the financial statements are recorded as adjustments to income taxes payable or receivable, or adjustments to deferred taxes, or both. We provide disclosure at the end of each annual reporting period on a tabular reconciliation of unrecognized tax benefits. We classify interest and penalties within the provision for income taxes.
We have a tax indemnification agreement with BMS related to certain contingent tax obligations arising prior to the acquisition of the business from BMS. The tax obligations are recognized in liabilities and the tax indemnification receivable is recognized within other noncurrent assets. The changes in the tax indemnification asset are recognized within other income, net in the statement of comprehensive loss, and the changes in the related liabilities are recorded within the tax provision. Accordingly, as these reserves change, adjustments are included in the tax provision while the offsetting adjustment is included in other income. Assuming that the receivable from BMS continues to be considered recoverable by us, there is no net effect on earnings related to these liabilities and no net cash outflows.
The calculation of our tax liabilities involves certain estimates, assumptions and the application of complex tax regulations in numerous jurisdictions worldwide. Any material change in our estimates or assumptions, or the tax regulations, may have a material impact on our results of operations.
94
Table of Contents
Quantitative and Qualitative Disclosures About Market Risk
We are exposed to market risk from changes in interest rates and foreign currency exchange rates. We do not hold or issue financial instruments to reduce these risks or for trading purposes.
Interest Rate Risk
We are subject to interest rate risk in connection with our senior secured credit facilities, which are variable rate indebtedness. Interest rate changes could increase the amount of our interest payments and thus negatively impact our future earnings and cash flows. As of March 31, 2015, there was $8.1 million outstanding including interest under our revolving credit facility and an $8.8 million unfunded Standby Letter of Credit, which reduced availability to $28.9 million on our revolving credit facility. Any increase in the interest rate under our senior secured credit facilities may have a negative impact on our future earnings. The effect of a 100 basis points adverse change in market interest rates on our interest expense for the three months ended March 31, 2015, would be approximately $9,000. Historically, we have not used derivative financial instruments or other financial instruments to hedge such economic exposures.
Foreign Currency Risk
We face exposure to movements in foreign currency exchange rates whenever we, or any of our subsidiaries, enter into transactions with third parties that are denominated in currencies other than ours, or that subsidiary’s, functional currency. Intercompany transactions between entities that use different functional currencies also expose us to foreign currency risk.
During the three months ended March 31, 2015 and 2014, the net impact of foreign currency changes on transactions was a loss of $0.4 million and $0.2 million, respectively. Historically, we have not used derivative financial instruments or other financial instruments to hedge such economic exposures.
Gross margins of products we manufacture at our U.S. plants and sell in currencies other than the U.S. Dollar are also affected by foreign currency exchange rate movements. Our gross margin on revenues for the three month periods ended March 31, 2015 and 2014 was 47.8% and 41.0%, respectively. If the U.S. Dollar had been stronger by 1%, 5% or 10%, compared to the actual rates during the three months ended March 31, 2015, we estimate our gross margin on revenues would have increased by 0.1%, 0.3% and 0.7%, respectively. If the U.S. Dollar had been stronger by 1%, 5% or 10%, compared to the actual rates during the three months ended March 31, 2014, we estimate our gross margin on revenues would have increased by 0.0%, 0.2% and 0.5%, respectively.
During years ended December 31, 2014, 2013 and 2012, the net impact of foreign currency changes on transactions was a loss of $279,000, $349,000 and $579,000, respectively. Historically, we have not used derivative financial instruments or other financial instruments to hedge these economic exposures.
Gross margins for our products that are manufactured in the United States and are sold in currencies other than the U.S. Dollar are also affected by foreign currency exchange rate movements. Our gross margin on revenues was 41.6%, 27.3% and 26.1% during the years ended December 31, 2014, 2013 and 2012, respectively. If the U.S. Dollar had been stronger by 1%, 5% or 10%, compared to the actual rates during 2014, we estimate our gross margin on revenues would have increased by 0.1%, 0.3% and 0.6%, respectively. If the U.S. Dollar had been stronger by 1%, 5% or 10%, compared to the actual rates during 2013, we estimate our gross margin on revenues would have increased by 0.0%, 0.2% and 0.4%, respectively. If the U.S. Dollar had been stronger by 1%, 5% or 10%, compared to the actual rates during 2012, we estimate our gross margin on revenues would have increased by 0.0%, 0.2% and 0.3%, respectively.
In addition, a portion of our earnings is generated by our foreign subsidiaries, whose functional currencies are other than the U.S. Dollar. Our earnings could be materially impacted by movements in foreign currency exchange rates upon the translation of the earnings of those subsidiaries into the U.S. Dollar. The Canadian Dollar presents the primary currency risk on our earnings.
95
Table of Contents
If the U.S. Dollar had been uniformly stronger by 1%, 5% or 10%, compared to the actual average exchange rates used to translate the financial results of our foreign subsidiaries, our revenues and net income for the three months ended March 31, 2015 would have been impacted by approximately the following amounts:
| Increase in U.S. Dollar to Applicable Foreign Currency Exchange Rate |
Approximate Decrease in Revenues |
Approximate Increase in Net Income |
||||||
| (dollars in thousands) | ||||||||
| 1% |
$ | (94 | ) | $ | 22 | |||
| 5% |
(469 | ) | 108 | |||||
| 10% |
(938 | ) | 215 | |||||
If the U.S. Dollar had been uniformly stronger by 1%, 5% or 10%, compared to the actual average exchange rates used to translate the financial results of our foreign subsidiaries, our revenues and net loss for the three months ended March 31, 2014 would have been impacted by approximately the following amounts:
| Increase in U.S. Dollar to Applicable Foreign Currency Exchange Rate |
Approximate Decrease in Revenues |
Approximate Decrease in Net Loss |
||||||
| (dollars in thousands) | ||||||||
| 1% |
$ | (112 | ) | $ | (5 | ) | ||
| 5% |
(558 | ) | (24 | ) | ||||
| 10% |
(1,116 | ) | (49 | ) | ||||
If the U.S. Dollar had been uniformly stronger by 1%, 5% or 10%, compared to the actual average exchange rates used to translate the financial results of our foreign subsidiaries, our revenues and net loss for the year ended December 31, 2014 would have been impacted by approximately the following amounts:
| Increase in U.S. Dollar to Applicable Foreign Currency Exchange Rate |
Approximate Decrease in Revenues |
Approximate Decrease in Net Loss |
||||||
| (dollars in thousands) | ||||||||
| 1% |
$ | (433 | ) | $ | (52 | ) | ||
| 5% |
(2,167 | ) | (259 | ) | ||||
| 10% |
(4,334 | ) | (517 | ) | ||||
If the U.S. Dollar had been uniformly stronger by 1%, 5% or 10%, compared to the actual average exchange rates used to translate the financial results of our foreign subsidiaries, our revenues and net loss for the year ended December 31, 2013 would have been impacted by approximately the following amounts:
| Increase in U.S. Dollar to Applicable Foreign Currency Exchange Rate |
Approximate Decrease in Revenues |
Approximate Decrease in Net Loss |
||||||
| (dollars in thousands) | ||||||||
| 1% |
$ | (487 | ) | $ | (38 | ) | ||
| 5% |
(2,436 | ) | (191 | ) | ||||
| 10% |
(4,871 | ) | (382 | ) | ||||
If the U.S. Dollar had been uniformly stronger by 1%, 5% or 10%, compared to the actual average exchange rates used to translate the financial results of our foreign subsidiaries, our revenues and net loss for the year ended December 31, 2012 would have been impacted by approximately the following amounts:
| Increase in U.S. Dollar to Applicable Foreign Currency Exchange Rate |
Approximate Decrease in Revenues |
Approximate Decrease in Net Loss |
||||||
| (dollars in thousands) | ||||||||
| 1% |
$ | (519 | ) | $ | (3 | ) | ||
| 5% |
(2,593 | ) | (17 | ) | ||||
| 10% |
(5,187 | ) | (34 | ) | ||||
96
Table of Contents
Overview
We are a global leader in developing, manufacturing, selling and distributing innovative diagnostic medical imaging agents and products that assist clinicians in the diagnosis of cardiovascular and other diseases. Our agents are routinely used to diagnose coronary artery disease, congestive heart failure, stroke, peripheral vascular disease and other diseases. Clinicians use our imaging agents and products across a range of imaging modalities, including echocardiography, nuclear imaging and MRI. We believe that the resulting improved diagnostic information enables healthcare providers to better detect and characterize, or rule out, disease, potentially achieving improved patient outcomes, reducing patient risk and limiting overall costs for payers and the entire healthcare system.
Our commercial products are used by cardiologists, nuclear physicians, radiologists, internal medicine physicians, sonographers and technologists working in a variety of clinical settings. We sell our products to hospitals, clinics, group practices, integrated delivery networks, group purchasing organizations, radiopharmacies and, in certain circumstances, wholesalers. We sell our products globally and have operations in the United States, Puerto Rico, Canada and Australia and distribution relationships in Europe, Asia Pacific and Latin America.
Our portfolio of 10 commercial products is diversified across a range of imaging modalities. Our imaging agents include contrast agents and radiopharmaceuticals (including technetium generators).
| • | Contrast agents are typically non-radioactive compounds that are used in diagnostic procedures such as echocardiograms, x-ray imaging or MRIs that are used by physicians to improve the clarity of the diagnostic image. |
| • | Radiopharmaceuticals are radioactive pharmaceuticals used by clinicians to perform nuclear imaging procedures. |
| • | In certain circumstances, a radioisotope is attached to a chemical compound to form the radiopharmaceutical. This act of attaching the radioisotope to the chemical compound is called radiolabeling, or labeling. Our products include both the chemical compounds that are radiolabeled as well as generators containing radioisotopes that radiolabel. |
| • | In other circumstances, a radioisotope can be used as a radiopharmaceutical without attaching any additional chemical compound. Our products also include this type of radiopharmaceutical. |
| • | Radioisotopes are most commonly manufactured in a nuclear research reactor, where a radioactive target is bombarded with subatomic particles, or on a cyclotron, which is a type of particle accelerator that also creates radioisotopes. Our products include radioisotopes produced in research reactors and in cyclotrons, and we own seven cyclotrons. |
| • | Two common forms of nuclear imaging procedures are SPECT and PET. In both SPECT and PET procedures, a radiopharmaceutical is injected into a patient, and it localizes in a specific organ or system within the body. The radiopharmaceutical emits small amounts of measurable radiation that are captured by a specialized camera that generates an image of the specific organ or system for the physician to read. The type of radiation the radiopharmaceutical emits will determine the type of camera that can be used—a SPECT radiopharmaceutical emits gamma rays captured with a SPECT camera, and a PET radiopharmaceutical emits positrons captured with a PET camera. |
As an example of the procedures in which our products may be used, in the diagnosis of coronary artery disease, a typical diagnostic progression could include an electrocardiogram, followed by an echocardiogram (possibly using our agent DEFINITY), and then a MPI study using either SPECT or PET imaging (possibly using our technetium generator or one of our MPI agents). An MPI study assesses blood flow distribution to the heart,
97
Table of Contents
and there are approximately six million MPI studies performed annually in the United States. An MPI imaging agent is injected into a patient intravenously, and the imaging agent deposits in the patient’s heart muscle based on how much blood reaches the various areas. A heart with normal blood flow will show the imaging agent taken up uniformly, while a scar from a previous heart attack that blocks or restricts blood flow will not show any uptake of the imaging agent. MPI is also used for diagnosing the presence of coronary artery disease. See “—Diagnostic Medical Imaging Agent Overview.”
Leading Products.
Our leading commercial product is:
| • | DEFINITY—the leading ultrasound contrast imaging agent used by cardiologists and sonographers during echocardiography exams based on revenue and usage. DEFINITY is an injectable agent that is indicated in the United States for use in patients with suboptimal echocardiograms to assist in the visualization of the left ventricle, the main pumping chamber of the heart. The use of DEFINITY in echocardiography allows physicians to significantly improve their assessment of the function of the left ventricle. Since its launch in 2001, DEFINITY has been used to image approximately 5.6 million patients in the United States alone. |
Of the total number of echocardiograms performed each year in the United States—over 30 million in 2014—based on medical literature, we estimate that approximately 20%, or approximately six million echocardiograms in 2014, produce suboptimal images. We believe that for the three months ended March 31, 2015, 4.4% of the total echocardiography procedures performed in the United States used a contrast agent, constituting an estimated 22% of all suboptimal echocardiograms performed. This compares to a contrast penetration rate of 3.5% for the three months ended March 31, 2014, or an estimated 17.7% of all suboptimal echocardiograms performed. Contrast penetration rates in echocardiography procedures have increased over the past seven years and, we believe, will continue to increase in the future as clinicians continue to adopt the use of contrast as an important tool to assist their clinical decision-making. Of the echocardiograms in which a contrast agent is used, we estimate that DEFINITY had an approximate 78% share of these procedures in the United States in December 2014.
We believe that DEFINITY has this leading position because of its preferred product functionality and composition derived from a synthetic rather than a blood-based product. As a result, we believe DEFINITY will be a key driver of the future growth of our business, both in the United States and in international markets, as we continue to grow contrast penetration through sales and marketing efforts focused on the appropriate use of contrast and maintain our leading position. DEFINITY currently has patent or other exclusivity protection until 2021 in the United States and until 2019 outside of the United States, and we have an active next generation development program for this agent.
Our leading commercial radiopharmaceutical products are:
| • | TechneLite—a self-contained system, or generator, of technetium (Tc99m), a radioisotope with a six hour half-life, used by radiopharmacists at radiopharmacies to prepare patient-specific radiolabeled imaging agents. Technetium results from the radioactive decay of Moly, itself a radioisotope with a 66-hour half-life produced in nuclear research reactors around the world from enriched uranium. Because of the short half-lives of Moly and technetium, radiopharmacies typically replace TechneLite generators on a weekly basis pursuant to standing orders made with us. In addition, the supply chain for Moly is global and, because of the 66-hour half-life, we utilize just-in-time inventory management. We believe that we have the most balanced and diversified supply chain in the industry, buying Moly from four out of the five major global Moly processors, which are supplied by seven of the eight major global Moly reactors. |
We are one of two principal technetium generator manufacturers in the United States and Canada. We are also the leading and most consistent U.S. manufacturer of LEU technetium generators. Governments and policy-makers are encouraging the increased use of technetium generators made with Moly derived from
98
Table of Contents
LEU rather than HEU, which may present greater proliferation and security risks. In the United States, nuclear imaging agent unit doses prepared with LEU technetium generators are reimbursed by Medicare in the hospital outpatient setting at a higher rate.
We believe that our substantial capital investments in our highly automated TechneLite production line and our extensive experience in complying with the stringent regulatory requirements for the handling of nuclear materials create significant and sustainable competitive advantages for us in generator manufacturing and distribution. We estimate that in 2014, we had an approximately 43% share of generator sales in the United States. Certain TechneLite generator components currently have U.S. patent protection until 2029.
| • | Xenon Xe 133 Gas is a radiopharmaceutical gas that is inhaled and used to assess pulmonary function and also cerebral blood flow. Based on third party data, there are an estimated 1.4 million pulmonary embolism studies performed annually in the United States, and Xenon is used in approximately 25% of these studies. Our Xenon is manufactured by a third party as part of the Moly production process and packaged by us. We are currently the leading provider of Xenon in the United States. |
Other Commercial Products
In addition to the products listed above, our portfolio of commercial products also includes important imaging agents in specific market segments, which provide a stable base of recurring revenue.
| • | Cardiolite is an injectable, technetium-labeled imaging agent, also known by its generic name sestamibi, used with SPECT technology in MPI procedures that assess blood flow to the muscle of the heart. Launched in 1991, Cardiolite has the highest cumulative revenue of any branded radiopharmaceutical in history. |
| • | Neurolite is an injectable, technetium-labeled imaging agent used with SPECT technology to identify the area within the brain where blood flow has been blocked or reduced due to stroke. |
| • | Thallium Tl 201 is an injectable radiopharmaceutical imaging agent used in MPI studies to detect coronary artery disease and is manufactured by us using cyclotron-based technology. |
| • | Gallium Ga 67 is an injectable radiopharmaceutical imaging agent used to detect certain infections and cancerous tumors, especially lymphoma, and is manufactured by us using cyclotron technology. |
| • | Gludef is an injectable, fluorine-18-labeled imaging agent used with PET technology to identify and characterize tumors in patients undergoing oncologic diagnostic procedures. Gludef is our branded version of FDG. |
| • | Quadramet, our only therapeutic product, is an injectable radiopharmaceutical used to treat severe bone pain associated with certain kinds of cancer, and is manufactured by us. Previously, we served as a contract manufacturer of Samarium 153, the radioisotope used to prepare Quadramet. Effective December 13, 2013, we purchased the rights to Quadramet in the United States and now serve as the direct manufacturer and supplier of Quadramet in the United States. |
| • | Ablavar is an injectable, gadolinium-based contrast agent used with MRA, a type of MRI scan, to image the iliac arteries that start at the aorta and go through the pelvis into the legs, in order to diagnose narrowing or blockage of these arteries in known or suspected peripheral vascular disease. |
For revenue and other financial information for our U.S. and International segments, see Note 19 to our consolidated financial statements, which are included elsewhere in this prospectus.
In the United States and Canada, we sell DEFINITY through our sales team of approximately 80 employees that call on healthcare providers in the echocardiography space, as well as group purchasing organizations and integrated delivery networks. Our radiopharmaceutical products are primarily distributed through commercial radiopharmacies, the majority of which are controlled by or associated with Cardinal, UPPI, GE Healthcare and Triad.
99
Table of Contents
In Canada, Puerto Rico and Australia, we own eight radiopharmacies and sell our radiopharmaceuticals, as well as others, directly to end users. In Europe, Asia Pacific and Latin America, we utilize distributor relationships to market, sell and distribute our products. We have entered into a partnership with Double-Crane to complete confirmatory clinical trials necessary for Chinese regulatory approval and to distribute DEFINITY in China. We believe that international markets, particularly China, represent significant growth opportunities for our products.
Our Agents in Development
We have established a portfolio of three internally-discovered imaging agents in clinical and preclinical development, each of which we believe could represent a large market opportunity and has the potential to significantly enhance current imaging modalities and fulfill unmet diagnostic medical imaging needs. We are currently seeking strategic partners to pursue the further development of each of these agents, which include:
| • | Flurpiridaz F 18—Myocardial Perfusion Imaging Agent. Flurpiridaz F 18 is a small molecule imaging agent radiolabeled with fluorine-18 and designed for use in PET MPI to assess blood flow to the muscle of the heart. We believe that, in comparison to SPECT MPI, the current standard of care, PET MPI with flurpiridaz F 18 potentially provides higher image quality, increased diagnostic certainty, more accurate risk stratification and reduced patient radiation exposure. This agent could be particularly useful in difficult to image heart patients, including women and obese patients, currently underserved by available diagnostic methods. In the first of two planned Phase 3 studies, PET MPI with flurpiridaz F 18 consistently showed a balanced performance in identifying disease (sensitivity) and ruling out disease (specificity), when compared to coronary angiography, the truth standard. Unlike flurpiridaz F 18, SPECT imaging results were skewed with low sensitivity and high specificity when compared to the truth standard. When the flurpiridaz F 18 results were compared to the SPECT results, flurpiridaz F 18 substantially outperformed SPECT in sensitivity, one of the study’s primary endpoints, but did not meet the study’s other primary endpoint, non-inferiority in specificity, implying a substantial and unexpected under-diagnosis of CAD with SPECT imaging in the trial. |
In subgroup analyses, the risk-benefit profile of flurpiridaz F 18 appeared to be favorable in women, obese patients and patients with multivessel disease. Importantly, radiation exposure associated with flurpiridaz F 18 was reduced to approximately 50% of SPECT, and a significantly higher percentage of images were rated as either excellent or good with flurpiridaz F 18 as compared to SPECT, leading to a greater diagnostic certainty of interpretation. In addition, no drug-related serious adverse events were observed.
Based on these results, we have redesigned the protocol for our second Phase 3 trial, including different primary endpoints. On March 13, 2015, the FDA granted us an SPA in connection with the new trial. We are now in active discussions with a number of prospective partners for the further development and commercialization of this promising agent. This compound currently has U.S. patent protection until 2028 before taking into account any potential regulatory extensions.
| • | 18F LMI 1195—Cardiac Neuronal Imaging Agent. 18F LMI 1195 is a small molecule imaging agent also radiolabeled with fluorine-18 and designed to assess cardiac sympathetic nerve function with PET imaging. We believe that PET imaging with 18F LMI 1195 could allow for better identification of patients at risk of heart failure progression and fatal arrhythmias, which would better inform pharmaceutical therapy or implantable device use. This compound has completed a Phase 1 study and currently has U.S. patent protection until 2030 before taking into account any potential regulatory extensions. |
| • | LMI 1174—Vascular Remodeling Imaging Agent. LMI 1174 is a gadolinium-based MRI agent designed to identify elastin in the arterial walls and atherosclerotic plaques. We believe that this agent could allow for the minimally-invasive assessment of plaque location, burden and composition and, accordingly, could be used to risk stratify patients for potential vascular events, including heart attack or stroke. This compound is in late-stage preclinical studies and currently has U.S. patent protection until 2031 before taking into account any potential regulatory extensions. |
100
Table of Contents
Diagnostic Medical Imaging Agents Overview
Medical imaging is commonly employed as a critical aid in the diagnosis of numerous medical conditions, including heart disease and cancer. Selection of treatment options and monitoring of disease progression are also facilitated by the use of imaging procedures. Diagnostic medical imaging procedures often employ imaging agents to highlight specific tissues and organs, or physiological or pathological processes. Imaging agents can be used in a range of imaging modalities, including ultrasound, SPECT, PET, MRI, x-ray and CT.
Echocardiography
Echocardiography is a non-invasive test that uses sound waves to create moving images of the heart. These images allow an assessment of the heart’s size, shape and function. For example, echocardiography can be used to detect areas of the heart that are not functioning properly due to poor blood supply, as seen in patients with coronary artery disease. Echocardiography is considered to be one of the safest, most reliable and cost-effective ways to diagnose certain cardiac abnormalities, and it is the most widely used technique for non-invasive imaging of the heart. Echocardiography may, however, yield images of limited diagnostic value in certain situations due to signal attenuation, such as in women and patients who are obese or have lung disease. It is estimated that suboptimal image quality occurs in approximately 20% of all patients undergoing echocardiography in the United States. Uninterpretable images may lead to misdiagnosis or the need for additional, often unnecessary and costly tests. Use of contrast agents in echocardiography increases sensitivity and specificity, particularly in hard to image patients by improving the delineation of the edges of the heart wall. In 2014, according to a third party source, there were approximately 30 million echocardiography procedures performed in the United States with a compound annual growth rate of 2.7% over the period 2007 through 2014. In the United States, from 2007 through 2014, contrast enhanced echocardiography procedures grew at a compound annual growth rate of 9.7% with 1,129,000 contrast enhanced echocardiography procedures performed in 2014, up from 589,000 in 2007.
Nuclear Imaging
Nuclear imaging uses small amounts of radioactive materials, called radiopharmaceuticals, taken by injection, inhalation or orally to diagnose and treat disease. Radiopharmaceutical imaging agents consist of a radioisotope (such as technetium) paired with a molecular agent designed to localize in specific organs and tissues (such as Cardiolite and Neurolite), and are used in combination with imaging techniques for clinical diagnostic applications.
Clinicians utilize specialized cameras, either SPECT or PET, designed to capture radiation emitted by the agent. Computers are then used to generate detailed images of the area of interest. The resulting images provide clinicians with important information on both the structure and function of the internal organ or tissue.
101
Table of Contents
Imaging Agents Market
We believe that the demand for imaging agents in developed and developing markets will continue to be driven by an aging and increasingly obese population, and bolstered by long-term initiatives focused on improving healthcare and the supporting infrastructure, with a particular emphasis on expanding access to rural areas and small towns and cities. According to a research report dated February 2012 released by GIA, the worldwide diagnostic imaging market is projected to reach approximately $18.0 billion by 2017, reflecting a compound annual growth rate of 7.2% over the period from 2013 through 2017. The worldwide diagnostic imaging market can be analyzed on a major market basis as follows:
| Market |
2013 Sales Projections |
Share of Total Global Diagnostic Imaging Market |
2017 Sales Projections |
CAGR (2013-2017) |
||||||||||||
| (dollars in billions) | ||||||||||||||||
| United States |
$ | 6.5 | 48 | % | $ | 8.9 | 8.1 | % | ||||||||
| Japan |
$ | 3.1 | 23 | % | $ | 3.9 | 5.4 | % | ||||||||
| Europe |
$ | 2.6 | 19 | % | $ | 3.6 | 8.0 | % | ||||||||
| Asia-Pacific (excluding Japan) |
$ | 0.6 | 5 | % | $ | 0.8 | 7.0 | % | ||||||||
| Canada |
$ | 0.3 | 2 | % | $ | 0.4 | 4.4 | % | ||||||||
In terms of specific imaging modalities, the worldwide market can be analyzed as between contrast agents and diagnostic radiopharmaceuticals as follows:
| Imaging Modality |
2013 Sales Projections |
Share of Total Global Diagnostic Imaging Market |
2017 Sales Projections |
CAGR (2013-2017) |
||||||||||||
| (dollars in billions) | ||||||||||||||||
| Contrast Agents* |
$ | 7.6 | 56 | % | $ | 9.4 | 5.2 | % | ||||||||
| Diagnostic Radiopharmaceuticals |
$ | 6.0 | 44 | % | $ | 8.6 | 9.7 | % | ||||||||
| * | Includes imaging agents for echocardiography, MRI, CTA, CT and x-ray procedures. |
The United States diagnostic imaging markets can be further analyzed as follows:
| U.S. Ultrasound Contrast Agent Market |
2013 Sales Projections |
2014 Sales Projections |
2015 Sales Projections |
2016 Sales Projections |
2017 Sales Projections |
CAGR (2013-2017) |
||||||||||||||||||
| (dollars in millions) | ||||||||||||||||||||||||
| Ultrasound Contrast Agents |
$ | 149.3 | $ | 170.8 | $ | 195.7 | $ | 224.5 | $ | 257.9 | 14.6 | % | ||||||||||||
Source: GIA Report, February 2012
| U.S. Radiopharmaceutical Market |
2013 Sales Projections |
2014 Sales Projections |
2015 Sales Projections |
2016 Sales Projections |
2017 Sales Projections |
CAGR (2013-2017) |
||||||||||||||||||
| (dollars in millions) | ||||||||||||||||||||||||
| SPECT |
$ | 857.2 | $ | 850.8 | $ | 882.9 | $ | 923.8 | $ | 973.6 | 3.2 | % | ||||||||||||
| PET |
$ | 257.5 | $ | 280.9 | $ | 311.0 | $ | 360.8 | $ | 430.6 | 13.7 | % | ||||||||||||
| Radiotherapy Agents |
$ | 58.4 | $ | 65.0 | $ | 74.0 | $ | 86.1 | $ | 98.3 | 13.9 | % | ||||||||||||
|
|
|
|
|
|
|
|
|
|
|
|
|
|||||||||||||
| Total |
$ | 1,173.1 | $ | 1,196.7 | $ | 1,267.9 | $ | 1,370.7 | $ | 1,502.5 | 6.4 | % | ||||||||||||
Source: Frost & Sullivan Report, September 2013
Heart disease is a key driver of growth in the market for diagnostic medical imaging procedures and agents. Heart disease is currently the leading cause of death for both women and men in the United States and worldwide. According to the AHA, an estimated 83.6 million American adults, greater than one in three, have one or more types of heart disease. The AHA also reports that the total number of inpatient cardiovascular operations and procedures increased 28%, from more than 5.9 million in 2000 to more than 7.5 million in 2010. The total direct and indirect cost of heart disease and stroke in the United States for 2010 was estimated to be
102
Table of Contents
$315.4 billion. Heart disease costs more than any other diagnostic group—and these costs are rising. Coronary artery disease alone costs the United States $108.9 billion each year. This total includes the cost of health care services, medications and lost productivity.
Heart disease refers to a number of disease states, including coronary artery disease and structural defects of the heart. Coronary artery disease is the most common form of heart disease, with an estimated prevalence of approximately 6% in the United States. The clinical approach to the diagnosis of this condition varies among clinicians based on clinical presentation, test availability and physicians’ preferences. However, a typical diagnostic progression includes an electrocardiogram, followed by an echocardiogram and then a nuclear MPI study using either SPECT or PET. This diagnostic progression would typically be followed until the point at which coronary artery disease could be credibly identified or ruled out and prior to when more invasive procedures are considered. Some clinicians may also favor MRI or computed tomography angiography, or CTA, to augment or replace a nuclear MPI study in the minimally invasive diagnostic progression. To evaluate structural defects of the heart, a typical diagnostic progression would start with an echocardiogram, followed by MRI, CT or CTA, again until that point at which a structural defect could be credibly identified or ruled out and an appropriate benefit/risk assessment for more invasive intervention can be made. These imaging methods are not mutually exclusive. Rather, they can provide complementary information, and physicians may select one or more modalities based on a variety of criteria, including the physician’s preference, available imaging equipment and overall clinical presentation. Our imaging agents and products are used in connection with diagnostic imaging for heart disease.
Our Competitive Strengths
We believe that our business model provides us with a strong platform to reach our strategic goal of providing cost-effective, clinically-beneficial diagnostic medical imaging agents and products that enable clinicians either to identify and characterize, or rule out, disease and consequently improve patient care. We believe our competitive strengths include:
| • | Leading Position Across a Range of Imaging Modalities. We are a global leader in the diagnostic medical imaging industry with over 50 years of experience in developing and bringing to market differentiated products critical to healthcare decision making, including contrast imaging agents, radiopharmaceutical imaging agents and other products. Our key brands include: DEFINITY, the leading echocardiology contrast imaging agent based on revenue and usage; and TechneLite, our technetium-based generator used by radiopharmacies to radiolabel technetium- based imaging agents, such as our own SPECT products Cardiolite and Neurolite. We also sell a broad portfolio of other commercial agents and products, diversified across a range of imaging modalities. |
| • | DEFINITY is a Uniquely-Positioned Growth Opportunity in the United States and Globally. We believe that DEFINITY will be a key driver of the future growth of our business, both in the United States and globally. We believe that for the three months ended March 31, 2015, 4.4% of the total echocardiography procedures performed in the United States used a contrast agent, constituting an estimated 22% of all suboptimal echocardiograms performed. This compares to a contrast penetration rate of 3.5% for the three months ended March 31, 2014, or an estimated 17.7% of all suboptimal echocardiograms performed. Contrast penetration rates in echocardiography procedures have increased over the past seven years, and we believe will continue to increase in the future as clinicians continue to adopt the use of contrast as an important tool to assist their clinical decision-making. In contrast echocardiography procedures in which a contrast agent is used, we estimate that DEFINITY had approximately 78% share of these procedures in the United States as of December 2014. |
We are actively pursuing international growth opportunities, such as our partnership with Double-Crane in China. Upon regulatory approval, we plan to commercialize DEFINITY in China with Double-Crane, a large Chinese pharmaceutical company that has extensive experience with the CFDA. We will be pursuing abdominal (liver and kidney) and cardiac indications for DEFINITY in China. In 2010, there
103
Table of Contents
were an estimated 48 million liver, 35 million renal and 18 million echocardiogram procedures performed in China which collectively represented approximately 50% of the total ultrasound procedures performed. Of these procedures, approximately 350,000 of the liver and renal studies and approximately 117,000 of the cardiac studies were enhanced with contrast agents. Chronic liver disease is one of the most common chronic diseases in China and provides us with what we believe to be a significant opportunity for improvement in patient diagnosis and care. If the regulatory and required clinical trial processes in China are both timely and successful, we currently estimate the timing for approval of DEFINITY in China will begin in 2018. We are also pursuing additional product registrations internationally to maximize the global potential of DEFINITY. We believe our intellectual property for DEFINITY currently gives us patent or other market exclusivity protection in the United States until 2021 and outside of the United States until 2019, and we have an active next generation development program for this agent.
| • | Significant Investment in Complex Manufacturing and Regulatory Capabilities. We believe that our expertise in the design, development and validation of complex manufacturing systems and processes that many of our radiopharmaceutical products require due to their limited half-lives, as well as our strong track record of on-time delivery and reputation as a high-quality, reliable provider, has enabled us to become a leader in the diagnostic medical imaging industry. We believe that our substantial capital investments in our highly automated generator production line, our cyclotrons and our extensive experience in complying with the stringent regulatory requirements for the handling of nuclear materials create significant and sustainable competitive advantages. |
| • | Diversified Supply Chain. We are establishing a strong and diversified supply chain for our key products. For DEFINITY, we have already successfully completed a technology transfer from BVL, our former manufacturing partner, to JHS. We are also now in the process of another technology transfer to Pharmalucence as an additional manufacturing partner for DEFINITY, and we currently target filing for FDA approval to manufacture DEFINITY at Pharmalucence in 2015. For TechneLite, we have a strong and reliable position in the technetium generator market because of our balanced and diversified Moly supply and our favorable access to Moly derived from LEU. We believe we have the most balanced and diversified Moly supply chain in the industry. We receive finished Moly from four of the five main processing sites in the world. These processing sites are, in turn, supplied by seven of the eight main Moly-producing reactors in the world. We are also the leading and most consistent manufacturer of LEU generators in North America. In addition, we continue to assess opportunities to further diversify and strengthen our supply chain with non-HEU Moly-producing technologies. We believe we are well-positioned with our current supply partners to have a secure supply of Moly, including LEU Moly, when the NRU reactor in Canada transitions from regular commercial operations in 2016 to providing only emergency back-up supply of medical isotopes through March 2018. |
| • | Experienced Direct Sales Force and Established Global Distribution Network. In the United States and Canada, we sell DEFINITY through our sales team of approximately 80 employees, which we believe is the largest dedicated sales force in the industry serving the echocardiography market. The majority of our sales team has over a decade of experience selling diagnostic imaging agents. Our radiopharmaceuticals (including technetium generators) are primarily distributed in the United States through commercial radiopharmacies, the majority of which are controlled by or associated with Cardinal, UPPI, GE Healthcare and Triad. In Canada, Puerto Rico and Australia, we own radiopharmacies and sell radiopharmaceutical products directly to end users. In Europe, Asia Pacific and Latin America, we utilize distributor relationships to market, sell and distribute all of our products. |
| • | Experienced Management Team. Our senior management team has an average of more than 25 years of healthcare industry experience and consists of industry leaders with significant expertise in product development, operations and commercialization. We believe that the depth and experience of our management team demonstrates our expertise within the diagnostic medical imaging industry and our ability to operate successfully in a highly regulated environment. |
104
Table of Contents
Our Business Strategy
Our objective is to enhance our position as a global leader in developing, manufacturing, selling and distributing innovative diagnostic medical imaging agents and products. The key elements of this strategy are to:
| • | Continue to grow U.S. sales of our existing commercial products, which are diversified across a range of imaging modalities. We will continue to drive the sales of our fastest growing and highest margin product, DEFINITY, through the growth of the appropriate use of contrast in echocardiography. As a strong and reliable supplier of technetium generators, we expect to continue to grow our leading position in LEU generators. We will also focus on driving the growth of our other diagnostic imaging products. |
| • | Enhance the position of our portfolio of commercial products in international markets, obtaining additional regulatory approvals where necessary. Through our development and commercialization arrangement with Double-Crane in China, once regulatory approval is obtained, we will seek to drive appropriate contrast adoption and DEFINITY sales for both abdominal (liver and kidney) and cardiac indications in one of the largest and most important markets in the world. We will also seek to enhance and expand our distribution relationships for DEFINITY and our other products with other national and regional partners. We will also pursue regulatory approvals and commercialization opportunities for DEFINITY and our other products in other important international markets. |
| • | Create strategic partnerships to further advance our agents in development to maximize their value in potentially large domestic and international markets. We are now in active discussions with a number of prospective partners for the further development and commercialization of flurpiridaz F 18. We are also currently seeking strategic partners to pursue the further development and possible commercialization of our two earlier stage agents in development, 18F LMI 1195 and LMI 1174, both of which represent potentially large market opportunities. |
| • | Pursue select strategic transactions to further strengthen and diversify our portfolios of commercial products, improve our margins and leverage our core competencies. We will continue to evaluate, and where appropriate pursue, select opportunities to strengthen and diversify our portfolio of commercial products and improve our margins, whether those opportunities are tuck-in acquisitions, commercial stage in-licensing transactions, discrete divestitures or transformative transactions. |
Our Products
Our portfolio of 10 commercial products is diversified across a range of imaging modalities. Our products include contrast agents and medical radiopharmaceuticals (including technetium generators). Contrast agents are typically non-radioactive compounds used by physicians to improve the clarity of the diagnostic image in diagnostic procedures such as echocardiograms or MRIs. Radiopharmaceuticals, or nuclear imaging agents, are radiolabeled compounds that are used by clinicians to perform nuclear imaging procedures, such as SPECT or PET. Technetium generators are used to prepare the radioactive Technetium (Tc99m) isotope that is combined with organ-localizing pharmaceuticals to create the most commonly used radiopharmaceuticals in diagnostic medicine.
DEFINITY
DEFINITY is the leading ultrasound contrast imaging agent based on revenue and usage and, in the United States, is indicated for use in patients with suboptimal echocardiograms. Numerous patient conditions can decrease the quality of images of the left ventricle, the primary pumping chamber of the heart. Of the total number of echocardiograms performed each year in the United States—over 30 million in 2014—a third party source estimates that approximately 20%, or approximately six million echocardiograms in 2014, produce suboptimal images. The use of DEFINITY during echocardiography allows physicians to significantly improve their assessment of the function of the left ventricle.
105
Table of Contents
DEFINITY is a clear, colorless, sterile liquid, which, upon activation in the Vialmix apparatus, a medical device specifically designed for DEFINITY, becomes a homogenous, opaque, milky white injectable suspension of perflutren-containing lipid microspheres. After activation and intravenous injection, DEFINITY improves the ultrasound delineation of the left ventricular endocardial border, or innermost layer of tissue that lines the chamber of the left ventricle. Better visualization of the ventricle wall allows clinicians to see wall motion abnormalities, namely that the heart muscle is not expanding and contracting in a normal, consistent and predictable way. We believe this allows clinicians to make more informed decisions about disease status.
According to a clinical study sponsored and conducted by The Methodist DeBakey Heart and Vascular Center in Houston, Texas from June 2007 until October 2008, 632 consecutive patients with technically difficult echocardiographic studies—86.2% were inpatients and 28.4% were in intensive care units—received DEFINITY to prospectively evaluate the impact of contrast use on cardiac diagnosis and management compared with noncontrast studies. The clinical study evaluated the quality of echocardigraphic studies, the number of left ventricular segments visualized, the estimated ejection fraction, presence of thrombus in the apex of the left ventricle, and comparative management decisions before and after contrast. The results of the study, published in the Journal of American College of Cardiology in 2009, showed that the use of DEFINITY significantly increased the percentage of adequate studies. Prior to DEFINITY use, 1.6% of the studies were deemed to be adequate, 86.7% technically difficult and 11.7% uninterpretable. Following DEFINITY use, 89.9% of the studies were deemed to be adequate, 9.8% technically difficult and 0.3% uninterpretable.
DEFINITY offers flexible dosing and administration through an IV bolus injection or continuous IV infusion. We believe DEFINITY’s synthetic lipid-cased coating gives the compound a distinct competitive advantage, because it provides a strong ultrasound signal and is the only perflutren-based echo contrast agent made without albumin.
Since its launch in 2001, DEFINITY has been used in imaging procedures in more than 5.6 million patients throughout the world. In 2014, DEFINITY was the leading ultrasound imaging agent based on revenue and usage, used by echocardiologists and sonographers. We estimate that DEFINITY had approximately 78% share of the market for contrast agents in the United States as of December 2014. DEFINITY currently competes with Optison, a GE Healthcare product, Lumason, a recently-approved Bracco product (known as SonoVue outside the U.S.) as well as other non-echocardiography imaging modalities. DEFINITY, Optison and Lumason all carry an FDA-required boxed warning, which has been modified over time, to notify physicians and patients about potentially serious safety concerns or risks posed by the products. See “Risk Factors—Risks Relating to our Business and Industry—Ultrasound contrast agents may cause side effects which could limit our ability to sell DEFINITY.”
We recently transferred our manufacturing of DEFINITY from BVL to JHS at its facility in Spokane, Washington.
DEFINITY is currently patent protected in the United States until 2021 and in numerous foreign jurisdictions with patent or regulatory protection until 2019, and we have an active next generation development program for this agent. For the three months ended March 31, 2015 and 2014, DEFINITY generated revenues of $25.7 million and $22.4 million, respectively, which represented 34% and 30%, respectively, of our revenues. DEFINITY generated revenues of $95.8 million, $78.1 million and $51.4 million for the years ended December 31, 2014, 2013 and 2012, respectively. DEFINITY represented approximately 32%, 28% and 18% of our revenues in 2014, 2013 and 2012, respectively.
TechneLite
TechneLite is a self-contained system or generator of Technetium (Tc99m), a radioactive isotope with a six hour half-life, used by radiopharmacies to prepare various nuclear imaging agents. Technetium results from the radioactive decay of Moly, itself a radioisotope with a 66-hour half-life produced in nuclear research reactors around the world from enriched uranium. The TechneLite generator is a little larger than a coffee can in size and the self-contained system houses a vertical glass column at its core that contains Moly. During our manufacturing
106
Table of Contents
process, Moly is added to the column within the generator where it is adsorbed onto alumina powder. The column is sterilized, enclosed in a lead shield and further sealed in a cylindrical plastic container, which is then immediately shipped to our radiopharmacy customers. Because of the short half-lives of Moly and technetium, radiopharmacies typically purchase TechneLite generators on a weekly basis pursuant to standing orders.
The technetium produced by our TechneLite generator is the medical radioisotope that can be attached to a number of imaging agents, including our own Cardiolite products and Neurolite, during the labeling process. To radiolabel a technetium-based radiopharmaceutical, a vial of sterile saline and a vacuum vial are each affixed to the top of a TechneLite generator. The sterile saline is pulled through the generator where it attracts technetium resulting from the radioactive decay of Moly within the generator column. The technetium-containing radioactive saline is then pulled into the vacuum vial and subsequently combined by a radiopharmacist with the applicable imaging agent, and individual patient-specific radiolabeled imaging agent doses are then prepared. When administered, the imaging agent binds to specific tissues or organs for a period of time, enabling the technetium to provide information related to the functional health of the imaged tissues or organs in a diagnostic image. Our ability to produce and market TechneLite is highly dependent on our supply of Moly. See “—Raw Materials and Supply Relationships—Molybdenum-99.”
TechneLite is produced in thirteen sizes and is currently marketed in North America, Latin America and Australia, largely to radiopharmacies that prepare unit doses of radiopharmaceutical imaging agents and that ship these preparations directly to hospitals for administration to patients. In the United States, we have supply contracts with commercial radiopharmacies, including UPPI and GE Healthcare. We also supply generators on a purchase order basis with other customers. In 2014, we believe TechneLite had approximately 43% of the U.S. generator market share, competing primarily with technetium-based generators produced by Mallinckrodt. In Canada and Puerto Rico, we also supply TechneLite to our Company-owned radiopharmacies to prepare radiopharmaceutical imaging agent unit doses.
The Moly used in our TechneLite generators can be produced using targets made of either HEU or LEU. LEU consists of uranium that contains less than 20% of the uranium-235 isotope. HEU is often considered weapons grade material, with 20% or more of uranium-235. On January 2, 2013, President Obama signed into law the American Medical Isotopes Production Act of 2012, or AMIPA, as part of the 2013 National Defense Authorization Act. AMIPA encourages the domestic production of LEU Moly and provides for the eventual prohibition of the export of HEU from the United States. Although Medicare generally does not provide separate payment to hospitals for the use of diagnostic radiopharmaceuticals administered in an outpatient setting, since January 1, 2013, CMS, the federal agency responsible for administering the Medicare program, has provided an add-on payment under the hospital outpatient prospective payment system for every technetium diagnostic dose produced from non-HEU sourced Moly, to cover the marginal cost for radioisotopes produced from non-HEU sources. Our LEU TechneLite generator satisfies the reimbursement requirements under the applicable CMS rules.
TechneLite has patent protection in the United States and various foreign countries on certain component technology currently expiring in 2029. In addition, given the significant know-how and trade secrets associated with the methods of manufacturing and assembling the TechneLite generator, we believe we have a substantial amount of valuable and defensible proprietary intellectual property associated with the product. We believe that our substantial capital investments in our highly automated TechneLite production line and our extensive experience in complying with the stringent regulatory requirements for the handling of nuclear materials create significant and sustainable competitive advantages for us in generator manufacturing and distribution. For the three months ended March 31, 2015 and 2014, TechneLite generated revenues of $20.9 million and $23.0 million, respectively, which represented approximately 28% and 31%, respectively, of our revenues. TechneLite generated revenues of $93.6 million, $92.2 million and $114.2 million for the years ended December 31, 2014, 2013 and 2012, respectively. TechneLite represented approximately 31%, 33% and 40% of our revenues in 2014, 2013 and 2012, respectively.
107
Table of Contents
Xenon Xe 133 Gas
Xenon is a radiopharmaceutical gas that is inhaled and used to assess pulmonary function and also cerebral blood flow. Our Xenon is manufactured by a third party as part of the Moly production process and packaged by us. We are currently the leading provider of Xenon in the United States. In 2014, 2013 and 2012, Xenon Xe 133 Gas represented approximately 12%, 11% and 10%, respectively, of our revenues.
Other Commercial Products
In addition to the products listed above, our portfolio of commercial products also includes important imaging agents in specific segments, which provide a stable base of recurring revenue.
| • | Cardiolite, also known by its generic name sestamibi, is an injectable, technetium-labeled imaging agent used in MPI procedures to assess blood flow to the muscle of the heart with SPECT. Cardiolite was approved by the FDA in 1990 and its market exclusivity expired in July 2008. With the advent of generic competition in September 2008, we have faced significant pricing and unit volume pressures on Cardiolite. We also sell Cardiolite in the form of a generic sestamibi at a lower price than branded Cardiolite. Since its launch in 1991, Cardiolite products have been used to image more than 53 million patients in the United States. Cardiolite represented approximately 6%, 9% and 12% of our revenues in 2014, 2013 and 2012, respectively. Included in Cardiolite revenues are branded Cardiolite and generic sestamibi revenues, some of which we produce and some of which we procure from third parties from time to time. |
| • | Neurolite is an injectable, technetium-labeled imaging agent used with SPECT technology to identify the area within the brain where blood flow has been blocked or reduced due to stroke. We launched Neurolite in 1995. In 2014, 2013 and 2012, Neurolite represented approximately 4%, 2% and 2%, respectively, of our revenues. |
| • | Thallium Tl 201 is an injectable radiopharmaceutical imaging agent used in MPI studies to detect coronary artery disease. We have marketed Thallium since 1977 and manufacture the agent using cyclotron technology. In 2014, 2013 and 2012, Thallium represented approximately 2%, 1% and 2%, respectively, of our revenues. |
| • | Gallium Ga 67 is an injectable radiopharmaceutical imaging agent used to detect certain infections and cancerous tumors, especially lymphoma. We manufacture Gallium using cyclotron technology. In each of 2014, 2013 and 2012, Gallium represented approximately 2% of our revenues. |
| • | Gludef is an injectable, fluorine-18-radiolabeled imaging agent used with PET technology to identify and characterize tumors in patients undergoing oncologic diagnostic procedures. Gludef is our branded version of FDG. In 2014, 2013 and 2012, Gludef represented approximately 2%, 3% and 2%, respectively, of our revenues. |
| • | Quadramet, our only therapeutic product, is an injectable radiopharmaceutical used to treat severe bone pain associated with certain kinds of cancer. Previously, we served as a contract manufacturer of Samarium 153, the radioisotope used to prepare Quadramet. Effective December 13, 2013, we purchased the rights to Quadramet in the United States and now serve as the direct manufacturer and supplier of Quadramet in the United States. In 2014, 2013 and 2012, Samarium 153 represented approximately1%, 2% and 2%, respectively, of our revenues. |
| • | Ablavar is an injectable, gadolinium-based contrast agent used with MRA, a type of MRI scan, to image the iliac arteries that start at the aorta and go through the pelvis into the legs, in order to diagnose narrowing or blockage of these arteries in known or suspected peripheral vascular disease. We launched Ablavar in January 2010. In each of 2014, 2013 and 2012, Ablavar represented less than 1% of our revenues. |
For revenue and other financial information for our U.S. and International segments, see Note 19 to our consolidated financial statements, which are included elsewhere in this prospectus.
108
Table of Contents
Distribution, Marketing and Sales
The following table sets forth certain key market information for each of our commercial products:
| Product |
Currently Marketed |
Regulatory Approval, but Not Currently Marketed | ||
|
|
United States, Canada, Australia, New Zealand, Mexico |
EU, Israel, India, South Korea, Singapore(1) | ||
|
|
United States, Canada, Caribbean Islands, Colombia, Costa Rica, Taiwan |
Korea, Mexico, Panama, Australia | ||
|
|
United States, Taiwan | Canada | ||
|
|
United States, Canada, Certain EU countries(2), Brazil, Costa Rica, Israel, Japan, South Korea, Mexico, Taiwan, Thailand, Japan, Australia, New Zealand, Slovenia, Hong Kong, Panama, Philippines |
Malta | ||
|
|
United States, Canada, Costa, Rica, Japan, Hong Kong, Mexico, Philippines, Australia, New Zealand, Taiwan, Thailand | South Korea, EU countries(3), Taiwan | ||
|
|
United States, Canada, Columbia, Australia, Mexico, South Korea, Pakistan, Panama, Taiwan |
New Zealand | ||
|
|
United States, Canada, Columbia, Mexico, Pakistan, Australia, Costa Rica, South Korea, Panama, Taiwan, New Zealand |
None | ||
|
|
Puerto Rico, Canada (Gludef) | None | ||
|
|
United States | None | ||
|
|
United States, Canada | Australia | ||


| (1) | In addition, we have applied for regulatory approval in China, and JHS is pending approval in India and South Korea. |
| (2) | Cardiolite is currently marketed in Austria, Belgium, Denmark, Finland, France, Germany, Italy, Luxembourg, Netherlands, Norway, Slovenia, Spain, Sweden and the United Kingdom. |
| (3) | JHS has regulatory approval pending for Neurolite in Austria, Belgium, Czech Republic, Denmark, Finland, France, Germany, Italy, Luxembourg, Norway, Slovenia, Spain and Sweden. |
In the United States and Canada, we sell DEFINITY through our sales team of approximately 80 employees that call on healthcare providers in the echocardiography space, as well as group purchasing organizations and integrated delivery networks. In 2013, we transitioned the sales and marketing efforts for Ablavar from our sales team to our customer service team in order to allow our sales team to focus exclusively on driving our DEFINITY sales growth. For the three months ended March 31, 2015 and the year ended December 31, 2014, DEFINITY sales represented approximately 34% and 32%, respectively, of our revenues.
109
Table of Contents
Our radiopharmaceutical products are sold in the United States through a small nuclear products sales team, primarily to radiopharmacies. We sell a majority of our radiopharmaceutical products in the United States to radiopharmacies that are associated with or controlled by UPPI, GE Healthcare and Cardinal. Our contractual distribution contracts and other arrangements with these radiopharmacy groups are as follows:
| • | UPPI is a cooperative purchasing group (roughly analogous to a group purchasing organization) of approximately 77 independently owned or smaller chain radiopharmacies located in the United States. UPPI’s radiopharmacies are typically broadly dispersed geographically, with some urban presence and a substantial number of radiopharmacies located in suburban and rural areas of the country. We estimate that these independent radiopharmacies, together with an additional 36 unofficial, independent radiopharmacies, distributed more than 25% of the aggregate U.S. SPECT doses sold in the first half of 2014 (the latest information available to us). We currently have an agreement with UPPI for the distribution of both TechneLite and Cardiolite products to radiopharmacies or families of radiopharmacies within the UPPI cooperative purchasing group. The agreement contains specified pricing levels based upon specified purchase amounts for UPPI. We are entitled to terminate the UPPI agreement upon 60 days’ written notice. The UPPI agreement expires on December 31, 2016. We also sell UPPI members generators, Xenon, Neurolite, Gallium and Thallium. |
| • | GE Healthcare maintains 32 radiopharmacies in the United States that purchase our TechneLite generators, Xenon and Gallium. These radiopharmacies primarily distribute GE Healthcare’s Myoview, a technetium-labeled MPI agent. We estimate that GE Healthcare distributed approximately 14% of the aggregate U.S. SPECT doses sold in the first half of 2014. We currently have one agreement with GE Healthcare for the distribution of TechneLite, Xenon and Gallium. The agreement provides that GE Healthcare will purchase a minimum percentage of TechneLite generators as well as certain other products from us. Our agreement, which expires on December 31, 2017, may be terminated by either party on (i) two years’ written notice relating to TechneLite and (ii) six months’ written notice relating to the other products. Our agreement also allows for termination upon the occurrence of specified events including a material breach by either party, bankruptcy by either party and force majeure events. |
| • | Cardinal maintains approximately 132 radiopharmacies that are typically located in large, densely populated urban areas in the United States. We estimate that Cardinal’s radiopharmacies distributed approximately 39% of the aggregate U.S. SPECT doses sold in the first half of 2014. Our written supply agreements with Cardinal relating to TechneLite, Xenon, Neurolite, Cardiolite and certain other products expired in accordance with their terms on December 31, 2014. Following extended discussions with Cardinal that have not yet resulted in one or more new written supply agreements, we are currently accepting and fulfilling product orders from Cardinal on a purchase order basis at list price. We cannot predict the volumes or product mix Cardinal will continue to order and purchase, and such volumes and product mix may vary over time. In the absence of written supply agreements with Cardinal, in early 2015, our sales volumes with Cardinal began to transition from previous historical levels to new, lower levels, but at substantially higher prices. This gave us a revenue and margin benefit in the first quarter of 2015. Some of the volume that we previously sold to Cardinal has shifted to sales to other of our radiopharmacy customers. We currently anticipate that overall quarterly levels for the remainder of 2015 will be lower than those experienced during the first quarter of 2015 and during the respective year-ago periods so long as we do not have written supply agreements with Cardinal. Future levels of net revenue and operating profit associated with Cardinal cannot be predicted at this time because such amounts depend on future unit sales volumes, product mix and pricing to Cardinal. |
In addition to the distribution arrangements for our radiopharmaceutical products described above, we also sell certain of our radiopharmaceutical products to Triad, independent radiopharmacies and directly to hospitals and clinics that maintain in-house radiopharmaceutical capabilities and operations. In the latter case, this represents a small percentage of overall sales because the majority of hospitals and clinics do not maintain these in-house capabilities.
In Europe, Asia Pacific and Latin America, we utilize third party distributor relationships to market, sell and distribute our products, either on a country-by-country basis or on a multicountry regional basis. In October
110
Table of Contents
2013, we entered into a new supply and distribution agreement for Cardiolite and Neurolite in certain European countries with Mallinckrodt AG. In March 2015, we terminated that agreement. In March 2012, we entered into a new development and distribution arrangement for DEFINITY in China, Hong Kong S.A.R. and Macau S.A.R. with Double-Crane. Double-Crane is currently pursuing the Chinese regulatory approval required to commence the necessary confirmatory clinical trials. There are three milestones in the regulatory approval process to commercialize DEFINITY in China:
| • | First, submission of a Clinical Trial Application which seeks Import Drug License approval. Double-Crane submitted the Clinical Trial Application to the CFDA in June 2013. The CFDA accepted the Clinical Trial Application for review in July 2013. |
| • | Second, approval of the Clinical Trial Application, at which point Double-Crane would conduct two small confirmatory clinical trials—one for abdominal (liver and kidney) and one for cardiac. |
| • | Third, approval of the Import Drug License. If the regulatory and clinical trial processes are both successful, we currently estimate the timing for approval of DEFINITY in China will begin in 2018. |
We believe that international markets, particularly China, represent significant growth opportunities for our products. The Mallinckrodt and Double-Crane distribution agreements did not have a significant impact on our revenue during 2014.
We sell our products (and others) directly to end users through the four radiopharmacies we own in Canada, the two radiopharmacies we own in Australia and the two radiopharmacies we own in Puerto Rico. We also maintain our own direct sales forces in these markets so we can control the marketing, distribution and sale of our imaging agents in these regions.
Customers
For the year ended December 31, 2014, our largest customers were Cardinal, UPPI and GE Healthcare, accounting for approximately 18.0%, 11.0% and 8.8%, respectively, of our revenues.
Competition
We believe that our key product characteristics, such as proven efficacy, reliability and safety, coupled with our core competencies, such as our efficient manufacturing processes, our established distribution network, our experienced field sales organization and our customer service focus, are important factors that distinguish us from our competitors.
The market for diagnostic medical imaging agents is highly competitive and continually evolving. Our principal competitors in existing diagnostic modalities include large, global companies that are more diversified than we are and that have substantial financial, manufacturing, sales and marketing, distribution and other resources. These competitors include GE Healthcare, Bracco, Mallinckrodt, Bayer and Draxis, as well as other competitors. We cannot anticipate their competitive actions in the same or competing diagnostic modalities, such as significant price reductions on products that are comparable to our own, development of new products that are more cost-effective or have superior performance than our current products or the introduction of generic versions after our proprietary products lose their current patent protection. In addition, distributors of our products could attempt to shift end-users to competing diagnostic modalities and products. Our current or future products could be rendered obsolete or uneconomical as a result of these activities.
Generic competition has substantially eroded our market share for Cardiolite, beginning in September 2008 when the first generic product was launched. We are currently aware of four separate, third party generic offerings of sestamibi. We also sell our own generic version of sestamibi. See “Risk Factors—Risks Relating to Our Business and Industry—Generic competition has significantly eroded our market share of the MPI segment for Cardiolite products and will continue to do so.”
111
Table of Contents
Raw Materials and Supply Relationships
We rely on certain raw materials and supplies to produce our products. Due to the specialized nature of our products and the limited, and sometimes intermittent, supply of raw materials available in the market, we have established relationships with several key suppliers. Our most important and widely used raw material is Moly. For the year ended December 31, 2014, our largest supplier of raw materials and supplies was Nordion, accounting for approximately 16% of our total purchases.
Molybdenum-99
Our TechneLite, Cardiolite and Neurolite products all rely on Moly, the radioisotope which is produced by bombarding Uranium-235 with neutrons in research reactors. Moly is the most common radioisotope used for medical diagnostic imaging purposes. With a 66-hour half-life, Moly decays into among other things technetium 99m (Tc-99m), another radioisotope with a half-life of six hours. Tc-99m is the isotope that is attached to radiopharmaceuticals, including our own Cardiolite and Neurolite, during the labeling process.
We currently purchase finished Moly from four of the five main processing sites in the world, namely, ANSTO in Australia; IRE, in Belgium; Nordion, in Canada; and NTP, in South Africa. These processing sites are, in turn, supplied by seven of the eight main Moly-producing reactors in the world, namely, OPAL in Australia; BR2 in Belgium; OSIRIS in France; LVR-10 in the Czech Republic; High Flux Reactor, or HFR, located in The Netherlands; NRU located in Canada; and SAFARI located in South Africa.
Historically, our largest supplier of Moly has been Nordion, which relies on the NRU reactor for its supply of Moly. Our agreement with Nordion contains minimum percentage purchase requirements for Moly. The agreement allows for termination upon the occurrence of certain events. Nordion can terminate if we fail to purchase a minimum percentage of Moly or if Nordion incurs certain cost increases. Either party may terminate if the other party fails to comply with material obligations, is bankrupt or experiences a force majeure event subject to a waiting period. The current agreement expires on December 31, 2015, and the NRU reactor has announced a transition in 2016 from providing regular supply of medical isotopes to providing only emergency back-up supply of medical isotopes through March 2018.
Our agreement with NTP includes their consortium partner, ANSTO. ANSTO has under construction, in cooperation with NTP, a new Moly processing facility that ANSTO believes will expand its production capacity by approximately 2.5 times, with expanded commercial production planned to start in the latter part of 2016. In addition, IRE is currently in the process of expanding its production capability by up to 50% of its current capacity, and IRE expects this capacity expansion to be approved by its regulatory body by 2016. This new ANSTO and IRE production capacity is expected to replace the NRU’s current routine production. The NTP/ANSTO agreement contains minimum percentage volume requirements and provides for the increased supply of Moly derived from LEU targets from NTP and ANSTO. The agreement allows for termination upon the occurrence of certain events, including failure by NTP to provide our required amount of Moly, material breach of any provision by either party, bankruptcy by either party and force majeure events. Additionally, we have the ability to terminate the agreement with six months’ written notice prior to the expiration of the agreement. The agreement expires on December 31, 2017.
In March 2013, we entered into a similar agreement with IRE, or the IRE Agreement. IRE previously supplied us as a subcontractor under the agreement with NTP. Similar to the agreement with NTP, the IRE Agreement contains minimum percentage volume requirements. The IRE Agreement also requires IRE to provide certain increased quantities of Moly during periods of supply shortage or failure. The IRE Agreement also provides for an increased supply of Moly derived from LEU targets upon IRE’s completion of its ongoing conversion program to modify its facilities and processes in accordance with Belgian nuclear security commitments. The IRE Agreement allows for termination upon the occurrence of certain events, including failure by IRE to provide our required amount of Moly, material breach of any provision by either party, bankruptcy by either party and force majeure events. The IRE Agreement expires on December 31, 2017.
112
Table of Contents
To further augment and diversify our current supply, we are pursuing additional sources of Moly from potential new producers around the world that seek to produce Moly with existing or new reactors or technologies. In November 2014, we announced entering into a new strategic agreement with SHINE Medical Technologies, Inc., a Wisconsin-based company, or SHINE, for the future supply of Moly. Under the terms of the supply agreement, SHINE will provide Moly produced using its proprietary LEU-solution technology for use in our TechneLite generators once SHINE’s facility becomes operational and receives all necessary regulatory approvals, which SHINE currently estimates will occur in 2018. See “Item 1A—Risk Factors—The global supply of Moly is fragile and not stable. Our dependence on a limited number of third party suppliers for Moly could prevent us from delivering some of our products to our customers in the required quantities, with the required timeframe, or at all, which could result in order cancellations and decreased revenues.”
Xenon
Currently, Nordion is our sole supplier of Xenon, and we believe it is currently the principal supplier of Xenon in the world. Xenon is captured by the NRU reactor as a by-product of the Moly production process. Our agreement with Nordion is on a purchase order basis. In January 2015, we announced entering into a new strategic agreement with IRE for the future supply of Xenon. Under the terms of the agreement, IRE will provide bulk Xenon to us for processing and finishing once development work has been completed and all necessary regulatory approvals have been obtained. We currently estimate commercial production will occur in 2016. If we are not able to begin providing commercial quantities of Xenon prior to NRU reactor’s announced medical isotope supply transition in October 2016, there may be a period of time during which we are not able to offer Xenon in our portfolio of commercial products. See “Risk Factors—Risks Relating to our Business and Industry—We face potential supply and demand challenges for Xenon.”
Other Materials
We have additional supply arrangements for APIs, excipients, packaging materials and other materials and components, none of which are exclusive, but a number of which are sole source, and all of which we believe are either in good standing or replaceable without any material disruption to our business.
Manufacturing
We maintain manufacturing operations at our North Billerica, Massachusetts facility. We manufacture TechneLite on a highly automated production line and also manufacture Thallium and Gallium at this site using our cyclotron infrastructure. We manufacture, finish and distribute our radiopharmaceutical products on a just-in-time basis, and supply our customers with these products either by next day delivery services or by either ground or air custom logistics. We believe that our substantial capital investments in our highly automated generator production line, our cyclotrons and our extensive experience in complying with the stringent regulatory requirements for the handling of nuclear materials and operations in the FDA regulated environment create significant and sustainable competitive advantages for us.
In addition to our in-house manufacturing capabilities, a substantial portion of our products are manufactured by third party contract manufacturing organizations, and in certain instances, we rely on them for sole source manufacturing. To ensure the quality of the products that are manufactured by third parties, all raw materials used in those products are first sent to our North Billerica facility, where we test them prior to the third party manufacturing the final product. After the final products are manufactured, they are sent back to us for final quality control testing and then we ship them to our customers. We have expertise in the design, development and validation of complex manufacturing systems and processes, and our strong execution and quality control culture supports the just-in-time manufacturing model at our North Billerica facility.
113
Table of Contents
BVL, JHS and Pharmalucence
Historically, we relied on BVL as our sole manufacturer of DEFINITY, Neurolite and evacuation vials, an ancillary component for our TechneLite generators, and as one of our two manufacturers of Cardiolite. Following extended operational and regulatory challenges at BVL’s Bedford, Ohio facility, in March 2012, we entered into a settlement arrangement with BVL, resulting in an aggregate payment to us of $35.0 million, a broad mutual waiver and a covenant by us not to sue. Later in 2012 and in 2013, BVL continued to attempt to manufacture products for us, and in October 2013 announced that it would cease to manufacture new batches of our products at its Bedford, Ohio facility. In November 12, 2013, we entered into a second settlement arrangement with BVL, resulting in an additional aggregate payment to us of $8.9 million, a broad mutual waiver and a covenant by us not to sue.
Contemporaneous with the BVL supply challenges, we expedited a number of technology transfer programs to secure and qualify production of our BVL-manufactured products from alternate contract manufacturer sites.
| • | DEFINITY—We entered into a Manufacturing and Supply Agreement, effective as of February 1, 2012, with JHS, for the manufacture of DEFINITY. Under the agreement, JHS manufactures DEFINITY for us for an initial term of five years. We have the right to extend the agreement for an additional five-year period, with automatic renewals for additional one year periods thereafter. The agreement allows for termination upon the occurrence of certain events such as a material breach or default by either party, or bankruptcy by either party. The agreement also requires us to place orders for a minimum percentage of our requirements for DEFINITY with JHS. |
On November 12, 2013, we entered into a Manufacturing and Supply Agreement with Pharmalucence to manufacture and supply DEFINITY and we are currently in the technology transfer process with Pharmalucence in order to diversify our supply. We currently target filing for FDA approval to manufacture DEFINITY at Pharmalucence in 2015. There are no minimum purchase requirements under this agreement, which has an initial term of five years from the effective date and is renewable at our option for an additional five years. The Manufacturing Agreement allows for termination upon the occurrence of certain events, including material breach or bankruptcy by either party. During the optional five year term, either party may terminate upon thirty months advance notice. Based on our current projections, we believe that we will have sufficient supply of DEFINITY from JHS to meet expected demand.
| • | Cardiolite—We currently have one manufacturer for our Cardiolite supply. We also entered into a Manufacturing and Supply Agreement, effective as of May 3, 2012, with JHS for the manufacture of Cardiolite products, and we are currently in the technology transfer process. Under the agreement, JHS has agreed to manufacture product for an initial term of five years. We have the right to extend the agreement for an additional five-year period, with automatic renewals for additional one year periods thereafter. The agreement allows for termination upon the occurrence of specified events, including material breach or bankruptcy by either party. The agreement requires us to place orders for a minimum percentage of our requirements for Cardiolite with JHS during such term. Based on our current projections, we believe that we will have sufficient Cardiolite product supply from our current supplier and JHS when it has completed the technology transfer process and we have obtained regulatory approval for this manufacturing site to meet expected demand. |
| • | Neurolite—We entered into a Manufacturing and Supply Agreement, effective as of May 3, 2012, with JHS for the manufacture of Neurolite, and in January 2015 the FDA granted approval to JHS to be a new manufacturing site for this product. Under the agreement, JHS has agreed to manufacture product for an initial term of five years. We have the right to extend the agreement for an additional five-year period, with automatic renewals for additional one year periods thereafter. The agreement allows for termination upon the occurrence of specified events, including material breach or bankruptcy by either party. The agreement also requires us to place orders for a minimum percentage of our requirements for Neurolite with JHS during such term. Based on current projections, we believe that we will have sufficient supply of Neurolite from JHS to meet expected demand. |
114
Table of Contents
Although we are pursuing new manufacturing relationships to establish and secure additional long-term or alternative suppliers as described above, we are uncertain of the timing as to when these arrangements could provide meaningful quantities of product. See “Risk Factors—Risks Relating to Our Business and Industry—The global supply of Moly is fragile and not stable. Our dependence on a limited number of third party suppliers for Moly could prevent us from delivering some of our products to our customers in the required quantities, within the required timeframes, or at all, which could result in order cancellations and decreased revenues,” “Risk Factors—Risks Relating to Our Business and Industry—Challenges with product quality or product performance, including defects, caused by us or our suppliers could result in a decrease in customers and sales, unexpected expenses and loss of market share” and “Risk Factors—Risks Relating to Our Business and Industry—Our business and industry are subject to complex and costly regulations. If government regulations are interpreted or enforced in a manner adverse to us or our business, we may be subject to enforcement actions, penalties, exclusion and other material limitations on our operations.”
PET Manufacturing Facilities
If flurpiridaz F 18 is ultimately successful in clinical trials, a new manufacturing model will have to be implemented where chemical ingredients of the imaging agent are provided to PET radiopharmacies that have fluorine-18 radioisotope-producing cyclotrons on premises. The radiopharmacies will combine these chemical ingredients with fluorine-18 they have manufactured in specially designed chemistry synthesis boxes to generate the final radiopharmaceutical imaging agent, flurpiridaz F 18. Radiopharmacists will be able to prepare and dispense patient-specific doses from the final product. However, because each of these PET radiopharmacies will be deemed by the FDA to be a separate manufacturing site for flurpiridaz F 18, each of the radiopharmacies will have to be included in the agent’s NDA and subsequent FDA filings. As a result, there will be quality and oversight responsibilities of the PET radiopharmacies associated with the NDA, unlike the current relationship we have with our nuclear imaging agent distributors that operate radiopharmacies. See “—Research and Development—Flurpiridaz F 18 Phase 3 Program.”
Research and Development
For the years ended December 31, 2014, 2013 and 2012, we invested $13.7 million, $30.5 million and $40.6 million, respectively, in R&D. Our R&D team includes our medical affairs and medical information functions, which educate physicians on the scientific aspects of our commercial products and the approved indications, labeling and the receipt of reports relating to product quality or adverse events. We have developed a pipeline of three potential cardiovascular imaging agents which were discovered and developed in-house and which are protected by patents and patent applications we own in the United States and numerous foreign jurisdictions.
In March 2013, we began to implement a strategic shift in how we will fund our important R&D programs. We have reduced, over time, our internal R&D resources while at the same time we seek to engage strategic partners to assist us in the further development and commercialization of these agents, including flurpiridaz F 18, 18F LMI 1195 and LMI 1174. See “Risk Factors—Risks Relating to our Business and Industry—We will not be able to further develop or commercialize our agents in development without successful strategic partners.”
Flurpiridaz F 18—PET Perfusion Agent—Myocardial Perfusion
We have developed flurpiridaz F 18, an internally discovered small molecule radiolabeled with fluorine-18, as an imaging agent used in PET MPI to assess blood flow to the heart.
Today, most MPI procedures use SPECT technology. Although this imaging provides substantial clinical value, there is growing interest in the medical community to utilize technology such as PET that can provide meaningful advantages. PET is an imaging technology that when used in combination with an appropriate radiopharmaceutical imaging agent can provide important insights into physiologic and metabolic processes in the body and be useful in evaluating a variety of conditions including heart disease, cancer and neurologic disease. PET imaging has demonstrated broad utility for diagnosis, prognosis, disease staging and therapeutic
115
Table of Contents
response. Images generated with PET technology typically exhibit very high image resolution because of substantially higher signal-to-noise efficiency, a measure of the efficiency by which energy can be captured to create an image.
Although SPECT imaging used in conjunction with a radiopharmaceutical imaging agent, such as Cardiolite, is most commonly used for MPI studies, PET imaging has gained considerable support in the field of cardiovascular imaging as it offers many advantages to SPECT imaging, including: higher image quality, increased diagnostic certainty, more accurate risk stratification and reduced patient radiation exposure. In addition, PET MPI imaging could be particularly useful in difficult to image patients, including women, obese patients and patients with multi-vessel disease. The use of PET technology in MPI tests represents a broad emerging application for a technology more commonly associated with oncology and neurology. We anticipate that the adoption of PET technology in MPI tests will increase significantly in the future.
Flurpiridaz F 18 Clinical Overview
We submitted an Investigational New Drug Application, or IND, for flurpiridaz F 18 to the FDA in August 2006. Our clinical program to date has consisted of three Phase 1 studies, a Phase 2 clinical trial, conducted from 2007 to 2010, involving a total of 208 subjects who received PET MPI performed with flurpiridaz F 18 and a Phase 3 clinical trial conducted from 2011 to 2013 involving 920 subjects who received PET MPI procedures with flurpiridaz F 18.
Flurpiridaz F 18 Phase 2 Trial
We evaluated flurpiridaz F 18 in a Phase 2 trial consisting of 176 subjects from 21 centers. These subjects underwent both SPECT and PET MPI with flurpiridaz at rest and at stress and were evaluated for safety. Of these subjects, 86 underwent coronary angiography, the current standard clinical method for diagnosing coronary artery disease. Coronary angiography is an invasive procedure using fluoroscopy performed in a cardiac catheterization lab while the subject is under mild sedation. These 86 subjects formed the population for evaluating diagnostic performance.
The PET MPI that was performed with flurpiridaz F 18 at stress utilized either pharmacological coronary vasodilation or treadmill exercise. Unlike currently available PET imaging agents for MPI with half-lives measured in seconds, flurpiridaz F 18 can be used in conjunction with treadmill exercise given its substantially longer 110 minute half-life.
The Phase 2 trial results showed the following:
| • | a significantly higher percentage of images were rated as either excellent or good quality with PET imaging, compared to SPECT imaging for stress images (98.8% vs. 84.9%, p<0.01) and rest images (95.3% vs. 69.8%, p<0.01); |
| • | diagnostic certainty of interpretation, the percentage of cases with definitely abnormal or definitely normal interpretation, was significantly higher for flurpiridaz F 18 compared to SPECT (90.7% vs. 75.6%, p<0.01); |
| • | the area under the ROC curve (the relative operating characteristic curve comparing the true positive rate to the false positive rate for coronary artery disease diagnosis) was significantly higher for flurpiridaz F 18 than SPECT (0.82±0.05 vs. 0.70±0.05, p<0.05), indicating higher diagnostic performance; |
| • | superiority for sensitivity (that is, the ability to identify disease) with flurpiridaz F 18 imaging was significantly higher than SPECT (78.8% vs. 61.5%, p=0.02); |
| • | a trend toward higher specificity (that is, the ability to rule out disease) was noted, although the advantage was not statistically significant in the study; and |
| • | no drug-related serious adverse events were observed, demonstrating a positive safety profile for PET MPI imaging with flurpiridaz F 18. |
116
Table of Contents
Flurpiridaz F 18 Phase 3 Program
To date, our Phase 3 program for flurpiridaz F 18 has included a phase 3 trial (study 301), which was an open-label, multicenter, international study enrolling 795 subjects with known or suspected CAD and scheduled for coronary angiography and SPECT imaging. Subjects underwent flurpiridaz F 18 PET MPI and SPECT MPI studies with coronary angiography used as the truth standard for each. The study then compared MPI imaging using flurpiridaz F 18 versus SPECT with primary endpoints of superiority for sensitivity (identifying disease) and non-inferiority for specificity (ruling out disease).
In March 2011, we obtained agreement from the FDA on an SPA for the 301 trial. See “Business—Regulatory Matters—Food and Drug Laws.” In June 2011, we enrolled our first patient, and we completed patient enrollment in the third quarter of 2013.
In the fourth quarter of 2013, we announced preliminary results from the 301 trial. Flurpiridaz F 18 appeared to be well-tolerated from a safety perspective and outperformed SPECT in a highly statistically significant manner in sensitivity. In addition, flurpiridaz F 18 showed statistically significant improvements in image quality and diagnostic certainty in comparison to SPECT. However, flurpiridaz F 18 did not meet the co-primary endpoint of non-inferiority for specificity.
In the fourth quarter of 2014, we completed a re-read of the 301 trial results, and in May 2015 we announced the complete results from the 301 trial. PET MPI with flurpiridaz F 18 consistently showed a balanced performance in sensitivity and specificity, when compared to coronary angiography, while SPECT imaging results were skewed with low sensitivity and high specificity when compared to coronary angiography. When the flurpiridaz F 18 results were compared to the SPECT results, flurpiridaz F 18 substantially outperformed SPECT in sensitivity but did not meet the non-inferiority endpoint in specificity, implying a substantial and unexpected under-diagnosis of CAD with SPECT imaging in the trial.
In subgroup analyses, the risk-benefit profile of flurpiridaz F 18 appeared to be favorable in women, obese patients and patients with multivessel disease. A significantly higher percentage of images were rated as either excellent or good with flurpiridaz F 18 as compared to SPECT, leading to a greater diagnostic certainty of interpretation. Importantly, radiation exposure associated with flurpiridaz F 18 was reduced to approximately 50% of SPECT. In addition, no drug-related serious adverse events were observed.
Based on these results, we have redesigned the protocol for our second Phase 3 trial, including different primary endpoints. On March 13, 2015, the FDA granted us an SPA in connection with the new trial. We are now in active discussions with a number of prospective partners for the further development and commercialization of this promising agent. See “Item 1A—Risk Factors—The process of developing new drugs and obtaining regulatory approval is complex, time-consuming and costly, and the outcome is not certain.”
18F LMI 1195—Cardiac Neuronal Activity Imaging Agent
We have developed 18F LMI 1195, also an internally discovered small molecule that is a fluorine-18-based radiopharmaceutical imaging agent, designed to assess cardiac sympathetic nerve function with PET. Sympathetic nerve activation increases the heart rate, constricts blood vessels and raises blood pressure by releasing a neurotransmitter called norepinephrine throughout the heart. Changes in the cardiac sympathetic nervous system have been associated with heart failure progression and fatal arrhythmias.
Heart failure is a major public health problem in North America, associated with high morbidity and mortality, frequent hospitalizations and a major cost burden on the community. In the United States alone, there are over five million patients living with congestive heart failure, and over a half million new diagnoses each year. Mortality for this condition is around 50% within five years of diagnosis. Expensive therapies for heart failure are often utilized without effective predictors of patient response. Costly device therapies (for example, implantable cardiac defibrillators, or ICDs, and cardiac resynchronization therapy) are often used, although they
117
Table of Contents
sometimes do not provide any benefits or are activated in only a minority of recipients. Conversely, heart failure clinical practice guidelines currently preclude the use of device therapy in many patients who might benefit. Thus, a key opportunity is to better match patients to treatment based on the identification of the underlying molecular status of disease progression.
18F LMI 1195 is taken up by the transporter that regulates norepinephrine released by the sympathetic nervous system at multiple nerve endings of the heart. PET imaging using 18F LMI 1195 could allow for the identification of patients at risk of sudden death, potentially improving clinical decision-making, including identifying which patients could benefit from certain drug therapies or the implantation of certain anti-arrhythmia devices such as ICDs.
We have completed a Phase 1 study of 18F LMI 1195 using PET imaging. 12 normal subjects were injected intravenously with approximately six millicuries of 18F LMI 1195, imaged sequentially for a period of approximately five hours and monitored closely to observe any potential adverse events. Excellent quality images were obtained, and the radiation dose to the subjects was found to be well within acceptable limits. Blood radioactivity cleared quickly and lung activity was low throughout the study. The agent appeared to have a favorable safety profile. We are seeking to engage strategic partners to assist us with the ongoing development activities relating to this agent.
LMI 1174—Vascular Remodeling Imaging Agent
We have developed LMI 1174, an internally discovered gadolinium-based MRI agent targeted to elastin in the arterial walls and atherosclerotic plaque. We believe that this agent could allow assessment of plaque location, burden, type of arterial wall remodeling and, as a result, the potential for a vascular event, which, in turn, could lead to heart attack or stroke.
Atherosclerosis is the leading cause of heart attacks, strokes and peripheral vascular disease. Elastin plays a key role in the structure of the arterial wall and in biological signaling functions. Several pathological stimuli may be responsible for triggering elastogenesis in atherosclerosis, leading to a marked increase in elastin content during plaque development. In addition to the increase in elastin seen in autopsy samples from patients with carotid atherosclerosis, there is also an increase of elastin in aortic aneurysm samples. As a result, an elastin-specific imaging agent may facilitate detection of remodeling of the arterial walls.
The majority of the assessments of atherosclerosis are currently obtained using angiography or MPI. MRI using LMI 1174 could allow for the identification, on a minimally-invasive basis without radiation exposure, of the presence and characteristics of atherosclerosis, potentially improving clinical decision-making to reduce the risks of cardiovascular events.
In our preclinical work, we have identified a series of low molecular weight molecules that bind to elastin and final optimization is ongoing. Our lead molecule, LMI 1174, has been used to demonstrate utility in a number of different animal models. We are seeking to engage strategic partners to assist us with the ongoing development activities relating to this agent.
Intellectual Property
Patents, trademarks and other intellectual property rights, both in the United States and foreign countries, are very important to our business. We also rely on trade secrets, manufacturing know-how, technological innovations and licensing agreements to maintain and improve our competitive position. We review third party proprietary rights, including patents and patent applications, as available, in an effort to develop an effective intellectual property strategy, avoid infringement of third party proprietary rights, identify licensing opportunities and monitor the intellectual property owned by others. Our ability to enforce and protect our intellectual property rights may be limited in certain countries outside the United States, which could make it easier for competitors to
118
Table of Contents
capture market position in those countries by utilizing technologies that are similar to those developed or licensed by us. Competitors also may harm our sales by designing products that mirror the capabilities of our products or technology without infringing our intellectual property rights. If we do not obtain sufficient protection for our intellectual property, or if we are unable to effectively enforce our intellectual property rights, our competitiveness could be impaired, which would limit our growth and future revenue.
Trademarks, Service Marks and Trade Names
We own various trademarks, service marks and trade names, including DEFINITY, TechneLite, Cardiolite, Neurolite, Ablavar, Vialmix, Quadramet (U.S. only) and Lantheus Medical Imaging. We have registered these trademarks, as well as others, in the United States and numerous foreign jurisdictions.
Patents
We actively seek to protect the proprietary technology that we consider important to our business, including chemical species, compositions and formulations, their methods of use and processes for their manufacture, as new intellectual property is developed. In addition to seeking patent protection in the United States, we file patent applications in numerous foreign countries in order to further protect the inventions that we consider important to the development of our international business. We also rely upon trade secrets and contracts to protect our proprietary information. As of April 30, 2015, our patent portfolio included a total of 36 issued U.S. patents, 193 issued foreign patents, 20 pending patent applications in the United States and 159 pending foreign applications. These patents include claims covering the composition of matter and methods of use for all of our preclinical and clinical stage agents.
Our patents cover many of our commercial products, and our current patent protection is generally in the United States, Canada, Mexico, most of Western Europe and Scandinavia (including Austria, Belgium, Denmark, Finland, France, Germany, Great Britain, Italy, Luxembourg, Netherlands, Norway, Spain, Switzerland and Sweden), and markets in Asia (including China, Hong Kong, Japan, Singapore and South Korea) and Latin America (including Chile and Brazil). For DEFINITY, we hold a number of different compositions of matter, use, formulation and manufacturing patents, with U.S. patent protection until 2021 and patent or regulatory extension protection in Canada, Europe and parts of Asia until 2019, and we have an active next generation development program for this agent. TechneLite currently has patent protection in the United States and various foreign countries on certain component technology expiring in 2029. In addition, given the significant know-how and trade secrets associated with the methods of manufacturing and assembling the TechneLite generator, we believe we have a substantial amount of valuable and defensible proprietary intellectual property associated with the product. Neither Cardiolite nor Neurolite is covered any longer by patent protection in either the United States or the rest of the world. For Ablavar, we hold a number of different compositions of matter, use, formulation and manufacturing patents, with the last U.S. patent not expiring until 2020 with regulatory extension and a manufacturing patent application, which if granted, will expire in 2034 in the absence of any patent term adjustment or regulatory extension. Thallium, Gallium and Xenon are all generic radiopharmaceuticals.
We have numerous patents and patent applications relating to our clinical development pipeline. We have patents in numerous jurisdictions covering composition, use, formulation and manufacturing of flurpiridaz F 18, including in the United States a composition patent expiring in 2026 and a method of use patent expiring in 2028 in the absence of any regulatory extension, and various patent applications, one of which, if granted, will expire in 2033. We also have patents and patent applications in numerous jurisdictions covering composition, use, and synthesis of 18F LMI 1195, our cardiac neuronal imaging agent, some of which, if granted, will expire in 2027 and some in 2031 in the absence of any patent term adjustment or regulatory extensions, in the United States a composition patent expiring in 2030 in the absence of any regulatory extension, and in Europe a composition patent expiring in 2027 in the absence of any regulatory extension. Additionally, we have patent applications in numerous jurisdictions covering composition, use and synthesis of LMI 1174, our vascular remodeling imaging
119
Table of Contents
agent, some of which if granted, will expire in 2029 and some in 2030 in the absence of any patent term adjustment or regulatory extensions and in the United States a composition and method of use patent expiring in 2031 in the absence of any regulatory extension.
In addition to patents, we rely where necessary upon unpatented trade secrets and know-how, proprietary information and continuing technological innovation to develop and maintain our competitive position. We seek to protect our proprietary information, in part, using confidentiality agreements with our collaborators, employees, consultants and other third parties and invention assignment agreements with our employees. These confidentiality agreements may not prevent unauthorized disclosure of trade secrets and other proprietary information, and we cannot assure you that an employee or an outside party will not make an unauthorized disclosure of our trade secrets, other technical know-how or proprietary information. We may not have adequate monitoring abilities to discover, or adequate remedies for, any unauthorized disclosure. This might happen intentionally or inadvertently. It is possible that a competitor will make use of such information, and that our competitive position will be compromised, in spite of any legal action we might take against persons making such unauthorized disclosures. In addition, our trade secrets may otherwise become known or be independently discovered by competitors. To the extent that our collaborators, employees and consultants use intellectual property owned by others in their work for us, disputes may arise as to the rights in related or resulting know-how and inventions.
In addition, we license a limited number of third party technologies and other intellectual property rights that are incorporated into some elements of our drug discovery and development efforts. These licenses are not material to our business, and the technologies can be obtained from multiple sources. We are currently party to separate royalty-free, non-exclusive, cross-licenses with each of Bracco, GE Healthcare and Imcor Pharmaceutical Company. These cross-licenses give us freedom to operate in connection with contrast enhanced ultrasound imaging technology. We also in-license certain freedom to operate rights for Ablavar from, among others, Bayer.
Regulatory Matters
Food and Drug Laws
The development, manufacture, sale and distribution of our products are subject to comprehensive governmental regulation both within and outside the United States. A number of factors substantially increase the time, difficulty and costs incurred in obtaining and maintaining the approval to market newly developed and existing products. These factors include governmental regulation, such as detailed inspection of and controls over research and laboratory procedures, clinical investigations, manufacturing, marketing, sampling, distribution, import and export, record keeping and storage and disposal practices, together with various post-marketing requirements. Governmental regulatory actions can result in the seizure or recall of products, suspension or revocation of the authority necessary for their production and sale as well as other civil or criminal sanctions.
Our activities in the development, manufacture, packaging or repackaging of our pharmaceutical and medical device products subjects us to a wide variety of laws and regulations. We are required to register for permits and/or licenses with, seek approvals from and comply with operating and security standards of the FDA, the NRC, the HHS, Health Canada, the EMA, MHRA, the CFDA and various state and provincial boards of pharmacy, state and provincial controlled substance agencies, state and provincial health departments and/or comparable state and provincial agencies, as well as foreign agencies, and certain accrediting bodies depending upon the type of operations and location of product distribution, manufacturing and sale.
The FDA and various state regulatory authorities regulate the research, testing, manufacture, safety, labeling, storage, recordkeeping, premarket approval, marketing, advertising and promotion, import and export and sales and distribution of pharmaceutical products in the United States. Prior to marketing a pharmaceutical product, we must first receive FDA approval. Specifically, in the United States, the FDA regulates drugs under the Federal Food, Drug, and Cosmetic Act, or FDCA, and the Public Health Service Act, and implementing
120
Table of Contents
regulations. The process of obtaining regulatory approvals and compliance with appropriate federal, state, local, and foreign statutes and regulations require the expenditure of substantial time and financial resources. Currently, the process required by the FDA before a drug product may be marketed in the United States generally involves the following:
| • | completion of preclinical laboratory tests, animal studies and formulation studies according to Good Laboratory Practices regulations; |
| • | submission to the FDA of an IND which must become effective before human clinical studies may begin; |
| • | performance of adequate and well-controlled human clinical studies according to Good Clinical Practices and other requirements, to establish the safety and efficacy of the proposed drug product for its intended use; |
| • | submission to the FDA of a NDA, for a new drug; |
| • | satisfactory completion of an FDA inspection of the manufacturing facility or facilities at which the drug product is produced to assess compliance with current cGMPs regulations; and |
| • | FDA review and approval of the NDA. |
The testing and approval process requires substantial time, effort, and financial resources, and we cannot be certain that any approvals for our agents in development will be granted on a timely basis, if at all. Once a pharmaceutical agent is identified for development, it enters the preclinical testing stage. Preclinical tests include laboratory evaluations of product chemistry, toxicity, formulation, and stability, as well as animal studies to assess its potential safety and efficacy. This testing culminates in the submission of the IND to the FDA.
Once the IND becomes effective, the clinical trial program may begin. Each new clinical trial protocol must be submitted to the FDA before the study may begin. Human clinical studies are typically conducted in three sequential phases that may overlap or be combined:
Phase 1. The agent is initially introduced into healthy human subjects and tested for safety, dosage tolerance, absorption, metabolism, distribution and excretion. In the case of some products for severe or life-threatening diseases, especially when the agent may be too inherently toxic to ethically administer to healthy volunteers, the initial human testing is often conducted in patients with those diseases.
Phase 2. Involves studies in a limited patient population to identify possible adverse effects and safety risks, to evaluate preliminarily the efficacy of the agent for specific targeted diseases and to determine dosage tolerance and optimal dosage and schedule.
Phase 3. Clinical studies are undertaken to further evaluate dosage, clinical efficacy and safety in an expanded patient population at geographically dispersed clinical study sites. These studies are intended to collect sufficient safety and effectiveness data to support the NDA for FDA approval.
Clinical trial sponsors may request an SPA from the FDA. The FDA’s SPA process creates a written agreement between the sponsoring company and the FDA regarding the clinical trial design and other clinical trial issues that can be used to support approval of an agent. The SPA is intended to provide assurance that, if the agreed-upon clinical trial protocols are followed and the trial endpoints are achieved, then the data may serve as the primary basis for an efficacy claim in support of an NDA. However, the SPA agreement is not binding on the FDA and is not a guarantee of an approval of an agent or any permissible claims about the agent.
Progress reports detailing the results of the clinical studies must be submitted at least annually to the FDA and safety reports must be submitted to the FDA and the investigators for serious and unexpected adverse events. Submissions must also be made to inform the FDA of certain changes to the clinical trial protocol. Federal law also requires the sponsor to register the trials on public databases when they are initiated, and to disclose the results of the trials on public databases upon completion. Phase 1, Phase 2 and Phase 3 testing may not be
121
Table of Contents
completed successfully within any specified period, if at all. The FDA or the clinical trial sponsor may suspend or terminate a clinical study at any time on various grounds, including a finding that the research subjects or patients are being exposed to an unacceptable health risk. Similarly, any institutional review board, or IRB, serving any of the institutions participating in the clinical trial can suspend or terminate approval of a clinical study at a relevant institution if the clinical study is not being conducted in accordance with the IRB’s requirements or if the agent has been associated with unexpected serious harm to patients. Failure to register a clinical trial or disclose study results within the required time periods could result in penalties, including civil monetary penalties.
Concurrent with clinical studies, companies usually complete additional animal studies and must also develop additional information about the chemistry and physical characteristics of the product and finalize a process for manufacturing the product in commercial quantities in accordance with cGMP requirements. The manufacturing process must be capable of consistently producing quality batches of the agent and, among other things, the manufacturer must develop methods for testing the identity, strength, quality and purity of the final product. Additionally, appropriate packaging must be selected and tested and stability studies must be conducted to demonstrate that the agent does not undergo unacceptable deterioration over its shelf life.
The results of product development, preclinical studies and clinical studies, along with descriptions of the manufacturing process, analytical tests conducted on the drug product, proposed labeling, and other relevant information, are submitted to the FDA as part of an NDA for a new drug, requesting approval to market the agent. The submission of an NDA is subject to the payment of a substantial user fee, pursuant to the Prescription Drug User Fee Act, or PDUFA, which was first enacted in 1992 to provide the FDA with additional resources to speed the review of important new medicines. A waiver of that fee may be obtained under certain limited circumstances. PDUFA expires every five years and must be reauthorized by Congress. The current version of PDUFA, the fifth reauthorization, was renewed as Title I of the FDA Safety and Innovation Act, or PDUFA V in 2012 and is scheduled to expire in 2017.
The approval process is lengthy and difficult and the FDA may refuse to approve an NDA if the applicable regulatory criteria are not satisfied. The FDA has substantial discretion in the product approval process, and it is impossible to predict with any certainty whether and when the FDA will grant marketing approval. The FDA may on occasion require the sponsor of an NDA to conduct additional clinical studies or to provide other scientific or technical information about the product, and these additional requirements may lead to unanticipated delay or expense. Even if such data and information are submitted, the FDA may ultimately decide that the NDA does not satisfy the criteria for approval. Data obtained from clinical studies are not always conclusive, and the FDA may interpret data differently than we interpret the same data.
If a product receives regulatory approval, the approval may be significantly limited to specific diseases and dosages or the indications for use may otherwise be limited, which could restrict the commercial value of the product. Further, the FDA may require that certain contraindications, warnings or precautions be included in the product labeling. In addition, the FDA may require Phase 4 testing which involves clinical studies designed to further assess a drug product’s safety and effectiveness after NDA approval. The FDA also may impose a Risk Evaluation and Mitigation Strategy, or REMS, to ensure that the benefits of a product outweigh its risks. A REMS could add training requirements for healthcare professionals, safety communications efforts and limits on channels of distribution, among other things. The sponsor would be required to evaluate and monitor the various REMS activities and adjust them if need be. Whether a REMS would be imposed on any of our products and any resulting financial impact is uncertain at this time.
Any drug products for which we receive FDA approvals are subject to continuing regulation by the FDA, including, among other things, record-keeping requirements, reporting of adverse experiences with the product, providing the FDA with updated safety and efficacy information, product sampling and distribution requirements, complying with certain electronic records and signature requirements, and complying with FDA promotion and advertising requirements. The FDA strictly regulates labeling, advertising, promotion and other types of information on products that are placed on the market. Drugs may be promoted only for the approved
122
Table of Contents
indications and in accordance with the provisions of the approved label and promotional claims must be appropriately balanced with important safety information and otherwise be adequately substantiated. Further, manufacturers of drugs must continue to comply with cGMP requirements, which are extensive and require considerable time, resources and ongoing investment to ensure compliance. In addition, changes to the manufacturing process generally require prior FDA approval before being implemented, and other types of changes to the approved product, such as adding new indications and additional labeling claims, are also subject to further FDA review and approval.
Drug product manufacturers and other entities involved in the manufacturing and distribution of approved drugs products are required to register their establishments with the FDA and certain state agencies, and are subject to periodic unannounced inspections by the FDA and certain other agencies for compliance with cGMP and other laws. The cGMP requirements apply to all stages of the manufacturing process, including the production, processing, sterilization, packaging, labeling, storage and shipment of the drug product. Manufacturers must establish validated systems to ensure that products meet specifications and regulatory standards, and test each product batch or lot prior to its release. In addition, manufacturers of commercial PET products, including radiopharmacies, hospitals and academic medical centers, are required to submit either an NDA or Abbreviated New Drug Application, or ANDA, in order to produce PET drugs for clinical use, or produce the drugs under an IND.
The FDA also regulates the preclinical and clinical testing, design, manufacture, safety, efficacy, labeling, storage, record keeping, sales and distribution, postmarket adverse event reporting, import/export and advertising and promotion of any medical devices that we distribute pursuant to the FDCA and FDA’s implementing regulations. The Federal Trade Commission shares jurisdiction with the FDA over the promotion and advertising of certain medical devices. The FDA can also impose restrictions on the sale, distribution or use of medical devices at the time of their clearance or approval, or subsequent to marketing. Currently, two medical devices, both of which are manufactured by third parties which hold the product clearances, comprise only a small portion of our revenues.
The FDA may withdraw marketing authorization for a pharmaceutical or medical device product if compliance with regulatory standards is not maintained or if problems occur after the product reaches the market. Later discovery of previously unknown problems with a product may result in restrictions on the product or even complete withdrawal of the product from the market. Further, the failure to maintain compliance with regulatory requirements may result in administrative or judicial actions, such as fines, warning letters, holds on clinical studies, product recalls or seizures, product detention or refusal to permit the import or export of pharmaceuticals or medical device products, refusal to approve pending applications or supplements, restrictions on marketing or manufacturing, injunctions, or civil or criminal penalties.
Because our operations include nuclear pharmacies and related businesses, such as cyclotron facilities used to produce PET products used in diagnostic medical imaging, we are subject to regulation by the NRC or the departments of health of each state in which we operate and the applicable state boards of pharmacy. In addition, the FDA is also involved in the regulation of cyclotron facilities where PET products are produced and compliance with cGMP requirements and United States Pharmacopeia requirements for PET drug compounding.
Drug laws also are in effect in many of the non-U.S. markets in which we conduct business. These laws range from comprehensive drug approval requirements to requests for product data or certifications. In addition, inspection of and controls over manufacturing, as well as monitoring of adverse events, are components of most of these regulatory systems. Most of our business is subject to varying degrees of governmental regulation in the countries in which we operate, and the general trend is toward increasingly stringent regulation. The exercise of broad regulatory powers by the FDA continues to result in increases in the amount of testing and documentation required for approval or clearance of new drugs and devices, all of which add to the expense of product introduction. Similar trends also are evident in major non-U.S. markets, including Canada, the European Union, Australia and Japan.
123
Table of Contents
To assess and facilitate compliance with applicable FDA, NRC and other state, federal and foreign regulatory requirements, we regularly review our quality systems to assess their effectiveness and identify areas for improvement. As part of our quality review, we perform assessments of our suppliers of the raw materials that are incorporated into products and conduct quality management reviews designed to inform management of key issues that may affect the quality of our products. From time to time, we may determine that products we manufactured or marketed do not meet our specifications, published standards, such as those issued by the International Standards Organization, or regulatory requirements. When a quality or regulatory issue is identified, we investigate the issue and take appropriate corrective action, such as withdrawal of the product from the market, correction of the product at the customer location, notice to the customer of revised labeling and other actions.
Drug Price Competition and Patent Term Restoration Act of 1984
The Drug Price Competition and Patent Term Restoration Act of 1984, known as the Hatch-Waxman Act, added two pathways for FDA drug approval. First, the Hatch-Waxman Act permits the FDA to approve ANDAs for generic versions of drugs if the ANDA applicant demonstrates, among other things, that its product is bioequivalent to the innovator product and provides relevant chemistry, manufacturing and product data. Second, the Hatch Waxman Act created what is known as a Section 505(b)(2) NDA, which requires the same information as a full NDA (known as a Section 505(b)(1) NDA), including full reports of clinical and preclinical studies but allows some of the information from the reports required for marketing approval to come from studies which the applicant does not own or have a legal right of reference. A Section 505(b)(2) NDA permits a manufacturer to obtain marketing approval for a drug without needing to conduct or obtain a right of reference for all of the required studies. The Hatch-Waxman Act also provides for: (1) restoration of a portion of a product’s patent term that was lost during clinical development and application review by the FDA; and (2) statutory protection, known as exclusivity, against the FDA’s acceptance or approval of certain competitor applications.
Patent term extension can compensate for time lost during product development and the regulatory review process by returning up to five years of patent life for a patent that covers a new product or its use. This period is generally one-half the time between the effective date of an IND and the submission date of an NDA, plus the time between the submission date of an NDA and the approval of that application. Patent term extensions, however, are subject to a maximum extension of five years, and the patent term extension cannot extend the remaining term of a patent beyond a total of 14 years. The application for patent term extension is subject to approval by the U.S. Patent and Trademark Office in conjunction with the FDA.
The Hatch-Waxman Act also provides for a period of statutory protection for new drugs that receive NDA approval from the FDA. If the FDA approves a Section 505(b)(1) NDA for a new drug that is a new chemical entity, meaning that the FDA has not previously approved any other new drug containing any same active moiety, then the Hatch-Waxman Act prohibits the submission or approval of an ANDA or a Section 505(b)(2) NDA, for a period of five years from the date of approval of the NDA, except that the FDA may accept an application for review after four years under certain circumstances. The Hatch-Waxman Act will not prevent the filing or approval of a full NDA, as opposed to an ANDA or Section 505(b)(2) NDA, for any drug, but the competitor would be required to conduct its own clinical trials, and any use of the drug for which marketing approval is sought could not violate another NDA holder’s patent claims. The Hatch-Waxman Act provides for a three-year period of exclusivity for an NDA for a new drug containing an active moiety that was previously approved by the FDA, but also includes new clinical data (other than bioavailability and bioequivalence studies) to support an innovation over the previously approved drug and those studies were conducted or sponsored by the applicant and were essential to approval of the application. This three year exclusivity period does not prohibit the FDA from accepting an application from a third party for a drug with that same innovation, but it does prohibit the FDA from approving that application for the three year period. The three year exclusivity does not prohibit the FDA, with limited exceptions, from approving generic drugs containing the same active ingredient but without the new innovation.
124
Table of Contents
Healthcare Reform Act and Related Laws
The Healthcare Reform Act substantially changes the way in which healthcare is financed by both governmental and private insurers and has a significant impact on the pharmaceutical industry. The Healthcare Reform Act contains a number of provisions that affect coverage and reimbursement of drug products and the medical imaging procedures in which our drug products are used. Key provisions, include the following:
| • | significantly increasing the presumed utilization rate for imaging equipment costing $1 million or more in the physician office and free-standing imaging facility setting which reduces the Medicare per procedure medical imaging reimbursement—which presumed utilization rate was further increased effective January 1, 2014; |
| • | increasing drug rebates paid to state Medicaid programs under the Medicaid Drug Rebate Program for brand name prescription drugs and extending those rebates to Medicaid managed care organizations; |
| • | imposing a non-deductible annual fee on manufacturers and importers of brand name prescription drugs reimbursed under certain federal government programs, including Medicare and Medicaid; and |
| • | imposing an excise tax on the sale of taxable medical devices, to be paid by the entity that manufactures or imports the device. |
The Healthcare Reform Act also establishes an Independent Payment Advisory Board, or IPAB, to reduce the per capita rate of growth in Medicare spending by proposing changes to Medicare payments if expenditures exceed certain targets. A proposal made by the IPAB must be implemented by CMS, unless Congress adopts a proposal that achieves the necessary savings. IPAB proposals may impact payments for physician and free-standing imaging services beginning in 2015 and for hospital services beginning in 2020. The threshold for triggering IPAB proposals has not been reached, so no adjustments will be made under the IPAB until 2017 (at the earliest).
The Healthcare Reform Act also amended the federal self-referral laws, requiring referring physicians to inform patients under certain circumstances that the patients may obtain services, including MRI, CT, PET and certain other diagnostic imaging services, from a provider other than that physician, another physician in his or her group practice, or another individual under direct supervision of the physician or another physician in the group practice. The referring physician must provide each patient with a written list of other suppliers who furnish those services in the area in which the patient resides. These new requirements could have the effect of shifting where certain diagnostic medical imaging procedures are performed.
In addition, the Budget Control Act of 2011 includes provisions to reduce the federal deficit. The Budget Control Act, as amended, resulted in the imposition of 2% reductions to Medicare (but not Medicaid) payments to providers beginning in April 2013. More recent legislation extends reductions through 2024.
The Healthcare Reform Act has been subject to political and judicial challenges. In 2012, the Supreme Court considered the constitutionality of certain provisions of the law. The Supreme Court upheld as constitutional the mandate for individuals to obtain health insurance, but held the provision allowing the federal government to withhold certain Medicaid funds to states that do not expand state Medicaid programs unconstitutional. Therefore, not all states have expanded their Medicaid programs under the Healthcare Reform Act. Political and judicial challenges to the law have continued in the wake of the Court’s ruling. The Supreme Court is currently considering a challenge to the Internal Revenue Service’s application of the premium tax credits to individuals in all states, regardless of whether the state established a state-run exchange or allowed the federal government to facilitate an exchange on its behalf. Oral arguments were heard in March of 2015 with a ruling expected later this year.
Healthcare Fraud and Abuse Laws
We are subject to various federal, state and local laws targeting fraud and abuse in the healthcare industry, including anti-kickback and false claims laws. The federal Anti-Kickback Statute generally prohibits, among
125
Table of Contents
other things, a pharmaceutical manufacturer from directly or indirectly soliciting, offering, receiving, or paying any remuneration in cash or in kind where one purpose is either to induce the referral of an individual for, or the purchase or prescription of a particular drug. Violations of the federal Anti-Kickback Statute can result in exclusion from Medicare, Medicaid or other governmental programs as well as civil and criminal fines and penalties of up to $50,000 per violation and three times the amount of the unlawful remuneration. The majority of states also have anti-kickback, false claims, and similar fraud and abuse laws and although the specific provisions of these laws vary, their scope is generally broad and there may not be regulations, guidance or court decisions that apply the laws to particular industry practices. There is therefore a possibility that our practices might be challenged under the anti-kickback statutes or similar laws. Federal and state false claims laws generally prohibit anyone from knowingly and willingly, among other activities, presenting, or causing to be presented for payment to third party payors (including Medicare and Medicaid) claims for drugs or services that are false or fraudulent (which may include claims for services not provided as claimed or claims for medically unnecessary services). False or fraudulent claims for purposes of the federal False Claims Act (“FCA”) carry fines and civil penalties for violations ranging from $5,500 to $11,000 for each false claim, plus up to three times the amount of damages sustained by the federal government and, most critically, may provide the basis for exclusion from federally funded healthcare programs. There is also a criminal FCA statute by which individuals or entities that submit false claims can face criminal penalties. In addition, under the federal Civil Monetary Penalty Law, the Department of Health and Human Services Office of Inspector General has the authority to impose civil penalties against any person who, among other things, knowingly presents, or causes to be presented, certain false or otherwise improper claims. Our activities relating to the sale and marketing of our products may be subject to scrutiny under these laws. Violations of fraud and abuse laws may be punishable by criminal or civil sanctions, including fines and civil monetary penalties, and/or exclusion from federal health care programs (including Medicare and Medicaid). Federal and state authorities are paying increased attention to enforcement of these laws within the pharmaceutical industry and private individuals have been active in alleging violations of the laws and bringing suits on behalf of the government under the false claims act. Violations of international fraud and abuse laws could result in similar penalties, including exclusion from participation in health programs outside the United States. If we were subject to allegations concerning, or were convicted of violating, these laws, our business could be harmed.
Laws and regulations have also been enacted by the federal government and various states to regulate the sales and marketing practices of pharmaceutical manufacturers. The laws and regulations generally limit financial interactions between manufacturers and health care providers; require pharmaceutical companies to comply with the pharmaceutical industry’s voluntary compliance guidelines and the relevant compliance guidance promulgated by the U.S. federal government; and/or require disclosure to the government and/or public of financial interactions (so-called “sunshine laws”). State laws may also require disclosure of pharmaceutical pricing information and marketing expenditures. Many of these laws and regulations contain ambiguous requirements or require administrative guidance for implementation. Given the lack of clarity in laws and their implementation, our reporting actions could be subject to the penalty provisions of the pertinent federal and state laws and regulations.
Other Healthcare Laws
Our operations may be affected by the Health Insurance Portability and Accountability Act of 1996, or HIPAA, as amended by the Health Information Technology for Economic and Clinical Health Act and its implementing regulations, or HITECH, which impose obligations on certain “covered entities” (healthcare providers, health plans and healthcare clearinghouses) and certain of their “business associate” contractors with respect to safeguarding the privacy, security and transmission of individually identifiable health information. Although we believe that we are neither a “covered entity” nor a “business associate” under the legislation, a business associate relationship may be imputed from facts and circumstances even in the absence of an actual business associate agreement. In addition, HIPAA and HITECH may affect our interactions with customers who are covered entities or their business associates.
126
Table of Contents
Laws Relating to Foreign Trade
We are subject to various federal and foreign laws that govern our international business practices with respect to payments to government officials. Those laws include the FCPA which prohibits U.S. companies and their representatives from paying, offering to pay, promising, or authorizing the payment of anything of value to any foreign government official, government staff member, political party, or political candidate for the purpose of obtaining or retaining business or to otherwise obtain favorable treatment or influence a person working in an official capacity. In many countries, the healthcare professionals we regularly interact with may meet the FCPA’s definition of a foreign government official. The FCPA also requires public companies to make and keep books and records that accurately and fairly reflect their transactions and to devise and maintain an adequate system of internal accounting controls.
Those laws also include the Bribery Act which proscribes giving and receiving bribes in the public and private sectors, bribing a foreign public official, and failing to have adequate procedures to prevent employees and other agents from giving bribes. U.S. companies that conduct business in the United Kingdom generally will be subject to the Bribery Act. Penalties under the Bribery Act include potentially unlimited fines for companies and criminal sanctions for corporate officers under certain circumstances.
Our policies mandate compliance with these anti-bribery laws. Our operations reach many parts of the world that have experienced governmental corruption to some degree, and in certain circumstances strict compliance with anti-bribery laws may conflict with local customs and practices. Despite our training and compliance programs, our internal control policies and procedures may not always protect us from reckless or criminal acts committed by our employees or agents.
Health and Safety Laws
We are also subject to various federal, state and local laws, regulations and recommendations, both in the United States and abroad, relating to safe working conditions, laboratory and manufacturing practices and the use, transportation and disposal of hazardous or potentially hazardous substances.
Environmental Matters
We are subject to various federal, state and local laws and regulations relating to the protection of the environment, human health and safety in the United States and in other jurisdictions in which we operate. Our operations, like those of other medical product companies, involve the transport, use, handling, storage, exposure to and disposal of materials and wastes regulated under environmental laws, including hazardous and radioactive materials and wastes. If we violate these laws and regulations, we could be fined, criminally charged or otherwise sanctioned by regulators. We believe that our operations currently comply in all material respects with applicable environmental laws and regulations. See “Risk Factors—We use hazardous materials in our business and must comply with environmental laws and regulations, which can be expensive.”
Certain environmental laws and regulations assess liability on current or previous owners or operators of real property for the cost of investigation, removal or remediation of hazardous materials or wastes at those formerly owned or operated properties or at third party properties at which they have disposed of hazardous materials or wastes. In addition to cleanup actions brought by governmental authorities, private parties could bring personal injury, property damage or other claims due to the presence of, or exposure to, hazardous materials or wastes. We currently are not party to any claims or any obligations to investigate or remediate contamination at any of our facilities.
We are required to maintain a number of environmental permits and nuclear licenses for our North Billerica facility, which is our primary manufacturing, packaging and distribution facility. In particular, we must maintain a nuclear byproducts materials license issued by the Commonwealth of Massachusetts. This license requires that we provide financial assurance demonstrating our ability to cover the cost of decommissioning and
127
Table of Contents
decontaminating, or D&D, the Billerica site at the end of its use as a nuclear facility. As of December 31, 2014, we currently estimate the D&D cost at the Billerica site to be approximately $24.1 million. As of December 31, 2014 and 2013, we have a liability recorded associated with the fair value of the asset retirement obligations of approximately $7.4 million and $6.4 million, respectively. We have recorded accretion expense of $0.8 million, $0.6 million and $0.6 million during the years ended December 31, 2014, 2013 and 2012, respectively. We currently provide this financial assurance in the form of surety bonds. We generally contract with third parties for the disposal of wastes generated by our operations. Prior to disposal, we store any low level radioactive waste at our facilities until the materials are no longer considered radioactive, as allowed by our licenses and permits.
Environmental laws and regulations are complex, change frequently and have become more stringent over time. While we have budgeted for future capital and operating expenditures to maintain compliance with these laws and regulations, we cannot assure you that our costs of complying with current or future environmental protection, health and safety laws and regulations will not exceed our estimates or adversely affect our results of operations and financial condition. Further, we cannot assure you that we will not be subject to additional environmental claims for personal injury or cleanup in the future based on our past, present or future business activities. While it is not feasible to predict the future costs of ongoing environmental compliance, it is possible that there will be a need for future provisions for environmental costs that, in management’s opinion, are not likely to have a material effect on our financial condition, but could be material to the results of operations in any one accounting period.
Employees
As of March 31, 2015, we had 521 employees, of which 403 were located in the United States and 118 were located internationally, and approximately 78 contractors. None of our employees are represented by a collective bargaining unit, and we believe that our relationship with our employees is good.
Corporate History
Founded in 1956 as New England Nuclear Corporation, our medical imaging diagnostic business was purchased by DuPont in 1981. BMS subsequently acquired our diagnostic medical imaging business as part of its acquisition of DuPont Pharmaceuticals in 2001. Avista acquired our medical imaging business from BMS in January 2008.
Properties
Our executive offices and primary manufacturing facilities are located at our North Billerica, Massachusetts facility, which we own. In addition, as of March 31, 2015, we lease five facilities in Canada, two in Australia and two in Puerto Rico. Our owned facilities consist of approximately 578,000 square feet of manufacturing, laboratory, mixed use and office space, and our leased facilities consist of approximately 62,466 square feet of manufacturing, laboratory, mixed use and office space. We believe all of these facilities are well-maintained and suitable for the office, radiopharmacy, manufacturing or warehouse operations conducted in them.
128
Table of Contents
The following table summarizes information regarding our significant leased and owned properties, as of April 30, 2015:
| Location |
Square footage |
Owned/ Leased |
||||||
| United States |
||||||||
| North Billerica, Massachusetts |
578,000 | Owned | ||||||
| Canada |
||||||||
| Montreal |
8,729 | Leased | ||||||
| Mississauga |
13,747 | Leased | ||||||
| Dorval |
13,079 | Leased | ||||||
| Quebec |
6,261 | Leased | ||||||
| Vancouver |
880 | Leased | ||||||
| Australia |
||||||||
| Melbourne |
4,634 | Leased | ||||||
| Adelaide |
4,306 | Leased | ||||||
| Puerto Rico |
||||||||
| San Juan |
9,550 | Leased | ||||||
| Ponce |
1,280 | Leased | ||||||
Legal Proceedings
From time to time, we are a party to various legal proceedings arising in the ordinary course of business. In addition, we have in the past been, and may in the future be, subject to investigations by governmental and regulatory authorities which exposes us to greater risks associated with litigation, regulatory or other proceedings, as a result of which we could be required to pay significant fines or penalties. The outcome of litigation, regulatory or other proceedings cannot be predicted with certainty, and some lawsuits, claims, actions or proceedings may be disposed of unfavorably to us. In addition, intellectual property disputes often have a risk of injunctive relief which, if imposed against us, could materially and adversely affect our financial condition or results of operations.
On December 16, 2010, we filed suit against one of our insurance carriers seeking to recover business interruption losses associated with the NRU reactor shutdown and the ensuing global Moly supply shortage (Lantheus Medical Imaging, Inc., Plaintiff v. Zurich American Insurance Company, Defendant, United States District Court, Southern District of New York, Case No. 10 Civ 9371). The claim is the result of the shutdown of the NRU reactor in Chalk River, Ontario. The NRU reactor was off-line from May 2009 until August 2010. The defendant answered the complaint on January 21, 2011, denying substantially all of the allegations, presenting certain defenses and requesting dismissal of the case with costs and disbursements. Discovery, including international discovery and related motion practice, went on for more than three years. The defendant filed a motion for summary judgment on July 14, 2014. The Company filed a memorandum of law in opposition to defendant’s motion for summary judgment on August 25, 2014. The defendant filed a reply memorandum of law in further support of its motion for summary judgment on September 15, 2014. Expert witness discovery was completed on October 31, 2014. On March 25, 2015, the United States District Court for the Southern District of New York granted defendant’s motion for summary judgment. On May 22, 2015, we filed a notice of appeal of the District Court decision with the United States Court of Appeals for the Second Circuit. We cannot be certain when, if ever, we will be able to recover for business interruption losses related to this matter and in what amount, if any.
129
Table of Contents
Executive Officers, Key Employees and Directors
The following table sets forth the names, ages and positions of our executive officers, key employees and directors as of June 5, 2015.
| Name |
Age | Position | ||||
| Executive Officers and Key Employees |
||||||
| Jeffrey Bailey |
53 | President, Chief Executive Officer and Director | ||||
| John Bakewell |
54 | Chief Financial Officer | ||||
| Jack Crowley |
51 | Vice President, Chief Accounting Officer | ||||
| William Dawes |
43 | Vice President, Manufacturing and Operations | ||||
| Michael Duffy |
54 | Vice President, General Counsel and Secretary | ||||
| Mary Anne Heino |
55 | Chief Operating Officer | ||||
| Cesare Orlandi |
65 | Chief Medical Officer | ||||
| Simon Robinson |
55 | Vice President, Research and Pharmaceutical Development | ||||
| Cyrille Villeneuve |
63 | Vice President, International | ||||
| Carol Walker |
52 | Vice President, Quality | ||||
| Non-Employee Directors |
||||||
| Brian Markison |
55 | Director and Non-Executive Chairman of the Board | ||||
| David Burgstahler |
46 | Director | ||||
| Samuel Leno |
69 | Director | ||||
| Patrick O’Neill |
65 | Director | ||||
| Sriram Venkataraman |
42 | Director | ||||
Set forth below is a description of the business experience of the foregoing persons.
Jeffrey Bailey is our President and Chief Executive Officer since January 2013 and is a Director. Mr. Bailey has more than 26 years of diverse pharmaceutical leadership experience across multiple functions, including sales, marketing, manufacturing, supply chain and operations. Prior to joining Lantheus, Mr. Bailey served from July 2011 to July 2012 as Chief Operating Officer and a member of the executive committee of Fougera Pharmaceuticals, Inc. prior to its sale to Sandoz. Before joining Fougera, from April 2010 to June 2011, Mr. Bailey served as Chief Commercial Officer of King-Pfizer Pharmaceuticals. From January 2008 to April 2010, he worked with Novartis Pharmaceuticals as President and General Manager of the Northwest Operating Unit, and from June 1984 to June 2006, he served in several roles with increasing responsibilities across manufacturing operations, commercial operations and general management at the Johnson & Johnson Family of Companies. Mr. Bailey also serves on the Board of Directors of Landauer, Inc. Mr. Bailey holds a Bachelor of Arts in Business from Rutgers University. Mr. Bailey was chosen to serve as a Director because of his extensive experience in the healthcare industry in senior commercial and operating positions. As our President and Chief Executive Officer and the only management representative on our Board of Directors, Mr. Bailey has significant knowledge of the pharmaceutical industry and provides valuable insight into a variety of business issues and challenges we face.
John Bakewell joined Lantheus in June 2014 as our Chief Financial Officer. Mr. Bakewell previously served as Chief Financial Officer of Interline Brands, Inc., or Interline, from June 2013 to May 2014. Prior to joining Interline, Mr. Bakewell served as the Executive Vice President and Chief Financial Officer of RegionalCare Hospital Partners from January 2010 to December 2011. In addition, Mr. Bakewell held the same position with Wright Medical Group, a global orthopedic medical device manufacturer from 2000 to 2009. Mr. Bakewell also served as Chief Financial Officer of Altra Energy Technologies from 1998 to 2000, Cyberonics, Inc. from 1993 to 1998, and Zeos International from 1990 to 1993. Mr. Bakewell also serves on the Board of Keystone Dental, Inc. Mr. Bakewell holds a Bachelor of Arts in Accounting from the University of Northern Iowa and is a certified public accountant (Minnesota and Iowa licensure, current status inactive).
130
Table of Contents
Jack Crowley is our Vice President, Chief Accounting Officer since March 2015. Mr. Crowley held the position of Vice President, Finance from April 2013 until March 2015 and was Director, Accounting from September 2010 until April 2013. Prior to joining Lantheus, Mr. Crowley was the Assistant Corporate Controller of Biogen Idec, the Director of Accounting at Thermo Fischer Scientific and a Senior Manager in the Audit practice of PricewaterhouseCoopers LLP. Mr. Crowley holds a Master of Business Administration degree from the University of Massachusetts and a Bachelor of Science in Business Administration from Westfield State University and is a Certified Public Accountant (Massachusetts licensure, current status inactive).
William Dawes is our Vice President, Manufacturing and Operations since November 2010. Mr. Dawes held the position of Vice President, Manufacturing & Supply Chain from January 2008 to November 2010. From 2005 to 2008, Mr. Dawes served as General Manager, Medical Imaging Technical Operations, Interim General Manager, Medical Imaging Technical Operations, and Director, Engineering and Maintenance for BMSMI. Mr. Dawes began his career with DuPont Merck Pharmaceuticals. He holds a Bachelor’s degree in Engineering from Hofstra University.
Michael Duffy is our Vice President, General Counsel and Secretary, a position he has held since January 2008. From 2002 to 2008, he served as Senior Vice President, General Counsel and Secretary of Point Therapeutics, Inc., a Boston-based biopharmaceutical company. Between 1999 and 2001, Mr. Duffy served as Senior Vice President, General Counsel and Secretary of Digital Broadband Communications, Inc., a competitive local exchange carrier which filed for protection under Chapter 11 of the United States Bankruptcy Code in December 2000. After the filing, Mr. Duffy served as the court-appointed liquidating trustee of the bankruptcy estate. From 1996 to 1999, Mr. Duffy served as Senior Vice President, General Counsel and Secretary of ETC w/tci, a sub-portfolio of TCI Ventures, Inc./Liberty Media Corporation. Mr. Duffy began his legal career with the law firm Ropes & Gray and holds law degrees from the University of Pennsylvania and Oxford University and a Bachelor’s degree in History of Science from Harvard College. Mr. Duffy is also the current Chairman of the Board of Directors of CORAR, the Council on Radionuclides and Radiopharmaceuticals, an international trade association for the radiopharmaceutical industry.
Mary Anne Heino is our Chief Operating Officer since March 2015 and joined Lantheus in April 2013 as Chief Commercial Officer. Ms. Heino brings more than 25 years of diverse pharmaceutical industry experience. Prior to joining Lantheus, Ms. Heino led Angelini Labopharm LLC and Labopharm USA in the roles of President and Senior Vice President of World Wide Sales and Marketing from February 2007 to March 2012. From May 2000 until February 2007, Ms. Heino served in numerous capacities at Centocor, Inc., a Johnson & Johnson Company, including Vice President Strategic Planning and Competitive Intelligence, Vice President Sales, Executive Director Customer Relationship Management and Senior Director Immunology Marketing. Ms. Heino began her professional career with Janssen Pharmaceutica as a Sales Representative in June 1989 and worked her way up to the role of Field Sales Director in 1999. Ms. Heino received her Master’s in Business Administration from New York University. She earned a Bachelor’s of Science in Nursing from the City University of New York and a Bachelor’s of Science in Biology from the State University of New York at Stony Brook.
Dr. Cesare Orlandi joined Lantheus in March 2013 as Chief Medical Officer. Dr. Orlandi brings more than 20 years of diverse pharmaceutical industry experience. Prior to joining Lantheus, Dr. Orlandi served from January 2012 until February 2013 as Senior Vice President and Chief Medical Officer of TransTech Pharma, Inc., a clinical stage pharmaceutical company focused on discovery and development of human therapeutics. From 2007 until 2011, Dr. Orlandi served as Senior Vice President and Chief Medical Officer of Cardiokine, Inc., a specialty pharmaceutical company developing hospital products for cardiovascular indications. From 1998 until 2007, Dr. Orlandi served, in among other positions, as Vice President, Global Clinical Development of Otsuka Pharmaceuticals, a large Japanese pharmaceutical company. Earlier in his career, Dr. Orlandi served in increasing roles of clinical research responsibility at Medco Research, Inc. and the Radiopharmaceutical Division of The DuPont Merck Pharmaceutical Company, a predecessor organization to Lantheus, and The Upjohn Company. Dr. Orlandi received his medical degree from the University of Pavia Medical School in Pavia, Italy. He is currently an Adjunct Assistant Professor of Medicine at Tufts University
131
Table of Contents
School of Medicine in Boston, Massachusetts, and he is a founding member of the American Society of Nuclear Cardiology and a Fellow of the American College of Cardiology, the European Society of Cardiology and the American College of Angiology.
Dr. Simon Robinson is our Vice President, Research and Pharmaceutical Development, a position he has held since February 2010. Dr. Robinson was our Senior Director Discovery Research from 2008 to 2010 and our Director Discovery Biology and Veterinary Sciences from 2001 to 2008. Prior to joining us, he held research positions at BMS, Sphinx Pharmaceuticals, BASF and Dupont Pharmaceuticals. He holds a Ph.D. and B.Sc. in Pharmacology from the University of Leeds, England and did post-doctoral training at the University of Wisconsin Clinical Cancer Center.
Cyrille Villeneuve is our Vice President, International and previously served as Chief Commercial Officer from October 2011 to April 2013, responsible for global sales and marketing. Previously Mr. Villeneuve was our Vice President and General Manager, International, a position he held since November 2008. Prior to joining us in 1985, Mr. Villeneuve held positions at the Montreal Heart Institute and Hospital Hotel-Dieu Montreal. He holds a Bachelor of Arts from Montreal University and a Master of Public Administration from the Ecole Nationale Administration Publique.
Carol Walker joined Lantheus Medical Imaging in February 2015 as Vice President, Quality. Ms. Walker brings more than 30 years of industry experience in quality and medical technology primarily the medical device area. Prior to joining Lantheus, Ms. Walker served as Vice President of Quality for Intelligent Medical Devices, Inc. from 2012 to 2015. Previously she held a number of successive Quality management roles at Siemens Healthcare Diagnostics (formerly Bayer Healthcare Diagnostics) including Vice President, Quality Assurance from 2007 to 2011 and Director, Quality Assurance from 2001 to 2007. Ms. Walker received a B.S. degree in Medical Technology from the Rochester Institute of Technology.
Brian Markison is our Non-Executive Chairman of the Board of Directors. Mr. Markison joined the Board in September 2012 and was elevated to Chairman in January 2013. Mr. Markison has been a Healthcare Industry Executive for Avista since September 2012. Mr. Markison is a seasoned executive with more than 30 years of operational, marketing, commercial development and sales experience with international pharmaceutical companies. He most recently held the position of President and Chief Executive Officer and member of the Board of Directors of Fougera Pharmaceuticals Inc., a specialty pharmaceutical company in dermatology, prior to its sale to Sandoz, the generics division of Novartis AG. Before leading Fougera, Mr. Markison was Chairman and Chief Executive Officer of King Pharmaceuticals, which he joined as Chief Operating Officer in March 2004, and was promoted to President and CEO later that year and elected Chairman in 2007. Prior to joining King, Mr. Markison held various senior leadership positions at BMS, including President of Oncology, Virology and Oncology Therapeutics Network; President of Neuroscience, Infectious Disease and Dermatology; and Senior Vice President, Operational Excellence and Productivity. Mr. Markison also serves on the Board of Directors of Immunomedics, Inc. He also serves as Board Chairman for Rosetta Genomics, Ltd. and Executive Chairman of Vertical/Trigen Holdings, LLC. He is also a Director of the College of New Jersey. Mr. Markison holds a B.S. degree from Iona College. Mr. Markison was chosen as a Director because of his strong commercial and operational management background and extensive experience in the pharmaceutical industry.
David Burgstahler is a Director and the Chairman of our Compensation Committee, serving on our Board of Directors since January 2008. He was a founding partner of Avista in 2005 and, since 2009, has been President of Avista. Prior to forming Avista, he was a Partner of DLJMB. He was at DLJ Investment Banking from 1995 to 1997 and at DLJMB from 1997 through 2005. Prior to that, he worked at Andersen Consulting (now known as Accenture) and McDonnell Douglas (now known as Boeing). He currently serves as a Director of AngioDynamics Inc. (Nasdaq: ANGO), ConvaTec Inc., INC Research Holdings, Inc. (Nasdaq: INCR), Strategic Partners, Inc., Vertical/Trigen Holdings, LLC, Visant Corporation and WideOpenWest, LLC. He previously served as a Director of a number of public and private companies, including Warner Chilcott plc (Nasdaq:
132
Table of Contents
WCRX) and BioReliance Holdings, Inc. He holds a Bachelor of Science in Aerospace Engineering from the University of Kansas and a Master of Business Administration from Harvard Business School. Mr. Burgstahler is also a Trustee of the Trinity School in New York City. Mr. Burgstahler was chosen as a Director because of his strong finance and management background, with over 19 years in banking and private equity finance. He has extensive experience serving as a director for a diverse group of private and public companies.
Samuel Leno is a Director and the Chairman of our Audit Committee, serving on the Board of Directors since May 2012. Mr. Leno is a strategic executive with more than 40 years of experience with complex multinational companies. He most recently held the positions of Executive Vice President and Chief Operations Officer at Boston Scientific. He previously served as Executive Vice President, Finance and Information Systems and Chief Financial Officer. He retired from Boston Scientific in December 2011. Prior to joining Boston Scientific, Mr. Leno served as Executive Vice President, Finance and Corporate Services and Chief Financial Officer at Zimmer Holdings, Inc. and Chief Financial Officer positions at Arrow Electronics, Inc., Corporate Express, Inc. and Coram Healthcare. Previously, he held a variety of senior financial positions at Baxter International, Inc. and American Hospital Supply Corporation. He is a member of the Board of Directors and the audit committee of Omnicare, is the Chairman of the Board of Zest Anchors, Inc. and serves as a Director of Endotronix Inc. He is also a member of the Advisory Board of the Harvard Business School Healthcare Initiative. He previously served on the Board and audit committee of Tomotherapy, Inc. Mr. Leno served as a Lieutenant in the United States Navy and is a Vietnam veteran. He holds a Bachelor of Science in Accounting from Northern Illinois University and an MBA from Roosevelt University. Mr. Leno was chosen as a Director because of his financial expertise and industry background.
Dr. Patrick O’Neill is a Director, serving on the Board of Directors since February 2008. He is also an Industry Advisor for Avista, a position he has held since 2008. Dr. O’Neill was at Johnson & Johnson from 1976 to 2006, holding Research and Development and New Business Development leadership positions in Johnson & Johnson’s pharmaceutical business, their Medical Devices and Diagnostics Group, and the surgical and interventional cardiology/radiology business units until he retired in February 2006. He served as Executive in Residence at New Enterprise Associates from March 2006 through 2007. Dr. O’Neill holds a Bachelor of Science in Pharmacy and Ph.D. in Pharmacology from The Ohio State University. He currently serves as Director of OptiNose US Inc. and Zest Anchors, Inc. Dr. O’Neill was chosen as a Director because of his experience in the pharmaceutical industry. Dr. O’Neill has participated directly in the development of pharmaceutical products for other companies, which provides valuable insight into strategic business decisions.
Sriram Venkataraman is a Director, serving on the Board of Directors since November 2010. He is also a Partner of Avista, having joined in May 2007. Prior to joining Avista, Mr. Venkataraman was a Vice President in the Healthcare Investment Banking group at Credit Suisse Group AG from 2001 to 2007. Previously, he worked at GE Healthcare (formerly known as GE Medical Systems) from 1996 to 1999. Mr. Venkataraman holds a Master of Science in Electrical Engineering from the University of Illinois, Urbana-Champaign and a Master of Business Administration with Honors from The Wharton School. He currently serves as a Director of AngioDynamics, Inc., OptiNose Inc., Zest Anchors, Inc. and Vertical/Trigen Holdings, LLC. Mr. Venkataraman was chosen as a Director because of his experience in the healthcare industry and his strong finance and management background. He also has experience serving as a director of private and public companies.
Board of Directors
Our Board of Directors is responsible for the management of our business and is comprised of six directors who are elected to serve in their position until their next election and until their successors are elected and qualified. Pursuant to the terms of the amended management and employee Shareholders Agreements described in “Certain Relationships and Related Person Transactions—Shareholders Agreements,” following the consummation of this offering, Avista will have the right to nominate two directors for election to the Board for so long as it owns 25% or more of our issued and outstanding common stock and the right to nominate for election one director to the Board for so long as it beneficially owns more than 10% but less than 25% of our issued and outstanding common stock.
133
Table of Contents
After the effectiveness of the registration statement of which this prospectus forms a part and prior to the consummation of this offering, we intend to amend and restate our certificate of incorporation and bylaws to, among other things, comply with SEC and NASDAQ guidelines. Our amended and restated certificate of incorporation will provide that our Board will be divided into three classes, with one class being elected at each annual meeting of stockholders. Each director will serve a three-year term, with termination staggered according to class. The Class I directors, whose terms will expire at the first annual meeting of our stockholders following the filing of our amended and restated certificate of incorporation, will be Messrs. Bailey and Leno. The Class II directors, whose terms will expire at the second annual meeting of our stockholders following the filing of our amended and restated certificate of incorporation, will be Mr. Venkataraman and Dr. O’Neill. The Class III directors, whose terms will expire at the third annual meeting of our stockholders following the filing of our amended and restated certificate of incorporation, will be Messrs. Burgstahler and Markison. See “Description of Capital Stock—Anti-Takeover Effects of our Amended and Restated Certificate of Incorporation and Bylaws.”
Director Independence and Controlled Company Exception
Prior to the consummation of this offering, Avista had controlled and, immediately after the consummation of this offering, will continue to control, a majority of our outstanding common stock. As a result, we are a “controlled company” within the meaning of NASDAQ corporate governance standards. Under these rules, a “controlled company” may elect not to comply with certain NASDAQ corporate governance standards, including:
| • | the requirement that a majority of the Board of Directors consist of independent directors; |
| • | the requirement that we have a nominating and corporate governance committee that is composed entirely of independent directors; |
| • | the requirement that we have a compensation committee that is composed entirely of independent directors; and |
| • | the requirement for an annual performance evaluation of the nominating and corporate governance committee and compensation committee. |
Following this offering, we intend to utilize these exemptions. As a result, we will not have a majority of independent directors, our Nominating and Corporate Governance Committee and Compensation Committee will not consist entirely of independent directors, and those committees will not be subject to annual performance evaluations. Accordingly, our stockholders will not have the same protections afforded to stockholders of companies that are subject to all NASDAQ corporate governance requirements.
Our Board has determined that Messrs. Leno and Markison and Dr. O’Neill are independent directors under NASDAQ rules and Exchange Act Rule 10A-3(b)(1).
Board Committees
Our Board of Directors has the authority to appoint committees to perform certain management and administration functions. Upon the consummation of this offering, our Board of Directors will have three committees: the Audit Committee, the Compensation Committee and the Nominating and Corporate Governance Committee.
Audit Committee
The primary purpose of the Audit Committee is to assist the Board’s oversight of:
| • | the integrity of our financial statements; |
| • | our systems of internal control over financial reporting and disclosure controls and procedures; |
134
Table of Contents
| • | our independent auditors’ qualifications, engagement, compensation and independence; |
| • | the performance of our independent auditors and our internal audit function; |
| • | our legal and regulatory compliance; |
| • | our related person transaction policy; and |
| • | our codes of business conduct and ethics. |
The Audit Committee is composed of Messrs. Leno and Venkataraman and, prior to the consummation of this offering, Mr. Burgstahler will be added to the Audit Committee. Mr. Leno, the Chairman of the Audit Committee, has been designated by the Board of Directors of Holdings as our “Audit Committee Financial Expert” as that term has been defined by the SEC in Item 407(d)(5) of Regulation S-K. Our Board of Directors has affirmatively determined that Mr. Leno meets the definition of “independent director” for the purposes of serving on the audit committee under the SEC and NASDAQ rules. Within 90 days following the consummation of this offering, we will have a second member of the audit committee who will also meet this definition of “independent director.” Within one year following the consummation of this offering, we will have a third member who is an “independent director.”
Compensation Committee
The primary purpose of our Compensation Committee is to assist the Board’s oversight of:
| • | our management compensation policies and practices; |
| • | the determination and approval of the compensation of our executive officers and other members of senior management; |
| • | the review, approval and administration of our incentive compensation policies and programs; |
| • | the review, approval and administration of our equity compensation programs; and |
| • | the preparation of the Compensation Committee report required by the SEC rules to be included in our annual report. |
Messrs. Burgstahler and Markison currently serve on our Compensation Committee. After this offering, Mr. Markison will serve as the chairman.
Nominating and Corporate Governance Committee
The primary purpose of the Nominating and Corporate Governance Committee is to:
| • | identify and recommend to the Board individuals qualified to serve as directors of our company and on committees of the Board; |
| • | assist the Board in overseeing our policies and procedures for the receipt of stockholder suggestions regarding Board compensation and recommendations of the Board; |
| • | develop, recommend to the Board and oversee the implementation of a set of corporate governance guidelines and principles applicable to us; and |
| • | review the overall corporate governance of our Company and recommend improvements when necessary. |
Messrs. Burgstahler and Markison currently serve on the Nominating and Corporate Governance Committee, and Mr. Markison serves as the chairman.
135
Table of Contents
Code of Ethics
We have a code of conduct and ethics for all of our employees, including our principal executive, financial and accounting officers and our controller, or persons performing similar functions, and each of the non-employee directors on our Board of Directors. Our Company Code of Conduct is currently available on our website, www.lantheus.com. The information on our web site is not part of, and is not incorporated into, this prospectus. We intend to provide any required disclosure of any amendment to or waiver from such code that applies to our principal executive officer, principal financial officer, principal accounting officer or controller, or persons performing similar functions, in a Current Report on Form 8-K filed with the Commission.
Compensation Committee Interlocks and Insider Participation
The members of our compensation committee are Messrs. Burgstahler and Markison. Mr. Burgstahler is the President of Avista. Prior to the consummation of this offering, Avista provided us with advisory services pursuant to an advisory services and monitoring agreement, which we will terminate upon consummation of this offering, and has entered into other transactions with us. See “Certain Relationships and Related Person Transactions—Advisory and Monitoring Services Agreement.”
Upon the consummation of this offering, none of our executive officers will serve on the Compensation Committee or Board of Directors of any other company of which any of the members of our Compensation Committee or any of our directors is an executive officer.
136
Table of Contents
EXECUTIVE AND DIRECTOR COMPENSATION
For 2014, our named executive officers were:
| • | Jeffrey Bailey, President and Chief Executive Officer; |
| • | John Bakewell, Chief Financial Officer; and |
| • | Mary Anne Heino, Chief Commercial Officer (promoted to Chief Operating Officer in March 2015). |
Summary Compensation Table
The following table sets forth certain information with respect to compensation for the year ended December 31, 2014 earned by or paid to our named executive officers.
| Name and Principal Position |
Year | Salary ($) |
Bonus ($) |
Option Awards(1)(2) ($) |
Non-Equity Incentive Plan Compensation(3) ($) |
All Other Compensation(4)(5)(6) ($) |
Total ($) |
|||||||||||||||||||||
| Jeffrey Bailey |
2014 | $ | 484,615 | $ | — | $ | — | $ | 635,000 | $ | 39,269 | $ | 1,158,884 | |||||||||||||||
| President and Chief Executive Officer |
2013 | $ | 401,538 | $ | — | $ | 2,440,000 | $ | 500,000 | $ | 79,281 | $ | 3,420,819 | |||||||||||||||
| John Bakewell |
2014 | $ | 215,385 | $ | — | $ | 744,344 | $ | 139,000 | $ | 28,551 | $ | 1,127,280 | |||||||||||||||
| Chief Financial Officer |
(New hire in 2014) | |||||||||||||||||||||||||||
| Mary Anne Heino |
2014 | $ | 353,846 | $ | — | $ | — | $ | 210,000 | $ | 45,052 | $ | 608,898 | |||||||||||||||
| Chief Commercial Officer(7) |
2013 | $ | 228,846 | $ | — | $ | 312,500 | $ | 112,000 | $ | 150,432 | $ | 803,778 | |||||||||||||||
| (1) | Mr. Bakewell received initial stock option grants in conjunction with his employment offer in 2014. Mr. Bailey and Ms. Heino received initial stock option grants in conjunction with their employment offer in 2013. |
| (2) | Includes the grant date fair value of the stock option awards granted during the fiscal year ended December 31, 2014 in accordance with ASC 718 with respect to options to purchase shares of our common stock awarded to the named executive officers in 2013 under our 2013 Equity Plan. See Note 12 to our consolidated financial statements, which is included elsewhere in this prospectus, for a description of the assumptions used in valuing the awards. |
| (3) | For 2014, the Compensation Committee awarded bonuses to Mr. Bailey, Mr. Bakewell and Ms. Heino under the Bonus Plan. For 2013, the Compensation Committee awarded bonuses to Mr. Bailey and Ms. Heino under the Bonus Plan. |
| (4) | For Messrs. Bailey, Bakewell and Ms. Heino, the amounts reflect matching contributions to our defined contribution retirement plans in 2014 of $9,750, $692 and $11,700, respectively. For Mr. Bailey and Ms. Heino, the amounts reflect matching contributions to our defined contribution retirement plans in 2013 of $7,057 and $2,877, respectively. |
| (5) | For Messrs. Bailey, Bakewell and Ms. Heino, the amounts reflect employer contributions to our long term disability insurance premiums in 2014 of $1,310, $706 and $1,130, respectively. For Mr. Bailey and Ms. Heino, the amounts reflect employer contributions to our long term disability insurance premiums in 2013 of $1,159 and $907, respectively. |
| (6) | As part of Mr. Bailey’s agreement he had been compensated for his commuting expenses from his former home in New Jersey and temporary housing expenses in Massachusetts, and that compensation arrangement terminated as of March 31, 2014. Included in his “All Other Compensation” is $28,209 and $71,065 for these expenses which included a tax gross up on aggregate basis in 2014 and 2013, respectively. As part of Mr. Bakewell’s agreement he has been compensated for basic transition-related expenses in connection with temporary housing expenses in Massachusetts. Included in his “All Other Compensation” is $27,153 for these expenses which included a tax gross up on aggregate basis in 2014. As part of Ms. Heino’s agreement she was reimbursed for certain relocation expenses from her former home in New Jersey to Massachusetts. Included in her “All Other Compensation” is $32,042 and $146,639 for taxable expenses associated with her home sales, temporary housing and physical move which includes the associated tax gross up on an aggregate basis for 2014 and 2013, respectively. |
| (7) | Ms. Heino was promoted to the role of Chief Operating Officer in March 2015. For 2015, Ms. Heino’s bonus target was increased to 60% of base salary. |
137
Table of Contents
Elements of Compensation
Our compensation program is heavily weighted towards performance-based compensation, reflecting our philosophy of increasing our long-term value and supporting strategic imperatives, as discussed above. Total compensation and other benefits consist of the following elements:
| • | base salary; |
| • | annual non-equity incentive compensation; and |
| • | long-term equity incentives in the form of stock options. |
We do not offer a defined benefit pension plan. The Compensation Committee supports a competitive employee benefit package, but does not support executive perquisites or other supplemental programs targeted to executives.
Base Salary
The base salaries of Mr. Bailey, Mr. Bakewell and Ms. Heino were negotiated as part of their employment offers and subsequent adjustments by the Compensation Committee as part of our annual merit cycle and reflective of Ms. Heino’s promotion to Chief Operating Officer.
The base salaries of our named executive officers were as follows:
| Name |
Base Salary |
|||
| Jeffrey Bailey |
$ | 500,000 | ||
| John Bakewell |
$ | 400,000 | ||
| Mary Anne Heino(1) |
$ | 360,000 | ||
| (1) | In connection with Ms. Heino’s promotion to Chief Operating Officer, Ms. Heino’s base salary was increased to $400,000. |
Annual Cash Incentive Compensation
Our 2014 Executive Leadership Team Incentive Bonus Plan, or the Bonus Plan, rewards executive officers, including our named executive officers, for annual financial performance and performance of other corporate goals that may be long-term in nature and meeting or exceeding certain short-term objectives.
Long-Term Equity Incentive Awards
In connection with the Acquisition, the Board of Directors approved and adopted our 2008 Equity Incentive Plan and the subsequently adopted our 2013 Equity Incentive Plan, or the Old Equity Plans, which allow grants of equity awards and options for shares of Holdings. Prior to the consummation of this offering, all incentive awards were issued pursuant to our Old Equity Plans. Upon consummation of this offering, we intend to adopt a new equity incentive plan, or the 2015 Equity Incentive Plan, for future grants. See “—2015 Equity Incentive Plan.”
The outstanding options have an exercise price equal to not less than 100% of the fair market value on the date of grant. Since our common stock was not traded on a national securities exchange prior to the consummation of this offering, fair market value has historically been determined reasonably and in good faith by the Board of Directors. These options have a term not exceeding ten years from the date of the grant. Options were generally issued either as time based options, or the Time Vesting Options, or EBITDA-based performance options, or the Performance Vesting Options.
138
Table of Contents
In 2014, the options granted to Mr. Bakewell were 100% Time Vesting Options in which 120,771 options will vest ratably on the anniversary of his date of employment over a four year period and 40,256 options will cliff vest on the fourth anniversary of his date of employment.
Our target EBITDA for purposes of our 2008 Equity Incentive Plan and our 2013 Equity Incentive Plan relative to performance vesting of options, to the extent applicable, in 2014 was $64.5 million. EBITDA for purposes of our equity incentive plans is defined as EBITDA (GAAP net income (loss), plus interest expense, net, provision of income taxes, depreciation and amortization), further adjusted to exclude unusual items and other adjustments required or permitted in calculating Adjusted EBITDA under the indenture governing our notes and the credit agreement for our revolving credit facility. Adjusted EBITDA as presented in “Prospectus Summary—Summary Consolidated Financial and Other Data” differs from EBITDA relative to the performance vesting of our awards granted as part of our long-term equity incentive awards. Non-executive recruiting and severance, which is included in calculating Adjusted EBITDA, is not permitted in calculating EBITDA for purposes of our equity incentive plans. In the fiscal year ended December 31, 2014, our actual EBITDA relative to performance vesting of options in 2014 was $70.2 million. As a result, 100% of the Performance Vesting Options vested in 2014. A carry back of $5.7 million was applied from 2014 to Performance Vesting Options in 2013 which resulted in those options becoming 100% vested.
In connection with this offering, we intend to enter into amendments with holders of options granted under our 2008 Equity Incentive Plan that contain performance-vesting criteria to amend the performance-vesting portion of such option so that it will become a time vesting option that cliff vests in full on the date that is the third anniversary of the date of the effectiveness of the Registration Statement of which this prospectus forms a part relating to our initial public offering; provided that, if prior to such third anniversary, a change of control of our company occurs, such new time vesting options shall be eligible for partial or full accelerated vesting in certain circumstances. In addition, in connection with this offering, we intend to enter into an amendment with Mr. Bailey to similarly amend the performance-vesting portion of the options granted to him under our 2013 Equity Incentive Plan.
For additional information concerning the options awarded in 2012, 2013 and 2014, see “—Outstanding Equity Awards at 2014 Fiscal Year-End.”
Other Benefits
Retirement Plans
We offer a 401(k) qualified defined contribution retirement plan, or the 401(k) Plan, for U.S.-based employees, including named executive officers, with a 100% match of each participant’s contributions up to 4.5% of the participant’s base salary.
Personal Benefits
Except as otherwise discussed herein, other welfare and employee-benefit programs are the same for all of our eligible employees, including our named executive officers. Our other named executive officers do not receive additional benefits outside of those offered to our other employees.
Ownership Guidelines
In the event of exercise of an option grant, the resulting shares are subject to the provisions of the Employee Shareholder Agreement that restrict transfer to ensure alignment with the initial investors. Employee Shareholders (as defined in the Employee Shareholder Agreement) and Management Shareholders (as defined in the Initial Shareholders Agreement) are restricted from transferring any of our securities, subject to certain exceptions outlined in the Employee Shareholder Agreement and Initial Shareholders Agreement, as applicable. See “Certain Relationships and Related Person Transactions—Shareholders Agreements.”
139
Table of Contents
Severance and Change in Control Benefits
In January 2008, we entered into an employment agreement with Don Kiepert, our former President and Chief Executive Officer, which detailed, among other things, his rights upon a termination of employment in exchange for non-competition, non-solicitation and confidentiality covenants. See “—Potential Payment Upon Termination or Change in Control.”
Mr. Bailey’s employment agreement, dated as of May 8, 2013, as amended effective upon the consummation of this offering, will provide for an amount equal to two times his base salary on the date of termination payable in substantially equal installments over 12 months and health benefit subsidies for a period of 12 months in the event of termination by the company without cause or by Mr. Bailey with good reason. If his termination under these provisions is within 12 months following a change of control, the agreement provides for an amount equal to four times his base salary on the date of termination payable in substantially equal installments over a period of 12 months and 18 months of certain benefit subsidies. Mr. Bailey will not be entitled to any additional payments calculated by reference to foregone bonuses. See “—Potential Payment Upon Termination or Change in Control.”
All of our other current named executive officers are covered by employment agreements that as amended effective upon the consummation of this offering will provide for an amount equal to the sum of the executive’s base salary on the date of termination and a pro rata portion (based upon the percentage of the fiscal year that shall have elapsed through the date of the officer’s termination of employment) of a specified percentage of the officer’s base salary (60% for Mr. Bakewell and 60% for Ms. Heino) payable in substantially equal installments over a period of 12 months, and certain benefit subsidies for a period of 12 months in the event of a termination by the company without cause. If their termination is by the company without cause or by the executive for good reason within 12 months following a change of control, the agreements provide for an amount equal to the sum of the executive’s base salary and a specified percentage of the executive’s base salary (60% for Mr. Bakewell and 60% for Ms. Heino) payable in substantially equal installments over a period of 12 months, and 12 months of certain benefit subsidies. See “—Potential Payment Upon Termination or Change in Control.”
In addition, all of the employment agreements with our current named executive officers, as amended effective upon the consummation of this offering, will provide for a modified cut back with respect to certain adverse tax consequences imposed on the receipt of parachute payments by certain specified individuals pursuant to Sections 280G and 4999 of the Internal Revenue Code whereby, if the named executive officer’s receipt of payments or distributions from the Company in the nature of compensation or for the named executive officer’s benefit, whether paid or payable pursuant to his or her employment agreement or otherwise (a “Payment”), would subject the named executive officer to the excise tax under Section 4999 of the Internal Revenue Code, the Payments shall be reduced to the greatest amount of the Payments that can be paid and would not result in the imposition of the excise tax (the “Reduced Amount”), however, if the portion of the Payments the named executive officer would receive after payment of all applicable taxes, including any excise taxes, is greater than the Reduced Amount, no such reduction shall occur.
Tax and Accounting Implications
While a privately held company, we were not subject to Section 162(m) of the Internal Revenue Code. Beginning in 2013, the compensation committee considered the impact of Section 162(m) in the design of its compensation strategies. Under Section 162(m), compensation paid to certain executive officers in excess of $1,000,000 cannot be taken by us as a tax deduction unless the compensation qualifies as performance-based compensation. We have determined, however, that we will not necessarily seek to limit executive compensation to amounts deductible under Section 162(m) if that limitation is not in the best interests of our stockholders. While considering the tax implications of its compensation decisions, the compensation committee believes its primary focus should be to attract, retain and motivate executives and to align the executives’ interests with those of our stockholders.
140
Table of Contents
The compensation committee operates its compensation programs with the good faith intention of complying with Section 409A of the Internal Revenue Code. We account for stock based payments with respect to our long-term equity incentive award programs in accordance with the requirements of ASC 718.
Outstanding Equity Awards at 2014 Fiscal Year-End
The following table includes certain information with respect to options held by the named executive officers as of December 31, 2014.
| Option Awards(1) | ||||||||||||||||||||
| Name and address of beneficial owner |
Number of Securities Underlying Unexercised Options Exercisable (#) |
Number of Securities Underlying Unexercised Options Unexercisable (#) |
Equity Incentive Plan Awards: Securities of Underlying Unexercised Unearned Options (#) |
Option Exercise Price ($) |
Option Expiration Date |
|||||||||||||||
| Jeffrey Bailey |
||||||||||||||||||||
| Stock options(2) |
86,164 | 91,772 | 177,936 | $ | 19.11 | 5/7/2023 | ||||||||||||||
| John Bakewell |
||||||||||||||||||||
| Stock options(3) |
— | 120,771 | — | $ | 12.42 | 12/31/2024 | ||||||||||||||
| Stock options(3) |
— | 40,256 | — | $ | 12.42 | 12/31/2024 | ||||||||||||||
| Mary Anne Heino |
||||||||||||||||||||
| Stock options(2) |
16,681 | 16,682 | 11,121 | $ | 19.11 | 4/14/2023 | ||||||||||||||
| (1) | Gives effect to our corporate reorganization (including the related reverse stock split). See “Prospectus Summary—Corporate Reorganization.” |
| (2) | The options granted to Mr. Bailey in conjunction with his employment offer were 50% Time Vesting Options and 50% Performance Vesting Options. Mr. Bailey’s Time Vesting Options vest ratably each month over a four year period from his date of hire; the options granted to Ms. Heino in 2013 granted under our 2008 Equity Incentive Plan in conjunction with her employment offer vest ratably on the anniversary of grant date over a four year period; 50% are Time Vesting and Options and 50% are Performance Vesting Options. See “—Elements of Compensation—Long-Term Equity Incentive Awards.” |
| (3) | The options granted to Mr. Bakewell in conjunction with his employment offer are 100% Time Vesting Options under our 2013 Equity Incentive Plan in conjunction with his employment offer vest ratably on the anniversary of grant date over a four year period. |
In April of 2015, the Compensation Committee granted restricted stock awards, or RSAs, to senior members of the management team as part of our annual performance cycle. Mr. Bailey and Ms. Heino received RSA grants of 181,494 and 44,484, respectively. As a recent new hire in 2014, Mr. Bakewell was deemed not eligible to participate in this grant. The values are not reflected in the table above.
Employment Agreements
The compensation committee determined that it was appropriate to enter into employment agreements with each of our named executive officers. Among other things, these agreements set the executives’ compensation terms, their rights upon a termination of employment, and restrictive covenants relating to non-competition, non-solicitation and confidentiality. Effective upon the consummation of this offering, these agreements will be amended. See “—Potential Payment Upon Termination or Change of Control—Employment Agreements and Arrangements” for the material terms of these employment agreements.
2014 Pension Benefits
We do not offer our executives or others a pension plan. Retirement benefits are limited to participation in our 401(k) plan with a 4.5% employer match of the contributor’s salary and a corresponding international plan.
141
Table of Contents
Nonqualified Deferred Compensation
We do not offer our executives any nonqualified deferred compensation.
Potential Payment Upon Termination or Change in Control
The information below describes and quantifies certain compensation that would become payable under certain named executive officer’s employment agreements if, as of December 31, 2014, his or her employment had terminated or there was a change in control. Due to the number of factors that affect the nature and amount of any benefits provided upon the events discussed below, any actual amounts paid or distributed may be different. Factors that could affect these amounts include the timing during the year of any such event.
Employment Agreements and Arrangements
Jeffrey Bailey
As of December 31, 2014, Mr. Bailey’s employment agreement provides for 12 months of salary of $500,000, a bonus of $500,000 and health benefit subsidies of $21,289 in the event of termination by the company without cause or by Mr. Bailey with good reason totaling to $1,021,289. If his termination under these provisions is within 12 months following a change of control, the agreement provides for 12 months of two times his salary in the amount of $1,000,000, two times in bonus payment of $1,000,000 and 12 months of certain benefit subsidies of $31,934 totaling to $2,031,934. For the terms of Mr. Bailey’s employment agreement as amended effective upon the consummation of this offering, see “—Elements of Compensation—Severance and Change in Control Benefits.”
Other Active Named Executive Officers
The following table sets forth certain information, as of December 31, 2014, with respect to agreements for Mr. Bakewell and Ms. Heino who are covered by employment agreements which provided for 12 months of salary, prorated bonus and 12 months of certain benefit subsidies in the event of termination by the company without cause.
| Name |
Salary | Bonus | Benefits | Total | ||||||||||||
| John Bakewell |
$ | 400,000 | $ | 140,000 | $ | 21,289 | $ | 561,289 | ||||||||
| Mary Anne Heino |
$ | 360,000 | $ | 162,000 | $ | 21,289 | $ | 543,289 | ||||||||
As of December 31, 2014, if their termination was by the company without cause or by the executive for good reason within 12 months following a change of control, the agreements provided for 12 months of salary, full target bonus and 12 months of certain benefit subsidies.
| Name |
Salary | Bonus | Benefits | Total | ||||||||||||
| John Bakewell |
$ | 400,000 | $ | 240,000 | $ | 21,289 | $ | 661,289 | ||||||||
| Mary Anne Heino |
$ | 360,000 | $ | 162,000 | $ | 21,289 | $ | 543,289 | ||||||||
For terms of Mr. Bakewell and Ms. Heino’s respective employment agreements as amended effective upon the consummation of this offering, see “—Elements of Compensation—Severance and Change in Control Benefits.”
The Old Equity Plans
The Old Equity Plans and each individual Stock Option Agreement provides for accelerated vesting of both Time Vesting Options and Performance Vesting Options granted under the Old Equity Plans upon a change of
142
Table of Contents
control if net cumulative cash proceeds received by our investors exceed certain multiples of their initial investment. If such a change in control occurred on December 31, 2014, each named executive officer’s unvested Time Vesting Options and Performance Vesting Options would immediately vest and become exercisable. The aggregate dollar value of unvested stock options held by each named executive officer on December 31, 2014 is zero.
2015 Equity Incentive Plan
We intend to adopt the 2015 Equity Incentive Plan in connection with this offering. The 2015 Equity Incentive Plan will become effective prior to the consummation of this offering and a total of 2,190,320 shares of our common stock will be reserved for issuance. We intend to file a registration statement on Form S-8 covering the shares issuable under the 2015 Equity Incentive Plan together with the shares issuable under the Old Equity Plans. The following is a summary of the material features of the 2015 Equity Incentive Plan.
Administration
The 2015 Equity Incentive Plan will be administered by the compensation committee or another committee of the Board of Directors, comprised of no fewer than two members of the Board of Directors who are appointed by the Board of Directors to administer the plan, or, subject to the limitations set forth in the 2015 Equity Incentive Plan, the board of directors. Subject to the limitations set forth in the 2015 Equity Incentive Plan, the committee or the board of directors has the authority to determine the persons to whom awards are to be granted, prescribe the restrictions, terms and conditions of all awards, interpret the 2015 Equity Incentive Plan and adopt sub-plans and rules for the administration, interpretation and application of the 2015 Equity Incentive Plan.
Reservation of Shares
Subject to adjustments as described below, the maximum aggregate number of shares of common stock that may be issued pursuant to awards granted under the 2015 Equity Incentive Plan will be equal to 2,190,320; provided, that no more than 20% (438,064) of the shares initially reserved under the 2015 Equity Incentive Plan may be granted as incentive stock options within the meaning of Section 422 of the Code. Any shares of common stock issued under the 2015 Equity Incentive Plan will consist of authorized and unissued shares or treasury shares.
In the event of any recapitalization, reclassification, stock dividend, extraordinary dividend, stock split, reverse stock split or other distribution with respect to common stock, or any merger, reorganization, consolidation, combination, spin-off, stock purchase, or other similar corporate change or any other change affecting common stock, equitable adjustments will be made to the number and kind of shares of common stock available for grant, as well as to other maximum limitations under the 2015 Equity Incentive Plan, and the number and kind of shares of common stock or other terms of the awards that are affected by the event.
Share Counting
Awards that are required to be paid in cash pursuant to their terms will not reduce the share reserve. To the extent that an award granted under the 2015 Equity Incentive Plan is canceled, expired, forfeited, surrendered, settled by delivery of fewer shares than the number underlying the award, settled in cash or otherwise terminated without delivery of the shares, the shares of common stock retained by or returned to us will (i) not be deemed to have been delivered under the 2015 Equity Incentive Plan, (ii) be available for future awards under the 2015 Equity Incentive Plan, and (iii) increase the share reserve by one share for each share that is retained by or returned to us. Notwithstanding the foregoing, shares that are (x) withheld from an award or separately surrendered by the participant in payment of the exercise or purchase price or taxes relating to such an award or (y) not issued or delivered as a result of the net settlement of an outstanding stock option or stock appreciation right shall be deemed to constitute delivered shares, will not be available for future awards under the 2015 Equity
143
Table of Contents
Incentive Plan and shall continue to be counted as outstanding for purposes of determining whether award limits have been attained. If an award is settled in cash, the number of shares of common stock on which the award is based shall not count toward any individual share limit, but shall count against the annual cash performance award limit. Awards assumed or substituted for in a merger, consolidation, acquisition of property or stock or reorganization will not reduce the share reserve.
Eligibility
Awards under the 2015 Equity Incentive Plan may be granted to any of our employees, directors, consultants or other personal service providers or any of the same of our subsidiaries.
Stock Options
Stock options granted under the 2015 Equity Incentive Plan may be issued as either incentive stock options, within the meaning of Section 422 of the Code, or as nonqualified stock options. The exercise price of an option will be not less than 100% of the fair market value of a share of common stock on the date of the grant of the option. The committee or the board of directors will determine the vesting and/or exercisability requirements and the term of exercise of each option, including the effect of termination of service of a participant or a change in control. The vesting requirements may be based on the continued employment or service of the participant for a specified time period or on the attainment of specified business performance goals established by the committee or the board of directors. The maximum term of an option will be 10 years from the date of grant.
To exercise an option, the participant must pay the exercise price, subject to specified conditions, (i) in cash, or, to the extent permitted by the committee or the board of directors, and set forth in an award agreement, (ii) in shares of common stock, (iii) through an open-market broker-assisted transaction, (iv) by reducing the number of shares of common stock otherwise deliverable upon the exercise of the stock option, (v) by combination of any of the above methods or (vi) by such other method approved by the committee or the board of directors must pay any required tax withholding amounts. All options generally are nontransferable.
Subject to the anti-dilution adjustment provisions and the change of control provisions of the 2015 Equity Incentive Plan, without the prior approval of our stockholders, neither the committee nor the board of directors shall (a) cancel a stock option in exchange for cash or another award when the exercise price per share under such stock option then exceeds the fair market value of one share of our common stock, (b) cause the cancellation, substitution or amendment of a stock option that would have the effect of reducing the exercise price of such stock option or (c) otherwise approve any modification to a stock option that would be treated as a “repricing” under the then applicable rules, regulations or listing requirements adopted by NASDAQ or other principal exchange on which our common stock is then listed.
Stock Appreciation Rights
A stock appreciation right may be granted either in tandem with an option or without a related option. A stock appreciation right entitles the participant, upon settlement or exercise, to receive a payment based on the excess of the fair market value of a share of common stock on the date of settlement or exercise over the base price of the right, multiplied by the number of shares of common stock as to which the right is being settled or exercised. Stock appreciation rights may be granted on a basis that allows for the exercise of the right by the participant or that provides for the automatic payment of the right upon a specified date or event. The base price of a stock appreciation right may not be less than 100% of the fair market value of a share of common stock on the date of grant. The committee or the board directors will determine the vesting requirements and the term of exercise of each stock appreciation right, including the effect of termination of service of a participant or a change in control. The vesting requirements may be based on the continued employment or service of the participant for a specified time period or on the attainment of specified business performance goals established by the committee or the board directors. The maximum term of a stock appreciation right will be ten years from
144
Table of Contents
the date of grant. Stock appreciation rights may be payable in cash or in shares of common stock or in a combination of both. All stock appreciation rights generally are nontransferable.
Subject to the anti-dilution adjustment provisions and the change of control provisions of the 2015 Equity Incentive Plan, without the prior approval of our stockholders, neither the committee nor the board of directors shall (a) cancel a stock appreciation right in exchange for cash or another award when the base price per share under such stock appreciation right then exceeds the fair market value of one share of our common stock, (b) cause the cancellation, substitution or amendment of a stock appreciation right that would have the effect of reducing the base price of such stock appreciation right or (c) otherwise approve any modification to a stock appreciation right that would be treated as a “repricing” under the then applicable rules, regulations or listing requirements adopted by NASDAQ or other principal exchange on which our common stock is then listed.
Restricted Stock Awards
A restricted stock award represents shares of common stock that are issued subject to restrictions on transfer and vesting requirements. The vesting requirements may be based on the continued service of the participant for a specified time period or on the attainment of specified performance goals established by the committee, and vesting may be accelerated in certain circumstances, as determined by the committee. Unless otherwise set forth in an award agreement, restricted stock award holders will not have any of the rights of a stockholder of us (including, the right to vote or receive dividends and other distributions paid or made with respect thereto), unless and until such shares vest. Any dividends with respect to a restricted stock award that is subject to performance-based vesting will be subject to the same restrictions on transfer and vesting requirements as the underlying restricted stock award. All restricted stock awards are generally nontransferable.
Restricted Stock Units
An award of restricted stock units, or RSUs, provides the participant the right to receive a payment based on the value of a share of common stock. RSUs may be subject to vesting requirements, restrictions and conditions to payment. RSUs may vest based solely on the continued service of the participant for a specified time period. In addition, RSUs may be denominated as performance share units, or PSUs and may vest in whole or in part based on the attainment of specified performance goals established by the committee or the board of directors. The vesting of RSUs and PSUs may be accelerated in certain circumstances, as determined by the committee or the board of directors. RSU and PSU awards will become payable to a participant at the time or times determined by the committee or the board of directors and set forth in the award agreement, which may be upon or following the vesting of the award. RSU and PSU awards are payable in cash or in shares of common stock or in a combination of both. RSUs and PSUs may be granted together with a dividend equivalent right with respect to the shares of common stock subject to the award. Dividend equivalent rights will be paid at such time as determined by the committee or the board of directors in its discretion (including, without limitation, at the times paid to stockholders generally or at the times of vesting or payment of the RSU or PSU). Dividend equivalent rights may be subject to forfeiture under the same conditions as apply to the underlying RSUs or PSUs. All RSUs and PSUs are generally nontransferable.
Stock Awards
A stock award represents shares of common stock that are issued free of restrictions on transfer and free of forfeiture conditions and to which the participant is entitled all incidents of ownership. A stock award may be granted for past, or in anticipation of future, services, in lieu of any discretionary bonus or other discretionary cash compensation, directors’ fees or for any other valid purpose as determined by the committee. The committee will determine the terms and conditions of stock awards, and such stock awards may be made without vesting requirements. Upon the issuance of shares of common stock under a stock award, the participant will have all rights of a shareholder with respect to such shares of common stock, including the right to vote the shares and receive all dividends and other distributions on the shares; provided, however, that the committee may issue or
145
Table of Contents
grant shares of common stock that are subject to vesting or forfeiture and that restrict or eliminate voting rights with respect to such shares until any such vesting criteria is satisfied or such forfeiture provisions lapse. Subject to Section 409A of the Code, upon advance written request of a participant and with the consent of the committee, such participant may receive a portion of any cash compensation otherwise due in the form of common stock either currently or on a deferred basis. The right to receive shares of common stock on a deferred basis is generally nontransferable.
Cash Performance Awards
A performance award is denominated in a cash amount (rather than in shares) and is payable based on the attainment of pre-established business and/or individual performance goals. The requirements for vesting may be also based upon the continued service of the participant during the performance period, and vesting may be accelerated in certain circumstances, as determined by the committee or the board of directors. All cash performance awards are generally nontransferable. The maximum amount of cash compensation that may be paid to a participant during any one calendar year under all cash performance awards and all other awards that are actually paid or settled in cash is limited to $2.0 million.
Performance Criteria
For purposes of cash performance awards, as well as for any other awards under the 2015 Equity Incentive Plan intended to qualify as “performance-based compensation” under Section 162(m) of the Code, the performance criteria will be one or any combination of the following, for us or any identified subsidiary, division or business unit or line, as determined by the committee at the time of the award: (i) total stockholder return; (ii) such total stockholder return as compared to total return (on a comparable basis) of a publicly available index such as, but not limited to, the Standard & Poor’s 500 Stock Index; (iii) net income; (iv) pretax earnings; (v) adjusted earnings before interest expense, taxes, depreciation and amortization, or EBITDA; (vi) pretax operating earnings after interest expense and before bonuses, service fees and extraordinary or special items; (vii) operating margin; (viii) earnings per share; (ix) return on equity; (x) return on capital; (xi) return on investment; (xii) operating earnings; (xiii) working capital; (xiv) ratio of debt to stockholders’ equity; (xv) revenue; (xvi) free cash flow (generally defined as adjusted EBITDA, less cash taxes, cash interest and net capital expenditures, mandatory payments of principal under any credit facility, and payments under collateralized lease obligations and financing lease obligations); and (xvii) any combination of or a specified increase in any of the foregoing. Each of the performance goals will be applied and interpreted in accordance with an objective formula or standard established by the committee at the time of grant of the award including, without limitation, GAAP.
The “performance goals” shall be the levels of achievement relating to the performance criteria selected by the committee for the award. The performance goals shall be written and shall be expressed as one objective formula or standard that precludes discretion to increase the amount of compensation payable that would otherwise be due upon attainment of the goal. The performance goals may be applied on an absolute basis or relative to an identified index, peer group, or one or more competitors or other companies (including particular business segments or divisions of such companies), or may be applied after adjustment for non-controllable industry performance (such as industry attendance), as specified by the committee.
At the time that an award is granted, the committee may provide for the performance goals or the manner in which performance will be measured against the performance goals to be adjusted in such objective manner as it deems appropriate, including, without limitation, adjustments to reflect non-cash losses or charges, charges for restructurings, non-operating income, the impact of corporate transactions, severance and recruitment costs, “run rate” savings, costs incurred in establishing new manufacturing sources, specified legal expenses, discontinued operations, or financing transactions, extraordinary and other unusual or non-recurring items or events and the cumulative effects of accounting or tax law changes. In addition, with respect to a participant hired or promoted
146
Table of Contents
following the beginning of a performance period, the committee may determine to prorate the performance goals and/or the amount of any payment in respect of such participant’s cash performance awards for the partial performance period.
Further, the committee shall, to the extent provided in an award agreement, have the right, in its discretion, to reduce or eliminate the amount otherwise payable to any participant under an award and to establish rules or procedures that have the effect of limiting the amount payable to any participant to an amount that is less than the amount that is otherwise payable under an award. The committee shall not have discretion to increase the amount that is otherwise payable to any participant. Following the conclusion of the performance period, the committee shall certify in writing whether the applicable performance goals have been achieved, or certify the degree of achievement, if applicable. Upon certification of the performance goals, the committee shall determine the level of vesting or amount of payment to the participant pursuant to the award, if any.
Notwithstanding anything to the contrary contained in the 2015 Equity Incentive Plan, with respect to any award intended to qualify as “performance-based compensation” under Section 162(m) of the Internal Revenue Code, unless the board of directors determines that an applicable exemption under applicable law applies, all references to the committee or the board of directors in the 2015 Equity Incentive Plan shall solely mean each such member that satisfies the requirements for an “outside director” under Section 162(m) of the Internal Revenue Code.
Award Limitations
For purposes of complying with the requirements of Section 162(m) of the Code, the maximum number of shares of common stock that may be subject to stock options, stock appreciation rights, performance-based restricted stock awards, performance-based RSUs and performance-based stock awards granted to any participant other than a non-employee director during any calendar year will be limited to 2,000,000 shares of common stock for each such award type individually.
Further, the maximum number of shares of common stock that may be subject to stock options, stock appreciation rights, restricted stock awards, RSUs and stock awards granted to any non-employee director during any calendar year will be limited to 500,000 shares of common stock for all such award types in the aggregate.
Effect of Change in Control
Upon the occurrence of a change in control, unless otherwise specifically prohibited under applicable law, or unless otherwise provided in the applicable award agreement, the committee is authorized to make adjustments in the terms and conditions of outstanding awards, including without limitation the following (or any combination thereof): (i) continuation or assumption of our outstanding awards (if we are the surviving company or corporation) or by the surviving company or corporation or its parent; (ii) substitution by the surviving company or corporation or its parent of awards with substantially the same or comparable terms (including, with respect to economic value) for outstanding awards; (iii) accelerated exercisability, vesting and/or payment; and (iv) if all or substantially all of our outstanding shares of common stock transferred in exchange for cash consideration in connection with such change in control: (A) upon written notice, provide that any outstanding stock options and stock appreciation rights are exercisable during a reasonable period of time immediately prior to the scheduled consummation of the event or such other reasonable period as determined by the committee (contingent upon the consummation of the event), and at the end of such period, such stock options and stock appreciation rights will terminate to the extent not so exercised within the relevant period; and (B) cancellation of all or any portion of outstanding awards for fair value, as determined in the sole discretion of the committee.
Forfeiture
The committee may specify in an award agreement that an award will be subject to reduction, cancellation, forfeiture or recoupment upon the occurrence of certain specified events, including termination of service for
147
Table of Contents
“cause” (as defined in the 2015 Equity Incentive Plan), violation of material Company policies, breach of noncompetition, confidentiality or other restrictive covenants that may apply to the participant, or other conduct by the participant that is detrimental to our business or reputation. Unless otherwise provided by the committee and set forth in an award agreement, if (i) a participant’s service is terminated for “cause” or (ii) after termination of service for any other reason, the committee determines in its discretion either that, (A) during the participant’s period of service, the participant engaged in an act which would have warranted termination from service for “cause” or (B) after termination, the participant engaged in conduct that violates any continuing obligation or duty of the participant set forth in any executive or restrictive covenant agreement to which the participant is a party in favor of us or any of our subsidiaries, such participant’s rights, payments and benefits with respect to such award may be subject to cancellation, forfeiture and/or recoupment.
Right of Recapture
If a participant receives compensation pursuant to an award calculated by reference to financial statements that are subsequently required to be restated in a way that would decrease the value of such compensation, the participant will, upon our written request, forfeit and repay to us the difference between what the participant received and what the participant should have received based on the accounting restatement, in accordance with (i) our compensation recovery, “clawback” or similar policy, as may be in effect from time to time and (ii) any compensation recovery, “clawback” or similar policy made applicable by law including the Dodd-Frank Act.
Notwithstanding anything to the contrary contained in the 2015 Equity Incentive Plan, in the event the receipt of all payments or distributions by us in the nature of compensation to or for a participant’s benefit, whether paid or payable pursuant to this plan or otherwise (a “Payment”), would subject the participant to the excise tax under Section 4999 of the Internal Revenue Code, the Payments shall be reduced to the greatest amount of the Payments that can be paid and would not result in the imposition of the excise tax (the “Reduced Amount”), however, if the portion of the Payments the participant would receive after payment of all applicable taxes, including any excise taxes, is greater than the Reduced Amount, no such reduction shall occur.
Tax Withholding
We have the power and the right to deduct or withhold automatically from any amount deliverable under an award or otherwise, or require a participant to remit to us, the minimum statutory amount to satisfy federal, state and local taxes, domestic or foreign, required by law or regulation to be withheld with respect to any taxable event arising as a result of the 2015 Equity Incentive Plan. With respect to required withholding, participants may elect (subject to our automatic withholding right set out above) to satisfy the withholding requirement with respect to any taxable event arising as a result of the 2015 Equity Incentive Plan, in whole or in part, by the methods described in the 2015 Equity Incentive Plan applicable to the payment of the exercise price in connection with stock option exercises.
Deferrals of Payment
The committee may in its discretion permit participants in the 2015 Equity Incentive Plan to defer the receipt of payment of cash or delivery of shares of common stock that would otherwise be due by virtue of the exercise of a right or the satisfaction of vesting or other conditions with respect to an award or an election to receive shares of our common stock (in lieu of compensation otherwise payable in cash) on a deferred basis in accordance with the terms of the 2015 Equity Incentive Plan; provided, however, that such discretion shall not apply in the case of a stock option or stock appreciation right.
Trading Policy Considerations
Stock option exercises and other awards granted under the 2015 Equity Incentive Plan shall be subject to our insider trading policy or other trading or ownership policy related restrictions, terms and conditions as in effect, from time to time.
148
Table of Contents
Term, Amendment and Termination
The 2015 Equity Incentive Plan shall be effective as of the later of (i) the date it was approved by the Board of Directors and (ii) the effectiveness of the Form 8-A in connection with this offering. The Board of Directors may amend, modify, suspend or terminate the 2015 Equity Incentive Plan at any time. However, no termination or amendment of the 2015 Equity Incentive Plan will adversely affect any award theretofore granted without the consent of the participant or the permitted transferee of the award; except as otherwise provided in the 2015 Equity Incentive Plan or determined by the committee or the board of directors to be necessary to comply with applicable laws. The Board of Directors may seek the approval of any amendment by our shareholders to the extent it deems necessary or advisable for purposes of compliance with Section 162(m) or Section 422 of the Code, the listing requirements of NASDAQ, or for any other purpose.
Outstanding Incentive Awards and Anticipated Awards in Connection with this Offering
Certain of our employees and members of management historically have received management incentive awards consisting of options to purchase our common stock. These awards were typically subject to time-vesting or performance-vesting. All vesting is subject to the grantee’s continued employment by us. In connection with this offering, we intend to enter into agreements with current employees who are holders of performance-vesting stock option granted under our Old Equity Plans to amend the vesting provisions of such option so that they vest based on the passage of time, such that any unvested performance option award shall cliff vest in full on the third anniversary of date on which the Registration Statement of which this prospectus forms a part becomes effective.
With respect to these amended awards, if a change of control occurs prior to such third anniversary, unless the award is assumed by the acquirer in such transaction or substituted for awards with substantially the same or comparable terms, a number of shares of our common stock shall vest immediately prior to such change of control transaction in an amount equal to the number of shares of Company common stock subject to the unvested award that would have otherwise be vested as of the date of such transaction if such award would have vested in three equal installments at each anniversary over the three year period, and any portion of the unvested award that did not vest will automatically terminate and be forfeited, and thereafter any such accelerated awards shall be canceled as of the consummation of the change of control transaction and converted into the right to receive (in the form of cash, shares, other property or any combination thereof) the excess, if any, of the value of the consideration to be paid in the change of control transaction to holders of the same number of shares of our common stock, or, if no such excess, zero.
Our committee or the board of directors will determine, subject to employment agreements, any future equity awards that executive officers will be granted pursuant to the 2015 Equity Incentive Plan.
April 2015 Restricted Stock Grant
In April of 2015, under our 2013 Equity Plan, the Compensation Committee granted to certain employees, including senior members of our management team and our independent directors, an aggregate of 446,375 RSAs. Such RSAs vest 50% on January 30, 2017 and 50% on January 30, 2019 (January 30, 2018 in the case of independent directors) and were granted at a fair value price of $12.42 per share. For further discussion of grants made prior to April 2015, please see Note 12 to our consolidated financial statements, which are included elsewhere in this prospectus.
149
Table of Contents
Director Compensation
The compensation paid in 2014 to Mr. Bailey, our President and CEO and Director, is reported in the Summary Plan Compensation Table as he does not receive compensation for services as a Director and was paid only as an employee during 2014. In 2014, we did not compensate our Board members with per meeting fees. Our Directors were reimbursed for any expenses incurred in connection with their services and as detailed in the table and notes below.
| Name |
Fees Earned or Paid in Cash ($) |
All Other Compensation ($) |
Total ($) |
|||||||||
| Brian Markison(1) |
$ | 75,000 | $ | 69,852 | $ | 144,852 | ||||||
| David Burgstahler(2) |
$ | — | $ | — | $ | — | ||||||
| Samuel Leno(3) |
$ | 48,750 | $ | 32,930 | $ | 81,680 | ||||||
| Patrick O’Neill(4) |
$ | 37,500 | $ | 34,595 | $ | 72,095 | ||||||
| Sriram Venkataraman(2) |
$ | — | $ | — | $ | — | ||||||
| (1) | On January 23, 2013, Mr. Markison was appointed Non-Executive Chairman of the Board. For 2014, Mr. Markison was compensated with an annual retainer for his services on the Board of Directors of $100,000, paid in quarterly increments. In connection with his appointment as Non-Executive Chairman, (i) his annual director compensation was increased to $100,000 effective as of January 23, 2013, (ii) 1,693 shares of his previous 4,448 option grant were deemed to be vested with the balance of 2,755 shares terminated as forfeitures, (iii) he received a new grant of 12,727 time vesting option shares that have a ten-year term and that vested monthly over a 12-month basis, and (iv) on each anniversary date of his appointment, in consideration of his services as Chairman and for so long as he served in that capacity, he was to be granted a stock option to purchase that number of underlying shares of common stock equal to $200,000 divided by the then fair market value per share. On January 23, 2014, Mr. Markison received a grant of 11,725 time vesting option shares that have a ten- year term and vest monthly over a 12-month basis, and on each anniversary date of his appointment, in consideration of his services as Chairman and for so long as he serves in that capacity, he was to be granted a stock option to purchase $200,000 worth of common stock, calculated as the multiple of the then fair market value times the number of shares necessary to equal $200,000. |
| (2) | Messrs. Burgstahler and Venkataraman are Partners of Avista and do not receive any direct compensation for their services as Directors. We have paid Avista a management fee of $1,000,000 annually pursuant to the Advisory Services and Monitoring Agreement, dated as of January 8, 2008, which we will terminate prior to the consummation of this offering. See “Certain Relationships and Related Person Transactions—Advisory and Monitoring Services Agreement.” |
| (3) | Samuel Leno is compensated with an annual retainer for his services on the Board of Directors of $50,000, paid in quarterly increments. In addition, pursuant to his current arrangement with us, Mr. Leno received $15,000 per year, paid in quarterly increments for his role as Chairman of the audit committee. Mr. Leno received a grant of 4,448 stock options in 2012. These options have a ten year term and are time vesting options that vested in full on the first anniversary of grant. Mr. Leno received a grant of 6,135 and 7,012 stock options in 2014 and 2013, respectively. These options have a ten-year term and are time vesting options that vested in full on the first anniversary of grant. On each anniversary date of his appointment, in consideration of his services as a Director and for so long as he served in that capacity, he was to be granted a stock option to purchase that number of underlying shares of common stock equal to $100,000 divided by the then fair market value per share. |
| (4) | Dr. Patrick O’Neill is compensated with an annual retainer for his services on the Board of Directors of $50,000, paid in quarterly increments. Dr. O’Neill received a grant of 17,793 stock options in 2008. These options have a ten-year term and are time vesting options. 20% of the shares subject to the time vesting options vested on each anniversary of the grant in 2008 through 2012. The remaining shares subject to the time vesting options were vested in full on January 8, 2013. Dr. O’Neill received a grant of 5,862 and 5,233 stock options in 2014 and 2013, respectively. These options have a ten-year term and are time vesting |
150
Table of Contents
| options and vested in full on the first anniversary of grant. On each anniversary date of his appointment, in consideration of his services as a Director and for so long as he served in that capacity, he was to be granted a stock option to purchase that number of underlying shares of common stock equal to $100,000 divided by the then fair market value per share. |
| (5) | In April of 2015, the Compensation Committee granted RSAs to Mssrs. Markison and Leno and Dr. O’Neill in conjunction with grants to the senior members of the management team. Mssrs. Markison and Leno and Dr. O’Neill received grants of 12,455, 8,896 and 4,270 RSAs, respectively. The values are not reflected in the table above. |
Following the consummation of this offering, each of the non-employee members of the Board of Directors will be compensated for their services as directors through Board fees of $50,000 per calendar year, a one-time equity award at the time of this offering as described below, annual equity awards as described below commencing with fiscal year 2015 and reimbursement for out-of-pocket expenses incurred in connection with rendering such services for so long as they serve as directors. Each of the members of the audit committee will receive an annual fee of $10,000 in cash and each of the members of the compensation committee will receive an annual fee of $7,500 in cash. Each of the members of the nominating and governance committee will receive a fee of $5,000 in cash. The chair of the Board of Directors will receive an annual fee of $25,000, the chair of the audit committee will receive an annual fee of $20,000 in cash, the chair of the nominating and governance committee will receive an annual fee of $10,000 in cash and the chair of the compensation committee will receive an annual fee of $15,000 in cash. In addition, certain non-employee members of the Board of Directors may also participate in the future in our 2015 Equity Incentive Plan as described under “—The 2015 Equity Incentive Plan.” All director compensation arrangements with Messrs. Markison, O’Neill and Leno will be restated to reflect the above-mentioned cash and equity compensation for their continued service as directors.
Effective upon the execution of the underwriting agreement relating to this offering, as part of the compensation for his director services, each Director will receive a one-time equity grant consisting of: (i) stock options to purchase that number of underlying shares of our common stock having an aggregate value of $50,000 (based on the public offering price for a share of our common stock in this offering, or the IPO Price), or $100,000 in the case of Mr. Markison (based on the IPO Price), at a per share exercise price equal to the per share IPO Price; and (ii) that number of shares of restricted common stock having an aggregate value of $50,000 (based on the IPO Price), or $100,000 in the case of Mr. Markison (based on the IPO Price), which will have an initial per share fair market value equal to the per share IPO Price. All of these grants will vest in three equal installments on the first three anniversaries of the grant date.
Commencing with fiscal year 2015, for so long as they each serve as a Director, each Director will be granted an annual equity award consisting of: (a) stock options to purchase that number of underlying shares of our common stock having an aggregate value of $50,000 (based on the closing sales price of our common stock on the Nasdaq, or the Measurement Date Price, on the date that is two business days after the public disclosure of our financial results for the prior fiscal year, or the Measurement Date) at a per share exercise price equal to the per share Measurement Date Price; and (b) that number of shares of restricted common stock having an aggregate value of $50,000 (based on the Measurement Date Price), which will have a per share fair market value equal to the Measurement Date Price. These grants of options and restricted stock shall be made each year on the Measurement Date. All of these grants will vest in three equal installments on the first three anniversaries of the grant date.
151
Table of Contents
CERTAIN RELATIONSHIPS AND RELATED PERSON TRANSACTIONS
Set forth below is a description of certain relationships and related person transactions between us or our subsidiaries, and our directors, executive officers and holders of more than 5% of our voting securities since January 1, 2011. We believe that all of the following transactions were entered into with terms as favorable as could have been obtained from unaffiliated third parties.
Shareholders Agreements
In connection with the Acquisition, Holdings entered into (i) a Shareholders Agreement with the Avista Entities and Don Kiepert, as Management Shareholder, dated January 8, 2008 and subsequently amended on February 26, 2008 and prior to the consummation of this offering, or the Initial Shareholders Agreement, and (ii) an Employee Shareholders Agreement with the Avista Entities and certain employee shareholders named therein, dated as of May 30, 2008, or the Employee Shareholders Agreement and, collectively with the Initial Shareholders Agreement, the Shareholders Agreements. Messrs. Markison, Bailey and Leno and Dr. O’Neill joined as parties to the Initial Shareholders Agreement. The Shareholders Agreements govern the parties’ respective rights, duties and obligations with respect to the ownership of Holdings securities. The Initial Shareholders Agreement includes provisions regarding tag-along rights in favor of the Management Shareholders (which terminate upon the consummation of this offering), demand registration rights in favor of the Avista Entities and piggy-back registration rights in favor of the Avista Entities and the Management Shareholders. Both Shareholders Agreements contain provisions for drag-along rights in favor of the Avista Entities (which terminate upon the consummation of this offering), and regarding the right of Holdings to repurchase shares held by Management Shareholders or employee shareholders who cease to be employed by Holdings, the Company or any of their subsidiaries (which terminate one year after the consummation of this offering). The Shareholders Agreements contain restrictions on the ability of the Management Shareholders and employee shareholders to transfer shares of Holdings that they own, including provisions that only allow Management Shareholders and employee shareholders to transfer shares of Holdings for one year following the consummation of this offering, but only in proportion with any transfers by the Avista Entities (which terminate one year after the consummation of this offering). Pursuant to the option award agreements between Holdings and its options holders, as a condition to a valid exercise of any such options, the optionee is obligated to join either the Initial Shareholders Agreement or the Employee Shareholders Agreement, as applicable, with respect to the shares of Holdings it is to receive upon exercise of any such option. Following the consummation of this offering, Avista will have the right to nominate two directors to the Board for so long as it owns 25% or more of our issued and outstanding common stock and the right to nominate one director for election to the Board for so long as it beneficially owns 10% or more, but less than 25%, of our issued and outstanding common stock.
Advisory and Monitoring Services Agreement
In connection with the closing of the Acquisition, LMI entered into an advisory services and monitoring agreement with Avista Capital Holdings, L.P., or Avista Capital Holdings, dated as of January 8, 2008, or the Advisory Services and Monitoring Agreement, pursuant to which ACP Lantern Acquisition, Inc. (a corporation which was merged into us as part of the Acquisition), paid Avista Capital Holdings a one-time fee equal to $10 million for the consulting and advisory and monitoring services to us, our subsidiaries and our parent companies, in connection with the Acquisition. In addition, the agreement provided for the payment of an annual fee equal to $1 million as consideration for ongoing advisory services. Under the agreement, to the extent of any future transaction entered into by us or our affiliates, Avista Capital Holdings was entitled to receive an additional fee that is reasonable and customary for the services it provided in connection with such a future transaction. In addition, we are required to pay directly, or reimburse Avista Capital Holdings for, its out-of-pocket expenses in connection with its performance of services under the Advisory Services and Monitoring Agreement. The Advisory Services and Monitoring Agreement has a seven-year term and automatically renews
152
Table of Contents
on each anniversary of its execution date such that it has a seven-year term from the date of each such renewal. Pursuant to the terms of the Advisory Services and Monitoring Agreement, we intend to exercise our right to terminate the agreement prior to the consummation of this offering. In connection with that termination, we will pay Avista an aggregate termination fee of $6.5 million from available cash on hand.
INC Research Master Services Agreement
In 2012, we entered into a Master Contract Research Organization Services Agreement with INC Research, LLC, or INC, to provide clinical development services in connection with the flurpiridaz F 18 Phase III program. Avista and its affiliates are principal owners of both INC and the Company. The agreement was cancelled during May 2014. The agreement had a term of five years, and we did not incur any costs associated with this agreement in the year ended December 31, 2014. We incurred associated with this agreement of approximately $0.5 million and $0.9 million during the years ended December 31, 2013 and 2012, respectively. At December 31, 2014 and 2013, there was no balance outstanding.
VWR Scientific Purchases
We purchase inventory supplies from VWR Scientific, or VWR. Avista and certain of its affiliates, are principal owners of both VWR and us. We made purchases of approximately $0.5 million, $0.3 million and $0.3 million during each of the years ended December 31, 2014, 2013 and 2012, respectively. At December 31, 2014 and 2013, $21,000 and $1,000, respectively, was included in accounts payable and accrued expenses.
Marsh
We retain Marsh for insurance brokering and risk management. In November 2013, Donald Bailey, brother of our President and Chief Executive Officer, Jeffrey Bailey, was appointed head of sales for Marsh’s U.S. and Canada division. In 2014, we paid Marsh approximately $0.3 million. At both December 31, 2014 and 2013, there was a prepaid of $43,000 included in other current assets.
Employee Loan
At December 31, 2013, we had $0.1 million due from an officer of the Company included in accounts receivable, net. This amount represented federal and state tax withholdings paid by us on behalf of the officer. During the second quarter of 2014, this amount was fully repaid by the officer.
Equity Investments
Series A Preferred Stock
On March 21, 2011, we redeemed 248,828, 96,766 and 553 shares of Series A Preferred Stock held by Avista and Mr. Kiepert, respectively, for approximately $31,537,000, $12,264,300 and $70,100, respectively, representing the liquidation value of the remaining Series A Preferred Stock held by Avista and Mr. Kiepert plus accrued but unpaid dividends through that date. Following this redemption of our remaining Series A Preferred Stock, there were no more amounts outstanding of our Series A Preferred Stock.
Stock Options
We granted stock options to our executive officers and certain of our directors. For a description of these options, see “Executive and Director Compensation—Elements of Compensation—Long-Term Equity Incentive Awards,” “Executive and Director Compensation—Outstanding Equity Awards at 2013 Fiscal Year-End” and “Executive and Director Compensation—Director Compensation.”
153
Table of Contents
Separation Agreements
On February 19, 2013, we entered into a separation agreement with Don Kiepert, our former President and Chief Executive Officer. Pursuant to his employment agreement, Mr. Kiepert received 12 months of severance payments totaling $426,000, continuation of life insurance and subsidized COBRA health benefits at the active employee rate for 12 months totaling $12,305. To effect a smooth leadership transition, Mr. Kiepert also agreed to a consulting arrangement with us at a rate of $10,000 per month for 12 months. Mr. Kiepert was paid a pro rata bonus for 2013 in the amount of $26,844 in early 2014.
On September 30, 2012, we entered into a retirement and resignation agreement with Larry Pickering, our former Chairman. Pursuant to this agreement, Mr. Pickering received any accrued but unpaid salary and vacation. He was not entitled to any severance or bonus payments.
On January 3, 2012, we entered into a retirement agreement with Robert Gaffey, our former Chief Financial Officer. Under the terms of the agreement, Mr. Gaffey continued to provide limited consulting services at a rate of $200 per hour for up to 24 hours per week through March 30, 2012. After March 31, 2012, Mr. Gaffey was paid at an hourly rate of $150 per hour on an independent consultant basis as required by us. Mr. Gaffey’s existing stock options were modified to allow for continued vesting, continued eligibility for payment of DERs and exercisability of his existing options for up to the full original term expiring in 2018. Mr. Gaffey was not eligible for any company benefits or other severance payments. During 2012, Mr. Gaffey’s fees for his post-employment independent consulting to us totaled $125,437.
Indemnification Agreements
Prior to the closing of this offering, we and LMI will enter into indemnification agreements with each of our and LMI’s directors and executive officers. These agreements, among other things, will require us to indemnify each director and executive officer to the fullest extent permitted by Delaware law, including indemnification of expenses such as attorneys’ fees, judgments, penalties, fines and settlement amounts actually and reasonably incurred by the director or executive officer in any action or proceeding, including, without limitation, all liability arising out of negligence or active or passive wrongdoing by such officer of director, in any action or proceeding by or in right of us, arising out of the person’s services as a director or executive officer. At present, we are not aware of any pending or threatened litigation or proceeding involving any of our directors, executive officers, employees, or agents in which indemnification would be required or permitted. We believe these indemnification agreements are necessary to attract and retain qualified persons as directors and executive officers.
Policies for Approval of Related Person Transactions
In connection with this offering, we will adopt a written policy relating to the approval of related person transactions. Our audit committee will review and approve or ratify all relationships and related person transactions between us and (1) our directors, director nominees and executive officers, (2) any 5% record or beneficial owner of our common stock or (3) any immediate family member of any person specified in (1) or (2) above. Our audit committee will be primarily responsible for the development and implementation of processes and controls to obtain information from our directors and executive officers with respect to related party transactions and for determining, based on the facts and circumstances, whether we or a related person have a direct or indirect material interest in the transaction.
As set forth in the related person transaction policy, in the course of its review and approval or ratification of a related party transaction, the audit committee will consider:
| • | the nature of the related person’s interest in the transaction; |
| • | the availability of other sources of comparable products or services; |
154
Table of Contents
| • | the material terms of the transaction, including, without limitation, the amount and type of transaction; and |
| • | the importance of the transaction to us. |
Any member of the audit committee who is a related person with respect to a transaction under review will not be permitted to participate in the approval or ratification of the transaction. However, that member of the audit committee will provide all material information concerning the transaction to the audit committee.
155
Table of Contents
The following table shows information as of June 1, 2015 regarding the beneficial ownership of our common stock (1) immediately prior to this offering and (2) as adjusted to give effect to this offering by:
| • | each person or group who is known by us to own beneficially more than 5% of our common stock; |
| • | each member of our Board of Directors and each of our named executive officers; and |
| • | all members of our Board of Directors and our executive officers as a group. |
Immediately prior to this offering, we had approximately 50 holders of record. For further information regarding material transactions between us and our principal stockholders, see “Certain Relationship and Related Person Transactions.”
Beneficial ownership of shares is determined under rules of the SEC and generally includes any shares over which a person exercises sole or shared voting or investment power. Except as noted by footnote, and subject to community property laws where applicable, we believe based on the information provided to us that the persons and entities named in the table below have sole voting and investment power with respect to all shares of our common stock shown as beneficially owned by them. Percentage of beneficial ownership is based on 18,527,319 shares of common stock outstanding as of June 1, 2015 after giving effect to our corporate reorganization (including the related 0.355872-for-1 reverse stock split) prior to the consummation of this offering and 26,422,055 shares of common stock outstanding after giving effect to this offering. Shares of common stock subject to options currently exercisable or exercisable within 60 days of the date of this prospectus are deemed to be outstanding and beneficially owned by the person holding the options for the purposes of computing the percentage of beneficial ownership of that person and any group of which that person is a member, but are not deemed outstanding for the purpose of computing the percentage of beneficial ownership for any other person. Except as otherwise indicated, the persons named in the table below have sole voting and investment power with respect to all shares of capital stock held by them. Unless otherwise indicated, the address for each holder listed below is Lantheus Holdings, Inc., 331 Treble Cove Road, North Billerica, MA 01862.
| Shares beneficially owned before this offering |
Shares beneficially owned after this offering(1) |
Shares beneficially owned after this offering assuming full exercise of underwriters’ option to purchase additional shares |
||||||||||||||||||||||
| Name and address of beneficial owner |
Number of shares |
Percentage of shares |
Number of shares |
Percentage of shares |
Number of shares |
Percentage of shares |
||||||||||||||||||
| Principal stockholders |
||||||||||||||||||||||||
| Avista(2) |
17,793,599 | 96.04 | % | 17,793,599 | 67.34 | % | 17,793,599 | 64.45 | % | |||||||||||||||
| Directors and Executive Officers |
||||||||||||||||||||||||
| Jeffrey Bailey(3) |
132,143 | * | 132,143 | * | 132,143 | * | ||||||||||||||||||
| John K. Bakewell |
30,192 | * | 30,192 | * | 30,192 | * | ||||||||||||||||||
| William Dawes(4) |
86,288 | * | 86,288 | * | 86,288 | * | ||||||||||||||||||
| Michael Duffy(5) |
71,439 | * | 71,439 | * | 71,439 | * | ||||||||||||||||||
| Mary Anne Heino(6) |
22,242 | * | 22,242 | * | 22,242 | * | ||||||||||||||||||
| Cesare Orlandi(7) |
15,568 | * | 15,568 | * | 15,568 | * | ||||||||||||||||||
| Brian Markison(8) |
47,497 | * | 47,497 | * | 47,497 | * | ||||||||||||||||||
| David Burgstahler(9) |
— | — | — | — | — | — | ||||||||||||||||||
| Samuel Leno(10) |
15,800 | * | 15,800 | * | 15,800 | * | ||||||||||||||||||
| Patrick O’Neill(11) |
30,667 | * | 30,667 | * | 30,667 | * | ||||||||||||||||||
| Sriram Venkataraman(12) |
— | — | — | — | — | — | ||||||||||||||||||
| All Board of Director members and named executive officers as a group (9 persons) |
278,541 | 1.48 | % | 278,541 | 1.05 | % | 278,541 | 1.00 | % | |||||||||||||||
156
Table of Contents
| * | Represents beneficial ownership of less than 1% of our outstanding common stock. |
| (1) | Percentage of beneficial ownership is based on 18,527,319 shares of common stock outstanding as of June 1, 2015 after giving effect to our corporate reorganization (including the related 0.355872-for-1 reverse stock split) prior to the consummation of this offering and 26,422,055 shares of common stock outstanding after giving effect to this offering. |
| (2) | Includes 10,138,072 shares held by Avista Capital Partners, L.P., 2,673,319 shares held by Avista Capital Partners (Offshore), L.P. and 4,982,208 shares held by ACP-Lantern Co-Invest, LLC, or collectively referred to as Avista. Avista Capital Partners GP, LLC ultimately exercises voting and dispositive power over the shares held by Avista Capital Partners, L.P., Avista Capital Partners (Offshore), L.P. and ACP-Lantern Co-Invest, LLC. Voting and disposition decisions at Avista Capital Partners GP, LLC with respect to those shares are made by an investment committee, the members of which are Thompson Dean, Steven Webster, David Burgstahler, David Durkin, Sriram Venkataraman and Brendan Scollans. The address for each of these entities is 65 East 55th Street, 18th Floor, New York, NY 10022. |
| (3) | Does not include 181,494 shares of unvested restricted common stock. |
| (4) | Does not include 14,234 shares of unvested restricted common stock. |
| (5) | Does not include 35,587 shares of unvested restricted common stock. |
| (6) | Does not include 44,484 shares of unvested restricted common stock. |
| (7) | Does not include 14,234 shares of unvested restricted common stock. |
| (8) | Does not include 12,455 shares of unvested restricted common stock. |
| (9) | Excludes shares held by Avista. Mr. Burgstahler is the President of the general partner of Avista Capital Partners GP, LLC and as a result may be deemed to beneficially own the shares owned by Avista. Mr. Burgstahler disclaims beneficial ownership of the shares held by Avista, except to the extent of his pecuniary interest therein. |
| (10) | Does not include 8,896 shares of unvested restricted common stock. |
| (11) | Does not include 4,270 shares of unvested restricted common stock. |
| (12) | Excludes shares held by Avista. Mr. Venkataraman is a Partner of the general partner of Avista Capital Partners GP, LLC and as a result may be deemed to beneficially own the shares owned by Avista. Mr. Venkataraman disclaims beneficial ownership of the shares held by Avista, except to the extent of his pecuniary interest therein. |
157
Table of Contents
The following is a description of the material terms of our amended and restated certificate of incorporation and amended and restated bylaws as they will be in effect at and after our corporate reorganization (including the related 0.355872-for-1 reverse stock split), which will occur after the effectiveness of the registration statement of which this prospectus forms a part and prior to the consummation of this offering. This summary does not purport to be complete and is qualified in its entirety by reference to the actual terms and provisions of our amended and restated certificate of incorporation and bylaws, copies of which will be filed as exhibits to the registration statement of which this prospectus is a part.
Authorized Capitalization
Immediately following our corporate reorganization, our authorized capital stock will consist of 250,000,000 shares of common stock, par value $0.01 per share, and 25,000,000 shares of preferred stock, par value $0.01 per share. Immediately following our corporate reorganization, 26,422,055 shares of common stock, or 27,606,265 shares if the underwriters exercise their option to purchase additional shares in full, will be outstanding, and there will be no outstanding shares of preferred stock.
Common Stock
The holders of our common stock are entitled to the following rights:
Voting Rights
Each share of common stock entitles the holder to one vote with respect to each matter presented to our stockholders on which the holders of common stock are entitled to vote; provided, however, that the Board of Directors may issue or grant shares of common stock that are subject to vesting or forfeiture and that restrict or eliminate voting rights with respect to such shares until any such vesting criteria is satisfied or such forfeiture provisions lapse. Our common stock votes as a single class on all matters relating to the election and removal of directors on our Board of Directors and as provided by law. Holders of our common stock will not have cumulative voting rights. Except as otherwise provided in our amended and restated certificate of incorporation or required by law, all matters to be voted on by our stockholders must be approved by a majority of the shares present in person or by proxy at the meeting and entitled to vote on the subject matter.
Dividend Rights
Holders of common stock will share equally on a per share basis in any dividend declared by our Board of Directors, subject to any preferential rights of the holders of any outstanding preferred stock.
Liquidation Rights
In the event of any voluntary or involuntary liquidation, dissolution or winding up of our affairs, holders of our common stock would be entitled to share ratably in our assets that are legally available for distribution to stockholders after payment of liabilities. If we have any preferred stock outstanding at that time, holders of the preferred stock may be entitled to distribution and/or liquidation preferences. In either case, we must pay the applicable distribution to the holders of our preferred stock before we may pay distributions to the holders of our common stock.
Other Rights
Our stockholders have no subscription privileges. Our common stock does not entitle its holders to preemptive rights for additional shares. All of the outstanding shares of our common stock are fully paid and nonassessable. The rights, preferences and privileges of the holders of our common stock are subject to the rights of the holders of shares of any series of preferred stock which we may issue.
158
Table of Contents
Registration Rights
Avista and certain of our existing stockholders have certain registration rights with respect to our common stock pursuant to a stockholders agreement. For further information regarding this agreement, see “Certain Relationships and Related Person Transactions—Shareholders Agreement,” and “Shares Eligible for Future Sale.”
Preferred Stock
Our Board of Directors is authorized to provide for the issuance of preferred stock in one or more series and to fix the preferences, powers and relative, participating, optional or other special rights, and qualifications, limitations or restrictions thereof, including the dividend rate, conversion rights, voting rights, redemption rights and liquidation preference and to fix the number of shares to be included in any such series without any further vote or action by our stockholders. Any preferred stock so issued may rank senior to our common stock with respect to the payment of dividends or amounts upon liquidation, dissolution or winding up, or both. In addition, any such shares of preferred stock may have class or series voting rights. The issuance of preferred stock may have the effect of delaying, deferring or preventing a change in control of our company without further action by the stockholders and may adversely affect the voting and other rights of the holders of our common stock.
Anti-Takeover Effects of our Amended and Restated Certificate of Incorporation and Bylaws
Upon the closing of this offering, our amended and restated certificate of incorporation and bylaws will contain provisions that may delay, defer or discourage another party from acquiring control of us. We expect that these provisions, which are summarized below, will discourage coercive takeover practices or inadequate takeover bids. These provisions are also designed to encourage persons seeking to acquire control of us to first negotiate with our Board of Directors, which we believe may result in an improvement of the terms of any such acquisition in favor of our stockholders. However, they also give our Board the power to discourage acquisitions that some stockholders may favor.
Board Composition and Filling Vacancies
We will have a classified Board of Directors upon the closing of this offering. See “Management—Board of Directors.” It will take at least two annual meetings of stockholders to elect a majority of the Board of Directors given our classified Board. As a result, it may discourage third-party proxy contests, tender offers or attempts to obtain control of us even if such changes would be beneficial to us and our stockholders. Our amended and restated certificate of incorporation will provide that directors may be removed only for cause by the affirmative vote of the holders of a majority of the voting power of the outstanding shares of common stock entitled to vote. Furthermore, any vacancy on our Board of Directors, however occurring, including a vacancy resulting from an increase in the size of our Board, may only be filled by the affirmative vote of a majority of our directors then in office even if less than a quorum.
No Stockholder Action by Written Consent
Our amended and restated certificate of incorporation will provide that, subject to the rights of any holders of preferred stock to act by written consent instead of a meeting, stockholder action may be taken only at an annual meeting or special meeting of stockholders and may not be taken by written consent instead of a meeting, unless affiliates of Avista beneficially own at least 50% of our outstanding common stock or the action to be taken by written consent of stockholders and the taking of this action by written consent has been unanimously approved in advance by our Board of Directors. Failure to satisfy any of the requirements for a stockholder meeting could delay, prevent or invalidate stockholder action.
159
Table of Contents
Meetings of Stockholders
Our amended and restated certificate of incorporation will provide that only a majority of the members of our Board of Directors then in office, the chairperson of the Board or the Chief Executive Officer may call special meetings of the stockholders. Our amended and restated bylaws will limit the business that may be conducted at an annual meeting of stockholders to those matters properly brought before the meeting.
Advance Notice Requirements
Our amended and restated bylaws will establish an advance notice procedure for stockholders to make nominations of candidates for election as directors or to bring other business before an annual meeting of our stockholders. The amended and restated bylaws will provide that any stockholder wishing to nominate persons for election as directors at, or bring other business before, an annual meeting must deliver to our secretary a written notice of the stockholder’s intention to do so. To be timely, the stockholder’s notice must be delivered to or mailed and received by us not later than the close of business on the 90th day nor earlier than the close of business on the 120th day prior to the anniversary date of the preceding annual meeting, except that if the annual meeting is not within 30 days before or 60 days after such anniversary date, we must receive the notice not earlier than the 120th day prior to such annual meeting and not later than the close of business on the 90th day prior to such annual meeting. If the first public announcement of the date of such annual meeting is made fewer than 100 days prior to the date of such annual meeting, then notice must be received by us no later than the tenth day following the day public announcement of the date of the meeting was first made. The notice must include the information specified in the amended and restated bylaws. These provisions may preclude stockholders from bringing matters before an annual or special meeting of stockholders or from making nominations for directors at an annual or special meeting of stockholders.
Amendment to Bylaws and Certificate of Incorporation
Any amendment to our amended and restated certificate of incorporation must first be approved by a majority of our Board of Directors and (i) thereafter be approved by a majority of the outstanding shares entitled to vote on the amendment, or (ii) if related to provisions regarding the classification of the Board of Directors, the removal of directors, director vacancies, forum selection for certain lawsuits or the amendment of certain provisions of our bylaws or certificate of incorporation, thereafter be approved by at least 66 2⁄3% of the outstanding shares entitled to vote on the amendment. For so long as Avista beneficially owns 5% or more of our issued and outstanding common stock entitled to vote generally in the election of directors, any amendment to provisions regarding Section 203 of the DGCL or corporate opportunities must also receive Avista’s prior written consent. Our bylaws may be amended (x) by the affirmative vote of a majority of the directors then in office, subject to any limitations set forth in the bylaws, without further stockholder action or (y) by the affirmative vote of at least 50.1% of the outstanding shares entitled to vote on the amendment, without further action by our Board of Directors.
Authorized but Unissued Shares
The authorized but unissued shares of our common stock and our preferred stock will be available for future issuance without any further vote or action by our stockholders. These additional shares may be utilized for a variety of corporate purposes, including future public offerings to raise additional capital, corporate acquisitions and employee benefit plans. The existence of authorized but unissued shares of our common stock and our preferred stock could render more difficult or discourage an attempt to obtain control over us by means of a proxy contest, tender offer, merger or otherwise.
Delaware Anti-Takeover Statute
Our amended and restated certificate of incorporation will contain a provision by which we expressly elect not to be governed by Section 203 of the DGCL, which is described below, until the moment in time, if ever,
160
Table of Contents
immediately following the time at which both of the following conditions exist: (i) Section 203 by its terms would, but for the terms of our amended and restated certificate of incorporation, apply to us and (ii) there occurs a transaction following the consummation of which Avista no longer owns at least 5% or more of our issued and outstanding common stock entitled to vote. Our certificate of incorporation will provide that, at such time, we will automatically become subject to Section 203 of the DGCL.
Section 203 of the DGCL provides that, subject to exceptions set forth therein, an interested stockholder of a Delaware corporation shall not engage in any business combination, including mergers or consolidations or acquisitions of additional shares of the corporation from the corporation, with the corporation for a three-year period following the time that such stockholder became an interested stockholder unless:
| • | prior to such time, the Board of Directors of the corporation approved either the business combination or the transaction which resulted in the stockholder becoming an interested stockholder; |
| • | upon consummation of the transaction which resulted in the stockholder becoming an “interested stockholder,” the interested stockholder owned at least 85% of the voting stock of the corporation outstanding at the time the transaction commenced, other than statutorily excluded shares; or |
| • | at or subsequent to such time, the business combination is approved by the Board of Directors of the corporation and authorized at an annual or special meeting of stockholders by the affirmative vote of at least 66 2/3% of the outstanding voting stock which is not owned by the interested stockholder. |
Except as otherwise set forth in Section 203, an interested stockholder is defined to include:
| • | any person that is the owner of 15% or more of the outstanding voting stock of the corporation, or is an affiliate or associate of the corporation and was the owner of 15% or more of the outstanding voting stock of the corporation at any time within three years immediately prior to the date of determination; and |
| • | the affiliates and associates of any such person. |
Our election to not initially be subject to Section 203 may have positive or negative consequences, depending on the circumstances. Being subject to Section 203 may make it more difficult for a person who would be an interested stockholder to effect various business combinations with us for a three-year period. Section 203 also may have the effect of preventing changes in our management. Section 203 also could make it more difficult to accomplish transactions which our stockholders may otherwise deem to be in their best interests. If the provisions of Section 203 were applicable, they may cause persons interested in acquiring us to negotiate in advance with our Board of Directors. In addition, because we did not elect to be initially subject to Section 203, Avista, as a controlling stockholder, may find it easier to sell its controlling interest to a third party because Section 203 would not apply to such third party. The restrictions on business combinations set forth in Section 203 would not, in any event, have been applicable to Avista.
Corporate Opportunities
Our amended and restated certificate of incorporation will provide that Avista and its affiliates have no obligation to offer us an opportunity to participate in business opportunities presented to Avista or its affiliates even if the opportunity is one that we might reasonably have pursued (and therefore may be free to compete with us in the same business or similar businesses), and that neither Avista nor its affiliates will be liable to us or our stockholders for breach of any duty by reason of any of those activities unless, in the case of any person who is a director or officer of our company, such business opportunity is expressly offered to such director or officer in writing solely in his or her capacity as an officer or director of our company.
Forum
Unless we consent in writing in advance to the selection of an alternative forum, the Delaware Court of Chancery shall, to the fullest extent permitted by law, be the sole and exclusive forum for (A) any derivative
161
Table of Contents
action or proceeding brought on our behalf, (B) any action asserting a claim of breach of a fiduciary duty owed by, or any wrongdoing by, any of our directors, officers or employees to our stockholders, (C) any action asserting a claim arising pursuant to any provision of the DGCL, our amended and restated certificate of incorporation (including as it may be amended from time to time), or our amended and restated bylaws, (D) any action to interpret, apply, enforce or determine the validity of our amended and restated certificate of incorporation or our amended and restated bylaws, or (E) any action asserting a claim governed by the internal affairs doctrine.
Listing
We have applied to list our common stock on NASDAQ under the symbol “LNTH.”
Transfer Agent and Registrar
The transfer agent and registrar for our common stock is Computershare Trust Company, N.A.
162
Table of Contents
DESCRIPTION OF MATERIAL INDEBTEDNESS
Revolving Credit Facility
LMI is a party to an amended and restated asset-based revolving credit facility which was entered into on July 3, 2013 with Wells Fargo Bank, National Association, as administrative agent and collateral agent, or, in such capacity, the ABL Agent, each of the lenders party thereto, or, in such capacity, the Lenders, and Lantheus Intermediate and Lantheus Real Estate, each as guarantors in respect thereto. On June 24, 2014, we entered into an amendment of our revolving credit facility, which, among other things, increased the revolving credit commitments under our revolving credit facility to $50.0 million. Concurrently with this offering, we intend to further amend and restate our revolving credit facility in contemplation of our new term facility.
Under the terms of our revolving credit facility, as amended, the Lenders may extend credit to LMI consisting of a revolving credit facility in an aggregate principal amount not to exceed $50.0 million at any time outstanding. Upon consummation of the corporate reorganization, we will become a guarantor of the revolving credit facility. Our revolving credit facility includes a sub-facility for the issuance of letters of credit, or Letters of Credit. LMI has a right to request an increase of the revolving credit facility in an aggregate amount of up to $25 million.
The Letters of Credit and the borrowings under our revolving credit facility are expected to be used for working capital and for other general corporate purposes. Our revolving credit facility matures on the earlier of (i) July 3, 2018 or (ii) if the outstanding Notes are not refinanced in full, the date that is 91 days before the maturity thereof, at which time all outstanding borrowings are due and payable. Concurrently with this offering, we intend to amend and restate our revolving credit facility to mature on the date that is five years from this offering.
In connection with our revolving credit facility, LMI and the guarantors under our revolving credit facility, Lantheus Intermediate (or, upon consummation of the corporate reorganization, us) and Lantheus Real Estate have entered into several other agreements including, but not limited to, an amended and restated pledge and security agreement and a mortgage.
Interest Rates and Fees
Subsequent to the amendment, the revolving loans under our revolving credit facility bear interest, with pricing based from time to time at our election at (i) LIBOR plus a spread of 2.00% or (ii) the Reference Rate (as defined in our revolving credit facility) plus a spread of 1.00%. Our revolving credit facility also includes an unused line fee, which, subsequent to the amendment, is set at 0.375%.
Optional Prepayments
LMI is permitted to voluntarily prepay our revolving credit facility, in whole or in part, without premium or penalty.
Mandatory Prepayments
On any business day on which the total amount of outstanding revolving loans and Letters of Credit exceeds the lesser of the total revolving credit commitment and the borrowing base, LMI must prepay the revolving loans and/or reduce the Letter of Credit obligations in an amount equal to such excess.
Guarantee and Security
Our revolving credit facility is guaranteed by Lantheus Intermediate (or, upon consummation of the corporate reorganization, us) and Lantheus Real Estate, and obligations under our revolving credit facility are
163
Table of Contents
secured by all the property and assets and all interests of the loan parties, then owned or thereafter acquired, as provided for under the amended and restated pledge and security agreement and the mortgage entered into in connection with our revolving credit facility and subject to express limitations contained therein. Following our corporate reorganization, we will become a guarantor and loan party under LMI’s revolving credit facility. Following the entry into the new term facility described below, we expect our revolving credit facility will have a first priority lien on the ABL Priority Collateral and will have a lien junior to our new term facility on the rest of the Collateral.
Covenants
Our revolving credit facility contains a number of affirmative, negative, reporting and financial covenants, in each case subject to certain exceptions and materiality thresholds. The affirmative covenants include, among other things, and subject to certain exceptions, requirements with respect to compliance with law and payment of taxes; inspection rights; maintenance of insurance; obtaining permits and providing additional guarantees and security and after acquired property; preservation of existence, keeping records and maintaining property. The negative covenants restrict or limit, among other things, and subject to certain exceptions, grants of liens; incurrence of additional debt; changes in the nature of the business; transactions with affiliates; dissolutions or mergers with others; assets sales; certain investments and restricted payments; payment of dividends and other distributions to equity holders; prepayments of certain debt; and grants of negative pledges. The reporting covenants include, among other things, requirements to provide the Lenders with notice of defaults and events of default; delivery of annual and quarterly financial statements; provision of the calculations necessary to demonstrate compliance with the financial covenant; delivery of budgets; providing information with respect to material litigation, breaches of material contracts, a termination event under employee plans, if any, and delivering a borrowing base certificate. During a covenant trigger period, our revolving credit facility requires us to comply with a financial covenant in the form of a consolidated fixed charge coverage ratio of not less than 1:00:1:00.
Events of Default
Our revolving credit facility contains events of default, including, among other things, in each case subject to certain exceptions and materiality thresholds, failure to pay principal, interest and other payments when due; any representation or warranty incorrect in any material respect when made; default in the observance or performance of any other covenant or agreement or security document related to our revolving credit facility beyond the applicable grace period; default in payment of an aggregate amount in excess of an amount to be agreed of principal or interest on any debt other than under our revolving credit facility; commencement by or against Lantheus Intermediate or any of its direct or indirect subsidiaries seeking to adjudicate it bankrupt or insolvent, or seeking dissolution, liquidation, winding up, reorganization, relief of it or its debt under any law relating to bankruptcy, insolvency or reorganization or relief of debtors, that remains undismissed, or unstayed for a period of 60 days; final payment judgments rendered against us or any of our direct or indirect subsidiaries in excess of an amount to be agreed in aggregate principal amount and either (i) an enforcement proceeding shall have been commenced with respect thereto, (ii) there shall be a period of 45 consecutive days after entry thereof during which a stay of enforcement of such judgment shall not be in effect, or (iii) at any time during a stay of enforcement of such judgment, such judgment is not bonded in the full amount, unless the amount of such judgment is covered by a valid insurance and the claim thereunder has not been disputed; certain events leading to an Employee Retirement Income Security Act, or ERISA, withdrawal liability or termination event which would result in a material adverse effect; and a change of control as defined under the agreement governing our revolving credit facility.
Upon an event of default, the ABL Agent has the right to declare the loans and other obligations outstanding immediately due and payable and all commitments immediately terminated or reduced, and the ABL Agent may, after such events of default, require LMI to make deposits with respect to any outstanding Letters of Credit in an amount equal to 105% of the greatest amount for which such Letter of Credit may be drawn.
164
Table of Contents
New Term Facility
Substantially concurrently with the consummation of this offering, LMI expects to enter into a new $365 million seven-year term facility. The following is a summary of the material terms currently expected to be included in the new term facility and is subject to change.
LMI has a right to request an increase of the term facility in an aggregate amount subject to certain leverage ratios, and an additional amount of up to $37.5 million.
The net proceeds of the new term facility, together with the net proceeds of this offering, will be used to refinance in full the aggregate principal amount of the notes and amounts outstanding under our revolving credit facility and pay related premiums, interest and expenses.
In connection with our term facility, LMI and the guarantors under our term facility, us (upon consummation of the corporate reorganization) and Lantheus Real Estate are expected to enter into several other agreements including, but not limited to, a pledge and security agreement and a mortgage.
Interest Rates and Fees
The term loans under our term facility will bear interest, with pricing based from time to time at our election at (i) LIBOR plus a spread of a rate to be agreed or (ii) the Base Rate (to be defined in our term facility) plus a spread of a rate to be agreed.
Optional Prepayments
LMI is expected to be permitted to voluntarily prepay our term facility, in whole or in part, with a premium applicable for the first 6 months of the term facility in connection with a repricing transaction (as defined therein).
Mandatory Prepayments
Our term facility will require us to prepay outstanding term loans, subject to certain exceptions, with
| • | 100% of the net cash proceeds of all non-ordinary course sales or other dispositions of assets (including as a result of casualty or condemnation, subject to certain exceptions); we may reinvest or commit to reinvest certain of those proceeds in assets useful in our business within 12 months (or in the case of commitments to reinvest within such 12-month period, so long as such reinvestment is completed within an additional 6 months) in lieu of making such prepayment; |
| • | 100% of the net cash proceeds from issuances or incurrence of debt, other than proceeds from debt permitted under the new senior secured credit facilities; and |
| • | 50% (with two leverage-based stepdowns) of our excess cash flow. |
The foregoing mandatory prepayments will be applied to the scheduled installments of principal of the term facility in direct order of maturity.
Guarantee and Security
Our term facility will be guaranteed by us (upon consummation of the corporate reorganization) and Lantheus Real Estate, and obligations under our term facility are secured by all the property and assets and all interests of the loan parties, then owned or thereafter acquired, as provided for under the pledge and security
165
Table of Contents
agreement and the mortgage entered into in connection with our term facility and subject to express limitations contained therein. Our new term facility will have a lien junior to our revolving credit facility on the ABL Priority Collateral and will have a first priority lien on the rest of the Collateral.
Covenants
Our term facility is expected to contain a number of covenants customary for facilities of this type.
Events of Default
Our term facility is expected to contain events of default, including, among other things, in each case subject to certain exceptions and materiality thresholds, failure to pay principal, interest and other payments when due; any representation or warranty incorrect in any material respect when made; default in the observance or performance of any other covenant or agreement or security document related to our term facility beyond the applicable grace period; default in payment of an aggregate amount in excess of an amount to be agreed of principal or interest on any debt other than under our term facility (but with cross acceleration to our revolving facility); commencement by or against Lantheus Intermediate or any of its direct or indirect subsidiaries seeking to adjudicate it bankrupt or insolvent, or seeking dissolution, liquidation, winding up, reorganization, relief of it or its debt under any law relating to bankruptcy, insolvency or reorganization or relief of debtors, that remains undismissed, or unstayed for a period of 60 days; final payment judgments rendered against us or any of our direct or indirect subsidiaries in excess of an amount to be agreed in aggregate principal amount and either (i) an enforcement proceeding shall have been commenced with respect thereto, (ii) there shall be a period of 45 consecutive days after entry thereof during which a stay of enforcement of such judgment shall not be in effect, or (iii) at any time during a stay of enforcement of such judgment, such judgment is not bonded in the full amount, unless the amount of such judgment is covered by a valid insurance and the claim thereunder has not been disputed; certain events leading to an Employee Retirement Income Security Act, or ERISA, withdrawal liability or termination event which would result in a material adverse effect; and a change of control as defined under the agreement governing our revolving credit facility.
Upon an event of default, the Term Loan Agent will have the right to declare the loans and other obligations outstanding immediately due and payable and all commitments immediately terminated or reduced.
166
Table of Contents
SHARES ELIGIBLE FOR FUTURE SALE
Prior to this offering, there was no public market for our common stock.
Sale of Restricted Securities
After this offering, there will be outstanding 26,422,055 shares (assuming no exercise of the underwriters’ option to purchase additional shares), or 27,606,265 shares (assuming full exercise of the underwriters’ option to purchase additional shares), of our common stock. Of these shares, all of the shares of our common stock sold in this offering will be freely tradable without restriction under the Securities Act, unless purchased by our “affiliates” as that term is defined in Rule 144 under the Securities Act. The remaining shares of common stock that will be outstanding after this offering are “restricted securities” within the meaning of Rule 144 under the Securities Act. Restricted securities may be sold in the public market only if they are registered under the Securities Act or are sold pursuant to an exemption from registration under Rule 144 under the Securities Act, which is summarized below. Subject to the lock-up agreements described below, shares held by our affiliates that are not “restricted securities” as defined in Rule 144 under the Securities Act may be sold subject to compliance with Rule 144 of the Securities Act without regard to the prescribed six month holding period under Rule 144. All shares of our common stock held by our existing shareholders will be “restricted securities.”
Lock-Up Arrangements
In connection with this offering, we, each of our directors, executive officers, and stockholders, representing all shares of our common stock, will enter into lock-up agreements as described under “Underwriting (Conflicts of Interest)” that restrict the sale of shares of our common stock for up to 180 days after the date of this prospectus, subject to an extension in certain circumstances.
In addition, following the expiration of the lock-up period, Avista will have the right, subject to certain conditions, to require us to register the sale of their remaining shares of our common stock under federal securities laws. If Avista exercises this right, certain of our other existing stockholders may require us to register their registrable securities. By exercising their registration rights, and selling a large number of shares, these stockholders could cause the prevailing market price of our common stock to decline.
Following the lock-up periods set forth above, all of the shares of our common stock that are restricted securities or are held by our affiliates as of the date of this prospectus will be eligible for sale in the public market in compliance with Rule 144 under the Securities Act.
Notwithstanding the foregoing, the Shareholders Agreements contain restrictions on the ability of the Management Shareholders and employee shareholders to transfer shares of Holdings that they own, including provisions that only allow Management Shareholders and employee shareholders to transfer shares of Holdings for one year following the consummation of this offering of Holdings in proportion with any transfers by Avista.
Rule 701
In general and subject to certain vesting restrictions and the expiration of the applicable lock-up restrictions, under Rule 701 promulgated under the Securities Act, any of our employees, directors or officers who purchased shares from us in connection with a qualified compensatory stock or option plan or other written agreement before the effective date of this offering, or who purchased shares from us after such date upon the exercise of options granted before such date, are eligible to resell such shares in reliance upon Rule 144 subject to the availability of current public information about us. If such person is not an affiliate, the sale may be made under Rule 144 without compliance with the holding periods of Rule 144 and subject only to the manner-of-sale restrictions of Rule 144. If such a person is an affiliate, the sale may be made under Rule 144 without compliance with the applicable holding period, but subject to the other Rule 144 restrictions. See “—Rule 144.”
167
Table of Contents
Rule 144
The shares of our common stock sold in this offering will generally be freely transferable without restriction or further registration under the Securities Act, except that any shares of our common stock held by an “affiliate” of ours may not be resold publicly except in compliance with the registration requirements of the Securities Act or under an exemption under Rule 144 under the Securities Act or otherwise. Rule 144 under the Securities Act permits our common stock that has been acquired by a person who is an affiliate of ours, or has been an affiliate of ours within the past three months, to be sold into the market in an amount that does not exceed, during any three-month period, the greater of:
| • | one percent of the total number of shares of our common stock outstanding; or |
| • | the average weekly reported trading volume of our common stock for the four calendar weeks prior to the sale. |
Those sales are also subject to specific manner of sale provisions, a six-month holding period requirement, notice requirements and the availability of current public information about us.
All shares of our common stock that are not subject to the lock-up arrangements described above will be eligible for sale pursuant to Rule 144 under the Securities Act immediately upon closing this offering.
Rule 144 under the Securities Act also provides that a person who is not deemed to have been an affiliate of ours at any time during the three months preceding a sale, and who has for at least six months beneficially owned shares of our common stock that are restricted securities, will be entitled to freely sell those shares of our common stock subject only to the availability of current public information regarding us. A person who is not deemed to have been an affiliate of ours at any time during the three months preceding a sale, and who has beneficially owned for at least one year shares of our common stock that are restricted securities, will be entitled to freely sell those shares of our common stock under Rule 144 under the Securities Act without regard to the current public information requirements of Rule 144 under the Securities Act.
Registration Rights
Upon the consummation of this offering, the holders of an aggregate of 18,197,751 shares of our common stock will be entitled to rights with respect to the registration of these shares under the Securities Act. Registration of these shares under the Securities Act would result in these shares becoming freely tradable without restriction under the Securities Act immediately upon the effectiveness of registration, except for shares purchased by affiliates. However, these registration rights will be limited by our Shareholders Agreements, which limit piggyback registration rights to holders of 1% or more of our common stock and limit demand registration rights to Avista. For more information, see “Certain Relationships and Related Person Transactions—Shareholders Agreements.”
168
Table of Contents
MATERIAL U.S. FEDERAL INCOME TAX CONSIDERATIONS TO NON-U.S. HOLDERS
The following discussion summarizes the material U.S. federal income and estate tax consequences to non-U.S. holders (as defined below) of ownership and disposition of our common stock. This summary does not provide a complete analysis of all potential U.S. federal income tax and estate tax considerations relating thereto. The information provided below is based on the Internal Revenue Code of 1986, as amended, or the Code, and administrative pronouncements, judicial decisions and final, temporary and proposed Treasury regulations as of the date hereof, changes to any of which subsequent to the date of this prospectus may affect the tax consequences described herein. In addition, this summary does not address the Medicare tax on certain investment income or any state, local or foreign taxes or any U.S. federal tax laws other than U.S. federal income tax laws and estate tax laws. Persons considering the purchase, ownership, or disposition of our common stock should consult their tax advisors concerning U.S. federal, state, local, foreign or other tax consequences in light of their particular situations.
As used in this section, a “non-U.S. holder” is a beneficial owner of our common stock that is not, for U.S. federal income tax purposes:
| • | any individual who is a citizen or resident of the United States, |
| • | a corporation (or other entity taxable as a corporation) created or organized in or under the laws of the United States, any state thereof or the District of Columbia, |
| • | any estate the income of which is subject to U.S. federal income taxation regardless of its source, or |
| • | any trust if (i) a court within the United States is able to exercise primary supervision over the administration of the trust and one or more U.S. persons have the authority to control all substantial decisions of the trust or (ii) it has a valid election in effect under applicable U.S. Treasury regulations to be treated as a U.S. person. |
If you are an individual, you may, in many cases, be deemed to be a resident alien, as opposed to a nonresident alien, by virtue of being present in the United States for at least 31 days in the calendar year and for an aggregate of at least 183 days during a three-year period ending in the current calendar year. For these purposes, all the days present in the current year, one-third of the days present in the immediately preceding year, and one-sixth of the days present in the second preceding year are counted. Resident aliens are subject to U.S. federal income tax as if they were U.S. citizens. Such an individual is urged to consult his or her own tax advisor regarding the U.S. federal income tax consequences of the ownership or disposition of our common stock. If a partnership or other pass-through entity is a beneficial owner of our common stock, the tax treatment of a partner in the partnership or an owner of the entity will depend upon the status of the partner or other owner and the activities of the partnership or other entity. Any partner in a partnership or owner of a pass-through entity holding shares of our common stock should consult its own tax advisor.
This discussion assumes that a non-U.S. holder will hold our common stock as a capital asset (generally, property held for investment). The summary generally does not address tax considerations that may be relevant to particular investors because of their specific circumstances, or because they are subject to special rules, including, without limitation if the investor is a “controlled foreign corporation,” “passive foreign investment company” or former citizen or long-term resident of the United States. If you fall within any of the foregoing categories, this description does not apply to you, and you should consult with your own tax advisor about the tax consequences of acquiring, owning, and disposing of our common stock.
INVESTORS CONSIDERING THE PURCHASE OF OUR COMMON STOCK SHOULD CONSULT THEIR OWN TAX ADVISORS REGARDING THE APPLICATION OF THE U.S. FEDERAL INCOME AND ESTATE TAX LAWS TO THEIR PARTICULAR SITUATIONS AND THE CONSEQUENCES OF FOREIGN, STATE OR LOCAL LAWS AND TAX TREATIES.
169
Table of Contents
Distributions on Common Stock
We do not expect to declare or pay any dividends on our common stock in the foreseeable future. If we do pay dividends on shares of our common stock, however, such distributions will constitute dividends for U.S. federal income tax purposes to the extent paid from our current or accumulated earnings and profits, as determined under U.S. federal income tax principles. Distributions in excess of our current and accumulated earnings and profits will constitute a return of capital that is applied against and reduces, but not below zero, a non-U.S. holder’s adjusted tax basis in shares of our common stock. Any remaining excess will be treated as gain realized on the sale or other disposition of our common stock. See “—Dispositions of Common Stock.”
Any dividend paid to a non-U.S. holder on our common stock will generally be subject to U.S. federal withholding tax at a 30% rate. The withholding tax might not apply, however, or might apply at a reduced rate, under the terms of an applicable income tax treaty between the United States and the non-U.S. holder’s country of residence. You should consult your tax advisors regarding your entitlement to benefits under a relevant income tax treaty. Generally, in order for us or our paying agent to withhold tax at a lower treaty rate, a non-U.S. holder must certify its entitlement to treaty benefits. A non-U.S. holder generally can meet this certification requirement by providing an Internal Revenue Service, or IRS, Form W-8BEN or W-8BEN-E, as applicable (or any successor form) or appropriate substitute form to us or our paying agent. If the non-U.S. holder holds the stock through a financial institution or other agent acting on the holder’s behalf, the holder will be required to provide appropriate documentation to the agent. The holder’s agent will then be required to provide certification to us or our paying agent, either directly or through other intermediaries
Dividends received by a non-U.S. holder that are effectively connected with a U.S. trade or business conducted by the non-U.S. holder, and if required by an applicable income tax treaty between the United States and the non-U.S. holder’s country of residence, are attributable to a permanent establishment (or, in certain cases involving individual holders, a fixed base) maintained by the non-U.S. holder in the United States, are not subject to such withholding tax. To obtain this exemption, a non-U.S. holder must provide us with an IRS Form W-8ECI properly certifying such exemption. Such effectively connected dividends, although not subject to withholding tax, are taxed at the same graduated rates applicable to U.S. persons, net of certain deductions and credits. In addition to the graduated tax described above, such effectively connected dividends received by corporate non-U.S. holders may also be subject to a branch profits tax at a rate of 30% or such lower rate as may be specified by an applicable tax treaty.
Dispositions of Common Stock
Subject to the discussion below on backup withholding and other withholding requirements, gain realized by a non-U.S. holder on a sale, exchange or other disposition of our common stock generally will not be subject to U.S. federal income or withholding tax, unless:
| • | the gain (1) is effectively connected with the conduct by the non-U.S. holder of a U.S. trade or business and (2) if required by an applicable income tax treaty between the United States and the non-U.S. holder’s country of residence, is attributable to a permanent establishment (or, in certain cases involving individual holders, a fixed base) maintained by the non-U.S. holder in the United States (in which case the special rules described below apply), |
| • | the non-U.S. holder is an individual who is present in the United States for 183 or more days in the taxable year of such disposition and certain other conditions are met (in which case the gain would be subject to a flat 30% tax, or such reduced rate as may be specified by an applicable income tax treaty, which may be offset by U.S. source capital losses), or |
| • | we are, or have been, a U.S. real property holding corporation, or a USRPHC, for U.S. federal income tax purposes at any time during the shorter of the five-year period ending on the date of disposition of our common stock and the non-U.S. holder’s holding period for our common stock. |
170
Table of Contents
Generally, a corporation is a USRPHC if the fair market value of its “United States real property interests” equals 50% or more of the sum of the fair market value of (a) its worldwide real property interests and (b) its other assets used or held for use in a trade or business. The tax relating to stock in a USRPHC does not apply to a non-U.S. holder whose holdings, actual and constructive, amount to 5% or less of our common stock at all times during the applicable period, provided that our common stock is regularly traded on an established securities market. We believe we have not been and are not currently a USRPHC, and do not anticipate being a USRPHC in the future.
If any gain from the sale, exchange or other disposition of our common stock, (1) is effectively connected with a U.S. trade or business conducted by a non-U.S. holder and (2) if required by an applicable income tax treaty between the United States and the non-U.S. holder’s country of residence, is attributable to a permanent establishment (or, in certain cases involving individuals, a fixed base) maintained by such non-U.S. holder in the United States, then the gain generally will be subject to U.S. federal income tax at the same graduated rates applicable to U.S. persons, net of certain deductions and credits. If the non-U.S. holder is a corporation, it also may be subject to the branch profits tax at a 30% rate, or such lower rate as may be specified by an applicable income tax treaty.
U.S. Federal Estate Tax
The estates of nonresident alien individuals generally are subject to U.S. federal estate tax on property with a U.S. situs. Because we are a U.S. corporation, our common stock will be U.S. situs property and therefore will be included in the taxable estate of a nonresident alien decedent, unless an applicable estate tax treaty between the United States and the decedent’s country of residence provides otherwise.
Backup Withholding and Information Reporting
Any dividends that are paid to a non-U.S. holder must be reported annually to the IRS and to the non-U.S. holder. Copies of these information returns also may be made available to the tax authorities of the country in which the non-U.S. holder resides under the provisions of various treaties or agreements for the exchange of information. Unless the non-U.S. holder is an exempt recipient, dividends paid on our common stock and the gross proceeds from a taxable disposition of our common stock may be subject to additional information reporting and may also be subject to U.S. federal backup withholding (at a rate of 28%) if such non-U.S. holder fails to comply with applicable U.S. information reporting and certification requirements. Provision of any IRS Form W-8 appropriate to the non-U.S. holder’s circumstances will satisfy the certification requirements necessary to avoid the backup withholding tax.
Backup withholding is not an additional tax. Any amounts so withheld under the backup withholding rules will be refunded by the IRS or credited against the non-U.S. holder’s U.S. federal income tax liability, provided that the required information is timely furnished to the IRS.
Other Withholding Requirements
Non-U.S. holders of our common stock may be subject to U.S. withholding tax at a rate of 30% under sections 1471 through 1474 of the Code (commonly referred to as FATCA). This withholding tax may apply if a non-U.S. holder (or any foreign intermediary that receives a payment on a non-U.S. holder’s behalf) does not comply with certain U.S. information reporting requirements and does not otherwise qualify for an exemption from these rules. The payments potentially subject to this withholding tax include dividends on, and gross proceeds from the sale or other disposition of, our common stock. If FATCA is not complied with, the withholding tax described above will apply to dividends and, beginning in 2017, to gross proceeds from the sale or other disposition of our common stock. Certain non-U.S. holders located in jurisdictions that have an intergovernmental agreement with the United States governing FATCA may be subject to different rules. Non-U.S. holders should consult their tax advisors regarding the possible implications of FATCA for their investment in our common stock.
171
Table of Contents
THE PRECEDING DISCUSSION OF U.S. FEDERAL TAX CONSIDERATIONS IS FOR GENERAL INFORMATION ONLY. IT IS NOT TAX ADVICE. EACH PROSPECTIVE INVESTOR SHOULD CONSULT ITS OWN TAX ADVISOR REGARDING THE PARTICULAR U.S. FEDERAL, STATE, LOCAL AND FOREIGN TAX CONSEQUENCES OF PURCHASING, HOLDING AND DISPOSING OF OUR COMMON STOCK, INCLUDING THE CONSEQUENCES OF ANY PROPOSED CHANGE IN APPLICABLE LAWS.
172
Table of Contents
UNDERWRITING (CONFLICTS OF INTEREST)
Credit Suisse Securities (USA) LLC and Jefferies LLC are acting as joint book-running managers of the offering and as representatives of the underwriters named below. Subject to the terms and conditions stated in the underwriting agreement dated the date of this prospectus, each underwriter named below has severally agreed to purchase, and we have agreed to sell to that underwriter, the number of shares set forth opposite the underwriter’s name.
| Underwriter |
Number of Shares |
|||
| Credit Suisse Securities (USA) LLC |
||||
| Jefferies LLC |
||||
| RBC Capital Markets, LLC |
||||
| Wells Fargo Securities, LLC |
||||
| Robert W. Baird & Co. Incorporated |
||||
|
|
|
|||
| Total |
7,894,736 | |||
|
|
|
|||
The underwriting agreement provides that the obligations of the underwriters to purchase the shares included in this offering are subject to approval of legal matters by counsel and to other conditions. The underwriters are obligated to purchase all the shares (other than those covered by the underwriters’ option to purchase additional shares) if they purchase any of the shares.
Shares sold by the underwriters to the public will initially be offered at the initial public offering price set forth on the cover of this prospectus. Any shares sold by the underwriters to securities dealers may be sold at a discount from the initial public offering price not to exceed $ per share. If all the shares are not sold at the initial offering price, the underwriters may change the offering price and the other selling terms. The representatives have advised us that the underwriters do not intend to make sales to discretionary accounts.
If the underwriters sell more shares than the total number set forth in the table above, we have granted to the underwriters an option, exercisable for 30 days from the date of this prospectus, to purchase up to 1,184,210 additional shares at the public offering price less the underwriting discount. The underwriters may exercise the option solely for the purpose of covering over-allotments, if any, in connection with this offering. To the extent the option is exercised, each underwriter must purchase a number of additional shares approximately proportionate to that underwriter’s initial purchase commitment. Any shares issued or sold under the option will be issued and sold on the same terms and conditions as the other shares that are the subject of this offering.
We, our officers and directors, certain of our employees and our other principal stockholders have agreed that, for a period of 180 days from the date of this prospectus, we and they will not, without the prior written consent of Credit Suisse Securities (USA) LLC and Jefferies LLC, dispose of or hedge any shares or any securities convertible into or exchangeable for our common stock subject to certain exceptions. Credit Suisse Securities (USA) LLC and Jefferies LLC in their sole discretion may release any of the securities subject to these lock-up agreements at any time, which, in the case of officers and directors, shall be with notice.
Prior to this offering, there has been no public market for our shares. Consequently, the initial public offering price for the shares was determined by negotiations among us and the representatives. Among the factors considered in determining the initial public offering price were our results of operations, our current financial condition, our future prospects, our markets, the economic conditions in and future prospects for the industry in which we compete, our management, and currently prevailing general conditions in the equity securities markets, including current market valuations of publicly traded companies considered comparable to our company. We cannot assure you, however, that the price at which the shares will sell in the public market after this offering will not be lower than the initial public offering price or that an active trading market in our shares will develop and continue after this offering.
173
Table of Contents
We intend to list our common stock on NASDAQ under the symbol “LNTH.”
The following table shows the underwriting discounts and commissions that we are to pay to the underwriters in connection with this offering. These amounts are shown assuming both no exercise and full exercise of the underwriters’ option to purchase additional shares.
| No Exercise | Full Exercise | |||||||
| Per share |
$ | $ | ||||||
We estimate that our portion of the total expenses of this offering, exclusive of underwriting discounts and commissions, will be approximately $4.1 million. We have agreed to reimburse the underwriters for certain of their expenses, in an amount up to $27,500, as set forth in the underwriting agreement.
In connection with the offering, the underwriters may purchase and sell shares in the open market. Purchases and sales in the open market may include short sales, purchases to cover short positions, which may include purchases pursuant to the underwriters’ option to purchase additional shares, and stabilizing purchases.
| • | Short sales involve secondary market sales by the underwriters of a greater number of shares than they are required to purchase in the offering. |
| • | “Covered” short sales are sales of shares in an amount up to the number of shares represented by the underwriters’ option to purchase additional shares. |
| • | “Naked” short sales are sales of shares in an amount in excess of the number of shares represented by the underwriters’ option to purchase additional shares. |
| • | Covering transactions involve purchases of shares either pursuant to the underwriters’ option to purchase additional shares or in the open market after the distribution has been completed in order to cover short positions. |
| • | To close a naked short position, the underwriters must purchase shares in the open market after the distribution has been completed. A naked short position is more likely to be created if the underwriters are concerned that there may be downward pressure on the price of the shares in the open market after pricing that could adversely affect investors who purchase in the offering. |
| • | To close a covered short position, the underwriters must purchase shares in the open market after the distribution has been completed or must exercise the underwriters’ option to purchase additional shares. In determining the source of shares to close the covered short position, the underwriters will consider, among other things, the price of shares available for purchase in the open market as compared to the price at which they may purchase shares through the underwriters’ option to purchase additional shares. |
| • | Stabilizing transactions involve bids to purchase shares so long as the stabilizing bids do not exceed a specified maximum. |
Purchases to cover short positions and stabilizing purchases, as well as other purchases by the underwriters for their own accounts, may have the effect of preventing or retarding a decline in the market price of the shares. They may also cause the price of the shares to be higher than the price that would otherwise exist in the open market in the absence of these transactions. The underwriters may conduct these transactions on NASDAQ, in the over-the-counter market or otherwise. If the underwriters commence any of these transactions, they may discontinue them at any time.
The underwriters are full service financial institutions engaged in various activities, which may include securities trading, commercial and investment banking, financial advisory, investment management, principal investment, hedging, financing and brokerage activities. The underwriters and their respective affiliates have in the past performed commercial banking, investment banking and advisory services for us from time to time for
174
Table of Contents
which they have received customary fees and reimbursement of expenses and may, from time to time, engage in transactions with and perform services for us in the ordinary course of their business for which they may receive customary fees and reimbursement of expenses. In the ordinary course of their various business activities, the underwriters and their respective affiliates may make or hold a broad array of investments and actively trade debt and equity securities (or related derivative securities) and financial instruments (which may include bank loans and/or credit default swaps) for their own account and for the accounts of their customers and may at any time hold long and short positions in those securities and instruments. Those investment and securities activities may involve our securities and instruments. In addition, affiliates of the underwriters are lenders under our revolving credit facility and affiliates of the underwriters are expected to be lenders under LMI’s new term facility.
We have agreed to indemnify the underwriters against certain liabilities, including liabilities under the Securities Act, or to contribute to payments the underwriters may be required to make because of any of those liabilities.
Conflicts of Interest
The net proceeds from this offering will be used to repay borrowings under our revolving credit facility. Because an affiliate of Wells Fargo Securities, LLC is a lender under our revolving credit facility and will receive 5% or more of the net proceeds of this offering, Wells Fargo Securities, LLC is deemed to have a “conflict of interest” under FINRA Rule 5121. As a result, this offering will be conducted in accordance with FINRA Rule 5121. Pursuant to that rule, the appointment of a “qualified independent underwriter” is not required in connection with this offering as the members primarily responsible for managing the public offering do not have a conflict of interest, are not affiliates of any member that has a conflict of interest and meet the requirements of paragraph (f)(12)(E) of FINRA Rule 5121. See “Prospectus Summary—The Offering” and “Use of Proceeds.” Wells Fargo Securities, LLC will not confirm any sales to any account over which it exercises discretionary authority without the specific written approval of the account holder.
Notice to Prospective Investors in the European Economic Area
In relation to each member state of the European Economic Area that has implemented the Prospectus Directive (each, a relevant member state), with effect from and including the date on which the Prospectus Directive is implemented in that relevant member state (the relevant implementation date), an offer of shares described in this prospectus may not be made to the public in that relevant member state other than:
| • | to any legal entity which is a qualified investor as defined in the Prospectus Directive; |
| • | to fewer than 100 or, if the relevant member state has implemented the relevant provision of the 2010 PD Amending Directive, 150 natural or legal persons (other than qualified investors as defined in the Prospectus Directive), as permitted under the Prospectus Directive, subject to obtaining the prior consent of the relevant Dealer or Dealers nominated by us for any such offer; or |
| • | in any other circumstances falling within Article 3(2) of the Prospectus Directive, |
provided that no such offer of shares shall require us or any underwriter to publish a prospectus pursuant to Article 3 of the Prospectus Directive.
For purposes of this provision, the expression an “offer of securities to the public” in any relevant member state means the communication in any form and by any means of sufficient information on the terms of the offer and the shares to be offered so as to enable an investor to decide to purchase or subscribe for the shares, as the expression may be varied in that member state by any measure implementing the Prospectus Directive in that member state, and the expression “Prospectus Directive” means Directive 2003/71/EC (and amendments thereto, including the 2010 PD Amending Directive, to the extent implemented in the relevant member state) and includes any relevant implementing measure in the relevant member state. The expression 2010 PD Amending Directive means Directive 2010/73/EU.
175
Table of Contents
The sellers of the shares have not authorized and do not authorize the making of any offer of shares through any financial intermediary on their behalf, other than offers made by the underwriters with a view to the final placement of the shares as contemplated in this prospectus. Accordingly, no purchaser of the shares, other than the underwriters, is authorized to make any further offer of the shares on behalf of the sellers or the underwriters.
Notice to Prospective Investors in the United Kingdom
This prospectus is only being distributed to, and is only directed at, persons in the United Kingdom that are qualified investors within the meaning of Article 2(1)(e) of the Prospectus Directive that are also (i) investment professionals falling within Article 19(5) of the Financial Services and Markets Act 2000 (Financial Promotion) Order 2005, or the Order, or (ii) high net worth entities, and other persons to whom it may lawfully be communicated, falling within Article 49(2)(a) to (d) of the Order (each such person being referred to as a “relevant person”). This prospectus and its contents are confidential and should not be distributed, published or reproduced (in whole or in part) or disclosed by recipients to any other persons in the United Kingdom. Any person in the United Kingdom that is not a relevant person should not act or rely on this document or any of its contents.
Notice to Prospective Investors in France
Neither this prospectus nor any other offering material relating to the shares described in this prospectus has been submitted to the clearance procedures of the Autorité des Marchés Financiers or of the competent authority of another member state of the European Economic Area and notified to the Autorité des Marchés Financiers. The shares have not been offered or sold and will not be offered or sold, directly or indirectly, to the public in France. Neither this prospectus nor any other offering material relating to the shares has been or will be:
| • | released, issued, distributed or caused to be released, issued or distributed to the public in France; or |
| • | used in connection with any offer for subscription or sale of the shares to the public in France. |
Those offers, sales and distributions will be made in France only:
| • | to qualified investors (investisseurs qualifiés) and/or to a restricted circle of investors (cercle restreint d’investisseurs), in each case investing for their own account, all as defined in, and in accordance with articles L.411-2, D.411-1, D.411-2, D.734-1, D.744-1, D.754-1 and D.764-1 of the French Code monétaire et financier; |
| • | to investment services providers authorized to engage in portfolio management on behalf of third parties; or |
| • | in a transaction that, in accordance with article L.411-2-II-1°-or-2°-or 3° of the French Code monétaire et financier and article 211-2 of the General Regulations (Règlement Général) of the Autorité des Marchés Financiers, does not constitute a public offer (appel public à l’épargne). |
The shares may be resold directly or indirectly, only in compliance with articles L.411-1, L.411-2, L.412-1 and L.621-8 through L.621-8-3 of the French Code monétaire et financier.
Notice to Prospective Investors in Hong Kong
The shares may not be offered or sold in Hong Kong by means of any document other than (i) in circumstances which do not constitute an offer to the public within the meaning of the Companies Ordinance (Cap. 32, Laws of Hong Kong), or (ii) to “professional investors” within the meaning of the Securities and Futures Ordinance (Cap. 571, Laws of Hong Kong) and any rules made thereunder, or (iii) in other circumstances which do not result in the document being a “prospectus” within the meaning of the Companies Ordinance (Cap. 32, Laws of Hong Kong) and no advertisement, invitation or document relating to the shares may be issued or may be in the possession of any person for the purpose of issue (in each case whether in Hong Kong or
176
Table of Contents
elsewhere), which is directed at, or the contents of which are likely to be accessed or read by, the public in Hong Kong (except if permitted to do so under the laws of Hong Kong) other than with respect to shares which are or are intended to be disposed of only to persons outside Hong Kong or only to “professional investors” within the meaning of the Securities and Futures Ordinance (Cap. 571, Laws of Hong Kong) and any rules made thereunder.
Notice to Prospective Investors in Japan
The shares offered in this prospectus have not been registered under the Securities and Exchange Law of Japan. The shares have not been offered or sold and will not be offered or sold, directly or indirectly, in Japan or to or for the account of any resident of Japan, except (i) pursuant to an exemption from the registration requirements of the Securities and Exchange Law and (ii) in compliance with any other applicable requirements of Japanese law.
Notice to Prospective Investors in Singapore
This prospectus has not been registered as a prospectus with the Monetary Authority of Singapore. Accordingly, this prospectus and any other document or material in connection with the offer or sale, or invitation for subscription or purchase, of the shares may not be circulated or distributed, nor may the shares be offered or sold, or be made the subject of an invitation for subscription or purchase, whether directly or indirectly, to persons in Singapore other than (i) to an institutional investor under Section 274 of the Securities and Futures Act, Chapter 289 of Singapore, or the SFA, (ii) to a relevant person pursuant to Section 275(1), or any person pursuant to Section 275(1A), and in accordance with the conditions specified in Section 275 of the SFA or (iii) otherwise pursuant to, and in accordance with the conditions of, any other applicable provision of the SFA, in each case subject to compliance with conditions set forth in the SFA.
Where the shares are subscribed or purchased under Section 275 of the SFA by a relevant person which is:
| • | a corporation (which is not an accredited investor (as defined in Section 4A of the SFA)) the sole business of which is to hold investments and the entire share capital of which is owned by one or more individuals, each of whom is an accredited investor; or |
| • | a trust (where the trustee is not an accredited investor) whose sole purpose is to hold investments and each beneficiary of the trust is an individual who is an accredited investor, |
shares, debentures and units of shares and debentures of that corporation or the beneficiaries’ rights and interest (howsoever described) in that trust shall not be transferred within six months after that corporation or that trust has acquired the shares pursuant to an offer made under Section 275 of the SFA except:
| • | to an institutional investor (for corporations, under Section 274 of the SFA) or to a relevant person defined in Section 275(2) of the SFA, or to any person pursuant to an offer that is made on terms that those shares, debentures and units of shares and debentures of that corporation or those rights and interests in that trust are acquired at a consideration of not less than S$200,000 (or its equivalent in a foreign currency) for each transaction, whether that amount is to be paid for in cash or by exchange of securities or other assets, and further for corporations, in accordance with the conditions specified in Section 275 of the SFA; |
| • | where no consideration is or will be given for the transfer; or |
| • | where the transfer is by operation of law. |
177
Table of Contents
Weil, Gotshal & Manges LLP, New York, New York, has passed upon the validity of the common stock offered hereby on behalf of us. Certain legal matters in connection with this offering will be passed upon for the underwriters by Latham & Watkins LLP, New York, New York, in connection with the offering.
The consolidated financial statements of Lantheus Holdings, Inc. and subsidiaries as of December 31, 2014 and 2013, and for each of the three years in the period ended December 31, 2014, included elsewhere in this prospectus, forming part of this Registration Statement have been audited by Deloitte & Touche LLP, an independent registered public accounting firm, as stated in their report appearing herein and elsewhere in this prospectus, forming part of this Registration Statement. Such financial statements are included in reliance upon the report of such firm given upon their authority as experts in accounting and auditing.
WHERE YOU CAN FIND ADDITIONAL INFORMATION
We have filed with the SEC a registration statement on Form S-1 under the Securities Act with respect to the shares of common stock offered hereby. This prospectus does not contain all of the information set forth in the registration statement and the exhibits and schedules thereto. For further information with respect to Lantheus and the shares of common stock offered hereby, you should refer to the registration statement and to the exhibits and schedules filed therewith. Statements contained in this prospectus regarding the contents of any contract or any other document that is filed as an exhibit to the registration statement are not necessarily complete, and each such statement is qualified in all respects by reference to the full text of such contract or other document filed as an exhibit to the registration statement. A copy of the Lantheus registration statement and the exhibits and schedules thereto may be inspected without charge at the public reference room maintained by the SEC located at 100 F Street, N.E., Room 1580, Washington, D.C. 20549. Copies of all or any portion of the registration statements and the filings may be obtained from those offices upon payment of prescribed fees. The public may obtain information on the operation of the public reference room by calling the SEC at 1-800-SEC-0330 or (202) 551-8090. The SEC maintains a website at www.sec.gov that contains reports, proxy and information statements and other information regarding registrants that file electronically with the SEC.
Additionally, our subsidiary, LMI, currently files reports and other information with the SEC. Those reports and other information can be inspected and copied at the Public Reference Room of the SEC located at Room 1580, 100 F Street, N.E., Washington D.C. 20549. Copies of those materials, including copies of all or any portion of the registration statement, can be obtained from the Public Reference Room of the SEC at prescribed rates. You can call the SEC at 1-800-SEC-0330 to obtain information on the operation of the Public Reference Room. These materials may also be accessed electronically by means of the SEC’s website, www.sec.gov.
You may obtain a copy of any of our or LMI’s filings, at no cost, by writing or telephoning us at:
Lantheus Holdings, Inc.
331 Treble Cove Road
North Billerica, MA 01862
Attn: Investor Relations
(978) 671-8001
178
Table of Contents
INDEX TO CONSOLIDATED FINANCIAL STATEMENTS
F-1
Table of Contents
REPORT OF INDEPENDENT REGISTERED PUBLIC ACCOUNTING FIRM
To the Board of Directors and Stockholders of
Lantheus Holdings, Inc.
North Billerica, Massachusetts
We have audited the accompanying consolidated balance sheets of Lantheus Holdings, Inc. and subsidiaries (the “Company”) as of December 31, 2014 and 2013, and the related consolidated statements of comprehensive loss, stockholders’ deficit, and cash flows for each of the three years in the period ended December 31, 2014. These financial statements are the responsibility of the Company’s management. Our responsibility is to express an opinion on these financial statements based on our audits.
We conducted our audits in accordance with the standards of the Public Company Accounting Oversight Board (United States). Those standards require that we plan and perform the audit to obtain reasonable assurance about whether the financial statements are free of material misstatement. The Company is not required to have, nor were we engaged to perform, an audit of its internal control over financial reporting. Our audits included consideration of internal control over financial reporting as a basis for designing audit procedures that are appropriate in the circumstances, but not for the purpose of expressing an opinion on the effectiveness of the Company’s internal control over financial reporting. Accordingly, we express no such opinion. An audit includes examining, on a test basis, evidence supporting the amounts and disclosures in the financial statements, assessing the accounting principles used and significant estimates made by management, as well as evaluating the overall financial statement presentation. We believe that our audits provide a reasonable basis for our opinion.
In our opinion, such consolidated financial statements present fairly, in all material respects, the financial position of Lantheus Holdings, Inc. and subsidiaries as of December 31, 2014 and 2013, and the results of their operations and their cash flows for each of the three years in the period ended December 31, 2014, in conformity with accounting principles generally accepted in the United States of America.
/s/ DELOITTE & TOUCHE LLP
Boston, Massachusetts
March 17, 2015
F-2
Table of Contents
LANTHEUS HOLDINGS, INC. AND SUBSIDIARIES
| (in thousands except share data) |
December 31, 2014 |
December 31, 2013 |
||||||
| Assets |
||||||||
| Current assets |
||||||||
| Cash and cash equivalents |
$ | 19,739 | $ | 18,578 | ||||
| Accounts receivable, net |
41,540 | 38,910 | ||||||
| Inventory |
15,582 | 18,310 | ||||||
| Income tax receivable |
247 | 325 | ||||||
| Deferred tax assets |
256 | 18 | ||||||
| Other current assets |
3,871 | 3,104 | ||||||
|
|
|
|
|
|||||
| Total current assets |
81,235 | 79,245 | ||||||
| Property, plant and equipment, net |
96,014 | 97,653 | ||||||
| Capitalized software development costs, net |
2,421 | 1,470 | ||||||
| Intangibles, net |
27,191 | 34,998 | ||||||
| Goodwill |
15,714 | 15,714 | ||||||
| Deferred financing costs |
7,349 | 9,639 | ||||||
| Deferred tax assets |
328 | 15 | ||||||
| Other long-term assets |
19,318 | 22,577 | ||||||
|
|
|
|
|
|||||
| Total assets |
$ | 249,570 | $ | 261,311 | ||||
|
|
|
|
|
|||||
| Liabilities and Stockholders’ Deficit |
||||||||
| Current liabilities |
||||||||
| Line of credit |
8,000 | 8,000 | ||||||
| Accounts payable |
15,665 | 18,103 | ||||||
| Accrued expenses and other liabilities |
24,579 | 25,492 | ||||||
| Deferred tax liability |
152 | 57 | ||||||
| Deferred revenue |
132 | 3,979 | ||||||
|
|
|
|
|
|||||
| Total current liabilities |
48,528 | 55,631 | ||||||
| Asset retirement obligations |
7,435 | 6,385 | ||||||
| Long-term debt, net |
399,280 | 399,037 | ||||||
| Dividend payable |
355 | 355 | ||||||
| Deferred tax liability |
247 | 12 | ||||||
| Other long-term liabilities |
32,995 | 35,408 | ||||||
|
|
|
|
|
|||||
| Total liabilities |
488,840 | 496,828 | ||||||
|
|
|
|
|
|||||
| Commitments and contingencies (see Notes 15 and 17) |
||||||||
| Stockholders’ deficit |
||||||||
| Preferred stock ($0.001 par value, 2,000,000 shares authorized; no shares issued and outstanding) |
— | — | ||||||
| Common stock ($0.001 par value, 60,000,000 shares authorized; 50,821,658 and 50,815,421 shares issued; 50,807,503 and 50,801,266 shares outstanding) |
51 | 51 | ||||||
| Treasury stock (14,155 and no shares, at cost) |
(106 | ) | (106 | ) | ||||
| Additional paid-in capital |
106,829 | 105,785 | ||||||
| Accumulated deficit |
(344,414 | ) | (340,853 | ) | ||||
| Accumulated other comprehensive loss |
(1,630 | ) | (394 | ) | ||||
|
|
|
|
|
|||||
| Total stockholders’ deficit |
(239,270 | ) | (235,517 | ) | ||||
|
|
|
|
|
|||||
| Total liabilities and stockholders’ deficit |
$ | 249,570 | $ | 261,311 | ||||
|
|
|
|
|
|||||
See notes to consolidated financial statements.
F-3
Table of Contents
LANTHEUS HOLDINGS, INC. AND SUBSIDIARIES
CONSOLIDATED STATEMENTS OF COMPREHENSIVE LOSS
| Year Ended December 31, | ||||||||||||
| 2014 | 2013 | 2012 | ||||||||||
| (in thousands except share and per share data) | ||||||||||||
| Revenues |
$ | 301,600 | $ | 283,672 | $ | 288,105 | ||||||
|
|
|
|
|
|
|
|||||||
| Cost of goods sold |
176,081 | 206,311 | 211,049 | |||||||||
| Loss on firm purchase commitment |
— | — | 1,859 | |||||||||
|
|
|
|
|
|
|
|||||||
| Total cost of goods sold |
176,081 | 206,311 | 212,908 | |||||||||
|
|
|
|
|
|
|
|||||||
| Gross profit |
125,519 | 77,361 | 75,197 | |||||||||
|
|
|
|
|
|
|
|||||||
| Operating expenses |
||||||||||||
| Sales and marketing expenses |
35,116 | 35,227 | 37,437 | |||||||||
| General and administrative expenses |
37,313 | 33,036 | 32,520 | |||||||||
| Research and development expenses |
13,673 | 30,459 | 40,604 | |||||||||
| Proceeds from manufacturer |
— | (8,876 | ) | (34,614 | ) | |||||||
| Impairment on land |
— | 6,406 | — | |||||||||
|
|
|
|
|
|
|
|||||||
| Total operating expenses |
86,102 | 96,252 | 75,947 | |||||||||
|
|
|
|
|
|
|
|||||||
| Operating income (loss) |
39,417 | (18,891 | ) | (750 | ) | |||||||
| Interest expense |
(42,288 | ) | (42,915 | ) | (42,014 | ) | ||||||
| Interest income |
27 | 104 | 252 | |||||||||
| Other income (expense), net |
478 | 1,161 | (44 | ) | ||||||||
|
|
|
|
|
|
|
|||||||
| Loss before income taxes |
(2,366 | ) | (60,541 | ) | (42,556 | ) | ||||||
| Provision (benefit) for income taxes |
1,195 | 1,014 | (555 | ) | ||||||||
|
|
|
|
|
|
|
|||||||
| Net loss |
(3,561 | ) | (61,555 | ) | (42,001 | ) | ||||||
|
|
|
|
|
|
|
|||||||
| Foreign currency translation |
(1,236 | ) | (1,729 | ) | 964 | |||||||
|
|
|
|
|
|
|
|||||||
| Total comprehensive loss |
$ | (4,797 | ) | $ | (63,284 | ) | $ | (41,037 | ) | |||
|
|
|
|
|
|
|
|||||||
| Net loss per common share: |
||||||||||||
| Basic and diluted |
$ | (0.07 | ) | $ | (1.21 | ) | $ | (0.84 | ) | |||
| Common shares: |
||||||||||||
| Basic and diluted |
50,806,512 | 50,670,274 | 50,250,957 | |||||||||
See notes to consolidated financial statements.
F-4
Table of Contents
LANTHEUS HOLDINGS, INC. AND SUBSIDIARIES
CONSOLIDATED STATEMENTS OF STOCKHOLDERS’ DEFICIT
| Preferred Stock |
Common Stock | Treasury Stock | Additional Paid-In Capital |
Accumulated Deficit |
Accumulated Other Comprehensive Income (Loss) |
Total Stockholders’ Deficit |
||||||||||||||||||||||||||||||||||
| Shares | Amount | Shares | Amount | Shares | Amount | |||||||||||||||||||||||||||||||||||
| (in thousands, except share data) | ||||||||||||||||||||||||||||||||||||||||
| Balance at January 1, 2012 |
— | $ | — | 50,236,905 | $ | 50 | — | — | $ | 103,190 | $ | (237,698 | ) | $ | 371 | $ | (134,087 | ) | ||||||||||||||||||||||
| Repurchase and retirement of common stock |
— | — | (20,759 | ) | — | — | — | (174 | ) | — | — | (174 | ) | |||||||||||||||||||||||||||
| Net share option exercise |
— | — | 9,085 | — | — | — | — | — | — | — | ||||||||||||||||||||||||||||||
| Common stock issuance |
— | — | 72,196 | — | — | — | 552 | — | — | 552 | ||||||||||||||||||||||||||||||
| Forfeiture of dividend equivalent right |
— | — | — | — | — | — | — | 401 | — | 401 | ||||||||||||||||||||||||||||||
| Net loss |
— | — | — | — | — | — | — | (42,001 | ) | — | (42,001 | ) | ||||||||||||||||||||||||||||
| Other comprehensive income |
— | — | — | — | — | — | — | — | 964 | 964 | ||||||||||||||||||||||||||||||
| Stock-based compensation |
— | — | — | — | — | — | 1,240 | — | — | 1,240 | ||||||||||||||||||||||||||||||
|
|
|
|
|
|
|
|
|
|
|
|
|
|
|
|
|
|
|
|
|
|||||||||||||||||||||
| Balance at December 31, 2012 |
— | — | 50,297,427 | 50 | — | — | 104,808 | (279,298 | ) | 1,335 | (173,105 | ) | ||||||||||||||||||||||||||||
| Repurchase of common stock |
— | — | — | — | (14,155 | ) | (106 | ) | — | — | — | (106 | ) | |||||||||||||||||||||||||||
| Net share option exercise |
— | — | 459,171 | 1 | — | — | (1 | ) | — | — | — | |||||||||||||||||||||||||||||
| Common stock issuance |
— | — | 58,823 | — | — | — | 400 | — | — | 400 | ||||||||||||||||||||||||||||||
| Net loss |
— | — | — | — | — | — | — | (61,555 | ) | — | (61,555 | ) | ||||||||||||||||||||||||||||
| Other comprehensive loss |
— | — | — | — | — | — | — | — | (1,729 | ) | (1,729 | ) | ||||||||||||||||||||||||||||
| Stock-based compensation |
— | — | — | — | — | — | 578 | — | — | 578 | ||||||||||||||||||||||||||||||
|
|
|
|
|
|
|
|
|
|
|
|
|
|
|
|
|
|
|
|
|
|||||||||||||||||||||
| Balance at December 31, 2013 |
— | $ | — | 50,815,421 | $ | 51 | (14,155 | ) | (106 | ) | $ | 105,785 | $ | (340,853 | ) | $ | (394 | ) | $ | (235,517 | ) | |||||||||||||||||||
| Net share option exercise |
— | — | 6,237 | — | — | — | 13 | — | — | 13 | ||||||||||||||||||||||||||||||
| Net loss |
— | — | — | — | — | — | — | (3,561 | ) | — | (3,561 | ) | ||||||||||||||||||||||||||||
| Other comprehensive loss |
— | — | — | — | — | — | — | — | (1,236 | ) | (1,236 | ) | ||||||||||||||||||||||||||||
| Stock-based compensation |
— | — | — | — | — | — | 1,031 | — | — | 1,031 | ||||||||||||||||||||||||||||||
|
|
|
|
|
|
|
|
|
|
|
|
|
|
|
|
|
|
|
|
|
|||||||||||||||||||||
| Balance at December 31, 2014 |
— | $ | — | 50,821,658 | $ | 51 | (14,155 | ) | (106 | ) | $ | 106,829 | $ | (344,414 | ) | $ | (1,630 | ) | $ | (239,270 | ) | |||||||||||||||||||
|
|
|
|
|
|
|
|
|
|
|
|
|
|
|
|
|
|
|
|
|
|||||||||||||||||||||
See notes to consolidated financial statements.
F-5
Table of Contents
LANTHEUS HOLDINGS, INC. AND SUBSIDIARIES
CONSOLIDATED STATEMENTS OF CASH FLOWS
| Year ended December 31, | ||||||||||||
| 2014 | 2013 | 2012 | ||||||||||
| (in thousands) | ||||||||||||
| Cash flows from operating activities |
||||||||||||
| Net loss |
$ | (3,561 | ) | $ | (61,555 | ) | $ | (42,001 | ) | |||
| Adjustments to reconcile net loss to cash flow from operating activities |
||||||||||||
| Depreciation |
9,901 | 9,336 | 9,722 | |||||||||
| Amortization |
8,350 | 15,819 | 17,680 | |||||||||
| Impairment of land |
— | 6,406 | — | |||||||||
| Impairment of intangible assets |
— | 17,175 | — | |||||||||
| Amortization of debt related costs |
2,708 | 2,600 | 2,403 | |||||||||
| Write-off of deferred offering costs |
2,392 | — | — | |||||||||
| Write-off of deferred financing costs |
— | 598 | — | |||||||||
| Provision for bad debt |
303 | 63 | (117 | ) | ||||||||
| Provision for excess and obsolete inventory |
1,593 | 4,854 | 12,809 | |||||||||
| Stock-based compensation |
1,031 | 578 | 1,240 | |||||||||
| Accretion of asset retirement obligations |
773 | 628 | 553 | |||||||||
| Loss on firm purchase commitment |
— | — | 1,859 | |||||||||
| Other |
(215 | ) | (237 | ) | (143 | ) | ||||||
| Long-term income tax receivable |
2,719 | (566 | ) | 299 | ||||||||
| Long-term income tax payable and other long-term liabilities |
(2,560 | ) | 187 | 139 | ||||||||
| Increase (decrease) in cash from operating assets and liabilities |
||||||||||||
| Accounts receivable, net |
(3,563 | ) | 2,627 | (1,442 | ) | |||||||
| Prepaid expenses and other current assets |
(865 | ) | 1,026 | 1,304 | ||||||||
| Inventory |
1,500 | (4,741 | ) | (6,903 | ) | |||||||
| Deferred revenue |
(3,881 | ) | (4,874 | ) | 5,349 | |||||||
| Accounts payable |
(4,047 | ) | (1,147 | ) | (2,231 | ) | ||||||
| Income tax payable |
68 | 410 | (2,217 | ) | ||||||||
| Accrued expenses and other liabilities |
(1,056 | ) | (4,759 | ) | 1,325 | |||||||
|
|
|
|
|
|
|
|||||||
| Cash provided by (used in) operating activities |
11,590 | (15,572 | ) | (372 | ) | |||||||
|
|
|
|
|
|
|
|||||||
| Cash flows from investing activities |
||||||||||||
| Capital expenditures |
(8,137 | ) | (5,010 | ) | (7,920 | ) | ||||||
| Proceeds from sale of property, plant and equipment |
227 | 1,527 | — | |||||||||
| Redemption (purchase) of certificate of deposit |
228 | — | (225 | ) | ||||||||
|
|
|
|
|
|
|
|||||||
| Cash used in investing activities |
(7,682 | ) | (3,483 | ) | (8,145 | ) | ||||||
|
|
|
|
|
|
|
|||||||
| Cash flows from financing activities |
||||||||||||
| Payments on note payable |
(71 | ) | (1,310 | ) | (1,530 | ) | ||||||
| Payments for offering costs |
(2,064 | ) | — | — | ||||||||
| Deferred financing costs |
(175 | ) | (1,249 | ) | (442 | ) | ||||||
| Proceeds from line of credit |
5,500 | 8,000 | — | |||||||||
| Payments on line of credit |
(5,500 | ) | — | — | ||||||||
| Proceeds from issuance of common stock |
13 | 400 | 551 | |||||||||
| Payments for common stock repurchase |
— | (106 | ) | (174 | ) | |||||||
| Payment of dividend |
— | (123 | ) | (3,519 | ) | |||||||
|
|
|
|
|
|
|
|||||||
| Cash (used in) provided by financing activities |
(2,297 | ) | 5,612 | (5,114 | ) | |||||||
|
|
|
|
|
|
|
|||||||
| Effect of foreign exchange rate on cash |
(450 | ) | (1,300 | ) | 649 | |||||||
|
|
|
|
|
|
|
|||||||
| Increase (decrease) in cash and cash equivalents |
1,161 | (14,743 | ) | (12,982 | ) | |||||||
| Cash and cash equivalents, beginning of year |
18,578 | 33,321 | 46,303 | |||||||||
|
|
|
|
|
|
|
|||||||
| Cash and cash equivalents, end of year |
$ | 19,739 | $ | 18,578 | $ | 33,321 | ||||||
|
|
|
|
|
|
|
|||||||
| Supplemental disclosure of cash flow information |
||||||||||||
| Interest paid |
$ | 39,214 | $ | 39,150 | $ | 39,020 | ||||||
| Income taxes paid, net |
$ | 508 | $ | 118 | $ | 1,146 | ||||||
| Noncash investing and financing activities |
||||||||||||
| Property, plant and equipment included in accounts payable and accrued expenses and other liabilities |
$ | 2,916 | $ | 1,243 | $ | 963 | ||||||
| Deferred offering cost included in accounts payable and accrued expenses and other liabilities |
$ | 132 | $ | — | $ | — | ||||||
See notes to consolidated financial statements.
F-6
Table of Contents
LANTHEUS HOLDINGS, INC. AND SUBSIDIARIES
NOTES TO CONSOLIDATED FINANCIAL STATEMENTS
Unless the context otherwise requires, references to the “Company” and “Lantheus” refer to Lantheus Holdings, Inc. (formerly Lantheus MI Holdings, Inc.) and its direct and indirect subsidiaries; references to “Lantheus Intermediate” refer to only Lantheus Intermediate, Inc., the parent of Lantheus Medical Imaging, Inc.; references to “Holdings” refer to Lantheus Holdings, Inc., the parent of Lantheus Intermediate; and references to “LMI” refer to Lantheus Medical Imaging, Inc., the subsidiary of Lantheus Intermediate. Solely for convenience, trademarks, service marks and trade names are referred to without the TM, SM and ® symbols. Those references are not intended to indicate, in any way, that The Company will not assert, to the fullest extent permitted under applicable law, its rights to its trademarks, service marks and trade names.
1. Business Overview
Overview
Holdings, a Delaware corporation, is the parent company and sole shareholder of Lantheus Intermediate, also a Delaware corporation. Holdings was formed for the purpose of acquiring the medical imaging business of Bristol-Myers Squibb, or BMS, which is now known as LMI.
The Company develops, manufactures, sells and distributes innovative diagnostic medical imaging agents and products that assist clinicians in the diagnosis of cardiovascular and other diseases. The Company’s commercial products are used by nuclear physicians, cardiologists, radiologists, internal medicine physicians, technologists and sonographers working in a variety of clinical settings. The Company sells its products to radiopharmacies, hospitals, clinics, group practices, integrated delivery networks, group purchasing organizations and, in certain circumstances, wholesalers. The Company sells its products globally and has operations in the United States, Puerto Rico, Canada and Australia and distribution relationships in Europe, Asia Pacific and Latin America.
The Company’s portfolio of 10 commercial products is diversified across a range of imaging modalities. The Company’s imaging agents include medical radiopharmaceuticals (including technetium generators) and contrast agents, including the following:
| • | DEFINITY is the leading ultrasound contrast imaging agent used by cardiologists and sonographers during cardiac ultrasound, or echocardiography, exams based on revenue and usage. DEFINITY is an injectable agent that, in the United States, is indicated for use in patients with suboptimal echocardiograms to assist in the visualization of the left ventricle, the main pumping chamber of the heart. The use of DEFINITY in echocardiography allows physicians to significantly improve their assessment of the function of the left ventricle. |
| • | TechneLite is a self-contained system, or generator, of technetium (Tc99m), a radioisotope with a six hour half-life, used by radiopharmacies to prepare various nuclear imaging agents. |
| • | Xenon Xe 133 Gas is a radiopharmaceutical gas that is inhaled and used to assess pulmonary function and also to image blood flow. |
| • | Cardiolite is an injectable, technetium-labeled imaging agent, also known by its generic name sestamibi, used with Single Photon Emission Computed Tomography, or SPECT, technology in myocardial perfusion imaging, or MPI, procedures that assess blood flow distribution to the heart. |
| • | Neurolite is an injectable, technetium-labeled imaging agent used with SPECT technology to identify the area within the brain where blood flow has been blocked or reduced due to stroke. |
In the United States, the Company sells DEFINITY through its sales team that calls on healthcare providers in the echocardiography space, as well as group purchasing organizations and integrated delivery networks. The Company’s radiopharmaceutical products are primarily distributed through approximately 350 radiopharmacies
F-7
Table of Contents
owned or controlled by third parties. In Canada, Puerto Rico and Australia, the Company owns eight radiopharmacies and sells its own radiopharmaceuticals, as well as others, directly to end users. In Europe, Asia Pacific and Latin America, the Company utilizes distributor relationships to market, sell and distribute its products.
2. Summary of Significant Accounting Policies
Basis of Consolidation and Presentation
The financial statements have been prepared in United States dollars, in accordance with accounting principles generally accepted in the United States of America, or U.S. GAAP. The consolidated financial statements include the accounts of Holdings and its wholly-owned subsidiaries. All intercompany accounts and transactions have been eliminated in consolidation.
The accompanying financial statements have been prepared on a going concern basis, which contemplates the realization of assets and the discharge of liabilities in the normal course of business. The Company incurred a net loss of $3.6 million during the year ended December 31, 2014 and had an accumulated deficit of $344.4 million at December 31, 2014.
As of December 31, 2014, the Company had $408.0 million of total principal indebtedness consisting of $400.0 million of senior notes, which mature on May 15, 2017, and $8.0 million outstanding under its revolving credit facility. The Company is obligated to make scheduled interest payments of $39.0 million per year on the senior notes.
The Company experienced operating losses, resulting from supply shortages beginning in the third quarter of 2011 through the third quarter of 2013 in connection with the manufacture of DEFINITY, Cardiolite and Neurolite at Ben Venue Laboratories, Inc. in Bedford, Ohio. As of November 2013, BVL ceased manufacturing any product for the Company. During 2012, the Company commenced a comprehensive manufacturing diversification strategy and currently relies on Jubilant HollisterStier, or JHS, as its sole source manufacturer of DEFINITY, Neurolite and evacuation vials for TechneLite. The Company has additional ongoing technology transfer activities at JHS for its Cardiolite product supply, which is currently manufactured by a single manufacturer. In addition, the Company has ongoing technology transfer activities at Pharmalucence for the manufacture and supply of DEFINITY, and the Company believes Pharmalucence will file for FDA approval to manufacture DEFINITY in 2015.
The Company has historically been dependent on key customers and group purchasing organizations for the majority of the sales of its medical imaging products. The Company’s ability to maintain and profitably renew those contracts and relationships with those key customers and group purchasing organizations is an important aspect of the Company’s strategy. The Company’s written supply agreements with a major customer relating to TechneLite, Xenon, Neurolite, Cardiolite and certain other products expired in accordance with contract terms on December 31, 2014. Extended discussions with this customer have not yet resulted in new written supply agreements. Consequently, the Company is currently accepting and fulfilling product orders with this customer on a purchase order basis.
Until the Company successfully becomes dual sourced for its principal products, the Company is vulnerable to future supply shortages. Disruption in the financial performance of the Company could also occur if it experiences significant adverse changes in customer mix, broad economic downturns, adverse industry or Company conditions or catastrophic external events. If the Company experiences one or more of these events in the future, it may be required to implement additional expense reductions, such as a delay or elimination of discretionary spending in all functional areas, as well as scaling back select operating and strategic initiatives.
During 2013 and 2014, the Company has utilized its revolving line of credit as a source of liquidity from time to time. Borrowing capacity under the revolving credit facility, or the Facility, is calculated by reference to a borrowing base consisting of a percentage of certain eligible accounts receivable, inventory and machinery and
F-8
Table of Contents
equipment minus any reserves, or the Borrowing Base. If the Company is not successful in achieving its forecasted operating results, the Company’s accounts receivable and inventory could be negatively affected, thus reducing the Borrowing Base and limiting the Company’s borrowing capacity. As of December 31, 2014, the aggregate Borrowing Base was approximately $50.0 million, which was reduced by the $8.8 million unfunded Standby Letter of Credit and the $8.0 million outstanding loan balance, resulting in a net Borrowing Base availability of approximately $33.2 million.
Based on the Company’s current operating plans, the Company believes its existing cash and cash equivalents, results of operations and availability under the Facility will be sufficient to continue to fund the Company’s liquidity requirements for at least the next twelve months.
Use of Estimates
The preparation of consolidated financial statements in conformity with U.S. GAAP requires management to make certain estimates and assumptions that affect the reported amounts of assets and liabilities at the date of the consolidated financial statements, and the reported amounts of revenues and expenses during the reporting period. The more significant estimates reflected in the Company’s consolidated financial statements include certain judgments regarding revenue recognition, goodwill, tangible and intangible asset valuation, inventory valuation and potential losses on purchase commitments, asset retirement obligations, income tax liabilities and related indemnification receivable, deferred tax assets and liabilities, accrued expenses and stock-based compensation. Actual results could materially differ from those estimates or assumptions.
Write-Off of Initial Public Offering Costs
The Company deferred costs incurred for an initial public offering (“IPO”) of common stock during 2014 which included legal, audit and other professional fees. During the third quarter of 2014, the Company determined that it was likely its IPO would be postponed for a period in excess of 90 days. As a result, the Company recorded a write-off of deferred offering costs of $2.4 million during the year ended December 31, 2014, which is included within operating income (loss) in the accompanying consolidated statements of comprehensive loss.
Revenue Recognition
The Company recognizes revenue when evidence of an arrangement exists, title has passed, the risks and rewards of ownership have transferred to the customer, the selling price is fixed and determinable, and collectability is reasonably assured. For transactions for which revenue recognition criteria have not yet been met, the respective amounts are recorded as deferred revenue until such point in time the criteria are met and revenue can be recognized. Revenue is recognized net of reserves, which consist of allowances for returns and rebates.
Revenue arrangements with multiple elements are divided into separate units of accounting if certain criteria are met, including whether the delivered element has stand-alone value to the customer. The arrangement’s consideration is then allocated to each separate unit of accounting based on the relative selling price of each deliverable. The estimated selling price of each deliverable is determined using the following hierarchy of values: (i) vendor-specific objective evidence of fair value; (ii) third-party evidence of selling price; and (iii) best estimate of selling price. The best estimate of selling price reflects the Company’s best estimate of what the selling price would be if the deliverable was regularly sold by the Company on a stand-alone basis. The consideration allocated to each unit of accounting is then recognized as the related goods or services are delivered, limited to the consideration that is not contingent upon future deliverables. Supply or service transactions may involve the charge of a nonrefundable initial fee with subsequent periodic payments for future products or services. The up-front fees, even if nonrefundable, are recognized as revenue as the products and/or services are delivered and performed over the term of the arrangement.
F-9
Table of Contents
On January 1, 2009, LMI executed an amendment to a license and supply agreement (the “Agreement”) with one of its customers, granting non-exclusive U.S. license and supply rights to the customer for the period from January 1, 2009 through December 31, 2012. Under the terms of the Agreement, the customer paid LMI $10.0 million in license fees; $8.0 million of which was received upon execution of the Agreement and $2.0 million of which was received in June 2009 upon delivery of a special license as defined in the Agreement. The Company’s product sales under the Agreement are recognized in the same manner as its normal product sales. The Company recognized the license fees as revenue on a straight-line basis over the term of the four-year Agreement. The Company recognized $2.5 million in fiscal year 2012 in license fee revenue pursuant to the Agreement.
In February 2012, the Company entered in to the first amendment to the Agreement. The amendment contained obligations for the Company to deliver a fixed minimum number of units of the same product at different specified unit prices throughout the 11-month amendment term. The fixed minimum number of units shipped at the beginning of the amendment term had a substantially higher unit selling price than the units shipped later in the amendment term. The Company determined the total arrangement consideration and allocated this to each unit of product by applying the relative selling price method; therefore, revenue under this arrangement is being recognized at an average selling price as the units are shipped. The Company recognized $5.6 million and $12.8 million in revenue pursuant to the first amendment during the years ended December 31, 2013 and 2012, respectively. There was no deferred revenue attributable to these units at December 31, 2013.
On December 27, 2012, the Company entered into the second amendment to the Agreement, which extended the term from December 31, 2012 to December 31, 2014 and established new pricing and purchase requirements over the extended term. The second amendment also provided for the supply of TechneLite generators containing molybdenum-99 sourced from LEU targets. The agreement includes a $3.0 million upfront payment by the customer to the Company and potential future milestone payments. During 2012, the Company received the $3.0 million upfront payment. During 2013, the Company received an additional $4.0 million upon achievement of the required milestones. At December 31, 2013, $3.6 million is included in deferred revenue as a current liability in the accompanying consolidated balance sheets. The Company recognized the upfront payment as revenue on a straight-line basis over the term of the two year agreement. At December 31, 2014, there was no deferred revenue related to this Agreement.
Product Returns
The Company provides a reserve for its estimate of sales recorded for which the related products are expected to be returned. The Company does not typically accept product returns unless an over shipment or non-conforming shipment was provided to the customer, or if the product was defective. The Company adjusts its estimate of product returns if it becomes aware of other factors that it believes could significantly impact its expected returns, including product recalls. These factors include its estimate of actual and historical return rates for non-conforming product and open return requests. Historically, the Company’s estimates of returns have reasonably approximated actual returns.
Distributor Relationships
Revenue for product sold to distributors is recognized at shipment, unless revenue recognition criteria have not been met. In those instances where collectability cannot be determined or the selling price cannot be reasonably estimated until the distributor has sold through the goods, the Company defers that revenue until such time as the goods have been sold through to the end-user customer, or the selling price can be reasonably estimated based on history of transactions with that distributor.
F-10
Table of Contents
Rebates and Allowances
Estimates for rebates and allowances represent the Company’s estimated obligations under contractual arrangements with third parties. Rebate accruals and allowances are recorded in the same period the related revenue is recognized, resulting in a reduction to revenue and the establishment of a liability which is included in accrued expenses in the accompanying consolidated balance sheets. These rebates result from performance-based offers that are primarily based on attaining contractually specified sales volumes and growth, Medicaid rebate programs for certain products, administration fees of group purchasing organizations and certain distributor related commissions. The calculation of the accrual for these rebates and allowances is based on an estimate of the third party’s buying patterns and the resulting applicable contractual rebate or commission rate(s) to be earned over a contractual period.
The accrual for rebates and allowances was approximately $2.2 million and $1.7 million at December 31, 2014 and 2013, respectively. Rebate and allowance charges against gross revenues totaled $5.2 million, $4.8 million and $2.8 million for the years ended December 31, 2014, 2013 and 2012, respectively.
Income Taxes
The Company accounts for income taxes using an asset and liability approach. The provision for income taxes represents income taxes paid or payable for the current year plus the change in deferred taxes during the year. Deferred taxes result from differences between the financial and tax bases of the Company’s assets and liabilities. Deferred tax assets and liabilities are measured using the currently enacted tax rates that apply to taxable income in effect for the years in which those tax attributes are expected to be recovered or paid, and are adjusted for changes in tax rates and tax laws when changes are enacted.
Valuation allowances are recorded to reduce deferred tax assets when it is more likely than not that a tax benefit will not be realized. The assessment of whether or not a valuation allowance is required involves the weighing of both positive and negative evidence concerning both historical and prospective information with greater weight given to evidence that is objectively verifiable. A history of recent losses is negative evidence that is difficult to overcome with positive evidence. In evaluating prospective information there are four sources of taxable income: reversals of taxable temporary differences, items that can be carried back to prior tax years (such as net operating losses), pre-tax income, and tax planning strategies. Any tax planning strategies that are considered must be prudent and feasible, and would only be undertaken in order to avoid losing an operating loss carryforward. Adjustments to the deferred tax valuation allowances are made in the period when those assessments are made.
The Company accounts for uncertain tax positions using a recognition threshold and measurement attribute for the financial statement recognition and measurement of a tax position taken or expected to be taken in a tax return. Differences between tax positions taken in a tax return and amounts recognized in the financial statements are recorded as adjustments to other long-term assets and liabilities, or adjustments to deferred taxes, or both. The Company provides disclosure at the end of each annual reporting period on a tabular reconciliation of unrecognized tax benefits. The Company classifies interest and penalties within the provision for income taxes.
Loss per Share
Basic earnings per share is computed by dividing net income by the weighted average number of shares of common stock outstanding during the period. Diluted earnings per common share is computed by dividing net income by the weighted average number of shares of common stock outstanding during the period, plus the potential dilutive effect of other securities if those securities were converted or exercised. During periods in which we incur net losses, both basic and diluted loss per share is calculated by dividing the net loss by the weighted average shares outstanding and potentially dilutive securities are excluded from the calculation because their effect would be anti-dilutive.
F-11
Table of Contents
Cash and Cash Equivalents
Cash and cash equivalents include savings deposits, certificates of deposit and money market funds that have original maturities of three months or less when purchased.
Accounts Receivable
Accounts receivable consist of amounts billed and currently due from customers. The Company maintains an allowance for doubtful accounts for estimated losses. In determining the allowance, consideration includes the probability of recoverability based on past experience and general economic factors. Certain accounts receivable may be fully reserved when specific collection issues are known to exist, such as pending bankruptcy. As of December 31, 2014 and 2013, the Company had allowances for doubtful accounts of approximately $0.6 million and $0.3 million, respectively.
Also included in accounts receivable are miscellaneous receivables of approximately $2.0 million and $1.9 million as of December 31, 2014 and 2013, respectively.
Concentration of Risks and Limited Suppliers
Financial instruments which potentially subject the Company to concentrations of credit risk consist principally of trade accounts receivable. The Company periodically reviews its accounts receivable for collectability and provides for an allowance for doubtful accounts to the extent that amounts are not expected to be collected. The Company sells primarily to large national distributors, which in turn, may resell the Company’s products. There were two customers that represented greater than 10% of the total net accounts receivable balance and revenue during the year ended December 31, 2014, the majority of which is included in the U.S. segment.
| Accounts Receivable as of December 31, |
Revenue for the year ended December 31, |
|||||||||||||||||||
| 2014 | 2013 | 2014 | 2013 | 2012 | ||||||||||||||||
| Company A |
16.5 | % | 16.7 | % | 18.0 | % | 18.8 | % | 27.4 | % | ||||||||||
| Company B |
13.4 | % | 13.2 | % | 11.1 | % | 10.2 | % | 8.4 | % | ||||||||||
| Company C |
9.8 | % | 7.2 | % | 8.8 | % | 9.8 | % | 11.5 | % | ||||||||||
The Company’s cash and cash equivalents are maintained with various financial institutions.
The Company relies on certain materials used in its development and manufacturing processes, some of which are procured from only one or a few sources. The failure of one of these suppliers to deliver on schedule could delay or interrupt the manufacturing or commercialization process and thereby adversely affect the Company’s operating results. In addition, a disruption in the commercial supply of, or a significant increase in the cost of one of the Company’s materials from these sources could have a material adverse effect on the Company’s business, financial position and results of operations. From May 2009 until August 2010, Nordion, the Company’s largest supplier of Moly, a key raw material in the Company’s TechneLite product, was affected by a nuclear reactor shutdown. The Company was not fully able to replace all of the quantity of supply it previously received from Nordion, which had a negative impact on the Company’s results of operations. As part of the conditions for the relicensing of the NRU reactor, the Canadian government has asked Atomic Energy of Canada Limited, or AECL, to shut down the reactor for at least four weeks at least once a year for inspection and maintenance. The scheduled 2012 shutdown period ran from mid-April 2012 until mid-May 2012, and during such period, some of LMI’s customers diverted a small amount of business to LMI’s competitor, which correspondingly reduced the Company’s aggregate orders during the shutdown period. With this diversion, LMI was able to fulfill all customer demand for Moly from other suppliers during the shutdown period. During 2012,
F-12
Table of Contents
the Company executed amendments to agreements with Nordion and NTP, the Company’s Moly suppliers, which extended the contract terms of those agreements to December 31, 2015 and December 31, 2017, respectively. In addition, because Xenon is a by-product of the Moly production process and is currently captured only by Nordion, the Company is currently reliant on Nordion as the sole supplier of Xenon to meet customer demand. In March 2013, the Company entered into an agreement with Institute for Radioelements (“IRE”) who had previously been supplying the Company with Moly under the previous agreement with NTP and this agreement expires on December 31, 2017.
Historically, the Company has relied on BVL as its sole manufacturer of DEFINITY and Neurolite and one of two manufacturers of its Cardiolite product supply. Following extended operational and regulatory challenges at BVL’s Bedford, Ohio facility, as of November 15, 2013, BVL ceased manufacturing for the Company any DEFINITY, Cardiolite or Neurolite.
Following extensive technology transfer activities, the Company currently relies on JHS as its sole source manufacturer of DEFINITY, Neurolite and evacuation vials for TechneLite. The Company has additional ongoing technology transfer activities at JHS for its Cardiolite product supply. In the meantime, the Company has no other currently active supplier of DEFINITY, Neurolite, and its Cardiolite product supply is manufactured by a single manufacturer.
Based on current projections, the Company believes that it will have sufficient supply of DEFINITY and Neurolite from JHS to meet expected demand and sufficient Cardiolite product supply from its current supplier to meet expected demand. Currently, the regulatory authorities in certain countries prohibit the Company from marketing products previously manufactured by BVL, and JHS has not yet obtained approval of such regulatory authorities that would permit the Company to market certain products manufactured by JHS. Accordingly, until such regulatory approvals have been obtained, the Company will not be able to sell and distribute those products in the relevant markets.
The Company is also currently working to secure additional alternative suppliers for its key products as part of its ongoing supply chain diversification strategy. On November 12, 2013, the Company entered into a Manufacturing and Supply Agreement with Pharmalucence to manufacture and supply DEFINITY. However, the Company is uncertain on the timing in which the Pharmalucence arrangement or any other arrangements could provide meaningful quantities of product. The Company believes Pharmalucence will file for FDA approval to manufacture DEFINITY in 2015.
The following table sets forth revenues for the Company’s products that represented greater than 10% of total revenue for the years ended December 31, 2014, 2013 and 2012.
| Year Ended December 31, |
||||||||||||
| 2014 | 2013 | 2012 | ||||||||||
| DEFINITY |
31.8 | % | 27.5 | % | 17.9 | % | ||||||
| TechneLite |
31.0 | % | 32.5 | % | 39.7 | % | ||||||
| Xenon |
12.1 | % | 11.3 | % | 10.4 | % | ||||||
| Cardiolite |
6.2 | % | 9.2 | % | 12.1 | % | ||||||
Inventory
Inventory includes material, direct labor and related manufacturing overhead, and is stated at the lower of cost or market on a first-in, first-out basis. The Company does have consignment arrangements with certain customers where the Company retains title and the risk of ownership of the inventory, which is included in the Company’s inventory balance.
F-13
Table of Contents
The Company assesses the recoverability of inventory to determine whether adjustments for excess and obsolete inventory are required. Inventory that is in excess of future requirements is written down to its estimated net realizable value based upon forecasted demand for its products. If actual demand is less favorable than what has been forecasted by management, additional inventory write-downs may be required.
Inventory costs associated with product that has not yet received regulatory approval are capitalized if the Company believes there is probable future commercial use of the product and future economic benefits of the asset. If future commercial use of the product is not probable, then inventory costs associated with such product are expensed during the period the costs are incurred. For the year ended December 31, 2014, the Company expensed $1.9 million of such product costs in cost of goods sold relating to Neurolite that was manufactured by JHS. At December 31, 2014 and 2013, the Company had no capitalized inventories associated with product that did not have regulatory approval.
Property, Plant and Equipment
Property, plant and equipment are stated at cost. Replacements of major units of property are capitalized, and replaced properties are retired. Replacements of minor components of property and repair and maintenance costs are charged to expense as incurred. Depreciation is computed on a straight-line method based on the estimated useful lives of the related assets. The estimated useful lives of the major classes of depreciable assets are as follows:
| Buildings |
50 years | |
| Land improvements |
15 - 40 years | |
| Machinery and equipment |
3 - 20 years | |
| Furniture and fixtures |
15 years | |
| Leasehold improvements |
Lesser of lease term or 15 years |
Upon retirement or other disposal of property, plant and equipment, the cost and related amount of accumulated depreciation are removed from the asset and accumulated depreciation accounts, respectively. The difference, if any, between the net asset value and the proceeds is included in comprehensive loss.
Capitalized Software Development Costs
Certain costs to obtain internal use software for significant systems projects are capitalized and amortized over the estimated useful life of the software, which ranges from 3 to 5 years. Costs to obtain software for projects that are not significant are expensed as incurred. Capitalized software development costs, net of accumulated amortization, were $2.4 million and $1.5 million at December 31, 2014 and 2013, respectively. Approximately $1.7 million and $0.7 million of software development costs were capitalized in the years ended December 31, 2014 and 2013, respectively. Amortization expense related to the capitalized software was $0.7 million, $1.5 million and $1.5 million for the years ended December 31, 2014, 2013 and 2012, respectively.
Goodwill, Intangibles and Long-Lived Assets
Goodwill is not amortized, but is instead tested for impairment at least annually and whenever events or circumstances indicate that it is more likely than not that they may be impaired. The Company has elected to perform the annual test for goodwill impairment as of October 31 of each year.
In performing tests for goodwill impairment, the Company is first permitted to perform a qualitative assessment about the likelihood of the carrying value of a reporting unit exceeding its fair value. If the Company determines that it is more likely than not that the fair value of a reporting unit is less than its carrying amount based on the qualitative assessment, it is required to perform the two-step goodwill impairment test described below to identify the potential goodwill impairment and measure the amount of the goodwill impairment loss, if
F-14
Table of Contents
any, to be recognized for that reporting unit. However, if the Company concludes otherwise based on the qualitative assessment, the two-step goodwill impairment test is not required. The option to perform the qualitative assessment is not an accounting policy election and can be utilized at the Company’s discretion. Further, the qualitative assessment need not be applied to all reporting units in a given goodwill impairment test. For an individual reporting unit, if the Company elects not to perform the qualitative assessment, or if the qualitative assessment indicates that it is more likely than not that the fair value of a reporting unit is less than its carrying amount, then the Company must perform the two-step goodwill impairment test for the reporting unit. If the implied fair value of goodwill is less than the carrying value, then an impairment charge would be recorded.
In performing the annual goodwill impairment test in 2014 and 2013, the Company bypassed the option to perform a qualitative assessment and proceeded directly to performing the first step of the two-step goodwill impairment test.
The Company calculates the fair value of its reporting units using the income approach, which utilizes discounted forecasted future cash flows, and the market approach which utilizes fair value multiples of comparable publicly traded companies. The discounted cash flows are based on the Company’s most recent long-term financial projections and are discounted using a risk adjusted rate of return, which is determined using estimates of market participant risk-adjusted weighted average costs of capital and reflects the risks associated with achieving future cash flows. The market approach is calculated using the guideline company method, where the Company uses market multiples derived from stock prices of companies engaged in the same or similar lines of business. There is not a quoted market price for the Company’s reporting units or the company as a whole, therefore, a combination of the two methods is utilized to derive the fair value of the business. The Company evaluated and weighed the results of these approaches as well as ensures it understands the basis of the results of these two methodologies. The Company believes the use of these two methodologies ensures a consistent and supportable method of determining its fair value that is consistent with the objective of measuring fair value. If the fair value were to decline, then the Company may be required to incur material charges relating to the impairment of those assets. The Company completed its required annual impairment test for goodwill in the fourth quarter of 2014, 2013 and 2012 and determined that at each of those periods, the Company’s fair value was substantially in excess of its carrying value. Goodwill is not deductible for tax purposes.
During the first quarter of 2013, the strategic shift in how the Company funds its R&D programs significantly altered the expected future costs and revenues associated with the Company’s agents in development. Accordingly, this action was deemed to be a triggering event for an evaluation of the recoverability of the Company’s goodwill as of March 31, 2013. The Company performed an interim impairment test and determined that there was no impairment of goodwill as of March 31, 2013.
The Company tests intangible and long-lived assets for recoverability whenever events or changes in circumstances suggest that the carrying value of an asset or group of assets may not be recoverable. The Company measures the recoverability of assets to be held and used by comparing the carrying amount of the asset to future undiscounted net cash flows expected to be generated by the asset. If those assets are considered to be impaired, the impairment equals the amount by which the carrying amount of the assets exceeds the fair value of the assets. Any impairments are recorded as permanent reductions in the carrying amount of the assets. Long-lived assets, other than goodwill and other intangible assets, that are held for sale are recorded at the lower of the carrying value or the fair market value less the estimated cost to sell.
In the first quarter of 2012, the Company reviewed the estimated useful life of its Cardiolite trademark as a result of a triggering event. Utilizing the most recent forecasted revenue data, the Company revised the estimate of the remaining useful life of the Cardiolite trademark to five years. The Company monitors the recoverability of its branded Cardiolite trademark intangible asset due to the ongoing generic competition based on actual results and existing estimates of future undiscounted cash flows associated with the branded Cardiolite product. As of December 31, 2013, the Company conducted, using its revised sales forecast, an impairment analysis and concluded that the estimate of future undiscounted cash flows associated with the Cardiolite trademark intangible
F-15
Table of Contents
did not exceed the carrying amount of the asset totaling $19.2 million and therefore, the asset has been written down to its fair value. Fair value was calculated by utilizing Level 3 inputs in the relief-from-royalty method, an income-based approach. As a result of this analysis, the Company recorded an impairment charge of $15.4 million to adjust the carrying value to its fair value of $3.8 million. This expense was recorded within cost of goods sold in the accompanying consolidated statement of comprehensive loss in the fourth quarter of 2013.
In the third quarter of 2013, the Company was in negotiations with a new distributor for the sale of certain products within certain international markets. This agreement was signed in October 2013 and as a result the Company did not renew the agreements with its former distributors in these international markets. The Company determined the customer relationship intangible related to these former distributors was no longer recoverable and recorded an impairment charge of $1.0 million in the third quarter of 2013. In the fourth quarter of 2013, the Company updated its strategic plan to reflect the non-renewal of these agreements and the uncertainty in the timing of product availability in this region. As a result, the Company reviewed the recoverability of certain of its customer relationship intangible assets in the International segment that were impacted by the Company’s revised strategic plan. The Company conducted an impairment analysis and concluded that the estimate of future undiscounted cash flows associated with the customer relationship intangible asset did not exceed the carrying amount of the asset and therefore, the asset would need to be written down to its fair value. In order to calculate the fair value of the acquired customer relationship intangible assets, the Company utilized Level 3 inputs to estimate the future discounted cash flows associated with remaining customers and as a result of this analysis, recorded an impairment charge of $0.7 million in the fourth quarter of 2013. These impairment charges were recorded within cost of goods sold in the accompanying consolidated statement of comprehensive loss.
During the third quarter of 2013, the Company committed to a plan to sell certain of its excess land in the U.S. segment, which had a carrying value of $7.5 million. This event qualified for held for sale accounting and the excess land was written down to its fair value, less estimated costs to sell. The fair value was estimated utilizing Level 3 inputs and using a market approach, based on available data for transactions in the region, discussions with real estate brokers and the asking price of comparable properties in its principal market. This resulted in a loss of $6.4 million, which is included within operating loss as impairment of land in the accompanying consolidated statement of comprehensive loss. During the fourth quarter of 2013, the Company sold the excess land for net proceeds of $1.1 million.
Fixed assets dedicated to R&D activities, which were impacted by the March 2013 R&D strategic shift, have a carrying value of $4.5 million as of December 31, 2014. The Company believes these fixed assets will be utilized for either internally funded ongoing R&D activities or R&D activities funded by a strategic partner. If the Company is not successful in finding a strategic partner, and there are no alternative uses for those fixed assets, they could be subject to impairment in the future.
The Company also tested certain long-lived assets utilized in the manufacturing of certain products in the U.S. for recoverability as of December 31, 2013, due to a change in the Company’s contract to manufacture Quadramet. The analysis indicated that there was no impairment as of December 31, 2013. The Company also evaluated the remaining useful lives of these long-lived assets that were tested for recoverability at December 31, 2013 and determined no revisions were required to the remaining periods of depreciation.
In the fourth quarter of 2014, the Company tested certain long-lived and intangible assets, associated with its U.S. operations, for recoverability as a result of the expiration of an agreement with a customer. The analysis indicated that there was no impairment as of December 31, 2014. The Company also evaluated the remaining useful lives of the long-lived and intangible assets that were tested for recoverability at December 31, 2014 and determined no revisions were required to the remaining periods of depreciation and amortization.
Intangible assets, consisting of patents, trademarks and customer relationships related to the Company’s products are amortized in a method equivalent to the estimated utilization of the economic benefit of the asset. Trademarks and patents are amortized on a straight-line basis, and customer relationships are amortized on an accelerated basis.
F-16
Table of Contents
Deferred Financing Costs
Deferred financing costs are capitalized and amortized to interest expense using the effective interest method. As of December 31, 2014 and 2013, the unamortized deferred financing costs were $7.3 million and $9.6 million, respectively. The expense associated with the amortization of deferred financing costs was $2.5 million, $2.4 million and $2.2 million for the years ended December 31, 2014, 2013 and 2012, respectively, and was included in interest expense. In connection with the Facility, the Company wrote off $0.6 million of the existing unamortized deferred financing costs related to the previous facility, which is included in interest expense in the accompanying consolidated statements of comprehensive loss during the year ended December 31, 2013.
Contingencies
In the normal course of business, the Company is subject to loss contingencies, such as legal proceedings and claims arising out of its business, that cover a wide range of matters, including, among others, product and environmental liability. The Company records accruals for those loss contingencies when it is probable that a liability will be incurred and the amount of loss can be reasonably estimated. The Company does not recognize gain contingencies until realized.
Fair Value of Financial Instruments
The estimated fair values of the Company’s financial instruments, including its cash and cash equivalents, receivables, accounts payable and accrued expenses approximate the carrying values of these instruments due to their short term nature. Assets measured at fair value on a nonrecurring basis include long-lived assets held for sale and certain intangible assets. The estimated fair value of the debt, at December 31, 2014, based on Level 2 inputs of recent market activity available to the Company was $384.0 million compared to the face value of $400.0 million. At December 31, 2013, the estimated fair value of the debt based on Level 2 inputs of recent market activity available to the Company was $356.0 million compared to the face value of $400.0 million.
Shipping and Handling Revenues and Costs
The Company typically does not charge customers for shipping and handling costs, but any shipping and handling costs charged to customers are included in revenues. Shipping and handling costs are included in cost of goods sold and were $19.4 million, $20.5 million and $20.4 million for the years ended December 31, 2014, 2013 and 2012, respectively.
Advertising and Promotion Costs
Advertising and promotion costs are expensed as incurred and totaled $2.8 million, $2.7 million and $3.2 million for the years ended December 31, 2014, 2013 and 2012, respectively, and are included in sales and marketing expenses.
Research and Development
Research and development costs are expensed as incurred and relate primarily to the development of new products to add to the Company’s portfolio and costs related to its medical affairs and medical information functions. Nonrefundable advance payments for goods or services that will be used or rendered for future research and development activities are deferred and recognized as an expense as the goods are delivered or the related services are performed.
F-17
Table of Contents
Foreign Currency
The consolidated statements of comprehensive loss of the Company’s foreign subsidiaries are translated into U.S. Dollars using average exchange rates. The net assets of the Company’s foreign subsidiaries are translated into U.S. Dollars using the end of period exchange rates. The impact from translating the net assets of these subsidiaries at changing rates are recorded in the foreign currency translation adjustment account, which is included in consolidated accumulated other comprehensive loss.
For the years ended December 31, 2014, 2013 and 2012, losses arising from foreign currency transactions totaled approximately $0.3 million, $0.3 million and $0.6 million, respectively. Transaction gains and losses are reported as a component of other income (expense), net.
Stock-Based Compensation
The Company’s stock-based compensation cost is measured at the grant date of the stock-based award based on the fair value of the award and is recognized as expense over the requisite service period, which generally represents the vesting period, and includes an estimate of the awards that will be forfeited. The Company uses the Black-Scholes valuation model for estimating the fair value of stock options. The fair value of stock option awards is affected by the valuation assumptions, including the estimated fair value of the Company’s common stock, the expected volatility based on comparable market participants, expected term of the option, risk-free interest rate and expected dividends. When a contingent cash settlement of vested options becomes probable, the Company reclassifies its vested awards to a liability and accounts for any incremental compensation cost in the period in which the settlement becomes probable.
Treasury Stock
The Company accounts for repurchases of common stock using the cost method with common stock held in treasury classified as a reduction of stockholders’ deficit in its consolidated balance sheets. Shares re-issued out of treasury are recorded based on a last-in first-out method.
Accumulated Other Comprehensive Loss
Comprehensive loss is comprised of net loss, plus all changes in equity of a business enterprise during a period from transactions and other events and circumstances from non-owner sources, including any foreign currency translation adjustments. These changes in equity are recorded as adjustments to accumulated other comprehensive loss in the Company’s consolidated balance sheet. The components of accumulated other comprehensive loss consist of foreign currency translation adjustments.
Asset Retirement Obligations
The Company’s compliance with federal, state, local and foreign environmental laws and regulations may require it to remove or mitigate the effects of the disposal or release of chemical substances in jurisdictions where it does business or maintains properties. The Company establishes accruals when those costs are legally obligated and probable and can be reasonably estimated. Accrual amounts are estimated based on currently available information, regulatory requirements, remediation strategies, historical experience, the relative shares of the total remediation costs and a relevant discount rate, when the time periods of estimated costs can be reasonably predicted. Changes in these assumptions could impact the Company’s future reported results. The amounts recorded for asset retirement obligations in the accompanying balance sheets at December 31, 2014 and 2013 were $7.4 million and $6.4 million, respectively.
Self Insurance Reserves
The Company’s consolidated balance sheet at both December 31, 2014 and 2013 includes approximately $0.4 million of accrued liabilities associated with employee medical costs that are retained by the Company. The Company estimates the required liability of those claims on an undiscounted basis based upon various
F-18
Table of Contents
assumptions which include, but are not limited to, the Company’s historical loss experience and projected loss development factors. The required liability is also subject to adjustment in the future based upon changes in claims experience, including changes in the number of incidents (frequency) and change in the ultimate cost per incident (severity). The Company also maintains a separate cash account to fund these medical claims and must maintain a minimum balance as determined by the plan administrator. The balance of this restricted cash account was approximately $0.1 million and $0.2 million at December 31, 2014 and 2013, respectively, and is included in other current assets.
Recent Accounting Standards
In July 2013, the Financial Accounting Standards Board, or the FASB, issued Accounting Standards Update, or ASU, No. 2013-11, “Presentation of an Unrecognized Tax Benefit When a Net Operating Loss Carryforward, a Similar Tax Loss, or a Tax Credit Carryforward Exists,” or ASU 2013-11. The amendments in ASU 2013-11 provide guidance on the financial statement presentation of unrecognized tax benefits when a net operating loss carryforward, a similar tax loss, or a tax credit carryforward exists. ASU 2013-11 is effective for fiscal years, and interim periods within those years, beginning after December 15, 2013. The amendments did not have a material impact on the Company’s financial position, results of operations or cash flows.
In April 2014, the FASB issued ASU No. 2014-08, “Presentation of Financial Statements (Topic 205) and Property, Plant, and Equipment (Topic 360): Reporting Discontinued Operations and Disclosures of Disposals of Components of an Entity,” or ASU 2014-08. The amendments in ASU 2014-08 change the criteria for reporting discontinued operations while enhancing disclosures in this area. The new guidance requires expanded disclosures about discontinued operations that will provide financial statement users with more information about the assets, liabilities, income, and expenses of discontinued operations. The new guidance also requires disclosure of the pre-tax income attributable to a disposal of a significant part of an organization that does not qualify for discontinued operations reporting. The amendments in the ASU are effective in the first quarter of 2015 for public companies with calendar year ends. Early adoption is permitted. The Company does not anticipate this ASU will have a material impact to the Company’s financial position, results of operations or cash flows.
In May 2014, the FASB issued ASU No. 2014-09, “Revenue from Contracts with Customers (Topic 606)” or ASU 2014-09. ASU 2014-09 supersedes nearly all existing revenue recognition guidance under U.S. GAAP. The core principle of ASU 2014-09 is to recognize revenues when promised goods or services are transferred to customers in an amount that reflects the consideration that is expected to be received for those goods or services. ASU 2014-09 defines a five step process to achieve this core principle and, in doing so, it is possible more judgment and estimates may be required within the revenue recognition process than required under existing U.S. GAAP including identifying performance obligations in the contract, estimating the amount of variable consideration to include in the transaction price and allocating the transaction price to each separate performance obligation. The amendments in ASU No. 2014-09 are effective for annual reporting periods beginning after December 15, 2016, including interim periods within that reporting period. Early application is not permitted. The Company is currently evaluating the impact this ASU will have on the Company’s financial position, results of operations and cash flows.
In June 2014, the FASB issued ASU No. 2014-12, “Compensation—Stock Compensation (Topic 718)” or ASU 2014-12. ASU 2014-12 requires that a performance target that affects vesting and could be achieved after the requisite service period be treated as a performance condition. The amendments in ASU 2014-12 are effective for annual reporting periods beginning after December 15, 2015, including interim periods within that reporting period. The Company does not anticipate this ASU will have a material impact to the Company’s financial position, results of operations or cash flows.
In August 2014, the FASB issued ASU No. 2014-15, “Presentation of Financial Statements-Going Concern (Subtopic 205-4): Disclosure of Uncertainties about an Entity’s Ability to Continue as a Going Concern” or ASU
2014-15. ASU 2014-15 to provide guidance on management’s responsibility in evaluating whether there is
F-19
Table of Contents
substantial doubt about a company’s ability to continue as a going concern and to provide related footnote disclosures. The amendments in ASU 2014-15 are effective for annual reporting periods ending after December 15, 2016. Early adoption is permitted. The Company does not anticipate this ASU will have a material impact to the Company’s financial position, results of operations or cash flows.
3. Financial Instruments and Fair Value Measurements
Fair value is defined as the price that would be received to sell an asset or paid to transfer a liability in an orderly transaction between market participants at the measurement date. In order to increase consistency and comparability in fair value measurements, financial instruments are categorized based on a hierarchy that prioritizes observable and unobservable inputs used to measure fair value into three broad levels, which are described below:
Level 1—Inputs are unadjusted quoted prices in active markets for identical assets or liabilities that the Company has the ability to access at the measurement date.
Level 2—Inputs include quoted prices for similar assets and liabilities in active markets, quoted prices for identical or similar assets or liabilities in markets that are not active, inputs other than quoted prices that are observable for the asset or liability (i.e., interest rates, yield curves, etc.) and inputs that are derived principally from or corroborated by observable market data by correlation or other means (market corroborated inputs).
Level 3—Unobservable inputs that reflect a Company’s estimates about the assumptions that market participants would use in pricing the asset or liability. The Company develops these inputs based on the best information available, including its own data.
At December 31, 2014 and 2013, the Company’s financial assets that are measured at fair value on a recurring basis are comprised of money market securities and are classified as cash equivalents. The Company invests excess cash from its operating cash accounts in overnight investments and reflects these amounts in cash and cash equivalents on the consolidated balance sheet using quoted prices in active markets for identical assets (Level 1).
The tables below present information about the Company’s assets and liabilities that are measured at fair value on a recurring basis as of December 31, 2014 and 2013:
| (in thousands) |
Total fair value at December 31, 2014 |
Quoted prices in active markets (Level 1) |
Significant other observable inputs (Level 2) |
Significant unobservable inputs (Level 3) |
||||||||||||
| Money market |
$ | 2,737 | $ | 2,737 | $ | — | $ | — | ||||||||
| Certificates of deposit—restricted |
89 | — | 89 | — | ||||||||||||
|
|
|
|
|
|
|
|
|
|||||||||
| $ | 2,826 | $ | 2,737 | $ | 89 | $ | — | |||||||||
|
|
|
|
|
|
|
|
|
|||||||||
| (in thousands) |
Total fair value at December 31, 2013 |
Quoted prices in active markets (Level 1) |
Significant other observable inputs (Level 2) |
Significant unobservable inputs (Level 3) |
||||||||||||
| Money market |
$ | 2,454 | $ | 2,454 | $ | — | $ | — | ||||||||
| Certificates of deposit—restricted |
322 | — | 322 | — | ||||||||||||
|
|
|
|
|
|
|
|
|
|||||||||
| $ | 2,776 | $ | 2,454 | $ | 322 | $ | — | |||||||||
|
|
|
|
|
|
|
|
|
|||||||||
At December 31, 2013, the Company had a $0.2 million certificate of deposit for which the Company’s use of such cash was restricted and is included in the line item “Certificates of deposit—restricted” above. This
F-20
Table of Contents
investment was classified in other current assets on the consolidated balance sheet and was redeemed during the quarter ended September 30, 2014. The remaining $0.1 million at both December 31, 2014 and 2013, represents a certificate of deposit that is collateral for a long-term lease and is included in other long-term assets on the consolidated balance sheet. Certificates of deposit are classified within Level 2 of the fair value hierarchy, as these are not traded on the open market.
At December 31, 2014, the Company had total cash and cash equivalents of $19.7 million, which included approximately $2.7 million of money market funds and $17.0 million of cash on-hand. At December 31, 2013, the Company had total cash and cash equivalents of $18.6 million, which included approximately $2.5 million of money market funds and $16.1 million of cash on-hand.
The table below presents information about the Company’s assets and liabilities that are measured at fair value on a nonrecurring basis during the year ended December 31, 2013, due to the remeasurement of assets resulting in impairment charges.
| Year ended December 31, 2013 (in thousands) |
Total fair value |
Quoted prices in active markets (Level 1) |
Significant other observable inputs (Level 2) |
Significant unobservable inputs (Level 3) |
||||||||||||
| Cardiolite trademark |
$ | 3,800 | $ | — | $ | — | $ | 3,800 | ||||||||
| Customer relationships |
— | — | — | — | ||||||||||||
|
|
|
|
|
|
|
|
|
|||||||||
| Total |
$ | 3,800 | $ | — | $ | — | $ | 3,800 | ||||||||
|
|
|
|
|
|
|
|
|
|||||||||
During the third quarter of 2013, the Company recorded an impairment charge of $6.4 million to write down the carrying value of excess land held for sale in the U.S. segment totaling $7.5 million to its fair value, less estimated costs to sell. See Note 6 for further discussion regarding the impairment charge. The fair value of land held for sale was determined using Level 3 inputs and was estimated using a market approach, based on available data for transactions in the region, discussions with real estate brokers and the asking price of comparable properties in its principal market. Unobservable inputs obtained from third parties are adjusted as necessary for the condition and attributes of the specific asset. The land sale was completed in the fourth quarter of 2013.
During the third and fourth quarters of 2013, the Company recorded an impairment charge of $1.0 million and $0.7 million, respectively, to write down the carrying value of a customer relationship intangible asset in the International segment totaling $1.8 million and $0.7 million, respectively, to its fair value of zero. See Note 8 for further discussion regarding the impairment charge. The determination of the customer relationship intangible assets impairment charge was based on Level 3 measurements under the fair value hierarchy. The Company utilized an income approach to calculate the discounted cash flows that would be generated by its remaining customer base. The unobservable inputs utilized by the Company included management’s assumptions regarding future revenues and profitability from the remaining customers and a discount rate of 15% as of September 30, 2013 and December 31, 2013, respectively.
During the fourth quarter of 2013, the Company recorded an impairment charge of $15.4 million to write down the Cardiolite trademark intangible asset in the U.S. segment totaling $19.2 million to its fair value of $3.8 million. See Note 8 for further discussion regarding the impairment charge. The fair value measurements were determined using a relief-from-royalty method, which incorporates unobservable inputs, thereby classifying the fair value measurements as a Level 3 measurement within the fair value hierarchy. The primary inputs used in the relief-from-royalty method, an income-based approach, included estimated prospective cash flows expected to be generated by Cardiolite and an estimated royalty rate that would be used by a market participant. The unobservable inputs utilized by the Company included management’s assumptions regarding future revenues and profitability from the branded Cardiolite product, a royalty rate of 6%, a discount rate of 15% and a life of 15 years.
F-21
Table of Contents
4. Income Taxes
The components of loss before income taxes for the years ended December 31 were:
| (in thousands) |
2014 | 2013 | 2012 | |||||||||
| United States |
$ | 2,201 | $ | (57,970 | ) | $ | (43,868 | ) | ||||
| International |
(4,567 | ) | (2,571 | ) | 1,312 | |||||||
|
|
|
|
|
|
|
|||||||
| $ | (2,366 | ) | $ | (60,541 | ) | $ | (42,556 | ) | ||||
|
|
|
|
|
|
|
|||||||
The provision (benefit) for income taxes as of December 31 was:
| (in thousands) |
2014 | 2013 | 2012 | |||||||||
| Current |
||||||||||||
| Federal |
$ | (208 | ) | $ | (782 | ) | $ | (3,508 | ) | |||
| State |
1,285 | 1,712 | 2,763 | |||||||||
| International |
325 | 356 | 618 | |||||||||
|
|
|
|
|
|
|
|||||||
| 1,402 | 1,286 | (127 | ) | |||||||||
|
|
|
|
|
|
|
|||||||
| Deferred |
||||||||||||
| Federal |
(277 | ) | — | 200 | ||||||||
| State |
— | — | — | |||||||||
| International |
70 | (272 | ) | (628 | ) | |||||||
|
|
|
|
|
|
|
|||||||
| (207 | ) | (272 | ) | (428 | ) | |||||||
|
|
|
|
|
|
|
|||||||
| $ | 1,195 | $ | 1,014 | $ | (555 | ) | ||||||
|
|
|
|
|
|
|
|||||||
The Company’s provision (benefit) for income taxes in the years ended December 31, 2014, 2013 and 2012 was different from the amount computed by applying the statutory U.S. Federal income tax rate to loss from operations before income taxes, as a result of the following:
| (in thousands) |
2014 | 2013 | 2012 | |||||||||||||||||||||
| U.S. statutory rate |
$ | (828 | ) | 35.0 | % | $ | (21,181 | ) | 35.0 | % | $ | (14,895 | ) | 35.0 | % | |||||||||
| Permanent items and foreign tax credits |
149 | (6.3 | )% | 292 | (0.5 | )% | (1,200 | ) | 2.8 | % | ||||||||||||||
| Uncertain tax positions |
817 | (34.5 | )% | 809 | (1.3 | )% | 892 | (2.1 | )% | |||||||||||||||
| Research credits |
(1,204 | ) | 50.9 | % | (1,346 | ) | 2.2 | % | — | — | ||||||||||||||
| State and local taxes |
234 | (9.9 | )% | (1,780 | ) | 3.0 | % | (1,821 | ) | 4.3 | % | |||||||||||||
| Impact of rate change on deferred taxes |
61 | (2.6 | )% | 31 | (0.1 | )% | (974 | ) | 2.3 | % | ||||||||||||||
| True-up of prior year tax |
1,065 | (45.0 | )% | (1,465 | ) | 2.4 | % | (2,345 | ) | 5.5 | % | |||||||||||||
| Foreign tax rate differential |
437 | (18.5 | )% | 92 | (0.2 | )% | (455 | ) | 1.1 | % | ||||||||||||||
| Valuation allowance |
958 | (40.5 | )% | 25,631 | (42.3 | )% | 20,243 | (47.6 | )% | |||||||||||||||
| Tax on repatriation |
(500 | ) | 21.1 | % | (18 | ) | 0.0 | % | — | — | ||||||||||||||
| Other |
6 | (0.2 | )% | (51 | ) | 0.1 | % | — | — | |||||||||||||||
|
|
|
|
|
|
|
|||||||||||||||||||
| $ | 1,195 | (50.5 | )% | $ | 1,014 | (1.7 | )% | $ | (555 | ) | 1.3 | % | ||||||||||||
|
|
|
|
|
|
|
|||||||||||||||||||
F-22
Table of Contents
The components of deferred income tax assets (liabilities) at December 31 were:
| (in thousands) |
2014 | 2013 | ||||||
| Deferred Tax Assets |
||||||||
| Federal benefit of state tax liabilities |
$ | 10,950 | $ | 11,541 | ||||
| Reserves, accruals and other |
38,285 | 29,242 | ||||||
| Capitalized research and development |
26,471 | 30,057 | ||||||
| Capital loss carryforward |
— | 2,309 | ||||||
| Amortization of intangibles other than goodwill |
36,523 | 52,665 | ||||||
| Net operating loss carryforwards |
46,843 | 34,209 | ||||||
|
|
|
|
|
|||||
| Deferred tax assets |
159,072 | 160,023 | ||||||
|
|
|
|
|
|||||
| Deferred Tax Liabilities |
||||||||
| Reserves, accruals and other |
(642 | ) | (500 | ) | ||||
| Customer relationships |
(6,012 | ) | (7,860 | ) | ||||
| Depreciation |
(95 | ) | (360 | ) | ||||
|
|
|
|
|
|||||
| Deferred tax liability |
(6,749 | ) | (8,720 | ) | ||||
| Less: Valuation allowance |
(152,138 | ) | (151,339 | ) | ||||
|
|
|
|
|
|||||
| $ | 185 | $ | (36 | ) | ||||
|
|
|
|
|
|||||
| 2014 | 2013 | |||||||
| Recorded in the accompanying consolidated balance sheet as: |
||||||||
| Current deferred tax assets |
$ | 256 | $ | 18 | ||||
| Current deferred tax liabilities |
(152 | ) | (57 | ) | ||||
| Noncurrent deferred tax assets |
328 | 15 | ||||||
| Noncurrent deferred tax liability |
(247 | ) | (12 | ) | ||||
|
|
|
|
|
|||||
| Net deferred tax liabilities |
$ | 185 | $ | (36 | ) | |||
|
|
|
|
|
|||||
The Company files separate federal income tax returns for Holdings, Lantheus Intermediate, and LMI, and its subsidiaries.
A reconciliation of the Company’s changes in uncertain tax positions for 2014, 2013 and 2012 is as follows:
| (in thousands) |
||||
| Beginning balance of uncertain tax positions as of January 1, 2012 |
$ | 16,253 | ||
| Additions related to current year tax positions |
301 | |||
| Reductions related to prior year tax positions |
— | |||
| Settlements |
(651 | ) | ||
| Lapse of statute of limitations |
(1,122 | ) | ||
|
|
|
|||
| Balance of uncertain tax positions as of December 31, 2012 |
14,781 | |||
| Additions related to current year tax positions |
18 | |||
| Reductions related to prior year tax positions |
— | |||
| Settlements |
(34 | ) | ||
| Lapse of statute of limitations |
(763 | ) | ||
|
|
|
|||
| Balance of uncertain tax positions as of December 31, 2013 |
14,002 | |||
| Additions related to current year tax positions |
— | |||
| Reductions related to prior year tax positions |
(8 | ) | ||
| Settlements |
(1,434 | ) | ||
| Lapse of statute of limitations |
(416 | ) | ||
|
|
|
|||
| Balance of uncertain tax positions as of December 31, 2014 |
$ | 12,144 | ||
|
|
|
|||
F-23
Table of Contents
As of December 31, 2014 and 2013, the total amount of unrecognized tax benefits was $12.1 million and $14.0 million, respectively, all of which would affect the effective tax rate, if recognized. These amounts are primarily associated with domestic state tax issues, such as the allocation of income among various state tax jurisdictions and transfer pricing. Since the Company operates in a number of countries in which it has income tax treaties, it believes that it is more-likely-than-not that the Company should be able to receive competent authority relief for potential adjustments in those countries. Included in the Company’s uncertain tax positions for transfer pricing exposures are $0.5 million, which is reflected within other long-term liabilities, and an offset of $0.2 million for expected competent authority relief, which is reflected in other long-term assets. The tabular rollforward reflected above is net of the $0.2 million of competent authority relief as of December 31, 2014. Within the next twelve months, unrecognized tax benefits of $0.5 million may be recognized associated with transfer pricing due to the closing of the statute of limitations.
As of December 31, 2014 and 2013, total liabilities for tax obligations and associated interest and penalties were $33.2 million and $35.8 million, respectively, consisting of income tax provisions for uncertain tax benefits of $12.4 million and $15.0 million, interest accruals of $18.6 million and $18.2 million and penalty accruals of $2.2 million and $2.6 million, respectively, which were included in other long-term liabilities on the consolidated balance sheets. Included in the 2014, 2013 and 2012 tax provision is $1.2 million, $1.9 million and $2.6 million, respectively, relating to interest and penalties, net of benefits for reversals of uncertain tax position interest and penalties recognized upon the lapse of statute of limitations.
In accordance with the Company’s acquisition of the medical imaging business from Bristol Myers Squibb (“BMS”) in 2008, the Company obtained a tax indemnification agreement with BMS related to certain tax obligations arising prior to the acquisition of the Company, for which the Company has the primary legal obligation. The tax indemnification receivable is recognized within other noncurrent assets. The total noncurrent asset related to the indemnification was $17.8 million and $19.7 million as of December 31, 2014 and 2013, respectively. The changes in the tax indemnification asset are recognized within other income (expense), net in the consolidated statement of comprehensive loss. In accordance with the Company’s accounting policy, the change in the tax liability and penalties and interest associated with these obligations (net of any offsetting federal or state benefit) is recognized within the tax provision. Accordingly, as these reserves change, adjustments are included in the tax provision while the offsetting adjustment is included in other income (expense), net. Assuming that the receivable from BMS continues to be considered recoverable by the Company, there is no net effect on earnings related to these liabilities and no net cash outflows.
During the year ended December 31, 2014 and 2012, BMS, on behalf of the Company, made payments totaling $6.3 million and $0.7 million, respectively, to a number of states in connection with prior year state income tax filings. As a result of these payments, the amount due from BMS, included within other long-term assets, decreased by $2.9 million and $0.7 million, respectively, which represented the release of asset balances associated with pre-acquisition years. There were no payments made on behalf of the Company in 2013.
Included in other income (expense), net for the year ended December 31, 2014, is an expense of $1.1 million relating to the reduction in the indemnification receivable from BMS associated with the expiration of statute of limitations and income of $1.9 million relating to the increase in the indemnification receivable for current year interest and penalties.
The Company has generated domestic pre-tax losses in the past three years. This loss history demonstrates negative evidence concerning the Company’s ability to utilize its domestic gross deferred tax assets. In order to overcome the presumption of recording a valuation allowance against the deferred tax assets, the Company must have sufficient positive evidence that it can generate sufficient taxable income to utilize these deferred tax assets within the carryover or forecast period. Although the Company has no history of expiring net operating losses or other tax attributes, based on the cumulative domestic loss incurred over the three-year period ended December 31, 2014, management determined that the net U.S. deferred tax assets are not more-likely-than-not recoverable. As a result of this analysis, the Company continues to maintain a full valuation allowance primarily against its net U.S. deferred tax assets in the amount of $152.1 million and $151.3 million at December 31, 2014 and 2013, respectively.
F-24
Table of Contents
The following is a reconciliation of the Company’s valuation allowance for the years ending December 31, 2014, 2013, and 2012.
| (in thousands) |
||||
| Balance at January 1, 2012 |
$ | 105,539 | ||
| Charged to provision for income taxes |
20,243 | |||
| Deductions |
— | |||
|
|
|
|||
| Balance at December 31, 2012 |
125,782 | |||
| Charged to provision for income taxes |
25,557 | |||
| Deductions |
— | |||
|
|
|
|||
| Balance at December 31, 2013 |
151,339 | |||
| Charged to provision for income taxes |
958 | |||
| Foreign currency |
(159 | ) | ||
| Deductions |
— | |||
|
|
|
|||
| Balance at December 31, 2014 |
$ | 152,138 | ||
|
|
|
|||
The Company’s U.S. income tax returns remain subject to examination for three years. The state income tax returns remain subject to examination for three to four years depending on the state’s statute of limitations.
At December 31, 2014, the Company has federal net operating loss carryovers of $126.9 million, which will begin to expire in 2031. The Company has $2.4 million of federal research credits, which begin to expire in 2029. The Company has foreign tax credits of approximately $4.7 million that will begin to expire in 2020. The Company has state research credits of $2.8 million, which will expire between 2024 and 2029. The Company has Massachusetts investment tax credits of approximately $0.5 million, which have no expiration date.
In 2010, the Company was granted a tax holiday from the Commonwealth of Puerto Rico, which expires on January 1, 2024. This grant provides for a 4% tax rate on activities relating to the operations of the Company’s radiopharmacies. This grant is conditioned upon the Company meeting certain employment and investment thresholds. The impact of this tax holiday was to decrease foreign tax by approximately $0.1 million, $0.3 million and $0.3 million in 2014, 2013 and 2012, respectively.
In September 2013, the Internal Revenue Service released final Tangible Property Regulations (the “Final Regulations”). The Final Regulations provide guidance on applying Section 263(a) of the Code to amounts paid to acquire, produce or improve tangible property, as well as rules for materials and supplies (Code Section 162). These regulations contain certain changes from the temporary and proposed tangible property regulations that were issued on December 27, 2011. The Final Regulations are generally effective for taxable years beginning on or after January 1, 2014. In addition, taxpayers are permitted to early adopt the Final Regulations for taxable years beginning on or after January 1, 2012. The Final Regulations did not have a material effect on the Company’s results of operations or financial condition during the year ended December 31, 2014.
5. Inventory
The Company includes within current assets the amount of inventory that is estimated to be utilized within twelve months. Inventory that will be utilized after twelve months is classified within other long-term assets.
F-25
Table of Contents
Inventory, classified in inventory or other long-term assets, consisted of the following:
| (in thousands) |
December 31, 2014 |
December 31, 2013 |
||||||
| Raw materials |
$ | 6,043 | $ | 7,063 | ||||
| Work in process |
1,788 | 5,849 | ||||||
| Finished goods |
7,751 | 5,398 | ||||||
|
|
|
|
|
|||||
| Inventory |
15,582 | 18,310 | ||||||
| Other long-term assets |
1,156 | 1,687 | ||||||
|
|
|
|
|
|||||
| Total |
$ | 16,738 | $ | 19,997 | ||||
|
|
|
|
|
|||||
At December 31, 2014 and 2013, inventories reported as other long-term assets included $1.2 million and $1.7 million of raw materials, respectively.
The Company’s Ablavar product was commercially launched in January 2010. The revenues for this product through December 31, 2014 have not been significant. At December 31, 2014 and 2013, the balances of inventory on- hand reflect approximately $0.9 million and $1.5 million, respectively, of finished products and raw materials related to Ablavar. At December 31, 2013, approximately $0.5 million of Ablavar inventory were included in long-term assets. At December 31, 2014, there was no Ablavar inventory included in long-term assets.
The Company entered into an agreement and subsequent amendments with a supplier to provide Active Pharmaceutical Ingredient (“API”) and finished products for Ablavar under which the Company was required to purchase future minimum quantities. At December 31, 2013, the remaining purchase commitment under the amended agreement was approximately $1.8 million, of which the Company had accrued a loss of $1.3 million associated with this future purchase commitment. At December 31, 2014, there were no remaining purchase commitments. The Company records the inventory when it takes delivery, at which time the Company assumes title and risk of loss.
In 2013, the Company transitioned the sales and marketing efforts for Ablavar from its direct sales force to the Company’s customer service team. During the fourth quarter of 2013, the Company updated its strategic plan, which had a significant impact on the Ablavar sales forecast. The Company performed an inventory reserve analysis using its expected future Ablavar sales and recorded an additional write-down of $1.6 million related to the API that the Company would not be able to convert or be able to sell prior to its expiry as of December 31, 2013. In the event that the Company does not meet its revised sales expectations for Ablavar or cannot sell the product prior to its expiration, the Company could incur additional inventory write-downs.
6. Property, Plant and Equipment, net
Property, plant and equipment consisted of the following at December 31:
| (in thousands) |
2014 | 2013 | ||||||
| Land |
$ | 14,950 | $ | 14,950 | ||||
| Buildings |
67,571 | 65,787 | ||||||
| Machinery, equipment and fixtures |
65,179 | 65,026 | ||||||
| Construction in progress |
9,746 | 8,029 | ||||||
| Accumulated depreciation |
(61,432 | ) | (56,139 | ) | ||||
|
|
|
|
|
|||||
| Property, plant and equipment, net |
$ | 96,014 | $ | 97,653 | ||||
|
|
|
|
|
|||||
Depreciation expense related to property, plant and equipment was $9.9 million, $9.3 million and $9.7 million for the years ended December 31, 2014, 2013 and 2012, respectively.
F-26
Table of Contents
Included within machinery, equipment and fixtures are spare parts of approximately $2.5 million as of December 31, 2014 and 2013, respectively. Spare parts include replacement parts relating to plant and equipment and are either recognized as an expense when consumed or re- classified and capitalized as part of the related plant and equipment and depreciated over a time period not exceeding the useful life of the related asset.
Long-Lived Assets Held for Sale
During the third quarter of 2013, the Company committed to a plan to sell certain of its excess land in the U.S. segment, which had a carrying value of $7.5 million. This event qualified for held for sale accounting and the excess land was written down to its fair value, less estimated costs to sell. The fair value was estimated utilizing Level 3 inputs and using a market approach, based on available data for transactions in the region, discussions with real estate brokers and the asking price of comparable properties in its principal market. This resulted in a loss of $6.4 million, which is included within operating loss as impairment of land in the accompanying consolidated statement of comprehensive loss. During the fourth quarter of 2013, the Company sold the excess land for net proceeds of $1.1 million.
Long-Lived Assets to Be Disposed of Other than by Sale
In November 2014, the Company announced its plans to decommission certain long-lived assets associated with its R&D operations in the United States. The Company expects the decommissioning to begin in the second half of 2015. As a result, the Company revised its estimates of the remaining useful lives of the affected long-lived assets to seven months, which increased depreciation expense by $1.2 million included in R&D expenses in the consolidated statement of comprehensive loss during the quarter ended December 31, 2014. At December 31, 2014, the net book value of these assets totaled $7.4 million.
7. Asset Retirement Obligations
The Company considers the legal obligation to remediate its facilities upon a decommissioning of its radioactive related operations as an asset retirement obligation. The operations of the Company have radioactive production facilities at its North Billerica, Massachusetts and San Juan, Puerto Rico sites.
The Company is required to provide the U.S. Nuclear Regulatory Commission and Massachusetts Department of Public Health financial assurance demonstrating the Company’s ability to fund the decommissioning of the North Billerica, Massachusetts production facility upon closure, although the Company does not intend to close the facility. The Company has provided this financial assurance in the form of a $28.2 million surety bond, which itself is currently secured by an $8.8 million unfunded Standby Letter of Credit provided to the third party issuer of the bond.
The fair value of a liability for asset retirement obligations is recognized in the period in which the liability is incurred. As of December 31, 2014, the liability is measured at the present value of the obligation expected to be incurred, of approximately $26.0 million, and is adjusted in subsequent periods as accretion expense is recorded. The corresponding asset retirement costs are capitalized as part of the carrying value of the related long-lived assets and depreciated over the asset’s useful life.
F-27
Table of Contents
The following is a reconciliation of the Company’s asset retirement obligations for the years ended December 31, 2014, 2013 and 2012:
| (in thousands) |
||||
| Balance at January 1, 2012 |
$ | 4,868 | ||
| Capitalization |
— | |||
| Net decrease due to changes in estimated future cash flows |
(5 | ) | ||
| Accretion expense |
553 | |||
|
|
|
|||
| Balance at December 31, 2012 |
5,416 | |||
| Capitalization |
— | |||
| Net increase due to changes in estimated future cash flows |
341 | |||
| Accretion expense |
628 | |||
|
|
|
|||
| Balance at December 31, 2013 |
6,385 | |||
| Capitalization |
277 | |||
| Accretion expense |
773 | |||
|
|
|
|||
| Balance at December 31, 2014 |
$ | 7,435 | ||
|
|
|
|||
The Company revises the asset retirement obligation as information about material changes to the liability becomes known. During the year ended December 31, 2013, the Company revised the asset retirement obligation, which resulted in an additional asset capitalization, in the amount of $0.3 million.
8. Intangibles, net
Intangibles, net consisted of the following:
| December 31, 2014 | ||||||||||||||||
| (in thousands) |
Cost | Accumulated amortization |
Net | Amortization Method |
||||||||||||
| Trademarks |
$ | 13,540 | $ | 5,116 | $ | 8,424 | Straight-line | |||||||||
| Customer relationships |
105,373 | 88,931 | 16,442 | Accelerated | ||||||||||||
| Other patents |
42,780 | 40,455 | 2,325 | Straight-line | ||||||||||||
|
|
|
|
|
|
|
|||||||||||
| $ | 161,693 | $ | 134,502 | $ | 27,191 | |||||||||||
|
|
|
|
|
|
|
|||||||||||
| December 31, 2013 | ||||||||||||||||
| (in thousands) |
Cost | Accumulated amortization |
Net | Amortization Method |
||||||||||||
| Trademarks |
$ | 13,540 | $ | 3,298 | $ | 10,242 | Straight-line | |||||||||
| Customer relationships |
106,298 | 84,476 | 21,822 | Accelerated | ||||||||||||
| Other patents |
42,780 | 39,846 | 2,934 | Straight-line | ||||||||||||
|
|
|
|
|
|
|
|||||||||||
| $ | 162,618 | $ | 127,620 | $ | 34,998 | |||||||||||
|
|
|
|
|
|
|
|||||||||||
The Company recorded amortization expense for its intangible assets of $7.6 million, $14.4 million and $16.1 million for the years ended December 31, 2014, 2013 and 2012, respectively.
F-28
Table of Contents
Expected future amortization expense related to the intangible assets is as follows (in thousands):
| Years ended December 31, |
||||
| 2015 |
$ | 5,997 | ||
| 2016 |
5,318 | |||
| 2017 |
3,506 | |||
| 2018 |
2,780 | |||
| 2019 |
1,906 | |||
| 2020 and thereafter |
7,684 | |||
|
|
|
|||
| $ | 27,191 | |||
|
|
|
|||
Changes in the gross carrying amount of intangible assets for the year ended December 31, 2014 and 2013, were as follows (in thousands):
| (in thousands) |
||||
| Balance at December 31, 2012 |
$ | 210,170 | ||
| Asset impairment |
(46,592 | ) | ||
| Effect of currency translation |
(960 | ) | ||
|
|
|
|||
| Balance at December 31, 2013 |
162,618 | |||
| Effect of currency translation |
(925 | ) | ||
|
|
|
|||
| Balance at December 31, 2014 |
$ | 161,693 | ||
|
|
|
|||
9. Accrued Expenses and Other Liabilities
Accrued expenses are comprised of the following at December 31:
| (in thousands) |
2014 | 2013 | ||||||
| Compensation and benefits |
$ | 11,198 | $ | 10,209 | ||||
| Accrued interest |
4,994 | 4,989 | ||||||
| Accrued professional fees |
1,508 | 1,361 | ||||||
| Research and development services |
248 | 338 | ||||||
| Freight, distribution and operations |
3,069 | 3,432 | ||||||
| Accrued loss on firm purchase commitment |
— | 1,315 | ||||||
| Marketing expense |
978 | 749 | ||||||
| Accrued rebates, discounts and chargebacks |
2,164 | 1,739 | ||||||
| Other |
420 | 1,360 | ||||||
|
|
|
|
|
|||||
| $ | 24,579 | $ | 25,492 | |||||
|
|
|
|
|
|||||
As of December 31, 2013, the Company had accrued a contract loss of $1.3 million associated with the portion of the committed purchases of Ablavar product from the Company’s supplier that the Company did not believe it would sell prior to expiry. As of December 31, 2014, the accrued contract loss has been reclassified to a reserve against the Ablavar inventory balance, because the Company satisfied the remaining purchase commitments in the first quarter of 2014.
10. Financing Arrangements
On March 21, 2011, LMI issued $150.0 million of New Restricted Notes. The New Restricted Notes were issued at a price of 101.50% and were issued as additional debt securities under the Indenture pursuant to which LMI previously issued in May 2010 $250.0 million in aggregate principal amount of 9.750% Senior Notes due 2017. The New Restricted Notes were issued with the same terms and conditions as the Senior Notes, except that
F-29
Table of Contents
the New Restricted Notes were subject to a separate registration rights agreement. The New Restricted Notes and the Senior Notes, or together, the Notes, vote as one class under the Indenture. As a result of the issuance of the New Restricted Notes, LMI has $400.0 million in aggregate principal amount of Notes outstanding. The Notes bear interest at a rate of 9.750% per year, payable on May 15 and November 15 of each year, beginning May 15, 2011 with respect to the New Restricted Notes. Interest on the Senior Notes accrued from November 15, 2010. The Notes mature on May 15, 2017. The net proceeds of the Senior Notes were used to repay $77.9 million due under LMI’s then outstanding credit agreement to repay a $75.0 million demand note and to repurchase $90.0 million of the outstanding Series A Preferred Stock of Holdings at the accreted value. The net proceeds of the New Restricted Notes were used to fully redeem the balance of the then outstanding Series A Preferred Stock of Holdings at the accreted value of $44.0 million, to pay a $106.0 million dividend to the holders of common stock and to fund dividend equivalent rights granted to holders of Holdings stock options. In conjunction with the issuance of the New Restricted Notes, LMI also made a cash payment of $3.75 million to the then Holders of the Senior Notes in exchange for their consent to amend the Indenture to modify the restricted payments covenant to provide for additional restricted payment capacity in order to accommodate the dividend payment. The premium of $2.25 million and the consent fee of $3.75 million were capitalized and are being amortized over the term of the Notes as an adjustment to interest expense. All of the Notes have been registered with the Securities and Exchange Commission.
Redemption
LMI can redeem the Notes at 100% of the principal amount on May 15, 2016 or thereafter. LMI may also redeem the Notes prior to May 15, 2016 depending on the timing of the redemption during the twelve-month period beginning May 15 of each of the years indicated below:
| Year |
Percentage | |||
| 2014 |
104.875 | % | ||
| 2015 |
102.438 | % | ||
| 2016 |
100.000 | % | ||
Upon a change of control (as defined in the Indenture), LMI will be required to make an offer to purchase each holder’s Note at a price of 101% of the principal amount thereof, plus accrued and unpaid interest, if any, to the date of purchase.
If LMI or its subsidiaries engage in asset sales (as defined in the Indenture), they generally must either invest the net cash proceeds from those sales in that business within a specified period of time, prepay certain indebtedness or make an offer to purchase a principal amount of the Notes equal to the excess net cash proceeds (as defined in the Indenture), subject to certain exceptions.
The Notes are unsecured and are equal in right of payment to all of the existing and future senior debt, including borrowings under its secured credit facilities, subject to the security interest thereof. LMI’s obligations under the Notes are fully and unconditionally guaranteed, jointly and severally, on an unsecured senior basis by Lantheus Intermediate and by one of LMI’s subsidiaries, and the obligations of those guarantors under their guarantees are equal in right of payment to all of their existing and future senior debt.
Revolving Line of Credit
LMI had a Facility with an original aggregate principal amount not to exceed $42.5 million. On June 24, 2014, the Company executed an amendment to the Facility, which (i) increased the committed availability for total borrowings under the Facility from $42.5 million to $50.0 million, (ii) set the interest at LIBOR plus 2.00% or the Reference Rate (as defined in the agreement) plus 1.00%, (iii) set the unused line fee at 0.375%, and (iv) further modified certain definitions. In connection with the amendment, LMI incurred approximately $0.2 million in fees and expenses during the year ended December 31, 2014, which will be amortized on a straight-line basis over the term of the Facility.
F-30
Table of Contents
The Facility expires on the earlier of (i) July 3, 2018, or (ii) if the outstanding Notes are not refinanced in full, the date that is 91 days before the maturity thereof, at which time all outstanding borrowings are due and payable.
As of December 31, 2014 and 2013, the Company has an unfunded Standby Letter of Credit for up to $8.8 million. The unfunded Standby Letter of Credit requires an annual fee, payable quarterly, which is set at LIBOR plus a spread of 2.00% and expires on February 5, 2016, which will automatically renew for a one year period at each anniversary date, unless the Company elects not to renew in writing within 60 days prior to that expiration.
The Facility is secured by a pledge of substantially all of the assets of each of the Company, LMI and Lantheus Real Estate, including each entity’s accounts receivable, inventory and machinery and equipment, and is guaranteed by each of Lantheus Intermediate and Lantheus Real Estate. Borrowing capacity is determined by reference to a Borrowing Base, which is based on a percentage of certain eligible accounts receivable, inventory and machinery and equipment minus any reserves. As of December 31, 2014, the aggregate Borrowing Base was approximately $50.0 million, which was reduced by (i) an outstanding $8.8 million unfunded Standby Letter of Credit and (ii) an $8.0 million outstanding loan balance including interest, resulting in a net Borrowing Base availability of approximately $33.2 million.
Covenants
The Facility is secured by a pledge of substantially all of the assets of each of Lantheus Intermediate, LMI and Lantheus Real Estate, including each entity’s accounts receivable, inventory and machinery and equipment, and is guaranteed by each of Lantheus Intermediate and Lantheus Real Estate. Borrowing capacity is determined by reference to a borrowing base, which is based on (i) a percentage of certain eligible accounts receivable, inventory and machinery and equipment minus (ii) any reserves.
The Facility contains affirmative and negative covenants, as well as restrictions on the ability of Lantheus Intermediate and its subsidiaries to: (i) incur additional indebtedness or issue preferred stock; (ii) repay subordinated indebtedness prior to its stated maturity; (iii) pay dividends on, repurchase or make distributions in respect of capital stock or make other restricted payments; (iv) make certain investments; (v) sell certain assets; (vi) create liens; (vii) consolidate, merge, sell or otherwise dispose of all or substantially all of its assets; and (viii) enter into certain transactions with its affiliates. The Facility also contains customary default provisions as well as cash dominion provisions which allow the lender to sweep its accounts during the period certain specified events of default are continuing under the Facility or excess availability under the New Facility falls below (i) the greater of $5.0 million or 15% of the then-current borrowing base for a period of more than five consecutive Business Days or (ii) $3.5 million. During a cash dominion period, Lantheus Intermediate is required to comply with a consolidated fixed charge coverage ratio of not less than 1:00:1:00. The fixed charge coverage ratio is calculated on a consolidated basis for Lantheus Intermediate and its subsidiaries for a trailing four fiscal quarter period basis, as (i) EBITDA (as defined in the agreement) minus capital expenditures minus certain restricted payments divided by (ii) interest plus taxes paid or payable in cash plus certain restricted payments made in cash plus scheduled principal payments paid or payable in cash.
Financing Costs
During the year ended December 31, 2013, LMI wrote off $0.6 million of the existing unamortized deferred financing costs related to a previous facility, which is included in interest expense in the accompanying consolidated statements of comprehensive loss.
During the years ended December 31, 2014 and 2013, LMI incurred approximately $0.2 million and $1.1 million in fees and expenses, in connection with the Facility and amendments under the previous facility, which are being amortized on a straight-line basis over the term of the Facility.
F-31
Table of Contents
11. Stockholders’ Equity
As of December 31, 2014, the authorized capital stock of the Company consisted of 60,000,000 shares of common stock, par value $0.001 per share, and 2,000,000 shares of preferred stock, par value $0.001 per share. The common stockholders are entitled to one vote per share.
12. Stock-Based Compensation
The Company’s employees are eligible to receive awards under the 2013 Equity Incentive Plan, or the 2013 Plan. The 2013 Plan is administered by the Board of Directors and permits the granting of nonqualified stock options, stock appreciation rights, or SARs, restricted stock, restricted stock units and dividend equivalent rights (“DERs”) to employees, officers, directors and consultants of the Company. The Board of Directors may, at its sole discretion, grant DERs with respect to any award and is treated as a separate award. On August 5, 2013, the Board of Directors adopted a resolution providing that no further grants be made under the 2008 Equity Incentive Plan, or the 2008 Plan. At the same time, the maximum number of shares that may be issued pursuant to awards under the 2013 Plan was increased from 1,500,000 to 2,700,000. Option awards under the 2013 Plan are granted with an exercise price equal to the fair value of the Company’s common stock at the date of grant, as determined by the Board of Directors. Time based option awards vest based on time, either four or five years, and performance based option awards vest based on the performance criteria specified in the grant. All option awards have a ten-year contractual term. The Company recognizes compensation costs for its time based awards on a straight-line basis equal to the vesting period. The compensation cost for performance based awards is recognized on a graded vesting basis, based on the probability of achieving the performance targets over the requisite service period for the entire award. The fair value of each option award is estimated on the date of grant using a Black-Scholes valuation model that uses the assumptions noted in the following table. Expected volatilities are based on the historic volatility of a selected peer group. Expected dividends represent the dividends expected to be issued at the date of grant. The expected term of options represents the period of time that options granted are expected to be outstanding. The risk-free interest rate assumption is the U.S. Treasury rate at the date of the grant which most closely resembles the expected life of the options.
The Company uses the following Black-Scholes inputs to determine the fair value of new stock option grants.
| Years Ended December 31, | ||||||||||||
| 2014 | 2013 | 2012 | ||||||||||
| Expected volatility |
27 - 35 | % | 30 - 37 | % | 36 - 41 | % | ||||||
| Expected dividends |
— | — | — | |||||||||
| Expected life (in years) |
3.1 - 7.0 | 3.6 - 6.3 | 5.5 - 6.5 | |||||||||
| Risk-free interest rate |
1.1 - 2.0 | % | 0.5 - 1.7 | % | 0.7 - 1.4 | % | ||||||
F-32
Table of Contents
A summary of option activity for 2014 is presented below:
| Time Based |
Performance Based |
Total | Weighted Average Exercise Price |
Weighted Average Remaining Contractual Term |
Aggregate Intrinsic Value |
|||||||||||||||||||
| Outstanding at January 1, 2014 |
2,761,037 | 1,097,425 | 3,858,462 | $ | 4.89 | 6.9 | $ | 6,777,000 | ||||||||||||||||
| Options granted |
527,153 | 3,696 | 530,849 | 4.64 | ||||||||||||||||||||
| Options cancelled |
(26,150 | ) | (8,174 | ) | (34,324 | ) | 5.68 | |||||||||||||||||
| Options exercised |
(4,500 | ) | (1,737 | ) | (6,237 | ) | 2.00 | |||||||||||||||||
| Options forfeited and expired |
(35,850 | ) | (10,480 | ) | (46,330 | ) | 7.56 | |||||||||||||||||
|
|
|
|
|
|
|
|||||||||||||||||||
| Outstanding at December 31, 2014 |
3,221,690 | 1,080,730 | 4,302,420 | $ | 4.83 | 6.4 | $ | 3,979,000 | ||||||||||||||||
|
|
|
|
|
|
|
|||||||||||||||||||
| Vested and expected to vest at December 31, 2014 |
3,106,583 | 713,091 | 3,819,674 | $ | 4.61 | 6.1 | $ | 3,979,000 | ||||||||||||||||
|
|
|
|
|
|
|
|||||||||||||||||||
| Exercisable at December 31, 2014 |
1,867,059 | 562,432 | 2,429,491 | $ | 3.66 | 4.6 | $ | 3,979,000 | ||||||||||||||||
|
|
|
|
|
|
|
|||||||||||||||||||
The weighted average grant-date fair value of options granted during the years ended December 31, 2014, 2013 and 2012 was $1.70, $2.45 and $3.29, respectively.
During the year ended December 31, 2013, 631,518 stock options were exercised on a cashless basis for which 459,171 shares of Holdings’ common stock were issued. No stock options were exercised on a cashless basis for the year ended December 31, 2014, but 6,237 options were exercised on a cash basis. The intrinsic value for the options exercised during the years ended December 31, 2014 and 2013, was approximately $25,000 and $3.4 million, respectively.
Stock-based compensation expense for both time based and performance based awards was recognized in the consolidated statements of comprehensive loss as follows:
| Years Ended December 31, | ||||||||||||
| (in thousands) |
2014 | 2013 | 2012 | |||||||||
| Cost of goods sold |
$ | 135 | $ | 41 | $ | 79 | ||||||
| Sales and marketing |
154 | 93 | 111 | |||||||||
| General and administrative |
621 | 429 | 982 | |||||||||
| Research and development |
121 | 15 | 68 | |||||||||
|
|
|
|
|
|
|
|||||||
| Total stock-based compensation expense |
$ | 1,031 | $ | 578 | $ | 1,240 | ||||||
|
|
|
|
|
|
|
|||||||
Stock-based compensation expense recognized in the consolidated statement of comprehensive loss for the years ended December 31, 2014, 2013, and 2012 are based on awards ultimately expected to vest as well as any changes in the probability of achieving certain performance features as required. Upon termination of employment, the Company has the right to call shares held by employees that were purchased or acquired through option exercise. As a result of this right, upon termination of service, vested stock-based awards are reclassified to liability-based awards when it is probable the employee will exercise the option and the Company will exercise its call right. The Company did not reclassify any equity awards to liability-based awards as of December 31, 2014 and 2013. There were no liability awards paid out during the years ended December 31, 2014, 2013 and 2012.
The Company did not recognize an income tax benefit for the years ended December 31, 2014, 2013 and 2012. As of December 31, 2014, there was approximately $2.6 million of total unrecognized compensation costs related to non-vested stock options granted under the 2013 and 2008 Plans. These costs are expected to be
F-33
Table of Contents
recognized over a weighted-average remaining period of 1.4 years. In addition, performance based awards contain certain contingent features, such as change in control provisions, which allow for the vesting of previously forfeited and unvested awards. As of December 31, 2014, there was approximately $1.0 million of unrecognized compensation expense relating to these features, which could be recognized through 2018 or longer.
13. Net Loss Per Share
Basic earnings per share is computed by dividing net loss by the weighted average number of shares of common stock outstanding during the period. Diluted earnings per common share is computed by dividing net loss by the weighted average number of shares of common stock outstanding during the period, plus the potential dilutive effect of other securities if those securities were converted or exercised. During periods in which the Company incurs net losses, both basic and diluted loss per share is calculated by dividing the net loss by the weighted average shares outstanding and potentially dilutive securities are excluded from the calculation because their effect would be antidilutive.
| Year Ended December 31, | ||||||||||||
| (in thousands, except share and per share amounts) |
2014 | 2013 | 2013 | |||||||||
| Net loss |
$ | (3,561 | ) | $ | (61,555 | ) | $ | (42,001 | ) | |||
|
|
|
|
|
|
|
|||||||
| Basic and diluted weighted average common shares outstanding |
50,806,512 | 50,670,274 | 50,250,957 | |||||||||
|
|
|
|
|
|
|
|||||||
| Basic and diluted loss per common share |
$ | (0.07 | ) | $ | (1.21 | ) | $ | (0.84 | ) | |||
|
|
|
|
|
|
|
|||||||
The weighted average number of common shares for the years ended December 31, 2014, 2013 and 2012 did not include 4,302,420, 3,858,462 and 3,329,298 options, respectively, because of their antidilutive effect.
14. Other Income (Expense), net
Other income, net consisted of the following:
| Years Ended December 31, | ||||||||||||
| (in thousands) |
2014 | 2013 | 2012 | |||||||||
| Foreign currency losses |
$ | (279 | ) | $ | (349 | ) | $ | (579 | ) | |||
| Tax indemnification income |
754 | 1,141 | 346 | |||||||||
| Other income |
3 | 369 | 189 | |||||||||
|
|
|
|
|
|
|
|||||||
| Total other income (expense), net |
$ | 478 | $ | 1,161 | $ | (44 | ) | |||||
|
|
|
|
|
|
|
|||||||
15. Commitments
The Company leases certain buildings, hardware and office space under operating leases. In addition, the Company has entered into purchasing arrangements in which minimum quantities of goods or services have been committed to be purchased on an annual basis.
F-34
Table of Contents
Minimum lease and purchase commitments under noncancelable arrangements are as follows (in thousands):
| Years ended December 31, |
Operating Leases |
|||
| 2015 |
$ | 854 | ||
| 2016 |
568 | |||
| 2017 |
455 | |||
| 2018 |
400 | |||
| 2019 |
397 | |||
| 2020 and thereafter |
1,190 | |||
|
|
|
|||
| $ | 3,864 | |||
|
|
|
|||
Lease expense was $1.0 million, $0.9 million and $1.0 million for the years ended December 31, 2014, 2013 and 2012, respectively.
The Company has entered into agreements which contain certain percentage volume purchase requirements. The Company has excluded these future purchase commitments from the table above since there are no minimum purchase commitments or payments under these agreements.
16. 401(k) Plan
The Company maintains a qualified 401(k) plan (the “401(k) Plan”) for its U.S. employees. The 401(k) Plan covers U.S. employees who meet certain eligibility requirements. Under the terms of the 401(k) Plan, the employees may elect to make tax-deferred contributions through payroll deductions within statutory and plan limits, and the Company may elect to make non-elective discretionary contributions. Effective April 2012, the employer match was suspended and was subsequently reinstated in January 2013. The Company did not contribute any additional non-elective discretionary match during the years ended December 31, 2014, 2013 and 2012. The Company may also make optional contributions to the 401(k) Plan for any plan year at its discretion. Expense recognized by the Company for matching contributions related to the 401(k) Plan was $1.5 million, $1.2 million and $0.4 million for the years ended December 31, 2014, 2013 and 2012, respectively.
17. Legal Proceedings
From time to time, the Company is a party to various legal proceedings arising in the ordinary course of business. In addition, the Company has in the past been, and may in the future be, subject to investigations by governmental and regulatory authorities, which expose it to greater risks associated with litigation, regulatory or other proceedings, as a result of which the Company could be required to pay significant fines or penalties. The outcome of litigation, regulatory or other proceedings cannot be predicted with certainty, and some lawsuits, claims, actions or proceedings may be disposed of unfavorably to the Company. In addition, intellectual property disputes often have a risk of injunctive relief which, if imposed against the Company, could materially and adversely affect its financial condition or results of operations. As of December 31, 2014, the Company had no material ongoing litigation in which the Company was a defendant or any material ongoing regulatory or other proceedings and had no knowledge of any investigations by government or regulatory authorities in which the Company is a target that could have a material adverse effect on its current business.
On December 16, 2010, LMI filed suit against one of its insurance carriers seeking to recover business interruption losses associated with the NRU reactor shutdown and the ensuing global Moly supply shortage. The claim is the result of the shutdown of the NRU reactor in Chalk River, Ontario. The NRU reactor was off-line from May 2009 until August 2010. The defendant answered the complaint on January 21, 2011, denying substantially all of the allegations, presenting certain defenses and requesting dismissal of the case with costs and disbursements. Discovery, including international discovery and related motion practice, has been on-going for
F-35
Table of Contents
more than three years. The defendant filed a motion for summary judgment on July 14, 2014. The Company filed a memorandum of law in opposition to defendant’s motion for summary judgment on August 25, 2014. The defendant filed a reply memorandum of law in further support of its motion for summary judgment on September 15, 2014. Expert witness discovery was completed on October 31, 2014. The Company cannot be certain what amount, if any, or when, if ever, it will be able to recover for business interruption losses related to this matter.
18. Related Party Transactions
Avista, the Company’s majority shareholder, provides certain advisory services to the Company pursuant to an advisory services and monitoring agreement. The Company is required to pay an annual fee of $1.0 million and other reasonable and customary advisory fees, as applicable, paid on a quarterly basis. The initial term of the agreement is seven years. Upon termination, all remaining amounts owed under the agreement shall become due immediately. The Company incurred costs associated with this agreement totaling $1.0 million for each of the years ended December 31, 2014, 2013 and 2012. At December 31, 2014 and 2013, $10,000 and $30,000, respectively, was included in accrued expenses.
The Company had a Master Contract Research Organization Services Agreement with INC Research, LLC, or INC, to provide clinical development services in connection with the flurpiridaz F 18 Phase III program. Avista and certain of its affiliates are principal owners of both INC and the Company. The agreement was cancelled during May 2014. The agreement had a term of five years and the Company did not incur any costs associated with this agreement in the year ended December 31, 2014. The Company incurred costs associated with this agreement of approximately $0.5 million and $0.9 million during the years ended December 31, 2013 and 2012, respectively At December 31, 2014 and 2013, there was no balance outstanding.
The Company purchases inventory supplies from VWR Scientific, or VWR. Avista and certain of its affiliates are principal owners of both VWR and the Company. The Company made purchases of approximately $0.5 million, $0.3 million and $0.3 million during each of the years ended December 31, 2014, 2013 and 2012, respectively. At December 31, 2014 and 2013, $21,000 and $1,000, respectively, was included in accounts payable and accrued expenses.
The Company retains Marsh for insurance brokering and risk management. In November 2013, Donald Bailey, brother of the Company’s President and Chief Executive Officer, Jeffrey Bailey, was appointed head of sales for Marsh’s U.S. and Canada division. In 2014, the Company paid Marsh approximately $0.3 million. At both December 31, 2014 and 2013, there was a prepaid of $43,000 included in other current assets.
At December 31, 2013, the Company had $0.1 million due from an officer of the Company included in accounts receivable, net. This amount represented federal and state tax withholdings paid by the Company on behalf of the officer. During the second quarter of 2014, this amount was fully repaid by the officer.
19. Segment Information
The Company reports two operating segments, U.S. and International, based on geographic customer base. The results of these operating segments are regularly reviewed by the Company’s chief operating decision maker, the President and Chief Executive Officer. The Company’s segments derive revenues through the manufacturing, marketing, selling and distribution of medical imaging products, focused primarily on cardiovascular diagnostic imaging. The U.S. segment comprises 78.4%, 75.3% and 72.9% of consolidated revenues in 2014, 2013 and 2012, respectively, and 90.4% and 89.9% of consolidated assets at December 31, 2014 and 2013, respectively. All goodwill has been allocated to the U.S. operating segment.
F-36
Table of Contents
Selected information for each business segment are as follows (in thousands):
| (in thousands) |
2014 | 2013 | 2012 | |||||||||
| Revenues |
||||||||||||
| U.S. |
$ | 258,148 | $ | 234,567 | $ | 229,926 | ||||||
| International |
65,080 | 70,033 | 78,094 | |||||||||
|
|
|
|
|
|
|
|||||||
| Total revenue, including inter-segment |
323,228 | 304,600 | 308,020 | |||||||||
| Inter-segment revenue |
(21,628 | ) | (20,928 | ) | (19,915 | ) | ||||||
|
|
|
|
|
|
|
|||||||
| $ | 301,600 | $ | 283,672 | $ | 288,105 | |||||||
|
|
|
|
|
|
|
|||||||
| Revenues from external customers |
||||||||||||
| U.S. |
$ | 236,520 | $ | 213,639 | $ | 210,011 | ||||||
| International |
65,080 | 70,033 | 78,094 | |||||||||
|
|
|
|
|
|
|
|||||||
| $ | 301,600 | $ | 283,672 | $ | 288,105 | |||||||
|
|
|
|
|
|
|
|||||||
| Revenues by product |
||||||||||||
| DEFINITY |
$ | 95,760 | $ | 78,094 | $ | 51,431 | ||||||
| TechneLite |
93,588 | 92,195 | 114,249 | |||||||||
| Xenon |
36,549 | 32,125 | 30,075 | |||||||||
| Cardiolite |
18,823 | 26,137 | 34,995 | |||||||||
| Other |
56,880 | 55,121 | 57,355 | |||||||||
|
|
|
|
|
|
|
|||||||
| $ | 301,600 | $ | 283,672 | $ | 288,105 | |||||||
|
|
|
|
|
|
|
|||||||
| Geographical revenue |
||||||||||||
| U.S. |
$ | 236,520 | $ | 213,639 | $ | 210,011 | ||||||
| Canada |
31,363 | 35,502 | 37,017 | |||||||||
| All other |
33,717 | 34,531 | 41,077 | |||||||||
|
|
|
|
|
|
|
|||||||
| $ | 301,600 | $ | 283,672 | $ | 288,105 | |||||||
|
|
|
|
|
|
|
|||||||
| Operating income/(loss) |
||||||||||||
| U.S. |
$ | 38,410 | $ | (18,781 | ) | $ | (11,104 | ) | ||||
| International |
353 | 703 | 9,820 | |||||||||
|
|
|
|
|
|
|
|||||||
| Total operating income (loss), including inter-segment |
38,763 | (18,078 | ) | (1,284 | ) | |||||||
| Inter-segment operating income (loss) |
654 | (813 | ) | 534 | ||||||||
|
|
|
|
|
|
|
|||||||
| Operating income (loss) |
39,417 | (18,891 | ) | (750 | ) | |||||||
| Interest expense |
(42,288 | ) | (42,915 | ) | (42,014 | ) | ||||||
| Interest income |
27 | 104 | 252 | |||||||||
| Other income (expense), net |
478 | 1,161 | (44 | ) | ||||||||
|
|
|
|
|
|
|
|||||||
| Loss before income taxes |
$ | (2,366 | ) | $ | (60,541 | ) | $ | (42,556 | ) | |||
|
|
|
|
|
|
|
|||||||
| Depreciation and amortization |
||||||||||||
| U.S. |
$ | 16,055 | $ | 22,146 | $ | 23,918 | ||||||
| International |
2,196 | 3,009 | 3,484 | |||||||||
|
|
|
|
|
|
|
|||||||
| $ | 18,251 | $ | 25,155 | $ | 27,402 | |||||||
|
|
|
|
|
|
|
|||||||
| Capital expenditures |
||||||||||||
| U.S. |
$ | 7,811 | $ | 4,903 | $ | 7,353 | ||||||
| International |
326 | 107 | 567 | |||||||||
|
|
|
|
|
|
|
|||||||
| $ | 8,137 | $ | 5,010 | $ | 7,920 | |||||||
|
|
|
|
|
|
|
|||||||
F-37
Table of Contents
| 2014 | 2013 | |||||||
| Assets |
||||||||
| U.S. |
$ | 225,546 | $ | 234,899 | ||||
| International |
24,024 | 26,412 | ||||||
|
|
|
|
|
|||||
| $ | 249,570 | $ | 261,311 | |||||
|
|
|
|
|
|||||
| 2014 | 2013 | |||||||
| Long-lived assets |
||||||||
| U.S. |
$ | 91,346 | $ | 91,683 | ||||
| International |
4,668 | 5,970 | ||||||
|
|
|
|
|
|||||
| $ | 96,014 | $ | 97,653 | |||||
|
|
|
|
|
|||||
20. Valuation and Qualifying Accounts
| (in thousands) |
Balance at Beginning of Fiscal Year |
Charge to Costs and Expenses (Recovery of write-offs) |
Deductions From Reserves |
Balance at End of Fiscal Year |
||||||||||||
| Year ended December 31, 2014: |
||||||||||||||||
| Allowance for doubtful accounts |
$ | 290 | $ | 303 | $ | (8 | ) | $ | 585 | |||||||
| Year ended December 31, 2013: |
||||||||||||||||
| Allowance for doubtful accounts |
$ | 301 | $ | 63 | $ | (74 | ) | $ | 290 | |||||||
| Year ended December 31, 2012: |
||||||||||||||||
| Allowance for doubtful accounts |
$ | 462 | $ | (117 | ) | $ | (44 | ) | $ | 301 | ||||||
Amounts charged to deductions from reserves represent the write-off of uncollectible balances.
21. Guarantor Financial Information
The Notes, issued by LMI, are guaranteed by Lantheus Intermediate, or the Parent Guarantor, and Lantheus Real Estate, one of Lantheus Intermediate’s wholly-owned consolidated subsidiaries, or the Guarantor Subsidiary. The guarantees are full and unconditional and joint and several. The following supplemental financial information sets forth, on a condensed consolidating basis, balance sheet information as of December 31, 2014 and 2013, and comprehensive (loss) income and cash flow information for the years ended December 31, 2014, 2013 and 2012 for Holdings, or the Parent Non-Guarantor, Lantheus Intermediate, LMI, the Guarantor Subsidiary and Lantheus Intermediate’s other wholly-owned subsidiaries, or the Non-Guarantor Subsidiaries. The supplemental financial information have been prepared on the same basis as the consolidated financial statements of Holdings. The equity method of accounting is followed within this financial information.
F-38
Table of Contents
Consolidating Balance Sheet Information
December 31, 2014
| (in thousands) |
Holdings (Non- Guarantor Parent) |
Lantheus Intermediate (Parent Guarantor) |
LMI (Issuer) |
Guarantor Subsidiary |
Non- Guarantor Subsidiaries |
Eliminations | Total | |||||||||||||||||||||
| Assets: |
||||||||||||||||||||||||||||
| Current assets |
||||||||||||||||||||||||||||
| Cash and cash equivalents |
$ | 1,922 | $ | — | $ | 12,586 | $ | — | $ | 5,231 | $ | — | $ | 19,739 | ||||||||||||||
| Accounts receivable, net |
— | — | 32,280 | — | 9,260 | — | 41,540 | |||||||||||||||||||||
| Intercompany accounts receivable |
— | — | 7,444 | — | — | (7,444 | ) | — | ||||||||||||||||||||
| Inventory |
— | — | 12,638 | — | 2,944 | — | 15,582 | |||||||||||||||||||||
| Income tax receivable |
— | — | 178 | — | 69 | — | 247 | |||||||||||||||||||||
| Deferred tax assets |
— | — | 239 | — | 17 | — | 256 | |||||||||||||||||||||
| Other current assets |
132 | — | 3,544 | — | 195 | — | 3,871 | |||||||||||||||||||||
|
|
|
|
|
|
|
|
|
|
|
|
|
|
|
|||||||||||||||
| Total current assets |
2,054 | — | 68,909 | — | 17,716 | (7,444 | ) | 81,235 | ||||||||||||||||||||
| Property, plant and equipment, net |
— | — | 75,811 | 15,535 | 4,668 | — | 96,014 | |||||||||||||||||||||
| Capitalized software development costs, net |
— | — | 2,421 | — | — | — | 2,421 | |||||||||||||||||||||
| Intangibles, net |
— | — | 24,891 | — | 2,300 | — | 27,191 | |||||||||||||||||||||
| Goodwill |
— | — | 15,714 | — | — | — | 15,714 | |||||||||||||||||||||
| Deferred financing costs |
— | — | 7,349 | — | — | — | 7,349 | |||||||||||||||||||||
| Deferred tax assets |
— | — | 277 | — | 51 | — | 328 | |||||||||||||||||||||
| Investment in subsidiaries |
(240,969 | ) | (240,969 | ) | 32,511 | — | — | 449,427 | — | |||||||||||||||||||
| Intercompany note receivable |
— | — | — | — | 5,626 | (5,626 | ) | — | ||||||||||||||||||||
| Other long-term assets |
— | — | 19,132 | — | 186 | — | 19,318 | |||||||||||||||||||||
|
|
|
|
|
|
|
|
|
|
|
|
|
|
|
|||||||||||||||
| Total assets |
$ | (238,915 | ) | $ | (240,969 | ) | $ | 247,015 | $ | 15,535 | $ | 30,547 | $ | 436,357 | $ | 249,570 | ||||||||||||
|
|
|
|
|
|
|
|
|
|
|
|
|
|
|
|||||||||||||||
| Liabilities and (deficit) equity: |
||||||||||||||||||||||||||||
| Current liabilities |
||||||||||||||||||||||||||||
| Line of credit |
$ | — | $ | — | $ | 8,000 | $ | — | $ | — | $ | — | $ | 8,000 | ||||||||||||||
| Accounts payable |
— | — | 14,027 | — | 1,638 | — | 15,665 | |||||||||||||||||||||
| Intercompany accounts payable |
— | — | — | — | 7,444 | (7,444 | ) | — | ||||||||||||||||||||
| Accrued expenses and other liabilities |
— | — | 21,022 | — | 3,557 | — | 24,579 | |||||||||||||||||||||
| Deferred tax liability |
— | — | — | — | 152 | — | 152 | |||||||||||||||||||||
| Deferred revenue |
— | — | 132 | — | — | — | 132 | |||||||||||||||||||||
|
|
|
|
|
|
|
|
|
|
|
|
|
|
|
|||||||||||||||
| Total current liabilities |
— | — | 43,181 | — | 12,791 | (7,444 | ) | 48,528 | ||||||||||||||||||||
| Asset retirement obligations |
— | — | 7,232 | — | 203 | — | 7,435 | |||||||||||||||||||||
| Long-term debt, net |
— | — | 399,280 | — | — | — | 399,280 | |||||||||||||||||||||
| Dividend payable |
355 | — | — | — | — | — | 355 | |||||||||||||||||||||
| Intercompany note payable |
— | — | 5,626 | — | — | (5,626 | ) | — | ||||||||||||||||||||
| Deferred tax liability |
— | — | 239 | — | 8 | — | 247 | |||||||||||||||||||||
| Other long-term liabilities |
— | — | 32,426 | — | 569 | — | 32,995 | |||||||||||||||||||||
|
|
|
|
|
|
|
|
|
|
|
|
|
|
|
|||||||||||||||
| Total liabilities |
355 | — | 487,984 | — | 13,571 | (13,070 | ) | 488,840 | ||||||||||||||||||||
| (Deficit) equity |
(239,270 | ) | (240,969 | ) | (240,969 | ) | 15,535 | 16,976 | 449,427 | (239,270 | ) | |||||||||||||||||
|
|
|
|
|
|
|
|
|
|
|
|
|
|
|
|||||||||||||||
| Total liabilities and (deficit) equity |
$ | (238,915 | ) | $ | (240,969 | ) | $ | 247,015 | $ | 15,535 | $ | 30,547 | $ | 436,357 | $ | 249,570 | ||||||||||||
|
|
|
|
|
|
|
|
|
|
|
|
|
|
|
|||||||||||||||
F-39
Table of Contents
Consolidating Balance Sheet Information
December 31, 2013
| (in thousands) |
Holdings (Non- Guarantor Parent) |
Lantheus Intermediate (Parent Guarantor) |
LMI (Issuer) |
Guarantor Subsidiary |
Non- Guarantor Subsidiaries |
Eliminations | Total | |||||||||||||||||||||
| Assets: |
||||||||||||||||||||||||||||
| Current assets |
||||||||||||||||||||||||||||
| Cash and cash equivalents |
$ | 1,909 | $ | — | $ | 11,995 | $ | — | $ | 4,674 | $ | — | $ | 18,578 | ||||||||||||||
| Accounts receivable, net |
— | — | 28,099 | — | 10,811 | — | 38,910 | |||||||||||||||||||||
| Intercompany accounts receivable |
— | — | 2,671 | — | — | (2,671 | ) | — | ||||||||||||||||||||
| Inventory |
— | — | 15,414 | — | 2,896 | — | 18,310 | |||||||||||||||||||||
| Income tax receivable |
— | — | 297 | — | 28 | — | 325 | |||||||||||||||||||||
| Deferred tax assets |
— | — | — | — | 18 | — | 18 | |||||||||||||||||||||
| Other current assets |
17 | — | 2,906 | — | 181 | — | 3,104 | |||||||||||||||||||||
|
|
|
|
|
|
|
|
|
|
|
|
|
|
|
|||||||||||||||
| Total current assets |
1,926 | — | 61,382 | — | 18,608 | (2,671 | ) | 79,245 | ||||||||||||||||||||
| Property, plant and equipment, net |
— | — | 76,068 | 15,615 | 5,970 | — | 97,653 | |||||||||||||||||||||
| Capitalized software development costs, net |
— | — | 1,468 | — | 2 | — | 1,470 | |||||||||||||||||||||
| Intangibles, net |
— | — | 31,838 | — | 3,160 | — | 34,998 | |||||||||||||||||||||
| Goodwill |
— | — | 15,714 | — | — | — | 15,714 | |||||||||||||||||||||
| Deferred financing costs |
— | — | 9,639 | — | — | — | 9,639 | |||||||||||||||||||||
| Deferred tax assets |
— | — | — | — | 15 | — | 15 | |||||||||||||||||||||
| Investment in subsidiaries |
(237,088 | ) | (237,088 | ) | 40,289 | — | — | 433,887 | — | |||||||||||||||||||
| Intercompany note receivable |
— | — | — | — | 5,396 | (5,396 | ) | — | ||||||||||||||||||||
| Other long-term assets |
— | — | 22,370 | — | 207 | — | 22,577 | |||||||||||||||||||||
|
|
|
|
|
|
|
|
|
|
|
|
|
|
|
|||||||||||||||
| Total assets |
$ | (235,162 | ) | $ | (237,088 | ) | $ | 258,768 | $ | 15,615 | $ | 33,358 | $ | 425,820 | $ | 261,311 | ||||||||||||
|
|
|
|
|
|
|
|
|
|
|
|
|
|
|
|||||||||||||||
| Liabilities and (deficit) equity: |
||||||||||||||||||||||||||||
| Current liabilities |
||||||||||||||||||||||||||||
| Line of credit |
$ | — | $ | — | $ | 8,000 | $ | — | $ | — | $ | — | $ | 8,000 | ||||||||||||||
| Accounts payable |
— | — | 16,672 | — | 1,431 | — | 18,103 | |||||||||||||||||||||
| Intercompany accounts payable |
— | — | — | — | 2,671 | (2,671 | ) | — | ||||||||||||||||||||
| Accrued expenses and other liabilities |
— | — | 21,409 | — | 4,083 | — | 25,492 | |||||||||||||||||||||
| Deferred tax liability |
— | — | — | — | 57 | — | 57 | |||||||||||||||||||||
| Deferred revenue |
— | — | 3,979 | — | — | — | 3,979 | |||||||||||||||||||||
|
|
|
|
|
|
|
|
|
|
|
|
|
|
|
|||||||||||||||
| Total current liabilities |
— | — | 50,060 | — | 8,242 | (2,671 | ) | 55,631 | ||||||||||||||||||||
| Asset retirement obligations |
— | — | 6,212 | — | 173 | — | 6,385 | |||||||||||||||||||||
| Long-term debt, net |
— | — | 399,037 | — | — | — | 399,037 | |||||||||||||||||||||
| Dividend payable |
355 | — | — | — | — | — | 355 | |||||||||||||||||||||
| Intercompany note payable |
— | — | 5,396 | — | — | (5,396 | ) | — | ||||||||||||||||||||
| Deferred tax liability |
— | — | — | — | 12 | — | 12 | |||||||||||||||||||||
| Other long-term liabilities |
— | — | 35,151 | — | 257 | — | 35,408 | |||||||||||||||||||||
|
|
|
|
|
|
|
|
|
|
|
|
|
|
|
|||||||||||||||
| Total liabilities |
355 | — | 495,856 | — | 8,684 | (8,067 | ) | 496,828 | ||||||||||||||||||||
| (Deficit) equity |
(235,517 | ) | (237,088 | ) | (237,088 | ) | 15,615 | 24,674 | 433,887 | (235,517 | ) | |||||||||||||||||
|
|
|
|
|
|
|
|
|
|
|
|
|
|
|
|||||||||||||||
| Total liabilities and (deficit) equity |
$ | (235,162 | ) | $ | (237,088 | ) | $ | 258,768 | $ | 15,615 | $ | 33,358 | $ | 425,820 | $ | 261,311 | ||||||||||||
|
|
|
|
|
|
|
|
|
|
|
|
|
|
|
|||||||||||||||
F-40
Table of Contents
Consolidating Comprehensive Loss Information
Year Ended December 31, 2014
| (in thousands) |
Holdings (Non- Guarantor Parent) |
Lantheus Intermediate (Parent Guarantor) |
LMI (Issuer) |
Guarantor Subsidiary |
Non- Guarantor Subsidiaries |
Eliminations | Total | |||||||||||||||||||||
| Revenues |
$ | — | $ | — | $ | 268,204 | $ | — | $ | 55,024 | $ | (21,628 | ) | $ | 301,600 | |||||||||||||
| Cost of goods sold |
— | — | 144,286 | — | 53,423 | (21,628 | ) | 176,081 | ||||||||||||||||||||
|
|
|
|
|
|
|
|
|
|
|
|
|
|
|
|||||||||||||||
| Gross profit |
— | — | 123,918 | — | 1,601 | — | 125,519 | |||||||||||||||||||||
| Operating expenses |
||||||||||||||||||||||||||||
| Sales and marketing expenses |
— | — | 31,505 | — | 3,611 | — | 35,116 | |||||||||||||||||||||
| General and administrative expenses |
2,392 | — | 32,529 | 80 | 2,312 | — | 37,313 | |||||||||||||||||||||
| Research and development expenses |
— | — | 13,252 | — | 421 | — | 13,673 | |||||||||||||||||||||
|
|
|
|
|
|
|
|
|
|
|
|
|
|
|
|||||||||||||||
| Operating income (loss) |
(2,392 | ) | — | 46,632 | (80 | ) | (4,743 | ) | — | 39,417 | ||||||||||||||||||
| Interest expense |
— | — | (42,518 | ) | — | — | 230 | (42,288 | ) | |||||||||||||||||||
| Interest income |
— | — | 1 | — | 256 | (230 | ) | 27 | ||||||||||||||||||||
| Other income (expense) |
— | — | 558 | — | (80 | ) | — | 478 | ||||||||||||||||||||
| Equity in earnings (losses) of affiliates |
(1,169 | ) | (1,169 | ) | (5,042 | ) | — | — | 7,380 | — | ||||||||||||||||||
|
|
|
|
|
|
|
|
|
|
|
|
|
|
|
|||||||||||||||
| (Loss) income before income taxes |
(3,561 | ) | (1,169 | ) | (369 | ) | (80 | ) | (4,567 | ) | 7,380 | (2,366 | ) | |||||||||||||||
| Provision for income taxes |
— | — | 800 | — | 395 | — | 1,195 | |||||||||||||||||||||
|
|
|
|
|
|
|
|
|
|
|
|
|
|
|
|||||||||||||||
| Net (loss) income |
(3,561 | ) | (1,169 | ) | (1,169 | ) | (80 | ) | (4,962 | ) | 7,380 | (3,561 | ) | |||||||||||||||
|
|
|
|
|
|
|
|
|
|
|
|
|
|
|
|||||||||||||||
| Foreign currency translation |
— | — | — | — | (1,236 | ) | — | (1,236 | ) | |||||||||||||||||||
| Equity in other comprehensive income (loss) of subsidiaries |
(1,236 | ) | (1,236 | ) | (1,236 | ) | — | — | 3,708 | — | ||||||||||||||||||
|
|
|
|
|
|
|
|
|
|
|
|
|
|
|
|||||||||||||||
| Total other comprehensive (loss) income |
$ | (4,797 | ) | $ | (2,405 | ) | $ | (2,405 | ) | $ | (80 | ) | $ | (6,198 | ) | $ | 11,088 | $ | (4,797 | ) | ||||||||
|
|
|
|
|
|
|
|
|
|
|
|
|
|
|
|||||||||||||||
F-41
Table of Contents
Consolidating Comprehensive Loss Information
Year Ended December 31, 2013
| (in thousands) |
Holdings (Non- Guarantor Parent) |
Lantheus Intermediate (Parent Guarantor) |
LMI (Issuer) |
Guarantor Subsidiary |
Non- Guarantor Subsidiaries |
Eliminations | Total | |||||||||||||||||||||
| Revenues |
$ | — | $ | — | $ | 243,079 | $ | — | $ | 61,521 | $ | (20,928 | ) | $ | 283,672 | |||||||||||||
| Cost of goods sold |
— | — | 169,334 | — | 57,905 | (20,928 | ) | 206,311 | ||||||||||||||||||||
|
|
|
|
|
|
|
|
|
|
|
|
|
|
|
|||||||||||||||
| Gross profit |
— | — | 73,745 | — | 3,616 | — | 77,361 | |||||||||||||||||||||
| Operating expenses |
||||||||||||||||||||||||||||
| Sales and marketing expenses |
— | — | 31,668 | — | 3,559 | — | 35,227 | |||||||||||||||||||||
| General and administrative expenses |
(123 | ) | — | 30,785 | 80 | 2,294 | — | 33,036 | ||||||||||||||||||||
| Research and development expenses |
— | — | 30,138 | — | 321 | — | 30,459 | |||||||||||||||||||||
| Proceeds from manufacturer |
— | — | (8,876 | ) | — | — | — | (8,876 | ) | |||||||||||||||||||
| Impairment on land |
— | — | — | 6,406 | — | — | 6,406 | |||||||||||||||||||||
|
|
|
|
|
|
|
|
|
|
|
|
|
|
|
|||||||||||||||
| Operating income (loss) |
123 | — | (9,970 | ) | (6,486 | ) | (2,558 | ) | — | (18,891 | ) | |||||||||||||||||
| Interest expense |
— | — | (43,011 | ) | — | — | 96 | (42,915 | ) | |||||||||||||||||||
| Interest income |
— | — | 1 | — | 199 | (96 | ) | 104 | ||||||||||||||||||||
| Other income (expense) |
— | — | 1,373 | — | (212 | ) | — | 1,161 | ||||||||||||||||||||
| Equity in earnings (losses) of affiliates |
(61,678 | ) | (61,678 | ) | (9,142 | ) | — | — | 132,498 | — | ||||||||||||||||||
|
|
|
|
|
|
|
|
|
|
|
|
|
|
|
|||||||||||||||
| (Loss) income before income taxes |
(61,555 | ) | (61,678 | ) | (60,749 | ) | (6,486 | ) | (2,571 | ) | 132,498 | (60,541 | ) | |||||||||||||||
| Provision (benefit) for income taxes |
— | — | 929 | — | 85 | — | 1,014 | |||||||||||||||||||||
|
|
|
|
|
|
|
|
|
|
|
|
|
|
|
|||||||||||||||
| Net (loss) income |
(61,555 | ) | (61,678 | ) | (61,678 | ) | (6,486 | ) | (2,656 | ) | 132,498 | (61,555 | ) | |||||||||||||||
|
|
|
|
|
|
|
|
|
|
|
|
|
|
|
|||||||||||||||
| Foreign currency translation |
— | — | — | — | (1,729 | ) | — | (1,729 | ) | |||||||||||||||||||
| Equity in other comprehensive income (loss) of subsidiaries |
(1,729 | ) | (1,729 | ) | (1,729 | ) | — | — | 5,187 | — | ||||||||||||||||||
|
|
|
|
|
|
|
|
|
|
|
|
|
|
|
|||||||||||||||
| Total other comprehensive (loss) income |
$ | (63,284 | ) | $ | (63,407 | ) | $ | (63,407 | ) | $ | (6,486 | ) | $ | (4,385 | ) | $ | 137,685 | $ | (63,284 | ) | ||||||||
|
|
|
|
|
|
|
|
|
|
|
|
|
|
|
|||||||||||||||
F-42
Table of Contents
Consolidating Comprehensive Loss Information
Year Ended December 31, 2012
| (in thousands) |
Holdings (Non- Guarantor Parent) |
Lantheus Intermediate (Parent Guarantor) |
LMI (Issuer) |
Guarantor Subsidiary |
Non-Guarantor Subsidiaries |
Eliminations | Total | |||||||||||||||||||||
| Revenues |
$ | — | $ | — | $ | 241,406 | $ | — | $ | 66,614 | $ | (19,915 | ) | $ | 288,105 | |||||||||||||
| Cost of goods sold |
— | — | 171,257 | — | 59,707 | (19,915 | ) | 211,049 | ||||||||||||||||||||
| Loss on firm purchase commitment |
— | — | 1,859 | — | — | — | 1,859 | |||||||||||||||||||||
|
|
|
|
|
|
|
|
|
|
|
|
|
|
|
|||||||||||||||
| Total cost of goods sold |
— | — | 173,116 | — | 59,707 | (19,915 | ) | 212,908 | ||||||||||||||||||||
|
|
|
|
|
|
|
|
|
|
|
|
|
|
|
|||||||||||||||
| Gross profit |
— | — | 68,290 | — | 6,907 | — | 75,197 | |||||||||||||||||||||
| Operating expenses |
||||||||||||||||||||||||||||
| Sales and marketing expenses |
— | — | 34,220 | — | 3,217 | — | 37,437 | |||||||||||||||||||||
| General and administrative expenses |
— | — | 30,112 | 80 | 2,328 | — | 32,520 | |||||||||||||||||||||
| Research and development expenses |
— | — | 40,457 | — | 147 | — | 40,604 | |||||||||||||||||||||
| Proceeds from manufacturer |
— | — | (34,614 | ) | — | — | — | (34,614 | ) | |||||||||||||||||||
|
|
|
|
|
|
|
|
|
|
|
|
|
|
|
|||||||||||||||
| Operating income (loss) |
— | — | (1,885 | ) | (80 | ) | 1,215 | — | (750 | ) | ||||||||||||||||||
| Interest expense |
— | — | (42,014 | ) | — | — | — | (42,014 | ) | |||||||||||||||||||
| Interest income |
— | — | 1 | — | 251 | — | 252 | |||||||||||||||||||||
| Other income (expense) |
— | — | 110 | — | (154 | ) | — | (44 | ) | |||||||||||||||||||
| Equity in earnings (losses) of affiliates |
(42,001 | ) | (42,001 | ) | 1,242 | — | — | 82,760 | — | |||||||||||||||||||
|
|
|
|
|
|
|
|
|
|
|
|
|
|
|
|||||||||||||||
| (Loss) income before income taxes |
(42,001 | ) | (42,001 | ) | (42,546 | ) | (80 | ) | 1,312 | 82,760 | (42,556 | ) | ||||||||||||||||
| Provision (benefit) for income taxes |
— | — | (545 | ) | — | (10 | ) | — | (555 | ) | ||||||||||||||||||
|
|
|
|
|
|
|
|
|
|
|
|
|
|
|
|||||||||||||||
| Net (loss) income |
(42,001 | ) | (42,001 | ) | (42,001 | ) | (80 | ) | 1,322 | 82,760 | (42,001 | ) | ||||||||||||||||
|
|
|
|
|
|
|
|
|
|
|
|
|
|
|
|||||||||||||||
| Foreign currency translation |
— | — | 200 | — | 764 | — | 964 | |||||||||||||||||||||
| Equity in other comprehensive income (loss) of subsidiaries |
964 | 964 | 764 | — | — | (2,692 | ) | — | ||||||||||||||||||||
|
|
|
|
|
|
|
|
|
|
|
|
|
|
|
|||||||||||||||
| Total other comprehensive (loss) income |
$ | (41,037 | ) | $ | (41,037 | ) | $ | (41,037 | ) | $ | (80 | ) | $ | 2,086 | $ | 80,068 | $ | (41,037 | ) | |||||||||
|
|
|
|
|
|
|
|
|
|
|
|
|
|
|
|||||||||||||||
F-43
Table of Contents
Condensed Consolidating Cash Flow Information
Year Ended December 31, 2014
| Holdings (Non- Guarantor Parent) |
Lantheus Intermediate (Parent Guarantor) |
LMI (Issuer) |
Guarantor Subsidiary |
Non-Guarantor Subsidiaries |
Eliminations | Total | ||||||||||||||||||||||
| (in thousands) | ||||||||||||||||||||||||||||
| Cash provided by (used in) operating activities |
$ | 17 | $ | — | $ | 10,240 | $ | — | $ | 2,833 | $ | (1,500 | ) | $ | 11,590 | |||||||||||||
|
|
|
|
|
|
|
|
|
|
|
|
|
|
|
|||||||||||||||
| Cash flows from investing activities |
||||||||||||||||||||||||||||
| Capital expenditures |
— | — | (7,811 | ) | — | (326 | ) | — | (8,137 | ) | ||||||||||||||||||
| Payments from subsidiary |
2,047 | 2,047 | — | — | — | (4,094 | ) | — | ||||||||||||||||||||
| Proceeds from sale of property, plant and equipment |
— | — | 227 | — | — | — | 227 | |||||||||||||||||||||
| Redemption of certificate of deposit |
— | — | 228 | — | — | — | 228 | |||||||||||||||||||||
|
|
|
|
|
|
|
|
|
|
|
|
|
|
|
|||||||||||||||
| Cash provided by (used in) investing activities |
2,047 | 2,047 | (7,356 | ) | — | (326 | ) | (4,094 | ) | (7,682 | ) | |||||||||||||||||
|
|
|
|
|
|
|
|
|
|
|
|
|
|
|
|||||||||||||||
| Cash flows from financing activities |
||||||||||||||||||||||||||||
| Payments on note payable |
— | — | (71 | ) | — | — | — | (71 | ) | |||||||||||||||||||
| Payments for offering costs |
(2,064 | ) | — | — | — | — | — | (2,064 | ) | |||||||||||||||||||
| Deferred financing costs |
— | — | (175 | ) | — | — | — | (175 | ) | |||||||||||||||||||
| Proceeds from issuance of common stock |
13 | — | — | — | — | — | 13 | |||||||||||||||||||||
| Proceeds from line of credit |
— | — | 5,500 | — | — | — | 5,500 | |||||||||||||||||||||
| Payments on line of credit |
— | — | (5,500 | ) | — | — | — | (5,500 | ) | |||||||||||||||||||
| Payments to parent |
— | (2,047 | ) | (2,047 | ) | — | — | 4,094 | — | |||||||||||||||||||
| Payment of dividend |
— | — | — | — | (1,500 | ) | 1,500 | — | ||||||||||||||||||||
|
|
|
|
|
|
|
|
|
|
|
|
|
|
|
|||||||||||||||
| Cash provided by (used in) financing activities |
(2,051 | ) | (2,047 | ) | (2,293 | ) | — | (1,500 | ) | 5,594 | (2,297 | ) | ||||||||||||||||
|
|
|
|
|
|
|
|
|
|
|
|
|
|
|
|||||||||||||||
| Effect of foreign exchange rate on cash |
— | — | — | — | (450 | ) | — | (450 | ) | |||||||||||||||||||
|
|
|
|
|
|
|
|
|
|
|
|
|
|
|
|||||||||||||||
| Increase in cash and cash equivalents |
13 | — | 591 | — | 557 | — | 1,161 | |||||||||||||||||||||
| Cash and cash equivalents, beginning of year |
1,909 | — | 11,995 | — | 4,674 | — | 18,578 | |||||||||||||||||||||
|
|
|
|
|
|
|
|
|
|
|
|
|
|
|
|||||||||||||||
| Cash and cash equivalents, end of year |
$ | 1,922 | $ | — | $ | 12,586 | $ | — | $ | 5,231 | $ | — | $ | 19,739 | ||||||||||||||
|
|
|
|
|
|
|
|
|
|
|
|
|
|
|
|||||||||||||||
F-44
Table of Contents
Condensed Consolidating Cash Flow Information
Year Ended December 31, 2013
| Holdings (Non- Guarantor Parent) |
Lantheus Intermediate (Parent Guarantor) |
LMI (Issuer) |
Guarantor Subsidiary |
Non-Guarantor Subsidiaries |
Eliminations | Total | ||||||||||||||||||||||
| (in thousands) | ||||||||||||||||||||||||||||
| Cash provided by (used in) operating activities |
$ | 106 | $ | — | $ | (17,273 | ) | $ | — | $ | 3,333 | $ | (1,738 | ) | $ | (15,572 | ) | |||||||||||
|
|
|
|
|
|
|
|
|
|
|
|
|
|
|
|||||||||||||||
| Cash flows from investing activities |
||||||||||||||||||||||||||||
| Capital expenditures |
— | — | (4,903 | ) | — | (107 | ) | — | (5,010 | ) | ||||||||||||||||||
| Proceeds from dividend |
— | — | 5,268 | — | — | (5,268 | ) | — | ||||||||||||||||||||
| Payments to subsidiary |
(94 | ) | (94 | ) | — | — | — | 188 | — | |||||||||||||||||||
| Intercompany note |
— | — | — | — | (5,300 | ) | 5,300 | — | ||||||||||||||||||||
| Proceeds from sale of property, plant and equipment |
— | — | 433 | 1,094 | — | — | 1,527 | |||||||||||||||||||||
|
|
|
|
|
|
|
|
|
|
|
|
|
|
|
|||||||||||||||
| Cash provided by (used in) investing activities |
(94 | ) | (94 | ) | 798 | 1,094 | (5,407 | ) | 220 | (3,483 | ) | |||||||||||||||||
|
|
|
|
|
|
|
|
|
|
|
|
|
|
|
|||||||||||||||
| Cash flows from financing activities |
||||||||||||||||||||||||||||
| Proceeds from line of credit |
— | — | 8,000 | — | — | — | 8,000 | |||||||||||||||||||||
| Payments on note payable |
— | — | (1,310 | ) | — | — | — | (1,310 | ) | |||||||||||||||||||
| Deferred financing costs |
— | — | (1,249 | ) | — | — | — | (1,249 | ) | |||||||||||||||||||
| Proceeds from issuance of common stock |
400 | — | — | — | — | — | 400 | |||||||||||||||||||||
| Payments for common stock repurchase |
(106 | ) | — | — | — | — | — | (106 | ) | |||||||||||||||||||
| Payments from parent |
— | 94 | 94 | — | — | (188 | ) | — | ||||||||||||||||||||
| Intercompany note |
— | — | 5,300 | — | — | (5,300 | ) | — | ||||||||||||||||||||
| Payment of dividend |
(123 | ) | — | — | (1,094 | ) | (5,912 | ) | 7,006 | (123 | ) | |||||||||||||||||
|
|
|
|
|
|
|
|
|
|
|
|
|
|
|
|||||||||||||||
| Cash provided by (used in) financing activities |
171 | 94 | 10,835 | (1,094 | ) | (5,912 | ) | 1,518 | 5,612 | |||||||||||||||||||
|
|
|
|
|
|
|
|
|
|
|
|
|
|
|
|||||||||||||||
| Effect of foreign exchange rate on cash |
— | — | — | — | (1,300 | ) | — | (1,300 | ) | |||||||||||||||||||
|
|
|
|
|
|
|
|
|
|
|
|
|
|
|
|||||||||||||||
| Increase (decrease) in cash and cash equivalents |
183 | — | (5,640 | ) | — | (9,286 | ) | — | (14,743 | ) | ||||||||||||||||||
| Cash and cash equivalents, beginning of year |
1,726 | — | 17,635 | — | 13,960 | — | 33,321 | |||||||||||||||||||||
|
|
|
|
|
|
|
|
|
|
|
|
|
|
|
|||||||||||||||
| Cash and cash equivalents, end of year |
$ | 1,909 | $ | — | $ | 11,995 | $ | — | $ | 4,674 | $ | — | $ | 18,578 | ||||||||||||||
|
|
|
|
|
|
|
|
|
|
|
|
|
|
|
|||||||||||||||
F-45
Table of Contents
Condensed Consolidating Cash Flow Information
Year Ended December 31, 2012
| Holdings (Non- Guarantor Parent) |
Lantheus Intermediate (Parent Guarantor) |
LMI (Issuer) |
Guarantor Subsidiary |
Non-Guarantor Subsidiaries |
Eliminations | Total | ||||||||||||||||||||||
| (in thousands) | ||||||||||||||||||||||||||||
| Cash provided by (used in) operating activities |
$ | (895 | ) | $ | — | $ | 3,829 | $ | — | $ | 4,568 | $ | (7,874 | ) | $ | (372 | ) | |||||||||||
|
|
|
|
|
|
|
|
|
|
|
|
|
|
|
|||||||||||||||
| Cash flows from investing activities |
||||||||||||||||||||||||||||
| Capital expenditures |
— | — | (7,353 | ) | — | (567 | ) | — | (7,920 | ) | ||||||||||||||||||
| Purchase of certificate of deposit |
— | — | (225 | ) | — | — | — | (225 | ) | |||||||||||||||||||
| Payments from subsidiary |
67 | 67 | — | — | — | (134 | ) | — | ||||||||||||||||||||
| Proceeds from dividend |
— | — | 2,949 | — | — | (2,949 | ) | — | ||||||||||||||||||||
|
|
|
|
|
|
|
|
|
|
|
|
|
|
|
|||||||||||||||
| Cash used in investing activities |
67 | 67 | (4,629 | ) | — | (567 | ) | (3,083 | ) | (8,145 | ) | |||||||||||||||||
|
|
|
|
|
|
|
|
|
|
|
|
|
|
|
|||||||||||||||
| Cash flows from financing activities |
||||||||||||||||||||||||||||
| Payments on note payable |
— | — | (1,530 | ) | — | — | — | (1,530 | ) | |||||||||||||||||||
| Deferred financing costs |
— | — | (442 | ) | — | — | — | (442 | ) | |||||||||||||||||||
| Proceeds from issuance of common stock |
551 | — | — | — | — | — | 551 | |||||||||||||||||||||
| Payments for common stock repurchase |
(174 | ) | — | — | — | — | — | (174 | ) | |||||||||||||||||||
| Payments to parent |
— | (67 | ) | (67 | ) | — | — | 134 | — | |||||||||||||||||||
| Payment of dividend |
(3,519 | ) | — | — | — | (10,823 | ) | 10,823 | (3,519 | ) | ||||||||||||||||||
|
|
|
|
|
|
|
|
|
|
|
|
|
|
|
|||||||||||||||
| Cash used in financing activities |
(3,142 | ) | (67 | ) | (2,039 | ) | — | (10,823 | ) | 10,957 | (5,114 | ) | ||||||||||||||||
|
|
|
|
|
|
|
|
|
|
|
|
|
|
|
|||||||||||||||
| Effect of foreign exchange rate on cash |
— | — | — | — | 649 | — | 649 | |||||||||||||||||||||
|
|
|
|
|
|
|
|
|
|
|
|
|
|
|
|||||||||||||||
| Decrease in cash and cash equivalents |
(3,970 | ) | — | (2,839 | ) | — | (6,173 | ) | — | (12,982 | ) | |||||||||||||||||
| Cash and cash equivalents, beginning of year |
5,696 | — | 20,474 | — | 20,133 | — | 46,303 | |||||||||||||||||||||
|
|
|
|
|
|
|
|
|
|
|
|
|
|
|
|||||||||||||||
| Cash and cash equivalents, end of year |
$ | 1,726 | $ | — | $ | 17,635 | $ | — | $ | 13,960 | $ | — | $ | 33,321 | ||||||||||||||
|
|
|
|
|
|
|
|
|
|
|
|
|
|
|
|||||||||||||||
22. Subsequent Events
The Company evaluated subsequent events through March 17, 2015, the date these financial statements were available to be issued.
F-46
Table of Contents
LANTHEUS HOLDINGS, INC. AND SUBSIDIARIES
Condensed Consolidated Balance Sheets
(unaudited, in thousands, except share data)
| March 31, 2015 |
December 31, 2014 |
|||||||
| Assets |
||||||||
| Current assets |
||||||||
| Cash and cash equivalents |
$ | 30,743 | $ | 19,739 | ||||
| Accounts receivable, net of allowance of $471 and $585 |
38,401 | 41,540 | ||||||
| Inventory |
16,153 | 15,582 | ||||||
| Income tax receivable |
157 | 247 | ||||||
| Deferred tax assets |
255 | 256 | ||||||
| Other current assets |
4,795 | 3,871 | ||||||
|
|
|
|
|
|||||
| Total current assets |
90,504 | 81,235 | ||||||
| Property, plant and equipment, net |
92,102 | 96,014 | ||||||
| Capitalized software development costs, net |
2,268 | 2,421 | ||||||
| Intangibles, net |
25,582 | 27,191 | ||||||
| Goodwill |
15,714 | 15,714 | ||||||
| Deferred financing costs |
6,668 | 7,349 | ||||||
| Deferred tax assets |
334 | 328 | ||||||
| Other long-term assets |
17,486 | 19,318 | ||||||
|
|
|
|
|
|||||
| Total assets |
$ | 250,658 | $ | 249,570 | ||||
|
|
|
|
|
|||||
| Liabilities and Stockholders’ Deficit |
||||||||
| Current liabilities |
||||||||
| Line of credit |
$ | 8,000 | $ | 8,000 | ||||
| Accounts payable |
13,053 | 15,665 | ||||||
| Accrued expenses and other liabilities |
29,876 | 24,579 | ||||||
| Deferred tax liability |
148 | 152 | ||||||
| Deferred revenue |
129 | 132 | ||||||
|
|
|
|
|
|||||
| Total current liabilities |
51,206 | 48,528 | ||||||
| Asset retirement obligation |
7,373 | 7,435 | ||||||
| Long-term debt, net |
399,348 | 399,280 | ||||||
| Dividend payable |
355 | 355 | ||||||
| Deferred tax liability |
246 | 247 | ||||||
| Other long-term liabilities |
31,106 | 32,995 | ||||||
|
|
|
|
|
|||||
| Total liabilities |
489,634 | 488,840 | ||||||
|
|
|
|
|
|||||
| Commitments and contingencies (See Note 15) |
||||||||
| Stockholders’ deficit |
||||||||
| Preferred stock ($0.001 par value, 2,000,000 shares authorized; no shares issued and outstanding) |
— | — | ||||||
| Common stock ($0.001 par value, 60,000,000 shares authorized; 50,821,658 shares issued; 50,807,503 shares outstanding) |
51 | 51 | ||||||
| Treasury stock (14,155 and no shares, at cost) |
(106 | ) | (106 | ) | ||||
| Additional paid-in capital |
107,106 | 106,829 | ||||||
| Accumulated deficit |
(344,039 | ) | (344,414 | ) | ||||
| Accumulated other comprehensive loss |
(1,988 | ) | (1,630 | ) | ||||
|
|
|
|
|
|||||
| Total stockholders’ deficit |
(238,976 | ) | (239,270 | ) | ||||
|
|
|
|
|
|||||
| Total liabilities and stockholders’ deficit |
$ | 250,658 | $ | 249,570 | ||||
|
|
|
|
|
|||||
See notes to unaudited condensed consolidated financial statements.
F-47
Table of Contents
LANTHEUS HOLDINGS, INC. AND SUBSIDIARIES
Condensed Consolidated Statements of Comprehensive Income (Loss)
(unaudited, in thousands)
| For the Three Months Ended March 31, |
||||||||
| 2015 | 2014 | |||||||
| Revenues |
$ | 74,823 | $ | 73,336 | ||||
| Cost of goods sold |
39,054 | 43,275 | ||||||
|
|
|
|
|
|||||
| Gross profit |
35,769 | 30,061 | ||||||
|
|
|
|
|
|||||
| Operating expenses |
||||||||
| Sales and marketing expenses |
9,072 | 9,498 | ||||||
| General and administrative expenses |
9,123 | 8,852 | ||||||
| Research and development expenses |
6,196 | 3,222 | ||||||
|
|
|
|
|
|||||
| Total operating expenses |
24,391 | 21,572 | ||||||
|
|
|
|
|
|||||
| Operating income |
11,378 | 8,489 | ||||||
| Interest expense, net |
(10,623 | ) | (10,552 | ) | ||||
| Other expense, net |
(383 | ) | (414 | ) | ||||
|
|
|
|
|
|||||
| Income (loss) before income taxes |
372 | (2,477 | ) | |||||
| Benefit for income taxes |
(3 | ) | (1,192 | ) | ||||
|
|
|
|
|
|||||
| Net income (loss) |
375 | (1,285 | ) | |||||
|
|
|
|
|
|||||
| Foreign currency translation |
(358 | ) | (271 | ) | ||||
|
|
|
|
|
|||||
| Total comprehensive income (loss) |
$ | 17 | $ | (1,556 | ) | |||
|
|
|
|
|
|||||
| Net income (loss) per common share: |
||||||||
| Basic |
$ | 0.01 | $ | (0.03 | ) | |||
| Diluted |
$ | 0.01 | $ | (0.03 | ) | |||
| Common shares: |
||||||||
| Basic |
50,807,503 | 50,803,484 | ||||||
| Diluted |
51,716,327 | 50,803,484 | ||||||
See notes to unaudited condensed consolidated financial statements.
F-48
Table of Contents
LANTHEUS HOLDINGS, INC. AND SUBSIDIARIES
Condensed Consolidated Statements of Stockholders’ Deficit
(unaudited, in thousands, except share data)
|
Preferred Stock |
Common Stock |
Treasury Stock |
Additional Paid-In Capital |
Accumulated Deficit |
Accumulated Other Comprehensive Loss |
Total Stockholders’ Deficit |
||||||||||||||||||||||||||||||||||
| Shares | Amount | Shares | Amount | Shares | Amount | |||||||||||||||||||||||||||||||||||
| Balance at January 1, 2014 |
— | $ | — | 50,815,421 | $ | 51 | (14,155 | ) | (106 | ) | $ | 105,785 | $ | (340,853 | ) | $ | (394 | ) | $ | (235,517 | ) | |||||||||||||||||||
| Net share option exercise |
— | — | 6,237 | — | — | — | 13 | — | — | 13 | ||||||||||||||||||||||||||||||
| Net loss |
— | — | — | — | — | — | — | (3,561 | ) | — | (3,561 | ) | ||||||||||||||||||||||||||||
| Other comprehensive loss |
— | — | — | — | — | — | — | — | (1,236 | ) | (1,236 | ) | ||||||||||||||||||||||||||||
| Stock-based compensation |
— | — | — | — | — | — | 1,031 | — | — | 1,031 | ||||||||||||||||||||||||||||||
|
|
|
|
|
|
|
|
|
|
|
|
|
|
|
|
|
|
|
|
|
|||||||||||||||||||||
| Balance at December 31, 2014 |
— | — | 50,821,658 | 51 | (14,155 | ) | (106 | ) | 106,829 | (344,414 | ) | (1,630 | ) | (239,270 | ) | |||||||||||||||||||||||||
| Net income |
— | — | — | — | — | — | — | 375 | — | 375 | ||||||||||||||||||||||||||||||
| Other comprehensive loss |
— | — | — | — | — | — | — | — | (358 | ) | (358 | ) | ||||||||||||||||||||||||||||
| Stock-based compensation |
— | — | — | — | — | — | 277 | — | — | 277 | ||||||||||||||||||||||||||||||
|
|
|
|
|
|
|
|
|
|
|
|
|
|
|
|
|
|
|
|
|
|||||||||||||||||||||
| Balance at March 31, 2015 |
— | $ | — | 50,821,658 | $ | 51 | (14,155 | ) | (106 | ) | $ | 107,106 | $ | (344,039 | ) | $ | (1,988 | ) | $ | (238,976 | ) | |||||||||||||||||||
|
|
|
|
|
|
|
|
|
|
|
|
|
|
|
|
|
|
|
|
|
|||||||||||||||||||||
See notes to unaudited condensed consolidated financial statements.
F-49
Table of Contents
LANTHEUS HOLDINGS, INC. AND SUBSIDIARIES
Condensed Consolidated Statements of Cash Flows
(unaudited, in thousands)
| For the Three Months Ended March 31, |
||||||||
| 2015 | 2014 | |||||||
| Cash flows from operating activities |
||||||||
| Net income (loss) |
$ | 375 | $ | (1,285 | ) | |||
| Adjustments to reconcile net loss to cash flow from operating activities |
||||||||
| Depreciation and amortization |
8,120 | 4,988 | ||||||
| Provision for excess and obsolete inventory |
180 | 440 | ||||||
| Stock-based compensation |
277 | 284 | ||||||
| Deferred income taxes |
(7 | ) | (2 | ) | ||||
| Other |
860 | (753 | ) | |||||
| Increase (decrease) in cash from operating assets and liabilities |
||||||||
| Accounts receivable |
2,761 | (4,369 | ) | |||||
| Inventory |
(953 | ) | (884 | ) | ||||
| Other current assets |
(1,021 | ) | (2,554 | ) | ||||
| Income taxes |
87 | (148 | ) | |||||
| Deferred revenue |
(11 | ) | (1,055 | ) | ||||
| Accounts payable |
(771 | ) | 298 | |||||
| Accrued expenses and other liabilities |
5,260 | 4,980 | ||||||
|
|
|
|
|
|||||
| Cash provided by (used in) operating activities |
15,157 | (60 | ) | |||||
|
|
|
|
|
|||||
| Cash flows from investing activities |
||||||||
| Capital expenditures |
(3,498 | ) | (1,482 | ) | ||||
| Proceeds from sale of property, plant and equipment |
— | 20 | ||||||
|
|
|
|
|
|||||
| Cash used in investing activities |
(3,498 | ) | (1,462 | ) | ||||
|
|
|
|
|
|||||
| Cash flows from financing activities |
||||||||
| Payments on note payable |
(18 | ) | (18 | ) | ||||
| Payments for offering costs |
(441 | ) | — | |||||
| Proceeds from issuance of common stock |
— | 13 | ||||||
|
|
|
|
|
|||||
| Cash used in financing activities |
(459 | ) | (5 | ) | ||||
|
|
|
|
|
|||||
| Effect of foreign exchange rate on cash |
(196 | ) | (41 | ) | ||||
|
|
|
|
|
|||||
| Increase (decrease) in cash and cash equivalents |
11,004 | (1,568 | ) | |||||
| Cash and cash equivalents, beginning of period |
19,739 | 18,578 | ||||||
|
|
|
|
|
|||||
| Cash and cash equivalents, end of period |
$ | 30,743 | $ | 17,010 | ||||
|
|
|
|
|
|||||
| Supplemental disclosure of cash flow information |
||||||||
| Interest paid |
$ | 59 | $ | 66 | ||||
| Income taxes (refunded)/paid, net |
$ | (59 | ) | $ | 127 | |||
| Noncash investing and financing activities |
||||||||
| Property, plant and equipment included in accounts payable and accrued expenses and other liabilities |
$ | 1,360 | $ | 1,204 | ||||
See notes to unaudited condensed consolidated financial statements.
F-50
Table of Contents
LANTHEUS HOLDINGS, INC. AND SUBSIDIARIES
Notes to Unaudited Condensed Consolidated Financial Statements
Unless the context otherwise requires, references to the “Company” and “Lantheus” refer to Lantheus Holdings, Inc. and its direct and indirect subsidiaries, references to “Lantheus Intermediate” refer to only Lantheus Intermediate, Inc., the parent of Lantheus Medical Imaging, Inc., references to “Holdings” refer to Lantheus Holdings, Inc., the parent of Lantheus Intermediate, and references to “LMI” refer to Lantheus Medical Imaging, Inc., the subsidiary of Lantheus Intermediate. Solely for convenience, we refer to trademarks, service marks and trade names are referred to without the TM, SM and ® symbols. Those references are not intended to indicate, in any way, that the Company will not assert, to the fullest extent permitted under applicable law, its rights to its trademarks, service marks and trade names.
1. Business Overview
Overview
Holdings, a Delaware corporation, is the parent company and sole shareholder of Lantheus Intermediate, also a Delaware corporation. Holdings was formed for the purpose of acquiring the medical imaging business of Bristol-Myers Squibb, or BMS, which is now known as LMI.
The Company develops, manufactures, sells and distributes innovative diagnostic medical imaging agents and products that assist clinicians in the diagnosis of cardiovascular and other diseases. The Company’s commercial products are used by cardiologists, nuclear physicians, radiologists, internal medicine physicians, technologists and sonographers working in a variety of clinical settings. The Company sells its products to radiopharmacies, hospitals, clinics, group practices, integrated delivery networks, group purchasing organizations and, in certain circumstances, wholesalers. The Company sells its products globally and has operations in the United States, Puerto Rico, Canada and Australia and distribution relationships in Europe, Asia Pacific and Latin America.
The Company’s portfolio of 10 commercial products is diversified across a range of imaging modalities. The Company’s imaging agents include contrast agents and medical radiopharmaceuticals (including technetium generators), including the following:
| • | DEFINITY is the leading ultrasound contrast imaging agent used by cardiologists and sonographers during cardiac ultrasound, or echocardiography, exams based on revenue and usage. DEFINITY is an injectable agent that, in the United States, is indicated for use in patients with suboptimal echocardiograms to assist in the visualization of the left ventricle, the main pumping chamber of the heart. The use of DEFINITY in echocardiography allows physicians to significantly improve their assessment of the function of the left ventricle. |
| • | TechneLite is a self-contained system, or generator, of technetium (Tc99m), a radioisotope with a six hour half-life, used by radiopharmacies to prepare various nuclear imaging agents. |
| • | Xenon Xe 133 Gas is a radiopharmaceutical gas that is inhaled and used to assess pulmonary function and also cerebral blood flow. |
| • | Cardiolite is an injectable, technetium-labeled imaging agent, also known by its generic name sestamibi, used with Single Photon Emission Computed Tomography, or SPECT, technology in myocardial perfusion imaging, or MPI, procedures that assess blood flow distribution to the heart. |
| • | Neurolite is an injectable, technetium-labeled imaging agent used with SPECT technology to identify the area within the brain where blood flow has been blocked or reduced due to stroke. |
In the United States, the Company sells DEFINITY through its sales team that calls on healthcare providers in the echocardiography space, as well as group purchasing organizations and integrated delivery networks. The Company’s radiopharmaceutical products are primarily distributed through commercial radiopharmacies owned
F-51
Table of Contents
or controlled by third parties. In Canada, Puerto Rico and Australia, the Company owns eight radiopharmacies and sells its own radiopharmaceuticals, as well as others, directly to end users. In Europe, Asia Pacific and Latin America, the Company utilizes distributor relationships to market, sell and distribute its products.
Basis of Consolidation and Presentation
The financial statements have been prepared in United States dollars, in accordance with accounting principles generally accepted in the United States of America, or U.S. GAAP. The condensed consolidated financial statements include the accounts of Holdings and its wholly-owned subsidiaries. All intercompany accounts and transactions have been eliminated in consolidation.
In the opinion of the Company’s management, the accompanying unaudited condensed consolidated financial statements include all adjustments, consisting of normal recurring accruals, necessary for a fair presentation of the Company’s financial statements for interim periods in accordance with U.S. GAAP. Certain information and footnote disclosures normally included in financial statements prepared in accordance with U.S. GAAP have been condensed or omitted pursuant to the rules and regulations of the Securities and Exchange Commission, or the SEC. The information included in this quarterly report should be read in conjunction with the Company’s consolidated financial statements and the accompanying notes included in the Company’s annual report for the year ended December 31, 2014, included in this registration statement. The Company’s accounting policies are described in the “Notes to Consolidated Financial Statements” in the 2014 annual report and updated, as necessary, in this quarterly report. There were no changes to the Company’s accounting policies since December 31, 2014. The year-end condensed consolidated balance sheet data presented for comparative purposes was derived from audited financial statements, but does not include all disclosures required by U.S. GAAP. The results of operations for the three months ended March 31, 2015 are not necessarily indicative of the operating results for the full year or for any other subsequent interim period.
Recent Events
As of March 31, 2015, the Company had an accumulated deficit of $344.0 million and $408.0 million of total principal indebtedness consisting of $400.0 million of senior notes, which mature on May 15, 2017, and $8.0 million outstanding under its revolving credit facility. The Company is obligated to make scheduled interest payments of $39.0 million per year on the senior notes.
The Company currently relies on Jubilant HollisterStier, or JHS, as its sole source manufacturer of DEFINITY, Neurolite and evacuation vials for TechneLite. The Company has additional ongoing technology transfer activities at JHS for its Cardiolite product supply, which is currently manufactured by a single manufacturer. In addition, the Company has ongoing technology transfer activities at Pharmalucence for the manufacture and supply of DEFINITY, and the Company believes it will file for U.S. Food and Drug Administration, or FDA, approval to manufacture DEFINITY at Pharmalucence in 2015.
The Company has historically been dependent on key customers and group purchasing organizations for the majority of the sales of its medical imaging products. The Company’s ability to maintain and profitably renew these contracts and relationships with these key customers and group purchasing organizations is an important aspect of the Company’s strategy. The Company’s written supply agreements with a major customer relating to TechneLite, Xenon, Neurolite, Cardiolite and certain other products expired in accordance with contract terms on December 31, 2014. Extended discussions with this customer have not yet resulted in new written supply agreements. Consequently, the Company is currently accepting and fulfilling product orders with this customer on a purchase order basis.
Until the Company successfully becomes dual sourced for its principal products, the Company is vulnerable to future supply shortages. Disruption in the financial performance of the Company could also occur if it experiences significant adverse changes in customer mix, broad economic downturns, adverse industry or
F-52
Table of Contents
Company conditions or catastrophic external events. If the Company experiences one or more of these events in the future, it may be required to implement additional expense reductions, such as a delay or elimination of discretionary spending in all functional areas, as well as scaling back select operating and strategic initiatives.
During 2013 and 2014, the Company has utilized its revolving line of credit as a source of liquidity from time to time. Borrowing capacity under the revolving credit facility, or the Facility, is calculated by reference to a borrowing base consisting of a percentage of certain eligible accounts receivable, inventory and machinery and equipment minus any reserves, or the Borrowing Base. If the Company is not successful in achieving its forecasted operating results, the Company’s accounts receivable and inventory could be negatively affected, thus reducing the Borrowing Base and limiting the Company’s borrowing capacity. As of March 31, 2015, the aggregate Borrowing Base was approximately $45.8 million, which was reduced by the $8.8 million unfunded Standby Letter of Credit and the $8.1 million outstanding loan balance including interest, resulting in a net Borrowing Base availability of approximately $28.9 million.
Based on the Company’s current operating plans, the Company believes its existing cash and cash equivalents, results of operations and availability under the Facility will be sufficient to continue to fund the Company’s liquidity requirements for at least the next twelve months.
Use of Estimates
The preparation of condensed consolidated financial statements in conformity with U.S. GAAP requires management to make certain estimates and assumptions that affect the reported amounts of assets and liabilities at the date of the condensed consolidated financial statements, and the reported amounts of revenues and expenses during the reporting period. The more significant estimates reflected in the Company’s condensed consolidated financial statements include certain judgments regarding revenue recognition, goodwill, tangible and intangible asset valuation, inventory valuation and potential losses on purchase commitments, asset retirement obligations, income tax liabilities and related indemnification receivable, deferred tax assets and liabilities, accrued expenses and stock-based compensation. Actual results could materially differ from those estimates or assumptions.
Recent Accounting Standards
In April 2015, the Financial Accounting Standards Board, or the FASB, issued ASU No. 2015-03, “Interest—Imputation of Interest (Topic 835): Simplifying the Presentation of Debt Issuance Costs,” or ASU 2015-03. The amendments in ASU 2015-03 require that debt issuance costs related to a recognized debt liability be presented in the balance sheet as a direct deduction from the carrying amount of that debt liability, consistent with debt discounts. ASU 2015-03 requires retrospective adoption and will be effective for fiscal years beginning after December 15, 2015. Early adoption is permitted. The Company is evaluating the impact of ASU 2015-03 on the Company’s consolidated financial statements.
2. Summary of Significant Accounting Policies
Revenue Recognition
The Company recognizes revenue when evidence of an arrangement exists, title has passed, the risks and rewards of ownership have transferred to the customer, the selling price is fixed and determinable, and collectability is reasonably assured. For transactions for which revenue recognition criteria have not yet been met, the respective amounts are recorded as deferred revenue until such point in time the criteria are met and revenue can be recognized. Revenue is recognized net of reserves, which consist of allowances for returns and rebates.
Revenue arrangements with multiple elements are divided into separate units of accounting if certain criteria are met, including whether the delivered element has stand-alone value to the customer. The arrangement’s consideration is then allocated to each separate unit of accounting based on the relative selling price of each
F-53
Table of Contents
deliverable. The estimated selling price of each deliverable is determined using the following hierarchy of values: (i) vendor-specific objective evidence of fair value; (ii) third-party evidence of selling price; and (iii) best estimate of selling price. The best estimate of selling price reflects the Company’s best estimate of what the selling price would be if the deliverable was regularly sold by the Company on a stand-alone basis. The consideration allocated to each unit of accounting is then recognized as the related goods or services are delivered, limited to the consideration that is not contingent upon future deliverables. Supply or service transactions may involve the charge of a nonrefundable initial fee with subsequent periodic payments for future products or services. The up-front fees, even if nonrefundable, are recognized as revenue as the products and/or services are delivered and performed over the term of the arrangement.
Inventory
Inventory costs associated with product that has not yet received regulatory approval are capitalized if the Company believes there is probable future commercial use of the product and future economic benefits of the asset. If future commercial use of the product is not probable, then inventory costs associated with such product are expensed during the period the costs are incurred. For the three months ended March 31, 2014, the Company expensed $1.3 million of such product costs in cost of goods sold relating to Neurolite that was manufactured by JHS. There was no significant product expensed for the three months ended March 31, 2015. At March 31, 2015 and December 31, 2014, the Company had no capitalized inventories associated with product that did not have regulatory approval.
Goodwill
Goodwill is not amortized, but is instead tested for impairment at least annually and whenever events or circumstances indicate that it is more likely than not that it may be impaired. The Company has elected to perform the annual test for goodwill impairment as of October 31 of each year.
3. Fair Value of Financial Instruments
The tables below present information about the Company’s assets and liabilities that are measured at fair value on a recurring basis as of March 31, 2015 and December 31, 2014, and indicate the fair value hierarchy of the valuation techniques utilized to determine such fair value. In general, fair values determined by Level 1 inputs utilize quoted prices (unadjusted) in active markets for identical assets or liabilities. Fair values determined by Level 2 inputs utilize data points from active markets that are observable, such as quoted prices, interest rates and yield curves. Fair values determined by Level 3 inputs utilize unobservable data points for the asset or liability.
| March 31, 2015 (in thousands) |
Total fair value |
Quoted prices in active markets (Level 1) |
Significant other observable inputs (Level 2) |
Significant unobservable inputs (Level 3) |
||||||||||||
| Money market |
$ | 2,285 | $ | 2,285 | $ | — | $ | — | ||||||||
| Certificates of deposit—restricted |
82 | — | 82 | — | ||||||||||||
|
|
|
|
|
|
|
|
|
|||||||||
| Total |
$ | 2,367 | $ | 2,285 | $ | 82 | $ | — | ||||||||
|
|
|
|
|
|
|
|
|
|||||||||
| December 31, 2014 (in thousands) |
Total fair value |
Quoted prices in active markets (Level 1) |
Significant other observable inputs (Level 2) |
Significant unobservable inputs (Level 3) |
||||||||||||
| Money market |
$ | 2,737 | $ | 2,737 | $ | — | $ | — | ||||||||
| Certificates of deposit—restricted |
89 | — | 89 | — | ||||||||||||
|
|
|
|
|
|
|
|
|
|||||||||
| Total |
$ | 2,826 | $ | 2,737 | $ | 89 | $ | — | ||||||||
|
|
|
|
|
|
|
|
|
|||||||||
F-54
Table of Contents
At both March 31, 2015 and December 31, 2014, the Company has a $0.1 million certificate of deposit which is collateral for a long-term lease and is included in other long-term assets on the condensed consolidated balance sheet. Certificates of deposit are classified within Level 2 of the fair value hierarchy, as these are not traded on the open market.
At March 31, 2015, the Company had total cash and cash equivalents of $30.7 million, which included approximately $2.3 million of money market funds and $28.4 million of cash on-hand. At December 31, 2014, the Company had total cash and cash equivalents of $19.7 million, which included approximately $2.7 million of money market funds and $17.0 million of cash on-hand.
The estimated fair values of the Company’s financial instruments, including its cash and cash equivalents, receivables, accounts payable and accrued expenses approximate the carrying values of these instruments due to their short term nature. The estimated fair value of the Company’s fixed rate debt, at March 31, 2015, based on Level 2 inputs of recent market activity available to the Company was $392.0 million compared to the face value of $400.0 million. At December 31, 2014, the estimated fair value of the debt based on Level 2 inputs of recent market activity available to the Company was $384.0 million compared to the face value of $400.0 million.
4. Income Taxes
The Company provides for income taxes at the end of each interim period based on the estimated effective tax rate for the full fiscal year in addition to discrete events which impact the interim period. The Company’s effective tax rate differs from the U.S. statutory rate principally due to the rate impact of uncertain tax positions, valuation allowance changes and state taxes. Cumulative adjustments to the tax provision are recorded in the interim period in which a change in the estimated annual effective rate is determined. The Company’s tax benefit was $3,000 and $1.2 million for the three months ended March 31, 2015 and 2014, respectively.
In connection with the Company’s acquisition of the medical imaging business from Bristol-Myers Squibb Company, or BMS, in 2008, the Company obtained a tax indemnification agreement with BMS related to certain tax obligations arising prior to the acquisition of the Company, for which the Company has the primary legal obligation. The tax indemnification receivable is recognized within other long-term assets. The changes in the tax indemnification asset are recognized within other expense, net in the condensed consolidated statement of comprehensive income (loss). In accordance with the Company’s accounting policy, the change in the tax liability and penalties and interest associated with these obligations (net of any offsetting federal or state benefit) is recognized within the tax provision. Accordingly, as these reserves change, adjustments are included in the tax provision while the offsetting adjustment is included in other expense, net. Assuming that the receivable from BMS continues to be considered recoverable by the Company, there is no net effect on earnings related to these liabilities and no net cash outflows.
On March 13, 2014, New York State, BMS, the Company and a relator entered into a Stipulation and Settlement Agreement and other related agreements, or collectively the Settlement Documents, to resolve an investigation by the Office of the Attorney General of New York State, claims relating to certain New York State and New York City tax matters and related claims under the New York False Claims Act. The claims at issue arose during the period from January 1, 2002 through December 31, 2006, which predated the acquisition of the medical imaging business from BMS in January 2008 and are subject to the tax indemnification agreement described above. Pursuant to the Settlement Documents, BMS paid (on behalf of itself and the Company) $6.3 million, and neither BMS nor the Company admitted any liability. The Company received a full release from New York State, New York City and the relator with respect to the claims at issue.
During the three months ended March 31, 2015, BMS, on behalf of the Company, made payments totaling $1.8 million to a number of states in connection with state income tax settlements.
F-55
Table of Contents
5. Inventory
The Company includes within current assets the amount of inventory that is estimated to be utilized within twelve months. Inventory that will be utilized after twelve months is classified within other long-term assets.
Inventory, classified in inventory or other long-term assets, consisted of the following:
| (in thousands) |
March 31, 2015 |
December 31, 2014 |
||||||
| Raw materials |
$ | 5,690 | $ | 6,043 | ||||
| Work in process |
2,549 | 1,788 | ||||||
| Finished goods |
7,914 | 7,751 | ||||||
|
|
|
|
|
|||||
| Inventory |
16,153 | 15,582 | ||||||
| Other long-term assets |
1,156 | 1,156 | ||||||
|
|
|
|
|
|||||
| Total |
$ | 17,309 | $ | 16,738 | ||||
|
|
|
|
|
|||||
At both March 31, 2015 and December 31, 2014, inventories reported as other long-term assets included $1.2 million of raw materials.
6. Property, Plant and Equipment, net
Property, plant and equipment consisted of the following:
| (in thousands) |
March 31, 2015 |
December 31, 2014 |
||||||
| Land |
$ | 14,950 | $ | 14,950 | ||||
| Buildings |
67,604 | 67,571 | ||||||
| Machinery, equipment and fixtures |
65,844 | 65,179 | ||||||
| Construction in progress |
10,555 | 9,746 | ||||||
| Accumulated depreciation |
(66,851 | ) | (61,432 | ) | ||||
|
|
|
|
|
|||||
| Property, plant and equipment, net |
$ | 92,102 | $ | 96,014 | ||||
|
|
|
|
|
|||||
For each of the three month periods ended March 31, 2015 and 2014, depreciation expense related to property, plant and equipment was $5.7 million and $2.2 million, respectively.
Included within machinery, equipment and fixtures are spare parts of approximately $2.5 million at both March 31, 2015 and December 31, 2014. Spare parts include replacement parts relating to plant and equipment and are either recognized as an expense when consumed or re-classified and capitalized as part of the related plant and equipment and depreciated over a time period not exceeding the useful life of the related asset.
Fixed assets dedicated to research and development, or R&D, activities, which were impacted by the March 2013 R&D strategic shift, have a carrying value of $4.4 million as of March 31, 2015. The Company believes these fixed assets will be utilized for either internally funded ongoing R&D activities or R&D activities funded by a strategic partner. If the Company is not successful in finding a strategic partner and there are no alternative uses for these fixed assets, then they could be subject to impairment in the future.
Long-Lived Assets to Be Disposed of Other than by Sale
In November 2014, the Company announced its plans to decommission certain long-lived assets associated with its R&D operations in the United States. The Company expects the decommissioning to begin in the second half of 2015. As a result, the Company revised its estimates of the remaining useful lives of the affected long-lived assets to seven months. At March 31, 2015 and December 31, 2014, the net book value of these assets totaled $3.7 million and $7.4 million, respectively.
F-56
Table of Contents
7. Asset Retirement Obligations
The Company considers the legal obligation to remediate its facilities upon a decommissioning of its radioactive related operations as an asset retirement obligation. The operations of the Company have radioactive production facilities at its North Billerica, Massachusetts and San Juan, Puerto Rico sites.
The Company is required to provide the U.S. Nuclear Regulatory Commission and Massachusetts Department of Public Health financial assurance demonstrating the Company’s ability to fund the decommissioning of the North Billerica, Massachusetts production facility upon closure, although the Company does not intend to close the facility. The Company has provided this financial assurance in the form of a $28.2 million surety bond, which itself is currently secured by an $8.8 million unfunded Standby Letter of Credit provided to the third party issuer of the bond.
The fair value of a liability for asset retirement obligations is recognized in the period in which the liability is incurred. As of March 31, 2015, the liability is measured at the present value of the obligation expected to be incurred, of approximately $26.0 million, and is adjusted in subsequent periods as accretion expense is recorded. The corresponding asset retirement costs are capitalized as part of the carrying value of the related long-lived assets and depreciated over the asset’s useful life.
The following is a reconciliation of the Company’s asset retirement obligations for the three months ended March 31, 2015:
| (in thousands) |
||||
| Balance at January 1, 2015 |
$ | 7,435 | ||
| Accretion expense |
213 | |||
|
|
|
|||
| Balance at March 31, 2015 |
7,648 | |||
| Amounts included in accrued expenses and other liabilities |
(275 | ) | ||
|
|
|
|||
| Asset retirement obligation, long-term |
$ | 7,373 | ||
|
|
|
|||
8. Intangibles, net
Intangibles, net consisted of the following:
| March 31, 2015 | ||||||||||||||||
| (in thousands) |
Cost | Accumulated amortization |
Net | Amortization Method |
||||||||||||
| Trademarks |
$ | 13,540 | $ | 5,571 | $ | 7,969 | Straight-line | |||||||||
| Customer relationships |
104,768 | 89,329 | 15,439 | Accelerated | ||||||||||||
| Other patents |
42,780 | 40,606 | 2,174 | Straight-line | ||||||||||||
|
|
|
|
|
|
|
|||||||||||
| $ | 161,088 | $ | 135,506 | $ | 25,582 | |||||||||||
|
|
|
|
|
|
|
|||||||||||
| December 31, 2014 | ||||||||||||||||
| (in thousands) |
Cost | Accumulated amortization |
Net | Amortization Method |
||||||||||||
| Trademarks |
$ | 13,540 | $ | 5,116 | $ | 8,424 | Straight-line | |||||||||
| Customer relationships |
105,373 | 88,931 | 16,442 | Accelerated | ||||||||||||
| Other patents |
42,780 | 40,455 | 2,325 | Straight-line | ||||||||||||
|
|
|
|
|
|
|
|||||||||||
| $ | 161,693 | $ | 134,502 | $ | 27,191 | |||||||||||
|
|
|
|
|
|
|
|||||||||||
For the three months ended March 31, 2015 and 2014, the Company recorded amortization expense for its intangible assets of $1.5 million and $1.9 million, respectively.
F-57
Table of Contents
Expected future amortization expense related to the intangible assets is as follows:
| (in thousands) |
||||
| Remainder of 2015 |
$ | 4,477 | ||
| 2016 |
5,298 | |||
| 2017 |
3,491 | |||
| 2018 |
2,767 | |||
| 2019 |
1,896 | |||
| 2020 and thereafter |
7,653 | |||
|
|
|
|||
| $ | 25,582 | |||
|
|
|
|||
9. Accrued Expenses and Other Liabilities
Accrued expenses and other liabilities are comprised of the following:
| (in thousands) |
March 31, 2015 |
December 31, 2014 |
||||||
| Compensation and benefits |
$ | 6,646 | $ | 11,198 | ||||
| Accrued interest |
14,727 | 4,994 | ||||||
| Accrued professional fees |
1,284 | 1,508 | ||||||
| Research and development services |
162 | 248 | ||||||
| Freight, distribution and operations |
3,064 | 3,069 | ||||||
| Marketing expense |
1,043 | 978 | ||||||
| Accrued rebates, discounts and chargebacks |
2,034 | 2,164 | ||||||
| Other |
916 | 420 | ||||||
|
|
|
|
|
|||||
| $ | 29,876 | $ | 24,579 | |||||
|
|
|
|
|
|||||
10. Financing Arrangements
Senior Notes
LMI has $400.0 million in aggregate principal amount of Senior Notes, or the Notes, outstanding. The Notes bear interest at a rate of 9.750% per year, payable on May 15 and November 15 of each year. The Notes mature on May 15, 2017.
Revolving Line of Credit
As of March 31, 2015, LMI has a Facility with an aggregate principal amount not to exceed $50.0 million. The revolving loans under the Facility bear interest subject to a pricing grid based on average historical excess availability under the Facility, with pricing based from time to time at the election of the Company at (i) LIBOR plus a spread ranging from 2.00% or (ii) the Reference Rate (as defined in the agreement) plus 1.00%. The Facility also includes an unused line fee of 0.375%. The Facility expires on the earlier of (i) July 3, 2018 or (ii) if the outstanding Notes are not refinanced in full, the date that is 91 days before the maturity thereof, at which time all outstanding borrowings are due and payable.
As of March 31, 2015 and December 31, 2014, the Company has an unfunded Standby Letter of Credit for up to $8.8 million. The unfunded Standby Letter of Credit requires an annual fee, payable quarterly, which is set at LIBOR plus a spread of 2.00% and expires on February 5, 2016, which will automatically renew for a one year period at each anniversary date, unless the Company elects not to renew in writing within 60 days prior to that expiration.
F-58
Table of Contents
The Facility is secured by a pledge of substantially all of the assets of each of the Company, LMI and Lantheus Real Estate, including each entity’s accounts receivable, inventory and machinery and equipment, and is guaranteed by each of Lantheus Intermediate and Lantheus Real Estate. Borrowing capacity is determined by reference to a Borrowing Base, which is based on a percentage of certain eligible accounts receivable, inventory and machinery and equipment minus any reserves. As of March 31, 2015, the aggregate Borrowing Base was approximately $45.8 million, which was reduced by (i) an outstanding $8.8 million unfunded Standby Letter of Credit and (ii) an $8.1 million outstanding loan balance including interest, resulting in a net Borrowing Base availability of approximately $28.9 million.
11. Stockholders’ Equity
As of March 31, 2015, the authorized capital stock of the Company consisted of 60,000,000 shares of common stock, par value $0.001 per share, and 2,000,000 shares of preferred stock, par value $0.001 per share. The common stockholders are entitled to one vote per share.
12. Stock-Based Compensation
The Company’s employees are eligible to receive awards under the 2013 Equity Incentive Plan, or the 2013 Plan. The 2013 Plan is administered by the Board of Directors and permits the granting of nonqualified stock options, stock appreciation rights, or SARs, restricted stock, restricted stock units and dividend equivalent rights (“DERs”) to employees, officers, directors and consultants of the Company. The Board of Directors may, at its sole discretion, grant DERs with respect to any award and is treated as a separate award. On April 6, 2015, the 2013 Plan was amended to increase the number of shares authorized for issuance under the 2013 Plan from 2,700,000 to 3,700,000. Option awards under the 2013 Plan are granted with an exercise price equal to the fair value of the Company’s common stock at the date of grant, as determined by the Board of Directors. Time based option awards vest based on time, either four or five years, and performance based option awards vest based on the performance criteria specified in the grant. All option awards have a ten-year contractual term. The Company recognizes compensation costs for its time based awards on a straight-line basis equal to the vesting period. The compensation cost for performance based awards is recognized on a graded vesting basis, based on the probability of achieving the performance targets over the requisite service period for the entire award. The fair value of each option award is estimated on the date of grant using a Black-Scholes valuation model that uses the assumptions noted in the following table. Expected volatilities are based on the historic volatility of a selected peer group. Expected dividends represent the dividends expected to be issued at the date of grant. The expected term of options represents the period of time that options granted are expected to be outstanding. The risk-free interest rate assumption is the U.S. Treasury rate at the date of the grant which most closely resembles the expected life of the options.
The Company uses the following Black-Scholes inputs to determine the fair value of new stock option grants.
| Three Months Ended March 31, |
||||||||
| 2015 | 2014 | |||||||
| Expected volatility |
28 - 32 | % | 35 | % | ||||
| Expected dividends |
— | — | ||||||
| Expected life (in years) |
5.5 - 6.3 | 5.5 | ||||||
| Risk-free interest rate |
1.3 - 1.5 | % | 1.5 - 1.6 | % | ||||
F-59
Table of Contents
A summary of option activity for 2015 is presented below:
| Time Based | Performance Based |
Total | Weighted Average Exercise Price |
Weighted Average Remaining Contractual Term |
Aggregate Intrinsic Value |
|||||||||||||||||||
| Outstanding at January 1, 2015 |
3,221,690 | 1,080,730 | 4,302,420 | $ | 4.83 | 6.4 | $ | 3,979,000 | ||||||||||||||||
| Options granted |
113,123 | — | 113,123 | 4.42 | ||||||||||||||||||||
| Options cancelled |
— | — | — | — | ||||||||||||||||||||
| Options exercised |
— | — | — | — | ||||||||||||||||||||
| Options forfeited or expired |
(68,800 | ) | (23,800 | ) | (92,600 | ) | 7.50 | |||||||||||||||||
|
|
|
|
|
|
|
|||||||||||||||||||
| Outstanding at March 31, 2015 |
3,266,013 | 1,056,930 | 4,322,943 | 4.76 | 6.2 | $ | 4,112,000 | |||||||||||||||||
|
|
|
|
|
|
|
|||||||||||||||||||
| Vested and expected to vest at March 31, 2015 |
3,152,012 | 702,830 | 3,854,842 | 4.56 | 5.9 | $ | 4,108,000 | |||||||||||||||||
|
|
|
|
|
|
|
|||||||||||||||||||
| Exercisable at March 31, 2015 |
1,942,013 | 584,907 | 2,526,920 | 3.81 | 4.5 | $ | 4,078,000 | |||||||||||||||||
|
|
|
|
|
|
|
|||||||||||||||||||
The weighted average grant-date fair value of options granted during the three months ended March 31, 2015 and 2014 was $1.39 and $2.11, respectively.
Stock-based compensation expense for both time based and performance based awards was recognized in the condensed consolidated statements of comprehensive loss as follows:
| Three Months Ended March 31, |
||||||||
| (in thousands) |
2015 | 2014 | ||||||
| Cost of goods sold |
$ | (1 | ) | $ | 41 | |||
| Sales and marketing |
37 | 44 | ||||||
| General and administrative |
213 | 169 | ||||||
| Research and development |
28 | 30 | ||||||
|
|
|
|
|
|||||
| Total stock-based compensation expense |
$ | 277 | $ | 284 | ||||
|
|
|
|
|
|||||
13. Net Income (Loss) Per Share
Basic earnings (loss) per share is computed by dividing net income (loss) by the weighted average number of shares of common stock outstanding during the period. Diluted earnings per common share is computed by dividing net income by the weighted average number of shares of common stock outstanding during the period, plus the potential dilutive effect of other securities if those securities were converted or exercised. During periods in which the Company incurs net losses, both basic and diluted loss per share is calculated by dividing the net loss by the weighted average shares outstanding and potentially dilutive securities are excluded from the calculation because their effect would be antidilutive.
F-60
Table of Contents
| Three Months Ended March 31, |
||||||||
| (in thousands, except share and per share amounts) |
2015 | 2014 | ||||||
| Net income (loss) |
$ | 375 | $ | (1,285 | ) | |||
|
|
|
|
|
|||||
| Basic weighted average common shares outstanding |
50,807,503 | 50,803,484 | ||||||
| Effect of dilutive stock options |
908,824 | — | ||||||
|
|
|
|
|
|||||
| Diluted weighted average common shares outstanding |
51,716,327 | 50,803,484 | ||||||
|
|
|
|
|
|||||
| Basic income (loss) per common share |
$ | 0.01 | $ | (0.03 | ) | |||
|
|
|
|
|
|||||
| Diluted income (loss) per common share |
$ | 0.01 | $ | (0.03 | ) | |||
|
|
|
|
|
|||||
The weighted average number of common shares for the three months ended March 31, 2015 and 2014, did not include 2,113,019 and 3,866,398 options, respectively, because of their antidilutive effect.
14. Other Expense, net
Other expense, net consisted of the following:
| Three Months Ended March 31, |
||||||||
| (in thousands) |
2015 | 2014 | ||||||
| Foreign currency losses |
$ | (378 | ) | $ | (238 | ) | ||
| Tax indemnification expense |
(4 | ) | (175 | ) | ||||
| Other expense |
(1 | ) | (1 | ) | ||||
|
|
|
|
|
|||||
| Total other expense, net |
$ | (383 | ) | $ | (414 | ) | ||
|
|
|
|
|
|||||
15. Legal Proceedings and Contingencies
From time to time, the Company is a party to various legal proceedings arising in the ordinary course of business. In addition, the Company has in the past been, and may in the future be, subject to investigations by governmental and regulatory authorities, which expose it to greater risks associated with litigation, regulatory or other proceedings, as a result of which the Company could be required to pay significant fines or penalties. The outcome of litigation, regulatory or other proceedings cannot be predicted with certainty, and some lawsuits, claims, actions or proceedings may be disposed of unfavorably to the Company. In addition, intellectual property disputes often have a risk of injunctive relief which, if imposed against the Company, could materially and adversely affect its financial condition or results of operations. As of March 31, 2015, the Company had no material ongoing litigation in which the Company was a defendant or any material ongoing regulatory or other proceedings and had no knowledge of any investigations by government or regulatory authorities in which the Company is a target that could have a material adverse effect on its current business.
On December 16, 2010, LMI filed suit against one of its insurance carriers seeking to recover business interruption losses associated with the NRU reactor shutdown and the ensuing global Moly supply shortage. The claim is the result of the shutdown of the NRU reactor in Chalk River, Ontario. The NRU reactor was off-line from May 2009 until August 2010. The defendant answered the complaint on January 21, 2011, denying substantially all of the allegations, presenting certain defenses and requesting dismissal of the case with costs and disbursements. Discovery, including international discovery and related motion practice, went on for more than three years. The defendant filed a motion for summary judgment on July 14, 2014. The Company filed a memorandum of law in opposition to defendant’s motion for summary judgment on August 25, 2014. The defendant filed a reply memorandum of law in further support of its motion for summary judgment on September 15, 2014. Expert witness discovery was completed on October 31, 2014. On March 25, 2015, the
F-61
Table of Contents
United States District Court for the Southern District of New York granted defendant’s motion for summary judgment. On May 22, 2015, we filed a notice of appeal of the District Court decision with the United States Court of Appeals for the Second Circuit. The Company cannot be certain when, if ever, it will be able to recover for business interruption losses related to this matter and in what amount, if any.
16. Related Party Transactions
Avista, the Company’s majority shareholder, provides certain advisory services to the Company pursuant to an advisory services and monitoring agreement. The Company is required to pay an annual fee of $1.0 million and other reasonable and customary advisory fees, as applicable, paid on a quarterly basis. The initial term of the agreement is seven years. Upon termination, all remaining amounts owed under the agreement shall become due immediately. During each of the three months ended March 31, 2015 and 2014, the Company incurred costs associated with this agreement totaling $0.3 million. At March 31, 2015 and December 31, 2014, $8,000 and $10,000, respectively, was included in accrued expenses.
The Company purchases inventory supplies from VWR Scientific, or VWR. Avista and certain of its affiliates are principal owners of both VWR and the Company. The Company made purchases of $71,000 and $60,000 during each of the three months ended March 31, 2015 and 2014, respectively. At March 31, 2015 and December 31, 2014, $11,000 and $21,000, respectively, was included in accounts payable and accrued expenses.
The Company retains Marsh for insurance brokering and risk management. Donald Bailey, brother of the Company’s President and Chief Executive Officer, Jeffrey Bailey, is head of sales for Marsh’s U.S. and Canada division. During each of the three months ended March 31, 2015 and 2014, the Company paid Marsh $0.1 million. At both March 31, 2015 and December 31, 2014, a prepaid amount of $43,000 was included in other current assets.
17. Segment Information
The Company reports two operating segments, U.S. and International, based on geographic customer base. The results of these operating segments are regularly reviewed by the Company’s chief operating decision maker, the President and Chief Executive Officer. The Company’s segments derive revenues through the manufacturing, marketing, selling and distribution of medical imaging products, focused primarily on cardiovascular diagnostic imaging. The U.S. segment comprises 81.1% and 77.5% of consolidated revenues for the three months ended March 31, 2015 and 2014, respectively, and 91.3% and 90.4% of consolidated assets at March 31, 2015 and December 31, 2014, respectively. All goodwill has been allocated to the U.S. operating segment.
F-62
Table of Contents
Selected information for each business segment are as follows (in thousands):
| Three Months Ended March 31, |
||||||||
| 2015 | 2014 | |||||||
| Revenues |
||||||||
| U.S. |
$ | 65,788 | $ | 61,387 | ||||
| International |
14,156 | 16,525 | ||||||
|
|
|
|
|
|||||
| Total revenue, including inter-segment |
79,944 | 77,912 | ||||||
| Less inter-segment revenue |
(5,121 | ) | (4,576 | ) | ||||
|
|
|
|
|
|||||
| $ | 74,823 | $ | 73,336 | |||||
|
|
|
|
|
|||||
| Revenues from external customers |
||||||||
| U.S. |
$ | 60,667 | $ | 56,811 | ||||
| International |
14,156 | 16,525 | ||||||
|
|
|
|
|
|||||
| $ | 74,823 | $ | 73,336 | |||||
|
|
|
|
|
|||||
| Operating income |
||||||||
| U.S. |
$ | 12,679 | $ | 7,020 | ||||
| International |
(1,474 | ) | 1,299 | |||||
|
|
|
|
|
|||||
| Total operating income, including inter-segment |
11,205 | 8,319 | ||||||
| Inter-segment operating income |
173 | 170 | ||||||
|
|
|
|
|
|||||
| Operating income |
11,378 | 8,489 | ||||||
| Interest expense, net |
(10,623 | ) | (10,552 | ) | ||||
| Other expense, net |
(383 | ) | (414 | ) | ||||
|
|
|
|
|
|||||
| Income (loss) before income taxes |
$ | 372 | $ | (2,477 | ) | |||
|
|
|
|
|
|||||
| March 31, 2015 |
December 31, 2014 |
|||||||
| Total assets |
||||||||
| U.S. |
$ | 228,876 | $ | 225,546 | ||||
| International |
21,782 | 24,024 | ||||||
|
|
|
|
|
|||||
| $ | 250,658 | $ | 249,570 | |||||
|
|
|
|
|
|||||
18. Guarantor Financial Information
The Notes, issued by LMI, are guaranteed by Lantheus Intermediate, or the Parent Guarantor, and Lantheus Real Estate, one of Lantheus Intermediate’s wholly-owned consolidated subsidiaries, or the Guarantor Subsidiary. The guarantees are full and unconditional and joint and several. The following supplemental financial information sets forth, on a condensed consolidating basis, balance sheet information as of March 31, 2015 and December 31, 2014, and comprehensive income (loss) and cash flow information for the three months ended March 31, 2015 and 2014 for Holdings, or the Parent Non-Guarantor, Lantheus Intermediate, LMI, the Guarantor Subsidiary and Lantheus Intermediate’s other wholly-owned subsidiaries, or the Non-Guarantor Subsidiaries. The condensed consolidating financial statements have been prepared on the same basis as the condensed consolidated financial statements of Holdings. The equity method of accounting is followed within this financial information.
F-63
Table of Contents
Condensed Consolidating Balance Sheet Information
March 31, 2015
| (in thousands) |
Holdings (Non- Guarantor Parent) |
Lantheus Intermediate (Parent Guarantor) |
LMI (Issuer) |
Guarantor Subsidiary |
Non- Guarantor Subsidiaries |
Eliminations | Total | |||||||||||||||||||||
| Assets: |
||||||||||||||||||||||||||||
| Current assets |
||||||||||||||||||||||||||||
| Cash and cash equivalents |
$ | 1,922 | $ | — | $ | 25,040 | $ | — | $ | 3,781 | $ | — | $ | 30,743 | ||||||||||||||
| Accounts receivable, net |
— | — | 29,311 | — | 9,090 | — | 38,401 | |||||||||||||||||||||
| Intercompany accounts receivable |
— | — | 9,021 | — | — | (9,021 | ) | — | ||||||||||||||||||||
| Inventory |
— | — | 13,540 | — | 2,613 | — | 16,153 | |||||||||||||||||||||
| Income tax receivable |
— | — | 93 | — | 64 | — | 157 | |||||||||||||||||||||
| Deferred tax assets |
— | — | 239 | — | 16 | — | 255 | |||||||||||||||||||||
| Other current assets |
— | — | 4,386 | — | 409 | — | 4,795 | |||||||||||||||||||||
|
|
|
|
|
|
|
|
|
|
|
|
|
|
|
|||||||||||||||
| Total current assets |
1,922 | — | 81,630 | — | 15,973 | (9,021 | ) | 90,504 | ||||||||||||||||||||
| Property, plant and equipment, net |
— | — | 72,354 | 15,515 | 4,233 | — | 92,102 | |||||||||||||||||||||
| Capitalized software development costs, net |
— | — | 2,268 | — | — | — | 2,268 | |||||||||||||||||||||
| Intangibles, net |
— | — | 23,518 | — | 2,064 | — | 25,582 | |||||||||||||||||||||
| Goodwill |
— | — | 15,714 | — | — | — | 15,714 | |||||||||||||||||||||
| Deferred financing costs |
— | — | 6,668 | — | — | — | 6,668 | |||||||||||||||||||||
| Deferred tax assets |
— | — | 277 | — | 57 | — | 334 | |||||||||||||||||||||
| Investment in subsidiaries |
(240,543 | ) | (240,543 | ) | 29,931 | — | — | 451,155 | — | |||||||||||||||||||
| Intercompany note receivable |
— | — | — | — | 5,683 | (5,683 | ) | — | ||||||||||||||||||||
| Other long-term assets |
— | — | 17,309 | — | 177 | — | 17,486 | |||||||||||||||||||||
|
|
|
|
|
|
|
|
|
|
|
|
|
|
|
|||||||||||||||
| Total assets |
$ | (238,621 | ) | $ | (240,543 | ) | $ | 249,669 | $ | 15,515 | $ | 28,187 | $ | 436,451 | $ | 250,658 | ||||||||||||
|
|
|
|
|
|
|
|
|
|
|
|
|
|
|
|||||||||||||||
| Liabilities and (deficit) equity: |
||||||||||||||||||||||||||||
| Current liabilities |
||||||||||||||||||||||||||||
| Line of credit |
$ | — | $ | — | $ | 8,000 | $ | — | $ | — | $ | — | $ | 8,000 | ||||||||||||||
| Accounts payable |
— | — | 12,005 | — | 1,048 | — | 13,053 | |||||||||||||||||||||
| Intercompany accounts payable |
— | — | — | — | 9,021 | (9,021 | ) | — | ||||||||||||||||||||
| Accrued expenses and other liabilities |
— | — | 27,093 | — | 2,783 | — | 29,876 | |||||||||||||||||||||
| Deferred tax liability |
— | — | — | — | 148 | — | 148 | |||||||||||||||||||||
| Deferred revenue |
— | — | 129 | — | — | — | 129 | |||||||||||||||||||||
|
|
|
|
|
|
|
|
|
|
|
|
|
|
|
|||||||||||||||
| Total current liabilities |
— | — | 47,227 | — | 13,000 | (9,021 | ) | 51,206 | ||||||||||||||||||||
| Asset retirement obligations |
— | — | 7,162 | — | 211 | — | 7,373 | |||||||||||||||||||||
| Long-term debt, net |
— | — | 399,348 | — | — | — | 399,348 | |||||||||||||||||||||
| Dividend payable |
355 | — | — | — | — | — | 355 | |||||||||||||||||||||
| Intercompany note payable |
— | — | 5,683 | — | — | (5,683 | ) | — | ||||||||||||||||||||
| Deferred tax liability |
— | — | 239 | — | 7 | — | 246 | |||||||||||||||||||||
| Other long-term liabilities |
— | — | 30,553 | — | 553 | — | 31,106 | |||||||||||||||||||||
|
|
|
|
|
|
|
|
|
|
|
|
|
|
|
|||||||||||||||
| Total liabilities |
355 | — | 490,212 | — | 13,771 | (14,704 | ) | 489,634 | ||||||||||||||||||||
| (Deficit) equity |
(238,976 | ) | (240,543 | ) | (240,543 | ) | 15,515 | 14,416 | 451,155 | (238,976 | ) | |||||||||||||||||
|
|
|
|
|
|
|
|
|
|
|
|
|
|
|
|||||||||||||||
| Total liabilities and (deficit) equity |
$ | (238,621 | ) | $ | (240,543 | ) | $ | 249,669 | $ | 15,515 | $ | 28,187 | $ | 436,451 | $ | 250,658 | ||||||||||||
|
|
|
|
|
|
|
|
|
|
|
|
|
|
|
|||||||||||||||
F-64
Table of Contents
Consolidating Balance Sheet Information
December 31, 2014
| (in thousands) |
Holdings (Non- Guarantor Parent) |
Lantheus Intermediate (Parent Guarantor) |
LMI (Issuer) |
Guarantor Subsidiary |
Non- Guarantor Subsidiaries |
Eliminations | Total | |||||||||||||||||||||
| Assets: |
||||||||||||||||||||||||||||
| Current assets |
||||||||||||||||||||||||||||
| Cash and cash equivalents |
$ | 1,922 | $ | — | $ | 12,586 | $ | — | $ | 5,231 | $ | — | $ | 19,739 | ||||||||||||||
| Accounts receivable, net |
— | — | 32,280 | — | 9,260 | — | 41,540 | |||||||||||||||||||||
| Intercompany accounts receivable |
— | — | 7,444 | — | — | (7,444 | ) | — | ||||||||||||||||||||
| Inventory |
— | — | 12,638 | — | 2,944 | — | 15,582 | |||||||||||||||||||||
| Income tax receivable |
— | — | 178 | — | 69 | — | 247 | |||||||||||||||||||||
| Deferred tax assets |
— | — | 239 | — | 17 | — | 256 | |||||||||||||||||||||
| Other current assets |
132 | — | 3,544 | — | 195 | — | 3,871 | |||||||||||||||||||||
|
|
|
|
|
|
|
|
|
|
|
|
|
|
|
|||||||||||||||
| Total current assets |
2,054 | — | 68,909 | — | 17,716 | (7,444 | ) | 81,235 | ||||||||||||||||||||
| Property, plant and equipment, net |
— | — | 75,811 | 15,535 | 4,668 | — | 96,014 | |||||||||||||||||||||
| Capitalized software development costs, net |
— | — | 2,421 | — | — | — | 2,421 | |||||||||||||||||||||
| Intangibles, net |
— | — | 24,891 | — | 2,300 | — | 27,191 | |||||||||||||||||||||
| Goodwill |
— | — | 15,714 | — | — | — | 15,714 | |||||||||||||||||||||
| Deferred financing costs |
— | — | 7,349 | — | — | — | 7,349 | |||||||||||||||||||||
| Deferred tax assets |
— | — | 277 | — | 51 | — | 328 | |||||||||||||||||||||
| Investment in subsidiaries |
(240,969 | ) | (240,969 | ) | 32,511 | — | — | 449,427 | — | |||||||||||||||||||
| Intercompany note receivable |
— | — | — | — | 5,626 | (5,626 | ) | — | ||||||||||||||||||||
| Other long-term assets |
— | — | 19,132 | — | 186 | — | 19,318 | |||||||||||||||||||||
|
|
|
|
|
|
|
|
|
|
|
|
|
|
|
|||||||||||||||
| Total assets |
$ | (238,915 | ) | $ | (240,969 | ) | $ | 247,015 | $ | 15,535 | $ | 30,547 | $ | 436,357 | $ | 249,570 | ||||||||||||
|
|
|
|
|
|
|
|
|
|
|
|
|
|
|
|||||||||||||||
| Liabilities and (deficit) equity: |
||||||||||||||||||||||||||||
| Current liabilities |
||||||||||||||||||||||||||||
| Line of credit |
$ | — | $ | — | $ | 8,000 | $ | — | $ | — | $ | — | $ | 8,000 | ||||||||||||||
| Accounts payable |
— | — | 14,027 | — | 1,638 | — | 15,665 | |||||||||||||||||||||
| Intercompany accounts payable |
— | — | — | — | 7,444 | (7,444 | ) | — | ||||||||||||||||||||
| Accrued expenses and other liabilities |
— | — | 21,022 | — | 3,557 | — | 24,579 | |||||||||||||||||||||
| Deferred tax liability |
— | — | — | — | 152 | — | 152 | |||||||||||||||||||||
| Deferred revenue |
— | — | 132 | — | — | — | 132 | |||||||||||||||||||||
|
|
|
|
|
|
|
|
|
|
|
|
|
|
|
|||||||||||||||
| Total current liabilities |
— | — | 43,181 | — | 12,791 | (7,444 | ) | 48,528 | ||||||||||||||||||||
| Asset retirement obligations |
— | — | 7,232 | — | 203 | — | 7,435 | |||||||||||||||||||||
| Long-term debt, net |
— | — | 399,280 | — | — | — | 399,280 | |||||||||||||||||||||
| Dividend payable |
355 | — | — | — | — | — | 355 | |||||||||||||||||||||
| Intercompany note payable |
— | — | 5,626 | — | — | (5,626 | ) | — | ||||||||||||||||||||
| Deferred tax liability |
— | — | 239 | — | 8 | — | 247 | |||||||||||||||||||||
| Other long-term liabilities |
— | — | 32,426 | — | 569 | — | 32,995 | |||||||||||||||||||||
|
|
|
|
|
|
|
|
|
|
|
|
|
|
|
|||||||||||||||
| Total liabilities |
355 | — | 487,984 | — | 13,571 | (13,070 | ) | 488,840 | ||||||||||||||||||||
| (Deficit) equity |
(239,270 | ) | (240,969 | ) | (240,969 | ) | 15,535 | 16,976 | 449,427 | (239,270 | ) | |||||||||||||||||
|
|
|
|
|
|
|
|
|
|
|
|
|
|
|
|||||||||||||||
| Total liabilities and (deficit) equity |
$ | (238,915 | ) | $ | (240,969 | ) | $ | 247,015 | $ | 15,535 | $ | 30,547 | $ | 436,357 | $ | 249,570 | ||||||||||||
|
|
|
|
|
|
|
|
|
|
|
|
|
|
|
|||||||||||||||
F-65
Table of Contents
Condensed Consolidating Statement of Comprehensive Income (Loss)
Three Months Ended March 31, 2015
| (in thousands) |
Holdings (Non- Guarantor Parent) |
Lantheus Intermediate (Parent Guarantor) |
LMI (Issuer) |
Guarantor Subsidiary |
Non- Guarantor Subsidiaries |
Eliminations | Total | |||||||||||||||||||||
| Revenues |
$ | — | $ | — | $ | 67,825 | $ | — | $ | 12,119 | $ | (5,121 | ) | $ | 74,823 | |||||||||||||
| Cost of goods sold |
— | — | 31,717 | — | 12,458 | (5,121 | ) | 39,054 | ||||||||||||||||||||
|
|
|
|
|
|
|
|
|
|
|
|
|
|
|
|||||||||||||||
| Gross profit |
— | — | 36,108 | — | (339 | ) | — | 35,769 | ||||||||||||||||||||
| Operating expenses |
||||||||||||||||||||||||||||
| Sales and marketing expenses |
— | — | 8,198 | — | 874 | — | 9,072 | |||||||||||||||||||||
| General and administrative expenses |
282 | — | 8,438 | 20 | 383 | — | 9,123 | |||||||||||||||||||||
| Research and development expenses |
— | — | 6,015 | — | 181 | — | 6,196 | |||||||||||||||||||||
|
|
|
|
|
|
|
|
|
|
|
|
|
|
|
|||||||||||||||
| Operating income (loss) |
(282 | ) | — | 13,457 | (20 | ) | (1,777 | ) | — | 11,378 | ||||||||||||||||||
| Interest expense, net |
— | — | (10,688 | ) | — | 65 | — | (10,623 | ) | |||||||||||||||||||
| Other income (expense), net |
— | — | 23 | — | (406 | ) | — | (383 | ) | |||||||||||||||||||
| Equity in earnings (losses) of affiliates |
657 | 657 | (2,222 | ) | — | — | 908 | — | ||||||||||||||||||||
|
|
|
|
|
|
|
|
|
|
|
|
|
|
|
|||||||||||||||
| Income (loss) income before income taxes |
375 | 657 | 570 | (20 | ) | (2,118 | ) | 908 | 372 | |||||||||||||||||||
| Provision (benefit) for income taxes |
— | — | (87 | ) | — | 84 | — | (3 | ) | |||||||||||||||||||
|
|
|
|
|
|
|
|
|
|
|
|
|
|
|
|||||||||||||||
| Net income (loss) |
375 | 657 | 657 | (20 | ) | (2,202 | ) | 908 | 375 | |||||||||||||||||||
|
|
|
|
|
|
|
|
|
|
|
|
|
|
|
|||||||||||||||
| Foreign currency translation |
— | — | — | — | (358 | ) | — | (358 | ) | |||||||||||||||||||
| Equity in other comprehensive income (loss) of subsidiaries |
(358 | ) | (358 | ) | (358 | ) | — | — | 1,074 | — | ||||||||||||||||||
|
|
|
|
|
|
|
|
|
|
|
|
|
|
|
|||||||||||||||
| Total other comprehensive income (loss) |
$ | 17 | $ | 299 | $ | 299 | $ | (20 | ) | $ | (2,560 | ) | $ | 1,982 | $ | 17 | ||||||||||||
|
|
|
|
|
|
|
|
|
|
|
|
|
|
|
|||||||||||||||
F-66
Table of Contents
Condensed Consolidating Statement of Comprehensive Income (Loss)
Three Months Ended March 31, 2014
| (in thousands) |
Holdings (Non- Guarantor Parent) |
Lantheus Intermediate (Parent Guarantor) |
LMI (Issuer) |
Guarantor Subsidiary |
Non- Guarantor Subsidiaries |
Eliminations | Total | |||||||||||||||||||||
| Revenues |
$ | — | $ | — | $ | 63,857 | $ | — | $ | 14,055 | $ | (4,576 | ) | $ | 73,336 | |||||||||||||
| Cost of goods sold |
— | — | 35,539 | — | 12,312 | (4,576 | ) | 43,275 | ||||||||||||||||||||
|
|
|
|
|
|
|
|
|
|
|
|
|
|
|
|||||||||||||||
| Gross profit |
— | — | 28,318 | — | 1,743 | — | 30,061 | |||||||||||||||||||||
| Operating expenses |
||||||||||||||||||||||||||||
| Sales and marketing expenses |
— | — | 8,489 | — | 1,009 | — | 9,498 | |||||||||||||||||||||
| General and administrative expenses |
— | — | 8,261 | 20 | 571 | — | 8,852 | |||||||||||||||||||||
| Research and development expenses |
— | — | 3,114 | — | 108 | — | 3,222 | |||||||||||||||||||||
|
|
|
|
|
|
|
|
|
|
|
|
|
|
|
|||||||||||||||
| Operating income (loss) |
— | — | 8,454 | (20 | ) | 55 | — | 8,489 | ||||||||||||||||||||
| Interest expense, net |
— | — | (10,618 | ) | — | 66 | — | (10,552 | ) | |||||||||||||||||||
| Other income (expense), net |
— | — | (177 | ) | — | (237 | ) | — | (414 | ) | ||||||||||||||||||
| Equity in earnings (losses) of affiliates |
(1,285 | ) | (1,285 | ) | (164 | ) | — | — | 2,734 | — | ||||||||||||||||||
|
|
|
|
|
|
|
|
|
|
|
|
|
|
|
|||||||||||||||
| Income (loss) income before income taxes |
(1,285 | ) | (1,285 | ) | (2,505 | ) | (20 | ) | (116 | ) | 2,734 | (2,477 | ) | |||||||||||||||
| Provision (benefit) for income taxes |
— | — | (1,220 | ) | — | 28 | — | (1,192 | ) | |||||||||||||||||||
|
|
|
|
|
|
|
|
|
|
|
|
|
|
|
|||||||||||||||
| Net income (loss) |
(1,285 | ) | (1,285 | ) | (1,285 | ) | (20 | ) | (144 | ) | 2,734 | (1,285 | ) | |||||||||||||||
|
|
|
|
|
|
|
|
|
|
|
|
|
|
|
|||||||||||||||
| Foreign currency translation |
— | — | — | — | (271 | ) | — | (271 | ) | |||||||||||||||||||
| Equity in other comprehensive income (loss) of subsidiaries |
(271 | ) | (271 | ) | (271 | ) | — | — | 813 | — | ||||||||||||||||||
|
|
|
|
|
|
|
|
|
|
|
|
|
|
|
|||||||||||||||
| Total other comprehensive income (loss) |
$ | (1,556 | ) | $ | (1,556 | ) | $ | (1,556 | ) | $ | (20 | ) | $ | (415 | ) | $ | 3,547 | $ | (1,556 | ) | ||||||||
|
|
|
|
|
|
|
|
|
|
|
|
|
|
|
|||||||||||||||
F-67
Table of Contents
Condensed Consolidating Cash Flow Information
Three Months Ended March 31, 2015
| Holdings (Non- Guarantor Parent) |
Lantheus Intermediate (Parent Guarantor) |
LMI (Issuer) |
Guarantor Subsidiary |
Non-Guarantor Subsidiaries |
Eliminations | Total | ||||||||||||||||||||||
| (in thousands) | ||||||||||||||||||||||||||||
| Cash provided by (used in) operating activities |
$ | — | $ | — | $ | 16,289 | $ | — | $ | (1,132 | ) | $ | — | $ | 15,157 | |||||||||||||
|
|
|
|
|
|
|
|
|
|
|
|
|
|
|
|||||||||||||||
| Cash flows from investing activities |
||||||||||||||||||||||||||||
| Capital expenditures |
— | — | (3,376 | ) | — | (122 | ) | — | (3,498 | ) | ||||||||||||||||||
| Payments from subsidiary |
441 | 441 | — | — | — | (882 | ) | — | ||||||||||||||||||||
|
|
|
|
|
|
|
|
|
|
|
|
|
|
|
|||||||||||||||
| Cash provided by (used in) investing activities |
441 | 441 | (3,376 | ) | — | (122 | ) | (882 | ) | (3,498 | ) | |||||||||||||||||
|
|
|
|
|
|
|
|
|
|
|
|
|
|
|
|||||||||||||||
| Cash flows from financing activities |
||||||||||||||||||||||||||||
| Payments on note payable |
— | — | (18 | ) | — | — | — | (18 | ) | |||||||||||||||||||
| Payments for offering costs |
(441 | ) | — | — | — | — | — | (441 | ) | |||||||||||||||||||
| Payments to parent |
— | (441 | ) | (441 | ) | — | — | 882 | — | |||||||||||||||||||
|
|
|
|
|
|
|
|
|
|
|
|
|
|
|
|||||||||||||||
| Cash provided by (used in) financing activities |
(441 | ) | (441 | ) | (459 | ) | — | — | 882 | (459 | ) | |||||||||||||||||
|
|
|
|
|
|
|
|
|
|
|
|
|
|
|
|||||||||||||||
| Effect of foreign exchange rate on cash |
— | — | — | — | (196 | ) | — | (196 | ) | |||||||||||||||||||
|
|
|
|
|
|
|
|
|
|
|
|
|
|
|
|||||||||||||||
| Increase (decrease) in cash and cash equivalents |
— | — | 12,454 | — | (1,450 | ) | — | 11,004 | ||||||||||||||||||||
| Cash and cash equivalents, beginning of year |
1,922 | — | 12,586 | — | 5,231 | — | 19,739 | |||||||||||||||||||||
|
|
|
|
|
|
|
|
|
|
|
|
|
|
|
|||||||||||||||
| Cash and cash equivalents, end of year |
$ | 1,922 | $ | — | $ | 25,040 | $ | — | $ | 3,781 | $ | — | $ | 30,743 | ||||||||||||||
|
|
|
|
|
|
|
|
|
|
|
|
|
|
|
|||||||||||||||
F-68
Table of Contents
Condensed Consolidating Cash Flow Information
Three Months Ended March 31, 2014
| Holdings (Non- Guarantor Parent) |
Lantheus Intermediate (Parent Guarantor) |
LMI (Issuer) |
Guarantor Subsidiary |
Non-Guarantor Subsidiaries |
Eliminations | Total | ||||||||||||||||||||||
| (in thousands) | ||||||||||||||||||||||||||||
| Cash provided by (used in) operating activities |
$ | (45 | ) | $ | — | $ | 1,797 | $ | — | $ | (1,812 | ) | $ | — | $ | (60 | ) | |||||||||||
|
|
|
|
|
|
|
|
|
|
|
|
|
|
|
|||||||||||||||
| Cash flows from investing activities |
||||||||||||||||||||||||||||
| Capital expenditures |
— | — | (1,465 | ) | — | (17 | ) | — | (1,482 | ) | ||||||||||||||||||
| Payments from subsidiary |
45 | 45 | — | — | — | (90 | ) | — | ||||||||||||||||||||
| Proceeds from sale of property, plant and equipment |
— | — | 20 | — | — | — | 20 | |||||||||||||||||||||
|
|
|
|
|
|
|
|
|
|
|
|
|
|
|
|||||||||||||||
| Cash provided by (used in) investing activities |
45 | 45 | (1,445 | ) | — | (17 | ) | (90 | ) | (1,462 | ) | |||||||||||||||||
|
|
|
|
|
|
|
|
|
|
|
|
|
|
|
|||||||||||||||
| Cash flows from financing activities |
||||||||||||||||||||||||||||
| Payments on note payable |
— | — | (18 | ) | — | — | — | (18 | ) | |||||||||||||||||||
| Proceeds from issuance of common stock |
13 | — | — | — | — | — | 13 | |||||||||||||||||||||
| Payments to parent |
— | (45 | ) | (45 | ) | — | — | 90 | — | |||||||||||||||||||
|
|
|
|
|
|
|
|
|
|
|
|
|
|
|
|||||||||||||||
| Cash provided by (used in) financing activities |
13 | (45 | ) | (63 | ) | — | — | — | (5 | ) | ||||||||||||||||||
|
|
|
|
|
|
|
|
|
|
|
|
|
|
|
|||||||||||||||
| Effect of foreign exchange rate on cash |
— | — | — | — | (41 | ) | — | (41 | ) | |||||||||||||||||||
|
|
|
|
|
|
|
|
|
|
|
|
|
|
|
|||||||||||||||
| Increase (decrease) in cash and cash equivalents |
13 | — | 289 | — | (1,870 | ) | — | (1,568 | ) | |||||||||||||||||||
| Cash and cash equivalents, beginning of year |
1,909 | — | 11,995 | — | 4,674 | — | 18,578 | |||||||||||||||||||||
|
|
|
|
|
|
|
|
|
|
|
|
|
|
|
|||||||||||||||
| Cash and cash equivalents, end of year |
$ | 1,922 | $ | — | $ | 12,284 | $ | — | $ | 2,804 | $ | — | $ | 17,010 | ||||||||||||||
|
|
|
|
|
|
|
|
|
|
|
|
|
|
|
|||||||||||||||
19. Subsequent Events
The Company evaluated subsequent events through June 5, 2015, the date these financial statements were available to be issued, and June 15, 2015, the date on which the Company’s Board of Directors approved a reverse stock split discussed below.
On June 15, 2015, the Company’s Board of Directors approved a merger whereby the Company’s direct, wholly-owned subsidiary, Lantheus MI Intermediate, Inc. (the direct parent of LMI) will merge with and into the Company, and the Company will be the surviving entity of the merger, and each share of the Company’s common stock outstanding immediately prior to the merger (other than shares held in treasury) will be converted into the right to receive shares of the Company’s newly issued common stock (tentatively set at a conversion factor of 0.355872-for-1), with any fractional shares rounded down, and shares held in treasury will be cancelled and retired to be effective upon consummation of the Company’s initial public offering. All share and per share data shown in the accompanying consolidated interim financial statements and related notes have not been retroactively revised to reflect the merger.
F-69
Table of Contents

Table of Contents
7,894,736 Shares
Lantheus Holdings, Inc.
Common Stock
PRELIMINARY PROSPECTUS
, 2015
Credit Suisse
Jefferies
RBC Capital Markets
Wells Fargo Securities
Baird
Until , 2015 (25 days after the date of this prospectus), all dealers that buy, sell or trade shares of our common stock, whether or not participating in this offering, may be required to deliver a prospectus. This is in addition to the dealers’ obligation to deliver a prospectus when acting as underwriters and with respect to their unsold allotments or subscriptions.
Table of Contents
PART II
INFORMATION NOT REQUIRED IN PROSPECTUS
Item 13. Other Expenses of Issuance and Distribution.
The expenses, other than underwriting commissions, expected to be incurred by Lantheus Holdings, Inc., or the Registrant, in connection with the issuance and distribution of the securities being registered under this Registration Statement are estimated to be as follows:
| Securities and Exchange Commission Registration Fee |
$ | 10,022 | ||
| Financial Industry Regulatory Authority, Inc. Filing Fee |
$ | 37,160 | ||
| NASDAQ Application and Listing Fee |
$ | 233,000 | ||
| Printing and Engraving |
$ | 563,000 | ||
| Legal Fees and Expenses |
$ | 2,001,000 | ||
| Accounting Fees and Expenses |
$ | 1,148,000 | ||
| Transfer Agent and Registrar Fees |
$ | 5,000 | ||
| Miscellaneous |
$ | 76,318 | ||
|
|
|
|||
| Total |
$ | 4,101,000 |
Item 14. Indemnification of Directors and Officers.
The Registrant is governed by the Delaware General Corporation Law, or DGCL. Section 145 of the DGCL provides that a corporation may indemnify any person, including an officer or director, who was or is, or is threatened to be made, a party to any threatened, pending or completed legal action, suit or proceeding, whether civil, criminal, administrative or investigative (other than an action by or in the right of such corporation), by reason of the fact that such person was or is an officer, director, employee or agent of such corporation or is or was serving at the request of such corporation as a director, officer, employee or agent of another corporation or enterprise. The indemnity may include expenses (including attorneys’ fees), judgments, fines and amounts paid in settlement actually and reasonably incurred by such person in connection with such action, suit or proceeding, provided such officer, director, employee or agent acted in good faith and in a manner such person reasonably believed to be in, or not opposed to, the corporation’s best interest and, for criminal proceedings, had no reasonable cause to believe that such person’s conduct was unlawful. A Delaware corporation may indemnify any person, including an officer or director, who was or is, or is threatened to be made, a party to any threatened, pending or contemplated action or suit by or in the right of such corporation, under the same conditions, except that such indemnification is limited to expenses (including attorneys’ fees) actually and reasonably incurred by such person, and except that no indemnification is permitted without judicial approval if such person is adjudged to be liable to such corporation. Where an officer or director of a corporation is successful, on the merits or otherwise, in the defense of any action, suit or proceeding referred to above, or any claim, issue or matter therein, the corporation must indemnify that person against the expenses (including attorneys’ fees) which such officer or director actually and reasonably incurred in connection therewith.
The Registrant’s certificate of incorporation authorizes the indemnification of its officers and directors, consistent with Section 145 of the DGCL. Reference is made to Section 102(b)(7) of the DGCL, which enables a corporation in its original certificate of incorporation or an amendment thereto to eliminate or limit the personal liability of a director for violations of the director’s fiduciary duty, except (i) for any breach of the director’s duty of loyalty to the corporation or its stockholders, (ii) for acts or omissions not in good faith or which involve intentional misconduct or a knowing violation of law, (iii) pursuant to Section 174 of the DGCL, which provides for liability of directors for unlawful payments of dividends of unlawful stock purchase or redemptions or (iv) for any transaction from which a director derived an improper personal benefit. As permitted by the DGCL, we have included in our certificate of incorporation a provision to eliminate the personal liability of our directors for
II-1
Table of Contents
monetary damages for breach of their fiduciary duties as directors, subject to certain exceptions. In addition, our certificate of incorporation and bylaws provide that we are required to indemnify our officers and directors under certain circumstances, including those circumstances in which indemnification would otherwise be discretionary, and we are required to advance expenses to our officers and directors as incurred in connection with proceedings against them for which they may be indemnified.
The Registrant intends to enter into indemnification agreements with each of its directors. These agreements, among other things, will require the Registrant to indemnify each director to the fullest extent permitted by Delaware law, including indemnification of expenses such as attorneys’ fees, judgments, fines and settlement amounts incurred by the director in any action or proceeding, including any action or proceeding by or in right of the Registrant, arising out of the person’s services as a director.
The Registrant maintains directors’ and officers’ liability insurance for the benefit of its directors and officers.
The proposed form of Underwriting Agreement to be filed as Exhibit 1.1 to this Registration Statement provides for indemnification to the Registrant’s directors and officers by the underwriters against certain liabilities.
Item 15. Recent Sales of Unregistered Securities.
During the three years preceding the filing of this registration statement, the Registrant has not issued its securities without registration under the Securities Act except as described below. After the effectiveness of this Registration Statement on Form S-1 and prior to the consummation of the Registrant’s initial public offering, the Registrant will effect a corporate reorganization, whereby its direct, wholly-owned subsidiary, Lantheus MI Intermediate, Inc. (the direct parent of Lantheus Medical Imaging, Inc.) will merge with and into the Registrant, and the Registrant will be the surviving entity of the merger, and each share of the Registrant’s common stock outstanding immediately prior to the merger (other than shares held in treasury) will be converted into the right to receive 0.355872 shares of the Registrant newly issued common stock, with any fractional shares rounded down (which equates to a 0.355872-for-1 reverse stock split), and shares held in treasury will be cancelled and retired. The following share numbers and prices of the Registrant’s common stock are based upon an assumed initial public offering price of $9.50 (the midpoint of the price range set forth on the cover of this prospectus) and the foregoing merger and reverse stock split:
| 1. | On July 10, 2012, the Registrant issued 695 shares of common stock at an exercise price of $19.22 per share pursuant to a cashless exercise of options held by a former employee. On February 4, 2013, the Registrant repurchased the shares at a price of $21.16 per share. |
| 2. | On October 12, 2012, the Registrant 21,352 sold shares of common stock at a price of $21.13 per share to a new director of the Registrant. |
| 3. | On March 22, 2013, the Registrant issued 120,163 shares of common stock at an exercise price of $5.62 per share pursuant to a cashless exercise of options held by a former employee. |
| 4. | On May 8, 2013, the Registrant sold 20,933 shares of common stock at a price of $19.11 per share to a new officer of the Registrant. |
| 5. | On May 14, 2013, the Registrant issued 39,169 shares of common stock at an exercise price of $5.62 per share pursuant to a cashless exercise of options held by a former employee. |
| 6. | On February 24, 2013, the Registrant issued 4,073 shares of common stock at an exercise price of $5.62 per share pursuant to a cashless exercise of options held by a former employee. |
| 7. | On February 27, 2014, the Registrant issued 2,219 shares of common stock at an exercise price of $5.62 per share pursuant to a cashless exercise of options held by a former employee. |
II-2
Table of Contents
The issuances of the above securities were deemed to be exempt from registration under the Securities Act in reliance upon Section 4(2) of the Securities Act or Rule 701 promulgated under Section 3(b) of the Securities Act as transactions by an issuer not involving any public offering or pursuant to benefit plans and contracts relating to compensation as provided under Rule 701. The recipients of the securities in each of these transactions represented their intentions to acquire the securities for investment only and not with a view to or for sale in connection with any distribution thereof, and appropriate legends were placed upon the stock certificates issued in these transactions. All recipients had adequate access, through their relationships with Lantheus Holdings, Inc., to information about Lantheus Holdings, Inc.
Item 16. Exhibits and Financial Statement Schedules
| (a) | Exhibits |
| Exhibit |
Description | |
| 1.1 | Form of Underwriting Agreement. | |
| 3.1 | Form of Amended and Restated Certificate of Incorporation of Lantheus Holdings, Inc. | |
| 3.2 | Form of Amended and Restated Bylaws of Lantheus Holdings, Inc. | |
| 4.1 | Form of Common Stock Certificate. | |
| 4.2 | Indenture, dated as of May 10, 2010, among Lantheus Medical Imaging, Inc., Lantheus MI Intermediate, Inc. and Lantheus MI Real Estate, LLC as guarantors, and Wilmington Trust FSB, as trustee (incorporated by reference to Exhibit 4.1 to Lantheus Medical Imaging, Inc.’s Registration Statement on Form S-4 filed with the Commission on October 6, 2010 (file number 333-169785)). | |
| 4.3 | First Supplemental Indenture, dated as of March 14, 2011, among Lantheus Medical Imaging, Inc., Lantheus MI Intermediate, Inc. and Lantheus MI Real Estate, LLC as guarantors, and Wilmington Trust FSB, as trustee (incorporated by reference to Exhibit 4.1 to Lantheus Medical Imaging, Inc.’s Current Report on Form 8-K filed with the Commission on March 16, 2011 (file number 333-169785)). | |
| 4.4 | Second Supplemental Indenture, dated as of March 21, 2011, among Lantheus Medical Imaging, Inc., Lantheus MI Intermediate, Inc. and Lantheus MI Real Estate, LLC as guarantors, and Wilmington Trust FSB, as trustee (incorporated by reference to Exhibit 4.1 to Lantheus Medical Imaging, Inc.’s Current Report on Form 8-K filed with the Commission on March 21, 2011 (file number 333-169785)). | |
| 4.3 | Registration Rights Agreement, dated May 10, 2010, by and among Lantheus Medical Imaging, Inc., Lantheus MI Intermediate, Inc. and Lantheus MI Real Estate, LLC, as guarantors, and Jefferies & Company, Inc. (incorporated by reference to Exhibit 4.2 to Lantheus Medical Imaging, Inc.’s Registration Statement on Form S-4 filed with the Commission on October 6, 2010 (file number 333-169785)). | |
| 4.5 | Registration Rights Agreement, dated March 21, 2011, by and among Lantheus Medical Imaging, Inc., Jefferies & Company, Inc., as representative of the initial purchasers and the guarantors party thereto (incorporated by reference to Exhibit 4.2 to Lantheus Medical Imaging, Inc.’s Current Report on Form 8-K filed with the Commission on March 21, 2011 (file number 333-169785)). | |
| 4.6 | Form of 9.750% Senior Notes due 2017 (included in Exhibit 4.2). | |
| 5.1 | Opinion of Weil, Gotshal & Manges LLP. | |
| 10.1 | Advisory Services and Monitoring Agreement, dated January 8, 2007, by and between ACP Lantern Acquisition, Inc. (now known as Lantheus Medical Imaging, Inc.) and Avista Capital Holdings, L.P. (incorporated by reference to Exhibit 10.3 to Lantheus Medical Imaging, Inc.’s Registration Statement on Form S-4 filed with the Commission on October 6, 2010 (file number 333-169785)). | |
II-3
Table of Contents
| Exhibit |
Description | |
| 10.2 | Amended and Restated Shareholders Agreement, dated as of February 26, 2008 among Lantheus Holdings, Inc., Avista Capital Partners, L.P., Avista Capital Partners (Offshore), L.P., ACP-Lantern Co-Invest, LLC and certain management shareholders named therein (incorporated by reference to Exhibit 10.4 to Lantheus Medical Imaging, Inc.’s Registration Statement on Form S-4 filed with the Commission on October 6, 2010 (file number 333-169785)). | |
| 10.3 | Employee Shareholders Agreement, dated as of May 8, 2008, among Lantheus Holdings, Inc., Avista Capital Partners, L.P., Avista Capital Partners (Offshore), L.P., ACP-Lantern Co-Invest, LLC and certain employee shareholders named therein (incorporated by reference to Exhibit 10.5 to Lantheus Medical Imaging, Inc.’s Registration Statement on Form S-4 filed with the Commission on October 6, 2010 (file number 333-169785)). | |
| 10.4† | Sales Agreement, dated as of April 1, 2009, between Lantheus Medical Imaging, Inc. and NTP Radioisotopes (Pty) Ltd. (incorporated by reference to Exhibit 10.9 to Lantheus Medical Imaging, Inc.’s Registration Statement on Form S-4 filed with the Commission on December 23, 2010 (file number 333-169785)). | |
| 10.5† | Amendment No. 1 to Sales Agreement, dated as of January 1, 2010, between Lantheus Medical Imaging, Inc. and NTP Radioisotopes (Pty) Ltd. (incorporated by reference to Exhibit 10.10 to Lantheus Medical Imaging, Inc.’s Registration Statement on Form S-4 filed with the Commission on December 1, 2010 (file number 333-169785)). | |
| 10.6† | Amendment No. 2 to Sales Agreement, dated as of January 1, 2010, between Lantheus Medical Imaging, Inc. and NTP Radioisotopes (Pty) Ltd. (incorporated by reference to Exhibit 10.1 to Lantheus Medical Imaging, Inc.’s Quarterly Report on Form 10-Q for the quarterly period ended March 31, 2011 (file number 333-169785)). | |
| 10.7† | Purchase and Supply Agreement, dated as of April 1, 2010, between Lantheus Medical Imaging, Inc. and Nordion (Canada) Inc. (formerly known as MDS Nordion, a division of MDS (Canada) Inc.) (incorporated by reference to Exhibit 10.12 to Lantheus Medical Imaging, Inc.’s Registration Statement on Form S-4 filed with the Commission on December 23, 2010 (file number 333-169785)). | |
| 10.8† | Amendment No. 1 to the Purchase and Supply Agreement, dated as of December 1, 2010, between Lantheus Medical Imaging, Inc. and Nordion (Canada) Inc. (incorporated by reference to Exhibit 10.13 to Lantheus Medical Imaging, Inc.’s Annual Report on Form 10-K for the fiscal year ended December 31, 2010 (file number 333-169785)). | |
| 10.9† | Amendment No. 1 to the Amended and Restated Supply Agreement (Thallium and Generators), dated as of December 29, 2009 between Lantheus Medical Imaging, Inc. and Cardinal Health 414, LLC (incorporated by reference to Exhibit 10.26 to Lantheus Medical Imaging, Inc.’s Registration Statement on Form S-4 filed with the Commission on December 1, 2010 (file number 333-169785)). | |
| 10.10† | Amended and Restated Supply Agreement (Thallium and Generators), dated October 1, 2004, by and between Lantheus Medical Imaging, Inc. and Cardinal Health 414, LLC (incorporated by reference to Exhibit 10.14 to Lantheus Medical Imaging, Inc.’s Registration Statement on Form S-4 filed with the Commission on December 23, 2010 (file number 333-169785)). | |
| 10.11† | Distribution Agreement, dated as of October 31, 2001, by and between Bristol-Myers Squibb Pharma Company (now known as Lantheus Medical Imaging, Inc.) and Medi-Physics Inc., doing business as Amersham Health (incorporated by reference to Exhibit 10.16 to Lantheus Medical Imaging, Inc.’s Registration Statement on Form S-4 filed with the Commission on December 29, 2010 (file number 333-169785)). | |
| 10.12† | First Amendment to Distribution Agreement, dated as of January 1, 2005, by and between Bristol-Myers Squibb Medical Imaging, Inc. (formerly known as Bristol-Myers Squibb Pharma Company and now known as Lantheus Medical Imaging, Inc.) and Medi-Physics Inc., doing business as G.E. Healthcare (incorporated by reference to Exhibit 10.17 to Lantheus Medical Imaging, Inc.’s Registration Statement on Form S-4 filed with the Commission on December 1, 2010 (file number 333-169785)). | |
II-4
Table of Contents
| Exhibit |
Description | |
| 10.13 | Lantheus Holdings, Inc. 2008 Equity Incentive Plan (incorporated by reference to Exhibit 10.18 to Lantheus Medical Imaging, Inc.’s Registration Statement on Form S-4 filed with the Commission on October 6, 2010 (file number 333-169785)). | |
| 10.14 | Amendment No. 1 to Lantheus Holdings, Inc. 2008 Equity Incentive Plan (incorporated by reference to Exhibit 10.19 to Lantheus Medical Imaging, Inc.’s Registration Statement on Form S-4 filed with the Commission on October 6, 2010 (file number 333-169785)). | |
| 10.15 | Amendment No. 2 to Lantheus Holdings, Inc. 2008 Equity Incentive Plan (incorporated by reference to Exhibit 10.20 to Lantheus Medical Imaging, Inc.’s Registration Statement on Form S-4 filed with the Commission on October 6, 2010 (file number 333-169785)). | |
| 10.16 | Form of Option Grant Award Agreement (incorporated by reference to Exhibit 10.21 to Lantheus Medical Imaging, Inc.’s Registration Statement on Form S-4 filed with the Commission on October 6, 2010 (file number 333-169785)). | |
| 10.17 | Lantheus Medical Imaging, Inc. Severance Plan Policy (incorporated by reference to Exhibit 10.24 to Lantheus Medical Imaging, Inc.’s Registration Statement on Form S-4 filed with the Commission on October 6, 2010 (file number 333-169785)). | |
| 10.18† | Second Amendment, effective as of January 1, 2012, to the Distribution Agreement, dated as of October 31, 2001, by and between Lantheus Medical Imaging, Inc., formerly known as Bristol-Myers Squibb Medical Imaging, Inc., and Medi-Physics, Inc., doing business as G.E. Healthcare Inc. (incorporated by reference to Exhibit 10.1 to Lantheus Medical Imaging, Inc.’s Quarterly Report on Form 10-Q for the quarterly period ended March 31, 2012 (file number 333-169785)). | |
| 10.19† | Manufacturing and Supply Agreement, dated as of February 1, 2012, for the manufacture of DEFINITY® by and between Lantheus Medical Imaging, Inc. and Jubilant HollisterStier LLC (incorporated by reference to Exhibit 10.2 to Lantheus Medical Imaging, Inc.’s Quarterly Report on Form 10-Q for the quarterly period ended March 31, 2012 (file number 333-169785)). | |
| 10.20† | First Amendment to Manufacturing and Supply Agreement, dated as of May 3, 2012, for the manufacture of DEFINITY® by and between Lantheus Medical Imaging, Inc. and Jubilant HollisterStier LLC (incorporated by reference to Exhibit 10.1 to Lantheus Medical Imaging, Inc.’s Quarterly Report on Form 10-Q for the quarterly period ended June 30, 2012 (file number 333-169785)). | |
| 10.21† | Amendment No. 2, dated as of October 15, 2012, to the Purchase and Supply Agreement between Lantheus Medical Imaging, Inc. and Nordion (Canada) Inc. (incorporated by reference to Exhibit 10.52 to Lantheus Medical Imaging, Inc.’s Annual Report on Form 10-K for the year ended December 31, 2012 (file number 333-169785)). | |
| 10.22† | Amendment No. 3, effective as of October 1, 2012, to Sales Agreement between Lantheus Medical Imaging, Inc. and NTP Radioisotopes (Pty) Ltd. (incorporated by reference to Exhibit 10.53 to Lantheus Medical Imaging, Inc.’s Annual Report on Form 10-K for the year ended December 31, 2012 (file number 333-169785)). | |
| 10.23† | Amendment No. 2, effective as of December 27, 2012, to the Amended and Restated Supply Agreement (Thallium and Generators) between Lantheus Medical Imaging, Inc. and Cardinal Health 414, LLC (incorporated by reference to Exhibit 10.54 to Lantheus Medical Imaging, Inc.’s Annual Report on Form 10-K for the year ended December 31, 2012 (file number 333-169785)). | |
| 10.24 | Separation Agreement, dated February 19, 2013, by and between Lantheus Medical Imaging, Inc. and Don Kiepert (incorporated by reference to Exhibit 10.57 to Lantheus Medical Imaging, Inc.’s Annual Report on Form 10-K for the year ended December 31, 2012 (file number 333-169785)). | |
| 10.25† | Fission Mo-99 Supply Agreement, effective January 1, 2013, by and between Lantheus Medical Imaging, Inc. and the Institut National des Radioelements (incorporated by reference to Exhibit 10.1 to Lantheus Medical Imaging, Inc.’s Quarterly Report on Form 10-Q for the quarterly period ended March 31, 2013 (file number 333-169785)). | |
II-5
Table of Contents
| Exhibit |
Description | |
| 10.26 | Lantheus Holdings, Inc. 2013 Equity Incentive Plan (incorporated by reference to Exhibit 10.1 to Lantheus Medical Imaging, Inc.’s Current Report on Form 8-K filed with the Commission on May 6, 2013 (file number 333-169785)). | |
| 10.27 | Form of Employee Option Grant Award Agreement (incorporated by reference to Exhibit 10.2 to Lantheus Medical Imaging, Inc.’s Current Report on Form 8-K filed with the Commission on May 6, 2013 (file number 333-169785)). | |
| 10.28 | Form of Non-Employee Director Option Grant Award Agreement (incorporated by reference to Exhibit 10.3 to Lantheus Medical Imaging, Inc.’s Current Report on Form 8-K filed with the Commission on May 6, 2013 (file number 333-169785)). | |
| 10.29 | Employment Agreement, dated May 8, 2013, by and between Lantheus Medical Imaging, Inc. and Jeffrey Bailey (incorporated by reference to Exhibit 10.1 to Lantheus Medical Imaging, Inc.’s Quarterly Report on Form 10-Q for the quarterly period ended September 30, 2013 (file number 333-169785). | |
| 10.30 | Amended and Restated Credit Agreement date as of July 3, 2013, by and among Lantheus Medical Imaging Inc., Lantheus MI Intermediate Inc., Lantheus MI Real Estate, LLC, the lenders from time to time party thereto, and Wells Fargo Bank, National Association, as collateral agent and administrative agent and as sole lead arranger, book runner and syndication agent (incorporated by reference to Exhibit 10.1 to Lantheus Medical Imaging, Inc.’s Quarterly Report on Form 10-Q for the quarterly period ended June 30, 2013 (file number 333-169785)). | |
| 10.31 | Employment Agreement, dated June 4, 2014, by and between Lantheus Medical Imaging, Inc. and John K. Bakewell. | |
| 10.32 | Employment Agreement, effective August 12, 2013, by and between Lantheus Medical Imaging, Inc. and Mary Anne Heino (incorporated by reference to Exhibit 10.47 to Lantheus Medical Imaging, Inc.’s Annual Report on Form 10-K for the year ended December 31, 2013 (file number 333-169785)). | |
| 10.33 | Employment Agreement, effective August 12, 2013, by and between Lantheus Medical Imaging, Inc. and Cesare Orlandi (incorporated by reference to Exhibit 10.48 to Lantheus Medical Imaging, Inc.’s Annual Report on Form 10-K for the year ended December 31, 2013 (file number 333-169785)). | |
| 10.34 | Amendment to Amended and Restated Credit Agreement, dated June 24, 2014, by and among Lantheus Medical Imaging Inc., Lantheus MI Intermediate Inc., Lantheus MI Real Estate, LLC, the lenders from time to time party thereto, and Wells Fargo Bank, National Association, as collateral agent and administrative agent and as sole lead arranger, book runner and syndication agent. | |
| 10.35 | Form of Amendment to Amended and Restated Shareholders Agreement, among Lantheus Holdings, Inc., Avista Capital Partners, L.P., Avista Capital Partners (Offshore), L.P., ACP-Lantern Co-Invest, LLC and certain management shareholders named therein. | |
| 10.36 | Form of Amendment to Employee Shareholders Agreement, among Lantheus Holdings, Inc., Avista Capital Partners, L.P., Avista Capital Partners (Offshore), L.P., ACP-Lantern Co-Invest, LLC and certain employee shareholders named therein. | |
| 10.37* | 2015 Equity Incentive Plan of Lantheus Holdings, Inc. | |
| 10.38* | Form of 2015 Restricted Stock Agreement of Lantheus Holdings, Inc. | |
| 10.39* | Form of 2015 Option Award Agreement of Lantheus Holdings, Inc. | |
| 10.40 | Form of Amendment to the Lantheus Holdings, Inc. 2013 Equity Incentive Plan. | |
| 10.41 | Form of Amendment to the Lantheus Holdings, Inc. 2008 Equity Incentive Plan. | |
| 10.42 | Amended and Restated Employment Agreement, effective March 16, 2015, by and between Lantheus Medical Imaging, Inc. and Mary Anne Heino (incorporated by reference to Exhibit 10.1 to Lantheus Medical Imaging, Inc.’s Quarterly Report on Form 10-Q for the quarterly period ended March 31, 2015 (file number 333-169785)). | |
II-6
Table of Contents
| Exhibit |
Description | |
| 10.43 | Amendment to Lantheus Holdings, Inc. 2013 Equity Incentive Plan (incorporated by reference to Exhibit 10.1 to Lantheus Medical Imaging, Inc.’s Current Report on Form 8-K filed with the Commission on April 10, 2015 (file number 333-169785)). | |
| 21.1 | Subsidiaries of Lantheus Holdings, Inc. | |
| 23.1* | Consent of Independent Registered Public Accounting Firm, Deloitte & Touche LLP. | |
| 23.2 | Consent of Weil, Gotshal & Manges LLP (included as part of Exhibit 5.1). | |
| 24.1 | Power of Attorney (included as part of the signature pages hereto). | |
| * | Filed herewith. |
| † | Confidential treatment requested as to certain portions, which portions shall be filed separately with the Securities and Exchange Commission. |
| (b) | Financial Statement Schedules |
None.
Item 17. Undertakings
The undersigned Registrant hereby undertakes to provide to the underwriters at the closing specified in the underwriting agreements, certificates in such denominations and registered in such names as required by the underwriters to permit prompt delivery to each purchaser.
Insofar as indemnification for liabilities arising under the Securities Act of 1933 may be permitted to directors, officers and controlling persons of the Registrant pursuant to the provisions referenced in Item 14 of this registration statement, or otherwise, the Registrant has been advised that in the opinion of the SEC such indemnification is against public policy as expressed in the Securities Act and is, therefore, unenforceable. In the event that a claim for indemnification against such liabilities (other than the payment by the Registrant of expenses incurred or paid by a director, officer, or controlling person of the Registrant in the successful defense of any action, suit or proceeding) is asserted by such director, officer or controlling person in connection with the securities being registered hereunder, the Registrant will, unless in the opinion of its counsel the matter has been settled by controlling precedent, submit to a court of appropriate jurisdiction the question of whether such indemnification by it is against public policy as expressed in the Securities Act and will be governed by the final adjudication of such issue.
The undersigned Registrant hereby undertakes that:
| (1) | For purposes of determining any liability under the Securities Act of 1933, the information omitted from the form of prospectus filed as part of this registration statement in reliance upon Rule 430A and contained in a form of prospectus filed by the Registrant pursuant to Rule 424(b)(1) or (4) or 497(h) under the Securities Act shall be deemed to be part of this registration statement as of the time it was declared effective. |
| (2) | For the purpose of determining any liability under the Securities Act of 1933, each post-effective amendment that contains a form of prospectus shall be deemed to be a new registration statement relating to the securities offered therein, and the offering of such securities at that time shall be deemed to be the initial bona fide offering thereof. |
| (3) | For the purpose of determining liability under the Securities Act of 1933 to any purchaser, if the Registrant is subject to Rule 430C, each prospectus filed pursuant to Rule 424(b) as part of a registration statement relating to an offering, other than registration statements relying on Rule 430B or other than prospectuses filed in reliance on Rule 430A, shall be deemed to be part of and included in the registration statement as of |
II-7
Table of Contents
| the date it is first used after effectiveness. Provided, however, that no statement made in a registration statement or prospectus that is part of the registration statement or made in a document incorporated or deemed incorporated by reference into the registration statement or prospectus that is part of the registration statement will, as to a purchaser with a time of contract of sale prior to such first use, supersede or modify any statement that was made in the registration statement or prospectus that was part of the registration statement or made in any such document immediately prior to such date of first use. |
| (4) | For the purpose of determining liability of the Registrant under the Securities Act of 1933 to any purchaser in the initial distribution of the securities, the undersigned Registrant undertakes that in a primary offering of securities of the undersigned Registrant pursuant to this registration statement, regardless of the underwriting method used to sell the securities to the purchaser, if the securities are offered or sold to such purchaser by means of any of the following communications, the undersigned Registrant will be a seller to the purchaser and will be considered to offer or sell such securities to such purchaser: |
| (a) | Any preliminary prospectus or prospectus of the undersigned Registrant relating to the offering required to be filed pursuant to Rule 424; |
| (b) | Any free writing prospectus relating to the offering prepared by or on behalf of the undersigned Registrant or used or referred to by the undersigned Registrant; |
| (c) | The portion of any other free writing prospectus relating to the offering containing material information about the undersigned Registrant or its securities provided by or on behalf of the undersigned Registrant; and |
| (d) | Any other communication that is an offer in the offering made by the undersigned Registrant to the purchaser. |
II-8
Table of Contents
SIGNATURES
Pursuant to the requirements of the Securities Act of 1933, as amended, the Registrant has duly caused this Amendment No. 9 to the Registration Statement to be signed on its behalf by the undersigned, thereunto duly authorized, in the City of North Billerica, Commonwealth of Massachusetts, on June 16, 2015.
| LANTHEUS HOLDINGS, INC. | ||||
| By: | /s/ Michael P. Duffy | |||
| Name: | Michael P. Duffy | |||
| Title: | Vice President, General Counsel and Secretary | |||
Pursuant to the requirements of the Securities Act of 1933, this registration statement has been signed by the following persons in the capacities indicated on June 16, 2015.
| Signature |
Title |
Date | ||
| * Jeffrey Bailey |
President, Chief Executive Officer and Director (Principal Executive Officer) |
June 16, 2015 | ||
| * John K. Bakewell |
Chief Financial Officer (Principal Financial Officer) |
June 16, 2015 | ||
| * Jack Crowley |
Chief Accounting Officer and Vice President, Finance (Principal Accounting Officer) |
June 16, 2015 | ||
| * Brian Markison |
Chairman of the Board of Directors | June 16, 2015 | ||
| * David Burgstahler |
Director | June 16, 2015 | ||
| * Samuel Leno |
Director | June 16, 2015 | ||
| * Patrick O’Neill |
Director | June 16, 2015 | ||
| * Sriram Venkataraman |
Director | June 16, 2015 | ||
| *By: | /s/ Michael P. Duffy | |
| Michael P. Duffy Attorney-in-Fact |
Table of Contents
EXHIBIT INDEX
| Exhibit |
Description | |
| 1.1 | Form of Underwriting Agreement. | |
| 3.1 | Form of Amended and Restated Certificate of Incorporation of Lantheus Holdings, Inc. | |
| 3.2 | Form of Amended and Restated Bylaws of Lantheus Holdings, Inc. | |
| 4.1 | Form of Common Stock Certificate. | |
| 4.2 | Indenture, dated as of May 10, 2010, among Lantheus Medical Imaging, Inc., Lantheus MI Intermediate, Inc. and Lantheus MI Real Estate, LLC as guarantors, and Wilmington Trust FSB, as trustee (incorporated by reference to Exhibit 4.1 to Lantheus Medical Imaging, Inc.’s Registration Statement on Form S-4 filed with the Commission on October 6, 2010 (file number 333-169785)). | |
| 4.3 | First Supplemental Indenture, dated as of March 14, 2011, among Lantheus Medical Imaging, Inc., Lantheus MI Intermediate, Inc. and Lantheus MI Real Estate, LLC as guarantors, and Wilmington Trust FSB, as trustee (incorporated by reference to Exhibit 4.1 to Lantheus Medical Imaging, Inc.’s Current Report on Form 8-K filed with the Commission on March 16, 2011 (file number 333-169785)). | |
| 4.4 | Second Supplemental Indenture, dated as of March 21, 2011, among Lantheus Medical Imaging, Inc., Lantheus MI Intermediate, Inc. and Lantheus MI Real Estate, LLC as guarantors, and Wilmington Trust FSB, as trustee (incorporated by reference to Exhibit 4.1 to Lantheus Medical Imaging, Inc.’s Current Report on Form 8-K filed with the Commission on March 21, 2011 (file number 333-169785)). | |
| 4.3 | Registration Rights Agreement, dated May 10, 2010, by and among Lantheus Medical Imaging, Inc., Lantheus MI Intermediate, Inc. and Lantheus MI Real Estate, LLC, as guarantors, and Jefferies & Company, Inc. (incorporated by reference to Exhibit 4.2 to Lantheus Medical Imaging, Inc.’s Registration Statement on Form S-4 filed with the Commission on October 6, 2010 (file number 333-169785)). | |
| 4.5 | Registration Rights Agreement, dated March 21, 2011, by and among Lantheus Medical Imaging, Inc., Jefferies & Company, Inc., as representative of the initial purchasers and the guarantors party thereto (incorporated by reference to Exhibit 4.2 to Lantheus Medical Imaging, Inc.’s Current Report on Form 8-K filed with the Commission on March 21, 2011 (file number 333-169785)). | |
| 4.6 | Form of 9.750% Senior Notes due 2017 (included in Exhibit 4.2). | |
| 5.1 | Opinion of Weil, Gotshal & Manges LLP. | |
| 10.1 | Advisory Services and Monitoring Agreement, dated January 8, 2007, by and between ACP Lantern Acquisition, Inc. (now known as Lantheus Medical Imaging, Inc.) and Avista Capital Holdings, L.P. (incorporated by reference to Exhibit 10.3 to Lantheus Medical Imaging, Inc.’s Registration Statement on Form S-4 filed with the Commission on October 6, 2010 (file number 333-169785)). | |
| 10.2 | Amended and Restated Shareholders Agreement, dated as of February 26, 2008 among Lantheus Holdings, Inc., Avista Capital Partners, L.P., Avista Capital Partners (Offshore), L.P., ACP-Lantern Co-Invest, LLC and certain management shareholders named therein (incorporated by reference to Exhibit 10.4 to Lantheus Medical Imaging, Inc.’s Registration Statement on Form S-4 filed with the Commission on October 6, 2010 (file number 333-169785)). | |
| 10.3 | Employee Shareholders Agreement, dated as of May 8, 2008, among Lantheus Holdings, Inc., Avista Capital Partners, L.P., Avista Capital Partners (Offshore), L.P., ACP-Lantern Co-Invest, LLC and certain employee shareholders named therein (incorporated by reference to Exhibit 10.5 to Lantheus Medical Imaging, Inc.’s Registration Statement on Form S-4 filed with the Commission on October 6, 2010 (file number 333-169785)). | |
| 10.4† | Sales Agreement, dated as of April 1, 2009, between Lantheus Medical Imaging, Inc. and NTP Radioisotopes (Pty) Ltd. (incorporated by reference to Exhibit 10.9 to Lantheus Medical Imaging, Inc.’s Registration Statement on Form S-4 filed with the Commission on December 23, 2010 (file number 333-169785)). | |
Table of Contents
| Exhibit |
Description | |
| 10.5† | Amendment No. 1 to Sales Agreement, dated as of January 1, 2010, between Lantheus Medical Imaging, Inc. and NTP Radioisotopes (Pty) Ltd. (incorporated by reference to Exhibit 10.10 to Lantheus Medical Imaging, Inc.’s Registration Statement on Form S-4 filed with the Commission on December 1, 2010 (file number 333-169785)). | |
| 10.6† | Amendment No. 2 to Sales Agreement, dated as of January 1, 2010, between Lantheus Medical Imaging, Inc. and NTP Radioisotopes (Pty) Ltd. (incorporated by reference to Exhibit 10.1 to Lantheus Medical Imaging, Inc.’s Quarterly Report on Form 10-Q for the quarterly period ended March 31, 2011 (file number 333-169785)). | |
| 10.7† | Purchase and Supply Agreement, dated as of April 1, 2010, between Lantheus Medical Imaging, Inc. and Nordion (Canada) Inc. (formerly known as MDS Nordion, a division of MDS (Canada) Inc.) (incorporated by reference to Exhibit 10.12 to Lantheus Medical Imaging, Inc.’s Registration Statement on Form S-4 filed with the Commission on December 23, 2010 (file number 333-169785)). | |
| 10.8† | Amendment No. 1 to the Purchase and Supply Agreement, dated as of December 1, 2010, between Lantheus Medical Imaging, Inc. and Nordion (Canada) Inc. (incorporated by reference to Exhibit 10.13 to Lantheus Medical Imaging, Inc.’s Annual Report on Form 10-K for the fiscal year ended December 31, 2010 (file number 333-169785)). | |
| 10.9† | Amendment No. 1 to the Amended and Restated Supply Agreement (Thallium and Generators), dated as of December 29, 2009 between Lantheus Medical Imaging, Inc. and Cardinal Health 414, LLC (incorporated by reference to Exhibit 10.26 to Lantheus Medical Imaging, Inc.’s Registration Statement on Form S-4 filed with the Commission on December 1, 2010 (file number 333-169785)). | |
| 10.10† | Amended and Restated Supply Agreement (Thallium and Generators), dated October 1, 2004, by and between Lantheus Medical Imaging, Inc. and Cardinal Health 414, LLC (incorporated by reference to Exhibit 10.14 to Lantheus Medical Imaging, Inc.’s Registration Statement on Form S-4 filed with the Commission on December 23, 2010 (file number 333-169785)). | |
| 10.11† | Distribution Agreement, dated as of October 31, 2001, by and between Bristol-Myers Squibb Pharma Company (now known as Lantheus Medical Imaging, Inc.) and Medi-Physics Inc., doing business as Amersham Health (incorporated by reference to Exhibit 10.16 to Lantheus Medical Imaging, Inc.’s Registration Statement on Form S-4 filed with the Commission on December 29, 2010 (file number 333-169785)). | |
| 10.12† | First Amendment to Distribution Agreement, dated as of January 1, 2005, by and between Bristol-Myers Squibb Medical Imaging, Inc. (formerly known as Bristol-Myers Squibb Pharma Company and now known as Lantheus Medical Imaging, Inc.) and Medi-Physics Inc., doing business as G.E. Healthcare (incorporated by reference to Exhibit 10.17 to Lantheus Medical Imaging, Inc.’s Registration Statement on Form S-4 filed with the Commission on December 1, 2010 (file number 333-169785)). | |
| 10.13 | Lantheus Holdings, Inc. 2008 Equity Incentive Plan (incorporated by reference to Exhibit 10.18 to Lantheus Medical Imaging, Inc.’s Registration Statement on Form S-4 filed with the Commission on October 6, 2010 (file number 333-169785)). | |
| 10.14 | Amendment No. 1 to Lantheus Holdings, Inc. 2008 Equity Incentive Plan (incorporated by reference to Exhibit 10.19 to Lantheus Medical Imaging, Inc.’s Registration Statement on Form S-4 filed with the Commission on October 6, 2010 (file number 333-169785)). | |
| 10.15 | Amendment No. 2 to Lantheus Holdings, Inc. 2008 Equity Incentive Plan (incorporated by reference to Exhibit 10.20 to Lantheus Medical Imaging, Inc.’s Registration Statement on Form S-4 filed with the Commission on October 6, 2010 (file number 333-169785)). | |
| 10.16 | Form of Option Grant Award Agreement (incorporated by reference to Exhibit 10.21 to Lantheus Medical Imaging, Inc.’s Registration Statement on Form S-4 filed with the Commission on October 6, 2010 (file number 333-169785)). | |
Table of Contents
| Exhibit |
Description | |
| 10.17 | Lantheus Medical Imaging, Inc. Severance Plan Policy (incorporated by reference to Exhibit 10.24 to Lantheus Medical Imaging, Inc.’s Registration Statement on Form S-4 filed with the Commission on October 6, 2010 (file number 333-169785)). | |
| 10.18† | Second Amendment, effective as of January 1, 2012, to the Distribution Agreement, dated as of October 31, 2001, by and between Lantheus Medical Imaging, Inc., formerly known as Bristol-Myers Squibb Medical Imaging, Inc., and Medi-Physics, Inc., doing business as G.E. Healthcare Inc. (incorporated by reference to Exhibit 10.1 to Lantheus Medical Imaging, Inc.’s Quarterly Report on Form 10-Q for the quarterly period ended March 31, 2012 (file number 333-169785)). | |
| 10.19† | Manufacturing and Supply Agreement, dated as of February 1, 2012, for the manufacture of DEFINITY® by and between Lantheus Medical Imaging, Inc. and Jubilant HollisterStier LLC (incorporated by reference to Exhibit 10.2 to Lantheus Medical Imaging, Inc.’s Quarterly Report on Form 10-Q for the quarterly period ended March 31, 2012 (file number 333-169785)). | |
| 10.20† | First Amendment to Manufacturing and Supply Agreement, dated as of May 3, 2012, for the manufacture of DEFINITY® by and between Lantheus Medical Imaging, Inc. and Jubilant HollisterStier LLC (incorporated by reference to Exhibit 10.1 to Lantheus Medical Imaging, Inc.’s Quarterly Report on Form 10-Q for the quarterly period ended June 30, 2012 (file number 333-169785)). | |
| 10.21† | Amendment No. 2, dated as of October 15, 2012, to the Purchase and Supply Agreement between Lantheus Medical Imaging, Inc. and Nordion (Canada) Inc. (incorporated by reference to Exhibit 10.52 to Lantheus Medical Imaging, Inc.’s Annual Report on Form 10-K for the year ended December 31, 2012 (file number 333-169785)). | |
| 10.22† | Amendment No. 3, effective as of October 1, 2012, to Sales Agreement between Lantheus Medical Imaging, Inc. and NTP Radioisotopes (Pty) Ltd. (incorporated by reference to Exhibit 10.53 to Lantheus Medical Imaging, Inc.’s Annual Report on Form 10-K for the year ended December 31, 2012 (file number 333-169785)). | |
| 10.23† | Amendment No. 2, effective as of December 27, 2012, to the Amended and Restated Supply Agreement (Thallium and Generators) between Lantheus Medical Imaging, Inc. and Cardinal Health 414, LLC (incorporated by reference to Exhibit 10.54 to Lantheus Medical Imaging, Inc.’s Annual Report on Form 10-K for the year ended December 31, 2012 (file number 333-169785)). | |
| 10.24 | Separation Agreement, dated February 19, 2013, by and between Lantheus Medical Imaging, Inc. and Don Kiepert (incorporated by reference to Exhibit 10.57 to Lantheus Medical Imaging, Inc.’s Annual Report on Form 10-K for the year ended December 31, 2012 (file number 333-169785)). | |
| 10.25† | Fission Mo-99 Supply Agreement, effective January 1, 2013, by and between Lantheus Medical Imaging, Inc. and the Institut National des Radioelements (incorporated by reference to Exhibit 10.1 to Lantheus Medical Imaging, Inc.’s Quarterly Report on Form 10-Q for the quarterly period ended March 31, 2013 (file number 333-169785)). | |
| 10.26 | Lantheus Holdings, Inc. 2013 Equity Incentive Plan (incorporated by reference to Exhibit 10.1 to Lantheus Medical Imaging, Inc.’s Current Report on Form 8-K filed with the Commission on May 6, 2013 (file number 333-169785)). | |
| 10.27 | Form of Employee Option Grant Award Agreement (incorporated by reference to Exhibit 10.2 to Lantheus Medical Imaging, Inc.’s Current Report on Form 8-K filed with the Commission on May 6, 2013 (file number 333-169785)). | |
| 10.28 | Form of Non-Employee Director Option Grant Award Agreement (incorporated by reference to Exhibit 10.3 to Lantheus Medical Imaging, Inc.’s Current Report on Form 8-K filed with the Commission on May 6, 2013 (file number 333-169785)). | |
| 10.29 | Employment Agreement, dated May 8, 2013, by and between Lantheus Medical Imaging, Inc. and Jeffrey Bailey (incorporated by reference to Exhibit 10.1 to Lantheus Medical Imaging, Inc.’s Quarterly Report on Form 10-Q for the quarterly period ended September 30, 2013 (file number 333-169785). | |
Table of Contents
| Exhibit |
Description | |
| 10.30 | Amended and Restated Credit Agreement date as of July 3, 2013, by and among Lantheus Medical Imaging Inc., Lantheus MI Intermediate Inc., Lantheus MI Real Estate, LLC, the lenders from time to time party thereto, and Wells Fargo Bank, National Association, as collateral agent and administrative agent and as sole lead arranger, book runner and syndication agent (incorporated by reference to Exhibit 10.1 to Lantheus Medical Imaging, Inc.’s Quarterly Report on Form 10-Q for the quarterly period ended June 30, 2013 (file number 333-169785)). | |
| 10.31 | Employment Agreement, dated June 4, 2014, by and between Lantheus Medical Imaging, Inc. and John K. Bakewell. | |
| 10.32 | Employment Agreement, effective August 12, 2013, by and between Lantheus Medical Imaging, Inc. and Mary Anne Heino (incorporated by reference to Exhibit 10.47 to Lantheus Medical Imaging, Inc.’s Annual Report on Form 10-K for the year ended December 31, 2013 (file number 333-169785)). | |
| 10.33 | Employment Agreement, effective August 12, 2013, by and between Lantheus Medical Imaging, Inc. and Cesare Orlandi (incorporated by reference to Exhibit 10.48 to Lantheus Medical Imaging, Inc.’s Annual Report on Form 10-K for the year ended December 31, 2013 (file number 333-169785)). | |
| 10.34 | Amendment to Amended and Restated Credit Agreement, dated June 24, 2014, by and among Lantheus Medical Imaging Inc., Lantheus MI Intermediate Inc., Lantheus MI Real Estate, LLC, the lenders from time to time party thereto, and Wells Fargo Bank, National Association, as collateral agent and administrative agent and as sole lead arranger, book runner and syndication agent. | |
| 10.35 | Form of Amendment to Amended and Restated Shareholders Agreement, among Lantheus Holdings, Inc., Avista Capital Partners, L.P., Avista Capital Partners (Offshore), L.P., ACP-Lantern Co-Invest, LLC and certain management shareholders named therein. | |
| 10.36 | Form of Amendment to Employee Shareholders Agreement, among Lantheus Holdings, Inc., Avista Capital Partners, L.P., Avista Capital Partners (Offshore), L.P., ACP-Lantern Co-Invest, LLC and certain employee shareholders named therein. | |
| 10.37* | 2015 Equity Incentive Plan of Lantheus Holdings, Inc. | |
| 10.38* | Form of 2015 Restricted Stock Agreement of Lantheus Holdings, Inc. | |
| 10.39* | Form of 2015 Option Award Agreement of Lantheus Holdings, Inc. | |
| 10.40 | Form of Amendment to the Lantheus Holdings, Inc. 2013 Equity Incentive Plan. | |
| 10.41 | Form of Amendment to the Lantheus Holdings, Inc. 2008 Equity Incentive Plan. | |
| 10.42 | Amended and Restated Employment Agreement, effective March 16, 2015, by and between Lantheus Medical Imaging, Inc. and Mary Anne Heino (incorporated by reference to Exhibit 10.1 to Lantheus Medical Imaging, Inc.’s Quarterly Report on Form 10-Q for the quarterly period ended March 31, 2015 (file number 333-169785)). | |
| 10.43 | Amendment to Lantheus Holdings, Inc. 2013 Equity Incentive Plan (incorporated by reference to Exhibit 10.1 to Lantheus Medical Imaging, Inc.’s Current Report on Form 8-K filed with the Commission on April 10, 2015 (file number 333-169785)). | |
| 21.1 | Subsidiaries of Lantheus Holdings, Inc. | |
| 23.1* | Consent of Independent Registered Public Accounting Firm, Deloitte & Touche LLP. | |
| 23.2 | Consent of Weil, Gotshal & Manges LLP (included as part of Exhibit 5.1). | |
| 24.1 | Power of Attorney (included as part of the signature pages hereto). | |
| * | Filed herewith. |
| † | Confidential treatment requested as to certain portions, which portions shall be filed separately with the Securities and Exchange Commission. |