Attached files
| file | filename |
|---|---|
| 8-K - 8-K - FIRST NIAGARA FINANCIAL GROUP INC | a8-k61615dfast.htm |
| EX-99.1 - EXHIBIT 99.1 - FIRST NIAGARA FINANCIAL GROUP INC | ex991dfastpressrelease.htm |

2015 Stress Test Results and Process Disclosure Severely Adverse Scenario June 16, 2015

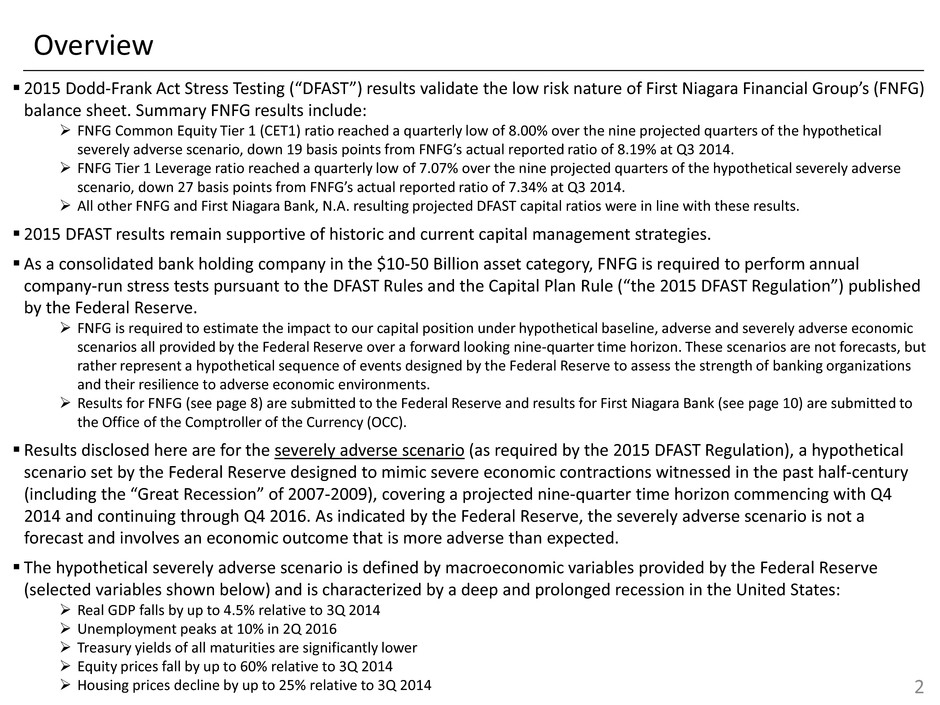
Overview 2015 Dodd-Frank Act Stress Testing (“DFAST”) results validate the low risk nature of First Niagara Financial Group’s (FNFG) balance sheet. Summary FNFG results include: FNFG Common Equity Tier 1 (CET1) ratio reached a quarterly low of 8.00% over the nine projected quarters of the hypothetical severely adverse scenario, down 19 basis points from FNFG’s actual reported ratio of 8.19% at Q3 2014. FNFG Tier 1 Leverage ratio reached a quarterly low of 7.07% over the nine projected quarters of the hypothetical severely adverse scenario, down 27 basis points from FNFG’s actual reported ratio of 7.34% at Q3 2014. All other FNFG and First Niagara Bank, N.A. resulting projected DFAST capital ratios were in line with these results. 2015 DFAST results remain supportive of historic and current capital management strategies. As a consolidated bank holding company in the $10-50 Billion asset category, FNFG is required to perform annual company-run stress tests pursuant to the DFAST Rules and the Capital Plan Rule (“the 2015 DFAST Regulation”) published by the Federal Reserve. FNFG is required to estimate the impact to our capital position under hypothetical baseline, adverse and severely adverse economic scenarios all provided by the Federal Reserve over a forward looking nine-quarter time horizon. These scenarios are not forecasts, but rather represent a hypothetical sequence of events designed by the Federal Reserve to assess the strength of banking organizations and their resilience to adverse economic environments. Results for FNFG (see page 8) are submitted to the Federal Reserve and results for First Niagara Bank (see page 10) are submitted to the Office of the Comptroller of the Currency (OCC). Results disclosed here are for the severely adverse scenario (as required by the 2015 DFAST Regulation), a hypothetical scenario set by the Federal Reserve designed to mimic severe economic contractions witnessed in the past half-century (including the “Great Recession” of 2007-2009), covering a projected nine-quarter time horizon commencing with Q4 2014 and continuing through Q4 2016. As indicated by the Federal Reserve, the severely adverse scenario is not a forecast and involves an economic outcome that is more adverse than expected. The hypothetical severely adverse scenario is defined by macroeconomic variables provided by the Federal Reserve (selected variables shown below) and is characterized by a deep and prolonged recession in the United States: Real GDP falls by up to 4.5% relative to 3Q 2014 Unemployment peaks at 10% in 2Q 2016 Treasury yields of all maturities are significantly lower Equity prices fall by up to 60% relative to 3Q 2014 Housing prices decline by up to 25% relative to 3Q 2014 2

Overview (cont’d) The 2015 DFAST Regulation requires the following over the projected nine-quarter time horizon: No change in common stock dividends from current levels No new issuance of common stock, except for that associated with employee stock compensation No repurchase of common stock No preferred stock actions other than continued payment of preferred stock dividends No new issuance of Tier 2 capital instruments Results presented are for a company run test (using internal methodologies). A supervisory run test, as performed by the Federal Reserve for banks with greater than $50 Billion in assets, is not done for DFAST banks. Results included in this presentation are under this hypothetical severely adverse scenario and therefore do not represent FNFG’s forecast of future revenue, net income, loan losses, balance sheet growth and capital ratios. FNFG’s actual financial information, prepared under U.S. Generally Accepted Accounting Principles (“GAAP”), is available in reports filed with the Securities and Exchange Commission (“SEC”). Our future financial results and conditions will be influenced by actual economic and financial conditions and other factors described in our periodic reports filed with the SEC and available at http://www.sec.gov, including our Annual Report on Form 10-K for the year end of December 31, 2014. For additional information on the supervisory severely adverse scenario, please see the 2015 Supervisory Scenarios for Annual Stress Tests required under the DFAST Rules and the Capital Plan Rule, published by the Federal Reserve on October 23, 2014, as well as the joint press release issued on June 2, 2015 by the Federal Reserve, OCC and Federal Deposit Insurance Corporation that provides additional background and context on the DFAST process for financial institutions between $10-50 Billion. 3

0.00% 0.50% 1.00% 1.50% 2.00% 2.50% 2009 2010 2011 2012 2013 2014 3Q YTD FNFG Peer Median RMBS, 57.3% CMBS, 13.9% CLO, 9.1% ABS, 5.9% Corporate, 7.2% Municipal, 4.2% U.S. Gov't, 1.9% Other, 0.2% UST, 0.2% FNFG Balance Sheet Profile (as of Sept 30, 2014) 4 FNFG stress test results reflect low risk nature of our balance sheet. Se cu ri ti es Lo an s Average rating of “AA” 81% of securities rated “AA” or better; 91% “A” or better 59% of securities backed by U.S. Treasury or GSE’s CMBS 74% of portfolio with credit enhancement >30% 99% of bonds with credit enhancement >20% CLOs 75% of portfolio with credit enhancement >20% 97% of bonds with credit enhancement >15% Investment Securities Mix (Book Value $11.5B) Gross Charge-offs to Average Loans Historic and current low level charge offs validate strong underwriting standards and low stress test loss levels Credit mark on acquired portfolio equals 2.5% of remaining $3.9B acquired book (or $100MM) 1. ASB, BOKF, CYN, CMA, CBSH, CFR, FHN, HBHC, HBAN, KEY, MTB, PBCT, SNV, ZION Source: SNL 1

Risks Included in Stress Testing Process 5 FNFG specifically considered the impact of regulatory defined economic stress on our balance sheet, income statement, and capital ratios at the consolidated holding company and bank levels. Material Risks Considered in Stress Testing Process: Credit Risk Credit risk is the risk to current or anticipated earnings or capital arising from an obligor’s failure to meet the terms of any contract with the bank or otherwise perform as agreed. Credit risk is found in all activities where success depends on counterparty issuer or borrower performance. Loans are the largest source of credit risk for the organization. Interest Rate Risk Interest rate risk is the risk to current or anticipated earnings or capital arising from movements in interest rates. Liquidity Risk Liquidity risk is the risk to earnings or capital arising from a bank’s inability to meet its obligations as they come due. Operational Risk Operational risk is the risk to current or anticipated earnings or capital arising from inadequate or failed internal processes or systems, the misconduct or errors of people, and adverse external events. Operational losses result from internal fraud, external fraud, employment practices and workplace safety, clients, products, and business practices, damage to physical assets, business disruption and systems failure, and execution, delivery and process management. Losses due to compliance issues or information technology risk are also included within operational risk.

DFAST process utilized FNFG’s existing capital planning process and governance structure with ultimate oversight at the Board of Directors. Committee Capital Management Committee (CMC) Internal Capital Adequacy Assessment Process (ICAAP) Oversight Committee Stress Test Working Group Purpose An executive level committee that oversees the capital adequacy assessment process and assesses/recommends capital actions for FNFG. A senior management committee that provides oversight and guidance on those functions overseen at CMC as it relates to the day to day execution of tasks associated with the capital adequacy assessment process. A subset of key stakeholders that need to direct the activities of DFAST Membership • CEO • CFO • CRO • Treasurer Senior management representation from Finance, Risk, Lines of Business, and Internal Audit including: • Treasurer • Chief Investment Officer • Corporate Controller • Head of Credit Risk, Model Risk, and Operational Risk • Head of Commercial and Consumer Finance Businesses • Chief Audit Executive • CFO • CRO • Chief Audit Executive • Treasurer • Director of Capital Risk • Stress Test Modeling Manager Key Duties • Approves the process/results • Recommends capital actions for approval by Board of Directors • Recommends enhancement to FNFG’s Capital Policies • Recommends Capital Plan for approval by Board of Directors • Typically meets bi-weekly during DFAST process • Provides oversight of risk management/control functions to ensure a robust ICAAP process; challenges stress test assumptions and results • Provides recommendations to the CMC on stress testing results and improvements to capital adequacy process • Oversees the development of the Capital Plan • Typically meets weekly during DFAST process • Provides guidance and project management oversight. • Typically meets weekly during DFAST process 6 FNFG DFAST and Capital Planning Governance Structure

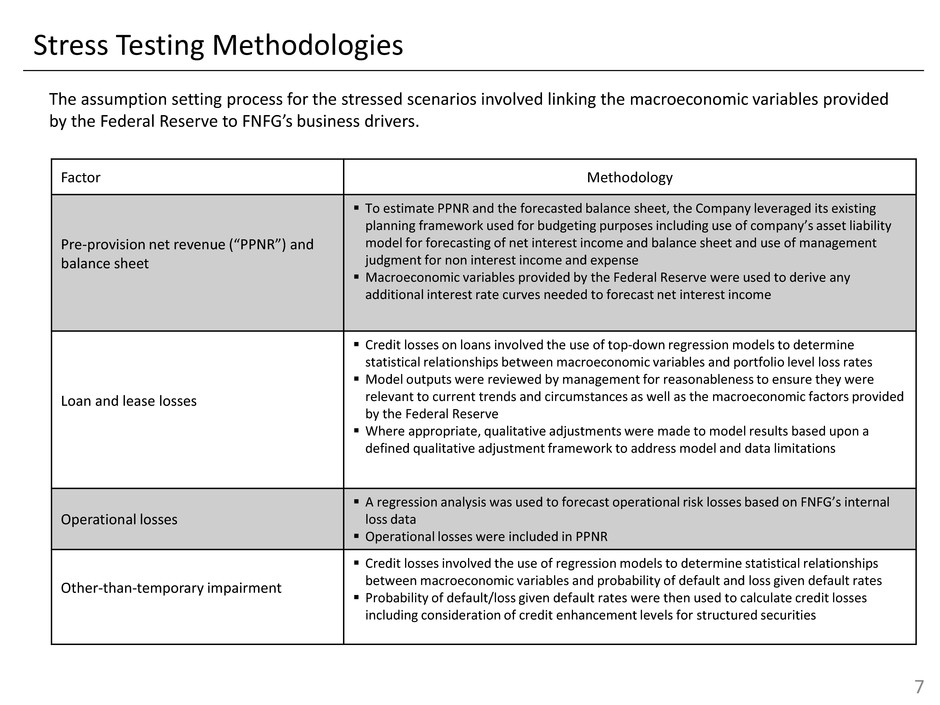
Stress Testing Methodologies The assumption setting process for the stressed scenarios involved linking the macroeconomic variables provided by the Federal Reserve to FNFG’s business drivers. 7 Factor Methodology Pre-provision net revenue (“PPNR”) and balance sheet To estimate PPNR and the forecasted balance sheet, the Company leveraged its existing planning framework used for budgeting purposes including use of company’s asset liability model for forecasting of net interest income and balance sheet and use of management judgment for non interest income and expense Macroeconomic variables provided by the Federal Reserve were used to derive any additional interest rate curves needed to forecast net interest income Loan and lease losses Credit losses on loans involved the use of top-down regression models to determine statistical relationships between macroeconomic variables and portfolio level loss rates Model outputs were reviewed by management for reasonableness to ensure they were relevant to current trends and circumstances as well as the macroeconomic factors provided by the Federal Reserve Where appropriate, qualitative adjustments were made to model results based upon a defined qualitative adjustment framework to address model and data limitations Operational losses A regression analysis was used to forecast operational risk losses based on FNFG’s internal loss data Operational losses were included in PPNR Other-than-temporary impairment Credit losses involved the use of regression models to determine statistical relationships between macroeconomic variables and probability of default and loss given default rates Probability of default/loss given default rates were then used to calculate credit losses including consideration of credit enhancement levels for structured securities

FNFG Results under Severely Adverse Scenario 8 FNFG Projected Stressed Capital Ratios¹ Actual Stressed Capital Ratios Q3 2014 Q4 2016 Lowest 9 Quarter Result Common Equity Tier 1 (CET1) (%) 8.19% 8.04% 8.00% Tier 1 risked-based capital ratio (%) 9.82% 9.75% 9.62% Total risk-based capital ratio (%) 11.75% 11.81% 11.57% Tier 1 leverage ratio (%) 7.34% 7.09% 7.07% Significant drivers of changes to FNFG’s actual Q3 2014 capital ratios over the hypothetical stress scenario include: Credit losses on loans elevated due to the deterioration of credit quality resulting from the projected economic environment Reduced PPNR due to the interest rate environment Reduction in risk-weighted assets, due to lower overall asset levels Operational losses elevated due to the strained economic conditions Maintaining dividend payments in line with 2014 actual levels Amortization of Tier 2 regulatory capital treatment for subordinated debt beginning in Q4 2016, which is the last quarter of the 2015 DFAST measurement period 1. From Q3 2014 through Q4 2014, the capital ratios are calculated using the general risk-based capital rules of the Federal Reserve as then in effect. From Q1 2015 to Q4 2016, the capital ratios are calculated under the new Basel III-based regulatory capital rules, including for risk-based measures the new rules’ “standardized approach”, utilizing transition provisions where applicable. The CET1 ratio from Q3 2014 to Q4 2014 is calculated based on the general risk-based capital rules then in effect in the same manner as the ratio of Tier 1 common to risk-weighted assets under Basel I. The Basel III-based regulatory capital rules did not become applicable to us until January 1, 2015.

FNFG Results under Severely Adverse Scenario 9 ($ in millions) Cumulative Hypothetical Results Over 9 Quarters Pre-provision net revenue $605 Provision for loan and lease losses $609 Net income $63 ($ in millions) Cumulative Hypothetical Results Over 9 Quarters Aggregate losses $581¹ 1. Includes Net Charge Offs on originated and acquired loans, reduced by the amount of write-downs on portfolios of loans purchased or acquired through mergers ($553MM), and other-than-temporary impairment ($28MM).

First Niagara Bank Results under Severely Adverse Scenario 10 FNB Projected Stressed Capital Ratios ¹ Actual Stressed Capital Ratios Q3 2014 Q4 2016 Lowest 9 Quarter Result Common Equity Tier 1 (CET1) (%) 10.41% 10.40% 10.25% Tier 1 risked-based capital ratio (%) 10.41% 10.37% 10.25% Total risk-based capital ratio (%) 11.27% 11.51% 11.13% Tier 1 leverage ratio (%) 7.78% 7.56% 7.51% First Niagara Bank (FNB) is the wholly-owned subsidiary of FNFG. First Niagara Bank and its consolidated subsidiaries account for approximately 99% of FNFG’s total assets. The process used for First Niagara Bank, including methodology, forecasting frameworks, governance and controls, are consistent with those used for FNFG. Given the proportional size of First Niagara Bank in relation to the consolidated entity, the impact of the Severely Adverse Scenario on First Niagara Bank very closely tracks that of FNFG. 1. From Q3 2014 through Q4 2014, the capital ratios are calculated using the general risk-based capital rules of the Federal Reserve as then in effect. From Q1 2015 to Q4 2016, the capital ratios are calculated under the new Basel III-based regulatory capital rules, including for risk-based measures the new rules’ “standardized approach”, utilizing transition provisions where applicable. The CET1 ratio from Q3 2014 to Q4 2014 is calculated based on the general risk-based capital rules then in effect in the same manner as the ratio of Tier 1 common to risk-weighted assets under Basel I. The Basel III-based regulatory capital rules did not become applicable to us until January 1, 2015.

Forward Looking Information Pursuant to the regulations issued by the Federal Reserve Board (FRB ) under the Dodd-Frank Act, FNFG and FNB are required to conduct a forward-looking company-run stress test exercise and to publicly disclose the results of that exercise. This release contains certain forward-looking statements as defined in the Private Securities Litigation Reform Act of 1995, including projections of financial condition, results of operations, plans, objectives, future performance or business under a hypothetical Supervisory Severely Adverse Scenario that incorporates a set of assumed economic and financial conditions prescribed by the FRB. These statements may address issues that involve significant risks, uncertainties, estimates, expectations, and assumptions made by management. Investors should not rely on these results as the projections are not intended to be a forecast of expected future economic or financial conditions or a forecast of FNFG’s expected future financial results or condition and actual results may differ materially from current projections and will be influenced by actual economic and financial conditions and various other factors as described in FNFG’s periodic and current reports filed with the Securities and Exchange Commission which are available at http://www.sec.gov. The regulations establishing DFAST require us to disclose certain projected financial measures that have not been prepared under U.S. Generally Accepted Accounting Principles (“GAAP”). FNFG’s actual financial information, prepared under GAAP, is available in reports filed with the SEC. FNFG undertakes no obligation to revise these statements following the date of this release. 11
